0001468522fer:SundryReceivablesMemberMemberfer:OtherReceivablesMember2024-12-310001468522ifrs-full:LaterThanTwoYearsAndNotLaterThanThreeYearsMemberfer:ExinfrastructureProjectMemberfer:CorporateDebtMember2027-12-310001468522country:ESfer:ConstructionDivisionMemberfer:IIDepusaAragonSAAMember2024-01-012024-12-31
UNITED STATES
SECURITIES AND EXCHANGE COMMISSION
Washington, D.C. 20549
FORM 20-F
(Mark One)
☐REGISTRATION STATEMENT PURSUANT TO SECTION 12(b) OR 12(g) OF THE SECURITIES EXCHANGE ACT OF
1934
OR
☒ANNUAL REPORT PURSUANT TO SECTION 13 OR 15(d) OF THE SECURITIES EXCHANGE ACT OF 1934
For the fiscal year ended December 31, 2024
OR
☐TRANSITION REPORT PURSUANT TO SECTION 13 OR 15(d) OF THE SECURITIES EXCHANGE ACT OF 1934
OR
☐SHELL COMPANY REPORT PURSUANT TO SECTION 13 OR 15(d) OF THE SECURITIES EXCHANGE ACT OF 1934
Commission file number 001-41912
Ferrovial SE
(Exact name of Registrant as specified in its charter)
The Netherlands
(Jurisdiction of incorporation or organization)
Gustav Mahlerplein 61-63 Symphony Towers, 14th Floor
1082 MS Amsterdam
The Netherlands
(Address of principal executive offices)
I
Ignacio Madridejos
Chief Executive Officer
Gustav Mahlerplein 61-63 Symphony Towers, 14th Floor
1082 MS Amsterdam
The Netherlands
Telephone: +31 20 798 3700
Investor Relations
ir@ferrovial.com
Príncipe de Vergara, 135
28002 Madrid
Spain
Telephone: +34 91 586 2736
(Name, Telephone, Email and/or Facsimile number and Address of Company Contact Person)
Securities registered or to be registered, pursuant to Section 12(b) of the Act.
| | | | |
| | | | Name of each exchange on which registered |
Ordinary shares, par value EUR 0.01 per share | | | | Nasdaq Global Select Market |
Securities registered or to be registered pursuant to Section 12(g) of the Act: None
Securities for which there is a reporting obligation pursuant to Section 15(d) of the Act: None
Indicate the number of outstanding shares of each of the issuer’s classes of capital stock or common stock as of the close of the period covered by the annual report: As of December 31, 2024,
the registrant had 721,806,552 ordinary shares outstanding.
Indicate by check mark if the registrant is a well-known seasoned issuer, as defined in Rule 405 of the Securities Act.
Yes ☐ No ☒
If this report is an annual or transition report, indicate by check mark if the registrant is not required to file reports pursuant to Section 13 or 15(d) of the Securities Exchange Act of 1934.
Yes ☐ No ☒
Indicate by check mark whether the registrant (1) has filed all reports required to be filed by Section 13 or 15(d) of the Securities Exchange Act of 1934 during the preceding 12 months (or for
such shorter period that the registrant was required to file such reports), and (2) has been subject to such filing requirements for the past 90 days.
Yes ☒ No ☐
Indicate by check mark whether the registrant has submitted electronically every Interactive Data File required to be submitted pursuant to Rule 405 of Regulation S-T (§ 232.405 of this
chapter) during the preceding 12 months (or for such shorter period that the registrant was required to submit such files).
Yes ☒ No ☐
Indicate by check mark whether the registrant is a large accelerated filer, an accelerated filer, a non-accelerated filer, or an emerging growth company. See the definitions of “large accelerated
filer,” “accelerated filer,” and “emerging growth company” in Rule 12b-2 of the Exchange Act.
Large accelerated filer ☐ Accelerated filer ☐ Non-accelerated filer ☒ Emerging growth company ☐
If an emerging growth company that prepares its financial statements in accordance with U.S. GAAP, indicate by check mark if the registrant has elected not to use the extended transition
period for complying with any new or revised financial accounting standards† provided pursuant to Section 13(a) of the Exchange Act. ☐
† The term “new or revised financial accounting standard” refers to any update issued by the Financial Accounting Standards Board to its Accounting Standards Codification after April 5,
2012.
Indicate by check mark whether the registrant has filed a report on and attestation to its management’s assessment of the effectiveness of its internal control over financial reporting under
Section 404(b) of the Sarbanes-Oxley Act (15 U.S.C. 7262(b)) by the registered public accounting firm that prepared or issued its audit report. ☐
If securities are registered pursuant to Section 12(b) of the Act, indicate by check mark whether the financial statements of the registrant included in the filing reflect the correction of an error to
previously issued financial statements. ☐
Indicate by check mark whether any of those error corrections are restatements that required a recovery analysis of incentive-based compensation received by any of the registrant’s executive
officers during the relevant recovery period pursuant to §240.10D-1(b). ☐
Indicate by check mark which basis of accounting the registrant has used to prepare the financial statements included in this filing:
☐ U.S. GAAP☒ International Financial Reporting Standards as issued by the International Accounting Standards Board☐ Other
If “Other” has been checked in response to the previous question indicate by check mark which financial statement item the registrant has elected to follow.
Item 17 ☐Item 18 ☐
If this is an annual report, indicate by check mark whether the registrant is a shell company (as defined in Rule 12b-2 of the Exchange Act).
Yes ☐ No ☒
| |
|
| |
| |
INTRODUCTION AND USE OF CERTAIN TERMS | |
PRESENTATION OF FINANCIAL AND OTHER INFORMATION | |
CAUTIONARY STATEMENT REGARDING FORWARD-LOOKING STATEMENTS | |
| |
| |
ITEM 1. IDENTITY OF DIRECTORS, SENIOR MANAGEMENT, AND ADVISERS | |
A. Directors and Senior Management | |
| |
| |
ITEM 2. OFFER STATISTICS AND EXPECTED TIMETABLE | |
| |
| |
B. Capitalization and Indebtedness | |
C. Reasons for the Offer and Use of Proceeds | |
| |
ITEM 4. INFORMATION ON THE COMPANY | |
A. History and Development of the Company | |
| |
C. Organizational Structure | |
D. Property, Plants, and Equipment | |
ITEM 4A. UNRESOLVED STAFF COMMENTS | |
ITEM 5. OPERATING AND FINANCIAL REVIEW AND PROSPECTS | |
| |
B. Liquidity and Capital Resources | |
C. Research and Development, Patents and Licenses, etc | |
| |
E. Critical Accounting Estimates | |
ITEM 6. DIRECTORS, SENIOR MANAGEMENT, AND EMPLOYEES | |
A. Directors and Senior Management | |
| |
| |
| |
| |
F. Disclosure of a Registrant’s Action to Recover Erroneously Awarded Compensation. | |
ITEM 7. MAJOR SHAREHOLDERS AND RELATED PARTY TRANSACTIONS | |
| |
B. Related Party Transactions | |
C. Interests of Experts and Counsel | |
ITEM8. FINANCIAL INFORMATION | |
A. Consolidated Statements and Other Financial Information | |
| |
ITEM 9. THE OFFER AND LISTING | |
| |
| |
| |
| |
| |
F. Expenses of the Issuer | |
ITEM 10. ADDITIONAL INFORMATION | |
| |
| |
B. Memorandum and Articles of Association | |
| |
| |
| |
F. Dividends and Paying Agents | |
| |
| |
I. Subsidiary Information | |
J. Annual Report to Security Holders | |
ITEM 11. QUANTITATIVE AND QUALITATIVE DISCLOSURES ABOUT MARKET RISK | |
ITEM 12. DESCRIPTION OF SECURITIES OTHER THAN EQUITY SECURITIES | |
| |
| |
| |
D. American Depositary Shares | |
| |
ITEM 13. DEFAULTS, DIVIDEND ARREARAGES AND DELINQUENCIES | |
ITEM 14. MATERIAL MODIFICATIONS TO THE RIGHTS OF SECURITY HOLDERS AND USE OF PROCEEDS | |
ITEM 15. CONTROLS AND PROCEDURES | |
A. Disclosure Controls and Procedures | |
B. Management’s Annual Report on Internal Control Over Financial Reporting | |
C. Attestation Report of the Registered Public Accounting Firm | |
D. Changes in Internal Control Over Financial Reporting | |
| |
ITEM 16A. AUDIT COMMITTEE FINANCIAL EXPERT | |
| |
ITEM 16C. PRINCIPAL ACCOUNTANT FEES AND SERVICES | |
ITEM 16D. EXEMPTIONS FROM THE LISTING STANDARDS FOR AUDIT COMMITTEES | |
ITEM 16E. PURCHASES OF EQUITY SECURITIES BY THE ISSUER AND AFFILIATED PURCHASERS | |
ITEM 16F. CHANGE IN REGISTRANT’S CERTIFYING ACCOUNTANT | |
ITEM 16G. CORPORATE GOVERNANCE | |
ITEM 16H. MINE SAFETY DISCLOSURE | |
ITEM 16I. DISCLOSURE REGARDING FOREIGN JURISDICTIONS THAT PREVENT INSPECTIONS | |
ITEM 16J. INSIDER TRADING POLICIES | |
| |
| |
ITEM 17. FINANCIAL STATEMENTS | |
ITEM 18. FINANCIAL STATEMENTS | |
| |
| |
INDEX TO CONSOLIDATED FINANCIAL STATEMENTS | |
INTRODUCTION AND USE OF CERTAIN TERMS
The Group started its operations in 1952 as a Spanish railway infrastructure company under the commercial name
“Ferrovial”. In May 1999, our predecessor, Grupo Ferrovial, S.A., completed an initial public offering of its ordinary
shares and the listing of its ordinary shares on the Madrid, Barcelona, Bilbao and Valencia Stock Exchanges, regulated
markets of Bolsas y Mercados Españoles, Sociedad Holding de Mercados y Sistemas Financieros, S.A. (such
exchanges, together, the “Spanish Stock Exchanges”).
Since our inception, we have undergone various corporate reorganizations, the most recent taking place on June 16,
2023, when we completed: (i) our re-domiciliation from Spain to the Netherlands through a cross-border merger by
absorption between Ferrovial, S.A. (“Ferrovial, S.A.”), as the Spanish absorbed company and the pre-Merger parent of
the Group (as defined below), and Ferrovial International SE (renamed Ferrovial SE (the “Company” or “Ferrovial”)
following the Merger (as defined below)), as a wholly-owned subsidiary of Ferrovial, S.A. and the Dutch absorbing
company, with the termination, via dissolution without liquidation, of Ferrovial, S.A. and the acquisition of all of
Ferrovial, S.A.’s assets, liabilities and other legal relationships by universal succession by Ferrovial International SE
(the “Merger”) and (ii) the admission to listing and trading of all ordinary shares with a nominal value of EUR 0.01
each (“ordinary shares”) in the share capital of Ferrovial on Euronext in Amsterdam, a regulated market of Euronext
Amsterdam N.V. (“Euronext Amsterdam”) and the Spanish Stock Exchanges. Our ordinary shares began trading on
Euronext Amsterdam and the Spanish Stock Exchanges on June 16, 2023, and on the Nasdaq Global Select Market,
under the symbol “FER”, on May 9, 2024.
We have prepared this Annual Report on Form 20-F (the “Annual Report”) using a number of conventions, which you
should consider when reading the information contained herein.
In this Annual Report, unless otherwise specified, the terms “Ferrovial,” the “Company,” the “Group”, “our
company,” “we,” “us,” and “our” refer to Ferrovial SE, individually or together with its consolidated subsidiaries, as
the context may require (or Ferrovial, S.A., individually or together with its consolidated subsidiaries, if referring to
the period prior to the Merger completion); the term the “Group Companies” refers to the companies within the Group
and the term the “Companies” refers to the companies within the Group and our equity-accounted companies. In
addition, we may use the full name of the pre-Merger or post-Merger parent company, wherever such reference may
aid in the understanding of this filing.
Additionally, this Annual Report uses the following conventions:
▪“Australian dollar”, “AUD” and “AU$” are the lawful currency of Australia;
▪“Canadian dollar”, “CAD”, and “Can$” are the lawful currency of Canada;
▪“euro”, “EUR” or “€” are the single currency of the European Economic and Monetary Union;
▪“Indian rupee”, “INR” and “₹” are the lawful currency of India;
▪“IFRS-IASB” are the International Financial Reporting Standards as issued by the International Accounting
Standards Board;
▪“Nasdaq” is the Nasdaq Global Select Market;
▪“Polish zloty”, “PLN” and “gr” are the lawful currency of Poland;
▪“pound sterling”, “GBP” or “£” are the lawful currency of the United Kingdom; and
▪“US$”, “U.S. dollar” and “dollar” are the lawful currency of the United States.
PRESENTATION OF FINANCIAL AND OTHER INFORMATION
Financial Statements
The financial information contained in this Annual Report includes our audited consolidated financial statements as of
December 31, 2024 and 2023 and for each of the years ending December 31, 2024, 2023 and 2022, prepared in
accordance with IFRS-IASB, which have been audited by Ernst & Young, S.L. (collectively, the “Audited Financial
Statements”).
In the Merger, all shareholders of the former parent company of the Group were allotted shares in the new parent
company of the Group, Ferrovial SE, except for a small group of shareholders who received cash in lieu of shares in
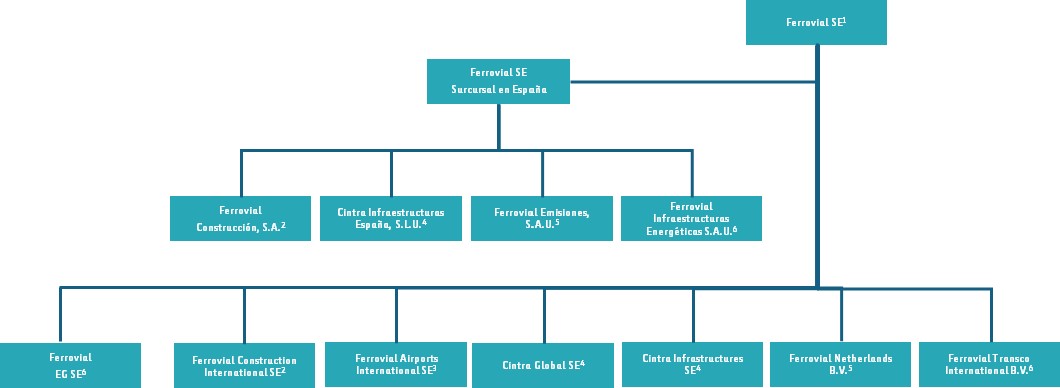
connection with the Merger, in compliance with the applicable laws and regulations. The only changes affecting the
corporate structure of the Group pursuant to the Merger were (i) the change of the parent company from the Spanish
entity Ferrovial, S.A. to the Dutch entity Ferrovial SE and (ii) the transfer of the Spanish assets from Ferrovial, S.A. to
Ferrovial SE’s Spanish branch, Ferrovial SE Sucursal en España. See “Item 4. Information on the Company—C.
Organizational Structure —Group Structure.” Therefore, in preparing the Audited Financial Statements, the Company
has decided to apply a “pooling of interest” or “predecessor accounting” approach, as it considers this approach best
reflects the substance of the reorganization. Moreover, the Company believes that this approach provides useful
information about the Group and is the best way for users of our financial information to understand the performance
of the Group’s underlying business. Therefore, the Audited Financial Statements covering the period before the
completion of the Merger were prepared for the consolidated group headed by Ferrovial, S.A.
In January 2024, we conducted a partial reorganization of our Business Divisions (for further information, see “Item 4.
Information on the Company —B.Business Overview —1. Overview” and Note 1.5 (Segment Reporting) to the Audited
Financial Statements). Information presented in this Annual Report for historical periods prior to the segment change
has been revised to reflect the partial reorganization.
The financial information presented in this Annual Report reflects the operating and financial performance of the
Group, its cash flows and financial position and resources. The Group’s results as reported in accordance with IFRS-
IASB represent the Group’s overall performance. The Group also uses a number of non-IFRS measures to report the
performance of its business, as described in “Item 5. Operating and Financial Review and Prospects—A. Operating
Results—8. Non-IFRS Measures: Operating Results” and “ —B. Liquidity and Capital Resources—6. Non-IFRS
Measures: Liquidity and Capital Resources.”
Industry and Market Data
This Annual Report includes statistical data, market data and other industry data and forecasts obtained from market
research, publicly available information and independent industry publications and reports that we believe to be
reliable sources, although we have not verified the accuracy and completeness of such third-party data. Forecasts,
projections and other forward-looking information obtained or derived from these sources involve risks and
uncertainties and are subject to the same qualifications and additional uncertainties applicable to the other forward-
looking statements included in this Annual Report. You should not place undue reliance on these statements. See
“Cautionary Statement Regarding Forward-Looking Statements.”
Foreign Currency Translations
Unless stated otherwise, transactions in foreign currencies are translated into euro at the exchange rates applicable at
the transaction dates. Monetary assets and liabilities denominated in foreign currencies are translated into the
functional currency at the applicable reporting date. For further details see Note 1.4 (Exchange Rate) to the Audited
Financial Statements.
Rounding
Amounts in this Annual Report have been rounded off to the nearest million euros, or in certain cases, the nearest
thousand euros; there may be discrepancies in totals and sums of the amounts listed due to rounding. Figures shown
as totals in certain tables may not be an arithmetic aggregation of the figures preceding them.
Trademarks, Service Marks and Trade Names
Throughout this Annual Report, we refer to various trademarks, service marks and trade names that we use in our
business. The “Ferrovial” logo is the property of Ferrovial SE. We have several other trademarks and service marks.
Solely for convenience, some of the trademarks, service marks and trade names referred to in this Annual Report are
listed without the “®” or “™” trademark designations. All rights to such trademarks are nevertheless reserved, and
other trademarks and service marks appearing in this Annual Report are the property of their respective owners.
CAUTIONARY STATEMENT REGARDING FORWARD-LOOKING STATEMENTS
This Annual Report contains forward-looking statements within the meaning of the safe harbor provisions of the U.S.
Private Securities Litigation Reform Act of 1995. We intend such forward-looking statements to be covered by the
safe harbor provisions for forward-looking statements contained in Section 27A of the U.S. Securities Act of 1933, as
amended (the “Securities Act”), and Section 21E of the U.S. Securities Exchange Act of 1934, as amended (the
“Exchange Act”). All statements other than statements of historical facts contained in this Annual Report, including
statements regarding our future results of operations, financial condition, the sufficiency of our sources of liquidity and
available working capital, business strategy and plans and objectives of management for future operations, plans,
expectations and estimations related to expenditures and divestitures, expectations surrounding future shareholder
distributions, our anticipated appointment of a new independent registered public accounting firm, are forward-looking
statements.
In some cases, you can identify forward-looking statements because they contain words such as “anticipate,”
“believe,” “contemplate,” “continue,” “could,” “estimate,” “expect,” “forecast,” “goal,” “intend,” “may,” “objective,”
“outlook,” “plan,” “potential,” “predict,” “probability,” “project,” “risk,” “should,” “target,” “trends,” “will,” or
“would,” or the negative of these words or other similar terms or expressions.
We have based these forward-looking statements largely on our current expectations and projections about future
events and trends that we believe may affect our financial condition, results of operations, business strategy and
financial needs. These forward-looking statements are neither promises nor guarantees, but are subject to a number of
known and unknown risks, uncertainties, other factors and assumptions that could cause our actual results,
performance or achievements to be materially different from any future results, performance, achievements
expectations or projections expressed or implied by the forward-looking statements, including the risks described in
“Item 3. Key Information—D. Risk Factors” and elsewhere in this Annual Report. Furthermore, new risks may
emerge from time to time and it is not possible for our management to predict all risks, nor can we assess the impact of
all factors on our business or the extent to which any factor, or combination of factors, may cause actual results to
differ materially from those contained in, or implied by, any forward-looking statements.
You should not rely on forward-looking statements as predictions of future events. We undertake no obligation to
update any forward-looking statements made in this Annual Report to reflect events or circumstances after the date of
this Annual Report or to reflect new information or the occurrence of unanticipated events, except as required by law.
We may not actually achieve the plans, intentions or expectations disclosed in our forward-looking statements, and
you should not place undue reliance on our forward-looking statements. Our forward-looking statements do not reflect
the potential impact of any future acquisitions, mergers, dispositions, joint ventures or investments.
In addition, statements that “we believe” and similar statements reflect our beliefs and opinions on the relevant subject.
These statements are based on information available to us as of the date of this Annual Report. While we believe that
information provides a reasonable basis for these statements, that information may be limited or incomplete. Our
statements should not be read to indicate that we have conducted an exhaustive inquiry into, or review of, all relevant
information. These statements are inherently uncertain, and investors are cautioned not to unduly rely on these
statements.
Additionally, we may provide information herein or on our website, or documents accessible thereby, that is not
necessarily “material” under the federal securities laws for Securities and Exchange Commission (“SEC”) reporting
purposes, but that is informed by various environmental, social, and governance (“ESG”) standards and frameworks
(including standards for the measurement of underlying data), and the interests of various stakeholders, among other
things. Much of this information is subject to assumptions, estimates or third-party information that are still evolving
and subject to change. For example, our disclosures based on any standards may change due to revisions in framework
requirements, availability or quality of information, changes in our business or applicable government policies, or
other factors, some of which may be beyond our control.
You should read this Annual Report and the documents that we reference in this Annual Report and have filed as
exhibits to the Annual Report of which this Annual Report is a part with the understanding that our actual future
results, levels of activity, performance and achievements may be different from what we expect. We qualify all of our
forward-looking statements by these cautionary statements.
SUMMARY OF RISK FACTORS
Our business is subject to numerous risks and uncertainties, including those described in “Item 3. Key Information—D.
Risk Factors.” You should carefully consider these risks and uncertainties when investing in our ordinary shares.
Principal risks and uncertainties affecting our business include the following:
◦risks related to our diversified geographical operations and Business Divisions, including without limitation
vehicle and passenger use levels for toll roads and airports we operate, unanticipated construction and
planning issues, including budget overruns and delays, and their impact on major project capital investment
programs, the availability of private sector projects and reductions in project procurement and delays in the
completion of projects by the private sector, energy price volatility and difficulties in securing long-term off-
take agreements, and changes in the regulation of any of the energy markets where we operate, and the
triggering of performance guarantees or other similar contractual obligations in connection with any of the
foregoing risks;
◦risks related to our acquisitions, divestments and other strategic transactions that we may undertake and
considering that our business is derived from a small number of projects;
◦the impact of competitive pressures in our industry and pricing, including the costs of and lack of certainty in
winning competitive tender processes, and the lack of funds allocated to public sector projects in the
countries in which we operate, and competition for skilled talent;
◦general economic and political conditions and events and the impact they may have on us, including, but not
limited to, increases in inflation rates and rates of interest, exchange rate fluctuations, increased costs for
materials, and the impact of cybersecurity attacks, terrorist attacks and other acts of violence, and impacts
resulting from the ongoing Russia/Ukraine and the Middle East conflicts;
◦our ability to obtain adequate financing in the future as needed;
◦our ability to maintain compliance with the continued listing requirements of Nasdaq Global Select Market,
Euronext Amsterdam and the Spanish Stock Exchanges;
◦lawsuits and other claims by third parties or investigations by various regulatory agencies that we may be
subject to;
◦impact of any changes in existing or future tax regimes or regulations; and other risks and uncertainties;
◦risks specific to our securities, including the payment of future dividends, which will depend on our financial
condition and results of operations, and the liquidity of our shares as a consequence of the multiple listings in
different jurisdictions;
◦risks related to increased digitalization and to cybersecurity threats, including risks relating to related
evolving legal and regulatory regimes;
◦risks related to the concentration of individual projects upon which our business is dependent;
◦the impacts of accidents or other incidents at our project sites and facilities, including possible disruptions
and delays, harm to our employees or customers and reputational damage;
◦physical and transitional risks in connection with the impacts of climate change, including the impact of
extreme weather conditions, and risks in connection with natural disasters or similar catastrophic events,
including extreme weather conditions, health emergencies and government and societal responses thereto;
◦risk related to increased scrutiny and changing expectations in connection with sustainability and ESG
matters;
◦risks related to the adequacy or existence of our insurance coverage and any non-recoverable losses;
◦risk associated with the international nature of our business and operations, including compliance with the
U.S. Foreign Corrupt Practices Act, EU anti-corruption legislation, the U.K. Bribery Act, import and export
controls and economic sanctions laws imposed by the U.S. government, and similar laws in other
jurisdictions;
◦our reliance on and ability to locate, select, monitor, and manage subcontractors and service providers;
◦our legal and regulatory risks given that we operate in highly regulated environments and may be subject to
changes in regulations, including that we contract with government authorities and face risks and
uncertainties in obtaining permits and rights-of-way and in securing land rights; and
◦risks related to our holding company structure and from our joint venture and partnership operations,
including impacts from our reliance on our partners’ financial condition, performance, and decisions
PART I
ITEM 1. IDENTITY OF DIRECTORS, SENIOR MANAGEMENT, AND ADVISERS
1.A.Directors and Senior Management
Not applicable.
1.B.Advisers
Not applicable.
1.C.Auditors
Not applicable.
ITEM 2. OFFER STATISTICS AND EXPECTED TIMETABLE
Not applicable.
ITEM 3. KEY INFORMATION
3.A.[Reserved]
3.B.Capitalization and Indebtedness
Not applicable.
3.C.Reasons for the Offer and Use of Proceeds
Not applicable.
3.D.Risk Factors
You should carefully consider the risks described below, together with all of the other information in this Annual
Report, including the Audited Financial Statements and related notes. Our business, financial condition, and results of
operations could be materially and adversely affected if any of the risks described below occur. As a result, the market
price of our ordinary shares could decline, and you could lose all or part of your investment. This Annual Report also
contains forward-looking statements that involve risks and uncertainties. See “Cautionary Statement Regarding
Forward-Looking Statements.” Our actual results could differ materially and adversely from those anticipated in
these forward-looking statements due to certain important factors, including the risks facing our Group. Additional
risks and uncertainties not presently known to us or that we currently deem immaterial also may impair our business
operations.
3.D.1Risks Related to Our Business and Structure
3.D.1.1Global economic and political conditions have had and in the future could have a material adverse effect
on our business, financial condition, results of operations, and prospects and may magnify certain risks that affect
our business.
Our business performance is closely linked to the economic cycle and political conditions in the countries, regions,
and cities in which we operate. As a result of our diverse geographical operations, in 2024 we generated the majority
of our revenues across several core jurisdictions, including the United States (35.8%), Poland (23.2%), Spain (17.3%),
the United Kingdom (8.8%) and Canada (2.7%).
Typically, robust economic growth in the areas where we operate results in greater demand for our services, while
slow economic growth or economic contraction adversely affects such demand. For example, the toll roads and
aviation businesses are cyclical by nature and are closely linked to general economic conditions.
All revenues, dividends, and investments from our Companies are exposed to risks inherent to economic conditions in
the countries in which they operate. Operations in the countries where we do business are exposed to factors such as:
(i) fluctuations in local economic growth; (ii) changes in inflation rates; (iii) devaluation, depreciation or excessive
appreciation of local currencies; (iv) foreign exchange controls or restrictions on profit repatriation; (v) changing
interest rate environments; (vi) changes in financial, economic and tax policies; (vii) instances of fraud, non-
compliance, bribery or corruption; (viii) social conflicts; (ix) political and macroeconomic instability; and (x) changes
in applicable law.
Geopolitical conflict, political uncertainty and instability risks have been on the rise across many economies, resulting,
in some cases, in inward-looking policies and protectionism, which could in turn lead to increased pressures for policy
reversals or failure to implement needed reforms. The conflicts in Ukraine and the Middle East have contributed to
greater global political uncertainty and instability, as further discussed under “—7. The conflicts in Ukraine and in the
Middle East may adversely impact our global activities and could have a material adverse effect on our business,
financial condition, results of operations, and prospects”.”
Economic growth, globally and in the EU, has been subject to constraints on private sector lending and increases in the
cost of financing. Recent examples of downside risks to the global economy that have also affected our results include:
(i) rising geopolitical tensions , most notably the ongoing conflicts in Ukraine and in the Middle East, (ii) the sharp
rise in inflation, and (iii) volatile global financial conditions. In addition, many developed economies where we
operate, such as the United States, Spain, the United Kingdom, and Canada, have experienced high inflation rates and
a corresponding tightening of monetary policy as a result of the strong and persistent upturn in prices.
Continued weakness in many emerging economies where we operate has also contributed to the risk of deterioration of
global economic and political conditions. For example, we believe that in Latin America, political systems and
institutions may be subject to increased stress as a consequence of the global macroeconomic events, including (i) the
conflicts in Ukraine and the Middle East, and (ii) high food and energy costs as a result of inflationary pressures, and
(iii) the slowdown in the Chinese economy and its contribution to global uncertainty, all of which contribute to
increased risks of sovereign defaults and social unrest. Although a number of measures have been implemented by the
public sector to mitigate these risks (such as the United States’ Infrastructure Investment and Jobs Act, the European
Union’s Next Generation EU (NGEU) fund, and the UK Build Back Better plan, among others), these measures may
prove to be ineffective or insufficient to prevent the deterioration of the economies of the countries in which we
operate.
Also, in the U.S., our assets are affected by economic growth and regulations. Regulations such as international trade
relations, energy and infrastructure, and new legislation and regulations, including those related to taxation and
importation; economic and monetary policies, and foreign policy and diplomacy; heightened diplomatic tensions and
political and civil unrest, which could adversely impact the global economy and our operating results. The nature,
timing, and economic and political effects of these potential changes to the current policy, legal and regulatory
framework affecting our activities remain highly uncertain. For example, potential stricter conditions for the import of
equipment from certain countries, which might impact the growth and profitability of our businesses in the US. In
addition, although the Federal Reserve recently decreased interest rates, inflation remains at moderately high levels.
In Canada, 2025 is a year of elections both at the federal and provincial levels in Ontario. The nature, timing, and
economic impact of potential changes on current policy, legal, and regulatory framework affecting our activities
remain highly uncertain.
In Spain, a number of concerns continue to exist in respect to the Spanish economy (where, in 2024, we generated
17.3% of our revenue) (for a detailed overview of the countries in which we operate, see “Item 5. Operating and
Financial Review and Prospects”). While in recent years, there has been some progress, the Spanish economy
continues to be susceptible to various geopolitical and macroeconomic factors, such as the uncertainty originated by,
among other circumstances, (a) international trade tensions between the United States and China, or (b) volatility in
commodity prices. These events could cause an increase in Spain’s political and economic uncertainty, which could, in
turn, have a material adverse effect on our business, financial condition, results of operations, and prospects.
We also have operations in a number of Latin American countries, which tend to be more vulnerable to the effects of
macroeconomic events and political instability. In those countries, we are exposed to, among others, macroeconomic
factors such as inflation, geopolitical tensions, environmental factors, and other socioeconomic and political factors.
For example, we have significant operations in Chile, where in the year ended December 31, 2024, we generated EUR
371 million in revenue.
In addition, other factors or events may affect global and national economic conditions, such as heightened
geopolitical tensions, war, acts of terrorism, natural disasters, pandemics, or other similar events outside our control.
Even in the absence of an economic downturn, we are exposed to substantial risk stemming from volatility in areas
such as consumer spending, business investment, financial conditions, government spending, capital markets
conditions, and price inflation, which affect our business and our economic environment and, consequently, our size
and profitability. Increases in national public debt may lead countries to increase taxes and to reduce investment in
infrastructure. Unfavorable economic conditions could also lead to decreased use of, and related income from, toll
roads projects, reduced air travel, and reduced investment in the construction sector and energy sector. Furthermore,
any financial difficulties suffered by our sub-contractors or suppliers could increase our costs or adversely affect our
project schedules.
Any deterioration of the economies or political conditions of the countries in which we operate could have a material
adverse effect on our business, financial condition, results of operations, and prospects.
3.D.1.2We operate in highly competitive industries and where customer risk transfer dynamics may not be
balanced; our profitability could be affected by our failure to manage competitive dynamics and address risk
transfer imbalances, including a failure to accurately estimate revenue, project risks, the availability and cost of
resources and time, when bidding on projects, any of which could have a material adverse effect on our business,
financial condition, and results of operations.
The market for infrastructure development and operation projects is highly competitive and is exposed to political and
social factors that are difficult to predict and manage. Most of our competitors are multinational companies bidding on
projects worldwide, which places the competitive focus on the attractiveness of each individual project as opposed to
its geographical location. These circumstances may have an impact on the achievement of our growth objectives.
We compete against various groups and companies that may have more local experience, resources, or awareness than
we do. Furthermore, the economic slowdown in Europe and the financial difficulties faced by emerging countries are
negatively affecting public clients’ investment capacity and, by extension, could affect to some of our business
opportunities in those geographies. This lack of investment opportunities in Europe has pushed capital flows towards
markets with greater availability of resources in which we also operate, increasing the competitive tension within those
markets and resulting in pressures on prices and profit margins in projects in which the customer risk transfer dynamic
is not balanced.
Technological developments in terms of digitalization of processes may also pose a risk to our business if our
competitors develop an advantage over us in this area. Specifically, if we fail to develop differential competitive
capabilities at the same or a higher pace than our competitors due to the rapid deployment of generative artificial
intelligence by said competitors, this may pose a significant risk to our business, financial condition, and results of
operations, as the engineering and construction industry is highly dependent on technology. Failure to adequately keep
up with technological advances could result in our decreased profitability and loss of market share.
In recent years, the construction sector at an international level has been experiencing low profitability margins, which
we believe to be partly driven by aggressive commercial strategies, imbalances in customer risk transfer, and cost
inflation. These financial considerations may be further accentuated by the political and economic environment created
as a result of the conflicts in Ukraine and the Middle East. In addition, the increase in infrastructure-focused
investment funds requiring lower rates of return in their investments, coupled with these funds’ readiness to take on
more segments of a project’s value chain, may increase competition in our target markets.
If we are unable to obtain contracts for new projects to sustain our current order book (the “Order Book”) volume, or if
these projects are only awarded under less favorable terms as a result of macroeconomic and competitive pressures,
our business, financial condition, and results of operations may be adversely affected.
Furthermore, particularly when operating under fixed fee contracts in the Construction Business Division, we realize a
profit only if we can successfully estimate our costs and prevent any cost overruns on contracts. Cost overruns can
result in lower profits or operating losses on projects, which could have an adverse effect on our business, financial
condition, and results of operations. Our estimates and predictions can be difficult to make, particularly in a highly
competitive and uncertain environment (for additional information on the worsening of the global economic and
political conditions and their impact on our business, see “—1. Global economic and political conditions have had and
in the future could have a material adverse effect on our business, financial condition, results of operations, and
prospects and may magnify certain risks that affect our business” and “—7. The conflicts in Ukraine and in the Middle
East may adversely impact our global activities and could have a material adverse effect on our business, financial
condition, results of operations, and prospects”), and may turn out to be inaccurate. If we fail to identify key risks or
effectively estimate costs for projects where we are exposed to the risk of cost overruns, this could have an adverse
effect on our business, financial condition, and results of operations.
For example, most of our customers in the public infrastructure sector are public entities. These or other customers
may, from time to time, request amendments or alterations to agreed projects plans, even after the project has
commenced, or ask to renegotiate terms. Any of this could lead to project delays, increased project development costs
for us, or even termination of contracts. We may not always be able to recoup the increased costs in such cases. Any
potential project amendments or renegotiations with our customers could therefore significantly reduce the revenue
and profit we are able to realize. If we are unsuccessful in our claims against customers in this context, there may be a
reduction in the expected revenues and profit of such projects, which could have an adverse effect on our business,
financial conditions, and results of operations.
If we fail to identify key risks or effectively estimate costs for projects where we are exposed to the risk of cost
overruns, or if client renegotiations cause a project to incur additional, unexpected costs, this could have an adverse
effect on our business, financial condition, and results of operations.
3.D.1.3We depend on funds allocated to public sector projects in the countries in which we operate, and any
decrease in allocation of such funds may adversely impact our project volume, which could adversely affect our
business, financial condition, and results of operations.
We currently indirectly benefit from funds granted by the European Union to its member states (the “Member States”)
and allocated to those Member States’ public entities. However, due to political, economic, or other considerations,
these funds may no longer be available to us in the future, or there may be delays in receipt of such funds. A
cancellation or delay in the receipt of such funds may adversely affect our business, financial condition, results of
operations, and prospects.
In particular, our Construction Business Division depends on public sector projects. For example, in 2024 clients from
the public sector accounted for 86% of the total Order Book of our Construction Business Division, which amounted
to EUR 14,411 million as of December 31, 2024 (for further information on the Construction Business Division’s
clients, see “Item 4. Information on the Company—B. Business Overview—3. Group Overview—3. Our Business
Divisions—3. Construction Business Division”).
The toll roads industry, generally, and our Toll Roads Business Division, specifically, depend mainly on the continued
availability of attractive levels of government funds and incentives to attract private investments, in particular as it
pertains to public-private risk sharing in connection with private toll roads development. Such government funds are
generally granted in connection with the construction and operation of toll roads for the benefit of the general public.
For instance, in the United States, we currently benefit from the Transportation Infrastructure Finance and Innovation
Act (“TIFIA”)’s credit assistance program as granted by the United States Department of Transportation to leverage
limited federal resources and stimulate capital market investment in transportation infrastructure by providing credit
assistance in the form of direct loans, loan guarantees, and standby lines of credit (rather than grants) to projects of
national or regional significance, such as our development of additional highway lanes within existing highways that
incorporate dynamic tolls that change in real-time based on traffic conditions (the “Managed Lanes”). Our projects in
the United States have been granted funds through different financial instruments under the TIFIA credit assistance
program (for a description of the credit assistance received, see “Item 5. Operating and Financial Review and
Prospects—B. Liquidity and Capital Resources—8. Financing”). As of December 31, 2024 the balance of these TIFIA
loans was USD 2,620 million.
If, due to political, economic, or other considerations, funds like those received through TIFIA are no longer available
or the TIFIA credit assistance program is cancelled, this could have a material adverse effect on our ability to develop
new projects. Furthermore, decreases in the funds allocated to public sector projects may force private sector
construction companies, such as us, to halt projects that are already underway. For these reasons, a continued and
further decrease in the spending on the development and execution of public sector projects by governments and local
authorities in the markets in which we already operate or in those in which we could operate in the future could
adversely affect our business, financial condition, and results of operations.
3.D.1.4The increase in digitalization and consequently, the increased risk of cyber threats and misuse of quantum
technology, may affect our normal operation of assets and our ability to generate expected value, which could have
a material adverse effect on our business, financial condition, and results of operations.
In a highly digitalized and interconnected economic environment, the risk of cyber security events or system failures
potentially harming us has exponentially increased in recent years. Our digital products and services, industrial
systems and Internet connected assets, which include hardware, software, technology infrastructure and online sites
and networks for both internal and external operations (collectively, “digital and technological environments” or “DT
environments”), are critical to our business operations. We own and manage some of these DT environments but also
rely on third-party providers for a range of services, including cloud computing. We and certain of our third-party
providers use these DT environments to collect, maintain and process data about customers, employees, business
partners and others, including information about individuals, as well as proprietary information belonging to our
business such as trade secrets (collectively, “Confidential Information”).
Our DT environments and Confidential Information are exposed to threats in the cyber space from diverse threat
actors by, among others, hostile government agencies, hacktivists, insiders, criminals as well as through diverse attack
vectors, such as social engineering/phishing, malware (including ransomware), human or technological error, and as a
result of malicious code embedded in open-source software, or misconfigurations, bugs or other vulnerabilities in
commercial software that is integrated into our (or our suppliers’ or service providers’) DT environments.
These threats can impact the normal operation of our DT environments, impact our ability to generate expected value
of the assets, result in the disclosure of our Confidential Information, or potentially undermine our reputation. For
example, there may be an increase in cyber threats in connection with the conflict in Ukraine, as discussed under “—7.
The conflicts in Ukraine and in the Middle East may adversely impact our global activities and could have a material
adverse effect on our business, financial condition, results of operations, and prospects.”
The extent to which a cyber threat can impact our DT environment, Confidential Information, or an asset depends on
the nature of the DT environment, Confidential Information or asset, the cyber threat agent’s origin, the scope of the
security breach, and the extent to which we are prepared to respond to such a cyber threat. Critical infrastructures
(such as airports, highways, and energy infrastructure), which are the main assets of our business, are a common target
for such threats. Additionally, if a cyber threat is not successfully managed, it could impact our ability to generate
expected value. For instance, a ransomware attack affecting one of our airports could cause flight cancellations, which
in turn could materially affect our operating revenues and financial results. Additionally, the rapid development of the
quantum computing industry is also relevant as it is shortening the time in which quantum computers can break current
encryption systems and compromise sensitive data security. Furthermore, remote and hybrid working arrangements
increase cybersecurity risks due to challenges in managing remote computing assets and vulnerabilities in non-
corporate networks.
During 2024, we experienced various security events, some of which were associated with malicious, harmful, or
potentially malicious and/or harmful activities (which we consider “security incidents”). None of these security
incidents had a significant impact on our DT environments, Confidential Information or assets, and they were
managed using our protection, detection, response, and recovery procedures, as appropriate. While to date no security
incidents have had a material impact on our operations or financial results, we cannot guarantee that material incidents
will not occur in the future. Additionally, cyber threats are expected to accelerate globally in frequency and magnitude,
with threat actors using sophisticated techniques, including artificial intelligence, to circumvent security controls,
evade detection and remove forensic evidence. As a result, we may be unable to detect, investigate, remediate or
recover from future attacks or security incidents, or to avoid a material adverse impact to our DT environments,
Confidential Information or assets.
There can also be no assurance that our cybersecurity risk management program and processes, including our policies,
controls or procedures, will be fully implemented, complied with or effective in protecting our DT environments,
Confidential Information, and assets. Furthermore, we regularly identify and track security vulnerabilities across our
DT environments, which may persist even after patches are issued or other remedial measures taken.
Any adverse impact on our DT environments, Confidential Information, or assets can result in legal claims, regulatory
actions, fines, reputational damage, and significant incident response costs. For example, there is a potential risk that
cyberattacks may render our DT environments or assets, or those of our service providers, temporarily inoperative.
Furthermore, the increased risk of cyber threats may impact our business plan due to a consequent reduction in the
value of the asset, may lead to loss or theft of Confidential Information, know-how and intellectual and industrial
property, as well as lead to economic loss tied to resuming operations, and may damage our reputation and related
competitive advantage, compromising potential business opportunities. In addition, we may face sanctions as a
consequence of potential regulatory and contractual non-compliance resulting from an asset’s lack of operations
following a cyber-attack or incur expenses in an effort to comply with obligations, including notification obligations,
under applicable laws.
Finally, we cannot guarantee that costs and liabilities from an attack will be covered by our existing insurance policies
or that future insurance will be available on reasonable terms or at all. These factors could have an adverse effect on
our business, financial condition, and results of operations.
3.D.1.5Any actual or perceived failure to comply with new or existing laws, regulations and other requirements
relating to the privacy, security and processing of Personal Information could adversely affect our business, results
of operations, or financial condition.
In conducting our business, we receive, store, use and otherwise process information that relates to individuals and/or
constitutes “personal data,” “personal information,” “personally identifiable information,” or similar terms under
applicable data privacy laws (collectively, “Personal Information”). We are therefore subject to a variety of federal,
state and foreign laws, regulations and other requirements relating to the privacy, security and handling of Personal
Information. For example, in Europe and the UK, we are subject to the European Union General Data Protection
Regulation (the “EU GDPR”) and to the United Kingdom General Data Protection Regulation and Data Protection Act
2018 (collectively, the “UK GDPR”) (the EU GDPR and UK GDPR together referred to as the “GDPR”), while in the
U.S., we are subject to various state and federal laws like the California Consumer Privacy Act and others. In addition,
the GDPR regulates cross-border transfers from the EEA and the UK and we anticipate ongoing legal complexity and
scrutiny regarding international data transfers. We have invested significant resources in complying with these
requirements, which can be both time-consuming and costly.
The application and interpretation of such requirements are constantly evolving and are subject to change, creating a
complex compliance environment. In some cases, these requirements may be either unclear in their interpretation and
application or they may have inconsistent or conflicting requirements with each other. Further, there has been a
substantial increase in legislative activity and regulatory focus on data privacy and security around the globe, including
in relation to cybersecurity incidents. In addition, some such requirements place restrictions on our ability to process
Personal Information across our business or across country borders.
It is possible that new laws, regulations and other requirements, or amendments to or changes in interpretations of
existing laws, regulations and other requirements, may require us to incur significant costs, implement new processes,
or change our handling of information and business operations, which could ultimately hinder our ability to grow our
business. In addition, any failure or perceived failure by us to comply with laws, regulations and other requirements
relating to the privacy, security and handling of information could result in legal claims or proceedings (including
class actions), regulatory investigations or enforcement actions. We could incur significant costs in investigating and
defending such claims and, if found liable, pay significant damages or fines or be required to make changes to our
business. These proceedings and any subsequent adverse outcomes may subject us to significant negative publicity and
an erosion of trust. If any of these events were to occur, our business, results of operations, and financial condition
could be materially adversely affected.
3.D.1.6Our business is derived from a small number of major projects, which, if terminated or otherwise
materially affected, may have a material adverse effect on our business, financial condition, and results of
operations.
Our main projects in terms of valuation and equity invested are (i) in the Toll Roads Business Division, the 407
Express Toll Road (the “407 ETR”) and several Managed Lanes projects such as the North Tarrant Express toll road
(“NTE”), the North Tarrant Express 35W toll road (“NTE 35W”), the I-66 toll road (“I-66”), the I-77 Express lane
(“I-77”), and the Lyndon B. Johnson Expressway (“LBJ”) and (ii) in the Airports Business Division, the New
Terminal One at John F. Kennedy International Airport (“NTO at JFK” or “NTO”). According to market analysts’
reports, Toll Roads and Airports amounted to approximately 91% of our valuation as of December 2024. This figure
still includes valuation from Heathrow, that should be reclassified to cash in 2025 after completion of the divestment
of the 19.75% on December 12, 2024. For further details on this divestment, see “Item 4. Information on the Company
—A. History and development of the Company —1. Summary of Historical Investments and Divestments —2. Sale of
Heathrow Stake.”
Aside from the Heathrow divestment, we cannot guarantee that any of the aforementioned projects, or our
performance thereunder, will not be terminated or otherwise materially affected by developments outside of our
control, such as regulatory developments, other factors related to our operations in highly regulated environments, or
the public and/or governmental nature of our clients in all of the above-mentioned projects, as well as inflationary
pressures, foreign exchange rate fluctuations, factors affecting traffic and infrastructure use, adverse weather,
availability of financing in favorable terms, or other conditions. For example, our concessions contracts typically
include termination rights that may be exercised by the concession grantor or lessor (see —2. Risks Related to Legal,
Regulatory, and Industry Matters —1. We operate in highly regulated environments that are subject to changes in
regulations and are subject to risks related to contracts with government authorities, which could have a material
adverse effect on our business, financial condition, and results of operations.”). The termination of any of these
projects or any material impact to our performance as a result of these factors could potentially have a material adverse
effect on our business, financial condition, and results of operations.
Furthermore, our reliance on a relatively small number of projects may adversely affect the development of our
business. As such, the loss of, or a material adverse effect to, any of our main projects may in turn have a material
adverse effect on our business, financial condition, and results of operations.
3.D.1.7The conflicts in Ukraine and in the Middle East may adversely impact our global activities and could have
a material adverse effect on our business, financial condition, results of operations, and prospects.
On February 24, 2022, Russia began its invasion of Ukraine. As of the date of this Annual Report, the conflict has not
come to an end. Although our direct exposure to the conflict is limited and mostly concentrated on our operations in
Poland and our operations at the Dalaman International Airport (“Dalaman”) in Turkey, which has experienced lower
demand from Russian and Ukrainian passengers in part due to inflation and currency devaluation related to the
Ukrainian conflict, the macroeconomic scenario triggered by this conflict includes broad-based price rises essentially
affecting energy and commodities, supply issues, and difficulties in the distribution chain for certain materials,
particularly in the construction industry. Additionally, and as a result of these financial pressures, interest rates have
been rising, impacting the banking and financing markets.
As a result of the invasion, the EU, together with the United States and most NATO countries, condemned the attack
and put in place coordinated sanctions and export-control measure packages against Russia, Belarus, and some other
territories related to the conflict in Ukraine. The uncertain nature, magnitude, and duration of Russia’s war in Ukraine
and the potential effects of the war, actions taken by Western and other states and multinational organizations in
response thereto (including, among other things, sanctions, export- control measures, travel bans, and asset seizures),
as well as of any Russian retaliatory actions (including, among other things, restrictions on oil and gas exports and
cyber-attacks) on the world economy and markets have contributed to increased market volatility and uncertainty.
Our activities in Poland (through Budimex’s construction business), as a neighboring country to Ukraine, are at an
increased risk of being disrupted by the conflict. Although as of the date of this Annual Report, our revenue generated
in Poland, which, in 2024, amounted to 23.2% of our revenues was not materially affected as a result of the conflict,
the risk that such impact may materialize in the future cannot be excluded. This potential risk has been evidenced by
the unattributed missile strike on an area close to Poland’s south-eastern border with Ukraine on December 15, 2022
that killed two people as well as by the disruption in the infrastructures of Poland and Ukraine as a consequence of
refugees from Ukraine entering Poland to flee the war and by the transportation of western military equipment to
support the Ukrainian front. Another country in which we operate that is close to Ukraine’s borders, and which could
be at risk of disruption in operations, is Slovakia, where we hold a concession for the D4R7 Bratislava ring road
(although, as of the date of this Annual Report, the impact of the Ukraine conflict in Slovakia has not significantly
impacted our Slovak business, other than through an increase of our labor costs due to the decreased access to
employees from Ukraine, which constituted a significant market for employees carrying out our projects in Slovakia).
Moreover, the situation that began in the Middle East on October 7, 2023, its escalation and any resulting conflicts in
the region (such as the attacks on commercial shipping vessels travelling through the Red Sea) could lead to further
disruptions in supply chains, higher oil and gas prices, the imposition of sanctions, travel and import/export
restrictions, increased inflationary pressures and market volatility, among other potential consequences.
Additionally, as a result of the Ukrainian and Middle East conflicts, there is also an increased risk of cyber-attacks,
and we are particularly exposed to these attacks as a holder of so-called “critical assets,” due to our position as a
provider of critical infrastructure services and solutions. Infrastructures are exposed to a variety of existing threats in
cyberspace (such as hostile government agencies, hacktivists, insiders, and mafias), which may impact or impede (i)
the normal operation of assets, (ii) our ability to generate the expected economic value from our assets, and (iii) our
reputation. Any adverse impact on our digital and technological environments or assets as a result of a cyber-attack
can result in legal claims, regulatory actions, fines, reputational damage, and significant incident response costs. For
more information on our increased risk of cyber-attacks, see “—4. The increase in digitalization and consequently, the
increased risk of cyber threats and misuse of quantum technology, may affect our normal operation of assets and our
ability to generate expected value, which could have a material adverse effect on our business, financial condition,
and results of operations.”
Although we do not foresee material effects to our results of operations as a direct result of the Ukrainian and Middle
East conflicts, the Construction Business Division is the most vulnerable to such effects due to the potential impact the
conflict could have on raw materials within the surrounding area, including cost increases of certain materials and
decreasing availability.
In contrast, our Toll Roads Business Division has been positively impacted by rising toll rates in those assets with
pricing models directly linked to inflation, although it is adversely exposed to possible negative impacts of significant
rises of fuel prices on traffic. Finally, unless there is a significant future escalation, no relevant impact is expected in
the Airports Business Division other than the aforementioned impact to the Dalaman airport in Turkey due to the scant
exposure to passenger traffic (the total number of incoming and outcoming passengers at the airport in a particular
period) from these regions in the airports managed by us, although the effects of inflation on ticket prices as a result,
among others, of the aforementioned fuel cost increases could have a certain consumer dissuasive effect that could
affect our results of operations. For additional information on the worsening of the global economic conditions and
their impact on our business, see “—1. Global economic and political conditions have had and in the future could have
a material adverse effect on our business, financial condition, results of operations, and prospects and may magnify
certain risks that affect our business”.
In addition, the increase in political tensions worldwide because of the conflict in Ukraine increases the risk of a large-
scale armed conflict. In this context, countries tend to boost regional economies at the expense of global integration by
applying competition and trade restrictions, sanctions, investment controls, expropriations, or other restrictions, which
could lead to a global recession with serious effects on global economy.
All of the above factors, as well as any further escalation of the conflict in Ukraine, could have a material adverse
effect on our business, financial condition, results of operations, and prospects.
3.D.1.8The increase in demand for skilled labor in the geographic areas in which we are active makes it more
difficult for us to attract and retain talent, which could impact our competitiveness and have an adverse effect on
our business, financial condition, and results of operations.
The increase in demand for skilled labor (i.e., STEM positions requiring higher education degrees, and more
specifically civil, industrial, or computer engineers, which are normally the main positions required for delivering our
projects and managing our assets) in our main markets and particularly in those markets in which the operations of toll
roads and other transportation-related construction are concentrated, such as in the United States, Spain, and the
United Kingdom, as well as several other western countries, makes it more difficult for us to attract and retain talent,
which could impact our competitiveness.
We may lose certain business opportunities and may not be able to fulfill certain commitments to clients, such as
commitments regarding contractual deadlines or the pre-established quality of work, due to hiring difficulties and/or
understaffing in the event of a potential lack or scarcity of qualified staff. This inability to acquire and retain skilled
labor and the resulting inability to fulfill contractual requirements could have an adverse effect on our business,
financial condition, and results of operations, and may impact our competitiveness. Furthermore, we may experience
lower profit margins due to increased labor costs resulting from a higher demand of skilled labor. This could have an
adverse effect on our business, financial condition, and results of operations.
3.D.1.9Regulators and other stakeholders may demand that our business objectives become more sustainable and
may be willing to penalize us if we do not meet them, and we could be affected by degradation of ecosystems, which
could have a material adverse effect on our business, financial condition, and results of operations.
Both regulators and other stakeholders may demand that our business objectives become more sustainable, both from
an environmental and social point of view, and may be willing to penalize us if we do not meet their expectations and
demands, for example if our activities do not qualify as environmentally sustainable in accordance with the EU
Taxonomy for sustainable activities in accordance with Regulation (EU) 2020/852 on the establishment of a
framework to facilitate sustainable investment , or in accordance with our own commitments in relation to reduction of
CO2 emissions. A misalignment between our strategy and the expectations and demands of regulators and other
stakeholders with regards to sustainability would compromise the fulfillment of our growth and investment objectives.
Furthermore, increasing demands in connection with sustainability by our stakeholders may result in increase in our
compliance costs in this regard.
We also run the risk that our subsidiaries may perform work on projects for governments and public institutions that
do not meet our environmental standards, potentially impacting protected areas or endangered fauna or flora.
In particular, if we are not able to adhere to a call for increased sustainability by certain regulators or stakeholders, we
may face penalties by said regulators and stakeholders, including shareholders, suffer damage to our corporate
reputation, lose our positioning in sustainability indexes, experience an increase in our financing costs, and experience
a negative impact in analysts’ ratings. Furthermore, as a consequence of the financial demands derived from our need
to become more sustainable or of our potential failure to become more sustainable, project financing and our access to
sources of financing may worsen.
Furthermore, if we or our counterparties fail to comply with environmental requirements in the relevant jurisdictions,
we may be subject to investigation or litigation and our reputation and business could be adversely affected. For
example, see “Item 8. Financial Information—A. Consolidated Statements and Other Financial Information—2. Legal
Proceedings —4. Legal Proceedings Related to D4R7 project (Slovakia).”
In addition, biodiversity plays a key role in the provision of ecosystem services that support the economy and social
well-being. The degradation of ecosystems and natural capital entails operational, economic, and reputational risks for
the development of business activities. Particularly, we could be affected by the loss of quality of certain ecosystem
services, such as the lack of water or the reduced availability of certain raw materials. Any of the above factors could
have an adverse effect on our business, financial condition, and results of operations.
3.D.1.10 Accidents may occur at our project sites and facilities and at our infrastructure assets, which may severely
disrupt our operations and cause harm to our employees or customers, which could in turn have a material adverse
effect on our business, financial condition, results of operations, and reputation.
Notwithstanding our implementation of health and safety strategies and systems, and the commitment of our top
management to invest resources in employee health and safety, the occurrence of low-probability high-impact events,
such as accidents, is a material risk to us and these events have taken place in the past and may occur in future.
The frequency rate of serious injuries and fatal accidents, calculated by reference to the total number of serious injuries
and fatal accidents against the total number of hours worked, has decreased by 26% as of December 31, 2024,
compared to December 31, 2022. Nevertheless, this risk remains relevant to us due to, among others, the fact that the
risk of an accident is inherent to the nature of our activities, the variability of the subcontractor’s safety cultures, or
uncontrolled risks caused by third parties in this respect (e.g. driving behaviors of the general public).
Our project sites and facilities, such as toll roads, airports, and construction project sites, may be exposed to incidents
such as fires, explosions, toxic product leaks, and other environmental incidents. In addition, these sites and facilities’
respective employees may be exposed to accidents (for example, falling from a significant height, being hit by vehicles
and machinery, overturning of heavy equipment, and coming in contact with electricity). Any such accidents may
cause death and injury to employees, contractors, and also residents in surrounding areas, and may cause damage to
the assets and property owned by us and third parties, as well as damage to the environment. We are also exposed to a
risk of negative impacts to our business, financial conditions, and results of operations resulting from various types of
damage, including temporary interruption of services as a result of accidents during the course of operations, as well as
impacts connected to accidents involving land and air transport, substances, goods, and equipment.
If an accident occurs at one of our facilities or project sites, in addition to the internal investigation to be carried out in
accordance with our internal policies and protocols, legal proceedings could be initiated by the relevant authorities to
identify the causes of the accident and assess any potential civil, labor, or criminal liability. Such legal proceedings
could result in the relevant facility or project site being closed while the investigation is conducted, disrupting our
operations during the time of such closure. In addition, sanctions may be imposed on us or victims of such accidents
may claim compensation from us and hence may expose us to civil liability.
Furthermore, accidents may occur on our infrastructure assets to the users of the infrastructures, such as incidents on
the toll roads we currently operate, which are more likely when the area is affected by heavy and severe weather
events. For instance, there was a multiple vehicle accident on February 11, 2021 on the NTE 35W in Dallas, Texas.
The accident involved 133 vehicles and resulted in six deaths and other injuries. As a result of this incident, the
concession company NTE Mobility Partners Segment 3 LLC, of which we indirectly own 53.7%, together with several
of our U.S. Companies, have been named parties to 29 claims filed. Of these, three cases have been fully resolved and
one additional case has been partially resolved by the parties. Discovery in the other cases is on-going and the court
has announced that one of the trials will start on July 20, 2025. Following consultation with external legal advisors, the
concession company expects no material impact even in the event of an unfavorable ruling due to the insurance
policies in place. Therefore, no provision has been recorded in relation to this event (see “Item 8. Financial
Information—A. Consolidated Statements and Other Financial Information—2. Legal Proceedings—1. Litigation and
other contingent liabilities relating to the Toll Roads Business Division”).
Any accidents, incidents, and consequential claims for damages, including any reputational damage, and disruptions at
our project sites or facilities, or related to our infrastructure assets, could have a material adverse effect on our
business, financial condition, results of operations, and reputation.
3.D.1.11 Beneficiaries of guarantees provided by our Group Companies could request their execution, which could
have a material adverse effect on our business, financial condition, and results of operations.
Some of our Group Companies provide guarantees to cover liability to customers for improper performance of
obligations under construction contracts. Such guarantees are subject to potential enforcement by customers if a
project were not carried out or failed to meet contractual specifications and requirements. In order to protect ourselves
from any exposure arising from potential liability, we obtain guarantees issued by banks and insurance companies to
cover such exposure. As of December 31, 2024, the balance of such guarantees amounted to EUR 8,260 million (EUR
8,533 million as of December 31, 2023).
Despite the significant amount of guarantees detailed above, the historical impact arising from them has been low,
since our Group has to date performed its contractual obligations in accordance with the terms and conditions agreed
upon with the customers and has recognized accounting provisions against the results of each contract for potential
performance-related risks. However, this may not be indicative of any future potential performance and guarantee
enforcement.
Should any beneficiary enforce any guarantee, such enforcement will have a specific follow-up investigation to verify
whether the request is based on a justified claim. Should a claim be justified, and the guarantees of a relevant or
significant amount be successfully enforced, or should multiple guarantees amounting to relevant or significant
amounts be successfully enforced simultaneously or within short periods of time, such events may have a material
adverse effect on our business, financial condition, and results of operations.
3.D.1.12 We may face increased risks due to climate change, which could have a material adverse effect on our
business, financial condition, and results of operations.
We may be subject to physical and transitional risks in connection with our activities due to climate change. Physical
risks include extreme weather events that may adversely affect our infrastructure and the development of our activity
in most of our Business Divisions. In this sense, our infrastructure and business need to adapt to climate change effects
and be resilient to extreme weather events. Global trends related to climate change and extreme weather may result in
further economic, regulatory, technological, and reputational effects and may require us to reassess our operations. For
instance, we may be forced to discontinue certain operations due to physical damage to infrastructure, productivity
may decrease under certain extreme weather conditions, and hedging and insurance premiums relating to
climatological events may increase.
We periodically perform an assessment and quantification of physical and transition risks related to climate change,
which include the following:
(i)an increase in the cost of energy, both fossil fuels and electricity, and other raw materials specific to each
activity;
(ii)a change in customer behavior by users of transportation modes;
(iii)an increase in reporting obligations on emissions and other environmental and climate considerations;
(iv)the loss of competitiveness in tender processes due to any potential failure to comply with environmental
requirements;
(v)new regulations limiting the use of certain modes of transportation, which would have a significant impact
on the use of the infrastructure we operate;
(vi)increased investor concern about our environmental performance and impact;
(vii)lack of availability of technologies for deep decarbonization in some areas (for example, heavy machinery
for civil works);
(viii)increased maintenance and extraordinary repairs of our infrastructure assets as a result of climatic hazards
such as floods, extreme temperatures, heat waves or drought; and
(ix) lack of availability of new technologies.
Transitional risks, particularly increases in the cost of energy, both fossil fuels and electricity, and other raw materials
specific to each activity, and changes in customer behavior users’ transportation modes, may affect our Business
Divisions.
The above factors could have an adverse effect on our business, financial condition, and results of operations.
3.D.1.13 Our insurance cover may not be adequate or sufficient, which could have a material adverse effect on our
business, financial condition, and results of operations.
In carrying out our activities, which are mainly related to high-value infrastructure assets such as toll roads and
airports, we are subject to possible contingent liabilities arising from the performance of various contracts entered into
by the Companies within our Business Divisions. To protect ourselves from a number of those contingent liabilities,
we have retained insurance cover in relation to:
(i)builders’ risk, property damage and business interruption caused by direct material damage;
(ii)general and auto liability;
(iii)workers’ compensation and employers’ liability;
(iv)directors’ and officers’ liability;
(v)environmental liability;
(vi)damage caused by cyber-attacks; and
(vii)in the United States, employment practices’ liability.
Accidents may occur at our infrastructure projects that may severely disrupt the operations and damage our reputation.
In particular, our toll roads and other infrastructure assets, such as airports, may suffer damages as a consequence of
disruptions caused by natural disasters (as, for example, was the case in connection with a number of toll roads in
Chile following the 2010 earthquake), epidemics or pandemics, extreme weather, wars, riots or political action, acts of
terrorism, or cybersecurity attacks resulting in losses, including loss of revenue, which may not be compensated for
under our insurance contracts, either fully or at all.
Furthermore, certain types of the aforementioned losses (generally, those of a catastrophic nature, such as wars, acts of
terrorism, earthquakes, and floods), may be uninsurable or not economically insurable.
In addition, even if we are adequately insured against potential unexpected events and damages, we may also be
unable to recover losses, in part or at all, in the event of insolvency of our insurers.
Moreover, there can be no assurance that if our current insurance cover is cancelled or not renewed, replacement cover
will be available on commercially reasonable terms, or at all.
Any material uninsured or insured, but non-recoverable, losses could have a material adverse effect on our business,
financial condition, results of operations, and prospects.
3.D.1.14 We may face increased scrutiny and changing expectations with respect to sustainability and ESG
matters, which could impose additional costs on us, impact our access to capital, or expose us to new or additional
risks.
Increased focus, including from regulators, investors, employees, clients, competitors and other stakeholders on
sustainability or ESG matters may result in increased costs (including but not limited to increased costs related to
compliance and stakeholder engagement), impact our reputation, or otherwise affect our business performance.
Negative public perception could damage our reputation or harm our relationships with regulators, employees,
customers, investors, or other stakeholders if we do not, or are not perceived to, adequately address these issues,
including if we fail to demonstrate progress towards any current or future ESG goals. Any harm to our reputation
could negatively impact employee engagement and retention, customers’ willingness to do business with us, and
investment decisions. At the same time, various stakeholders may have divergent views on ESG practices and the
speed of their adoption. This divergence increases the risk that any commitment, position, target or other action or lack
thereof with respect to ESG matters will be perceived negatively by at least some stakeholders and adversely impact
our reputation and business.
It is possible that stakeholders may not be satisfied with our ESG practices or the speed of their adoption. At the same
time, certain stakeholders might not be satisfied if we adopt ESG practices at all. Actual or perceived shortcomings
with respect to our ESG practices and reporting could negatively impact our business. We could also incur additional
costs and require additional resources to monitor, report, and comply with various ESG practices and current or
emerging regulatory requirements, including with respect to climate change and sustainability. For example, we
operate in various jurisdictions in the U.S. that have adopted or proposed federal and state laws related to sustainability
and climate change reporting to which we could eventually become subject. We are currently assessing the potential
impacts of the such adopted or proposed laws, as well as other sustainability and climate-related disclosure obligations
and evolving legal and regulatory requirements, to which we may be subject. Further, not complying with enhanced
sustainability and climate-related disclosure requirements could lead to reputational or other harm to our relationships
with regulators, employees, customers, investors, or other stakeholders.
In addition, various organizations have developed ratings to measure the performance of companies on ESG topics,
and the results of some of these assessments are widely publicized. Such ratings are used by some investors to inform
their investment and voting decisions. Many investors have created their own proprietary ratings that inform their
investment and voting decisions. Unfavorable ratings of our Group or our industry, as well as omission of inclusion of
our stock into ESG-oriented investment funds, may lead to negative investor sentiment and the diversion of investment
to other companies or industries, which could have a negative impact on our stock price and our access to and cost of
capital.
3.D.1.15 Acts of violence, geopolitical unrest, catastrophic events, extreme weather conditions and health
emergencies may disrupt our business.
Labor discord or disruption, geopolitical events, social unrest, war, terrorism, political instability, acts of public
violence, boycotts, hostilities and social unrest, and health emergencies that lead to avoidance of public places or cause
people to stay at home could harm our business.
Our operations, particularly those in the Airports and Toll Roads Business Divisions, cover a broad geographic scope
and are subject to many hazards and operational risks, including a risk of disruptions due to terrorist attacks, or other
acts of violence or geopolitical unrest and similar events. Any geopolitical unrest, including the current situation in the
Middle East, is likely to adversely affect the airport passenger traffic and, consequently, our results in the Airports
Business Division. In the event of a terrorist attack or catastrophic event (such as fire, power loss, telecommunications
failure or cyber-attack) we may be unable to continue operations and may endure system interruptions, reputational
harm, breaches of data security, and loss of critical data, all of which could have an adverse effect on future operating
results.
Moreover, we do not have insurance coverage to cover all of our liabilities related to such hazards or operational risks.
The occurrence of a significant uninsured claim, or a claim in excess of the insurance coverage limits maintained by
us, could harm our business, financial condition and results of operations.
Additionally, natural disasters, catastrophic events, or other emergencies may cause damage or disruption to our
operations, international commerce, and the global economy, and thus could harm our business. For example, extreme
weather conditions in areas in which we operate, such as hurricanes, high winds, flooding, water scarcity or drought,
extreme heat and cold, snow or ice storms and other extreme weather events, as well as disease outbreaks or
pandemics or other health emergencies, as well as major earthquakes or fires (including in each case the reactions of
governments, markets, and the general public), may result in a number of adverse consequences for our business,
operations, and results of operations, many of which are beyond our control.
In addition, we rely on the stable provision of utilities such as telecommunications, power and water that are subject to
disruption or increased costs due to such events, which may cause significant operational disruptions or cause our
operating costs to increase significantly, and we may endure property loss, reputational harm, breaches of data
security, and loss of critical data due to such events, any of which could harm our business, results of operations, and
financial condition.
3.D.1.16 Our business and operations may be adversely affected by violations of applicable anticorruption laws, in
particular the U.S. Foreign Corrupt Practices Act, the EU anti-corruption legislation, the United Kingdom Bribery
Act, or similar worldwide anti-bribery laws.
Our international operations require us to comply with international and national laws and regulations regarding anti-
bribery and anti-corruption, including the U.S. Foreign Corrupt Practices Act, the EU anti-corruption legislation, the
United Kingdom Bribery Act, or similar anti-bribery laws that may be applicable to our business. These laws and
regulations, for example, prohibit improper payments to foreign officials and private individuals for the purpose of
obtaining or retaining business and may include reporting obligations to relevant regulatory and governmental bodies.
The scope and enforcement of anti-corruption laws and regulations may vary. However, many of such laws and
regulations have a broad extraterritorial reach.
Some of the markets in which we operate have experienced governmental corruption to some degree, and some of
them are high risk markets. Therefore, in certain circumstances, strict compliance with anti-bribery laws and reporting
obligations may conflict with local customs and practices. In addition, we use third parties, such as joint venture
partners, in these high-risk markets, which pose an inherent risk to strict compliance with anti-bribery and anti-
corruption laws.
Our compliance programs, internal controls, policies, and procedures may not have always protected and, in the future,
may not always protect us from reckless or negligent acts including bribery of government officials and private
individuals, petty corruption, and misuse of corporate funds committed by our employees or associated third parties,
particularly given our decentralized nature and our use of joint venture arrangements. Violations of these laws, or
allegations of such violations, may lead to fines, findings of criminal responsibility, or harm to our reputation, disrupt
our business, and could result in inaccurate books and records, each of which may have a material adverse effect on
our business, results of operations, financial condition, and prospects. For some examples of the potential
materialization of this risk, see “—2. Risks Related to Legal, Regulatory, and Industry Matters—3. We are subject to
litigation risks, including claims and lawsuits arising in the ordinary course of business, which could have a material
adverse effect on our reputation, business, financial condition, and results of operations”.
3.D.1.17 We may be required to bear the costs of tendering for new contracts, contract renewals, and/or extensions
with no control over the selection process nor certainty of winning the tender, which may adversely affect our
business, financial condition, results of operations, and prospects.
A substantial portion of our work is subject to competitive tender processes. It is difficult to predict whether we will be
awarded contracts due to multiple factors such as qualifications, experience, reputation, technology, customer
relationships, financial strength, and ability to provide the relevant services in a timely, safe, and cost-efficient manner.
Bidding costs associated with tendering for new contracts, extensions in the scope of work, or renewals of existing
contracts can be significant and may not necessarily result in the award of a contract. Furthermore, preparation for bids
occupies management and operating resources.
If we fail to win a particular tender, bidding costs are generally unrecoverable. We participate in a significant number
of tenders each year and the failure to win such tenders may adversely affect our business, financial condition, results
of operations, and prospects.
3.D.1.18 We are dependent on the continued availability, effective management, and performance of
subcontractors and other service providers, the absence of which could have a material adverse effect on our
business, financial condition, results of operations, and prospects.
In the ordinary course of operations, we rely on subcontractors to provide certain services. As a result, our business,
financial condition, results of operations, and prospects may be adversely affected if we are not able to locate, select,
monitor, and manage our subcontractors and service providers effectively. Additionally, subcontractors to whom we
have awarded work may become insolvent, which would require us to select a new subcontractor at the risk of delays
and/or at higher cost. For example, in the Construction Business Division, billing by subcontractors and services
providers represented 76.2% of the total operating cost for the year ended December 31, 2024.
If we are not able to locate, select, monitor, and manage subcontractors and service providers effectively, our ability to
complete contracts on schedule and within forecasted costs to the requisite levels of quality could be adversely
impacted and there may be a material adverse effect on our business, financial condition, results of operations, and
prospects.
3.D.1.19 We may face risks related to past and future acquisitions or divestments, which could have a material
adverse effect on our business, results of operations, and financial condition.
We deploy capital in mergers and acquisitions from time to time. This deployment is subject to various general risks,
including:
i.the inability to sufficiently integrate newly acquired businesses;
ii.the inability to achieve the anticipated benefits from the acquisition;
iii.a loss of critical talent;
iv.the transmission of actual or potential liabilities in connection with such past or future acquisitions
including, but not limited to, third-party liability and tort claims;
v.claims or penalties as a result of breach of applicable laws or regulations;
vi.financial liabilities relating to employee claims;
vii.claims for breach of contract;
viii.claims for breach of fiduciary duties;
ix.employment-related claims;
x.environmental liabilities;
xi.tax liabilities; or
xii.cybersecurity incidents.
For example, we may be subject to environmental liabilities at sites we acquire even if the damage relates to activities
prior to our ownership of such sites. Although acquisition agreements may include covenants and indemnities in our
favor, these covenants and indemnities may not always be insurable or enforceable, or may expire or be limited in
amount, and we may have disputes with the sellers or guarantors, who might become insolvent, regarding their
enforceability or scope.
In addition, we may be unable to cost-effectively integrate the new activities from an acquisition into our business and
realize the performance that we anticipate when acquiring a business. Acquired companies may have lower
profitability or require more significant investments than anticipated, which could affect our profitability margins.
As part of our strategic plans, we may also from time to time divest businesses or assets we no longer deem profitable
or in strategic alignment. For example, on December 12, 2024, the Group completed the divestment of the Group’s
19.75% stake in Heathrow airport, retaining a 5.25% stake. On February 26, 2025, we announced that a binding
agreement has been reached for the sale of that 5.25% remaining stake. Furthermore, on January 28, 2025, we
completed the sale of our entire stake in AGS Airports. For additional details on our divestments, see “Item 4.
Information on the Company —A. History and development of the Company —1. Summary of Historical Investments
and Divestments Any failure to complete our planned divestments in timely manner or on favorable terms, could have
a material adverse impact on our assets, profitability and business operations.
Furthermore, if we are unable to complete the expected divestments in a timely manner it may also impact our brand
and reputation. We are also subject to risks related to the divestment process, in particular with regard to warranties
and indemnities given within the scope of such process and any other potential seller’s liability under the applicable
law. Specifically, we may remain subject to potential environmental liability in relation to entities and businesses we
no longer own due to covenants and indemnities in favor of such entities or the entities’ purchasers under the relevant
sale agreements and related transaction documents.
Environmental, health, and safety requirements and regulations and labor disputes could affect not only activities in
connection with businesses that have been acquired and are in operation, but also activities at businesses that have
been divested or that will be acquired or divested in the future. As a result, past and future acquisitions and
divestments expose us to potential losses and liabilities, and lower than anticipated benefits, which could have an
overall material adverse effect on our business, results of operations, and financial condition.
3.D.1.20 We have experienced, and expect to continue to experience, quarterly fluctuations in our results of
operations.
Our results of operations have fluctuated from quarter to quarter in the past and may continue to vary significantly in
the future so that period-to-period comparisons of our results of operations may not be meaningful. Our quarterly
financial results may fluctuate as a result of a variety of factors, many of which are outside of our control and may be
difficult to predict. Accordingly, our financial results in any one quarter should not be relied upon as indicative of
future performance. Factors that may cause fluctuations in our quarterly financial results include, but are not limited
to:
▪Unforeseen extraordinary events, such as natural disasters, geopolitical events like the recent Ukraine and
Middle East conflicts, pandemics like COVID-19, or accidents at our project sites and facilities could have a
significant impact in our infrastructure assets demand, or result in a reduction in construction activity,
negatively impacting our financial results.
▪Regulatory changes in the highly regulated environments in which we operate, such as decisions taken by
governmental authorities, like the unilateral termination of a concession agreement that, although rare, could
adversely affect our financial results.
▪Internal update of contract end results. We periodically perform a complete review of contract end results for
our construction activities. The complexity and size of some of our contracts and the existing risks inherent
to them may lead to contract end losses arising between quarterly financial results, which would have a
negative impact in our financial results.
▪Seasonality. Typically, construction activity will be higher over the spring and summer months, due to
improved weather conditions. Toll roads traffic and passengers demand will generally also be higher during
spring and summer. Thus, we may expect our second and third quarters revenues to be higher than that of
other quarters.
▪Dividends collected from infrastructure assets, which may vary significantly from quarter to quarter due to
various factors, including project debts refinancing, and traffic levels.
▪Non-recurring events, such as acquisitions, divestments, potential claims and legal disputes, or legal
settlements may have a significant impact in our financial results, especially in our cash flow generation.
▪Other events impacting the normal operations of our assets, such as cyber-attacks.
Any significant fluctuations to our quarterly results of operations could adversely affect our operations, financial
reporting and/or results of operations and affect the price of our ordinary shares.
3.D.1.21Risks relating to the Toll Roads Business Division
3.D.1.21.1 Reduced vehicle use on the toll roads operated by our toll roads concession companies may adversely
impact our business, results of operations, and financial condition.
If our concession companies are unable to have an adequate level of vehicle traffic on their toll roads in the future, our
toll receipts and profitability will suffer and a prolonged and significant reduction in traffic could result in the
bankruptcy of a specific project or concession. The tolls collected by the concession companies on their toll roads
depend on the number of vehicles using such toll roads, their capacity to absorb traffic, their toll rates, and the
existence of competing alternative roads. In turn, traffic volumes and toll receipts depend on a number of factors,
including economic growth, toll rates, the quality, convenience, and travel time on competing roads, toll-free roads or
toll roads that are not part of our portfolio, the increase in capacity of those competing roads, the quality and state of
repair of the toll roads, the economic climate and fuel prices, environmental legislation (including potential measures
to restrict internal combustion engine vehicle use and/or incentives to electric vehicles), and the viability and existence
of alternative means of transportation, such as air and rail transport, buses, and urban mass transportation. In addition,
traffic volumes and toll revenues may be affected by the occurrence of natural disasters and other exceptional events
such as earthquakes, forest fires, and meteorological conditions in the countries in which our concession companies
operate (for example, in Canada and some of the Texas lanes, where climate disruptions caused by usual winter
conditions, as it pertains to the former, and unusual winter conditions, as it pertains to the latter, have affected the
operation of the assets in the past). Measures taken by governments in response to potential future pandemics similar
to COVID-19 may also have an adverse impact in this respect due to the travel restrictions and the institution of social
distancing measures (see “—15. Acts of violence, geopolitical unrest, catastrophic events, extreme weather conditions
and health emergencies may disrupt our business”).
For example, a specific financial risk regarding toll roads usage in connection with 407 ETR exists. The concession
agreement relating to the 407 ETR provides that certain 407 ETR annual traffic levels are to be measured against
annual minimum traffic thresholds prescribed by Schedule 22 to the concession agreement and which are increased
annually up to a pre-established lane capacity. If the actual annual traffic level measurements are below the
corresponding pre-established traffic thresholds, certain amounts calculated under the concession agreement are
payable to the province of Ontario, Canada, in the following year. In April 2020, an amount of CAD 1,775,000 (EUR
1,199,338) corresponding to 2019 traffic calculations was paid to the province of Ontario. In 2020, annual minimum
traffic thresholds prescribed by Schedule 22 could not be met due to COVID-19. We agreed with the province of
Ontario that COVID-19 should be considered a force majeure event under the provisions of the 407 ETR concession
agreement and, therefore, we were not subject to further payments for below-threshold traffic levels for the duration of
2020 and until the end of the force majeure event. We were also in agreement with the province of Ontario that the
force majeure event should terminate at such time when the traffic volumes on 407 ETR reached pre-pandemic levels
(pre-pandemic levels measured as the average traffic volume during the 2017 to 2019 period) or when there was an
increase in toll rates or user charges pursuant to the terms of the concession agreement, which is a unilateral decision
of the concession company. During 2021, 2022, and 2023, the force majeure event has continued to apply, as neither
the toll rates have been raised nor have the traffic levels reached the average traffic volume during the 2017 to 2019
period. On December 29, 2023, the concession company announced a new toll rates schedule that increases the 407
ETR rates starting in February 2024. As a result, the force majeure event will terminate as set forth in the 407 ETR
concession agreement with the province of Ontario and the concession company will be subject to payments for
below-threshold traffic levels, if applicable, commencing in 2025, with a potential first payment due in early 2026.
There is a risk that a substantial payment may be required by the concession company to the province of Ontario as a
result of the termination of the force majeure event, if annual traffic level measurements are below the pre-established
traffic thresholds, as described above.
For the year ended December 31, 2024, our net profit from the Toll Roads Business Division was EUR 663 million,
representing 19.0% of our total net profit (compared to EUR 548 million for the year ended December 31, 2023,
representing 107.2% of our total net profit). Similarly, our Adjusted EBITDA from the Toll Roads Business Division
was EUR 918 million, representing 68.4% of our total Adjusted EBITDA (compared to EUR 799 million for the year
ended December 31, 2023, representing 80.6% of our total Adjusted EBITDA). We received EUR 895 million in
dividends from our toll roads assets (an increase of 27.0%, compared to EUR 704 million in dividends from our toll
roads assets for the year ended December 31, 2023).
The revenues generated by, and dividends distributed from, our Toll Roads Business Division are dependent in part on
our toll rates, with the toll rate structure being usually established under each individual concession agreement.
If we are unable to maintain an adequate level of traffic or traffic toll rates, our business, financial condition, and
results of operations may be adversely affected.
3.D.1.22 Risks relating to the Airports Business Division
3.D.1.22.1 Our aeronautical and non-aeronautical income is subject to risks related to a reduction in flights,
passengers, or other factors outside our control, which could have a material adverse effect on our business,
financial condition, and results of operations.
In relation to our Airports Business Division, the number of passengers using the Dalaman airport (together with the
New Terminal One at John F. Kennedy International Airport, once operational (“NTO at JFK” or “NTO”, the
“Airports”), which is a direct driver of the Airports Business Division’s results, may be affected by a number of
factors, including:
▪adverse macroeconomic developments (including changes in fuel prices and currency exchange rates),
whether affecting the global economy or the domestic economies of the countries in which the Airports are
located;
▪an increase in airfares;
▪large-scale epidemics or pandemics, which could have an adverse impact due to potential travel restrictions,
quarantine requirements, and social distancing measures in the countries in which the Airports are located;
▪heightened geopolitical tensions or war such as the conflicts in Ukraine, the Middle East and any associated
sanctions, which may disrupt the operations of airlines and the Airports;
▪the development of efficient and viable alternatives to air travel, including the improvement or expansion of
existing surface transport systems, the introduction of new transport links or technology, the increased use of
communications technology or the obsolescence of the technologies used;
▪route operators facing financial difficulties or becoming insolvent;
▪an increase in competition from other airports or terminals, including the risk of increase of capacity of these
airports and terminals;
▪decisions by airlines regarding the number, type, and capacity of aircraft (including the mix of premium and
economy seats), as well as the routes utilized;
▪implementation of additional security measures or new security equipment;
▪changes in domestic or international regulation, for instance international trade liberalization developments,
such as Open Skies, or government intervention;
▪disruptions caused by natural disasters, extreme weather, riots, or political action or acts of terrorism or
cybersecurity threats and attacks;
▪restrictions on the use of certain aircraft imposed by national regulatory safety bodies;
▪efforts to decarbonize air travel, including potential limitations to airline and airport capacity; and
▪new taxes that could affect flight demand.
There can be no guarantee that the Airports’ contingency plans will be effective in anticipating and addressing the
effects of the factors listed above. Any of these factors could negatively affect the Airports’ reputation and day-to-day
operations and may result in a decrease in the number of passengers using the Airports, which in turn could have a
material adverse effect on our business, financial condition, and results of operations. A prolonged and significant
reduction in passenger volume could result in the bankruptcy of a specific project or concession.
Passenger numbers and the propensity of passengers to spend in the restaurants and shops located within the Airports
also drive retail concession fees. Changes in the mix of long- and short-haul and transfer and origin and destination
passengers, economic factors, retail tenant defaults, lower retail yields on lease renegotiations, and redevelopments or
reconfigurations of retail facilities at the Airports may also affect levels of retail income at the Airports. Occurrence of
any of these circumstances may result in:
(i)a temporary or permanent decline in retail concession fees;
(ii)reduced competitiveness of the airport retail offering;
(iii)stricter hand luggage and other carry-on restrictions; and
(iv)reduced shopping time as a result of more rigorous and time consuming security procedures.
Non-aeronautical income could decline as a result of a decrease in demand from airport users, such as car rental
operators and airlines leasing check-in counters.
As a general matter, passenger and cargo traffic volumes and air traffic movements depend on many factors beyond
our control, including economic conditions in the countries in which the airports are located, the political situation in
those countries and globally, public health crises, the attractiveness of the destinations that the Airports serve relative
to those of other competing airports, fluctuations in petroleum prices, disruptions of global debt markets and changes
in regulatory policies applicable to the aviation industry. Any of these factors could have a material adverse effect on
our business, financial condition, and results of operations.
3.D.1.22.2 The successful implementation of the capital investment program of NTO and/or the investment in any
other significant asset are subject to, among others, risks related to unanticipated construction and planning issues,
which could have a material adverse effect on our business, financial condition, results of operations, and
prospects.
The capital investment program of NTO at JFK, includes major construction projects and is subject to a number of
risks.
Furthermore, NTO is also a significant design and construction endeavor, with multiple milestones and a schedule that
contemplates completion in phases; as with any major construction effort, the project involves many risks that could
result in cost overruns, in delays or in a failure to complete the project.
Difficulties in obtaining any requisite permits, consents (including environmental consents), licenses, planning
permissions, compulsory purchase orders, or easements could adversely affect the design or increase the cost of the
investment projects or delay or prevent the completion of the project or the commencement of its commercial
operation. We may also experience difficulties in coordination with other projects at JFK, which could affect our
schedule or impact our cost.
Although contractors typically share in cost and schedule risks, NTO may face higher-than- expected construction
costs and delays and possible shortages of equipment, materials, and labor due to the number of major construction
projects in the New York area, respectively. The commencement of commercial operations of a newly constructed
facility may also give rise to start-up problems, such as the breakdown or failure of equipment or processes, failures in
systems integration or lack of readiness of airline operators, closure of facilities, and disruptions of operations and
compliance with budget and specifications. The ability of contractors to meet their financial or other liabilities in
connection with these projects cannot be assured. The construction contract of NTO contain restricted remedies or
limitations on liability such that any such sums claimed or amounts paid may be insufficient to cover the financial
impact of breach of contract.
The failure of NTO to recognize, plan for or manage the extent of the impact of construction projects could result in
projects overrunning budgets, operational disruptions, capital expenditure trigger rebates to airlines, unsatisfactory
facilities, safety and security performance deficiencies, and higher-than- expected operating costs.
Any of these risks could affect NTO’s day-to-day operations and impact our reputation and, consequently, have a
material adverse effect on our business, financial condition, and results of operations.
These unanticipated construction and planning issues are not the only issues that could affect the successful
implementation of the capital investment program of NTO. For example, in deciding to commit to certain investments
in connection with airports, we make certain forecasts and projections, including projections of traffic flows, which are
based on assumptions that we believe are reasonable. Revenues of NTO may be affected by the economic condition of
the airline industry, which is highly competitive and volatile (sensitive to a variety of factors, including cost and
availability of fuel, aircraft, general economic conditions, international trade, governmental regulation, disruption
caused by accidents, acts of war, terrorism, or similar events). The NTO revenues may also be affected by the capacity
and competition by other competing JFK terminals and airports. In a highly competitive environment the revenues of
NTO will also depend on traffic demand for New York and JFK in particular and the capacity of the NTO to attract
airlines to operate in its terminal, as well as the capacity of such airlines to bring sufficient traffic to the terminal and to
comply with their obligations (in particular, financial obligations) under their airlines’ use agreements with NTO. As
NTO is also competing with other terminals within JFK airport for international traffic; the overall demand at JFK and
NTO’s ability to compete with other terminals at the same airport will determine NTO’s success in generating
revenues. The competitive landscape and demand would also determine the prices charged by NTO and
other terminals to the airlines. A very competitive situation with limited demand and spare capacity could lead to price
reductions which would also affect NTO business performance. Any differences between our forecast and projections
and actual results of NTO or any other assets could adversely affect our business, results of operations, prospects, and
financial condition. In particular, as the project is still under construction, NTO’s actual results have a greater
likelihood to differ from the forecasts and projections made at the outset, such that revenues generated from the
operation of the new terminal facilities may be insufficient to support our investment obligations at NTO.
Another risk that should be considered when analyzing NTO’s performance is the fact that it will still need to go
through two subsequent phases (Phase B1 and Phase B2) to accommodate the terminal to traffic needs. Phase B1 and
Phase B2 need to go through design, construction and Port Authority and other governmental approvals and therefore
the costs of such expansions and any variations with respect to the initial plans and their impact in costs and revenues
are also risks which may affect NTO’s financial performance. The schedule for the opening of new gates under each of
these phases will also depend on the traffic demand evolution and the availability of investment financing for each of
them (as well as on regulations applicable from time to time affecting JFK airport or air traffic in general).
3.D.1.23 Risks relating to the Construction Business Division and aspects of our Energy Business Division
3.D.1.23.1 Difficulties in securing private sector projects may adversely affect our business, financial condition,
results of operations, and prospects.
Procurement by private sector companies has in the past sometimes decreased, and could decrease in the future, as a
result of the effects of the economic downturn. Difficulties in securing private sector projects as a result of such
decreases may adversely affect our business, financial condition, results of operations, and prospects.
In addition, private sector companies may be forced to halt projects that are already underway due to a lack of funds,
or they may decide to delay or abandon studies of potential projects while they await more favorable investment
conditions. Whilst standard practice in the private sector is for the construction company to be paid as the works are
executed, we are exposed to loss of revenue if such works are delayed or cancelled. Such risks are also relevant in the
energy construction and energy efficiency service activities of the Energy Business Division.
Reductions in project procurement and delays in the completion of projects by the private sector may adversely affect
our business, financial condition, results of operations, and prospects.
3.D.1.23.2 Any failure to meet construction project deadlines and budgets may have a material adverse effect on
our business, financial condition, results of operations, and prospects.
There are certain risks that are inherent to large-scale construction projects, including energy construction projects,
such as supply chain shortages and increased costs of materials, machinery, and labor. If any of our contractors and
sub-contractors fail to meet agreed deadlines and budgets, or if there are any interruptions arising from adverse
weather conditions, unpredictable geological conditions, or unexpected technical or environmental difficulties, there
may be resulting delays and excess construction costs.
Contractor and sub-contractor liability clauses, included in most standard construction agreements entered into with
contractors and sub-contractors, generally cover these situations, although they may not cover the total value of any
resulting losses.
In the event of construction delays, we may receive revenues later than expected and could face penalties and even
contractual termination. These eventualities could increase our expenses and reduce our income, particularly if we are
unable to recover any such expenses from third parties under our concessions, in which case our business, financial
condition, results of operations, and prospects may be materially adversely affected.
3.D.1.24 Risks relating to the Energy Business Division
3.D.1.24.1 Energy price volatility and difficulties in securing long-term off-take agreements could have a material
adverse effect on our business financial condition, results of operations and prospects.
Our renewable energy generating facilities operate in a volatile price environment that is impacted by external factors
such as commodity prices (gas, GHG emissions where applicable, etc.) that are not under the reasonable control of the
Company. In that context, counterparties might be disincentivized punctually to close long term off-take agreements.
The failure to close such kind of arrangements may have an impact on our ability to stabilize and have predictable cash
flows and therefore reach the expected rates of return in our investments.
3.D.1.25Risks relating to other business lines
3.D.1.25.1 The triggering of performance guarantees in relation to our waste management plants in the U.K. could
have a material adverse effect on our business, financial condition, and results of operations.
We operate waste treatment at four sites in the United Kingdom with the majority of the facilities operated under four
different concession contracts with different local authorities and scheduled to expire between 2026 and 2043. All four
contracts are in their operational phase.
Certain of our contracts include parent company guarantees relating to the performance of the associated underlying
contractual arrangements. As of December 31, 2024, the maximum value supported by these guarantees amounted to
GBP 295 million (EUR 357 million); however, this value is not capped in the event of fraud, willful default, or
criminal conduct or abandonment.
This waste management business was originally developed and operated by the Amey Group (“Amey”) and the
obligations under certain of the contracts were guaranteed by Amey and by Cespa, S.A. (the parent company of the
waste treatment business in Spain) (“Cespa”). However, it was carved out of Amey prior to its sale in 2022.
Therefore, we are responsible for delivering the existing contracts and for the liabilities that may arise under the
associated parent company guarantees. The Group has indemnified the purchasers of each of Amey and Cespa for any
losses suffered in relation to the parent company guarantees prior to their full formal transfer to us.
Certain of the facilities have encountered issues in relation to their construction and operation. As of December 31,
2024, we recognized a provision for future losses in the amount of GBP 22 million (EUR 26 million). This provision
does not include overhead costs of the business which in the year 2024 amounted at GBP 8 million (EUR 9 million).
The occurrence of further issues in connection with the operation of the waste treatment facilities may trigger the
performance guarantees and materially and adversely affect our results of operations and wider financial condition.
3.D.1.25.2 We provide services to a limited number of customers in the mining sector in Chile, which is a highly
regulated sector and is subject to risks.
As further discussed in “Item 4. Information on the Company—B. Business Overview—10. Regulatory Environment—
7. Support services to the mining industry,” we provide services to the mining sector in Chile. Mining is a highly-
regulated activity, in large part due to its inherent risks to health and safety. Health and safety standards in this sector
are particularly stringent. Changes in laws, regulations and standards applicable to our businesses or the business of
our customers could increase our costs of doing business, which could have a material adverse effect on our results of
operations. Furthermore, any accidents or related our operations may damage our reputation and expose us to claims
and litigation, increased insurance premiums or otherwise adversely impact our operations.
Currently we provide our services in this sector in Chile to a limited number of large mining companies that focus on
extraction and refinement of copper. Any factors that could impact our clients’ financial condition or demand for our
services, such as international copper prices, a downturn in the copper mining industry due to lower demand, higher
competition or other factors, could materially impact the need for our services and, in turn, have an adverse effect on
our business, financial condition, and results of operations.
Furthermore, mining services and our activities in this sector are labor intensive. Any changes in legislation that may
impact labor costs, increases in salaries or lack of availability of qualified labor force could lead to increases in costs
that we may not be able to pass on under our contracts in the short-term and to non-compliance with requirements
under our existing contracts. Any of the above-mentioned factors could materially and adversely affect our business,
financial condition, and results of operations.
3.D.2Risks Related to Legal, Regulatory, and Industry Matters
3.D.2.1We operate in highly regulated environments that are subject to changes in regulations and are subject to
risks related to contracts with government authorities, which could have a material adverse effect on our business,
financial condition, and results of operations.
General and industry-specific considerations. We must comply with both (i) specific aviation, toll road, waste
management and treatment, public procurement, and construction and energy sector regulations, as well as (ii) general
regulations in the various jurisdictions where we operate. Each jurisdiction where we provide our services has a
different risk profile and may present different risks, including political and social tensions, locations with limited
access, legal uncertainty, local content requirements, increased tax pressures, or heightened complexity of the profit
margin allocation process. The current geo-economic context has and may further encourage economic policies aimed
at prioritizing national or regional interests, and increasing fiscal pressure in some markets. These interventions could
affect asset management and the development of future projects.
For instance, energy sector is usually highly regulated. Changes in energy markets regulation can have a material
adverse effect in both short-term and long-term results of the business, as they can lead to variation in the financial
condition as well as income and costs of operation of the projects. Transfer of change in law impacts may not be
contemplated in the contractual documents of the affected project and transfer of such detrimental impact to the clients
may not always be feasible or may result in a dispute with the clients.
The rise of protectionist policies and political instability in some areas where we operate may lead to regulatory
changes that adversely impact management of assets and expose us to new risks, a risk which has been accentuated by
the macroeconomic situation generated by the conflicts in Ukraine and the Middle East. Any regulatory changes in the
sectors where we operate could adversely affect our business, financial condition, and results of operations.
Environmental considerations. In the countries where we operate, there are local, regional, national, and supranational
bodies which regulate our activities and establish applicable environmental regulations. These laws may impose strict
liability in the event of damage to natural resources, pollution over established limits, or threats to public safety and
health. Strict and/or criminal liability may mean that we could be held jointly and severally liable with other parties for
environmental damage regardless of whether we have acted negligently, or that we owe fines whether or not effective
or potential damage exists or is proven. Significant liability could be imposed on us for damages, clean-up costs, or
penalties in the event of certain discharges into the environment and environmental contamination and damage, as has
occurred in the past.
Granting and retention of concessions. Our concessions are granted by governmental authorities and are subject to
special risks, including the risk that governmental authorities will take action contrary to our interests or rights under
the concession agreements, which has occurred in the past and may take place in future (this includes, and has
included in the past, unilaterally terminating, amending or expropriating the concessions on public interest grounds, or
imposing additional restrictions on toll rates).
This risk is especially relevant in infrastructure assets, where we enter into most of our agreements with governmental
authorities. Under these concession development agreements or facility agreements, typically, the relevant government
authority, as the concession grantor or lessor, has, in addition to other termination rights for concessionaire default,
certain judicial rulings and other specified matters, a right to terminate the concession/lease unilaterally if such
governmental authority determines that such termination is in its best interests, oftentimes referred to as a right to
terminate for convenience. In the past such termination rights have been exercised in respect of infrastructure assets
and related contractual regimes, and in respect of a limited number of similar concessions in the United States. In the
event that such termination for convenience right is exercised a government authority is typically required to make a
payment to the relevant concessionaire as compensation for such termination.
For example, the 407 ETR, I-77 and I-66 concession contracts stipulate that compensation in the event of termination
for convenience will be at fair market value plus any reasonable costs and expenses incurred due to the termination.
Additionally, under our agreements with the Texas Department of Transportation in respect of our infrastructure assets
in Texas, the amount payable to the relevant concessionaire in respect of any such exercise will typically require a
payment that is calculated by reference to the fair market value of the concession, the outstanding or initial debt
incurred in respect of such concession and/or a guaranteed equity return plus outstanding or initial debt. Although the
agreements regulating such concessions establish both the method and formula for the calculation of the applicable
compensation amount, disputes may arise between the parties as to the ultimate amount of such compensation, the
method used to calculate the same or related interpretation of the contract and applicable provisions.
Furthermore, with respect to airport assets, the concession grantors typically may also terminate the concession
unilaterally in circumstances where no breach or omission by the concession operator has occurred.
In the case of the airport assets within the portfolio of the Airport Business Division, the only concession agreement
that expressly allows the administration to terminate the concession unilaterally is the concession agreement for the
operation of the airport terminals at Dalaman. Under this contract, in the event of a unilateral termination, the
administration must pay to the concessionaire a termination fee for the loss of income corresponding to the remaining
concession period at the time of termination, as determined by independent international audit firms.
Should any actions such as the above be taken by government authorities in any of the jurisdictions in which we
operate, there is no certainty that adequate compensation for any losses arising from such risks will be provided by the
relevant government, which could have a material adverse effect on our business, financial condition and results of
operations.
Development of complex infrastructures. We operate in sectors (toll roads, energy and airports) where a relevant part
of our pipeline depends on public awards for the development, improvement and/or operation of complex
infrastructure. The construction, revamping and entering into operation of such infrastructure assets usually comprises
a wide range of requirements to be fulfilled, such as administrative and environmental permits, land access, rights of
way, as well as construction and interconnection requirements.
Potential delays in any of those, may result in us not completing construction or not entering into operation within the
deadlines set forth by the relevant authority, which may lead to adverse consequences.
3.D.2.2We operate in highly regulated environments and are subject to risks related to the granting of permits and
rights-of-way and securing land rights, which could have a material adverse effect on our business, financial
condition, and results of operations.
Approvals, licenses, permits, and certificates. We require various approvals, licenses, permits, and certificates in the
conduct of our business. We cannot assure that we will not encounter significant problems in obtaining new or
renewing existing approvals, licenses, permits, and certificates required for the conduct of our business, nor that we
will continue to satisfy the conditions under which authorities grant such authorizations. In addition, there may be
delays on the part of the regulatory, administrative, or other relevant bodies in reviewing our applications and granting
the required authorizations. If we fail to obtain or maintain the necessary approvals, licenses, permits, and certificates
required for the conduct of our business, we may lose contracts or be required to incur substantial costs or suspend the
operations of one or more of our projects. Furthermore, to bid, develop, and complete a construction project or an
energy project, we may also need to obtain permits, licenses, certificates, and other approvals from the relevant
administrative authorities. We cannot assure that we will be able to obtain or maintain such governmental approvals or
fulfill the conditions required for obtaining the approvals or adapt to new laws, regulations, or policies that may come
into effect from time to time, without undue delay or at all. Obtaining environmental permits and the acquisition of the
relevant rights-of-way are key elements in the pre-construction phase of many toll roads and transmission line or
energy generation projects in which we are or may be involved in the future.
Land rights and related governmental action. Additionally, we may not be able to secure, timely or at all, the land
rights we need to obtain to build or extend the toll roads, develop the infrastructure assets, or develop energy
infrastructure projects for the concessions in which we have an interest. Securing such land rights is generally
dependent on governmental action, as it often involves governmental authorities taking action to expropriate the land
on which the relevant infrastructure asset is to be constructed.
The entry into force of new regulations and the imposition of new or more stringent requirements as part of permits or
authorizations, or a stricter application of existing regulations, may cause delays or increase our costs or impose new
responsibilities, leading to lower earnings and liquidity available for our activities and the business, in turn materially
adversely affecting our financial condition and results of operations.
3.D.2.3We are subject to litigation risks, including claims and lawsuits arising in the ordinary course of business,
which could have a material adverse effect on our reputation, business, financial condition, and results of
operations.
We are, and in the future may be, a party to judicial, arbitration, and regulatory proceedings. We are exposed to risks
derived from potential lawsuits or litigation of different kinds arising, including in the ordinary course of business. In
relation to these legal risks, and according to prevailing accounting standards, when such risks are deemed probable,
we must make accounting provisions. When such risks are less likely to materialize, we recognize contingent
liabilities. For description of our potential significant liabilities, see “Item 8. Financial Information—A. Consolidated
Statements and Other Financial Information—2. Legal Proceedings” and Note 6.5.1 (Litigation) to the Audited
Financial Statements. For example, as of December 31, 2024, our litigation and tax provisions amounted to EUR 182
million, including provisions of EUR 97 million to account for possible risks resulting from lawsuits and litigation in
progress. The litigation provision amount remained relatively stable compared to the previous year.
Our business strategy is to focus on technically complex projects with long periods of maturation and the development
of which, due to such long period of maturation, may result in non-compliance with agreed quality levels and
committed deadlines. Any such non-compliance or perceived non-compliance risk may give rise to disputes with
clients, counterparties, partners, or stakeholders and potential litigation. In addition, the budgetary constraints faced by
some of our public clients may increase their need or willingness to litigate, and consequently increase our exposure to
the risk of contractual disputes on construction and maintenance projects, as has been the case in the past with regards
to certain of our projects in the United Kingdom, which can negatively impact our return on investment.
Several types of claims may arise in connection with this risk, including:
(i)claims relating to compulsory land purchases required for toll roads construction;
(ii)claims relating to acts, errors, omissions, or to defects in construction projects performed or services
rendered;
(iii)claims for third party liability in connection with the use of our assets or the actions of our employees;
(iv)employment-related claims;
(v)environmental claims; and
(vi)claims relating to tax inspections.
Also, criminal claims against our employees may arise, such as the proceedings relating to potential irregularities in
tenders organized by the Warsaw Municipal Wastewater Treatment Works for contracts for municipal waste disposal.
For further information on this matter, see “Item 8. Financial Information—A. Consolidated Statements and Other
Financial Information—2. Legal Proceedings —4. Matters previously reported —FB Serwis (Poland).”
An unfavorable outcome, including an out-of-court settlement, in one or more of such disputes or proceedings beyond
our total litigation provisions, as well as material new claims and proceedings, could have a material adverse effect on
our reputation, business, financial condition, and results of operations.
3.D.3Risks Relating to Our Structure and Financial Risks
3.D.3.1The Company is a holding company with no direct cash generating operations and relies on our operating
Group Companies to provide itself with funds necessary to meet its financial obligations, which could have an
adverse effect on our business, financial position, results of operations, and prospects.
The Company is a holding company with no material, direct business operations. The principal assets of the Company
are its equity interests in the Group Companies. The Company depends on our operating Group Companies to meet its
financial obligations, including its expenses as a publicly traded company and the payment of dividends. The funds the
Company receives from our Group Companies are in the form of dividend distributions, loans, and other payments.
Regarding our Companies’ dividend distributions, the amount and timing of such distributions will depend, among
other factors, on the laws of our operating Group Companies’ respective jurisdictions, their operating performance, the
decisions of other shareholders of such entities, any restrictions arising in connection with any anticipated actions from
the rating agencies, as well as any financing arrangements entered into by such Group Companies which restrict their
ability to distribute dividends.
For example, due to the impact of COVID-19, the 407 ETR experienced significant declines in traffic volumes, which
decreased operating revenues and the resulting dividends. As a result of these impacts, 407 ETR dividends were
reduced in 2021 and 2022.
Additionally, as an equity investor in our Group Companies, the Company’s right to receive assets upon such Group
Companies’ liquidation or reorganization will be effectively subordinated to the claims of creditors. To the extent that
the Company is recognized as a creditor of subsidiaries, the Company’s claims may still be subordinated to any
security interest in, or other lien on, the relevant Group Company’s assets and to any of their debt or other (lease)
obligations that are senior to the Company’s claims.
3.D.3.2Our joint venture and partnership operations could be affected by our reliance on our partners’ financial
condition, performance, and decisions, which could have a material adverse effect on our business, financial
position, results of operations, and prospects.
A relevant number of our operations are conducted through joint ventures and partnerships, including holding non-
controlling interests in companies that operate some of our main infrastructure assets, such as the 407 ETR. For further
information in respect to our associates in collaboration with whom we operate certain of our assets and investments
(i.e., the companies accounted for using the equity method) see “Item 4. Information on the Company—B. Business
Overview—3. Group Overview—3. Our Business Divisions.”
We may continue to enter into arrangements subject to joint control, such as joint ventures or minority ownership.
Joint ventures, related partnerships, and minority ownership interests are subject to risks related to oversight and
control, compliance, competing business interests, financial liabilities, and difficulties to dispose of the stake due to
the existence of pre-emptive rights. Disputes with joint venture partners may result in the loss of business
opportunities or intellectual property or disruption to, or termination of, the relevant joint venture, as well as to
litigation or other legal proceedings. In the event that risks related to oversight and control, compliance, competing
business interests, financial liabilities, and difficulties to dispose of the stake, in respect of joint ventures, joint venture
partners and minority shareholders materialize, this could result in financial, reputational, and legal consequences,
which could have a material adverse effect on our business, results of operations, and financial condition.
Investment partners may have economic or other interests that do not align with our interests. Furthermore, investment
partners may be in a position to take or influence actions contrary to our interests and plans, which may create
impasses on decisions and affect our ability to implement our strategies and dispose of the affected concession or
entity.
In certain situations, we may not have a controlling stake, and consequently, payment of dividends to us may be
blocked by our partners, which may result in us not being able to optimize the management and value of the specific
joint venture or partnership. Finally, as a result of different interests between the partners, disputes may develop,
resulting in us incurring litigation or arbitration costs and distracting our management from its other tasks. Any of
these factors may adversely affect our business, financial condition, and results of operations.
Examples of projects in which we do not have a controlling stake include some of our main assets, such as our 43.2%
ownership interest in 407 International Inc., the concession operator of the 407 ETR, our 19.9% ownership interest in
IRB Infrastructure Developers Limited (“IRB”), an Indian toll road builder and operator, and our indirect 49.0%
ownership interest in JFK NTO, the concessionaire entity that manages the NTO at JFK concession.
For the year ended December 31, 2024, our total dividends received from our infrastructure assets amounted to EUR
947 million, of which EUR 584 million were received from consolidated entities (61.7% of such total dividends) and
EUR 363 million were received from equity-accounted companies (i.e., business activities with companies in which
joint control is identified) from joint venture and partnership operations (38.3% of such total dividends).
In addition, the success of our joint ventures and partnerships depends on the partner’s satisfactory performance of
their obligations. If our partners fail to satisfactorily perform their obligations as a result of financial or other
difficulties, the joint venture or partnership may be unable to adequately perform contracted services. Under these
circumstances, we may be required to make additional investments to ensure the adequate performance of the
contracted services.
Furthermore, mainly in connection with the Construction Business Division, we could be jointly and severally liable
for both our obligations and those of our partners (although we generally execute counter guarantees with our partners
in order to be held harmless or reduce our risk). In addition, in the ordinary course of our business, we undertake to
provide guarantees and indemnities in respect of the performance of the contractual obligations of our joint venture
entities and partnerships. These guarantees and obligations may give rise to a liability to the extent the respective
entity fails to perform its contractual obligations. A partner may also fail to comply with applicable laws, rules, or
regulations, which may further result in our liability.
Any of the above factors could have a material adverse effect on our business, financial condition, results of
operations, and prospects.
3.D.3.3An increase in inflation may negatively affect our results of operations (mainly in the Construction
Business Division) and an increase in real rates or an increase in inflation with no economic growth may decrease
the value of our assets, which could have a material adverse effect on our business, financial condition, and results
of operations.
Although we are positively exposed to inflation risk in general terms, through toll rates with a great degree of
flexibility or inflation indexation, under scenarios of low or negative economic growth and high inflation, the
additional revenue generated by the toll rate increases may be limited by the negative impact of such increases on
traffic volumes. In addition, if real rates (interest rates adjusted for the effects of inflation) increase, the value of our
assets may be affected, as the effect on present value of discount rates would be offsetting the benefits of inflation in
toll highways.
Any future rises in inflation may have an adverse effect on operating margins under the construction contracts due to
increases in the cost of raw materials and energy, which may affect expected profitability. Although this risk is
partially mitigated in certain jurisdictions by inflation-related price adjustment clauses in contracts (such as in Poland
and in certain contracts in Spain and Canada), the risk may not be adequately hedged from the effects of inflation,
which could have a material adverse effect on our business, financial condition, and results of operations.
We have entered into an inflation derivative in connection with Autema, a toll road project in Spain, in order to fix the
inflation component of our revenue from this project. An increase in inflation would have a negative fair value impact
on this derivative, and could, as such, have a material adverse effect on our business, financial condition, and results of
operations.
3.D.3.4Exchange rate fluctuations could have a material adverse effect on our business, financial condition, and
results of operations.
We have exposure to foreign currency, mainly to the Canadian dollar, the U.S. dollar, the Polish zloty, the Indian
rupee, the pound sterling, the Chilean peso, the Colombian peso, and the Australian dollar.
Our foreign exchange rate risks arise primarily from:
(i)our international presence, through our investments and businesses in countries that use currencies other than
the euro;
(ii)debt denominated in currencies other than that of the country where the business is conducted or the home
country of the company incurring such debt; and
(iii)trade receivables or payables in a foreign currency to the currency of the company with which the
transaction was registered.
In analyzing sensitivity to exchange rate effects, we estimate that a 10% depreciation in the value of the euro at year-
end 2024 against the main currencies in which we hold investments would have an impact on our equity attributable to
shareholders of EUR 322 million, of which 15% would relate to the impact of the Canadian dollar, 27% to the U.S.
dollar and 35% to the Indian rupee.
We establish our hedging strategy by analyzing past fluctuations in both short- and long-term exchanges rates and
have monitoring mechanisms in place, such as future projections and long-term equilibrium exchange rates. These
hedges are made by arranging foreign currency indebtedness, foreign currency deposits, or financial derivatives.
Although we enter into foreign exchange derivatives to cover our significant future expected operations and cash
flows, any current or future hedging contracts or foreign exchange derivatives we enter into may not adequately
protect our operating results from the effects of exchange rate fluctuations which could have a material adverse effect
on our business, financial condition, and results of operations. We are subject to the creditworthiness, and, in certain
circumstances, the early termination of the hedging agreements by hedge counterparties.
We cannot assure that future exchange rate fluctuations will not have a material adverse effect on our business,
financial condition, and results of operations.
3.D.3.5Interest rate fluctuations may affect our net financial expense, which could have a material adverse effect
on our business, financial condition, and results of operations.
Interest rate fluctuations affect our business, which may impact our net financial expense due to the variable interest
on financial assets and liabilities, as well as the measurement of financial instruments arranged at fixed interest rates.
Certain of our indebtedness bears interest at variable rates, generally linked to market benchmarks such as EURIBOR,
Secured Overnight Financing Rate (“SOFR”), Canadian Overnight Repo Rate Average (“CORRA”), and Sterling
Overnight Interbank Average Rate (“SONIA”). Any increase in interest rates would increase our finance costs relating
to variable rate indebtedness and increase the costs of refinancing existing indebtedness and of issuing new debt. This
interest rate fluctuation risk is particularly important in the financing of infrastructure projects and other projects,
which are heavily leveraged in their early stages and the performance of which depends on possible changes in the
interest rate.
For example, a linear increase of 100 basis points in market interest rate curves as of December 31, 2024 would
increase financial expenses in our income statement by an estimated EUR 5 million, of which EUR 2 million would
relate to our interest in infrastructure project companies and EUR 3 million would relate to our interest in ex-
infrastructure project companies. This impact would be offset by any increases in financial results due to the expected
higher return of cash held by us as of that specific date.
Although we enter into hedging arrangements to cover interest rate fluctuations on a portion of its debt, any current or
future hedging contracts or financial derivatives entered into by us may not adequately protect our operating results
from the effects of interest rate fluctuations, which could have a material adverse effect on our business, financial
condition, and results of operations. We are subject to the creditworthiness of hedge counterparties and, in certain
circumstances, the early termination of the hedging agreements by hedge counterparties in the context of interest rate
risk arrangement.
We cannot assure that future interest rate fluctuations would not have a material adverse effect on our business,
financial condition, and results of operations.
3.D.3.6We may not be able to effectively manage the exposure of our liquidity risk, which could have a material
adverse effect on our business, financial condition, and results of operations.
Our assets, especially our infrastructure assets, must be able to secure significant levels of financing for us to be able
to carry out our operations (for example, regarding the NTO at JFK). Certain industries in which we operate, such as
airports and toll roads, are by nature capital-intensive businesses. Therefore, the development and operation of our
assets, especially infrastructure concession assets, require a high level of financing.
Our ability to secure financing depends on several factors, many of which are beyond our control, including:
(i)general economic conditions;
(ii)developments in the debt or capital markets;
(iii)the availability of funds from financial institutions; and
(iv)monetary policy in the markets in which we operate.
Our ability to make payments on and to refinance our debt, as well as to fund future working capital and capital
expenditures, will also depend on our future operating performance and ability to generate sufficient cash. Credit
markets are subject to fluctuations that may result in periodic tightening of the credit markets, including lending by
financial institutions, which is a source of credit for us, and affects our customers’ and suppliers’ borrowing and
liquidity. There is a risk that the markets that provide funding will not always be available to us due to unexpected
events, which may lead to a situation where we cannot honor our liabilities in time. This could also lead to an increase
in our cost of capital. In such an environment, it may be more difficult and costly for us to refinance our maturing
financial liabilities or secure new or additional financing. In addition, if the financial condition of our customers or
suppliers is negatively affected by illiquidity, their difficulties could also have a material adverse effect on us. From
time to time in the past we have provided, and in the future we may provide, financing support in the form of, for
example, equity contributions or shareholder loans in connection with our projects or investments and our exposure to
such additional liquidity risk may affect our business, financial condition, and results of operations,
As it pertains to ex-infrastructure borrowings, there are a number of facilities and one bond maturing in 2025. The
revolving credit facility and the bond have been refinanced in January 2025 (see “Item 5. Operating and financial
review and prospects —B. Liquidity and capital resources —8. Financing —2. Ex-infrastructure project borrowings
—1. Corporate debt”). For the remaining maturities, if we are unable to secure additional financing on favorable
terms, or at all, our growth opportunities would be limited and our business, financial condition, and results of
operations may be materially adversely affected.
Our ability to effectively manage our credit risk exposure may affect our business, financial condition, and results of
operations. We are exposed to the credit risk implied by default on the part of a counterparty (customer, provider,
partner, or financial entity), which could impact our business, financial condition, and results of operations.
The risk of late payments in both the public and private sectors has increased during global financial crises. The cost
of government financing and financing of other public entities has also increased due to financial stress in Europe, and
this may represent an increased risk for our public sector clients.
Although we actively manage this credit risk through credit scoring and eventually, in certain cases, the use of non-
recourse factoring contracts and credit insurance, our risk management strategies may not be successful in limiting our
exposure to credit risk, which could adversely affect our business, financial condition, and results of operations.
3.D.3.7We have entered into equity swaps which could result in losses and have a material adverse effect on our
business, financial condition, and results of operations.
We entered into equity swaps linked to our share price in order to hedge any potential asset losses derived from the
different incentive share plans to which we are a party. Under the general terms of these equity swaps, if, at the
maturity date of each equity swap, our share price decreases below a reference share price (i.e., the strike price agreed
at the inception of each equity swap), we will make a payment to the counterparty. However, if, at the maturity date of
each swap, the share price increases above the reference price, we will receive payment from the counterparty. During
the lifetime of the equity swaps, the counterparty will pay us cash amounts equal to the dividends generated by those
shares and we will pay the counterparty a floating interest rate.
Further, whilst the equity swaps are not deemed to be hedging derivatives under International Accounting Standards
(“IAS”), their market value during a given period of time has an effect on our income statement, which will be positive
if the share price increases or negative if the share price decreases during that period. If our share price decreases
below the reference price, the market value of the swap will decrease and our business, financial condition, and results
of operations may be materially adversely affected.
3.D.3.8Our shareholders in the United States may have difficulty bringing actions and enforcing judgements,
against us, our directors, and our executive officers based on the civil liabilities provisions of the federal securities
laws or other laws of the United States or any state thereof.
We are incorporated in the Netherlands and the vast majority of our directors and executive officers reside outside the
United States, primarily in Spain or the Netherlands. As a result, our shareholders’ ability to bring an action against
these individuals or us in the United States in the event that the shareholders believe their rights have been infringed
under the U.S. federal securities laws or otherwise, or the procedures in relation thereto, may be subject to
uncertainties. Even if our shareholders are successful in bringing an action of this kind, whether they can successfully
enforce a judgment against our directors, executive officers, or us outside the United States is subject to substantial
uncertainty.
3.D.4Risks Relating to Tax
3.D.4.1The Spanish Tax authorities may consider the Merger to fall outside of the Special Tax Neutrality
Regime’s protection, which could have a material adverse effect on our business, financial condition, and results of
operations.
The Company has applied the special tax neutrality regime implemented in Spain pursuant to Chapter VII of Title VII
of the Spanish Law 27/2014 of November 27 on Corporate Income Tax and its implementing regulations, as approved
by Decree Law 634/2015 of July 10 (the “Spanish CIT Law”), implementing in Spain Council Directive 2009/133/EC
of 19 October 2009 on the common system of taxation applicable to mergers, divisions, partial divisions, transfers of
assets and exchanges of shares concerning companies of different Member States and to the transfer of the registered
office of an SE or SCE between Member States. Under this tax neutrality regime, the Merger benefits from total or
partial tax neutrality consisting in the deferral of tax due to the capital gains or losses that may have arisen in
connection with the Merger while maintaining the tax basis of the assets and shares affected by the Merger.
In connection with the application of the special tax neutrality regime, there is a potential risk of a challenge by the
Spanish tax authorities. Specifically, the Spanish tax authorities may, in the course of a tax audit, consider that the
Merger did not take place for a valid business reason and instead occurred with the main intention of obtaining a tax
advantage, a position that the Company expressly rejects. In such case, the Spanish Tax Authorities may deny the
application of such special regime and reverse the intended tax advantages.
Should the Spanish Tax Authorities make such a determination, they will seek to eliminate any intended tax
advantage. The main difference in taxation between the Spanish and the Dutch Corporate Income Tax (“CIT”) regimes
is the participation exemption—while the Netherlands has full participation exemption, in Spain, although the tax
payers enjoy a participation exemption, 5.0% of such exempt dividends and gains are included in the CIT taxable base.
If the Spanish Tax Authorities conclude that avoidance of the inclusion of 5.0% of the exempt dividends and gains in
the CIT taxable base is a tax advantage the Company sought, they may as a result assess the CIT due on the difference
between the fair market value of our assets transferred as a result of the Merger not allocated to a branch in Spain and
the assets’ tax basis. In this regard, the main impact would derive from the gains on the transfer of the ordinary shares;
however, only 5.0% of the gains would be effectively subject to taxation at a 25.0% CIT rate; such part of the gains
would be further reduced by the carry-forward losses that Ferrovial had and deductible expenses, including financial
expenses and pending tax credits.
Although the Company does not believe the foregoing would materially affect our overall business or financial
condition, the tax impact will depend on the appraisal of transferred assets market value made by the competent
authorities, and it could nevertheless result in a significant additional cost.
3.D.4.2We are subject to complex tax laws, including changes thereto, in the jurisdictions in which we operate
which could have a material adverse effect on our business, financial condition, results of operations, cash flows,
and prospects.
We are subject to complex tax legislation in the jurisdictions in which we operate. Our tax treatment depends on the
determination of facts and interpretation of complex provisions of applicable tax law, for which no clear precedent or
authority may be available. Any failure to comply with the tax laws or regulations applicable to us may result in
reassessments, late payment interest, fines, and penalties.
We are exposed to risks based on transfer pricing rules applying to intra-group transactions. Pursuant to such rules,
related companies and enterprises are required to conduct inter-company transactions at arm’s length (i.e., on terms
which would also apply among unrelated third parties in comparable transactions) and to sufficiently document the
relevant transactions. Although we endeavor to follow such arm’s length principle, one or more tax authorities might
challenge the transfer pricing model we have implemented, which may result in disputes, double taxation in two or
more jurisdictions, and the imposition of interest and penalties on underpaid taxes.
The tax rules applicable to us are consistently under review by persons involved in the legislative process and tax
authorities, which may result in the passing of new tax laws, new or revised interpretations of established concepts,
statutory changes, new reporting obligations, revisions to regulations, and other modifications and interpretations. Our
present tax treatment may be modified by administrative, legislative, or judicial interpretation at any time, and any
such action may apply on a retroactive or retrospective basis.
Any change in current tax legislation (including conventions for the avoidance of double taxation) in the countries
where we operate or a change in the interpretation of such legislation by the tax authorities, as well as any change in
accounting standards as a result of the application of tax regulations, could have a material adverse effect on our
business, operating results, and financial position of the Company and our Group Companies. There is also a risk that
unexpected tax expenses may arise or that tax authorities may challenge the general transfer pricing policy we have
adopted, which could have a material adverse effect on our business, operating results, and financial position.
We continue to assess the impact of changes in tax laws and interpretations on our businesses and may determine that
changes to our structure, practice, tax positions, or the manner in which we conduct our businesses are necessary in
light of such changes and developments in the tax laws of the jurisdictions in which we operate. Such changes may
nevertheless be ineffective.
For example, the G20/OECD Inclusive Framework has been working on addressing the tax challenges arising from the
digitalization of the economy. One of the solutions to address the impact and consequence of the digitalization of the
global economy is the Organization for Economic Cooperation and Development’s (the “OECD”) Pillar One and
Pillar Two blueprints, released on October 12, 2020. Pillar One refers to the re-allocation of taxing rights to
jurisdictions where sustained and significant business is conducted, regardless of a physical presence, and Pillar Two
contains a minimum tax to be paid by the multinational enterprises. On December 14, 2022, the EU approved
implementation of Pillar Two.
The Dutch legislative proposal to transpose Pillar Two in the Dutch corporate tax system, titled “Minimum Tax Act
2024 (Pillar Two),”entered into force on January 1, 2024.
This measure aims to ensure that multinationals are subject to a corporation tax rate of at least 15.0%, preventing them
from shifting profits to low-tax jurisdictions in order to minimize the tax that they pay. The Company’s current view is
that the Minimum Tax Rate Act 2024 is not expected to lead to adverse tax consequences for the Group. In principle,
the Minimum Tax Rate Act 2024 is not expected to lead to an increase in taxes payable by us, as we develop our
activity in jurisdictions with a nominal tax rate for CIT purposes above the minimum 15.0% threshold, but it could
have an adverse effect due to the potential increase in our tax compliance obligations.
The original treatment of a tax-relevant matter in a tax return, tax assessment, or otherwise could later be found
incorrect and as a result, we may be subject to additional taxes, interest, penalty payments, and social security
payments. Such reassessment may be due to an interpretation or view of laws and facts by tax authorities in a manner
that deviates from our view.
We are subject to tax audits by the respective tax authorities on a regular basis. As a result of ongoing and future tax
audits or other reviews by the tax authorities, additional taxes could be imposed that exceed the provisions reflected in
previous financial statements. This could lead to an increase in our tax obligations, either as a result of the relevant tax
payment being assessed directly against the Company or as a result of becoming liable for the relevant tax as a
secondary obligor due to the primary obligor’s failure to pay such taxes. Consequently, we may have to engage in tax
litigation to defend or achieve results reflected in prior estimates, declarations, or assessments which may be time-
consuming and expensive and which may be unsuccessful. We are subject to pending litigation on tax matters which
could result in a material amount of tax becoming payable. For further details, see “—3. The final outcome of ongoing
tax proceedings could adversely affect our after-tax profitability and financial results.”
The materialization of any of the above risks could have a material adverse effect on our business, financial condition,
results of operations, cash flows, and prospects.
3.D.4.3The final outcome of ongoing tax proceedings could adversely affect our after-tax profitability and
financial results.
We are a Dutch-based Group with operations in several countries and, thus, are subject to tax in multiple jurisdictions.
Significant judgment is required in determining our global provision for income taxes, deferred tax assets and
liabilities and in evaluating our tax positions in these jurisdictions. For further details, see “—2. We are subject to
complex tax laws, including changes thereof, in the jurisdictions in which we operate which could have a material
adverse effect on our business, financial condition, results of operations, cash flows, and prospects.” We are subject to
tax audits and tax litigation, which could be complex and may require an extended period of time to resolve. While we
believe that our tax positions are consistent with the tax laws of the jurisdictions in which we conduct our business, it
is possible that these positions may be overturned by the relevant tax authorities.
Specifically, we are currently involved in a tax proceeding relating to a previous tax assessments at a supranational
level, see “Item 8. Financial Information—A. Consolidated Statements and Other Financial Information—2. Legal
Proceedings—8. Tax-Related Proceedings.” The outcome of this or any future tax proceedings may have a significant
impact on our tax provisions and could have a material adverse effect on our business, financial condition, results of
operations, cash flows, and prospects.
3.D.4.4The recoverability of our deferred tax assets may be subject to certain limitations, which could have a
material adverse effect on our business, financial position, results of operations, and prospects.
As of December 31, 2024, a significant portion of our recognized deferred tax assets was tax loss carry-forwards and
prepaid taxes from losses incurred by the Company and its subsidiaries. In Spain, for the purpose of assessing the
recoverability of tax loss carry-forwards by our Spanish tax consolidated group, we have decided not to record all the
tax credits for accounting purposes, due to a reasonable doubt that they may be recovered in the short- or medium-
term.
Our current and deferred income taxes may be further impacted by events and transactions arising in the normal course
of business, as well as by special non-recurring items or changes in the applicable tax laws. Changes in the
assumptions and estimates made by our management may result in our inability to recover our deferred tax assets if we
consider that it is not probable that a taxable profit will be available against which the deductible temporary difference
can be used. A future change in applicable tax laws could also limit our ability to recover our deferred tax assets.
Additionally, currently ongoing or potential future tax audits and adverse determinations by the Spanish tax authorities
may affect the recoverability of our deferred tax assets.
Specifically, we currently have ongoing litigation with respect to our CIT assessments pertaining to the tax years 2016
through 2023 (see “Item 8. Financial Information—A. Consolidated Statements and Other Financial Information—2.
Legal Proceedings—8. Tax-Related Proceedings”). On January 18, 2024, the Spanish Constitutional Court issued a
decision declaring unconstitutional Royal Decree-Law 3/2016, on tax measures aimed at the consolidation of public
finances. This decision could affect the outcome of our ongoing CIT litigation. Should the final outcome of the CIT
litigation be favorable, which we believe is likely following the Spanish Constitutional Court’s unconstitutionality
determination, it may result in our tax credits being recoverable and available to the Group in connection with its
future CIT filings, however such outcome is uncertain.
Moreover, as a result of the Merger, the Company’s and its Dutch subsidiaries’ ability to use carry-forward losses and
other tax attributes for Dutch tax purposes that arose prior to the Merger to offset taxable income that arises after the
Merger may be subject to certain limitations, as certain rules apply to restrict such an entity’s use of carry-forward
losses incurred prior to the Merger only to profits arising after the Merger that are attributable to such entity. Any such
limitation on the Company’s or its Dutch subsidiary’s use of carry-forward losses or other tax attributes may adversely
affect our business, financial position, results of operations, and prospects.
The Company and its Spanish subsidiaries that apply the special CIT group regime allowing entities residing in Spain
and permanent establishments forming part of a group regime to be taxed as a single CIT payer would also face
restrictions on its ability to use carry-forward losses and other tax attributes for Spanish tax purposes.
The amounts of tax credits the future use of which could be impacted by these legal restrictions are: (i) in Spain, EUR
76 million of tax loss credits and EUR 32 million of other tax credits, with only EUR 41 million recorded in books as
deferred tax assets, and (ii) in the Netherlands, EUR 74 million tax loss credits, with only EUR 10 million recognized
in books as deferred tax assets.
3.D.4.5If the Company ceases to be a resident in the Netherlands for the purposes of a tax treaty concluded by the
Netherlands, and in certain other events, the Company’s shareholders could potentially be subject to a proposed
Dutch dividend withholding tax in respect of a deemed distribution of the entire market value of the Company less
paid-up capital.
Under a law proposal currently pending before the Dutch parliament, the DWT Exit Tax, the Company will be deemed
to have distributed an amount equal to its entire market capitalization less recognized paid-up capital immediately
before the occurrence of certain events, including if the Company ceases to be a Dutch tax resident for purposes of a
tax treaty concluded by the Netherlands with another jurisdiction and becomes, for purposes of such tax treaty,
exclusively a tax resident of that other jurisdiction, which is the “qualifying jurisdiction.” A qualifying jurisdiction is a
jurisdiction other than a member state of the EU/EEA that does not impose a withholding tax on distributions, or that
does impose such tax but that grants a step-up for earnings attributable to the period prior to the Company becoming
exclusively a resident in such jurisdiction. This deemed distribution would be subject to a 15.0% tax insofar it exceeds
a franchise of EUR 50 million. The tax is payable by the Company as a withholding agent. A full exemption applies to
entities and individuals who are resident in an EU/EEA member state or a state that has concluded a tax treaty with the
Netherlands that contains a dividend article, provided the Company submits a declaration confirming the satisfaction
of applicable conditions by qualifying shareholders within one month following the taxable event. The Company
would be deemed to have withheld the tax on the deemed distribution and have a statutory right to recover this from
the shareholders. Dutch resident shareholders qualifying for the exemption are entitled to a credit or refund, and non-
Dutch resident shareholders qualifying for the exemption are entitled to a refund, subject to applicable statutory
limitations, provided the tax has been actually recovered from them.
The DWT Exit Tax has been amended several times since its initial proposal and is under ongoing discussion. It is
therefore not certain whether the DWT Exit Tax would be enacted and if so, in what form. If enacted in its present
form, the DWT Exit Tax will have retroactive effect as from December 8, 2021.
3.D.4.6The Company operates so as to be treated exclusively as a resident of the Netherlands for tax purposes, but
other jurisdictions may also claim taxation rights over the Company, which could have a material adverse effect on
our business, financial condition, results of operations, cash flows, and prospects, and on the net cash proceeds
received by the Company’s shareholders in respect of distributions by the Company.
The Company has established its organizational and management structure in such a manner that the Company is
regarded to have its residence for tax purposes exclusively in the Netherlands and to exclusively qualify as a Dutch tax
resident for purposes of the Dutch Dividend Withholding Tax Act (the “DWTA”) and the Dutch Corporate Income
Tax Act. However, the determination of the Company’s residency for tax purposes depends primarily upon its place of
effective management, which is largely a question of fact, based on all relevant circumstances. Therefore, no assurance
can be given regarding the final or future determination of the Company’s tax residency by the relevant tax authorities.
If the tax authorities of a jurisdiction other than the Netherlands take the position that the Company should be treated
as a tax resident of exclusively that jurisdiction (including for purposes of a tax treaty), the Company may be liable to
pay an exit tax for Dutch income tax purposes and may also become subject to income tax in such other jurisdiction.
See “—6. If the Company ceases to be a resident in the Netherlands for the purposes of a tax treaty concluded by the
Netherlands and in certain other events, the Company’s shareholders could potentially be subject to a proposed Dutch
dividend withholding tax in respect of a deemed distribution of the entire market value of the Company less paid-up
capital.” In addition, this assessment would result in the Company no longer being part of the Dutch fiscal unity
headed by it, which may subsequently result in certain deconsolidation charges becoming due, and the loss or
restriction of certain tax assets such as carry-forward tax losses.
If the Company is regarded to also have its residence for tax purposes in any other jurisdiction(s) than the Netherlands,
the shareholders could become subject to dividend withholding tax in such other jurisdiction(s), as well as in the
Netherlands.
In each case, this could have a material adverse effect on our business, financial condition, results of operations, cash
flows, and prospects, and on the net cash proceeds received by shareholders in respect of distributions by the
Company. The impact of these risks differs depending on the jurisdictions and tax authorities involved and the
Company’s and its shareholders’ ability to resolve double taxation issues, for instance through mutual agreement
procedures and other dispute resolution mechanisms under an applicable tax treaty, the dispute resolution mechanism
under Council Directive (EU) 2017/1852 of 10 October 2017 on tax dispute resolution mechanisms in the European
Union (in the case of an EU jurisdiction), or judicial review by the relevant national courts. These procedures require
substantial time, costs, and efforts, and it is not certain that double taxation issues can be resolved in all circumstances.
3.D.4.7If the Company is classified as a passive foreign investment company for U.S. federal income tax purposes,
U.S. investors in the Company’s ordinary shares may be subject to adverse U.S. federal income tax consequences.
A non-U.S. corporation will be classified as a passive foreign investment company (“PFIC”) for any taxable year if,
either: (i) 75.0% or more of its gross income for the taxable year consists of “passive income” for the purposes of the
PFIC rules (including dividends, interest, and other investment income, with certain exceptions) or (ii) at least 50.0%
of the value of its assets for the taxable year (determined based upon a quarterly average) is attributable to assets that
produce or are held for the production of “passive income.” The PFIC rules also contain a look-through rule whereby
the Company will be treated as owning its proportionate share of the assets and earning its proportionate share of the
income of any other corporation in which it owns, directly or indirectly, 25.0% or more (by value) of the stock.
Whether the Company is treated as a PFIC is a factual determination to be made annually after the close of each
taxable year and thus may be subject to change. The Company’s PFIC status for each taxable year will depend on facts
including the composition of the Company’s assets and income, as well as the value of the Company’s assets (which
may fluctuate with the Company’s market capitalization) at such time. Based on the nature of the Company’s business,
the ownership, and the composition of the income, assets, and operations of the Company, although not free from
doubt, the Company believes it was not a PFIC for the taxable year ended December 31, 2024.
The determination of the Company’s PFIC status is complex and subject to ambiguities. In addition, the Company’s
PFIC status for the current and future taxable years depends, in large part, on the expected value of its goodwill, which
could fluctuate significantly. Moreover, the U.S. Internal Revenue Service (“IRS”) or a court may disagree with the
Company’s determinations, including the manner in which the Company determines the value of the Company’s assets
and the percentage of the Company’s assets that are passive assets under the PFIC rules. Therefore, there can be no
assurance that the Company will not be classified as a PFIC for the current taxable year or for any future taxable year.
If the Company is treated as a PFIC for any taxable year during which a U.S. Holder (as defined in “Item
10. Additional Information—E. Taxation—2. Material U.S. Federal Income Tax Consequences”) held ordinary
shares, such U.S. Holder could be subject to adverse U.S. federal income tax consequences. See “Item 10. Additional
Information—E. Taxation— 2. Material U.S. Federal Income Tax Consequences” for further discussion on this matter.
3.D.4.8Changes to applicable tax laws and regulations or exposure to additional income tax liabilities could affect
our future business and profitability.
We are a Dutch company and thus subject to Dutch corporate income tax as well as other applicable local taxes on our
operations. Our subsidiaries are subject to the tax laws applicable in their respective jurisdictions of incorporation.
New local laws and policy relating to taxes, whether in the Netherlands or in any of the jurisdictions in which our
subsidiaries operate, may have an adverse effect on our future business and profitability. Further, existing applicable
tax laws, tax rates, statutes, rules, regulations, treaties, administrative practices and principles, judicial decisions or
ordinances could be interpreted, changed, modified or applied to us or our subsidiaries in a manner that could
adversely affect our after-tax profitability and financial results, in each case, possibly with retroactive effect.
Additionally, there is also a high level of uncertainty in today’s tax environment stemming from both global initiatives
put forth by the OECD, and unilateral measures being implemented by various countries due to a lack of consensus on
these global initiatives. As an example, the OECD has put forth two proposals, Pillar One and Pillar Two, that revise
the existing profit allocation and nexus rules (profit allocation based on location of sales versus physical presence) and
ensure a minimal level of taxation, respectively (as of November 4, 2021, the OECD published that 137 countries have
agreed on Pillar Two at a rate of 15.0%. The Dutch legislative proposal to transpose Pillar Two in the Dutch corporate
tax system, titled “Minimum Tax Act 2024 (Pillar Two)”, entered into force on January 1, 2024. Further, unilateral
measures, such as digital services tax and corresponding toll rates in response to such measures, are creating additional
uncertainty. If these initiatives are implemented, they may negatively impact our financial condition, tax liability, and
results of operations and could increase our administrative costs.
3.D.4.9Our tax obligations may change or fluctuate, become significantly more complex, or become subject to
greater risk of examination by taxing authorities, including as a result of plans to expand our business operations,
including to jurisdictions in which tax laws may not be favorable, any of which could adversely affect our after-tax
profitability and financial results.
We currently operate in several jurisdictions in addition to the Netherlands and Spain, such as the United States,
Canada, the United Kingdom and Poland, among others. In the event that our business expands to additional
jurisdictions, our effective tax rates may fluctuate widely. Future effective tax rates could be affected by operating
losses in jurisdictions where no tax benefit can be recorded under the International Financial Reporting Standards
(“IFRS”), changes in deferred tax assets and liabilities, or changes in tax laws. Factors that could materially affect our
future effective tax rates include, but are not limited to: (i) changes in tax laws or the regulatory environment; (ii)
changes in accounting and tax standards or practices; (iii) changes in the composition of operating income by tax
jurisdiction; and (iv) pre-tax operating results of our business.
Outcomes from audits or examinations by taxing authorities could have an adverse effect on our after-tax profitability
and financial condition. Additionally, foreign tax authorities have increasingly focused attention on intercompany
transfer pricing with respect to sales of products and services and the use of intangibles. Tax authorities could disagree
with our intercompany charges, cross-jurisdictional transfer pricing or other matters and assess additional taxes. If we
do not prevail in any such disagreements, our profitability may be affected.
3.D.5Risks Related to Our Ordinary Shares
3.D.5.1The payment of future dividends will depend on our financial condition and results of operations, which
could negatively impact the market price of our ordinary shares.
The Company is a European public limited liability company (Societas Europaea) organized under the laws of the
Netherlands. Under Dutch law, distribution of dividends may take place only after the adoption of the Company’s
annual accounts referred to in article 2:391 2 of the Dutch Civil Code (Burgerlijk Wetboek) (the “BW”) by the general
meeting of the Company (the “General Meeting”), showing that the distribution is allowed. Furthermore, the
distribution by the Company of interim dividends and the distribution of dividends in the form of ordinary shares are
subject to the prior approval of our board of directors (the “Board”).
A distribution to shareholders by the Company will be allowed under the terms of articles 2:391 BW insofar as the
Company’s equity exceeds the sum of the paid-up and called-up share capital, increased by the reserves required to be
maintained by either Dutch law or the Articles of Association. Once the annual accounts are available, the Board will
determine whether the Company is able to, or should, make distributions in accordance with Dutch law. As a holding
company with no direct cash generating operations, the Company depends on its operating Group Companies to
generate the funds necessary to meet its financial obligations, as well as the payment of dividends.
The declaration and payment of any dividend distribution will be subject to the discretion of the Board, which will
determine whether the Company should make distributions. Future dividends or distributions, if any, and their timing
and amount, may be affected by, among other factors, the Board or senior management team’s views on potential
future capital requirements for strategic transactions, earnings levels, contractual restrictions, the cash position and
overall financial condition, debt related payments and commitments we may incur, including restrictive covenants
which may limit the ability to pay a dividend, changes in tax or corporate laws, the need to invest in our business
operations and such other factors as the Board or senior management may deem relevant.
Dividend or other distribution payments may change from time to time, and we cannot provide assurance that we will
declare dividends or other distributions in any particular amounts (including with regards to prior shareholder
distributions schemes that we could have put in place) or at all as the payment of any such dividends or other
distributions will depend on our ability to generate profits available for distribution and cash flow.
3.D.5.2Rights of holders of shares may be limited, particularly outside the Netherlands and Spain, and as a result,
shareholders may suffer dilution.
Pursuant to a resolution adopted by the General Meeting, the Board has been authorized, for a period of eighteen
months (from April 11, 2024, the date of our General Meeting, through October 10, 2025), to (i) issue shares or grant
rights to subscribe for ordinary shares up to a maximum of 10.0% of our issued share capital on April 11, 2024 (the
date of our General Meeting), and to limit or exclude pre-emptive rights in relation thereto, for any and all corporate
purposes, and (ii) issue shares or grant rights to subscribe for ordinary shares up to a maximum of 5.0% of our issued
share capital on April 11, 2024 (the date of our General Meeting), and to limit or exclude pre-emptive rights in relation
thereto, for the implementation of one or more scrip dividends as may be resolved on by our Board.
Furthermore, the securities laws of certain jurisdictions may restrict the ability of certain shareholders outside the
Netherlands and Spain to participate in future equity offerings, who may therefore suffer dilution. In particular,
shareholders in the United States may not be entitled to exercise pre-emptive rights or participate in a rights offer,
unless either our ordinary shares and any other securities that are offered and sold are registered under the Securities
Act, or are offered pursuant to an exemption from, or in a transaction not subject to, the registration requirements of
the Securities Act. We cannot assure prospective investors that any Annual Report would be filed as to enable the
exercise of such shareholders’ pre-emptive rights or participation in a rights offer, or that any exemption from such
securities law requirements would be available to enable shareholders in the United States or other jurisdictions to
exercise their pre-emption rights or, if available, that we would use any such exemption. If the Company increases its
share capital in the future, shareholders who are not able to exercise a potential pre-emptive right (in accordance with
the laws applicable to them) should take into account that their interest in the Company’s share capital may be diluted
as a result, possibly without such dilution being offset by any compensation received in exchange for subscription
rights.
In addition, the Company has in the past and may in the future offer, from time to time, a share dividend election to its
shareholders, subject to applicable corporate and securities laws and regulations. However, the Company may not, or
may not be able to, permit shareholders and other prospective investors with registered addresses, or who are resident
or located in, or who are organized under the laws of, certain restricted jurisdictions, to exercise this election subject to
certain exceptions. Accordingly, shareholders and other prospective investors in these restricted jurisdictions may be
unable to receive dividends in the form of ordinary shares rather than cash and may, as a result, suffer dilution.
3.D.5.3The multiple listings of our ordinary shares in different jurisdictions may adversely affect the liquidity and
price of our ordinary shares.
Our ordinary shares are admitted to listing and trading on Nasdaq, Euronext Amsterdam and the Spanish Stock
Exchanges. Our ordinary shares on these markets trade in different currencies (U.S. dollars on Nasdaq and EUR on
Euronext Amsterdam and the Spanish Stock Exchanges) and take place at different times (as a result of different time
zones, different trading days and different public holidays in the United States, Spain and the Netherlands).
Multiple listings may adversely affect liquidity and trading prices for our ordinary shares on one or more of the
exchanges due to the above-mentioned factors or other circumstances, which may be beyond our control. For example,
the multiple listings may increase share price volatility as trading will be split between the three markets, resulting in
less liquidity on the various exchanges. Different liquidity levels, trading volumes, market conditions and regulatory
conditions (including the imposition of capital controls) on the various exchanges may result in different prevailing
prices and any decrease in the price of our ordinary shares on one exchange could cause a decrease in the trading price
of our ordinary shares on another exchange.
Investors could seek to sell or buy our ordinary shares to take advantage of any price differences between the markets
through a practice referred to as arbitrage. Any arbitrage activity could create unexpected volatility in both the prices
and the volumes of the shares available for trading on the exchanges. In addition, investors may not be able to sell or
buy our ordinary shares on an exchange in case of a technological malfunction or other failure, or trading halt, which
may further increase the risk of arbitrage activities and create unexpected volatility in the trading price of our ordinary
shares.
3.D.5.4Future issuances of additional ordinary shares or debt or equity securities convertible into our ordinary
shares may adversely affect the market price of our ordinary shares and dilute investors’ shareholdings.
The rights of our shareholders are governed by Dutch law, the Articles of Association and other internal rules. In the
event of an increase in our share capital, holders of our ordinary shares are generally entitled to full pre-emptive rights
unless these rights are limited or excluded either by virtue of Dutch law, a resolution of the General Meeting pursuant
to a proposal of the Board, or by a resolution of the Board (if the Board has been designated by the General Meeting or
the Articles of Association for this purpose). Pursuant to a resolution adopted by the General Meeting, the Board has
been authorized, for a period of eighteen months (from April 11, 2024, the date of our General Meeting, through
October 10, 2025), to (i) issue shares or grant rights to subscribe for ordinary shares up to a maximum of 10.0% of our
issued share capital on April 11, 2024 (the date of our General Meeting), and to limit or exclude pre-emptive rights in
relation thereto, for any and all corporate purposes, and (ii) issue shares or grant rights to subscribe for ordinary shares
up to a maximum of 5.0% of our issued share capital on April 11, 2024 (the date of our General Meeting), and to limit
or exclude pre-emptive rights in relation thereto, for the implementation of one or more scrip dividends as may be
resolved on by our Board.
As of December 31, 2024, we had 729,559,951 ordinary shares issued, of which 721,806,552 ordinary shares were
outstanding and 7,753,399 ordinary shares were held by the Company as treasury shares. In the future, we may seek to
raise capital through public or private debt or equity financings by issuing additional shares, debt or equity securities
convertible into shares or rights to acquire these securities, and exclude the pre-emptive rights pertaining to then
outstanding shares. Moreover, we may seek to issue additional shares as consideration for, or otherwise in connection
with, the acquisition of new businesses. Furthermore, we may issue new shares in the context of any new employment
arrangement for employees. The issuance of any additional shares may dilute our then-existing shareholders’ interest
in the Company if they do not have preferential subscription rights in connection with the issuance, if they do not
exercise their pre-emptive rights or if such rights are totally or partially excluded. Moreover, any new securities that
we may issue may have rights, preferences or privileges senior to those of our existing shareholders.
In addition, in the past, typically on a semi-annual basis in May and November of each year, we paid our dividends by
way of an optional scrip dividend, allowing our shareholders to elect payment of dividends in either cash or newly
issued ordinary shares. Our most recent scrip dividend was paid out in November 2024. In the future, we expect to
continue such periodic practice and anticipate paying our scrip dividend on a semi-annual basis on or about May and
November of each year. Any ordinary shares that we issue, including under any scrip dividends, options plans or
otherwise, could dilute the percentage ownership held by the investors who own our ordinary shares at that time.
3.D.5.5The requirements of being a public company, including compliance with the reporting requirements of the
Exchange Act and the requirements of the Sarbanes-Oxley Act, may strain our resources, increase our costs, and
we may be unable to comply with these requirements in a timely manner
As a public company, we need to comply with new laws, regulations and requirements, certain corporate governance
provisions of the Sarbanes-Oxley Act, related regulations of the SEC, including filing interim and annual financial
statements, and the requirements of Nasdaq. Complying with these statutes, regulations and requirements has and will
absorb a significant amount of time of our Board of Directors and management and may significantly increase our
costs and expenses. We will need to continue to:
▪increase the resources of compliance function, including for financial reporting and disclosures;
▪prepare and distribute periodic public reports in compliance with our obligations under federal securities
laws;
▪comply with rules promulgated by Nasdaq;
▪prepare and distribute periodic public reports in compliance with our obligations under federal securities
laws;
▪enhance our investor relations function;
▪review and maintain internal policies, such as those relating to insider trading; and
▪involve and retain to a greater degree outside counsel,accountants and other consultants and advisors in the
above activities.
As a U.S.-listed public company, we will be required to furnish a report by management on, among other things, the
effectiveness of our internal control over financial reporting pursuant to Section 404(a) in the second annual report
following the completion of our U.S. listing. This assessment will need to include disclosure of any material
weaknesses identified by our management in our internal control over financial reporting. The rules governing the
standards that must be met for our management to assess our internal control over financial reporting are complex and
require significant documentation, testing and possible remediation. Additionally, our independent registered public
accounting firm will be required to formally attest to the effectiveness of our internal control over financial reporting
pursuant to Section 404(b). At such time, our independent registered public accounting firm may issue a report that is
adverse in the event it is not satisfied with the level at which our internal control over financial reporting is
documented, designed or operating. To achieve compliance with Section 404, we are engaged in a process to
document and evaluate our internal control over financial reporting, which is both costly and challenging. In this
regard, we will need to continue to dedicate internal resources, potentially engage outside consultants, and adopt and
pursue a detailed work plan to assess and document the adequacy of internal control over financial reporting, continue
steps to improve control processes as appropriate, validate through testing that controls are functioning as documented,
and implement a continuous reporting and improvement process for internal control over financial reporting. Despite
our efforts, there is a risk that we will not be able to conclude, within the prescribed time frame or at all, that our
internal control over financial reporting is effective as required by Section 404. For example, as previously disclosed,
we have in the past identified material weaknesses in our internal control over financial reporting, and as
December 31, 2024, one of the previously identified material weaknesses has not been remediated. If we identify
further material weaknesses, it could result in an adverse reaction in the financial markets due to a loss of confidence
in the reliability of our financial statements. As a result, the market price of our ordinary shares could be negatively
affected, and we could become subject to investigations by the SEC or other regulatory authorities, or private
litigation, which could require additional financial and management resources.
The changes necessitated by becoming a public company require a significant commitment of resources and
management oversight that has increased, and may continue to increase, our costs and might place a strain on our
systems and resources. Such costs could have a material adverse effect on our business, financial condition and results
of operations.
In addition, we expect that being a public company subject to these rules and regulations may make it more difficult
and more expensive for us to obtain director and officer liability insurance, and we may be required to accept reduced
policy limits and coverage or incur substantially higher costs to obtain the same or similar coverage. As a result, it may
be more difficult for us to attract and retain qualified individuals to serve on our Board of Directors or as executive
officers. We are currently evaluating these rules and implementation, and we cannot predict or estimate the amount of
additional costs we may incur or the timing of such costs.
3.D.5.6In our registration statement on Form 20-F, filed with the SEC on April 29, 2024, we identified three
material weaknesses in our internal control over financial reporting. We have concluded that those material
weaknesses have been remediated as of December 31, 2024, except for the insufficient monitoring controls in
relation to the activity of privileged users of IT applications. This issue has been reported as a material weakness as
of December 31, 2024. If due to this material weakness, or if we identify additional material weaknesses in the
future, we may not be able to accurately or timely report our financial information and such failure could result in
a negative reaction in the financial markets due to a loss of confidence in the reliability of our financial
information and the market price of our shares may be adversely affected.
As part of the work done for the planned listing of our ordinary shares on Nasdaq, we started a process to determine
whether our existing system of internal control over financial reporting (“ICFR”) was compliant with Section 404 of
the Sarbanes-Oxley Act (“SOX”). Through this exercise we identified three material weaknesses, as controls in our
previous ICFR system were not designed at the level required by SOX. A material weakness is a deficiency, or a
combination of deficiencies in ICFR, such that there is a reasonable possibility that a material misstatement of the
company’s annual financial statements will not be prevented or detected on a timely basis.
The material weaknesses identified in our registration statement on Form 20-F, filed with the SEC on April 29, 2024
(the “20-F Registration Statement”), related specifically to: (i) lack of evidence of management review controls
pertaining to control attributes, precision level applied and documentation of matters resolved and over the
completeness and accuracy of reports used in the controls, (ii) lack of designed, implemented and operating
effectiveness testing internal controls over information technology general controls impacting systems and
applications used in significant processes, and (iii) lack of control design to ensure appropriate segregation of duties is
maintained in recording transactions.
As of December 31, 2024, we have completed the design and implementation of remedial efforts with respect to the
three material weaknesses identified in our 20-F Registration Statement, and performed a testing exercise of controls
following the implementation of such remedial efforts. Following the assessment of the testing results, we have
concluded that the three material weaknesses identified in the 20-F Registration Statement have been remediated,
except for the insufficient monitoring controls in relation to the activity of privileged users of IT applications within
the previously identified material weakness related to information technology general controls referenced above.
For further details regarding our remediation efforts with respect to the previously identified three material weaknesses
see “Item 15. Controls and Procedures —D. Changes in Internal Control Over Financial Reporting”.
As of December 31, 2024, we are not yet required to make a formal assessment of the effectiveness of our internal
control over financial reporting in accordance with the requirements of Section 404 of SOX. As such, we have not
conducted a full operating effectiveness testing of all the controls performed in the year ended December 31, 2024
and, furthermore, we have, in the course of conducting the testing exercises referenced above, identified certain
additional deficiencies. As a result of the foregoing, we cannot provide assurance that the measures we are taking will
be sufficient to remediate the remaining material weakness or avoid the identification of additional material
weaknesses in the future. We will be required to furnish a report by our management on our ICFR under Section 404
of SOX in our second annual report on Form 20-F and a full operating effectiveness assessment will be performed for
the first time as of December 31, 2025. Our independent registered public accounting firm will also be required to
attest the effectiveness of our ICFR at that time. Any testing by us conducted in connection with Section 404 of SOX,
or any testing by our independent registered public accounting firm, may reveal additional deficiencies in our ICFR
that are deemed to be material weaknesses.
Considering these factors, if we identify additional material weaknesses in the future or otherwise fail to maintain an
effective system of ICFR, we may not be able to accurately or timely report our financial information and such failure
could result in a negative reaction in the financial markets due to a loss of confidence in the reliability of our financial
information, which could negatively affect the market price of our shares. In addition, we may be required to incur
additional costs in connection with maintaining and improving our internal control system and hiring additional
personnel. Any such action could negatively affect our results of operations and cash flows.
3.D.5.7As a foreign private issuer, we are permitted to follow certain home country corporate governance
practices instead of certain SEC and Nasdaq requirements, which may result in less protection than is afforded to
investors under rules applicable to U.S. domestic issuers.
As a foreign private issuer, we are permitted to follow certain home country corporate governance practices instead of
those otherwise required by Nasdaq for U.S. domestic issuers. For instance, we are permitted to follow, and in some
cases follow, Dutch home country practices with respect to, among other things, composition and function of the
committees of our Board, certain quorum requirements, shareholder approval requirements with respect to employee
share plans, and other general corporate governance matters. In addition, in certain instances, we may choose to follow
our home country law, instead of Nasdaq rules applicable to U.S. domestic issuers that would require that we obtain
shareholder approval for certain dilutive events, such as an issuance that will result in a change of control of our
Company, certain transactions other than a public offering involving issuances of a 20.0% or more interest in our
Company and certain acquisitions of the stock or assets of another company. Following our home country corporate
governance practices as opposed to the requirements that would otherwise apply to a U.S. company listed on Nasdaq
may provide less protection than is afforded to investors under Nasdaq rules applicable to U.S. domestic issuers. For
additional detail regarding home country practices we have elected to follow see “Item 16G, Corporate Governance”
of this Annual Report.
In addition, as a foreign private issuer, we are exempt from the rules and regulations under the Exchange Act related to
the furnishing and content of proxy statements and the requirements of Regulation Fair Disclosure (“Regulation FD”),
and our directors, officers and principal shareholders will be exempt from the reporting and short-swing profit
recovery provisions of Section 16 of the Exchange Act. In addition, we are not required under the Exchange Act to file
annual, quarterly and current reports and financial statements with the SEC as frequently or as promptly as domestic
companies whose securities are registered under the Exchange Act.
3.D.5.8Investors may suffer adverse tax consequences in connection with owning and disposing of our ordinary
shares.
The tax consequences in connection with owning and disposing of our ordinary shares may differ depending on a
shareholder’s particular circumstances including, without limitation, where such shareholder is a tax resident. Such
difference in tax consequences could, for example, relate to the taxation of distributions made to a shareholder for
Spanish and Dutch dividend withholding tax purposes and the possibilities for a shareholder to obtain a credit, refund,
or other type of relief in connection therewith. These differences could be materially adverse to shareholders and they
should seek their own tax advice about the tax consequences in connection with owning and disposing of our ordinary
shares.
3.D.6General Risk Factors
3.D.6.1Our operating results and the market price of our ordinary shares have been and may be, volatile, and, you
may lose all or part of your investment.
Our quarterly operating results are likely to fluctuate in the future in response to numerous factors, many of which are
beyond our control, including each of the factors set forth above. In addition, securities markets worldwide have
experienced, and are likely to continue to experience, significant price and volume fluctuations. This market volatility,
as well as general economic, market or geopolitical conditions, could subject the market price of our ordinary shares to
wide price fluctuations regardless of our operating performance.
These and other factors, many of which are beyond our control, may cause our operating results and the market price
and demand for our ordinary shares to fluctuate substantially, which may limit or prevent investors from readily
selling their shares and may otherwise negatively affect the liquidity of our ordinary shares. In addition, in the past,
when volatility has affected the market price of a company’s shares, holders of those shares have sometimes instituted
securities class action litigation against the company that issued the shares. If any of our shareholders were to bring a
lawsuit against us, we could incur substantial costs defending the lawsuit. Such a lawsuit could also divert the time and
attention of our management from our business, which could significantly harm our profitability and reputation.
3.D.6.2If securities or industry analysts cease to publish research or publish inaccurate or unfavorable research
about the Company’s business, the trading volume and price of our ordinary shares could decline.
The trading market for our ordinary shares depends in part on the research and reports that securities or industry
analysts publish about the Company or its business. In addition, if one or more of the analysts covering the Company
downgrade our ordinary shares or publish inaccurate or unfavorable research about the Company’s business or
industry, the price for our ordinary shares could decline. If one or more of these analysts cease coverage of the
Company or fail to publish reports on the Company regularly, demand for our ordinary shares could decrease, which
could cause its price and trading volume to decline.
3.D.6.3If the Shares cease to be eligible for deposit and clearing within the facilities of DTC, then transactions in
the Shares may be disrupted.
The facilities of the Depository Trust Company (“DTC”) are a widely used mechanism that allows for rapid electronic
transfers of securities between the participants in the DTC system, which include many large banks and brokerage
firms. The Shares are eligible for deposit and clearing within the DTC system. Even though DTC has accepted the
Shares for deposit and clearing within the DTC system, it generally has discretion to cease to act as a depository and
clearing agency for the Shares. If DTC determined at any time
that the Shares were not eligible for continued deposit and clearance within its facilities, then the Shares would not be
eligible for continued listing on a U.S. securities exchange and trading in the Shares would be disrupted. While we
would pursue alternative arrangements to preserve our listings and maintain trading, any such disruption could have a
material adverse effect on the trading price of the Shares.
ITEM 4. INFORMATION ON THE COMPANY
4.A.History and Development of the Company
Corporate Information
Our principal executive office is located at GR Gustav Mahlerplein 61-63, Symphony Towers, 14th floor, 1082 MS
Amsterdam, The Netherlands. The telephone number of our office is +31 20798 37 00.
We also maintain a website at www.ferrovial.com. We use our website as a means of disclosing material non-public
information. Such disclosures will be made available on the “Investors” section of our website. Accordingly, investors
should monitor such sections of our website, in addition to following our press releases, SEC filings and public
conference calls and webcasts. The information contained on our website or available through our website is not
incorporated by reference into, and should not be considered a part of, this Annual Report, and the reference to our
website in this Annual Report is an inactive textual reference only. We have included our website address, and
references to various other documents, in this Annual Report solely for informational purposes. Our agent for service
of process in the United States is CT Corporation System, which maintains its principal offices at 28 Liberty Street,
42nd floor, New York, NY 10005. Its telephone number is (212) 894-8940.
4.A.1Summary of Historical Investments and Divestments
The following summary provides an overview of our material transactions, including our related material investments
and divestments since January 1, 2022. For an overview of our investments and divestments by segment during the
period, see “Item 5. Operating and Financial Review and Prospects—B. Liquidity and Capital Resources—7.
Investments and divestments.”
We have also completed certain debt issuances since 2022, which are described under “Item 5. Operating and
Financial Review and Prospects—B. Liquidity and Capital Resources—8. Financing—2. Ex-infrastructure project
borrowings.”
4.A.1.1Sale of AGS Airport
On November 13, 2024, we through our subsidiary Hubco Netherlands B.V announced an agreement with Avialliance
UK Limited for the sale of our entire stake (50%) in AGS Airports Holdings Limited (AGS), the parent company
owning the Aberdeen, Glasgow and Southampton Airports. As part of the agreement, Macquarie (Ferrovial’s joint
venture partner in AGS) also agreed to sell its entire stake (50%) in AGS. The agreement values 100% of the stake at
£900 million, representing the equity value for a 100% interest in AGS and is subject to certain closing adjustments
and transaction costs. This price represents an Enterprise Value (EV) estimated at £1,535 billion. Following
satisfaction of applicable regulatory conditions, the sale was completed on January 28, 2025 for a price of GBP 900
million, of which approximately GBP 450 million are Ferrovial net proceeds. This is expected to give rise to a capital
gain of approximately EUR 297 in the first quarter of 2025.
4.A.1.2Sale of Heathrow Stake
On November 28, 2023, we, through our subsidiary, Hubco Netherlands B.V. (“Hubco”), entered into a share purchase
agreement (the “Heathrow SPA”) with InfraEuropa SCA represented by its managing general partner InfraEuropa
Management S.a r.l (entities and funds managed or controlled by Ardian France SA and its affiliates) (“Ardian”) and
Alrahala First Investment Company (a wholly owned subsidiary of The Public Investment Fund) (“PIF”, together with
Ardian, the “Buyers”) pursuant to which Hubco agreed to sell and the Buyers agreed to purchase Hubco’s full stake
(approximately 25% interest) in FGP Topco Limited, a direct shareholder of Heathrow Airports Holdings Limited
(“HAH”), the owner of the Heathrow airport in London, United Kingdom (the “Heathrow Transaction”).
The Heathrow Transaction was conditional upon, among other things, the full tag-along rights in favor of the other
HAH shareholders, such that any shares decided to be sold by such shareholders in the exercise of the aforementioned
right should also be sold as part of the Heathrow Transaction. In January 2024, in accordance with the tag-along
process, some of the shareholders of FGP Topco Limited exercised their tag-along rights in respect of shares
representing 35% of the share capital of FGP Topco Limited (the “Tagging Shareholders”). As a result of this exercise,
Ardian and PIF made a revised offer to acquire shares representing 37.62% of the share capital of FGP Topco Limited
for GBP 3.3 billion, (including our share (19.75%) for GBP 1.7 billion). The offer was accepted by us and certain of
the Tagging Shareholders, and, as a result, an agreement was entered into on June 14, 2024 pursuant to which we and
certain Tagging Shareholders agreed to sell part of their shares in FGP Topco Limited such that we would retain
5.25% of the issued share capital of FGP Topco Limited. Following the sale, we, together with the Tagging
Shareholders, hold shares representing 10% of the issued share capital of FGP Topco Limited. Ardian and PIF hold
shares representing c. 22.6% and c.15.0%, respectively, through separate vehicles.
The Heathrow Transaction closed on December 12, 2024 after having obtained all required regulatory approvals. As a
consequence of the Heathrow Transaction, Ferrovial recognized at 2024 year-end a profit of EUR 2,570 million, of
which EUR 2,023 million corresponds to our ordinary shares sold and EUR 547 million to the 5.25% stake retained,
which is reflected as a financial investment valued at fair value with changes recognized through profit and loss.
On February 26, 2025, we announced that a binding agreement has been reached with Ardian for the sale of our entire
remaining stake (5.25%) in FGP Topco Limited, the parent company of Heathrow Airport Holdings Ltd., for
approximately GBP 455 million (current book value of the asset), which will be adjusted with an interest rate to be
applied until closing.
The transaction is subject to complying with the right of first offer (ROFO) which may be exercised by FGP Topco
Limited shareholders pursuant to the Shareholders’ Agreement and the Articles of Association of the company. Full
completion of the acquisition under the agreement is also subject to the satisfaction of applicable regulatory
conditions.
4.A.1.3Transfer of the economic rights of stakes in the M3 Eurolink and M4 Eurolink motorways in Ireland; the
M8-M73-M74 motorway in Scotland, the 407 East Extension Phase 1 and 407 East Extension Phase 2 in Canada;
Serrano Park and Autovía de la Plata (A-66) in Spain
On February 29, 2024, we through our subsidiary Cintra, entered into an agreement with Inter Infrastructure Capital
S.A., to sell the 49% of the Class A shares of Umbrella Roads BV (which confer voting rights on its holder) and all the
Class B shares of Umbrella Roads BV (which confer economic rights on its holder). Umbrella Roads BV is the direct
shareholder of Cintra OM&R 407 East Development Group Inc, Cintra 407 East Development Group Inc, Blackbird
Maintenance 407 Cintra GP Inc and Blackbird Infrastructure 407 Cintra GP Inc (the holding companies of the 407
Phase I and Phase II Projects), the indirect shareholder of Serranopark S.A., Scot Roads Partnership Project (M8
Project in the UK), Eurolink Motorway Operations Ltd and Eurolink Motorway Operations (M3) Ltd (M4 and M3
Projects in Ireland), and has the economic rights over Sociedad Concesionaria Autovía de la Plata S.A. (A66 Project in
Spain). The sale of shares was completed on October 8, 2024 for EUR 100 million.
4.A.1.4Divestment of 24.8% stake in Serveo
On June 28, 2024, we completed the sale of our 24.8% stake in Grupo Serveo to its majority shareholder, Portobello
Capital. We had originally acquired this stake upon completion of the sale our Spanish infrastructure services business
to Portobello Capital for approximately EUR 175 million after price adjustment on January 31, 2022 (see “—4.A.2.14.
Divestment of Infrastructure Services Business in Spain”). The disposal’s capital gain before taxes amounts to EUR 33
million.
4.A.1.5Purchase of a stake of IRB Infrastructure Trust
On June 13, 2024, we, through our subsidiary Cintra, acquired a 23.99% stake in IRB Infrastructure Trust (“Private
InvIT”), a subsidiary of IRB, in which we hold a 19.86% ownership interest from certain affiliates of GIC Private
Limited (“GIC”) for EUR 652 million (estimated at an EUR/INR exchange rate of 90.21). Private InvIT holds a
portfolio of 15 toll road concessions in India, with a committed pipeline of one additional concession. Within the
equity commitments in projects being developed by Private InvIT, on December 20, 2024, Cintra made an additional
contribution of EUR 57.6 million for the acquisition of the Ganga Expressway Project. This investment will increase
by EUR 18 million due to outstanding equity commitments (considering an exchange rate of 89.2 EUR/INR).After
the transaction, GIC’s affiliates retained a 25.0% stake in Private InvIT and IRB maintained its 51.0% stake.
4.A.1.6Divestment of a 5% stake in IRB Infrastructure Developers Limited
On June 11, 2024, we, through our subsidiary Cintra, completed the sale of a 5.0% stake in the Indian company IRB
Infrastructure Developers Limited (“IRB”) to certain institutional investors for EUR 215 million, excluding transaction
costs (estimated at a EUR/INR exchange rate of 89.3) . The sale was carried out in the form of a placement of 301.9
million shares with institutional investors on the National Stock Exchange and the Bombay Stock Exchange. The
shares in IRB were sold at an average price of INR 63.60, resulting in a capital gain before taxes of EUR 131.7
million. After the transaction, we will continue being the second-largest shareholder of the entity, with a 19.86% stake
on the same.
4.A.1.7Acquisition of Misae Solar IV, LLC
On May 17, 2024, we, through our subsidiary Ferrovial Energy US. LLC, acquired a 100% stake in Misae Solar IV,
LLC, Texas Limited Liability Company owning rights to develop an approximately 257.3 MWdc solar project known
as “Leon Solar Park” in Leon, Texas (USA). The Group plans to invest USD 72 million (approximately EUR 67
million) in the development of this project.
4.A.1.8Acquisition of Developres Zielona Energia sp. z o.o.
On April 25, 2024, we, through our subsidiary BxF Energia sp. z o.o. acquired, a 100% stake in Developres Zielona
Energia sp. z o.o., Polish Limited Liability Company owning rights to develop an approximately 60 MWdc solar
project known as “Azalia” in Wysoka Glowowska, Rzeszów (Poland). We plan to invest approximately PLN 89.4
million (EUR 20.5 million) in the development of this project.
4.A.1.9Divestment of Car Sharing Mobility Services, S.L. (Zity)
On December 20, 2023, we completed the sale of our 50.0% stake in Car Sharing Mobility Services, S.L. (Zity) to the
Renault Group. The Renault Group, which held a 50.0% stake in the entity prior to the sale, has acquired full
ownership following completion of the transaction.
4.A.1.10Divestment of Azores toll road asset
On June 5, 2023, we agreed to sell our 89.2% stake in our Portuguese toll road concession Euroscut Azores to
infrastructure funds Horizon Equity Partners and RiverRock for an initial price of EUR 42.6 million. At completion of
the transaction, once the agreed conditions precedent had been satisfied, the sale price was adjusted with the ticking
fees accrued as from the signing of the sale and purchase agreement. The final price amounted to EUR 43.4 million.
The sale was completed, and the transactions funds were received, on December 28, 2023.
4.A.1.11I-77 toll road stake increase
On December 1, 2022, we acquired an additional 7.1% interest in the I-77 toll road from Aberdeen, which increased
our stake to 72.2% for USD 109 million (EUR 104 million).
4.A.1.12Divestment of Amey
On October 11, 2022, we agreed to sell Amey (the UK Services subsidiary) to One Equity Partners and Buckthorn
Partners. We finalized the sale on December 30, 2022. The final net consideration amounted to GBP 264.6 million
(EUR 301.3 million). This net consideration was in the form of cash of GBP 112.8 million (EUR 128.5 million, based
on the respective closing date of the sale, and EUR 132 million at December 31, 2022 average exchange rate) and a
vendor loan note of GBP 151.8 million (EUR 172.8 million). We issued the vendor loan note at sale completion,
repayable over the next five years with an interest of 6% per annum, increasing to 8% per annum three years after
issuance. The capital gain from this sale was EUR 58.3 million reflected in the 2022 financial year. On April 5, 2024,
the vendor loan granted in relation to the Amey divestment was terminated. In accordance with the agreement reached
with Buckthorn Partners in December 2023, we received GBP 149.0 million of loan principal, plus GBP 1.9 million
interest accrued in 2024.
4.A.1.13Dalaman International Airport (Turkey) acquisition
On February 17, 2022, we agreed to acquire a 60% stake in the company that manages the Dalaman airport concession
from Turkish infrastructure company YDA Group. We completed the acquisition in July 2022. The total price for the
stake in Dalaman airport was EUR 144 million consisting of an initial payment of EUR 104 million paid in July 2022,
two deferred payments of EUR 15.2 million each (paid in October 2022 and October 2023) and a final variable earn-
out of EUR 9.9 million paid in December 2023.
4.A.1.14Investment in New Terminal One (NTO) at JFK International Airport in New York
On February 10, 2022, CGI Phoenix Aggregator, Carlyle CGI AIV, L.P (“Carlyle”), and Ferrovial Airports Holding
US Corp reached an exclusivity agreement to negotiate the transfer by Carlyle to us of a 96% stake in Mars NTO LLC,
the company that indirectly holds 51% in JFK NTO LLC (“NTO”), the entity appointed to design, build and operate
the New Terminal One at JFK International Airport in New York (which includes the former Terminals 1, 2, and 3 of
this airport and potential extensions).
In June 2022, we finalized the agreement to invest in the consortium. As a result, we currently hold a 49% indirect
ownership interest in the project and are the consortium’s lead sponsor (i.e., the largest shareholder). Other
shareholders in this project include Carlyle (indirect holdings of 2%), JLC (direct holdings of 30%), and Ullico (direct
holdings of 19%). Completion of the transfer and financial close for the project occurred on June 10, 2022, when NTO
at JFK entered into (i) a concession agreement with the Port Authority of New York and New Jersey and (ii) certain
financing and construction contracts necessary for the development of the project. An internal analysis of the
shareholder agreements and related contracts determined that the project is subject to joint control because the voting
rules and veto rights set out under these agreements result in key decisions requiring the support of other shareholders.
In connection with this transaction, we agreed with the Carlyle Group on the payment of earn-out consideration should
Carlyle divest its outstanding 4% interest in Mars NTO LLC. This earn-out payment would be triggered either if
Carlyle transfers its stake to a third party or to the Company and depends on the value created by the project. An
estimation of the earn-out payment was included in our valuation of the investment as presented in the Audited
Financial Statements. Any future changes in the valuation of the earn-out may affect our results.
In accordance with the concession agreement and other related contracts, we expect construction of the NTO to
proceed in phases and to complete the first phase (i.e., Phase A) in 2026, at which time the terminal is expected to start
operating. There are two expected subsequent construction phases (Phase B1 and Phase B2) to accommodate the
terminal to traffic needs. The concession agreement for the operation of the terminal will end in 2060 and its revenue
streams will be (i) passengers’ fees charged to the airlines and (ii) commercial revenues.
In connection with the NTO concession agreement and other related contracts, the consortium’s shareholders made an
equity commitment to JFK NTO in an amount equal to USD 2,330 million (USD 1,141.8 million of which represents
our commitment) over a four-year term ending in 2026. In 2024, our affiliate contributed USD 507.4 million (EUR
469.1 million at the 2024 average exchange rate), compared to 2023 during which our affiliate contributed USD 231.5
million (EUR 214.0 million at the 2023 average exchange rate), increasing the amount already invested to USD 801.2
million (EUR 742.3 million, with each year’s contribution valued at its respective year’s average exchange rate) as of
December 31, 2024. Our remaining investment commitments as of December 31, 2024, amounted to USD 340.6
million (EUR 329.1 million at the year-end 2024 exchange rate), which we are required to contribute by 2026. Aside
from the equity commitments related to the NTO, the remaining source of funding for the project constitutes non-
recourse bank financing of JFK NTO. In June 2022, JFK NTO entered into a loan agreement for a principal amount of
USD 6,630.0 million with a bank syndicate. JFK NTO, as a matter of its ongoing business operations, monitors the
refinancing market for its bank facility and may refinance any outstanding amounts thereunder when market
conditions are deemed appropriate by the lessee. In December 2023, NTO JFK LLC issued USD 2.0 billion in
municipal bonds to partially refinance the bank loan initially arranged for the NTO project. A portion of the bond
issuance amounting to USD 800.0 million was insured by Assured Guaranty Municipal Corp. In June 2024, NTO JFK
LLC issued USD 2.55 billion in municipal bonds to partially refinance the bank loan initially arranged for the NTO
project. A portion of the bond issuance amounting to USD 800.0 million was insured by Assured Guaranty Municipal
Corp.
4.A.1.15Divestment of Infrastructure Services business in Spain
On January 31, 2022, we completed the sale of our Spanish infrastructure services business to Portobello Capital for
approximately EUR 175 million after price adjustment. The reported sale price did not include the earn-outs, which we
may be entitled to after the closing of the transaction if certain requirements are fulfilled. These earn-outs are currently
estimated at EUR 44.6 million. Part of these earn-outs, amounting to EUR 14.2 million, has already been collected in
2023 and 2022, together. The transaction, excluding earn-outs, did not have a relevant impact on our consolidated
accounts, since the book value of the business was similar to the relevant purchase price.
4.A.2Current Investments
Throughout 2025, we plan to continue investing in current assets in our portfolio and analyze potential new
opportunities that may add value to our business.
Our key future investment commitments in the Airports Business Division include the NTO at JFK, for an expected
amount of USD 267 million (EUR 258 million at the year-end 2024 exchange rate) in 2025.
The main equity investments commitments in our Toll Roads Business Division pertain to our standing equity
commitments in projects developed by Private InvIT, including our purchase of a stake of Private InvIT (see Item 5.
Information on the Company—A. History and Development of the Company —1. Summary of Historical Investments
and Divestments —5. Purchase of a stake of IRB Infrastructure Trust), and the Anillo Vial Periférico Project: On April
4, 2024, the Private Investment Promotion Agency of Peru (Proinversión), a specialized technical agency attached to
the Peruvian Ministry of Economy and Finance, awarded the Anillo Vial Periférico Project in Lima (Peru) to a
consortium led by our toll roads subsidiary Cintra, which owns 35% of the consortium, together with Acciona and
Sacyr, which own 32.5% each. The Anillo Vial Periférico Project is a 30-year concession contract that covers the
financing, design, construction, operation and maintenance of approximately 35 kilometers of ring road in the
metropolitan area of Lima. The project entails an expected investment of approximately USD 3.4 billion
(approximately EUR 3.13 billion). This amount consists of the expected equity to be contributed by the consortium,
which at our stake is estimated at approximately EUR 218 million (EUR 205 million of future investment
commitments and EUR 13 million that have been already contributed in 2024), as well as contributions from public
funds by the Peruvian government and other financing sources. The Anillo Vial Periférico Project resulted from an
unsolicited proposal submitted to Proinversión by Cintra in 2013. The concession agreement was signed on
November 12, 2024.
4.B.Business Overview
4.B.1Overview
We were founded as a construction group focusing on railway infrastructure and later expanded our business into other
activities including, among others, toll roads, airport management, and energy. We have been active internationally for
over 40 years and operate across seven core geographic markets comprising Spain, the United States, the United
Kingdom, Canada, Poland, Chile and India with over 25,501 employees.
Over time, we have developed into one of the world’s leading infrastructure groups in terms of managed investment
with operations in a range of sectors including development, construction, and operation of toll roads and airports.
Since our inception, we have invested in diversifying our business and expanding internationally.
Our experience in, and portfolio of, infrastructure assets have enabled us to develop specialized knowledge in the field
of urban congestion management that we believe differentiates us from our competitors. This differential knowledge in
the realm of urban congestion is particularly advantageous in connection with Managed Lanes projects (i.e., the
development of toll roads with dynamic pricing schemes, where users pay variable rates depending on congestion
levels at any given time). We currently undertake our activities through the following four operating divisions, or lines
of business, which also correspond to our reporting segments (the “Business Divisions”):
▪Toll Roads;
▪Airports;
▪Construction; and
▪Energy.
We generally use the “other” category to reflect results for companies not assigned to any Business Division, the most
significant being Ferrovial SE, the Group’s parent company, as well as the new business line Ferrovial Digital
Infrastructure (created in 2024 with the aim to identify investment opportunities to develop high-value projects in the
data center market), and some minor subsidiaries, including the mobility business and remaining services businesses,
(i.e. the Chilean mining services and the waste management plants in the United Kingdom).
Segment Change
In January 2024, we conducted a partial reorganization of our Business Divisions pursuant to which the energy
solutions business line, which was part of the Construction Business Division, and the energy infrastructures business
line, which was part of the former Energy Infrastructure and Mobility Business Division, merged. The resulting
Business Division has been named the Energy Business Division. The purpose of this segment reorganization is to
group all energy business activity into a single organizational unit with unified direction to ensure alignment among
activities and maximize any benefits arising from synergies among them. See “Item 5. Operating and Financial
Review and Prospects--A. Operating Results” and Note 1.1.2 (Business Reorganization) and Note 1.5 (Segment
Reporting) to the Audited Financial Statements for additional information about our reporting segments.
4.B.2 Strategy and Objectives
In 2020, we approved a plan setting out the strategy for the 2020-2024 period (the Horizon 24 Strategic Plan) that
placed our primary focus the development and operation of sustainable infrastructure, with main presence in the
transport sector.
In connection with this strategy, we focused our activity in the main countries where we are active: the United States,
Canada, the United Kingdom, Spain, Poland, Chile, and India. We also periodically monitor and identify opportunities
in Australia and selected countries in Latin America and other geographies. We also decided to integrate the United
Nations’ Sustainable Development Goals into our business strategy.
The Horizon 24 Strategic Plan also established several financial targets related to profitability and cash flow
generation. The targets were established at the end of 2019, shortly before COVID-19 started. Hence, from the
beginning, they were severely impacted by the effects of the COVID-19 mobility restrictions on our key infrastructure
assets, with special focus in 407 ETR toll road and Heathrow airport. The accumulated dividends for the period from
2020 to 2024 have been EUR 2,974 million, not achieving the pre-established financial target by 2024 due to the
impact of COVID-19 on our results in the 2020 to 2022 period. On the contrary, the Construction division 3.5%
Adjusted EBIT Margin average long-term target has been achieved in 2024.
The Horizon 24 Strategic Plan also contemplated an expansion of our operations to activities that complement our
existing businesses, such as:
▪The Toll Roads Business Division continues to focus on the development of our Managed Lanes’ projects in
the United States, with the opening of segment 3C of NTE 35W in June 2023 and the increase of our stake in
the I-66 toll road in Virginia and the I-77 toll road in North Carolina.
▪The Airports Business Division continues to invest in expanding its portfolio with a focus on geographical
areas in which the overall business currently operates.
▪The Energy Business Division focus on the development, building and investment of renewable generation,
storage and transmission lines projects and render energy efficiency services in the US, as well as Spain,
Poland, Chile and Australia,
▪The Construction Business Division continues to seek and execute complex projects, such as the Ontario
Line subway in Toronto, Canada.
The conclusion of the Services Business Division’s divestment after the sale of Amey in the United Kingdom and our
infrastructure services business in Spain further supported our Business Divisions’ progress in line with the Horizon
24 Strategic Plan’s priorities. For further discussion on the conclusion of the Services Business Division’s divestment
process, see “—3. Group Overview—3. Our Business Divisions—6. Discontinued Operations (Services).”
Under the Horizon 24 Strategic Plan, we also implemented a new operating model designed to improve transparency,
strengthen our ability to adapt to the new industry cycle, and enhance process rationalization, efficiency, and
digitalization.
As of December 31, 2024, we completed our fifth year of the Horizon 24 Strategic Plan. Our strategic priorities for the
year focused on: (i) people, (ii) sustainable growth across Business Divisions, (iii) operational excellence, and (iv)
innovation.
People. We intend to promote the highest health and safety standards and implement innovative technologies to
prevent accidents for users and employees. We also contribute to employee wellbeing and promote healthy habits
through the Hábitos Saludables de Vida (“HASAVI”) program, our global health and wellbeing project focused on the
physical, mental, social and financial health of our employees.
Sustainable growth across Business Divisions. We intend to develop and operate sustainable infrastructures with high
concession value.
▪The Toll Roads Business Division intends to continue developing greenfield projects such as the Managed
Lanes’ project in North America, supporting the growth of its IRB partner in India, and leveraging
digitalization to improve user experience and road safety.
▪The Airports Business Division intends to continue managing the assets in its portfolio, focusing on
completing the construction and commissioning of NTO.
▪The Energy Business Division intends to develop, invest in, build, finance and operate renewable energy
generation, storage and transmission infrastructures and render energy efficiency services.
▪The Construction Business Division intends to continue to support the business, creating value from
construction delivery with excellent capabilities in large design and building of complex projects, while
maintaining its relationships with core third parties to optimize this support.
Operational excellence. We intend to continue to improve efficiency, reinforce our risk management strategies,
strengthen our financial discipline and keep sustainability at the core of our operations. For example, we strive to
mitigate any project-related environmental impacts to the extent possible by introducing eco-design procedures and
optimizing the efficiency of construction processes, including the use of energy and raw materials, as well as by
minimizing waste generation. We also intend to use our transport infrastructure capabilities to help improve living
conditions and communities by enhancing safety, improving user experience, and reducing travel times. From the
financial point of view, we intend to continue to strengthen our capital structure and rotate non-strategic assets and
businesses to realize value and finance our future growth.
Innovation. We intend to support the transformation and digitalization of the Business Divisions with initiatives such
as Nextpass (Cintra’s digital business subsidiary, whose mission is to lead technology innovations that power the
future of mobility and infrastructure) and Connected Sites (the use of artificial intelligence and other technologies to
optimize progress monitoring, resource and machinery oversight, documentation and approval flows in connection
with construction sites) and to promote a culture of innovation and entrepreneurship.
On February 1, 2024, as part of our Capital Markets Day, we reaffirmed the main focus and priorities of the Horizon
24 Strategic Plan, which consist of:
▪Growth in greenfield projects, with a specific focus on North America, with high concessional value.
▪Selected Investments opportunities in other geographies.
▪Asset rotation of mature assets.
▪Solid cash flow generation combined with financial discipline.
In terms of outlook, we reiterated that the Group aims to maintain as an average long-term target the 3.5% Adjusted
EBIT Margin for the Construction Division. We also provided two financial targets related to our cash flow generation
between 2024 and 2026:
▪we aim for our dividend collection from infrastructure assets in the existing portfolio to reach approximately
EUR 2.2 billion and
▪we aim to distribute approximately EUR 2.2 billion in shareholder distributions during such period, which is
EUR 500 million higher than our previously reported target of EUR 1.7 billion, following the announcement
of an additional buyback program of up to EUR 500 million to be distributed in 2025. Of the EUR 2.2 billion
in shareholder distributions that we aim to distribute during the period, we aim to distribute approximately
EUR 1.07 billion in 2025.
4.B.2.1Horizon 24 Strategic Plan by Business Line
Toll Roads
As it pertains to the Toll Roads Business Division, the Horizon 24 Strategic Plan prioritized the development of our
complex assets’ business in the United States and the selective study of opportunities in new geographies. Cintra, our
main Toll Roads’ subsidiary, drives our growth through the management and development of the Managed Lanes’
business.
In addition to the United States, which is a core market for capital allocation, we consider opportunities in the markets
in which we are already active, including countries such as Canada, Spain, the United Kingdom, India, Peru as well as
selected opportunities in other geographies.
Construction
As it pertains to the Construction Business Division, the Horizon 24 Strategic Plan prioritized the development of the
concession business. Ferrovial Construction, our main Construction subsidiary, targets improvements on our key
operational processes of design, procurement, and supervision. Some financial objectives for this Business Division
are: 25% of revenue (including managed capital expenditures, such as NTO) origination from projects developed by
other Business Divisions, which may vary year to year depending on the phasing of each construction project, and a
3.5% Adjusted EBIT Margin average long-term target, which has been achieved in 2024.
Airports
As it pertains to the Airports Business Division, the Horizon 24 Strategic Plan prioritized the improvement of our
competitive position. Ferrovial Airports, our main Airports subsidiary, concentrates on leveraging our operational
expertise in the airports business and dynamically managing our portfolio, which includes the Dalaman airport, and the
NTO project at JFK airport.
Energy
As it pertains to the Energy Business Division, the Horizon 24 Strategic Plan prioritized exploring new opportunities
to invest in and operate sustainable infrastructures, such as renewable energies and other net-zero technology
solutions.
We aim for our energy projects to make us a preferred industrial partner able to add value in the development,
financing, construction and operation, of energy assets. Our goal is to make energy infrastructure activities an active
part of our ESG strategy, which promotes the fight against climate change and decarbonization.
4.B.2.2Sustainability Strategy 2030
The Sustainability Strategy 2030 was updated in 2023 to integrate new ESG metrics that align with expectations from
our stakeholders, including:
▪Clearer and simplified reporting of sustainability results to shareholders.
▪Increased attention to projects supported by “green investment” funds from public entities, such as IRA,
NextGen, or REPowerEU.
▪Adoption of new regulation on non-financial disclosure and monitoring of latest regulatory developments
pertaining to ESG, such as the EU Taxonomy Regime, CSRD and climate disclosure rules and guidance.
This strategy has a specific focus on decarbonization as one of the main challenges we have to resolve in the years to
come. Sustainable mobility and energy transition are at the core of the solutions we are implementing to reduce our
carbon footprint and to achieve the targets we have set for 2025, 2030, and 2050 (i.e., 100% of electricity consumption
from renewable sources by 2025, reduction of fleet emissions by 2030, and net-zero by 2050).
Furthermore, we believe that long-term initiatives to decarbonize the mobility sector and accelerate energy transition
may also benefit and result in synergies in other areas of our business model, for example: (i) the implementation of
innovative solutions to integrate IT in transport infrastructures as a way to optimize traffic goes hand-in-hand with the
further development of our urban congestion expertise, while offering the potential for reduced carbon emissions
similarly; (ii) the setup of infrastructures for the electrification of transportation and multi-modality solutions should
lead to reduced congestion and pollution in cities; and (iii) comprehensive solutions for the development, construction,
and management of energy infrastructures, electrification, and renewable energies, as well as energy management
services, should provide further access to green energy.
4.B.2.3Key Milestones under the Horizon 24 Strategic Plan
Some of the key milestones we achieved during the period 2022-2024 in relation to the Horizon 24 Strategic Plan are:
2022
▪We continued our Toll Roads Business Division’s focus on the Managed Lanes in the United States, with the
opening of the I-66 toll road in Virginia and the increase of our stake in the I-77 toll road.
▪We continued our Airports Business Division’s investment and expansion plans with the investment in two
news assets, the NTO at JFK in the United States and the Dalaman airport in Turkey.
▪Our Energy Business Division continued to progress in the construction of its projects in Spain and Chile.
▪Our Construction Business Division continued the execution of complex projects, including Ontario’s
subway Ontario Line in Canada.
▪We concluded the divestment of our Services Business Division with the sale of Amey in the United
Kingdom and the infrastructure services business in Spain.
2023
▪We reduced our carbon footprint by 28.9% compared to 2022 (by 12.8% if not accounting for the Amey
divestment during 2023), as calculated by using the GHG Protocol (WRI&WBCSD), the most accepted
calculation method internationally, which is also ISO 14064-1 compliant.
▪We completed the Merger resulting in our re-domiciliation from Spain to The Netherlands and gained
admission to listing and trading of our ordinary shares in the Spanish Stock Exchanges and Euronext
Amsterdam.
▪We announced the planned divestment of our stake in the Heathrow airport.
▪We repurchased our hybrid bond (nominal value of EUR 500 million) with a bondholder acceptance of
94.3%.
▪Our Toll Roads’ Business Division increased its managed investment in the U.S. with the opening of
segment 3C of NTE35W in June 2023.
▪We continued our mature asset rotation strategy, reaching an agreement to sell our 89.2% stake in the Azores
concession to infrastructure funds Horizon and RiverRock.
2024
▪On May 3, we completed the regulatory review process for Nasdaq Listing. On May 9, we started trading on
Nasdaq.
▪We acquired a 24% stake in Private InvIT.
▪We sold our remaining 24.8% stake in Serveo, culminating our divestment of the services business in Spain
as part of our strategy to focus on our core business.
▪We sold a 5% stake in IRB.
▪We were awarded to participate in the Anillo Vial Periférico in Lima (Peru) under a concession format with a
total investment of USD 3.4 billion.
▪We reached an agreement for the sale of our entire stake in AGS. The transaction was closed on January 28,
2025.
▪Construction Division has reached above 3.5% Adjusted EBIT Margin target.
▪We finalized the divestment of a 19.75% stake in HAH, retaining a 5.25% stake. On February 26, 2025, we
announced that a binding agreement has been reached for the sale of that 5.25% remaining stake.
▪Energy Business Division was set up in January 2024, merging all energy business activities present across
the Group into a single organizational unit with unified direction.
▪CDP (Carbon Disclosure Project) has included Ferrovial, for the fifteenth consecutive year, in the “A List” of
the Climate Change questionnaire and, for the second consecutive year, in the Water questionnaire, has being
recognized among leading environmental companies.
4.B.2.4Outlook and Trend Information
Toll Roads
In 2025, we expect traffic to increase in most of our toll road assets, although NTE could be impacted by the ongoing
construction works to expand the toll road, which are starting earlier than anticipated due to the positive performance
of the asset.
We expect our main toll roads infrastructure assets to continue to distribute dividends in line with their performance.
During the year ended December 31, 2024, we received EUR 895 million in dividends from our operating toll road
subsidiaries (of which EUR 321 million correspond to 407 ETR, EUR 205 million to I77 first dividend, higher than a
regularly yearly dividend, where free cash flow is distributed, EUR 103 million to NTE, EUR 89 million to I66, EUR
87 million to NTE 35W, EUR 54 million to LBJ, EUR 7 million to IRB and EUR 4 million to Private InvIT),
compared to EUR 704 million in the year ended December 31, 2023, an increase of EUR 190 million.
To further increase our revenues and profitability in the Toll Roads Business Division, Cintra is expected to focus its
efforts on optimizing the Business Division’s revenues and costs under the terms permitted by concession contracts.
Cintra is also expected to continue working on exploring new pipeline opportunities to grow the business, focusing
primarily on complex greenfield projects.
Our expected project evolution by geography as follows:
▪Canada: The 407 ETR toll road will continue to focus on optimization and cost control measures without
ceasing the development of its user value generation strategy. The toll road is expected to maintain its
investment in the Data Lab to improve its understanding of user behavior and personalize its value
propositions, as well as to enhance its customer management systems, potentially enabling it to offer
individualized attention through loyalty plans and specific offers.
Under the Schedule 22 of the 407 ETR concession agreement, we are subject to payments if traffic is lower
than the traffic thresholds established according to said concession agreement (see Schedule 22 mechanism
explanation in “Item 4. Information on the Company —B. Business overview —3. Group Overview —3. Our
Business Divisions —1. Toll Roads business —Canada —The 407 ETR” and “Item 3. Key Information—D.
Risk Factors—1. Risks Related to Our Business and Structure—21. Risks Relating to the Toll Roads
Business Division—1. Reduced vehicle use on the toll roads operated by our toll roads concession
companies may adversely impact our business, results of operations, and financial condition).” Since 2020
due to COVID-19 the force majeure event was set to terminate either when traffic volumes reached pre-
pandemic levels or when there was an increase in toll rates. The concession decided to increase the rates
starting in February 2024 and has already approved an increase for 2025. The concession will be subject to
Schedule 22 if annual traffic level measurements are below the corresponding traffic thresholds. 407 ETR
will have to pay potentially significant amounts calculated under Schedule 22 to the province and a potential
first payment due in early 2026. During 2025 we will accrue expenses for this Schedule 22.
▪United States: Throughout 2024, all toll roads have shown good traffic growth as well as growth in average
revenue per transaction. The soft cap toll rates are expected to increase in 2025 based on last December CPI
(Consumer Price Index) compared to the previous year. During 2024, and thanks to the success of the North
Tarrant Express project, toll road expansion work started earlier than initially planned in the development
agreement that we have with the Texas Department of Transportation. Works are expected to continue
during 2025, and to be completed in 2027. These works are affecting the traffic level, but thanks to efforts
to optimize construction management, the impact during 2024 was less than expected, and a similar
evolution is expected during 2025.
▪India: IRB, which currently manages 26 projects, and Private InvIT, which manages 15 projects, are
expected to reach significant milestones within their pipeline of projects under development during 2025.
▪Australia: We expect that Cintra will continue to manage the Toowoomba toll road and the Western Roads
Upgrade (“OSARs”) project.
▪Other markets: We expect that Cintra will continue to manage the assets already in operation, including the
D4R7 toll road in Slovakia. It is also expected to start the execution of the construction of Anillo Vial
Periferico, in Peru, and in April 2025, it is expected to open Silvertown Tunnel, in the United Kingdom.
We also plan to continue our bidding activity in its target regions (North America, Europe, Australia, Colombia and
Peru), focusing on complex greenfield projects, due to their high potential for value creation.
We also expect to continue pursuing toll-road technology innovation initiatives. For example, in November 2022, we
launched NextPass, a mobile application for iPhone and Android that allows payment on any toll road, bridge, tunnel,
or express lane across 18 states.
Although our outlook as it pertains to the Toll Roads Business Division is positive, we believe that there is a risk of
traffic growth not materializing due to uncertainty in the evolution of work-from-home trends and a reversal of
economic growth trends in the areas where we currently operate. If materialized, this risk could have an adverse
impact on both results and dividends distributed by our toll Roads’ projects.
Airports
In 2024, Dalaman airport showed a steady increase in number of passengers, with 5.6 million passengers in 2024, a
7.7% increase compared to the same period in the previous year. Construction at NTO at JFK continues to progress on
schedule.
We plan to grow our airport investment portfolio globally with a specific focus on North America and Europe. We
expect that Ferrovial Airports will continue to rely on its in-depth knowledge of the sector and consistent track record
with partners and stakeholders to manage our Airports Business Division projects and seek new investment
opportunities. We expect to prioritize investment opportunities in high-growth leisure and business markets and in
particular airports in which our unique capital expenditure expertise and stakeholder relationships can add value in
light of the market’s growth potential. We will as part of our plan to grow our airport investment portfolio, we intend
to consider participation in select open-bid opportunities while prioritizing bilaterally negotiated projects in which our
partnership approach may provide origination advantages.
Our expected evolution by project is the following:
▪NTO at JFK: During 2024, the development progressed within expectations and construction progress
reached 60% at the end of the year. We plan to continue with the execution of Phase A construction and
airline negotiations, among other activities, with a view to the terminal opening in 2026. There are two
expected subsequent construction phases (Phase B1 and Phase B2) to accommodate the terminal to traffic
evolution. During 2025 important works to integrate systems and operations for all the parties will be carried
out. This is the most complex part of Phase A.
▪Dalaman airport: We expect to continue to manage the airport with our partner YDA Group and continue
implementing improvement plans such as the projects for generation of renewable energy and improvement
of sustainability.
Although our outlook as it pertains to the Airports Business Division is positive, there is a risk that passenger numbers
could decrease by unexpected geopolitical events, or the macroeconomic situation may impact demand. If
materialized, these risks could have an adverse impact on both results and dividends distributed by our Airports’
assets.
Our Airports Business Division projects distributed EUR 8 million in dividends in 2024 (EUR 6 million in 2023). In
2025 and beyond, total dividend payments will largely depend on traffic performance at Dalaman, as well as at NTO,
following the opening of the terminal, which is expected for 2026.
Construction
In 2024, the Construction Business Division has reached a 3.9% Adjusted EBIT Margin, above the 3.5% target
established in the Horizon 24 Strategic Plan. The expected evolution for 2025 is equally positive based on a robust
backlog, with what believe to be adequate exposure to key markets and projects for group companies, in line with our
strategy. We expect this to allow for a selective approach to bidding, with a focus on risk mitigation and long-term
profitability.
The outlook for 2025, by market, is as follows:
▪In the United States and Canada, sales growth is expected to be supported by the execution of the relevant
awards obtained by Webber in recent years, which include diverse sectors such as transportation
infrastructure, water treatment plants and renewable energy projects both in Texas and on the East Coast of
the United States, as well as the favorable pace of execution of the Ontario Line of the Toronto Metro once
the initial design phase has been completed. In the medium term, the transportation infrastructure
construction industry is expected to continue to absorb the momentum of the United States’ Infrastructure
Investment and Jobs Act, through the progressive disbursement of funds, which is expected to continue
materializing through state investment programs such as the Unified Transportation Program 2025 in Texas,
the Moving Forward in Florida, or the Major Mobility Investment Program in Georgia. The Construction
Business Division plans to continue to support the bidding process for P3 projects of the Group's investment
units, with a particular focus on highway and airport initiatives on the East Coast of the United States.
▪In Spain, revenues are expected to increase in line with the upward trend of recent years, thanks to the high
level of contracting with both public and private clients. In the future, private initiatives in industrial,
logistics, technology and data center construction are expected to continue, in addition to the stable public
demand for railway, health and water plant projects.
▪In Poland, an increase in revenues is anticipated and the selective bidding strategy is expected to continue,
with a focus on maintaining profitability and diversification in sectors such as energy, renewables or unique
building of technological and industrial projects. Public tendering of rail and road projects is expected to
maintain good prospects supported by the high level of funding allocation under the EU's 2021-27
multiannual financial framework, which ensures future stability of investment in the country.
▪In the rest of the markets, the United Kingdom and Australia stand out, where the execution of large metro,
rail and road projects continues, which are entering their respective final phases of execution. We anticipate
a moderate drop in revenues from the United Kingdom and Australia in 2025. In January 2025, we were
awarded the contract to design and build the track infrastructure for the high-speed railway project HS2 from
London to Birmingham in the United Kingdom. This is estimated to be the largest construction contract in
our history in the country (see “—4. Information on the company—B. Business Overview—3.Group
Overview—3. Our business divisions—3. Construction Business Division—Customers and type of contracts).
In 2024, we were also awarded the construction of the Anillo Vial Periférico in Peru, an urban highway
connecting Lima and Callao, again showing the support to the investment divisions of the Group, as this
contract was tendered under a concession scheme.
Although our outlook as it pertains to the Construction Business Division is positive, there is a risk that our project
award volume could decrease due to a corresponding decrease in the level of funds granted by public entities and the
number of private sector projects due to the effects of a potential economic downturn. In addition, failure to meet
contract and budget deadlines as a result of increased costs for materials, machinery, and labor could also have a
negative effect on our business. If materialized, these risks could have an adverse impact on the sales volume and
profitability of our Construction Business Division.
Energy
We believe that the future of energy depends largely on five rapidly evolving trends: (i) increasing electrification of
the economy in the coming decades, driven mainly by the electrification of production processes, the digitalization of
the economy, the development of data centers and the electrification of transportation; (ii) the need and willingness to
have a greater degree of energy autonomy at the national and supernational levels; (iii) national, regional, and local
regulation on economic incentives or disincentives for CO2 production; (iv) policies for the closure and/or dismantling
of electricity generation infrastructures using fossil fuels or nuclear energy; and (v)social changes driven by the
growing awareness of climate change and the green economy
Despite uncertainty on the degree and pace at which these five points will evolve, we believe there is certainty with
regards to the need for greater electrification of the economy and, the incremental interest to transition from
conventional power generation sources to renewable power generation options. In the year ended December 31, 2024,
this Business Division’s results continued to grow, as shown by the 30.4% increase in revenues, to EUR 270 million,
from EUR 207 million in the year ended December 31, 2023.
In the field of renewable electricity generation and transmission, we expect to continue with the execution of
greenfield projects in our main markets and seek further acquisitions to accelerate our growth.
Other
The project outlook for the businesses reported as Other is the following:
▪Ferrovial Digital Infrastructure: The data centers sector is experiencing rapid growth driven by the continued
transition to the cloud, artificial intelligence, the expansion of the Internet of Things (IoT), and increasing
data sovereignty.
It is expected that the increasing demand of data by consumers and businesses will continue to generate
consequent demand of digital infrastructure to cope with it.
The capabilities from Ferrovial building data centres for hyperscalers and collocators over the last decade is
positioning the company as an attractive delivery partner to develop the critical infrastructure required.
▪Mobility: In December 2024, we maintain minority stakes in Inspiration Mobility Holdings, LLC, and
Maniv Mobility III LP.
▪Circular economy: We intend to maintain our relationship with our customers in the United Kingdom,
increase plant utilization, maximize the recovery of recycles and the generation of electricity. There is a risk
of underperformance due to variations in the waste flows and the intrinsic operation of the assets in the three
“energy from waste” assets management plants in the United Kingdom which operate energy from waste
assets.
▪Ancillary services: We provide support services to large-scale copper mining operations in Chile. We expect
to continue to respond effectively to customer needs, ensuring reliability of their facilities and enhancing the
positive impact we make on local communities through employment and training.
4.B.3Group Overview
4.B.3.1The Group and its Organizational Structure
The table below provides a summary of the main events affecting the organizational structure of the Group:
| | |
| | |
| | In 2009, Grupo Ferrovial, S.A. underwent a merger with Cintra Concesiones, a subsidiary listed on the Spanish Stock Exchange. The merger was structured as a “reverse” merger (fusión inversa) where the subsidiary, Cintra Concesiones, increased its capital to absorb the parent, Grupo Ferrovial, S.A. Following the merger, Cintra Concesiones remained listed on the Spanish Stock Exchanges and became the parent of the Group, at that moment comprising Ferrovial and its subsidiaries, and changed its corporate name to Ferrovial, S.A. As a consequence of this merger, the minority shareholders of Cintra Concesiones became shareholders of Ferrovial. |
| | In 2019, the Group completed the implementation of a reorganization of its corporate structure. This corporate reorganization was aimed at splitting the Group’s national and international activities to benefit from the cross-capabilities of the different businesses in each country and with respect to each client. Through the reorganization, the Group’s non- Spanish businesses were consolidated into one subgroup of companies, headed by the Company. |
| | In 2020, as a result of the approval and start of the implementation of the Horizon 24 Strategic Plan, the Group embarked on additional projects in mobility and electrification and transmission. |
| | On June 16, 2023, we completed: (i) our re-domiciliation from Spain to the Netherlands through the Merger and (ii) the admission to listing and trading of our ordinary shares on Euronext Amsterdam. Our ordinary shares began trading on Euronext Amsterdam and the Spanish Stock Exchanges on June 16, 2023. |
4.B.3.2Segments, Products, and Services
Our operations are segmented into the following Business Divisions: (i) the Toll Roads Business Division, (ii) the
Airports Business Division, (iii) the Construction Business Division, and (iv) the Energy Business Division.
We also had a Services Business Division, and after completing a strategic review we decided to classify it as “held for
sale” in 2018. This decision was part of our strategy to focus on our infrastructure business. In the context of this
strategic decision, we have divested certain parts of our business between 2019 and 2022.
We concluded the divestment of the Services Business Division in 2022, when we closed the sale of Amey to One
Equity Partners and Buckthorn Partners for GBP 264.6 million (EUR 301.3 million). Certain assets that were
previously included under the Services Business Division, such as the waste management plants of Amey in the U.K.,
were retained and reassigned to other Business Divisions. For further discussion on the conclusion of the Services
Business Division’s divestment process, see “—3. Our Business Divisions—5. Discontinued Operations (Services).”
In January 2024, we conducted a partial reorganization of our Business Divisions pursuant to which the energy
solutions business line, which was part of the Construction Business Division, and the energy infrastructures business
line, which was part of the former Energy Infrastructure and Mobility Business Division, merged. The resulting
Business Division has been named the Energy Business Division. The mobility business line and remaining services
businesses, which were until then part of the former Energy Infrastructure and Mobility Business Division, are
separately managed outside of the scope of our Business Divisions and reported as “Other” (see further explanation in
“—1. Overview”).
The table below sets out the entities that head each Business Division and the main activities of each Business
Division:
| | |
| | |
| Cintra Infraestructuras España, S.L.U., Cintra Infrastructures SE, Cintra Global SE, Cintra Holding US Corp and subsidiaries | Development, financing, and operation of toll road infrastructure. |
| Ferrovial Airports International, S.E., Ferrovial Airports Holding US Corp. and subsidiaries. | Development, financing, and operation of airports. |
| Ferrovial Construcción, S.A., Ferrovial Construction International S.E., Budimex, S.A., Ferrovial Construction US Corp., Webber, LLC and subsidiaries. | Development, financing, and operation of construction activities, including the design and construction of all types of public and private works and, most notably, the construction of public infrastructures. |
| Ferrovial Infraestructuras Energéticas S.A.U., Ferrovial Energia S.A.U., Ferrovial Energy US LLC, ., Ferrovial Transco International B.V., Ferrovial EG SE and subsidiaries. | Development and/or construction of energy transmission and renewable generation energy infrastructure as well as render of services regarding energy efficiency. |
| Thalia Waste Treatment B.V. and subsidiaries. | Mobility business and the outstanding (non- divested) Services business activities. Digital Infrastructure business |
4.B.3.3Our Business Divisions
4.B.3.3.1Toll Roads Business Division
Overview
Our activities in the Toll Roads Business Division include the development, financing, and operation of toll road
projects. We conduct our operations in this Business Division through Cintra, one of our wholly owned subsidiaries.
Cintra offers a strong proposition in the industry, with over 50 years of experience, a broad management model, and
in-depth knowledge of new technologies applied to pricing (such as advanced analytics) that aim to improve demand
forecasting and fare optimization. Cintra also offers synergies with our Construction Business Division subsidiary,
Ferrovial Construction, that result in high value creation potential. The partnership of Cintra and Ferrovial
Construction supports the success of complex greenfield projects since Cintra, as licensee, and Ferrovial Construction,
as construction affiliate, can align their risks and reduce the total cost of a project.
In 2024, our Toll Roads Business Division increased its dividends received, mainly due to increases in traffic and
vehicle kilometers traveled in 407 ETR due to greater traffic and toll rates increase in February 2024. All U.S.
Managed Lanes showed similar improvement driven by strong performance and toll rates increases. As a result of this
continuous improvement, our Toll Roads Business received dividends of EUR 895 million from its main toll roads’
assets in 2024 (of which EUR 293 million corresponded to I77 and I66’s first dividend distributions).
Value Creation
Cintra specializes in complex greenfield projects (new construction infrastructure projects) due to their high value
creation potential.
The infrastructure sector depends often on complex projects with high risk exposure. Generally, risk levels increase in
the beginning of a project, with their highest level at the tendering or bidding stage. After production starts, these risks
are either updated or they no longer apply and the level of risk decreases as the project progresses. Therefore, we have
a structured risk management process that focuses especially on the bidding stage of a project and which consists in
evaluating and assuming adequate levels of project risk that allow us to optimize the available rates of return (“IRR”)
and create value by decreasing the discount rates of future cash flows as project risks decrease, whether through traffic
revenues or financial solutions over the life of the concession.
From the equity’s point of view, construction risks generally diminish once construction projects are completed and
the project starts operations; although, the constructor remain liable for construction defects. For example, we opened
the I-66 toll road’s Managed Lanes in two phases in September and November 2022 as the segments became ready to
open to traffic. The opening of these sections helped to reduce the overall construction risks and therefore allowed us
to create value by decreasing the discount rate of future cash flows for the I-66 toll road project. In June 2023, segment
3C of NTE35W commenced operations.
We also materialize value creation in the Toll Roads Business Division through the sale of mature projects, the
proceeds of which are invested in new assets, where we believe there is a greater potential to generate value. Some
examples of this reinvestment strategy include: the sale of a 15.0% stake in Autopista del Sol (“Ausol”) in Malaga,
Spain in December 2022 for EUR 111 million to the infrastructure fund Meridiam pursuant to their exercise of a put
option, which followed the previous sale of an additional 65.0% stake in 2019; the divestment of our stake in two
Portuguese toll roads (49.0% of the Norte Litoral toll road and 48.0% of Vía do Infante (Algarve)) to the DIF Capital
Partners infrastructure fund for which we received EUR 170 million in three instalments (EUR 100 million in 2020,
EUR 47 million in July 2021, and EUR 23 million in August 2022); and the sale of our remaining 89.2% stake in the
Azores highway to Horizon Equity Partners and RiverRock for EUR 42.6 million in June 2023. The total sale price for
that sale was later increased to EUR 43.4 million following the fulfillment of the conditions precedent to the ticking
fee provision in the purchase agreement. The sale was completed, and the transaction funds were received, on
December 28, 2023. On February 29, 2024, we entered into an agreement with Inter Infrastructure Capital S.A., to sell
the 49% of the Class A shares of Umbrella Roads BV (which confer voting rights on its holder) and all the Class B
shares of Umbrella Roads BV (which confer economic rights on its holder). Umbrella Roads BV is the direct
shareholder of Cintra OM&R 407 East Development Group Inc, Cintra 407 East Development Group Inc, Blackbird
Maintenance 407 Cintra GP Inc and Blackbird Infrastructure 407 Cintra GP Inc (the holding companies of the 407
Phase I and Phase II Projects), the indirect shareholder of Serranopark S.A., Scot Roads Partnership Project (M8
Project in the UK), Eurolink Motorway Operations Ltd and Eurolink Motorway Operations (M3) Ltd (M4 and M3
Projects in Ireland), and has the economic rights over Sociedad Concesionaria Autovía de la Plata S.A. (A66 Project in
Spain). The sale of shares was completed on October 8, 2024 for EUR 100 million.
As it pertains to the Managed Lanes’ projects, the main projects in the Toll Roads Business Division, value creation
arises from toll rates being dynamic, allowing for modifications every few minutes according to the degree of
congestion, always guaranteeing a minimum speed for drivers. With free-flow (barrier-free) toll systems, the Managed
Lanes stand out for their long concession terms, their toll rate flexibility, and their optimized long-term financial
structure. We believe these projects position Cintra as a leader in the private development of highly complex road
transport infrastructures. Examples of Managed Lanes include the NTE 1-2, LBJ, NTE 35W, I-77, and I-66 toll roads.
Investments / Main Assets
Cintra has consistently invested in growing and diversifying its portfolio, with a strong focus on the North American
markets. For example, in November 2022 Cintra acquired an additional 7.1% ownership interest in the I-77 toll road
project in North Carolina, United States, increasing our total stake to 72.2%. In September 2021, Cintra acquired an
additional 5.7% ownership interest in the I-66 toll road, increasing our total stake to 55.7%.
Cintra’s investments go beyond the North American market and extend to emerging markets with attractive prospects.
In December 2021, Cintra identified an opportunity in the Indian toll road market and partnered with IRB. We
completed the acquisition of a 24.9% stake in IRB through our subsidiary Cintra INR Investments BV. Our current
stake states at 19.9%, after the sale of a 5.0% stake executed on June 11, 2024. In 2024, Cintra acquired a 23.99%
interest in Private InvIT, an investment vehicle sponsored by the Group’s equity- accounted company IRB, increasing
its presence in the Indian toll roads market.
We continue to pursue ways to increase the value of Cintra’s investment portfolio and optimize the financial structure
of its assets. In December 2021, Cintra completed the issuance of USD 609 million (EUR 535.2 million) in
senior secured notes in the LBJ concession in connection with the partial refinancing of one of its TIFIA loans, which
extended the maturity of the debt (2057, as opposed to 2050 under TIFIA) and lowered the all-in borrowing cost
(3.797% yield to maturity, as opposed to 4.22% coupon under TIFIA). On March 30, 2023, Cintra executed the
financing transaction for NTE 35W’s 5-year bonds to be used for the 2023 and 2024 principal pre-payments of the
TIFIA loan. Out of a total committed USD 221 million, in addition to USD 2.9 million drawn in March 31, 2023 to
cover emission expenses, USD 103.7 million were drawn on June 26, 2023 for a partial prepayment of the TIFIA loan.
Dated in August 1, 2023 Cintra completed the issuance of USD 397 million in Senior Bonds in the NTE concession in
connection with the finance the Mandatory Capacity Improvements that will be performed by the Company in
accordance with the Comprehensive Development Agreement. On April 25, 2024, I77 completed the issuance of USD
371 million of Senior Secured Notes, which proceeds were used mainly to refinance TIFIA increasing the average life
of the outstanding debt.
As of December 31, 2024, Cintra’s concession portfolio consisted of 18 concessions. Excluding IRB and Private
InvIT, comprising approximately 972 kilometers of motorway, and a total managed investment of approximately EUR
23,882 million. Cintra’s portfolio of concessions is diversified geographically, with interests in toll road concessions
located in Canada, the United States, Australia, Colombia, Spain, Slovakia, India, Peru and the United Kingdom.
Within the Toll Roads Business Division, we carried out a series of acquisitions and divestments from 2022 to 2024,
as set forth under “—A. History and Development of the Company —1. Summary of Historical Investments and
Divestments” above. As of the date of this Annual Report, our main toll concession portfolio includes the following
assets:
| | | |
For the year ended December 31, 2024 |
| | | |
Fully consolidated assets | | | |
NTE 1-2 ............................................................................................................................. | | | |
LBJ ..................................................................................................................................... | | | |
NTE 35W ........................................................................................................................... | | | |
I-77 ..................................................................................................................................... | | | |
I-66 ..................................................................................................................................... | | | |
Autema ............................................................................................................................... | | | |
Aravia(1) ............................................................................................................................. | | | |
Via Livre ............................................................................................................................ | | | |
| | | |
407 ETR ............................................................................................................................. | | | |
IRB .................................................................................................................................... | | | |
Private InvIT ...................................................................................................................... | | | |
EMESA(2) and Calle 30(3) .................................................................................................. | | | |
Toowoomba ....................................................................................................................... | | | |
OSARs .............................................................................................................................. | | | |
Zero ByPass (Bratislava) ................................................................................................... | | | |
(1)Our interest is divided between Ferrovial Construcción, S.A. (55.0%); Cintra (30.0%); and Ferrovial, SE (15.0%).
(2)Although EMESA is managed by Cintra, our interest in the company is held by Ferrovial Construcción, S.A..
(3)EMESA holds 20.0% of Calle 30.
Other toll road concessions are included within the Toll Roads Business Division: Ruta del Cacao (Colombia),
Silvertown tunnel (U.K.), Anillo Vial Periferico (Peru).
Inception
We began our toll road activities in 1968 with the AP-8 Bilbao—Behobia toll road concession in Spain. Since then, we
have continued to develop and expand our toll roads business. On February 3, 1998, we incorporated Cintra
Concesiones, in which we hold a 100% stake, with the aim of consolidating and optimizing the infrastructure
development business. In 1999, we won the 407 ETR toll road concession award in Canada, which became one of
Cintra Concesiones’ first projects, together with the concession of two stretches of the Pan-American highway in
Chile. We continued to develop our infrastructure business through Cintra Concesiones, which had its initial public
offering in October 2004 following its entrance in the U.S. market through the establishment of its headquarters in
Austin, Texas. In 2009, we merged with Cintra Concesiones (see “—C. Organizational Structure”). Since 2015 we
also manage concessions in Australia, Colombia, Slovakia, and the United Kingdom. In 2021 we gained access to the
Indian market through IRB.
Customers and Types of Contracts
We operate our toll roads business through concession agreements. Concession agreements are contracts under which
a public sector entity reaches an understanding with a private company for such company to construct and operate
certain infrastructures for a period of time in consideration for the right to collect tolls (or to be paid either shadow
tolls by the grantor of the concession or availability payments if there is no demand risk). The private company returns
the infrastructure to the public sector entity at the end of the concession period.
Toll road concessions projects are long term, capital-intensive projects that can typically be divided into two distinct
phases: the construction phase and the operation phase. The construction phase involves the design and construction of
the toll road and typically spans between two to five years. This phase is characterized by large capital expenditures,
during which we usually do not receive revenues except for those projects that include toll road sections already in
operation.
The operation phase commences once the construction phase is completed. It involves operating and maintaining the
toll road and tolling equipment associated with the concession, as well as collecting toll receipts and managing prices.
In some cases, the operation phase may commence while certain parts of the toll road are still under construction,
allowing us to collect tolls on the operational sections of the motorway, which reduces the risks inherent to these
projects and leads to value creation. The operation phase is generally characterized by increasing levels of revenue as
tolls are collected, lower levels of capital expenditure and incurring operating expenses and generally increasing cash
flows. Revenues from toll road concessions with demand risk depend on the toll rates charged. Toll rates are typically
set by the relevant governmental authority in the concession agreement. The rates that the concession can charge are
typically agreed as part of the concession agreement with the relevant governmental authority.
The toll rates usually increase in line with inflation, except in certain cases, such as the 407 ETR, I-77, and I-66 toll
roads, in which toll rates increases may exceed the rate of inflation. This is similar for the Managed Lanes in Dallas,
Texas, United States (i.e., the NTE 1-2, LBJ, and NTE 35W), which have soft caps that are updated yearly based on
annual changes to inflation. The revenues from toll rates also depend on the levels of traffic on the road, which can be
affected by general economic conditions, weather, and other factors. Revenues from availability payment roads
concessions (i.e., concessions with no demand risk) are pre-determined in the concession contract and usually linked
to inflation.
Operating expenses during the operation phase are primarily driven by the length and age of the toll road, as well as of
factors such as traffic volumes and weather conditions. In this regard, this Business Division is affected by seasonality
in that there is lower traffic over the winter months, due to deteriorated visibility and driving conditions as a result of
winter storms and other adverse weather events (as compared to the summer and spring months, which have a lower
incidence of adverse weather events and a higher traffic volume).
Our financing expenses in toll roads depend primarily on interest rates. The industry is principally debt-financed, to
the extent that long-term concession agreements generally provide a basis for non-recourse long term debt under
project finance plans, leading to high financing expenses. As the concession matures once the construction phase has
ended, a traffic growth pattern is expected, and its risk profile improves. This, in turn, typically creates more
opportunities to refinance projects and thereby reduce financing costs, subject to market conditions and contractual
regulations. These refinancings create value by further decreasing project risk.
Cintra has a young portfolio of toll roads with a weighted average remaining life of approximately 38 years. Cintra
manages such a portfolio with the objective of maximizing its Adjusted EBITDA by generating strong operating
revenues possible while complying with contractual obligations. To this end, Cintra operates its toll roads following a
“premium operator” approach, which entails (i) using a hands-on approach with a common management strategy, (ii)
building know-how on lessons learned across the portfolio, and (iii) continuously looking for new technologies and
their potential benefits to the business.
Activities
The table below sets forth the traffic volume for each of our operating toll road concessions with traffic risk for the
years ended December 31, 2024, 2023 and 2022.
| | | | |
| | For the year ended December 31, |
| | | |
|
Fully consolidated assets (in millions of transactions) | | | |
NTE 1-2 .......................................................................................................... | | | | |
LBJ ................................................................................................................ | | | | |
NTE 35W ...................................................................................................... | | | | |
I-77 ............................................................................................................... | | | | |
I-66 ................................................................................................................ | | | | |
Equity-accounted assets (in millions of VKT, vehicle kilometers travelled) | | | |
407 ETR ......................................................................................................... | | | | |
A brief description of Cintra’s main concessions, by geographical area, is as follows:
Canada
The 407 ETR
The 407 ETR toll road concession in Canada, in which we hold a 43.2% interest, is the first all-electronic open access
toll road in the world whereby tolls are incurred while vehicles are in motion by means of vehicle identification at
entry and exit points either through transponders or video-based license plate imaging. By removing the need for toll
barriers, this toll collection system enables free flow of traffic along the highway, allowing high traffic volumes
without long queues. It covers 108 kilometers in an east-west direction, traversing Canada’s largest and most affluent
urban center, the Greater Toronto Area.
In May 1999, the 407 ETR was privatized and Cintra (as part of the bidding consortium) won the concession award,
which involved (i) the construction and completion of seven interchanges, (ii) the construction of the east (15
kilometers) and west (24 kilometers) extensions of the highway, both completed in 2001, and (iii) the financing,
maintenance, and operation of the entire stretch of the 407 ETR for a period of 99 years (ending in 2098).
On October 5, 2010, we entered into an agreement with the Canada Pension Plan Investment Board for the sale of
10.0% of the share capital of the 407 ETR for approximately CAD 894.3 million (approximately EUR 640 million as
of 2010). The share transfer took place on November 18, 2010, resulting in Cintra holding its current 43.2% interest in
the 407 ETR.
As traffic grows, the 407 ETR keeps widening the number of lanes to preserve the user experience. Cintra, through its
407 ETR concession company, generally commences construction of these new lanes before it is contractually obliged
to do so. Since we completed the extensions in 2001, we have added 315 kilometers of total new lanes, and the road’s
capacity could still be increased by a further 12.0%. Although impacted by COVID-19, traffic levels on the 407 ETR
have increased in most years since Cintra won the concession award in May 1999.
The 407 ETR has an innovative toll rates’ structure that allows us to raise prices freely without prior authorization
from the Ontario Ministry of Transportation, provided that the traffic is maintained above a certain threshold. This
system makes it possible for us to optimize revenues by adjusting toll fees to the time savings offered to drivers by the
toll highway. The asset’s revenue compound annual growth rate for the 2009 to 2024 period is 7.7%. Certain 407 ETR
annual traffic levels are measured against annual minimum traffic thresholds, which are prescribed by Schedule 22 to
the concession agreement and escalate annually up to a specified lane capacity. On December 29, 2023, the concession
company announced a new toll rates schedule that increases the 407 ETR rates starting in February 2024. If annual
traffic level measurements are below the corresponding traffic thresholds, 407 ETR will have to pay potentially
significant amounts calculated under Schedule 22 to the province. The concession will be subject to Schedule 22 in
2025 and a potential first payment due in early 2026. See “Item 3. Key Information—D. Risk Factors—1. Risks Related
to Our Business and Structure—21. Risks Relating to the Toll Roads Business Division—1. Reduced vehicle use on the
toll roads operated by our toll roads concession companies may adversely impact our business, results of operations,
and financial condition.”
United States
The Managed Lanes offer a solution to the problem of congestion in urban areas providing choices to users. Under the
Managed Lanes system, toll rates charged are dynamic and may be changed every few minutes to manage traffic
volume and ensure a minimum speed. Cintra has different projects under this model, including the NTE 1-2, LBJ,
NTE 35W , I-77, and I-66.
NTE 1-2
Cintra holds a 63.0% stake in the NTE concession, a 13.2 mile (21.4 kilometer) highway located in the Dallas Fort
Worth area in north Texas. The NTE 1-2 is intended to improve mobility along a series of highways vital to the region,
including IH-820 and SH 121/183. We fully opened the project to the public in October 2014. The concession
agreement ends in 2061. During 2024, due to the success of the NTE project, additional toll road expansion works and
capacity improvements under the agreement with Texas Department of Transportation are planned to be brought
forward, with an expected completion in 2027.
LBJ
Cintra holds a 54.6% stake in the LBJ concession, which provides a solution to congestion problems on interstates
IH-35E and IH-635 in Dallas, Texas. This project increases capacity in the corridor with the creation of six new
express toll lanes.
LBJ is 13.2 miles (21.4 kilometers) in length and located between IH-35E and US-75. The project was the largest
private-public partnership (“PPP”) in the United States at the time and is, to date, the largest PPP in the Southwest of
the United States. The project features a combination of four general purpose lanes and two to three continuous
frontage roads in each direction, along with 13.2 miles (21.4 kilometers) of two-to-three managed lanes in each
direction that use dynamic pricing to keep traffic moving above 50 miles per hour (80 kilometers per hour). The
Managed Lanes feature about 5 miles (8 kilometers) of depressed roadway. A lump sum, fixed-price contract entered
into as a joint venture with LBJ Mobility Partner governs the reconstruction and has a design-build period of 60
months. It is divided into three sections: (i) the I-35 section from Loop 12/IH35 to Crown Road, with a length of 3.6
miles (5.8 kilometers), (ii) the LBJ/I-35E interchange, located on the I635 corridor between I35E and Dallas North
Tollway, with a length of 5.0 miles (8.0 kilometers), and (iii) the LBJ Section, located on the I635 corridor between
the Dallas North Tollway and the east of the US75 corridor, with a length of 4.6 miles (7.4 kilometers). We fully
opened LBJ in September 2015. The concession agreement ends in 2061.
NTE 35W
Cintra holds a 53.7% stake in the NTE 35W project concession, which serves to link downtown Fort Worth, Texas,
with the surrounding residential and business areas while also providing vital congestion relief by using Managed
Lanes to support this major transportation corridor.
The NTE 35W comprises three different segments: (i) segment 3A (7.0 miles (11.0 kilometers) along the I-35W
corridor through downtown Fort Worth, including the total reconstruction of the I-35W link between downtown Fort
Worth and SH-820), (ii) 3B (4.0 miles or 6.4 kilometers, financed, designed, and built by the Texas Department of
Transportation; operated and maintained by the consortium in charge of NTE 35W and led by Cintra), fully opened to
traffic in July 2018, with a total investment of over USD 1.4 billion, and (iii) segment 3C, an amendment to the
original concession agreement awarded in August 2019 that comprises 6.8 miles or 11 kilometers, with an investment
of roughly USD 0.9 billion and a concession term of nearly 50 years. Segment 3C started operating in June 2023. The
concession agreement includes renovation of existing lanes, which are expected to remain toll-free, and the
construction of two managed lanes in each direction. .
I-77
Cintra holds a 72.2% stake in the I-77 express lanes concession in North Carolina, which connect the metropolitan
area in the northern part of Charlotte with the residential area of Lake Norman over a distance of 26 miles (41.8
kilometers). The express lanes are dedicated travel lanes that run adjacent to the existing general purpose lanes. The
express lanes are divided into three sections: two express lanes running on both directions on I-77 between Charlotte
and Exit 28, and one express lane in either direction between Exit 28 and Exit 36, which seeks to minimize
environmental impacts of traffic on neighboring Lake Norman.
The express lanes operate based on a dynamic toll system that facilitates demand management. A minimum speed of
45 miles per hour (approximately 72 kilometers per hour) is ensured. The highway’s 50-year concession term began
once we opened the road to traffic, in December 2019.
I-66
Cintra holds a 55.7% stake in the I-66 project concession, which comprises the construction of three toll free lanes and
two express lanes in each direction between Capital Beltway and Gainesville (Virginia). The project has committed
investments of at least USD 3.7 billion, including (i) USD 2.3 billion in project construction, (ii) USD 579 million in
upfront concession fees to the Commonwealth of Virginia for the funding of additional improvement projects in the
corridor, (iii) USD 800 million to expand transit services in the corridor, and (iv) USD 350 million for other
improvement projects over the course of the 50-year concession period. The 50-year concession began at closing of
the commercial agreement in 2016. The highway opened to traffic in two stages in September and November 2022.
India
IRB Infrastructure Developers Limited (“IRB”)
IRB, in which we hold a 19.86% interest, manages 26 different toll road projects over a total distance of more than
15,000 lane kilometers and includes the Mumbai-Pune toll road. IRB’s assets represent around 14% of the “Golden
Quadrilateral,” the road network that connects India’s main economic development hubs. IRB has its own construction
division that works exclusively for IRB’s own concessions, which allows for similar synergies and complimentary
capabilities as those derived by the relationship between Cintra and Ferrovial Construction, discussed in relevant part
of this section.
IRB Infrastructure Trust (“Private InvIT”)
Cintra, acquired a 23.99% stake in Private InvIT, a subsidiary of IRB.
Private InvIT holds a portfolio of 15 toll road concessions in India (14 concessions in operation and 1 under
construction). Private InvIT operates in 12 Indian states over a total distance of more than 10,000 lane kilometers. The
future growth of Private InvIT will be assessed by us and our partners on a project-by-project basis and is expected to
be mostly funded by assets distributions.
4.B.3.3.2Airports Business Division
Overview
Our activities in the Airports Business Division include the development, financing, and investing of airports.
Ferrovial Airports integrates all the Group’s airport management activities.
The origins of the Airports Business Division date back to 1998, but it was only in 2006, with the acquisition of HAH,
that it gained its current relevance within our operations.
Investments / Main Assets
In 2022, we increased our airports portfolio after reaching an agreement with Turkish infrastructure company YDA
Group to acquire a 60% stake in the company that manages the Dalaman airport concession. YDA Group was awarded
the concession to operate the airport for the 26 years following 2014, which was extended to 2042. The agreement
included the construction of a new international terminal that came into service in 2018.
Additionally, in 2022, we acquired a 96% interest in Mars NTO LLC, an entity holding a 51% stake in the consortium
that was awarded the concession to design, build and operate the New Terminal One at JFK airport in New York
(which includes the former Terminals 1, 2 and 3 of this airport). We hold a 49% indirect ownership interest in the
project, becoming the consortium’s lead sponsor. Other shareholders are Carlyle (with indirect holdings of 2%), JLC
(direct holdings of 30%) and Ullico (direct holdings of 19%). On 10 June 2022, a concession agreement with the Port
Authority of New York and New Jersey and certain financing and construction contracts came into force. The
concession agreement will end in 2060. This project is now under construction and is expected to start operation
during 2026.
On December 12, 2024, the Group completed the divestment of the Group’s 19.75% stake in Heathrow airport,
retaining a 5.25% stake. On February 26, 2025, we announced that a binding agreement has been reached for the sale
of that 5.25% remaining stake. For further details see “Item 4. Information on the Company —A. History and
Development of the Company —1. Summary of Historical Investments and Divestments —2. Sale of Heathrow Stake.”
Furthermore, on January 28, 2025, we completed the sale of our entire stake in AGS. For further details on this
potential divestment, see “Item 4. Information on the Company—A. History and development of the Company—1.
Summary of Historical Investments and Divestments-- 1.Sale of AGS Airports”.
Customers and Types of Contracts
The main customers in connection with the operations of the Airports Business Division are airlines and passengers
who use the facilities operated by the airports we invest in. The airports are managed through concession agreements
and applicable regulatory regimes, with some airports’ revenues (i.e., Dalaman) being regulated by a local regulatory
authority and other airports’ revenues (i.e., NTO) not being regulated, meaning that the fees charged to users are
established by the airport.
Activities
The Airports generate two primary types of income: (i) aeronautical income and (ii) non-aeronautical income.
Aeronautical income is generated from airport fees and traffic charges, which in turn are principally levied on the basis
of passenger numbers, maximum total aircraft weight, aircraft noise and emission characteristics, and the length of
time during which an aircraft is parked at the airport. In this regard, the division’s revenues are affected by seasonality,
since there is higher passenger traffic (the total number of incoming and outgoing passengers at the airport in a
particular period) over the spring and summer months.
Non-aeronautical income is generated mainly from retail concession fees, car parking income, advertising revenue,
and other services supplied by the airport’s operators, such as the rental of aircraft hangars, cargo storage facilities,
maintenance facilities, and the provision of facilities such as baggage handling and passenger check-in. This income is
also somewhat affected by seasonality, since items such as car parking income, baggage handling, and passenger
check-in depend on passenger volume.
The Airports Business Division’s assets are divided into economically regulated and economically non-regulated
assets. For example, passenger fees at Dalaman are set by the governing concession contract.
A brief description of Ferrovial Airports’ main assets is as follows:
NTO at John F. Kennedy International Airport in New York
In 2022, we entered a consortium for the development of NTO at JFK airport and as a result hold a 49.0% indirect
interest in the project. On June 10, 2022, the consortium signed the concession contract with the Port Authority of
New York and New Jersey for the construction and later operation of the terminal, which ends in 2060. After
construction, the terminal is expected to come into operation in 2026. The revenue streams from the terminal under the
concession agreement are the passenger fees charged to the airlines, as well as commercial revenues. This investment
is in line with our Horizon 24 Strategic Plan, as (i) JFK is a premium destination as one of the United States’ largest
international getaway in terms of international flights as at December 2023, (ii) there is a strong growth demand of
international traffic, (iii) the project will increase the airport’s capacity to host large aircrafts and (iv) the air charges
are unregulated.
The NTO project will be completed in phases to match traffic demand. The initial phase of development (Phase A),
related to the initial round of financing, will replace the operations of the Terminal 1, Terminal 2 and Terminal 3.
Terminals 2 and 3 have already been demolished and Terminal 1 will be demolished as part of the subsequent phases
of the NTO project once Phase A opens to traffic. Work on Phase A began in June 2022 and is anticipated to continue
until 2026. Our Construction Business Division also participates in this project through Ferrovial Construction, which
acts as the lead on the technical area of the project management office (PMO).
In June 2022, JFK NTO LLC entered into a loan agreement for a principal amount of USD 6,630 million with a bank
syndicate. JFK NTO LLC, as a matter of its ongoing business operations, monitors the refinancing market for its bank
facility and may refinance any outstanding amounts thereunder when market conditions are deemed appropriate by the
lessee. In December 2023, NTO JFK LLC issued USD 2.0 billion in municipal bonds to partially refinance the bank
loan initially arranged for the NTO project. A portion of the bond issuance amounting to USD 800 million was insured
by Assured Guaranty Municipal Corp. In June 2024, NTO JFK LLC issued USD 2.55 billion in municipal green
bonds, representing one of the largest municipal bond issuances to date for an airport project.
As of today, we have agreements with sixteen airlines out of which ten are airline executed agreements (Air France,
LOT, Etihad, KLM, Korean, Eva Air, Air Serbia, SAS, Neos and Philippines Airlines). Five of those new airlines
agreements signed in 2024 (Eva Air, Air Serbia, SAS, Neos and Philippines Airlines). In addition, we have signed six
letters of intention with Air China, Turkish Airlines and other international carriers.
Dalaman Airport
In February 2022, we reached an agreement to acquire a 60.0% interest in the company that manages the concession
for the Dalaman airport in Turkey. We completed the acquisition in July 2022 for EUR 144 million. The concession
started in 2014 and it terminates in 2042. Passenger charges are set and collected in euros, so most of the airport’s
revenues are in that currency.
The airport, which is located on the Turkish Riviera, a vacation destination for both domestic and international
passengers, had 5.6 million passengers in 2024, compared to 5.2 million passengers in 2023, representing a 7.7%
increase.
As a consequence of the conflict in Ukraine, there has been a decline in Russian and Ukrainian passengers, although
the impact is limited and partly offset by increased traffic from other European destinations, especially the United
Kingdom.
In 2024, Dalaman was awarded Level 3 of the Airport Carbon Accreditation (ACA) program of Airports Council
International Europe (ACI Europe) Carbon Emissions Certificate, which recognizes its efforts to manage and reduce
its CO2 emissions. Additionally, in the same year,,the airport completed the installation of a solar power plant on its
terminal roof, featuring 15,000 panels. This initiative aims to generate nearly 55% of the airport’s energy requirements
in its initial phase. With this project, the airport anticipates protecting 200,000 trees annually and avoiding 4,500
tonnes of CO2 emissions.
Heathrow Airport
On December 12, 2024, the Group announced the closing of the planned divestment of the Group’s 19.75% stake in
Heathrow airport, retaining a 5.25% stake. On February 26, 2025, we announced that a binding agreement has been
reached for the sale of that 5.25% remaining stake. For further details on this potential divestment, see “Item 4.
Information on the Company —A. History and development of the Company —1. Summary of Historical Investments
and Divestments —2. Sale of Heathrow Stake.”
AGS Airports
On January 28, 2025, we completed the planned divestment of our stake in AGS. For further details on this potential
divestment, see “Item 4. Information on the Company—A. History and Development of the Company—1. Summary of
Historical Investments and Divestments— 1.Sale of AGS.”
Other Operations
We operate in the airport facility maintenance and management sector through our 49.0% stake in the local company
FMM, responsible for the maintenance and management of the Doha airport in Qatar.
4.B.3.3.3Construction Business Division
Overview
We conduct our construction activities through our wholly-owned subsidiary Ferrovial Construction as well as through
other companies within the Construction Business Division. With over 90 years of experience in the industry,
Ferrovial Construction is a leading construction company in terms of revenue. Ferrovial Construction is involved in all
areas of civil engineering, residential building, and non-residential building internationally. The company is also
involved in water treatment plant engineering and construction through its wholly-owned subsidiary Cadagua,
recognized internationally for its seawater desalination plants. Our Construction Business Division is also involved in
energy transition projects, maintaining our commitment to the development of sustainable, innovative, and efficient
solutions.
We have established a strong presence in Poland and the U.S., where we function through our local subsidiaries
Budimex and Webber, respectively. We also function through permanent branch offices and subsidiaries in markets
such as the United Kingdom, Canada, Chile, and Australia.
The Construction Business Division’s operations are affected by seasonality due to an increase in activity over the
spring and summer months due to improved weather conditions (as compared to the winter). For further details on the
effect of seasonality on the Construction Business Division’s results, see “Item 5. Operating and Financial Review and
Prospects—A. Operating Results—2. Material Factors Affecting Results of Operations—5. Seasonality.”
The principal products we use in our Construction Business Division include concrete, steel reinforcing bars, and
asphalt. The fabrication of these products is subject to raw material (such as cement, aggregates, and crude oil)
availability and pricing fluctuations, which we monitor on a regular basis. We purchase most of these raw materials,
necessary to operate our business, from numerous sources. The availability and cost of these raw materials may vary
significantly from year to year due to various factors, including the logistics market, customer demand, producer
capacity, inflation, market conditions, and specific material shortages.
Investments / Main Assets
During 2024, we won, among other projects, the following:
▪I-10 White Oak: the contract consists of the reconstruction of 1.328 miles mainlanes and HOV lanes on I-10
along White Oak Bayou in Houston, for USD 408 million (EUR 377 million).
▪I-27 Randall: the contract consists of the reconstruction of 6.9 miles along Hollywood to Canyon Split in
Amarillo, Texas, for USD 313 million (EUR 290 million).
▪Design (in the railway traffic control industry) and comprehensive execution of construction works on the
railway line No 104 at section D Limanowa – Klęczany industrial spur as part of the project entitled:
“Modernisation of the railway line No 104 Chabówka – Nowy Sącz, at the sections Chabówka – Rabka
Zaryte – Mszana Dolna and Limanowa – Klęczany – Nowy Sącz” for PLN 838 million (50%) (approximately
EUR 195 million).
▪Design and construction of the S17 Piaski – Hrebenne Expressway, section Nº. 3: “Krasnystaw Pólnoc”
junction (“Krasnystaw I”) together with the junction – “Izbica” junction (“Tarzymiechy”) for PLN 782
million (approximately EUR 180 million.)
Inception
We have developed and expanded our Construction Business Division nationally and internationally since 1952,
mainly through the award of concession contracts in countries such as the United Kingdom, the United States, and
Canada, and through strategic acquisitions such as Budimex in Poland and Webber in the U.S.
We have a great degree of expertise in large and complex international projects, mainly through construction works
carried out for the benefit of our Companies, such as Cintra or HAH, but also through construction works carried out
for the benefit of third party clients.
In 1985, we expanded our portfolio of national expertise to include know-how in the field of engineering and
construction of water purification and treatment plants, through the acquisition of a 100% holding in the Spanish
company Cadagua.
In 1995, we acquired a 98.3% interest in Agroman Empresa Constructora, a Spanish construction company founded in
1927. On October 5, 1999, we merged with Agroman Empresa Constructora and incorporated Ferrovial Agroman,
which became one of the largest Spanish construction companies in terms of revenue. We then acquired the remaining
interest in Ferrovial Agroman, therefore becoming the sole shareholder of Ferrovial Agroman and completing the
integration process of the construction business. In May 2020, Ferrovial Agroman changed its corporate name to
Ferrovial Construction.
We have continued to expand our international portfolio within the Construction Business Division through the
acquisition of a 59.1% holding in the Polish construction company Budimex in 2000 and the acquisition of a 100%
holding in the U.S. company Webber in 2005.
In 2021, the energy solutions business line was created as part of Construction Business Division. The energy
solutions business line has merged with the Energy Infrastructure portion of our former Energy Infrastructure and
Mobility Business Division in 2024. The resulting Business Division has been named the Energy Business Division.
See “Item 4. Information on the Company—A. History and Development of the Company—1. History of the
Company.” for a description of the partial reorganization.
Customers and Type of Contracts
Ferrovial Construction’s Order Book was EUR 16.8 billion as December 31, 2024, not including pre-awarded
contracts or contracts pending commercial or financial agreements for an approximate amount of EUR 2,670 million.
Clients in countries outside of Spain accounted for 86% of the Order Book’s accounts. Clients from the public sector
accounted for 86% of the total Order Book, with our Companies representing 3% and private customers representing
11%.
Within the EUR 2,670 million was the contract to design and build the track infrastructure for the high-speed railway
project HS2 in the UK, included in Order Book in January 2025. The project, awarded by the joint venture formed by
Ferrovial and BAM, includes the entire 140-mile route in three sections, from Old Oak Common in London to
Birmingham Curzon Street station. The contract is valued at approximately EUR 1 billion for Ferrovial. It also
includes the Anillo Vial Periferico construction contract, for approximately EUR 800 million, related to the Anillo
Vial Periferico concession contract, in which we, through our subsidiary Cintra, hold a 35% stake (for more
information see “Item 4. Information on the Company—A. History and Development of the Company—2. Current
investments.”
Ferrovial Construction’s Order Book was EUR 15.6 billion as of December 31, 2023 (not including pre-awarded
contracts or contracts pending commercial or financial agreements for an amount of EUR 1.9 billion, mainly related to
contracts at Budimex), with clients in countries outside of Spain accounting for 82% of the Order Book’s accounts.
Clients from the public sector accounted for 82% of the total Order Book, with our Companies representing 5% and
private customers representing 13%.
Generally, our Construction Business Division operates through design and construction agreements whereby we
assume obligations to design and construct infrastructure. We generally enter into those agreements by virtue of our
successful participation in public and private procurements.
Activities
A brief description of the Construction Business Divisions’ main companies is as follows:
Ferrovial Construction
Ferrovial Construction is the company that heads the Construction Business Division in the Spanish market and
participates in all areas of construction, including civil works and building and industrial works, both in Spain and
internationally through other companies within the Business Division. Within the context of civil works, the Business
Division’s largest segment, it designs and builds all types of infrastructures, including roads, railways, hydraulic
works, maritime works, hydroelectric works, and industrial projects. Ferrovial Construction’s building activities also
include the construction of non-residential buildings (including airports, sports facilities, health centers, schools and
cultural buildings, shopping and leisure centers, museums, hotels, building refurbishment projects, offices, factories,
and industrial warehouses) and residential construction. Additionally, Ferrovial Construction, through Cadagua,
provides engineering and construction services of water treatment plants, mainly in seawater desalination plants, but
also in sewage treatment, water purification, and waste management plants.
Budimex
Budimex, a company founded in 1968, has been listed on the Warsaw stock exchange since 1995. It is the leading
construction company in Poland in terms of revenue (based on the data from the “Polish Construction Companies
2022” report from Deloitte). Our stake in Budimex as of December 31, 2024 was 50.1%.
Budimex has been traditionally focused on the construction of civil works (such as roads, highways, railways, airports,
and bridges), industrial construction, residential buildings, and non-residential building, which aligns with the overall
operational split of the Construction Business Division. Over the last few years, Budimex has systematically
diversified its activities, both by seeking and acquiring projects other than roads and by participating in new activities
such as public-private partnerships and infrastructure and facilities management. Budimex is currently a key player in
the infrastructure market (road and rail) and general construction market in Poland. As a general contractor, the
company offers construction services in the following infrastructure sectors: roads, railways, airports, general
construction, energy, industrial and environmental construction. In recent years, the company has increased its
exposure to the prospective hydro and military markets. General construction within the Budimex Group has also
undergone a transformation demonstrated by the reduction of exposure to the real estate market. Instead, the company
has focused on specialized construction and areas of the market that can be characterized by capital inflows related to
local government investments and private investments by foreign companies. Budimex is also involved in the facility
management, specifically real estate and infrastructure facility services, and waste management sectors through
FBSerwis. On November 7, 2024, Budimex informed of its decision to start the process of reviewing strategic options
in relation to FBSerwis, analyzing scenarios covering, among others search for a significant investor or investors for
FBSerwis (both minority and majority), concluding a strategic alliance with another entity, introducing the selected
company to the Warsaw Stock Exchange (IPO). Moreover, Budimex plans to analyze the possibility of FBSerwis
group activity diversification. The above list of scenarios is not exhaustive and other scenarios not listed above can be
also considered if they appear as a result of the review. We expect the completion of this process by the last quarter of
2025. The result of the process may also be a decision to adopt a new strategy for FBSerwis within Budimex.
The company’s strategic plans include expansion of its construction activities into neighboring countries, taking a
decision regarding the new strategy for FB Serwis, as explained above, and participation in Poland’s energy
transformation (investments in renewable energy generation assets through the joint venture BXF Energia).
Webber
Webber specializes in the construction of infrastructure works, such as roads, highways, bridges, and airport runways.
In 2018, it became the leading transport infrastructure company in the State of Texas, United States, according to
Engineering News Record (“ENR”) magazine. In 2016, Webber acquired Pepper Lawson Construction, a specialized
company in water infrastructure, enhancing the capabilities and resources of Webber in this segment. It also provides
operations and maintenance solutions for critical infrastructure assets. Webber is one of the leading transportation-
focused contractors in Texas (based on the 2022 data from ENR Texas & Louisiana report), and in the last few years,
it has expanded operations into other U.S. states, including Virginia, Georgia, North Carolina, and Florida.
4.B.3.3.4Energy Business Division
The Energy Division is mainly focused in providing innovative solutions for the promotion, development, investment,
construction, financing and operation of renewable energy generation, storage and transmission infrastructures.
In addition, there are multiple entities promoting measures to reduce energy consumption and improve energy
efficiency, leading to have a business line dedicated to supporting public and private clients in meeting their
environmental and economic objectives.
The Division is present mainly in five geographical areas, in line with Ferrovials global positioning: the United States,
Spain, Poland, Chile and Australia.
The Group has two transmission lines already operational in Chile, and another under construction and another in early
stages of development.The Group also has an operational photovoltaic solar plant in Spain with a total capacity of 50
MWp.
Investments / Main Assets
In Chile, the Energy Division has two transmission line assets in operation across the country (Transchile and
Centella ) and currently another transmission line under construction (Tap Mauro). In January 2025, we were officially
awarded with a group of works, which includes a concession contract for the development, construction, and
exploitation of a new transmission line (2x154kV Tinguiririca – Santa Cruz), that should start commercial operation in
2030, and the construction of five expansion works for the grid.
In Spain, the Energy Division has a 50 MWdc photovoltaic plant in operation, located in Seville, as well as a pipeline
of generation projects in their early stages of development.
Additionally, during 2024 we won, among other projects, the following in Spain:
▪In November 2023 we signed with Red Eléctrica (Redeia) a “Framework Agreement of refurbishment and
Assembly of Substations” starting in March 2024 for a period of three years in the following areas: North,
Northeast, East, Central and Canary Islands.
▪On January 31, 2024, we were awarded the contract for the construction of two solar photovoltaic plants with
an aggregated capacity of 62 MWp in Soria (Spain). We will execute this project on a turnkey basis and the
scope of the work includes the design and construction of the plants, as well as its operation and maintenance
during the first two years. The plant’s delivery is scheduled for 2025 and expected to have an estimated
annual production of 114 GWh.
▪In June 2024, we were awarded the contract to upgrade and operate for a period of 15 years the street lighting
infrastructure of the Municipality of Santa Pola, in eastern Spain, through a joint venture with Iberdrola.
▪In August 28, 2024, we were awarded by Aquila Clean Energy the contract to build on a BOP modality 8
wind farms located in the provinces of Granada and Almería with a total capacity of 265 MW, as well as the
corresponding evacuation infrastructure (consisting of two 220/30 kV substations, one 400/220 kV
substation, two 220 kV evacuation lines and one 400 kV line). The project has an envisaged execution period
of two years and a total estimated cost of EUR 82 million.
▪On October 28, 2024, we were awarded the construction of a solar photovoltaic plant with a capacity of
18MWp in Valladolid (Spain). We will execute this project on a turnkey basis and the scope of the work
includes the design, the construction, and the commissioning of the plant, as well as its operation and
maintenance during the first two years. The plant delivery is scheduled for 2025 and is expected to have an
estimated production of 37GWh per year.
▪On December 2024, we were awarded the construction of a solar photovoltaic plant with a capacity of
95MWp in Murcia (Spain). We will execute this project on a turnkey basis and the scope of the work includes
the design, the construction and the commissioning of the plant. The plant delivery is scheduled for 2026.
In the United States, we acquired a project for the construction and operation of a 257 Mwdc photovoltaic plant in
Texas in the first half of 2024 for USD 14.08 million (EUR 13.04 million). The group plans to invest USD 72 million
(approximately EUR 67 million) in the development of this project. This asset, currently under construction, is
expected to start operations in 2026. For more information, see Item 4. Information on the Company—A. History and
Development of the Company —1. Summary of Historical Investments and Divestments —7. Acquisition of Misae
Solar IV, LLC.
In Poland, through a JV (BxF Energia) together with Budimex, a project was acquired for the construction and
operation of a 60MWdc photovoltaic plant in the first half of 2024 for PLN 89.4 million (EUR 20.5 million) . This
asset, currently under construction, is expected to start operations in 2025. (See “Item 4. Information on the Company
—A. History and Development of the Company —1. Summary of Historical Investments and Divestments —4.
Acquisition of Developres Zielona Energia sp. z o.o.”).
Inception
The Energy Business Division was set up in January 2024, when Ferrovial announced the reorganization of all energy
business activities present across the Group into a single organizational unit with unified direction, intended to align
strategies and maximize any benefits arising from the synergies among them.
Customers and Type of Contracts
Within the Energy Business Division, our main customers and type of contracts vary depending on the market
dynamics of each business line of the Division and the specific underlying service or asset.
For our electricity generation and storage activity, we acquire or promote and develop our own energy assets. The
energy generated by our assets will be sold through a long term off-take agreement -for example a Power Purchase
Agreement (PPA) at an agreed price with an off-taker requiring large amounts of electricity-, or alternatively selling
the produced energy in the wholesale market in accordance with the applicable electric sector regulations.
Our transmission lines are freehold assets awarded by governmental authorities—for example, the Chilean Ministry of
Energy—following our successful participation in a competitive bidding process. These assets are not subject to
demand risk (i.e., financial risk that we will be unable to sell our services) since they are subject to availability
payment, a means to compensate private parties for designing, constructing, operating and maintaining a facility,
codified pursuant to Chile’s General Law of Electric Services and the Adjudication Decree (administrative act issued
by the Ministry of Chile). Although we enter into underlying agreements with the appropriate governmental
authorities, the direct recipients of the services provided by our transmission lines assets managed under our energy
infrastructure are electricity generation and distribution companies.
Our EPC activity operates through engineering, procurement and construction agreements whereby we assume
obligations to design, procure and construct energy infrastructures. We generally enter into those agreements by virtue
of our successful participation in public and private procurements.
Activities
Our activities include:
▪The development, acquisition, finance, and operation of renewable generation, storage and transmission line
infrastructures.
▪The construction of renewable generation, storage and transmission lines infrastructure.
▪Provision of Energy Efficiency solutions for public and private clients.
In a sector subject to constant change, we intend to use, together with our own resources, our participation in industrial
ecosystems to develop and invest in technologies that enable growth in profitable businesses. The Energy Business
Division’s activity focus on selected preferred geographies: the U.S., Spain, Poland, Chile and Australia.
The Energy Business Division is an active part of our ESG strategy, with the focus on the fight against climate change
and the decarbonization of the economy, in line with the Horizon 24 Strategic Plan. For more information on our ESG
actions, see “—13. Environmental and ESG / Sustainability / Health and safety.”
4.B.3.3.5Other
We generally use the “other” category to reflect results for companies not assigned to any Business Division, the most
significant being Ferrovial SE, the Group’s parent company, as well as the new business line Ferrovial Digital
Infrastructure and some minor subsidiaries, including the mobility business and remaining services businesses, (i.e. the
Chilean mining services and the waste management plants in the United Kingdom).
Ferrovial Digital Infrastructure
In 2024, we created a new business line, Ferrovial Digital Infrastructure, with the target of identifying investment
opportunities to develop high-value projects in the data center market.
Services and Mobility Businesses
Between 2017 and 2023, our Mobility subdivision operated Car Sharing Mobility Services, S.L. (“Zity”), an electric
car-sharing company operating, directly or through subsidiaries, in Madrid, Paris, Lyon, and Milan with a fleet of
approximately 1,500 electric vehicles. We had a 50.0% stake in this project, developed jointly with manufacturer the
Renault Group. On December 20, 2023, we completed the sale of our stake in Zity to focus on activities linked to the
development and management of sustainable infrastructures. For further details on this divestment, see “Item 4.
Information on the Company—A. History and Development of the Company—1. Summary of Historical Investments
and Divestments—7. Divestment of Car Sharing Mobility Services, S.L. (Zity).” Within the Mobility subdivision, we
also have a minority stake in Inspiration Mobility, which is a North American company investing in the electric
vehicle sector, both in cars and associated charging structures.
We also manage circular economy (i.e., a production and consumption model that incentivizes the sharing, leasing,
reutilizing, repairing, renewing, and recycling of already-existing raw materials and products throughout their life
cycle) activities. We have four municipal solid waste management centers in the United Kingdom, located in
Yorkshire, Milton Keynes, Cambridge, and Isle of Wight. Each of them is largely (Cambridge) or exclusively (other
three locations) associated with a concession contract with different local authorities. Together, they have capacity to
treat some 800,000 tons per year.
Finally, in Chile, our activity includes providing services to large-scale copper mining, such as maintenance, hoisting,
or management of the electrical loop.
Inception
As part of our partial reorganization of our Business Divisions mentioned in “A. History and Development of the
Company—1. History of the Company” resulting in the Energy Business Division, the mobility business line and
remaining services businesses, (i.e. the Chilean mining services and the waste management plants in the United
Kingdom), which were until then part of the former Energy Infrastructure and Mobility Business Division, are
separately managed outside of the scope of our Business Divisions and reported as “Other” (see further explanation in
“4. Information on the Company —B.Business overview —1. Overview”).
Customers and Type of Contracts
In the case of our waste management plants our main customers are local authorities. Our main customers with respect
to the services we provide to the Chilean mining industry are large copper producers including Codelco, BHP Billiton
and Antofagasta Minerals.
Most of our waste management activities in United Kingdom occur under four concession contracts with different
local authorities, which regulate both the plants’ construction and subsequent operations. These concession contracts
are expected to expire between 2026 and 2043. Finally, our services to the Chilean mining industry are governed by
services contracts entered into with the relevant services’ recipient and usually last between 3 and 5 years.
Activities
Our activities include:
▪The operation of waste management plants in the United Kingdom; and
▪The management of our outstanding services businesses, mainly providing services to the mining industry in
Chile.
4.B.3.3.6Discontinued Operations (Services)
In 2018, following completion of a strategic review process, we decided to classify the Services Business Division as
discontinued operations. We concluded the divestment process in 2022.
As discussed in “Item 4. Information on the Company—A. History and Development of the Company—1. History of
the Company” we have retained the United Kingdom waste management business and the services activity in Chile as
part of our former Energy Infrastructure and Mobility Business Division. Since January 2024, these businesses are
reported as “Other”.
On June 28, 2024, we completed the sale of our 24.8% stake in Grupo Serveo to its majority shareholder, Portobello
Capital. See “Item 4. Information on the Company—A. History and Development of the Company—1. Summary of
Historical Investments and Divestments—4. Divestment of 24.8% stake in Serveo.” We had originally acquired this
stake upon completion of the sale our Spanish infrastructure services business to Portobello Capital for approximately
EUR 175 million after price adjustment on January 31, 2022 (see “Item 4. Information on the Company—A. History
and Development of the Company—1. Summary of Historical Investments and Divestments——15. Divestment of
Infrastructure Services Business in Spain”), This transaction culminates our divestment of the services business in
Spain as part of our strategy to focus on our core business—the development and operation of sustainable
infrastructure.
4.B.4Seasonality
For a discussion of seasonality, see “Item 5. Operating and Financial Review and Prospects—A. Operating Results—
2. Material Factors Affecting Results of Operations—5. Seasonality.”
4.B.5Sources and Availability of Raw Materials
For a discussion of sources and availability of raw materials, see “—3. Group Overview—3. Our Business Divisions—
3. Construction Business Division” and “Item 5. Operating and Financial Review and Prospects—A. Operating
Results—2. Material Factors Affecting Results of Operations—1. Inflationary pressures and energy and commodity
prices.”
4.B.6Research and Development
Innovation is an important element to improving existing business models and exploring new ways of adding value,
and is one of the key priorities for our Horizon 24 Strategic Plan. We expect to continue increasing our digital and
innovation ratios and supporting the transformation of our Business Divisions and physical infrastructures through
Digital Horizon 24, the innovation and digitization program of the Horizon 24 Strategic Plan. Digital Horizon 24
entails the improvement of our risk management, efficiency, customer-focused competitiveness, differentiation, and
diversification processes, as well as growth in new areas.
To ensure sustainable impact, we have established a new innovation strategy (2022-2024) focused on generating
impact in the following areas: (i) competitive advantages, (ii) transformation, and (iii) diversification and growth.
▪Competitive advantages. We invest to develop new products and processes that generate a higher quality of
service to our customers. For example, in 2022, we launched INFRAVERSE, an initiative for the efficient
use of the technologies that make up the metaverse, to improve construction and operation processes to
better respond to customer needs.
▪Business transformation. Managed by our centers of excellence, which are focused on three critical areas: (i)
mobility and digital infrastructure, (ii) asset management, and (iii) energy and sustainability, the latter of
which we launched in 2022 to directly support our energy infrastructure development activities. In parallel,
we also promote the industrialization of the entire construction process by synchronizing the production and
assembly of components through supply chain and logistics planning.
▪Diversification and growth. We have launched new adjacent businesses under the venture building process
created in 2022 to develop and launch business ideas. We expect to create new products and services under
this initiative that will increase the value generated for our clients and enable new digital channels and
additional sources of income.
We promote our open innovation ecosystem and alliance network through relationships with universities and research
centers, startups and venture capital funds, public innovation agencies responsible for setting industrial policy, and
with other large corporations. Particularly relevant is the research collaboration with the Massachusetts Institute of
Technology (MIT), through MIT’s energy initiative, renewed in 2021 for a third five-year period, and through the MIT
Mobility Initiative, which we joined in 2021 as a founding member. We have also established a 5-year strategic
partnership agreement with Microsoft to cooperate in developing solutions to reimagine sustainable construction,
infrastructures, and mobility of the future. The Toll Roads Business Division has also historically collaborated with
top academic research centers in the U.S. including Stanford, Cornell, The University of Texas, and Texas A&M. As
an example, we have recently signed two master research agreements with Georgia Tech and the Texas Transportation
Institute to develop research projects.
We also work in the development of tools, applications and initiatives that are useful to us and our Business Divisions:
▪We developed ATLAS, a new digital tool that centralizes IT and innovation initiatives, in 2022. Digitizing
and unifying management provides considerable benefits, such as the homogeneity of processes, having a
single source of information, transparent collaboration between teams, and integration with other digital
tools. ATLAS also enables the implementation of a governance model that ensures constant communication
and exchange of information between the portfolio department and the business lines, facilitating the
monitoring of initiatives and strategic, operational, and budgetary decision-making related to our investment
in IT and innovation.
▪The Toll Roads Business Division developed the Nextpass app, which allows payment on toll roads across
several states.
The Energy Business Division launched our Monitoring and Control Center, which encompasses operation and
maintenance activities related to electricity generation assets and transmission lines and enables the monitoring of the
electricity systems (generation facilities and transmission lines) in the markets in which we operate.
4.B.7Intellectual Property
We implement intellectual property (“IP”) protection policies and procedures. The measures we take to protect our IP
include the registration of trademarks and Internet domain names to protect our interests, as appropriate. In addition,
we protect our IP assets through patents and utility models. We have more than 50 patents and utility models.
However, we believe that none of the referred patents and utility models are key or material elements in our Business
Divisions.
In order to protect our IP, our relevant policies and procedures on this field apply to all subsidiaries, which are
required, among others, to (i) proceed with an early registration of trademarks and Internet domain names whenever it
is expected that we enter a new industry or commence activities in a new country and (ii) properly define the relevant
products and services to ensure an adequate protection of our trademarks.
We developed, and continuously improve, applications and systems that are crucial to efficiently run our Business
Divisions: for example, the InSite System for the Construction Business Division, the Managed Lanes (BOS system)
for the Toll Roads Business Division, and the Asset Management Platform for all Business Divisions.
4.B.8Market and Competitive Environment
The markets and geographies where we operate are numerous and the competitive environment depends on the activity
and the countries in which we perform each activity. We have numerous competitors. The extent of our competition
varies depending on particular markets and geographic areas and is influenced by the type and scope of a particular
project.
A summary of our main competitors, differentiating between infrastructure and other contracts, is set out below.
4.B.8.1Concessions in infrastructure projects
For concessions in infrastructure projects, our main competitors are international developers and infrastructure funds.
Such funds typically raise money from different types of investors, such as pension funds or insurance companies
interested in investing in long term projects linked to inflation. In addition, we face competition from listed companies
vying for concessions projects and from big construction groups interested in investing in the equity of our concession
companies and building the projects for the concession company.
The main competitive factors in this industry include: (i) financing capacity in order to inject equity in projects and
being able to close financial agreements with banks or other financial institutions in order to finance the required
investments, (ii) technical skills to design better solutions to cover clients’ needs in terms of, for example, traffic
management and environmental impact, (iii) expected returns on projects, (iv) technical skill in operating the
infrastructure, including, for example, electronic tolling systems or infrastructure maintenance and (v) the use of data
analytics and artificial intelligence to produce self improving pricing algorithms.
4.B.8.2Construction contracts
For construction contracts our main competitors are big or medium size construction companies; in some cases, these
are global players in terms of geography, but, mainly, they are local or regional players with different types of skills
and, in some cases, specialized by type of work.
The main competitive factors in the industry include: (i) availability of qualified, skilled, and/or licensed personnel, (ii)
reputation for quality and technical expertise as well as design capabilites, (iii) cost structure and the ability to control
project costs, (iv) price, (v) geographic diversity, (vi) experience in specialized markets, and (vii) financial robustness
in terms of solvency and liquidity.
We believe we are well-positioned to compete in our markets because of our reputation, our technical experience in
the design of feasible solutions for our clients, our cost effectiveness, our employee expertise, and our broad range of
services. Furthermore, we believe our size, technical capabilities, and geographic presence places us in a strong market
position.
4.B.9Regulatory Environment
We must comply with specific regulations in the sector in which we carry out our activities and operations.
Additionally, in the countries where we operate, there are local, regional, national, and EU bodies that regulate our
activities and establish applicable environmental regulations.
4.B.9.1Tolls roads
United States
The United States follows a PPP approach (long term agreements between the government and a private partner
whereby the private partner delivers and funds public services using a capital asset and sharing the associated risks) to
toll road construction and operations.
Federal, state, and local laws regulate PPP procurement: (i) at a federal level, through (a) environmental obligations
imposed by the National Environmental Policy Act and the Comprehensive Environmental Response, Compensation,
and Liability Act, (b) anti-corruption and anti-money laundering obligations and, among others, (c) foreign investment
regulations dictated by the Committee on Foreign Investment in the United States (“CFIUS”), and (ii) at a state or
local level, by PPP-enabling state and local laws and regulations, which cover the statutory framework under which
states have general or limited authority to procure and to enter into a PPP contract with a private party for the
development of highway transportation infrastructure projects.
United Kingdom
In UK, private investment into government funded projects including the construction of roads has been by way of
Public Private Partnership (PPP). The UK does not have a PPP law or PPP specific procurement regulations. PPP
projects are procured under Public Contracts Regulations 2015, and other regulations such as the Procurement
Regulations 2015 and the Concession Contracts Regulations 2016, which are based on EU procurement regulations.
The Procurement Act 2015 will be soon replaced by the Procurement Act 2023, that is due to become effective on 24
February 2025. National Highways (formerly Highways England) is the government-owned company responsible for
operating, maintaining and improving England’s motorways and major A-roads, the Strategic Road Network (SRN).
Transport for London (TfL) is a local government body responsible for most of the transport network in London,
United Kingdom.
Canada
Case law on procurements generally, as well as public sector statutes, directives, and policies applicable to PPPs apply
to our toll roads projects in Canada.
Each Canadian province also has its own health and safety legislation and applicable environmental impact
assessment. For example, in Ontario, the Occupational Health and Safety Act applies to toll roads. The Ministry of
Labour, Immigration, Training and Skills Development administers the applicable health and safety legislation,
including enforcement of legislative requirements. In that role, Ministry inspectors may inspect workplaces, issue
orders where there is a contravention of the legislation, investigate accidents, and recommend prosecutions.
Environmental Assessments conducted pursuant to the Environmental Assessment Act (EAA) are under the
jurisdiction of the Ministry of Environment Conservation and Parks (MECP).
Australia
In Australia, the following laws and regulations apply to toll roads, among others: (i) the National PPP Policy
Framework, which sets out the processes authorities are to follow in all stages of PPPs, (ii) the Competition and
Consumer Act 2010, (iii) the Foreign Acquisitions and Takeovers Act 1975, (iv) environmental regulations, and (v)
workplace health and safety laws.
The Australian government has a centralized PPP authority associated to the Treasury Department, although it
cooperates with regional and local governments in the procurement of projects.
Spain
The following laws and regulations apply to toll roads projects in Spain: (i) Public Sector Contracts’ Act of 2017
(Ley 9/2017, de 8 de noviembre, de Contratos del Sector Público), (ii) Motorways Act of 1972 (Ley 8/1972, de 10 de
mayo, de construcción, conservación y explotación de autopistas en régimen de concesión), (iii) the Regulation on
General Terms and Conditions for the Construction, Operation and Maintenance of Motorways (Decreto
215/1973, de 25 de enero, por el que se aprueba el pliego de cláusulas generales para la construcción, conservación y
explotación de autopistas en regimen de concesión), (iv) Compulsory Acquisition of Land Act of 1954 (Ley de 16 de
diciembre de 1954 sobre expropiación forzosa), and (v) the Environmental Assessment Act of 2013 (Ley 21/2013, de
9 de diciembre, de evaluación medioambiental).
The Department of Roads of the Ministry of Transport is the responsible entity for projects related to the national
network of roads. The relevant Department of Transport of an autonomous community (comunidad autonóma) is the
responsible entity for projects related to the roads of an autonomous community.
Portugal
The following laws and regulations apply to toll roads projects in Portugal: (i) the Public Contracts’ Code (Código dos
Contratos Públicos), (ii) the National Road Network Act of 2015 (Estatuto das Estradas da Rede Rodoviária
Nacional), (iii) the Highway User’s Act of 2007 (Lei dos Direitos nas Vias Rodoviárias Classificadas como Auto-
estradas Concessionadas, Itinerários Principais e Itinerários Complementares), (iv) the Compulsory Acquisition of
Land Code of 1999 (Código das Expropriações), and (v) the Environmental Assessment Act of 2013 (Regime Jurídico
de Avaliação de Impacte Ambiental). Projects related to the roads of an autonomous community may be subject to
specific regional regulation. For example, in Azores, the Regional Road Network Act of 2003 (Estatuto das Vias de
Comunicação Terrestre na Região Autónoma dos Açores) applies toll roads projects.
The Secretary of State for Infrastructure and the Secretary of State for Finances are the responsible entities for projects
related to toll roads in Portugal.
Following completion of the sale of our stake in the Euroscut Azores to infrastructure funds Horizon Equity Partners
and RiverRock on December 28, 2023, we no longer hold an interest in any toll road concessions in Portugal, although
we continue to render managerial services to the Norte Litoral, Via do Infante (Algarve) and Euroscut Azores toll
roads through the relevant services’ contracts.
Ireland
The following laws and regulations apply to toll road projects, which are procured as PPPs, in Ireland: (i) the State
Authorities (Public Private Partnership Arrangements) Act of 2002, (ii) the Roads Act of 1993, as amended, and (iii)
the Safety, Health and Welfare at Work Act of 2005.
Transport Infrastructure Ireland is the public entity responsible for managing the procurement process of national road
schemes in Ireland.
Slovakia
The following laws and regulations apply to toll road projects, which are procured as PPPs, in Slovakia:
(i) Public Procurement Act (Act No. 343/2015 Coll.), (ii) Building Act (Act No. 50/1976 Coll., to be shortly replaced
by Act No. 201/2022 Coll.), (iii) the EIA Act (Act No. 24/2006 Coll.), (iv) the Act on Safety and Protection of Health
at Work (Act No. 124/2006 Coll.), (v) the Regulation of Slovak Government on Minimum Safety Requirements (Act
No. 391/2006 Coll.), (vi) the Slovak Constitution, (vii) the Expropriation Act (Act No. 282/2015 Coll.), and (viii) the
Special Acceleration Acts (Act No. 129/1996 Coll. and Act No. 669/2007 Coll.).
The Ministry of Transport and/or the National Highway Company procure for new PPP road projects in collaboration
with (i) the Ministry of Finance, (ii) the Slovak Government, and (iii) the Slovak Public Procurement Office.
Colombia
Colombia also regulates toll road projects as PPPs. The following laws and regulations apply to toll road projects in
Colombia: (i) Law 80 of 1993 on public procurement law (Ley 80 de 1993 por la cual se expide el Estatuto General de
Contratación de la Administración Pública), (ii) Law 1508 of 2012 (Ley 1508 de 2012 por la cual se establece el
regimen jurídico de las Asociaciones Público Privadas), Decree 1467 of 2012 (Decreto 1467 de 2012 por el cual se
reglamenta la Ley 1508 de 2012), and Decree 0100 of 2013 (Decreto 0100 de 2013 por el cual se modifica el Decreto
1467 de 2012) on PPPs, (iii) Decree 1079 of 2015 on the transport sector (Decreto 1079 de 2015 por medio del cual se
expide el Decreto Único Reglamentario del Sector Transporte) and (iv) Decree 1076 of 2015 on environmental
licenses which are to be granted by the National Environmental Licensing Authority (Decreto 1076 de 2015 por medio
del cual se expide el Decreto Único Reglamentario del Sector Ambiente y Desarrollo Sostenible).
The public authorities involved in the toll roads’ procurement are the Ministries of Transport and Finance and the
National Infrastructure Agency.
India
The following laws and regulations apply to toll road projects in India: (i) procurement regulations at both at a national
level, such as (a) the National Highways Authority of India Act of 1988 and (b) the National Highways Act of 1956,
and at a state level, such as specific regulations pursuant to which state regulators may develop roads in their region
(for example, the Uttar Pradesh Expressways Industrial Development Authority, set up under the Uttar Pradesh
Industrial Area Development Act of 1976), (ii) labor and environmental laws, including (a) the Code on Social
Security of 2020, (b) the Occupational Safety, Health & Working Conditions Code of 2020, and (c) the Environmental
Protection Act of 1986, as well as (iii) foreign investment regulations, including (a) the Foreign Exchange
Management Act of 1999, (b) the Securities and Exchange Board of India Act of 1992, and (c) the Competition Act of
2002.
The National Highways Authority of India is the responsible entity for national highway projects in India.
4.B.9.2Airports
United States
Generally applicable civil and commercial laws and regulations, federal, state, and municipal regulations on
transportation, labor matters, construction activities, environmental matters, state contract law, and permitting, among
others, apply to our NTO project. There are also various miscellaneous federal laws that apply to and frame the
activities of NTO at JFK, including those related to civil rights, anti-discrimination, the environment, and other
relevant matters (such as anti-money laundering, corruption, and similar matters).
In addition, since the activities of the project company relate to airport activities, federal agencies such as the FAA,
Transportation Security Administration (“TSA”) and CFIUS have overview powers over the investments we make,
our ongoing operations, and other relevant operational and regulatory matters. Furthermore, due to the anticipated
construction activities of the project company, the project requires federal National Environmental Policy Act
(“NEPA”) (or environmental) approval in order to proceed. NTO must also comply with a number of airport
regulations, which include the Port Authority of New York and New Jersey’s Airport Rules and Regulations (which
regulate operations at the JFK), as well as the Federal Aviation Regulations (“FARs”) prescribed by the FAA, which
govern aviation activities in the United States.
Title 14 of the Code of Federal Regulations (“CFR”) codified The FAA’s FARs and regulates aircraft design and
maintenance, airline flights, pilot training activities, and commercial space operations. The FAA also regulates
certifications and operation of airports, investigation procedures, air and water regulation, soil erosion, programs and
project grants’ applications, noise compatibility planning, and noise and access restrictions.
The NEPA is also relevant for environmental compliance.
In addition, we collaborate with TSA to comply with its regulations to facilitate security screening of passengers, U.S.
Customs & Border Protection, and other security activities at the airport.
In the event that we access the capital markets to raise any debt incurred to finance the project, federal and state
securities laws related to the issuance of securities, including, without limitation, the Securities Act (and jurisprudence
related thereto, including in respect of 10b-5 liability), will apply. Lastly, the operations of any such project/asset
implicate both state and federal tax laws.
Turkey
The main regulations governing the activities of the Dalaman airport include those relating to the concession and
operation of the Dalaman airport terminals, such as (i) the Turkish Civil Aviation Law No. 2920, (ii) the Terminal
Operation Services Instructions of the Turkish Directorate General of Civil Aviation, (iii) the Regulation on Opening
and Operating Permits of Sanitary Enterprises at Civil Airport Terminals, (iv) the Airport Terminal Operation
Instruction of the Turkish Directorate General of Civil Aviation, (v) the tariffs announced by General Directorate of
State Airports Authority of Turkey on airport charges, (vi) the Terminal Operation Services Directive, and (vii) the
Regulation on Building, Operation and Certification of Airports.
Other relevant regulations and certifications include (i) the Safety Management Regulation and related International
Civil Aviation Organization publications, such as the International Civil Aviation Organization Annex 19 on Safety
Management Systems, International Civil Aviation Organization Document 9859 (Safety Management Guide) and
Safety Management Systems Operation Instruction (safety and security requirements), (ii) the Occupational Health
and Safety Law No. 6331 and OHSAS 18001:2007 certificate (health and safety requirements), (iii) the Turkish
Environmental Law No. 2872, ISO 14001:2015 certificate, Regulation on Environmental Permit and License, as well
as sector-connected regulations on air quality, water quality and waste management (environmental requirements), and
(iv) the Security Services Administration and Organization Instruction of the Turkish Directorate General of Civil
Aviation (SHT-17.3), on Homeland security, (v) the general protocol dated October 26, 2017 between the Ministry of
Transportation and the General Staff of Republic of Turkey, regarding civil aviation operators’ use of military bases,
and (vi) the protocol dated October 25, 2017 between the general Directorate of State Airports Authority of Turkey
Dalaman airport General Directorate and the Dalaman Air Base Command and the Dalaman Naval Air Base
Command regarding the joint use of the Dalaman airport (homeland security requirements in connection with military
use of the airport).
The main public authorities/entities with regulatory and supervisory powers on airport activities in Turkey are (i) the
Ministry of Transportation and Infrastructure of Turkey, (ii) the General Directorate of State Airports Authority of
Turkey, and (iii) the Turkish Directorate General of Civil Aviation.
Qatar
The laws and regulations applicable to companies operating in the aeronautical sector in Qatar apply to FMM. Apart
from generally applicable civil and commercial laws and regulations, the following rules and protocols apply to FMM
operations: (i) Labor Law no. 14 of 2004 with all its applicable and related regulations, including but not limited to
health, welfare, safety, accommodation regulations, sponsorship law and related regulations, (ii) Income Tax Law no.
24 of 2018, (iii) Privacy and Data Protection of Personal Data Law no. 13 of 2016, (iv) Ministerial Resolution No. (16)
of 2018 Concerning waste transportation controls and the means to be followed in the process of disposal, (v) Minister
of Municipality Decision No. (143) of 2022 Regulations for the use of plastic bags, (vi) Doha airport Operating Rules,
Safety and Security Procedures, and (viii) Cleaning and Sanitation Standards QTR-CNT-STD-010.
The main public authorities/entities with regulatory and supervisory powers on airport activities in Qatar are (i) the
Ministry of Commerce and Industry, (ii) the Ministry of Labor, (iii) the Ministry of Finance, and (iv) the Ministry of
Environment and Climate Change.
4.B.9.3Construction
United States
The Federal Acquisition Regulations serve as the primary regulatory code with respect to U.S. federal agencies
acquiring services and supplies. Construction projects must also comply with (i) federal safety and health legislation,
such as the Occupational Safety and Health Act of 1970 (“OSHA”), enforced by the Occupational Health and Safety
Administration, (ii) other federal requirements regarding human health and environment enforced by the U.S.
Environmental Protection Agency (“EPA”), and (iii) other federal and state labor regulations, including regulations in
the fields of health and safety, employee wages and benefits, anti- discrimination and subcontracting. In addition to the
aforementioned OSHA, EPA, and labor regulations, most states also enact safety regulations, and there are further
regulations at the regional and local levels. Some states also require a variety of construction licenses in connection
with the carrying out of certain projects.
United Kingdom
The main regulations governing construction services in the United Kingdom include: (i) health and safety regulations,
such as (a) the Health and Safety at Work etc. Act 1974 (“HSWA”) and its subordinate regulations and (b) the
Construction (Design and Management) Regulations 2015, (ii) environment regulations, including (a) the Clean Air
Act 1993 and (b) the Climate Change Act 2008, (iii) water quality regulations, including the Water Resources Act
1991 and related acts and regulations, (iv) waste management regulations, with a wide range of legislation controlling
the generation, transportation, and disposal of waste, and (v) labor legislation, which governs labor rights, including,
among others, (a) the Employment Right Act 1996 (“ERA”), (b) the Equality Act 2010, (c) the Employment Relations
Act 1999, and (d) the Working Time Regulations 1998 (“WTR”) and National Minimum Wage Act 1998 (“NWM”).
The Health and Safety Executive (“HSE”), an agency with extensive enforcement powers, oversees compliance with
the HSWA. There are several licenses and consents that a contractor may be required to obtain to carry out
construction work. For example, work that involves asbestos requires a license from the HSE. In addition, the HSE
also receives pre-work commencement notifications in connection with certain construction projects as set forth in the
Construction (Design and Management) Regulations 2015.
The Environment Agency is responsible for enforcing laws that protect the environment and issuing environmental
permits and exemptions.
Canada
Canada is a federal state, with law-making authority divided among the federal government and the governments of
each Canadian province. Laws at both levels govern Ferrovial Construction’s projects. The laws and regulations
applicable to our construction projects in Canada include: (i) health and safety regulations, as regulated by the
provinces and territories, (ii) environmental regulations, such as (a) the Environmental Assessment Act, applicable in
each province and territory, (b) the Canadian Environmental Assessment Act, (c) the Canadian Environmental
Protection Act, (d) the Fisheries Act, (e) the Species at Risk Act, and (f) the Ontario Environmental Protection Act
(with respect to the latter, similar legislation exists in the other Canadian provinces), and (iii) water regulations, mainly
as regulated by the Canada Water Act, as well as a number of other federal and provincial or territorial statutes and
regulations, and (iv) labor regulations.
In the province of Ontario, where Ferrovial Construction’s activities are mostly located, the Occupational Health and
Safety Act establishes requirements aimed at preventing workplace injuries, occupational diseases and harassment in
the work place (similar laws exist in other provinces). Specific requirements, in addition to provincial laws, apply to
projects, or industries, regulated by the federal government. Other relevant labor legislation includes: at the federal
level, (i) the Canada Labour Code, (ii) the Employment Equity Act, and (iii) the Employment Standards Act. Workers’
compensation is regulated at the provincial and territorial level.
The permitting process is the main source of construction oversight. Professional and other licensing and permit
requirements vary widely in each province and territory in Canada. Provincial and municipal jurisdictions, and a
governmental agency in charge of a project could require additional qualifications in a request for proposal. This is a
highly detailed and regulated area of law that not only depends on the jurisdiction, but also on the nature of the project
being undertaken and the type of work being performed. Examples of licenses and permits that an engineer or
contractor may be required to obtain to carry out construction work include: (i) Engineering and Architect License, (ii)
General Contractor License, or (iii) Trade Contractor License. Most provinces, territories, and municipalities also
require a variety of construction permits, such as building permits or plumbing permits.
Australia
The main regulations applicable to construction projects in Australia are (i) health and safety regulations, with regards
to which the Federal Government has effected regulations specific to each state and territory’s jurisdiction, (ii) water
regulations, including the State Acts and Regulations, (iii) waste regulations, with a wide range of legislation
controlling the generation, transportation, and disposal of waste, (iv) labor regulations, including (a) the Fair Work Act
2009, (b) Superannuation Guarantee law and (c) the Work Health and Safety Act 2011, (v) anti-harassment, bullying
and discrimination regulations, and (v) other specific regulations, such as the Security of Payment Legislation. The
permitting process is the main avenue for construction oversight in Australia. In general, non-residential construction
in each state or territory requires registration or licensing as a builder before construction work can be carried out.
Many governmental subdivisions in Australia have statutory bodies which monitor compliance with these licensing
and registration regimes. Other construction activities must also comply with specific regulations and licensing across
Australia: working at heights, working with asbestos, welding, conducting demolitions, conducting excavations, using
cranes, and using scaffolding. Furthermore, businesses operating in Australia are also required to have systems in
place certified to international standards and, for projects with federal funding, accredited by the Office of the Federal
Safety commissioner.
Poland
In Poland, the following regulations apply to construction services: each construction contract must comply with (i)
construction regulations, including (a) the Polish Civil Code, (b) the Building Act, and (c) the Zoning and
Development Act, (ii) health and safety regulations, (iii) labor regulations, including the Labor Law (Act of June 26,
1974) and its developing and implementing regulations, and (iii) environmental regulations, including (a) the
Environment Protection Act, (b) the Water Act, (c) the Waste Act, and (d) the Revitalization Act.
The main public authorities/entities with regulatory and supervisory powers on construction activities in Poland are,
with respect to environmental matters, the General Directorate for Environmental Protection and, with respect to
construction generally, the Ministry of Infrastructure.
Spain
The following laws and regulations govern a variety of aspects of the construction industry in Spain: (i) public
construction contracts, such as (a) the Spanish Civil Code (Código Civil), (b) the Spanish Building Act (Ley 38/1999,
de 5 de noviembre, de Ordenación de la Edificación), (c) for construction contracts entered into with public
authorities, the Spanish Public Sector Contracts Act (Ley 9/2017, de 8 de noviembre, de Contratos del Sector Público)
and the Law on the Administrative Procedure for Public Authorities (Ley 39/2015, de 1 de octubre, del Procedimiento
Administrativo Común de las Administraciones Públicas), (d) Law on the Prevention of Risks at Work, (Ley 31/1995,
de 8 de noviembre, de Prevención de Riesgos Laborales), (e) Law on Subcontracting within the Construction Sector
(Ley 32/2006, de 18 de octubre, reguladora de la subcontratación en el Sector de la Construcción), and (f) various
statutory regulations setting out other specific obligations, as well as (ii) health and safety, including (a) Decree Law
providing for minimum health and safety requirements applicable to construction works (Real Decreto 1627/1997, de
24 de octubre, por el que se establecen disposiciones mínimas de seguridad y de salud en las obras de construcción),
(b) Law governing outsourcing within the construction industry (Ley 32/2006, de 18 de octubre, reguladora de la
subcontratación en el Sector de la Construcción), and (c) Decree Law developing Article 24 of the on the Prevention
of Risks at Work (Real Decreto 171/2004, de 30 de enero, por el que se desarrolla el artículo 24 de la Ley 31/1995, de
8 de noviembre, de Prevención de Riesgos Laborales, en materia de coordinación de actividades empresariales), (iii)
land pollution, as governed by the Land Pollution Law (Ley 7/2022, de 8 de abril, de residuos y suelos contaminados
para una economía circular), (iv) air quality, as governed by the Air Quality Law (Ley 34/2007, de 15 de noviembre,
de calidad del aire y protección de la atmósfera), (v) water, as regulated by a variety of acts and regulations, (vi) waste
management, as regulated by a wide range of legislation imposing a “duty of care” in operators, (vi) labor, including
(a) Decree Law approving the Workers’ Statute Act (Real Decreto Legislativo 2/2015, de 23 de octubre, por el que se
aprueba el texto refundido de la Ley del Estatuto de los Trabajadores), (b) the Equal Treatment and Non-
Discrimination Act (Ley 15/2022, de 12 de julio, integral para la igualdad de trato y la no discriminación), (c) Decree
Law fixing the minimum interprofessional wage (Real Decreto 99/2023, de 14 de febrero, por el que se fija el salario
mínimo interprofessional para 2023) (updated annually), and (d) Law on Subcontracting in the Construction Sector.
The permitting process is the main avenue of construction oversight in Spain. There are four main licenses granted by
local authorities and required to carry out construction works: (1) municipal works license (licencia de obras). The
purpose of this license is to verify that the projected works comply with the applicable urban planning regulations.
Any type of construction, including the refurbishment or fitting-out of existing buildings, and for demolition of works,
requires this license; (2) municipal activity license (licencia de instalación de actividades). The purpose of this license
is to confirm that the project complies with the health and safety standards part of the urban planning regulations. The
permitted use for the building and the activities to be carried out there will depend on the uses permitted by the
applicable urban planning regulations. If the activity is disruptive, unhealthy, harmful, or dangerous, the municipal
activity license will lay down some requirements that must be fulfilled by the holder of the license; (3) municipal first
occupancy license (licencia de primera ocupación). This license confirms that the construction follows the technical
specifications contained in the relevant municipal works license. The authority will grant it following an inspection of
the building by the relevant local authority’s technical experts; (4) municipal opening license (licencia de
funcionamiento). This license confirms that the technical specifications part of the municipal activity license have
been properly complied with and, as a result, that the building can be used for the purpose described in that license.
Chile
The following laws and regulations govern our construction activities in Chile: (i) health and safety, by legislation
such as (a) Supreme Decree regarding basic sanitary and environmental conditions in the worksite (Decreto 594/1999,
Reglamento sobre Condiciones Sanitarias y Ambientales Básicas en los Lugares de Trabajo) and (b) Supreme Decree
approving the regulation for the adoption of Article No. 66 bis of Law No. 16.744, regarding safety and health
management at the worksite (Decreto 76/2006, Reglamento para la Aplicación del Artículo 66 bis de la Ley No 16.744
sobre la Gestión de la Seguridad y Salud en el Trabajo en Obras, Faenas o Servicios que Indica), (ii) environment and
air, including legislation such as (a) Supreme Decree on Rules of Particulate Matter Emissions for Artifacts that Burn
or May Burn Firewood and Wood Pellet (Decreto 39/ 2012, Norma de Emisión de Material Particulado, para los
Artefactos que Combustionen o Puedan Combustionar Leña y Pellet) and (b) Regulation on the Establishment of
Prevention and Decontamination Plans, (iii) water, governed by regulation such as Decree on the Water Code (Decreto
1,112/1981, Código de Aguas), and (iv) labor, including (a) the Labor Code (DFL 1, Texto Refundido, Coordinado y
Sistematizado del Código del Trabajo), (b) the Subcontracting in the Construction Industry Act (Ley 20.123, de
Subcontratación en la Industria de la Construcción), (c) the Workplace Accidents and Illnesses Act (Ley 16.744, que
establece normas sobre Accidentes del Trabajo y Enfermedades Profesionales). and (d) the Social Security Law (Ley
16.395, Ley de Organización y Atribuciones de la Superintendencia de Seguridad Social).
The permitting process is the main avenue for construction oversight in Chile. Prior to work execution, construction
projects generally require a construction permit from the respective municipal works director. Some projects require
obtaining an environmental permit through the Chilean Environmental Assessment Service. Other specific permits
may be required, based on the project’s nature.
During construction, projects must comply with and maintain the permits obtained before the execution of work, and
obtain additional permits, such as crane, zoning, environmental, etc. Projects will also be subject to inspections from
the relevant authority. On completion, certain construction works will need a municipal reception certificate, obtained
after a final inspection of the relevant authority, certifying that the project meets the design and technical requirements
in the construction permit.
4.B.9.4Energy
United States
The following laws and regulations apply to energy generation and energy storage infrastructure in the United States at
a federal level: (i) the Energy Policy Act (EPA) (42 USC §13201) that addresses energy production in the United
States, including energy efficiency and renewable energy; (ii) Energy Independence and Security Act (Public Law
110-140 (2007)), which reinforces the energy reduction goals for federal agencies; and (iii) the Federal Renewable
Electricity Requirement (42 U.S.C. § 15852), which requires the federal government to consume at least 7.5% of its
total electricity from renewable sources each fiscal year.
For Texas, the following laws and regulations apply to energy generation and energy storage infrastructure: (i) The
Renewable Portfolio Standard (RPS) (Texas Administrative Code, Title 16, Chapter 25, Subchapter H, Division 1,
Section 25.173), which is a rule that requires electricity retailers to support renewable energy generation; (ii) HB 1500,
the "PUC Sunset" bill, a bill that requires renewable energy projects to pay higher transmission fees and requires
renewable energy projects to secure backup capacity through "firming" requirements starting in 2027; and (iii) Chapter
25 of the Public Utilities Code, which deals with the Renewable Energy Credit Program (Section §25.173) and sets out
renewable energy resource requirements. Projects located within the Electric Reliability Council of Texas (ERCOT)
are largely exempt from FERC’s regulations addressing interconnection, transmission, or power sales.
The relevant regulatory bodies that govern energy generation and energy storage infrastructure in the United States at a
federal level include: (i) the Federal Energy Regulatory Commission (FERC), which regulates interstate transmission
of electricity, natural gas and oil, and also regulates hydropower projects and natural gas terminals pursuant to the
Federal Power Act; (ii) the US Department of Energy, which manages the US nuclear infrastructure, administers
energy policy, and funds scientific research in the energy field; (iii) the Office of Energy Efficiency and Renewable
Energy, a department of the US Department of Energy, which is responsible for research, development and utilization
of energy technologies and processes; (iv) the US Environmental Protection Agency (EPA), which sets annual volume
requirements for biofuels and other alternative vehicle fuels, and manages state renewable energy resources; (v) the
US Department of the Interior, which works with a variety of stakeholders to identify strategies and goals for a clean
energy future; and (vi) the Federal Trade Commission, which regulates advertising and telemarketing, including how
solar developers advertise their systems.
In addition to the federal regulatory bodies that govern energy generation and energy storage at a federal level, Texas
has the following regulatory bodies that also govern energy storage and energy storage infrastructure: (i) the Public
Utility Commission of Texas (PUCT), who is responsible for the regulation and operation of the state's electric,
telecommunication, and water and sewer utilities; (ii) the State Energy Conservation Office (SECO), which helps the
state maximize energy efficiency through a variety of energy efficiency and renewable energy programs that
significantly reduce energy cost and consumption in the institutional, industrial, transportation and residential sectors
of the Texas economy; (iii) the South-central Partnership for Energy Efficiency as a Resource (SPEER), which is a
regional energy efficiency organization (REEO) which devoted to accelerating the adoption of energy efficient
products, technologies, and services in Texas and Oklahoma; (iv) Texas Renewable Energy Industries Alliance
(TREIA), which is aimed to increase renewable energy across Texas as well as grow the state economy; and (v) the
Electric Reliability Council of Texas (ERCOT), which is the independent system operator in the region, which
manages 90 percent of the state's electric load and schedule power on an electric grid and also the administrator of the
Renewable Energy Credit (REC) trading program in Texas.
Spain
The following laws and regulations apply to our energy generation, transmission and storage infrastructure business
line in Spain: (i) the Spanish Energy Act 24/2013 (Ley 24/2013 de 26 de diciembre, del Sector Eléctrico) and its
developing regulations, either at a national or regional level and (ii) EU energy regulations, such as Directive (EU)
2024/1711 of the European Parliament and of the Council of 13 June 2024 amending Directives (EU) 2018/2001 and
(EU) 2019/944 as regards improving the Union’s electricity market design (Text with EEA relevance); Regulation
(EU) 2024/1747 of the European Parliament and of the Council of 13 June 2024 amending Regulations (EU) 2019/942
and (EU) 2019/943 as regards improving the Union’s electricity market design (Text with EEA relevance);
Regulation (EU) 2019/943 of the European Parliament and of the Council of 5 June 2019 on the internal market for
electricity, Directive (EU) 2019/944 of the European Parliament and of the Council of 5 June 2019 on common rules
for the internal market for electricity, and amending Directive 2012/27/EU and Directive (EU) 2018/2001 on the
promotion of the use of energy from renewable sources.
The relevant regulatory authorities and other relevant actors with respect to the Spanish energy ecosystem are the
Ministry for Green Transition and Demographic Challenge (Ministerio para la Transición Ecológica y el Reto
Demográfico), the National Commission for Markets and Competition (Comisión Nacional de los Mercados y la
Competencia), and Red Eléctrica de España, S.A.U., as well those departments of each autonomous community in
Spain bestowed with authority over electricity and environmental matters. A draft law for the re-establishment of the
National Energy Commission is currently in process, subject to the final decision of the Parliament, and is intended to
grant the National Energy Commission with the regulatory powers already allocated to the National Commission for
Markets and Competition. Supranational bodies also perform overview roles such as the European Commission
(Directorate-General Energy) and European Union Agency for the Cooperation of Energy Regulators (ACER).
As it pertains to environmental protection, the Spanish Act 21/2013 (Ley 21/2013, de 9 de diciembre, de Evaluación
Ambiental), as well as its developing regulations, whether national or regional, are relevant for the planning,
permitting, building, and operation of energy infrastructures. In addition, because energy infrastructure extends over
large areas, primarily regional or local zone planning and plotting regulations are also relevant to some extent.
In addition to the laws and regulations referred to in relation to our energy generation, transmission and energy storage
infrastructure business line, the most relevant regulations that apply to our energy solutions business line are those
discussed above in ““Item 4. Information on the Company—B. Business Overview—9. Regulatory Environment—3.
Construction, Spain ”.
In order to get the different permits and authorizations required for the energy business, we must also comply with
general (non-industrial) regulations on public authorization and proceedings such as the Law on Common
Administrative Procedure of the Public Administrations (Ley 39/2015, de 1 de octubre, del Procedimiento
Administrativo Común de las Administraciones Públicas) and the Law on the Legal Regime of the Public Sector (Ley
40/2015, de 1 de octubre, de Régimen Jurídico del Sector Público).
Chile
Chile also highly regulates energy transmission. Its main regulations stem from the General Law of Electric Services
(DFL N°4/20018, Texto Refundido, Coordinado y Sistematizado del Decreto con fuerza de Ley nº 1, de Minería, de
1982, Ley General de Servicios Eléctricos, en Materia de Energía Eléctrica) and its development regulation (Decreto
N°327 que Fija el Reglamento de la Ley General de Servicios Eléctricos), the Transmission Systems and Transmission
Planning Regulations (Decreto n° 37 que Aprueba el Reglamento de los Sistemas de Transmisión y de la Planificación
de la Transmisión), issued by the Ministry of Energy, and the Regulation on the Qualification, Valorization,
Tariffication and Remuneration of Transmission Installations (Decreto n° 10 que Aprueba el Reglamento de
Calificación, Valorización, Tarificación y Remuneración de las Instalaciones de Transmisión), issued by the Ministry
of Energy.
The General Basis for the Environment Act (Ley n° 19300 que Aprueba la Ley sobre Bases Generales del Medio
Ambiente), is a key piece of environmental protection legislation. Other key environmental protection standards in
Chile are (i) the Organic Law of the Superintendence of the Environment (Ley n° 20417 que Crea el Ministerio, el
Servicio de Evaluación Ambiental y la Superintendencia del Medio Ambiente), which provides the regulatory
framework for environmental compliance and enforcement, (ii) Law which creates the environmental courts and a
special environmental jurisdiction (Ley n° 20600 que Crea los Tribunales Ambientales), and (iii) the Regulations
Implementing the Environmental Impact Assessment System.
Other general (non-industrial) regulations on public authorization and proceedings, such as Law of General Bases of
Administrative Procedures, governing the acts of the organs of the State Administration, (Ley n° 19.880 que Establece
las Bases de los Procedimientos Administrativos que Rigen los Actos de los Órganos de la Administración del Estado)
and the Constitutional Organic Law of General Bases of the State Administration (Ley n° 18.575, Ley Orgánica
Constitucional de Bases Generales de la Administración del Estado), also apply to the energy business. In addition to
the laws and regulations referred to in relation to our transmission infrastructure business, the most relevant
regulations that apply to our energy infrastructure construction business are essentially those listed in ”Item 4.B.9.3
Construction—Chile” of this document.
The main regulatory or supervisory authorities of the energy ecosystem in Chile are the Ministry of Energy (Ministerio
de Energía), the National Energy Commission (Comisión Nacional de Energía), the Superintendency of Electricity
and Fuels (Superintendencia de Electricidad y Combustibles), and the National Electrical Coordinator (Coordinador
Eléctrico Nacional).
Poland
In Poland we do follow the regulations established by the European Union, as well as the Polish laws established
largely to ensure compliance with the EU’s regulations.
The primary Polish legal act regulating the development of onshore renewable energy is the Act of 20 February 2015
on Renewable Energy Sources (Ustawa o odnawialnych źródłach energii). It implements among others Directive
2018/2001 of the European Parliament and of the Council of 11 December 2018 into the Polish legal order. The
Directive governs the promotion of the use of energy from renewable sources,. We also cannot ignore the Polish Act
of 20 May 2016 on wind power investments (Ustawa o inwestycjach w zakresie elektrowni wiatrowych) what sets out
the conditions and procedures for the location and construction of wind power plants. Moreover, in May 2020, Poland
adopted the Electricity Market Reform Implementation Plan developed on the basis of the provisions of Regulation
(EU) 2019/943 of the European Parliament and of the Council of 5 June 2019 on the internal market for electricity.
However, connection-related issues, i.e., regulations relating to the connection of energy systems (including RES) to
the power grid, are the domain of the Act of 10 April 1997. – Energy Law (Ustawa – Prawo energetyczne).
The main European legal acts concerning the issues of the environment and the energy sector are: the Renewable
Energy Directive (RED III; the Renewable Energy Directive EU/2018/2001 and the amending Directive
EU/2024/1788 of the European Parliament and of the Council), the European Wind Power Action Plan stemming from
the Wind Power Package unveiled by the Commission on 24 October 2023 and so-called Net Zero Industry Act – a
proposal of the European Parliament and of the Council for strengthening Europe’s net-zero technology products
manufacturing ecosystem. These regulations involve increasing the total share of RES energy in the generation mix of
EU member states from 32% to 42.5% (with a possible increase to 45%) by 2030, the development of renewable
energy sector and the growth of the production of carbon-neutral technology products in Europe. These concepts are
the reflection of the European Green Deal in which the European Commission has adopted a set of proposals to make
the EU's climate, energy, transport and taxation policies fit for reducing net greenhouse gas emissions by at least 55%
by 2030 (the, so called, Fit for 55 package).
Another EU energy regulations applicable also in Poland include, among others, the Directive (EU) 2019/944 of the
European Parliament and of the Council of 5 June 2019 on common rules for the internal market for electricity or the
amending Directive 2012/27/EU and Directive (EU) 2018/2001 on the promotion of the use of energy from renewable
sources.
As it pertains to environmental protection in Poland, the Act of 3 October 2008 on providing information about the
environment and its protection, public participation in environmental protection and environmental impact
assessments, as well as its developing regulations, are relevant for obtaining the decisions on environmental conditions
for the energy projects (including RES).
General regulations on location of the onshore energy projects are contained in the Act of 27 March 2003 on Area
Planning and Development. Local zoning plans and regulations are also relevant location of the onshore energy
projects.
In order to get the different permits and authorizations required for the energy business, we must also comply with
general (non-industrial) public regulations and proceedings, such as, among others, the Act of 7 July 1994 –
Construction Law, the Code of the Administrative Proceedings, Act of 9 June 2011 – Geological and Mining Law, and
many others.
The main regulatory and supervisory authorities in Poland are the Energy Regulatory Office (Urząd Regulacji
Energetyki) and the Ministry of Climate and Environment (Minister Klimatu i Środowiska). The role of the President
of the Energy Regulatory Office is the most crucial. Its responsibilities include, among others, issuing the licenses for
energy generation, transmission, distribution and trade, as well as monitoring compliance with energy laws and
regulations. On the other hand, the Ministry of Climate and Environment promulgates legal acts, such as, for example,
the Regulation of the Ministry of Climate and Environment dated on March 22, 2023 on detailed conditions for the
operation of the electric power system. Transnational entities also perform overview roles such as the European
Commission (Directorate-General Energy) and European Union Agency for the Cooperation of Energy Regulators
(ACER).
4.B.9.5Waste
United Kingdom
We, as an entity involved in the collection, storage, treatment, disposal, and generation of electricity from waste in
England, must comply with a variety of legislative and regulatory requirements, including the Companies Act 2006,
the primary source of corporate law that applies to all companies and directors. The Environment Act 2021 and
Environmental Protection Act 1990 provide the framework for environmental protection, with the Environmental
Permitting (England and Wales) Regulations 2016 and associated permits applying to installations, mobile plant, and
waste activities. The Environment Agency is responsible for enforcing laws that protect the environment and issuing
environmental permits and exemptions. There are additional general legislative provisions that apply to our activities
in the United Kingdom, including the (i) Data Protection Act 2018 and General Data Protection Regulation, which
detail personal data protection principles, rights, and obligations (ii)the Finance Act, which contains provisions
relating to changes in taxes, duties, exemptions, and reliefs , and (iii) labor legislation, which governs labor rights,
including, among others, (a) the Employment Right Act 1996, (b) the Equality Act 2010, (c) the Employment
Relations Act 1999, and (d) the Working Time Regulations 1998 and National Minimum Wage Act 1998 also apply to
us.
The Department for Environment, Food and Rural Affairs, the Secretary of State, the Environment Agency, the Health
and Safety Executive, and local authorities are responsible for regulating waste activities locally, regionally, and
nationally.
The Health and Safety Executive and local authorities are responsible for regulating occupational health and safety by
reference to the Health and Safety at Work Act 1974 and its subordinated regulations, providing the framework
regarding general duties employers have towards employees and members of the public.In addition, it also receives
pre-work commencement notifications in connection with certain construction projects as set forth in the Construction
(Design and Management) Regulations 2015.
The Secretary of State and individual local authorities are responsible for development management under the Town
and Country Planning Act 1990, local development plans, and Building Regulations 2010, which regulate land use and
new building.
The Department for Business, Energy and Industrial Strategy, the Gas and Electricity Markets Authority, the Office of
Gas and Electricity Markets and the Competition and Markets Authority are responsible for regulating the electricity
sector and ensure compliance with the main legislation in this matter, including the Electricity Act 1989, the
Competition Act 1998, the UK Utilities Act 2000, the Enterprise Act 2002, the Energy Acts, and the Gas Act 1986.
We also enter into waste management agreements with local authorities, which can oversee our operations thereunder.
4.B.9.6Support services to the mining industry
Chile
We provide services to the mining sector in Chile. Mining is a highly-regulated activity due to its inherent risks to
health and safety. One of the most relevant fields in the context of this activity is labor law, including mainly the
Labor Code (Código del Trabajo (D.F.L 1, 31-07-2002), Ley 20.123), which deals with subcontracting work, and Ley
16.774, which deals with work accidents and occupational diseases.In this field, it is important to mention the recent
entry into force of Law 21643, called "Ley Karin", which modified the labor code, establishing a legal framework for
the prevention and punishment of harassment and violence in the work environment, which implies new obligations
that we must comply with as employers, especially reports to the labor authority, regarding investigation processes for
complaints of sexual and workplace harassment, or violence at work.
Furthermore, in relation to health and safety requirements, there are numerous other applicable regulations, such as the
Mining Safety Regulation (Decreto 132/2002, Reglamento de Seguridad Minera), the Health Code (D.F.L. 725/1967,
Código Sanitario), the Health and Environmental Conditions Regulation (Decreto 594/1999, Reglamento sobre
Condiciones Sanitarias y Ambientales Básicas en los Lugares de Trabajo), and the Occupational Hazards’ Prevention
Regulation (Decreto 40/1969, Reglamento sobre Prevención de Riesgos Profesionales), among others.
In addition, with respect to environmental protection, to the following laws and regulations apply: the General Basis
for the Environment Act (Ley 19300, sobre Bases Generales del Medio Ambiente), and Regulation of the
Environmental Impact Assessment (Decree 40/2012, Reglamento del Sistema de Evaluación de Impacto Ambiental),
as well as its development regulations, either at a national or regional level, which are relevant for obtaining industry
permits.
General (non-industrial) regulations in civil and commercial law are also relevant to the mining business in Chile, such
as the Chilean Civil Code (D.F.L. 1/2000, Código Civil ), the Capital Markets Law (Ley 18045, del Mercado de
Valores), and the Public Limited Companies Law (Ley 18046, sobre Sociedades Anónimas).
The main regulatory and supervisory authorities of the Chilean mining sector are the Ministry of Labor and Social
Security (Ministerio del Trabajo y Previsión Social), the Labor Directorate (Dirección del Trabajo), the Ministry of
Health (Ministerio de Salud), the Ministry of Mining (Ministerio de Minería), and the National Service of Geology
and Mining (Servicio Nacional de Geología y Minería de Chile).
4.B.10Insurance
Under our risk management policy, we maintain insurance policies that we believe are customary for our business and
our risk profile and which provide cover against various risks, such as third-party damage (aviation, environmental,
and civil liability, in general), construction defects, management’s and employees’ liability. Our insurance policies
also cover risks to our property, plant, and equipment, as well as claims that might arise against us for performing our
business activities. Additionally, we have a cyber-insurance policy that covers possible disruptive events and cyber
incidents that may occur in the context of our business activities.
Our risk management policy also includes the assessment of tools for risk transfer alternatives to insurance cover.
We believe that we are insured to a commercially reasonable standard and that we pay appropriate premiums for this
coverage. Our insurance coverage is regularly evaluated and adjusted as necessary. It could be the case, however, that
the Company or one of our Companies could suffer damages that are not covered by the existing insurance policies or
that exceed the coverage limits set in these policies. See “Item 3. Key Information—D. Risk Factors—1. Risks Related
to Our Business and Structure—13. Our insurance cover may not be adequate or sufficient, which could have a
material adverse effect on our business, financial condition, and results of operations.”
4.B.11Property, Plants, and Equipment
Our property, plants, and equipment amounted to EUR 772 million as of December 31, 2024 and EUR 594 million as
of December 31, 2023. Our investment balance in property, plant, and equipment amounted to EUR 1,377 million as
of December 31, 2024 (EUR 1,124 million as of December 31, 2023), and consisted mainly of fixtures, fittings,
tooling and furniture (EUR 436 million), plants and machinery (EUR 755 million), and land and buildings (EUR 186
million).
Additions in property, plants, and equipment totaled EUR 318 million as of December 31, 2024 (EUR 215 million
as of December 31, 2023), the most significant relating to the Construction Business Division (EUR 117 million) , and
the Energy Business Division (EUR 107 million), arising primarily from Misae Solar project, the construction of the
Centella electricity transmission infrastructure and Azalia project. Other additions in other businesses as of
December 31, 2024 (EUR 94 million,) include mainly the acquisition of a land in Spain for data center developments.
Disposals due to sales or retirement amounted to EUR 77 million as of December 31, 2024 (EUR 63 million as of
December 31, 2023), of which approximately EUR 64 million related to construction, mainly plant, machinery and
other equipment.
Leases are not part of the plant and equipment line item. We primarily have lease agreements for buildings, vehicles,
plants, and machinery (although we also have lease agreements in place for land and office equipment, among other
categories), amounting to EUR 238 million as of December 31, 2024 (EUR 196 million as of December 31, 2023).
Buildings are the most valuable right-of-use assets, relating mainly to long-term office leases. Additions to the lease
category as of December 31, 2024 totaled EUR 143 million, of which EUR 109 million is associated with
Construction Division leases.
For information on environmental matters related to our Property, Plant, and Equipment, see “—12.
Environment and ESG / Sustainability / Health and Safety.”
4.B.12Environment and ESG / Sustainability / Health and Safety
Our Sustainability Policy provides the framework for all existing policies and strategies that are linked to diverse ESG
items (i.e., Environment, Human Resources, Human Rights, Compliance and Ethics, and Health and Safety, among
others) and which the Board has approved. We deploy our Sustainability Policy through our Sustainability Strategy
2030, which outlines our ESG and sustainability strategies. Such strategies incorporate ESG criteria to decarbonize our
activities in airports, roads and construction, while developing new green lines in energy, mobility, and water.
Therefore, the Sustainability Strategy 2030 complements the Sustainability Policy and suite of our underlying ESG
policies by providing the framework for developing innovative, efficient, and sustainable infrastructures, always
accounting for the three fundamental ESG dimensions: (i) environmental, (ii) social, and (iii) governance issues.
4.B.12.1Relevant environmental issues that may affect the issuer’s utilization of the tangible fixed assets
We may be subject to physical and transition risks in our activities as a consequence of climate change. For more
information, please refer to “Item 3. Key Information—D. Risk Factors—1. Risks Relating to our Business and
Structure—12. We may face increased risks due to climate change, which could have a material adverse effect on our
business, financial condition, and results of operations.”
To mitigate those risks, we identify, assess, and quantify both climate transition risks (i.e., scenarios recommended by
the International Energy Agency in its World Energy Outlook report, in particular its Stated Policies Scenario
(STEPS), Announced Pledges Scenario (APS), and the Net Zero Emissions by 2050 Scenario (NZE)), and physical
impacts linked to climate change (according to the scenarios included in the Intergovernmental Panel on Climate
Change (IPCC)’s Fifth Assessment Report’s (AR5) Representative Concentration Pathways (RPCs) 4.5 and 8.5, the
intermediate and very-high GHG emissions scenarios).
We measure and update transition risks at least yearly, while we have a platform developed in-house (“Adaptare”) that
supports our physical risks assessments and integrates climate modeling and engineering of our infrastructures to
provide technical and economic efficiency measures to increase the resilience of the assets.
4.B.12.2Environment and ESG
The Sustainability Strategy 2030 outlines our main and leading ESG strategy and was updated in 2023 to integrate
new ESG targets. This strategy is aligned with the United Nations’ Sustainable Development Goals and the objectives
of the Paris Agreement.
The “Deep Decarbonization Path”, which is our roadmap to decarbonize our portfolio of activities, forms an integral
part of the Sustainability Strategy 2030. This roadmap includes a year-by-year description of our internally calculated
GHG emissions’ estimates, the emissions reduction targets (by 2030 and 2050), the low-carbon measures that are
being implemented, and the abatement cost of carbon. We believe that our commitment to the environment (as one of
the pillars of the Sustainability Strategy 2030) is leading us to reduce our carbon footprint and support sustainable
approaches across our operations.
Based on our data and the information published by the Science Based Targets Initiative (SBTi), we were the first
construction and engineering company worldwide to establish and have our emissions reduction targets endorsed by
SBTi. We have set the following targets: (i) to reduce scope 1and 2 emissions in absolute terms by 35.3% in 2030
(base year 2009) and (ii) to reduce scope 3 emissions in absolute terms (excluding capital goods and purchased goods
and services categories) by 20% in 2030 (base year 2012).
In 2024, we embarked on obtaining new 1.5°C aligned SBTi-validated targets. We wanted to increase the level of
ambition of the short-term goals and set a Net Zero target of 2050 or sooner. Significant progress has been made in
achieving this validation, with final SBTi confirmation expected in early 2025.
The objectives to be validated are:
◦Reduce Scope 1 and 2 emissions by 42% in 2030 (base year 2020) in absolute terms.
◦Reduce Scope 3 emissions by 25% in 2030 (base year 2020) in absolute terms. Including purchased goods &
services, upstream transportation, waste generated in operations and fuel and energy categories.
The new targets were presented to the Board of Directors. The 2024 Climate Strategy Report, which includes these
new targets, will be brought for advisory vote at the Annual General Meeting.
The Deep Decarbonization Path (DDP), which establishes the mitigation lines on which to work in order to achieve
the 2030 emission reduction targets, is based on:
◦An electric and more efficient vehicle fleet.
◦Reduction of emissions associated with construction machinery through the implementation of energy
efficiency measures by 2030.
◦Reduction of asphalt plant emissions through energy efficiency by 2030.
◦Exploration of technology alternatives for low carbon heavy machinery.
◦Use of less polluting fuels and promotion of biofuels.
◦Consumption of 100% of electricity from renewable sources: Self-generation & renewable energy
procurement (target of 100% of electricity coming from renewable sources for 2025).
The Scope 3 emissions decarbonization strategy focuses on:
◦Proactively managing the procurement process with a focus on reducing the embedded carbon across the
supply chain, particularly in construction activities.
◦Fostering low-carbon products particularly cement and concrete – we work in partnership with our most
relevant suppliers to integrate progressively low carbon cement at an industrial scale. We have launched a
Supplier Collaboration Program to work with suppliers to understand their emissions performance.
◦Developing new raw materials with less carbon embedded, using new technologies and innovative
approaches (e.g., reducing the carbon in modified asphaltic bitumen by introducing recycled materials).
◦Use Green Purchasing Catalog to promote the purchase of sustainable products.
◦Using engineering design to reduce the use of the most carbon-intensive raw materials, which is also good in
the construction process.
◦The Group fosters local procurement, when products are available, to minimize emissions from transportation
and distribution of goods, and prioritizing low-carbon modes of transport, when possible, by encouraging the
most relevant suppliers to accelerate their adoption of low-carbon transport.
◦Implementing our “Circular Economy Plan” aimed at increasing recycling and reusing opportunities,
particularly in construction activities. The Plan includes actions such as the reuse of excavation in civil works
(mostly transport infrastructure projects) and onsite recycling of concrete and asphalt from demolition work.
The penetration of these decarbonization lines is not linear over time and will depend on their technological feasibility
and economic efficiency.
Regarding our carbon footprint, we have calculated and reported our carbon footprint for 100% of our activities since
2009. The calculation methodology is mainly based on the GHG Protocol, while maintaining compliance with ISO
14064-1. The emissions reported are: (i) scope 1—those from sources owned or controlled by us, which come mainly
from (1) the combustion of fuels in stationary equipment (boilers, furnaces, turbines, etc.) to produce electricity, heat,
or steam, (2) fuel consumption in fleet vehicles owned or controlled by us, (3) diffuse emissions (i.e., those emissions
not associated with a specific source, such as biogas emissions from landfills and channeled emissions), and (4) GHG
emissions generated through a source, excluding those from fuel combustion; (ii) scope 2—those generated as a result
of the consumption of electricity purchased from other companies that produce or control it; and (iii) scope 3—indirect
emissions occurring in the value chain.
In the last fiscal year the company has set the goal of being “Net Zero” by 2050 or earlier through the SBTi for direct
emissions by reducing emissions and voluntary compensation for those that are residual. Offsetting is done through
neutralization and mitigation beyond the value chain, relying on nature-based solutions. Since 2019, the Spanish
Ministry for Ecological Transition and the Demographic Challenge has awarded us the highest available recognition in
connection with our work on “Calculate,” “Reduce,” and “Compensate.”
We also incorporate the recommendations of the Task Force on Climate-Related Financial Disclosures in our process
of identifying, analyzing, and managing risks and opportunities related to climate change, and we have implemented
certain climate change mitigation actions such as the development and implementation of the Deep Decarbonization
Path (an internal emissions reduction plan) and Shadow Carbon Pricing (which is an internal methodology to
economically quantify the potential climate risk of our most relevant investments with the aim of reorienting our
activity to more decarbonized business models), the consideration of raw material and energy price increases in
contract negotiations, the search for innovative technological solutions to reduce energy consumption and emissions,
and the study and collaboration with key stakeholders for the development of projects that favor the transition to a
low-carbon economy.
Regarding biodiversity, we recognize the key role played by biodiversity in the provision of services that support the
economy and social well-being. For this reason, we have a biodiversity policy, which is integrated into the
management system that governs the organizational and operational processes of all our contracts. We are also
aligning our practices to the Taskforce on Nature-related Financial Disclosures (TNFD), a global initiative that seeks
to address the biodiversity loss and ecosystem deterioration crisis. We have committed to adopting the TNFD by
registering our intention to publish our first disclosure document aligned with this standard, the 2025 annual report, in
2026. In 2024, we progressed on this objective and, in particular, one of the TNFD pillars, through the analysis of our
biodiversity dependencies, impacts risks and opportunities.
We have a water policy, which recognizes water as a limited and irreplaceable natural resource and its access as a
fundamental human right. In order to manage the resource positively, the focus of the policy is on the availability,
quality and impact of water on ecosystems.
In addition, we have launched a circular economy plan that recognizes that the circular economy aims to keep the
value of products, materials, and resources in the economy for as long as possible, optimizing the consumption of
materials and minimizing waste generation, and is a solution to a problem that directly impacts the deterioration of the
environment and allows us to identify new business opportunities.
4.B.12.3Other Sustainability Matters
We also implement many initiatives towards the promotion of environmentally positive and sustainable management
of the supply chain. We share information with our key suppliers through the environmental management system
implemented in our activities in order to promote the better management and performance of our supply chain. In this
regard, work has been carried out along two lines: (i) the development of an internal purchasing guide containing
environmental guidelines on material procurement specifications, and (ii) launching of a collaboration program with
suppliers to learn about and improve their environmental management. As of the date of this Annual Report, we have
completed item (i), including the implementation of our Supplier Code of Ethics, and we continue to progress item (ii),
including through the assessment of our suppliers in connection with their environmental practices. In addition, we
promote sustainable procurement and the incorporation of ESG criteria in the supply chain, as well as digitalization,
the incorporation of tools, application of procedures, and development of projects aimed at promoting the
sustainability of our supply chain through a deeper understanding of the type of suppliers that offer us their products
and services.
We have a Supplier Code of Ethics, which is part of the Supplier Ethical Integrity Due Diligence Procedure and is
applicable to all suppliers in fulfilling our orders and upholding our contracts. The Code includes the basic principles
that should govern the behavior of all suppliers in their business relationship with us. In addition, the model orders and
contracts include environmental, social and labor, and health and safety considerations, compliance with the United
Nations Global Compact guidelines, as well as ethics and anti-corruption clauses, thus ensuring compliance with
overarching ESG requirements. ESG issues are considered in the supplier analysis and the evaluation and monitoring
of supplier performance also takes ESG criteria into account.
The application of new technologies and the development of innovation projects is key to achieve an agile, efficient,
and transparent supply chain that incorporates sustainability principles. Some of our most noteworthy initiatives are:
▪The Low Carbon Concrete Project. This project aims to identify the most innovative projects worldwide for
the development of sustainable concretes (with low levels of CO2 emissions).
▪The Guide to Procurement Aligned with EU Taxonomy. The Guide brings together the necessary
information on and establishes the principles to advise contract purchasers on procurement to comply with
taxonomy requirements.
▪The purchase of electricity from renewable sources. This item entails our promotion of the purchase of
electricity with a guarantee of origin and our progressive movement towards the 100% target set out in the
Climate Strategy for 2025.
▪The acquisition of an efficient vehicle fleet. This item relates to our goal of reaching a reduction in the
emissions of our vehicle fleet by 2030 as part of the Climate Strategy. Hybrid and plug-in hybrid vehicles
continue to be added to the fleet, resulting in a substantial and continuous reduction in emissions levels.
▪The Green Purchasing Catalog. This item consists in the update and increase of the information available in
the catalog in order to promote the purchase of sustainable products.
▪Green products. In our Construction Business Division, we work on alternatives for the supply of green
products. For that purpose, we have incorporated Environmental Product Declarations and Ecolabel
products.
▪Supplier 360. Supplier 360 is an IT tool that monitors suppliers using advanced data analytics techniques,
language processing, and internet searches, making it possible to detect potential risks.
We also incorporate other sustainability initiatives in our Business Divisions.
Our Toll Roads Business Division, has designed its Sustainability Strategy bearing in mind that developing lasting
connections to communities, nature, and transformation is key to our success. The relationships formed with the
people and the world around us support our ability to tackle complex problems, create value, improve outcomes, and
expand our impact.
Through its new Sustainability Strategy, our Construction Business Division, aims to contribute to society by
designing and building sustainable and efficient infrastructures, leading responsibly, helping communities to progress
and protecting the environment and following strict guidelines that minimize the environmental impact in our
operations. As well as improving water quality and water supply through water treatment plants. A practical example
of implementing our environmental impact guidelines can be seen in our project to build a section of Paris Metro line
18 where, along with our partner, we have reached an agreement with the electricity supplier to ensure that the
electricity supply required during construction work under our responsibility will come exclusively from renewable
sources. This measure is expected to save around 7,400 tons CO2e emissions. Moreover, the extracted soil is reused
for the manufacture of mortar and concrete in external plants.
With our Energy Business Division, we promote the transition towards a sustainable, clean, cutting-edge economy in
energy. We provide innovative solutions for the promotion, construction, and operation of energy generation and
transmission infrastructures and implement decarbonization and energy efficiency actions, thus contributing to a more
sustainable and environmentally friendly future. As examples Ferrovial Energy signed an agreement which includes
the construction and operation of a solar photovoltaic (PV) plant Texas, capable of serving over 36,000 homes and
once fully operational, it will be able to produce approximately 475 GWh a year while avoiding the emission of over
195,000 tons of CO2e annually. In Spain we are to build two photovoltaic plants, on a turnkey basis, with the capacity
to supply 30,000 homes. The two facilities will have a combined capacity of 62 MWp (megawatt peak) — 31 MWp
each — and will produce a total of 114 GWh/year, they will avoid 29,700 tons of CO2e emissions per year.
In our Airports Business Division, Dalaman airport, one of the busiest airports in Turkey, has underway a major
project in the field of renewable energy generation and sustainability strategies: a solar power plant consisting of
15,000 panels installed (in the first phase) on the roof of the terminal. This structure of 45,000 m², has an annual
generation capacity of 10,230 MWh. More than 55% of the airport's annual energy needs will be covered by solar
energy
4.B.12.4Human rights and health and safety
We consider human rights to be a fundamental part of our global sustainability strategy. In 2022, our Human Rights
Policy, which is aligned with the main international human rights standards, (including the United Nations Guiding
Principles on Business and Human Rights and Regulations of the International Labor Organization), was renewed.
One of the pillars of our strategy is the embracing of diversity and inclusion. The policy hence clearly defines the
rejection of any type of unlawful discrimination in all of our activities. To support this, we have a Diversity and
Inclusion Strategy, and goals that are periodically monitored and renewed.
The preservation of labor rights is of special relevance among our commitments. We reject any type of child or forced
labor in any form, promote equal opportunities and non-discrimination, protect against harassment of our workers,
preserve the right to strike, freedom of association, and the right to collective bargaining in all countries in which we
operate, and promote the reconciliation of professional and family life. We have implemented a set of tools that
promote the protection of and respect for human rights.
As part of these mechanisms, we periodically evaluate potential human rights risks as part of the risk identification and
assessment process known as Ferrovial Risk Management. For each risk, the responsible person identifies the controls
implemented to mitigate or eliminate the risk, either by reference to its impact or its probability of occurrence.
Similarly, we have a procedure for approving capital allocation operations, so that the analysis of all corporate
operations carried out takes into account whether they may undermine our ethical principles, with special attention to
human rights, social, good governance, and environmental aspects.
Additionally, Health, Safety and Wellbeing (HSW) is a fundamental value for Ferrovial and is supervised by the
Board of Directors at each of the meetings held during the year. The Health and Safety Policy, which was approved by
the Board in 2015, establishes the principles and values that guide the behavior of employees and collaborators. In this
matter, the Health and Safety policy has been implemented through our HSW strategy which was approved in
December 2019, and its validity until 2026. The HSW strategy determines the path to follow to achieve operational
excellence with special emphasis on four pillars based on leadership, competency, resilience and engagement to
improve the business for Serious Injury and Fatality (SIF) Prevention.
The extension of the strategy’s validity has been accompanied by a series of adjustments to adapt it to the changes that
have arisen in the organization since its approval, defining a more operational approach based on three layers of
protection:planning and preparation, control and verification, and competence and awareness.
4.B.13Disclosure Pursuant to Section 219 of the Iran Department Threat Reduction and Syria Human Rights
Act of 2012 and Section 13(r) of the Exchange Act.
Section 13(r) of the Exchange Act requires each issuer registered with the SEC to disclose in its annual or quarterly
reports whether it or any of its affiliates have knowingly engaged in specified activities or transactions with persons or
entities targeted by certain U.S. sanctions programs relating to Iran, terrorism, or the proliferation of weapons of mass
destruction, even if those activities are not prohibited by U.S. law and are conducted outside the U.S. by non-U.S.
affiliates in compliance with local laws and regulations.
We are providing the following disclosure pursuant to Section 13(r) of the Exchange Act:
During the year ended December 31, 2024, we conducted limited Iran-related activities and transactions that could be
qualified as dealings with the Government of Iran / persons or entities designated under an executive order identified
in Section 13(r) of the Exchange Act. These activities all relate to operations at the Dalaman airport in Turkey by YDA
Havalimani Yatirim ve Isletme A.S. (“YDA Turkey”), our majority-owned Turkish subsidiary, and in particular in
connection with certain international flights operated by Meraj Airlines, an airline based in Tehran, Iran, that operates
international flights between Turkey and Iran. In 2014, pursuant to Executive Order No. 13224, the U.S. Treasury
Department’s Office of Foreign Assets Control designated Meraj Airlines as a Specially Designated National
YDA Turkey operates the Dalaman airport terminals under a concession agreement with the Turkish government.
Under the concession agreement, YDA Turkey acts under the supervision of the Turkish General Directorate of State
Airports Authority (“DHMI”), and must comply with the rules, regulations and instructions of DHMI, as well as the
decisions and regulations of the Dalaman airport’s Local Administration. In other words, YDA Turkey operates the
Dalaman airport terminals on behalf of the Turkish government and does not have any authority to allow or deny
entrance into Turkey of passengers or aircraft which, under Turkish law, would otherwise be permitted or prohibited,
as applicable, to enter. As a result, YDA Turkey must enter into agreements with any airline (or its representative) that
is willing to fly to or from Turkey and is legally permitted to do so under Turkish laws.
In accordance with these requirements, YDA Turkey collected aeronautical fees (including fees for passenger and
aircraft-related services) from Meraj Airlines as required under the Turkish concession agreement during the year
ended December 31, 2024. During this period, the total revenue that YDA Turkey derived from aeronautical fees
charged to Meraj Airlines amounted to EUR 0.17 million (resulting in approximately EUR 0.003 million of net profit
after factoring in operational and concession expenses applicable to Meraj Airlines’ operations), which represents less
than 0.002% of our total revenue for the year ended December 31, 2024). Therefore, we believe that our activities
involving Meraj Airlines for the year ended December 31, 2024 were negligible and immaterial to our overall
business.
YDA Turkey is required under the concession agreement with the Turkish government to enter into agreements with
any airline that is willing to fly to or from Turkey and is legally permitted to do so under Turkish laws (which
currently includes Meraj Airlines). Therefore, and as long as the current legal and regulatory framework does not
change and Meraj Airlines continues to operate international flights between Turkey and Iran, we do not anticipate any
significant changes to our activities involving Meraj Airlines.
4.C.Organizational Structure
Ferrovial SE is the ultimate holding company for our subsidiaries. As of December 31, 2024, we had 263 (direct or
indirect) subsidiaries and 26 equity-accounted companies. Refer to Appendix I (Subsidiaries and Associate
Companies) to the Audited Financial Statements for a complete listing of our subsidiaries, including legal name,
country of registration, and proportion of ownership interest. The following table sets out the subsidiaries and equity-
accounted companies we consider principally significant as of December 31, 2024.
| | | | | | |
| | | | Percentage Ownership and Voting Interest | | |
Ferrovial Construcción, S.A. (through Spanish branch) | | | | | | One of the two head entities of the Construction Business Division |
| | | | | | |
Ferrovial Construction International SE (direct) | | | | | | One of the three head entities of the Construction Business Division (excluding Spain and the U.S. construction business, for which Ferrovial Construction US Holding Corp is the parent company) |
| | | | | | |
Ferrovial Airports International SE (direct) | | | | | | One of the two head entities of the Airports Business Division (excluding the U.S. airports business for which Ferrovial Airports Holding US Corp is the parent company) |
| | | | | | |
Cintra Infraestructuras España, S.L.U. (through Spanish branch) | | | | | | One of the three head entities of the Toll Roads Business Division |
| | | | | | |
Cintra Global SE (direct) | | | | | | One of the three head entities of the Toll Roads Business Division (excluding Spain and the U.S. business for which Cintra Holding US Corp is the parent company) |
| | | | | | |
Cintra Infrastructures SE (direct) | | | | | | One of the three head entities of the Toll Roads Business Division (excluding Spain and other international Toll Roads businesses). It indirectly holds the various subsidiaries and affiliates responsible for the U.S. businesses across all Business Divisions |
| | | | | | |
Ferrovial Infraestructuras Energéticas S.A.U. (through Spanish branch) | | | | | | Parent Company of the Energy Division for the Spanish businesses |
| | | | | | |
407 International Inc (equity- accounted) | | | | | | Management of 407 ETR concession |
| | | | | | |
IRB Infrastructure Developers Limited (equity-accounted) | | | | | | Management of network of toll roads in India |
| | | | | | |
Group Structure
The Company is a holding company without material direct business operations. The principal assets of the Company
are the equity interests that it directly or indirectly holds in our Companies.
The following summary corporate chart shows the major companies and the head companies of our Business
Divisions.
__________________________________________
(1) Ferrovial SE is our parent company.
(2) Ferrovial Construcción, S.A. is the head entity of the Spanish Construction Business Division. Ferrovial Construction International SE is the head
entity of the global Construction Business Division, except for the U.S. construction business (see footnote 4), for which Ferrovial Construction US
Holding Corp is the parent company.
(3) Ferrovial Airports International SE is the head entity of the global Airports Business Division, except for the U.S. airports business (see footnote
4), of which Ferrovial Airports Holding US Corp is the parent company.
(4) Cintra Infraestructuras España, S.L.U. is the head entity of the Spanish Toll Roads Business Division. Cintra Global SE and Cintra Infrastructures
SE are the head entities of the global Toll Roads Business Division. Additionally, Cintra Infrastructures SE indirectly holds the various subsidiaries
and affiliates that develop businesses in the U.S. pertaining to all of our Business Divisions, including Cintra Holding US Corp, Ferrovial
Construction US Holding Corp and Ferrovial Airports Holding US Corp.
(5) Ferrovial Emisiones, S.A.U. and Ferrovial Netherlands B.V. are financing companies created for the purpose of raising financing for other Group
Companies.
(6) Ferrovial Infraestructuras Energéticas S.A.U., Ferrovial EG SE and Ferrovial Transco International B.V. are part of the Energy Business Division.
4.D.Property, Plants, and Equipment
See “—.B. Business Overview—12. Property, Plants, and Equipment.”
ITEM 4A. UNRESOLVED STAFF COMMENTS
None.
ITEM 5. OPERATING AND FINANCIAL REVIEW AND PROSPECTS
The following discussion of our financial condition and results of operations should be read in conjunction with the
Financial Statements, including the related notes thereto, included elsewhere in this Annual Report. The following
discussion contains forward-looking statements that involve risks and uncertainties. Our actual results may differ
materially from those discussed in the forward-looking statements as a result of various factors, including those set
forth in “Cautionary Statement Regarding Forward-Looking Statements” and “Item 3. Key Information—D. Risk
Factors.”
5.AOperating Results
5.A.1Overview
We are one of the world’s leading infrastructure groups in terms of construction revenue, focusing our operations
across toll roads, airports, construction and energy. For an overview of our activities, see “Item 4. Information on the
Company—B. Business Overview.”
5.A.1.1Description of segments
We undertake our activities through the following four operating divisions, or lines of business, which also correspond
to our reporting segments (the Business Divisions) under IFRS 8:
▪Toll Roads: Our activities in the Toll Roads Business Division include the development, financing and
operation of toll road projects. We conduct our operations in this Business Division through Cintra, a wholly
owned subsidiary of the Company, and mainly operate in Canada through 407 ETR, in the United
States through the Texas Managed Lanes, Virginia’s I-66 and North Carolina’s I-77, as well as in India,
through IRB and Private InvIT.
▪Airports: Our activities in the Airports Business Division include the development and financing of airports.
We participate in the airport industry principally through the NTO consortium, established to design, build
and operate the NTO at JFK Airport in New York and our indirect holding in YDA Turkey.
▪Construction: Our activities in the Construction Business Division include the design and execution of
various public and private works, with an emphasis on public infrastructures. We conduct our construction
activities through Ferrovial Construcción, S.A., a wholly owned subsidiary of the Company and a leading
Spanish construction company in terms of revenue with over 90 years of experience in the industry.
▪Energy: The Energy Division was first reported as a stand-alone Business Division starting in 2024: Our
activities in this Business Division mainly consist of the development, financing and operation of power
transmission lines and renewable energy generation plants and the construction of energy infrastructures
focused on three areas: renewable generation and storage, energy transmission, and energy efficiency
projects.
We generally use the “other” category to reflect results for companies not assigned to any Business Division,
the most significant being Ferrovial SE, the Group’s parent company, the new business line Ferrovial Digital
Infrastructure, which was created in 2024, and some minor subsidiaries, including our mobility business,
waste management plants and services to the mining industry in Chile.
In December 2022, we concluded the divestment of the Services Business Division. The process, which began in
December 2018, was driven by our strategy to focus on the development of our infrastructure business. Certain assets
that were previously included under the Services Business Division, such as the waste management plants of Amey in
the U.K., were retained and reassigned to other Business Divisions. For further discussion on the conclusion of the
Services Business Division’s divestment process, see “Item 4. Information on the Company—B. Business Overview—
3. Group Overview—3. Our Business Divisions—5. Discontinued Operations (Services).”
5.A.1.2 Segment Change
In January 2024, we conducted a partial reorganization of our Business Divisions pursuant to which the energy
solutions business line, which was part of the Construction Business Division, and the energy infrastructures business
line, which was part of the former Energy Infrastructure and Mobility Business Division, merged. The resulting
Business Division has been named the Energy Business Division. The mobility business line and remaining services
businesses, which were until then part of the former Energy Infrastructure and Mobility Business Division, are
separately managed outside of the scope of our Business Divisions and reported as “Other” (see “Note 1.5 (Segment
Reporting)” to the Audited Financial Statements for additional information about our reporting segments). Information
presented in this Annual Report for historical periods prior to this segment change has been revised to reflect the
partial reorganization.
5.A.2Material Factors Affecting Results of Operations
Our results of operations and financial condition are affected by a variety of factors, a number of which are outside of
our control. Set out below is a discussion of the most significant factors that have affected our financial results during
the periods under review and which we currently expect to affect our financial results in the future. Factors other than
those set forth below could also have a significant impact on our results of operations and financial condition in the
future (see “Item 3. Key Information—D. Risk Factors”).
5.A.2.1Inflationary pressures and energy and commodity prices
We are exposed to inflationary pressures as well as the impact of energy and commodity prices, which have in the
past, and may in future have, varying effects on our Business Divisions. In the Construction Business Division,
inflationary pressures typically have a negative effect on our costs base through increases in costs of materials
consumed, particularly cement, concrete, steel rebars and bitumen (or asphalt), energy costs and an increase in
personnel expenses.
In the Construction Business Division, we have two key mechanisms in place in an effort to mitigate the effects of
inflationary pressures: through direct claims to our customers or, where possible, through the use of price adjustment
mechanisms, which are included in some of our agreements. Such pass-through mechanisms may be more common in
some jurisdictions, such as, for example, Spain, Canada and Poland, than others, such as the United States, where they
are not frequently used. However, due to particular contractual provisions or otherwise, we may not always be able to
effectively pass through the costs to our customers. Thus, we may remain subject to market risk with respect to
inflationary pressures and increases in commodity prices.
In the Toll Roads Business Division, our asset toll rates are either linked to the inflation index, allowing us to regularly
update the toll rates based on the latest economic situation, or can be freely set. Thus, inflationary increases typically
have a strong positive impact on the Toll Roads Business Division’s revenues. The rising fuel prices, on the other
hand, tend to adversely impact traffic levels, particularly if home working arrangements are more common. This, in
turn, may have a negative effect on the Toll Roads Business Division’s traffic and consequently revenues.
Additionally, in the Airports Business Division, the airlines may pass any increases in fuel prices on to their customers
through increases in the prices of flights, which could lead to decline demand for air travel.
5.A.2.2Foreign exchange rates
Our functional currency is the euro. However, we operate internationally and hold assets, incur liabilities, generate
revenues and pay expenses in a variety of currencies other than the euro. As a result, our results of operations are
affected by exchange rate fluctuations between the euro and other currencies in which we conduct and plan to continue
conducting transactions. We are particularly exposed to the U.S. dollar, Canadian dollar, Polish zloty, Indian rupee,
pound sterling and the Australian dollar. For example, in 2024, such currencies led to translation differences of EUR
(83) million, net of the effect of foreign currency hedging instruments, with appreciation of the Canadian dollar and
U.S. dollar against the euro.
Overall, our foreign exchange rate risk arises from: (i) our international presence, through our investments and
businesses, in countries that use currencies other than the euro, (ii) debt denominated in currencies other than that of
the country where the business is conducted or the home country of the company incurring such debt, and (iii) trade
receivables or payables in a foreign currency to the currency of the company with which the transaction was
registered.
In order to reduce foreign currency translation exposure, we seek to denominate borrowings in the currencies of our
principal assets and cash flows. We also manage foreign currency transactional exposure by selectively hedging our
exposure. We also adopt a natural hedging strategy and, to the extent reasonably possible, seek to align the currency of
inflows and outflows to minimize foreign exchange exposure.
5.A.2.3Traffic performance
The table below presents the toll roads traffic volume in the period under review.
| | | | |
| | For the year ended December 31, |
| | | |
Fully consolidated assets (in millions of transactions) | | | |
NTE 1-2 ............................................................................................................ | | | | |
LBJ.................................................................................................................... | | | | |
NTE 35W .......................................................................................................... | | | | |
I-77 .................................................................................................................... | | | | |
I-66 .................................................................................................................... | | | | |
Equity-accounted assets (in millions of VKT, vehicle kilometers travelled) | | | |
407 ETR ............................................................................................................ | | | | |
In 2024, the Toll Roads Business Division experienced significant growth, primarily attributed to a general increase in
mobility across the areas where we operate our main concessions, with the traffic on 407 ETR and the U.S Managed
Lanes showing consistent growth. Regarding NTE, traffic decrease affected by the capacity improvement construction
works.
The tables below set out the toll roads traffic volume trends by quarter and for the year ended December 31, 2024,
compared to the similar periods in 2023:
| | | | | | | | | |
| | | | | | | | | |
407 ETR ...................................... | | | | | | | | | |
NTE ............................................. | | | | | | | | | |
LBJ ............................................... | | | | | | | | | |
NTE 35W ..................................... | | | | | | | | | |
I-66 .............................................. | | | | | | | | | |
I-77 ............................................... | | | | | | | | | |
During 2024, airport traffic showed a positive evolution with increases in capacity boosted by the recovery of
international traffic.
The table below presents the passenger traffic, or the total number of incoming and outgoing passengers at the airport
in a particular period, for the Dalaman airport in the period under review.
| | | |
| For the year ended December 31, |
| | | |
| (in millions of passengers) |
Dalaman ...................................................................................... | | | |
The table below sets out the airport passenger traffic by quarter and for the year ended December 31, 2024, compared
to the same periods in the previous year:
| | | | | | | | | |
| | | | | | | | | |
Dalaman ....................................... | | | | | | | | | |
5.A.2.4Impact of macroeconomic factors and conflicts in Ukraine and Middle East
Given the international scope of our operations, our business performance and results are impacted by a number of
drivers, including macroeconomic and geopolitical events affecting tax policies, the regulatory environment, and the
risk and return of assets. For example, Russia’s invasion of Ukraine in February 2022 has had an adverse effect on the
global geopolitical and economic environment. Although we believe that its direct exposure to the conflict in Ukraine
is limited, as we primarily operate across the United States, Spain, Poland, the United Kingdom and Canada, the
macroeconomic scenario resulting from this situation translates into generalized price increases, mainly in energy and
raw materials, labor costs, supply problems and difficulties in the distribution chain of certain materials, especially in
the construction sector. The above factors also impact interest rates, which affect the banking and financing market
and hence our financing options.
While the conflict in Ukraine is still ongoing, we developed an action plan to mitigate its potential negative effects,
particularly as it relates to our Construction Business Division. Such action plan includes continuous reporting to
directors, managers and projects on the situation of the purchase prices of basic materials, their possible evolution and
risks in order to make the best purchasing decisions; weekly monitoring of the situation in the different countries with
activity and main projects to identify issues and provide assistance to the Group’s procurement department;
communication with our bidding department to provide information on prices and their possible evolution; as well as
analysis of financial hedging for certain basic materials, and support to Budimex due to the special impact of the
ongoing conflict in Ukraine on Poland.
Our Construction Business Division has been the most affected by the Ukraine conflict due to its effects on the
increase in the costs of certain materials, such as cement, concrete, steel rebars and bitumen (asphalt), energy costs and
employee salaries. All of the above-mentioned factors put pressure on our profit margins, which varied depending on
the geography. The conflict in Ukraine also exacerbated the global inflation levels and caused problems in the supply
and distribution chain of certain materials, causing delays and reducing supply. For further details, see “—1.
Inflationary pressures and energy and commodity prices.”
Furthermore, the U.S. government has recently announced proposals for, or imposed, tariffs on certain foreign goods
including a 25% import tax on all steel and aluminum entering the U.S., and 10% tariffs on products from certain
countries, including China. The tariffs, or potential risk of their imposition, have introduced significant uncertainty
into the market, leading to volatility in material prices and potential delays in project timelines. These tariffs, whether
imposed or proposed and at the rates or levels announced or at other rates or levels, and related uncertainty, could lead
to increased costs and affect our strategic planning and financial forecasting, particularly in our Construction Business
Division. Management continues to evaluate the potential impact of these evolving developments.
5.A.2.5Seasonality
Revenue and cash flow in the Toll Roads, Construction and Airports Business Divisions is also partially impacted by
seasonal factors, including weather conditions and holiday seasons, which drive demand for transport infrastructure.
The Toll Roads Business Division revenue is affected by seasonal changes in traffic volumes, with typically lower
traffic in the winter months due to adverse climate conditions. We believe that this trend has recently been exacerbated
in the Toll Roads Business Division as a result of the increase in hybrid work models and work flexibility.
The Construction Business Division is also affected by weather conditions, typically experiencing lower revenues in
the first quarter of the year. For example, in the first quarter of the year ended December 31, 2024, Construction
Business Division revenues amounted to EUR 1,476 million, compared to EUR 1,895 million, EUR 1,866 million and
EUR 1,998 million in the second, third and fourth quarters of 2024, respectively.
The Airports Business Division is also affected by seasonal trends, including holiday seasons. For example, in the
third quarter of the year ended December 31, 2024, Dalaman airport’s revenues amounted to EUR 42 million, in
contrast with EUR 3 million and EUR 15 million in the first and fourth quarters, respectively, as the airport is much
busier during the summer holidays.
5.A.2.6Liquidity management and investments
Our infrastructure assets must be able to secure significant levels of financing to be able to carry out their operations.
Certain of the industries in which we operate, such as airports and toll roads, are by nature capital-intensive
businesses. Therefore, the development and operation of infrastructure concession assets require a high level of
financing. As a result, our business is sensitive to the availability, cost and other terms of financing. We have
established mechanisms to preserve the necessary levels of liquidity with periodic procedures that include cash
generation forecasts and cash requirements, both for the different short-term collections and payments as well as long-
term obligations. See “Item 3. Key Information—D. Risk Factors—3. Risks Relating to Our Structure and Financial
Risks—6. We may not be able to effectively manage the exposure of our liquidity risk, which could have a material
adverse effect on our business, financial condition, and results of operations.” For further details on our liquidity
position, see “—B. Liquidity and Capital Resources.”
5.A.2.7Regulatory matters
Our activities are subject to various regulations by governments and other regulatory bodies across the jurisdictions
where we operate, including specific aviation, toll road, energy, waste management and treatment, as well as public
procurement and construction sector regulations. For further details, see “Item 4. Information on the Company—B.
Business Overview—10. Regulatory Environment.”
We spend significant resources, mainly accounted for as part of personnel expenses and other operating expenses, to
support compliance with a broad and varied range of regulatory requirements. Failure to comply with regulations
could lead to supply interruptions, product recalls, and/or regulatory enforcement action and fines from regulators. For
additional information on the impact of the regulated environment on our business, see “Item 3. Key Information—D.
Risk Factors—2. Risks Related to Legal, Regulatory, and Industry Matters—1. We operate in highly regulated
environments that are subject to changes in regulations and are subject to risks related to contracts with government
authorities, which could have a material adverse effect on our business, financial condition, and results of operations”
and “—2. We operate in highly regulated environments and are subject to risks related to the granting of permits and
rights-of-way and securing land rights, which could have a material adverse effect on our business, financial
condition, and results of operations.”
5.A.2.8Acquisitions and disposals
In the course of our business, we periodically engage in acquisitions and disposals of businesses or stakes therein and
our results of operations may be affected by significant acquisitions and divestments. For example, on December 12,
2024, we completed the divestment of the Group’s 19.75% stake in Heathrow airport, retaining a 5.25% stake. This
divestment resulted in a profit of EUR 2,552 million in 2024, of which EUR 2,023 million corresponds to our ordinary
shares sold and EUR 547 million to the fair value revaluation of the 5.25% stake retained. This divestment generated a
profit in our impairment and disposal of fixed assets line item in 2024 by EUR 2,023 million. Our net financial
income/(expense) from ex-infrastructure projects also increased by EUR 547 million due to revaluation of the
remaining 5.25% HAH stake. On February 26, 2025, we announced that a binding agreement has been reached for the
sale of that 5.25% remaining stake.
Additionally, in 2024, we executed other significant divestments, including a 5.0% stake in IRB and a 24.78% stake
in Grupo Serveo, resulting in capital gains before taxes of EUR 132 million and EUR 33 million, respectively.
For further details on these divestments, see "Item 4. Information on the Company —A. History and development of
the Company —1. Summary of Historical Investments and Divestments.”
5.A.3Factors Affecting Comparability of Our Results of Operations
5.A.3.1Changes in the scope of consolidation and business combinations.
Changes in 2024
On February 29, 2024, the Group, through its subsidiary Cintra, entered into an agreement with Inter Infrastructure
Capital S.A., to sell the 49% of the Class A shares of Umbrella Roads BV (which confer voting rights on its holder)
and all the Class B shares of Umbrella Roads BV (which confer economic rights on its holder). Umbrella Roads BV is
the direct shareholder of Cintra OM&R 407 East Development Group Inc, Cintra 407 East Development Group Inc,
Blackbird Maintenance 407 Cintra GP Inc and Blackbird Infrastructure 407 Cintra GP Inc (the holding companies of
the 407 Phase I and Phase II Projects), the indirect shareholder of Serranopark S.A., Scot Roads Partnership Project
(M8 Project in the UK), Eurolink Motorway Operations Ltd and Eurolink Motorway Operations (M3) Ltd (M4 and
M3 Projects in Ireland), and has the economic rights over Sociedad Concesionaria Autovía de la Plata S.A. (A66
Project in Spain). The sale of shares was completed on October 8, 2024 for EUR 100 million.
On May 17, 2024, we acquired a 100% stake in Misae Solar IV, LLC, a solar PV project in Leon County, Texas, for
an acquisition price of USD 14.08 million (EUR 13.04 million), which is part of the committed investment related to
the development of this project, that amounts to USD 72 million (approximately EUR 67 million). See “Item 4.
Information on the Company—A. History and Development of the Company —1. Summary of Historical Investments
and Divestments —7. Acquisition of Misae Solar IV, LLC.”.
On June 11, 2024, we completed the sale of a 5% stake in the Indian company IRB for EUR 215 million excluding
transaction costs (assuming a EUR/INR exchange rate of 89.3). Our ordinary shares in IRB were sold at an average
price of 63.60 rupees, resulting in a capital gain before taxes of EUR 132 million.
On June 13,2024, we acquired a 23.99% stake in Private InvIT, a subsidiary of IRB, in which Ferrovial holds a
19.86% ownership interest as before mentioned. The total investment reached EUR 652 million (considering an
exchange rate of 90.21 EUR/INR).Within the equity commitments in projects being developed by Private InvIT, on
December 20, 2024, Cintra made an additional contribution of EUR 57.6 million for the acquisition of the Ganga
Expressway Project. This investment will increase by EUR 18 million due to outstanding equity commitments in
projects being developed by Private InvIT (considering an exchange rate of 89.2 EUR/INR). Ferrovial acquired this
stake from affiliates of GIC Private Limited, which prior to this transaction owned a 49% stake in the company.
On June 28, 2024, we completed the sale of our 24.78% stake in Grupo Serveo to the main shareholder, Portobello
Capital. In connection with this disposal, we recorded a capital gain before taxes of EUR 33 million.
On November 13, 2024, the Group announced an agreement with Avialliance UK Limited for the sale of Ferrovial’s
entire stake (50.0%) in AGS. As part of the agreement, Macquarie (the Group’s joint venture partner in AGS) will also
sell its entire stake (50.0%) in AGS. The agreement values 100% of the stake at £900 million, representing the equity
value for a 100% interest in AGS and is subject to certain closing adjustments and transaction costs. This price
represents an Enterprise Value (EV) estimated at £1.535 billion. Following satisfaction of applicable regulatory
conditions, the sale was completed on January 28, 2025.
On December 12, 2024, the Group completed the divestment of the Group’s 19.75% stake in Heathrow airport,
retaining a 5.25% stake. On February 26, 2025, we announced that a binding agreement has been reached for the sale
of that 5.25% remaining stake.
Changes in 2023
On June 5, 2023, we agreed to sell our 89.2% stake in our Portuguese toll road concession Euroscut Azores to
infrastructure funds Horizon Equity Partners and RiverRock for EUR 42.6 million. The total sale price later increased
to EUR 43.4 million following the fulfillment of the conditions precedent to the ticking fee provision in the purchase
agreement. The sale was completed, and the transaction funds were received, on December 28, 2023.
On December 20, 2023, we completed the sale of our 50.0% stake in Car Sharing Mobility Services, S.L. (Zity) to the
Renault Group. The Renault Group, which held a 50.0% stake in the entity prior to the sale, has acquired full
ownership following completion of the transaction.
Changes in 2022
On June 10, 2022, we entered into a joint venture agreement to acquire 49.0% share in NTO at JFK , which is
responsible for the remodeling, construction, financing, operation and maintenance of the NTO facilities at New
York’s JFK Airport. Also on June 10, 2022, the concession agreement between NTO at JFK and the Port Authority of
New York and New Jersey, as well as the financing and construction contracts between the concession operator, the
financing banks and the design and build contract came into force. The ownership interest in the project is
consolidated using the equity method.
On July 19, 2022, we acquired a 60.0% stake in Dalaman airport from YDA Group for EUR 144.0 million, of which
EUR 119.2 million were paid as of December 31, 2022, EUR 15.2 million corresponds to a deferred payment made in
October 2023, and the remaining EUR 9.9 million corresponds to an estimated variable payment dependent on the
Dalaman airport’s international passenger volume. YDA Turkey holds the concession agreement for the Dalaman
International Airport and other ancillary buildings’ terminal management until 2042. The ownership interest in the
project is fully consolidated.
In November 2022, through our toll road subsidiary Cintra, we increased our interest in the I-77 toll road in North
Carolina, U.S., by 7.1% (for a total of 72.2%) for USD 109 million (EUR 104 million).
In December 2022, we sold our Amey business in the United Kingdom for GBP 264.6 million (EUR 301.3 million),
with no further price adjustments. The transaction generated a net capital gain of EUR 58.3 million. Amey’s sale
concluded the divestment of our Services Business Division, with the exception of certain assets that were kept and
reclassified within the Group. For further discussion on the conclusion of the Services Business Division’s divestment
process, see “Item 4. Information on the Company—B. Business Overview—3. Group Overview—3. Our Business
Divisions—5. Discontinued Operations (Services).”
On January 31, 2022, we completed the sale of the Spanish infrastructure services business to Portobello for
approximately EUR 175 million after price adjustments. For further details, see “Item 4—A. History and Development
of the Company—1. Summary of Historical Investments and Divestments—7. Divestment of Infrastructure Services
business in Spain.”
5.A.3.2Financial Risk Management
Our business is affected by changes to the financial variables that have an impact on our accounts, these being mainly
foreign exchange risk, liquidity management risk, interest rate risk, inflation, credit, variable income and capital
management. The main financial risks and how we manage them is summarized below.
5.A.3.2.1 Exposure to interest rate fluctuations
We and our businesses are subject to interest rate fluctuations that may affect our net financial expense due to the
variable interest on financial assets and liabilities, as well as the measurement of financial instruments arranged at
fixed interest rates. We manage interest rate risk with the goal of optimizing the financial expense we bear and achieve
suitable proportions of fixed and variable rate debt based on the market conditions.
5.A.3.2.2 Exposure to foreign exchange fluctuations
We regularly monitor our expected net exposure with regard to each currency by assessing the expected cash flows
over coming years (both for dividends receivable and for potential investments or divestments), balance sheet
valuations and free cash flow generation. We establish our hedging strategy by analyzing past changes in foreign
exchange rates, and have monitoring mechanisms such, as future projections and comparing currency levels to its
fundamental valuation or long-term equilibrium rates.
5.A.3.2.3 Exposure to credit and counterparty risk
Some of our main financial assets, such as investments in financial assets, non-current financial assets, net financial
derivatives and trade and other receivables, are exposed to credit our counterparty risk. We actively monitor these
risks with each bank, territory and customer by analyzing the performance of risk through internal credit quality
studies. Also, the internal regulations, we establish maximum investment limits for each of our counterparties.
5.A.3.2.4 Exposure to liquidity risk
We have established mechanisms to preserve the level of liquidity that reflect the cash generation and needed
projections, in relation to both short-term collections and payments and obligations to be met at long-term.
5.A.3.2.5 Exposure to equities risk
We are exposed to risks relating to the fluctuation of our share price. This exposure arises specifically from the risk of
appreciation of share-based remuneration schemes. These plans are hedged through equity swaps. Since these equity
swaps are not classified as hedging derivatives, their market value has an impact on profit or loss.
5.A.3.2.6 Exposure to inflation risk
Our revenue from infrastructure projects is associated with prices tied to inflation (for example, toll road concession
contracts). Therefore, an increase in inflation would increase the cash flow derived from assets of this nature.
However, a rise in inflation rates may have an adverse effect on operating margins under construction contracts. This
risk is partially mitigated in certain jurisdictions (e.g., Spain, Canada and Poland) by inflation-related price
adjustments in contractual clauses. We also make our best efforts to hedge inflation risk by closing the main direct
costs when the tender is accepted.
5.A.3.2.7 Capital management
We aim to achieve a debt-equity ratio that makes it possible to optimize costs while safeguarding our capacity to
continue managing our recurring activities and to grow through new projects that create shareholder value. Our
objective is to maintain a level of indebtedness, excluding infrastructure project companies, to retain our current
investment grade rating. In order to achieve this goal, we have established a financial policy consisting of the
maintenance of a ratio of net debt (gross debt less cash) to Adjusted EBITDA plus dividends from projects of no more
than two times, excluding infrastructure project companies.
5.A.4Recent Developments
See “Item 4. Information on the Company—A. History and Development on the Company.”
5.A.5Description of Key Line Items
Set forth below is a brief description of the composition of certain line items of the consolidated income statement.
This description must be read in conjunction with the significant accounting policies elsewhere in this section and in
the Audited Financial Statements.
5.A.5.1Revenues
Most of our revenues come from: (i) contracts with customers, which include public, private or internal entities, for
services in the Construction Business Division; (ii) fees from users of toll roads in the Toll Roads Business Division,
(iii) concession contracts from clients in the Airports Business Division and (iv) other activities. Revenues also include
the financial income for the services provided by the concession operators that apply the financial asset model.
5.A.5.2Other operating income
Other operating income includes mainly income from the impact of the certain public grants related to our operations.
5.A.5.3Materials consumed
Materials consumed include expenses related to energy and materials’ consumption, primarily in relation to our
Construction Business Division.
5.A.5.4Other operating expenses
Other operating expenses include work carried out by other companies and changes in provisions for each year
including subcontracted works, leases, repairs and maintenance, independent professional services, changes in
provisions for liabilities and other operating expenses.
5.A.5.5Personnel expenses
Personnel expenses consist of expenses related to wages and salaries, social security, pension plan contributions,
share-based payments and other welfare expenses of our employees.
5.A.5.6Fixed asset depreciation
Fixed asset depreciation consists mainly of depreciation related to our fixed assets such as property, plant and
equipment.
5.A.5.7Impairment and disposal of fixed assets
Impairment and disposal of fixed assets refers to gains or losses related to the sale of our fixed assets such as property,
plant and equipment.
5.A.5.8Net financial income/(expense) from infrastructure projects and ex-infrastructure projects
Part of our activities, primarily in the Toll Roads and Airports Business Divisions but also, to some extent, in the
Construction and Energy Business Divisions, consist of the development of infrastructure projects through long-term
arrangements with public authorities, under which a concession operator, in which we have an ownership interest
together with other shareholders, finances the construction or upgrade of public infrastructure, mainly with borrowings
secured by the project cash flows and capital contributed by shareholders, and subsequently operates and maintains the
infrastructure. Key examples of such infrastructure projects include the Texas Managed Lanes and I-66 Managed
Lanes.
In some cases, the construction and subsequent maintenance of the infrastructure projects are subcontracted by the
concession operators to the Group’s Construction Business Division.
In order to aid in understanding our financial performance, we disclose our net financial income/(expense) separately
for (i) infrastructure projects and (ii) excluding infrastructure projects:
▪Net financial income/(expense) from infrastructure projects consists of financial income from financing
of our infrastructure projects minus the accrued financial expenses and expenses capitalized during the
construction period.
▪Net financial income/(expense) from ex-infrastructure projects consists of income from external
borrowing costs and from financial investments and includes the impact of derivatives and other fair value
adjustments.
For a further description of our infrastructure project companies, see “—B. Liquidity and Capital Resources— 6. Non-
IFRS Measures: Liquidity and Capital Resources—1. Consolidated Net Debt.”
5.A.5.9Share of profits of equity-accounted companies
Share of profits of equity-accounted companies reflects the effect in our consolidated income statement relating to our
companies consolidated by means of equity accounting.
5.A.5.10Profit/(loss) before tax from continuing operations
Profit/(loss) before tax from continuing operations represents our operating profit/(loss) after net financial income/
(expense) and including share of profits of equity-accounted companies.
5.A.5.11Income tax / (expense)
Income tax / (expense) consists of our current tax payable on the taxable profit for the period after applying allowable
deductions, changes in deferred tax assets and liabilities, and tax credits.
5.A.5.12Profit/(loss) net of tax from discontinued operations
Profit / (loss) net of tax from discontinued operations refers to income from discontinued operations and includes all
income and costs generated from our Services and Construction Business Divisions, including divestments of
businesses. It also includes an impairment loss equal to the difference between the estimated fair value of the assets
and their carrying amount.
5.A.5.13Net profit/(loss)
Net profit / (loss) accounted for using the equity method reflecting the effect in our consolidated income statement
relating to companies consolidated by means of equity accounting.
5.A.5.14Net Profit/(loss) attributed to non-controlling interests
Net Profit / (loss) attributed to non-controlling interests refers to the profits we obtain that may be allocated to other
partners with a stake in the said companies.
5.A.6Results of Operations
The following tables set out our consolidated results of operations for the periods indicated. In January 2024, we
conducted a partial reorganization of our Business Divisions (for further information, see “Item 4. Information on the
Company —B.Business Overview —1. Overview” and Note 1.5 (Segment Reporting) to the Audited Financial
Statements). Information presented in this Annual Report for historical periods prior to the segment change has been
revised to reflect the partial reorganization.
5.A.6.1Comparison of the Years Ended December 31, 2024 and December 31, 2023
Unless stated otherwise, numbers in this section have been derived from the Audited Financial Statements. For a
discussion of the presentation of our historical financial information included in this Annual Report, see “Presentation
of Financial and Other Information.”
Our consolidated results of operations for the year ended December 31, 2024 compared with the year ended
December 31, 2023, are discussed below.
| | | |
| For the year ended December 31, |
| | | |
| |
Revenues ............................................................................................................. | | | |
Other operating income ...................................................................................... | | | |
Revenues and other operating income ........................................................... | | | |
Materials consumed ............................................................................................ | | | |
Other operating expenses ................................................................................... | | | |
Personnel expenses ............................................................................................. | | | |
Total operating expenses .................................................................................. | | | |
Fixed asset depreciation ...................................................................................... | | | |
Impairment and disposal of fixed assets ............................................................. | | | |
Operating profit/(loss) ...................................................................................... | | | |
Net financial income/(expense) from financing ................................................. | | | |
Profit/(loss) on derivatives and other net financial income/(expense) .............. | | | |
Net financial income/(expense) from infrastructure projects ...................... | | | |
Net financial income/(expense) from financing ................................................ | | | |
Profit/(loss) on derivatives and other net financial income/(expense) ............... | | | |
Net financial income/(expense) from ex-infrastructure projects ..................... | | | |
Net financial income/(expense) ....................................................................... | | | |
Share of profits of equity-accounted companies ................................................ | | | |
Profit/(loss) before tax from continuing operations ..................................... | | | |
Income tax / (expense) ........................................................................................ | | | |
Profit/(loss) net of tax from continuing operations ...................................... | | | |
Profit/(loss) net of tax from discontinued operations ......................................... | | | |
Net profit/(loss) ................................................................................................. | | | |
Net profit/(loss) for the year attributed to non-controlling interests .................. | | | |
Net profit/(loss) for the year attributed to the parent company .................. | | | |
Revenues
Revenues increased by 7.4% to EUR 9,147 million in 2024 from EUR 8,514 in 2023, primarily due to the
improvement in results across the Business Divisions and particularly in the Toll Roads and Construction Business
Divisions.
The table below sets out our revenues by Business Division for the years ended December 31, 2024 and 2023:
| | | |
| For the year ended December 31, |
| | | |
| |
Toll Roads .............................................................................................. | | | |
Airports ................................................................................................... | | | |
Construction ........................................................................................... | | | |
Energy .................................................................................................... | | | |
Others(1) ................................................................................................. | | | |
Adjustments(2) ........................................................................................ | | | |
Total ...................................................................................................... | | | |
(1)Others include revenues from: Ferrovial SE (mainly management fees charged to our business divisions) and ii) the different businesses
that are not included as part of our business divisions (see "Item 4 Information on the Company,—B. Business Overview, —1 Overview").
(2)Adjustments consist of inter-segment sales that are eliminated in the Group’s consolidated financial statements.
Our Toll Roads Business Division revenue increased by 15.8% to EUR 1,256 million in 2024 from EUR 1,085 million
in 2023. This increase was primarily attributed to higher traffic volumes and increased toll rates. All Managed Lanes
revenue-per-transaction, grew compared to 2023. Particularly, within this Business Division:
▪NTE 1-2 revenues increased by 3.5% to USD 299 million (EUR 276 million), which was mainly driven by
higher toll rates, despite traffic being impacted by construction capacity improvements works along the NTE 1-2
corridor, which started on 2024.
▪NTE 35W revenues increased by 36.8% to USD 320 million (EUR 296 million), which was mainly driven
by an increase in traffic following the opening of segment 3C in June 2023, as well as by higher toll rates.
▪LBJ revenues increased by 16.6% to USD 225 million (EUR 208 million), which was primarily driven by a
stable increase in traffic and higher toll rates.
▪I-77 revenues increased by 17.6% to USD 107 million (EUR 98 million), which was primarily driven by an
increase in traffic and higher toll rates.
▪I-66 revenues amounted to USD 247 million (EUR 228 million), which was driven by a gradually increase
in traffic, following the opening of the project in November 2022, coupled with higher toll rates.
Our Airports Business Division revenue increased by 13.8% to EUR 91 million in 2024 from EUR 80 million in 2023.
This increase was primarily driven by Dalaman airport’s revenues, which were boosted by positive passenger growth.
Our Construction Business Division revenue increased by 5.3% to EUR 7,234 million in 2024 from EUR 6,869
million in 2023. This increase was primarily driven mainly by the performance of Webber. Particularly, within the
Business Division:
▪Budimex revenues decreased by 1.9%, which was mainly driven by the lower civil works activities due to
the termination of contracts not compensated by the new contracts awarded, since new bidding processes
have suffered delays after the change in Polish government.
▪Webber revenues increased by 22.2%, which was driven mainly by higher civil works activities on the back of
the numerous awards in 2023.
▪Ferrovial Construction increased by 2.8%, which was mainly driven by the growth in the UK and Canada
markets, together with the Spanish market, and was partially offset by lower activity in the United States due
to the completion of several large projects.
Our Energy Business Division revenue increased by 30.4% to EUR 270 million in 2024 from EUR 207 million in
2023, which was primarily driven by activities related to the energy solutions business line.
Other operating income
Other operating income remaining unchanged at EUR 1 million in 2024 compared to EUR 1 million in 2023.
Revenues and other operating income
Revenues and other operating income increased by 7.4% to EUR 9,148 million in 2024 from EUR 8,515 million in
2023 due to the corresponding increase in revenues.
Materials consumed
Materials consumed increased by 6.5% to EUR 1,115 million in 2024 from EUR 1,047 million in 2023, primarily due
an increase in activity in the Construction Business Division.
Other operating expenses
Other operating expenses increased by 1.1% to EUR 4,931 million in 2024 from EUR 4,878 million in 2023, primarily
due to higher costs in the Toll Roads Business Division in line with the US Managed Lanes increase on traffic and
higher revenue share in toll roads NTE 35W and I-77. This was partially offset by the Construction Business Division,
which in 2023 was affected by losses in the U.S as a result of an increase of the expected costs to complete the works.
Personnel expenses
Personnel expenses increased by 10.1% to EUR 1,760 million in 2024 from EUR 1,599 million in 2023. This was
primarily driven by an increase of approximately 4% in our workforce, which grew by 887 employees, and an average
generalized increase of approximately 3.5% with respect to the prior year, which was mainly driven by the
Construction Business Division.
Fixed asset depreciation
Fixed asset depreciation increased by 10.0% to EUR 441 million in 2024 from EUR 401 million in 2023, primarily
due to traffic increase in the Toll Roads Business Division mainly driven by I-66 and increased activity in the
Construction Business Division driven by Webber.
Impairment and disposal of fixed assets
Impairment and disposal of fixed assets increased to income of EUR 2,208 million in 2024 from an income of EUR 35
million in 2023, which was primarily driven by the sale of our 19.75% stake in HAH, our 5.0% stake in IRB and the
sale of our 24.78% stake in Grupo Serveo, which resulted in capital gains before taxes of EUR 2,023 million and EUR
132 million and EUR 33 million, respectively.
Net financial income/(expense) from infrastructure projects
Net financial expense from infrastructure projects increased by 10.5% to a loss of EUR 411 million in 2024 from a
loss of EUR 372 million in 2023, which was primarily driven by:
▪an increase of 3.4% in net financial expense financing, which amounted to EUR 339 million in 2024, as
compared to EUR 328 million in 2023, which was primarily driven by the borrowing costs of infrastructure
project companies, mainly within the Toll Roads Business division, and the decrease in capitalized expenses
related to segment 3C of NTE 35W toll road as it entered into operation in June 2023; and
▪an increase of 63.6% in loss on derivatives and other net financial (expense) to a loss of EUR 72 million in
2024, as compared to a loss of EUR 44 million in 2023, which was primarily related to the financial
provision update related to the future payments to be made to the U.S Department of Transportation
according to the contract terms in the I-66 concession.
Net financial income/(expense) from ex-infrastructure projects
Net financial income from ex-infrastructure projects increased to EUR 685 million in 2024 from an income of EUR
142 million in 2023, which was primarily due to:
▪a decrease in net financial income from financing, which amounted to EUR 74 million in 2024 from EUR
111 million in 2023, driven by lower cash levels, leading to the reduction in returns on our cash resources in
all geographies; and
▪an increase in profit on derivatives and other net financial income, which was EUR 611 million in 2024 as
compared to a profit EUR 31 million in 2023, this was driven by the revaluation of the remaining 5.25%
HAH stake.
Net financial income/(expense)
Net financial expense increased by 219.1% to an income of EUR 274 million in 2024 from an expense of EUR 230
million in 2023, primarily due to the revaluation of the remaining 5.25% stake in HAH, which was partially offset by the
receipt of higher financial expenses from infrastructure project companies, mainly from the Toll Roads Business
Division.
Share of profits of equity-accounted companies
Share of profits of equity-accounted companies increased by 10.7% to EUR 238 million in 2024 from EUR 215
million in 2023, primarily due to the contribution to results from 407 ETR (EUR 188 million), IRB (EUR 13 million),
Serveo Group (EUR 3 million), JFK NTO (EUR 3 million) and other equity-accounted entities (EUR 31 million).
Under the share of profits of equity-accounted companies, in 2024, we recorded results of EUR 0 million contributed
by HAH and AGS, respectively, as compared to a result of EUR 0 million contributed by HAH and AGS,
respectively, in 2023. This resulted from application of IAS 28, according to which if the shareholder’s share in losses
of the associate equals or exceeds the amount of its share in the associate, the shareholder shall cease to recognize its
share in the additional losses, unless there are legal or constructive obligations justifying the recognition of a liability
for additional losses once the investment value is reduced to zero. The considerable losses posted in 2019 and 2020 in
HAH and AGS reduced our investments in HAH and AGS to zero, as prior-year losses exceeded the amount of
investment, and there was no commitment to inject additional funds per IAS 28.
In terms of the overall operational performance, 407 ETR’s revenues increased by 14.0% to CAD 1,705 million in
2024, which was driven largely by the increase in toll rates on February 1, 2024 coupled with higher traffic supported by
an increase in mobility and rush-hour commuting as workplaces experienced a higher percentage of on-site employees
combined with an increase in rehabilitation construction activities on Highway 401. The 407 ETR’s net result
increased to 22.0% to CAD 692 million, with our share thereof being CAD 278 million (EUR 188 million) in 2024,
from CAD 567 million, with our share thereof being CAD 225 million (EUR 154 million) in 2023.
Income tax / (expense)
Our income tax expense increased to EUR 145 million in 2024 from EUR 115 million in 2023. The 2024 expense is
mainly related to the tax expense booked in Poland (EUR 50 million), the deferred tax expense in US due to the
accelerated tax depreciation, partially offset by the recognition of net operating losses arisen in the year (EUR 50
million), the corporate income tax expense in Australia (EUR 16 million) and the withholding tax expense in the
Netherlands related to dividends from Canada and capital gains in India (EUR 32 million). Additionally, there is a
positive impact (income) on the tax expense which arises from registering previous years’ net deferred tax assets
(EUR 6 million, mainly in Turkey and Spain), and from the effects of the Spanish Constitutional Court ruling related
to RD 3/2016 (EUR 31 million).
Profit/(loss) net of tax from discontinued operations
Profit/(loss) net of tax from discontinued operations decreased by 12.5% to a profit EUR 14 million in 2024 from a
profit of EUR 16 million in 2023, which was primarily driven by earn-outs from the divested Services Business
Division’s business in accordance with the sale agreements (mainly pertaining to the Spanish infrastructure services
businesses). The profit of EUR 16 million generated in 2023 was primarily driven by the same factors.
Net profit/(loss)
Net profit/(loss) for the year increased to EUR 3,490 million in 2024 from EUR 511 million in 2023, which was
primarily driven by the sale of the 19.75% stake in HAH.
Net profit/(loss) for the year attributed to non-controlling interests
Net profit/(loss) for the year attributed to non-controlling interests increased by 47.6% to a loss of EUR 251
million in 2024 from a loss of EUR 170 million in 2023, which was primarily due to the Toll Roads Business
Division’s non-controlling interests in the U.S.
5.A.6.2Comparison of the Years Ended December 31, 2023 and December 31, 2022
Unless stated otherwise, numbers in this section have been derived from the Audited Financial Statements. For a
discussion of the presentation of our historical financial information included in this Annual Report, see “Presentation
of Financial and Other Information”.
Our consolidated results of operations for the year ended December 31, 2023 compared with the year ended
December 31, 2022, are discussed below.
| | | |
| For the year ended December 31, |
| | | |
| |
Revenues ................................................................................................................... | | | |
Other operating income ............................................................................................. | | | |
Revenues and other operating income ................................................................. | | | |
Materials consumed ................................................................................................... | | | |
Other operating expenses ......................................................................................... | | | |
Personnel expenses .................................................................................................... | | | |
Total operating expenses ........................................................................................ | | | |
Fixed asset depreciation ............................................................................................ | | | |
Impairment and disposal of fixed assets ................................................................... | | | |
Operating profit/(loss) ............................................................................................. | | | |
Net financial income/(expense) from financing ........................................................ | | | |
Profit/(loss) on derivatives and other net financial income/(expense) ..................... | | | |
Net financial income/(expense) from infrastructure projects ............................ | | | |
Net financial income/(expense) from financing ....................................................... | | | |
Profit/(loss) on derivatives and other net financial income/(expense) ...................... | | | |
Net financial income/(expense) from ex-infrastructure projects ........................... | | | |
Net financial income/(expense) .............................................................................. | | | |
Share of profits of equity-accounted companies ....................................................... | | | |
Profit/(loss) before tax from continuing operations ............................................ | | | |
Income tax / (expense) .............................................................................................. | | | |
Profit/(loss) net of tax from continuing operations ............................................ | | | |
Profit/(loss) net of tax from discontinued operations ................................................ | | | |
Net profit/(loss) ........................................................................................................ | | | |
Net profit/(loss) for the year attributed to non-controlling interests ......................... | | | |
Net profit/(loss) for the year attributed to the parent company ........................ | | | |
Revenues
Revenues increased by 12.8% to EUR 8,514 million in 2023 from EUR 7,551 million in 2022, primarily due to the
improvement in results across the Business Divisions and particularly in the Toll Roads and Construction Business
Divisions.
The table below sets out our revenues by Business Division for the years ended December 31, 2023 and 2022:
| | | |
| For the year ended December 31, |
| | | |
| |
Toll Roads .............................................................................................. | | | |
Airports ................................................................................................... | | | |
Construction ........................................................................................... | | | |
Energy .................................................................................................... | | | |
Others(1) ................................................................................................. | | | |
Adjustments(2) ........................................................................................ | | | |
Total ....................................................................................................... | | | |
(1)Others include management revenues of headquarters and certain other immaterial non-operating entities.
(2)Adjustments consist of inter-segment sales that are eliminated in the Group’s consolidated financial statements.
Our Toll Roads Business Division revenue increased by 39.1% to EUR 1,085 million in 2023 from EUR 780
million in 2022. This increase was mainly due to the traffic increase and toll rates increases, together with the opening
of I-66 in November 2022. All Managed Lanes revenue-per-transaction, grew compared to 2022. Particularly, within
this Business Division:
▪NTE 1-2 revenues increased by 19.0% to USD 289 million (EUR 267 million), which was mainly driven by
the post-pandemic increase in traffic and higher toll rates.
▪NTE 35W revenues increased by 39.4% to USD 234 million (EUR 217 million), which was mainly driven
by the opening of segment 3C in June 2023.
▪LBJ revenues increased by 20.9% to USD 193 million (EUR 178 million), which was primarily driven by
the post-pandemic increase in traffic and higher toll rates.
▪I-77 revenues increased by 50.5% to USD 91 million (EUR 84 million), which was primarily driven by the
post-pandemic increase in traffic and higher toll rates.
▪I-66 revenues amounted to USD 167 million (EUR 155 million), which was driven by the opening of the
project in November 2022
Our Airports Business Division revenue increased by 48.1% to EUR 80 million in 2023 from EUR 54 million in 2022.
This increase was primarily impacted by the Dalaman airport’s revenues following the consolidation of the entity into
the Group in July 2022.
Our Construction Business Division revenue increased by 9.4% to EUR 6,869 million in 2023 from EUR 6,280
million in 2022. This increase was primarily driven by the performance of Budimex. Particularly, within the Business
Division:
▪Budimex revenues increased by 17.3%, which was mainly driven by its building and civil works activities
due to its portfolio of contracts in progress and exceeding forecasts supported by good weather, as well as
new projects awarded in 2022.
▪Webber revenues increased by 8.9%, which was driven mainly by higher sales in its water and heavy civil
works activities as a result of recent project awards.
▪Ferrovial Construction increased by 5.3%, which was mainly driven by growth in the Spanish market (both
civil works and non-residential buildings) and the Australian market, in connection with the execution of the
Sydney Metro and Coffs Harbour Bypass projects, partially offset by lower activity in North America due to
the completion of several large projects at the same time several other projects commenced.
Our Energy Infrastructure and Mobility Business Division revenue increased by 8.4% to EUR 207 million in 2023
from EUR 191 million in 2022, which was primarily driven by activities related to waste management in the UK and
the Group’s services activities in Chile.
Other operating income
Other operating income decreased by 50.0% to EUR 1 million in 2023 from EUR 2 million in 2022, which was driven
by a decrease in construction operating subsidies received.
Revenues and other operating income
Revenues and other operating income increased by 12.7% to EUR 8,515 million in 2023 from EUR 7,553
million in 2022 due to the corresponding increase in revenues.
Materials consumed
Materials consumed decreased by 12.5% to EUR 1,047 million in 2023 from EUR 1,197 million in 2022, primarily
due to the stabilization of raw materials’ prices, which had significantly increased in 2022 due to the conflict in
Ukraine.
Other operating expenses
Other operating expenses increased by 16.6% to EUR 4,878 million in 2023 from EUR 4,182 million in 2022,
primarily due to a Construction Business Division project in the U.S., where losses were recognized as a result of an
increase of the expected costs to complete the works that was caused by unexpected events occurring throughout the
year and partially offset by the expected recovery of related claims.
Personnel expenses
Personnel expenses increased by 10.6% to EUR 1,599 million in 2023 from EUR 1,446 million 2022. This was
primarily driven by an increase in our workforce, which grew by 608 employees, an increase of 2.5% with respect to
the prior year and mainly driven by the Construction Business Division as well as a generalized increased in the
average wage.
Fixed asset depreciation
Fixed asset depreciation increased by 34.1% to EUR 401 million in 2023 from EUR 299 million in 2022, primarily
due to the opening of toll road I-66 in November 2022.
Impairment and disposal of fixed assets
Impairment and disposal of fixed assets increased to income of EUR 35 million in 2023 from a loss of EUR (6)
million in 2022, which was primarily driven by the sale of our 89.2% stake in the toll road Euroscut Azores, which
resulted in a capital gain of EUR 41 million.
Net financial income/(expense) from infrastructure projects
Net financial expense from infrastructure projects increased by 1.9% to a loss of EUR 372 million in 2023 from a loss
of EUR 365 million in 2022, which was primarily driven by:
▪an increase of 35.0% in net financial expense financing, which amounted to EUR 328 million in 2023, as
compared to EUR 243 million in 2022, which was primarily driven by the borrowing costs of infrastructure
project companies and the decrease in capitalized expenses in the I-66 toll road as it entered into operation in
November 2022; and
▪a decrease of 63.9% in loss on derivatives and other net financial (expense) to a loss of EUR 44 million in
2023 , as compared to a loss of EUR 122 million in 2022, which was primarily related to the positive
variation in the performance of Autema’s insurance-linked security (ILS) derivative.
Net financial income/(expense) from ex-infrastructure projects
Net financial income from ex-infrastructure projects increased to EUR 142 million in 2023 from EUR 48 million in
2022, which was primarily due to:
▪an increase in net financial income from financing, which amounted to EUR 111 million in 2023 from EUR
1 million in 2022, driven by the increase in returns on our cash resources in Poland and the U.S., which was
partially offset by our cash hedging strategy in Canada, where cash flows are hedged in euro due to no
expected liabilities in Canadian dollars, as well as by an increase in external borrowing costs (in particular,
higher interest rates on our ECP and corporate credit lines); and
▪a decrease of 34% in profit on derivatives and other net financial income, which was EUR 31 million in
2023 as compared to a profit of EUR 47 million in 2022, which was primarily driven by the positive impact
in 2022 of the termination of our hedging arrangement contracted in connection with the expected issuance
of a corporate bond, which was ultimately not issued.
Net financial income/(expense)
Net financial expense decreased by 27.4% to an expense of EUR 230 million in 2023from an expense of EUR 317
million in 2022, primarily due to the receipt of higher financial income from ex-infrastructure project companies.
Share of profits of equity-accounted companies
Share of profits of equity-accounted companies increased by 30.3% to EUR 215 million in 2023 from EUR 165
million in 2022, primarily due to the contribution to results of 407 ETR (EUR 154 million), IRB (EUR 14 million),
Serveo Group (EUR 11 million), NTO at JFK (EUR 4 million) and other equity accounted entities (EUR 32 million).
Under share of profits of equity-accounted companies, in 2023, we recorded results of EUR 0 million and EUR 0
million contributed by HAH and AGS, respectively, as compared to results of EUR 0 million and EUR 0 million,
respectively, in 2022. This resulted from application of IAS 28, according to which if the shareholder’s share in losses
of the associate equals or exceeds the amount of its share in the associate, the shareholder shall cease to recognize its
share in the additional losses, unless there are legal or constructive obligations justifying the recognition of a liability
for additional losses once the investment value is reduced to zero. The considerable losses posted in 2019 and 2020 in
HAH and AGS reduced our investments in HAH and AGS to zero, as prior-year losses exceeded the amount of
investment, and there was no commitment to inject additional funds per IAS 28.
In terms of the overall operational performance, Heathrow airport revenue increased by 26.6% to GBP 3,687 million
in 2023, which was driven by an increase in airport traffic throughout the year. AGS airports revenue increased by
18.9% to GBP 198 million in 2023, which was also driven by an increase in airport traffic.
407 ETR’s revenues increased by 12.7% to CAD 1,495 million in 2023, which was driven largely by the lifting of the
COVID-19 restrictions by the province of Ontario and the resulting increases in traffic, with return-to-work policies in
place, supported by rehabilitation construction works in competing Highway 301 and favorable weather conditions.
407 ETR’s net result increased by 30.3% to CAD 567 million, with our share thereof being CAD 225 million (EUR
154 million) in 2023, from CAD 435 million, with our share thereof being CAD 169 million (EUR 124 million) in
2022.
Income tax / (expense)
Our income tax expense increased to EUR 115 million in 2023 from an expense of EUR 30 million in 2022. The 2023
expense was primarily driven by an increase in our Polish corporate income tax expense and lower corporate tax
income in the Netherlands due to the lack of recognition of the tax losses and credits for the year. Expense of EUR 91
million in the Netherlands due to deferred tax liability for withholding tax of future Canadian dividends and
derecognition of previous years’ net operating losses, which was partially offset by income of EUR 62 million in
Spain in connection with the regularization and corresponding recognition of net operating losses and tax credits for
previous years.
Profit/(loss) net of tax from discontinued operations
Profit/(loss) net of tax from discontinued operations decreased by 75.0% to a profit EUR 16 million in 2023 from a
profit of EUR 64 million in 2022, which was primarily driven by earn-outs from the divested Services Business
Division’s business in accordance with sale agreements mainly pertaining to the Spanish infrastructure services
businesses. The profit of EUR 64 million generated in 2022 was primarily driven by the divestment of Amey
following its sale, which was completed in December 2022 and generated a capital gain of EUR 58.3 million.
Net profit/(loss)
Net profit/(loss) for the year increased by 67.5% to EUR 511 million in 2023 from EUR 305 million in 2022, which
was primarily driven by increased income from continued operations.
Net profit/(loss) for the year attributed to non-controlling interests
Net profit/(loss) for the year attributed to non-controlling interests increased by 45.3% to a loss of EUR 170 million in
2023 from a loss of EUR 117 million in 2022, which was primarily due to the Toll Roads Business Division’s non-
controlling interests in the U.S., partially offset by Dalaman airport’s profits, as the entity was not consolidated until
the second half of 2022.
5.A.7Segment Reporting
The tables below show our income statement for the years ended December 31, 2024, 2023 and 2022, by reporting
segments and total sales by geographic market.
5.A.7.1Segment reporting
In January 2024, we conducted a partial reorganization of our Business Divisions pursuant to which the energy
solutions business line, which was part of the Construction Business Division, and the energy infrastructures business
line, which was part of the former Energy Infrastructure and Mobility Business Division, merged. The resulting
Business Division has been named the Energy Business Division. The mobility business line and remaining services
businesses, which were until then part of the former Energy Infrastructure and Mobility Business Division, are
separately managed outside of the scope of our Business Divisions and reported as “Other” (see further explanation in
“4. Information on the Company —B._Business overview —1. Overview” and “Note 1.5 (Segment Reporting)” to the
Audited Financial Statements for additional information about our reporting segments). Information presented in this
Annual Report for historical periods prior to this segment change has been revised to reflect the partial reorganization.
The tables below show our income statement for the years ended December 31, 2024, 2023 and 2022, by reporting
segments.
| | | | | | | |
| For the year ended December 31, 2024 |
| | | | | | | |
| |
Revenue .................................... | | | | | | | |
Total operating expenses .......... | | | | | | | |
Fixed asset depreciation ............ | | | | | | | |
Impairment and disposal of fixed assets ................................ | | | | | | | |
Operating profit/(loss) ............ | | | | | | | |
Profit/(loss) on derivatives and other net financial income/ (expense) ................................... | | | | | | | |
Net financial income/(expense) from financing .......................... | | | | | | | |
Net financial income/ (expense) .................................. | | | | | | | |
Share of profits of equity- accounted companies ................ | | | | | | | |
Profit/(loss) before tax from continuing operations ............. | | | | | | | |
Income/(expense) tax ................ | | | | | | | |
Profit/(loss) net of tax from continuing operations ............... | | | | | | | |
Profit/(loss) net of tax from discontinued operations ............ | | | | | | | |
Net profit/(loss) ....................... | | | | | | | |
Net profit/(loss) for the year attributed to non-controlling interests ..................................... | | | | | | | |
Net profit/(loss) for the year attributed to the parent company ................................... | | | | | | | |
(1) We use the “other” category to reflect results for companies not assigned to any Business Division, the most significant being Ferrovial
SE, the Group’s parent company, and some minor subsidiaries, including our mobility business, waste management plants and services to the
mining industry in Chile.
(2) Adjustments consist of inter-segment sales that are eliminated in the Group’s consolidated financial statements.
| | | | | | | |
| For the year ended December 31, 2023 |
| | | | | | | |
| |
Revenue .................................... | | | | | | | |
Total operating expenses .......... | | | | | | | |
Fixed asset depreciation ............ | | | | | | | |
Impairment and disposal of fixed assets ................................ | | | | | | | |
Operating profit/(loss) ............ | | | | | | | |
Profit/(loss) on derivatives and other net financial income/ (expense) ................................... | | | | | | | |
Net financial income/(expense) from financing .......................... | | | | | | | |
Net financial income/ (expense) .................................. | | | | | | | |
Share of profits of equity- accounted companies ................ | | | | | | | |
Profit/(loss) before tax from continuing operations ............... | | | | | | | |
Income/(expense) tax ................ | | | | | | | |
Profit/(loss) net of tax from continuing operations ............... | | | | | | | |
Profit/(loss) net of tax from discontinued operations ............ | | | | | | | |
Net profit/(loss) ....................... | | | | | | | |
Net profit/(loss) for the year attributed to non-controlling interests ..................................... | | | | | | | |
Net profit/(loss) for the year attributed to the parent company ................................... | | | | | | | |
(1) We use the “other” category to reflect results for companies not assigned to any Business Division, the most significant being Ferrovial
SE, the Group’s parent company, and some minor subsidiaries, including our mobility business, waste management plants and services to the
mining industry in Chile.
(2) Adjustments consist of inter-segment sales that are eliminated in the Group’s consolidated financial statements
| | | | | | | |
| For the year ended December 31, 2022 |
| | | | | | | |
| |
Revenue .................................... | | | | | | | |
Total operating expenses .......... | | | | | | | |
Fixed asset depreciation ............ | | | | | | | |
Impairment and disposal of fixed assets ................................ | | | | | | | |
Operating profit/(loss) ............ | | | | | | | |
Profit/(loss) on derivatives and other net financial income/ (expense) ................................... | | | | | | | |
Net financial income/(expense) from financing .......................... | | | | | | | |
Net financial income/ (expense) .................................. | | | | | | | |
Share of profits of equity- accounted companies ................ | | | | | | | |
Profit/(loss) before tax from continuing operations ............. | | | | | | | |
Income/(expense) tax ................ | | | | | | | |
Profit/(loss) net of tax from continuing operations ............... | | | | | | | |
Profit/(loss) net of tax from discontinued operations ............ | | | | | | | |
Net profit/(loss) ....................... | | | | | | | |
Net profit/(loss) for the year attributed to non-controlling interests ..................................... | | | | | | | |
Net profit/(loss) for the year attributed to the parent company ................................... | | | | | | | |
(1) We use the “other” category to reflect results for companies not assigned to any Business Division, the most significant
being Ferrovial SE, the Group’s parent company, and some minor subsidiaries, including our mobility business, waste management
plants and services to the mining industry in Chile.
(2) Adjustments consist of inter-segment sales that are eliminated in the Group’s consolidated financial statements
5.A.7.2 Geographic information
We report our revenues based on the following geographic breakdowns: United States, Poland, Spain, United
Kingdom, Canada and Other.
| | | |
| For the year ended December 31, |
| | | |
| | | |
USA . . . . . . . . . . . . . . . . . . . . . . . . . . . . . . . . . . . . . . . . . . . . . . . . . . . . . . . | | | |
Poland . . . . . . . . . . . . . . . . . . . . . . . . . . . . . . . . . . . . . . . . . . . . . . . . . . . . . . | | | |
Spain . . . . . . . . . . . . . . . . . . . . . . . . . . . . . . . . . . . . . . . . . . . . . . . . . . . . . . . | | | |
UK . . . . . . . . . . . . . . . . . . . . . . . . . . . . . . . . . . . . . . . . . . . . . . . . . . . . . . . . | | | |
Canada . . . . . . . . . . . . . . . . . . . . . . . . . . . . . . . . . . . . . . . . . . . . . . . . . . . . . | | | |
Other . . . . . . . . . . . . . . . . . . . . . . . . . . . . . . . . . . . . . . . . . . . . . . . . . . . . . . . | | | |
Total revenues . . . . . . . . . . . . . . . . . . . . . . . . . . . . . . . . . . . . . . . . . . . . . . . | | | |
5.A.8 Non-IFRS Measures: Operating Results
In evaluating our operating performance, we analyze certain measures of operating results not defined by, or
calculated in accordance with, IFRS: Adjusted EBIT, Adjusted EBIT Margin, Adjusted EBITDA, Comparable or
“Like-for-like” (“LfL”) Growth, and Order Book. Those measures are not audited and are not a substitute for, or
superior to, reported results presented in accordance with IFRS-IASB.
These non-IFRS measures should not be considered as alternatives to consolidated result for the period, operating
result, revenue, cash generated from operating activities or any other performance measures derived in accordance
with IFRS as measures of operating performance or operating cash flows or liquidity.
We believe that these non-IFRS measures are metrics commonly used by investors and analysts to evaluate our
performance. We further believe that the disclosure of these non-IFRS measures is useful to investors and analysts
because these metrics assist investors and analysts in comparing our operating performance across reporting periods
on a consistent basis by excluding items that our management believes are not indicative of our core operating
performance. Furthermore, these non-IFRS measures form the basis of how our executive team and the Board evaluate
our performance.
By disclosing these non-IFRS measures, we believe that we create for investors and analysts a greater understanding
of, and an enhanced level of transparency into, some of the means by which our management team operates and
evaluates us and facilitates comparisons of the current period’s results with prior periods. While similar measures are
widely used in the industry in which we operate, the financial measures we use may not be comparable to similarly
titled measures used by other companies, nor are they intended to be substitutes for measures of financial performance
or financial position as prepared in accordance with IFRS-IASB.
Our management uses Adjusted EBIT, Adjusted EBIT Margin, Adjusted EBITDA, Comparable or “Like- for-
like” (“LfL”) Growth, and Order Book as measures of operating performance and in communications with the Board
concerning our financial performance.
For non-IFRS measures relating to our liquidity and capital resources, see “—B. Liquidity and Capital Resources—6.
Non-IFRS Measures: Liquidity and Capital Resources.”
In January 2024, we conducted a partial reorganization of our Business Divisions (for further information, see “4.
Information on the Company —B.Business Overview —1. Overview” and Note 1.5 (Segment Reporting) to the Audited
Financial Statements). Information presented in this Annual Report for historical periods prior to the segment change
has been revised to reflect the partial reorganization.
5.A.8.1Adjusted EBIT and Adjusted EBIT Margin
Adjusted EBIT is defined as our net profit/(loss) for the period excluding profit/(loss) net of tax from discontinued
operations, income tax/(expense), share of profits of equity-accounted companies, net financial income/(expense) and
impairment and disposal of fixed assets.
Adjusted EBIT is a non-IFRS financial measure and should not be considered as an alternative to net profit or loss or
any other measure of our financial performance calculated in accordance with IFRS. Adjusted EBIT does not have a
standardized meaning and, therefore, cannot be compared to Adjusted EBIT of other companies.
Adjusted EBIT has limitations as an analytical tool. Some of these limitations include:
▪Adjusted EBIT
▪does not reflect our cash expenditures or future requirements for capital expenditures or contractual
commitments;
▪does not reflect changes in, or cash requirements for, our working capital needs;
▪does not reflect the significant interest expense, or the cash requirements necessary to service interest or
principal payments, on our debt, or our proportional interest in the interest expense of our unconsolidated
investments or the cash requirements necessary to service interest or principal payments on the debt borne
by our unconsolidated investments;
▪does not reflect our income taxes or the cash requirement to pay our taxes; or our proportional interest in
income taxes of our unconsolidated investments or the cash requirements necessary to pay the taxes of our
unconsolidated investments; and
▪does not reflect the effect of certain mark-to-market adjustments and non-recurring items or our
proportional interest in the mark-to-market adjustments at our unconsolidated investments.
▪We do not have control, nor have any legal claim to the portion of the unconsolidated investees’ revenues and
expenses allocable to our joint venture partners. As we do not control, but do exercise significant influence,
we account for the unconsolidated investments in accordance with the equity method of accounting. Net
earnings from these investments are reflected within our consolidated statements of operations in share of
profits of equity-accounted companies. Adjustments related to our proportionate share from unconsolidated
investments include only our proportionate amounts of interest expense, income taxes, depreciation,
amortization and accretion, and mark-to-market adjustments included in share of profits of equity-accounted
companies; and
▪Other companies in our industry may calculate Adjusted EBIT differently than we do, limiting its usefulness
as a comparative measure.
Because of these limitations, Adjusted EBIT should not be considered in isolation or as a substitute for performance
measures calculated in accordance with IFRS.
Adjusted EBIT Margin is defined as Adjusted EBIT divided by our revenues for the relevant period.
The following tables set forth a reconciliation of Adjusted EBIT to our net profit/(loss) for the periods indicated:
| | | |
| For the year ended December 31, |
| | | |
| |
Net profit/(loss) . . . . . . . . . . . . . . . . . . . . . . . . . . . . . . . . . . . . . . . . . . . . . . . . . . . . | | | |
Profit/(loss) net of tax from discontinued operations . . . . . . . . . . . . . . . . . . . . . . . | | | |
Income tax/(expense) . . . . . . . . . . . . . . . . . . . . . . . . . . . . . . . . . . . . . . . . . . . . . . . | | | |
Share of profits of equity-accounted companies . . . . . . . . . . . . . . . . . . . . . . . . . . | | | |
Net financial income/(expense) . . . . . . . . . . . . . . . . . . . . . . . . . . . . . . . . . . . . . . . | | | |
Impairment and disposal of fixed assets . . . . . . . . . . . . . . . . . . . . . . . . . . . . . . . . . | | | |
Adjusted EBIT . . . . . . . . . . . . . . . . . . . . . . . . . . . . . . . . . . . . . . . . . . . . . . . . . . . | | | |
The following tables set forth a reconciliation of Adjusted EBIT by Business Division to our net profit/(loss) by
Business Division for the years ended December 31, 2024, 2023 and 2022:
| | | | | | | |
| For the year ended December 31, 2024 |
| | | | | | | |
| |
Net profit/(loss) ......................... | | | | | | | |
Profit/(loss) net of tax from discontinued operations ............ | | | | | | | |
Income tax/(expense) ................ | | | | | | | |
Share of profits of equity- accounted companies ................ | | | | | | | |
Net financial income/(expense) | | | | | | | |
Impairment and disposal of fixed assets ................................ | | | | | | | |
Adjusted EBIT ........................ | | | | | | | |
| | | | | | | |
| For the year ended December 31, 2023 |
| | | | | | | |
| |
Net profit/(loss) ......................... | | | | | | | |
Profit/(loss) net of tax from discontinued operations ............ | | | | | | | |
Income tax/(expense) ................ | | | | | | | |
Share of profits of equity- accounted companies ................ | | | | | | | |
Net financial income/(expense) | | | | | | | |
Impairment and disposal of fixed assets ................................ | | | | | | | |
Adjusted EBIT ........................ | | | | | | | |
| | | | | | | |
| For the year ended December 31, 2022 |
| | | | | | | |
| |
Net profit/(loss) ......................... | | | | | | | |
Profit/(loss) net of tax from discontinued operations ............ | | | | | | | |
Income tax/(expense) ................ | | | | | | | |
Share of profits of equity- accounted companies ................ | | | | | | | |
Net financial income/(expense) | | | | | | | |
Impairment and disposal of fixed assets ................................ | | | | | | | |
Adjusted EBIT ........................ | | | | | | | |
The table below sets out our Adjusted EBIT by Business Division for the years ended December 31, 2024 and 2023:
| | | |
| For the year ended December 31, |
| | | |
|
Toll Roads ................................................................................................... | | | |
Airports ........................................................................................................ | | | |
Construction ................................................................................................ | | | |
Energy ........................................................................................................ | | | |
Others(1) ...................................................................................................... | | | |
Total ............................................................................................................ | | | |
(1)Others include management revenues of our headquarters and certain other immaterial non-operating entities, including our mobility
business, waste management plants and services to the mining industry in Chile.
Our Toll Roads Adjusted EBIT increased to EUR 686 million in 2024 from EUR 586 million in 2023, which was
primarily driven by increased traffic volume and toll rates increases, mainly in the United States.
Our Construction Adjusted EBIT increased to EUR 284 million in 2024 from EUR 77 million in 2023, resulting in an
Adjusted EBIT Margin of 3.9% in 2024 as compared to 1.1% in 2023. This was generally driven by Budimex’s
profitability supported by risk mitigations in the completion of contracts, together with the absence of losses in the
completion works in large projects in the U.S.
Our Airports Adjusted EBIT increased to a profit of EUR 4 million in 2024 from a loss of EUR 2 million in 2023,
which was mainly driven by Dalaman airport, where increased passenger traffic led to higher revenues, while also
benefiting from savings in utilities due to lower energy prices.
Our Energy Adjusted EBIT decreased to a loss of EUR 11 million in 2024 from a loss of EUR 8 million in 2023,
which was generally driven by higher overheads due to increased activity post-merger, and the negative impact of
depreciation of Centella after starting operations in July 2024.
The table below sets out our Adjusted EBIT by Business Division for the years ended December 31, 2023 and 2022:
| | | |
| For the year ended December 31, |
| | | |
|
Toll Roads .............................................................................................. | | | |
Airports ................................................................................................... | | | |
Construction ........................................................................................... | | | |
Energy ................................................................................................... | | | |
Others(1) ................................................................................................. | | | |
Total ....................................................................................................... | | | |
(1)Others include management revenues of our headquarters and certain other immaterial non-operating entities, including our mobility
business, waste management plants and services to the mining industry in Chile.
Our Toll Roads Adjusted EBIT increased to EUR 586 million in 2023 from EUR 391 million in 2022, which was
primarily driven by increased traffic volume following the lifting of COVID-19 restrictions and higher toll rates.
Our Construction Adjusted EBIT decreased to EUR 77 million in 2023 from EUR 69 million in 2022, resulting in an
Adjusted EBIT Margin of 1.1% in 2023 as compared to 1.1% in 2022. This was generally driven by Budimex’s
profitability, indexation agreements and higher building and civil works volume, partially offset by the completion of
several large projects in the U.S. and the negative impact of a landslide in one of our projects in Colombia.
Our Airports Adjusted EBIT increased to a loss of EUR 2 million in 2023 from a loss of EUR 9 million in 2022,
which was mainly driven by increases in passenger traffic and the incorporation of Dalaman airport’s revenues after its
consolidation into the Group in July 2022.
Our Energy Adjusted EBIT increased to a loss of EUR 8 million in 2023 from a loss of EUR 13 million in 2022,
which was generally driven by the positive evolution of the energy solutions business line.
5.A.8.2Adjusted EBITDA
Adjusted EBITDA is defined as our net profit/(loss) for the period excluding profit/(loss) net of tax from discontinued
operations, income tax/(expense), share of profits of equity-accounted companies, net financial income/(expense),
impairment and disposal of fixed assets and charges for fixed asset and right of use of leases depreciation and
amortization.
Adjusted EBITDA is a non-IFRS financial measure and should not be considered as an alternative to net profit or loss
or any other measure of our financial performance calculated in accordance with IFRS. We use Adjusted EBITDA, in
addition to Adjusted EBIT, to provide an analysis of our operating results, excluding depreciation and amortization, as
they are non-cash variables, which can vary substantially from company to company depending on accounting policies
and accounting valuation of assets. Adjusted EBITDA is used as an approximation to pre-tax operating cash flow and
reflects cash generation before working capital variation.
Adjusted EBITDA has limitations as an analytical tool. Some of these limitations include:
▪Adjusted EBITDA
▪does not reflect our cash expenditures or future requirements for capital expenditures or contractual
commitments;
▪does not reflect changes in, or cash requirements for, our working capital needs;
▪does not reflect the significant interest expense, or the cash requirements necessary to service interest or
principal payments, on our debt, or our proportional interest in the interest expense of our unconsolidated
investments or the cash requirements necessary to service interest or principal payments on the debt
borne by our unconsolidated investments;
▪does not reflect our income taxes or the cash requirement to pay our taxes; or our proportional interest in
income taxes of our unconsolidated investments or the cash requirements necessary to pay the taxes of
our unconsolidated investments;
▪does not reflect depreciation, amortization and accretion which are non-cash charges; or our proportional
interest in depreciation, amortization and accretion of our unconsolidated investments. The assets being
depreciated, amortized and accreted will often have to be replaced in the future, and Adjusted EBITDA
does not reflect any cash requirements for such replacements; and
▪does not reflect the effect of certain mark-to-market adjustments and non-recurring items or our
proportional interest in the mark-to-market adjustments at our unconsolidated investments.
▪We do not have control, nor have any legal claim to the portion of the unconsolidated investees’ revenues and
expenses allocable to our joint venture partners. As we do not control, but do exercise significant influence,
we account for the unconsolidated investments in accordance with the equity method of accounting. Net
earnings from these investments are reflected within our consolidated statements of operations in share of
profits of equity-accounted companies. Adjustments related to our proportionate share from unconsolidated
investments include only our proportionate amounts of interest expense, income taxes, depreciation,
amortization and accretion, and mark-to-market adjustments included in share of profits of equity-accounted
companies; and
▪Other companies in our industry may calculate Adjusted EBITDA differently than we do, limiting its
usefulness as a comparative measure.
Because of these limitations, Adjusted EBITDA should not be considered in isolation or as a substitute for
performance measures calculated in accordance with IFRS.
Adjusted EBITDA is a measure which is widely used to track our performance and profitability as well as to evaluate
each of our businesses and the level of debt by comparing the Adjusted EBITDA with Consolidated Net Debt.
However, Adjusted EBITDA does not have a standardized meaning and, therefore, cannot be compared to Adjusted
EBITDA of other companies.
The following tables set forth a reconciliation of Adjusted EBITDA to our net profit/(loss) for the periods indicated:
| | | |
| For the year ended December 31, |
| | | |
| |
Net profit/(loss) ......................................................................................... | | | |
Profit/(loss) net of tax from discontinued operations ............................... | | | |
Income tax/(expense) ................................................................................ | | | |
Share of profits of equity-accounted companies ....................................... | | | |
Net financial income/(expense) ................................................................ | | | |
Impairment and disposal of fixed assets ................................................... | | | |
Fixed asset depreciation ............................................................................ | | | |
Adjusted EBITDA ................................................................................... | | | |
The following tables set forth a reconciliation of Adjusted EBITDA by Business Division to our net profit/ (loss) by
Business Division for the years ended December 31, 2024, 2023 and 2022:
| | | | | | | |
| For the year ended December 31, 2024 |
| | | | | | | |
| |
Net profit/(loss) ......................... | | | | | | | |
Profit/(loss) net of tax from discontinued operations ............ | | | | | | | |
Income tax/(expense) ................ | | | | | | | |
Share of profits of equity- accounted companies ................ | | | | | | | |
Net financial income/(expense) | | | | | | | |
Impairment and disposal of fixed assets ................................ | | | | | | | |
Fixed asset depreciation ............ | | | | | | | |
Adjusted EBITDA .................. | | | | | | | |
| | | | | | | |
| For the year ended December 31, 2023 |
| | | | | | | |
| |
Net profit/(loss) ......................... | | | | | | | |
Profit/(loss) net of tax from discontinued operations ............ | | | | | | | |
Income tax/(expense) ................ | | | | | | | |
Share of profits of equity- accounted companies ................ | | | | | | | |
Net financial income/(expense) | | | | | | | |
Impairment and disposal of fixed assets ................................ | | | | | | | |
Fixed asset depreciation ............ | | | | | | | |
Adjusted EBITDA .................. | | | | | | | |
| | | | | | | |
| For the year ended December 31, 2022 |
| | | | | | | |
| |
Net profit/(loss) ......................... | | | | | | | |
Profit/(loss) net of tax from discontinued operations ............ | | | | | | | |
Income tax/(expense) ................ | | | | | | | |
Share of profits of equity- accounted companies ................ | | | | | | | |
Net financial income/(expense) | | | | | | | |
Impairment and disposal of fixed assets ................................ | | | | | | | |
Fixed asset depreciation ............ | | | | | | | |
Adjusted EBITDA .................. | | | | | | | |
Our Toll Roads Adjusted EBITDA increased to EUR 918 million in 2024 from EUR 799 million in 2023, which was
primarily driven by traffic improvement , coupled with a rates increase in our Texas Managed Lanes (NTE 1-2, NTE
35W, LBJ, I-77 and I-66), along with the contributions of NTE 35W, after its segment 3C opened in June 2023.
Our Toll Roads Adjusted EBITDA increased to EUR 799 million in 2023 from EUR 550 million in 2022, which was
primarily driven by general traffic improvement as COVID-19 restrictions were lifted, coupled with a rates increase in
our Texas Managed Lanes (NTE 1-2, NTE 35W, LBJ, I-77 and I-66), along with the contributions of I-66 after it
opened in November 2022.
Our Construction Adjusted EBITDA increased to EUR 430 million in 2024 from EUR 211 million in 2023, which was
primarily driven by Budimex’s profitability supported by risk mitigations in the completion of contracts and due to the
completion of several large projects in the US in 2023.
Our Construction Adjusted EBITDA increased to EUR 211 million in 2023 from EUR 176 million in 2022, which was
primarily driven by Budimex’s profitability, indexation agreements and higher building and civil works volume,
partially offset by the completion of several large projects in the U.S. and the negative impact of a landslide in one of
our projects in Colombia as well as an increase of inflation impact on supply and subcontracting prices, partially offset
by price review formula compensation under some of our contracts.
Our Airports Adjusted EBITDA increased to EUR 26 million in 2024 from EUR 22 million in 2023, which was
primarily driven by improvements in the Dalaman airport’s operating performance.
Our Airports Adjusted EBITDA increased to a profit of EUR 22 million in 2023 from a loss of EUR 2 million in 2022,
which was primarily driven by the incorporation of Dalaman airport’s revenues following its consolidation into the
Group in July 2022.
Our Energy Adjusted EBITDA increased to EUR 2 million in 2024 from EUR 0 million in 2023, which was primarily
driven by Energy Infrastructure’s new project, Centella, starting operations in July 2024 and El Berrocal plant
operating the full year. This was partially offset, however, by higher overheads due to business growth in 2024.
Our Energy Adjusted EBITDA increased to EUR 0 million in 2023 from a loss of EUR 5 million in 2022, which was
primarily driven by the positive evolution of the energy solutions business line.
5.A.8.3Comparable or “Like-for-like” (“LfL”) Growth
Comparable Growth, also referred to as “Like-for-like” Growth (“LfL”), corresponds to the relative year-on- year
variation in comparable terms of the figures for revenues, Adjusted EBIT and Adjusted EBITDA. Comparable or
“Like-for-like” (“LfL”) Growth is a non-IFRS financial measure and should not be considered as an alternative to
revenues, net income or any other measure of our financial performance calculated in accordance with IFRS.
Comparable or “Like- for-like” (“LfL”) Growth is calculated by adjusting each year, in accordance with the following
rules:
▪Elimination of the exchange-rate effect, calculating the results of each period at the rate in the current period.
▪Elimination from Adjusted EBIT of each period the impact of fixed asset impairments.
▪In the case of disposals of any of our companies and loss of control thereto, elimination of the operating
results of the disposed company when the impact effectively occurred to achieve the homogenization of the
operating result.
▪Elimination of the restructuring costs in all periods.
▪In acquisitions of new companies which are considered material, elimination in the current period of the
operating results derived from those companies except in the case where this elimination is not possible due
to the high level of integration with other reporting units. Material companies are those whose revenues
represent ≥5% of the reporting unit’s revenues before the acquisition.
▪In the case of changes in the accounting model of a specific contract or asset, when material, application of
the same accounting model to the previous year’s operating result.
▪Elimination of other non-recurrent impacts (mainly related to tax and human resources) considered relevant
for a better understanding of our underlying results in all periods.
We use Comparable or “Like-for-like” (“LfL”) Growth to provide a more homogenous measure of the underlying
profitability of its businesses, excluding non-recurrent elements which would induce a misinterpretation of the
reported growth, impacts such as exchange-rate movements, or changes in the consolidation perimeter which distort
the comparability of the information. Additionally, we believe that it allows us to provide homogenous information for
better understanding of the performance of each of our businesses.
The following tables set forth a reconciliation of revenues on like-for-like basis to our revenues for the periods
indicated:
| | | |
| For the year ended December 31, |
| | | |
| |
| | | |
Exchange rate effect(1) ......................................................................................................... | | | |
Fixed asset impairments(2) ................................................................................................... | | | |
Operating results of disposed companies(3) ......................................................................... | | | |
Restructuring costs ............................................................................................................... | | | |
Operating results from new acquired companies(4) .............................................................. | | | |
Accounting model adjustments(5) ......................................................................................... | | | |
Non-current impact(6) ........................................................................................................... | | | |
Revenues Comparable (Like-for-like) ............................................................................. | | | |
(1)Calculation of the results of each period at the exchange rate in the current period.
(2)Elimination of the impact of fixed asset impairments.
(3)Elimination of the operating results of disposed companies when the impact effectively occurred.
(4)Elimination in the current period of the operating results derived from new material companies.
(5)Following the acquisitions of new companies which are considered material, elimination in the current period of the operating results
derived from those companies.
(6)Elimination of other non-recurrent impacts (mainly related to tax and human resources).
The following table sets forth a reconciliation of Adjusted EBIT on like-for-like basis to our net profit/(loss) for the
periods indicated:
| | | |
| For the year ended December 31, |
| | | |
| |
Net profit/(loss) ................................................................................................................... | | | |
Profit/(loss) net of tax from discontinued operations ........................................................... | | | |
Income tax/(expense) ........................................................................................................... | | | |
Share of profits of equity-accounted companies .................................................................. | | | |
Net financial income/(expense) ............................................................................................ | | | |
Impairment and disposal of fixed assets(1) ........................................................................... | | | |
Exchange rate effect(2) .......................................................................................................... | | | |
Operating results of disposed companies(3) .......................................................................... | | | |
Restructuring costs ............................................................................................................... | | | |
Operating results from new acquired companies(4) .............................................................. | | | |
Accounting model adjustments(5) ......................................................................................... | | | |
Non-current impact(6) ........................................................................................................... | | | |
Adjusted EBIT Comparable (Like-for-like) ................................................................... | | | |
(1)Primarily includes asset impairment and gains or losses on the purchase, sale and disposal of investment companies and associates.
(2)Calculation of the results of each period at the exchange rate in the current period.
(3)Elimination of the operating results of disposed companies when the impact effectively occurred.
(4)Elimination in the current period of the operating results derived from new material companies..
(5)Following the acquisitions of new companies which are considered material, elimination in the current period of the operating
results derived from those companies.
(6)Elimination of other non-recurrent impacts (mainly related to tax and human resources).
The following tables set forth a reconciliation of Adjusted EBITDA on like-for-like basis to our net profit/ (loss) for
the periods indicated:
| | | |
| For the year ended December 31, |
| | | |
| |
Net profit/(loss) .................................................................................................................. | | | |
Profit/(loss) net of tax from discontinued operations .......................................................... | | | |
Income tax/(expense) .......................................................................................................... | | | |
Share of profits of equity-accounted companies ................................................................. | | | |
Net financial income/(expense) ........................................................................................... | | | |
Impairment and disposal of fixed assets(1) .......................................................................... | | | |
Fixed asset depreciation(2) ................................................................................................... | | | |
Exchange rate effect(3) ........................................................................................................ | | | |
Operating results of disposed companies(4) ......................................................................... | | | |
Restructuring costs .............................................................................................................. | | | |
Operating results from new acquired companies(5) ............................................................. | | | |
Accounting model adjustments(6) ........................................................................................ | | | |
Non-current impact(7) .......................................................................................................... | | | |
Adjusted EBITDA Comparable (Like-for-like) ............................................................ | | | |
(1)Primarily includes asset impairment and gains or losses on the purchase, sale and disposal of investments companies and associates.
(2)Comprises mainly by depreciation relating to the Toll Roads and Construction Business Division. Increase (+10.0%) in the year ended
December 31, 2024 to EUR 441 million, as compared to the year ended December 31, 2023, and increase +34.1% in 2023 to EUR 401 million, as
compared to 2022.
(3)Calculation of the results of each period at the exchange rate in the current period.
(4)Elimination of the operating results of disposed companies when the impact effectively occurred.
(5)Elimination in the current period of the operating results derived from new material companies.
(6)Following the acquisitions of new companies which are considered material, elimination in the current period of the operating
results derived from those companies.
(7)Elimination of other non-recurrent impacts (mainly related to tax and human resources).
5.A.8.4Order Book
Order Book corresponds to our income which is pending execution corresponding to those contracts which we have
signed and over which we have certainty regarding their future execution. The Order Book is calculated by adding the
contracts of the actual year to the balance of the contract Order Book at the end of the previous year, less the income
recognized in the current year. The total income from a contract corresponds to the agreed price or rate corresponding
to the delivery of goods and/or the rendering of the contemplated services. If the execution of a contract is pending the
closure of financing, the income from said contract will not be added to the calculate the Order Book until said
financing is closed.
We use the Order Book as an indicator of our future income, as it reflects, for each contract, the final revenue minus
the net amount of work performed.
There is no comparable financial measure to the Order Book in IFRS. This reconciliation is based on the order book
value of a specific construction being comprised of its contracting value less the construction work completed, which
is the main component of the sales figure. Therefore, it is not possible to present a reconciliation of the Order Book to
our Financial Statements. We believe the difference between the construction work completed and the revenues
reported for the Construction Business Division in the Audited Financial Statements is attributable to the fact that
these are subject to, among others, the following adjustments: (i) consolidation adjustments, (ii) charges to joint
ventures, (iii) sale of machinery, and (iv) confirming income.
The following table sets forth the Construction Business Division Order Book as of December 31, 2024, 2023 and
2022:
| | | |
| |
| | | |
| |
Budimex ............................................................................................................. | | | |
Webber ................................................................................................................ | | | |
Ferrovial Construction(1)...................................................................................... | | | |
Construction ..................................................................................................... | | | |
(1)Order Book does not include Energy business as part of the new Energy Division since January 2024 (EUR 453 million in 2023; EUR
351 million in 2022).
Construction Order Book increased by 10.4% to EUR 16,755 million as of December 31, 2024 from EUR 15,179
million as of December 31, 2023 due to new project awards awarded to Budimex and Webber. For an overview of our
new projects, see “Item 4. Information on the Company—B. Business Overview—3. Group Overview—3. Our Business
Divisions—3. Construction Business Division.”. The Order Book breakdown by geography in 2024 was: U.S. &
Canada 49%; Poland 25%; Spain 14%; UK 4%; Australia 2%; and the rest of the world 6%.
Construction Order Book increased by 5.5% to EUR 15,179 million as of December 31, 2023 from EUR 14,392
million as of December 31, 2022 due to new projects project awards awarded to Budimex and Webber.
5.BLiquidity and Capital Resources
5.B.1Working capital statement
Our available working capital is, in our opinion, sufficient for our present requirements for at least twelve months
following the date of this Annual Report.
Our main material cash requirements for the next twelve months from known contractual and other obligations are
related to our committed investment in NTO at JFK for an amount of USD 267 million (EUR 258 million at the year-
end 2024 exchange rate) (see “—9. Future Material Investments and Anticipated Capital Expenditures”), the
corporate bond with a notional amount of EUR 500 million maturing on March 31, 2025 (see “—5. Ex- Infrastructure
project borrowings” and “—8. Financing —2. Ex- infrastructure project borrowings —1 Corporate Debt”) and the
potential payments related to the August 2024 Share Repurchase Program (see “Item 16.E Purchases of equity
securities by the issuer and affiliated purchasers”), with a total potential amount of EUR 600 million, of which EUR
271.7 million have been already paid in 2024. There are no significant infrastructure project debts maturities in 2025
(see —4. Infrastructure project borrowings).
We also expect that our sources of liquidity and available working capital will be sufficient to fund our long-term
contractual obligations and capital needs.
However, this is subject, to a certain extent, to general economic, financial, competitive, regulatory and other factors
that are beyond our control. If we are unable to generate sufficient cash flows from operations in the future, we may
have to obtain additional financing, which may include equity or debt issuances and/or credit financing. If we obtain
additional capital by issuing equity, the interests of our existing stockholders will be diluted and, if we incur additional
indebtedness, that indebtedness may contain significant financial and other covenants that may significantly restrict
our operations. We cannot assure you that we could obtain additional financing on favorable terms or at all.
5.B.2Cash flows
The following table presents primary components of our cash flow statement for each of the periods indicated. The
consolidated cash flow statement has been prepared in accordance with International Accounting Standard 7 (“IAS
7”).
| | | |
| For the year ended December 31, |
| |
| | | |
Cash flows from operating activities ...................................... | | | |
Cash flows from (used in) investing activities ....................... | | | |
Cash flows from (used in) financing activities ....................... | | | |
Cash and cash equivalents at the end of the period .......... | | | |
5.B.2.1Cash Flows from Operating Activities
Cash flows from operating activities increased by 2.4% to EUR 1,293 million in 2024 from EUR 1,263 million in
2023. This was driven by an increase in the contribution of the Construction Business Division, as large contracts in
the US came to an end, as well as the positive evolution of Managed Lanes, particularly NTE 35W, following the
opening of its segment 3C in June 2023. Cash flows were also impacted by higher dividends from our equity
accounted infrastructure companies, that amounted to EUR 363 million in 2024 (EUR 324 million in 2023) mainly due
to higher dividends from 407 ETR.
Dividends received from infrastructure project companies consolidated by global consolidation that were eliminated in
the consolidation process were EUR 584 million (EUR 417 million in 2023). Total dividends received from
infrastructure project companies were EUR 947 million (EUR 741 million in 2023), being the main contributor our
Toll Roads Business Division with EUR 895 million, including the first dividend received from I-77 and I-66 and
dividends from 407 ETR, NTE 35W and NTE.
Cash flows from operating activities increased by 26.0% to EUR 1,263 million in 2023 from EUR 1,002 million in
2022. This was primarily driven by an increase in the contribution of the Construction Business Division, which had
higher collections in Spain and other geographies such as Australia, as well as increases in the contributions of the
Toll Roads and Airports Business Divisions following the opening of the toll road I-66 in November 2022 and
consolidation of the Dalaman airport into the Group in July 2022. The increase was also impacted by higher dividends
from our equity accounted infrastructure companies, that amounted to EUR 324 million in 2023 (EUR 284 million in
2022) mainly due to the increase of dividends from 407 ETR.
Dividends received from infrastructure project companies consolidated by global consolidation that were eliminated in
the consolidation process were EUR 417 million (EUR 191 million in 2022). Total dividends received from
infrastructure project companies were EUR 741 million (EUR 475 million in 2022), being the main contributor our
Toll Roads Business Division with EUR 704 million, highlighting dividends received from 407 ETR, NTE 35W and
NTE.
5.B.2.2Cash Flows from (Used in) Investing Activities
Cash flows from (used in) investing activities increased to an inflow of EUR 1,313 million in 2024 from an outflow of
EUR 425 million in 2023. This was primarily driven by higher divestments in 2024, which amounted to EUR 2,582
million, and related mainly the divestment of the Group’s 19.75% stake in Heathrow airport for EUR 2,004 million,
the sale of a 5% stake in our infrastructure company IRB for EUR 211 million, the termination of the vendor loan
related to the Amey divestment in 2022 for EUR 176 million, and the completion of the sale of our services
infrastructure business in Spain for EUR 40 million. These impacts were offset by higher investments, which
amounted to EUR 1,286 million in 2024 (EUR 257 million in 2023), and mainly related to acquisitions of companies
in 2024, mainly the 23.99% stake in Private InvIT for EUR 652 million a subsequent investment of EUR 58 million in
December 2024, and the equity investments in NTO of EUR 469 million.
Investments in equity in our infrastructure project companies consolidated by global consolidation that were
eliminated in the consolidation process were EUR 79 million (EUR 111 million in 2023). Total investments in equity
in our infrastructure project companies and acquisition of companies in 2024 amounted to EUR 186 million (EUR 319
million in 2023).
Cash flows from (used in) investing activities decreased to an outflow of EUR 425 million in 2023 from an inflow of
EUR 732 million in 2022. This was primarily driven by lower capital expenditures in construction of new
infrastructure projects in 2023, mainly due to I-66 and segment 3C of NTE 35W opening in November 2022 and June
2023, respectively. Additionally, our cash flows (used in) investing activities were positively impacted by interest
received due to the global increase in interest rates in comparison to the previous year. Part of those impacts were
offset by the lower divestments in 2023 (EUR 43 million from Azores divestment) in comparison with 2022, that was
impacted by the sale of Amey for GBP 265 million in December 2022 and our Spanish infrastructure services business
for EUR 175 in January 2022. Our investments in associates (that were exclusively to infrastructure project
companies) amounted to EUR 257 million in 2023 (EUR 347 million in 2022) mainly related to equity investments in
NTO.
Investments in equity in our infrastructure project companies consolidated by global consolidation that were
eliminated in the consolidation process were EUR 111 million (EUR 414 million in 2022). Total investments in equity
in our infrastructure project companies and acquisition of companies in 2023 amounted to EUR 368 million (EUR 761
million in 2022).
5.B.2.3Cash Flows from (Used in) Financing Activities
Cash flows (used in) financing activities increased to an outflow of EUR 2,591 million in 2024 from an outflow of
EUR 1,305 million in 2023. This change was primarily attributed to an increase in shareholder distributions in 2024,
amounting to EUR 831 million in 2024 compared to EUR 250 million in 2023, including cash dividend payment of
EUR 130 million and treasury share repurchase of EUR 701 million from the share buy-back program announced in
November 2023 together with the share buy-back program announced in May 2024. Additionally, EUR 272 million of
treasury shares acquisition following the announcement of the share repurchase program in August 2024 (for more
information regarding our treasury shares repurchases please see “Item 16E. Purchases of Equity Securities by the
Issuer and Affiliated Purchasers”). Finally, changes in corporate debt due to Euro Commercial Paper repayment and
bond amortization in July 2024.
Cash flows (used in) financing activities decreased to an outflow of EUR 1,305 million in 2023 from an outflow of
EUR 316 million in 2022. This change was mainly driven by our repurchase of the hybrid bond in 2023 (for EUR 513
million), partially offset by the decrease in shareholder distributions compared to the previous year.
5.B.3Financial Indebtedness
For a detailed breakdown of our Consolidated Net Debt, see “—6. Non-IFRS Measures: Liquidity and Capital
Resources—1. Consolidated Net Debt.”
5.B.4Infrastructure project borrowings
The following table sets forth our total infrastructure project borrowings as of the periods indicated. In January 2024,
we conducted a partial reorganization of our Business Divisions (for further information, see “Item 4. Information on
the Company —B.Business Overview —1. Overview” and Note 1.5 (Segment Reporting) to the Audited Financial
Statements). Information presented in this Annual Report for historical periods prior to the segment change has been
revised to reflect the partial reorganization.
| | | | | | |
| |
| | |
| | | | | | |
| |
Long term ................................................ | | | | | | |
Toll roads ................................................. | | | | | | |
U.S. toll roads......................................... | | | | | | |
Spanish toll roads ................................... | | | | | | |
Other concessions .................................. | | | | | | |
Airports .................................................... | | | | | | |
Construction ............................................ | | | | | | |
Energy ...................................................... | | | | | | |
Other ........................................................ | | | | | | |
Short term ................................................ | | | | | | |
Toll Roads ................................................ | | | | | | |
U.S. toll roads......................................... | | | | | | |
Spanish toll roads ................................... | | | | | | |
Other concessions .................................. | | | | | | |
Airports .................................................... | | | | | | |
Construction ............................................ | | | | | | |
Energy ...................................................... | | | | | | |
Other ........................................................ | | | | | | |
Total ......................................................... | | | | | | |
The following table presents the maturity of our infrastructure project borrowings as of December 31, 2024:
| | | | | | | | | | |
| | | | | | | | | | |
| | | | | | |
Infrastructure project obligations .............................. | | | | | | | | | | |
Toll roads .............................. | | | | | | | | | | |
USD ....................................... | | | | | | | | | | |
EUR ...................................... | | | | | | | | | | |
Bank borrowings of infrastructure project companies ................................ | | | | | | | | | | |
Toll roads .............................. | | | | | | | | | | |
USD ....................................... | | | | | | | | | | |
EUR ....................................... | | | | | | | | | | |
Airports .................................. | | | | | | | | | | |
EUR ...................................... | | | | | | | | | | |
Construction .......................... | | | | | | | | | | |
EUR ....................................... | | | | | | | | | | |
PLN ........................................ | | | | | | | | | | |
Energy ................................... | | | | | | | | | | |
EUR ...................................... | | | | | | | | | | |
USD ....................................... | | | | | | | | | | |
Other ...................................... | | | | | | | | | | |
GBP ....................................... | | | | | | | | | | |
Total infrastructure project borrowings .............................. | | | | | | | | | | |
5.B.5Ex-infrastructure project borrowings
The following table sets forth our total ex-infrastructure project borrowings as of the periods indicated:
| | | | | | |
| |
| | |
| | | | | | |
| |
Corporate bonds and debentures ............................................ | | | | | | |
Euro Commercial Paper ......................................................... | | | | | | |
Corporate liquidity lines ........................................................ | | | | | | |
Other borrowings ................................................................... | | | | | | |
Total financial borrowings excluding infrastructure project companies ................................................................ | | | | | | |
The following table presents the maturity of our ex-infrastructure project borrowings as of December 31, 2024:
| | | | | | | | | |
| | | | | | | | | |
| | | | | |
Corporate debt .............................. | | | | | | | | | |
EUR ................................................ | | | | | | | | | |
Other borrowings ......................... | | | | | | | | | |
EUR ................................................ | | | | | | | | | |
PLN ................................................ | | | | | | | | | |
CLP................................................. | | | | | | | | | |
Other ............................................... | | | | | | | | | |
Total financial borrowing excluding infrastructure project companies ...................................... | | | | | | | | | |
5.B.6Non-IFRS Measures: Liquidity and Capital Resources
In considering the financial performance of the business, we analyze certain measures of liquidity and capital
resources not defined by, or calculated in accordance with, IFRS-IASB: Consolidated Net Debt, Cash flows excluding
infrastructure projects (Ex-Infrastructure Cash Flows), Cash flows from infrastructure projects (Infrastructure Cash
Flows),and Ex-Infrastructure Liquidity. Those measures are not audited and are not a substitute for, or superior to,
reported results presented in accordance with IFRS-IASB.
These non-IFRS measures should not be considered as alternatives to consolidated result for the period, operating
result, revenue, cash generated from operating activities or any other performance measures derived in accordance
with IFRS-IASB as measures of operating performance or operating cash flows or liquidity. We believe that these
non-IFRS measures are metrics commonly used by investors to evaluate our performance and that of our competitors.
We further believe that the disclosure of these non-IFRS measures is useful to investors, as these non-IFRS measures
form the basis of how our executive team and the Board evaluate our performance. By disclosing these non-IFRS
measures, we believe that we create for investors a greater understanding of, and an enhanced level of transparency
into, some of the means by which our management team operates and evaluates us and facilitates comparisons of the
current period’s results with prior periods.
For non-IFRS measures relating to our operating results, see “—A. Operating Results—8. Non-IFRS Measures:
Operating Results.”
5.B.6.1Consolidated Net Debt
Consolidated Net Debt corresponds to our balance of cash and cash equivalents minus short and long-term borrowings
and other financial items that include our non-current restricted cash, the balance related to exchange-rate derivatives
(covering both the debt issuance in currency other than the currency used by the issuing company, through forward
hedging derivatives, and cash positions that are exposed to exchange rate risk, through cross currency swaps) and
other short term financial assets. Lease liabilities are not part of the Consolidated Net Debt. Consolidated Net Debt is a
non-IFRS financial measure and should not be considered as an alternative to net income or any other measure of our
financial performance calculated in accordance with IFRS.
We further break down our Consolidated Net Debt into two categories:
◦Consolidated Net Debt of infrastructure project companies: corresponds to our infrastructure project
companies, which has no recourse to us, as a shareholder, or with recourse limited to the guarantees issued.
◦Consolidated Net Debt of ex-infrastructure project companies: corresponds to our other businesses,
including our holding companies and other companies that are not considered infrastructure project
companies. The debt included in this category generally has recourse to the Group.
We also discuss the evolution of our Consolidated Net Debt during any relevant period and split it into two categories:
(i) Consolidated Net Debt of ex-infrastructure project companies and (ii) Consolidated Net Debt of infrastructure
project companies, separated into the following items:
1.change in cash and cash equivalents, as reported in our consolidated cash flows statement for the relevant
period;
2.change of our short and long-term borrowings for the relevant period; and
3.change in additional financial items that we consider part of our Consolidated Net Debt, including changes
of non-current restricted cash, changes in balance related to exchange-rate derivatives, changes in intragroup
position balances and changes in other short-term financial assets.
We use Consolidated Net Debt to explain the evolution of our global indebtedness and to assist our management in
making decisions related to our financial structure.
We also separate Consolidated Net Debt into Consolidated Net Debt of ex-infrastructure project companies and
infrastructure project companies, as we find it helpful for investors and rating agencies to show the evolution of our
Consolidated Net Debt of excluding infrastructure project companies, because the debt of infrastructure project
companies has: (i) no recourse to the Group Companies or (ii) the recourse is limited to guarantees issued by other
Group Companies. Net Debt of ex- infrastructure project companies is used by analysts and rating agencies to better
understand the indebtedness that has recourse to the Group. For investors and rating agencies, it is important to clearly
see and understand whether the rest of the Group is under any obligation to inject capital to repay the debt or cure any
potential covenant breach if any of the Group’s infrastructure project companies underperform.
Additionally, our equity investors track performance of our infrastructure project companies on a cash basis, namely
dividends received and capital invested, that are not shown in our change in cash and cash equivalents reported in our
consolidated cash flow statement. Similarly, our debt investors need to know the dividends received from
infrastructure project companies, as the key parameters for the rating of corporate bonds are cash flows of ex-
infrastructure project companies (the main contributor of which is dividends from infrastructure project companies)
and net debt of the ex-infrastructure project companies.
We allocate amounts from the different components of Consolidated Net Debt and its evolution, specifically cash flow
as reported in IAS 7, between infrastructure project companies and ex-infrastructure project companies as follows:
◦Our consolidated subsidiaries and our equity-accounted companies are classified as infrastructure project
companies (infrastructure project companies) or not infrastructure project companies (ex-infrastructure
project companies). These two categories are not simultaneously applied to the same company (i.e., any given
company is either categorized as an infrastructure project company or an ex-infrastructure project company,
but it cannot be both).
◦We include as ex-infrastructure project companies all companies (whether consolidated or accounted for as
equity-accounted companies) dedicated to construction activities, companies providing services to the rest of
the group, and holding companies (including those that are direct shareholders of infrastructure project
companies).
◦We include as infrastructure project companies, all companies (whether consolidated or accounted for as
equity-accounted companies) that meet the definition of “infrastructure project companies” as this is stated in
our annual reports: specifically, they are companies, which are part of our toll roads, airports, energy and
construction businesses. Appendix I to our Consolidated Financial Statements as of December 31, 2024 and
2023 and for the years ended December 31, 2024, 2023 and 2022, includes a complete list of our subsidiaries
and associate companies, including details of all companies classified as infrastructure project companies,
which are identified with a “P” in the “Type” column.
Specifically, cash flows of ex-infrastructure project companies are comprised of the cash flows generated by all
companies classified as ex-infrastructure project companies, after the elimination of transactions between ex-
infrastructure project companies. Cash flows of infrastructure project companies are comprised of the cash flows
generated by all companies classified as infrastructure project companies, after the elimination of transactions between
infrastructure project companies.
The key distinction in the classification between cash flows of ex-infrastructure project companies and cash flows of
infrastructure project companies is the treatment of intercompany transactions between ex-infrastructure project
companies and infrastructure project companies. These intercompany transactions are comprised of dividends paid by
infrastructure project companies to ex-infrastructure project companies and investments of equity paid by ex-
infrastructure project companies to infrastructure project companies. We treat these transactions as follows:
◦Dividends received by ex-infrastructure project companies from infrastructure project companies are
classified as cash flows from operations ex-infrastructure project companies;
◦Dividends paid by infrastructure project companies to ex-infrastructure project companies are classified as
cash flows from financing of infrastructure project companies;
◦Equity investment paid by ex-infrastructure project companies to infrastructure project companies are
classified as cash flows from investments ex-infrastructure project companies; and
◦Equity investment received by infrastructure project companies from ex-infrastructure project companies are
classified as cash flows from financing of infrastructure project companies.
These dividends include dividends and other similar items, comprising (i) interest on shareholder loans and (ii)
repayments of capital and shareholder loans.
The equity investment includes the cash invested by the Group in infrastructure project companies through capital
contributions or other similar financial instruments such as shareholder loans. These intercompany transactions are
eliminated in the consolidated cash flows.
The following table sets forth a reconciliation of Consolidated Net Debt to our cash and cash equivalents for the
periods indicated:
| | | |
| |
| | | |
| |
Cash and cash equivalents excluding infrastructure projects ........................... | | | |
Short and long-term borrowings ....................................................................... | | | |
Non-current restricted cash ............................................................................... | | | |
Forwards hedging balances .............................................................................. | | | |
Cross currency swaps balances ......................................................................... | | | |
Intragroup position balances (*) ....................................................................... | | | |
Other short term financial assets ...................................................................... | | | |
CONSOLIDATED NET DEBT OF EX-INFRASTRUCTURE PROJECT COMPANIES .............................................................................. | | | |
Cash and cash equivalents from infrastructure projects ................................... | | | |
Short and long-term borrowings ....................................................................... | | | |
Non- current restricted cash .............................................................................. | | | |
Intragroup position balances (*) ....................................................................... | | | |
CONSOLIDATED NET DEBT OF INFRASTRUCTURE PROJECT COMPANIES .................................................................................................. | | | |
CONSOLIDATED NET DEBT ..................................................................... | | | |
(*) Intragroup balances are comprised of financial assets (cash) and liabilities (borrowings) between our ex-infrastructure project companies and
infrastructure project companies that are eliminated in the consolidation process and therefore have no impact on our Consolidated Net Debt.
The following tables present, for the periods indicated, the changes in Consolidated Net Debt (including separation by
ex-infrastructure project companies and infrastructure project companies), as well as the breakdown of our statement
of cash flows into cash flows of ex-infrastructure project companies, cash flows of infrastructure project companies
and intercompany eliminations.
| | | | |
| |
| Change in Consolidated Net Debt (1+2+3) | Ex- infrastructure project companies (1) | Infrastructure project companies (2) | Intercompany eliminations (3) |
| |
Cash flow from operating activities ..................................................................... | | | | |
Cash flow from/ (used in) investing activities ..................................................... | | | | |
Cash flow from/ (used in) financing activities ..................................................... | | | | |
Effect of exchange rate on cash and cash equivalents ......................................... | | | | |
Change in cash and cash equivalents due to consolidation scope changes .......... | | | | |
Change in cash and cash equivalents from assets held for sale ........................... | | | | |
Cash Flows (Change in cash and cash equivalents) (A) ................................. | | | | |
Change in short and long-term borrowings (B) .............................................. | | | | |
Change in Non-current restricted cash ................................................................. | | | | |
Change in Forwards hedging balances ................................................................ | | | | |
Change in Cross currency swaps balances ........................................................... | | | | |
Change in Intragroup balances ............................................................................. | | | | |
Change in other short term financial assets ......................................................... | | | | |
Other changes in Consolidated Net Debt (C) .................................................. | | | | |
CHANGE IN CONSOLIDATED NET DEBT (C+B-A) .................. | | | | |
CONSOLIDATED NET DEBT AT BEGINNING OF YEAR (*) ... | | | | |
CONSOLIDATED NET DEBT AT YEAR-END (*) ........................ | | | | |
(*) For the reconciliation of Consolidated Net Debt, a non-IFRS measure, to our cash and cash equivalents see the “reconciliation of Consolidated
Net Debt to our cash and cash equivalents” table above.
(A) Figures in this line item represent change in cash flow figures as reported in our consolidated cash flow statements, as well as the change in
cash and cash equivalents ex-infrastructure project companies and change in cash and cash equivalents of infrastructure project companies.
(B) Figures in this line item represent the change in our short and long-term borrowings included in our Consolidated Statement of Financial
Position.
(C) Figures in this line item represent: the changes of non-current restricted cash, the changes related to exchange-rate derivatives balances
(including forwards and cross currency swaps), the changes in our Intragroup balances related to financial assets and liabilities between our ex-
infrastructure project companies and infrastructure project companies with no impact on our Consolidated Net Debt, and changes in other short-term
financial assets.
(1) Ex-infrastructure project companies column includes the change in cash and cash equivalents of our ex-infrastructure project companies. Cash
flows from (used in) operating activities include dividends received from infrastructure project companies that are globally consolidated and cash
flows from (used in) investing activities includes the equity investment by the Group in infrastructure project companies that are globally
consolidated. These dividends received and equity investments are eliminated in column Intercompany eliminations.
(2) Infrastructure project companies column includes the change in cash and cash equivalents of our infrastructure project companies. Cash flows
from (used in) financing include the dividends paid to shareholders (which include the Group Companies that are not infrastructure project
companies), as well as the equity investment received from its shareholders. These dividends paid and equity investments received are eliminated in
column Intercompany eliminations.
(3) Intercompany eliminations include eliminations either of the dividends or equity investment, as applicable, of infrastructure project companies
that are consolidated on the Group level. Specifically, it includes EUR (539) million dividends paid by infrastructure project companies within our
toll roads division: I-77 EUR (205) million, NTE EUR (103) million, I-66 EUR (89) million, LBJ EUR (54) million, from our Construction division
EUR (34) million and other minor dividends from toll roads and Energy divisions. It also includes equity investments of EUR 79 million, mainly
invested in energy infrastructure project Azalia and Leon and other minor investments in Airports.
| | | | |
| |
| Change in Consolidated Net Debt (1+2+3) | Ex- infrastructure project companies (1) | Infrastructure project companies (2) | Intercompany eliminations (3) |
| |
Cash flow from operating activities ..................................................................... | | | | |
Cash flow from/ (used in) investing activities ..................................................... | | | | |
Cash flow from/ (used in) financing activities ..................................................... | | | | |
Effect of exchange rate on cash and cash equivalents ......................................... | | | | |
Change in cash and cash equivalents due to consolidation scope changes .......... | | | | |
Change in cash and cash equivalents from assets held for sale ........................... | | | | |
Cash Flows (Change in cash and cash equivalents) (A) ................................. | | | | |
Change in short and long-term borrowings (B) .............................................. | | | | |
Change in Non-current restricted cash ................................................................. | | | | |
Change in Forwards hedging balances ................................................................ | | | | |
Change in Cross currency swaps balances ........................................................... | | | | |
Change in Intragroup balances ............................................................................. | | | | |
Change in other short term financial assets ......................................................... | | | | |
Other changes in Consolidated Net Debt (C) .................................................. | | | | |
CHANGE IN CONSOLIDATED NET DEBT (C+B-A) .................. | | | | |
CONSOLIDATED NET DEBT AT BEGINNING OF YEAR (*) ... | | | | |
CONSOLIDATED NET DEBT AT YEAR-END (*) ........................ | | | | |
(*) For the reconciliation of Consolidated Net Debt, a non-IFRS measure, to our cash and cash equivalents see the “reconciliation of Consolidated
Net Debt to our cash and cash equivalents” table above.
(A) Figures in this line item represent change in cash flow figures as reported in our consolidated cash flow statements, as well as the change in
cash and cash equivalents ex-infrastructure project companies and change in cash and cash equivalents of infrastructure project companies.
(B) Figures in this line item represent the change in our short and long-term borrowings included in our Consolidated Statement of Financial
Position.
(C) Figures in this line item represent: the changes of non-current restricted cash, the changes related to exchange-rate derivatives balances
(including forwards and cross currency swaps), the changes in our Intragroup balances related to financial assets and liabilities between our ex-
infrastructure project companies and infrastructure project companies with no impact on our Consolidated Net Debt, and changes in other short-term
financial assets.
(1) Ex-infrastructure project companies column includes the change in cash and cash equivalents of our ex-infrastructure project companies. Cash
flows from (used in) operating activities include dividends received from infrastructure project companies that are globally consolidated and cash
flows from (used in) investing activities includes the equity investment by the Group in infrastructure project companies that are globally
consolidated. These dividends received and equity investments are eliminated in column Intercompany eliminations.
(2) Infrastructure project companies column includes the change in cash and cash equivalents of our infrastructure project companies. Cash flows
from (used in) financing include the dividends paid to shareholders (which include the Group Companies that are not infrastructure project
companies), as well as the equity investment received from its shareholders. These dividends paid and equity investments received are eliminated in
column Intercompany eliminations.
(3) Intercompany eliminations include eliminations either of the dividends or equity investment, as applicable, of infrastructure project companies
that are consolidated on the Group level. Specifically, it includes EUR (417) million dividends paid by infrastructure project companies within our
toll roads division: NTE 35W EUR (251) million, NTE EUR (109) million, LBJ EUR (37) million, from our Energy division, EUR (18) million
coming from El Berrocal renewable energy generation plant and other minor dividends. It also includes equity investments of EUR 104 million,
invested in toll roads infrastructure project companies I-66 EUR 53 million, segment 3C of NTE 35W EUR 35 million, as well as in Centella project
EUR 10 million and El Berrocal plant EUR 3 million and other minor investments.
| | | | |
| |
| Change in Consolidated Net Debt (1+2+3) | Ex- infrastructure project companies (1) | Infrastructure project companies (2) | Intercompany eliminations (3) |
| |
Cash flow from operating activities ..................................................................... | | | | |
Cash flow from/ (used in) investing activities ..................................................... | | | | |
Cash flow from/ (used in) financing activities ..................................................... | | | | |
Effect of exchange rate on cash and cash equivalents ......................................... | | | | |
Change in cash and cash equivalents due to consolidation scope changes .......... | | | | |
Change in cash and cash equivalents from assets held for sale ........................... | | | | |
Cash Flows (Change in cash and cash equivalents) (A) ................................. | | | | |
Change in short and long-term borrowings (B) .............................................. | | | | |
Change in Non-current restricted cash ................................................................. | | | | |
Change in Forwards hedging balances ................................................................ | | | | |
Change in Cross currency swaps balances ........................................................... | | | | |
Change in Intragroup balances ............................................................................. | | | | |
Change in other short term financial assets ......................................................... | | | | |
Other changes in Consolidated Net Debt (C) .................................................. | | | | |
CHANGE IN CONSOLIDATED NET DEBT (C+B-A) .................. | | | | |
CONSOLIDATED NET DEBT AT BEGINNING OF YEAR (*) ... | | | | |
CONSOLIDATED NET DEBT AT YEAR-END (*) ........................ | | | | |
(*) For the reconciliation of Consolidated Net Debt, a non-IFRS measure, to our cash and cash equivalents see the “reconciliation of Consolidated
Net Debt to our cash and cash equivalents” table above.
(A) Figures in this line item represent change in cash flow figures as reported in our consolidated cash flow statements, as well as the change in
cash and cash equivalents ex-infrastructure project companies and change in cash and cash equivalents of infrastructure project companies.
(B) Figures in this line item represent the change in our short and long-term borrowings included in our Consolidated Statement of Financial
Position.
(C) Figures in this line item represent: the changes of non-current restricted cash, the changes related to exchange-rate derivatives balances
(including forwards and cross currency swaps), the changes in our Intragroup balances related to financial assets and liabilities between our ex
infrastructure project companies and infrastructure project companies with no impact on our Consolidated Net Debt, and changes in other short-term
financial assets.
(1) Ex-infrastructure project companies column includes the change in cash and cash equivalents of our ex-infrastructure project companies. Cash
flows from (used in) operating activities include dividends received from infrastructure project companies that are globally consolidated and cash
flows from (used in) investing activities includes the equity investment by the Group in infrastructure project companies that are globally
consolidated. These dividends received and equity investments are eliminated in column Intercompany eliminations.
(2) Infrastructure project companies column includes the change in cash and cash equivalents of our infrastructure project companies. Cash flows
from (used in) financing include the dividends paid to shareholders (which include the Group Companies that are not infrastructure project
companies), as well as the equity investment received from its shareholders. These dividends paid and equity investments received are eliminated in
column Intercompany eliminations.
(3) Intercompany eliminations include eliminations either of the dividends or equity investment, as applicable, of infrastructure project companies
that are consolidated on the Group level. Specifically, it includes EUR (191) million dividends paid by infrastructure project companies within our
toll roads division from NTE EUR (92) million and LBJ EUR (31) million and from our Energy division, EUR (51) million coming from Trasnchile
and other minor dividends. It also includes equity investments of EUR 410 million, invested in toll roads and segment 3C of NTE 35W EUR 46
million, as well as in El Berrocal EUR 27 million and other minor investments.
Change in Consolidated Net Debt
Our Consolidated Net Debt increased by EUR 82 million to EUR 6,061 million at December 31, 2024, from EUR
5,979 million at December 31, 2023. This increase was driven by a net cash increase of EUR 674 million of our
Consolidated Net Debt of ex-infrastructure project companies to EUR (1,794) million at December 31, 2023 from
EUR (1,121) million at December 31, 2023, in addition to a decrease of EUR 756 million in our Consolidated Net
Debt of infrastructure project companies to EUR 7,856 million at December 31, 2024 from EUR 7,100 million at
December 31, 2023.
Our Consolidated Net Debt increased by EUR 198 million to EUR 5,979 million at December 31, 2023, from EUR
5,781 million at December 31, 2022. This increase was driven by a net cash reduction of EUR 318 million of our
Consolidated Net Debt of ex-infrastructure project companies to EUR (1,121) million at December 31, 2023 from
EUR (1,439) million at December 31, 2022, which was partially offset by a decrease of EUR (119) million in our
Consolidated Net Debt of infrastructure project companies to EUR 7,100 million at December 31, 2023 from EUR
7,219 million at December 31, 2022.
Change in Consolidated Net Debt ex-infrastructure project companies
The EUR 674 million net cash increase in our Consolidated Net Debt of ex-infrastructure project companies in 2024
was affected by the positive cash flows (used in) investing activities, mainly the divestment of the Group’s 19.75%
stake in HAH for EUR 2,004 million. Additionally, negative cash flows (used in) financing activities partially offset
this impact, driven by higher shareholder distributions.
The EUR 318 million net cash reduction in our Consolidated Net Debt of ex-infrastructure project companies in 2023
was affected by the negative cash flows (used in) financing activities, driven, in turn, by the repurchase of the hybrid
bond in 2023 for EUR 513 million and the shareholders remuneration, partially offset by the positive cash flow from
operating activities.
Cash flow from operating activities ex-infrastructure projects companies
Cash flows from operating activities ex-infrastructure project companies increased to an inflow of EUR 861 million in
2024 as compared to an inflow of EUR 791 million in 2023. This was primarily driven by higher dividends received
from our infrastructure project companies, being the main contributor our Toll Roads Business Division, with EUR
895 million from dividends received from I-66 (EUR 89 million) and I-77 (EUR 205 million). This was partially offset
by a higher tax impact in 2024, that amounted to EUR 192 million, mainly from our Toll Roads Business Division
withholding tax payments in Canada.
The rest of cash flows from operating activities excluding infrastructure projects were mainly related by corporate
offices overheads and contributions from other minor activities.
Cash flows from operating activities ex-infrastructure project companies increased to an inflow of EUR 791 million in
2023 as compared to an inflow of EUR 565 million in 2022. This was primarily driven by dividends received from our
infrastructure project companies, that amounted to EUR 741 million (of which EUR 417 million corresponded to
infrastructure project companies that we consolidate globally and that are eliminated in our Consolidated Cash Flows),
being the main contributor our Toll Roads division with EUR 704 million, highlighting dividends received from 407
ETR, NTE 35W and NTE (EUR 475 million in 2022, of which EUR 388 million from Toll Roads division); and the
cash flows from our Construction Division, that amounted to EUR 332 million, primarily driven by Budimex
performance and cash received in advance in relevant contracts, such us the Ontario Line of the Toronto Metro. The
rest of cash flows from operating activities excluding infrastructure projects were mainly related by corporate offices
overheads and contributions from other minor activities.
Cash flows (used in) investing activities excluding infrastructure project companies
Cash flows (used in) investing activities ex-infrastructure project companies increased to an outflow of EUR 1,161
million in 2024 from an outflow of EUR 184 million in 2023. This change was mainly due to higher divestments in
2024, with the the sale of 19.75% of the share capital of FGP Topco Limited, which is the direct shareholder of HAH,
the owner of Heathrow airport for EUR 2,004 million, the sale of a 5% stake in our infrastructure company IRB for
EUR 211 million, the termination of the vendor loan related to the Amey divestment in 2022 for EUR 176 million, and
the completion of the sale of our services infrastructure business in Spain for EUR 40 million, which was partially
offset by our investment in our infrastructure project companies and acquisition of companies in 2024 which amounted
to EUR (1,591), mainly the acquired 23.99% stake on March 2024 in Private InvIT for EUR 652 million, and the
subsequent investment of EUR 57.6 million in December 2024, and the equity investments in NTO JFK of EUR 469
million.
Cash flows (used in) investing activities ex-infrastructure project companies increased to an outflow of EUR 184
million in 2023 from an outflow of EUR 421 million in 2022. This change was mainly due to the sale of the Amey to
One Equity Partners for EUR 301 million and the Spanish infrastructure services business to Portobello for EUR 175
million in 2022, which was partially offset by the lower investments in Toll Roads Business Division and the positive
interest inflow derived from cash remuneration improvements in 2023. Specifically, our investment in our
infrastructure project companies and acquisition of companies in 2023 amounted to EUR (368) million (of which EUR
(111) million corresponded to infrastructure project companies that we consolidate globally and that are eliminated in
our Consolidated Cash Flows), primarily in NTO JFK, I-66 and NTE 35W Segment C projects.
Cash flows (used in) financing activities ex-infrastructure project companies
Cash flows (used in) financing activities ex-infrastructure project companies increased to an outflow of EUR 1,975
million in 2024 from an outflow of EUR 1,146 million in 2023. This change was mainly driven by higher shareholder
distributions in 2024, including cash dividend payment of EUR 130 million and treasury share repurchase of EUR 701
million from the share buy-back program announced in November 2023 together with the share buy-back program
announced in May 2024. Additionally, EUR 272 million of treasury shares acquisition following the announcement of
the share repurchase program in August 2024 (for more information regarding our treasury shares repurchases please
see “Item 16E. Purchases of Equity Securities by the Issuer and Affiliated Purchasers”). Finally, changes in corporate
debt due to Euro Commercial Paper repayment and bond amortization in July 2024.
Cash flows (used in) financing activities ex-infrastructure project companies decreased to an outflow of EUR 1,146
million in 2023 from an outflow of EUR 140 million in 2022. This change was mainly driven by the repurchase of our
hybrid bond (EUR 513 million) and lower external corporate borrowings in 2023, which was partially offset by the
higher shareholder distributions in 2022.
Effect of exchange rate on cash and cash equivalents ex-infrastructure project companies
The positive impact of effect of exchange rate on cash and cash equivalents of EUR 54 million in 2024 was primarily
driven by the US dollars offset by cash impact from exchange rate derivatives covering Canadian dollars.
The positive impact of effect of exchange rate on cash and cash equivalents of EUR 161 million in 2023 was primarily
driven by the cash impact from exchange rate derivatives covering Canadian dollars.
Change in cash and cash equivalents from assets held for sale ex-infrastructure project companies
The change in cash and cash equivalents from assets held for sale in 2024 was explained by the divestment of the M3
Eurolink and M4 Eurolink motorways in Ireland; the M8-M73-M74 motorway in Scotland, the 407 East Extension
Phase 1 and 407 East Extension Phase 2 in Canada; Serrano Park and Autovía de la Plata (A-66) in Spain and El
Berrocal being reclassified as asset held for sale in December 31, 2024. In 2023, there were no assets held for sale.
Change in short and long-term borrowings ex-infrastructure project companies
The decrease EUR 561 million in 2024 in our short and long-term borrowings ex-infrastructure project companies was
mainly explained by a reduction in our Euro commercial paper volume of EUR 251 million and the amortization of
EUR 300 million bonds in July 2024.
The reduction EUR 236 million in our short and long-term borrowings ex-infrastructure project companies in 2023
was explained by a reduction in our corporate liquidity lines of EUR 509 million and a reduction in our Euro
commercial paper volume of EUR 196 million, partially offset by the issuance of sustainability-linked bond amounting
to EUR 500 million issued on September 10, 2023.
Other changes in Consolidated Net Debt ex-infrastructure project companies
The other changes in Consolidated Net Debt were primarily driven by the fair value impact on our statement of
financial positions of our forward derivatives, in 2024, 2023 and 2022.
Change in Consolidated Net Debt of infrastructure project companies
The increase of EUR 756 million in our Consolidated Net Debt of infrastructure project companies in 2024 was
primarily driven by the additional debt issued for I-77 toll road and the foreign exchange impact in our US projects
debt.
The decrease of EUR 120 million in our Consolidated Net Debt of infrastructure project companies in 2023 was
primarily driven by the consolidation scope change after the Azores divestment and the foreign exchange impact in
our US projects debt, partially offset by additional debt issued at NTE 35W project.
Cash flows from operating activities from infrastructure project companies
Cash flows from operating activities from infrastructure project companies increased to EUR 1,016 million in 2024 as
compared to EUR 890 million in 2023. This was primarily driven by the positive evolution of Managed Lanes,
particularly NTE 35W, following the opening of its segment 3C in June 2023.
Cash flows from operating activities from infrastructure project companies increased to EUR 890 million in 2023 as
compared to EUR 629 million in 2022. This was primarily driven by the impact of I-66 after its opening in November
2022 and the positive evolution of other Managed Lanes.
Cash flows from (used in) investing activities from infrastructure project companies
Cash flows from (used in) investing activities from infrastructure project companies increased to EUR 73 million in
2024 from EUR 347 million in 2023. This change was mainly due to the impact of investments in I-66 and NTE 35W
in 2023.
Cash flows from (used in) investing activities from infrastructure project companies increased to a loss of EUR 347
million in 2023 from a loss of EUR 720 million in 2022. This change was mainly due to the impact of investments in
I-66 in 2022, together with lower restricted cash in NTE 35W.
Cash flows (used in) financing activities from infrastructure project companies
Cash flows (used in) financing activities from infrastructure project companies increase to an inflow of EUR 1,121
million in 2024 from an inflow of EUR 471 million in 2023. This change was mainly driven by the lower dividends
paid to non-controlling interests of investees (first dividend distribution by NTE 35W in 2023, partially offset by I-77
first dividend in 2024), along with the positive impact of the USD exchange rate evolution.
Cash flows (used in) financing activities from infrastructure project companies increased to an outflow of EUR 471
million in 2023 from an inflow of EUR 42 million in 2022. This change was mainly driven by the higher dividends
paid to non-controlling interests of investees (first dividend distribution by NTE 35W), together with interests paid.
Change in cash and cash equivalents due to consolidation scope changes from infrastructure project companies
The change in cash and cash equivalents due to consolidation scope changes in 2023 was explained by the divestment
of Azores.
Change in short and long-term borrowings from infrastructure project companies
The increase of EUR 484 million in short and long-term borrowings from infrastructure project companies in 2024
was primarily driven by additional debt issued at I-77 project partially offset by the foreign exchange impact in our US
projects debt.
The decrease of EUR 52 million in short and long-term borrowings from infrastructure project companies in 2023 was
primarily driven by the consolidation scope change after the Azores divestment and the foreign exchange impact in
our US projects debt, partially offset by additional debt issued at NTE 35W project.
Other changes in Consolidated Net Debt from infrastructure project companies
The other changes in Consolidated Net Debt from infrastructure project companies were primarily related to the
change in our non-current restricted cash in 2024, 2023 and 2022.
5.B.6.2 Ex-Infrastructure Liquidity
Ex-Infrastructure Liquidity corresponds to the sum of the cash and cash equivalents raised from to our ex-
infrastructure projects, long-term restricted cash, as well as the committed short and long-term credit facilities which
remain undrawn by the end of each period (corresponding to credits granted by financial entities which may be drawn
by us within the terms, amount and other conditions agreed in each contract) and forward hedging cash flows.
We use Ex-Infrastructure Liquidity to determine our liquidity to meet any financial commitment in relation to our ex-
infrastructure projects. The liquidity disclosure figures below for the years ended December 31, 2024, 2023 and 2022
are as presented in our audited financials for those years and therefore include our continued and discontinued
activities.
The following table sets forth a reconciliation of Ex-Infrastructure Liquidity for the periods indicated.
| | | |
| |
| | | |
| |
Cash and cash equivalents ........................................................................................................ | | | |
Non- current restricted cash ...................................................................................................... | | | |
Other short term financial assets ............................................................................................. | | | |
Undrawn credit lines ................................................................................................................. | | | |
Forward hedging cash flows ..................................................................................................... | | | |
Total liquidity ex infrastructure ............................................................................................ | | | |
As of December 31, 2024, our liquidity, excluding infrastructure projects, was EUR 5,320 million, which included
EUR 651 million liquidity lines available at the infrastructures projects level.
As of December 31, 2023, our liquidity, excluding infrastructure projects, was EUR 5,387 million, which included
liquidity lines available at the ex-infrastructures level in the amount of EUR 789 million, as compared to EUR 6,118
million as of December 31, 2022.
Ex-infrastructure projects, the principal source of our liquidity, is cash generated from operations. We also have access
to the debt capital markets through debt issuances and a number of local borrowing facilities in a variety of currencies
and at floating rates in order to meet specific funding needs of certain of our subsidiaries. Our liquidity requirements
primarily relate to servicing our ongoing debt obligations, our working capital requirements, funding our operating
expenses and capital expenditures, funding our dividend payments, and implementing our growth strategies.
We intend to continue to apply a disciplined approach to capital allocation and have established mechanisms to
preserve the necessary level of liquidity with periodic procedures that include cash generation forecasts and cash
requirements, both for the different short-term collections and payments as well as long-term obligations.
5.B.7Investments and divestments
The table below sets out our investments and divestments split by Business Division for the years ended December 31,
2024, 2023 and 2022:
| | | | | | | | | |
| |
| | | |
| | | Cash flows from (used in) investing activities | | | Cash flows from (used in) investing activities | | | Cash flows from (used in) investing activities |
| | | | | | | | | |
Airports ................ | | | | | | | | | |
| | | | | | | | | |
Services ................ | | | | | | | | | |
Others ................... | | | | | | | | | |
| | | | | | | | | |
Investment of long-term restricted cash ....... | | | | | | | | | |
| | | | | | | | | |
(1)Corresponds to the sum of the concepts Investments in property, plant and equipment/intangible assets, investments in infrastructure
projects, Non-refundable grants, and Investments in associates and non-current financial assets/ acquisition of companies reported in our
consolidated Cash Flow.
(2)Corresponds to the sum of the concepts Divestment of infrastructure projects and Divestment/sale of companies reported in our
consolidated Cash Flow.
For discussion of our material investments, dispositions, and acquisitions made in recent years, see “Item 4.
Information on the Company—A. History and Development of the Company—1. Summary of Historical Investments
and Divestments.”
5.B.8Financing
5.B.8.1.1.Infrastructure project borrowings
5.B.8.1.1.1.Project debt guarantees and covenants
Our debt classified as project debt refers to debt (i) without recourse to the shareholders of the projects (i.e., our
consolidated subsidiaries through which we have an indirect interest in the relevant project), including us, or (ii) with
recourse limited to the guarantees granted by said shareholders. The guarantees granted by our subsidiaries in relation
to the debt of these projects are described in “—E. Critical Accounting Estimates—1. Off-Balance-Sheet Arrangements
and Contingent Liabilities.” As of December 31, 2024, all of our fully consolidated project companies comply with the
significant covenants in force.
Our infrastructure project borrowings include debt covenants and covenant debt ratios, in particular related to the
obligation to arrange certain restricted accounts to cover short-term or long-term obligations relating to the payment of
principal or interest on borrowings and to infrastructure maintenance and operation, which are customary in the
industry. The recovery for any potential breach under such covenants is limited to the assets of the relevant project,
and, thus, it is considered a ring-fenced project debt which has no recourse to us and our respective subsidiary
participating in the relevant project. Although the overall consequence of not complying with such covenant debt
ratios will depend on a particular agreement, in most cases it will be limited to declaration of an event of default in
connection with the relevant financing agreement, without an obligation on our part to inject additional equity and/or
repay the underlying debt, except in specific cases for the guarantees granted by shareholders. No individual event of
default in connection with our infrastructure project financing agreements would be material to us.
5.B.8.2.Ex-infrastructure project borrowings
5.B.8.2.1Corporate Debt
Our corporate debt consists of the following debt instruments.
▪Corporate Bonds: the book value of the corporate bonds as of December 31, 2024, amounted to EUR 2,292
million (EUR 2,590 million as of December 31, 2023). Their characteristics are shown in the following
table.
| | | |
| Notional amount as of December 31, 2024 | | |
|
| | | |
| | | |
| | | |
| | | |
▪All issues made as of 2017 and up to 2023 are admitted to trading on the AIAF fixed income market
(Spain). All these issues are guaranteed by the Company.
▪During the year ended December 31, 2024, the bond issued in July 2014 for a notional amount of
EUR 300 million and annual coupon of 2.500% was repaid.
▪On January 9, 2025, we announced the issuance of a corporate bond amounting to EUR 500 million,
with maturity date on January 16, 2030. The bond has an annual coupon of 3.25% payable annually
and was issued by our parent company, Ferrovial SE, and is admitted to trading on Euronext Dublin.
▪Sustainability Linked Bond: in September 2023, we issued a sustainable linked bond for an amount of EUR
500 million, with maturity in 2030. The proceeds of the sustainability linked bond were used to repay EUR
500 million of the bilateral banking facilities, increasing the average life of our debt and reducing the cost of
debt of ex-infrastructure project borrowings. The sustainability linked bond includes two sustainability
performance targets (“SPTs”): (i) an absolute reduction of Scope 1&2 GHG emissions of 31.9% by 2028,
using 2009 as base year (SPT1.1) and (ii) a 20% reduction of certain Scope 3 GHG emissions by 2028, using
2015 as base year (SPT2.1). Failure to meet one or both SPTs would entitle bondholders to receive: (i) if
SPT1.1 is missed, +30 bps at maturity, and (ii) if SPT2.1 is missed, +45 bps at maturity. The sustainability
linked bond is listed in the regulated market of Ireland (Euronext Dublin).
▪Sustainability Target Euro Commercial Paper: in the first quarter of 2018, we formalized a program to issue
promissory notes for a maximum amount of EUR 1,000 million, with maturities between 1 and 364 days
from the issue date, allowing for greater diversification of funding sources in the capital market and more
efficient management of available liquidity. At the end of 2019, the limit was increased to EUR 1.5 billion,
with the book balance as of December 31, 2024, being EUR 249 million. This promissory note issuance
program has been renewed annually since 2018. After the Merger, the previous program was replaced with a
new Sustainability Target Euro Commercial Paper program issued by the Company from the Netherlands,
with similar terms and conditions to the previous program. This new program is not listed on any regulated
markets and has received the Short-Term European Paper label (STEP label) from the STEP Secretariat, the
body in charge of the day-to-day management of the STEP label. Outstanding notes issued under the
previous program will be repaid at maturity by the Company and will be counted towards the limit of the
new program.
▪Corporate liquidity facility: in January 2025 we refinanced the corporate liquidity line incorporating
sustainability criteria linked to key performance metrics. The line’s final maturity is January 2030 with the
possibility of two extensions of 1 year each. It has a maximum limit of EUR 900 million with the possibility
of drawing down balances in EUR, USD, CAD and GBP. No amount is drawn as of the date of this Annual
Report.
▪Cross-currency swaps: in order to hedge possible variations in the interest rate and exchange rate of the
amounts drawn under the corporate liquidity facility, we have contracted cross currency swaps for USD 260
million, maturing in 2025, and with an agreed countervalue of EUR 250 million, the fair value of which
amounts to a loss of EUR 13 million.
The change in corporate debt compared to December 31, 2023 (EUR 534 million) is mainly due to the lower issuance
of Euro-commercial papers (EUR 251 million), with an average rate of 3.85%, as well as the redemption of the bond
issued in 2014 for EUR 300 million.
5.B.8.2.2Corporate Rating
The financial rating agencies Standard & Poor’s and Fitch maintain their opinion on the financial rating of our
corporate senior debt at ‘BBB’ and ‘BBB with a stable outlook’, respectively, within the “Investment Grade” category.
5.B.8.2.3Other Debt
The other debt line amounts to EUR 36 million as of December 31, 2024, compared to EUR 63 million as of
December 31, 2023 and mainly includes balances of other bank debt, predominantly in the Airports Business Division
(EUR 14 million as of December 31, 2024) and related to the capital contributions made to the NTO AT JFK project.
5.B.9Future Material Investments and Anticipated Capital Expenditures
Our future investment commitments to invest capital in infrastructure project companies as of December 31, 2024, is
the following:
| | | | | | | |
| | | | | | | |
| | | | | |
Toll Roads .......................................................................... | | | | | | | |
Airports ............................................................................... | | | | | | | |
Energy ................................................................................ | | | | | | | |
INVESTMENTS IN FULLY- CONSOLIDATED INFRASTRUCTURE PROJECT | | | | | | | |
Toll Roads .......................................................................... | | | | | | | |
Airports ............................................................................... | | | | | | | |
Construction ....................................................................... | | | | | | | |
INVESTMENTS IN EQUITY- ACCOUNTED INFRASTRUCTURE PROJECT | | | | | | | |
| | | | | | | |
On top of the committed investments shown above, EUR 285 million are pending of financial closing. The increase
during the year is mainly due to new investment commitments in toll road projects in Peru and renewable energy
projects in the US and Poland.
In addition, we committed to invest up to EUR 35 million in companies in which Ferrovial holds non-controlling
interests that are engaged in innovation projects related primarily to mobility.
5.CResearch and Development, Patents and Licenses, etc.
See “Item 4. Information on the Company—B. Business Overview—6. Research and Development” and “Item 5.
Operating and Financial Review and Prospects—A. Operating Results.”
5.DTrend Information
See “—A. Operating Results.”
5.ECritical Accounting Estimates
We have provided a summary of our significant accounting policies, estimates and judgments in Note 1.3 (Summary
of Significant Accounting Policies) to the Audited Financial Statements. The following critical accounting discussion
pertains to the accounting policies, judgments, estimates and assumptions that management believes are most critical
to the portrayal of our historical financial condition and results of operations. Other companies in similar businesses
may use different estimation policies and methodologies, which may impact the comparability of our financial
condition, results of operations and cash flows to those of other companies. For additional information, see Note 1.1
(Basis of presentation, the Company’s activities and consolidation scope) and Note 1.3 (Accounting policies) to the
Audited Financial Statements.
Basis of consolidation
In order to calculate the degree of control, joint control or significant influence in each Group company, the
consistency of the ownership interest held with the number of votes controlled in each company under their bylaws
and shareholder agreements is reviewed. In the case of business activities with companies in which the existence of
joint control is identified, the general basis of consolidation is the equity method.
In relation to these jointly controlled businesses, apart from the situations in which there are two venturers, each with a
50% ownership interest, the cases requiring a more in-depth analysis are those relating to infrastructure projects in
which Ferrovial is the shareholder with the largest ownership interest (less than or equal to 50%) and has the right to
propose the Chief Executive Officer or other executives of the investee, while the other shareholders, mainly
infrastructure funds, it directly on the Board of Directors.
In all these cases, it has been concluded that the projects in question should be equity-accounted, because Ferrovial
does not have the right to appoint the majority of the Board Directors and the Board resolutions (including the
appointment of the main executive positions) always require a simple or qualified majority, where Ferrovial does not
itself have a casting vote in the event of a tie. For further details, see Note 1.3.2 (Basis of Consolidation) to the
Audited Financial Statements.
Accounting estimates and judgements
Most relevant estimates to measure some of the assets, liabilities, income, expenses and commitments recognized
relate to the following:
I.Revenue from long-term construction contracts with customers (see Note 1.3.3.4 (Revenue recognition) in
the Audited Financial Statements), particularly as regards to:
a.Application of the output method to recognize revenue over time, measuring the work carried out
by surveying performance completed to date, in which the revenue recognized reflects the work
units executed and the unit price. Under this method, the units completed in each contract are the
basis used to recognize revenue. Those units are calculated by each project team based on the
technical progress made up to the financial statements date. The revenue recognized reflects the
work units executed valued applying the unit price established in the contract.
b.Application of the input method to recognize revenue over time on those contracts where the
output method cannot be applied, estimating the total costs forecast to complete the work, using
most recent contract budgets approved for each project by the relevant members of management,
making assumptions on future prices of materials and subcontractors’ work. Prices included in
future materials supply arrangements and subcontractors’ contracts are used. In case no supply
contracts are in place, materials or subcontractors’ costs are calculated based on market evidence
or supply arrangements recently signed for other contracts.
c.Provisions for deferred expenses: management bases its calculations on historic experience and
bears in mind the different countries and contract requirements.
d.Provisions for contractual losses: contractual losses are recognized when the probable budget
scenario, adjusted for internal fees, shows a loss.
e.Recognition of revenue for variable consideration, for a modification, for a claim or for a dispute.
In this regard, management bases its calculation on the specific clauses included in each contract
and also considers past experience in other contracts. Management needs to make assumptions
regarding the amount of incurred costs that will give rise to these additional sources of revenue and
whether those costs meet the conditions for variable considerations, modifications, claims or
disputes arising in connection with the contract.
II.Toll Roads and Airports financial information under IFRIC-12 (Note 3.3 on investments in infrastructure
projects; Note 6.3 on Provisions) and the related impairment test (Note 3.1 on Goodwill and acquisitions)
performed based on a discounted cash flow model, which involves management assumptions, mainly related
to:
a.Future traffic volumes (vehicles and passengers for toll roads and airports, respectively): for
concessions already in operation, traffic estimates are built on actual traffic and growth patterns are
derived from macroeconomic data, external studies in certain cases and any other information and
plans that may impact future traffic. For concessions under construction, external projections (e.g.
airports traffic forecast from international agencies) and research (e.g. impact of e-commerce on
heavy vehicles traffic or home working habits on the use of private vehicles for toll roads) are
used.
b.Pricing: specific pricing arrangements included in concession contracts are considered. In case the
arrangements do not include a fixed price, internal estimates of elasticity of demand regarding
prices and other related inputs are used.
c.Future operating expenses: estimates of future prices of materials, subcontractors and other costs
required to operate the concessions are based on historical experience, estimating price index grow
and considering related requirements established in the concession agreements.
d.Discount rates: management calculates weighted average cost of capital based on external
information sourced obtained from banks reports and converts it into a pre-tax discount rate for
impairment test purposes.
III.Fair value of assets held for sale related to discontinued operations (see Note 1.1.5 Assets and liabilities held
for sale and discontinued operation in the Audited Financial Statements) which only applies to 2022 and
2024: if the divestment process is in an advanced stage, non-binding and binding offers received from
potential buyers are the main input. Where there are no offers in place, calculations based on publicly
available multiples of similar transactions are also used.
IV.Calculation of the goodwill arising in the acquisitions of Dalaman in June 2022 and Private InvIT in June
2023, and its allocation to the fair values of its assets and liabilities (see Note 1.1.6 Consolidation scope
changes and other divestments of investees in the Audited Financial Statements).
V.Consolidation method of the remaining 5.25% stake in FGP Topco Limited at December, 31, 2024, which is
the direct shareholder of HAH, after Ferrovial completed the sale of 19.75% of the share capital of FGP
Topco Limited. Additionally, Private InvIT, in which Ferrovial acquired a 23.99% stake in June 2024.
ITEM 6. DIRECTORS, SENIOR MANAGEMENT, AND EMPLOYEES
6.ADirectors and Senior Management
The following table sets forth information regarding our directors and executive officers as of the date of this Annual
Report.
| | | | |
| | | | |
| | | | |
Rafael del Pino .............................................................. | | | | Executive Director (Chairman) |
Óscar Fanjul ................................................................... | | | | Non-Executive Director (Vice-Chairman) |
Ignacio Madridejos ........................................................ | | | | Executive Director (Chief Executive Officer) |
María del Pino ................................................................ | | | | |
José Fernando Sánchez-Junco ........................................ | | | | |
Philip Bowman .............................................................. | | | | |
Hanne Sørensen ............................................................. | | | | |
Bruno Di Leo ................................................................ | | | | |
Juan Hoyos ..................................................................... | | | | Non-Executive Director (Lead Director) |
Gonzalo Urquijo ............................................................ | | | | |
Hildegard Wortmann ..................................................... | | | | |
Alicia Reyes ................................................................... | | | | |
| | | | |
| | | | |
Rafael del Pino ............................................................... | | | | Executive Director (Chairman) |
Ignacio Madridejos ....................................................... | | | | Executive Director (Chief Executive Officer) |
Ernesto Lopez Mozo ...................................................... | | | | |
Andrés Sacristán ............................................................ | | | | Chief Executive Officer of Cintra |
Luke Bugeja .................................................................. | | | | Chief Executive Officer of Ferrovial Airports |
Ignacio Gastón .............................................................. | | | | Chief Executive Officer of Ferrovial Construction |
María José Esteruelas .................................................... | | | | Chief Executive Officer of Ferrovial Energy |
Unless otherwise indicated, the current business addresses for our directors and executive officers is Gustav
Mahlerplein 61-63, Symphony Towers, 14th floor, 1082 MS Amsterdam, The Netherlands. The following is a brief
summary of the business experience of our directors and executive officers.
6.A.1Biographies of Directors
Rafael del Pino—Executive Director (Chairman)
Rafael del Pino has served as our CEO (1992-2000) and as our Executive Chairman (since 2000). Within the Group,
he has also been Chairman of Cintra, our Toll Roads Business Division subsidiary (1998-2009). Other past
directorships include Uralita, a Spanish construction materials company (1996-2002); Banesto, a Spanish bank owned
by Banco Santander (2003-2012); and the Zurich Insurance Group, a Swiss insurance company (2012-2014). In
addition to his directorship roles, Mr. del Pino is a member of the MIT Corporation, MIT Energy Initiative’s External
Advisory Board, and MIT Sloan European Advisory Board, as well as of the IESE Business School’s International
Advisory Board. He is also a member of the Royal Academy of Engineering of Spain since 2014. Mr. del Pino holds a
degree in Civil Engineering from Universidad Politécnica de Madrid and an MBA from MIT Sloan School of
Management.
Óscar Fanjul—Non-Executive Director (Vice-Chairman)
Óscar Fanjul has served as one of our directors since 2015 and has also held the position of Vice-Chairman since
2020. He also serves as a director of Marsh & McLennan Companies, a U.S. professional services firm (since 2001);
as a non-executive director of Cellnex, a Spanish telecommunications company (since 2023) and as its chairman (since
2024); and as a non-executive chairman of HWK, an asset management firm specialized in technology (since 2024).
He is a trustee of the Center of Monetary and Financial Studies of the Bank of Spain (since 1999), the Spanish branch
of the Aspen Institute (since 2011), and the Norman Foster Foundation (since 2019). Previously, Mr. Fanjul was the
founding chairman and CEO of Repsol, a Spanish global multi-energy provider (1985-1996). He has also served as
chairman of NH Hotel Group, a Spanish multinational hotel company (1997-1999) and Hidroelectrica del Cantabrico,
a Spanish electricity producer (1999-2001). He has held the position of vice-chairman at LafargeHolcim, a Swiss
construction materials company, both prior to (2009-2015), and after (2015-2021), Lafarge and Holcim’s merger in
2015 and has been a director at Unilever (1996-2004), BBVA (1998-2002), Acerinox, a Spanish steel manufacturer
(2001-2016), the London Stock Exchange (2001-2013) and Areva, a French nuclear energy conglomerate
(2008-2012). He holds a Ph.D. degree in economics from Universidad Complutense de Madrid and has been a visiting
scholar at the Departments of Economics at Harvard University and MIT.
Ignacio Madridejos—Executive Director (Chief Executive Officer)
Ignacio Madridejos has served as an executive director and as our Chief Executive Officer since September 2019. He
has over 30 years’ professional experience working across the United States, Europe, Latin America, and Africa.
Previously, he was a project manager at Agroman (now Ferrovial Construction) (1990-1992), the subsidiary that heads
our Construction Business Division; and a consultant at McKinsey & Company, a global management consulting firm,
in Spain and Argentina (1993-1996). In 1996, Mr. Madridejos joined CEMEX, a global building materials company,
where he served in various positions as chief executive officer for CEMEX Egypt (1999-2003) and CEMEX Spain
(2003-2007); global head of energy, health and safety, and sustainability (2011-2017); and president for CEMEX
Northern Europe (2008-2015) and CEMEX USA (2016-2019). He has also previously served as president of
Oficemen, the Spanish Cement Association, and president of CEMBUREAU, the European Cement Association. Mr.
Madridejos holds a MsC in Civil Engineering from Universidad Politécnica de Madrid and an MBA from Stanford
Graduate School of Business.
María del Pino—Non-Executive Director
María del Pino has served as one of our directors since 2006. She is also chairperson of the Fundación Rafael del
Pino, a Spanish private non-profit organization (since 2008) and chairperson of Chart Inversiones SICAV S.A., a
Spanish collective investment vehicle (since 2022). Since 2008, Ms. del Pino has also been a member of the board of
trustees of the Fundación Princesa de Asturias, the honorary consultancy body of a Spanish non-profit organization.
Furthermore, since 2017, Ms. del Pino has also been the chief executive officer and chairperson of Menosmares, S.L.
(“Menosmares”), a holding company under her control. Ms. del Pino acts as legal representative of Menosmares on
several boards, including: Lolland S.A., a holding company of which Menosmares is a joint director (since 2016); the
board of directors of Casa Grande de Cartagena, S.A.U., a holding company of which Menosmares is rotating
chairman and vice-chairman (since 2017); the board of directors of Polan S.A., a Spanish real estate company focused
on the rental of office space and parking and of which Menosmares is rotating chairman and vice-chairman (since
2017); and the board of directors of Pactio Gestión, SGIIC, S.A.U., a Spanish investment management firm of which
Menosmares is vice-chairman (since 2017). Previously, she was also chairperson of Altais Invest SICAV S.A.
(1998-2022), a Spanish collective investment vehicle. Ms. del Pino holds a degree in Economics and Business
Administration from Universidad Complutense de Madrid and in Management Development from IESE Business
School.
José Fernando Sánchez-Junco—Non-Executive Director
José Fernando Sánchez-Junco has served as one of our directors since 2009. Prior to this directorship, he was a
director of Cintra, the subsidiary that heads our Toll Roads Business Division (2004-2009). He is also a director at
Villabuena Inversiones, S.L., a Spanish private wealth management firm, since 2007, and an honorary chairman of the
Maxam Group, a Spanish technology and chemical multinational company, since 2020. Previously, Mr. Sánchez-
Junco served in various roles at the Maxam Group, including as former sole administrator (1990-1994), executive
chairman and chief executive officer (1994-2020), and as executive/non-executive director (1990-2021); he was also
the founder and chairman of the board of trustees of the Maxam Foundation (2006-2022), a Spanish private non-profit
organization. He was a member of the State Corp of Industrial Engineers (1978-1990), managing director of the iron,
steel, and naval industries (1985-1988) and a managing director of industry (1988-1990) at the Spanish Ministry of
Industry and Energy. He served as independent director of Alantra (2002-2012), a Spanish investment banking and
asset management company, and as independent director on the board of Uralita (1993-2002). Mr. Sánchez-Junco has
also been a director and honorary member of the board of trustees of the Museo de la Minería y la Industria de
Asturias (2017- 2022), an autonomous government-owned museum. He holds a degree in Industrial Engineering from
Universidad Politécnica de Cataluña, Barcelona and is an International Senior Management Program graduate of the
Harvard Business School.
Philip Bowman—Non-Executive Director
Philip Bowman has served as one of our directors since 2016. He is the non-executive chairman of Tegel Group
Holdings Limited, a poultry producer and food processing company (since 2019) and Sky Network Television
Limited, a New Zealand media company (since 2019). He also serves as a director at Tom Tom Holdings Inc., a
private real estate investment company that owns and rents out properties in the Caribbean (since 2017) and as a non-
executive director of KMD Brands Limited, a New Zealand outdoor, lifestyle and sports company (since 2017). Mr.
Bowman has served as non-executive chairman of Majid Al Futtaim Properties LLC, a developer, owner and operator
of shopping malls and hotels, and developer and manager of residential communities across the Middle East
(2017-2024), and as a non-executive director of Majid Al Futtaim Properties LLC’s immediate parent company, Majid
Al Futtaim Holding LLC, (2018-2024) and its ultimate holding company, Majid al Futtaim Capital LLC (2018-2024).
He was also director of Better Capital PCC Limited, a Guernsey investment company (2009-2024). Mr. Bowman has
held positions as chairman of Liberty plc (1998-2000), a U.K. owner and operator of department stores and fabric
designer; Coral Eurobet Limited (2004-2005), a U.K. sports betting company; Potrero Distilling Holdings LLC (2016-
2018), a holding company for a U.S. beverage conglomerate; and Hotaling & Co. LLC (2018-2019), a U.S. alcoholic
beverage manufacturer and importer. He served as non-executive chairman of The Munroe Group (UK) Limited
(2013-2017), a U.K. house builder, general contractor, property developer and mining company; as chief executive
officer of Allied Domecq plc (1998-2005), a U.K. spirits and wine producer and quick services restaurant franchisor
and operator, Scottish Power plc (2006-2007), a U.K. and U.S. energy company, and Smiths Group plc (2007-2015), a
U.K. engineering multinational company; and as director of British Sky Broadcasting Group plc (1994-2003), a U.K.
media and telecommunications conglomerate, Coles Myer Limited (1995), an Australian retailer (where Mr. Bowman
also served as chief financial officer), Bass plc (2001-2005), a U.K. brewer, pub operator, soft drinks manufacturer,
property developer, hotel operator and leisure conglomerate (where Mr. Bowman also served first as chief financial
officer and later as chief executive officer of Bass’ taverns’ division), Burberry Group plc (2002-2017), a U.K. luxury
fashion group, Berry Bros. & Rudd Limited (2006-2016), a U.K. wine and spirits company, and Scottish & Newcastle
Group plc (2006- 2008), a U.K. brewing company. He graduated with honors in Natural Science and holds a Master of
Sciences in Natural Science from the University of Cambridge.
Hanne Sørensen—Non-Executive Director
Hanne Sørensen has served as one of our directors since 2017. Ms. Sørensen also serves as a director of Holcim, a
Swiss construction materials manufacturer multinational company (since 2013) and as its vice-chair (since 2022). She
is a director at Tata Motors, an Indian automotive manufacturing company (since 2018); Tata Consulting Services, an
Indian-based information technology services and consulting company (since 2018); Jaguar Land Rover Automotive
Plc., a U.K. holding company for the Jaguar Land Rover Group, a U.K. automobile manufacturing multinational
company (since 2018); and its subsidiaries Jaguar Land Rover Limited (since 2019) and Jaguar Land Rover Holdings
(since 2023).
She was the interim chief executive officer of V Group Limited (2017), a U.K. ship management company. She was
also chief executive officer for Damco (2014-2016), a Dutch-based international logistics company, and of Maersk
Tankers (2012-2013), a Danish tanker services company, part of the Maersk Group. She also served as a chief
commercial officer (2008-2012); East Mediterranean regional manager (2006-2008); SAP program director
(2002-2006); regional chief financial officer for the far east region (2001-2002); chief financial officer for India
(1999-2001); finance manager for Italy (1997-1999); and business auditor (1994-1997) at Maersk Line, a Danish
international integrated logistics company.
Ms. Sørensen was chairman of ITOPF (2013), a U.K. non-profit organization, vice-chairman of Hoegh Autoliners
(2012-2013), a Norwegian provider of ocean transportation services; non-executive director of Sulzer (2018-2023), a
Swiss-based international company specialized in pumps, rotating equipment and chemtech; and a director of Axcel
(2010-2013), a Danish private equity firm, INTTRA (2010-2012), a U.S. technology provider to the maritime industry,
Jaguar Land Rover Holdings Limited (2019-2022), Jaguar Land Rover North America Holdings LLC (2021-2022),
Jaguar Land Rover China (2021-2022), and Delhivery (2017-2021), an Indian courier service provider company. Ms.
Sørensen holds a Master of Sciences in Economics and Management from the University of Aarhus.
Bruno Di Leo—Non-Executive Director
Bruno Di Leo has served as one of our directors since 2018. He is a managing director and chief executive officer of
Bearing North LLC, an independent advisory firm focused on business expansion and senior executive counseling in
strategy and operations. He is also a non-executive director of Cummins, a U.S. engine manufacturing multinational
company (since 2015), as well as a member of the IESE’s International Advisory Board in Spain (since 2013) and of
the Deming Center Advisory Board of Columbia Business School (since 2012). Previously, he held various executive
roles at IBM Corporation, a U.S. technology multinational company, including as a general manager for IBM Latin
America (2002-2004), general manager of IBM Europe (2005-2008), general manager of the growth markets unit
(2008-2011), and senior vice-president of global markets (2012-2018). Mr. Di Leo has a degree in Business
Administration from Universidad Ricardo Palma and a postgraduate degree from Escuela Superior de Administración
de Negocios.
Juan Hoyos—Non-Executive Director
Juan Hoyos has served as one of our directors since 2019. He is also an independent board member of Inmoglaciar, a
Spanish real estate developer (since 2017) and Gescobro Collection Services, a Spanish collection services company
(since 2015). Previously, Mr. Hoyos served as office manager of McKinsey & Company Iberia (1997-2004) and was a
member of the McKinsey & Company shareholder council worldwide (1998-2006). He also served in a variety of
roles for Banco Santander, a Spanish financial institution. He was a director of Banco Santander Chile (2007-2012)
and Banco Santander Mexico (2011-2012), and strategy, brand, and marketing executive vice-president of Banco
Santander Brazil (2012). He has also acted as executive chairman of Haya Real Estate (2013-2020), a Spanish real
estate agency services company. Mr. Hoyos holds a degree in Actuarial Sciences from Universidad Complutense de
Madrid and an MBA in Finance and Accounting from Columbia Business School.
Gonzalo Urquijo—Non-Executive Director
Gonzalo Urquijo has served as one of our directors since 2019. He also serves as chief executive officer of Talgo, a
Spanish manufacturer of passenger trains (since 2021); as a non-executive director of Gestamp Automoción, a Spanish
automotive engineering multinational company (since 2017); as the chairman of the Fundación Hesperia, a Spanish
non-profit entity (since 2012); and as a member of the board of trustees of the Fundación Princesa de Asturias (since
2006). Previously, Mr. Gonzalo Urquijo was the chairman of ArcelorMittal Spain (2008-2016), the Spanish branch of
Luxembourgish steel manufacturing multinational company ArcelorMittal, and Abengoa (2016-2021), a Spanish green
infrastructure, energy and water multinational company; a member of the general management of ArcelorMittal
(2006-2016) and head of the long products, stainless steel, tubes, and emerging markets sectors (2006-2010); the chief
financial officer and head of the distribution sector of Arcelor (2002-2006), a Luxemburgish steel producer and
predecessor of ArcelorMittal; and the chief financial officer of Aceralia Corporación Siderúrgica (1997-2002), a
Spanish steel producer and predecessor of Arcelor. Furthermore, Mr. Urquijo was the chairman of UNESID
(2002-2017), the Spanish steel companies’ union and a director of Aceralia (2002-2004), Aperam (2010-2015), a
Luxemburgish company steel producer and former subsidiary of ArcelorMittal, Vocento (2016-2019), a Spanish mass
media group, and Atlantica Yield (2017-2019), a U.K. sustainable infrastructure company, among others. Mr. Urquijo
started his professional career in the finance field, holding various positions at financial institutions Citibank and
Crédit Agricole (1984-1992). Mr. Urquijo holds a degree in Economic and Political Sciences from Yale University
and an Executive MBA from Instituto de Empresa.
Hildegard Wortmann—Non-Executive Director
Hildegard Wortmann has served as one of our directors since 2021. Previously, Ms. Wortmann was a member of the
extended executive committee (2022-2024) and a member of the board of management for sales (2022) of
Volkswagen Group, a German automotive manufacturer multinational company; and a member of the board of
management of Audi AG, a German automotive manufacturer multinational company (2019-2024). She also served as
a non-executive director of Volkswagen Financial Services AG (2021-2024); a non-executive director of each of
Porsche Holding GmbH, a German holding multinational company within the Volkswagen Group, Porsche Austria
GmbH, the Austrian branch of automotive manufacturer Porsche, and Porsche Retail GmbH (each from 2020-2024);
and a non-executive director of the supervisory board of CARIAD SE (2022-2023), a German automotive software
company and subsidiary of Volkswagen Group. Ms. Wortmann has also worked in various management positions at
BMW Group (1998-2019), a German automotive manufacturer multinational company, including as a senior vice
president for product management (2010-2017), a senior vice president for the brand (2016-2017), and a chief
executive officer for the Asia-Pacific region (2018-2019). She also held various management positions at Unilever in
Germany and London (1990-1998). Ms. Wortmann holds a degree in Business Administration from Fachhochschule
Münster and an MBA from the University of London.
Alicia Reyes—Non-Executive Director
Alicia Reyes has served as one of our directors since 2021. She is also a non-executive director of Banco Sabadell, a
Spanish financial institution, and one the Group’s lenders (since 2020); an independent non-executive director of KBC
Group, a Belgian bank-insurance group, and its affiliates KBC Bank N.V. and KBC Global Services (since 2022); an
independent member of the General and Supervisory Board of Energias de Portugal (EDP) (since 2024); and a trustee
of Fareshare UK, a U.K. charity (since 2020). Previously, Ms. Reyes was a president and chief executive officer of
Momentus Securities, a FINRA member firm (2023); a guest industrial professor at the Institute of Finance and
Technology in University College London (UCL) (2020-2023); a director and the chief executive officer of Wells
Fargo Securities International Limited, a U.K. broker-dealer part of U.S. financial services multinational company
Wells Fargo, and Wells Fargo Securities Europe SA (2016-2019), also part of Wells Fargo; a non-executive director of
TSB Bank (2021-2022), a U.K. financial institution; global head of structuring in the investment banking division and
global head of insurance solutions and strategic equity derivatives of Barclays Capital (2006-2014), a U.K. brokerage
firm and investment advisor part of Barclays PLC; country manager for Spain and Portugal of Bear Stearns, a U.S.
investment bank (2002-2006); and chief investment officer of Telecom Ventures (1998-2002), Abengoa’s venture
capital fund specialized in technology. She also worked for Deutsche Bank (1996-1998), a German financial
institution, as an associate in the relative value group. Ms. Reyes holds a degree in Law, Economics, and Business
Administration and a PhD in quantitative methods and financial markets from Universidad Pontificia Comillas
(ICADE).
6.A.2Biographies of Executive Officers
Rafael del Pino—Executive Director (Chairman)
See “—1. Biographies of Directors.”
Ignacio Madridejos—Executive Director (Chief Executive Officer)
See “—1. Biographies of Directors.”
Ernesto López Mozo—Chief Financial Officer
Ernesto López Mozo has served as the Chief Financial Officer of Ferrovial since 2009. Mr. López Mozo is also the
chairman of the board of directors (since 2023) and the vice-president of the audit and control committee (since 2018),
of Aegon España, S.A., the Spanish branch of Dutch insurance group Aegon. He previously served as a board member
of HAH (2009-2024). He has held various management positions at Telefónica Group (1999-2009), a Spanish
telecommunications multinational company; JP Morgan (1994-1999), a U.S. financial entity; and Banco Santander
(1992-1994). He was also a member of the IFRS Advisory Council (2013-2015), the formal strategic advisory board to
the IFRS Foundation, the IASB and the International Sustainability Standards Board (“ISSB”). Mr. López Mozo holds
a MsC in Civil Engineering from Universidad Politécnica de Madrid and an MBA from The Wharton School of the
University of Pennsylvania.
Andrés Sacristán—Chief Executive Officer of Cintra
Andrés Sacristán has served as the Chief Executive Officer of Cintra since 2021. Mr. Sacristán began his career with
Cintra in 2001, holding several positions in the car parks division, including head of development (2005-2007), before
moving on to the toll roads division, where he served as head of operations at Eurolink M4 in Ireland (2007-2009) and
as managing director of Radial 4 in Madrid (2009-2010). In 2010, he was appointed country manager for Spain and as
a member of Cintra’s Executive Committee. In 2013, he became head of Europe, and in 2015 he took charge of the
Australian and Colombian markets. He was appointed director and chief executive officer of Canadian concession
companies 407 International Inc. (director between 2017 to present; chief executive officer between 2017-2020),
Canadian Tolling Company International Inc (2017-2020), and 407 ETR Concession Company Limited (2017-2020).
In 2020, Mr. Sacristán took over the management of Cintra’s United States branch and became director of our U.S. toll
roads concession companies I-66 Express Mobility Partner Holdings LLC (since 2020); I-77 Mobility Partners
Holding LLC (since 2020); LBJ Infrastructure Group Holding LLC (since 2020), NTE Mobility Partners Holding LLC
(since 2020; he also served as president between 2021-2022) and NTE Mobility Partners Segments 3 Holding LLC
(since 2020; he also served as president between 2021-2022). Mr. Sacristán holds a Master of Sciences in Civil
Engineering from Universidad Politécnica de Madrid.
Luke Bugeja—Chief Executive Officer of Ferrovial Airports
Luke Bugeja has served as the Chief Executive Officer of Ferrovial Airports, the subsidiary that heads our Airports
Business Division, since 2021. He has also served as a non-executive director of FGP Topco and HAH (since 2021);
non-executive chairman of NTO and YDA Turkey, the concession company managing Dalaman Airport (since 2022).
He is also the independent chairman of Interflour Group, a Singaporean grain producer (since 2019). Previously, he
was a non-executive director of Eurostar International Limited (2020-2021), a railway company operating the Eurostar
train services. Mr. Bugeja has spent most of his career in the aviation industry, focusing on airport infrastructure with
operational, commercial, and financial experience in airlines, airports, and investment management. He worked at
Australian airlines Qantas Airways (1989-2000) and Virgin Blue (2000-2005) and has held senior positions, including
as chief operating officer, at Changi Airports International in Singapore (2018-2019) and non-executive director roles
at the London City Airport in the U.K. (2016-2018), Brussels Airport in Belgium (2008-2018), and Bristol Airport in
the U.K. (2005-2018). Mr. Bugeja also held senior executive positions at Macquarie Bank Limited / MAp Airports
(2005-2011), an Australian airport operator, and at Ontario Airport Investments (2011-2018), a U.K. airport operator
owned by the Ontario Teachers’ Pension Plan. Most recently, Mr. Bugeja was a senior advisor for OMERS
Infrastructure (2019-2020), the infrastructure investment advisory branch of OMERS, the pension plan for municipal
employees in the province of Ontario and was an operating partner at Hermes GPE (2020-2021), a U.K. equity
partnership investment entity. He holds a Diploma in Business Travel and Tourism from William Angliss College and
an MBA from Deakin University.
Ignacio Gastón—Chief Executive Officer of Ferrovial Construction
Ignacio Gastón has served as the Chief Executive Officer of Ferrovial Construction, the subsidiary that heads our
Construction Business Division, since 2018. He is also a Supervisory Board director of Budimex, our Polish
construction subsidiary (since 2018). He joined Ferrovial in 1995 and has since held various high-level positions in the
Construction Business Division and the Services Business Division. In 2003, Mr. Gastón joined Amey as
development director for rail and in 2007 he went on to take the position of construction director at Ferrovial
Construction U.K. In 2013, Mr. Gastón was appointed managing director at Ferrovial Services Spain (2013-2018). He
has also served as chairman of the Board of our former affiliate Car Sharing Mobility Services (2017-2018) and chief
executive officer of Compañía Española de Servicios Públicos Auxiliares (“Cespa”) (2013-2016). Mr. Gastón holds a
masters degree in Civil Engineering from Universidad de Cantabria and an MBA from the London Business School.
María José Esteruelas—Chief Executive Officer of Ferrovial Energy
María José Esteruelas has served as the Chief Executive Officer of our Energy Division since January 2024. She also
serves as a director of Ferrovial’s subsidiaries Ferrovial Energìa, S.A.U. (formerly Siemsa Industria, S.A.) (since
2021), Siemsa Control y Sistemas, S.A.U. (since 2021), Ferrovial Energy Solutions LLC (since 2021), Ferrovial
Webber Energy LLC (since 2022), Ferrovial Energy US LLC (since 2024), BXF Energia Spzoo (since 2024),
Ferrovial EG SE (since 2024), Ferrovial Energy Pty Ltd (since 2024), Ferrovial Transco International BV (since
2024), Ferrovial Power Infrastructure Chile Spa (since 2024), and Ferrovial Infraestructuras Energéticas, S.A.U. (since
2024).
Previously, she was a member of the Board of Directors of Applus+, a Spanish group specialized in providing quality
inspection and certification advisory services (2019-2024) and a director of Ferrovial Energía Construción SpA
(formerly Siemsa Chile Spa) from (2021 to 2024). She was also a member of the Board of Directors and a member of
the Compensation and Remuneration Committee of Atlantica, a U.K sustainable infrastructures company (2014-2017);
and the Executive Vice President, South America, at ASA IBEROAMERICA S.A., a Spanish energy company part of
the Abengoa group (2011-2018). Ms. Esteruelas has also held various executive roles at our subsidiary Ferrovial
Construcción, S.A., as the Managing Director of Energy Solutions (2021-2024), and Abengoa, a Spanish green
infrastructure, energy and water multinational company, including as the CEO of the Americas region of Abengoa
Abenewco 1 S.A. (2019-2021) and as CEO of Abengoa Energía S.A. (2018-2019). Ms. Esteruelas holds an Industrial
Electrical Engineering degree from the Universidad Pontificia Comillas, a Master’s Degree in Operations Management
from IE Business School, and a PDG from IESE Business School.
6.A.3Family Relationships and Other Information
Rafael del Pino, the Chairman of our Board is the brother of María del Pino, who serves as one of our directors. Aside
from this, there are no other family relationships between any of our executive officers and our directors.
Ignacio del Pino, the Company’s Chief Investment Officer, is the son of our Chairman, Rafael del Pino. His
compensation in 2024 exceeded $120,000 and is consistent with the compensation paid to similarly-situated
employees of the Company. Ignacio del Pino holds a BS in Mechanical Engineering from MIT and an MBA from the
Stanford Graduate School of Business.
Following the appointment of our director Alicia Reyes to the general and supervisory board of Energias de Portugal
(EDP), which operates in the energy sector, it was discussed during two meetings of the Board of Directors during
2024 whether such appointment resulted in potential conflict of interest considerations. The Board of Directors
ultimately concluded that this appointment in itself did not result in Ms. Alicia Reyes having a de facto conflict of
interest, and that it would be assessed on a case-by-case basis whether a conflict of interest could arise in the future in
relation to any specific matters in connection therewith.
6.A.4Director or Executive Officer Involvement in Certain Proceedings
Mr. Urquijo was a member of the board of directors of Abengoa S.A. which entered into bankruptcy proceedings in
2021, that finalized on April 28, 2023, after the bankruptcy entered its liquidation phase.
Ms. del Pino was the chairman of Altais Invest, SICAV, S.A. when it was voluntarily wound up and liquidated in
2022.
6.BCompensation
6.B.1Overview
Our remuneration policy establishes a competitive remuneration package that, we believe, promotes the long-term
development and sustainable value creation of the Company, avoids the assumption of excessive or inappropriate risks
and aligns the interests of the Company’s directors (executive and non-executive) with those of its shareholders and
other stakeholders. We believe that our remuneration policy establishes an appropriate balance between fixed and
variable remuneration components. Our Board believes the remuneration policy to be appropriate and effective in its
ability to attract and retain the best executive officers and executive and non-executive directors to run and manage the
Group.
The Board and the Nomination and Remuneration Committee are responsible for determining the appropriate
remuneration package for our directors in accordance with the remuneration policy as in effect from time to time (the
“Remuneration Policy”). The Nomination and Remuneration Committee is also responsible for proposing the basic
conditions of the contracts of the Executive Officers, including our Chief Executive Officer, and other senior
managers.
6.B.2Compensation of Directors and Executive Directors
6.B.2.1.Compensation of Directors
The director compensation in their standing as such (i.e., for their mere membership of the Board) consists of: (i) a
fixed fee; (ii) attendance fees; and (iii) a complementary fixed fee. We believe that the fixed fee and the
complementary fixed fee are competitive and serve as appropriate remuneration for the responsibility and dedication
demanded by the post of a director, but without reaching levels which may compromise the independence of the
Company’s non-executive directors (the ‘‘Non-Executive Directors”). The fixed fee is paid in quarterly settlements.
The complementary fixed compensation is paid in one lump sum at the end of the financial year. If the maximum
annual amount included in the Directors’ Remuneration Policy is exceeded, the fixed complementary compensation is
first reduced in proportion to each director.
Attendance fees are paid quarterly. The amount of the attendance fees corresponding to the chairmen of the Board, the
Executive Committee, the Audit and Control Committee and the Nomination and Remuneration Committee is double
the amounts otherwise established, in accordance with the principle of remuneration reward upon the basis of the level
of responsibility and the dedication required by the position.
In 2024, the Company and its subsidiaries did not set aside or accrue any amounts to provide for pensions and
retirement to Directors. The Company does not have any pension plans in place for Non-Executive Directors. See “—
2. Compensation for Executive Directors—3. Long-term savings system” for a description of the long term savings
system (the “Long Term Savings Plan”) available to the Chief Executive Officer.
Presented below is a breakdown of compensation payments for the Company directors (the ‘‘Directors”) in 2024:
| | | | | | |
| | | |
Fixed fee ........................................................................... | | | |
Complementary Fixed Emolument ............................... | | | |
| | | |
| | | |
| Other members of the Board | | |
Attendance fees (EUR per meeting) .............................. | | | |
| | | |
| Audit and Control Committee | | |
| Nomination and Remuneration Committee | | |
The total amount paid in 2024 to the Directors for their membership of the Board was EUR 1,900,000, which is the
maximum annual amount established in the Remuneration Policy in force at the time. This amount included (i) EUR
664,950 for attendance fees; (ii) EUR 420,000 for fixed emolument (linear); and (iii) EUR 815,050 for complementary
fixed emolument. The last figure comprised EUR 182,550 distributed among the Directors considering their length of
service on the Board during the year. It is the difference between the whole amount paid to Directors for attendance
fees and fixed emolument (linear and complementary) and the maximum annual amount established in said
Remuneration Policy.
Presented below is a description of the compensation payments to each of our Directors in their capacity as such made
during the year ended December 31, 2024, as recognized in the Audited Financial Statements for the year then ended:
| | | | | | | | |
| | | | | | | | |
| | | | | | | | |
| | |
Rafael del Pino ............................................................................. | | | | | | | | |
Óscar Fanjul ................................................................................. | | | | | | | | |
Ignacio Madridejos ...................................................................... | | | | | | | | |
María del Pino ............................................................................. | | | | | | | | |
José Fernando Sánchez-Junco ...................................................... | | | | | | | | |
Philip Bowman ............................................................................ | | | | | | | | |
Hanne Sørensen ........................................................................... | | | | | | | | |
Bruno Di Leo ............................................................................... | | | | | | | | |
Juan Hoyos .................................................................................. | | | | | | | | |
Gonzalo Urquijo ........................................................................... | | | | | | | | |
Hildegard Wortmann ................................................................... | | | | | | | | |
Alicia Reyes ................................................................................. | | | | | | | | |
(1) The numbers in the column are rounded.
6.B.2.2.Compensation of Executive Directors
The compensation package for the executive directors (the “Executive Directors”), consisting of the Chairman of the
Board and the Chief Executive Officer, consists of the following fixed and variable components: (i) fixed
remuneration; (ii) variable remuneration; (iii) long-term value remuneration; (iv) long term savings system; (v)
remuneration in kind; and (vi) severance arrangements.
The Board establishes the remuneration of individual Executive Directors, with due observance of the Remuneration
Policy. Executive Directors may not participate in the deliberations and decision-making process of the Board in
determining the remuneration and other terms of service for Executive Directors.
The following table summarizes the remuneration components for the Executive Directors.
| | | | | | | |
| | | | Annual Variable Remuneration | | Long-Term Value Remuneration |
| | | | | |
Chairman and Executive and Proprietary Director ..................... | | Target: 125% of the Fixed Remuneration Maximum: 190% of the Fixed Remuneration | Maximum (annualized): 150% of the Fixed Remuneration |
|
Chief Executive Officer and Executive Director ......................... | | Target: 100% of the Fixed Remuneration Maximum: 150% of the Fixed Remuneration | Maximum (annualized): 150% of the Fixed Remuneration |
6.B.2.2.1Fixed remuneration
The fixed annual base salary of Executive Directors is determined through consideration of the executive duties
associated with the specific role of each Executive Director and comparative remuneration for listed companies similar
to us. The fixed remuneration is paid on a monthly basis.
6.B.2.2.2Remuneration in kind
The Company has taken out life insurance policies to cover the risk of death and disability, of which the Executive
Directors are beneficiaries. In addition, Executive Directors are eligible for other social benefits such as a company
car, medical insurance, life and accident insurance, liability insurance and other non- material benefits, in an amount of
up to EUR 50,000. The Chairman and the Chief Executive Officer may allocate part of their annual gross fixed
remuneration to obtaining some of the products or services offered by the Company as part of the flexible
remuneration plan.
6.B.2.2.3Long-term savings systems
This component of the remuneration scheme consists of an extraordinary and deferred remuneration that will only
become effective when, on reaching a certain age, the Chief Executive Officer leaves the Company by mutual
agreement with the Company, with no consolidated rights. To cover this extraordinary remuneration, the Company
will make annual contributions to a Group savings insurance policy, of which the Company itself is the policyholder
and beneficiary. For an explanation of similar compensation received by the Executive Officers and other senior
management, see “—3. Compensation of Executive Officers and Other Senior Management.”
This extraordinary remuneration shall not exceed 20% of the total annual remuneration calculated as the fixed annual
base remuneration plus the annual variable remuneration target of 100%. The amount of extraordinary remuneration
accumulates annually to the savings plan. An amount equal to 50% of the benefit received by the Chief Executive
Officer upon termination of the employment relationship with the Company shall be subject to a two-year post-
contractual non-competition agreement entered into between the Chief Executive Officer and the Company.
The right to receive the extraordinary remuneration shall be incompatible with the payment of any compensation that
the Chief Executive Officer may be entitled to receive as a result of the termination of the employment relationship
with the Company.
6.B.2.2.4Variable Elements
6.B.2.2.4.1Annual Variable Remuneration (“AVR”)
AVR, which is paid in cash, is linked to individual performance and to the achievement of specific, predetermined and
quantifiable economic/financial, industrial and operating targets, as to be set out in the Company’s strategic plans. The
targets are determined without prejudice to the possibility of considering other factors, particularly in the fields of
corporate governance and corporate social responsibility. Such other factors may be of a quantitative or qualitative
nature.
The amount of the AVR is determined at the end of the year by the Board at the proposal of the Nomination and
Remuneration Committee. The Nomination and Remuneration Committee may propose adjustments to the variable
remuneration determined by the Board under exceptional circumstances due to internal or external factors.
Additionally, the remuneration related to the results of the Company shall consider any qualifications recorded in the
report of the external auditor which might impair the cited results.
If Executive Directors receive fees for attendance at meetings of the boards and committees of other companies related
to Ferrovial, the sums received for this purpose shall be deducted from the AVR of each Director.
The AVR calculation tests whether the quantitative and qualitative targets have been met.
▪Quantitative targets: these targets have a minimum weight of 70% of the entire incentive and consist of
metrics that ensure an appropriate balance between the financial and operational aspects of managing the
Company.
▪Qualitative targets: these targets relate to environmental, social and corporate governance (ESG) factors
and have a maximum weight of 30% of the overall incentive. Qualitative targets are principally linked to the
evaluation of the individual performance of the Executive Directors.
The current target amount of the AVR for the Chairman and the Chief Executive Officer is as follows:
▪Chairman: 125% of the fixed remuneration and exceeding targets up to 190% of the fixed remuneration.
▪Chief Executive Officer: 100% of fixed remuneration and exceeding targets up to 150% of the fixed
remuneration.
6.B.2.2.4.2Long-term Variable Remuneration (“LTVR”)
Executive Directors participate in a long-term variable remuneration system based on performance shares delivery
plans, in which other executives and key professionals of the Group also participate (the “LTVR”). These plans are
usually structured in overlapping multiyear cycles (currently three years), granting “units” each year (which may be
converted into ordinary shares at the end of the vesting period (currently three years) if the metrics to which the LTVR
is subject are fulfilled). The LTVR can be summarized as follows:
The 2020-2022 plan
▪The 2020-2022 plan was approved for the Executive Directors and certain other managers of the Group by
the Ferrovial, S.A. Board on December 19, 2019, and consequently approved for the Executive Directors at
the general meeting of Ferrovial, S.A. on April 17, 2020.
▪The 2020-2022 Long-Term Remuneration Plan (the “LTRP”) provides for the allocation of “units,”
potentially convertible into ordinary shares, in 2020, 2021 and 2022. These ordinary shares, as the case may
be, are to be delivered in the year in which the third anniversary of the allocation of the corresponding units
is reached (i.e., 2023 for the 2020 grant, 2024 for the 2021 grant, and 2025 for the 2022 grant).
▪The “units” granted under the 2020-2022 LTRP may be converted into ordinary shares if (i) the beneficiaries
remain in the Company for a period of three years from the date of grant of the units, except in exceptional
circumstances such as retirement, disability or death, and (ii) certain objectives linked to internal or external
metrics reflecting economic-financial and value creation for the company are met, as approved by the board
of directors of Ferrovial, S.A. and the general meeting of Ferrovial, S.A.
The 2023-2025 plan
▪The 2023-2025 LTRP was approved for the Executive Directors and certain other managers of the Group by
the Ferrovial Board on December 15, 2022. The 2023-2025 LTRP was also consequently approved for the
Executive Directors at the general meeting of Ferrovial, S.A. on April 13, 2023, as required under Spanish
corporate law.
▪The 2023-2025 LTRP provides for the grant of “units,” potentially convertible into ordinary shares, in 2023,
2024 and 2025. These ordinary shares, as the case may be, will be delivered in the year in which the third
anniversary of the grant of the corresponding units is reached (i.e., 2026 for the 2023 grant, 2027 for the
2024 grant and 2028 for the 2025 grant).
▪The “units” granted under the 2023-2025 LTRP may be converted into ordinary shares if (i) the beneficiaries
remain in the Company for a period of three years from the date of grant of the units, expect in
circumstances such as retirement, disability or death, and (ii) certain objectives linked to internal or external
metrics reflecting economic-financial, value creation for the company and ESG targets are met, as approved
by the board of directors of Ferrovial, S.A. and the general meeting of Ferrovial, S.A.
Both the 2020-2022 plan and the 2023-2025 plan as they apply to the Executive Directors, were submitted to approval
at the general shareholders’ meeting of Ferrovial International SE as it pertains to the plans’ post-Merger
implementation on June 13, 2023, and were approved during this meeting.
The chart below contains a summary of the LTVR granted under the 2020-2022 plan and 2023 plan and 2024 plan:
| | | | | | | | | | | | | | | | | |
| | At the beginni ng of 2023 financi al year | Granted during the 2023 financial year | Granted during the 2024 financial year | Consolidated during the 2023 financial year | Consolidated during the 2024 financial year | Instrum ents expired and not exercise (2023) | At the end of the 2023 financial year | Instrumen ts expired and not exercise 2024 | At the end of the 2024 financial year |
| | | | | | | No. of consoli dated Equiv alent | | Gross profit from consolidated share | | No . of consolid ated equivale nt | | Gross profit from consolidate d share | | | | |
| | | | | | | | | | | | | | | | | |
| | | | | | | | | | | | | | | | | |
| | | | | | | | | | | | | | | | |
| | | | | | | | | | | | | | | | | |
| | | | | | | | | | | | | | | | | |
| | | | | | | | | | | | | | | | | |
Chief Executive officer ....... | | | | | | | | | | | | | | | | | |
| | | | | | | | | | | | | | | | |
| | | | | | | | | | | | | | | | | |
| | | | | | | | | | | | | | | | | |
| | | | | | | | | | | | | | | | | |
6.B.2.2.5Pension and fringe benefits
Executive Directors do not receive any pension or fringe benefits other than those mentioned in “—2. Remuneration in
kind.” Executive Directors may allocate part of their annual gross fixed remuneration to obtain some of the products or
services offered by the Company under the flexible remuneration plan, such as life insurance, accident insurance,
health insurance and company cars.
The Chief Executive Officer participates in a deferred compensation scheme that only takes effect when he leaves the
Company by mutual agreement with the Company upon reaching a certain age, and therefore there are no consolidated
rights. See “—3. Long-term savings systems.”
6.B.2.2.6Severance arrangements and compensation for non-competition agreements
We have contractual severance arrangements in place with the Executive Directors. The relevant key conditions of the
Chairman’s and the Chief Executive Officer’s contracts are described below:
Chairman:
▪Termination and compensation: termination of the Chairman’s contract for any reason whatsoever shall not
entitle the Chairman to any compensation.
▪Non-competition: the contract contains a post-contractual non-competition obligation for a period of two
years after termination of the contract, compensated by two annuities of the Chairman’s fixed remuneration.
Chief Executive Officer:
▪Termination and compensation: in the event of termination, the Chief Executive Officer shall be entitled to
gross compensation equal to the greater of the following two amounts: (i) the amount resulting from the sum
of the annual amount of the fixed remuneration and the annual variable target remuneration corresponding to
the year in which the contract is terminated; or (ii) the amounts accumulated on the date of termination of the
contract in the extraordinary deferred remuneration plan, with the limit of two annual payments of the total
annual remuneration.
▪Non-competition: 50% of the total amount the Chief Executive Officer could receive in case of termination
of the contract will be subject to compliance with a two-year post-contractual non- competition agreement.
Presented below is a description of the compensation for Executive Directors for the year ended December 31, 2024,
as recognized in the Audited Financial Statements for the year then ended:
| | | |
| | |
| |
| | | |
Fixed remuneration .......................................................................................................................... | | |
Variable remuneration ..................................................................................................................... | | |
Plans linked to shares ....................................................................................................................... | | |
Other (1) ............................................................................................................................................... | |
Total ................................................................................................................................................ | | |
| | |
| | | |
Fixed remuneration ........................................................................................................................... | | |
Variable remuneration .................................................................................................................... | | |
Share plan linked to objectives ......................................................................................................... | | |
Other (1) ................................................................................................................................................. | |
Total ................................................................................................................................................. | | |
(1)Item "other" corresponds to a life insurance premium and other remuneration in kind.
6.B.2.2.7Employment and Service Agreements
The Executive Directors have entered into service agreements with us. The service agreements are entered into for an
indefinite term. The service contract with the Chairman does not contain provisions for benefits upon termination of
employment. The service contract with the Chief Executive Officer contains severance provisions which provide for
compensation for the loss of income resulting from a termination of employment in addition to a notice period of 3
months (as described in further detail above). The Non-Executive Directors do not have an employment or severance
contract with the Company. The Company may provide the Non- Executive Directors with a short-form appointment
letter, setting forth the principles of a Non-Executive Director’s appointment and relationship with the Company,
provided, however, that the Non-Executive Directors will be remunerated within the limits of the Remuneration
Policy.
The service contract with the Chief Executive Officer was amended in July 17, 2023, to reflect a change on his place
of work, which, following the Merger, is located in Amsterdam, The Netherlands. The amendments to the Chief
Executive Officer’s service contract also update his compensation to reflect the changes approved under the most
recent version of the Remuneration Policy, approved by the 2023 general shareholders’ meeting of Ferrovial.
6.B.3.Compensation of Executive Officers and Other Senior Management
In 2024, the total remuneration for the members of the senior management, including the Executive Officers with the
exception of the Executive Directors (i.e., the Chairman and the Chief Executive Officer), amounted to EUR
19,355,109, comprised of EUR 5,793,252 in fixed remuneration, EUR 6,205,152 in variable remuneration, EUR
5,637,927 in shares under the LTRP and EUR 1,492,509 in life insurance premiums, Council memberships in other
subsidiaries and expatriates’ premiums and 226,269 in separation of members of Non-Management Committee in
2024 (amount subject to income tax).
In 2024, no amounts were set aside or accrued by us or our subsidiaries to provide for pensions and retirement or
similar benefits of senior management, except for a contribution (including EUR 5,427 of expenses) of EUR 1,808,955
to a group savings insurance policy under which the Company is both the policy holder and beneficiary in relation to
an extraordinary remuneration scheme for senior management, similar to the Long Term Savings Plan described for
the Chief Executive Officer. For further details on the operation of the Long Term Savings Plan, please see “—2.
Compensation of Directors and Executive Directors—2. Compensation of Executive Directors—3. Long-term savings
systems.” Under this extraordinary remuneration scheme, senior managers are, subject to the fulfillment of certain
conditions, paid extraordinary remuneration upon leaving their respective position. Ferrovial does not have any
pension plan in place for senior management.
6.B.4.Equity Incentive Plan
The 2020-2022 and 2023-2025 LTRP described above are provided to Executive Directors, senior managers and
managers. The annual cost for the 2020-2022 plan cannot exceed EUR 22,000,000 and is capped at a maximum of 350
managers. The annual cost for the 2023-2025 plan cannot exceed EUR 22,700,000 and is capped at a maximum of 340
managers. Both plans are conditional on employees remaining at the Company for three years as from the date they are
granted (barring special circumstances). The 2020-2022 plan is also conditional on the achievement of certain ratios
calculated on the basis of business cash flow and total shareholder return relative to a peer group during the vesting
period. The 2023-2025 plan is conditional on the achievement of certain ratios calculated on the basis of business cash
flow, total shareholder return relative to a peer group during the vesting period and certain ESG indicators.
| | | | | |
| | | |
Number of ordinary shares at beginning of year ....... | | | | | |
Plans granted ................................................................... | | | | | |
Plans settled ..................................................................... | | | | | |
Shares surrendered and other ........................................... | | | | | |
Shares exercised .............................................................. | | | | | |
Number of ordinary shares at year-end ...................... | | | | | |
There were 1,729,752 shares outstanding in relation to these plans as of December 31, 2024.
In addition to the ordinary shares granted under the LTRP, all Ferrovial employees who are Spanish residents are
allowed, pursuant to PIT Law, to request to receive payment of their compensation in ordinary shares in lieu of cash,
up to an annual maximum amount of EUR 12,000.
6.CBoard Practices
6.C.1Board
We have a one-tier board consisting of two Executive Directors (the Chairman and the Chief Executive Officer) and
ten Non-Executive Directors.
6.C.1.1Powers, Responsibilities and Functioning
The Board is charged with the management of the Company. The Board is responsible for the continuity of the
Company and its affiliated enterprise and for sustainable long-term value creation of the Company and its affiliated
enterprise. The Board is responsible for determining the Company’s strategy, aimed at sustainable long-term value
creation by the Company and its affiliated enterprise, enhancing its performance, identifying, analyzing and managing
the risks associated with its strategy and activities, and establishing and implementing internal procedures to ensure
that all relevant information is known available to the Board in a timely manner. The Board takes into account the
impact the actions of the Company and its affiliated enterprise have on people and the environment and to that end
weighs the stakeholder interests that are relevant in this context. The Board is also responsible for stimulating
openness and accountability within the Board and between different corporate bodies within the Company, while
creating a culture aimed at sustainable long-term value creation for the Company and its affiliated enterprise. In
fulfilling their responsibilities, the Directors are required to be guided by the interests of the Company and its affiliated
enterprise, taking into consideration the interests of the Company’s stakeholders (which include but are not limited to
its shareholders, its creditors and its employees).
The Board may allocate its duties among the Directors by means of the Board Rules or otherwise in writing, subject to
any limitations provided for by law or in the Articles of Association. Directors may validly adopt resolutions on
matters that fall within the scope of their duties.
The Executive Directors are primarily responsible for the day-to-day management of the Company. The Executive
Directors must timely provide the Non-Executive Directors with the information they need to carry out their duties.
The Non- Executive Directors supervise the Executive Directors’ management and performance of duties and the
Company’s general affairs and its business. The Non-Executive Directors also render advice to the Executive
Directors. The Non-Executive Directors also perform any duties allocated to them under, or pursuant to, the law, the
Articles of Association and the Board Rules.
The Board, as well as each Executive Director, acting individually, may represent the Company. In addition, the
Company may authorize persons, whether or not employed by the Company, to represent the Company on a
continuing basis or authorize such persons to represent the Company in a different manner.
6.C.1.2Board Rules
Pursuant to the Articles of Association, the Board may, in writing, adopt, and has adopted, board rules (the “Board
Rules”) concerning its organization, decision-making, the duties and organization of committees and other internal
matters concerning the Board, the Executive Directors, the Non-Executive Directors, and the committees established
by the Board.
6.C.1.3Composition, Appointment and Removal
The Articles of Association provide that the Board consists of one or more Executive Directors and two or more Non-
Executive Directors. Pursuant to the Articles of Association, the majority of the Board must consist of Non-Executive
Directors. The Board determines the exact number of Directors, as well as the number of Executive and Non-
Executive Directors, provided that the number of Directors must be at least three and cannot exceed twelve. The Board
is currently composed of twelve members, which facilitates an efficient effective and participatory operation. There
are two Executive Directors (the Chairman and the CEO) and ten Non-Executive Directors.
The Board shall designate one of the Directors as Chairman and shall designate one of the Independent Directors as
Lead Director if the Chairman is not an Independent Director. The Board shall also designate one or more Directors as
Vice-Chairman. In case of more than one Vice-Chairman, the Board shall assign each Vice-Chairman a rank. The
Board may also grant other titles to Directors. The Board may designate a person as Secretary and may also designate
one or more persons as Vice-Secretary. The Board has designated one of the Executive Directors as Chairman, one of
its Non-Executive Directors as Vice-Chairman, one CEO, and one of the Independent Directors as Lead Director.
The Chairman has the ultimate responsibility for the effective operation of the Board. The Chairman’s duties include
preparing and submitting to the Board a schedule of meeting dates and agendas, calling meetings of the Board, setting
the agenda for the meetings, leading the deliberations while ensuring that sufficient time is given to discussion of
strategic questions, organizing the periodic evaluation of the Board, and arranging relevant trainings for Directors
when circumstances so advise. He also acts as the main contact for the Directors and shareholders regarding the
functioning of the Board.
The Vice-Chairman stands in for the Chairman in the latter´s unavoidable absence or inability to act and acts as a
contact for Directors regarding the functioning of the Chairman or the Lead Director.
The Lead Director, amongst other duties, is specifically empowered to request the convening of the Board or include
new items on the agenda of a Board meeting already convened, coordinate and convene the Non-Executive Directors
and direct, if applicable, the periodic evaluation of the Chairman. Similarly, the Lead Director chairs meetings of the
Board in the absence of the Chairman and Vice-Chairmen and gives voice to any concerns of the Non-Executive
Directors. Alongside the Chairman, the Lead Director acts as the main contact for the Directors and shareholders
regarding the functioning of the Board. The Lead Director also has, together with the Chairman, the duties set out in
article 17.3 of Board Rules, including ensuring the proper function on the Board, that the Board has proper contact
with the General Meeting and that effective communication with shareholders is assured.
The General Meeting appoints the Directors pursuant to a nomination thereto by the Board. The nomination for
appointment of a Director sets out whether such Director is nominated for appointment as Executive Director or Non-
Executive Director. The nomination must be included in the notice of the General Meeting at which the nomination is
to be considered.
Neither Dutch law nor the Articles of Association or Board Rules contain provisions on the retirement of Directors
based on an age-limit, or a number of ordinary shares required to qualify for the role of Director.
The General Meeting may suspend or dismiss a Director. A suspension by the General Meeting may, at any time, be
discontinued by the General Meeting. The Board may, at any time, suspend an Executive Director. A suspension by
the Board may, at any time, be discontinued by the Board or by the General Meeting. A suspension may be extended
one or more times, but the total duration of the suspension may not exceed three months. If at the end of that period,
no decision has been taken on termination of the suspension or on dismissal, the suspension ends.
If the seat of an Executive Director or the seat of a Non-Executive Director is vacant or upon the inability of such
director, the remaining Executive Directors (as to an Executive Director vacancy or inability) shall temporarily be
entrusted with the tasks and duties of that Executive Director, provided that the Board may provide for a temporary
replacement, and the remaining Non-Executive Directors (as to a Non-Executive Director vacancy or inability) shall
temporarily be entrusted with the performance of the duties and the exercise of the authorities of that Non-Executive
Director, provided that the Board may provide for a temporary replacement.If there are no Executive Directors in
office and able to act, the Non-Executive Directors may decide that they are entrusted with the tasks and duties of the
Executive Directors, notwithstanding that the Board may provide for a temporary replacement. If there are no Non-
Executive Directors in office and able to act, the General Meeting will be authorised to temporarily entrust the tasks
and duties of the Non-Executive Directors to one or more temporary replacements.
The Executive Directors have entered into service agreements with us, but only the service contract with the Chief
Executive Officer contains severance provisions. For additional information, including regarding Non-Executive
Directors in this regard, see “—B.2.2.7 Employment and Service Agreements.”
6.C.1.4Director Independence
Subject to the “foreign private issuer exemption,” Nasdaq Listing Rule 5605(b)(1) requires that a majority of the board
of directors of companies listed on Nasdaq be independent. An “independent director” is defined generally as a person
who has no relationships with the listed company that would interfere with the exercise of independent judgment in
carrying out their responsibilities (directly or indirectly, as a partner, stockholder, shareholder, or officer of an
organization that has a relationship with the listed company or as a family member of someone holding any of those
positions).
The Company does not rely on the “foreign private issuer exemption” from Nasdaq’s requirement that a majority of
the Company’s Board be independent. Under the Board Rules, the Board is comprised by the majority of independent
directors. The Board consists of twelve directors, nine of whom qualify as independent directors as defined in the
Nasdaq corporate governance rules.
6.C.1.5Term of Appointment
The Articles of Association provide that a Director shall be appointed for a term as set out in the nomination for
appointment. The term of appointment of a Director lapses (at the latest) at the end of the annual General Meeting held
in the third calendar year following the year of appointment. A Director may be re-appointed with due observance of
the Articles of Association and applicable law. The Board has drawn up a rotation schedule for the Non-Executive
Directors which is published on Ferrovial’s website.
6.C.1.6Diversity
Pursuant to Dutch law, Dutch listed companies, such as the Company, are required to apply a mandatory transitional
quota of at least one-third women and at least one-third men in relation to appointments of non-executive directors. A
resolution to appoint a non-executive director that does not contribute to the mandatory quota while the quota is not
met is null and void. In such event, the person in question will not become a Non-Executive Director. The Board
currently comprises six male Non-Executive Directors and four female Non-Executive Directors.
In addition, large listed Dutch companies must set appropriate and ambitious gender balance targets for the executive
directors, non-executive directors and senior management levels. The targets need to be included in a plan, which has
to outline the actions required to meet the gender balance targets. Such companies will also be required to report to the
Dutch Social and Economic Council annually, within ten months at the end of the financial year, on the annual targets,
how to achieve these and, if it has not met the targets, why and how this will be remedied. Such companies will also
have to include the information on gender balance target reporting in the annual management report. These
requirements will formally apply to Ferrovial as of financial year 2025. We must disclose information on our diversity
in our Dutch annual management report.
6.C.1.7Board Meetings and Decisions
Unless the applicable Dutch law, the Articles of Association or the Board Rules provide otherwise, resolutions of the
Board are adopted by a majority of the votes cast in a meeting to which the majority of Directors entitled to vote
attend, either in person or simultaneously through technical means (the latter, following authorization of the
Chairman). Voting and adopting resolutions in writing (including by email) and without a meeting is only permitted
when no Director expresses opposition to this procedure. In the event of a tied vote, the Chairman has a casting vote,
provided at least two other Directors entitled to vote are in office. At a Board meeting, resolutions can only be validly
adopted if the majority of the Directors entitled to vote attend the meeting in person or represented.
Pursuant to the Board Rules, the Board shall meet at least once every three months. Additionally, the Board shall also
meet whenever the Chairman, the Lead Director or at least three Directors have requested a meeting. Directors are
expected, as much as possible, to attend the meetings of the Board, the Committees of which they are a member and
the General Meeting, in person.
Directors may, when attendance to the meeting in person is not possible, grant a proxy to another Director for each
session by any written means (including email), with the appropriate instructions.
A Director may only be represented at a meeting of the Board by another Director who is entitled to vote. Non-
Executive Directors may only grant a proxy to another Non-Executive Director.
The approval of the General Meeting is required for resolutions of the Board regarding an important change in the
identity or character of the Company or its business. The approval of the General Meeting is in any event required for
Board resolutions relating to:
▪the transfer of the business enterprise, or practically the entire business enterprise, to a third party;
▪concluding or cancelling a long-lasting cooperation of the Company or a Group Company with another legal
person or company, or as a fully liable general partner in a partnership, provided that the cooperation or
cancellation is of material significance to the Company; and
▪acquiring or disposing of a participating interest in the share capital of a company with a value of at least
one-third of the Company’s assets, as shown in the consolidated balance sheet with explanatory notes
according to the last adopted annual accounts, by the Company or a Group Company.
The absence of approval of the General Meeting does not affect the authority of the Board or the Executive Directors
to represent the Company.
6.C.2Conflicts of Interest
Pursuant to Dutch law and the Articles of Association, if a Director has a direct or indirect personal conflict of interest
with the Company and its business as referred to in article 2:129(5) BW, such Director may not participate in the
Board’s deliberations and decision-making on that matter.
Pursuant to the Board Rules, an Executive Director must, without delay, report any potential conflict of interest that is
material to the Company or such Executive Director to the other Executive Directors and the Lead Director or, if the
Chairman is an Independent Director, the Chairman.
A Non-Executive Director must, without delay, report any potential conflict of interest that is material to the Company
or such Non-Executive Director to the Lead Director or, if the Chairman is an Independent Director, the Chairman. If
the conflict of interest concerns the Lead Director or, if the Chairman is an Independent Director, the Chairman, such
report must be made to the Vice-Chairman. In each case, the Director must provide all relevant information on this
subject, including information relevant to the situation regarding his or her spouse, registered partner or life
companion, foster child or relative by blood or marriage up to the second degree.
If no resolution of the Board can be adopted as a consequence of such a personal conflict or article 2:169(4) BW being
applicable to all Directors, the resolution may be adopted by the General Meeting. Article 2:169(4) BW provides that,
in case of a related party transaction, a director may not participate in the Board’s deliberations and decision-making in
case the director is involved in the transaction with the related party.
6.C.3Board Committees
The Board has constituted, from among its members, an Executive Committee, an Audit and Control Committee and a
Nomination and Remuneration Committee. Among other duties, the Audit and Control Committee and the Nomination
and Remuneration Committee have a preparatory and/or advisory role to the Board. Each of these committees is
governed by a charter on its role, responsibilities and functioning. These committees consist of Directors who are
appointed for such committees by the Board. The committees report their findings to the Board, which is ultimately
responsible for all decision-making. Each committee’s members and functions are described below.
6.C.4Executive Committee
Pursuant to the Board Rules, the Executive Committee may resolve on all matters on which the Board can resolve,
subject to applicable law and the Articles of Association or as explicitly provided otherwise in the Board Rules. The
entirety of the members must consist of Directors. Among its duties, the Executive Committee monitors the Group’s
financial information, the evolution of the main business indicators, as well as the status of the most relevant matters
of the Company. The Executive Committee shall ordinarily meet once per month, and as often as the Chairman should
deem fit for the proper operation of the Company.
The Executive Committee consists of Rafael del Pino (the Chairman), Óscar Fanjul, Ignacio Madridejos, María del
Pino, José Fernando Sánchez-Junco, and Juan Hoyos.
6.C.5Audit and Control Committee
In addition to the functions that may be attributed to it by the Board, the Audit and Control Committee holds the
powers determined by applicable law, the Articles of Association and the Board Rules. The Audit and Control
Committee oversees the Company’s accounting and financial reporting processes and the audits of the financial
statements of the Company and assists the Board in its decision-making in relation to the supervision of the integrity
and quality of the Company’s financial and sustainability reporting and the effectiveness of the Company’s internal
risk management and control systems. Among its duties, the Audit and Control Committee monitors the financial and
the assurance of sustainability reporting processes, reviews and discusses the annual audited financial statement and
the management report with management and the independent auditor, prepares the selection of the independent
auditor, advises the Board in relation to its decision-making on the independent auditor’s nomination and assurance
provider of sustainability reporting for appointment or reappointment, or its dismissal, and makes recommendations to
the Board on the appointment or dismissal of the senior internal auditor.
The Audit and Control Committee meets when convened by its chairperson, who must do so whenever requested to do
so by the Board, the Chairman of the Board, or two of the Committee members, and in any case, at least once per
quarter and whenever appropriate for the proper exercise of its duties.
Under the Nasdaq listing rules, the audit committee shall consist of at least three directors, all of whom shall be
independent within the meaning of Section 5605(a)(2) of the Nasdaq listing rules and meet the criteria for
independence set forth in Rule 10A-3 or Rule 10C-1 of the Exchange Act. The majority of the audit committee must
also qualify as independent under the applicable rules of the Dutch Corporate Governance Code. Each member of the
Audit and Control Committee is independent under the applicable rules of Nasdaq and the SEC. The chairperson of
the Audit and Control Committee shall always be an independent Non-Executive Director under the applicable rules of
the Dutch Corporate Governance Code. The Audit and Control Committee currently complies with these
independence requirements.
Each committee member must meet the financial literacy requirements under the applicable rules of Nasdaq and SEC,
and at least one member must fulfill audit committee “financial expert” requirements under the applicable rules of
Nasdaq, and the SEC, and financial experience requirements under the Dutch Decree on the Establishment of Audit
Committees (Besluit instelling auditcommissie). All members of the Audit and Control Committee meet the
requirements for financial literacy under the applicable rules and regulations of Nasdaq and the SEC.
The Audit and Control Committee consists of Óscar Fanjul (chairman), Philip Bowman, Gonzalo Urquijo and Alicia
Reyes. Gonzalo Urquijo is an audit committee “financial expert” as defined by the SEC rules and has the prior
financial experience required under the Dutch Decree on the Establishment of Audit Committees.
6.C.6Nomination and Remuneration Committee
In addition to the function that may be attributed to it by the Board, the Nomination and Remuneration Committee
holds the powers set forth by the applicable law and regulations, the Articles of Association and the Board Rules. The
Nomination and Remuneration Committee identifies individuals qualified to become Directors, consistent with criteria
approved by the Board, recommends that the Board selects the director nominees to be presented by the Board to the
General Meeting, and prepares decision-making of the Board relating to the compensation of Directors and executive
officers. Among its duties, the Nomination and Remuneration Committee identifies qualified individuals to be
nominated for appointment as Directors and recommends to the Board on the nominees for election by the General
Meetings, prepares the Board’s periodical assessment of the size and composition of the Board and makes
recommendations to the Board with respect to the remuneration policy and the remuneration of each individual
Director, including Executive Directors, and reviews and sets or makes recommendations to the Board with respect to
the remuneration of other executive officers that do not serve as Directors. Furthermore, the Nomination and
Remuneration Committee monitors compliance with the Remuneration Policy set by the Company and periodically
reviews the Remuneration Policy for Directors and senior managers.
The Nomination and Remuneration Committee meets when convened by its chairperson, who must do so whenever
requested by the Board, the Chairman, or two of its members, and in any case, whenever appropriate for the proper
exercise of its duties.
The number of members of the Nomination and Remuneration Committee is determined by the Board and shall
consist of at least two members. The majority of the committee members shall be independent under the applicable
rules of Nasdaq and the SEC. The majority of the committee members should also qualify as independent under the
Dutch Corporate Governance Code. The chairperson of the Nomination and Remuneration Committee shall always be
an independent Non-Executive Director under the Dutch Corporate Governance Code. The Nomination and
Remuneration Committee currently complies with these requirements.
The Nomination and Remuneration Committee consists of Bruno Di Leo (chairman), José Fernando Sánchez-Junco,
Hanne Sørensen and Gonzalo Urquijo.
6.DEmployees
As of December 31, 2024, we had 25,501 employees. As of December 31, 2024, we had 25,264 full-time employees
and 237 part-time employees, out of which 3,969 employees were under a temporary employment contract. In 2024,
over 4,604 of our employees were based in the United States, with the remainder in various countries including Spain
and the Netherlands. We believe we offer our employees competitive compensation packages and a dynamic work
environment. We have generally been able to attract and retain qualified employees and maintain a core management
team. We plan to hire additional experienced and talented employees in areas such as technical production, finance,
marketing and certain technical areas as we grow our business.
We believe that we maintain a good working relationship with our employees, and we have not experienced any major
labor disputes.
6.EShare Ownership
See “Item 7. Major Shareholders and Related Party Transactions—A. Major Shareholders.”
6.FDisclosure of a Registrant’s Action to Recover Erroneously Awarded Compensation
None.
ITEM 7. MAJOR SHAREHOLDERS AND RELATED PARTY TRANSACTIONS
7.AMajor Shareholders
The following table presents the beneficial ownership of our ordinary shares as of February 7, 2025 for:
▪each person, or group of affiliated persons, known by us to own beneficially 5% or more of our outstanding
ordinary shares;
▪each of our executive officers and members of our Board; and
▪all of our executive officers and members of our Board as a group.
Beneficial ownership is determined in accordance with the rules of the SEC and generally includes voting or
investment power with respect to securities. Under those rules, beneficial ownership includes any shares as to which
the individual or entity has sole or shared voting power or investment power. Except as otherwise indicated, and
subject to community property laws where applicable, we believe, based on the information provided to us, that the
persons and entities named in the table below have sole voting and investment power with respect to all ordinary
shares shown as beneficially owned by them.
The SEC rules for determination of substantial interest differ from the rules for determination of beneficial ownership
under Dutch securities laws. The figures included herein have been calculated taking into consideration shares
outstanding. Therefore, ordinary shares held by the Company as treasury shares have not been considered in
determining the percentage of ordinary shares beneficially owned by each shareholder, executive officer or board
member.
The percentage of beneficial ownership for the following table is based on 720,186,092 ordinary shares outstanding as
of February 7, 2025 (and excludes 9,373,859 ordinary shares held by Ferrovial as treasury shares). Shares that an
individual has the right to acquire within 60 days of February 7, 2025 through the vesting or exercise of any option,
warrant or other right are deemed to be beneficially owned by the persons holding such rights for the purpose of
computing percentage ownership of that person, but are not treated as outstanding for the purpose of computing any
other person’s ownership percentage.
Unless otherwise indicated, the address for each listed shareholder is: Gustav Mahlerplein 61-63, (Symphony Towers,
14th floor), 1082 MS Amsterdam, the Netherlands.
| | | | | |
| | | Number of Ordinary Shares Beneficially Owned | | Percentage of Ordinary Shares Beneficially Owned |
5% or Greater Shareholders |
Rafael del Pino(1) .................................................................................................. | | | | | |
María del Pino(2) .................................................................................................. | | | | | |
|
Executive Officers and Board Members |
Rafael del Pino(1) .................................................................................................. | | | | | |
Óscar Fanjul ......................................................................................................... | | | | | |
Ignacio Madridejos ............................................................................................. | | | | | |
María del Pino(2) .................................................................................................. | | | | | |
José Fernando Sánchez-Junco .............................................................................. | | | | | |
Philip Bowman ..................................................................................................... | | | | | |
Hanne Sørensen ................................................................................................... | | | | | |
Bruno Di Leo ...................................................................................................... | | | | | |
Juan Hoyos .......................................................................................................... | | | | | |
Gonzalo Urquijo ................................................................................................... | | | | | |
Hildegard Wortmann .......................................................................................... | | | | | |
Alicia Reyes ......................................................................................................... | | | | | |
Ernesto Lopez Mozo ........................................................................................... | | | | | |
Ignacio Gastón .................................................................................................... | | | | | |
Luke Bugeja ......................................................................................................... | | | | | |
María José Esteruelas .......................................................................................... | | | | | |
Andrés Sacristán ................................................................................................. | | | | | |
All executive officers and directors as a group (17 persons) | | | | | |
(*) Represents less than 1%.
(1)Based on information reported on a Schedule 13G filed on November 1, 2024 and other information known to the Company. Rafael del Pino
owns an interest of 99.87% in Rijn Capital SARL, an entity which holds 155,481,565 ordinary shares, and may be deemed to be the
beneficial owner of such ordinary shares held by Rijn Capital SARL.
(2)Based on information reported on a Schedule 13G filed on October 22, 2024 and other information known to the Company. María del Pino
directly holds 23,806 ordinary shares. María del Pino owns an approximate interest of 100% in Menosmares, S.L., an entity which holds
62,415,110 ordinary shares, and may be deemed to be the beneficial owner of such ordinary shares. María del Pino has joint control based on
voting rights of Casa Grande de Cartagena, S.A.U, an entity which holds 9,334,095 ordinary shares, and may be deemed to be the beneficial
owner of such ordinary shares.
Significant Changes
To our knowledge, other than as provided in the table above, our other filings with the SEC, public disclosure,
including without limitation Schedule 13 filings, and this Annual Report, there has been no significant change in the
percentage ownership held by any other major shareholder since January 1, 2022.
Registered Holders
As of February 7, 2025, we had one holder of record of our ordinary shares with a registered address in the United
States. This holder is Cede & Co., the nominee of The Depository Trust Company. This shareholder held in the
aggregate 493,808,822 of our outstanding ordinary shares, or 68.57% of our outstanding ordinary shares as of
February 7, 2025. The number of record holders in the United States is not representative of the number of beneficial
holders nor is it representative of where such beneficial holders are resident since many of these ordinary shares were
held by brokers or other nominees.
Change of Control Arrangements
We are not aware of any arrangement that may at a subsequent date result in a change of control of the Company.
7.BRelated Party Transactions
The following includes, among other information, a description of related party transactions, including any presently
proposed transactions, as defined under Item 7.B of Form 20-F, since January 1, 2022. In reporting the commercial
transactions between the Company (or the Group Companies) and related parties, carried out on an arm’s length basis
and in the ordinary course of business, we separate disclosure into four separate categories: (i) transactions between
Ferrovial and its directors or senior managers; (ii) transactions between Group Companies and the Company’s
directors or senior managers (iii) transactions between Group Companies and equity-accounted companies, and (iv)
transactions between Group Companies.
7.B.1Transactions between Ferrovial and its directors and senior managers
The following includes a description of transactions carried out between Ferrovial and, in each case, Ferrovial’s
Directors, Ferrovial’s key management personnel, or their respective close family members, or entities in which one or
the other holds control or joint control, or over which they could exercise significant influence. It includes transactions
with enterprises that have a director or a member of key management personnel in common with Ferrovial:
At December 31, 2024:
| | | | | | | | |
| | | | | | | | |
| | | | | | | | |
| | | | | | | | |
| | Bank and other guarantees received | | | | | | |
| | | | | | | | |
(1) A senior manager of Ferrovial,who is not considered an executive officer, is a non-executive director of Bankinter, S.A.
(2) Ms. Alicia Reyes, a Director of Ferrovial, is a non-executive director of Banco Sabadell, S.A.
At December 31, 2023:
| | | | | | | | |
| | | | | | | | |
| | | | | | | | |
| | | | | | | | |
| | Bank and other guarantees received | | | | | | |
| | | | | | | | |
| | | | | | | | |
| | Bank and other guarantees received | | | | | | |
| | | | | | | | |
| | Settlement of derivatives | | | | | | |
| | | | | | | | |
| | Bank and other guarantees received | | | | | | |
(The transactions shown in the table are presented in accordance with the current applicable regulatory and accounting frameworks, which frameworks differ from those
applicable in 2023. Accordingly, differences may exist in the presentation of these figures compared to the information reported in the financial statements for those
periods).
(3) Bank of America held a 5% stake in Ferrovial as of December 31, 2023.
(4) Ms. Alicia Reyes, a Director of Ferrovial, is a non-executive director of KBC Bank.
At December 31, 2022:
| | | | | | | | |
| | | | | | | | |
| | | | | | | | |
| | | | | | | | |
| | | | | | | | |
| | | | | | | | |
| | Bank and other guarantees received | | | | | | |
| | | | | | | | |
| | | | | | | | |
(The transactions shown in the table are presented in accordance with the current applicable regulatory and accounting frameworks, which frameworks differ from those
applicable in 2022. Accordingly, differences may exist in the presentation of these figures compared to the information reported in the financial statements for those
periods).
(5) Mr. Óscar Fanjul, a Director and Vice-Chairman of Ferrovial, is a director of Marsh & McLennan Companies.
We have entered into service agreements with our Executive Directors. Information about these agreements, and short-
form appointment letters to Non-Executive Directors, may be found in this Annual Report under “Item 6. Directors,
Senior Management and Employees—B. Compensation” and is incorporated herein by reference.
7.B.2Transactions between Group Companies and Ferrovial’s directors or senior managers
The following includes a description of transactions carried out between Group Companies and, in each case,
Ferrovial’s Directors, Ferrovial’s key management personnel, or their respective close family members, or entities in
which one or the other holds control or joint control, or over which they could exercise significant influence. It
includes transactions with enterprises that have a director or a member of key management personnel in common with
Ferrovial.
At December 31, 2024:
| | | | | | | | |
| | | | | | | | |
| | | | | | | | |
| | | | | | | | |
| | | | | | | | |
| | | | | | | | |
| | | | | | | | |
| | | | | | | | |
| | | | | | | | |
| | | | | | | | |
Juan del Pino Fdez-Fontecha(10) | | | | | | | | |
Ignacio del Pino Fdez-Fontecha(10) | | | | | | | | |
Rafael del Pino Fdez-Fontecha(10) | | | | | | | | |
| | | | | | | | |
| | Bank and other guarantees received | | | | | | |
| | | | | | | | |
| | | | | | | | |
| | | | | | | | |
| | Bank and other guarantees received | | | | | | |
| | | | | | | | |
| | | | | | | | |
| | Settlement of derivatives | | | | | | |
(6) Ms. Alicia Reyes, a Director of Ferrovial, is a member of the general and supervisory board of EDP.
(7) Mr. Bruno Di Leo, a Director of Ferrovial, is a non-executive director of Cummins Inc.
(8) Ms. Hanne Sorensen, a Director of Ferrovial, is a director and Vice-Chair of Holcim.
(9) Ms. María José Esteruelas, senior management at Ferrovial, served as director of Applus until June 17, 2024.
(10) Mr. Rafael, Mr. Ignacio and Mr. Juan del Pino Fernández-Fontecha are close family members of the Chairman of Ferrovial.
At December 31, 2023:
| | | | | | | | |
| | | | | | | | |
| | | | | | | | |
| | | | | | | | |
| | | | | | | | |
Juan del Pino Fdez-Fontecha | | | | | | | | |
Ignacio del Pino Fdez-Fontecha | | | | | | | | |
Rafael del Pino Fdez-Fontecha | | | | | | | | |
| | | | | | | | |
| | | | | | | | |
| | Bank and other guarantees received | | | | | | |
| | | | | | | | |
| | | | | | | | |
| | | | | | | | |
| | Bank and other guarantees received | | | | | | |
| | | | | | | | |
| | | | | | | | |
| | | | | | | | |
| | | | | | | | |
| | | | | | | | |
| | | | | | | | |
(The transactions shown in the table are presented in accordance with the current applicable regulatory and accounting frameworks, which frameworks differ from those
applicable in 2023. Accordingly, differences may exist in the presentation of these figures compared to the information reported in the financial statements for those
periods).
At December 31, 2022:
| | | | | | | | |
| | | | | | | | |
| | | | | | | | |
| | | | | | | | |
| | | | | | | | |
| | | | | | | | |
| | | | | | | | |
| | Bank and other guarantees | | | | | | |
| | | | | | | | |
| | | | | | | | |
| | Bank and other guarantees | | | | | | |
| | | | | | | | |
| | | | | | | | |
(The transactions shown in the table are presented in accordance with the current applicable regulatory and accounting frameworks, which frameworks differ from those
applicable in 2022. Accordingly, differences may exist in the presentation of these figures compared to the information reported in the financial statements for those
periods).
In 2023, a company controlled by Mr. Rafael del Pino, the Chairman of the Company, hired Ferrovial Construcción,
S.A., a wholly-owned subsidiary of the Company, as project manager in charge of the control and supervision of the
construction and refurbishment works of certain buildings. These project management services commenced in 2023
and will continue until the works are completed. The underlying works are being executed by third parties. The price
of the project management contract is calculated with basis on the actual costs incurred by Ferrovial Construcción,
S.A. in providing these services to which a multiplier of 1.4 is applied. The resulting price is similar to the price of
these services when provided by Ferrovial Construcción, S.A. to other clients that are not related parties (market
price). The estimated fees for the services provided under this agreement are approximately EUR 590,000.
Additionally, in October 2023, Mr. Rafael, Mr. Ignacio and Mr. Juan del Pino Fernández-Fontecha, all sons of Mr.
Rafael del Pino, the Chairman of the Company, entered into a construction contract with Ferrovial Construcción, S.A.
in relation to the completion of the construction of real estate. The contract is an “open book project” pursuant to
which the final contract price will be calculated as the sum of the actual direct and indirect costs of the works, plus a
fee of 8.9% (market price). The initial estimated contract price under this agreement was EUR 1,846,057. The final
price of the contract has increased to EUR 2,025,308.63.
Both agreements have been entered into as part of the ordinary course of business of Ferrovial Construcción, S.A.
For description of certain family relationships, see “Item 6. Directors, Senior Management, and Employees—A.
Directors and Senior Management—3. Family Relationships.”
7.B.3Transactions between Group Companies and equity-accounted companies
The following includes a tabular presentation of transactions, carried out between Group Companies and equity-
accounted companies in the ordinary course of business on standard customer terms.
| | | |
| For the year ended December 31, |
| | | |
| |
Services received ................................................................ | | | |
Services provided ................................................................ | | | |
Net financial expenses/Income ........................................... | | | |
Payables to related parties ................................................... | | | |
Receivables from related parties ......................................... | | | |
7.B.4Transactions between Group Companies
The following includes a description of transactions, carried out between the Group Companies in the ordinary course
of business (in terms of purpose and conditions) not eliminated on consolidation.
Balances and transactions relating to construction work performed by the Construction Business Division for the
Group’s infrastructure project companies are not eliminated on consolidation since the related contracts are classified
as construction contracts in which the work is deemed to be performed in favor of third parties, since both from a
financial and legal perspective, the ultimate recipient of the performed works is the entity that granted the concession,
rather than the infrastructure project company holding an interest in the concession project. See Note 1.3.2 (Basis of
Consolidation) to the Audited Financial Statements for a further description of the criteria we follow in eliminating
intragroup balance and transactions on consolidation.
In 2024, our Construction Business Division billed EUR 206,077 thousand (EUR 375,680 thousand in 2023 and EUR
865,487 thousand in 2022) to our infrastructure project companies for work performed and related advance payments.
The Construction Business Division recognized sales in connection with the aforementioned work performed
amounting to EUR 303,050 thousand in 2024 (EUR 489,259 thousand in 2023 and EUR 1,030,639 thousand in 2022).
The loss from these transactions attributable to the Company’s holdings in the infrastructure project companies
involved in these transactions (and not eliminated on consolidation), net of taxes and non-controlling interests,
amounted to a loss of EUR 14,206 thousand in 2024 (EUR 34,942 thousand losses in 2023 and EUR 60,507 thousand
losses in 2022.
7.CInterests of Experts and Counsel
Not applicable.
ITEM 8. FINANCIAL INFORMATION
8.AConsolidated Statements and Other Financial Information
8.A.1Financial Statements
See “Item 18. Financial Statements,” which contains our financial statements prepared in accordance with IFRS.
8.A.2Legal Proceedings
We are, from time to time, party to various legal proceedings arising out of our ordinary course of business.
8.A.2.1Litigation and other contingent liabilities relating to the Toll Roads Business Division
U.S. Toll roads NTE—35W
On February 11, 2021 there was a multiple vehicle accident on the 35W Managed Lanes toll road in Fort Worth, Texas
involving 133 vehicles and resulting in six deaths and multiple people injured.
As a result of this incident, the concession company NTE Mobility Partners Segment 3 LLC, which is 53.66% owned
by Ferrovial, together with other Group Co-Defendant entities and several non-Group US companies, is a party in 29
of the claims that have been filed. Of these, three cases have been fully resolved and one additional case has been
partially resolved by the parties. Discovery in the other cases is ongoing. One case has been set for trial starting on
July 20, 2025.
Following consultation with external legal advisors, the concession company expects no material impact even in the
event of an unfavorable ruling, in view of the insurance policies in place.
Therefore, no provision has been recorded to date in relation to this risk.
Portugal—Auto-Estradas Norte Litoral, S.A.
The insolvency estate of J. Gomes - Construções do Cávado, S.A., (the “J. Gomes Parent”) filed a civil lawsuit against
Cintra Infrastructures SE (“CISE”) seeking the invalidity of its purchase of shares in Auto-Estradas Norte Litoral, S.A.
("AENL”) (the “AENL Shares”) by CISE from J. Gomes – Concessões Norte, Unipessoal, Lda. (the “J. Gomes
Subsidiary”), a fully-owned subsidiary of J. Gomes Parent. J. Gomes Parent initiated proceedings against both CISE
and J. Gomes Subsidiary on the basis that the purchase price paid by CISE was lower than the fair market value of the
AENL Shares. J. Gomes Subsidiary is not an insolvent entity (unlike the claimant, J. Gomes Parent). CISE acquired
the AENL Shares from J. Gomes Subsidiary and the rest of the minority shareholders of AENL, paying the same price
per share to all shareholders.
The claimant, J. Gomes Parent has requested that (i) CISE return to the claimant (a) the AENL Shares and (b) an
amount corresponding to the total dividends received in connection with those shares since the date on which the sale
took place; and (ii) the claimant be allowed to pay a small fraction of the price received by the J. Gomes Subsidiary
from CISE for such AENL Shares, with the remainder of the price to be claimed by CISE as a common creditor under
the J. Gomes Parent insolvency proceedings.
The Company estimates the value of the claim, including accrued legal interest, which although not yet claimed, may
be requested in connection with the proceedings by J. Gomes Parent, to be an amount under EUR 10 million.
The Company believes, after consultation with external legal advisors, that its position is reasonable and therefore has
not recorded a provision in relation to this risk.
8.A.2.2Litigation relating to the Construction Business Division
The Construction Division is involved in several ongoing legal proceedings, relating principally to potential
construction defects in the building work it has completed and claims for civil liability. As indicated in Note 6.3
(Provisions) to the Audited Financial Statements, as of December 31, 2024, provisions amounting to EUR 90 million
had been recorded in relation to these proceedings. The provision for each of the lawsuits corresponds to the best
estimate made by Ferrovial on the possible impact of the same.
Legal Proceedings Related to Construction Business in Spain
In 2019, the Spanish National Markets and Competition Commission (CNMC) initiated penalty proceedings against
Ferrovial Construcción, S.A. and other construction firms for alleged anti-competitive behavior.
On July 6, 2022, the CNMC issued a resolution finding that Ferrovial Construcción S.A. had committed a “very
serious infringement” of Article 1 of Law 15/2007, of July 3, 2007, on the Defense of Competition and Article 101 of
the European Union Treaty, and imposing a fine of EUR 38.5 million.
Ferrovial Construcción, S.A. filed a contentious-administrative appeal against the CNMC’s resolution in the Spanish
National High Court on October 4, 2022. The claim also requested a precautionary measure staying enforcement.
On December 9, 2022, the Spanish National High Court agreed to suspend the resolution issued by the CNMC’s
Competition Court, pending its decision on the contentious-administrative appeal.
The Group considers the outcome of this lawsuit is unlikely to be unfavorable and therefore no amount has been
provisioned in this respect.
Legal Proceedings Related to D4R7 project (Slovakia)
Criminal Investigation for Alleged Environmental Risks and Damage in Connection with the Exploitation of Plots of
Land in Jánošíková.
In June 2019, the Provincial Headquarters of the National Police in Bratislava (Slovakia) initiated a criminal
investigation ex officio against D4R7 Construction s.r.o., the joint venture established to carry out the D4R7 toll road
construction project in Bratislava, which was formed by Ferrovial and PORR (with 65% and 35% stakes in the joint
venture, respectively). The grounds for the investigation are alleged environmental risks and damage, as defined in the
Slovakian Criminal Code, due to an alleged failure to obtain the necessary permits to excavate dirt from two plots of
land in Jánošíková, Slovakia. The alleged damages were quantified at EUR 8.7 million.
The two plots requiring the environmental permits do not form part of the toll road site layout, although materials
extracted from the plots were used to construct the project pursuant to agreements with the owners, who incurred no
environmental damage. The excavation work, which also included obtaining the property owners’ consent, as well as
the necessary environmental permits to extract the dirt material, was subcontracted to a local company specialized in
this type of work.
The matter is ongoing and a variety of filings against the alleged charges, including expert reports, have been
submitted. In November 2023, the court rejected the indictment, ruling that formal errors were committed during the
investigative phase, and returned the matter back to the prosecutor. The prosecutor has appealed the decision.
The Group considers improbable that the investigation will give rise to risk and, therefore, no provision has been set
aside with respect to this dispute.
Criminal Investigation for Alleged Hazardous Substances and Environmental Damage in Connection with the
Exploitation of Plots of Land in Blatná na Ostrove
On June 2, 2023, the Presidium of the Police Force for the National Center of Special Types of Criminality, the
division investigating hazardous substances and environmental crimes, filed charges against D4R7 Construction s.r.o.
for an alleged crime of “endangering and damaging the environment” in violation of Section 300(1) of the Slovak
Criminal Procedure Code. The charges allege that, between May and December 2018, D4R7 Construction s.r.o.
caused environmental damage quantified at EUR 6.6 million on certain protected parcels of land located in Blatná na
Ostrove by extracting more than 200,000 tons of dirt without a permit. D4R7 disputes these charges and has filed
responsive pleadings and reports. The pre-trial investigative phase of this matter has concluded and the matter has
been submitted to the court for review. The court will next decide whether there is sufficient evidence to support the
allegations and if all legal requirements have been met.
The Group considers improbable that the investigation will give rise to risk and, therefore, no provision has been set
aside with respect to this dispute.
Criminal Investigation for Alleged Unauthorized Handling of Waste at an Embankment in Jarovce.
The Police Force in Bratislava (Environmental Division) has pressed charges against D4R7 Construction s.r.o., for
alleged unauthorized handling of waste under the Slovak Criminal Code. The allegation relates to the use of recycled
dirt material for the construction of a road embankment without proper permits. The recycled material was purchased
from local suppliers specialized in this type of material and no environmental damage occurred due to its use. If found
responsible, D4R7 could face a fine, likely in the low six figures. Numerous pleadings and expert reports have been
submitted by the parties, and the matter is expected to proceed to trial. To date, however, the court has not scheduled
hearings to commence.
The Group considers improbable that the investigation will give rise to risk, and therefore, no provision has been set
aside with respect to this dispute.
Bucaramanga Project (Colombia)
In December 2023, the National Infrastructure Authority (NIA) of Colombia imposed a fine for project delays on the
concessionaire for the Ruta del Cacao project, Concesionaria Ruta del Cacao, S.A.S. The fine flows on a “back-to-
back” basis to Consorcio Ferrocol Santander (CJV), the entity responsible for the construction of the project in which
Ferrovial Construcción has a 70% stake. On January 13, 2025, the NIA ratified the fine amount, making it due and
payable in February 2025. The concessionaire and CJV have initiated a proceeding seeking a declaration of force
majeure. If the proceeding is successful, the NIA would be compelled to reduce and potentially nullify the fine
amount. We expect a decision by June 2025. The impact of this delay and the associated costs have been considered in
the provision for future losses in 2024 (also in 2023) relating to this project.
I-66 project (U.S)
In 2016, FAM Construction, LLC (in which Ferrovial Construction US Corp. holds a 70% interest and Allan Myers
VA holds a 30% interest) was awarded the design and construction of the Interstate 66 Outside the Beltway project.
In June 2024, project completion was agreed with the Virginia Department of Transportation. FAM Construction, LLC
filed a lawsuit in January 2024 related to costs incurred due to the COVID-19 pandemic and associated matters.
These claims have been considered in the calculation of the Group’s future loss provisions in accordance with IFRS
15.
Power unit in Turów (Poland)
On January 17, 2025, Budimex S.A. received a lawsuit claiming EUR 248.2 million in liquidated damages and other
damages for, among other things, reduced availability of the power unit and alleged delays in the remediation of
disputed defects. The action was brought by the state-owned energy producer, PGE Górnictwo i Energetyka
Konwencjonalna S.A. against the consortium responsible for the construction of a new power unit at the Turów Power
Plant. The consortium comprises Mitsubishi Power Europe GmbH (52.84%), Técnicas Reunidas, S.A. (23.58%) and
Budimex, S.A. (23.58%).
Taking into account the amount claimed and the associated costs involved with defending this lawsuit, the putative
risk has been duly provisioned in accordance with Budimex's share in the consortium.
8.A.2.3 Litigation relating to the Energy Business Division
Centella Project (Chile)
In 2018, the Republic of Chile awarded the design, construction and operation of a new 252km, 220KV- 580 MVA-
double circuit transmission line ("Centella Project") to Centella Transmisión S.A. (an indirect wholly owned
subsidiary of Ferrovial SE).
The project commenced operation on June 27, 2024 as formally acknowledged by the relevant authority on January
15, 2025.
Pursuant to restated terms of the award, commencement of operations of the transmission line should have occurred no
later than January 15, 2024, but during construction, the project suffered certain delays due to unforeseen
circumstances, including different force majeure events. In particular, on August 26, 2024, an extension of the final
milestone (CoD) of the contract was successfully granted by the Ministry of Energy as a consequence of one of those
force majeure events.
Out of the different force majeure events requested by Centella Transmisión S.A. to the Ministry of Energy, there are -
as of today- two proceedings still pending, whose outcome could enable the Authority to call a guarantee bond and
may apply certain penalties under the contract.
Although force majeure must be evaluated on a case-by-case basis, the Ministry of Energy has granted in the past
different extensions of milestones due to force majeure events in the Centella Project and in other transmission
projects in Chile.
As of December 31, 2024, the Group has recognised a provision to cover the estimated risk arising from this
contingency.
8.A.2.4 Matters Previously Reported
FBSerwis (Poland)
We previously reported on a broad investigation by the Polish Central Anticorruption Office into alleged tax fraud and
money laundering, invoice forgery, and bribery that implicated two past members of the Management Board of
FBSerwis, S.A., a subsidiary of Budimex. As previously reported, these individuals were dismissed by FBSerwis, S.A.
and their employment terminated. The investigation appears to have been completed with respect to Budimex with no
further developments related to the company.
I-285/SR400 Improvement Project (USA)
It was previously reported that North Perimeter Contractors, LLC whose sole member is Ferrovial Construction US
Corp. had initiated upstream claims stemming from client-directed changes, weather events and other issues. These
claims have been amicably resolved.
8.A.2.5 Tax-Related Proceedings
Tax proceedings relating to the amortization for tax purposes of financial goodwill on the acquisitions of Amey and
Swissport
We are currently in ongoing litigation proceedings related to the tax amortization of financial goodwill paid on the
acquisitions of Amey and Swissport. On September 27, 2023, the European General Court issued a ruling overturning
the European Commission’s October 15, 2014, decision, which considered the Spanish tax depreciation of financial
goodwill with respect to the indirect acquisition of non-resident companies to be “state aid” incompatible with the EU
Treaty. The European General Court’s ruling upheld the appeals of Spain and several Spanish companies, including
Ferrovial, finding that the European Commission’s decision violated the principles of legal certainty and protection of
legitimate expectations. On December 14, 2023 the European Commission logged its appeal against this ruling before
the Court of Justice of the European Union (C-780/23 P). The proceeding is currently ongoing.
As the Group considers there are sound grounds supporting its procedural stance in this proceeding, no provision has
been recorded as of December 31, 2024. However, if the final ruling is unfavorable for the Group there will be an
adverse effect of EUR 87.6 million on the Group's income statement in relation to additional Spanish CIT for FY 2002
to 2022. The maximum amount payable in connection with a potential unfavorable result would be EUR 42.0 million,
as the remainder has already been settled by the Group. In case of a favorable ruling for the Group, the Spanish Tax
Agency must refund the initially claimed and paid amounts (EUR 45.5 million).
Unconstitutional Royal Decree-Law 3/2016
On January 18, 2024, the Spanish Constitutional Court announced its ruling related to Royal Decree-Law 3/2016
(RDL 3/2016), on tax measures aimed at the consolidation of public finances, which amended corporate income
taxation by limiting the offsetting of net operating losses (25% current limit versus 70% prior to RDL 3/2016),
establishing limits on the application of double taxation deductions and forcing the inclusion in the tax base of
impairment losses on portfolio investments deducted in previous years.
The Spanish Constitutional Court ruling resolves that the use of the Royal Decree-Law is not suitable for amending the
essential elements of Corporate Income Tax (CIT), and that this practice infringes constitutional requirements. Based
on the aforementioned grounds, the Spanish Constitutional Court overturned RDL 3/2016, which is considered null
and void. The Company filed several lawsuits with respect to its CIT assessment for tax years 2016 through 2023
based on the same argument.
Based on the Spanish Constitutional Court ruling, the Company believes it is almost certain it will obtain a favorable
ruling in its proceedings, with the expected amount to be recovered by the Group in relation to years 2016 to 2023
amounting to EUR 30.6 million, which has been recorded in 2024 consolidated financial statements.
8.A.2.6 Director or Executive Officer Involvement in Certain Proceedings
See “Item 6. Directors, Senior Management and Employees —A. Directors and Senior Management —4. Director or
Executive Officer Involvement in Certain Proceedings”
8.A.3Dividend Policy
8.A.3.1General
We may only make distributions, whether a distribution of profits or freely distributable reserves, to our shareholders
to the extent that our equity exceeds the sum of the paid-up and called-up part of the capital and the reserves which
must be maintained by Dutch law or by the Articles of Association.
8.A.3.1.1Annual profit distribution
A distribution of profits other than an interim distribution is resolved on by the General Meeting on a proposal thereto
by the Board. Such a distribution is only allowed after the adoption of the Company’s annual accounts (i.e., non-
consolidated) by the General Meeting, and the information therein will determine if the distribution of profits is legally
permitted for the respective financial year.
8.A.3.1.2Right to reserve
The Board may determine that an amount out of the profit will be added to the reserves. The Board determines how a
shortfall that is determined following the adoption of the annual accounts will be accounted for. A loss may be set off
against the reserves to be maintained by law only to the extent allowed by law. The profits remaining after application
of the foregoing will be at the disposal of the General Meeting.
8.A.3.1.3Interim distribution
Subject to Dutch law and the Articles of Association, the Board may resolve to make interim distributions if an interim
statement of assets and liabilities meeting the requirements laid down in section 2:105(4) BW shows that the
Company’s equity exceeds the sum of the paid-up and called-up part of the capital and the reserves which must be
maintained by law or the Articles of Association.
8.A.3.1.4Distribution in kind
The corporate body resolving on a distribution decides whether such distribution is made in cash, in kind or in
ordinary shares, or any combination thereof. The General Meeting may only resolve to make a distribution in kind or
in the form of ordinary shares pursuant to a proposal thereto by the Board. If a distribution is made in a form other
than in cash, the Board determines the value the Company will allocate to such distribution for accounting purposes.
8.A.3.1.5Profit ranking of our ordinary shares
All ordinary shares rank equally in all distributions. When determining the allocation of an amount to be distributed,
ordinary shares held by the Company in its capital are not taken into account, unless those ordinary shares are
encumbered with a right of usufruct or a right of pledge.
In the event of insolvency, any claims of the holders of ordinary shares are subordinated to those of the creditors of the
Company. This means that an investor could potentially lose all or part of its invested capital.
8.A.3.1.6Payment
Payment of any future dividend on ordinary shares in cash will be made in euro and USD dollar. Any dividends on
ordinary shares that are paid to shareholders through the Depository Trust Company (“DTC”) will be automatically
credited to the cash account of the relevant shareholders’ DTC participant account in U.S. dollars, including holders of
book-entry interests in our ordinary shares holding through intermediaries who are direct participants in Euroclear
Bank (except for Euroclear Nederland and its participant entities), while dividends ordinary shares that are paid to
shareholders through Iberclear and Euroclear Nederland are expected to be credited in euro to the cash account of the
relevant Euroclear Nederland or Iberclear participant. Payments to DRS Holders will be paid by the U.S. transfer agent
in U.S. dollars, either by cheque or through bank transfer. Shareholders may consult their intermediary or professional
advisor in relation to the currency in which their dividends will be paid. There are no restrictions in relation to the
payment of dividends under Dutch law in respect of holders of ordinary shares who are non-residents of the
Netherlands. Payments of profit and other payments are announced in a notice by the Company. A shareholder’s claim
to payments of profits and other payments lapses five years and one day after the day on which the claim became
payable. Any profit or other payments that are not claimed within this period will be considered to have been forfeited
to the Company and will be carried to the reserves of the Company.
For more information, see “Item 10. Additional Information—A. Share Capital.” Dividends may also be subject to
Dutch withholding taxes. See “Item 10. Additional Information—E. Taxation—1. Material Dutch Tax Considerations”
for additional information regarding dividends in accordance with Dutch law.
8.A.3.2Our Dividend History and Policy
8.A.3.2.1.Shareholder distributions
We have traditionally remunerated our shareholders through the payment of cash dividends and we intend to maintain
a policy that allows our shareholders, if they wish, to receive all their remuneration (if any) in cash.
In order to improve the system of shareholder distributions and pursuant to the latest trends followed in this area by
peers, since 2014, we have offered our shareholders a flexible dividend program that, without limiting their ability to
receive their full remuneration in cash if they so desire, allows them to receive our ordinary shares instead.
The flexible dividend program is part of our larger shareholder distributions scheme, which typically also consists of a
share buy-back and amortization of shares program.
If the Board, in its sole discretion, does not consider it advisable to implement such a flexible dividend in view of
market conditions, the conditions of Ferrovial itself, or any other circumstances, it may elect not to distribute such
dividend. The Board, in its sole discretion, may also decide to pay additional dividends or to pay a dividend in cash
only or shares only.
8.A.3.2.2.Flexible dividend program
We aim to make investments to facilitate profitable growth and to maintain a solid investment grade rating while
providing our shareholders with dividends based on returns from infrastructure projects.
Dividends may be implemented through a flexible dividend program, pursuant to which our shareholders have the
option to receive additional ordinary shares in the Company’s capital instead of a cash dividend. Dividends paid in the
form of our ordinary shares may have a dilutive effect and may be made available in the form of newly issued ordinary
shares, paid up from our freely distributable reserves or such other reserves as permitted under Dutch law, or our
treasury shares.
We generally distribute the flexible dividend in May and November of each year. However, in 2023, due to the
Merger, the first distribution of flexible dividend was on July 26, 2023 and the second distribution of flexible dividend
was on November 22, 2023.
The table below summarizes the distributions taking place under the flexible dividend program in place for our
shareholders for financial years ended December 31, 2024, 2023, and 2022.
| | | | | | |
| | | |
Ferrovial scrip dividend history | | | | | | |
Guaranteed set price to purchase rights(Euro) | | | | | | |
Rights per ordinary share .............................. | | | | | | |
% Ferrovial shareholders who chose ordinary shares as dividends .......................................... | | | | | | |
% Ferrovial shareholders who chose cash as dividends ........................................................ | | | | | | |
Number of new ordinary shares issued ........... | | | | | | |
Number of rights purchased ............................ | | | | | | |
Cash dividend (Euro) ...................................... | | | | | | |
On April 11, 2024, the Board explained at the Company’s General Meeting its intention to distribute one or more
interim flexible dividends in 2024 for a cash equivalent amount of approximately EUR 550 million, subject to the
Board’s discretion in light of market conditions, the Company’s conditions and any other relevant circumstances.
On the back of forecast cash levels at year-end, on December 4, 2024, we declared an additional interim cash dividend
of EUR 0.0346 per Ferrovial share against Ferrovial's reserves, amounting to an aggregate dividend of EUR 25
million.
8.A.3.2.3 Share buy-back and amortization of ordinary shares
In addition to the flexible dividend program, our shareholder distributions scheme also includes our periodic share
buybacks for the purpose of reducing our share capital through the subsequent amortization of our ordinary shares. For
additional information regarding our share buy-back programs, see “Item 16E. Purchases of Equity Securities by the
Issuer and Affiliated Purchasers.”
8.A.3.2.4 Uncollected Dividends
A claim for any declared dividend and other distributions lapses five years and one day after the date those dividends
or distributions became payable. Any dividend or distribution that is not claimed within this period will be considered
to have been forfeited to us and will be carried to the reserves of the Company.
8.A.3.2.5 Taxation
The tax legislation of the jurisdiction where Shareholders are resident for tax purposes, and that of the Netherlands
where the Company is resident for tax purposes, may have an impact on income received from the ordinary shares.
Shareholders should consult their own tax adviser regarding the tax consequences of any income derived from our
ordinary shares. For a description of certain tax considerations related to our ordinary shares.
8.A.4Recent Developments
8.A.4.1Business developments
See “Item 4. Information on the Company—A. History and Development on the Company.”
8.B.Significant Changes
Please refer to Note 6.11 (Events After the Reporting Date) to the Audited Financial Statements for details regarding
events subsequent to the reporting period. Since December 31, 2024, until the filing of this Annual Report, no other
significant changes have occurred in our financial statements included “Item 18. Financial Statements.”
ITEM 9. THE OFFER AND LISTING
9.A.Offer and Listing Details
Our ordinary shares commenced trading on each of Euronext Amsterdam and the Spanish Stock Exchanges on June
16, 2023. Our ordinary shares commenced trading on Nasdaq on May 9, 2024 under the symbol “FER”. Prior to this,
no public market existed for our ordinary shares.
9.B.Plan of Distribution
Not applicable.
9.C.Markets
See “Item 9. The Offer and Listing—A. Offering and Listing Details”.
9.D.Selling Shareholders
Not applicable.
9.E.Dilution
Not applicable.
9.F.Expenses of the Issuer
Not applicable.
ITEM 10. ADDITIONAL INFORMATION
10.AShare Capital
Not applicable.
10.BMemorandum and Articles of Association
A copy of the Company’s Articles is incorporated by reference as Exhibit 1.1 to this Annual Report. The information
called for by this Item is set forth in Exhibit 2.2 to this Annual Report.
10.CMaterial Contracts
The following are the material contracts, other than material contracts entered into in the ordinary course of business,
to which we are or have been a party, for the two years immediately preceding the date of this Annual Report:
• 407 ETR Concession and Ground Lease Agreement (incorporated by reference to Exhibit 4.1 to the Company’s
Registration Statement on Form 20-F (File No. 001-41912) filed with the SEC on January 5, 2024). See “Item 4.
Information on the Company —B. Business overview —3. Group Overview —3. Our Business Divisions —1. Toll
Roads business —Canada —The 407 ETR”
• Heathrow Airport Share Purchase Agreement (incorporated by reference to Exhibit 4.2 to the Company’s
Registration Statement on Form 20-F (File No. 001-41912) filed with the SEC on January 5, 2024). See “Item 4.
Information on the Company —A. History and development of the Company. Investments and Divestments —2. Sale
of Heathrow Stake.”
• 2023 General Conditions of the Performance-Based Share Plan of the Company for Executive Directors and Senior
Management 2023-2025, together with the form of Specific Conditions thereunder (filed as Exhibit 4.5 to this Annual
Report). See “Item 6. Directors, Senior Management, and Employees—B. Compensation.”
• 2023 General Conditions of the Performance-Based Share Plan of the Company for Executives 2023-2025, together
with the form of Specific Conditions thereunder (filed as Exhibit 4.6 to this Annual Report). See “Item 6. Directors,
Senior Management, and Employees—B. Compensation.”
• 2024 General Conditions of the Performance-Based Share Plan of the Company for Executive Directors and Senior
Management 2023-2025, together with the form of Specific Conditions thereunder (filed as Exhibit 4.7 to this Annual
Report). See “Item 6. Directors, Senior Management, and Employees—B. Compensation.”
• 2024 General Conditions of the Performance-Based Share Plan of the Company for Executives 2023-2025, together
with the form of Specific Conditions thereunder (filed as Exhibit 4.8 to this Annual Report). See “Item 6. Directors,
Senior Management, and Employees—B. Compensation.”
• General Conditions of the Plan to Receive Remuneration Through the Delivery of Ferrovial SE Shares 2025-2029
(filed as Exhibit 4.10 to this Annual Report). See “Item 6. Directors, Senior Management, and Employees—B.
Compensation—4. Equity Incentive Plan.”
10.DExchange Controls
There are currently no Dutch currency control restrictions on remittances of dividends on our ordinary shares,
proceeds from the sale of the ordinary shares or interest or other payments to non-residents of the Netherlands.
10.ETaxation
The following summary contains a description of certain Dutch, U.S. federal income and Spanish tax consequences of
the acquisition, ownership and disposition of our ordinary shares, but it does not purport to be a comprehensive
description of all the tax considerations that may be relevant to a decision to purchase our ordinary shares. The
summary is based upon the tax laws of the Netherlands and regulations thereunder, on the tax laws of the United
States and regulations thereunder and upon the tax laws of Spain and regulations thereunder, all as of the date hereof,
which are subject to change.
You should consult your own tax advisor concerning the tax consequences of your particular situation, as well as any
tax consequences that may arise under the laws of any state, local, or other taxing jurisdiction.
10.E.1 Material Dutch Tax Considerations
This section outlines the principal Dutch tax consequences of the acquisition, holding, settlement, redemption, and
disposal of our ordinary shares. It does not present a comprehensive or complete description of all aspects of Dutch tax
law which could be relevant to a shareholder. For Dutch tax purposes, a shareholder may include an individual or
entity not holding the legal title to our ordinary shares, but to whom, or to which, our ordinary shares are, or the
income from our ordinary shares is, nevertheless attributed based either on this individual or entity owning a beneficial
interest in our ordinary shares or on specific statutory provisions. These include statutory provisions attributing
ordinary shares to an individual who is, or who has directly or indirectly inherited from a person who was, the settlor,
grantor or similar originator of a trust, foundation or similar entity that holds ordinary shares.
This section is intended as general information only. Prospective shareholders should consult their own tax adviser
regarding the tax consequences of any acquisition, holding or disposal of ordinary shares.
This section is based on Dutch tax law as applied and interpreted by Dutch tax courts and as published and in effect on
the date of the Annual Report, including the tax rates applicable on that date, without prejudice to any amendments
introduced at a later date and implemented with or without retroactive effect.
Any reference in this section made to Dutch taxes, Dutch tax or Dutch tax law should be construed as a reference to
any taxes of any nature levied by or on behalf of the Netherlands or any of its subdivisions or taxing authorities or to
the law governing such taxes, respectively.
Any reference made to a treaty for the avoidance of double taxation concluded by the Netherlands includes the Tax
Regulation for the Kingdom of the Netherlands (Belastingregeling voor het Koninkrijk), the Tax Regulation for the
State of the Netherlands (Belastingregeling voor het land Nederland), the Tax Regulations for the Netherlands and
Curacao (Belastingregeling Nederland Curaçao), the Tax Regulations for the Netherlands and St. Maarten
(Belastingregeling Nederland Sint Maarten) and the Agreement between the Taipei Representative Office in the
Netherlands and the Netherlands Trade and Investment Office in Taipei for the avoidance of double taxation.
This section only describes the principal Dutch tax consideration for non-resident shareholders. A non-resident
shareholder is a shareholder that is neither resident nor deemed to be resident in the Netherlands for purpose of Dutch
income tax or corporation tax as the case may be.
This section does not describe any Dutch tax considerations or consequences that may be relevant where a
shareholder:
▪is an individual and the shareholder’s income or capital gains derived from our ordinary shares are
attributable to employment activities, the income from which is taxable in the Netherlands;
▪has a substantial interest (aanmerkelijk belang) or a fictitious substantial interest (fictief aanmerkelijk
belang) in the Company within the meaning of chapter 4 of the Dutch Income Tax Act. Generally, a
shareholder has a substantial interest in the Company if the shareholder, alone or, in case of an individual,
together with a partner for Dutch tax purposes, or any relative by blood or by marriage in the ascending or
descending line (including foster-children) of the shareholder or the partner, owns or holds, or is deemed to
own or hold shares or certain rights to shares, including rights to directly or indirectly acquire shares,
directly or indirectly representing 5.0% or more of the Company’s issued capital as a whole or of any class
of Shares or profit participating certificates (winstbewijzen) relating to 5.0% or more of the Company’s
annual profits or 5.0% or more of the Company’s liquidation proceeds;
▪is an entity that, although it is in principle subject to Dutch corporate income tax under the Dutch Corporate
Income Tax Act, is not subject to Dutch corporate income tax or is fully or partly exempt from Dutch
corporate income tax (such as a qualifying pension fund as described in Section 5 of the Dutch Corporate
Income Tax Act 1969 (Wet op de vennootschapsbelasting 1969) (“CITA”) and a tax exempt investment fund
(vrijgestelde beleggingsinstelling) as described in Section 6a CITA), or is an entity that is not tax resident in
the Netherlands and that has a function comparable to a tax exempt investment fund (vrijgestelde
beleggingsinstelling) as described in Section 6a CITA;
▪is an investment institution (beleggingsinstelling) as described in Section 28 CITA, or is an entity that is not
tax resident in the Netherlands and that has a function comparable to an investment institution
(beleggingsinstelling) as described in Section 28 CITA;
▪is required to apply the participation exemption (deelnemingsvrijstelling) with respect to ordinary shares (as
defined in Section 13 CITA). Generally, a shareholder is required to apply the participation exemption if it is
subject to Dutch corporate income tax and it, or a related entity, holds an interest of 5.0% or more of the
nominal paid-up share capital in the Company;
▪is entitled or required to apply the dividend withholding tax exemption (inhoudingsvrijstelling) (pursuant to
Section 4 or 4a of the DWTA) with respect to any profits derived from ordinary shares. A shareholder may,
in general terms, be entitled or required to apply a dividend withholding tax exemption if it holds an interest
of 5.0% or more of the nominal paid-up share capital in the Company. Pursuant to Section 4a of the DWTA,
a shareholder may, in general terms, be entitled to apply a dividend withholding tax exemption if such
shareholder: (x) is an entity that is tax resident in the Netherlands but not subject to Dutch corporate income
tax, or (y) is an entity which (a) is a resident of a member state of the European Union (“EU”), or a state that
is a party to the Agreement on the European Economic Area (“EEA”; Iceland, Liechtenstein or Norway) or,
to the extent that it concerns shares that are held as a portfolio investment, another state that has been
designated by means of a ministerial decree as a state with which the Netherlands can exchange information
in line with the international standard on exchange of information, (b) is not subject to a profit tax levied by
that state, and (c) would not have been subject to Dutch corporate income tax had that entity been resident in
the Netherlands for Dutch corporate income tax purposes, and such shareholder has obtained a formal
decision from the Dutch Tax Authorities stating that these requirements are met (kwalificatiebeschikking);
or
▪is an entity related (gelieerd) to the Company within the meaning of the Withholding Tax Act 2021 (Wet
bronbelasting 2021). An entity is considered related if: (i) it holds, directly or indirectly, a Qualifying
Interest (as defined below) in the Company; (ii) the Company, directly or indirectly, holds a Qualifying
Interest in the shareholder; or (iii) a third party holds, directly or indirectly, a Qualifying Interest in both the
Company and the shareholder. An entity is also considered related to the Company if the entity is part of a
collaborating group (samenwerkende groep) of entities that jointly directly or indirectly holds a Qualifying
Interest in the Company. The term “Qualifying Interest” means a directly or indirectly held interest, either by
an entity individually or jointly if an entity is part of a collaborating group, that enables such entity or such
collaborating group to exercise a definite influence over another entities’ decisions, such as the Company or
the shareholder as the case may be, and allows it to determine the other entities’ activities.
Furthermore, this section does not describe any Dutch tax considerations or consequences that may be relevant for a
shareholder that is part of a multinational enterprise group or large-scale domestic group within the meaning of the
Dutch Minimum Tax Act 2024 (Wet minimumbelasting 2024), the Dutch implementation of Directive (EU)
2022/2523 of December 14, 2022 on ensuring a global minimum level of taxation for multinational enterprise groups
and large-scale domestic groups in the EU.
10.E.1.1Withholding Tax
A shareholder is generally subject to Dutch dividend withholding tax pursuant to the Dutch Dividend Withholding Tax
Act 1965 (Wet op dividendbelasting 1965) (the “DWTA”) at a rate of 15.0% on dividends distributed by the Company.
Generally, the Company is responsible for the withholding of such dividend withholding tax at source. To the extent
such tax is not, or cannot be, withheld for the account of the shareholder, such tax is due by the Company at the
grossed-up rate of approximately 17.65%.
Dividends distributed by the Company include, but are not limited to:
▪distributions of profits in cash or in kind, whatever they be named and in whatever form;
▪proceeds from the liquidation of the Company or proceeds from the repurchase of the Company’s ordinary
shares, other than as a temporary portfolio investment (tijdelijke belegging), in excess of the average paid-in
capital recognized for Dutch dividend withholding tax purposes;
▪the par value of the Company’s ordinary shares issued to a shareholder or an increase in the par value of the
Company’s ordinary shares, to the extent that no related contribution, recognized for the purposes of the
DWTA, has been made or will be made; and
▪partial repayment of paid-in capital that is not recognized for Dutch dividend withholding tax purposes, or
recognized for Dutch dividend withholding tax purposes, to the extent that the Company has “net
profits” (zuivere winst), unless (a) the General Meeting has resolved in advance to make this repayment, and
(b) the par value of the Company’s ordinary shares concerned has been reduced by an equal amount by way
of an amendment to the articles of association of the Company. The term “net profits” includes anticipated
profits that have yet to be realized.
Depending on specific circumstances, a shareholder resident in a country other than the Netherlands and for whom
dividends distributed by the Company or income deemed to be derived from the ordinary shares are not subject to tax
under the Dutch Personal Income Tax Act 2001 (Wet inkomstenbelasting 2001) or the CITA may be entitled to
exemptions from, reduction of, or full or partial refund of, Dutch dividend withholding tax under Dutch law, EU law,
or treaties for the avoidance of double taxation concluded by the Netherlands.
A shareholder who is resident in the United States for purposes of the 1992 treaty for the avoidance of double taxation
between the United States and the Netherlands, as amended most recently by the Protocol signed on March 8, 2004
(the “U.S. Treaty”) (a “U.S. Shareholder”) and who is entitled to the benefits of the U.S. Treaty, will be entitled to an
exemption from or a reduction of Dutch dividend withholding tax, inter alia, in the following situations:
▪if the U.S. Shareholder is an exempt pension trust as described in Article 35 of the U.S. Treaty or an exempt
organization as described in Article 36 of the U.S. Treaty, the U.S. Shareholder is entitled to an exemption
from Dutch dividend withholding tax; and
▪if the U.S. Shareholder is a company that directly holds at least 10%, but less than 80% of the voting power
in the Company, the U.S. Shareholder will be entitled to a reduction of Dutch withholding tax to a rate of
5%.
A U.S. Shareholder that qualifies for an exemption from, or a reduction of, Dutch dividend withholding tax may
generally claim (i) an exemption or reduction at source, or (ii) a refund, by making the requisite filings within three
years after the end of the calendar year in which the Dutch dividend withholding tax was levied.
According to Dutch domestic anti-dividend stripping rules, no credit against Dutch tax, exemption from, reduction, or
refund of Dutch dividend withholding tax will be granted if the recipient of the dividends paid by the Company is not
considered to be the beneficial owner (uiteindelijk gerechtigde) of those dividends.
The DWTA provides for a non-exhaustive negative description of a beneficial owner. According to the DWTA, a
shareholder will not be considered the beneficial owner of the dividends if, as a consequence of a combination of
transactions:
▪a person other than the shareholder wholly or partly, directly or indirectly, benefits from the dividends;
▪whereby this other person retains or acquires, directly or indirectly, an interest similar to that in the ordinary
shares on which the dividends were paid; and
▪that other person is entitled to a credit, reduction, or refund of Dutch dividend withholding tax that is less
than that of the shareholder.
In general terms, the burden of proof with respect to beneficial ownership of dividends distributed by the Company
rests on the Dutch tax authorities. If, however, a shareholder would receive dividends, including dividends on the
ordinary shares, in a calendar year in respect of which an aggregate amount of EUR 1,000 in Dutch dividend
withholding tax would otherwise be due based on the rate of 15%, the burden of proof with respect to beneficial
ownership of such dividends lies with the shareholder.
10.E.1.2Non-Residents of the Netherlands
The description of certain Dutch tax consequences in this chapter is only intended for the following shareholders:
▪Individuals who are not resident and not deemed to be resident in the Netherlands (“Non-Dutch Resident
Individuals”); and
▪Entities that are not resident and not deemed to be resident in the Netherlands (“Non-Dutch Resident
Corporate Entities”).
Non-Dutch Resident Individuals
A Non-Dutch Resident Individual will not be subject to any Dutch taxes on income or capital gains derived from the
purchase, ownership and disposal or transfer of our ordinary shares, other than withholding tax as described above,
unless:
▪the Non-Dutch Resident Individual derives profits from an enterprise, whether as entrepreneur or by being
co-entitled to the net worth of this enterprise other than as an entrepreneur or shareholder and this enterprise
is fully or partly carried on through a permanent establishment (vaste inrichting) or a permanent
representative (vaste vertegenwoordiger) in the Netherlands, to which our ordinary shares are attributable;
▪the Non-Dutch Resident Individual derives benefits from miscellaneous activities carried on in the
Netherlands in respect of ordinary shares, including activities which are beyond the scope of regular
portfolio investment activities; or
▪the Non-Dutch Resident Individual is entitled to a share—other than by way of securities—in the profits of
an enterprise, which is effectively managed in the Netherlands and to which ordinary shares are attributable.
Non-Dutch Resident Corporate Entities
A Non-Dutch Resident Corporate Entity will not be subject to any Dutch taxes on income or capital gains derived
from the purchase, ownership and disposal or transfer of our ordinary shares, other than withholding tax as described
above, unless:
▪the Non-Dutch Resident Corporate Entity derives profits from an enterprise, which is fully or partly carried
on through a permanent establishment or a permanent representative in the Netherlands to which ordinary
shares are attributable; or
▪the Non-Dutch Resident Corporate Entity is entitled to a share—other than by way of securities—in the
profits of an enterprise or a co-entitlement to the net worth of an enterprise, which is effectively managed in
the Netherlands and to which ordinary shares are attributable.
Under certain specific circumstances, Dutch taxation rights may be restricted for Non-Dutch Resident Individuals and
Non-Dutch Resident Corporate Entities pursuant to treaties for the avoidance of double taxation.
10.E.1.3Dutch Gift Tax or Inheritance Tax
No Dutch gift tax or inheritance tax is due in respect of any gift of our ordinary shares by, or inheritance of our
ordinary shares on the death of, a shareholder, unless:
▪the shareholder is resident, or is deemed to be resident, in the Netherlands at the time of the gift or death of
the shareholder;
▪the shareholder dies within 180 days after the date of the gift of ordinary shares and was, or was deemed to
be, resident in the Netherlands at the time of the shareholder’s death but not at the time of the gift; or
▪the gift of ordinary shares is made under a condition precedent and the shareholder is resident, or is deemed
to be resident, in the Netherlands at the time the condition is fulfilled.
10.E.1.4Other Taxes and Duties
No other Dutch taxes, including taxes of a documentary nature, such as capital tax, stamp or registration tax or duty,
are payable by, or on behalf of, the shareholder by reason only of the purchase, ownership and disposal of ordinary
shares.
10.E.1.5Residency
A shareholder will not become a resident or deemed resident of the Netherlands by reason only of holding our
ordinary shares.
10.E.2Material U.S. Federal Income Tax Consequences
The following discussion describes certain U.S. federal income tax consequences to U.S. Holders (as defined below)
of owning and disposing of our ordinary shares. This summary applies only to U.S. Holders that hold ordinary shares
as capital assets within the meaning of Section 1221 of the Code (as defined below) and have the U.S. dollar as their
functional currency.
This discussion is based on the tax laws of the United States as in effect on the date of this Annual Report, including
the Internal Revenue Code of 1986, as amended (the “Code”), and U.S. Treasury Regulations in effect or, in some
cases, proposed, as of the date of this Annual Report, as well as judicial and administrative interpretations thereof
available on or before such date. All of the foregoing authorities are subject to change, and any such change could
apply retroactively and could affect the U.S. federal income tax consequences described below. The statements in this
Annual Report are not binding on the IRS or any court, and thus we can provide no assurance that the U.S. federal
income tax consequences discussed below will not be challenged by the IRS or will be sustained by a court if
challenged by the IRS. Furthermore, this summary does not address any estate or gift tax consequences, any state,
local or non-U.S. tax consequences or any other tax consequences other than U.S. federal income tax consequences.
The following discussion does not describe all the tax consequences that may be relevant to any particular investor or
to persons in special tax situations such as:
▪banks and certain other financial institutions;
▪regulated investment companies;
▪real estate investment trusts;
▪insurance companies;
▪individual retirement accounts and other tax-deferred accounts;
▪broker-dealers;
▪traders that elect to mark to market;
▪tax-exempt entities;
▪persons liable for alternative minimum tax or the Medicare contribution tax on net investment income;
▪U.S. expatriates;
▪persons holding our ordinary shares as part of a straddle, hedging, constructive sale, conversion or integrated
transaction;
▪persons that actually or constructively own 5.0% or more of our stock by vote or value;
▪persons subject to special tax accounting rules as a result of any item of gross income with respect to our
ordinary shares being taken into account in an applicable financial statement;
▪persons that are resident or ordinarily resident in or have a permanent establishment in a jurisdiction outside
the United States;
▪persons who acquired our ordinary shares pursuant to the exercise of any employee share option or
otherwise as compensation; or
▪persons holding our ordinary shares through partnerships or other pass-through entities.
PROSPECTIVE PURCHASERS ARE URGED TO CONSULT THEIR TAX ADVISORS ABOUT THE
APPLICATION OF THE U.S. FEDERAL TAX RULES TO THEIR PARTICULAR CIRCUMSTANCES AS
WELL AS THE STATE, LOCAL AND NON-U.S. TAX CONSEQUENCES TO THEM OF THE
OWNERSHIP AND DISPOSITION OF SHARES.
As used herein, the term “U.S. Holder” means a beneficial owner of ordinary shares that, for U.S. federal income tax
purposes, is or is treated as:
▪an individual who is a citizen or resident of the United States;
▪a corporation created or organized in or under the laws of the United States, any state thereof or the District
of Columbia;
▪an estate whose income is subject to U.S. federal income taxation regardless of its source; or
▪a trust that (1) is subject to the supervision of a court within the United States and the control of one or more
U.S. persons or (2) has a valid election in effect under applicable U.S. Treasury Regulations to be treated as
a U.S. person.
The tax treatment of a partner in an entity or arrangement treated as a partnership for U.S. federal income tax purposes
that holds ordinary shares generally will depend on such partner’s status, the activities of the partnership and certain
determinations made at the partner level. A U.S. Holder that is a partner in such partnership should consult its tax
advisor.
10.E.2.1Dividends and other distributions on our ordinary shares
Subject to the PFIC considerations discussed below, the gross amount of distributions made by the Company with
respect to our ordinary shares (including the amount of any non-U.S. taxes withheld therefrom, if any) generally will
be includible as dividend income in a U.S. Holder’s gross income in the year received, to the extent such distributions
are paid out of the Company’s current or accumulated earnings and profits, as determined under U.S. federal income
tax principles. Distributions in excess of current and accumulated earnings and profits will be treated as a non-taxable
return of capital to the extent of the U.S. Holder’s basis in ordinary shares and thereafter as capital gain. Assuming the
Company does not maintain calculations of its earnings and profits under U.S. federal income tax principles, a U.S.
Holder should expect all cash distributions will be reported as dividends for U.S. federal income tax purposes. Such
dividends will not be eligible for the kind of dividends-received deduction allowed to U.S. corporations with respect to
dividends received from other U.S. corporations. Dividends received by non-corporate U.S. Holders may be “qualified
dividend income,” which is taxed at the lower applicable capital gains rate, provided that (1) the Company is eligible
for the benefits of the Treaty between the United States and the Netherlands or ordinary shares are listed on the
Nasdaq or another established securities market in the United States, (2) the Company is not a PFIC (as discussed
below) for either the taxable year in which the dividend was paid or the preceding taxable year, (3) the U.S. Holder
satisfies certain holding period requirements, and (4) the U.S. Holder is not under an obligation to make related
payments with respect to positions in substantially similar or related property. U.S. Holders should consult their tax
advisors regarding the availability of the lower rate for dividends paid with respect to ordinary shares.
The amount of any distribution paid in foreign currency will be equal to the U.S. dollar value of such currency,
translated at the spot rate of exchange on the date such distribution is received, regardless of whether the payment is in
fact converted into U.S. dollar at that time.
Dividends on our ordinary shares generally will constitute foreign source income for foreign tax credit limitation
purposes. Subject to certain complex conditions and limitations, Dutch taxes withheld on any distributions on ordinary
shares may be eligible for credit against a U.S. Holder’s federal income tax liability, or at such holder’s election, may
be eligible as a deduction in computing such holder’s U.S. federal taxable income. If a refund of, an exemption from,
or a reduction of the tax withheld is available under the laws of the Netherlands or under the Treaty, the amount of tax
withheld that is refundable, exempted, or reduced will not be eligible for such credit against a U.S. Holder’s U.S.
federal income tax liability (and will not be eligible for the deduction against U.S. federal taxable income). If the
dividends constitute qualified dividend income as discussed above, the amount of the dividend taken into account for
purposes of calculating the foreign tax credit limitation will generally be limited to the gross amount of the dividend,
multiplied by the reduced rate applicable to the qualified dividend income, divided by the highest rate of tax normally
applicable to dividends. The limitation on foreign taxes eligible for credit is calculated separately with respect to
specific classes of income. For this purpose, dividends distributed by the Company with respect to ordinary shares will
generally constitute “passive category income.” Recently issued U.S. Treasury Regulations further restrict the
availability of foreign tax credits. However, a recent notice from the IRS indicates that the U.S. Department of the
Treasury and the IRS are considering proposing amendments to such Treasury Regulations and allows, subject to
certain conditions, taxpayers to defer the application of many aspects of such Treasury Regulations for taxable years
beginning on or after December 28, 2021 and ending before the date that a notice or other guidance withdrawing or
modifying the temporary relief is issued (or any later date specified in such notice or other guidance). The rules
relating to the determination of the U.S. foreign tax credit are complex, and U.S. Holders should consult their tax
advisors regarding the availability of a foreign tax credit in their particular circumstances and the possibility of
claiming an itemized deduction (in lieu of the foreign tax credit) for any foreign taxes paid or withheld.
10.E.2.2Sale or other taxable disposition of our ordinary shares
Subject to the PFIC considerations discussed below, upon a sale or other taxable disposition of ordinary shares, a U.S.
Holder will recognize capital gain or loss in an amount equal to the difference between the amount realized and the
U.S. Holder’s adjusted tax basis in such ordinary shares, in each case as determined in U.S. dollars. Any such gain or
loss generally will be treated as long-term capital gain or loss if the U.S. Holder’s holding period in our ordinary
shares exceeds one year. Non-corporate U.S. Holders (including individuals) generally will be subject to U.S. federal
income tax on long-term capital gain at preferential rates. The deductibility of capital losses is subject to significant
limitations.
Gain or loss, if any, realized by a U.S. Holder on the sale or other disposition of our ordinary shares generally will be
treated as U.S. source gain or loss for U.S. foreign tax credit limitation purposes. As a result, the use of U.S. foreign
tax credits relating to any Dutch income tax imposed upon gains in respect of our ordinary shares may be limited. U.S.
Holders should consult their tax advisors regarding the tax consequences if Dutch taxes are imposed on a taxable
disposition of our ordinary shares and their ability to credit any Dutch tax against their U.S. federal income tax
liability.
If the consideration received upon the sale or other disposition of our ordinary shares is paid in foreign currency, the
amount realized will be the U.S. dollar value of the payment received, translated at the spot rate of exchange on the
date of taxable disposition. The ordinary shares are listed on the Nasdaq Global Select Market. If our ordinary shares
are treated as traded on an established securities market for U.S. federal income tax purposes and the relevant U.S.
Holder is either a cash basis taxpayer or an accrual basis taxpayer who has made a special election (which must be
applied consistently from year to year and cannot be changed without the consent of the IRS), such holder will
determine the U.S. dollar value of the amount realized in foreign currency by translating the amount received at the
spot rate of exchange on the settlement date of the sale. An accrual basis taxpayer that does not make the special
election will recognize exchange gain or loss to the extent attributable to the difference between the exchange rates on
the sale date and the settlement date, and such exchange gain or loss generally will constitute U.S.-source ordinary
income or loss.
A U.S. Holder’s initial tax basis in our ordinary shares generally will equal the cost of such ordinary shares. However,
if a U.S. Holder acquired our ordinary shares upon the Merger in exchange for the Ferrovial, S.A.’s ordinary shares
and if the Merger qualifies as a tax-free reorganization for U.S. tax purposes, such U.S. Holder’s tax basis may be
equal to the adjusted tax basis in the Ferrovial, S.A.’s shares surrendered in exchange. If a U.S. Holder used foreign
currency to purchase our ordinary shares, the cost of our ordinary shares will be the U.S. dollar value of the foreign
currency purchase price on the date of purchase, translated at the spot rate of exchange on that date. If our ordinary
shares are treated as traded on an established securities market for U.S. federal income tax purposes and the relevant
U.S. Holder is either a cash basis taxpayer or an accrual basis taxpayer who has made the special election described
above, the U.S. Holder will determine the U.S. dollar value of the cost of such ordinary shares by translating the
amount paid at the spot rate of exchange on the settlement date of the purchase.
10.E.2.3Passive foreign investment company considerations
The Company will be classified as a PFIC for any taxable year if either: (a) at least 75.0% of its gross income is
“passive income” for purposes of the PFIC rules or (b) at least 50.0% of the value of its assets (determined on the basis
of a quarterly average) is attributable to assets that produce or are held for the production of passive income. For this
purpose, passive income includes interest, dividends and other investment income, with certain exceptions. The PFIC
rules also contain a look-through rule whereby the Company will be treated as owning its proportionate share of the
assets and earning its proportionate share of the income of any other corporation in which it owns, directly or
indirectly, 25.0% or more (by value) of the stock.
Under the PFIC rules, if the Company were considered a PFIC at any time that a U.S. Holder holds ordinary shares,
the Company would continue to be treated as a PFIC with respect to such investment unless (i) the Company ceased to
be a PFIC and (ii) the U.S. Holder made a “deemed sale” election under the PFIC rules.
Whether the Company is treated as a PFIC is a factual determination that is made on an annual basis after the close of
each taxable year. This determination will depend on, among other things, the ownership and the composition of the
income and assets, as well as the value of the assets (which may fluctuate with our market capitalization), of the
Company and its subsidiaries from time to time. Based on the nature of the Company’s business, the ownership and
the composition of the income, assets and operations of the Company, although not free from doubt, the Company
believes it was not a PFIC for the taxable year ending December 31, 2024. However, the determination of the
Company’s PFIC status is complex and subject to ambiguities. Moreover, the Company’s PFIC status for the current
and future taxable years depends, in large part, on the expected value of our goodwill, which could fluctuate
significantly. The IRS or a court may disagree with our determinations, including the manner in which we determine
the value of our assets and the percentage of our assets that are passive assets under the PFIC rules. Therefore, there
can be no assurance that the Company will not be classified as a PFIC for the current taxable year or for any future
taxable year.
If the Company is considered a PFIC at any time that a U.S. Holder holds our ordinary shares, any gain recognized by
the U.S. Holder on a sale or other disposition of ordinary shares, as well as the amount of any “excess
distribution” (defined below) received by the U.S. Holder, would be allocated ratably over the U.S. Holder’s holding
period for ordinary shares. The amounts allocated to the taxable year of the sale or other disposition (or the taxable
year of receipt, in the case of an excess distribution) and to any year before the Company became a PFIC would be
taxed as ordinary income. The amount allocated to each other taxable year would be subject to tax at the highest rate in
effect for individuals or corporations, as appropriate, for that taxable year, and an interest charge would be imposed.
For the purposes of these rules, an excess distribution is the amount by which any distribution received by a U.S.
Holder on ordinary shares exceeds 125.0% of the average of the annual distributions on ordinary shares received
during the preceding three years or the U.S. Holder’s holding period, whichever is shorter. Certain elections may be
available that would result in alternative treatments (such as mark-to-market treatment) ordinary shares if the
Company is considered a PFIC.
If the Company is considered a PFIC, a U.S. Holder will also be subject to annual information reporting requirements.
U.S. Holders should consult their tax advisors about the potential application of the PFIC rules to an investment in
ordinary shares.
10.E.2.4Information reporting and backup withholding
Distributions with respect to our ordinary shares and proceeds from the sale, exchange or redemption of ordinary
shares may be subject to information reporting to the IRS and U.S. backup withholding. A U.S. Holder may be eligible
for an exemption from backup withholding if the U.S. Holder furnishes a correct taxpayer identification number and
makes any other required certification or is otherwise exempt from backup withholding. U.S. Holders who are
required to establish their exempt status may be required to provide such certification on IRS Form W-9. U.S. Holders
should consult their tax advisors regarding the application of the U.S. information reporting and backup withholding
rules.
Backup withholding is not an additional tax. Amounts withheld as backup withholding may be credited against a U.S.
Holder’s U.S. federal income tax liability, and such U.S. Holder may obtain a refund of any excess amounts withheld
under the backup withholding rules by timely filing an appropriate claim for refund with the IRS and furnishing any
required information.
10.E.2.5Additional information reporting requirements
Certain U.S. Holders who are individuals (and certain entities) that hold an interest in “specified foreign financial
assets” (which may include ordinary shares) are required to report information relating to such assets, subject to
certain exceptions (including an exception for ordinary shares held in accounts maintained by certain financial
institutions). Penalties can apply if U.S. Holders fail to satisfy such reporting requirements. U.S. Holders should
consult their tax advisors regarding the applicability of these requirements to their acquisition and ownership of
ordinary shares.
10.E.3Spanish Tax Considerations
Spanish tax law foresees a special tax neutral regime established in Spain in Chapter VII of Title VII of the Spanish
CIT Law (the “Special Tax Neutral Regime”). Under this Special Tax Neutral Regime, certain transactions of a
reorganization nature may benefit from total or partial tax neutrality that consists in deferring the tax due on the gains
or losses which may arise in connection with the reorganization, both for the companies involved and its shareholders.
This Special Tax Neutral Regime is applicable if certain requirements are met.
Cross-border mergers where the absorbed company is resident for tax purposes in Spain and the absorbing company is
resident in another EU member state for tax purposes may elect for this Special Tax Neutral Regime provided the
merger takes place mainly for valid business reasons and not for tax purposes. In order for the Special Tax Neutrality
Regime to apply to the Company, its assets and liabilities must be allocated to a permanent establishment of the
Company located in Spain.
Ferrovial, S.A. applied the Special Tax Neutrality Regime, and at such time, Ferrovial, S.A.’s assets were allocated to
a branch of the Company in Spain, and to the extent that the Merger is considered by the Spanish tax authorities to be
carried out for sound business reasons and not tax driven:
▪The Merger did not constitute any realization or distribution of capital gains or losses relating to assets of
Ferrovial, S.A. which were transferred to the Company and affected to its Spanish branch.
▪The assets which were transferred to the Company and affected to its Spanish branch by means of the
Merger will keep the same tax basis that they had in the hands of Ferrovial, S.A. prior to the Merger.
▪As referred above, to benefit from the Special Tax Neutral Regime, the Merger has to meet the business
purposes test: the Merger must be carried out with the purpose of rationalizing, reorganizing or restructuring
the economic activities of the entities participating in the operation but cannot be carried out merely to
obtain a tax advantage or tax deferral.
The Special Tax Neutral Regime will also apply to shareholders resident in Spain or in an EU or EEA member state,
that should attribute to ordinary shares received in exchange the same tax basis that ordinary shares of Ferrovial,S.A.
exchanged held immediately before the Merger. This Special Tax Neutral Regime does not apply to shareholders not
resident in an EU or EEA member state; which cannot take advantage of the Special Tax Neutral Regime and will
trigger gains or losses in Spain as a result of the Merger.
Pursuant to the amended consolidated text of the Spanish Non-resident Income Tax Law, approved by Royal
Legislative Decree 5/2004 of March 5 and its implementing regulations, as approved by Decree Law 1776/2004 of
July 30 (the “NRIT Law”), capital gains derived from the transfer of ordinary shares (the Merger implies a transfer of
Shares), or any other capital gain related to such securities by legal entities or individuals who do not act through a
permanent establishment in Spain, are subject to non-resident income tax (“NRIT”), being the tax payable calculated,
generally, in accordance with the rules set forth by the Spanish Law 35/2006 of November 28 on the Personal Income
Tax and on the partial amendment of the Corporate Income Tax, Non-resident Income Tax and Wealth Tax Law and
its implementing regulations, as approved by Decree Law 439/2007 of March 30 (“PIT Law”). In particular, capital
gains derived from the transfer of our ordinary shares are subject to NRIT at the rate of 19.0% in the 2023 tax year,
unless a domestic exemption or a Double Taxation Treaty applies, in which case the provisions of the Double Taxation
Treaty prevails.
Under Spanish tax law, capital gains derived from the transfer of shares which have not been obtained through a
permanent establishment in Spain by individuals and entities resident for tax purposes in other member states of the
EU, or permanent establishments of these residents in another EU member state (other than Spain) are exempt from
NRIT, provided that they have not been obtained through countries officially qualifying as non-cooperative
jurisdictions for Spanish tax purposes. This exemption does not apply to capital gains resulting from the transfer of
shares or rights of an entity: (i) when the assets of that entity comprise, mainly, real estate property located in the
Spanish territory, whether directly or indirectly; (ii) in the case that the transferor is a non-resident individual at any
time during the twelve months prior to the transfer, when the transferor holds an interest, directly or indirectly, of at
least 25.0% of the capital or equity of the company; or (iii) in the case that the transferor is a non-resident company,
when the transfer does not meet the requirements for application of the exemption set down in article 21 of the CIT
Law. This exemption also applies to capital gains which have not been obtained through a permanent establishment in
Spain by individuals and entities resident for tax purposes in member states of the EEA, or permanent establishments
of these resident in other member states of the EEA, provided that the requirements set forth in the NRIT Law are met.
Please also note that, under the Spanish holding company regime (régimen de entidades de tenencia de valores
extranjeros) capital gains obtained by non-residents corresponding to gains related to the holding of foreign active
entities are not subject to capital gain taxes in Spain, provided the non-resident shareholder is not acting through a
non-cooperative jurisdiction for Spanish tax purposes.
In general, offsetting gains and losses from different transfers is not permitted.
Non-resident shareholders are obliged to file a tax return (currently, Form 210), calculating and paying, as applicable,
the resulting NRIT due. This tax return may also be filed, and the NRIT paid, by the taxpayer’s tax representative in
Spain, the depository or the manager of ordinary shares, applying the procedure and the tax return set out in Order
EHA/3316/2010, of December 17, 2010.
In the event that an exemption applies, whether under Spanish law or through a Double Taxation Treaty, the non-
resident shareholder must provide evidence of his, her or its right by providing a certificate of tax residency in a timely
manner duly issued by the tax authorities of his/her/its country of residence (which must state, as the case may be, that
the investor is resident in that country within the meaning of the applicable Double Taxation Treaty) or the form
stipulated in the Order implementing the applicable Double Taxation Treaty. Such tax residency certificates are
generally valid for one year from the date of issue for these purposes, and must refer to the tax period in which the
capital gain is made.
10.FDividends and Paying Agents
Not applicable.
10.GStatement by Experts
Not applicable.
10.HDocuments on Display
We are subject to the periodic reporting and other informational requirements of the Exchange Act. Under the
Exchange Act, we are required to file reports and other information with the SEC. Specifically, we are required to file
annually a Form 20-F within 120 days of each fiscal year. Copies of reports and other information, when so filed may
be inspected without charge and may be obtained at prescribed rates at the public reference facilities maintained by the
SEC at 100 F Street, N.E., Washington, D.C. 20549. You can request copies of these documents upon payment of a
duplicating fee, by writing to the SEC. Please call the SEC at 1-800-SEC-0330 for further information on the operation
of the public reference rooms. The SEC also maintains a website at https://www.sec.gov/ that contains reports, proxy
and information statements and other information regarding registrants that make electronic filings with the SEC using
its EDGAR system.
As a foreign private issuer, we are exempt from the rules under the Exchange Act prescribing the furnishing and
content of quarterly reports and proxy statements, and officers, directors and principal shareholders are exempt from
the reporting and short-swing profit recovery provisions contained in Section 16 of the Exchange Act. In addition,
since our ordinary shares are traded on Euronext Amsterdam and the Spanish Stock Exchanges, we file or disclose, as
applicable, annual and semi-annual reports and other information with, and furnish information to the Dutch Authority
for the Financial Markets (Stichting Autoriteit Financiële Markten, the “AFM”) and the Spanish National Securities
Market Commission (Comisión Nacional del Mercado de Valores, or “CMNV”), as required under the applicable
Dutch and Spanish laws.
Copies of our filings with the AFM and the CMNV can be retrieved electronically at www.afm.nl and www.cnmv.es,
respectively.
We also maintain a website at www.ferrovial.com. The information contained on our website or available through our
website is not incorporated by reference into and should not be considered a part of this Annual Report, and the
reference to our website in this Annual Report is an inactive textual reference only.
10.ISubsidiary Information
Not applicable
10.JAnnual Report to Security Holders
If we are required to provide an annual report to security holders in response to the requirements of Form 6-K, we will
submit the annual report to security holders in electronic format in accordance with the EDGAR Filer Manual.
ITEM 11. QUANTITATIVE AND QUALITATIVE DISCLOSURES ABOUT MARKET RISK
We are exposed to certain market risks in the ordinary course of our business. These risks primarily consist of interest
rate risk, foreign exchange risk, credit risk, liquidity risk, equities risk and inflation risk. For information on our
quantitative and qualitative market risks, see Note 5.4 (Financial Risk and Capital Management) to the Audited
Financial Statements.
ITEM 12. DESCRIPTION OF SECURITIES OTHER THAN EQUITY SECURITIES
12.ADebt Securities
Not applicable.
12.BWarrants and Rights
Not applicable.
12.COther Securities
Not applicable.
12.D American Depositary Shares
Not applicable.
PART II
ITEM 13. DEFAULTS, DIVIDEND ARREARAGES AND DELINQUENCIES
None.
ITEM 14. MATERIAL MODIFICATIONS TO THE RIGHTS OF SECURITY HOLDERS AND USE OF
PROCEEDS
None.
ITEM 15. CONTROLS AND PROCEDURES
15.AManagement’s Evaluation over Disclosure Controls and Procedures
We maintain disclosure controls and procedures (as such term is defined in Rules 13a-15(e) and 15d-15(e) under the
Exchange Act) designed to ensure that information required to be disclosed in our reports filed under the Exchange
Act is recorded, processed, summarized and reported within the time period specified in the SEC’s rules and forms,
and that such information is accumulated and communicated to our management, including our Chief Executive
Officer and Chief Financial Officer, as appropriate, to allow timely decisions regarding required disclosures. In
designing and evaluating our disclosure controls and procedures, management recognizes that any controls and
procedures, no matter how well designed and operated, can provide only reasonable assurance of achieving the desired
control objectives.
Our management, with the participation of our Chief Executive Officer and Chief Financial Officer, have evaluated
the effectiveness of our disclosure controls and procedures as of December 31, 2024. Based upon our evaluation, our
Chief Executive Officer and Chief Financial Officer concluded that, as of December 31, 2024, as a result of the
material weakness in our internal control over financial reporting described below related to the insufficient
monitoring controls in relation to the activity of privileged users of IT applications, our disclosure controls and
procedures were not effective to accomplish their objectives at the reasonable assurance level.
Notwithstanding the existing material weakness in internal control over financial reporting, management has
concluded that the Company’s consolidated financial statements as at and for the year ended December 31, 2024
present fairly, in all material respects, the Company’s financial position, results of operations, changes in equity and
cash flows in accordance with IFRS. Also, and considering the disclosure controls and procedures specifically
implemented for reports filed under the Exchange Act, management has concluded that the current report and for the
year ended December 31, 2024 accurately and fairly captures all relevant information for investors.
15.BManagement’s Annual Report on Internal Control over Financial Reporting
This Annual Report does not include a report of management’s assessment regarding internal control over financial
reporting due to a transition period established by rules of the Securities and Exchange Commission for newly public
companies.
15.CAttestation Report of the Registered Public Accounting Firm
This Annual Report does not include an attestation report of the company’s registered public accounting firm due to a
transition period established by rules of the Securities and Exchange Commission for newly public companies.
15.DChanges in Internal Control Over Financial Reporting
As previously disclosed in our registration statement on Form 20-F, filed with the SEC on April 29, 2024 (the “20-F
Registration Statement”), our management identified three material weaknesses in the design and operating
effectiveness of our internal control over financial reporting, as controls in our previous internal control over financial
reporting system were not designed at the level required by SOX. A material weakness is a deficiency, or a
combination of deficiencies, in internal control over financial reporting, such that there is a reasonable possibility that
a material misstatement of the company’s annual or interim financial statements will not be prevented or detected on a
timely basis. The material weaknesses identified related specifically to: (i) lack of evidence of management review
controls pertaining to control attributes, precision level applied and documentation of matters resolved and over the
completeness and accuracy of reports used in the controls, (ii) lack of designed, implemented and operating
effectiveness testing internal controls over information technology general controls impacting systems and
applications used in significant processes, and (iii) lack of control design to ensure appropriate segregation of duties is
maintained in recording transactions.
During 2024, we completed the definition of our overall SOX model and the framework applicable to the generation
and retention of control evidence. Additionally, we started generating evidence for all controls applicable under our
new framework on a recurring basis, and commenced a recurring testing program performed by our Internal Audit
function to assess whether the controls were designed properly to address the risks, and if the controls were
implemented as designed.
Also during 2024, we have implemented the following changes in our internal control over financial reporting related
to our remediation plan for the three material weaknesses identified in the 20-F Registration Statement:
▪In relation to management review controls and reports used in the controls:
◦For management review controls we have identified a complete population of management review
controls that operate throughout our business processes for which we focused our remediation
efforts. Additionally, we have included in our internal SOX procedures a detailed framework related
to preparation and retention of documentation of the control performance, required control attributes,
the precision level applied, and the investigation and resolution of review matters. Finally, we have
tested the design and implementation of those management review controls that directly address a
risk of material misstatement in our consolidated financial statements.
◦For reports used in the controls, as in the case of management review controls, we have identified
the complete population of reports used in the controls (what we call Information Prepared by the
Entity, or IPEs); we have defined a framework of the documentation requirements for those reports
to prove accuracy and completeness; we have implemented that framework in the complete
population; and finally we have tested the design and implementation of those IPEs that directly
address a risk of material misstatements in our consolidated financial statements.
▪In relation to information technology general controls, or ITGCs, we have identified the key applications used
in the business processes that are used for the preparation of consolidated financial statements; we have
identified for those applications the controls impacting risks related to access management, change
management, computers operations and programs development; we have established a framework regarding
the documentation requirements of the controls, implemented the framework; and finally we have tested the
design and implementation of those ITGCs that relate to a risk of material misstatements in our financial
statements.
▪In relation to segregation of duties, we have defined, formalized and approved an internal framework
identifying the main risks related to segregation of duties, functions related to those risks and applications
related to those functions. After that analysis, we have identified the segregation of duties conflicts identified
in the relevant IT applications and have adjusted the roles of users, authorization of transactions and accesses
to minimize the number of conflicts and have identified compensating controls where conflicts could not be
resolved. Also, we have incorporated the segregation of duties conflicts identified in the mentioned analysis
to the provision of access to new users. Finally, we have designed and implemented for core financial
applications periodic controls to ensure that the Segregation of Duties position is reviewed on a recurrent
basis.
Finally, we have reviewed the results of the testing performed by our Internal Audit function, focusing on design and
implementation of controls in key business processes and in IT applications addressing risks of material misstatement,
to assess whether any deficiency or a combination of deficiencies could be qualified as material weaknesses.
Following this assessment we have concluded that the material weaknesses identified in the 20-F Registration
Statement have been remediated as of December 31, 2024, except for the insufficient monitoring controls in relation to
the activity of privileged users of IT applications within the previously identified material weakness related to
information technology general controls referenced above.
In connection with the material weakness related to the insufficient monitoring controls of the activity of privileged
users of IT applications, starting in 2025, we will complete the activation of logs in core financial applications and the
monitoring of the information obtained from those logs to supervise the activity of privileged users, and will
commence a recurring testing of these controls by our Internal Audit function.
Other than with respect to the improvements to our internal control over financial reporting and the remediation efforts
taken to address the material weaknesses described above, there were no changes to our internal control over financial
reporting (as such term is defined in Rules 13a-15(f) and 15d-15(f) under the Exchange Act) during the year ended
December 31, 2024 that has materially affected, or is reasonably likely to materially affect, our internal control over
financial reporting.
ITEM 16. [RESERVED]
ITEM 16A. AUDIT COMMITTEE FINANCIAL EXPERT
Our Board has determined that Mr. Gonzalo Urquijo is an independent director and audit committee financial expert in
accordance with SEC Rule 10A-3 pursuant to Section 10A of the Exchange Act.
ITEM 16B. CODE OF ETHICS
We have adopted a Code of Ethics and Business Conduct that applies to all of employees, officers, and directors of the
Group and is intended to meet the definition of “code of ethics” under item 16B of Form 20-F. This includes the
Company’s principal executive officer, principal financial officer, principal accounting officer or controller, or persons
performing similar functions. The Code of Ethics and Business Conduct is available on our website at https://
www.ferrovial.com/en/ir-shareholders/corporate-governance/corporate-policies/, and we intend to disclose on our
website any future amendments to the Code of Ethics and Business Conduct or waivers that exempt any principal
executive officer, principal financial officer, principal accounting officer or controller, or persons performing similar
functions, or Directors from provisions in the Code of Ethics and Business Conduct. We granted no waivers under our
Code of Ethics and Business Conduct in 2024. The information contained on our website is not incorporated by
reference in this Annual Report.
ITEM 16C. PRINCIPAL ACCOUNTANT FEES AND SERVICES
The audited consolidated financial statements of Ferrovial SE at December 31, 2024 and 2023 and for each of the two
years in the period ended December 31, 2024, appearing in this Annual Report have been audited by Ernst & Young,
S.L., independent registered public accounting firm, as set forth in their report thereon appearing elsewhere herein, and
are included in reliance upon such report given on the authority of such firm as experts in accounting and auditing.
The registered business address of Ernst & Young, S.L. is Calle de Raimundo Fernández Villaverde, 65, 28003
Madrid, Spain.
The table below sets out the total amount billed to us by Ernst & Young, S.L. for services performed in each of the
years ended December 31, 2024 and 2023, and breaks down these amounts by category of service:
| | |
| |
| | |
| |
Audit Fees ............................................................................................... | | |
Audit-Related Fees ................................................................................. | | |
Tax Fees .................................................................................................. | | |
All Other Fees ......................................................................................... | | |
Total ....................................................................................................... | | |
“Audit fees” relate to the following audit services:
▪Statutory consolidated financial statements for the years ended December 31, 2023 and 2024;
▪Statutory subsidiaries' financial statements for the years ended December 31, 2023 and 2024;
▪Consolidated financial statements under PCAOB standards filed with the SEC for the years ended December
31, 2023 and 2024;
▪Review of the half year interim consolidated financial statements performed in June of each year.
“Audit-related Fees” are assurance and related services that are reasonably related to the performance of the audit or
review of the Group’s financial statements. This category includes fees related to the preparation of comfort letters for
debt issued and verification of the no financial information among others.
"Tax Fees" relate to fees incurred for tax compliance, tax advice and tax planning.
"All Other Fees" consists of services provided by the principal accountant, other than the services reported in the
above-mentioned sections. During 2023 and 2024 there were no services rendered for this item.
Pre-Approval Policies and Procedures
The advance approval of the Audit and Control Committee or members thereof, to whom approval authority has been
delegated, is required for all audit and non-audit services provided by our auditors to ensure that such engagements do
not impair the independence of our independent registered public accounting firm.
All services provided by our auditors are approved in advance by either the Audit and Control Committee or members
thereof, to whom authority has been delegated, in accordance with the Audit and Control Committee's pre-approval
policy, except for these types of Audit-related services that are, as determined by the Audit and Control Committee,
unlikely to impair the Auditors’ independence, and are considered pre-approved. They are subject to oversight by the
ACC, moreover the ACC is informed on a timely basis of any such services rendered by the Auditors.
ITEM 16D. EXEMPTIONS FROM THE LISTING STANDARDS FOR AUDIT COMMITTEES
Not applicable.
ITEM 16E. PURCHASES OF EQUITY SECURITIES BY THE ISSUER AND AFFILIATED PURCHASERS
November 2023 Share Buy-Back Program
On June 13, 2023, the General Meeting of the Company resolved to authorize the Board to resolve on the repurchase
of the Company’s ordinary shares for a period of 18 months from Merger effectiveness, subject to the following
conditions: (i) the Company and the Group Companies could not hold more than 10% of the issued share capital of the
Company (either through purchase on a stock exchange or otherwise); (ii) the minimum price paid for each common
share repurchased, excluding expenses, had to be the nominal value of such share; and (iii) the maximum price paid
for each common share repurchased, excluding expenses, could not exceed an amount equal to 125% of the quoted
price on the date of acquisition on a market on which the ordinary shares of the Company are listed.
On November 30, 2023, the Board resolved on the implementation of and we announced a share buy-back program
with a maximum net investment of EUR 500,000,000 and maximum share acquisition of 34,000,000 ordinary shares
of the Company (representing approximately 4.59% of the Company’s share capital as of that date), in a form and
manner consistent with Dutch law and Dutch market practice applicable, U.S. federal securities laws and the terms of
the authorization of the 2023 General Meeting. The purpose of the program was to reduce the share capital of the
Company. The program was authorized for the period from December 1, 2023 up to, and including, May 1, 2024,
subject to earlier termination if the maximum net investment or maximum share acquisition are reached, or in any
other advisable circumstances. Under this share buy-back program, we entered into agreements with one or more
financial institutions to facilitate our share buy-back. During 2024, we acquired a total of 10,355,493 ordinary shares
under the November 2023 share buy-back program.
April 2024 Share Buy-Back Program
On April 11, 2024, the General Meeting of the Company resolved to authorize the Board on the repurchase of the
Company’s ordinary shares for a period of 18 months from April 11, 2024, up to and including October 10, 2025,
subject to the following conditions: (i) the Company and the Group Companies could not hold more than 10% of the
issued share capital of the Company; (ii) the minimum price paid for each share repurchased had to be the nominal
value of such share; and (iii) the maximum price paid for each share repurchased, excluding expenses, could not
exceed an amount equal to 110% of the closing price on the day prior to the date of acquisition on the exchange on
which the ordinary shares of the Company are acquired or, in the case of shares not acquired on an exchange, the
exchange designed by the Board. This authorization, upon adoption, replaced the authorization dated June 13, 2023.
On that same date, the Board resolved on the implementation of and we announced a share buy-back program with a
maximum net investment of EUR 500,000,000 and maximum share acquisition of 37,000,000 ordinary shares of the
Company (representing approximately 4.995% of the Company’s share capital as of that date), in a form and manner
consistent with Dutch law and Dutch market practice, applicable U.S. federal securities laws and the terms of the
authorization of the 2024 General Meeting. The purpose of the program was to reduce the share capital of the
Company. The program was authorized for the period from May 2, 2024 up to, and including, December 31, 2024,
subject to earlier termination if the maximum net investment or maximum share acquisition are reached, or in any
other advisable circumstances and was not to commence until the Company's buy-back program announced on
November 30, 2023 has ended. Under this share buy-back program, we entered into agreements with one or more
financial institutions to facilitate our share buy-back. During 2024, we acquired a total of 9,231,251 ordinary shares
under the April 2024 share buy-back program.
August 2024 Share Repurchase Program
In addition to shares acquired under our periodic share buy-back and amortization of shares program, on August 23,
2024, the Board resolved on the implementation of and we announced a repurchase program of our shares to be used
in the context of different corporate actions (such as, for instance, satisfaction of obligations under employee share-
based incentives plans, placement of shares in the market, or cancellation of the repurchased shares),with a maximum
net investment of EUR 300,000,000 and maximum share acquisition of 30,000,000 ordinary shares of the Company
(representing approximately 4.1% of the Company’s share capital as of that date), in a form and manner consistent
with Dutch law and Dutch market practice, applicable U.S. federal securities laws and the terms of the authorization of
the 2024 General Meeting. The program was authorized for the period from August 26, 2024 up to, and including,
February 28, 2025, subject to earlier termination if the maximum net investment or maximum share acquisition are
reached, or in any other advisable circumstances.
On December 13, 2024, we announced an extension of the duration of the August 2024 repurchase program to May
30, 2025 (inclusive), and an increase of the maximum investment amount by EUR 300,000,000, bringing the total
maximum amount of investment to EUR 600,000,000. Under this share repurchase program, we may from time-to-
time enter into agreements with one or more financial institutions to facilitate our share repurchases. During 2024, we
acquired a total of 7,169,540 ordinary shares under the August 2024 share repurchase program. We may extend its
duration in view of the prevailing circumstances and in the interest of the Company and its stakeholders.
Reduction of Share Capital
During the year 2024 we reduced our share capital in 23,250,608 ordinary shares through the cancellation of our
treasury shares, including 21,486,744 ordinary shares acquired during 2024 and 2023 as part of our November 2023
and April 2024 repurchase programs.
The table below summarizes the number of shares that we acquired under the periodic share buy-back and
amortization of shares programs and our additional repurchase program in the context of other corporate actions for
the year ended December 31, 2024.
| | | | |
| | | | |
| Total Number of Shares Purchased (1) | Average Price Paid per share. Amounts in EUR (2) | Total Number of Shares Purchased as Part of Publicly Announced Plans or Programs | Maximum Number of Shares (or Approximate Dollar Value) that May Yet be purchased Under the Plans or Programs |
| | | | |
| | | | |
| | | | |
| | | | |
| | | | |
| | | | |
| | | | |
| | | | |
| | | | |
| | | | |
| | | | |
| | | | |
| | | | |
(1) As of the settlement date of the transaction. No shares were repurchased by the Company during 2024 other than through the publicly disclosed
share buy-back and repurchase programs.
(2) Excludes broker and transaction fees.
(3) On November 30, 2023, Ferrovial announced a share buy-back program with a maximum net investment of EUR 500,000,000 and maximum
share acquisition of 34,000,000 ordinary shares. The program was authorized for the period from December 1, 2023 up to, and including, May 1,
2024. The program was completed on April 30, 2024. The total number of shares repurchased under the program in the year 2024 is 10,355,493
ordinary shares at an average price of EUR 34.91 per share for a total consideration of EUR 361.5 million.
(4) On April 11, 2024, Ferrovial announced a share buy-back program with a maximum net investment of EUR 500,000,000 and maximum share
acquisition of 37,000,000 ordinary shares. The program was authorized for the period from May 2, 2024 up to, and including, December 31, 2024.
The program was completed on August 19, 2024. The total number of shares repurchased under the program is 9,231,251 ordinary shares at an
average price of EUR 36.75 per share for a total consideration of EUR 339.2 million.
(5) On August 23, 2024, Ferrovial announced an additional repurchase program with a maximum net investment of EUR 300,000,000 and
maximum share acquisition of 30,000,000 ordinary shares. The program was authorized for the period from August 26, 2024 up to, and including,
February 28, 2025. On December 13, 2024 we announced an extension of the duration of this program until May 30, 2025, and an increase of the
maximum investment by EUR 300,000,000, to a total of EUR 600,000,000. The total number of shares repurchased under the program is 7,169,540
ordinary shares at an average price of EUR 37.90 per share for a total consideration of EUR 271.7 million.
ITEM 16F. CHANGE IN REGISTRANT’S CERTIFYING ACCOUNTANT
On July 30, 2024, the Board of Directors of Ferrovial SE, at the recommendation of its Audit and Control Committee
and following a transparent competitive process, resolved to propose to the Annual General Shareholders’ Meeting of
the Company, that PricewaterhouseCoopers Auditores, S.L. (“PwC”) be appointed as the independent registered
public accounting firm of Ferrovial SE and its consolidated group of companies for the years ending December 31,
2025 through December 31, 2027. This proposal is anticipated to be considered by the shareholders at the upcoming
Annual General Shareholders' Meeting, which is expected to be held in April 2025.
Accordingly, Ernst & Young, S.L. (“EY”) was not re-elected for another term and, upon approval by the shareholders,
it will be dismissed as our independent registered public accounting firm.
The reports of EY on our financial statements for the fiscal years ended December 31, 2023 and 2024 did not contain
an adverse opinion or a disclaimer of opinion, and were not qualified or modified as to uncertainty, audit scope, or
accounting principles.
In addition, in connection with the audits of our financial statements for each of the fiscal years ended December 31,
2023 and 2024, and in the subsequent interim period through the date of filing of this Annual Report, (i) there was no
matter that was the subject of a disagreement (as that term is used in Item 16F(a)(1)(iv) of Form 20-F and the related
instructions thereto) with EY on any matters of accounting principles or practices, financial statement disclosure, or
auditing scope and procedures which, if not resolved to the satisfaction of EY would have caused EY to make
reference to the subject matter of the disagreement in connection with its reports; and (ii) there were no “reportable
events” as defined in Item 16F(a)(1)(v) of Form 20-F, except as it relates to the identification of material weaknesses
in internal control over financial reporting as disclosed in Item 3.D.5.8 of our registration statement on Form 20-F,
filed with the SEC on April 29, 2024, and Item 15 of this Annual Report.
The Company has furnished EY with a copy of the aforementioned disclosure and has formally requested and received
from EY the letter addressed to the SEC, indicating their concurrence with the statements made. A copy of EY's letter,
dated February 27, 2025, is filed as Exhibit 15.1 to this Annual Report.
During the fiscal years ended December 31, 2023 and 2024, and in the subsequent interim period through the date of
filing of this Annual Report, neither we, nor any person acting on our behalf, consulted with PwC on any matter
regarding: (i) the application of accounting principles to a specified transaction, either completed or proposed, or (ii)
the type of audit opinion that might be rendered on our financial statements, and neither a written report nor oral
advice was provided to us that PwC, concluded was an important factor considered by us in reaching a decision as to
the accounting, auditing or financial reporting issue.
ITEM 16G. CORPORATE GOVERNANCE
The Company is a “foreign private issuer,” as such term is defined in Rule 3b-4 under the Exchange Act. As a foreign
private issuer, the Company is permitted to comply with Dutch corporate governance practices in lieu of the otherwise
applicable Nasdaq corporate governance rules, provided that the Company discloses the Nasdaq requirements it will
not follow and the equivalent Dutch requirements with which it will comply instead.
The Company intends to rely on the “foreign private issuer exemption” with respect to the following requirements:
▪Quorum. Nasdaq Listing Rule 5620(c) requires that each company that is not a limited partnership provides
for a quorum as specified in its by-laws for any meeting of the holders of common stock; provided, however,
that in no case shall such quorum be less than 33 1/3% of the outstanding shares of the Company’s common
voting stock.
The Company is permitted, and intends to, follow home country practice in lieu of this requirement. In
accordance with Dutch law, the General Meeting adopts its resolutions in a meeting where no quorum
applies, with the exception of cases in which Dutch law or the Articles of Association specifically provide
for a quorum.
Under Dutch law, a resolution for a specific form of legal demerger whereby different shareholders of the
Company acquire shares in different companies resulting from the demerger, is subject to a quorum of 95%
of the outstanding share capital. The Articles of Association do not provide for additional quorum
requirements.
▪Certain Matters Requiring Shareholder Approval. Nasdaq Listing Rule 5635(c) generally requires
shareholder approval for the adoption or amendment of equity compensation arrangements.
The Company is permitted, and intends to, follow home country practice in lieu of this requirement. In
accordance with Dutch law, our Board, without approval by the General Meeting, may approve the adoption
of an employee equity compensation arrangement insofar as it does not apply to its statutory directors. For
example, during the meeting of our Board held on December 17, 2024, such a plan, pursuant to which shares
may be granted to certain of the Company's employees, but not its statutory directors, was adopted.
The Company otherwise intends to comply with the rules generally applicable to U.S. domestic companies listed on
Nasdaq. The Company may, however, in the future, decide to rely upon the “foreign private issuer exemption” for
purposes of opting out of some or all of the other corporate governance rules.
Following our home country governance practices may provide less protection than is accorded to investors under
Nasdaq rules applicable to domestic issuers.
We intend to take all actions necessary for us to maintain compliance as a foreign private issuer under the applicable
corporate governance requirements of the Sarbanes-Oxley Act of 2002, the rules adopted by the SEC and Nasdaq
listing standards.
Because we are a foreign private issuer, our directors and senior management are not subject to short-swing profit and
insider trading reporting obligations under Section 16 of the Exchange Act. They are, however, subject to the
obligations to report changes in share ownership under Section 13 of the Exchange Act and related SEC rules, as well
as under EU and Dutch securities laws.
ITEM 16H. MINE SAFETY DISCLOSURE
Not applicable.
ITEM 16I. DISCLOSURE REGARDING FOREIGN JURISDICTIONS THAT PREVENT INSPECTIONS
Not applicable
ITEM 16J. INSIDER TRADING POLICIES
The Company has adopted an Insider Trading Compliance Policy and Procedures that governs the purchase, sale and
other dispositions of the Company’s securities by directors, officers and employees. The Company believes that its
Insider Trading Compliance Policy and Procedures is reasonably designed to promote compliance with insider trading
laws, rules and regulations, and listing standards applicable to the Company. A copy of the Company’s Insider Trading
Compliance Policy and Procedures is filed as Exhibit 11.1 to this Annual Report.
ITEM 16K. CYBERSECURITY
Cybersecurity Risk Management and Strategy
We have developed and implemented a cybersecurity risk management program intended to protect the confidentiality,
integrity, and availability of our digital products and services, industrial systems and Internet connected assets
(collectively, “digital and technological environments” or “DT environments”), and the information generated and
used in all processes and operations that support business activities (collectively, “Confidential Information”).
We design and assess our program based on the National Institute of Standards and Technology Cybersecurity
Framework (NIST CSF). This does not imply that we meet any particular technical standards, specifications or
requirements, only that we use the NIST CSF as a guide to help us identify, assess and manage cybersecurity risks
relevant to our business. Separately, our program has also been certified as meeting the requirements of the
International Organization for Standardization (“ISO”) 27001 security standard.
Our cybersecurity risk management program is integrated into our overall enterprise risk management program, and
shares common methodologies, reporting channels and governance processes that apply across the enterprise risk
management program to other legal, compliance, strategic, operational, and financial risk areas.
Key elements of our cybersecurity risk management program include but are not limited to the following:
▪a risk management methodology, which we use as a guide to help us identify and manage privacy related
risks;
▪risk assessments designed to help identify potential material cybersecurity risks to our DT environments and
Confidential Information.
▪a security team lead by Ferrovial Global Chief Information Security Officer (Global CISO), principally
responsible for managing (1) our cybersecurity risk assessment processes, (2) our security controls,
platforms and portfolio and (3) our response to cybersecurity incidents;
▪the use of external service providers, where appropriate, to assess, test or otherwise assist with aspects of our
security controls;
▪cybersecurity awareness training of our employees, incident response personnel, and senior management;
▪a cybersecurity incident response plan that includes procedures for responding to cybersecurity incidents;
and
▪a third-party risk management process for key service providers based on our assessment of their criticality
to our operations and respective risk profile.
We have not identified risks from known cybersecurity threats, including as a result of any prior cybersecurity
incidents, that have materially affected us, including our operations, business strategy, results of operations, or
financial condition. We face risks from cybersecurity threats that, if realized, are reasonably likely to materially affect
us, including our operations, business strategy, results of operations or financial condition. See “3. Key Information—
D. Risk Factors—1. Risks Related to Our Business and Structure—4”. The increase in digitalization and consequently,
the increased risk of cyber threats and misuse of quantum technology, may affect our normal operation of assets and
our ability to generate expected value, which could have a material adverse effect on our business, financial condition,
and results of operations.”
Cybersecurity Governance
Our Board considers cybersecurity risk as part of its risk oversight function and monitors cybersecurity and other
information technology risks. The Board also oversees management’s implementation of our cybersecurity risk
management program.
Once a year, the Board receives from our Global CISO a presentation on our cybersecurity risks, the status of our
cybersecurity program and general cybersecurity topics that impact public companies. In addition, the Global CISO
updates the Board, where they deem appropriate, regarding any significant cybersecurity incidents, as well as any
incidents considered to be potentially significant.
The Global CISO, together with the Ferrovial Head of Cybersecurity Governance and Business Continuity, the
Ferrovial Head of Cybersecurity Operations, and the local CISOs of our various Business divisions and subsidiaries
(collectively, the “Cybersecurity Management Team”), is responsible for assessing and managing our material risks
from cybersecurity threats and allocating resources to implement the cybersecurity program. The team has primary
responsibility for our overall cybersecurity risk management program and supervises both our internal cybersecurity
personnel and our retained external cybersecurity consultants. Our Cybersecurity Management Team’s general
experience includes:
▪Cybersecurity Governance, Risk & Compliance.
▪Cybersecurity Risk Management.
▪Control Framework Management and Assessment.
▪Third Party Risk Management.
▪Business Continuity Management.
▪Vulnerability Management.
▪Identity & Access Management and Protection.
▪Cybersecurity Culture and Awareness..
▪Audit and eDiscovery Management.
▪Cybersecurity Operations and Architectures.
▪Monitoring and Correlation.
▪Incident Detection and Response.
▪Endpoint Security.
▪Security in Communications Networks and Perimeters.
▪Cloud Security.
▪Application Security.
▪Attack Surface Management.
▪Threat Intelligence.
▪Information Protection.
▪Security in Software Development Lifecycle.
▪ OT/IoT Security.
▪Cybersecurity Automation.
Specifically, the Ferrovial Global CISO is a security professional with more than 25 years of IT and cybersecurity
experience gained in a variety of companies and sectors with a balanced mix of strategy, management and operational
security skills developed in multicultural international environments, analyzing and delivering secure, cost effective
services in complex and high value business environments. Over his career, he has obtained ISACA CISA, CISM,
CRISC and CDPSE qualifications and complemented his education by completing an IESE Business School
Management Development Program (PDD) and an ESADE Business School Global Management Program (GMP).
He is trusted and relied upon by our executive management team to establish security governance and design a culture
throughout Ferrovial, that places an emphasis on building and leading internal teams at all levels to transform, embed
and improve security throughout the Organization.
The Ferrovial Head of Cybersecurity Governance and Business Continuity has 20 years of experience in cybersecurity,
developing global governance, risk and control models, and deploying them in complex, heterogeneous and
multicultural environments. Over his career, he has obtained ISACA CISA and CISM qualifications and ISO 27001
LA & LI and ISO 22301 LA certifications and complemented his education by completing an IT Governance Program
provided by Universidad of Deusto. He is a professor, collaborator and occasional speaker in associations focused on
the practice of cybersecurity and privacy.
The Ferrovial Head of Cybersecurity Operations is a seasoned cybersecurity, communications, and cloud professional
with over 15 years of experience in managing and deploying international security services, including prevention,
detection, response, and auditing. He has played a pivotal role in technological and operational transformations and the
extension of cybersecurity frameworks to corporate and OT/IoT environments, and leading cybersecurity initiatives in
major corporate carve-outs. He has also completed executive programs at IMD Business School, IE Business School,
and Universitas Ferrovial and obtained his master’s degree in DevOps from Universidad de La Rioja. He holds
multiple industry-recognized certifications, including Fortinet (FCNSA & FCNSP), Checkpoint (CCSA & CCSE),
Microsoft Azure Fundamentals, Bluecoat (BCCPA & BCCPP), and Cisco CCNA.
The Ferrovial Construction local CISO is a seasoned technology professional with over 18 years of experience in
cybersecurity, technology risk management, compliance, and internal audit. He possesses a senior profile with a
multidisciplinary background and a proven history of managing international projects. His expertise includes advising
senior management and implementing significant information security transformation and cultural change programs.
He holds a master’s degree in computer science and engineering from Universidad Autónoma de Madrid and has
completed Executive Management Programs at IE, Headspring, and The Power Business Schools. Throughout his
career, he has obtained numerous professional certifications, including ISACA's CISA, COBIT, ITIL, BS25999, and
CCI's Green Level Professional.
The Ferrovial CINTRA EU and NM local CISO is a security professional with more than 20 years of experience
spanning several multinational companies, in roles including IT Security Manager, Head of IT Audit, CIO and CISO.
Over his career, he has obtained several information security qualifications such as CISA, CISM, CRISC, Business
Continuity Lead Auditor and Green Level in Industrial Cybersecurity. He has also complemented his education with
an IE Business School Management Development Program.
The Ferrovial CINTRA USA local CISO is an information technology professional with over 25 years of experience
in cybersecurity, technical architecture design, systems implementation, operation, and maintenance. He holds a
bachelor’s degree in computer science from Universidad Tecnológica Simon Rodriguez de Venezuela, and a master’s
degree in computer network technology from Herzing University. Throughout his career, he has obtained numerous
professional certifications, including ISACA's CISA, ITIL, Cisco Certified Network Associate, Microsoft Certified
Systems Engineer, VMware Certified Professional, Red Hat Certified Engineer, Microsoft® Certified Azure
Fundamental, and Microsoft® Certified Azure Security Engineer.
The Ferrovial Energy local CISO has over 20 years of experience in technology and risk management across various
sectors. He supplements his professional life with teaching and is also a member of advisory boards and collaborates
with associations focused on cybersecurity and privacy. He holds a degree in Computer Engineering from Universidad
Autónoma of Madrid and has multiple risk management and security certifications (CISSP, CISA, CISM, CRISC,
CDPSE, CSX-F and ISO 27001). Additionally, he is certified as a Security Chief and Security Director by the
Ministry of the Interior of Spain. In addition to completing a board member program at ESADE, he is currently
finishing a degree in Business Management at Universidad Ramon Llull – LaSalle and an Executive MBA at EAE
Business School.
Our management team supervises efforts to prevent, detect, mitigate and remediate cybersecurity risks and incidents
through various means, which may include: briefings from security personnel; threat intelligence and other
information obtained from governmental, public or private sources, including external consultants engaged by us; and
alerts and reports produced by security tools deployed in the digital environment.
PART III
ITEM 17. FINANCIAL STATEMENTS
See “Item 18. Financial Statements.”
ITEM 18. FINANCIAL STATEMENTS
Financial Statements together with the respective report of the Independent Registered Public Accounting firm, are
filed as a part of this Annual Report, beginning on page F-1.
ITEM 19. EXHIBITS
The following documents are filed as part of this Annual Report.
| | | | | | |
|
| | Incorporation by Reference |
| | | | | | |
| | | | | | |
| | | | | | |
| | | | | | |
| | | | | | |
| | | | | | |
| | | | | | |
| | | | | | |
| | | | | | |
| | | | | | |
| | | | | | |
| | | | | | |
| | | | | | |
| | | | | | |
| | | | | | |
| | | | | | |
| | | | | | |
| | | | | | |
| | | | | | |
| | | | | | |
| | | | | | |
| | | | | | |
| | | | | | |
| Inline XBRL Instance Document – the instance document does not appear in the Interactive Data File because XBRL tags are embedded within the Inline XBRL document. | | | | | |
| Inline XBRL Taxonomy Extension Schema Document | | | | | |
| Inline XBRL Taxonomy Extension Calculation | | | | | |
| Inline XBRL Taxonomy Definition Linkbase Document | | | | | |
| Inline XBRL Taxonomy Extension Label Linkbase Document | | | | | |
| Inline XBRL Taxonomy Extension Presentation Linkbase Document | | | | | |
| Cover Page Interactive Data File (embedded within the Inline XBRL document) | | | | | |
* Filed herewith.
** Furnished herewith.
+ Certain portions of this exhibit (indicated by “[***]”) have been redacted pursuant to Item 4 of the “Instructions As To Exhibits” of
Form 20-F because the Company customarily and actually treats the redacted information as private or confidential and the omitted
information is not material. The Company hereby agrees to furnish an unredacted copy of the exhibit to the SEC upon request.
# Indicates management contract or compensatory plan or arrangement.
SIGNATURES
The registrant hereby certifies that it meets all of the requirements for filing on Form 20-F and that it has duly caused
and authorized the undersigned to sign this Annual Report on its behalf.
| |
| |
| By: /s/ Ignacio Madridejos |
| |
| Title: Chief Executive Officer |
| |
| By: /s/ Ernesto Lopez Mozo |
| |
| Title: Chief Financial Officer |
ferrovial
Ferrovial SE
Consolidated Financial Statements
as of December 31, 2024, 2023
and for each of the years ended
December 31, 2024, 2023 and 2022
CONTENTS
| | | | | |
| CONTENTS | |
| REPORT OF INDEPENDENT REGISTERED PUBLIC ACCOUNTING FIRM (PCAOB ID: 1461) | |
| CONSOLIDATED STATEMENTS OF FINANCIAL POSITION FOR THE YEARS ENDED DECEMBER 31, 2024 AND 2023 | |
| CONSOLIDATED INCOME STATEMENTS FOR THE YEARS ENDED DECEMBER 31, 2024, 2023 AND 2022 | |
| CONSOLIDATED STATEMENTS OF COMPREHENSIVE INCOME FOR THE YEARS ENDED DECEMBER 31, 2024, 2023 AND 2022 | |
| CONSOLIDATED STATEMENTS OF CHANGES IN EQUITY FOR THE YEARS ENDED DECEMBER 31, 2024, 2023 AND 2022 | |
| CONSOLIDATED CASH FLOW STATEMENTS FOR THE YEARS ENDED DECEMBER 31, 2024, 2023 AND 2022 | |
| NOTES TO THE CONSOLIDATED FINANCIAL STATEMENTS FOR 2024, 2023 AND 2022 | |
| SECTION 1: BASIS OF PRESENTATION AND CONSOLIDATION SCOPE | |
| 1.1 BASIS OF PRESENTATION, THE COMPANY’S ACTIVITIES AND CONSOLIDATION SCOPE | |
| 1.2 GOING CONCERN EVALUATION | |
| 1.3 ACCOUNTING POLICIES | |
| 1.4 EXCHANGE RATE | |
| 1.5 SEGMENT REPORTING | |
| SECTION 2: PROFIT/(LOSS) FOR THE YEARS ENDED DECEMBER 31, 2024, 2023 AND 2022 | |
| 2.1 OPERATING INCOME | |
| 2.2. OTHER OPERATING EXPENSES | |
| 2.3. PERSONNEL EXPENSES | |
| 2.4. IMPAIRMENTS AND DISPOSALS | |
| 2.5 NET FINANCIAL INCOME/(EXPENSE) | |
| 2.6 SHARE OF PROFITS OF EQUITY-ACCOUNTED COMPANIES | |
| 2.7 CORPORATE INCOME TAX AND DEFERRED TAXES | |
| 2.8 PROFIT/(LOSS) FROM DISCONTINUED OPERATIONS | |
| 2.9 PROFIT/(LOSS) FROM NON-CONTROLLING INTERESTS | |
| 2.10 NET PROFIT/(LOSS) AND EARNINGS PER SHARE | |
| SECTION 3: NON-CURRENT ASSETS AT DECEMBER 31, 2024 AND 2023 | |
| 3.1 GOODWILL AND ACQUISITIONS | |
| 3.2 INTANGIBLE ASSETS | |
| 3.3 INVESTMENTS IN INFRASTRUCTURE PROJECTS | |
| 3.4 PROPERTY, PLANT AND EQUIPMENT | |
| 3.5 INVESTMENT IN ASSOCIATES | |
| 3.6 NON-CURRENT FINANCIAL ASSETS | |
| 3.7 RIGHTS-OF-USE ASSETS AND ASSOCIATED LIABILITIES | |
| SECTION 4: TRADE CURRENT ASSETS AND LIABILITIES AT DECEMBER 31, 2024 AND 2023 | |
| 4.1. INVENTORIES | |
| 4.2. SHORT-TERM TRADE AND OTHER RECEIVABLES | |
| 4.3. SHORT-TERM TRADE AND OTHER PAYABLES | |
| 4.4. BALANCES UNDER CONTRACTS WITH CUSTOMERS AND OTHER IFRS 15 DISCLOSURES | |
| SECTION 5: CAPITAL STRUCTURE AND FINANCING AT DECEMBER 31, 2024 AND 2023 | |
| 5.1 EQUITY | |
| 5.2 CASH AND CASH EQUIVALENTS AND BORROWINGS | |
| 5.3 CASH FLOW | |
| 5.4. FINANCIAL RISK AND CAPITAL MANAGEMENT | |
| 5.5. FINANCIAL DERIVATIVES AT FAIR VALUE | |
| SECTION 6: OTHER DISCLOSURES | |
| 6.1 DEFERRED INCOME | |
| 6.2 PENSION PLAN DEFICIT | |
| 6.3 PROVISIONS | |
| 6.4 OTHER LONG-TERM PAYABLES | |
| 6.5 CONTINGENT LIABILITIES, CONTINGENT ASSETS AND COMMITMENTS | |
| 6.6 SHARE-BASED REMUNERATION SCHEMES | |
| 6.7 REMUNERATION OF THE BOARD OF DIRECTORS ANS SENIOR MANAGEMENT | |
| 6.8 RELATED-PARTY TRANSACTIONS | |
| 6.9 AUDIT FEES | |
| 6.10 RESTRICTED NET ASSETS | |
| 6.11 EVENTS AFTER THE REPORTING DATE | |
| 6.12 PARENT COMPANY INFORMATION | |
| 6.11 APPENDICES | |
| Appendix I. Subsidiaries (fully-consolidated companies) (million euro) | |
| Appendix I. Associate companies (equity-accounted companies) (million euro) | |
| |
REPORT OF INDEPENDENT REGISTERED PUBLIC ACCOUNTING FIRM
To the Shareholders and Board of Directors of Ferrovial SE (formerly, Ferrovial, S.A.)
Opinion on the Financial Statements
We have audited the accompanying consolidated statements of financial position of Ferrovial SE (the Company) as of December 31, 2024 and 2023, the related consolidated income statements, consolidated statements of comprehensive income, changes in equity, and cash flows for each of the three years in the period ended December 31, 2024, and the related notes (collectively referred to as the “consolidated financial statements”). In our opinion, the consolidated financial statements present fairly, in all material respects, the financial position of the Company at December 31, 2024 and 2023, and the results of its operations and its cash flows for each of the three years in the period ended December 31, 2024, in conformity with International Financial Reporting Standards as issued by the International Accounting Standards Board (IFRS).
Basis for Opinion
These financial statements are the responsibility of the Company’s management. Our responsibility is to express an opinion on the Company’s financial statements based on our audit. We are a public accounting firm registered with the Public Company Accounting Oversight Board (United States) (PCAOB) and are required to be independent with respect to the Company in accordance with the U.S. federal securities laws and the applicable rules and regulations of the Securities and Exchange Commission and the PCAOB.
We conducted our audits in accordance with the standards of the PCAOB. Those standards require that we plan and perform the audit to obtain reasonable assurance about whether the financial statements are free of material misstatement, whether due to error or fraud. The Company is not required to have, nor were we engaged to perform, an audit of its internal control over financial reporting. As part of our audits we are required to obtain an understanding of internal control over financial reporting but not for the purpose of expressing an opinion on the effectiveness of the Company's internal control over financial reporting. Accordingly, we express no such opinion.
Our audits included performing procedures to assess the risks of material misstatement of the financial statements, whether due to error or fraud, and performing procedures that respond to those risks. Such procedures included examining, on a test basis, evidence regarding the amounts and disclosures in the financial statements. Our audits also included evaluating the accounting principles used and significant estimates made by management, as well as evaluating the overall presentation of the financial statements. We believe that our audits provide a reasonable basis for our opinion.
Critical Audit Matters
The critical audit matters communicated below are matters arising from the current period audit of the financial statements that were communicated or required to be communicated to the audit committee and that: (1) relate to accounts or disclosures that are material to the financial statements and (2) involved our especially challenging, subjective, or complex judgments. The communication of critical audit matters does not alter in any way our opinion on the consolidated financial statements, taken as a whole, and we are not, by communicating the critical audit matters below, providing separate opinions on the critical audit matters or on the accounts or disclosures to which they relate.
| | | | | |
| Recognition of revenue from long-term construction contracts |
|
| Description of the Matter | As more fully described in notes 1.3.3.4, 1.3.4, and 4.4 to the consolidated financial statements, the Company enters into long-term construction contracts with customers where revenue is recognized over time in accordance with either the output or input method. For the fiscal year ended December 31, 2024, the Company recognized revenue from long-term construction contracts for EUR 7,091 million. Revenue recognition for contracts accounted for under the output method requires judgement in measuring the work carried out based on the surveyed performance units completed to date. Contracts accounted for under the input method require estimating the total forecasted cost to complete. For both methods, management estimates, when applicable, the total amount of revenue to be recognized including variable consideration, modifications or claims. To calculate the revenue due to variable consideration, management estimates the amount of incurred costs that will give rise to these additional sources of, or reductions to, revenue. Whether such revenue meets the conditions for variable consideration, modifications or claims. When the estimated costs to complete the project exceed the transaction price, the Company recognizes a provision for the indicated loss. Auditing management’s measurement of revenue recognized over time on long-term construction contracts is especially challenging because it involves subjective management assumptions regarding the judgements in measuring the work carried out based on the surveyed performance units completed to date, the estimated total costs forecast to complete the work that could span several years and the amount of incurred costs that would give rise to additional sources of revenue. These assumptions could be impacted by future market and economic conditions. |
| |
| How We Addressed the Matter in Our Audit | We obtained an understanding of the policies and procedures that the Company applies in recognizing revenues from long-term construction contracts using the output or input method, as appropriate, and the underlying assumptions and estimates.
Our audit procedures also included, among others, evaluating the application of the Company’s revenue recognition method in accordance with IFRS 15 `Revenue from Contracts with Customers´, performing analytical procedures and test of details on a sample of contracts to assess the relevant contractual clauses, and comparing the inputs to the Company’s historical data or experience for similar contracts, to assess the reasonableness of management’s assumptions and estimates. We further assessed the reasonableness of management’s judgement on measuring the work carried out based on the surveyed performance units completed to date and the estimations on total forecasted costs to complete the work through meetings with management, as well as comparative analysis of deviations between originally planned costs and actual costs, the deviations' impact on the estimated project margins, and certifications received by the customer, as applicable. We performed a comparative analysis of budgeted versus actual revenues recognized during the year, and look-back analyses to historical actual costs to assess management’s ability to estimate. For variable consideration, we assessed the estimated amount of incurred costs that will give rise to additional sources of revenue by comparing actual construction progress to contractual completion dates and milestones, and evaluated if these are reasonably met to recognize the revenue. For contract modifications, we assessed the evidence of the underlying technical report approvals and the status of the negotiation with the customers. For the amounts recognised in claims, we assessed the reasonableness of management’s judgement in recognizing such items as revenues by inspecting supporting technical reports and legal confirmations. |
| |
| Recoverability of investments in infrastructure projects (Intangible asset model) operated under concession arrangements and related goodwill |
| | | | | |
|
| Description of the Matter | As more fully described in note 1.3.3.2, 1.3.4, 3.1 and 3.3 to the consolidated financial statements, concession arrangements that fall in scope of IFRIC 12, for which the consideration received consists of the right to charge fees based on the degree of use of the public service are classified as fixed assets in infrastructure projects (Intangible asset model). Upon acquisition of the infrastructure investment, the Company recognizes goodwill for consideration paid in excess of the fair value of the net assets acquired. At December 31, 2024, the Company recorded EUR 6,782 million of fixed assets in infrastructure projects (Intangible asset model) and EUR 303 million of goodwill for I-66 toll road project and Dalaman airport project. Management assesses, at least at each reporting date, whether there is an indication that the investment in infrastructure projects may be impaired. In addition, related goodwill is tested for impairment at least annually. The related impairment tests are based on a discounted cash flow model, which involves management assumptions related to future traffic volumes, prices applied to customers, future operating expenses and the discount rate. Auditing management’s estimates of recoverability investments in infrastructure projects operated under concession arrangements and related goodwill for I-66 and Dalaman is complex due to significance of the amounts involved, and required subjective auditor’s judgement due to the significant management’s judgement required in estimating the future traffic volumes, prices applied to customers, future operating expenses and discount rate management assumptions. Changes in the assumptions used could materially affect the recoverability of such assets. |
| |
| How We Addressed the Matter in Our Audit | We obtained an understanding of the policies and procedures related to the recoverability of investments in infrastructure projects and related goodwill and evaluated the application of the Company’s accounting policies related to estimations for recoverability of assets in accordance with IAS 36 `Impairment of assets´ and IAS 38 `Intangible assets´. The procedures designed to address the matter in our audit included, among others, understanding the terms and conditions of concession arrangements. We assessed the arithmetical accuracy of the discounted cash flow models. We assessed the reasonableness of the future traffic volumes, prices applied to customers, future operating expenses by comparing those assumptions to recent historical performance, current economic and industry trends, and financial forecasts. We further evaluated the consistency of the future traffic volumes, prices applied to customers and future operating expenses by comparing past forecasts to subsequent actual activity. We involved a specialist to assist in evaluating the discount rate by developing a range of discount rates, which we compared to those used by the Company. |
/s/ Ernst & Young, S.L.
We have served as the Company’s auditor since 2020.
Madrid, Spain
February 27, 2025
FERROVIAL SE CONSOLIDATED STATEMENTS OF FINANCIAL POSITION AS OF DECEMBER 31, 2024 AND 2023
| | | | | | | | | | | |
| (Million euro) | Note | 2024 | 2023 |
| Non-current assets | | 21,327 | 19,328 |
| Goodwill | 3.1 | 500 | 475 |
| Intangible assets | 3.2 | 128 | 122 |
| Fixed assets in infrastructure projects | 3.3 | 14,147 | 13,495 |
| Intangible asset model | | 13,989 | 13,333 |
| Financial asset model | | 158 | 162 |
| | | |
| Property, plant and equipment | 3.4 | 772 | 594 |
| Right of use assets | 3.7 | 238 | 196 |
| Investments in associates | 3.5 | 3,023 | 2,038 |
| Non-current financial assets | 3.6 | 1,139 | 1,148 |
| Loans granted to associates | | 101 | 262 |
| Non-current restricted cash | 5.2 | 401 | 628 |
| Other non-current financial assets | 5.2 | 637 | 258 |
| Deferred tax assets | 2.7 | 1,159 | 1,006 |
| Long-term financial derivatives at fair value | 5.5 | 221 | 254 |
| Current assets | | 7,672 | 6,990 |
| Inventories | 4.1 | 492 | 458 |
| Current income tax assets | | 48 | 35 |
| Short-term trade and other receivables | 4.2 | 2,228 | 1,677 |
| Trade receivables for sales and services | | 1,625 | 1,353 |
| Other short-term receivables | | 603 | 324 |
| Other short-term financial assets | | - | - |
| Cash and cash equivalents | 5.2 | 4,828 | 4,789 |
| Infrastructure project companies | | 175 | 204 |
| Restricted cash | | 18 | 31 |
| Other cash and cash equivalents | | 157 | 173 |
| Ex-infrastructure project companies | | 4,653 | 4,585 |
| Short-term financial derivatives at fair value | 5.5 | 20 | 31 |
| Assets held for sale | 1.1.5 | 56 | - |
| TOTAL ASSETS | | 28,999 | 26,318 |
| | | | | | | | | | | |
| (Million euro) | Note | 2024 | 2023 |
| Equity | 5.1 | 8,120 | 5,879 |
| Equity attributable to shareholders | | 6,075 | 3,766 |
| Equity attributable to non-controlling interests | | 2,045 | 2,113 |
| Non-current liabilities | | 14,578 | 14,664 |
| Deferred income | 6.1 | 1,375 | 1,334 |
| Employee benefit plans | 6.2 | 4 | 3 |
| Long-term provisions | 6.3 | 353 | 268 |
| Long term lease liabilities | 3.7 | 165 | 141 |
| Borrowings | 5.2 | 10,092 | 10,423 |
| Debentures and borrowings of infrastructure project companies | | 8,256 | 7,852 |
| Debentures and borrowings of ex-infrastructure project companies | | 1,836 | 2,571 |
| Other payables | 6.4 | 1,279 | 1,310 |
| Deferred taxes | 2.7 | 1,239 | 1,086 |
| Long-term financial derivatives at fair value | 5.5 | 71 | 99 |
| Current liabilities | | 6,301 | 5,775 |
| Short-term lease liabilities | 3.7 | 80 | 59 |
| Borrowings | 5.2 | 1,196 | 942 |
| Debentures and borrowings of infrastructure project companies | | 143 | 63 |
| Debentures and borrowings of ex-infrastructure project companies | | 1,053 | 879 |
| Financial derivatives at fair value | 5.5 | 61 | 34 |
| Current income tax liabilities | | 80 | 83 |
| Short-term trade and other payables | 4.3 | 3,902 | 3,646 |
| Trade payables | | 1,781 | 1,698 |
| Advance payments from customers and work certified in advance | | 1,619 | 1,529 |
| Other short-term payables | | 502 | 419 |
| Short-term provisions | 6.3 | 958 | 1,011 |
| Liabilities held for sale | 1.1.5 | 24 | - |
| TOTAL LIABILITIES AND EQUITY | | 28,999 | 26,318 |
The accompanying notes are an integral part of the consolidated statement of financial position as of December 31, 2024, and 2023.
FERROVIAL SE CONSOLIDATED INCOME STATEMENTS FOR THE YEARS ENDED DECEMBER 31, 2024, 2023 AND 2022
| | | | | | | | | | | | | | | | | | | | | | | |
| Income statement (Million euro) | Note | | | | 2024 | | | 2023 | | | 2022 |
| Revenue | | | | | 9,147 | | | 8,514 | | | 7,551 |
| Other operating income | | | | | 1 | | | 1 | | | 2 |
| Revenues and other operating income | 2.1 | | | | 9,148 | | | 8,515 | | | 7,553 |
| Materials consumed | | | | | 1,115 | | | 1,047 | | | 1,197 |
| Other operating expenses | 2.2 | | | | 4,931 | | | 4,878 | | | 4,182 |
| Personnel expenses | 2.3 | | | | 1,760 | | | 1,599 | | | 1,446 |
| Total operating expenses | | | | | 7,806 | | | 7,524 | | | 6,825 |
| | | | | | | | | | | |
| | | | | | | | | | | |
| Fixed asset depreciation | | | | | 441 | | | 401 | | | 299 |
| | | | | | | | | | | |
| | | | | | | | | | | |
| Impairment and disposal of fixed assets | 2.4 | | | | 2,208 | | | 35 | | | (6) |
| Operating profit/(loss) | | | | | 3,109 | | | 625 | | | 423 |
| | | | | | | | | | | |
| | | | | | | | | | | |
| Net financial income/(expense) from financing | | | | | (339) | | | (328) | | | (243) |
| Profit/(loss) on derivatives and other net financial income/(expense) | | | | | (72) | | | (44) | | | (122) |
| Net financial income/(expense) from infrastructure projects | | | | | (411) | | | (372) | | | (365) |
| | | | | | | | | | | |
| | | | | | | | | | | |
| Net financial income/(expense) from financing | | | | | 74 | | | 111 | | | 1 |
| Profit/(loss) on derivatives and other net financial income/(expense) | | | | | 611 | | | 31 | | | 47 |
| Net financial income/(expense) from ex-infrastructure projects | | | | | 685 | | | 142 | | | 48 |
| Net financial income/(expense) | 2.5 | | | | 274 | | | (230) | | | (317) |
| Share of profits of equity-accounted companies | 2.6 | | | | 238 | | | 215 | | | 165 |
| Profit/(loss) before tax from continuing operations | | | | | 3,621 | | | 610 | | | 271 |
| Income/(expense) tax | 2.7 | | | | (145) | | | (115) | | | (30) |
| Profit/(loss) net of tax from continuing operations | | | | | 3,476 | | | 495 | | | 241 |
| Profit/(loss) net of tax from discontinued operations | 2.8 | | | | 14 | | | 16 | | | 64 |
| Net profit/(loss) | | | | | 3,490 | | | 511 | | | 305 |
| Net profit/(loss) for the year attributed to non-controlling interests | 2.9 | | | | (251) | | | (170) | | | (117) |
| Net profit/(loss) for the year attributed to the parent company | | | | | 3,239 | | | 341 | | | 188 |
| | | | | | | | | | | |
| Net earnings per share attributed to the parent company (in euros) | 2.10 | Diluted | | | 4.47 | | | 0.46 | | | 0.25 |
| Basic | | | 4.47 | | | 0.46 | | | 0.25 |
| Net earnings per share attributed to the parent company´s Continuing Operations (in euros) | Diluted | | | 4.45 | | | 0.44 | | | 0.16 |
| Basic | | | 4.45 | | | 0.44 | | | 0.16 |
The accompanying notes are an integral part of the consolidated income statement for the years 2024, 2023 and 2022.
FERROVIAL SE CONSOLIDATED STATEMENTS OF COMPREHENSIVE INCOME FOR THE YEARS ENDED DECEMBER 31, 2024, 2023 AND 2022
| | | | | | | | | | | | | | |
| (Million euro) | Note | 2024 | 2023 | 2022 |
| a) Net profit/(loss) | | 3,490 | 511 | 305 |
| Attributed to parent company | | 3,239 | 341 | 188 |
| Attributed to non-controlling interests | | 251 | 170 | 117 |
| b) Income and expense recognized directly in equity | 5.1 | 268 | (119) | 456 |
| Fully-consolidated companies | | 189 | (98) | 333 |
| Impact on hedge reserves | 5.5 | 104 | 20 | 193 |
| Impact on defined benefit plan reserves | | - | - | - |
| Currency translation differences | | 82 | (92) | 160 |
| Tax effect | | 3 | (26) | (20) |
| Companies held for sale | | (1) | (5) | (8) |
| Impact on hedge reserves | | - | (6) | - |
| Impact on defined benefit plan reserves | | - | - | - |
| Currency translation differences | | (1) | - | (8) |
| Tax effect | | - | 1 | - |
| Equity-accounted companies | | 80 | (16) | 131 |
| Impact on hedge reserves | | 27 | 12 | 236 |
| Impact on defined benefit plan reserves | | - | - | - |
| Currency translation differences | | 58 | (33) | (29) |
| Tax effect | | (5) | 5 | (76) |
| c) Transfers to income statement | 5.1 | (15) | 8 | 131 |
| Fully-consolidated companies | | 7 | (3) | (47) |
| Transfers to income statement | 5.5 | 9 | (4) | (62) |
| Tax effect | | (2) | 1 | 15 |
| Companies held for sale | | (24) | 11 | 178 |
| Transfers to income statement | | (65) | 13 | 179 |
| Tax effect | | 41 | (2) | (1) |
| Equity-accounted companies | | 2 | - | - |
| Transfers to income statement | | 1 | - | - |
| Tax effect | | 1 | - | - |
| a)+ b)+ c) TOTAL COMPREHENSIVE INCOME | | 3,743 | 400 | 892 |
| Attributed to the parent company | | 3,382 | 269 | 710 |
| Attributed to non-controlling interests | | 361 | 131 | 182 |
The accompanying notes are an integral part of the consolidated statements of comprehensive income for the years 2024, 2023 and 2022.
FERROVIAL SE CONSOLIDATED STATEMENTS OF CHANGES IN EQUITY FOR THE YEARS ENDED DECEMBER 31, 2024, 2023 AND 2022
| | | | | | | | | | | | | | | | | | | | | | | | | | | | | | |
| Share capital | Share/Merger premium | Reserves related to Treasury shares | Other equity instruments | Measurement adjustments reserves | Retained earnings and other reserves | | Attributed to shareholders | Attributed to non-controlling interest | Total Equity |
| (Million Euro) |
| Balance at 12.31.21 | 147 | 218 | (124) | 507 | (1,299) | 4,707 | | 4,156 | 1,790 | 5,946 |
| | | | | | | | | | |
| | | | | | | | | | |
| Consolidated profit/(loss) for the year 2022 | - | - | - | - | - | 188 | | 188 | 117 | 305 |
| Income and expense recognized directly in equity | - | - | - | - | 391 | - | | 391 | 65 | 456 |
| Transfers to income statement | - | - | - | - | 131 | - | | 131 | - | 131 |
| Total income and expenses recognized for the year | - | - | - | - | 522 | 188 | | 710 | 182 | 892 |
| Cash dividend | 3 | - | - | - | - | (135) | | (132) | - | (132) |
| Other dividends | - | - | - | - | - | - | | - | (160) | (160) |
| Treasury shares purchases | (5) | (218) | 98 | - | - | (321) | | (446) | - | (446) |
| Shareholder distributions | (2) | (218) | 98 | - | - | (456) | | (578) | (160) | (738) |
| Share capital increases/reductions | - | - | - | - | - | - | | - | 356 | 356 |
| Share-based remuneration schemes | - | - | - | - | - | - | | - | - | - |
| Other treasury shares repurchase | - | - | - | - | - | - | | - | - | - |
| Other movements | - | - | - | - | - | 41 | | 41 | 5 | 46 |
| Other transactions | - | - | - | - | - | 41 | | 41 | 361 | 402 |
| Perpetual subordinated bond issuances (Note 5.1.1) | - | - | - | 1 | - | (9) | | (8) | - | (8) |
| Scope changes | - | - | - | - | - | (88) | | (88) | 67 | (21) |
| Balance at 12.31.2022 | 145 | - | (26) | 508 | (777) | 4,383 | | 4,233 | 2,240 | 6,473 |
| | | | | | | | | | | | | | | | | | | | | | | | | | | | | | |
| Merger impact (June 16th) | (138) | 4,426 | - | - | - | (4,288) | | - | - | - |
| | | | | | | | | | |
| Consolidated profit/(loss) for the year 2023 | - | - | - | - | - | 341 | | 341 | 170 | 511 |
| Income and expense recognized directly in equity | - | - | - | - | (80) | - | | (80) | (39) | (119) |
| Transfers to income statement | - | - | - | - | 8 | - | | 8 | - | 8 |
| Total income and expenses recognized for the year | - | - | - | - | (72) | 341 | | 269 | 131 | 400 |
| Cash dividend | - | (58) | - | - | - | (78) | | (136) | - | (136) |
| Other dividends | - | - | - | - | - | - | | - | (379) | (379) |
| Treasury shares purchases | - | (52) | (52) | - | - | (10) | | (114) | - | (114) |
| Shareholder distributions | - | (110) | (52) | - | - | (88) | | (250) | (379) | (629) |
| Share capital increases/reductions | - | - | - | - | - | - | | - | 117 | 117 |
| Share-based remuneration schemes | - | - | - | - | - | 12 | | 12 | - | 12 |
| Other treasury shares repurchase | - | - | - | - | - | - | | - | - | - |
| Other movements | - | - | - | - | - | 15 | | 15 | 2 | 17 |
| Other transactions | - | - | - | - | - | 27 | | 27 | 119 | 146 |
| Perpetual subordinated bond issuances (Note 5.1.1) | - | - | - | (508) | - | (5) | | (513) | - | (513) |
| Scope changes | - | - | - | - | - | - | | - | 2 | 2 |
| Balance at 12.31.2023 | 7 | 4,316 | (78) | - | (849) | 370 | | 3,766 | 2,113 | 5,879 |
| | | | | | | | | | | | | | | | | | | | | | | | | | | | | | |
| | | | | | | | | | |
| | | | | | | | | | |
| Consolidated profit/(loss) for the year 2024 | - | - | - | - | - | 3,239 | | 3,239 | 251 | 3,490 |
| Income and expense recognized directly in equity | - | - | - | - | 158 | - | | 158 | 110 | 268 |
| Transfers to income statement | - | - | - | - | (15) | - | | (15) | - | (15) |
| Total income and expenses recognized for the year | - | - | - | - | 143 | 3,239 | | 3,382 | 361 | 3,743 |
| Cash dividend | - | - | - | - | - | (130) | | (130) | - | (130) |
| Other dividends | - | - | - | - | - | - | | - | (446) | (446) |
| Treasury shares purchases | - | - | - | - | - | (701) | | (701) | - | (701) |
| Shareholder distributions | - | - | - | - | - | (831) | | (831) | (446) | (1,277) |
| Share capital increases/reductions | - | - | - | - | - | - | | - | 22 | 22 |
| Share-based remuneration schemes | - | - | - | - | - | 13 | | 13 | - | 13 |
| Other treasury shares repurchase | - | - | - | - | - | (272) | | (272) | - | (272) |
| Other movements | - | - | - | - | - | 17 | | 17 | (5) | 12 |
| Other transactions | - | - | - | - | - | (242) | | (242) | 17 | (225) |
| | | | | | | | | | |
| Scope changes | - | - | - | - | - | - | | - | - | - |
| Balance at 12.31.2024 | 7 | 4,316 | (78) | - | (706) | 2,536 | | 6,075 | 2,045 | 8,120 |
The accompanying notes are an integral part of the consolidated statements of changes in equity for the years 2024, 2023 and 2022.
FERROVIAL SE CONSOLIDATED CASH FLOW STATEMENTS FOR THE YEARS ENDED DECEMBER 31, 2024, 2023 AND 2022
| | | | | | | | | | | | | | |
| (Million euro) | Note | 2024 | 2023 | 2022 |
| Net profit/(loss) attributable to parent company | | 3,239 | 341 | 188 |
| Adjustments to profit/(loss) | | (1,897) | 650 | 695 |
| Net profit/(loss) for the year attributed to non-controlling interests | | 251 | 170 | 117 |
| Profit (loss) net of tax from discontinued operations | | (14) | (16) | (64) |
| Income tax / (expense) | | 145 | 115 | 30 |
| Share of profits of equity-accounted companies | | (238) | (215) | (165) |
| Net financial income/(expense) | | (274) | 230 | 317 |
| Impairment and disposal of fixed assets | 2.4 | (2,208) | (35) | 6 |
| Fixed asset depreciation | | 441 | 401 | 299 |
| Operating profit/(loss) discontinued operations ex - depreciation/amortization & impairment | 2.8 | - | - | 155 |
| | | | |
| Tax payments | | (192) | (170) | (82) |
| Change in working capital (receivables, payables and other) | 4.0 | (220) | 118 | (83) |
| Dividends received from infrastructure project companies | 3.5 | 363 | 324 | 284 |
| Cash flows from operating activities | | 1,293 | 1,263 | 1,002 |
| Investments in property, plant and equipment/intangible assets | 3.4 | (226) | (86) | (95) |
| Investments in infrastructure projects | 3.3 | (186) | (319) | (809) |
| Non-refundable grants | | - | 9 | 25 |
| Investments in associates and non-current financial assets/ acquisition of companies | 3.5 | (1,286) | (257) | (347) |
| Interest received | 2.5 | 172 | 236 | 47 |
| Investment of long-term restricted cash | | 257 | (51) | 18 |
| | | | |
| Divestment/sale of companies | 1.1.5 | 2,582 | 43 | 429 |
| Cash flows from (used in) investing activities | | 1,313 | (425) | (732) |
| | | | |
| Capital cash flows from non-controlling interests | | 23 | 130 | 350 |
| Cash dividend | | (130) | (136) | (132) |
| Treasury share purchases | | (701) | (114) | (446) |
| Shareholder distributions | 5.1 | (831) | (250) | (578) |
| Dividends paid to non-controlling interests of investees | 5.1 | (444) | (377) | (161) |
| Other treasury shares repurchase | 5.1 | (272) | - | - |
| Other movements in shareholders' funds | | 8 | (506) | (69) |
| | | | |
| Interest paid | 2.5 | (464) | (432) | (329) |
| Lease payments | 3.7 | (104) | (87) | (72) |
| Increase in borrowings | | 150 | 964 | 1,207 |
| Decrease in borrowings | | (657) | (747) | (665) |
| Net change in borrowings from discontinued operations | | - | - | 1 |
| Cash flows from (used in) financing activities | | (2,591) | (1,305) | (316) |
| Effect of exchange rate on cash and cash equivalents | | 59 | 160 | (283) |
| Change in cash and cash equivalents due to consolidation scope changes | | (35) | (34) | 4 |
| Changes in cash and cash equivalents from discontinued operations | 5.3 | - | - | (81) |
| Change in cash and cash equivalents | 5.3 | 39 | (341) | (406) |
| Cash and cash equivalents at beginning of year | | 4,789 | 5,130 | 5,536 |
| Cash and cash equivalents at year-end | | 4,828 | 4,789 | 5,130 |
The accompanying notes are an integral part of the consolidated cash flow statements for the years 2024, 2023 and 2022.
CONSOLIDATED FINANCIAL STATEMENTS
FERROVIAL SE AND SUBSIDIARIES
NOTES TO THE CONSOLIDATED FINANCIAL STATEMENTS
FOR THE YEARS ENDED DECEMBER 31 2024, 2023 AND 2022
SECTION 1: BASIS OF PRESENTATION AND CONSOLIDATION SCOPE
The information deemed necessary before reading Ferrovial SE consolidated financial statements is set out in this section.
BASIS OF PRESENTATION
Basis of presentation
The consolidated financial statements of Ferrovial SE and its subsidiaries and investees (hereinafter referred to as “Ferrovial”, the "Ferrovial Group", the "Group" or "FSE Group") have been prepared in accordance with the International Financial Reporting Standards (hereinafter, "IFRS") as issued by the International Accounting Standards Board (“IASB”). Accounting policies applied are explained in Note 1.3.
Group reorganization
As described in Ferrovial SE 2023 consolidated financial statements, on February 28, 2023, Ferrovial’s Board of Directors approved the common terms of the cross-border merger of Ferrovial, S.A., the Spanish listed company and ultimate parent company of the Ferrovial Group, into its wholly-owned Dutch subsidiary Ferrovial International SE, which was finally completed on June 16, 2023. As a result of this transaction, the new parent company of the Ferrovial Group was Ferrovial SE (or "FSE"), a European public limited company ("Societas Europaea") domiciled in the Netherlands and currently listed in United States, Spain and The Netherlands. All the information included in the different reporting periods corresponds with the historical consolidated information of Ferrovial group, without any adjustments in the value of assets and liabilities, as the combined entity is considered a continuation of the former parent company Ferrovial, S.A. (Note 1.1.2).
This type of reorganization was not considered a business combination under IFRS 3 and is not specifically covered under IFRS. Therefore, pooling of interest or predecessor accounting was applied. This was the approach adopted because the combined entity was considered a continuation of the Group headed by Ferrovial S.A., and it had only changed the location of its resources within the Group. Moreover, this approach provides useful information about the combined company and allows for users of financial information to understand the performance of the underlying business (Note 1.1.2).
The Group’s activities
The four business lines, which constitute its reporting segments under IFRS 8, are the following: Construction, Toll Roads, Airports and Energy.
For the purpose of understanding these consolidated financial statements, it should be noted that part of the activity carried out by the Group’s business divisions consists of the development of infrastructure projects, primarily in the toll roads and airports business lines, but also in the construction and energy activities. In order to aid understanding of the Group’s financial performance, these consolidated financial statements disclose separately the impact of projects of this nature in different lines of the financial statements (see Note 1.1.4).
It should also be noted that the Group has relevant equity-accounted participations, mostly related to infrastructures assets (see note 1.1.4).
Main divestment and investment transactions in 2024
On December 12, 2024, following satisfaction of applicable regulatory conditions, Ferrovial has completed the sale of 19.75% of the share capital of FGP Topco, which is the direct shareholder of Heathrow Airports Holdings Limited (HAH), the owner of Heathrow Airport in London (UK), to Ardian and The Public Investment Fund (PIF), with a capital gain of EUR 2,023 million. As a result, Ferrovial now holds shares representing 5.25%, recognized as a financial asset at fair value through the income statement (see note 1.1.5) generating an additional positive impact of EUR 547 million.
Additionally, on June 13, Ferrovial acquired 23.99% direct ownership interest in IRB Infrastructure Trust (Private InvIT), a subsidiary of IRB Infrastructure Developers Limited (Note 1.1.5), which manages a portfolio of 15 toll road concessions in India.
Going concern evaluation
Note 1.2 analyses the Group´s capacity to continue operating under the going concern principle, analyzing liquidity, future cash requirements as well as other external factors that could compromise this principle, concluding that no material uncertainties exist about the group´s ability to continue on a going concern basis.
Judgements and estimates
Ferrovial's main estimates when measuring its assets, liabilities, revenues, expenses and commitments are detailed in Note 1.3.4.
Foreign exchange effect
While euro is Ferrovial’s functional currency, most of its activities are carried out in countries outside the eurozone. Note 1.4 analyses the impact on the consolidated financial statements of changes in the main currencies where the Group operated in 2024, 2023 and 2022.
SECTION 1: BASIS OF PRESENTATION AND CONSOLIDATION SCOPE
1.1 BASIS OF PRESENTATION, THE COMPANY’S ACTIVITIES AND CONSOLIDATION SCOPE
1.1.1 Basis of presentation
These Ferrovial SE consolidated financial statements have been approved by the Board of Directors on February 27, 2025, and have been prepared in accordance with the International Financial Reporting Standards (“IFRS”) as issued by the International Accounting Standards Board (“IASB”). There are no effects on these consolidated financial statements resulting from differences between IFRS as issued by the IASB and IFRS as endorsed by the European Union.
The consolidated financial statements include the consolidated statement of financial position, consolidated income statement, consolidated statement of comprehensive income, consolidated statement of changes in equity, consolidated statement of cash flow and the accompanying notes (referred to collectively as the “Consolidated Financial Statements”).
For presentation of the consolidated income statement, the Group uses a classification method based on the nature of expenses, as it is more representative of the format used by management for internal reporting purposes and aid to provide reliable information to investors.
The Group’s presentation currency is the Euro, which is also the functional currency of the parent company, and unless otherwise stated amounts are presented in millions of euros.
1.1.2 Business reorganization
As described in Ferrovial SE 2023 consolidated financial statements, on February 28, 2023, Ferrovial’s Board of Directors approved the common terms of the cross-border merger of Ferrovial, S.A., the Spanish listed company and ultimate parent company of the Ferrovial Group, into its wholly-owned Dutch subsidiary Ferrovial International SE, which was finally completed on June 16, 2023. As a result of this transaction, the new parent company of the Ferrovial Group was Ferrovial SE (or "FSE"), a European public limited company ("Societas Europaea") domiciled in the Netherlands and currently listed in United States, Spain and The Netherlands.
All the information included in the different reporting periods corresponds with the historical consolidated information of Ferrovial group, without any adjustments in the value of assets and liabilities, as the combined entity is considered a continuation of the former parent company Ferrovial, S.A. The only accounting impact as a consequence of the merger was the modification of the share capital and share premium figures of the new legal parent entity. Considering this change is a reclassification among the legal share capital and share premium of the former parent entity, any difference is being included as a movement within equity reserves in 2023, the year that the merger formally took place.
1.1.3 The Group’s activities
Ferrovial Group comprises The Netherlands parent company, Ferrovial SE, and its subsidiaries and investees (hereinafter referred to as “Ferrovial”, the "Ferrovial Group", the "Group" or "FSE Group"). Its registered office is at Gustav Mahlerplein 61-63, 1082 MS, Amsterdam, The Netherlands.
Through these companies, Ferrovial is engaged in the following four business lines, which constitute its reporting segments under IFRS 8:
•Construction: Design and execution of all manner of public and private works, including most notably the construction of public infrastructures.
•Toll Roads: Development, financing and operation of toll roads.
•Airports: Development, financing and operation of airports.
•Energy: It focuses on innovative solutions for the promotion, construction and operation of energy generation and transmission infrastructures.
In January 2024 in order to boost the energy transition related business and develop new capabilities in this area more quickly and efficiently, Ferrovial approved a partial reorganization of the business divisions pursuant to which the Energy Solutions business line, which was part of the Construction Business Division in 2023, and the energy infrastructures business line, which was part of the Energy Infrastructure and Mobility Business Division in 2023, were merged. From this point onwards, the resulting Business Division is named the Energy Business Division.
See note 1.5 for Segment Activities. Additionally, more detailed description of the various areas of activity in which the consolidated Group conducts business, please consult the Group's website: www.ferrovial.com.
For the purpose of understanding these consolidated financial statements, it should be noted that part of the activity carried out by the Group’s business divisions consists of the development of infrastructure projects, primarily in the toll road and airport business lines, but also in the construction and energy activities.
In order to aid understanding the Group’s financial performance, these consolidated financial statements disclose separately the impact of projects of this nature in “fixed assets in infrastructure projects” within the long-term financial assets headings (distinguishing those to which the intangible asset model is applied from those to which the financial asset model is applied – Note 3.3) and, in particular, in the cash and cash equivalents and borrowing headings (Note 5.2).
Following competitive bidding processes, these projects are conducted through long-term contracts entered into with public authorities (“the grantor”) which grant the right to build or upgrade, operate and maintain the infrastructure. The contract is awarded to a legal entity, the concessionaire entity, whose sole purpose is the performance of the project, in which the Group has an ownership interest.
The concessionaire has to finance the construction or upgrade of the public infrastructure mainly with borrowings guaranteed by the future cash flows coming from the project term; as a result, these projects usually have cash restrictions established in the financing agreements to ensure repayment of borrowings. The shareholders also make capital contributions. Borrowings are generally secured at inception of the service concession arrangement and have no recourse to the shareholder or, in some cases, recourse to the shareholders is limited to the guarantees issued.
SECTION 1: BASIS OF PRESENTATION AND CONSOLIDATION SCOPE
Once construction or upgrade is complete, the concessionaire starts to operate and maintain the infrastructure, and in return, collects tolls or regulated charges for the use of the infrastructure, or amounts paid by the grantor based on the availability for use of the related asset. These inflows allow the initial investment to be recovered. In most cases the construction and subsequent maintenance of the infrastructure is subcontracted by the concession operators to the Group’s Construction Division.
From an accounting standpoint, most of these arrangements are within the scope of IFRIC 12 application. A list of the companies regarded as infrastructure project companies is included in Appendix I.
It should also be noted that Ferrovial Group has relevant participations in equity-accounted companies managing infrastructure assets being the most relevant the following: the 43.23% ownership interest in 407 ETR, the concession operator of the 407 ETR toll road in Toronto (Canada), the 49% indirect shareholding in the company JFK NTO LLC, the concession company of the New Terminal One at the International John F. Kennedy Airport in New York; the 50% stake in AGS, which owns Aberdeen, Glasgow and Southampton airports in UK; the 19.86% ownership interest in IRB Infrastructure Developers Limited, one of India's leading infrastructure companies, listed in Bombay, and the 23.99% ownership interest acquired in IRB Infrastructure Trust (Private InvIT), an associate of IRB Infrastructure Developers Limited (Note 1.2). Details of these companies are included in Note 3.5 on investments in equity-accounted companies. It is also worth mentioning that a 19.75% ownership interest in FGP Topco Limited, which is the direct shareholder of Heathrow Airports Holdings Limited (HAH), the owner of Heathrow Airport in London (UK), has been divested on December 12, and that the remaining 5.25% stake is being recognized as a financial asset at fair value through the income statement (see note 1.1.5).
1.1.4. Assets and liabilities held for sale and discontinued operations
Assets and liabilities held for sale
At December 31, 2024 assets held for sale amount to EUR 56 million and liabilities stand at EUR 24 million, related to energy assets scheduled to be divested within 12 months, and to the 50% stake in AGS Airports Holdings Limited (AGS), the parent company owning the Aberdeen, Glasgow and Southampton Airports.
On November 13, 2024, Ferrovial announced that an agreement had been reached with Avialliance UK Limited for the sale of its entire stake in AGS (50%), and as part of the same transaction, Macquarie also agreed to sell its entire stake (50%) in AGS to the same purchaser. The completion of this transaction was subject to the obtainment of applicable regulatory approvals by the 2024 year-end and therefore the 50% ownership interest in AGS Airports Holdings Limited was reclassified to held for sale as of December 31, 2024. The ownership interest in this company remained valued at zero, due to the fact that losses generated in previous years brought equity attributable to Ferrovial below zero.
As disclosed in Note 3.6. of these consolidated financial statements, the group granted subordinated loans to AGS totaling EUR 235 million, that after the agreement reached in November, have been reclassified from long-term financial assets to short-term receivables at December 2024, as these loans are also part of the divestment transaction.
On January 28, 2025, and following satisfaction of the applicable regulatory conditions, Ferrovial and Macquarie completed the sale of the entire ownership interest in AGS for a price of GBP 900 million, of which circa GBP 450 million are Ferrovial's net proceeds, entailing a capital gain of EUR 297 million for Ferrovial, which will impact Q1 2025 results (see Note 6.11).
There were no assets and liabilities held for sale at December 31, 2023.
The following table provides a breakdown by nature of the assets and liabilities classified as held for sale as of December 2024:
| | | | | |
| (Million euro) | 2024 |
| Intangible assets | 9 |
| Property, plant and equipment | 39 |
| Other non-current assets | 4 |
| Non-current assets | 52 |
| Short-term trade and other receivables | 1 |
| Cash and cash equivalents | 1 |
| Other current assets | 2 |
| Current assets | 4 |
| TOTAL assets classified as held for sale | 56 | |
| |
| Borrowings | 17 |
| Other non-current liabilities | 4 |
| Non-current liabilities | 21 |
| Borrowings | 2 |
| Other current liabilities | 1 |
| Current liabilities | 3 |
| TOTAL liabilities classified as held for sale | 24 | |
Discontinued operations
Discontinued operations fundamentally relate to the Services Division, the divestment of which was completed in 2022, once the Infrastructure Upkeep and Maintenance business in Spain and the United Kingdom (Amey) had been sold.
During 2024 and 2023
Profit from discontinued operations amounted to EUR 14 and EUR 16 million in 2024 and 2023, respectively, and relates mainly to the indemnities and updated earn-outs associated with the disposal of the Services Business in Spain and Portugal, as well as other adjustments related to the Amey business divestment in the United Kingdom (see Note 2.8.).
SECTION 1: BASIS OF PRESENTATION AND CONSOLIDATION SCOPE
Divestments executed during 2022
On January 31, 2022, the sale agreement between Ferrovial and Portobello Capital for the acquisition of the Infrastructure Upkeep and Maintenance business in Spain was completed once all the conditions precedent had been fulfilled. The total price received by Ferrovial reached EUR 175 million.
Following completion of the sale, Ferrovial acquired a stake (24.8%) in the share capital of the acquirer (Grupo Serveo) for EUR 17.5 million, the impact on the income statement being immaterial. As described below in Note 1.1.5, on June 28, 2024, Ferrovial completed the sale of this 24.78% stake in Grupo Serveo, consolidated as an equity-accounted company, to the main shareholder, Portobello Capital, for EUR 55 million, entailing a capital gain before taxes of EUR 33 million, reported in the income statement within the line item “Impairment and disposal of fixed assets” (Note 2.4).
On December 31, 2022, the Amey business in the United Kingdom, relating to full lifecycle engineering and infrastructure upkeep and maintenance services, was sold to a company controlled by funds managed by One Equity Partners, which completed the transaction in association with its shareholder Buckthorn Partners. The net consideration (equity value) received by Ferrovial was GBP 264.6 million (EUR 301.3 million), as per the final agreement reached on April, 17 2023, with no further applicable price adjustments. The net consideration was in the form of cash (GBP 112.8 million (EUR 128.5 million)) and a vendor loan note of GBP 151.8 million (EUR 172.8 million) to the buyer, arranged on the completion date, repayable over the coming five years and accruing 6% annual interest (increasing to 8% after year three). The capital gain generated totaled EUR 58.3 million and was accounted for under Profit/(loss) from discontinued operations in the income statement, which also included the transfer to the income statement of currency translation differences (EUR -155.6 million) and changes in the fair value of derivatives (EUR -15.4 million) accumulated in equity.
Previously, the business activity providing financial management services for PFI (Project Finance Initiative) project companies in the United Kingdom through the subsidiary Amey was sold for GBP 5 million in the first half of 2022, while Amey’s business area engaged in energy and water infrastructure maintenance was also sold (to British fund Rubicon) for a total price of GBP 20.3 million, including a deferred payment of GBP 18 million arranged through a loan to the buyer (Note 3.6.2). The impact on the income statement was immaterial.
1.1.5 Consolidation scope changes and other divestments of investees
There follows a description of the most significant movements in the consolidation scope in 2024, 2023 and 2022.
Airports
During 2024
Heathrow Airport Holdings divestment
Regarding the Heathrow Airport Holdings divestment, as disclosed in the December 31, 2023 Consolidated Financial Statements, on November 28, 2023, Ferrovial entered into a share purchase agreement with Ardian and the Public Investment Fund (PIF), pursuant to which Ferrovial agreed to sell its full stake (25% interest) in FGP Topco Limited.
At the 2023 year-end, the completion of the transaction was subject to the fulfillment of some shareholder tag-along rights and applicable regulatory conditions, and consequently, there was no certainty whether the transaction would be completed.
During 2024, the parties worked towards fulfilling the above-mentioned conditions, which led to a revised offer presented by Ardian and PIF on June 14 to acquire shares representing 37.62% of FGP Topco’s share capital for GBP 3,259 million, of which 19.75% would relate to Ferrovial’s stake, subject to fulfillment of some shareholders’ tag-along rights and applicable regulatory conditions. On July 25, 2024, following the expiry of the period to exercise the tag-along and pre-emption rights, no FGP Topco shareholder exercised either its tag-along or pre-emption rights.
On December 12, 2024, following satisfaction of applicable regulatory conditions, Ferrovial completed the sale of 19.75% of the share capital of FGP Topco Ltd., which is the direct shareholder of Heathrow Airports Holdings Limited (HAH), the owner of Heathrow Airport in London (UK), to Ardian and the Public Investment Fund (PIF), with a capital gain of EUR 2,023 million, reported in the income statement within the line item “Impairment and disposal of fixed assets” (Note 2.4) - the ownership interest in this company was valued at zero, due to the fact that losses generated in previous years brought equity attributable to Ferrovial below zero.
As a result, Ferrovial now holds 5.25% stake, which is recognized as a non-current financial asset at fair value through profit or loss (Note 3.6.), once concluded that according to IAS28 p.5-6, Ferrovial will no longer exercise significant influence in FGP Topco Ltd., despite having the right to nominate a board member together with other shareholders, as the group will have no participation in the policy-making processes of the asset, neither participation in decisions related to dividend distributions. The fair value of the remaining stake has been determined by referencing the selling price of the recently 19.75% stake divested in FGP Topco Ltd., generating an additional positive impact of EUR 547 million.
Finally, on January 26, 2025, Ferrovial announced that a binding agreement has been reached with Ardian for the sale of its entire remaining stake (5.25%) in FGP Topco Ltd. (Topco), parent company of Heathrow Airport Holdings Ltd., for c. GBP 455 million (current book value of the asset), which will be adjusted with an interest rate to be applied until closing (Note 6.11). The transaction is subject to complying with the right of first offer (ROFO) which may be exercised by Topco shareholders pursuant to the Shareholders’ Agreement and the Articles of Association of the company. Full completion of the acquisition under the agreement is also subject to the satisfaction of applicable regulatory conditions.
Vertiports divestment
On December 11, 2024, Ferrovial has completed the sale of its Vertiports business in United States, with a capital gain of EUR 2 million.
SECTION 1: BASIS OF PRESENTATION AND CONSOLIDATION SCOPE
During 2023
There were no changes in the consolidation scope during 2023.
Toll roads
During 2024
Divestment of a 5% stake in IRB Infrastructure Developers
On June 11, Ferrovial, through its subsidiary Cintra, completed the sale of a 5% stake in the Indian company IRB Infrastructure Developers (IRB) for EUR 215 million excluding transaction costs (assuming a EUR/INR exchange rate of 89.3). The sale was carried out by placing 301.9 million shares with institutional investors on the National Stock Exchange (NBE) and the Bombay Stock Exchange (BSE). The shares in IRB were sold at an average price of 63.60 rupees, resulting in a capital gain before taxes of EUR 132 million, reported in the income statement on the line “Impairment and disposal of fixed assets” as disclosed in Note 2.4. Following the transaction, Ferrovial is still the second-largest shareholder, with a 19.86% stake and has the same representatives on the Board of Directors (two out of a total of eight members). Therefore, Ferrovial still exercises significant influence according to IAS 28 and this remaining ownership interest continues to be equity accounted.
Acquisition of 23.99% of IRB Private InvIT
On June 13, Ferrovial, through its subsidiary Cintra, acquired a 23.99% stake in IRB Infrastructure Trust (Private InvIT), a subsidiary of IRB Infrastructure Developers (IRB), in which Ferrovial holds a 19.86% ownership interest as previously mentioned. Private InvIT held a portfolio of 14 toll road concessions in India with a committed pipeline of one additional concession (Ganga Expressway Project "Ganga"). This investment was paid in cash, totaling EUR 652 million (considering an exchange rate of 90.21 EUR/INR).
Ferrovial acquired this stake from affiliates of GIC Private Limited, which prior to this transaction owned a 49% stake in the company. After the transaction, GIC’s affiliates retain a 25% stake in Private InvIT and IRB retains its current 51% stake. Considering the indirect ownership interest which Ferrovial holds through the 19.86% stake in IRB, Ferrovial retains a total stake in Private InvIT of 34.1%.
On December 20, Private InvIT raised unit capital by way of rights issued of Private InvIT units to IRB Infrastructure Developers (IRB) and GIC Affiliates. After the right issuance, Ferrovial acquired 23.99% of these rights issued, increasing its investment in Private InvIT by EUR 58 million (considering an exchange rate of 87.83 EUR/INR), and maintaining its stake in a 23.99%. On December 27, Private InvIT acquired 80.4% of Ganga, the above-mentioned additional concession. Whenever Private InvIT acquires the remaining 19.6% of Ganga, Ferrovial investment in Private InvIT is estimated to increase by EUR 18 million (considering an exchange rate of 89.2 EUR/INR - see Note 6.5).
As required by IFRS 10, the shareholder agreements and the other project contracts were analyzed, and the conclusion was drawn that the qualified majorities and veto rights set out in these agreements for the approval of most of the relevant decisions means that Ferrovial has significant influence over IRB Private InvIT. The 23.99% ownership interest is therefore consolidated through the equity method, as per IAS 28.
Regarding the purchase price allocation exercise, the difference between the net fair value of the identifiable assets and liabilities of Private InvIT and its carrying amount at the date of acquisition (EUR 300 million for Ferrovial’s stake) was fully allocated to the value of the toll concession rights, as the book value of the rest of net assets is not significantly different to their fair value. According to IAS 12, paragraph 66, the deferred tax liability resulting from this fair value adjustment to the intangible asset (EUR 90 million for Ferrovial’s stake) affects the goodwill implicit in the carrying amount of the investment.
In December 2024, the valuation was completed and the fair value of the net assets acquired is considered definitive.
Divestment of several roads and parking concessions
In October 2024, Ferrovial and Interogo Holding, via its infrastructure investment fund Inter Infrastructure Capital (IIC), created the company Umbrella Roads BV to manage Ferrovial’s stakes in several road and parking concessions in Spain, Scotland, Ireland and Canada.
Ferrovial transferred the 100% of the economic rights and still holds the majority of the voting rights (51%) in Umbrella Roads BV through its toll road division Cintra. After the analysis performed by the company of this transaction and the purchase share agreements, it has been concluded that Ferrovial has no control over these assets according to IFRS 10, p. 7 criteria, neither significant influence under IAS 28, which implies the recognition of a capital gain of EUR 19 million (EUR 100 million transaction price), reported in the income statement within the line item “Impairment and disposal of fixed assets” (Note 2.4). The partnership between Ferrovial and Interogo Holding could allow for further collaboration between the parties in future.
The transferred stakes include the M3 Eurolink and M4 Eurolink motorways in Ireland; the M8-M73-M74 motorway in Scotland; the 407 East Extension Phase 1 and 407 East Extension Phase 2 in Canada, and Serrano Park and Autovía de la Plata (A-66) in Spain. The assets operate under availability payment schemes or have limited traffic risk.
Anillo Vial Periférico Project
On April 4, 2024, the Private Investment Promotion Agency of Peru (Proinversión), a specialized technical agency attached to the Peruvian Ministry of Economy and Finance, awarded the Anillo Vial Periférico Project in Lima (Perú) to a consortium led by the toll roads subsidiary Cintra, which owns 35% of the consortium, together with Acciona and Sacyr, which own 32.5% each. The Anillo Vial Periférico Project is a 30-year concession contract that covers the financing, design, construction, operation and maintenance of an approximately 35 kilometers ring road in the metropolitan area of Lima. The project entails an expected investment of approximately USD 3.4 billion (approximately EUR 3.1 billion). This amount consists of the expected equity to be contributed by the consortium currently estimated at approximately USD 0.4-0.6 billion (of which USD 0.14-0.21 billion is expected to be invested by Cintra) as well as contributions from public funds by the Peruvian government and other financing sources.
During 2023
Azores toll road
SECTION 1: BASIS OF PRESENTATION AND CONSOLIDATION SCOPE
Ferrovial, through its Toll Roads subsidiary, reached an agreement in June 2023 to sell 89.2% of the Azores toll road, in Portugal, to the infrastructure funds Horizon and RiverRock. The initial price of the transaction, which is in line with the company’s asset rotation strategy and was completed on December 28, 2023, was EUR 42.6 million (final price of EUR 43.4 million once adjusted for the ticking fees accrued as from the signing of the sale and purchase agreement).
The sale brought EUR 39 million before taxes in capital gains for Ferrovial (reported in the income statement under "Impairment and disposal of fixed assets"). Ferrovial will continue to provide technical services to the concession company for two years, which may be extended by mutual agreement.
Construction
During 2024 and 2023
There were no changes in the consolidation scope during 2024 and 2023.
Energy
During 2024
Ferrovial Energy US. LLC. acquires Misae Solar IV, LLC, a solar SPV project (257MW) in Leon County
On May 1, Ferrovial, through Ferrovial Energy US. LLC, acquired a 100% stake in Misae Solar IV, LLC, a solar SPV project (257MW) in Leon County, Texas, for an acquisition price of USD 14.3 million (EUR 13.8 million). The company will perform the design, construction and operation of the plant.
During 2023
There were no changes in the consolidation scope during 2023.
Other business
During 2024
As commented in Note 1.1.4., on June 28, Ferrovial completed the sale of its 24.78% stake in Grupo Serveo, consolidated as an equity-accounted company, to the main shareholder, Portobello Capital, for EUR 55 million. 15 million of the price was deferred (up to four years after the completion date, not accruing interest). The capital gain before taxes on the disposal is EUR 33 million, reported in the income statement within the line item “Impairment and disposal of fixed assets” (Note 2.4). According to the Spanish Tax law the 95% of the capital gain is not subject to taxes, being the effective tax rate 1.25%.
This 24.78% stake was acquired by Ferrovial in 2022 when the Services Infrastructure business in Spain was sold to Portobello. This transaction culminates Ferrovial’s divestment of the Services business in Spain as part of its strategy to focus on its core business — the development and operation of sustainable infrastructure. As a result of the transaction, Ferrovial is no longer a shareholder of Grupo Serveo and is no longer represented on its Board of Directors.
1.2 GOING CONCERN EVALUATION
On December 31, 2024, our cash and cash equivalents of ex-infrastructure project companies reached EUR 4,653 million. Ferrovial also has additional liquidity lines available in the amount of EUR 538 million related to corporate debt, and EUR 114 million related to other borrowings balances at December 31, 2024. It should also be noted that the Group’s short-term assets and liabilities, including cash and debt, show a positive balance at end-December 31, 2024. Ferrovial believes that this strong cash position should be sufficient to comply with its future obligations, including expected shareholder distributions for an accumulated amount of EUR 2.3 billion during the period 2024-2026. Also worthy of note are the expected dividends from infrastructure assets in the existing portfolio (excluding dividends from Heathrow), amounting to EUR 2.7 billion for 2024-2026.
As in prior financial years, in order to conclude as to the Company’s capacity to continue as a going concern, the Group has analyzed future cash needs, focusing on the financial years 2025 and 2026, also including a pessimistic scenario with a series of stress assumptions regarding the Company's cash flow, most notably:
•Reduction in dividends from infrastructure project companies in 2025 and 2026 ( 50% in the case of toll roads and all dividends in the case of energy).
•Construction business cash flows for 2025 and 2026 projected to fall at around EUR -200 million per annum, explained by worse working capital evolution and lower business profitability.
•Elimination of the asset divestments expected for the period 2025-2026, including the possible divestment of our pending 5.25% stake in Heathrow Airport.
•Contingent capital contributions of around EUR 100 million per annum.
The conclusion drawn from the analysis demonstrates that, although the scenario would entail a deterioration of the Company’s cash position, cash resources would continue to be sufficient to meet commitments. Therefore, based on the available information, no material uncertainties have been identified with respect to events or conditions that could raise significant doubts regarding the Group's capacity to continue operating under the going concern principle for twelve months following the date these financial statements are signed.
SECTION 1: BASIS OF PRESENTATION AND CONSOLIDATION SCOPE
1.3 ACCOUNTING POLICIES
1.3.1. New accounting standards
1.3.1.a) New standards, amendments and interpretations adopted by the IASB and mandatorily applicable for the first time in 2024, 2023 and 2022
At December 31, 2024 none of the standards, interpretations or amendments described in following paragraphs, that are applicable for the first time in the current year, have had a significant impact on the measurement, recognition or presentation of any items in the Group's financial statements.
Amendments to IFRS 16 - Lease Liability in a Sale and Leaseback agreement
The amendments in IFRS 16 specify the requirements that a seller-lessee uses in measuring the lease liability arising in a sale and leaseback transaction, to ensure the seller-lessee does not recognize any amount of the gain or loss that relates to the right of use it retains.
The amendments had no impact on the Group’s financial statements.
Amendments to IAS 1 - Classification of Liabilities as Current or Non-current
The amendments to IAS 1 specify the requirements for classifying liabilities as current or non-current. The amendments clarify:
•What is meant by a right to defer settlement for at least 12 months after the reporting date and that the right may be subject to the company complying with conditions (covenants) specified in a loan arrangement ( meeting covenants within twelve months after the reporting period).
•That a right to defer must exist at the end of the reporting period.
•That classification is unaffected by the likelihood that an entity will exercise its deferral right. of a compound financial instrument.
The amendments have resulted in additional disclosures in Note 5.2.2, and have impacted on the classification of one of the Group’s financial debts by an amount of EUR 84 million, which has been reclassified as current as at 31 December 2024.
Reverse factoring Arrangements - Amendments to IAS 7 and IFRS 7
The amendments to “IAS 7 Statement of Cash Flows” and “IFRS 7 Financial Instruments: Disclosures” clarify the characteristics of reverse factoring arrangements and require additional disclosures of such arrangements to assist users of financial statements in understanding the effects of reverse factoring arrangements on an entity’s liabilities, cash flows and exposure to liquidity risk.
As a result of implementing the amendments, the Group has provided additional disclosures about its reverse factoring arrangement. Please refer to Note 4.3.
1.3.1.b) New standards, amendments and interpretations mandatorily applicable in financial years after December 31, 2024:
The new standards, amendments and interpretations approved by the IASB but not yet mandatorily applicable at December 31, 2024 that might have an effect on the Group are as follows:
| | | | | | | | |
| Standards and amendments | Mandatory application: annual periods beginning on or after |
| Amendment to IAS 21 | Amendment to IAS 21 – The effects of changes in foreign exchange rates: Lack of exchangeability. | 1 January 2025 |
| Amendment to IFRS 9 | Contracts Referencing Nature-dependent Electricity Amendments to IFRS 9
and IFRS 7. Amendments to the Classification and Measurement of Financial Instruments. | 1 January 2026 |
| Amendment to IFRS 7 |
| IFRS 18: Presentation and Disclosure in Financial Statements | It replaces IAS 1 and introduces significant new requirements, particularly for the statement of profit or loss. | 1 January 2027 |
Although the Group is currently analyzing the impact of the above amendments, the preliminary analyses carried out to date do not indicate that first- time adoption will have a material impact on the consolidated financial statements. Nevertheless, the Group anticipates changes in the presentation of financial information resulting from IFRS 18.
1.3.2.Basis of consolidation
In 2024, 2023 and 2022 the reporting dates of the individual financial statements of all the companies included in the consolidation scope were either the same as, or were temporarily brought into line with, that of the parent company. In this regard, in order to calculate the degree of control, joint control or significant influence in each Group company, the consistency of the ownership interest held with the number of votes controlled in each company under their bylaws and shareholder agreements is reviewed.
In the case of business activities with companies in which joint control is identified, the general basis of consolidation is the equity method. In relation to these businesses, besides the situations in which there are two venturers, each with a 50% ownership interest, cases requiring a more in-depth analysis are those relating to infrastructure projects in which Ferrovial has a significant ownership interest (less than or equal to 50%) and has the right to propose the Chief Executive Officer or other executives of the investee, while the other shareholders, mainly infrastructure funds, sit directly on the Board of Directors.
Notable cases in this regard are the ownership interests held in the companies that own the following Toll Road projects (the percentage interest held in each is shown in brackets): 407 ETR (43.23%), Slovakia (35%), Toowoomba (40%) and OSARs (50%), as well as the interest in JFK NTO (49%), which was incorporated into the Airports Division in 2022, as described in point 1.1.4.
Contracts that are undertaken through temporary consortia (JVs) or similar entities that meet IFRS 11 requirements to be classified as “joint operations” are proportionately consolidated.
SECTION 1: BASIS OF PRESENTATION AND CONSOLIDATION SCOPE
It is considered that, in such joint operations, the shareholders have direct control over the assets, liabilities, income and expenses of these entities. In 2024, operations of this nature contributed to the consolidated Group assets, profit/(loss) and revenue totaling EUR 1,057 million, EUR 157 million and EUR 1,581 million, respectively (EUR 1,173 million, EUR 36 million and EUR 1,401 million in 2023; and EUR 428 million to the consolidated Group's assets, EUR 40 million profit/(loss) and EUR 1,242 million revenue in 2022). The following companies stand out as being involved in construction projects:
| | | | | | | | | | | | | | |
| PROJECT | ACTIVITY | COUNTRY | % SHARE | 2024 REVENUE
(EUR M) |
| HS2 Main works | Works on 80 km of the HS2 between Chilterns and Warwickshire, including 15 viaducts, 5 km of green tunnels, 22 km of road diversions, 67 | UK | 15 | % | 332 |
| Sydney Metro West | Metro design and construction on an 11-kilometre stretch of twin railway tunnels between Sydney Olympic Park and The Bays, Australia. | Australia | 50 | % | 233 |
| Ontario Transit Group Constructor GP | Design, build and finance Ontario Line Subway: Construction of a 6.7 km, seven-station rapid transit system. | Canada | 50 | % | 216 |
| Riverlinx | Design, build, financing, operation and maintenance of the Silvertown Tunnel in East London. | UK | 40 | % | 127 |
| Coffs Harbour Bypass | Design and Building contract. It involves 14 km of road, three tunnels and a service road. | Australia | 50 | % | 113 |
| Thames Tideway Tunnel Central Section J.V | Construction of new infrastructure for the London sewerage system | UK | 50 | % | 60 |
| Metro Paris Ligne 3A JV | Metro Paris with 6,7 KM tunnel. The work includes building three stations and eight ancillary infrastructures. | France | 50 | % | 54 |
| Linha Circular, A.C.E. | Ferrovial will build a new circular metro line in Oporto, the Pink Line, which will be 3.1 kilometers long. The work on the Pink Line includes the construction of four new stations, three ventilation shafts and the installation of the track and catenary. | Portugal | 65 | % | 54 |
| | | | |
| TOTAL | | | | 1,187 |
A breakdown of the equity-accounted companies can be found in Note 3.5 and in Appendix I.
Intragroup balances and transactions are eliminated on consolidation. However, the transactions recognized in the income statement in relation to construction works undertaken by the Construction Division for infrastructure project concession operators are not eliminated on consolidation, since it is considered that the Group performs work for the concession awarding entity or regulator in exchange for the right to operate the infrastructure under the terms pre-established by the granting entity or regulator.
The awarding entity or regulator thus controls the asset from inception and grants the above-mentioned right in exchange for the work performed and, therefore, the conclusion may be reached that, at the Group level, the work is performed for third parties. This approach is in line with IFRIC12.
The non-elimination of these transactions had an impact of EUR -14.206 million on the income statement in 2024, after taxes and non-controlling interests (EUR -34.942 million and EUR -60.507 million in 2023 and 2022, respectively).
Finally, as regards to transactions for the purchase or sale of an ownership interest that does not entail a change of control in the company in question, the non-controlling interest is measured at the proportional value of the net identifiable assets of the company acquired or sold. Changes in the parent’s ownership interest in a subsidiary that do not give rise to a loss of control are equity transactions.
1.3.3. Accounting policies applied to each item in the consolidated statement of financial position and consolidated income statement
Set forth below is a breakdown reflecting only those accounting policies applied by the consolidated Group when preparing these consolidated financial statements that include an option permitted by IFRS or, as the case may be, on the basis of the specific nature of the industry in which it operates or of materiality.
1.3.3.1 Intangible assets, property, plant and equipment and investment property
• Following initial recognition, “Intangible assets”, and “Property, plant and equipment” are measured at cost less accumulated depreciation and any impairment losses.
• The straight-line method is used to calculate the depreciation/amortization charge for the assets included under “Intangible assets”, and “Property, plant and equipment”, except in the case of certain machinery in the construction business, which is depreciated using the diminishing balance method.
The consolidated companies depreciate “Property, plant and equipment” over the following useful lives:
| | | | | |
| YEARS OF USEFUL LIFE |
| Buildings and other structures | 10-50 |
| Machinery, installations and tooling | 2-25 |
| Furniture and fittings | 2-15 |
| Vehicles | 3-20 |
| Other fixed assets | 2-20 |
1.3.3.2 Investments in infrastructure projects
This heading includes infrastructure investments made by the project companies within the scope of IFRIC 12 (mainly toll roads), where remuneration consists of an unconditional right to receive cash or other assets, or a right to charge fees for the use of the public infrastructure.
The assets acquired by the concession operator to provide the concession services but which do not form part of the infrastructure (such as vehicles, furniture or computer hardware) are not included under this heading because they do not revert to the concession awarding entity. Assets of this nature are carried under “Property, plant and equipment” and are depreciated over their useful life using a financial method.
SECTION 1: BASIS OF PRESENTATION AND CONSOLIDATION SCOPE
IFRIC 12 Intangible asset model assets
All initial investments relating to the infrastructure that subsequently reverts to the awarding entity, including costs to fulfil the contract and borrowing costs capitalized during construction, are amortized on the basis of the applicable pattern of consumption in each case (generally traffic forecasts in the case of toll roads) over the term of the concession.
Investments contractually agreed at concession inception on a final irrevocable basis that will be made at a later date during the concession term, provided they are not investments made to upgrade the infrastructure, are treated as initial investments. For investments of this kind, an asset and an initial liability are recognized for the present value of the future investment, applying a discount rate equal to the borrowing costs associated with the project to calculate present value. The asset is amortized based on the pattern of consumption over the entire term of the concession and the provision is updated to reflect interest expense until the investment is made.
Where a payment is made to the awarding entity to obtain the right to operate the concession, this amount is also amortized based on the pattern of consumption over the concession term.
A provision is recognized systematically for replacement investments over the period in which the related obligations accrue and must be fully funded by the time the replacement becomes operational. The provision is recognized based on the pattern of consumption over the period in which the obligation accrues using a financial method.
Infrastructure upgrade investments are those that increase the infrastructure’s capacity to generate revenue or reduce its costs. In the case of investments that will be recovered over the concession term, since the upgrade investments increase the capacity of the infrastructure, they are treated as an extension of the right granted and, therefore, they are recognized in the balance sheet when they come into service. They are amortized as from the date on which they come into service based on the difference in the pattern of consumption arising from the increase in capacity.
However, if, on the basis of the terms and conditions of the concession, these investments will not be recovered by the possibility of obtaining increased revenue from the date on which they are made, a provision is recognized for the best estimate of the present value of the cash outflow required to settle the obligations related to the investment that will not be offset by the possibility of obtaining increased revenue from the date on which the investments are made. The balancing entry is an increase in the asset’s acquisition cost.
In the event that only a part of the upgrade is expected to be recovered through an increase in future revenue, the general accounting treatment used for investments that will be recovered over the concession term will be applied. The main assumptions employed in relation to these arrangements relate to traffic and replacement investment estimates, which are updated each year by the technical departments.
Set out below is a breakdown of the main concession agreements in force to which the intangible asset model is applied for both toll roads and airports, highlighting the acquisitions of Dalaman International Airport and the New Terminal One at JFK NTO in 2022 and showing the term, status and consolidation method:
Intangible asset model concessions:
| | | | | | | | | | | | | | | | | |
| CONCESSION OPERATOR | COUNTRY | STATUS | START YEAR (*) | END YEAR | CONSOL. METHOD |
| 407 International Inc. | Canada | Operation | 1999 | 2098 | Equity consolidation |
| NTE Mobility Partners, LLC | USA | Operation | 2014 | 2061 | Full consolidation |
| NTE Mobility Partners Seg 3 LLC | USA | Operation | 2018 | 2061 | Full consolidation |
| LBJ Infr. Group LLC | USA | Operation | 2014 | 2061 | Full consolidation |
| I-66 Mobility Partners LLC | USA | Operation | 2016 | 2066 | Full consolidation |
| I-77 Mobility Partners LLC | USA | Operation | 2019 | 2069 | Full consolidation |
| IRB Infrastructure Developers Limited (**) | India | Operation/Construction | - | - | Equity consolidation |
| IRB Infrastructure Trust Limited (***) | India | Operation/Construction | - | - | Equity consolidation |
| Sociedad Concesionaria Anillo Vial S.A.C (****) | Peru | Construction | 2024 | 2054 | Equity consolidation |
| Autopista Terrassa Manresa, S.A. | Spain | Operation | 1989 | 2036 | Full consolidation |
| Autovía de Aragón, S.A. | Spain | Operation | 2007 | 2026 | Full consolidation |
| Dalaman International Airport | Turkey | Operation | 2022 | 2042 | Full consolidation |
| JFK NTO LLC | USA | Construction | 2022 | 2060 | Equity consolidation |
(*) First year of the concession (if in service) or year construction began (if it is in the construction phase).
(**) IRB Infrastructure Developers Limited includes several Intangible and Financial asset model projects whose concession end date goes from 2030 to 2053.
(***) IRB Infrastructure Trust Limited includes several Intangible asset model projects whose concession end date goes from 2036 to 2053.
(****) Bifurcated model, therefore a financial asset and an intangible asset are recognized.
IFRIC 12 Financial asset model assets
This heading reflects service concession arrangements related to infrastructures in which the consideration consists of an unconditional contractual right to receive cash or another financial asset, either because the awarding entity guarantees payment of specific amounts or because it guarantees recovery of the shortfall between amounts received from public service users and the specified amounts. Therefore, these are concession agreements in which demand risk is borne in full by the awarding entity. In such cases, the amount due from the awarding entity is accounted for as a financial asset in the balance sheet.
To calculate the amount due from the grantor, the value of the construction, operation and/or maintenance services provided and the financial return in arrangements of this nature are taken into consideration.
SECTION 1: BASIS OF PRESENTATION AND CONSOLIDATION SCOPE
Revenue from the services (mainly construction and maintenance) provided in each period increases the amount of the related receivables with a balancing entry in sales. The financial return on the consideration for the services provided also increases the amount of the receivables with a balancing entry in sales. Amounts received from the grantor reduce the total receivable with a balancing entry in cash.
This financial return from such concessions is recognized as revenue, since it forms part of the concession activity and is accrued on a regular, periodic basis.
At December 31, 2024, 2023 and 2022, financial returns recognized as revenue amounted to EUR 9 million, EUR 10 million and EUR 10 million, respectively.
Also, the borrowing costs associated with the financing of concessions to which the financial asset model is applied amounted to EUR 6 million in 2024, EUR 7 million in 2023 and EUR 9 million in 2022.
The main concession contracts that apply the account receivable model correspond to the Construction and Waste Treatment businesses (Thalia):
| | | | | | | | | | | | | | | | | |
| CONCESSION OPERATOR | COUNTRY | STATUS | START YEAR(*) | END YEAR | CONSO. METHOD |
| Concesionaria de Prisiones Lledoners | Spain | Operation | 2008 | 2038 | Full consolidation |
| Depusa Aragón, S.A. | Spain | Operation | 2017 | 2037 | Full consolidation |
| Wroclaw Budimex Car Park | Poland | Operation | 2012 | 2042 | Full consolidation |
| UK Waste Treatment (Thalia - Waterbeach plant) | UK | Operation | 2008 | 2036 | Full consolidation |
(*) First year of operation (if the project is in operational status) or First year of concession/construction period (if the project is in the construction phase).
In addition, within the companies accounted for by the equity method, the following toll road concession contracts also apply the account receivable model:
| | | | | | | | | | | | | | | | | |
| CONCESSION OPERATOR | COUNTRY | STATUS | START YEAR (*) | END YEAR | CONSOL. METHOD |
| Nexus Infr. Unit Trust (Toowoomba) | Australia | Operation | 2019 | 2043 | Equity consolidation |
| IRB Infrastructure Developers Limited (**) | India | Operation | - | - | Equity consolidation |
| Sociedad Concesionaria Anillo Vial S.A.C (***) | Peru | Construction | 2024 | 2054 | Equity consolidation |
| Ruta del Cacao S.A.S | Colombia | Construction | 2015 | 2040 | Equity consolidation |
| Zero Bypass Ltd. | Slovakia | Operation | 2016 | 2050 | Equity consolidation |
| Netflow OSARs Western | Australia | Operation | 2017 | 2040 | Equity consolidation |
| Riverlinx, Ltd. | UK | Construction | 2019 | 2050 | Equity consolidation |
(*) First year of the concession (if in service) or year construction began (if it is in the construction phase).
(**) IRB Infrastructure Developers Limited includes several Intangible and Financial asset model projects whose concession end date goes from 2036 to 2053.
(***) Bifurcated model, therefore a financial asset and an intangible asset are recognized.
1.3.3.3 Other balance sheet and income statement items
Impairment and disposal of fixed and intangible assets
The Group assesses, at each reporting date, whether there is an indicator that an asset may be impaired. If any indicator exists, the asset's recoverable amount is compared with its carrying value (i.e. net of accumulated depreciation). A provision for impairment is recognized in the income statement if the recoverable amount is lower than the carrying value. The provision is reversed in future years if the recoverable amount exceeds the carrying value.
The Group also assesses at the end of each reporting period whether there is any indication that an impairment loss recognized in prior periods for an asset other than goodwill may no longer exist.
The line “Impairment and disposal of fixed assets” primarily includes asset impairment and gains or losses on the purchase, sale and disposal of investments in Group companies and associates. When any such acquisitions or disposals of assets results in a takeover or loss of control, the capital gain relating to the updating of the fair value in respect of the stake maintained is recognized in the column showing fair value adjustments.
Leases
The Group applies a single recognition and measurement approach for all leases, except for short-term leases, which in line with the exception set forth in the IFRS 16 paragraph 5(a), leases that have a term of less than twelve months and leases of low-value assets are treated as operating expenses (Note 2.2). The Group recognizes lease liabilities to make lease payments and right-of-use assets representing the right to use the underlying assets (Note 3.7).
The Group recognizes right-of-use assets at lease inception (i.e., the date the underlying asset is available for use). Right-of-use assets are measured at cost, less any accumulated depreciation and impairment losses, and adjusted for any remeasurement of lease liabilities. The cost of right-of-use assets includes the amount of lease liabilities recognized, initial direct costs incurred, and lease payments made at or before the commencement date less any lease incentives received. Right-of-use assets are depreciated on a straight-line basis over the lease term.
At the commencement date of the lease, the Group recognizes lease liabilities measured at the present value of lease payments to be made over the lease term. After the commencement date, the amount of lease liabilities is increased to reflect the accretion of interest and reduced for the lease payments made. In addition, the carrying amount of lease liabilities is remeasured if there is a modification, a change in the lease term, a change in the lease payments or a change in the assessment of an option to purchase the underlying asset.
SECTION 1: BASIS OF PRESENTATION AND CONSOLIDATION SCOPE
Taxes
Current income tax assets and liabilities are measured at the amount expected to be recovered from or paid to the tax authorities. The tax rates and tax laws used to compute the amount are those that are enacted or substantively enacted at the reporting date in the countries where the Group operates and generates taxable income.
Deferred tax assets and liabilities are measured at the tax rates that are expected to apply in the year in which the asset is realized or the liability is settled, based on tax rates (and tax laws) that have been enacted or substantively enacted at the reporting date.
Deferred tax assets are recognized for the carryforward of unused tax losses and unused tax credits to the extent that it is probable that future taxable profit will be available against which the unused tax losses and unused tax credits can be utilized.
Deferred tax assets and liabilities are not offset in these financial statements, as Ferrovial´s subsidiaries do not have a clear intention to settle current tax liabilities and assets on a net basis or to realize the assets and settle the liabilities simultaneously.
Cash and cash equivalents of infrastructure project companies: Restricted cash (Note 5.2.1)
This heading includes investments of the same type and maturity that are assigned to the financing of infrastructure projects, the availability of which is restricted under the financing contracts as security to cover certain obligations relating to the interest or principal on the borrowings and to infrastructure maintenance and operation.
Fair value measurement
When measuring derivatives, the credit risk of the parties to the agreement is taken into account. The impact of credit risk will be taken to the income statement unless the derivatives qualify as effective cash flow hedges, in which case the effect will be recognized in reserves.
The Group uses appropriate measurement methods based on the circumstances and on the volume of inputs available for each item, attempting to maximize the use of relevant observable inputs and avoiding the use of unobservable inputs. According to IFRS 13, the Group establishes a fair value band that categorizes the inputs to measurement methods used to measure fair value into the following three levels:
• Level 1: Quoted prices for identical assets or liabilities.
• Level 2: Inputs other than quoted prices that are observable for assets or liabilities, either directly or indirectly.
• Level 3: Unobservable market inputs for the asset or liability.
As explained in Note 5.5, Financial derivatives, all the Group’s financial derivatives are on Level 2.
It is important to highlight the fair value measurement of the remaining 5.25% stake in FGP Topco after selling the 19.75% stake in December 2024. The fair value has been determined by reference to the selling price of the recently sold 19.75% stake in FGP Topco, and therefore, it is classified as Level 2 because the selling price is an observable input.
Financial instruments
Impairment of financial assets
Ferrovial applies IFRS 9 which is based on an expected loss model whereby the loss provision is calculated based on the coming 12-month or lifetime expected losses for the financial instruments, depending on the significance of the related increase in risk.
This model applies to all financial assets, including commercial assets contracted under IFRS 15, non-trade assets and receivables under the IFRIC 12 model. For this calculation, the Group has developed a method whereby certain rates are applied to financial asset balances that reflect expected credit losses based on the credit profile of the counterparty (the customer, in the case of trade and other receivables and the awarding entity for financial assets under IFRIC 12).
These percentages reflect probability of default (receivables not being cashed) and loss in case default materializes.
The assignment of ratings and rate trends is overseen by the financial risk department, which performs an update at each year-end based on credit risks. If during the analysis a significant increase in risk is identified with respect to that initially recognized, the expected loss is calculated considering lifetime probability of default.
The Group applies the simplified approach to trade and other receivables. In order to calculate the expected credit loss, an average rating is obtained for customers by business and geographic area and is used to generate the rates to be applied to the balances, depending on whether the customer is a public or private entity and on its business sector (only in the case of private sector customers).
Moreover, if the customer is declared insolvent, a claim is filed against it or it defaults on payment, a breach is deemed to have occurred and the entire trade receivable will be provisioned. To this end, the Group has defined payment periods per type of customer that trigger a breach and thus the posting of a provision.
In the case of receivables under the IFRIC 12 model (Note 3.3.2), the expected credit loss provision is calculated individually for each asset based on the awarding entity’s credit quality. If the credit risk has not increased significantly, the calculation will be made based on the same amount as the expected credit losses over the next 12 months. The risk is deemed not to have increased significantly if the awarding entity has a rating above investment grade and has maintained this level since initial recognition.
Classification and measurement of financial assets
Financial assets are classified, at initial recognition, as subsequently measured at amortised cost, fair value through other comprehensive income (OCI), and fair value through profit or loss.
Under IFRS 9, the classification and measurement methods are based on two aspects: the characteristics of the contractual cash flows from the financial asset and the entity’s business approach to managing financial assets.
SECTION 1: BASIS OF PRESENTATION AND CONSOLIDATION SCOPE
This entails three potential measurement methods: amortized cost, fair value through other comprehensive income (equity) and fair value through profit or loss. The Group’s financial assets are mainly assets held to maturity, the cash flows of which only comprise payments of principal and interest, so financial assets are carried at amortized cost. It should be noted that there is an option to report fair value changes in other comprehensive income from the outset in the case of equity instruments measured by default at fair value through profit or loss. This decision is irrevocable and must be made for each individual asset.
The equity instruments classified as financial assets through profit or loss are presented as non-current assets, because (i) they are not expected to be realized within the company´s normal operating cycle, (ii) they are not held primarily for trading purposes, and (iii) they are not expected to be realized within twelve months after the reporting period.
Classification and measurement of financial liabilities
Financial liabilities are classified, at initial recognition, as financial liabilities at fair value through profit or loss, loans and borrowings, payables, or as derivatives designated as hedging instruments in an effective hedge, as appropriate.
All financial liabilities are recognised initially at fair value and, in the case of loans and borrowings and payables, net of directly attributable transaction costs.
The Group’s financial liabilities include trade and other payables, loans and borrowings including bank overdrafts, and derivative financial instruments.
For purposes of subsequent measurement, financial liabilities are classified in two categories: Financial liabilities at fair value through profit or loss and financial liabilities at amortised cost (loans and borrowings).
Non-refundable grants related to assets
Non-repayable capital grants are measured at the amount granted under “Deferred income” (Note 6.1) in the consolidated statement of financial position and are progressively released to the income statement in proportion to the depreciation charged during the year on the assets financed by the grants. From a cash flow standpoint, the investments made are presented separately from the non-refundable grants received during the year.
Trade payables
The heading “Trade payables” also includes the liability to pay for goods or services acquired from suppliers under reverse factoring arrangements with banks.
These balances are classified as trade payables and the related payments as cash flows from operating activities in line with IAS 1, as they are part of the working capital used in the entity’s normal operating cycle. Payments are made to the banks on the same terms agreed with the suppliers and with no extensions beyond the due dates agreed with the suppliers, and there are no special guarantees securing the payments to be made.
Provisions
This heading includes provisions covering risks arising in the course of business (see Note 6.3). The accounting treatment of each type of provision is as follows:
i.Litigation provisions and taxes: These provisions are recognized and reversed against operating profit/(loss), against net financial income/(expense) and/or against corporate income tax, depending on the nature of the tax for which the provision has been recognized (penalties, related interest, and/or contested tax assessments).
ii.Provisions for replacements under IFRIC 12: These provisions are recognized and reversed against depreciation charged during the period in which the obligations accrue, until the replacement becomes operational. The net depreciation charges amounted to EUR 37 million and EUR 24 million in 2024 and 2023, respectively.
iii.Provisions for other long-term risks: They are recognized and reversed against changes to provisions in operating profit/(loss), as and when the landfill closure costs are incurred
iv.Trade provisions: These provisions are recognized and reversed against changes to provisions in operating profit/(loss).
Share-based remuneration schemes
Share-based remuneration scheme are accounted for as a future and therefore the value of the foreseeable shareholder distributions up to the date is discounted to the value of the shares at the grant date using a rate of return equal to the average cost of borrowings over the share award period.
1.3.3.4 Revenue recognition
Ferrovial has a common revenue recognition policy adapted to IFRS 15 “Revenue from contracts with customers” so as to ensure a consistent approach across all lines of business.
i) General revenue recognition approach
The first step in the revenue recognition process involves identifying the relevant contracts and the performance obligations that they contain.
A single performance obligation is generally identified in construction contracts due to the high degree of integration and customization of the various goods and services forming a combined output that is transferred to the customer over time.
In general, performance obligations in Construction activities carried out by Ferrovial are satisfied over time rather than at a point in time, since the customer simultaneously receives and consumes the benefits of the Company’s work as the service is provided.
SECTION 1: BASIS OF PRESENTATION AND CONSOLIDATION SCOPE
As regards the approach to recognizing revenue over time (a way of measuring the progress of a performance obligation), Ferrovial has established certain criteria that are applied consistently to similar performance obligations.
In this regard, the Group has chosen the output method as its preferred approach when measuring goods and services the control of which is transferred to the customer over time.
In contracts for goods and services that are different but closely interrelated when making a combined product, which often occurs under construction contracts, the applicable output method consists of measuring the work carried out based on the surveyed performance completed to date, in which the revenue recognized reflects the work units executed and the unit price. Under this method, the units completed under each contract are measured and the relevant output is recognized as revenue.
Costs of works or services are recognized on an accrual basis, expensing amounts actually incurred (Note 1.3.3.4.iv on provisions for deferred expenses).
For recurring and routine services (involving substantially the same services) such as maintenance, showing the same pattern over time and remuneration consisting of a recurring fixed amount over the contract term (e.g. monthly or annual payments), such that the customer benefits from the services as they are provided, the Group opted for the time-elapsed output method to recognize revenue. Under this method, revenue is recognized on a straight-line basis over the term of the contract and costs are recognized on an accrual basis.
The costs-incurred input method only is applied to contracts that are not for recurring and routine services and for which the unit price of the units to be executed cannot be determined. Under this method, the Company recognizes revenue based on costs incurred as a percentage of the total costs forecast to complete the work, taking account of the expected profit margin for the whole project, based on the most recently updated budget.
This method entails measuring the costs incurred as a result of the work completed to date as a proportion of the total costs forecast and recognizing them as revenue in proportion to the total revenues expected.
As indicated above, this method only applies to lump-sum construction or service contracts in which it is not possible to break down the price and the measurement of units to be completed.
Finally, as regards determining whether the Company acts as a principal or agent in relation to its contractual performance obligations, Ferrovial is the principal in both construction and service contracts if it provides goods and services directly to the customer and transfers control of them without involving intermediaries.
In the case of concession agreements in which Ferrovial both builds and operates the infrastructure, the construction company is the principal if it is ultimately responsible for fulfilling the contractual obligation to execute the work in accordance with the concession agreement specifications and therefore assumes the consequences in the event of a claim or delay. Revenues and results of those construction services are therefore recognized by the Construction Division. Conversely, the concession company acts as an agent in connection with the construction performance obligation and does not therefore recognize revenues or results in this regard.
ii) Recognition of revenue from contract modifications, claims and disputes
Modifications are understood as changes to the initial contract's scope of works that could result in a change to the contract revenues. Changes to the initial contract require the customer’s technical and financial approval prior to the issuance of billings and collection of the amounts relating to additional work.
The Group generally does not recognize any revenue from such additional work until it has been approved by the customer. When the scope of work has been approved but the impact on revenue has yet to be valued, the “variable consideration” requirement (as explained below) will apply. This entails recognizing revenue in an amount that is highly unlikely to be reversed.
Any costs associated with the units completed or services rendered will be recognized when they are incurred, regardless of whether or not the modification has been approved.
A claim is a request for payment or compensation to the customer (e.g., compensation events, reimbursement of costs) subject to an application procedure directly to the customer.
A dispute is the result of an incident of non- compliance or rejection after a claim has been made to the customer under the terms of the contract, the result of which is pending in a procedure being pursued directly with the customer or in court or arbitration proceedings.
The general criterion followed by the Group is not to recognize revenue until a claim is approved or a dispute is resolved.
In the event that the claim work is approved but the valuation is pending, the requirement mentioned below for the case of “variable consideration” in accordance with IFRS 15 is applied, recording the amount of revenue for which it is highly probable that there will not be a significant reversal. This treatment is also applied in exceptional cases where approval has not yet been granted if (i) there is a legal report justifying that the contract rights are clearly enforceable, (ii) as well as a technical report supporting the technical basis of the claim and (iii) approval from the Division’s CFO and General Counsel.
In those cases in which a legal report confirms that the rights forming the subject of a dispute are clearly enforceable and, therefore, at least the costs directly associated with the service relating to the dispute are recoverable, revenue may be recognized up to the maximum amount of the costs incurred.
iii) Determination of the transaction price
The transaction price must allocate a price to each performance obligation (or distinct good or service) in an amount that represents the consideration to which the entity expects to be entitled in exchange for the transfer of committed goods or services to the customer. To this end, the transaction price of each performance obligation identified in the contract is allocated as a separate selling price in relative terms.
SECTION 1: BASIS OF PRESENTATION AND CONSOLIDATION SCOPE
The best evidence of a separate selling price is the observable price of a good or service when the company sells that good or service separately in similar circumstances and to similar customers.
Variable consideration
If the consideration promised in a contract includes a variable amount, this amount is recognized only to the extent that it is highly probable that a significant reversal in the amount recognized will not occur when the uncertainty associated with the variable consideration is subsequently resolved. For example, it is stipulated that a bonus may only be recognized once a high percentage of completion of the contract has been reached.
Financing component
In general, when more than one year elapses between the date on which the good or service is delivered and the date on which the customer is expected to make payment, an implicit financing component is included when calculating the price of a performance obligation. This component is treated as financial income.
Where a performance obligation relates to a period of less than one year between the date on which the company transfers a good and the date on which the customer makes payment, the practical expedient permitted by the accounting standard is applied to avoid adjusting the amount of the consideration.
In cases in which there is a contractual or legal right to charge late-payment interest based on the contractually agreed terms, the late-payment interest is only recognized when it is highly probable that it will be effectively received.
iv) Balance sheet items related to revenue recognition
Completed work pending certification/work certified in advance
Unlike revenue recognition, amounts billed to the customer are based on the various milestones reached under the contract and on acknowledgement thereof by the customer by means of a contractual document referred to as a progress billing certificate. Therefore, the amounts recognized as revenue for a given year do not necessarily match those billed to or certified by the customer.
For contracts in which the revenue recognized exceeds the amount billed or certified, the difference is recognized in an asset account named “Completed work pending certification” (as a contract asset) under “Trade receivables for sales and services”, while for contracts in which the revenue recognized is lower than the amount billed or certified, the difference is recognized in a liability account named “Work certified in advance” (as a contract liability) under “Short-term trade and other payables”.
Bidding and mobilization costs
In addition to the balance sheet items described above, the Group also recognizes assets reflecting costs of obtaining contracts (bidding costs), costs incurred to fulfil contracts or start-up costs (mobilization costs) directly related to the main contract, provided they are recoverable during the performance of the contract. These balances are included in a separate asset account in the balance sheet under “Inventories” (Note 4.1).
Bidding costs are only capitalized when they are directly related to a contract, it is probable that they will be recovered in the future and the contract has been awarded or the company has been selected as preferred bidder.
Bidding costs incurred before a contract is awarded or the contractor selected as preferred bidder are recognized as an expense, unless they are explicitly recoverable from the customer in any event (whether or not the contract is obtained). They are amortized systematically as the goods and services related to the asset are transferred to the customer.
Any costs that are necessary to start up a contract or mobilization costs are capitalized whenever it is probable that they will be recoverable in the future, excluding any expenses that would have been incurred if the contract had not been obtained. They expensed based on the proportion of actual output to estimated output under each contract. Otherwise, they are taken directly to the income statement.
v) Provisions for contracts with customers
The main provisions relating to contracts with customers are provisions for deferred expenses and for budgeted losses.
•Provisions for deferred expenses. They cover expenses that are expected to be incurred at contract close-out, such as for the removal of construction machinery or decommissioning, as well as estimated repairs to be carried out during the warranty period. These provisions reflect an existing obligation stipulated in the contract on the basis of which the company is likely to allocate resources to satisfy the obligation, the amount of which can be reliably estimated. The provisions are based on the best available information. They may be calculated as a percentage of the total revenue expected from the contract, if there is historical information for similar contracts.
Warranty obligations included in this type of provisions are not treated as a separate performance obligation, unless the customer has the option of contracting the warranty separately, therefore they are recognized in accordance with IAS 37.
These provisions are classified as current liabilities since they relate to the operating construction projects cycle, in line with IFRS 1.
•Provisions for budgeted losses. These provisions are recognized when it becomes apparent that the total costs expected to fulfil a contract exceed expected contract revenues. For the purpose of determining, where appropriate, the amount of the provision, budgeted contract revenue will include the forecast revenue that is considered probable, in line with IAS 37 (paragraph 14 (b) as well as incremental costs and those directly related to the contract. General costs are not directly attributable to a contract and are therefore excluded from the calculation unless they are explicitly passed on to the counterparty in accordance with the contract, in line with paragraph 68 (a) of IAS 37.
This differs from the IFRS 15 approach described above in Note 1.3.3.4 “Revenue recognition”, according to which revenue is only recognized when considered highly probable.
Should the total profit expected from a contract be lower than the amount recognized applying the above-mentioned revenue recognition approach, the difference is reflected as a negative margin provision.
SECTION 1: BASIS OF PRESENTATION AND CONSOLIDATION SCOPE
vi) Segment-specific revenue recognition approach
Toll roads business
The contracts included in this line of business are accounted for in accordance with IFRIC 12, which provides for the classification of contract assets on the basis of the intangible asset model and the financial asset model (mixed models could also be applied) (Note 1.3.3.2).
In the case of contracts classified as intangible assets, the customer is the infrastructure user and therefore each use of the infrastructure by users is deemed a performance obligation and the revenue is recognized at a point in time. In the case of contracts accounted for using the financial asset model, in which the public administration is the customer, revenue recognition depends on the various services provided (e.g. operation or maintenance), which are recognized as separate performance obligations to which market prices must be allocated.
Where a separate selling price is not directly observable, the best possible estimate is employed, applying the forecast business margin.
As mentioned above in point 1.3.3.4.i, in the case of concession agreements in which Ferrovial both builds and operates the infrastructure, the construction company is the principal if it is ultimately responsible for fulfilling the contractual obligation to execute the work in accordance with the concession agreement specifications and therefore assumes the consequences in the event of a claim or delay.
Airports business
Generally speaking, these are short-term services rendered to the customer (airlines or airport users), in which revenues will be recognized at a point in time.
It should be noted that JFK NTO LLC is acting as an agent in relation to the construction performance obligation. In this case, the design and construction services are the responsibility of a third-party company, contracted for this purpose by the former (such third party, the construction company). The conclusion that it was acting as an agent for the construction activity was reached after performing an assessment following the provisions of IFRS 15, especially considering paragraphs B35 and B37.
Energy business
In these contracts, Ferrovial typically undertakes the construction and operation of energy generation and transmission infrastructures. Generally, two performance obligations are identified: one for the construction and another for the operation of the infrastructure.
The first performance obligation is fulfilled over time rather than at a single point, as the customer simultaneously receives and consumes the benefits of the Company's services as they are rendered. Regarding the method for recognizing revenue over time (a measure of the progress of a performance obligation), Ferrovial has established specific criteria that are consistently applied to similar performance obligations.
The second one encompasses a variety of services that are fundamentally similar and are transferred based on the same pattern. The monthly rate reflects the value of the services rendered. This performance obligation that is transferred over time for which revenues are recognized using the output method.
1.3.4 Accounting estimates and judgments
These financial statements are prepared in accordance with IFRS-IASB, which require the use of estimates, judgments and assumptions that affect the carrying amount of assets and liabilities, the disclosure of contingent assets and liabilities and the amount of income and expenses recognized. The estimates and associated assumptions are based on management´s best judgement of aspects that are known when the financial statements are prepared, on historical experience and on any other factor that is deemed to be relevant.
The estimation of items for which there is a risk that differences could arise in the future in respect of the carrying amounts of assets and liabilities, involves significant analysis and requires management to make judgments when determining the assumptions, as discussed in the following paragraphs:
i) Revenue from long-term construction contracts with customers (Note 1.3.3.4), particularly as regards to:
•Application of the output method to recognize revenue over time, measuring the work carried out or surveying performance completed to date, in which the revenue recognized reflects the work units executed. Under this method, the units completed in each contract are the basis used to recognize revenue. Those units are calculated by each project team based on the technical progress made up to the financial statements date. The revenue recognized reflects the work units executed valued applying the unit price established in the contract.
•Application of the input method to recognize revenue over time on those contracts where the output method cannot be applied, estimating the total costs forecast to complete the work, using most recent contract budgets approved for each project by the relevant members of management, making assumptions on future prices of materials and subcontractors’ work. Prices included in future materials supply arrangements and subcontractors’ contracts are used. In case no supply contracts are in place, materials or subcontractors’ costs are calculated based on market evidence or supply arrangements recently signed for other contracts.
•Provisions for deferred expenses: Management bases its calculations on historic experience and bears in mind the different countries and contract requirements.
•Provisions for contractual losses: When the estimated costs to complete a construction project exceed the transaction Price, the Company recognizes a provision for the indicated loss.
•Recognition of revenue for variable consideration, for a modification, for a claim or for a dispute. In this regard, management bases its calculation on the specific clauses included in each contract and also considers past experience in other contracts. Management needs to make assumptions regarding the amount of incurred costs that will give rise to these additional sources of revenue and whether those costs meet the conditions for variable considerations, modifications, claims or disputes arising in connection with the contract.
ii) Toll Roads and Airports financial information under IFRIC 12 (Note 3.3 on Investments in infrastructure projects; Note 6.3 on Provisions) and the related impairment test (Note 3.1. on Goodwill and acquisitions) performed based on a discounted cash flow model, which involves management assumptions, mainly related to:
SECTION 1: BASIS OF PRESENTATION AND CONSOLIDATION SCOPE
•Future traffic volumes (vehicles and passengers for toll roads and airports, respectively): For concessions already in operation, traffic estimates are built on actual traffic and growth patterns are derived from macroeconomic data, external studies in certain cases and any other information and plans that may impact future traffic. For concessions under construction, external projections (e.g. airports traffic forecast from international agencies) and research (e.g. impact of e-commerce on heavy vehicles traffic or home working habits on the use of private vehicles for toll roads) are used.
•Pricing: specific pricing arrangements included in concession contracts are considered. In case the arrangements do not include a fixed price, internal estimates of elasticity of demand regarding prices and other related inputs are used.
•Future operating expenses: Estimates of future prices of materials, subcontractors and other costs required to operate the concessions are based on historical experience, estimating price index grow and considering related requirements established in the concession agreements.
•Discount rates: Management calculates weighted average cost of capital based on external information sourced obtained from banks reports and converts it into a pre-tax discount rate for impairment test purposes.
iii) Fair value of assets held for sale related to discontinued operations (Note 1.1.4.), which only applies to 2022 and 2024: If the divestment process is in an advanced stage, non-binding and binding offers received from potential buyers are the main input. Where there are no offers in place, calculations based on publicly available multiples of similar transactions are also used.
iv) Calculation of the goodwill arising in the acquisitions of Dalaman in June 2022 and IRB Infrastructure Trust (Private InvIT) in June 2024, and its allocation to the fair values of its assets and liabilities (Note 1.1.5).
v) Consolidation method applicable to the following stakes:
•For the IRB Infrastructure Trust (Private InvIT) stake (23.99%) acquired in June 2024, management considers Ferrovial has significant influence and therefore this stake is consolidated through equity method.
•The sale of 100% of the economic rights and 49% of the voting rights of Umbrella Roads BV in October 2024, has resulted in the loss of control and significant influence, which has led to the recognition of a capital gain of EUR 19 million.
•Finally, following the completion in December 2024 of the sale of 19.75% of the share capital of FGP Topco (direct shareholder of Heathrow Airports Holdings Limited ), in which Ferrovial had a 25% stake and that was consolidated through equity method, the remaining 5.25% stake in FGP Topco has been classified as a financial asset measured at fair value through profit or loss, as Ferrovial does not have now significant influence over this entity. The fair value has been determined by reference to the selling price of the recently sold 19.75% stake in FGP Topco.
1.3.5 Disclosures
It should also be noted that information or disclosures that need not be included on the basis of qualitative significance have been omitted from these consolidated financial statements due to being immaterial under the IFRS Conceptual Framework.
1.4 EXCHANGE RATE
As indicated previously, Ferrovial does business outside the eurozone through various subsidiaries. The exchange rates used to translate their financial statements for Group consolidation purposes are as follows:
For balance sheet items, the exchange rates used at December 31, 2024 and for the comparative period at December 31, 2023 are as follows:
| | | | | | | | | | | |
| Closing exchange rate | 2024 | 2023 | Change 24/23 (*) |
| Pound sterling | 0.82667 | 0.86691 | (4.64) | % |
| US dollar | 1.03490 | 1.10390 | (6.25) | % |
| Canadian dollar | 1.48912 | 1.46061 | 1.95 | % |
| Australian dollar | 1.67318 | 1.62057 | 3.25 | % |
| Polish zloty | 4.27820 | 4.34300 | (1.49) | % |
| Chilean peso | 1,031.520 | 967.780 | 6.59 | % |
| Indian rupee | 89.20050 | 91.94270 | (2.98) | % |
(*) A negative change represents an appreciation of the reference currency against the euro and vice versa.
For items in the income statement and cash flow statement (cumulative average rates at December 2024, December 2023 and December 2022 for the comparative periods):
| | | | | | | | | | | | | | | | | |
| Average exchange rate | 2024 | 2023 | 2022 | Change 24/23 (*) | Change 23/22(*) |
| Pound sterling | 0.84653 | 0.86961 | 0.85269 | (2.65) | % | 1.98 | % |
| US dollar | 1.08180 | 1.08147 | 1.05330 | 0.03 | % | 2.67 | % |
| Canadian dollar | 1.48193 | 1.45920 | 1.36984 | 1.56 | % | 6.52 | % |
| Australian dollar | 1.64031 | 1.62876 | 1.51685 | 0.71 | % | 7.38 | % |
| Polish zloty | 4.30523 | 4.54119 | 4.68474 | (5.20) | % | (3.06) | % |
| Chilean peso | 1,021.132 | 908.75223 | 917.53335 | 12.37 | % | (0.96) | % |
| Indian rupee | 90.53760 | 89.31345 | 82.72616 | 1.37 | % | 7.96 | % |
(*) A negative change represents an appreciation of the reference currency against the euro and vice versa.
The impact recorded in equity attributable to the parent company for this reason is EUR 33 million in 2024 and EUR -83 million in 2023 (see Note 5.1.1 Changes in equity).
The exchange rate effects are also analyzed in the notes to the accounts, where relevant.
SECTION 1: BASIS OF PRESENTATION AND CONSOLIDATION SCOPE
1.5 SEGMENT REPORTING
As indicated in Note 1.1.3, in January 2024 Ferrovial approved a partial reorganization of the Business Divisions pursuant to which the energy solutions business line and the energy infrastructures business line were merged. As a consequence of this reorganization, 2023 and 2022 figures have been restated.
For management purposes, the Group is organized into business units based on its activities and services and has four reportable segments, as follows (Note 1.1.3):
•Construction, which undertakes the design and build of all sorts of public and private works, including most notably the construction of public infrastructures.
•Toll Roads, which carries out the development, financing and operation of toll roads.
•Airports, which is engaged in developing, financing and operating airports.
•Energy: It focuses on innovative solutions for the promotion, construction and operation of energy generation and transmission infrastructures.
No operating segments have been aggregated to form the above reportable operating segments.
The global Chief Executive Officer is the Chief Operating Decision Maker (CODM) and monitors the operating results of its business units separately for the purpose of making decisions on resource allocation and performance assessment. Segment performance is evaluated based on profit or loss and is measured consistently with profit or loss in the consolidated financial statements. Furthermore, information reported to the market is also broken down into the above four segments.
The income statement is shown below by segment for 2024, 2023 and 2022. The “Other” column includes the income and/or expenses of companies not assigned to any of the business segments, including most notably the parent company Ferrovial SE and its other businesses, such as the waste treatment plants in UK, the mining services in Chile and the new activity started by the group in 2024 related to the development of data centers called Digital Infrastructure. The “Adjustments” column reflects inter-segment consolidation eliminations.
As can be seen in the following tables, Construction and Toll Roads revenues account for more than 10% of the Group’s consolidated revenue. The Airports segment is a distinct business line, managed separately and therefore disclosed as a reporting segment. The Energy segment is a relatively new business area the Group is focusing on. The CEO assesses its performance separately based on an income statement measured consistently with profit or loss in the consolidated financial statements and with a similar presentation.
Income statement by business segment 2024, 2023 and 2022 (Million euro).
| | | | | | | | | | | | | | | | | | | | | | | |
| (Millions of euros) | Construction | Toll Roads | Airports | Energy | Other | Adjustments | Total 2024 |
| Revenue | 7,234 | 1,256 | 91 | 270 | 520 | -224 | 9,147 |
| Other operating income | 2 | — | — | — | -1 | — | 1 |
| Revenues and other operating income | 7,236 | 1,256 | 91 | 270 | 519 | -224 | 9,148 |
| | | | | | | |
| | | | | | | |
| | | | | | | |
| Total operating expenses | 6,806 | 338 | 65 | 268 | 551 | -222 | 7,806 |
| | | | | | | |
| Fixed asset depreciation | 146 | 232 | 22 | 13 | 28 | — | 441 |
| | | | | | | |
| Impairment and disposal of fixed assets | — | 151 | 2,025 | — | 32 | — | 2,208 |
| Operating profit/(loss) | 284 | 837 | 2,029 | -11 | -28 | -2 | 3,109 |
| | | | | | | |
| | | | | | | |
| | | | | | | |
| | | | | | | |
| | | | | | | |
| | | | | | | |
| Profit/(loss) on derivatives and other net financial income/(expense) | -34 | -75 | 627 | — | 24 | -3 | 539 |
| Net financial income/(expense) from financing | 150 | -215 | -2 | -8 | -193 | 3 | -265 |
| Net financial income/(expense) | 116 | -290 | 625 | -8 | -169 | — | 274 |
| Share of profits of equity-accounted companies | — | 226 | 8 | — | 4 | — | 238 |
| Profit/(loss) before tax from continuing operations | 400 | 773 | 2,662 | -19 | -193 | -2 | 3,621 |
| Income/(expense) tax | -142 | -110 | 3 | 5 | 99 | — | -145 |
| Profit/(loss) net of tax from continuing operations | 258 | 663 | 2,665 | -14 | -94 | -2 | 3,476 |
| Profit/(loss) net of tax from discontinued operations | — | — | — | — | 14 | — | 14 |
| Net profit/(loss) | 258 | 663 | 2,665 | -14 | -80 | -2 | 3,490 |
| Net profit/(loss) for the year attributed to non-controlling interests | -68 | -160 | -23 | — | — | — | -251 |
| Net profit/(loss) for the year attributed to the parent company | 190 | 503 | 2,642 | -14 | -80 | -2 | 3,239 |
SECTION 1: BASIS OF PRESENTATION AND CONSOLIDATION SCOPE
| | | | | | | | | | | | | | | | | | | | | | | |
| Construction | Toll Roads | Airports | Energy | Other | Adjustments | Total 2023 |
| Revenue | 6,869 | 1,085 | 80 | 207 | 506 | (233) | 8,514 |
| Other operating income | 1 | — | — | — | — | — | 1 |
| Revenues and other operating income | 6,870 | 1,085 | 80 | 207 | 506 | (233) | 8,515 |
| | | | | | | |
| | | | | | | |
| | | | | | | |
| Total operating expenses | 6,659 | 286 | 58 | 206 | 548 | (233) | 7,524 |
| | | | | | | |
| Fixed asset depreciation | 134 | 213 | 20 | 9 | 26 | (1) | 401 |
| | | | | | | |
| Impairment and disposal of fixed assets | — | 38 | — | — | (2) | (1) | 35 |
| Operating profit/(loss) | 77 | 624 | 2 | (8) | (70) | — | 625 |
| | | | | | | |
| | | | | | | |
| | | | | | | |
| | | | | | | |
| | | | | | | |
| | | | | | | |
| Profit/(loss) on derivatives and other net financial income/(expense) | (31) | 5 | (12) | (1) | 28 | (2) | (13) |
| Net financial income/(expense) from financing | 117 | (224) | 3 | — | (114) | 1 | (217) |
| Net financial income/(expense) | 86 | (219) | (9) | (1) | (86) | (1) | (230) |
| Share of profits of equity-accounted companies | — | 198 | 11 | (1) | 6 | 1 | 215 |
| Profit/(loss) before tax from continuing operations | 163 | 603 | 4 | (10) | (150) | — | 610 |
| Income/(expense) tax | (65) | (55) | (20) | 2 | 22 | 1 | (115) |
| Profit/(loss) net of tax from continuing operations | 98 | 548 | (16) | (8) | (128) | 1 | 495 |
| Profit/(loss) net of tax from discontinued operations | — | — | — | — | 17 | (1) | 16 |
| Net profit/(loss) | 98 | 548 | (16) | (8) | (111) | — | 511 |
| Net profit/(loss) for the year attributed to non-controlling interests | (51) | (126) | 7 | — | — | — | (170) |
| Net profit/(loss) for the year attributed to the parent company | 47 | 422 | (9) | (8) | (111) | — | 341 |
| | | | | | | | | | | | | | | | | | | | | | | |
| Construction | Toll Roads | Airports | Energy | Other | Adjustments | Total 2022 |
| Revenue | 6,280 | 780 | 54 | 191 | 466 | (220) | 7,551 |
| Other operating income | 2 | — | — | — | 1 | (1) | 2 |
| Revenues and other operating income | 6,282 | 780 | 54 | 191 | 467 | (221) | 7,553 |
| | | | | | | |
| | | | | | | |
| | | | | | | |
| Total operating expenses | 6,106 | 230 | 56 | 196 | 458 | (221) | 6,825 |
| | | | | | | |
| Fixed asset depreciation | 107 | 159 | 7 | 8 | 18 | — | 299 |
| | | | | | | |
| Impairment and disposal of fixed assets | — | (3) | — | — | (3) | — | (6) |
| Operating profit/(loss) | 69 | 388 | (9) | (13) | (12) | — | 423 |
| | | | | | | |
| | | | | | | |
| | | | | | | |
| | | | | | | |
| | | | | | | |
| | | | | | | |
| Profit/(loss) on derivatives and other net financial income/(expense) | (34) | (109) | 19 | — | 50 | (1) | (75) |
| Net financial income/(expense) from financing | 36 | (240) | — | (4) | (35) | 1 | (242) |
| Net financial income/(expense) | 2 | (349) | 19 | (4) | 15 | — | (317) |
| Share of profits of equity-accounted companies | — | 157 | 7 | — | — | 1 | 165 |
| Profit/(loss) before tax from continuing operations | 71 | 196 | 17 | (17) | 3 | 1 | 271 |
| Income/(expense) tax | (6) | (39) | 2 | (2) | 15 | — | (30) |
| Profit/(loss) net of tax from continuing operations | 65 | 157 | 19 | (19) | 18 | 1 | 241 |
| Profit/(loss) net of tax from discontinued operations | — | — | — | — | 64 | — | 64 |
| Net profit/(loss) | 65 | 157 | 19 | (19) | 82 | 1 | 305 |
| Net profit/(loss) for the year attributed to non-controlling interests | (42) | (66) | (9) | — | — | — | (117) |
| Net profit/(loss) for the year attributed to the parent company | 23 | 91 | 10 | (19) | 82 | 1 | 188 |
CONSOLIDATED FINANCIAL STATEMENTS
FERROVIAL SE AND SUBSIDIARIES
SECTION 2: PROFIT/(LOSS) FOR THE YEARS ENDED DECEMBER 31, 2024, 2023 AND 2022
This section comprises the notes relating to profit/(loss) for the years ended December 31, 2024, 2023 and 2022.
For the year ended December 31, 2024:
Net profit for the year reached EUR 3,239 million on the back of the positive one-off impacts related to the divestment transactions executed during the year, as mentioned in note 1.1.5, highlighting the positive impact of the 19.75% stake in Heathrow Airports Holdings (EUR 2.570 million), the 5% stake in IRB Infrastucture Developers (EUR 116 million) and the 24% stake in Grupo Serveo (EUR 32 million). Excluding this one-off effect, worth mentioning the net income improvement compared to previous year on the back of the positive operational performance in Toll Roads business in US and Canada due to higher traffic and toll rates, as well as the Construction Division’s results.
For the year ended December 31, 2023:
Net profit for the year reached EUR 341 million thanks to traffic and revenue per transaction growth in the Toll Roads business in US, as well as by the Construction Division’s results, particularly the contributions from the businesses in Spain and Poland (Budimex).
Also noteworthy is the sale of the Azores toll road in Portugal (EUR 41 million) and the positive impact of financial derivatives (EUR 43 million), highlighting equity swaps impact due to the positive performance of the Company´s shares and Autema toll road interest rate swaps positive variation.
For the year ended December 31, 2022:
Net profit for the year reached EUR 188 million thanks to operational improvements in the Toll Roads business following traffic growth, which is explained mainly by the lifting of the COVID-19 restrictions and the rate rise in the US, as well as by the Construction Division’s results, particularly the contributions from the businesses in Spain and Poland (Budimex).
In addition, net profit/(loss) for the year was impacted by a profit of EUR 64 million from discontinued operations relating mainly to the divestments of the business operated in the UK through the subsidiary Amey (Note 1.1.5).
Finally, of particular note is the recognition of EUR 26 million in deferred tax liabilities, in addition to the EUR 41 million recognized in December 2021, for withholding tax on the repatriation of future dividends from Canada (Note 2.7.2).
NOTES ON PROFIT/(LOSS) FROM CONTINUING OPERATIONS
2.1. OPERATING INCOME
The Group’s revenue as of and for the years ended December 31, 2024, 2023 and 2022 reached EUR 9,147 million, EUR 8,514 and EUR 7,551 million, respectively.
The Group´s revenue from contracts with customers, as interpreted by IFRS 15, amounted to EUR 9,024 million, EUR 8,339 million and EUR 7,385 million, respectively (Note 4.4), for the years ended December 31, 2024, 2023 and 2022.
Revenue includes financial income from services provided by the concession operators that apply the financial asset model, totaling EUR 9 million, EUR 10 million and EUR 10 million in 2024, 2023 and 2022, respectively.
Set out below is a breakdown of revenue by segment and comparative figures for 2024, 2023 and 2022:
For the year ended December 31, 2024:
| | | | | | | | | | | | | | |
| (Million euro) | External sales | Inter-segment sales | Total | Var. % |
| Construction | 6,919 | | 315 | | 7,234 | | 5 | % |
| Toll Roads | 1,246 | | 10 | | 1,256 | | 16 | % |
| Airports | 82 | | 9 | | 91 | | 14 | % |
| Energy | 268 | | 2 | | 270 | | 30 | % |
| Other activities (*) | 348 | | 172 | | 520 | | 3 | % |
| Adjustments | — | | (224) | | (224) | | (4) | % |
| Total | 8,864 | | 283 | | 9,147 | | 7 | % |
(*) Corresponds to support services provided by the Corporation Division to the rest of the Group’s businesses, which are eliminated in the consolidation process.
For the year ended December 31, 2023:
| | | | | | | | | | | | | | |
| (Million euro) | External sales | Inter-segment sales | Total | Var. % |
| Construction | 6,380 | | 489 | | 6,869 | | 9 | % |
| Toll Roads | 1,084 | | 1 | | 1,085 | | 39 | % |
| Airports | 80 | | — | | 80 | | 48 | % |
| Energy | 207 | | — | | 207 | | 8 | % |
| Other activities (*) | 350 | | 156 | | 506 | | 9 | % |
| Adjustments | — | | (233) | | (233) | | 6 | % |
| Total | 8,101 | | 413 | | 8,514 | | 13 | % |
(*) Corresponds to support services provided by the Corporation Division to the rest of the Group’s businesses, which are eliminated in the consolidation process.
For the year ended December 31, 2022:
| | | | | | | | | | | |
| (Million euro) | External sales | Inter-segment sales | Total |
| Construction | 5,249 | | 1,031 | | 6,280 | |
| Toll Roads | 779 | | 1 | | 780 | |
| Airports | 54 | | — | | 54 | |
| Energy | 191 | | — | | 191 | |
| Other activities (*) | 327 | | 139 | | 466 | |
| Adjustments | — | | (220) | | (220) | |
| Total | 6,600 | | 951 | | 7,551 | |
(*) Mainly corresponds to support services provided by the Corporation Division to the rest of the Group’s businesses, which are eliminated in the consolidation process.
The inter-segment sales reached EUR 951 million, and are mainly related to works completed by the Construction Division for the infrastructure concession operators (Note 1.3.2 and Note 6.8).
The breakdown of sales by geographic area is as follows:
| | | | | | | | | | | | | | | | | |
| (Million euro) | 2024 | 2023 | Var. 23/22 | 2022 | Var. 22/21 |
| USA | 3,271 | | 2,879 | | 392 | | 2,906 | | (27) | |
| Poland | 2,119 | | 2,160 | | (41) | | 1,842 | | 318 | |
| Spain | 1,582 | | 1,475 | | 107 | | 1,154 | | 321 | |
| UK | 809 | | 771 | | 38 | | 708 | | 63 | |
| Canada | 246 | | 161 | | 85 | | 100 | | 61 | |
| Other | 1,120 | | 1,068 | | 52 | | 841 | | 227 | |
| TOTAL | 9,147 | | 8,514 | | 633 | | 7,551 | | 963 | |
The Ferrovial Group’s sales in its five main markets accounted for 88% of total sales in 2024 (87% in 2023 and 89% in 2022).
2.2. OTHER OPERATING EXPENSES
Set out below is a breakdown of other operating expenses:
| | | | | | | | | | | | | | | | | |
| (Million euro) | 2024 | 2023 | Var. 24/23 | 2022 | Var. 23/22 |
| Subcontracted work | 3,550 | | 3,337 | | 213 | | 2,975 | | 362 | |
| Leases | 257 | | 251 | | 6 | | 257 | | (6) | |
| Repairs and maintenance | 75 | | 82 | | (7) | | 89 | | (7) | |
| Independent professional services | 454 | | 485 | | (31) | | 449 | | 36 | |
| Changes in provisions for liabilities (Note 6.3) | (36) | | 53 | | (89) | | (68) | | 121 | |
| Other operating expenses | 631 | | 670 | | (39) | | 480 | | 190 | |
| Total other operating expenses | 4,931 | | 4,878 | | 53 | | 4,182 | | 696 | |
2.3 PERSONNEL EXPENSES
Set out below is a breakdown of personnel expenses:
| | | | | | | | | | | | | | | | | |
| (Million euro) | 2024 | 2023 | Var. 24/23 | 2022 | Var.23/22 |
| Wages and salaries | 1,468 | | 1,350 | | 118 | | 1,111 | | 239 | |
| Social security contributions | 375 | | 179 | | 196 | | 158 | | 21 | |
| Pension plan contributions | 18 | | 15 | | 3 | | 13 | | 3 | |
| Share-based payments | 13 | | 11 | | 2 | | 8 | | 4 | |
| Other welfare expenses | (114) | | 43 | | (157) | | 156 | | (113) | |
| TOTAL | 1,760 | | 1,599 | | 162 | | 1,446 | | 153 | |
The trend in the number of employees at December 31, 2024, 2023 and 2022, by professional category and gender is as follows.
At December 31, 2024:
| | | | | | | | | | | | | | |
| 12.31.2024 |
| CATEGORY | MEN | WOMEN | TOTAL | VAR 24/23 |
| Executive directors | 2 | — | 2 | — | % |
| Senior managers | 12 | 4 | 16 | 23 | % |
| Executives | 2,900 | 757 | 3,657 | 4 | % |
| Managers/Professionals/Supervisors | 4,236 | 2,270 | 6,506 | 4 | % |
| Administrative/Support personnel | 680 | 772 | 1,452 | 1 | % |
| Manual workers | 13,160 | 708 | 13,868 | 2 | % |
| Total | 20,990 | 4,511 | 25,501 | 3 | % |
At December 31, 2023:
| | | | | | | | | | | | | | |
| 12.31.2023 |
| CATEGORY | MEN | WOMEN | TOTAL | VAR. 23/22 |
| Executive directors | 2 | — | 2 | — | % |
| Senior managers | 11 | 2 | 13 | — | % |
| Executives | 2,819 | 703 | 3,522 | 10 | % |
| Managers/Professionals/Supervisors | 4,145 | 2,132 | 6,277 | 2 | % |
| Administrative/Support personnel | 670 | 766 | 1,436 | 16 | % |
| Manual workers | 12,910 | 639 | 13,549 | — | % |
| Total | 20,558 | 4,241 | 24,799 | 3 | % |
At December 31, 2022:
| | | | | | | | | | | |
| 12.31.2022 |
| CATEGORY | MEN | WOMEN | TOTAL |
| Executive directors | 2 | — | 2 |
| Senior managers | 12 | 1 | 13 |
| Executives | 2,580 | 635 | 3,215 |
| Managers/Professionals/Supervisors | 4,117 | 2,044 | 6,161 |
| Administrative/Support personnel | 565 | 668 | 1,233 |
| Manual workers | 12,864 | 703 | 13,567 |
| Total | 20,140 | 4,051 | 24,191 |
At December 31, 2024, 2023 and 2022, there were 175, 121 and 107 employees, respectively, with a disability rating of 33% or more, accounting for 1%, 0.5% and 0.4% of the total workforce at the end of each period.
The average workforce by business division for the three periods is as follows:
| | | | | | | | | | | | | | |
| 12.31.2024 |
| BUSINESS | MEN | WOMEN | TOTAL | VAR 24/23 |
| Construction | 14,944 | 3,355 | 18,299 | (6) | % |
| Toll Roads | 588 | 227 | 815 | (11) | % |
| Airports | 201 | 46 | 248 | 5 | % |
| Energy | 1,460 | 201 | 1,661 | 2296 | % |
| Other | 4,140 | 694 | 4,834 | 7 | % |
| | | | |
| Total | 21,333 | 4,523 | 25,857 | 3 | % |
| | | | | | | | | | | | | | |
| 12.31.2023 |
| BUSINESS | MEN | WOMEN | TOTAL | VAR 23/22 |
| Construction | 16,067 | 3,345 | 19,412 | 5 | % |
| Toll Roads | 678 | 233 | 911 | 68 | % |
| Airports | 195 | 42 | 237 | 1 | % |
| Energy | 48 | 21 | 69 | 202 | % |
| Other | 3,866 | 670 | 4,536 | 3 | % |
| | | | |
| Total | 20,855 | 4,311 | 25,166 | (27) | % |
| | | | | | | | | | | |
| BUSINESS | 12.31.2022 |
| MEN | WOMEN | TOTAL |
| Construction | 15,316 | 3,135 | 18,451 |
| Toll Roads | 373 | 169 | 541 |
| Airports | 192 | 43 | 235 |
| Energy | 17 | 6 | 23 |
| Other | 3,785 | 617 | 4,402 |
| Total continuing operations | 19,683 | 3,970 | 23,653 |
| Total discontinued operations | 7,346 | 3,352 | 10,698 |
| Total | 27,029 | 7,322 | 34,351 |
2.4. IMPAIRMENTS AND DISPOSALS
There follows a breakdown of the main gains and losses due to impairment and disposals for the corresponding periods.
| | | | | | | | |
| 2024 | | |
| (Million euro) | Impact on profit/(loss) before tax | Impact on profit/(loss) after tax |
| 19.75% HAH Sale | 2,023 | 2,023 |
| 5% IRB Sale | 132 | 116 |
| Serveo Sale | 33 | 32 |
| Equity-accounted availability toll road assets | 19 | 19 |
| Vertiports sale | 2 | 2 |
| Capital gains and disposals (Note 1.1.5) | 2,209 | 2,192 |
| | |
| Impairment gains/(losses) | (1) | (1) |
| TOTAL IMPAIRMENT AND DISPOSALS | 2,208 | 2,191 |
| | | | | | | | |
| 2023 | | |
| (Million euro) | Impact on profit/(loss) before tax | Impact on profit/(loss) after tax |
| Azores sale | 39 | 41 |
| Capital gains and disposals (Note 1.1.5) | 39 | 41 |
| Aravia | (2) | (2) |
| Zity Sale | (2) | (2) |
| Impairment gains/(losses) | (4) | (4) |
| TOTAL IMPAIRMENT AND DISPOSALS | 35 | 37 |
| | | | | | | | |
| 2022 | | |
| (Million euro) | Impact on profit/(loss) before tax | Impact on profit/(loss) after tax |
| Algarve sale | (3) | (3) |
| Capital gains and disposals | (3) | (3) |
| Impairment of the ownership interest in MaaS Global | (3) | (3) |
| Impairment gains/(losses) | (3) | (3) |
| TOTAL IMPAIRMENT AND DISPOSALS | (6) | (6) |
2.5 NET FINANCIAL INCOME/(EXPENSE)
The following tables provide an itemized breakdown of changes in net financial income/(expense) in 2024, 2023 and 2022.
Net financial income/(expense) for these years from the infrastructure project companies is presented separately from that of ex-infrastructure project companies (see the definition in Note 1.1.3). In each case, a distinction is made between net financial income/(expense) from financing (which includes borrowing costs on bank borrowings and bonds, and returns on financial investments and loans granted) and net financial income/(expense) from derivatives and other items (including the effect of the fair value measurement of ineffective hedges, and other income and expenses not directly related to financing).
For 2024, as compared to 2023:
| | | | | | | | | | | |
| (Million euro) | 2024 | 2023 | Var. % |
| Financial income from infrastructure project financing | 43 | 34 | 26 | % |
| Financial expense from infrastructure project financing | (382) | (362) | 6 | % |
| Net financial income/(expense) from financing, infrastructure project companies | (339) | (328) | 3 | % |
| Net financial income/(expense) from derivatives and other fair value adjustments, infrastructure project companies | 9 | 13 | (31) | % |
| Other net financial income/(expense), infrastructure project companies | (81) | (57) | 42 | % |
| Other net financial income/(expense), infrastructure project companies | (72) | (44) | 64 | % |
| Net financial income/(expense) from infrastructure projects | (411) | (372) | 10 | % |
| Financial income, other companies | 169 | 216 | (22) | % |
| Financial expense, other companies | (95) | (105) | (10) | % |
| Net financial income/(expense) from financing, other companies | 74 | 111 | (33) | % |
| Net financial income/(expense) from derivatives and other fair value adjustments, other companies | 574 | 11 | 5118 | % |
| Other net financial income/(expense), other companies | 37 | 20 | 85 | % |
| Other net financial income/(expense), other companies | 611 | 31 | 1871 | % |
| Net financial income/(expense), other companies | 685 | 142 | 382 | % |
| Total net financial income/(expense) | 274 | (230) | (219) | % |
Regarding the 2024 financial result, it should be noted that the line item "Net financial income/(expense) from derivatives and other fair value adjustments, other companies" includes a positive effect of EUR 547 million related to the Heathrow Airports Holding (HAH) divestment (Note 1.1.5), as a consequence of the recognition of the remaining 5.25% stake in HAH as a financial asset at fair value through profit or loss. The fair value has been determined by referencing the selling price of the recently 19.75% stake divested in FGP Topco.
For 2023, as compared to 2022:
| | | | | | | | | | | |
| (Million euro) | 2023 | 2022 | Var. % |
| Financial income from infrastructure project financing | 34 | 8 | 325 | % |
| Financial expense from infrastructure project financing | (362) | (251) | 44 | % |
| Net financial income/(expense) from financing, infrastructure project companies | (328) | (243) | 35 | % |
| Net financial income/(expense) from derivatives and other fair value adjustments, infrastructure project companies | 13 | (105) | (112) | % |
| Other net financial income/(expense), infrastructure project companies | (57) | (17) | 235 | % |
| Other net financial income/(expense), infrastructure project companies | (44) | (122) | (64) | % |
| Net financial income/(expense) from infrastructure projects | (372) | (365) | 2 | % |
| Financial income, other companies | 216 | 104 | 108 | % |
| Financial expense, other companies | (105) | (103) | 2 | % |
| Net financial income/(expense) from financing, other companies | 111 | 1 | 11000 | % |
| Net financial income/(expense) from derivatives and other fair value adjustments, other companies | 11 | 47 | (77) | % |
| Other net financial income/(expense), other companies | 20 | - | — | % |
| Other net financial income/(expense), other companies | 31 | 47 | (34) | % |
| Net financial income/(expense), other companies | 142 | 48 | 196 | % |
| Total net financial income/(expense) | (230) | (317) | (27) | % |
The following table provides a breakdown of financial expense from infrastructure project companies showing capitalized expenses relating to toll roads under construction:
| | | | | | | | | | | |
| Infrastructure project financing expenses from infrastructures (Million euro) | 2024 | 2023 | 2022 |
| Accrued financial expenses | (387) | (379) | (347) |
| Expenses capitalized during the construction period | 5 | 17 | 96 |
| Financial expenses in P&L | (382) | (362) | (251) |
2.6 SHARE OF PROFITS OF EQUITY-ACCOUNTED COMPANIES
The share of profits of equity-accounted companies in 2024 amounted to EUR 238 million (EUR 215 million in 2023 and EUR 165 million in 2022). Set out below is a breakdown of the most significant companies:
| | | | | | | | | | | |
Profit/(loss) of equity-accounted companies
(Million euro) | 2024 | 2023 | 2022 |
| 407 ETR | 188 | | 154 | | 124 | |
| JFK NTO | 3 | | 4 | | 1 | |
| IRB | 13 | | 14 | | 22 | |
| Serveo Group | 3 | | 11 | | 6 | |
| Other | 31 | | 32 | | 12 | |
| TOTAL | 238 | | 215 | | 165 | |
Note 3.5 provides further details of these companies’ profits/(losses).
2.7 CORPORATE INCOME TAX AND DEFERRED TAXES
2.7.1 Breakdown of current and deferred tax expense and tax paid for 2024, 2023 and 2022
The breakdown of the income tax expense for 2024, 2023 and 2022, distinguishing between current tax, deferred tax, withholding on foreign operations and changes in prior year tax estimates and other items, is as follows.
| | | | | | | | | | | |
| (Million euro) | 2024 DEC | 2023 DEC | 2022 DEC |
| Tax expense of the year | (145) | | (115) | | (30) | |
| Current tax expense | (107) | | (146) | | (64) | |
| Deferred tax expense | (28) | | 65 | | 42 | |
| Withholdings in a foreign operation | (36) | | (73) | | (51) | |
| Change to the prior-year tax evaluation and other | 26 | | 39 | | 43 | |
2.7.2 Explanation of corporate income tax expense for the year and the applicable tax rate
In 2024, corporate tax expense was recognized in the amount of EUR -145 million (EUR -115 million in 2023 and EUR -30 million in 2022) as shown in the following tables:
| | | | | | | | | | | |
| (Million euro) | 2024 DEC | 2023 DEC | 2022 DEC |
| Profit/(Loss) before tax on continuing operations | 3,621 | | 610 | | 271 | |
| Results of associates | (239) | | (215) | | (164) | |
| Pass-through tax rules (USA & Canada) | (147) | | (93) | | (71) | |
| Divestments completed during the year (note 1.1.5) | (2,814) | | — | | — | |
| Profit/(Loss) before tax on continuing operations adjusted | 421 | | 302 | | 36 | |
| Theoretical income tax expense (25.8%) | (109) | | (78) | | (9) | |
| Recognition of previously unrecognized tax losses / Unrecognized tax losses of the year | (16) | | (5) | | (38) | |
| | | |
| Ruling related to Royal Decree-Law 3/2016 (Spain) | 31 | | — | | — | |
| | | |
| | | |
| | | |
| | | |
| Withholding tax | (36) | | (73) | | (51) | |
| Other adjustments | (15) | | 40 | | 68 | |
| Income Tax expense | (145) | | (115) | | (30) | |
| Effective tax rate (%) | 4.0 | % | 18.8 | % | 11.1 | % |
For the analysis of the corporate income tax, we have to consider the following adjustments:
•Results of associates: the results of the equity method companies already include the tax effect, so they must be adjusted for the analysis.
•Pass-through tax rule: Primarily relates to profit/losses in concession project companies in the US and Canada, which are fully consolidated. However, the associated tax expense/credit is recognized based solely on Ferrovial's ownership interest, as these companies are taxed under pass-through tax rules, whereby the shareholders are the taxpayers according to their stake in the concession.
•Divestments completed during 2024 which are tax exempt under the application of the participation exemption (note 1.1.5.), highlighting the sale of 19.75% share capital of FGP Topco, the 5% stake in the Indian company IRB Infrastructure Developers, the sale of 24.78% stake in Grupo Serveo and the divestment of several road and parking concessions in Spain, Scotland, Ireland and Canada.
The main adjustments to the theoretical income tax expense for the year are as follows:
•Recognition of previously unrecognized net operating losses carryforwards, primarily in Spain and UK, and unrecognized tax losses generated in the 2024, primarily in The Netherlands, Slovakia, Colombia and Poland.
•The Ruling related to Royal Decree-Law (RDL) 3/2016, includes a positive impact of EUR 31 million in favor of Ferrovial. As reported in the December 2023 Consolidated Financial Statements, on January 18, 2024, the Spanish Constitutional Court officially announced its ruling related to this matter, resolving that the use of the RDL was not suitable for amending the essential elements of Corporate Income Tax (CIT) Law, therefore this practice infringed constitutional requirements.
•Withholding taxes (EUR -36 million), which mainly correspond to the withholding tax paid in India due to the sale of the 5% stake in the company IRB Infrastructure Developers (IRB) for EUR 16 million, and the withholding related to dividends received from Canada (EUR 16 million).
•Other adjustments, which primarily correspond to the following
•Tax-losses carryforward recoverability analysis in Spain and Turkey, where a model was designed based on the Group companies' latest available earnings projections for each jurisdiction, and which implied the recognition of EUR -22 million provision in Spain, and a positive impact for the recognition of EUR 31 million of deferred tax assets in Turkey.
•Tax-losses carryforward recoverability analysis related to The Netherlands and US tax groups, where in accordance with IAS 12, an amount of tax credits was recognized equal to the excess of liability temporary differences over asset temporary differences, which implied the recognition of EUR 10 million of deferred tax assets in The Netherlands, and a provision of EUR 8 million in US.
•Effect of different tax rates of subsidiaries operating in other jurisdictions, highlighting Poland (EUR 13 million).
•Non tax deductible financial expenses, primarily in The Netherlands (EUR -14 million).
•Prior year tax effects mainly related to 2023 true-up recognition in US (EUR -9 million) and in The Netherlands (EUR -7 million).
2.7.3 Movements in deferred tax assets and liabilities
Set out below is a breakdown of movements in deferred tax assets and liabilities for 2024-2022 period:
| | | | | | | | | | | | | | | | | | | | |
| ASSETS | | | | | | |
| (Million euro) | 2023 | Prior years, transfers and other | Charged/credited to income statement | Charged/credited to equity | Foreign exchange effect | 2024 |
| Tax credits | 503 | | (40) | | 48 | | — | | 26 | | 537 | |
| Differences between tax and accounting criteria | 422 | | (93) | | 38 | | 3 | | 7 | | 377 | |
| Equity measurement adjustments | 48 | | 2 | | 4 | | 143 | | — | | 197 | |
| Other items | 33 | | — | | 15 | | — | | 1 | | 48 | |
| TOTAL | 1,006 | | (131) | | 105 | | 145 | | 34 | | 1,159 | |
| | | | | | | | | | | | | | | | | | | | |
| LIABILITIES | | | | | | |
| (Million euro) | 2023 | Prior years, transfers and other | Charged/credited to income statement | Charged/credited to equity | Foreign exchange effect | 2024 |
| Deferred taxes on goodwill | 22 | | (1) | | 1 | | — | | — | | 22 | |
| Deferred fair value adjustments to acquisitions | 308 | | (17) | | (7) | | — | | 17 | | 301 | |
Differences
between tax and accounting criteria | 561 | | (169) | | 119 | | 2 | | 35 | | 548 | |
| Equity measurement adjustments | 69 | | 1 | | 5 | | 156 | | 2 | | 234 | |
| Other items | 126 | | (9) | | 15 | | — | | 2 | | 134 | |
| TOTAL | 1,086 | | (194) | | 133 | | 158 | | 57 | | 1,239 | |
| | | | | | | | | | | | | | | | | | | | |
| ASSETS | | | | | | |
| (Million euro) | 2022 | Prior years, transfers and other | Charged/credited to income statement | Charged/credited to equity | Foreign exchange effect | 2023 |
| Tax credits | 370 | | 26 | | 119 | | — | | (13) | | 503 | |
| Differences between tax and accounting criteria | 274 | | 46 | | 87 | | 4 | | 11 | | 422 | |
| Equity measurement adjustments | 86 | | (1) | | 11 | | (47) | | — | | 48 | |
| Other items | 55 | | 9 | | (31) | | 1 | | — | | 33 | |
| TOTAL | 784 | | 80 | | 186 | | (42) | | (2) | | 1,006 | |
| | | | | | | | | | | | | | | | | | | | |
| LIABILITIES | | | | | | |
| (Million euro) | 2022 | Prior years, transfers and other | Charged/credited to income statement | Charged/credited to equity | Foreign exchange effect | 2023 |
| Deferred taxes on goodwill | 21 | | — | | 1 | | — | | — | | 22 | |
| Deferred fair value adjustments to acquisitions | 315 | | 13 | | (12) | | — | | (8) | | 308 | |
Differences
between tax and accounting criteria | 378 | | 65 | | 131 | | — | | (13) | | 561 | |
| Equity measurement adjustments | 64 | | 2 | | 1 | | 3 | | (1) | | 69 | |
| Other items | 145 | | (22) | | — | | — | | 2 | | 126 | |
| TOTAL | 924 | | 58 | | 121 | | 3 | | (20) | | 1,086 | |
Deferred tax assets
a) Tax credits
This item relates to tax credits that have not yet been used by the Group companies.
It does not include all the tax credits available, only those that the Group expects to be able to use in the short or medium term, based on a 10 year-period financial projections performed. The total balance recognized amounts to EUR 537 million, of which EUR 517 million relates to tax credits for tax-loss carryforwards and EUR 20 million to other tax credits.
Set out below is a breakdown of tax-loss carryforwards pending offset, and showing the maximum tax credit and the tax credit recognized:
| | | | | | | | | | | | | | |
| 2024 | | | |
(Million euro) Country | Tax-loss carryforwards | Limitation period | Maximum tax credit | Tax credit recognized |
| US tax consolidated group | 2,138 | | No expiry date | 493 | | 443 | |
| Spanish tax consolidated group | 303 | | No expiry date | 76 | | 23 | |
| Netherlands tax consolidated group | 288 | | No expiry date | 74 | | 10 | |
| UK | 218 | | No expiry date | 55 | | — | |
| Turkey | 107 | | 2025-2029 | 27 | | — | |
| Australia | 30 | | No expiry date | 9 | | — | |
| Canada | 28 | | 2035-2045 | 7 | | — | |
| Other | 579 | | 2024-No expiry date | 146 | | 41 | |
| Total | 3,691 | | | 887 | | 517 | |
| | | | | | | | | | | | | | |
| 2023 | | | | |
(Million euro)
Country | Tax-loss carryforwards | Limitation period | Maximum tax credit | Tax credit recognized |
| US tax consolidated group | 1,790 | | No expiry date | 409 | | 376 | |
| Spanish tax consolidated group | 585 | | No expiry date | 146 | | 36 | |
| Netherlands tax consolidated group | 227 | | No expiry date | 59 | | — | |
| UK | 201 | | No expiry date | 50 | | 5 | |
| Canada | 106 | | 2024-2044 | 28 | | 20 | |
| Turkey | 81 | | 2024-2028 | 20 | | — | |
| Other | 559 | | 2024 - No expiry date | 141 | | 36 | |
| Total | 3,549 | | | 853 | | 473 | |
Spanish and US tax-consolidated groups:
For the purpose of assessing the 2024 tax-losses carryforward recoverability in Spain, a model was designed based on the Group companies' latest available earnings projections, which implied the recognition of a provision of EUR 12 million of net operating losses and 10 million of tax credits, bringing the total operating losses to EUR 23 million and EUR 17 million of tax credits as of December 31, 2024.
Regarding US tax group, and in accordance with IAS 12, an amount of tax credits was recognized equal to the excess of liability temporary differences over asset temporary differences, amounting of EUR 8 million of recognition of provision (EUR 26 million of reversal of provision in 2023).
b) Assets arising from temporary differences between accounting and tax criteria
This item reflects the tax effects arising from the different timing of the recognition of certain expenses and income for accounting and tax purposes.
The recognition of an asset means that certain expenses have been recognized for accounting purposes before they may be recognized for tax purposes and therefore the company will recover the income or expense for tax purposes in future years.
The main deferred tax assets are set out below:
•Provisions recognized in the financial statements that do not have tax effects until they are applied (EUR 198 million; EUR 195 million in 2023).
•Deferred tax assets of EUR 238 million due to differences between the tax and accounting approach related to revenue recognition, mainly in the Construction Division (EUR 216 million in 2023).
•Difference between the tax and accounting depreciation/amortization (EUR 16 million; EUR 7 million in 2023).
c) Deferred taxes arising from measurement adjustments recognized in reserves.
The deferred asset balance relates to losses accumulated in reserves that will have a tax effect when they are transferred to the income statement. They mostly relate to deferred tax assets arising from financial derivatives, which amount to EUR 198 million (EUR 48 million in 2023).
Deferred tax liabilities
a) Deferred taxes relating to goodwill
These relate to deferred tax liabilities relating to the tax credit for goodwill amounting to EUR 18 million, which mainly include those related to the amortization of Webber, LLC goodwill (EUR 21 million in 2023).
b) Deferred taxes due to the fair value adjustment to acquisitions
I-66 Mobility Partners
This reflects deferred tax liabilities due to differences between tax and accounting values:
•EUR 270 million at December 31, 2024, recognized due to the difference between tax and accounting values following the acquisition of an additional stake in the I-66 toll road assets on December 17, 2021 (EUR 257 million at December 31, 2023). EUR 36 million recognized as a result of measuring the concession debt at fair value on December 31, 2024 (EUR 35 million at December 31, 2023).
These amounts were recognized in 2021 with a balancing item in goodwill in the same amount, in accordance with IAS 12, paragraph 66.
Dalaman
EUR 31 million recognized as a result of the acquisition of the 60% interest held by the Group in the company, as deferred tax (see Note 1.1.4) in 2024 (EUR 51 million at December 31, 2023).
According to paragraphs 19 and 20 of IAS 12, if in a business combination a balance sheet item is measured at fair value but its tax value does not change, a deferred tax asset or liability must be recognized.
c) Liabilities arising from temporary differences between accounting and tax criteria
A liability represents an expense that is recognized for tax purposes before it may be recognized for accounting purposes, or income recognized in the financial statements before it is declared in the tax return.
Deferred tax liabilities relate essentially to:
•Deferred tax liabilities for differences between tax and accounting amortization (EUR 322 million; EUR 242 million in 2023).
•Deferred tax liabilities of EUR 234 million arising as a result of differences between the tax and accounting methods used to recognize revenue under IFRIC 12, mainly in the Toll Roads Division (EUR 201 million in 2023).
d) Deferred taxes arising from equity measurement adjustments.
The deferred liability balance reflects profits not yet recognized for tax purposes. They relate mostly to deferred tax liabilities arising from financial derivatives, which amount to EUR 234 million. (EUR 69 million in 2023).
e) Deferred tax liabilities relating to dividends pending payment by investees
The Group recognizes EUR 11 million in deferred tax liabilities in relation to withholding tax on the repatriation of future dividends from Canada, as shown on the “Other items” line in the above table (EUR 72 million in 2023).
2.7.4. International Tax Reform - Pillar Two
The Pillar Two regulation provides for an international framework of rules aimed at ensuring that the worldwide profits of multinational groups are subject to tax at a rate not lower than 15% in every jurisdiction in which the groups operate.
The rules have been firstly designed by the Inclusive Framework of the OECD and then implemented in the European Union through the EU Council Directive 2022/2523 of 14 December 2022. In The Netherlands, the Minimum Tax Act 2024, based on the EU Directive, is applicable for reporting years starting on or after 31 December 2023.
In a nutshell, the Pillar Two rules provide that, if in certain jurisdictions where Ferrovial operates the effective tax rate (given by the ratio between adjusted accounting results and adjusted corporate income taxes paid in that jurisdiction) falls below 15%, then Ferrovial would be required to pay an additional tax (so-called top-up tax) to reach the 15% tax rate threshold.
The relevant set of rules also provides for a transition period in which the in-scope multinational groups may avoid undergoing the complex effective tax rate calculation required by the new piece of legislation. In particular, the Pillar Two legislation provides for a transitional safe harbor (“TSH”) that applies for the first three fiscal years following the entry into force of the relevant regulation; the TSH relies on simplified calculations (mainly based on data extracted from the Country-by-Country Reporting) and three kinds of alternative tests, relying on pre-tax income and profits, effective tax rate and routine profits generated in each jurisdiction. Where at least one of the TSH tests is met for a jurisdiction in which Ferrovial operates, the top-up tax due for such jurisdiction will be deemed to be zero.
Ferrovial has estimated its potential exposure to Pillar Two top-up taxes for fiscal year 2024, based on the financial statements at fiscal year-end and taking into consideration the TSH described above.
Based on the estimate performed, four jurisdictions would not benefit from the TSH, namely Canada, The Netherlands, Spain and United States.
With respect to these jurisdictions, Ferrovial has prepared an estimate on the potential top-up tax exposure based on the full Pillar Two regime and the conclusion is that no top-up tax would arise in any of them.
According to the estimate, the effective tax rate in Canada for Pillar Two purposes exceeds the minimum rate of 15% once the dividends excluded under the full regime have been negatively adjusted to the accounting result. The Netherlands shows a loss once the excluded dividends and excluded equity gains have been adjusted. Finally, the income for Pillar Two purposes in Spain and United States, after adjusting excluded dividends, equity gains and reversals of impairment of ownership interests, is below the substance-based income exclusion amount. Therefore, no top-up tax would arise in any of the jurisdictions where Ferrovial operates.
The mentioned estimates are based on a complex regulatory framework and not all relevant data needed to perform the full Pillar Two calculation was available. However, we do not expect the final calculations to deviate significantly.
Finally, starting from 2024, each legal entity of Ferrovial applies the mandatory exception to the recognition and disclosure of deferred tax assets and liabilities relating to Pillar Two income taxes referred to in paragraph 4A of the IAS12.
2.7.5. Years open to tax inspection
In accordance with tax legislation in force, taxes may not be finally settled until the filed returns have been audited by the tax authorities, or until the legally stipulated statute of limitation period has elapsed.
The following inspections are currently in progress, in the jurisdictions indicated:
Spain:
In June 2023 the Spanish Tax Authorities notified the start of a general tax audit for Ferrovial S.E. (successor Company of Ferrovial S.A) and its subsidiaries, including Corporate Income Taxes (CIT) FY 2017-2020, Withholding Taxes FY 2019-2020, and VAT FY 2019-2020. Documentation required is currently being submitted, pending final position adopted by the Tax Authorities.
Canada:
The Canadian tax authorities (CRA) initiated in 2019 a tax audit related to CIT of Cintra 4352238 Investments Inc and Cintra 11200232 Investments Inc for FY 2013 to 2019. The CRA challenged tax deductibility of intragroup charges made by Cintra Servicios de Infraestructuras, S.A. during 2013 to 2016 for the provision of financial services, reclassifying the transaction as dividend for fiscal years 2013 to 2016. The regularization pending of payment for financial services is estimated at EUR 2.2 million (CAD 3.3 million), including the non-deductible expense, withholding tax per Double Taxation Treaty, interest and penalties. The claim in the Canadian courts is held in abeyance until Mutual Agreement Procedure (MAP) initiated is ruled.
Chile:
The start of a tax audit for Berliam SpA has been notified in May 2024, for CIT related to FY2019-2023. Additionally, a Transfer Pricing review for Ferrovial Power Infrastructure Chile SpA has been notified in November 2024 related to FY2021. The required documentation is currently being submitted for both processes, pending positioning adopted by the Tax Authorities.
Saudi Arabia:
The start of a tax audit for Ferrovial Agroman LLC. has been notified in March 2023, for Non-Resident Income Tax related to FY2020. The required documentation is currently being submitted, pending positioning adopted by the Tax Authorities.
India:
The start of a tax audit for CIINFRA India Private Limited has been notified by local Tax Authorities, related to CIT for FY2022-2023. The required documentation is currently being submitted pending positioning adopted by the Tax Authorities.
The companies are subject to a statute of limitations between three and five years in most of the countries in which the Group carry out operations.
In view of the potential different interpretations of tax regulations, any audit that may be undertaken in the future by the tax authorities for the years open to review could give rise to tax liabilities the amount of which cannot currently be objectively quantified. Nonetheless, the likelihood that significant liabilities in addition to those recognized in the Financial Accounts could have a material impact on the Ferrovial Group’s equity is considered as remote
NOTES ON PROFIT/(LOSS) FROM DISCONTINUED OPERATIONS
2.8 PROFIT/(LOSS) FROM DISCONTINUED OPERATIONS
Profit from discontinued operations for 2024, 2023 and 2022 amounted to EUR 14 million, EUR 16 million and EUR 64 million, respectively, relating to the Services Division.
As also explained in Note 1.1.4, the Services Division divestment process was completed in 2022.
During 2024 and 2023, profit from discontinued operations amounted to EUR 14 million and EUR 16 million respectively and relates mainly to the update of the indemnities and earn-outs following the divestment of the Services Business in Spain and Portugal and other adjustments related to the Amey business divestment in the UK.
The main impact recognized in discontinued operations in 2022 relates to the divestment of the Amey business in the UK, completed in December 2022, generating a capital gain of EUR 58 million, including the transfer to the income statement of currency translation differences accumulated in equity (EUR -156 million) and interest rate hedging derivatives (EUR -15 million) (see Note 5.1.1).
For a better understanding of the results of the Services business and the way in which they have been included in the Group’s consolidated results, the accompanying table provides a breakdown by line of profit/(loss) from these discontinued operations in 2024, 2023 and 2022.
| | | | | | | | | | | |
| (Million euro) | 2024 | 2023 | 2022 |
| Revenue | — | — | 2 |
| Operating profit/(loss) | 14 | 28 | 9 |
| Net financial income/(expense) | — | (15) | (1) |
| Share of profits of equity-accounted companies | — | — | 5 |
| Consolidated profit/(loss) before tax | 14 | 13 | 13 |
| Corporate income tax | — | 3 | (10) |
| Profit/(loss) after tax | 14 | 16 | 3 |
| Profit/(loss) for the year attributed to non- controlling interests | — | — | — |
| Profit/(loss) for the year attributed to the parent company | 14 | 16 | 3 |
| Adjustments to discontinued operations | — | — | 61 |
| Profit/(loss) from discontinued operations | 14 | 16 | 64 |
NOTES ON PROFIT/(LOSS) FROM NON-CONTROLLING INTERESTS, NET PROFIT/(LOSS) AND EARNINGS PER SHARE
2.9 PROFIT/(LOSS) FROM NON-CONTROLLING INTERESTS
In 2024, 2023 and 2022 profit/(loss) attributed to non-controlling interests amounted to EUR -251 million, EUR -170 million and EUR -117 million, respectively.
These figures relate to the profits obtained by Group companies attributable to the company’s other shareholders. The positive figures relate to loss-making companies and the negative figures relate to profit-making companies.
| | | | | | | | | | | | | | |
| (Million euro) | 2024 | 2023 | 2022 | NON-GROUP |
| Budimex Group | (77) | | (83) | | (60) | | 49.86 | % |
| Autop.Terrasa Manresa, S.A. | (8) | | (8) | | 19 | | 23.72 | % |
| LBJ Infraestructure Group | (28) | | (20) | | (9) | | 45.40 | % |
| NTE Mobility Partners | (59) | | (60) | | (47) | | 37.03 | % |
| NTE Mobility Partners Segments 3 LLC | (60) | | (41) | | (33) | | 46.33 | % |
| FAM Construction LLC | 9 | | 34 | | 26 | | 30.00 | % |
| D4R7 Construction S.R.O. | 3 | | (1) | | 2 | | 35.00 | % |
| I-77 Mobility Partners | (9) | | (12) | | (6) | | 27.77 | % |
| I-66 Mobility Partners | 3 | | 16 | | 10 | | 44.30 | % |
| Yda Havalimani Yatrim Ve (Dalaman) | (24) | | 7 | | (8) | | 40.00 | % |
| Webber United LLC | — | | 1 | | — | | 40.00 | % |
| Other companies | (2) | | (3) | | (11) | | — | % |
| | | | |
| | | | |
| TOTAL | (251) | | (170) | | (117) | | — | % |
2.10 NET PROFIT/(LOSS) AND EARNINGS PER SHARE
The calculation of earnings per share attributed to the parent company for 2024, 2023 and 2022 is as follows:
| | | | | | | | | | | |
| (Million euro, except otherwise indicated) | 2024 | 2023 | 2022 |
| Net profit/(loss) attributable to ordinary equity holders of the parent: | | | |
| Continuing operations | 3,225 | 325 | 124 |
| Discontinued operations | 14 | 16 | 64 |
| Net cost of subordinated perpetual bond | — | (5) | (8) |
| Profit/(loss) attributable to ordinary equity holders of the parent for basic earnings | 3,239 | 336 | 180 |
| Effects of dilution | — | — | — |
| Profit/(loss) attributable to ordinary equity holders of the parent adjusted for the effect of dilution | 3,239 | 336 | 180 |
| | | |
| Weighted average number of ordinary shares for basic EPS (*) (thousands of shares) | 724,191 | 728,255 | 723,477 |
| Effects of dilution | — | — | — |
| Weighted average number of ordinary shares adjusted for the effect of dilution (thousands of shares) | 724,191 | 728,255 | 723,477 |
| | | |
| Profit/(loss) attributable to ordinary equity holders of the parent from discontinued operations for the basic EPS calculations | 14 | 16 | 64 |
| Effects of dilution | — | — | — |
| Profit/(loss) attributable to ordinary equity holders of the parent from discontinued operations for the diluted EPS calculations | 14 | 16 | 64 |
(*) The weighted average number of ordinary shares takes into account the weighted effect of changes in treasury shares during the year.
Basic earnings per share have been calculated by dividing profit for the year attributed to the parent company's shareholders, adjusted for the net coupon for the year on the subordinated perpetual bonds issued by the Group and taken directly to equity (Note 5.1.2), by the weighted average number of ordinary shares outstanding, excluding the average number of treasury shares held during the year.
As regards diluted earnings per share, it should be noted that the Group did not have any dilutive potential ordinary shares, since no convertible debt instruments were issued and the share-based remuneration schemes will not give rise to any share capital increases in the Group. Consequently, no dilutive impact is envisaged when employee rights under the plans are exercised. Hence there is no difference between basic and diluted earnings per share, as shown in the following table:
| | | | | | | | | | | | | | |
| | 2024 | 2023 | 2022 |
| Net earnings per share attributed to the parent company (in euros) | Diluted | 4.47 | 0.46 | 0.25 |
| Basic | 4.47 | 0.46 | 0.25 |
| Net earnings per share attributed to the parent company, discontinued operations (in euros) | Diluted | 0.02 | 0.02 | 0.09 |
| Basic | 0.02 | 0.02 | 0.09 |
Profit/(loss) per business segment is shown in Note 1.5 for 2024, 2023 and 2022.
CONSOLIDATED FINANCIAL STATEMENTS
FERROVIAL SE AND SUBSIDIARIES
SECTION 3: NON-CURRENT ASSETS AT DECEMBER 31, 2024 AND 2023
This section includes the notes on non-current assets in the balance sheet, excluding deferred tax assets (Section 2) and financial derivatives (Section 5).
The main components of Ferrovial’s non-current assets at December 2024 are “Fixed assets in infrastructure projects” (Note 3.3), amounting to EUR 14,147 million (EUR 13,495 million in 2023), “Investments in Associates” (Note 3.5) totaling EUR 3,023 million (EUR 2,038 million in 2023) relating mainly to the investments in 407 ETR, IRB, Private InvIT and JFK NTO, and “Goodwill on consolidation” (Note 3.1) reaching EUR 500 million (EUR 475 million in 2023).
Investments in infrastructure projects
| | | | | | | | |
INVESTMENTS IN INFRASTRUCTURE PROJECTS
(Million euro) | 2024 | 2023 |
| Opening balance at 01.01 | 13,495 | | 13,667 | |
| Additions | 87 | | 695 | |
| Depreciation | (235) | | (235) | |
| Disposals | (14) | | (4) | |
| Exchange rate effect | 814 | | (374) | |
| Changes in the scope of consolidation and others | — | | (254) | |
| Closing balance at 12.31 | 14,147 | | 13,495 | |
The variation under this heading during 2024 reached EUR 652 million, mainly due to the EUR/US dollar foreign exchange rate effect and the accumulated depreciation. The additions primarily pertain to the ultimate capacity works in North Tarrant Express.
During 2023, the variation was EUR -172 million mainly due to the scope changes following the sale of Euroscut Azores in Portugal for EUR -254 million in May 2023 and the EUR/US dollar foreign exchange rate negative effect (EUR -374 million). The additions pertained primarily to the investments in I-66 and North Tarrant Express Extension.
Investments in Associates
| | | | | | | | |
INVESTMENTS IN ASSOCIATES
(Million euro) | 2024 | 2023 |
| Opening balance at 01.01 | 2,038 | | 1,951 | |
| Share of profit | 238 | | 215 | |
| Exchange rate effect | 60 | | (33) | |
| Dividends | (357) | | (321) | |
| Capital contributions and new investments | 1,192 | | 214 | |
| Other movements | (148) | | 12 | |
| Closing balance at 12.31 | 3,023 | | 2,038 | |
During 2024, investments in associates heading increased by EUR 985 million on the back of the capital contributions in JFK NTO Airport (EUR 469 million), the acquisition of 23.99% of IRB Private InvIT (EUR 710 million) described in Note 1.1.5, and the share of these companies’ profits (EUR 238 million), particularly the 407 ETR's results (EUR 188 million). Also worth mentioning is the effect on other movements of the 5% stake divestment in IRB Infrastructure Developers (EUR -77 million), the availability concession assets sold to Interogo Holding in October 2024 (EUR -70 million), and the sale of 24.78% stake in Grupo Serveo (EUR -21 million), partially offset by the derivatives impact (EUR 20).
During 2023, this caption increased by EUR 87 million due to the capital contributions to JFK NTO Airport (EUR 214 million), and the share of these companies’ profits (EUR 215 million), relating primarily to 407 ETR (EUR 154 million), which was partially offset by dividend distributions during the year, particularly by 407 ETR.
Goodwill
The company recognizes goodwill for the consideration transferred in excess of the fair value of the net assets acquired in the context of business combinations, such as those that involve infrastructure projects.
Regarding the changes in Goodwill, in 2024 there was an increase of EUR 25 million, primarily due to the exchange rate, and in 2023, there was a decrease of EUR -5 million, also as a result of exchange fluctuations.
SECTION 3: NON-CURRENT ASSETS
3.1 GOODWILL AND ACQUISITIONS
Movements in goodwill during 2024 and 2023 are set out below:
| | | | | | | | | | | | | | |
| (Million euro) | BALANCE
AT 12.31. 2023 | Changes in consolidation scope | Exchange rate and others | BALANCE
AT 31.12. 2024 |
| Construction | 135 | | — | | 5 | | 140 | |
| Budimex | 70 | | — | | 1 | | 71 | |
| Webber | 65 | | — | | 4 | | 69 | |
| Toll Roads | 259 | | — | | 17 | | 276 | |
| I-66 Express Mobility Partners Hold. LLC | 259 | | — | | 17 | | 276 | |
| Airports | 27 | | — | | — | | 27 | |
| Dalaman | 27 | | — | | — | | 27 | |
| Energy | 43 | | — | | 3 | | 46 | |
| Power Transmission Serv. Chile | 43 | | — | | 3 | | 46 | |
| Other | 10 | | — | | (1) | | 10 | |
| Mining Services Chile | 10 | | — | | (1) | | 10 | |
| TOTAL | 475 | | — | | 25 | | 500 | |
| | | | | | | | | | | | | | |
| (Million euro) | BALANCE
AT 12.31. 2022 | Changes in consolidation scope and other | Exchange rate | BALANCE
AT 12.31. 2023 |
| Construction | 132 | | — | | 3 | | 135 | |
| Budimex | 65 | | — | | 5 | | 70 | |
| Webber | 67 | | — | | (2) | | 65 | |
| Toll Roads | 265 | | — | | (6) | | 259 | |
| I-66 Express Mobility Partners Hold. LLC | 265 | | — | | (6) | | 259 | |
| Airports | 27 | | — | | — | | 27 | |
| Dalaman | 27 | | — | | — | | 27 | |
| Energy | 45 | | — | | (1) | | 43 | |
| Power Transmission Serv. Chile | 45 | | — | | (1) | | 43 | |
| Other | 11 | | — | | (1) | | 10 | |
| Mining Services Chile | 11 | | — | | (1) | | 10 | |
| TOTAL | 479 | | — | | (5) | | 475 | |
Impairment test
The Group assesses at least twice a year (in June and December) whether there is any indicator that an asset may be impaired and, if so, performs an impairment test in accordance with the applicable accounting standards IAS 36 "Impairment of assets" and IAS 38 "Intangible assets". In addition, the Group also systematically tests its cash-generating units that include goodwill for impairment (in December).
Goodwill recovery is analyzed at the level of each cash generating unit. The projections used in the impairment tests are consistent with the latest business projections presented to the Board and it was concluded that there is no impairment as of December 31, 2024. The impairment test is a process that compares the recoverable amount of the cash generating unit with its carrying amount, including goodwill. In 2024 and 2023 we did not recognize any impairment loss for goodwill. In the explanatory notes we disclose the recoverable amounts and the carrying amounts of the investments for those entities to which goodwill have been tested.
Where a change in a key assumption is deemed to be reasonably possible, the Group will carry out a sensitivity analysis to determine whether additional risk could arise. Additionally, the Group has carried out a sensitivity analysis applying +100bps to the discount rate on each cash generated unit subject to impairment test, presenting headroom against each carrying amount.
A. Construction Division goodwill (Webber and Budimex):
In the case of Webber, in 2024 the goodwill impairment test, based on a 5-year projection, reflects a headroom of 245% with respect to its carrying amount of EUR 395 million (174% and EUR 362 million at December 31, 2023). The cash flows have been discounted at a rate of 8.6% (9.9% before taxes), calculated using the CAPM based on current market input and in line with the method used in prior years.
As Budimex is listed on the Warsaw Stock Exchange and has a free float, we consider the share price to be representative of its value. Therefore, the goodwill was tested for impairment by ascertaining whether Budimex’s closing market price at December 31, 2024 was higher than its carrying amount. Budimex’s share price at December 31, 2024 was 891% higher than its carrying amount of EUR 141 million (1,086% and EUR 156 million at December 31, 2023), so there are no indications of impairment.
B. Toll Roads Division goodwill (I-66):
The I-66 toll road goodwill arose following the acquisition of an additional 5.704% of the concession operator I-66 Express Mobility Partners Hold. LLC in December 2021.The toll road became operational in the last quarter of 2022.
The impairment test considers the whole concession term. As pointed out in Note 1.3.4, traffic estimates are based on internal projections and research (e.g. impact of e-commerce in traffic of heavy vehicles or working from home habits in the use of private vehicles); tariffs used are in line with traffic estimates and contract clauses. The 2024 impairment test reflected a headroom of 13% with respect to the carrying amount of EUR 2,281 million (20% and EUR 1,971 million at December 31, 2023). The cash flows have been discounted at a rate of 8.5% (9.5% before taxes).
A sensitivity analysis based on the assumption of a 5% decline in the toll revenue curve from 2026 onwards shows no risk of impairment.
SECTION 3: NON-CURRENT ASSETS
C. Energy goodwill (Power Transmission Services):
The impairment test of the goodwill uses long-term projections that go beyond one year after the first 20 years of the regulated period, when the concessionaire is remunerated based on the replacement cost of the infrastructure. The result of the impairment test reflects a headroom of 57% with respect to the carrying amount of EUR 38 million at December 31, 2024 (EUR 34 million and 79% in 2023). The cash flows have been discounted at a rate of 9.9% (10.1% before taxes) in 2024.
D. Airports Goodwill (Dalaman):
The 2024 impairment test reflected a headroom of 24% in relation to the carrying amount which was EUR 180 million at December 31, 2024 (26% and EUR 146 million at December 31, 2023). The cash flows have been discounted at a rate of 10.2% (12.7% before taxes).
E.Other businesses goodwill (Mining Services Chile):
Goodwill was also recognized in Mining Services Chile, which is engaged mainly in providing mining industry operation and maintenance services.
The impairment test, based on a 5-year projection, identified a headroom of 141% in relation to the carrying amount, which was EUR 29 million at December 31, 2024 (12% and EUR 16 million at December 31, 2023). The cash flows have been discounted at a rate (WACC) of 14.7% (18.6% before taxes).
3.2. INTANGIBLE ASSETS
At 2024 year-end, the balance of intangible assets, excluding infrastructure project companies, amounted to EUR 128 million (EUR 122 million in 2023). This heading mainly includes:
•“Concession rights”, reflecting rights to operate the concessions that are not classified as Projects (see definition in Note 1.1.2). At December 31, 2024, the carrying amount of EUR 4 million (EUR 3 million at December 31, 2023) relates primarily to the UK Waste Treatment activity.
•“Computer software” with a net value of EUR 30 million (EUR 28 million at December 31, 2023).
•“Other intangible assets”, different from IFRIC 12 intangible rights, amounting to EUR 95 million (EUR 90 million at December 31, 2023), relate essentially to the Budimex services business included in the Construction Division (EUR 22 million), the easements (rights to use the land) of the Chilean power transmission lines amounting to EUR 47 million (EUR 44 million at December 31, 2023), and the EUR 14 million of the acquisition of the solar SPV project in Leon County, Texas.
•No significant fully-depreciated assets were written off during 2024 and 2023.
3.3 INVESTMENTS IN INFRASTRUCTURE PROJECTS
3.3.1 Intangible asset model
| | | | | | | | | | | | | | | | |
| (Million euro) | BALANCE AT 01/01/2024 | TOTAL ADDITIONS | | FOREIGN EXCHANGE EFFECT | | BALANCE AT 12/31/2024 |
| Spanish toll roads | 721 | | 3 | | | — | | | 724 | |
| US toll roads | 12,823 | | 76 | | | 858 | | | 13,757 | |
| Other toll roads | 4 | | — | | | — | | | 4 | |
| Toll road investment | 13,549 | | 79 | | 858 | | | 14,485 | |
| Accumulated depreciation | (834) | | (209) | | | (46) | | | (1,089) | |
| Net investment in toll roads | 12,715 | | (130) | | | 812 | | | 13,396 | |
| Investment in other infrastructure projects | 650 | | — | | | — | | | 650 | |
| Depreciation of other infrastructure projects | (34) | | (24) | | | — | | | (58) | |
| Total net investment in other infrastructure projects | 616 | | (24) | | | — | | | 592 | |
| TOTAL INVESTMENT | 14,199 | | 79 | | 858 | | | 15,135 | |
| TOTAL DEPRECIATION AND PROVISION | (867) | | (233) | | (46) | | | (1,146) | |
| TOTAL NET INVESTMENT | 13,333 | | (154) | | | 812 | | | 13,989 | |
SECTION 3: NON-CURRENT ASSETS
| | | | | | | | | | | | | | | | | | | | |
| (Million euro) | BALANCE AT 01/01/2023 | TOTAL ADDITIONS | TOTAL DISPOSALS | FOREIGN EXCHANGE EFFECT | CONSOLIDATION SCOPE CHANGES AND TRANSFERS | BALANCE AT 12/31/2023 |
| Spanish toll roads | 714 | | 7 | — | | — | | — | | 721 | |
| US toll roads | 12,547 | | 670 | (1) | | (393) | | — | | 12,823 | |
| Other toll roads | 391 | | — | | — | | — | | (387) | | 4 | |
| Toll road investment | 13,653 | | 677 | (1) | | (393) | | (387) | | 13,549 | |
| Accumulated depreciation/amortization | (781) | | (201) | | — | | 16 | | 132 | | (834) | |
| Net investment in toll roads | 12,872 | | 476 | | (1) | | (377) | | (255) | | 12,715 | |
| Investment in other infrastructure projects | 632 | | 18 | | — | | — | | — | | 650 | |
| Depreciation/amortization of other infrastructure projects | — | | (34) | | — | | — | | — | | (34) | |
| Total net investment in other infrastructure projects | 632 | | (16) | | — | | — | | — | | 616 | |
| TOTAL INVESTMENT | 14,285 | | 695 | | (1) | | (393) | | (387) | | 14,199 | |
| TOTAL DEPRECIATION/AMORTIZATION AND PROVISION | (781) | | (235) | | — | | 17 | | 132 | | (867) | |
| TOTAL NET INVESTMENT | 13,504 | | 460 | | (1) | | (376) | | (255) | | 13,333 | |
The most significant changes in 2024 and 2023 were as follows:
◦Toll road additions amounted to a gross EUR 79 million in 2024, mainly related to the North Tarrant Express Extension. These additions reached EUR 677 million in 2023, highlighting the I-66 Express Mobility Partners LLC (EUR 489 million) and the North Tarrant Express Extension (EUR 178 million).
◦Exchange rate fluctuations resulted in a total change of EUR 812 million in 2024 (EUR -376 million in 2023), fully attributed to the appreciation of the US dollar against the euro on the US toll roads (Note 1.4).
◦At December 31, 2024 there were no impact on "consolidation scope changes and transfers", whereas at December 31, 2023, the effect related to the Euroscut Azores toll road divestment (EUR -255 million).
The caption of US toll roads includes the intangible asset related to I-66 Express Mobility Partners, among others, amounting to EUR 6,190 million (EUR 5,925 million in 2023). Investments in other infrastructure projects include the intangible asset of Dalaman airport, amounting to EUR 592 million (EUR 617 million in 2023).
All the concession assets of infrastructure project companies are pledged to secure borrowings (Note 5.2). The capitalization of borrowing costs eligible for capitalization in 2024 and 2023 are described in Note 1.3.3.2 and Note 2.5.
3.3.2 Financial assets from financial asset model concessions
They mainly relate to long-term receivables (more than twelve months) from public administrations in return for services rendered or investments made under concession arrangements, as a result of applying IFRIC 12 financial asset model. Movements during 2024 and 2023 are set out below:
| | | | | | | | |
| (Million euro) | INFRASTRUCTURE PROJECT RECEIVABLES 2024 | INFRASTRUCTURE PROJECT RECEIVABLES 2023 |
| OPENING BALANCE | 162 | | 163 | |
| Additions | 6 | | 9 | |
| Disposals | (14) | | (12) | |
| | |
| Foreign exchange effect | 3 | | 2 | |
| | |
| | |
| YEAR-END BALANCE | 158 | | 162 | |
Note: Balances net of provisionsThe following tables show financial assets by concession operator for 2024 and 2023:
| | | | | | | | | | | |
| BALANCES AT 12/31/2024 |
| CONCESSION OPERATOR (Million euro) | LONG-TERM RECEIVABLES | SHORT-TERM RECEIVABLES | TOTAL |
| Concesionaria de Prisiones Lledoners | 49 | | 3 | | 52 | |
| Depusa Aragón | 21 | | 1 | | 22 | |
| Budimex Parking Wrocław | 11 | | — | | 11 | |
| CONSTRUCTION | 81 | | 4 | | 85 | |
| UK Waste Treatment (Thalia) | 77 | | — | | 77 | |
| UK WASTE TREATMENT | 77 | | — | | 77 | |
| GROUP TOTAL | 158 | | 4 | | 162 | |
SECTION 3: NON-CURRENT ASSETS
| | | | | | | | | | | |
| BALANCES AT 12/31/2023 |
| CONCESSION OPERATOR (Million euro) | LONG-TERM RECEIVABLES | SHORT-TERM RECEIVABLES | TOTAL |
| Concesionaria de Prisiones Lledoners | 52 | | 3 | | 55 | |
| Depusa Aragón | 22 | | 1 | | 23 | |
| Budimex Parking Wrocław | 11 | | — | | 11 | |
| CONSTRUCTION | 85 | | 4 | | 89 | |
| UK Waste Treatment (Thalia) | 77 | | — | | 77 | |
| UK WASTE TREATMENT | 77 | | — | | 77 | |
| GROUP TOTAL | 162 | | 4 | | 166 | |
3.3.3 Cash flow effect
The cash flow effect of project additions primarily accounted for using the intangible asset model amounted to EUR -132 million in 2024 (EUR -248 million in 2023), which differed from the additions recognized in the balance sheet for the following main reasons:
•For projects in which the intangible asset model is applied, due to differences between the accrual basis and cash basis of accounting, as well as capitalized financial costs attributable to projects under construction, which do not give rise to cash outflows.
•For projects in which the financial asset model is applied, due to increases in receivables as a balancing entry for revenue from services rendered, which also do not give rise to cash inflows.
3.4. PROPERTY, PLANT AND EQUIPMENT
Movements under property, plant and equipment in the consolidated statement of financial position for 2024 and 2023 are set out below:
| | | | | | | | | | | | | | |
Movements during
2024 (million euro) | Land and buildings | Plant and machinery | Fixtures, fittings, tooling and furniture | Total |
Investment: Balance at
01.01.2024 | 106 | | 523 | | 495 | | 1,124 | |
| Additions | 75 | | 80 | | 163 | | 318 | |
| Disposals | (3) | | (49) | | (25) | | (77) | |
| Scope changes and transfers | 5 | | 185 | | (207) | | (17) | |
| Foreign exchange effect | 3 | | 16 | | 10 | | 29 | |
| Balances at 12.31.2024 | 186 | | 755 | | 436 | | 1,377 | |
| Accumulated depreciation and impairment losses at 01.01.2024 | (35) | | (323) | | (172) | | (530) | |
| Depreciation charge | (6) | | (104) | | (27) | | (137) | |
| Disposals | 2 | | 66 | | 12 | | 80 | |
| Scope changes and transfers | (2) | | (2) | | (6) | | (10) | |
| Foreign exchange effect | (1) | | (4) | | (3) | | (8) | |
| Balances at 12.31.2024 | (42) | | (367) | | (196) | | (605) | |
Carrying amount at
12.31.2024 | 144 | | 388 | | 240 | | 772 | |
| | | | | | | | | | | | | | |
Movements during
2023 (Million euro) | Land and buildings | Plant and machinery | Fixtures, fittings, tooling and furniture | Total |
Investment: Balance at
01.01.2023 | 94 | | 480 | | 395 | | 969 | |
| Additions | 4 | | 69 | | 142 | | 215 | |
| Disposals | (2) | | (34) | | (27) | | (63) | |
| Scope changes and transfers | 8 | | 3 | | (11) | | — | |
| Foreign exchange effect | 2 | | 5 | | (4) | | 3 | |
| | | | |
| Balances at 12.31.2023 | 106 | | 523 | | 495 | | 1,124 | |
| Accumulated depreciation and impairment losses at 01.01.2023 | (29) | | (297) | | (164) | | (490) | |
| Depreciation charge | (6) | | (48) | | (19) | | (73) | |
| Disposals | — | | 18 | | 14 | | 32 | |
| Scope changes and transfers | 1 | | 7 | | (5) | | 3 | |
| Foreign exchange effect | (1) | | (3) | | 1 | | (3) | |
| Impairment of property, plant and equipment | — | | — | | 1 | | 1 | |
| | | | |
| Balances at 12.31.2023 | (35) | | (323) | | (172) | | (530) | |
Carrying amount at
12.31.2023 | 71 | | 200 | | 323 | | 594 | |
Significant changes in 2024 and 2023 by business division were as follows:
SECTION 3: NON-CURRENT ASSETS
Additions:
| | | | | | | | |
| (Million euro) | 2024 | 2023 |
| Construction | 117 | | 103 | |
| Energy | 107 | | 102 | |
| Other businesses | 94 | | 10 | |
| TOTAL | 318 | | 215 | |
In 2024, additions mainly correspond to the Construction Division (EUR 117 million) due to the acquisition of machinery and other equipment, and to the Energy Division (EUR 107 million), particularly Misae Solar IV project in the United States, a solar SPV project (257MW) in Leon County, Texas, where the company will perform the design, construction and plant operation, the construction of the Centella project electricity transmission infrastructure in Chile, and a solar plant of 60MW in Poland. Finally, the main additions in other businesses relate to the purchase of a plot of land in Spain for data center development.
In 2023, additions totaled EUR 215 million, the most significant relating to the Construction Division (EUR 103 million) due to the acquisition of machinery and other equipment, and to the Energy Division (EUR 102 million), arising primarily from the construction of the Centella project electricity transmission infrastructure in Chile.
Cash flow effect:
The 2024 impact on cash flows arising from additions to property, plant and equipment amounted to EUR -282 million (EUR -158 million in 2023), primarily related to the Construction and Energy Divisions.
Disposals due to sales or retirement:
As of December 31, 2024, disposals due to sales or retirement amount to EUR 77 million (EUR 63 million in 2023) and approximately EUR 64 million of this amount (EUR 52 million in 2023) relates to Construction, mainly plant, machinery and other equipment.
Other disclosures relating to property, plant and equipment:
The Group has taken out insurance policies to cover the possible risks to which its property, plant and equipment are subject and any claims that may be brought in the course of business. These policies are considered to provide sufficient coverage for the related risks.
The transfer to held for sale as of December 2024 amounts to 39 and is included as Scope changes and transfers in 2024.
Property, plant and equipment under construction totaled EUR 144 million in 2024 (EUR 191 million in 2023).
At December 31, 2024 and 2023, no significant property, plant or equipment were subject to ownership restrictions or pledged as collateral for liabilities.
3.5 INVESTMENTS IN ASSOCIATES
Due to their significance, the investments in 407 ETR (43.23%), IRB (19.86%), Private InvIT (23.99%) and JFK NTO (49%) are presented separately. The following tables show the main items that explain the variation in these investments.
| | | | | | | | | | | | | | | | | | | | |
| 2024 (Million euro) | 407 ETR (43.23%) | IRB (19.86%) | Private InvIT (23.99%) | JFK (49%) | OTHER | TOTAL |
| Balance at 12.31.23 | 928 | | 376 | | — | | 471 | | 263 | | 2,038 | |
| Capital contribution | — | | — | | 710 | | 469 | | 13 | | 1,192 | |
| Share of profit/(loss) | 188 | | 13 | | (8) | | 3 | | 42 | | 238 | |
| Dividends | (321) | | (6) | | (4) | | — | | (26) | | (357) | |
| Foreign exchange differences | (17) | | 16 | | 6 | | 54 | | 1 | | 60 | |
| Derivatives | — | | (4) | | — | | 9 | | 15 | | 20 | |
| Other | — | | (80) | | — | | — | | (88) | | (168) | |
| Balance at 12.31.24 | 778 | | 315 | | 704 | | 1,006 | | 220 | | 3,023 | |
| | | | | | | | | | | | | | | | | | | | | | | |
| 2023 (Million euro) | HAH (25%) | 407 ETR (43,23%) | AGS (50%) | IRB (24,86%) | JFK (49%) | OTHER | TOTAL |
| Balance at 12.31.22 | — | | 1,063 | | — | | 377 | | 235 | | 276 | | 1,951 | |
| Capital contributions | — | | — | | — | | — | | 214 | | — | | 214 | |
| Share of profit/(loss) | — | | 154 | | — | | 14 | | 4 | | 43 | | 215 | |
| Dividends | — | | (281) | | — | | (1) | | — | | (39) | | (321) | |
| Foreign exchange differences | — | | (8) | | — | | (14) | | (12) | | 1 | | (33) | |
| Derivatives | — | | — | | — | | 1 | | 31 | | (15) | | 17 | |
| Other | — | | — | | — | | (1) | | (1) | | (3) | | (5) | |
| Balance at 12.31.23 | — | | 928 | | — | | 376 | | 471 | | 263 | | 2,038 | |
During 2024, investment in associates heading increased by EUR 985 million on the back of the capital contributions in JFK NTO Airport (EUR 469 million), the acquisition of 23.99% of IRB Private InvIT (EUR 710 million) described in Note 1.1.5, and the share of these companies’ profits (EUR 238 million), highlighting the 407 ETR results (EUR 188 million). Also worth mentioning the effect in other movements are mainly related to the 5%
SECTION 3: NON-CURRENT ASSETS
stake divestment in IRB Infrastructure Developers (EUR -77 million) and the availability concession assets sold to Interogo Holding in October 2024 (Note 1.1.5).
3.5.1. Heathrow Airports Holdings (HAH) divestment
As mentioned in Note 1.1.5, on December 12, 2024, following satisfaction of applicable regulatory conditions, Ferrovial completed the sale of 19.75% of the share capital of FGP Topco Ltd., which is the direct shareholder of Heathrow Airports Holdings Limited (HAH), the owner of Heathrow Airport in London (UK), to Ardian and the Public Investment Fund (PIF), with a capital gain of EUR 2,023 million, reported in the income statement within the line item “Impairment and disposal of fixed assets” (Note 2.4) - the ownership interest in this company was valued at zero, due to the fact that losses generated in previous years brought equity attributable to Ferrovial below zero.
As a result, Ferrovial now holds 5.25% stake, which is recognized as a non-current financial asset at fair value through profit or loss (Note 3.6.), once concluded that according to IAS28 p.5-6, Ferrovial will no longer exercise significant influence in FGP Topco Ltd., despite having the right to nominate a board member together with other shareholders, as the group will have no participation in the policy-making processes of the asset, neither participation in decisions related to dividend distributions. The fair value of the remaining stake has been determined by referencing the selling price of the recently 19.75% stake divested in FGP Topco Ltd., generating an additional positive impact of EUR 547 million.
Finally, on January 26, 2025, Ferrovial announced that a binding agreement has been reached with Ardian for the sale of its entire remaining stake (5.25%) in FGP Topco Ltd. (Topco), parent company of Heathrow Airport Holdings Ltd., for c. GBP 455 million (current book value of the asset), which will be adjusted with an interest rate to be applied until closing (Note 6.11). The transaction is subject to complying with the right of first offer (ROFO) which may be exercised by Topco shareholders pursuant to the Shareholders’ Agreement and the Articles of Association of the company. Full completion of the acquisition under the agreement is also subject to the satisfaction of applicable regulatory conditions.
3.5.2. Disclosures relating to 407 ETR
a.Balance sheet and income statement movements 2024- 2023
These figures reflect the company´s full balances and are presented in millions of Canadian dollars (details of the exchange rate used in 2024 for the balance sheet and the income statement figures are provided in Note 1.4.).
Balance sheet December 2024 and December 2023
| | | | | | | | | | | |
| 407 ETR (100%) (million CAD) | Dec. 2024 | Dec. 2023 | Var. 24/23 |
| Non-current assets | 4,594 | | 4,584 | | 10 | |
| Fixed assets in infrastructure projects | 3,921 | | 3,954 | | (33) | |
| Non-current financial assets | 611 | | 568 | | 43 | |
| Deferred taxes | 62 | | 62 | | — | |
| Current assets | 1,163 | | 1,014 | | 149 | |
| Short-term trade and other receivables | 443 | | 322 | | 121 | |
| Cash and cash equivalents | 720 | | 691 | | 29 | |
| Total assets | 5,757 | | 5,598 | | 159 | |
| Equity | (6,199) | | (5,791) | | (408) | |
| Non-current liabilities | 11,309 | | 10,908 | | 401 | |
| Borrowings | 10,716 | | 10,318 | | 398 | |
| Deferred taxes | 593 | | 590 | | 3 | |
| Current liabilities | 647 | | 481 | | 166 | |
| Borrowings | 514 | | 403 | | 111 | |
| Short-term trade and other payables | 133 | | 77 | | 56 | |
| Total liabilities | 5,757 | | 5,598 | | 159 | |
There follows a description of the main movements in 407 ETR’s balance sheet at December 31, 2024 compared to the previous year:
Equity
Equity fell by CAD 409 million with respect to the previous year, primarily due to the payment of CAD 1,100 million in dividends to shareholders, which was offset by the profit for the year of CAD 692 million.
The 43.23% of the subsidiary’s shareholders’ funds does not reflect the consolidated carrying amount of the ownership interest, since the latter also includes the amount of the fair value remeasurement of the investment retained, following the divestment of a 10% ownership interest in this company in 2010, recognized as an increase in the investment’s value.
Borrowings
Overall financial debt (short and long term) increased in relation to December 2023 by CAD 509 million due to issuance of new senior debt.
SECTION 3: NON-CURRENT ASSETS
Income statement December 2024 - December 2022
The following table shows movements in 407 ETR’s income statement during the financial years ended December 2024, December 2023 and December 2022:
| | | | | | | | | | | | | |
| 407 ETR (100%) (million CAD) | Dec.24 | Dec.23 | | Dec.22 | |
| Operating income | 1,705 | 1,495 | | 1,327 | |
| Operating expenses | (228) | (212) | | (188) | |
| | | | | |
| Fixed asset depreciation | (106) | (97) | | (100) | |
| Operating profit/(loss) | 1,372 | 1,187 | | 1,039 | |
| Net financial income/(expense) | (429) | (412) | | (447) | |
| Profit/(loss) before tax | 942 | 775 | | 592 | |
| Corporate income tax | (250) | (208) | | (156) | |
| Net profit/(loss) | 692 | 567 | | 435 | |
| Profit/(loss) attributable to Ferrovial (million CAD) | 299 | 245 | | 188 | |
| Intangible asset amortization adjustment (CAD million) | (21) | (21) | | (19) | |
| Adjusted net profit/(loss) attributable to Ferrovial (43.23%) (million CAD) | 278 | 225 | | 169 | |
| Adjusted net profit/(loss) attributable to Ferrovial (43.23%) (million euro) | 188 | 154 | | 124 | |
It should be noted that the profit/(loss) attributable to Ferrovial also includes depreciation recognized over the concession term on the remeasurement recognized, following the loss of control of the company as a result of the above mentioned 2010 sale.
3.5.3 Disclosures relating to JFK NTO LLC
The agreement whereby Ferrovial invested in the capital of JFK NTO LLC, which will remodel, build, finance, operate and maintain the facilities of the new terminal one at New York’s John F. Kennedy International (JFK) Airport, came into effect on June 10, 2022. Ferrovial holds a 49% indirect ownership interest in the project.
As also commented in that note, Ferrovial agreed with the Carlyle Group to pay of an earn-out should Carlyle divest its outstanding 4% interest in Mars NTO LLC. This earn-out payment would be triggered if Carlyle were to transfer its stake either to a third party or to Ferrovial. This payment depends on the value creation by the project. An estimation of the earn-out payment was included in our valuation of the investment as presented in the audited financial statements. Any future changes in the valuation of the earn-out may affect our results.
The shareholders made a commitment to inject share capital of USD 2,330 million, of which Ferrovial will contribute USD 1,142 million. At December 31, 2024, USD 1,635 million had been invested (USD 801 million relates to Ferrovial, of which USD 507 million (EUR 469 million) was invested in 2024)).
In 2025 and beyond, total dividend payments will largely depend on traffic performance at Dalaman, as well as at NTO, following the opening of the terminal, which is expected for 2026.
The company's consolidated IFRS balance sheet is disclosed in the table below:
Balance sheet December 2024 and 2023
| | | | | | | | |
| JFK (100%) Million USD | Dec. 2024 | Dec. 2023 |
| Non-current assets | 8,330 | 6,482 |
| Intangible assets | 8,067 | 6,168 |
| Non-current financial assets | 180 | 132 |
| Long-term financial derivatives at fair value | 83 | 182 |
| Current assets | 2,510 | 322 |
| Debtors and other short-term accounts receivable | 275 | 174 |
| Cash and cash equivalents | 251 | 148 |
| Other short-term financial assets | 1,984 | — |
| Total assets | 10,840 | 6,804 |
| Equity | 1,994 | 932 |
| Share capital | 1,635 | 600 |
| Share of profit/(loss) | 40 | 11 |
| Other Comprehensive Income | 319 | 321 |
| Non-current liabilities | 8,504 | 5,559 |
| Bonds and debts - infrastructure projects | 4,654 | 1,774 |
| Other long-term debts | 3,850 | 3,785 |
| | |
| Current liabilities | 342 | 313 |
| | |
| Creditors and other short-term accounts payables | 342 | 313 |
| Total liabilities | 10,840 | 6,804 |
JFK NTO's main assets and liabilities are described below:
•Intangible assets, which fundamentally comprise:
–Concession assets (USD 3,971 million in 2024 and USD 2,247 million in 2023), including all the expenses necessary to obtain the concession contract, as well as the project’s construction and development costs.
SECTION 3: NON-CURRENT ASSETS
–Payments to the Port Authority (USD 4,096 million in 2024 and USD 3,921 million in 2023), reflecting the present value of the future payments, throughout the concession period, for the acquisition of the concession. Also, a liability of the same amount was initially recorded, corresponding to the value of the future payment obligations, under financial debt in non-current liabilities (“Other long-term debts”).
•Long-term borrowings (USD 4,600 million in 2024 and USD 1,740 million in 2023) explained mainly by:
–USD 2,000 million nominal amount of Munibonds issued on December 6, 2023. A portion of the issuance (USD 800 million) was insured by Assured Guaranty Municipal Corp. (“AGM”).
–USD 2,550 million nominal amount of green bonds issued on June 18, 2024. A portion of the issuance (USD 800 million) was insured by Assured Guaranty Municipal Corp. (“AGM”). The transaction achieved an all-in true interest cost of 4.65% at a weighted average maturity of 30 years.
•Other short-term financial assets (USD 1,984 million in 2024) correspond to treasury bills, treasury notes and state and local government securities, aligned with NTO reinvestment strategy, derived from the cash obtained from the bond issuance before mentioned.
•In addition, JFK NTO has contracted interest rate swaps (IRS) associated with the project's bank borrowings and future debt issuances, for a notional amount of USD 645 million (USD 3,005 million in 2023), which have been treated as effective cash flow hedges. During the year, there was an impact of USD 20 million on the company's reserves (EUR 9 million at Ferrovial's ownership interest).
•Equity (USD 1,994 million in 2024 and USD 932 million in 2023). Movements in equity are primarily explained by capital contributions under this same heading in the amount of USD 1,035 million and USD 20 million reflecting the effect on reserves of the change in market value of the derivative associated with current debt since the acquisition date.
3.5.4 Disclosures relating to AGS
On November 13, 2024, Ferrovial announced that an agreement had been reached with Avialliance UK Limited for the sale of its entire stake in AGS (50%). As part of the same transaction, Macquarie also agreed to sell its entire stake (50%) in AGS to the same purchaser. The completion of this transaction was subject to the obtainment of applicable regulatory approvals by the 2024 year-end, and the 50% ownership interest in AGS Airports Holdings Limited as of December 31, 2024 was therefore reclassified to held for sale. The ownership interest in this company remained valued at zero, due to the fact that losses generated in previous years brought equity attributable to Ferrovial below zero (Note 1.1.4 and Note 6.11.).
As disclosed in Note 3.6. of these consolidated financial statements, the group granted subordinated loans to AGS totaling EUR 235 million, that after the agreement reached in November, have been reclassified from long-term financial assets to short-term receivables at December 2024, as these loans are also part of the divestment transaction.
On January 28, 2025, and following satisfaction of applicable regulatory conditions, Ferrovial and Macquarie completed the sale of AGS' entire share capital (100%) for a price of GBP 900 million, of which circa GBP 450 million are Ferrovial's net proceeds, together with a capital gain of EUR 297 million for Ferrovial which will affect Q1 2025 results.
3.5.5. Disclosures relating to IRB
As indicated in Ferrovial’s 2021 consolidated financial statements, the Group (through Cintra) acquired a 24.86% stake in the Indian listed company IRB Infrastructure Developers Ltd (IRB) on December 29, 2021. The deal was completed following a preferential share issue by IRB Infrastructure Developers. The amount paid totaled EUR 369 million. The transaction price was set in accordance with applicable legislation, taking into account the average price weighted by the trading volume for the two-week period prior to the year-end.
The price of IRB’s stock at December 31, 2024 was INR (Indian Rupee) 57.24 per share (41.55 at December 31, 2023).
The company's fiscal year runs from April through March. IRB’s latest available audited financial statements are those of March 2024. IRB contributed a profit of EUR 13 million to Ferrovial for the period from January to December 2024.
On June 11, 2024, Ferrovial, through its subsidiary Cintra, completed the sale of its 5% stake in IRB for EUR 215 million (assuming a EUR/INR exchange rate of 89.3), resulting in a capital gain before taxes of EUR 133 million (Note 1.1.5).
IRB only reports to the market its consolidated balance sheet at March and September month-end. This balance sheet below for December 2024 is based on the balance sheet reported by IRB for September 2024, adjusted by (i) the distributions to unit holders and results reported by IRB for the last quarter of 2024 excluding the impact of measuring at fair value through profit and loss account some investments that Ferrovial maintains as equity investments, and (ii) Ferrovial´s purchase price allocation adjustments.
| | | | | | | | |
| IRB (100%) Million INR | Dec.24 | Dec.23 |
| Non-current assets | 405,626 | | 388,946 | |
| | |
| | |
| | |
| | |
| | |
| Current assets | 46,158 | | 55,742 | |
| | |
| | |
| | |
| Total assets | 451,784 | | 444,688 | |
| Equity | 141,663 | | 139,195 | |
| | |
| | |
| | |
| | |
| Non-current liabilities | 273,464 | | 238,920 | |
| | |
| | |
| | |
| Current liabilities | 36,657 | | 66,573 | |
| | |
| | |
| | |
| Total liabilities | 451,784 | | 444,688 | |
| | |
| Group´s share in equity (19.86% and 24.86% post and pre-sale, respectively) | 28,141 | | 34,611 | |
| Group´s share in equity (Million EUR) | 315 | | 376 | |
The following table illustrates the summarized income statement as reported by IRB, excluding the impact of measuring at fair value through profit and loss account some investments that Ferrovial maintains as equity investments, and adjusted by Ferrovial´s purchase price allocation adjustments:
SECTION 3: NON-CURRENT ASSETS
| | | | | | | | | |
| IRB (100%) Million INR | Dec.24 | Dec.23 | |
| Revenue | 72,806 | | 69,677 | | |
| Profit for the year (continuing operations) | 5,096 | | 5,205 | | |
| Other comprehensive income | (1,440) | | 407 | | |
| Total comprehensive income | 3,656 | | 5,612 | | |
| | | |
| Group´s share in profits (19.86% and 24.86% post and pre-sale, respectively) | 1,534 | | 1,294 | | |
| Group´s share in profits (Million EUR) | 13 | | 14 | | |
3.5.6. IRB Infrastructure Trust (Private InvIT)
On June 13, 2024, Ferrovial, through its toll road subsidiary Cintra, acquired a 23.99% stake in IRB Infrastructure Trust (Private InvIT), a subsidiary of IRB Infrastructure Developers (IRB), in which Ferrovial holds a 19.86% ownership interest as mentioned previously. Private InvIT held a portfolio of 14 toll road concessions in India with a committed pipeline of one additional concession. This investment amounted to EUR 652 million (considering an exchange rate of 90.2 EUR/INR).
Ferrovial acquired this stake from affiliates of GIC Private Limited, which prior to this transaction owned a 49% stake in the company. After the transaction, GIC’s affiliates retain a 25% stake in Private InvIT and IRB retains its current 51% stake. Considering the indirect ownership interest which Ferrovial holds through the 19.86% stake in IRB, Ferrovial retains a total stake in Private InvIT of 34.1%.
On December 20, Private InvIT raised unit capital by way of rights issue of units of Private InvIT to IRB Infrastructure Developers (IRB) and GIC Affiliates. Post right issue, Ferrovial acquired 23.99% of these rights issued, increasing its investment in Private InvIT by EUR 58 million (considering an exchange rate of 87.83 EUR/INR), and maintaining its stake in a 23.99%. On December 27, Private InvIT acquired 80.4% of Ganga, the above-mentioned additional concession.
IRB Private InvIT contributed a loss of EUR -8 million to Ferrovial for the period from June to December 2024.
Regarding the purchase price allocation exercise (see Note 1.1.5.), the difference between the net fair value of the identifiable assets and liabilities of Private InvIT and its carrying amount as at the date of acquisition (EUR 300 million at Ferrovial's stake) was fundamentally allocated to the value of the toll concession rights, as the book value of the rest of net assets is not significantly different to their fair value. According to IAS 12, paragraph 66, the deferred tax liability resulting from this fair value adjustment to the intangible asset (EUR 90 million for Ferrovial’s stake) affects the goodwill implicit in the carrying amount of the investment.
The consolidated IFRS balance sheet integrated by Ferrovial of Private InvIT is summarized in the table below.
Private InvIT only reports to the market its consolidated balance sheet at March and September month-end. This balance sheet below for December 2024 is based on the balance sheet reported by Private InvIT for September 2024, adjusted by (i) the distributions to unit holders and results reported by Private InvIT for the last quarter of 2024, and (ii) Ferrovial´s purchase price allocation adjustments. The acquisition of 80.4% of Ganga project is not included in these figures as there is no available balance sheet detailed information.
| | | | | | | | |
| Private InvIT (100%) Million INR | Dec.24 | Fair Value recognized on acquisition
Jun.24 |
| Non-current assets | 536,192 | | 537,578 | |
| | |
| | |
| | |
| | |
| | |
| Current assets | 15,719 | | 13,799 | |
| | |
| | |
| | |
| Total assets | 551,911 | | 551,377 | |
| Equity | 240,784 | | 245,257 | |
| | |
| | |
| | |
| | |
| Non-current liabilities | 297,474 | | 294,852 | |
| | |
| | |
| | |
| Current liabilities | 13,653 | | 11,268 | |
| | |
| | |
| | |
| Total liabilities | 551,911 | | 551,377 | |
| | |
| Group´s share in equity (23.99%) | 57,769 | | 58,842 | |
| Group´s share in equity (23.99%) Million EUR | 646 | | 652 | |
| Ganga Acquisition (Million EUR) | 58 | | — | |
| Group´s share in equity including Ganga acquisition (23.99%) Million EUR | 704 | | 652 | |
The following table illustrates the summarized income statement for the 6 month-period from the acquisition to December 31, 2024 as reported by Private InvIT, and adjusted by Ferrovial´s purchase price allocation adjustments:
| | | | | | |
| Private InvIT (100%) Million INR | Dec.24 | |
| Revenue | 22,040 | | |
| Profit for the year (continuing operations) | (3,131) | | |
| Total comprehensive income | (3,131) | | |
| | |
| Group´s share in loss (23.99%) | (751) | | |
| Group´s share in loss (23.99%) Million EUR | (8) | | |
3.5.7. Other disclosures relating to associates
a) Movements relating to the remaining associates
Appendix I to the 2024 consolidated financial statements includes a list of ownership interests in equity-accounted companies, including names, countries of incorporation, business segments, shareholding percentages, aggregate assets and liabilities, revenue and profit/(loss) for the year.
SECTION 3: NON-CURRENT ASSETS
A summary is presented in the following table:
| | | | | | | | |
| Million euro | 2024 | 2023 |
| Madrid Calle 30 | 56 | 52 |
| Riverlinx Limited – Silvertown Tunnel | 65 | 52 |
| Netflow OSARS (Western) | 38 | 42 |
| Ruta del Cacao | 27 | 22 |
| FMM Company LLC | 18 | 19 |
| Other | 16 | 76 |
| Balance at 12.31.2024 | 220 | 263 |
The main movement in relation to the remaining associates corresponds to the divestment of several availability concession assets in the Toll Roads Division. As mentioned in Note 1.1.5, in October 2024, Ferrovial and Interogo Holding, via its infrastructure investment fund Inter Infrastructure Capital (IIC), created the company Umbrella Roads BV to manage Ferrovial’s stakes in several road and parking concessions in Spain, Scotland, Ireland and Canada.
Ferrovial transferred 100% of the economic rights and holds the majority of the voting rights (51%) in Umbrella Roads BV through its toll roads division Cintra. After the analysis performed by the company of this transaction and the share purchase agreements, it was concluded that Ferrovial has no control over these assets according to IFRS 10, p. 7 criteria, nor significant influence under IAS 28, which entails recognizing a capital gain of EUR 19 million, reported in the income statement within the line item “Impairment and disposal of fixed assets” (transaction price of EUR 100 million). The partnership between Ferrovial and Interogo Holding could allow for further collaboration between the parties in future.
b) Other information
There are no significant restrictions on the capacity of associates to transfer funds to the parent company in the form of dividends, debt repayments or advances, other than such restrictions as might arise from the financing agreements of those associates or from their own financial position, and there are no contingent liabilities relating to associates that might ultimately be assumed by the Group.
There are no significant companies in which the ownership interest exceeds 20% that are not equity-accounted.
The guarantees provided by Group companies to equity-accounted companies are described in Note 6.5.2.
3.6 NON-CURRENT FINANCIAL ASSETS
Set out below is a breakdown of movements at December 31, 2024 and December 31, 2023:
| | | | | | | | | | | | | | | | | | | | |
| MOVEMENTS (Million euro) | LONG- TERM LOANS TO ASSOCIATES | RESTRICTED CASH FROM INFRASTRUCTURE PROJECT COMPANIES AND OTHER FINANCIAL ASSETS | FINANCIAL INVESTMENTS CARRIED AT FAIR VALUE | LOANS ASSOCIATED WITH DIVESTMENT TRANSACTIONS | OTHER LONG- TERM RECEIVABLES | TOTAL |
| BALANCE AT 31/12/2022 | 247 | 597 | 35 | 189 | 27 | 1,095 |
| Additions | 40 | 432 | 9 | 10 | 6 | 497 |
| Disposals | (37) | (381) | — | — | (5) | (423) |
| Transfers and other | — | — | 1 | (13) | — | (12) |
| Foreign exchange | 12 | (20) | — | — | (1) | (9) |
| BALANCE AT 31/12/2023 | 262 | 628 | 45 | 186 | 27 | 1,148 |
| Additions | 113 | 18 | 566 | 1 | 32 | 730 |
| Disposals | (3) | (275) | (2) | (176) | (33) | (489) |
| Transfers and other | (273) | | (1) | (13) | — | (287) |
| Foreign exchange | 1 | 30 | 2 | 2 | 2 | 37 |
| BALANCE AT 31/12/2024 | 100 | 401 | 610 | — | 28 | 1,139 |
Note: Balances net of provisionsLong-term loans to associates
The main movement under this heading during 2024, disclosed in the line item "Transfer and others", corresponds to the reclassification from long-term financial assets to short-term receivables of the subordinated loans granted to AGS (GBP 195 million; EUR 235 million), derived from the divestment agreement reached with Avialliance UK Limited for the sale of Ferrovial's entire stake in this asset (Note 1.1.4.), finally completed on January 28, 2025. Also noteworthy, is the effect of the 24.78% stake divested in Grupo Serveo (EUR -18 million) and the divestment of the Toll Roads concession assets (EUR -18 million).
Additionally, it is worth mentioning the subordinated debt loan granted to Concesionaria Ruta del Cacao, S.A.S., in the amount of EUR 68 million.
Restricted cash from infrastructure project companies
The item “Restricted cash from infrastructure project companies and other financial assets” (EUR 401 million) relates primarily to the NTE Mobility Partners toll road (EUR 281 million) and the I-66 Express Mobility Partners toll road (EUR 57 million). During 2024, the main movement corresponds to the I-77 Mobility Partners toll road's restricted cash released due to its refinancing transaction (EUR -99 million), and to I-66 Mobility Partners (EUR -77 million) and NTE Mobility Partners (EUR -51 million).
SECTION 3: NON-CURRENT ASSETS
Financial investment recognized at fair value
The main movement in this item, EUR 566 million in Additions, relates to the sale of the 19.75% stake in Heathrow Airport Holdings Limited (HAH) (Note 1.1.5), which implies that, after the divestment, Ferrovial now holds shares representing 5.25% of share capital, recognized as a financial assets at fair value through the profit or loss, once concluded that according to IAS28 p.5-6, Ferrovial will no longer exercise significant influence in FGP Topco Ltd., despite having the right to nominate a board member together with other shareholders, as the group will have no participation in the policy-making processes of the asset, neither participation in decisions related to dividend distributions. The fair value of the remaining stake has been determined by referencing the selling price of the recently 19.75% stake divested in FGP Topco Ltd., generating an additional positive impact of EUR 547 million (Note 3.5.1.).
Loans associated with divestment transactions
This item mainly relates to the deferred payments collected during 2024 in relation to the Amey business divestment in the United Kingdom, relating to full life-cycle engineering and infrastructure upkeep and maintenance services (EUR 176 million), as mentioned in Note 1.1.4.
Additionally, the energy and water infrastructure maintenance services business was sold to the British fund Rubicon in 2023 for GBP 18 million (EUR 20 million). Based on the agreed repayment schedule, the remaining amount has been reclassified to the short-term (EUR 13 million).
Other long-term receivables
This item primarily relates to other equity and long term loans, bonds, or deposits. The interest in investment funds relates to the Credit Suisse (Lux) Supply Chain Finance Fund, which made an investment in supplier invoices insured by companies with an investment grade rating (average of AA-) that was already recovered during the year (EUR -18 million impact in 2024).
This heading also includes other trade receivables, mainly from various public authorities under long-term contracts, primarily relating to companies in the Construction and Toll Roads Divisions.
3.7 RIGHT-OF-USE ASSETS AND ASSOCIATED LIABILITIES
Set out below are movements in right-of-use assets in the balance sheet:
| | | | | | | | | | | | | | | | | | | | |
MOVEMENTS (Million euro) | LAND | BUILDINGS | VEHICLES | PLANT AND MACHINERY | OFFICE EQUIPMENT AND OTHER | TOTAL |
| BALANCE AT 12/31/2022 | 13 | | 77 | | 61 | | 29 | | 3 | | 183 | |
| Additions | 2 | | 16 | | 34 | | 30 | | 5 | | 87 | |
| Disposals | 2 | | 3 | | 1 | | (2) | | (1) | | 3 | |
| Transfers and other | (2) | | 6 | | — | | (2) | | — | | 2 | |
| Depreciation/amortization | (1) | | (15) | | (27) | | (20) | | (2) | | (65) | |
| Scope changes | (2) | | (4) | | (5) | | (1) | | — | | (12) | |
| Foreign exchange effect | — | | — | | (1) | | (1) | | — | | (2) | |
| BALANCE AT 12/31/2023 | 12 | | 83 | | 63 | | 33 | | 5 | | 196 | |
| Additions | 26 | | 25 | | 61 | | 27 | | 4 | | 143 | |
| Disposals | — | | (7) | | (4) | | (6) | | — | | (17) | |
| Transfers and other | — | | 1 | | 1 | | 4 | | (1) | | 5 | |
| Depreciation/amortization | (4) | | (24) | | (41) | | (20) | | (4) | | (93) | |
| Scope changes | (3) | | — | | — | | — | | — | | (3) | |
| Foreign exchange effect | 1 | | 2 | | 3 | | 1 | | — | | 7 | |
| BALANCE AT 12/31/2024 | 32 | | 80 | | 83 | | 39 | | 4 | | 238 | |
The most significant variations under this heading relate to additions totaling EUR 143 million (EUR 87 million in 2023), of which EUR 109 million (EUR 72 million in 2023) correspond to the Construction Division leases.
Movements in lease liabilities are set out below:
| | | | | |
| LEASE LIABILITIES |
| BALANCE AT 12/31/2022 | 184 | |
| Additions under new leases | 97 | |
| Associated financial expenses | 14 | |
| Payments | (87) | |
| Foreign exchange effect | (1) | |
| Consolidation scope changes and other | (7) | |
| BALANCE AT 12/31/2023 | 200 | |
| Additions under new leases | 143 | |
| Associated financial expenses | 12 | |
| Payments | (104) | |
| Foreign exchange effect | 7 | |
| Consolidation scope changes and other | (13) | |
| BALANCE AT 12/31/2024 | 245 | |
| Short-term lease liabilities 2024 | 80 | |
| Long-term lease liabilities 2024 | 165 | |
SECTION 3: NON-CURRENT ASSETS
Set out below are future maturities of lease liabilities in each business area at December 31, 2024:
| | | | | | | | | | | | | | | | | | | | | | | |
| 2025 | 2026 | 2027 | 2028 | 2029 | 2030 and beyond | TOTAL |
| Corporation | 3 | | 3 | | 3 | | 3 | | 3 | | 11 | | 26 | |
| Construction | 68 | | 44 | | 27 | | 14 | | 8 | | 24 | | 185 | |
| Toll Roads | 2 | | 2 | | — | | — | | — | | — | | 4 | |
| Other | 7 | | 4 | | 1 | | — | | — | | 18 | | 30 | |
| TOTAL LEASE LIABILITIES | 80 | | 53 | | 31 | | 17 | | 11 | | 53 | | 245 | |
At December 31, 2024 lease expenses recognized in operating profit/(loss) reached EUR 257 million (EUR 251 million in 2023 and EUR 257 million in 2022), relating to the following items:
a. Expenses under agreements which though meeting the definition of a lease under IFRS 16, qualify for the exemptions granted by the standard for short-term leases, and leases for which the underlying asset is of low value. Given the nature of the Group’s business, assets are normally leased to carry out various phases of a project for periods of less than one year or are considered to have a low value (below EUR 5,000).
b. Agreements that are not leases as defined in IFRS 16 as they do not convey the right to control the use of an identified asset or even if an asset is specified, the supplier has the substantive right to substitute the asset throughout the period of use. This is especially frequent in construction projects.
CONSOLIDATED FINANCIAL STATEMENTS
FERROVIAL SE AND SUBSIDIARIES
SECTION 4: TRADE CURRENT ASSETS AND LIABILITIES AT DECEMBER 31, 2024 AND 2023
This section contains the notes related to Inventories (Note 4.1), Short-term trade and other receivables (Note 4.2) and Short-term trade and other payables (Note 4.3). The net balance of these items is referred to as working capital.
The distinction between current and non-current assets and liabilities is made on the basis of whether or not the asset or liability is expected to be recovered or settled in the ordinary course of the company´s business cycle. There is a presumption that normally the business cycle has a duration of one year, but there could be assets and liabilities used in activities in which operations are considered to mature over more than one year that should be considered as current assets and liabilities, specifically in relation to the construction activity, since the life of a construction contract is greater than one year.
The main movement under this heading during 2024 corresponds to the reclassification from long-term financial assets to short-term receivables of the subordinated loans granted to AGS (EUR 235 million), derived from the divestment agreement reached for the sale of Ferrovial's entire stake in this asset (Note 1.1.4.). Excluding this impact, the total balance for December 2024 would reach EUR 1,417 million.
| | | | | | | | | | | | | | | | | |
| Million euro | 2023 | Exchange rate | Consolidation scope changes | Other | 2024 |
| Inventories | 458 | 13 | — | 21 | 492 |
| Short-term trade and other receivables | 1,677 | 29 | 1 | 522 | 2,228 |
| Short-term trade and other payables | (3,646) | (63) | 4 | (198) | (3,902) |
| TOTAL | (1,511) | (21) | 4 | 345 | (1,182) |
| | | | | | | | | | | | | | | | | |
| Million euro | 2022 | Exchange rate | Consolidation scope changes | Other | 2023 |
| Inventories | 476 | 5 | — | (23) | 458 |
| Short-term trade and other receivables | 1,600 | 19 | (12) | 70 | 1,677 |
| Short-term trade and other payables | (3,429) | (23) | 1 | (195) | (3,646) |
| TOTAL | (1,353) | 1 | (11) | (148) | (1,511) |
Section 4.4 contains a more detailed analysis of the balance sheet items relating to the recognition of revenue from contracts with customers in the Construction business, including the disclosures required by IFRS 15 in relation to those contracts.
SECTION 4:WORKING CAPITAL
4.1 INVENTORIES
Inventories break down as follows at December 31, 2024 and 2023:
| | | | | | | | | | | | | | | | | |
| Million euro | 2023 | Exchange rate | Consolidation scope changes | Other | 2024 |
| Goods purchased for resale | 20 | | — | | — | | 6 | | 26 | |
| Raw materials and other supplies | 303 | | 10 | | — | | 30 | | 343 | |
| Bidding and mobilization costs | 135 | | 3 | | — | | (15) | | 124 | |
| Inventories | 458 | | 13 | | — | | 21 | | 492 | |
| | | | | | | | | | | | | | | | | |
| Million euro | 2022 | Exchange rate | Consolidation scope changes | Other | 2023 |
| Goods purchased for resale | 24 | | — | | — | | (4) | | 20 | |
| Raw materials and other supplies | 322 | | 8 | | — | | (27) | | 303 | |
| Bidding and mobilization costs | 129 | | (2) | | — | | 8 | | 135 | |
| Inventories | 476 | | 5 | | — | | (23) | | 458 | |
Goods purchased for resale relate primarily to the Construction business (EUR 26 million in 2024, compared to EUR 19 million in 2023).
The movement during 2024 in raw materials and other supplies (EUR 40 million) mainly relates to the Construction Division, primarily the US activity for EUR 23 million (EUR 10 million in 2023) and the activity in Spain for an amount of EUR 13 million (EUR -1 million in 2023).
Bidding and mobilization costs are written off systematically as the goods and services relating to the asset are transferred to customers, entailing a variation of EUR 15 million during 2024, particularly in the United States and Canada.
4.2 SHORT-TERM TRADE AND OTHER RECEIVABLES
Set out below is a breakdown of this heading at December 31, 2024 and 2023:
| | | | | | | | | | | | | | | | | |
| Million euro | 2023 | Exchange rate | Consolidation scope changes | Other | 2024 |
| Trade receivables for sales and services | 1,353 | 24 | 1 | 248 | 1,625 |
| Other receivables | 324 | 5 | — | 274 | 602 |
| TOTAL RECEIVABLES | 1,677 | 29 | 1 | 522 | 2,228 |
| | | | | | | | | | | | | | | | | |
| Million euro | 2022 | Exchange rate | Consolidation scope changes | Other | 2023 |
| Trade receivables for sales and services | 1,300 | 15 | (12) | 51 | 1,353 |
| Other receivables | 300 | 4 | — | 20 | 324 |
| TOTAL RECEIVABLES | 1,600 | 19 | (12) | 70 | 1,677 |
a) Trade receivables for sales and services
Trade receivables break down as follows at December 31, 2024 and 2023:
| | | | | | | | | | | | | | | | | |
| Million euro | 2023 | Exchange rate | Consolidation scope changes | Other | 2024 |
| Trade receivables | 963 | 13 | 1 | 111 | 1,088 |
| Bad debt provisions | (216) | (1) | — | (10) | (227) |
| Net trade receivables | 748 | 12 | 1 | 101 | 861 |
| | | | | |
| | | | | |
| Completed work pending certification | 446 | 10 | — | 118 | 573 |
| Retentions | 160 | 3 | — | 28 | 191 |
| TRADE RECEIVABLES FOR SALES AND SERVICES | 1,353 | 24 | 1 | 248 | 1,625 |
| | | | | | | | | | | | | | | | | |
| Million euro | 2022 | Exchange rate | Consolidation scope changes | Other | 2023 |
| Trade receivables | 962 | 13 | (12) | 1 | 963 |
| Bad debt provisions | (209) | (1) | — | (6) | (216) |
| Net trade receivables | 753 | 12 | (12) | (5) | 748 |
| | | | | |
| | | | | |
| Completed work pending certification | 406 | 2 | — | 38 | 446 |
| Retentions | 141 | 1 | — | 18 | 160 |
| TRADE RECEIVABLES FOR SALES AND SERVICES | 1,300 | 15 | (12) | 51 | 1,353 |
The change under the heading “Other” (EUR 248 million) is explained primarily by the increase in Construction (EUR 228 million), highlighting Canada (EUR 95 million), Spain (EUR 68 million) and United States (EUR 67 million), as a result of the business performance.
Additionally, the heading "Trade receivables" includes collections of non recourse factoring during 2024 for EUR 11 million (there were no factoring agreements during 2023).
SECTION 4:WORKING CAPITAL
Set out below is a breakdown of the main trade receivables by debtor type at December 31, 2024 and 2023:
| | | | | | | | | | | | | | | | | | | | |
At 12.31.2024
(Million euro) | CONSTRUCTION | OTHER AND ADJUSTMENTS | TOTAL |
| Public sector | 820 | | 57 | % | 138 | | n.a. | 958 | | 60 | % |
| Private sector | 458 | | 31 | % | 75 | | n.a. | 533 | | 32 | % |
| Group companies and associates | 186 | | 12 | % | (52) | | n.a. | 134 | | 8 | % |
| TOTAL | 1,465 | | 100 | % | 161 | | N.A. | 1,625 | | 100 | % |
| | | | | | | | | | | | | | | | | | | | |
At 12.31.2023
(Million euro) | CONSTRUCTION | OTHER AND ADJUSTMENTS | TOTAL |
| Public sector | 777 | — | 93 | n.a. | 870 | 64 | % |
| Private sector | 414 | — | 13 | n.a. | 427 | 32 | % |
| Group companies and associates | 171 | — | (116) | n.a. | 55 | 4 | % |
| TOTAL | 1,363 | — | (10) | N.A. | 1,353 | 100 | % |
The Group has pre and post-contracting measures in place to manage customer credit risk, such as consulting debtor registers, ratings or solvency studies, etc. and monitoring incidents and default, etc. while the work is in progress.
Changes to trade provisions are set out below:
| | | | | | | | |
| (Million euro) | 2024 | 2023 |
| Opening balance | 216 | 209 |
| Amounts charged to the income statement: | 10 | 5 |
| Charges | 16 | 12 |
| Reversals | (7) | (8) |
| Applications | — | — |
| Foreign exchange effect | 1 | 1 |
| Transfers and other | — | 1 |
| Closing balance | 227 | 216 |
Group management considers that the carrying amount of trade receivables approximates fair value.
b) Other receivables
Other receivables break down as follows at December 31, 2024 and 2023:
| | | | | | | | | | | | | | | | | |
| Million euro | 2023 | Exchange rate | Consolidation scope changes | Other | 2024 |
| Advance payments to suppliers | 67 | 3 | — | 13 | 83 |
| Sundry receivables and other short terms financial assets | 110 | 1 | — | 233 | 343 |
| Infrastructure project receivables | 4 | — | — | — | 4 |
| Amounts receivable from Public Administrations | 144 | 1 | — | 28 | 172 |
| OTHER RECEIVABLES | 324 | 5 | — | 274 | 602 |
| | | | | | | | | | | | | | | | | |
| Million euro | 2022 | Exchange rate | Consolidation scope changes | Other | 2023 |
| Advance payments to suppliers | 61 | — | — | 6 | 67 |
| Sundry receivables and other short terms financial assets | 96 | 4 | — | 10 | 110 |
| Infrastructure project receivables | 3 | — | — | — | 4 |
| Amounts receivable from Public Administrations | 139 | 1 | — | 4 | 144 |
| OTHER RECEIVABLES | 300 | 4 | — | 20 | 324 |
The main movement under this heading during 2024, disclosed in the line item "Sundry receivables an other short terms financial assets", corresponds to the AGS divestment agreement reached with Avialliance UK Limited for the sale of Ferrovial entire stake in this asset (Note 1.1.4. and Note 6.11.), that has been completed on January 28, 2025. The completion of this transaction was subject to satisfaction of applicable regulatory approvals by 2024 year-end, and therefore, the subordinated loans granted to AGS of GBP 195 million (EUR 235 million) have been reclassified from long-term to short-term receivables.
4.3 SHORT-TERM TRADE AND OTHER PAYABLES
Set out below is a breakdown of this heading at December 31, 2024 and 2023:
| | | | | | | | | | | | | | | | | |
| Million euro | 2023 | Exchange rate | Consolidation scope changes | Other | 2024 |
| Trade payables | 1,698 | 29 | 2 | 53 | 1,781 |
| Work certified in advance | 1,124 | 26 | — | 77 | 1,227 |
| Advance payments | 406 | 1 | — | (14) | 392 |
| Other non-trade payables | 419 | 6 | (6) | 83 | 502 |
| TRADE AND OTHER PAYABLES | 3,646 | 63 | (4) | 198 | 3,902 |
SECTION 4:WORKING CAPITAL
| | | | | | | | | | | | | | | | | |
| Million euro | 2022 | Exchange rate | Consolidation scope changes | Other | 2023 |
| Trade payables | 1,663 | 13 | (2) | 24 | 1,698 |
| Work certified in advance | 962 | (3) | — | 165 | 1,124 |
| Advance payments | 402 | 5 | — | (1) | 406 |
| Other non-trade payables | 402 | 9 | 1 | 7 | 419 |
| TRADE AND OTHER PAYABLES | 3,429 | 23 | (1) | 195 | 3,646 |
a) Trade payables
Set out below is a breakdown of trade payables at December 31, 2024 and 2023:
| | | | | | | | | | | | | | | | | |
| Million euro | 2023 | Exchange rate | Consolidation scope changes | Other | 2024 |
| Trade payables | 1,158 | 24 | 2 | 20 | 1,203 |
| Trade payables sent for reverse factoring | 281 | — | — | 35 | 317 |
| Withholdings made from suppliers | 259 | 5 | — | (2) | 261 |
| TRADE PAYABLES | 1,698 | 29 | 2 | 53 | 1,781 |
| | | | | | | | | | | | | | | | | |
| Million euro | 2022 | Exchange rate | Consolidation scope changes
| Other | 2023 |
| Trade payables | 1,187 | 7 | (2) | (35) | 1,158 |
| Trade payables sent for reverse factoring | 234 | — | — | 48 | 281 |
| Withholdings made from suppliers | 242 | 5 | — | 11 | 259 |
| TRADE PAYABLES | 1,663 | 13 | (2) | 24 | 1,698 |
Trade payables increased by EUR 84 million compared to the balance recognized at December 31, 2023. Excluding the foreign exchange effect and scope changes, trade payables grew by EUR 53 million, primarily in the Energy Division (EUR 23 million) and particularly in the activity in United States.
The Group offers its suppliers the option of utilizing reverse factoring arrangements to receive early payment of their invoices through banks. Suppliers may choose to participate in this arrangement at their discretion.
Suppliers that participate in these reverse factoring arrangements will receive early payment on invoices from the banks, paying a fee to the finance provider. In the due dates and without any extension beyond the original dates agreed with the suppliers, the Group will pay to the banks in the same terms. Additionally, there are no special guarantees securing these payments.
All trade payables where suppliers can use these reverse factoring arrangements are included in trade and other payables in the consolidated statement of financial position and within trade payables in the table above, regardless of whether they have made use of the early payment. From the EUR 317 million (EUR 281 million in 2023) of the trade payables sent for reverse factoring, EUR 130 million of suppliers have received the payment on December 31, 2024.
As disclosed in the table above, trade payables pending payment to suppliers under reverse factoring arrangements increased by EUR 35 million, compared to the balance at December 31, 2023. This increase relates to the difference of payments made in the year and new invoices that are pending to be paid by December 2024.
There were no significant non-cash changes in the carrying amount of the trade payables such as the effect of business combinations or exchange differences, included in the Group´s supplier finance arrangement.
Group management considers that the carrying amount of trade payables approximates fair value.
b) Work certified in advance and advance payments from customers
This heading includes:
•Work certified in advance (see definition in Notes 4.4 and 1.3.3.4) increased by EUR 77 million against December 2023 (excluding the foreign exchange effect and scope changes), primarily in Construction (EUR 59 million), mainly in United States and in the Energy Division (EUR 24 million) in Spain.
•The balance of advance payments from customers (see definition in Note 4.4) decreased by EUR -14 million in relation to December 2023.
c) Other non-trade payables
“Other non-trade payables” break down as follows:
| | | | | | | | | | | | | | | | | |
| Million euro | 2023 | Exchange rate | Consolidation scope changes | Other | 2024 |
| Accrued wages and salaries | 227 | 3 | (1) | 25 | 254 |
| Taxes payable | 162 | 2 | (5) | 17 | 176 |
| Other payables | 30 | 2 | — | 41 | 72 |
| OTHER NON- TRADE PAYABLES | 419 | 6 | (6) | 83 | 502 |
SECTION 4:WORKING CAPITAL
| | | | | | | | | | | | | | | | | |
| Million euro | 2022 | Exchange rate | Consolidation scope changes | Other | 2023 |
| Accrued wages and salaries | 190 | 5 | — | 32 | 227 |
| Taxes payable | 171 | 4 | — | (13) | 162 |
| Other payables | 41 | — | 1 | (12) | 30 |
| OTHER NON- TRADE PAYABLES | 402 | 9 | 1 | 7 | 419 |
4.4 BALANCES UNDER CONTRACTS WITH CUSTOMERS AND OTHER IFRS 15 DISCLOSURES
Balance sheet information under IFRS 15
As indicated in Note 1.3.3.4 in relation to the policy for recognizing contract revenue (IFRS 15), for contracts in which the performance obligations are measured over time, the difference between the revenues recognized for services rendered and the amounts actually billed to the customer are systematically analyzed on a contract-by-contract basis.
If the amount billed is lower than the revenue recognized, the difference is recognized as an asset under “Trade receivables for sales and services – Net completed work pending certification” (Note 4.2), whereas if the revenue recognized is lower than the amount billed, a liability is recognized under “Short-term trade and other payables - Work certified in advance” (Note 4.3).
For certain construction contracts, advances are agreed, paid by the customer at contract inception and offset against progress billings as the works are executed.
These balances are carried on the liabilities side of the balance sheet under the heading “Trade payables” (Note 4.3.a).
In contrast to the advance payments, under some contracts the customer retains a portion of each progress billing payment to guarantee certain contractual obligations are met, which is not reimbursed until the contract is definitively settled. These balances are carried on the assets side of the balance sheet under “Trade receivables for sales and services” (Note 4.2.a).
Unlike completed work pending certification and work certified in advance, advances and retentions are balances that will have an impact on future cash flows, since in the case of the advances a lower amount will be collected in the future as the advances are discounted from the progress billings, whereas the retentions will give rise to higher collections in the future, since the customer will reimburse the related amounts as and when the contract work is settled. Most of the revenue recognized during the reporting period was included in the contract liability balance at the beginning of the period.
Set out below is a breakdown of the amounts recognized in this connection at December 31, 2024 and 2023:
| | | | | | | | | | | | | | | | | |
| Million euro | 2023 | Exchange rate | Consolidation scope changes | Other | 2024 |
| Completed work pending certification | 446 | 10 | — | 118 | 573 |
| Retentions | 160 | 3 | — | 28 | 191 |
| Total customer contract assets | 606 | 13 | — | 146 | 764 |
| Work certified in advance | 1,124 | 26 | — | 77 | 1,227 |
| Advance payments | 406 | 1 | — | (14) | 392 |
| Total customer contract liabilities | 1,530 | 27 | — | 63 | 1,619 |
| | | | | | | | | | | | | | | | | |
| Million euro | 2022 | Exchange rate
| Consolidation scope changes | Other | 2023 |
| Completed work pending certification | 406 | 2 | — | 38 | 446 |
| Retentions | 141 | 1 | — | 18 | 160 |
| Total customer contract assets | 547 | 3 | — | 56 | 606 |
| Work certified in advance | 962 | (3) | — | 165 | 1,124 |
| Advance payments | 402 | 5 | — | (1) | 406 |
| Total customer contract liabilities | 1,364 | 2 | — | 164 | 1,530 |
The balance of work completed pending certification at December 31, 2024 and 2023 related almost entirely to revenue under the main contract with the customer since, according to the Group’s general policy, only work that is due and payable, i.e. has been approved by the customer, may be recognized in the financial statements. Claims only include cases in which it is deemed highly likely that there will be no reversal of revenue in the future.
In general, performance obligations in the construction business are fulfilled over time. Therefore, as the amounts relating to changes and claims are immaterial under the completed work pending certification heading, the balance relates basically to differences between work completed and work certified due to timing differences in the customer certification and review process, billing milestones or certification schedule.
Other disclosures relating to IFRS 15:
Revenue from contracts with customers:
EUR 9,024 million of the total revenue recognized in 2024 (EUR 8,339 million and EUR 7,385 million in 2023 and 2022, respectively) (Note 2.1 Operating income) relates to revenue from contracts with customers, which accounted for 98.7% of revenue recognized (97.9% and 97.8% in 2023 and 2022, respectively).
SECTION 4:WORKING CAPITAL
| | | | | | | | | | | |
| Million euro | 2024 | 2023 | 2022 |
| Construction | 7,091 | 6,909 | 6,287 |
| Toll Roads | 1,236 | 1,071 | 765 |
| Airports | 90 | 8 | 5 |
| Other segments | 607 | 351 | 328 |
| Revenue from contracts with customers | 9,024 | 8,339 | 7,385 |
The table below shows a breakdown of income pending recognition in relation to uncompleted performance obligations by business area at year-end, and includes an estimate of the years in which it is expected to appear in income:
| | | | | | | | | | | | | | | | | | | | |
| REVENUE | 2025 | 2026 | 2027 | 2028 | 2029 and beyond | TOTAL |
| Construction | 6,482 | 5,309 | 2,521 | 683 | 1,760 | 16,756 |
| Energy | 523 | 193 | 113 | 101 | 394 | 1,324 |
| Total | 7,005 | 5,502 | 2,634 | 784 | 2,154 | 18,080 |
In 2024, there are a total of 738 contracts in force in the Construction businesses (750 contracts in 2023) and 138 Energy contracts (198 contracts in 2023).
CONSOLIDATED FINANCIAL STATEMENTS
FERROVIAL SE AND SUBSIDIARIES
SECTION 5: CAPITAL AND FINANCING STRUCTURE AT DECEMBER 31, 2024 AND 2023
The notes in this section describe trends in Ferrovial's financial structure at December 31, 2024 and 2023, addressing both changes in equity (Note 5.1) and cash and cash equivalents and borrowings (Note 5.2), broken down by project company and ex-project company. They also describe the Group's exposure to the main financial risks and risk management policies (Note 5.4), as well as derivatives contracted for such purposes (Note 5.5).
At December 31, 2024 , the Company’s equity (Note 5.1) attributed to shareholders increased in relation to the previous year, due essentially to the net profit for the year (EUR 3,239 million), which was partially offset by shareholder remuneration and the purchase of discretionary treasury shares.
| | | | | |
| EQUITY ATTRIBUTED TO SHAREHOLDERS | (Million euro) |
| Closing balance at 12.31.2023 | 3,766 |
| Net profit/(loss) | 3,239 |
| Income and expense recognized directly in equity | 158 |
| Amounts transferred to the income statement | (15) |
| Shareholder distributions | (831) |
| Share-based remuneration scheme | 13 |
| Other treasury shares repurchase | (272) |
| Other | 17 |
| Closing balance at 12.31.2024 | 6,075 |
Regarding infrastructure project borrowings, the variation during 2024 is primarily due to the foreign exchange effect (EUR 472 million).
| | | | | |
| BORROWINGS OF INFRASTRUCTURE PROJECTS | (Million euro) |
| Closing balance at 12.31.2023 | 7,915 | |
| Net drawdowns | 34 | |
| Exchange rate effects | 472 | |
| Changes in scope of consolidation | (22) | |
| Closing balance at 12.31.2024 | 8,400 | |
Regarding ex-infrastructure project borrowings, the variation during the year is primarily due to the redemption of one of the corporate bonds issued in July 2014, maturing in 2024 (EUR -300 million) as well as to the reduction in the Euro Commercial Paper (ECPs) issued at the December 2024 closing (EUR -251 million).
| | | | | |
| BORROWINGS OF EX INFRASTRUCTURE PROJECTS | (Million euro) |
| Closing balance at 12.31.2023 | 3,463 |
| Net drawdowns | (580) |
| Exchange rate effects | 4 |
| Changes in scope of consolidation | — |
| Closing balance at 12.31.2024 | 2,886 |
SECTION 5: CAPITAL AND
FINANCING STRUCTURE
5.1 EQUITY
5.1.1 Changes in equity
There follows a breakdown of the main equity impacts during 2024 and 2023:
| | | | | | | | | | | |
| Attributed to shareholders | Attributed to non-controlling interest | Total equity |
| | | |
| | | |
| | | |
| | | |
| Equity at 01.01.2023 | 4,233 | 2,240 | 6,473 |
| Consolidated profit/(loss) for the year | 341 | 170 | 511 |
| Impact on hedge reserves | 3 | 3 | 6 |
| | | |
| Currency translation differences | (83) | (42) | (125) |
| Income and expenses recognized directly in equity | (80) | (39) | (119) |
| Amounts transferred to the income statement | 8 | — | 8 |
| TOTAL RECOGNIZED INCOME AND EXPENSES | 269 | 131 | 400 |
| Cash dividend | (136) | — | (136) |
| Other dividends | — | (379) | (379) |
| Treasury shares purchases | (114) | — | (114) |
| SHAREHOLDER DISTRIBUTIONS | (250) | (379) | (629) |
| Share capital increases/reductions | — | 117 | 117 |
| Share-based remuneration scheme | 12 | — | 12 |
| Other treasury shares repurchase | — | — | — |
| Other movements | 15 | 2 | 17 |
| OTHER TRANSACTIONS | 27 | 119 | 146 |
| Hybrid bond | (513) | — | (513) |
| Scope changes | — | 2 | 2 |
| Equity at 12.31.2023 | 3,766 | 2,113 | 5,879 |
| | | |
| | | |
| Consolidated profit/(loss) for the year | 3,239 | 251 | 3,490 |
| Impact on hedge reserves | 125 | 4 | 129 |
| | | |
| Currency translation differences | 33 | 106 | 139 |
| Income and expenses recognized directly in equity | 158 | 110 | 268 |
| Amounts transferred to the income statement | (15) | — | (15) |
| TOTAL RECOGNIZED INCOME AND EXPENSES | 3,382 | 361 | 3,743 |
| Cash dividend | (130) | — | (130) |
| Other dividends | — | (446) | (446) |
| Treasury shares purchases | (701) | — | (701) |
| SHAREHOLDER DISTRIBUTIONS | (831) | (446) | (1,277) |
| Share capital increases/reductions | — | 22 | 22 |
| Share-based remuneration scheme | 13 | — | 13 |
| Other treasury shares repurchase | (272) | — | (272) |
| Other movements | 17 | (5) | 12 |
| OTHER TRANSACTIONS | (242) | 17 | (225) |
| | | |
| | | |
| Equity at 12.31.2024 | 6,075 | 2,045 | 8,120 |
There follows a description of the main movements in shareholders’ funds in 2024 and 2023, which resulted in an increase of EUR 2,309 million in 2024 and a decrease of EUR -467 million in 2023 in equity attributable to shareholders. The increase for 2024 is essentially due to the net profit for the year, partially offset by shareholder remuneration and the purchase of discretionary treasury shares.
Consolidated profit/(loss) for 2024 and 2023 attributed to the parent company reached EUR 3,239 million and EUR 341 million, respectively.
Income and expense recognized directly in equity relate to:
•Hedging instruments: recognition of changes in the value of the effective portion of derivatives designated as hedges, as detailed in Note 5.5, with a positive impact of EUR 125 million in 2024, of which EUR 104 million related to fully-consolidated companies and EUR 21 million to equity-accounted companies, as compared to EUR 3 million in 2023, of which EUR -9 million related to fully-consolidated companies, EUR 17 million to equity-accounted companies and EUR -5 million to companies held for sale.
•Currency translation differences: In 2024, the currencies to which Ferrovial was most exposed in terms of equity (mainly the Canadian dollar, US dollar, and Indian rupee), as detailed in Note 5.4.b, gave rise to currency translation differences of EUR 33 million attributed to the parent company, relating primarily to the US dollar (EUR 33 million), Canadian dollar (EUR -12 million) and Indian rupee (EUR 18 million). In 2023, the currencies to which Ferrovial was most exposed in terms of equity (mainly the Canadian dollar, US dollar, pound sterling and Indian rupee), gave rise to currency translation differences of EUR -83 million attributed to the parent company, relating primarily to the US dollar (EUR -52 million) and Canadian dollar (EUR -34 million). These translation differences are presented net of the effect of foreign currency hedging instruments contracted by the Group to offset this impact (Note 5.5).
Amounts transferred from other comprehensive income to the income statement:
At December 31, 2024
This impact reflects the reclassification from other comprehensive income to results of the amounts accumulated in equity (EUR -15 million), related to currency translation differences (EUR 55 million) and derivatives hedging divestment transactions (EUR -84 million), highlighting the
SECTION 5: CAPITAL AND
FINANCING STRUCTURE
19.75% HAH divestment, in addition to other divestments described in Note 1.1.5 (5% stake in IRB Infrastructure Developers, 24.78% stake in Grupo Serveo, S.L. and some equity-accounted availability toll road assets sale).
At December 31, 2023
This reflects the impact of the reclassification from shareholders’ funds to results (under IAS 21) of the effect accumulated in reserves of the IRSs contracted to cover the bank borrowings obtained by Ferrovial SE in 2022 (which were voluntarily repaid in September 2023), in the amount of EUR -9 million after tax (positive impact on the income statement). This was partially offset by the reclassification to the income statement of the impact accumulated in reserves of the derivatives used to hedge the debt of Euroscut Azores, the toll road sold in December 2023, as indicated in Note 1.1.5, and the recycling impact of the pre-hedged bond issue initially planned for 2018 by Ferrovial Emisiones and cancelled in 2020, in the amounts of EUR 6 million after taxes (negatives effects on the income statement).
Shareholder distributions:
Scrip dividend: On April 11, 2024 Ferrovial´s Board approved another flexible shareholder distribution scheme whereby the shareholders may freely choose to receive new shares or an amount in cash, with a total cash impact of EUR 831 million, as follows:
•Cash dividend. The impact related to shareholders that received the dividend in the form of cash payment during 2024 reached EUR 130 million, corresponding to the first scrip dividend on May 9, 2024 (EUR 48 million; EUR 58 million in July 2023), the second scrip dividend on November, 2024, (EUR 57 million; EUR 78 million in November 2023) and the final interim cash dividend on December 4, 2024 (EUR 25 million), on the back of forecast year-end cash levels, corresponding to EUR 0.0346 per share against Ferrovial's reserves.
•Treasury shares repurchase. Additionally, and in parallel with the payment in cash, Ferrovial, to reduce the dilution effect of paying the scrip dividend in shares, has purchased 19,586,744 shares for an amount of EUR 701 million, with the aim of reducing share capital.
•On May 9, 2024 Ferrovial SE announced an interim scrip dividend of EUR 0.3033 per Ferrovial share (4,719,782 new shares were issued compared to 5,051,417 new shares issued in July 2023). The dividend was payable in cash or shares at the choice of the shareholder, against Ferrovial's reserves. On June 19, 2024 Ferrovial announced the ratio of this interim scrip dividend, being one new Ferrovial share for every 120.2110 existing Ferrovial shares. 78.21% of the outstanding Ferrovial shares received the dividend in the form of new Ferrovial shares.
•On November 5, 2024 Ferrovial SE announced an interim scrip dividend of EUR 0.4597 per Ferrovial share (7,402,412 new shares were issued compared to 8,193,687 new shares issued in November 2023). The dividend was payable in cash or shares at the choice of the shareholder, against Ferrovial's reserves. On December 11, 2024 Ferrovial announced the ratio of this interim scrip dividend, being one new Ferrovial share for every 80.694 existing Ferrovial shares. 82.66% of the outstanding Ferrovial shares received the dividend in the form of new Ferrovial shares.
•Finally, and regarding the treasury shares purchased during 2023 and 2024, 23,250,608 shares were applied to the share capital reduction associated with the scrip dividend programs before mentioned, having an impact of -0.2 million on the shared capital.
Share-based remuneration schemes:
The impact of these remuneration schemes recognized in the Company's equity was EUR 13 million in 2024 (with a counterparty impact through income statement of EUR -13 million (Note 6.6.).
As explained in Note 5.5, the Company has equity swaps hedging against the possible equity impact of these share-based remuneration schemes. The equity swaps had a positive fair value effect of EUR 17 million in 2024 on net financial income/(expense) (EUR 25 million in 2023).
Other treasury shares repurchase
As described in note 5.1.2.c., on August 23, 2024 Ferrovial SE announced a discretional repurchase program of it shares in accordance with the authorization granted by the Company´s General Shareholder´s Meeting held on April 11, 2024. The purpose was to repurchase Ferrovial shares in the context of different corporate actions (such as, for instance, employee share incentives, placement of shares in the market, or cancelling the repurchased shares) for a maximum of up to 30 million shares and a maximum investment amount of EUR 300 million. The program was authorized for the period from August 26, 2024 to February 28, 2025 (both inclusive).
On December 13, 2024 Ferrovial SE announced the extension and increase of the discretional repurchase program of it shares, extending the duration of the program to May 30, 2025 (inclusive) and increasing the maximum investment amount under the program by EUR 300 million, bringing the total maximum amount of investment up to EUR 600 million. During 2024 7,169,540 shares were acquired giving rise to a total disbursement of EUR 272 million.
Subordinated hybrid bond:
In February 2023, and as a result of the reverse merger transaction described in Note 1.1.2, Ferrovial committed to repurchase its subordinated hybrid bond. As of June 2023, the company obtained acceptance of 94.28% of the amount of the issuance to which the offer was directed. Specifically, of the EUR 500 million that the placement amounted to, holders of a total of EUR 471 million accepted Ferrovial's early purchase proposal, leaving a balance of around EUR 29 million in short-term debt to be paid at end-June. The company executed the full cancellation of the bond and paid the remaining amount on August 7. Therefore, at the close of these financial statements, no balance is recorded in relation to this hybrid bond.
This subordinated hybrid bond was treated as an equity instrument (IAS 32.16), as mentioned in Note 1.3.3., because the issuer did not have a contractual obligation to (i) deliver cash or another financial asset to another entity; or (ii) exchange financial assets or financial liabilities with another entity under conditions that are potentially unfavorable to the issuer.
SECTION 5: CAPITAL AND
FINANCING STRUCTURE
Scope changes related to the following transactions:
The impact in 2023 is explained by the completion of the sale agreement reached in June 2023 to sell 89.2% of the Azores toll road (Note 1.1.5).
5.1.2 Equity components
There follows an explanation of each equity item reflected in the consolidated statement of changes in equity:
a) Share capital
At December 31, 2024, fully subscribed and paid in share capital stood at EUR 7,295,600 (EUR 7,406,884 in 2023), corresponding to Ferrovial SE as the Groups´s parent holding company (see Consolidated Statement of Changes in Equity). Share capital consists of 729,559,951 ordinary shares (740,688,365 ordinary shares in 2023) in a single class with a par value of one euro cent each (EUR 0.01). Movements during the year, broken down in the following table, relate to the share capital increase and reduction transactions mentioned in the preceding section.
| | | | | | | | |
| SHARES | NUMBER | PAR VALUE |
| Opening balance 01.01.2024 | 740,688,365 | 7,406,884 |
| Scrip dividend | 12,122,194 | 121,222 |
| Share capital reduction | (23,250,608) | (232,506) |
| CLOSING SHARES 12.31.2024 | 729,559,951 | 7,295,600 |
| | | | | | | | |
| SHARES | NUMBER | PAR VALUE |
| Opening balance 01.01.2023 | 727,443,261 | 7,274,433 |
| Scrip dividend | 13,245,104 | 132,451 |
| Share capital reduction | — | — |
| CLOSING SHARES 12.31.2023 | 740,688,365 | 7,406,884 |
At December 31, 2024 the companies with an ownership interest of over 10% were Rijn Capital S.A.R.L., which held 21.31% of the shares and is controlled by the Chairman of the Company's Board of Directors, Rafael del Pino y Calvo Sotelo and TCI Fund Management Ltd., which held 10.03% of the shares. At December 31, 2023 the only company with an ownership interest of over 10% was Rijn Capital S.A.R.L., which held 20.56% of the shares.
At December 31, 2024, parent company's shares were traded on the Euronext in Amsterdam, a regulated market of Euronext Amsterdam N.V. (the “Dutch Stock Exchange”), the Nasdaq in the United States and the Spanish Stock Exchanges. They all carried the same voting and dividend rights.
b) Share premium and merger premium
As commented in Note 1.1.2, the merger between Ferrovial, S.A. and Ferrovial International SE had no impact on a consolidated level, and only affected the breakdown of equity (see Consolidated Statement of Changes in Equity). This transaction gave rise to a merger share premium of EUR 4,426 million. The reduction in the share/merger premium in relation to the balance at January 1, 2023 is explained by the redemption of treasury shares agreed in the Buy-Back Program explained in the following section. Consequently, at December 31, 2023 the share premium and merger premium totaled EUR 4,316 million. At December 31, 2024 the share premium and merger premium reached EUR 4,316 million, as no other adjustments were accounted for against this heading. Both share premium and merger premium are classed as unrestricted reserves.
c) Treasury shares
Movements during 2024 and 2023 were as follows:
| | | | | | | | | | | |
| TRANSACTION PERFORMED/OBJECTIVE | NUMBER OF SHARES PURCHASED | NUMBER OF SHARES APPLIED TO PURPOSE | TOTAL NUMBER OF SHARES |
| Balance at 12.31.2023 | | | 4,759,310 |
| Share capital reduction | 19,586,744 | (23,250,608) | (3,663,864) |
| Remuneration schemes | — | (511,587) | (511,587) |
| Other treasury shares repurchase | 7,169,540 | — | 7,169,540 |
| Balance at 12.31.2024 | 26,756,284 | (23,762,195) | 7,753,399 |
| | | | | | | | | | | |
| TRANSACTION PERFORMED/OBJECTIVE | NUMBER OF SHARES PURCHASED | NUMBER OF SHARES APPLIED TO PURPOSE | TOTAL NUMBER OF SHARES |
| Balance at 12.31.2022 | | | 1,168,290 |
| Share capital reduction | 3,900,000 | — | 3,900,000 |
| Remuneration schemes | — | (308,980) | (308,980) |
| | | |
| Balance at 12.31.2023 | 3,900,000 | (308,980) | 4,759,310 |
As commented in the Group's consolidated financial statements for the year ended December 31, 2023, on November 30, 2023 Ferrovial SE announced its decision to implement a treasury share buy-back program for a maximum of up to 34 million shares and a maximum investment of EUR 500 million, the purpose of which was a subsequent capital reduction by cancelling the repurchased shares. The program was authorized for the period from December 1, 2023 to May 1, 2024 (both inclusive). During 2024, 10,355,493 shares were acquired giving rise to a total disbursement of EUR 361 million, while 1,900,000 shares were acquired in 2023 for a total disbursement of EUR 62 million. In addition to this program, over the course of 2023, 2,000,000 of treasury shares were acquired with a total disbursement of EUR 52 million.
On April 11, 2024, the Board approved a new buyback program for a maximum of 37 million shares and a maximum investment of EUR 500 million, the purpose of which was a subsequent capital reduction by cancelling the repurchased shares. The program was authorized for the period from May 2 to December 31, 2024, notwithstanding that Ferrovial reserved the right to terminate the program if, prior to that term, it had acquired shares under the program for either a price that reaches the maximum net investment amount or the maximum number of shares authorized, or if
SECTION 5: CAPITAL AND
FINANCING STRUCTURE
any other circumstance makes it advisable to do so. During 2024 9,231,251 shares were acquired giving rise to a total disbursement of EUR 339 million.
In the General Shareholders' Meeting held on 11 April 2024, the Board informed that, in line with the shareholder remuneration policy carried out in previous years, the Board intended to implement one or more interim dividends in 2024 which would be distributed to the shareholders by way of a flexible dividend scheme (scrip dividend) for a cash equivalent amount of around EUR 550 million.
In order to enable the Board to implement the scrip dividend scheme, the General Meeting approved: (i) the Board’s designation as the corporate body authorized to issue ordinary Company shares and to grant rights; and (ii) a limit on or exclusion of pre-emptive rights in connection with the issue and/or granting of rights to subscribe for ordinary Company shares, up to a maximum of 5% of the Company's issued share capital at the date of the 2024 General Meeting.
Additionally, on August 23, 2024 Ferrovial SE announced a discretional repurchase program of it shares in accordance with the authorization granted by the Company´s General Shareholder´s Meeting held on April 11, 2024. The purpose was to repurchase Ferrovial shares in the context of different corporate actions (such as, for instance, employee share incentives, placement of shares in the market, or cancelling the repurchased shares) for a maximum of up to 30 million shares and a maximum investment amount of EUR 300 million. The program was authorized for the period from August 26, 2024 to February 28, 2025 (both inclusive).
On December 13, 2024 Ferrovial SE announced the extension and increase of the discretional repurchase program of it shares, extending the duration of the program to May 30, 2025 (inclusive) and increasing the maximum investment amount under the program by EUR 300 million, bringing the total maximum amount of investment up to EUR 600 million. During 2024 7,169,540 shares were acquired giving rise to a total disbursement of EUR 272 million.
Over the course of 2024, 26,756,284 treasury shares were acquired at an average price of EUR 36.34 per share giving rise to a payment of EUR 972 million (3,900,000 treasury shares at an average price of EUR 29.17 per share totaling EUR 114 million in 2023).
The market value of the treasury shares held by Ferrovial at December 31, 2024 (7,753,399 shares) was EUR 315 million (EUR 157 million in 2023).
d) Measurement adjustment reserves
Measurement Adjustments Reserves refer to the cumulative impact at consolidated level of Other Comprehensive Income (OCI) items and other valuation adjustments different to OCI.
The cumulative impact of Other Comprehensive Income reached EUR -534 million at December 2024, comprising the adjustments to currency translation differences accumulated in reserves (EUR -311 million), the adjustments due to hedging instruments (EUR 232 million) and the impact related to pension plans of group companies already divested (EUR -455 million), as Ferrovial decided, in accordance with IAS 19.122, not to transfer those amounts within equity.
e) Retained earnings and other reserves
This heading includes retained earnings and other reserves totaling EUR 2,536 million in 2024 (EUR 370 million in 2023).
Adjustments relating to share-based remuneration schemes and the impact of the subordinated perpetual bond coupons and associated costs are also recognized under this heading.
5.1.3 Proposed distribution of 2024 profit/(loss)
The Company posted a profit for 2024 of EUR 3,270 million.
The Board of Directors proposed to the Company’s Annual General Meeting the following distribution of Ferrovial's individual profit/(loss), at December 31, 2024:
| | | | | |
| Million EUR | 2024 |
| Profit/(loss) of Ferrovial SE. (individual company) | 3,270 |
| Distribution (million euros): |
|
| Other reserves | 3,270 |
SECTION 5: CAPITAL AND
FINANCING STRUCTURE
5.1.4 Non-Group companies with significant ownership interests in subsidiaries.
At December 31, 2024 and 2023, non-controlling interests in the share capital of the most significant fully-consolidated Group companies were as follows:
At December 31, 2024:
| | | | | | | | |
| FERROVIAL GROUP SUBSIDIARY | NON-GROUP % | NON-GROUP SHAREHOLDER |
| TOLL ROADS | | |
| Autopista Terrassa-Manresa, S.A. | 23.72 | % | Acesa (Autopista Concesionaria Española, S.A.) |
| LBJ Infrastructure Group Holding LLC | 28.33%-17.07% | LBJ Blocker (APG)- Meridiam Infr. S.a.r.l. (MI LBJ) |
| NTE Mobility Partners Holding LLC | 37.03 | % | Meridiam Infrastrucuture S.a.r.l. |
| NTE Mobility Partners SEG 3 Holding LLC | 28.84%-17.49% | NTE Segments 3 Blocker, Inc. (APG) - Meridiam Infraestructure NTE 3A/3B LLC |
| I-77 Mobility Partners, LLC | 24.58%-3.18% | John Laing I-77 Holco Corp./Aberdeen Infr. Invest. |
| I-66 Mobility Partners, LLC | 29.75%-14.55% | Meridiam Infrastrucuture S.a.r.l. - I-66 Blocker (APG) |
| CONSTRUCTION | | |
| Budimex S.A. | 9.8%-6.3%-33.8% | AVIVA OFE Aviva BZ WBK-Nationale Nederlanden OFE-Traded |
| AIRPORTS | | |
| Dalaman | 40.00 | % | YDA Group |
The financial highlights of the most significant Group companies in which there are non-controlling interests are as follows:
| | | | | | | | | | | | | | | | | |
| 2024 | ASSETS | LIABILITIES | SHAREHOLDERS' FUNDS | NET CASH POSITION | NET PROFIT/(LOSS) |
| (Millon euro) |
| Autopista Terrassa-Manresa, S.A. | 573 | 138 | 436 | 8 | 25 |
| LBJ Infrastructure Group Holding LLC | 2,197 | 2,462 | (265) | (1,959) | 33 |
| NTE Mobility Partners Holding LLC | 2,128 | 2,117 | 11 | (1,285) | 101 |
| NTE Mobility Partners SEG 3 Holding LLC | 2,129 | 1,857 | 272 | (1,581) | 70 |
| I-77 Mobility Partners, LLC | 708 | 688 | 20 | (450) | 23 |
| I-66 Mobility Partners, LLC | 6,276 | 2,676 | 3,600 | (1,672) | (4) |
| Budimex | 1,907 | 1,565 | 342 | 726 | 74 |
| Dalaman | 717 | 428 | 289 | (61) | 35 |
The main movements under “Equity attributable to non-controlling interests” in 2024 were as follows:
| | | | | | | | | | | | | | | | | | | | | | | | | | |
Company
(Million euro) | Balance at 12.31.2023 | Profit/(loss) | Derivatives | Currency translation differences | Dividends | Share capital increase | Other movements | Balance at 12.31.2024 |
| Autopista Terrassa-Manresa, S.A. | 93 | 8 | 2 | — | — | — | — | 103 |
| LBJ Infrastructure Group Holding LLC | (96) | 28 | — | (7) | (45) | — | — | (120) |
| NTE Mobility Partners Holding LLC | 5 | 59 | — | — | (61) | — | 1 | 4 |
| NTE Mobility Partners Segments 3 LLC | 131 | 60 | 2 | 8 | (75) | — | — | 126 |
| I-77 Mobility Partners, LLC | 74 | 9 | — | 2 | (79) | — | (1) | 5 |
| I-66 Mobility Partners, LLC | 1,571 | (3) | — | 101 | (70) | — | (4) | 1,595 |
| FAM Construction LLC (I-66) | — | (9) | — | 2 | — | 22 | (1) | 14 |
| Budimex | 234 | 77 | — | — | (111) | — | (4) | 196 |
| Dalaman | 86 | 24 | (1) | — | — | — | — | 109 |
| Others | 15 | (2) | 1 | — | (5) | — | 4 | 13 |
| TOTAL | 2,113 | 251 | 4 | 106 | (446) | 22 | (5) | 2,045 |
The heading “share capital increase” reflects the impact of the increase in funds attributable to non-controlling interests of FAM Construction LLC amounting to EUR 22 million.
At December 31, 2023:
| | | | | | | | |
| FERROVIAL GROUP SUBSIDIARY | NON-GROUP % | NON-GROUP SHAREHOLDER |
| TOLL ROADS | | |
| Autopista Terrassa-Manresa, S.A. | 23.72 | % | Acesa (Autopista Concesionaria Española, S.A.) |
| LBJ Infrastructure Group Holding LLC | 28.33%-17.07% | LBJ Blocker (APG)- Meridiam Infr. S.a.r.l. (MI LBJ) |
| NTE Mobility Partners Holding LLC | 37.03 | % | Meridiam Infrastrucuture S.a.r.l. |
| NTE Mobility Partners SEG 3 Holding LLC | 28.84%-17.49% | NTE Segments 3 Blocker, Inc. (APG) - Meridiam Infraestructure NTE 3A/3B LLC |
| I-77 Mobility Partners, LLC | 24.58%-3.18% | John Laing I-77 Holco Corp./Aberdeen Infr. Invest. |
| I-66 Mobility Partners, LLC | 29.75%-14.55% | Meridiam Infrastrucuture S.a.r.l. - I-66 Blocker (APG) |
| CONSTRUCTION | | |
| Budimex S.A. | 9.8%-6.3%-33.8% | AVIVA OFE Aviva BZ WBK-Nationale Nederlanden OFE-Traded |
| AIRPORTS | | |
| Dalaman | 40.00 | % | YDA Group |
SECTION 5: CAPITAL AND
FINANCING STRUCTURE
The main financial statement aggregates of the most significant Group companies in which other shareholders own interests are as follows:
| | | | | | | | | | | | | | | | | |
| 2023 | ASSETS | LIABILITIES | SHAREHOLDERS' FUNDS | NET CASH POSITION | NET PROFIT/(LOSS) |
| (Millon euro) |
| Autopista Terrassa-Manresa, S.A. | 590 | 196 | 394 | 18 | 27 |
| LBJ Infrastructure Group Holding LLC | 2,084 | 2,296 | (212) | (1,828) | 24 |
| NTE Mobility Partners Holding LLC | 1,967 | 1,954 | 13 | (1,144) | 102 |
| NTE Mobility Partners SEG 3 Holding LLC | 2,019 | 1,735 | 284 | (1,471) | 48 |
| I-77 Mobility Partners, LLC | 775 | 509 | 266 | (183) | 31 |
| I-66 Mobility Partners, LLC | 6,108 | 2,567 | 3,542 | (1,469) | (20) |
| Budimex | 2,029 | 1,616 | 413 | 874 | 80 |
| Dalaman | 710 | 478 | 232 | (86) | (10) |
The main movements under “Equity attributable to non-controlling interests” in 2023 were as follows:
| | | | | | | | | | | | | | | | | | | | | | | | | | |
Company
(Million euro) | Balance at 12.31.2022 | Profit/(loss) | Derivatives | Currency translation differences | Dividends | Share capital increase | Other movements | Balance at 12.31.2023 |
| Autopista Terrassa-Manresa, S.A. | 94 | 8 | 4 | — | (13) | — | — | 93 |
| LBJ Infrastructure Group Holding LLC | (89) | 20 | — | 3 | (31) | — | — | (96) |
| NTE Mobility Partners Holding LLC | 9 | 60 | — | — | (64) | — | — | 5 |
| NTE Mobility Partners Segments 3 LLC | 282 | 41 | — | (6) | (216) | 30 | — | 131 |
| I-77 Mobility Partners, LLC | 64 | 12 | — | (2) | — | — | — | 74 |
| I-66 Mobility Partners, LLC | 1,610 | (16) | — | (49) | — | 26 | — | 1,571 |
| FAM Construction LLC (I-66) | (28) | (34) | — | — | — | 60 | — | — |
| Budimex | 192 | 83 | — | 13 | (54) | — | — | 234 |
| Dalaman | 94 | (7) | (2) | — | — | — | 1 | 86 |
| Others | 11 | 2 | — | (1) | (1) | — | 3 | 15 |
| TOTAL | 2,240 | 170 | 3 | (42) | (379) | 117 | 4 | 2,113 |
5.2 CASH AND CASH EQUIVALENTS AND BORROWINGS
In order to aid understanding of the Group’s financial performance, and as mentioned in Note 1.1.3, the Group analyzes cash and cash equivalents and borrowings for each corresponding period distinguishing between infrastructure project companies and ex infrastructure companies.
The main items forming the Group's cash and cash equivalents and borrowings, are described below.
5.2.1 Cash and cash equivalents
a) Cash and cash equivalents and restricted cash of infrastructure projects companies
The cash and cash equivalents of infrastructures project companies as at December 31, 2024 and December 31, 2023 stood at EUR 175 million and EUR 204 million, respectively.
Infrastructure project financing agreements often impose the obligation to arrange certain restricted accounts to cover short-term or long-term obligations relating to the payment of principal or interest on the borrowings and the infrastructure maintenance and operation.
Restricted cash is classified as short-term or long-term depending on whether it must remain restricted for less or more than one year. These funds are invested in highly-liquid financial products earning floating interest. The type of financial product in which the funds may be invested is also restricted by the financing agreements or, where no restrictions are stipulated, the decision is made on the basis of the Group’s policy for the placement of cash surpluses.
For 2024:
Short-term balances, which amounted to EUR 18 million, are recognized under cash and cash equivalents in the balance sheet, whereas long-term balances totaling EUR 380 million are carried as financial assets. Therefore, short- and long-term restricted cash recognized at December 31, 2024 amounts to EUR 398 million and relates to the NTE Segment 3, LBJ, I-66 and NTE toll roads (EUR 22 million, EUR 12 million, EUR 57 million and EUR 281 million, respectively), as well as to other European concessions in the amount of EUR 26 million, primarily treatment plants in the United Kingdom, and the Autovía de Aragón toll road (EUR 9 million and EUR 17 million, respectively). The variation of EUR -228 million compared to December 2023 is explained by:
•A net decrease in the restricted cash amount of EUR -257 million (excluding exchange rate effects), essentially from the NTE toll road (EUR -70 million), I-66 (EUR -82 million) and the I-77 (EUR -101 million), due mainly to the distribution of dividends in these toll roads.
•The exchange rate effect reached EUR 29 million, mainly generated by US dollar fluctuations (Note 1.4).
Other cash and cash equivalents relate to bank accounts and highly-liquid investments subject to interest rate risk.
For 2023:
Short-term balances, which amounted to EUR 31 million, are recognized under cash and cash equivalents in the balance sheet, whereas long-term balances totaling EUR 596 million are carried as financial assets. Therefore, short- and long-term restricted cash recognized at December 31, 2023 amounts to EUR 627 million and relates to the NTE Segment 3, LBJ, I-77, I-66 and NTE Mobility Partners toll roads (EUR 23 million, EUR 7 million, EUR 99 million, EUR 134 million and EUR 333 million, respectively), as well as to other European concessions in the amount of EUR 31
SECTION 5: CAPITAL AND
FINANCING STRUCTURE
million, primarily treatment plants in the United Kingdom and the Autovía de Aragón toll road in Spain (EUR 14 million, EUR 17 million respectively).
Other cash and cash equivalents relate to bank accounts and highly-liquid investments subject to interest rate risk.
b) Cash and cash equivalents and restricted cash of ex- infrastructures projects
Cash and cash equivalents of ex-infrastructure project companies at December, 31 2024 and December, 31 2023 amounted to EUR 4,653 million and EUR 4,585 million, respectively. At December 2023, EUR 207 million denominated in Canadian dollars and the exchange rate risk affecting these cash and cash equivalents is fully hedged by forward derivatives.
At December, 31 2024, certain accounts totaling EUR 22 million (EUR 37 million at December, 31 2023) are restricted due mainly to the UK waste treatment business (Thalia). This is cash but is kept in escrow so that Thalia cannot access it without the Environment Agency's consent. When there is a need to pay for landfill aftercare in the future, the cash can be used at that time.
5.2.2 Borrowings
a) Infrastructure project companies
a.1) Breakdown by project, significant changes during the year and main features of the borrowings
There follows a breakdown of borrowings secured by project cash flows, distinguishing between bonds and bank borrowings, short- and long-term, and changes during 2024 and 2023:
| | | | | | | | | | | | | | | | | | | | | | | | | | | | | |
| 2024 | 2023 | Change 24/23 |
| (Million euro) | Bonds | Bank borrowings | Total | Bonds | Bank borrowings | Total | Bonds | Bank borrowings | Total |
| Long term | 5,198 | 3,058 | 8,256 | 4,441 | 3,412 | 7,852 | 758 | (354) | 404 |
| Toll roads | 5,198 | 2,707 | 7,905 | 4,441 | 2,937 | 7,378 | 758 | (230) | 528 |
| US toll roads | 5,198 | 2,138 | 7,337 | 4,441 | 2,307 | 6,748 | 758 | (169) | 589 |
| Spanish toll roads | — | 564 | 564 | — | 611 | 611 | — | (47) | (47) |
| Other concessions | — | 5 | 5 | — | 19 | 19 | — | (14) | (14) |
| Airports | — | — | — | — | 89 | 89 | — | (89) | (89) |
| Construction | — | 97 | 97 | — | 102 | 102 | — | (4) | (4) |
| Energy | — | 209 | 209 | — | 236 | 236 | — | (26) | (26) |
| Other | — | 44 | 44 | — | 48 | 48 | — | (4) | (4) |
| Short term | 1 | 142 | 143 | 1 | 62 | 63 | — | 81 | 81 |
| Toll roads | 1 | 38 | 39 | 1 | 31 | 33 | — | 7 | 7 |
| US toll roads | 1 | — | 1 | 1 | — | 1 | — | — | — |
| Spanish toll roads | — | 24 | 24 | — | 17 | 17 | — | 6 | 6 |
| Other concessions | — | 14 | 14 | — | 14 | 14 | — | 1 | 1 |
| Airports | — | 94 | 94 | — | 15 | 15 | — | 80 | 80 |
| Construction | — | 5 | 5 | — | 5 | 5 | — | 1 | 1 |
| Energy | — | 2 | 2 | — | 11 | 11 | — | (9) | (9) |
| Other | — | 3 | 3 | — | 3 | 3 | — | — | — |
| TOTAL | 5,199 | 3,200 | 8,400 | 4,442 | 3,473 | 7,915 | 757 | (272) | 485 |
The following table shows, for 2024 movements in infrastructure project borrowings, broken down into variations in borrowings with balancing entries in cash flows, exchange rate effects and scope changes, as well as movements in borrowings due to the accrual of interest, which do not affect period cash positions.
| | | | | | | | | | | | | | | | | | | | |
| (Million euro) | Dec. 2023 | Increase/decrease with impact on cash flow
| Foreign exchange effect | Impact of scope changes and other
| Capitalized/accrued interest | Dec. 2024 |
| Infrastructures project borrowings | 7,915 | | 70 | | 472 | | (22) | | (36) | | 8,400 | |
Infrastructure project borrowings increased by EUR 485 million in 2024 with respect to December 2023, mainly for the following reasons:
•Exchange rate effect amounting to EUR 472 million, mainly due to the appreciation of the US dollar against the euro.
•Increase of EUR 34 million in debt, excluding the foreign exchange effect and scope changes, relating primarily to the US projects and attributable to the debt drawn down by the I-77 toll road, capitalization of interest and accrued unmatured interest.
US toll roads:
NTE Mobility Partners, LLC
Regarding NTE Mobility Partners, the total debt at December, 31 2024 reached USD 1,600 million were as follows:
–A taxable bond issue of USD 871.1 million maturing in 2049 at a fixed interest rate of 3.92% and a PAB (Private Activity Bonds) issue of USD 331.8 million (at a fixed interest rate of 4.00% for USD 122.8 million and 5.00% for USD 209.0 million, repayable from 2030 to 2039).
–USD 397 million in bonds issued in August 2023 at a fixed interest rate of 5.50%, repayable from 2052 to 2058, for the funding of the Mandatory Capacity Improvement project.
SECTION 5: CAPITAL AND
FINANCING STRUCTURE
NTE Mobility Partners Seg 3 LLC
In relation to NTE Mobility Partners Seg 3 LLC the total debt at December 31, 2024 reached USD 1,578 million. This debt consists of:
–The issuance of USD 265.9 million in PABs related to the debt of the 3A-3B segments at a rate of 5.00% fixed interest on USD 32.4 million, 5.13% on USD 22.5 million, 5.25% on USD 23.7 million, 5.38% on USD 64.7 million and 5.50% on USD 122.6 million.
–A TIFIA loan in the amount of USD 437.7 million at a fixed rate of 3.84% at December 31, 2024 with final maturity in 2053.
–Amount of USD 221 million drawn down in 2024 from the 5-year bonds.
–The issuance of USD 653.9 million in PABs repayable from 2047 to 2058 at a fixed interest rate of 5.00% for the debt of segment 3C (total of USD 750 million including the issuance premium).
LBJ Infr. Group LLC
The total debt of this company at December 31, 2024 reached USD 2,007 million. This debt consists of:
–A PABs issuance of USD 537.5 million (total of USD 615 million including the premium) at a fixed interest rate of 4.00%, repayable from 2030 to 2040.
–Taxable bond issuance of USD 615.5 million (of which USD 7 million bears a fixed interest rate of 2.75% and matures in 2026, and USD 608.5 million bears a fixed interest rate of 3.80% and matures in 2057).
–A TIFIA loan granted by the U.S. Federal Government, valued at USD 835.6 million as of December 31, 2024, with an amortization profile from 2035 to 2050, bearing a fixed interest rate of 4.22%.
–A credit line maturing in 2027 with an interest rate of 4.51%, of which USD 18.0 million had been drawn as of December 31, 2024.
I-77 Mobility Partners, LLC
The total debt of I-77 Mobility Partners, LLC this company at December 31, 2024 reached USD 471 million. This debt consists of:
–USD 100 million in PABs at a fixed rate of 5.00% maturing between 2026 and 2030.
–On April 25, 2024, the issuance of USD 371 million in Senior Secured Notes was completed, the proceeds of which were used to refinance the TIFIA debt, thereby increasing the average maturity of the outstanding debt. The Senior Secured Notes bear interest at a fixed rate of 6.57% and mature in 2051.
–On April 26, 2024, the TIFIA debt was repaid in full.
I-66 Mobility Partners, LLC
Regarding I-66 Mobility Partners, LLC, the total debt of this company at December 31, 2024 reached USD 2,084 million. This debt consists of:
–USD 737 million in PABs (a total of USD 800.4 million including the premium) at a fixed rate of 5.00%, maturing between 2047 and 2056.
–A TIFIA loan balance of USD 1,346.9 million, of which USD 21.2 million had been prepaid as of December 31, 2024. This loan bears interest at a fixed rate of 2.8% and finally matures in 2057.
Spanish toll roads:
Cintra Inversora Autopistas de Cataluña (Terrasa Manresa toll road)
In relation to Cintra Inversora Autopistas de Cataluña , the total debt of this company at December 31, 2024 reached EUR 584.9 million. This debt consists of:
–Tranches A and B amounting to EUR 264.9 million and EUR 280.3 million as of December 31, 2024, accruing interest at the 6-month EURIBOR rate +3.672% +1.5% at year-end. Both tranches were fully utilized and fall due in 2035.
–A liquidity tranche (tranche C) with a balance of EUR 39.7 million as of December 31, 2024 (the year-end interest rate is the 6-month EURIBOR +3.672% +1.5%).
–It should also be noted that this company has an interest rate derivative with a notional amount of EUR 551.7 million, with a guaranteed interest rate of 5.2064% and maturity in 2035. The fair value of the derivative (recognized under “Derivative financial instruments”, Note 5.5) was EUR -83.4 million at the year- end 2024.
Breakdown of other projects:
| | | | | | | | | | | | | | | | | | | | | | | |
| 2024 | 2023 | |
| (Million euro) | Long term | Short term | Total | Long term | Short term | Total | Change 24/23 |
| Autovía de Aragón | 5 | | 14 | | 19 | | 19 | | 14 | | 33 | | (14) | |
| Dalaman International Airport | — | | 94 | | 94 | | 89 | | 15 | | 104 | | (10) | |
| Conc. Prisiones Lledoners,S.A. | 61 | | 3 | | 63 | | 63 | | 2 | | 65 | | (2) | |
| Depusa Aragón S.A. | 22 | | 2 | | 24 | | 24 | | 1 | | 25 | | (2) | |
| Budimex Group | 15 | | 1 | | 16 | | 15 | | 1 | | 16 | | — | |
| Parque Solar Casilla | — | | — | | — | | 20 | | 3 | | 23 | | (22) | |
| Transchile Charrúa Transmisión, S.A. | 105 | | — | | 105 | | 91 | | 8 | | 99 | | 5 | |
| Centella Transmisión, S.A. | 105 | | 2 | | 106 | | 125 | | — | | 125 | | (18) | |
| UK Waste Treatment (Thalia) | 44 | | 3 | | 47 | | 48 | | 1 | | 49 | | (2) | |
| TOTAL Other infrastructure project company borrowings | 356 | | 119 | | 474 | | 494 | | 44 | | 538 | | (64) | |
SECTION 5: CAPITAL AND
FINANCING STRUCTURE
Other project borrowings decreased by EUR -64 million against December 2023 primarily in the Autovía de Aragón, Spanish toll road. Also noteworthy is Dalaman international airport, which waiver effective as of December 31, 2024, originally ending on February 28, 2025, has been extended to December 31, 2025. In December 2024, the airport´s borrowings (EUR 94 million) were reclassified from long-term to short-term.
On December 2024, Centella Transmisión S.A. carried out a refinancing operation in the amount of USD 112.6 million at a “Daily Compounded SOFR” rate, applicable to any business day of the U.S. government securities market during an interest period, with a maturity date of December 12, 2029. In addition, in December 2024, Centella also repaid the credit line with Ferrofin S.L., which at December 31, 2023 amounted to EUR 31 million.
a.2) Maturities by currency and fair value of infrastructure project company borrowings
December 31, 2024
| | | | | | | | | | | | | | | | | | | | | | | | | | | | | | | | | |
| (Million euro) | Currency | Fair value 2024 | Carrying amount 2024 | 2025 | 2026 | 2027 | 2028 | 2029 | 2030+ | Total maturities | |
| Infrastructure project company obligations | | 3,574 | | 5,199 | | 1 | | 8 | | 1 | | 215 | | 1 | | 4,704 | | 4,930 | | |
| TOLL ROADS | | 3,574 | | 5,199 | | 1 | | 8 | | 1 | | 215 | | 1 | | 4,704 | | 4,930 | | |
| USD | 3,574 | | 5,199 | | 1 | | 8 | | 1 | | 215 | | 1 | | 4,704 | | 4,930 | | |
| EUR | — | | — | | — | | — | | — | | — | | — | | — | | — | | |
| | | | | | | | | | | |
| | | | | | | | | | | |
| | | | | | | | | | | |
| | | | | | | | | | | |
| | | | | | | | | | | |
| Bank borrowings of infrastructure project companies | | 3,200 | | 3,200 | | 120 | | 233 | | 155 | | 151 | | 274 | | 2,690 | | 3,624 | | |
| TOLL ROADS | | 2,745 | | 2,745 | | 98 | | 104 | | 130 | | 122 | | 133 | | 2,565 | | 3,152 | | |
| USD | 2,138 | | 2,138 | | 70 | | 71 | | 95 | | 79 | | 82 | | 2,153 | | 2,549 | | |
| EUR | 607 | | 607 | | 28 | | 33 | | 35 | | 43 | | 51 | | 412 | | 603 | | |
| AIRPORTS | | 94 | | 94 | | 14 | | 16 | | 18 | | 20 | | 21 | | 16 | | 105 | | |
| EUR | 94 | | 94 | | 14 | | 16 | | 18 | | 20 | | 21 | | 16 | | 105 | | |
| CONSTRUCTION | | 103 | | 103 | | 4 | | 4 | | 5 | | 5 | | 5 | | 79 | | 102 | | |
| EUR | 87 | | 87 | | 4 | | 4 | | 5 | | 5 | | 5 | | 64 | | 87 | | |
| PLN | 16 | | 16 | | — | | — | | — | | — | | — | | 15 | | 15 | | |
| ENERGY | | 211 | | 211 | | 2 | | 106 | | — | | — | | 109 | | — | | 216 | | |
| EUR | — | | — | | — | | — | | — | | — | | — | | — | | — | | |
| USD | 211 | | 211 | | 2 | | 106 | | — | | — | | 109 | | — | | 216 | | |
| OTHER | | 47 | | 47 | | 3 | | 3 | | 3 | | 4 | | 5 | | 30 | | 49 | | |
| GBP | 47 | | 47 | | 3 | | 3 | | 3 | | 4 | | 5 | | 30 | | 49 | | |
| TOTAL INFRASTRUCTURE PROJECT COMPANY BORROWINGS | | 6,774 | | 8,400 | | 121 | | 241 | | 156 | | 366 | | 275 | | 7,394 | | 8,554 | | |
December 31, 2023
| | | | | | | | | | | | | | | | | | | | | | | | | | | | | | | | |
| (Million euro) | Currency | Fair value 2023 | Carrying amount 2023 | 2024 | 2025 | 2026 | 2027 | 2028 | 2029+ | Total maturities |
| Infrastructure project company obligations | | 4,092 | | 4,442 | | — | | 1 | | 7 | | 1 | | 1 | | 2,625 | | 2,636 | |
| TOLL ROADS | | 4,092 | | 4,442 | | — | | 1 | | 7 | | 1 | | 1 | | 2,625 | | 2,636 | |
| USD | 4,092 | | 4,442 | | — | | 1 | | 7 | | 1 | | 1 | | 2,625 | | 2,636 | |
| EUR | — | | — | | — | | — | | — | | — | | — | | — | | — | |
| | | | | | | | | | |
| | | | | | | | | | |
| | | | | | | | | | |
| | | | | | | | | | |
| | | | | | | | | | |
| Bank borrowings of infrastructure project companies | | 3,473 | | 3,473 | | 76 | | 60 | | 285 | | 61 | | 169 | | 4,782 | | 5,434 | |
| TOLL ROADS | | 2,968 | | 2,968 | | 34 | | 38 | | 34 | | 35 | | 141 | | 4,627 | | 4,909 | |
| USD | 2,307 | | 2,307 | | 3 | | — | | — | | — | | 97 | | 4,154 | | 4,253 | |
| EUR | 661 | | 661 | | 31 | | 38 | | 34 | | 35 | | 44 | | 473 | | 656 | |
| AIRPORTS | | 104 | | 104 | | 10 | | 14 | | 16 | | 18 | | 20 | | 37 | | 115 | |
| EUR | 104 | | 104 | | 10 | | 14 | | 16 | | 18 | | 20 | | 37 | | 115 | |
| CONSTRUCTION | | 106 | | 106 | | 4 | | 4 | | 4 | | 5 | | 5 | | 84 | | 106 | |
| EUR | 91 | | 91 | | 4 | | 4 | | 4 | | 5 | | 5 | | 69 | | 91 | |
| PLN | 15 | | 15 | | — | | — | | — | | — | | — | | 15 | | 15 | |
| ENERGY | | 295 | | 295 | | 28 | | 5 | | 230 | | 3 | | 4 | | 34 | | 304 | |
| USD | 224 | | 224 | | 2 | | 2 | | 228 | | — | | — | | — | | 232 | |
| OTHER | | 49 | | 49 | | 3 | | 3 | | 3 | | 3 | | 4 | | 34 | | 49 | |
| GBP | 49 | | 49 | | 3 | | 3 | | 3 | | 3 | | 4 | | 34 | | 49 | |
| TOTAL INFRASTRUCTURE PROJECT COMPANY BORROWINGS | | 7,565 | | 7,915 | | 76 | | 61 | | 292 | | 62 | | 171 | | 7,407 | | 8,070 | |
At December 31, 2024 the difference between the total maturities of bank borrowings of EUR 8,554 million (EUR 8,070 million in 2023) and the carrying amounts recognized at December 31, 2024 in the amount of EUR 8,400 million (EUR 7,915 million in 2023) is explained mainly by the difference between the nominal values and carrying amounts of the borrowings, as certain adjustments are made in accordance with applicable accounting rules. Thus, the accrued interest payable and the application of the amortized cost method had an impact of EUR 154 million (EUR 155 million in 2023), considering that the maturities of the borrowings do not include interest.
The fair value reflected in the table above is calculated as follows:
SECTION 5: CAPITAL AND
FINANCING STRUCTURE
•For fixed-rate bonds, subject to changes in value due to fluctuations in market interest rates: since they are quoted in an active market, the related market value is used.
•For fixed-interest bank borrowings, also subject to changes in value due to fluctuations in rates: future cash flows are discounted using a market interest rate, calculated using an internal valuation model.
•Lastly, for floating-rate bank borrowings: no significant differences are deemed to exist between the fair value of the borrowings and their carrying amount and therefore the carrying amount is used.
a.3) Information on credit limits and credit drawable for infrastructure projects
There follows is a comparative analysis of borrowings not drawn down at December 31, 2024 and 2023:
| | | | | | | | | | | | | | | | | | | | | | | | | | |
| 2024 | 2023 |
| (Million euro) | Limit | Utilized | Drawable | Debt recognized | Limit | Utilized | Drawable | Debt recognized |
| Toll Roads | 8,091 | | 8,082 | | 9 | | 7,945 | | 7,545 | | 7,545 | | — | | 7,410 | |
| US toll roads | 7,479 | | 7,479 | | — | | 7,338 | | 6,889 | | 6,889 | | — | | 6,749 | |
| Spanish toll roads | 593 | | 584 | | 9 | | 587 | | 623 | | 623 | | — | | 628 | |
| Other concessions | 19 | | 19 | | — | | 19 | | 33 | | 33 | | — | | 33 | |
| Airports | 105 | | 105 | | — | | 94 | | 115 | | 115 | | — | | 104 | |
| Construction | 103 | | 102 | | — | | 103 | | 106 | | 106 | | 1 | | 106 | |
| Energy | 220 | | 216 | | 4 | | 211 | | 255 | | 255 | | — | | 246 | |
| Other | 49 | | 49 | | — | | 47 | | 49 | | 49 | | — | | 49 | |
| TOTAL BORROWINGS | 8,567 | | 8,554 | | 13 | | 8,400 | | 8,070 | | 8,070 | | 1 | | 7,915 | |
a.4) Guarantees and covenants for project borrowings
The borrowings classified as project borrowings are without recourse to the project shareholders or with recourse limited to the guarantees given. The guarantees given by Ferrovial subsidiaries for project borrowings are described in Note 6.5, Contingent liabilities.
After reviewing the information reported by the businesses and conducting a subsequent review, we have concluded that there is no event of default for the fully-consolidated project companies as of December 31, 2024. In the case of Dalaman International Airport, there was a waiver effective as of December 31, 2024, originally ending on February 28, 2025. As this waiver ended before December 2025, the borrowings of the airport have been reclassified from long-term to short-term at December 2024. On February 17, 2025 the waiver has been extended to December 31, 2025.
At December 31 2023, all the fully-consolidated project companies fulfilled the significant covenants in force.
b) Ex-infrastructure projects
b.1) Breakdown of short- and long-term borrowings, changes during 2024 and main features
| | | | | | | | | | | | | | | | | | | | | | | |
| | | 2024 | | | 2023 | |
| (Million euro) | Long term | Short term | Total | Long term | Short term | Total | | | |
| Corporate bonds and debentures | 1,773 | | 518 | | 2,292 | | 2,270 | | 320 | | 2,590 | | | | |
| Euro Commercial Paper | — | | 249 | | 249 | | — | | 500 | | 500 | | | | |
| Corporate liquidity lines | 60 | | 252 | | 312 | | 296 | | — | | 296 | | | | |
| Other borrowings | 3 | | 33 | | 36 | | 5 | | 58 | | 63 | | | | |
| TOTAL BORROWINGS EXCLUDING INFRASTRUCTURE PROJECT COMPANIES | 1,836 | | 1,052 | | 2,889 | | 2,571 | | 879 | | 3,449 | | | | |
The following table shows changes to ex-infrastructure project borrowings, broken down into variations in borrowings with balancing entries in cash flows, exchange rate effects and scope changes, as well as changes in borrowings due to the accrual of interest during 2024, which do not affect period cash positions:
| | | | | | | | | | | | | | | | | | | | |
| (Million euro) | Dec. 2023 | Increase/decrease with impact on cash flow | Foreign exchange effect | Impact of scope changes | Capitalized/accrued interest and other | Dec. 2024 |
| Bank borrowings | 3,449 | | (569) | | 19 | | — | | (11) | | 2,888 | |
| Cross- currency swaps | 13 | | — | | (16) | | — | | | (2) | |
| Ex-infrastructure projects borrowings | 3,463 | | (569) | | 4 | | — | | (11) | | 2,886 | |
b.1.1) Corporate debt
Corporate debt comprises the following debt instruments:
Corporate bonds:
The carrying amount totals EUR 2,292 million at December 31, 2024 (EUR 2,590 million at December, 31 2023). The breakdown is as follows:
SECTION 5: CAPITAL AND
FINANCING STRUCTURE
| | | | | | | | | | | |
| Issuance date | Nominal value (Million euro) | Maturity | Annual coupon |
| 3/29/2017 | 500 | | 3/31/2025 | 1.375 | % |
| 5/14/2020 | 780 | | 5/14/2026 | 1.38 | % |
| 11/12/2020 | 500 | | 11/12/2028 | 0.540 | % |
| 9/10/2023 | 500 | | 9/13/2030 | 4.375 | % |
Regarding the variation in corporate bonds during 2024, the repayment of the bond issued in July 2014 and maturing in July 2024 (EUR 300 million) should be noted. All issues completed for 2017 and up to 2023 are admitted to trading on the AIAF fixed income market (Spain). All these issuances except the 2023 bond, are guaranteed by the Company. The bond issued by Ferrovial SE in 2023 is listed on Euronext Dublin.
Euro Commercial Paper:
This Euro Commercial Paper (ECP) issuance program has been renewed each year since 2018, with maturities between 1 and 364 days as from the issue date, allowing further diversification of capital market funding and more efficient liquidity management.
The notes outstanding during 2024 were issued under the EUR 1,500 million Sustainability Target STEP label compliant Euro-commercial paper program registered on July 31, 2023, at an average rate of 3.74% (2023: 3.13%). Regarding the notes outstanding as of December 31, 2024, the average cost were 3.17% (2023: 4.09%).
Regarding the movement during 2024, it is worth noting the variation in the Euro Commercial Paper issued at December 2024 closing (EUR 249 million) compared to December 2023 (EUR 500 million), representing a reduction of EUR -251 million.
Other corporate debt:
In July 2018, Ferrovial refinanced the liquidity facility and included sustainability criteria in the process for a maximum of EUR 1.100 million. The limit was reduced to EUR 788 million in 2024 and the balance can be drawn-down in EUR, USD, CAD and GBP.
EUR 250 million had been utilized at December 31, 2024 and 2023, and in order to cover possible interest rate and foreign exchange fluctuations affecting this amount, Ferrovial arranged cross currency swaps for USD 260 million, maturing in 2025 for an agreed equivalent value of EUR 250 million, the fair value of which amounts to EUR 1.49 million (EUR -13 million at December 31, 2023).
Additionally, Ferrovial has a credit line, fully draw down, for a total of EUR 60 million which matures in 2027 at a fixed rate of 0.425%.
The Group’s liquidity stood at EUR 5,320 million and EUR 5,387 million (Note 5.4.d) at December 31, 2024 and 2023, respectively.
b.1.2) Information on corporate debt limits and drawable balances.
Set out below is a breakdown of corporate debt limits and drawable balances at December 31, 2024 and at December 31, 2023:
| | | | | | | | | | | | | | | | | | | | | | | | | | |
| 2024 | 2023 |
| (Million euro) | Limit | Utilized | Drawable | Consolidated debt | Limit | Utilized | Drawable | Consolidated debt |
| Bonds | 2,280 | | 2,280 | | — | | 2,292 | | 2,581 | | 2,581 | | — | | 2,590 | |
| Syndicated facility | 788 | | 250 | | 538 | | 252 | | 900 | | 250 | | 650 | | 236 | |
| ECPs | 249 | | 249 | | — | | 249 | | 500 | | 500 | | — | | 500 | |
| Credit lines | 60 | | 60 | | — | | 60 | | 60 | | 60 | | — | | 60 | |
| TOTAL CORPORATE DEBT | 3,377 | | 2,839 | | 538 | | 2,852 | | 4,041 | | 3,391 | | 650 | | 3,386 | |
The variation in corporate debt compared to December 2023 (EUR -534 million) is explained mainly by the repayment of the bond issued in July 2014 and maturing in July 2024 (EUR 300 million) and by the lower volume of ECPs outstanding (EUR -251 million).
The Company's credit rating
The credit rating agencies Standard & Poor’s and Fitch maintained their opinion regarding the financial rating of Ferrovial’s corporate debt in 2024 and 2023, respectively rating it at BBB and BBB with stable outlook and, therefore, within the “Investment Grade” category.
b.1.3) Other borrowings
At December 31, 2024 “Other borrowings” of EUR 36 million (EUR 63 million at December 31, 2023) related primarily to Construction Division bank borrowings.
b.1.4) Information on limits and drawable balances of other borrowings:
Set out below is a breakdown of debt limits and drawable balances at December 31, 2024 and 2023:
| | | | | | | | | | | | | | | | | | | | | | | | | | |
| 2024 | 2023 |
| (Million euro) | Limit | Utilized | Drawable | Consolidated debt | Limit | Utilized | Drawable | Consolidated debt |
| Construction | 131 | | 17 | | 114 | | 14 | | 163 | | 26 | | 137 | | 13 | |
| Airports | — | | — | | — | | 14 | | — | | — | | — | | 31 | |
| | | | | | | | |
| Other | 8 | | 8 | | — | | 8 | | 22 | | 20 | | 2 | | 19 | |
| OTHER BORROWINGS | 140 | | 26 | | 114 | | 36 | | 185 | | 46 | | 139 | | 63 | |
SECTION 5: CAPITAL AND
FINANCING STRUCTURE
The differences between total bank borrowings and the carrying amount at December 31, 2024 and 2023 are explained mainly by the difference between the nominal values and carrying amounts of the borrowings, as certain adjustments are made in accordance with applicable accounting rules.
b.2) Maturities by currency and fair value of borrowings excluding infrastructure project companies
At December 31, 2024:
| | | | | | | | | | | | | | | | | | | | | | | | | | | | | | | | |
| Borrowings (Million euro) | Currency | Fair value 2024 | Carrying amount 2024 | 2025 | 2026 | 2027 | 2028 | 2029 | 2030+ | Total maturities |
| Corporate debt | | 2,830 | | 2,852 | | 999 | | 780 | | 60 | | 500 | | — | | 500 | | 2,839 | |
| EUR | 2,830 | | 2,852 | | 999 | | 780 | | 60 | | 500 | | — | | 500 | | 2,839 | |
| Other borrowings | | 36 | | 36 | | 2 | | 9 | | 12 | | 2 | | 1 | | — | | 26 | |
| EUR | 7 | | 7 | | — | | — | | — | | 1 | | — | | — | | 1 | |
| PLN | 5 | | 5 | | 2 | | 1 | | 1 | | — | | 1 | | — | | 5 | |
| CLP | 7 | | 7 | | — | | — | | 7 | | 1 | | — | | — | | 8 | |
| Other | 17 | | 17 | | — | | 8 | | 4 | | — | | — | | — | | 12 | |
| TOTAL BORROWINGS EXCLUDING INFRASTRUCTURE PROJECT COMPANIES | | 2,866 | | 2,889 | | 1,001 | | 789 | | 72 | | 502 | | 1 | | 500 | | 2,865 | |
At December 31, 2023:
| | | | | | | | | | | | | | | | | | | | | | | | | | | | | | | | |
| Borrowings (Million euro) | Currency | Fair value 2023 | Carrying amount 2023 | 2024 | 2025 | 2026 | 2027 | 2028 | 2029+ | Total maturities |
| Corporate debt | | 3,331 | | 3,386 | | 800 | | 750 | | 781 | | 60 | | 500 | | 500 | | 3,391 | |
| EUR | 3,331 | | 3,386 | | 800 | | 750 | | 781 | | 60 | | 500 | | 500 | | 3,391 | |
| Other borrowings | | 63 | | 63 | | 21 | | 5 | | 13 | | 6 | | 1 | | — | | 46 | |
| EUR | 3 | | 3 | | — | | — | | — | | — | | 1 | | — | | 1 | |
| PLN | 9 | | 9 | | 1 | | 5 | | 2 | | 1 | | — | | — | | 9 | |
| CLP | 19 | | 19 | | 20 | | — | | — | | — | | — | | — | | 20 | |
| Other | 32 | | 32 | | — | | — | | 11 | | 5 | | — | | — | | 16 | |
| TOTAL BORROWINGS EXCLUDING INFRASTRUCTURE PROJECT COMPANIES | | 3,394 | | 3,449 | | 821 | | 755 | | 794 | | 66 | | 501 | | 500 | | 3,437 | |
The differences between the total maturities of borrowings and the carrying amounts of the debt at December 31, 2024 and 2023 are primarily explained by the difference between the nominal values and carrying amounts of the borrowings, as certain adjustments are made in accordance with applicable accounting legislation (basically accrued interest payable and the application of the amortized cost method).
The fair value of bank borrowings excluding infrastructure project companies matches the related carrying amount because the borrowings are tied to floating market interest rates and therefore changes to the benchmark interest rates do not affect fair value.
As corporate debts are quoted in an active market, the related market value is used.
On this basis, the estimated total fair value of bank borrowings and bonds excluding infrastructure project companies at December 31, 2024 and December 31, 2023 amounted to EUR 2,866 million and EUR 3,394 million, respectively.
The 2025 maturities total EUR 1,001 million and relate to the ECPs (EUR 249 million), corporate bonds (EUR 500 million) and liquidity facility (EUR 250 million). The debt maturities do not include interest.
5.3 CASH FLOW
The following table summarizes the cash flows from operating, investing and financing activities for each of the years ended December 31, 2024, 2023 and 2022.
| | | | | | | | | | | | |
| (Million euro) | | 2024 | 2023 | 2022 |
| Cash flows from operating activities ex tax payments | | 1,485 | | 1,433 | | 1,084 | |
| Tax payments | | (192) | | (170) | | (82) | |
| Cash flows from operating activities | | 1,293 | | 1,263 | | 1,002 | |
| | | | |
| | | | |
| | | | |
| | | | |
| | | | |
| | | | |
| Investment | | (1,269) | | (468) | | (1,161) | |
| | | | |
| | | | |
| Divestment | | 2,582 | | 43 | | 429 | |
| Cash flows from investing activities | | 1,313 | | (425) | | (732) | |
| Cash flows before financing activities | | 2,606 | | 838 | | 270 | |
| | | | |
| | | | |
| | | | |
| | | | |
| | | | |
| | | | |
| | | | |
| | | | |
| | | | |
| | | | |
| | | | |
| | | | |
| | | | |
| | | | |
| | | | |
| | | | |
| | | | |
| Cash flows from financing activities | | (2,567) | | (1,179) | | (676) | |
| | | | |
| Change in cash and cash equivalents | | 39 | | (341) | | (406) | |
| | | | |
| | | | |
Cash flows from discontinued operations:
The cash flows from discontinued operations are included in the group reported cash flows. The following table shows the disclosure corresponding to the period 2024, 2023 and 2022.
SECTION 5: CAPITAL AND
FINANCING STRUCTURE
| | | | | | | | | | | | |
2024-2022
(Million euro) | 2024 | 2023 | 2022 | |
| Cash flows from operating activities ex tax payments | — | | — | | 20 | | |
| Tax payments | — | | — | | (1) | | |
| Cash flows from operating activities | — | | — | | 19 | | |
| Investment | — | | — | | (1) | | |
| Divestment | — | | — | | — | | |
| Cash flows before financing activities | — | | — | | 18 | | |
| | | | |
5.4 FINANCIAL RISK AND CAPITAL MANAGEMENT
The Group’s businesses are affected by changes to financial variables, such as interest rates, exchange rates, inflation, credit, liquidity and equities.
The following are specific data on the Group's exposure to each of these risks and an analysis of the sensitivity to a change in the various variables, together with a brief description of the way in which each risk is managed.
a) Exposure to interest rate fluctuations
Ferrovial's businesses are exposed to interest rate fluctuations, which may affect the Company’s net financial expense due to the variable interest on financial assets and liabilities, as well as the measurement of financial instruments arranged at fixed interest rates.
Ferrovial manages interest rate risk so as to optimize the financial expense borne by the Group and achieve suitable proportions of fixed- and variable-rate debt based on market conditions. Therefore, when interest rates are low, the Group seeks to fix future amounts at the ex-infrastructure project company level, although such hedging can affect liquidity in the event of cancellation.
At the infrastructure project company level, banks and rating agencies require a higher percentage of fixed-rate debt. These strategies are implemented by issuing fixed-rate debt or by arranging financial derivative hedges, a breakdown of which is provided in Note 5.5 Financial derivatives at fair value.
The accompanying tables show a breakdown of the Group’s borrowings, indicating the percentage of borrowings that is considered to be hedged (either by a fixed rate or by derivatives).
| | | | | | | | | | | | | | | | | | | | | | | | | | |
| BORROWINGS | | | | 2024 | | | | 2023 |
| (Million euro) | Total debt | % debt hedged | Net exposed debt | Impact on profit/(loss) + 100 bps | Total debt | % debt hedged | Net exposed debt | Impact on profit/(loss) + 100 bps |
| Ex-infrastructure project companies | 2,886 | | 91 | % | 255 | | 3 | | 3,463 | | 92 | % | 260 | | 3 | |
| Toll Roads | 7,945 | | 97 | % | 237 | | 2 | | 7,410 | | 99 | % | 51 | | 1 | |
| Airports | 94 | | 96 | % | 4 | | — | | 104 | | 100 | % | — | | 1 | |
| Construction | 103 | | 90 | % | 10 | | — | | 106 | | 91 | % | 10 | | — | |
| Energy | 211 | | 100 | % | — | | — | | 246 | | 93 | % | 18 | | — | |
| Other | 47 | | 100 | % | — | | — | | 49 | | 93 | % | 4 | | — | |
| Infrastructure project companies | 8,400 | | 97 | % | 251 | | 2 | | 7,915 | | 99 | % | 83 | | 1 | |
| Total borrowings | 11,288 | | 96 | % | 503 | | 5 | | 11,378 | | 97 | % | 343 | | 4 | |
Accordingly, in the fully-consolidated companies, a linear increase of 100 basis points in market interest rate curves at December 31, 2024 and 2023 would increase financial expenses in the income statement by an estimated EUR 5 million (EUR 4 million at December 31, 2023), of which EUR 2 million (EUR 1 million at December, 31 2023) relates to infrastructure project companies and EUR 3 million (EUR 3 million at December 31, 2023) to ex-infrastructure project companies, entailing a net effect on Ferrovial’s results of EUR 3 million (EUR 3 million at December 31, 2023) (expense).
The Group's cash amounted to EUR 4,828 million in 2024 (EUR 4,789 million in 2023), a large portion of it at variable rates, which meant an improvement in the financial result for the year.
It is also necessary to take into account changes in the fair value of the financial derivatives arranged, which are indicated in Note 5.5.
As regards these interest rate hedging instruments, a linear increase of 100 basis points in the market yield curves at December 31, 2024 would, in the case of the effective hedges, have a positive impact of approximately EUR 63 million on shareholders’ funds attributable to the parent from fully consolidated companies (EUR 109 million at December 31, 2023), while a decrease of 100 basis points would have a negative impact of approximately EUR 54 million (EUR 41 million at December 31, 2023).
As a balancing entry for this impact, it should be noted that a drop in interest rates would trigger an increase in the value of the projects, through a lower discount rate.
b) Exposure to foreign exchange fluctuations
Ferrovial regularly monitors net exposure to each currency over the coming years for dividends receivable, investments in new projects and potential divestments.
Ferrovial establishes its hedging strategy by analyzing past fluctuations in both short-term and long-term exchanges rates and has monitoring mechanisms in place, such as future projections and long-term equilibrium exchange rates. These hedges consist of foreign currency deposits or derivatives (see Note 5.5 for more details).
SECTION 5: CAPITAL AND
FINANCING STRUCTURE
The following tables show, by type of currency, the value of assets, liabilities, non-controlling interests and shareholders’ funds attributed to the parent company at December 2024 and 2023, adjusted to account for the above-mentioned currency forwards relating to each currency:
| | | | | | | | | | | | | | |
| DEC. 2024 |
| Currency | Assets | Liabilities | Parent company shareholders’ funds | Non-controlling interests |
| (Million euro) |
| Euro | 8,145 | 4,815 | 3,119 | 211 |
| Pound sterling | 602 | 382 | 219 | 1 |
| US dollar | 15,561 | 13,131 | 796 | 1,634 |
| Canadian dollar | 882 | 457 | 425 | — |
| Australian dollar | 289 | 215 | 74 | — |
| Polish zloty | 1,918 | 1,576 | 144 | 199 |
| Chilean peso | 251 | 132 | 120 | — |
| Colombian peso | 233 | 133 | 100 | — |
| Indian rupee | 1,026 | 3 | 1,023 | — |
| Other | 91 | 36 | 56 | — |
| GROUP TOTAL | 28,999 | 20,879 | 6,075 | 2,045 |
| | | | | | | | | | | | | | |
| DEC. 2023 |
| Currency | Assets | Liabilities | Parent company shareholders’ funds | Non-controlling interests |
| (Million euro) |
| Euro | 7,957 | 5,996 | 1,780 | 181 |
| Pound sterling | 715 | 477 | 237 | 1 |
| US dollar | 13,399 | 11,294 | 408 | 1,696 |
| Canadian dollar | 976 | 469 | 507 | — |
| Australian dollar | 269 | 225 | 44 | — |
| Polish zloty | 2,011 | 1,613 | 164 | 234 |
| Chilean peso | 301 | 191 | 110 | — |
| Colombian peso | 230 | 142 | 89 | — |
| Indian rupee | 380 | 4 | 376 | — |
| Other | 81 | 28 | 52 | 1 |
| GROUP TOTAL | 26,318 | 20,439 | 3,766 | 2,113 |
Note 1.4 contains a breakdown of year-end exchange rates. As a result of these changes, the impact of currency translation differences on equity at December 31, 2024 EUR was 33 million (EUR -83 million at December 31, 2023) for the parent company. A breakdown by currency is set out in Note 5.1.1.
After analyzing sensitivity to exchange rate effects, for 2024 Ferrovial estimates that a 10% depreciation in the value of the euro at the year-end against the main currencies in which the Group holds investments would have an impact on the parent company shareholders' funds of EUR 322 million, of which 35% would relate to the effect of the Indian rupee, 27% to the US dollar and 15% to the Canadian dollar.
Note 1.4 contains a breakdown of average exchange rates for 2024 and 2023. In this regard, the impact on the income statement of a 10% appreciation of the euro against other currencies would have amounted to a change of EUR 56 million in 2024 (EUR 52 million in 2023).
c) Exposure to credit and counterparty risk
The Group’s main financial assets exposed to credit or counterparty risk are as follows:
| | | | | | | | | | | |
| (Million euro) | 2024 | 2023 | Var. 24/23 |
Investments in financial assets (1) | 1,945 | | 671 | | 1,275 | |
| Non-current financial assets | 1,297 | | 1,310 | | (19) | |
| Net financial derivatives (assets) | 241 | | 285 | | (44) | |
| Trade and other receivables | 2,223 | | 1,677 | | 525 | |
(1) Included in cash and cash equivalents |
•Ferrovial actively and continuously monitors counterparty risk affecting financial transactions and performs internal credit quality analyses on each of the financial institutions with which there is exposure. The Company´s internal policy for the investment of cash surpluses establishes the minimum counterparty risk as investment grade rating.
•The internal rules for managing cash surpluses impose maximum investment limits for each counterparty, based on objective criteria: minimum acceptable risk requirements for the investment of cash surpluses and limits on the amounts invested in line with the defined risk in each case. In addition, the Risk Department monitors each counterparty’s performance and proposes appropriate protective or corrective measures depending on the specific circumstances.
•Geographies: Ferrovial monitors trends in markets (geographies) where it has operations, as well as in its target markets. The Financial Risk Department proposes potential actions to be taken should changes in risk levels be expected in a particular geography or market.
•Customers: Ferrovial analyses and monitors customer credit risk by means of an internal method used by all the Group companies to assign credit ratings to Ferrovial’s customers.
SECTION 5: CAPITAL AND
FINANCING STRUCTURE
d) Exposure to liquidity risk
The Group has the necessary mechanisms in place to preserve the required liquidity through periodic procedures that take account of cash flow projections, cash needs, short-term collections and payments, and long-term obligations.
Ex-infrastructure project companies
At December 31, 2024, cash and cash equivalents amounted to EUR 4,653 million (EUR 4,585 million in 2023. At that date, undrawn credit lines totaled EUR 652 million (EUR 789 million in 2023), forwards hedging cash flows denominated in a currency other than the euro amounted to EUR -5 million (EUR -18 million in 2023) and long term restricted cash stood at EUR 21 million (EUR 32 million in 2023).
Therefore, liquidity totaled EUR 5,320 million (EUR 5,387 million in December 2023).
Infrastructure projects companies
At December 31, 2024, cash and cash equivalents (including short-term restricted cash) amounted to EUR 175 million (EUR 204 million in 2023). Also, at that date undrawn credit lines stood at EUR 13 million (EUR 1 million in 2023), and were primarily arranged to cover committed investment needs.
Liquidity (including long-term restricted cash) totaled EUR 557 million (EUR 817 million in December 2023).
e) Equities risk exposure
Ferrovial is exposed to the risk of fluctuations in its own share price. This exposure arises from equity swaps used to hedge against risks of appreciation of share-based remuneration schemes, the detail of which is shown in Note 5.5 to these consolidated financial statements.
As the equity swaps are not classified as accounting hedges, the market value has an impact on profit or loss. Accordingly, a EUR 1 increase/decrease in Ferrovial’s share price would have a positive/negative impact of EUR 2.8 million on Ferrovial’s net profit/(loss) in 2024.
f) Exposure to inflation risk
Most of the revenue from infrastructure projects is associated with prices tied directly to inflation. This is the case of the prices of both the toll road concession contracts and those of Heathrow. Therefore, an increase in inflation as is currently the case will increase cash flows from assets of this kind.
The rise in inflation may have an adverse effect on operating margins under the construction contracts. However, a substantial part of the division's portfolio is protected against the effects of rising inflation due to the existence of price adjustment contract clauses linked to inflation in certain jurisdictions, such as Poland or, in certain contracts, such as in Spain. In the absence of such clauses, the risk is hedged by closing the main direct costs at the time of bidding.
g) Capital management
The Group aims to achieve a debt-equity ratio that makes it possible to optimize costs while safeguarding the capacity to continue managing recurring activities and the capacity to continue to grow through new projects in order to create shareholder value.
With regard to borrowings, the Ferrovial Group seeks to maintain a level of indebtedness, excluding infrastructure project companies, so as to retain an investment grade credit rating. To achieve this, a clear and consistent financial policy has been established in which a relevant metric refers to the maintenance of an ex-projects net debt (borrowings less cash and cash equivalents) to EBITDA ratio, plus project dividends, of no more than 2x.
5.5 FINANCIAL DERIVATIVES AT FAIR VALUE
a) Breakdown by type of derivative, movements, maturity dates and main features
The table below includes the fair values of the derivatives arranged at December 31, 2024, as well as the maturity dates of the notional amounts to which the derivatives relate (maturities of notional amounts are shown as positive figures and already-arranged future increases are presented as negative amounts):
CONSOLIDATED FINANCIAL STATEMENTS
FERROVIAL SE AND SUBSIDIARIES
| | | | | | | | | | | | | | | | | | | | | | | | | | | |
| TYPE OF INSTRUMENT | | | FAIR VALUE | NOTIONAL MATURITIES |
| (Million euro) | | (P) Proyecto | BALANCES AT 12/31/2024 | 2025 | 2026 | 2027 | 2028 | 2029 and beyond | TOTAL |
| ASSET BALANCES | | | 241 | | 421 | | 3 | | (1) | | (1) | | 2,748 | | 3,170 | |
| Toll road Division index-linked swaps | | P | 134 | | (4) | | (3) | | (3) | | (4) | | 89 | | 76 | |
| Corporate cross-currency swaps | | | 1 | | 250 | | — | | — | | — | | — | | 250 | |
| Toll road Division cross-currency swaps | | | 41 | | — | | — | | — | | — | | 1,850 | | 1,850 | |
| Corporate interest rate swaps | | | 1 | | — | | — | | — | | — | | 165 | | 165 | |
| Transchile and Centella interest rate swaps | | P | 19 | | 2 | | 2 | | — | | — | | 320 | | 324 | |
| Dalaman interest rate swaps | | P | 1 | | — | | — | | — | | — | | 72 | | 72 | |
| Toll road Division interest rate swaps | | P | 6 | | — | | — | | — | | — | | 231 | | 231 | |
| Corporate equity swaps | | | 29 | | 54 | | — | | — | | — | | — | | 54 | |
| | | | | | | | | |
| | | | | | | | | |
| Construction Division interest rate swaps | | P | 2 | | 1 | | 3 | | 2 | | 3 | | 20 | | 29 | |
| Other derivatives | | | 7 | | 117 | | 2 | | — | | — | | — | | 119 | |
| LIABILITY BALANCES | | | (132) | | 2,584 | | 40 | | 35 | | 43 | | 566 | | 3,268 | |
| Toll road Division interest rate swaps | | P | (84) | | 28 | | 37 | | 32 | | 40 | | 430 | | 567 | |
| | | | | | | | | |
| | | | | | | | | |
| | | | | | | | | |
| | | | | | | | | |
| | | | | | | | | |
| | | | | | | | | |
| Toll road Division foreign exchange derivatives | | | (38) | | 975 | | — | | — | | — | | — | | 975 | |
| Corporate foreign exchange derivatives | | | (4) | | 481 | | — | | — | | — | | 100 | | 581 | |
| Airport Division foreign exchange derivatives | | | (3) | | 1,068 | | — | | — | | — | | — | | 1,068 | |
| Thalia interest rate swaps | | P | (2) | | 3 | | 3 | | 3 | | 3 | | 36 | | 49 | |
| Other derivatives | | | (1) | | 29 | | — | | — | | — | | — | | 29 | |
| TOTAL | | | 109 | | 3,005 | | 43 | | 34 | | 42 | | 3,314 | | 6,438 | |
(P) - project companies
The maturities of cash flows comprising the fair value of the derivatives are set out below:
| | | | | | | | | | | | | | | | | | | | | | | | | | | |
| TYPE OF INSTRUMENT | | | FAIR VALUE | CASH FLOW MATURITIES |
| (Million euro) | | (P) Proyecto | BALANCES AT 12/31/2024 | 2025 | 2026 | 2027 | 2028 | 2029 and beyond | TOTAL |
| ASSET BALANCES | | | 241 | | 35 | | (2) | | (3) | | (4) | | 270 | | 296 | |
| Toll road Division index-linked swaps | | P | 134 | | 12 | | 12 | | 13 | | 13 | | 108 | | 158 | |
| Corporate cross-currency swaps | | | 1 | | 2 | | — | | — | | — | | — | | 2 | |
| Toll road Division cross-currency swaps | | | 41 | | (19) | | (19) | | (19) | | (19) | | 144 | | 68 | |
| Corporate interest rate swaps | | | 1 | | 1 | | — | | — | | — | | — | | 1 | |
| Transchile and Centella interest rate swaps | | P | 19 | | 4 | | 3 | | 1 | | 1 | | 17 | | 26 | |
| Dalaman interest rate swaps | | P | 1 | | 1 | | — | | — | | — | | — | | 1 | |
| Toll road Division interest rate swaps | | P | 6 | | 2 | | 2 | | 2 | | 1 | | — | | 7 | |
| Corporate equity swaps | | | 29 | | 29 | | — | | — | | — | | — | | 29 | |
| | | | | | | | | |
| | | | | | | | | |
| Construction Division interest rate swaps | | P | 2 | | — | | — | | — | | — | | 1 | | 2 | |
| Other derivatives | | | 7 | | 2 | | — | | — | | — | | — | | 2 | |
| LIABILITY BALANCES | | | (132) | | (57) | | (16) | | (13) | | (12) | | (38) | | (139) | |
| Toll road Division interest rate swaps | | P | (84) | | (16) | | (16) | | (14) | | (12) | | (37) | | (96) | |
| | | | | | | | | |
| | | | | | | | | |
| | | | | | | | | |
| | | | | | | | | |
| | | | | | | | | |
| | | | | | | | | |
| Toll road Division foreign exchange derivatives | | | (38) | | (38) | | — | | — | | — | | — | | (38) | |
| Corporate foreign exchange derivatives | | | (4) | | (4) | | — | | — | | — | | — | | (4) | |
| Airport Division foreign exchange derivatives | | | (3) | | (3) | | — | | — | | — | | — | | (3) | |
| Thalia interest rate swaps | | P | (2) | | — | | — | | — | | — | | (1) | | (1) | |
| Other derivatives | | | (1) | | 4 | | — | | — | | — | | — | | 4 | |
| TOTAL | | | 109 | | (23) | | (18) | | (16) | | (16) | | 232 | | 156 | |
(P) - project companies
Derivatives of project companies (P)
Interest Rate Swaps (IRS)
To hedge interest rate risk in infrastructure projects, the borrowings of which accrue variable interest (primarily Cintra Inversora Autopistas de Cataluña, S.A., Transchile, Centella, Autovía de Aragón, Depusa Aragón, Dalaman International Airport, and the UK waste treatment businesses, Thalia), the companies have contracted interest rate hedges on project debt, establishing a fixed or increasing interest rate, for a total notional amount of EUR 1,272 million at December 31, 2024. Overall, the fair value of these hedges has changed from EUR -39 million at December 2023 to EUR -58 million at December 2024.
In general, periodic hedge effectiveness measurements show that derivatives are effective, so changes in their fair value are recorded in reserves, amounting to EUR 16 million.
The movement in settlements, accruals and also in ineffectiveness, had an impact on net financial income/(expense) of EUR -1.19 million and on cash of EUR -0.46 million.
CONSOLIDATED FINANCIAL STATEMENTS
FERROVIAL SE AND SUBSIDIARIES
Index-linked swaps (ILS)
They relate solely to Autema, which arranged an index-linked swap fixing the annual inflation rate at 2.5% in 2008 to hedge revenue variability. The underlying hedged items are the toll flows and price compensation flows received by the Catalan Regional Government, which are inflation-adjusted. The rise in inflation during 2024 had an impact of EUR 12 million on reserves and a fair value impact of EUR 6 million on results.
Derivatives of ex-project companies
Interest rate swaps (IRS)
The Group has interest rate swaps in Ferrovial SE, which contracted a pre-hedge to hedge the refinancing of a future bond for a notional amount of EUR 165 million.
Cross-currency swaps (CCS)
At December 31, 2024, Ferrovial SE recorded cross-currency swaps to hedge a corporate liquidity line in US dollars (Note 5.2.2). These instruments have a notional value of USD 260 million (EUR 250 million agreed equivalent value) mature in 2025 and have a fair value of EUR 1.49 million (EUR -13 million in 2023).
The results of the effectiveness tests carried out show that the derivatives are effective. The change in fair value during the year had an impact of EUR -1 million on reserves, EUR 7 million on financial results and EUR -7 million on cash.
In addition, the Cintra Infrastructure SE Company and 407 Toronto Highway BV have cross-currency swaps (CCS) hedging the fair value of their net investment in the US in USD and the investment in Canada in CAD. These instruments have a notional amount of EUR 1,712 million and EUR 139 million, a maturity in 2032 and a fair value of EUR 40 million and EUR 1 million.
The result of the effectiveness tests carried out show that the derivatives are effective. The interest rate component of these derivatives, treated as a hedging cost, amounts to EUR 64 million and is recorded as reserves. As the coupons for the interest rate spread are paid, this cost is directly recognized as income. In addition, the impact of the investment hedges was EUR -109 million and is recognized as a translation difference.
Foreign exchange derivatives (FX)
There are foreign exchange hedges, designed for the Group's CAD investment. The notional amount is EUR 485 million at December 31, 2024 (CAD 732 million) (Note 1.3) and the fair value amount is EUR -5 million.
Value changes are recognized under currency translation differences in the amount of EUR 23 million in 2024. Additionally, movements in settlements and accruals had an impact of EUR -6 million on the financial result and EUR -1 million on cash.
There are also hedges of foreign currency risk, for the volatility of future cash flows in foreign currencies or assets denominated in foreign currencies (primarily the US dollar, pound sterling and Polish zloty). Their notional value stood at EUR 2,287 million at December 31, 2024, of which EUR 1,068 million relates to pounds sterling, EUR 976 million to the US dollar and EUR 142 million to the Polish zloty, they all expire in the short-term.
Value changes are recognized as translation differences and amounted to EUR -45 million in 2024 (for effective derivatives). Options, which are not classified as accounting hedges, are recognized in net financial income/(expense) at fair value, entailing an expense of EUR -4 million during the year.
Equity swaps (ES)
The Company has arranged equity swaps hedging the potential financial impact of the exercise of share-based remuneration schemes granted to employees. These swaps contracted by the Company generally hedge its own shares, and are therefore, treated as financial hedging derivatives but not as accounting hedges (speculative), so the change in fair value of these derivatives in recognized through the profit or loss as a fair value adjustment.
These contracts are described below:
•The calculation base comprises a given number of Ferrovial shares and a reference price, which is usually the share price on the execution date.
•During the swap term, Ferrovial pays interest at a given interest rate (EURIBOR plus a spread to be applied to the result of multiplying the number of shares by the strike price) and receives remuneration equal to the dividends on those shares.
•When the swap expires, if the share price has risen, Ferrovial will receive the difference between the arithmetic mean of the share price during the observation period and the reference price, multiplied by the number of shares contracted. Otherwise, Ferrovial will pay the difference to the financial institution.
Its fair value at December 31, 2024 is EUR 29 million. The change in value during the year was due to the increase in Ferrovial's share price from EUR 33 at December 31, 2023 to EUR 41 at December 31, 2024, entailing an impact of EUR 17 million under the income statement heading “Changes in the fair value of financial instruments”. The column “Impact on Net financial income/(expense)” includes the remuneration as income and the finance cost of these instruments as an expense in the amount of EUR -2 million (Note 2.6). The total impact of these instruments on cash resources amounted to EUR -6 million.
At December 2024, these derivatives had a notional value equivalent to 2,042 thousand shares which, based on the strike price of the equity swaps (price at which they must be settled with the banks), represented a total notional amount of EUR 54 million.
b) Main effects on the income statement and equity
Set out below is a breakdown of the main derivatives arranged by fully-consolidated companies showing movements in fair values at December 31, 2024 and December 2023 and the effect on reserves, profit/(loss) and other balance sheet items:
CONSOLIDATED FINANCIAL STATEMENTS
FERROVIAL SE AND SUBSIDIARIES
| | | | | | | | | | | | | | | | | | | | | | | | | | | | | | | | |
TYPE OF INSTRUMENT (Million euro) | FAIR VALUE | EFFECTS |
| BALANCES AT 12/31/2024 | BALANCES AT 12/31/2023 | Var. | EFFECT ON RESERVES (I) | FAIR VALUE EFFECT ON PROFIT/(LOSS) (II) | EFFECT ON FINANCIAL PROFIT/(LOSS) (III) | CASH (IV) | EXCHANGE RATE (V) | OTHER EFFECTS ON BALANCE SHEET OR INCOME | TOTAL |
| Inflation derivatives | 134 | | 115 | | 19 | | 12 | | 6 | | 4 | | (11) | | — | | 8 | | 19 | |
| Cash flow hedge | 134 | | 115 | | 19 | | 12 | | 6 | | 4 | | (11) | | — | | 8 | | 19 | |
| Interest rate derivatives | (57) | | (39) | | (17) | | 26 | | 3 | | (1) | | (1) | | 1 | | (45) | | (17) | |
| Cash flow hedge | (57) | | (39) | | (17) | | 17 | | 3 | | (1) | | (1) | | 1 | | (36) | | (17) | |
| Fair value hedge | — | | — | | — | | 9 | | — | | — | | — | | — | | (9) | | — | |
| Cross-currency swaps | 42 | | 58 | | (17) | | 77 | | (19) | | 7 | | 12 | | (109) | | 15 | | (17) | |
| Cash flow hedge | 1 | | (13) | | 14 | | (1) | | — | | 7 | | (7) | | — | | 15 | | 14 | |
| Hedge of net investment in foreign operations | 41 | | 72 | | (31) | | 78 | | (19) | | — | | 19 | | (109) | | — | | (31) | |
| Fair value hedge | — | | — | | — | | — | | — | | — | | — | | — | | — | | — | |
| Foreign exchange derivatives | (39) | | (1) | | (38) | | (2) | | (12) | | (6) | | 65 | | (23) | | (60) | | (38) | |
| Fair value hedge | (5) | | — | | (5) | | — | | (1) | | — | | — | | (4) | | — | | (5) | |
| Hedge of net investment in foreign operations | (38) | | (8) | | (30) | | — | | (5) | | (6) | | — | | (19) | | — | | (30) | |
| Cash flow hedge | (2) | | — | | (2) | | (2) | | 1 | | — | | 58 | | — | | (59) | | (2) | |
| Speculative | 6 | | 7 | | (1) | | — | | (7) | | — | | 7 | | — | | (1) | | (1) | |
| Equity swaps | 29 | | 20 | | 9 | | — | | 17 | | — | | (6) | | — | | (2) | | 9 | |
| Speculative | 29 | | 20 | | 9 | | — | | 17 | | — | | (6) | | — | | (2) | | 9 | |
| TOTAL | 109 | | 153 | | (44) | | 113 | | (5) | | 4 | | 59 | | (131) | | (84) | | (44) | |
Derivatives are recognized at market value at inception and at fair value at later dates. Changes in the value of these derivatives are recognized for accounting purposes as follows:
•Fair value changes during the year to the effective portion of cash flow hedging derivatives are recognized, with a balancing entry in reserves (column I).
•Fair value changes to derivatives that do not qualify for hedge accounting or are deemed to be speculative are recognized separately as a fair value adjustment in the Group’s income statement (column II).
•“Effect on net financial income/(expense)” (column III) reflects the effects of the financing of interest flows accrued during the year.
•The “Cash” column (IV) refers to net settlements of receipts and payments during the year.
•The effect of foreign exchange fluctuations on currency translation differences from December 31, 2023 to December 31, 2024 is also presented separately (column V).
•The “Other effects on balance sheet or income” column shows the effects on operating profit/(loss), net financial income/(expense) (exchange rate) and other effects not previously mentioned (column VI).
c) Derivative measurement methods
All the Group’s financial derivatives and other financial instruments carried at fair value are included in Level 2 of the fair value hierarchy since, though they are not quoted on regulated markets, they are based on directly or indirectly observable inputs.
Most of the fair value measurements are made by the Company using a tool developed in-house based on market best practices. However, all the internal valuations are reconciled against the values indicated by the counterparty banks on a monthly basis.
Equity swaps are measured as the difference between the quoted share price on the calculation date and the unit settlement (strike) price agreed at inception, multiplied by the number of shares under the contract.
The other instruments are measured by quantifying net future flows of payments and receipts, discounted to present value, as specified below:
•Interest rate swaps (IRS): future flows tied to floating reference rates are estimated using market projections on the measurement date for each currency and settlement frequency. Each flow is discounted using the discount factors on the date of each settlement period and currency at the measurement date.
•Index-linked swaps (ILS): future flows are estimated by projecting the future behavior implicit in the market curves on the measurement date for each currency and settlement frequency, for both reference interest rates and reference inflation rates. As in the cases described above, the flows are discounted at rates obtained at the measurement date for each flow settlement period and currency.
•Cross-currency swaps (CCS): future flows tied to floating reference rates are estimated using market projections on the measurement date for each currency and settlement frequency. Each flow is discounted using the market zero-coupon rate corresponding to the settlement period and currency at the measurement date, taking account of cross-currency basis spreads. The present value of the flows in a currency other than the measurement currency is translated at the spot exchange rate prevailing at the measurement date.
•Foreign currency derivatives: as a general rule, future flows are estimated using the exchange rates and market curves associated with each currency pair (forward points curve), and each flow is discounted using the market discount rate corresponding to the settlement period and currency at the measurement date. For other more complex instruments (options, etc.), appropriate measurement methods are used for each instrument, taking into consideration the necessary market data.
Lastly, credit risk included when measuring derivatives under IFRS 9 is estimated as follows:
CONSOLIDATED FINANCIAL STATEMENTS
FERROVIAL SE AND SUBSIDIARIES
•To calculate the adjustments associated with own and counterparty credit risk (CVA/DVA), Ferrovial applies a method based on calculating the future exposure of the various financial products using Monte Carlo simulations. A probability of default and a loss given default is applied to this potential exposure based on the parties’ business and credit quality, as well as a discount factor based on the currency and term at the measurement date.
•To calculate probabilities of default for the Ferrovial Group companies, the Financial Risks Department assesses the counterparty’s rating (company, project, etc.) using an in-house, rating agency-based method. This rating is used to obtain market spread curves for the currency and term in question (generic curves per rating level).
•Probability of counterparty default is calculated using the companies’ CDS curves, if they are available. Otherwise, the CDS curves of a similar entity (proxy) or a generic spread curve per rating level are used.
CONSOLIDATED FINANCIAL STATEMENTS
FERROVIAL SE AND SUBSIDIARIES
SECTION 6: OTHER DISCLOSURES
This section includes other notes required under the applicable legislation.
Note 6.5 stands out on contingent liabilities and assets, as it describes the main lawsuits in which Group companies are involved and the guarantees given. Special emphasis is placed on the guarantees given by ex-infrastructure project companies on behalf of infrastructure project companies.
Movements in liabilities other than current liabilities and borrowings, such as provisions (Note 6.3), are also analyzed.
6.1 DEFERRED INCOME
Deferred income breaks down as follows at December 31, 2024 and 2023:
| | | | | | | | | | | |
| (Million euro) | 2024 | 2023 | Var. 24/23 |
| Capital grants | 1,372 | | 1,317 | | 55 | |
| Other deferred income | 3 | | 17 | | (14) | |
| TOTAL DEFERRED INCOME | 1,375 | | 1,334 | | 41 | |
Capital grants awarded by government bodies relate entirely to infrastructure projects in the Toll Roads Division at December 31, 2024 and 2023.
These grants are primarily related to the following toll road projects: EUR 510 million and EUR 486 million for NTE Mobility Partners in 2024 and 2023, respectively. EUR 429 million and EUR 407 million for LBJ Infrastructure Group, in 2024 and 2023, respectively. EUR 216 million and EUR 205 million for I-77 Mobility Partners, in 2024 and 2023, respectively and, lastly, EUR 205 million and EUR 204 million for NTE Mobility Partners Segments 3 LLC, in 2024 and 2023, respectively.
Amounts received by the US companies increased by EUR 86 million and decreased by EUR -41 million in 2024 and 2023 respectively, due to the US dollar's appreciation against the euro in 2024 and depreciation in 2023.
These capital grants are released to the income statement for each year at the same rate as the depreciation charged on the assets. As the charge estimated for the following 12 months is not significant, the balance as at December 31, 2024 is presented as non-current in the balance sheet. The impact of the grants on cash flows are presented as an increase in investments for 2024, 2023 and 2022.
The effect of these grants on cash flows is presented net of cash flows from investing activities.
6.2 EMPLOYEE BENEFIT PLANS
This heading reflects the deficit in pension and other employee retirement benefit plans. At December 31, 2024, the provision recognized in the balance sheet amounted to EUR 4 million and solely relates to Budimex (EUR 3 million at December 31, 2023).
6.3 PROVISIONS
The provisions recognized by the consolidated Group cover risks arising in the course of business. They are recognized using best estimates of the risks. This note provides a breakdown of all provisions disclosed separately on the liabilities side of the balance sheet. In addition to these items, other provisions net certain asset items and are disclosed in the specific notes on those assets.
Movements in long- and short-term provisions presented separately on the liabilities side of the balance sheet are set out below at December 31, 2024:
| | | | | | | | | | | | | | | | | | | | |
| (Million euro) | LITIGATION AND TAXES | REPLACEMENTS AND UPGRADES, IFRIC 12 | OTHER LONG- TERM RISKS | TOTAL NON-CURRENT PROVISIONS | SHORT-TERM PROVISIONS | TOTAL |
| Balance at December 31,2023 | 156 | | 86 | | 26 | | 268 | | 1,011 | | 1,279 | |
| Scope changes and transfers | (3) | | 17 | | (2) | | 13 | | 1 | | 14 | |
| Charges: | 41 | | 42 | | 1 | | 85 | | 297 | | 382 | |
| Operating profit/(loss) | 38 | | 5 | | 1 | | 44 | | 295 | | 339 | |
| Net financial income/(expense) | — | | — | | — | | — | | 2 | | 2 | |
| Impairment and disposals | — | | — | | — | | — | | — | | — | |
| Corporate income tax | — | | — | | — | | — | | — | | — | |
| Fixed asset depreciation | 3 | | 37 | | — | | 40 | | — | | 40 | |
| Reversals: | (8) | | — | | 1 | | (8) | | (252) | | (260) | |
| Operating profit/(loss) | (4) | | — | | 1 | | (4) | | (252) | | (256) | |
| Net financial income/(expense) | — | | — | | — | | — | | — | | — | |
| Impairment and disposals | — | | — | | — | | — | | — | | — | |
| Corporate income tax | (4) | | — | | — | | (4) | | — | | (4) | |
| Fixed asset depreciation | — | | — | | — | | — | | — | | — | |
| Applications | (6) | | (7) | | — | | (13) | | (114) | | (128) | |
| Foreign exchange differences | 1 | | 7 | | — | | 9 | | 15 | | 24 | |
| Balance at December 31, 2024 | 182 | | 145 | | 26 | | 353 | | 958 | | 1,311 | |
SECTION 6: OTHER DISCLOSURES
Litigation and tax provisions
This includes the following provisions:
•Provisions to cover possible risks resulting from lawsuits and litigation in progress, amounting to EUR 97 million and EUR 71 million in 2024 and 2023, respectively, and largely relating to the Construction business (EUR 90 million in 2024 and EUR 68 million in 2023). This provision is recognized and reversed against changes to provisions in operating profit/(loss).
•Provisions for tax claims, amounting to EUR 85 million for both 2024 and 2023, arising in relation to local or central government duties, taxes or other levies as a result of the different possible interpretations of tax legislation in the various countries in which the Group operates (Note 6.5.1).
Provision for replacements under IFRIC 12
This heading includes provisions for replacement investments under IFRIC 12 (Note 1.3.3.2), totaling EUR 145 million and EUR 86 million in 2024 and 2023, respectively.
Provisions for other long-term risks
This heading includes provisions recognized to cover certain long-term risks other than those attributable to litigation or tax claims, such as third-party liability resulting from the performance of contracts, guarantees given and exposed to enforcement risk, and other similar items, which amounted to EUR 26 million at December 31, 2024 (EUR 26 million at December 31, 2023).
At December 31, 2024, it also contains the estimated cost of landfill closure and post-closure activities relating to Budimex and UK waste treatment businesses (Thalia). The provision is calculated based on a technical estimate of total landfill capacity consumed to date. It is recognized and reversed against changes to provisions in operating profit/loss, as and when the landfill closure costs are incurred. The balance recognized for this item at December 31, 2024 amounted to EUR 16 million.
Short-term provisions
This heading relates essentially to provisions for contracts with customers, such as provisions for deferred expenses (relating to construction project close-out costs under the contract), amounting to EUR 325 million and EUR 313 million in 2024 and 2023 respectively), and provisions for budgeted losses totaling EUR 531 million and EUR 606 million in 2024 and 2023 respectively.
Provisions for budgeted losses relate primarily to the Construction Division in the amount of EUR 504 million and EUR 561 million in 2024 and 2023 respectively, and the UK waste treatment businesses (Thalia) in the amount of EUR 26 million and EUR 46 million at December 31, 2024 and 2023, respectively.
The change during 2024 is explained by net provisions recognized in the Construction Division (EUR -17 million), basically in the Polish business, and to the application of provisions for budgeted losses in Colombia and US businesses (EUR -47 million). Additionally, also worth mentioning the impact in the UK waste treatment businesses (Thalia), explained by a provision recognition impact of EUR 16 million, offset by applications reaching EUR -37 million, mainly related to the Isle of Wight treatment plant.
For the accounting treatment of each provision, see Notes 1.3.3.3.and 1.3.3.4.v.
6.4. OTHER LONG-TERM PAYABLES
This heading mainly includes:
•Participating loans accruing interest granted by Spain’s Central Government to Autovía de Aragón concession in the Toll Roads Division totaling EUR 57 million at December 31, 2024 and EUR 53 million at December 31, 2023.
•Long-term loans from associates of the Toll Roads Division, amounting to EUR 4 million at December 31, 2024 and EUR 21 million at December 31, 2023.
•Debt owed by Dalaman International Airport to the administration for the concession fee, which amounted to EUR 247 million in the long term at the year-end (EUR 276 million at December 31, 2023).
•Net present value of contractual payments to the Department of Transportation in Virginia under the concession agreement on the I-66 project related to the transit funding payment and the support for corridor improvement, which amounted to EUR 915 million (EUR 865 million at December 31, 2023).
6.5 CONTINGENT LIABILITIES, CONTINGENT ASSETS AND COMMITMENTS
6.5.1 Litigation
The Group is exposed to risks derived from the resolution of litigation of different kinds arising in the ordinary course of its business. When such risks are deemed to be probable, provisions are booked using the best estimate of the expected disbursements necessary to settle the obligations arising from such litigation. These provisions are set out in Note 6.3. When such risks are less likely to materialize, contingent liabilities arise. No significant liabilities are envisaged to have a material adverse effect on the Group other than those for which provisions have already been recognized.
There are also contingent assets, meaning assets that could arise from various proceedings in progress. Assets of this kind are not recognized in the financial statements unless it is virtually certain that they will materialize, as required by accounting legislation.
There follows a description of the most significant litigation, in the Group's various business divisions. This includes those that may generate both liabilities or assets.
SECTION 6: OTHER DISCLOSURES
a) Litigation and other contingent liabilities relating to the Toll Roads business.
Ongoing litigation at December 2024
US Toll Roads: NTE 35W
On February 11, 2021 there was a multiple vehicle accident on the 35W Managed Lanes toll road in Fort Worth, Texas involving 133 vehicles and resulting in six deaths and multiple people injured.
As a result of this incident, the concession company NTE Mobility Partners Segment 3 LLC, which is 53.66% owned by Ferrovial, together with other Group Co-Defendant entities and several non-Group US companies, is a party in 29 of the claims that have been filed. Of these, three cases have been fully resolved and one additional case has been partially resolved by the parties. Discovery in the other cases is ongoing. One case has been set for trial starting on July 20, 2025.
Following consultation with external legal advisors, the concession company expects no material impact even in the event of an unfavorable ruling, in view of the insurance policies in place.
Therefore, no provision has been recorded to date in relation to this risk.
Portugal: Auto-Estradas Norte Litoral, S.A.
The insolvency estate of J. Gomes - Construções do Cávado, S.A., (the “J. Gomes Parent”) filed a civil lawsuit against Cintra Infrastructures SE (“CISE”) seeking the invalidity of its purchase of shares in Auto-Estradas Norte Litoral, S.A. ("AENL”) (the “AENL Shares”) by CISE from J. Gomes – Concessões Norte, Unipessoal, Lda. (the “J. Gomes Subsidiary”), a fully-owned subsidiary of J. Gomes Parent. J. Gomes Parent initiated proceedings against both CISE and J. Gomes Subsidiary on the basis that the purchase price paid by CISE was lower than the fair market value of the AENL Shares. J. Gomes Subsidiary is not an insolvent entity (unlike the claimant, J. Gomes Parent). CISE acquired the AENL Shares from J. Gomes Subsidiary and the rest of the minority shareholders of AENL, paying the same price per share to all shareholders.
The claimant, J. Gomes Parent has requested that (i) CISE return to the claimant (a) the AENL Shares and (b) an amount corresponding to the total dividends received in connection with those shares since the date on which the sale took place; and (ii) the claimant be allowed to pay a small fraction of the price received by the J. Gomes Subsidiary from CISE for such AENL Shares, with the remainder of the price to be claimed by CISE as a common creditor under the J. Gomes Parent insolvency proceedings.
The Company estimates the value of the claim, including accrued legal interest, which although not yet claimed, may be requested in connection with the proceedings by J. Gomes Parent, to be an amount under EUR 10 million.
The Company believes, after consultation with external legal advisors, that its position is reasonable and therefore has not recorded a provision in relation to this risk.
b) Litigation relating to the Construction business
The Construction Division is involved in several ongoing legal proceedings, relating principally to potential construction defects in the building work it has completed and claims for civil liability. As indicated in Note 6.3, as of December 31, 2024, provisions amounting to EUR 90 million had been recorded in relation to these proceedings. The provision for each of the lawsuits corresponds to the best estimate made by Ferrovial on the possible impact of the same.
Below is a description of the most relevant lawsuits.
Ongoing litigation at December 2024
Construction business Spain
In 2019, the Spanish National Markets and Competition Commission (CNMC) initiated penalty proceedings against Ferrovial Construcción, S.A. and other construction firms for alleged anti-competitive behavior.
On July 6, 2022, the CNMC issued a resolution finding that Ferrovial Construcción S.A. had committed a “very serious infringement” of Article 1 of Law 15/2007, of July 3, 2007, on the Defense of Competition and Article 101 of the European Union Treaty, and imposing a fine of EUR 38.5 million.
Ferrovial Construcción, S.A. filed a contentious-administrative appeal against the CNMC’s resolution in the Spanish National High Court on October 4, 2022. The claim also requested a precautionary measure staying enforcement.
On December 9, 2022, the Spanish National High Court agreed to suspend the resolution issued by the CNMC’s Competition Court, pending its decision on the contentious-administrative appeal.
The Group considers the outcome of this lawsuit is unlikely to be unfavorable and therefore no amount has been provisioned in this respect.
D4R7 project (Slovakia)
There are three proceedings under way:
Criminal Investigation for Alleged Environmental Risks and Damage in Connection with the Exploitation of Plots of Land in Jánošíková.
In June 2019, the Provincial Headquarters of the National Police in Bratislava (Slovakia) initiated a criminal investigation ex officio against D4R7 Construction s.r.o., the joint venture established to carry out the D4R7 toll road construction project in Bratislava, which was formed by Ferrovial and PORR (with 65% and 35% stakes in the joint venture, respectively). The grounds for the investigation are alleged environmental risks and damage, as defined in the Slovakian Criminal Code, due to an alleged failure to obtain the necessary permits to excavate dirt from two plots of land in Jánošíková, Slovakia. The alleged damages were quantified at EUR 8.7 million.
SECTION 6: OTHER DISCLOSURES
The two plots requiring the environmental permits do not form part of the toll road site layout, although materials extracted from the plots were used to construct the project pursuant to agreements with the owners, who incurred no environmental damage. The excavation work, which also included obtaining the property owners’ consent, as well as the necessary environmental permits to extract the dirt material, was subcontracted to a local company specialized in this type of work.
The matter is ongoing and a variety of filings against the alleged charges, including expert reports, have been submitted. In November 2023, the court rejected the indictment, ruling that formal errors were committed during the investigative phase, and returned the matter back to the prosecutor. The prosecutor has appealed the decision.
The Group considers improbable that the investigation will give rise to risk and, therefore, no provision has been set aside with respect to this dispute.
Criminal Investigation for Alleged Hazardous Substances and Environmental Damage in Connection with the Exploitation of Plots of Land in Blatná na Ostrove
On June 2, 2023, the Presidium of the Police Force for the National Center of Special Types of Criminality, the division investigating hazardous substances and environmental crimes, filed charges against D4R7 Construction s.r.o. for an alleged crime of “endangering and damaging the environment” in violation of Section 300(1) of the Slovak Criminal Procedure Code. The charges allege that, between May and December 2018, D4R7 Construction s.r.o. caused environmental damage quantified at EUR 6.6 million on certain protected parcels of land located in Blatná na Ostrove by extracting more than 200,000 tons of dirt without a permit. D4R7 disputes these charges and has filed responsive pleadings and reports. The pre-trial investigative phase of this matter has concluded and the matter has been submitted to the court for review. The court will next decide whether there is sufficient evidence to support the allegations and if all legal requirements have been met.
The Group considers improbable that the investigation will give rise to risk and, therefore, no provision has been set aside with respect to this dispute.
Criminal Investigation for Alleged Unauthorized Handling of Waste at an Embankment in Jarovce.
The Police Force in Bratislava (Environmental Division) has pressed charges against D4R7 Construction s.r.o., for alleged unauthorized handling of waste under the Slovak Criminal Code. The allegation relates to the use of recycled dirt material for the construction of a road embankment without proper permits. The recycled material was purchased from local suppliers specialized in this type of material and no environmental damage occurred due to its use. If found responsible, D4R7 could face a fine, likely in the low six figures. Numerous pleadings and expert reports have been submitted by the parties, and the matter is expected to proceed to trial. To date, however, the court has not scheduled hearings to commence.
The Group considers improbable that the investigation will give rise to risk, and therefore, no provision has been set aside with respect to this dispute.
Bucaramanga Project (Colombia)
In December 2023, the National Infrastructure Authority (NIA) of Colombia imposed a fine for project delays on the concessionaire for the Ruta del Cacao project, Concesionaria Ruta del Cacao, S.A.S. The fine flows on a “back-to-back” basis to Consorcio Ferrocol Santander (CJV), the entity responsible for the construction of the project in which Ferrovial Construcción has a 70% stake. On January 13, 2025, the NIA ratified the fine amount, making it due and payable in February 2025. The concessionaire and CJV have initiated a proceeding seeking a declaration of force majeure. If the proceeding is successful, the NIA would be compelled to reduce and potentially nullify the fine amount. We expect a decision by June 2025. The impact of this delay and the associated costs have been considered in the provision for future losses in 2024 (also in 2023) relating to this project.
I-66 project (USA)
In 2016, FAM Construction, LLC (in which Ferrovial Construction US Corp. holds a 70% interest and Allan Myers VA holds a 30% interest) was awarded the design and construction of the Interstate 66 Outside the Beltway project.
In June 2024, project completion was agreed with the Virginia Department of Transportation. FAM Construction, LLC filed a lawsuit in January 2024 related to costs incurred due to the COVID-19 pandemic and associated matters.
These claims have been considered in the calculation of the Group’s future loss provisions in accordance with IFRS 15.
Power unit in Turów (Poland)
On January 17, 2025, Budimex S.A. received a lawsuit claiming EUR 248.2 million in liquidated damages and other damages for, among other things, reduced availability of the power unit and alleged delays in the remediation of disputed defects. The action was brought by the state-owned energy producer, PGE Górnictwo i Energetyka Konwencjonalna S.A. against the consortium responsible for the construction of a new power unit at the Turów Power Plant. The consortium comprises Mitsubishi Power Europe GmbH (52.84%), Técnicas Reunidas, S.A. (23.58%) and Budimex, S.A. (23.58%).
Taking into account the amount claimed and the associated costs involved with defending this lawsuit, the putative risk has been duly provisioned in accordance with Budimex's share in the consortium.
Matters previously reported
FBSerwis (Poland)
We previously reported on a broad investigation by the Polish Central Anticorruption Office into alleged tax fraud and money laundering, invoice forgery, and bribery that implicated two past members of the Management Board of FBSerwis, S.A., a subsidiary of Budimex. As previously reported, these individuals were dismissed by FBSerwis, S.A. and their employment terminated. The investigation appears to have been completed with respect to Budimex with no further developments related to the company.
SECTION 6: OTHER DISCLOSURES
I-285/SR400 Improvement Project (USA)
It was previously reported that North Perimeter Contractors, LLC whose sole member is Ferrovial Construction US Corp. had initiated upstream claims stemming from client-directed changes, weather events and other issues. These claims have been amicably resolved.
c) Litigation and other contingent liabilities relating to the Energy business
Ongoing contingent liabilities at December 2024:
Centella Project (Chile)
In 2018, the Republic of Chile awarded the design, construction and operation of a new 252km, 220KV- 580 MVA-double circuit transmission line ("Centella Project") to Centella Transmisión S.A. (an indirect wholly owned subsidiary of Ferrovial SE).
The project commenced operation on June 27, 2024 as formally acknowledged by the relevant authority on January 15, 2025.
Pursuant to restated terms of the award, commencement of operations of the transmission line should have occurred no later than January 15, 2024, but during construction, the project suffered certain delays due to unforeseen circumstances, including different force majeure events. In particular, on August 26, 2024, an extension of the final milestone (CoD) of the contract was successfully granted by the Ministry of Energy as a consequence of one of those force majeure events.
Out of the different force majeure events requested by Centella Transmisión S.A. to the Ministry of Energy, there are -as of today- two proceedings still pending, whose outcome could enable the Authority to call a guarantee bond and may apply certain penalties under the contract.
Although force majeure must be evaluated on a case-by-case basis, the Ministry of Energy has granted in the past different extensions of milestones due to force majeure events in the Centella Project and in other transmission projects in Chile.
As of December 31, 2024, the Group has recognised a provision to cover the estimated risk arising from this contingency.
d) Tax-related litigation
Ongoing litigation at December 2024:
As indicated in Note 6.3, Ferrovial has recorded provisions for taxes in its balance sheet for a total amount of EUR 84 million, EUR 85 million and EUR 200 million at December 31, 2024, 2023 and 2022, respectively.
These provisions essentially relate to ongoing litigation arising from tax assessments raised following tax audits in Spain for a disputed sum of EUR 200 million, EUR 207 million and EUR 332 million for 2024, 2023 and 2022 respectively, the most significant amounts relating to corporate income tax (CIT) and VAT for the periods 2002 to 2019.
Tax proceedings related to the tax amortization of financial goodwill on the acquisitions of Amey and Swissport
We are currently in ongoing litigation proceedings related to the tax amortization of financial goodwill paid on the acquisitions of Amey and Swissport. On September 27, 2023, the European General Court issued a ruling overturning the European Commission’s October 15, 2014, decision, which considered the Spanish tax depreciation of financial goodwill with respect to the indirect acquisition of non-resident companies to be “state aid” incompatible with the EU Treaty. The European General Court’s ruling upheld the appeals of Spain and several Spanish companies, including Ferrovial, finding that the European Commission’s decision violated the principles of legal certainty and protection of legitimate expectations. On December 14, 2023 the European Commission logged its appeal against this ruling before the Court of Justice of the European Union (C-780/23 P). The proceeding is currently ongoing.
As the Group considers there are sound grounds supporting its procedural stance in this proceeding, no provision has been recorded as of December 31, 2024. However, if the final ruling is unfavorable for the Group there will be an adverse effect of EUR 87.6 million on the Group's income statement in relation to additional Spanish CIT for FY 2002 to 2022. The maximum amount payable in connection with a potential unfavorable result would be EUR 42.0 million, as the remainder has already been settled by the Group. In case of a favorable ruling for the Group, the Spanish Tax Agency must refund the initially claimed and paid amounts (EUR 45.5 million).
Unconstitutional Royal Decree-Law 3/2016
On January 18, 2024, the Spanish Constitutional Court announced its ruling related to Royal Decree-Law 3/2016 (RDL 3/2016), on tax measures aimed at the consolidation of public finances, which amended corporate income taxation by limiting the offsetting of net operating losses (25% current limit versus 70% prior to RDL 3/2016), establishing limits on the application of double taxation deductions and forcing the inclusion in the tax base of impairment losses on portfolio investments deducted in previous years.
The Spanish Constitutional Court ruling resolves that the use of the Royal Decree-Law is not suitable for amending the essential elements of Corporate Income Tax (CIT), and that this practice infringes constitutional requirements. Based on the aforementioned grounds, the Spanish Constitutional Court overturned RDL 3/2016, which is considered null and void. The Company filed several lawsuits with respect to its CIT assessment for tax years 2016 through 2023 based on the same argument.
Based on the Spanish Constitutional Court ruling, the Company believes it is almost certain it will obtain a favorable ruling in its proceedings, with the expected amount to be recovered by the Group in relation to years 2016 to 2023 amounting to EUR 30.6 million, which has been recorded in 2024 consolidated financial statements.
SECTION 6: OTHER DISCLOSURES
6.5.2 Guarantees
a) Bank guarantees and other guarantees issued by insurance companies
In the course of business, the Group is exposed to possible risks the materialization of which is uncertain, relating to liability under the various contracts entered into in its business divisions.
The Group obtains bank guarantees and other guarantees issued by insurance companies to cover potential liabilities arising in the course of business. At December 31, 2024, the balance amounted to EUR 8,260 million (EUR 8,533 in 2023).
The following table contains a breakdown of the risk covered in each business area:
| | | | | | | | |
| (Million euro) | Dec. 2024 | Dec. 2023 |
| Construction | 7,074 | 7,013 |
| Toll Roads | 476 | 404 |
| Airports | 355 | 799 |
| Energy | 199 | 66 |
| Other | 157 | 251 |
| | |
| TOTAL | 8,260 | 8,533 |
The EUR 8,260 million, by type of instrument, relates to: i) EUR 2,888 million in bank guarantees; ii) EUR 4,666 million in guarantees provided by bonding agencies and iii) EUR 706 million in bank guarantees provided by insurance companies.
These guarantees cover the liability to customers for the proper performance of construction or services contracts involving Group companies; the guarantee would be enforced by the customer were a project not carried out.
Despite the significant amount of these guarantees, the impact that might arise is very low, since the Group companies perform contracts in accordance with the terms and conditions agreed upon with the customers and recognize provisions within the results of each contract for potential risks that might arise from such performance (Note 6.3).
Lastly, of the total amount of the Group's bank guarantees for continuing operations listed in the above table, EUR 359 million secures commitments to invest in the capital of infrastructure project companies, mainly JFK-NTO (Note 6.5.3).
b) Guarantees given by Group companies for other Group companies
As indicated previously, in general guarantees are provided among the Group companies to cover third-party liability arising from contractual, commercial or financial relationships.
Although these guarantees do not have any effect at the Group’s consolidated level, there are certain guarantees provided by ex-infrastructure project companies to infrastructure project companies (Note 1.1.4) which should be noted due to the classification of project borrowings as non-recourse debt (see Note b.1). Contingent capital guarantees).
Other guarantees have also been given to equity-accounted companies (see b.2. below).
b.1) Guarantees provided by ex-infrastructure project companies to infrastructure project companies to secure borrowings, which could give rise to future additional capital disbursements should the guaranteed events take place (contingent capital guarantees).
Two types of guarantees are given by ex-infrastructure project companies to infrastructure project companies:
•Guarantees securing the proper performance of construction and service contracts (Note 6.5.2.a).
•Guarantees related to risks other than the correct performance of construction and service contracts, which could give rise to future additional capital disbursements should the guaranteed events take place (some of which are also included in note 6.5.2.a) because they are bank guarantees).
The latter guarantees are explained in further detail in this section since, as mentioned in Note 5.2. on cash and the cash equivalent and borrowings, infrastructure project company borrowings are without recourse to the shareholders or with limited recourse to the guarantees provided and, therefore, it is relevant to distinguish the guarantees which, should the guaranteed event occur, could be enforced and lead to payments to the infrastructure project companies or the holders of their debt, other than the committed capital or investment mentioned in Note 6.5.3. They are referred to as contingent capital guarantees.
The detail, by beneficiary company, purpose and maximum amount, of outstanding guarantees of this nature at December 31, 2024 relating to fully consolidated infrastructure project companies, is as follows. It should be noted that these amounts relate to Ferrovial share:
| | | | | | | | |
| BENEFICIARY COMPANY (PROJECT) | GUARANTEE PURPOSE | Dec. 2024 |
| Conc. Prisiones Lledoners | Technical guarantee to repay amounts to the bank in the event of termination of the contract. Does not cover insolvency (default) or breach by the awarding entity | 62 | |
| |
| Centella | Bank guarantees to cover the achievement of various milestones and payment of any fines during the initial execution period. PCG to cover the liquidity gap up to EUR 20 million | 50 | |
| TOTAL GUARANTEES FOR FULLY-CONSOLIDATED INFRASTRUCTURE PROJECTS | 111 | |
SECTION 6: OTHER DISCLOSURES
b.2) Other guarantees given to waste treatment plant companies (Note 3.2.)
The “Thalia” Group operates waste treatment facilities at Allerton, Cambridge, Milton Keynes and Isle of Wight in the UK with the majority of the facilities operated under concession contracts with different local authorities. The four concessions contracts represent the majority of our waste management operations and are expected to expire between 2026 and 2043.
The guarantees given by various Group companies totaled GBP 295 million in 2024. The guarantees are limited but the limitations do not apply in the event of liability arising in certain scenarios including from death or personal injury, fraud, willful misconduct and / or criminal conduct or abandonment.
In recent years, the plants have had issues in both the construction phase and the commissioning and operation phase, particularly in the case of Milton Keynes and the Isle of Wight plants. As indicated in Note 6.3., at year-end 2024, the Group recognized a provision for future losses relating to these plants in the amount of GBP 22 million (GBP 40 million as of December 31, 2023). The provision does not include business overheads estimated at GBP 8 million per annum.
c) Guarantees given in divestment processes
The sale agreements entered into during the divestment of the former Services Division include various guarantees given to the buyers in connection with a number of potential lawsuits or litigation in progress on the transaction dates.
Guarantees that met the relevant requirements of accounting legislation (IAS 37) were provisioned at the year-end. These provisions amount to EUR 19 million.
The main guarantees are as follows:
Litigation relating to the penalty proceedings opened by the Spanish National Markets and Competition Commission (CNMC) in relation to the road maintenance sector:
In July 2019, the CNMC initiated penalty proceedings against Ferroser Infraestructuras, S.A. (currently Serveo Infraestructuras S.A.), as well as against other companies in the sector, due to alleged anti-trust practices during tendering for maintenance and operations services for the State Road Network, arranged by the Ministry of Public Works.
In August 2021, notice was received of a Resolution by the CNMC’s Board declaring a very serious infringement of Article 1 of the Spanish Competition Law (LDC) and Article 101 of the Treaty on the Functioning of the European Union (TFUE). The Board imposed a fine of EUR 5.7 million.
A contentious-administrative appeal was filed against the resolution at the National High Court. In December 2021, notification was received of the admission of the appeal. On February 22, 2022, notification was received of the decision to suspend the penalty resolution in relation to both the fine and the prohibition on contracting. The appealed was suspended on May 10, 2022.
Ferroser Infraestructuras, S.A. (now Serveo Infraestructuras, S.A.) is one of the companies sold as a result of the divestment of the infrastructure maintenance business in Spain completed on January 31, 2022 and is therefore no longer controlled by Ferrovial SE.
Ferrovial gave a guarantee of EUR 6 million to the buyer in relation to this lawsuit, though for a limited period. This amount has been provisioned.
Tax proceedings
At December 31, 2022, guarantees had been granted to PREZERO in connection with various ongoing tax proceedings. The guarantees, which have been provisioned, amount to EUR 4.4 million.
d) Security interests in assets
The security interests in assets, are described in the following notes:
•Guarantees given for fixed assets (Note 3.4).
•Security interests in deposits or restricted cash (Note 5.2).
e) Guarantees received from third parties
At December 31, 2024, Ferrovial had received guarantees from third parties totaling EUR 1,575 million (EUR 1,757 million at December 31 2023), mainly in the Ferrovial Construction companies in the United States (EUR 1,235 million) the Budimex Group (EUR 158 million) and other construction companies (EUR 180 million), particularly noteworthy were the companies in the UK (EUR 119 million) and Spain (EUR 22 million).
These third party guarantees are technical guarantees that are offered by certain subcontractors or suppliers in the construction business in order to guarantee full compliance with their contractual obligations with regard to the work they are engaged to complete, and may not be sold or pledged.
6.5.3. Commitments
As described in Note 1.1, infrastructure projects are performed under long-term contracts where the concession operator is a company in which the Group has interests, either alone or together with other partners, and the borrowings necessary for financing the project are allocated to the project itself, without recourse to the shareholders or with recourse limited to the guarantees provided, under the terms set forth in Note 5.2 From a management viewpoint, Ferrovial takes into account only the investment commitments related to project capital, since the investment in the assets is financed by the project company’s borrowings.
a) Investment commitments
The investment commitments undertaken by the Group in relation to capital contributions to infrastructure projects amount to EUR 427 million (EUR 850 million in 2023). The decrease during the year 2024 is explained primarily by the capital contributions made by Ferrovial to the new
SECTION 6: OTHER DISCLOSURES
Terminal One at New York’s JFK Airport and US Toll Roads. The investment commitments to the new Terminal One at New York´s JFK Airport at 31 December 2024 amount to EUR 329 million (EUR 768 million in December 2023).
A breakdown of the Group’s commitments to invest capital in infrastructure project companies is as follows:
| | | | | | | | | | | | | | | | | | | | | | | |
| (Million euro) | 2025 | 2026 | 2027 | 2028 | 2029 | 2030 AND BEYOND | TOTAL |
| Toll Roads | — | | 5 | | — | | — | | — | | — | | 5 | |
| | | | | | | |
| Construction | 1 | | — | | — | | — | | — | | — | | 1 | |
| Energy | 22 | | 23 | | — | | 1 | | — | | — | | 45 | |
INVESTMENTS IN FULLY- CONSOLIDATED INFRASTRUCTURE PROJECT
COMPANIES | 23 | | 28 | | — | | 1 | | — | | — | | 52 | |
| Toll Roads | 28 | | — | | 18 | | — | | — | | — | | 46 | |
| Airports | 258 | | 71 | | — | | — | | — | | — | | 329 | |
| Construction | 1 | | — | | — | | — | | — | | — | | 1 | |
INVESTMENTS IN EQUITY- ACCOUNTED INFRASTRUCTURE PROJECT
COMPANIES | 287 | | 71 | | 18 | | — | | — | | — | | 376 | |
TOTAL INVESTMENTS
IN INFRASTRUCTURE PROJECT
COMPANIES | 310 | | 99 | | 18 | | 1 | | — | | — | | 427 | |
On top of the committed investments shown above, worth mentioning additional EUR 285 million of committed investments corresponding to projects still pending of financial closing, mainly related to Anillo Vial Periférico (EUR 205 million of future investment commitments and EUR 13 million that have been already contributed in 2024), and renewable energy projects in the US and Poland.
In addition, commitments were made to invest up to EUR 35 million in companies in which Ferrovial holds non-controlling interests that are engaged in projects related primarily to innovation and mobility.
b) Environmental commitments
Any operation undertaken mainly to prevent, reduce or repair damage to the environment is treated as an environmental activity.
Costs incurred to protect and improve the environment are taken to profit or loss in the year in which they are incurred, irrespective of when the resulting monetary or financial flow takes place.
Provisions for probable or certain environmental liability, litigation in progress and indemnities or other outstanding obligations of undetermined amount not covered by insurance policies are recorded when the liability or obligation giving rise to the indemnity or payment arises.
6.6 SHARE-BASED REMUNERATION SCHEMES
Performance-based share plan.
Executive Directors participate in a long-term variable remuneration scheme based on performance share plans, in which other executives and key professionals of the Group also participate (the “LTVR”). These plans are usually structured in overlapping multiyear cycles (currently three years), granting “units” each year (which may be converted into shares at the end of the vesting period (currently three years) if the metrics to which the LTVR is subject are fulfilled). The LTVR can be summarized as follows:
The 2020-2022 plan
▪The 2020-2022 plan was approved for the Executive Directors and certain other managers of the Group by the Ferrovial, S.A. Board on December 19, 2019, and consequently approved for the Executive Directors at the General Meeting of Ferrovial, S.A. on April 17, 2020.
▪The 2020-2022 Long-Term Remuneration Plan (the “LTRP”) provides for the allocation of “units,” potentially convertible into shares, in 2020, 2021 and 2022. These shares, as the case may be, are to be delivered in the year in which the third anniversary of the allocation of the corresponding units is reached (i.e. 2023 for the 2020 grant, 2024 for the 2021 grant, and 2025 for the 2022 grant).
▪The “units” granted under the 2020-2022 LTRP may be converted into shares if (i) the beneficiaries remain in the Company for a period of three years from the date of grant of the units, except in exceptional circumstances such as retirement, disability or death, and (ii) certain objectives linked to internal or external metrics reflecting economic-financial aspects and value creation for the company are met, as approved by the Board of Directors and General Meeting of Ferrovial, S.A.
The 2023-2025 plan
▪The 2023-2025 LTRP was approved for the Executive Directors and certain other managers of the Group by the Ferrovial Board on December 15, 2022. The 2023-2025 LTRP was also consequently approved for the Executive Directors at the General Meeting of Ferrovial, S.A. on April 13, 2023, as required under Spanish corporate law.
▪The 2023 LTRP provides for the grant of “units”, potentially convertible into shares, in 2023, 2024 and 2025. These shares, as the case may be, will be delivered in the year in which the third anniversary of the grant of the corresponding units is reached (i.e., 2026 for the 2023 grant, 2027 for the 2024 grant and 2028 for the 2025 grant).
▪The “units” granted under the 2023-2025 LTRP may be converted into shares if (i) the beneficiaries remain in the Company for a period of three years from the date of grant of the units, expect in circumstances such as retirement, disability or death, and (ii) certain objectives linked to internal or external metrics reflecting economic-financial aspects, value creation for the company and ESG targets are met, as approved by the Board of Directors and General Meeting of Ferrovial, S.A.
SECTION 6: OTHER DISCLOSURES
Both the 2020-2022 plan and the 2023-2025 plan as they apply to the Executive Directors were subsequently approved by the General Shareholders' Meeting of Ferrovial International SE on 13 June 2023, with effects from the effectiveness of the merger, as this relates to the plans’ post-Merger implementation on June 13, 2023.
There were 1,729,752 shares outstanding on December 31, 2024 relating to these plans, as commented in Note 5.1.1.
Changes to the share-based remuneration schemes in 2024, 2023 and 2022 are summarized below:
| | | | | | | | | | | |
| 2024 | 2023 | 2022 |
| Number of shares at beginning of year | 1,953,016 | 1,782,127 | 2,054,531 |
| Plans granted | 543,320 | 653,611 | 702,675 |
| Plans settled | (538,868) | (277,493) | (356,958) |
| Shares surrendered and other | (200,618) | (192,425) | (526,552) |
| Shares exercised | (27,098) | (12,804) | (91,569) |
| Number of shares at year-end | 1,729,752 | 1,953,016 | 1,782,127 |
These share award plans are addressed in Note 6.7 on remuneration of executive directors and senior managers.
The impact of these remuneration schemes on the Group’s income statement in 2024 was an expense of EUR 13 million (expense of EUR 11 million in 2023 and income of EUR 8 million in 2022) with a balancing entry in equity.
Measurement of performance-based share plans
These plans were accounted for as a future and therefore the value of the foreseeable dividends up to the delivery date is discounted to the value of the shares at the grant date using a rate of return equal to the average cost of borrowings over the share award period. It is equity settled and thus measured when granted. The initially calculated value is not re-estimated. The related amounts are recognized under “Staff costs” with a balancing entry in reserves.
6.7. REMUNERATION OF THE BOARD OF DIRECTORS AND SENIOR MANAGEMENT
6.7.1. Directors’ remuneration in their capacity as such (i.e. for their membership of the Board)
Under the Company’s current remuneration scheme, regulated by Article 8.5 of its Articles of Association, the Company has a policy in respect of the remuneration of Executive Directors and Non-Executive Directors. This policy, whether or not combined for Executive Directors and Non-Executive Directors, is proposed by the Board for adoption by the General Meeting.
The Directors’ Remuneration Policy adopted by the General Meeting of Ferrovial International SE on June 13, 2023 (as also approved by the General Meeting of Ferrovial, S.A. held on April 13, 2023), which came into effect upon completion of the merger between Ferrovial, S.A. and Ferrovial International SE (renamed Ferrovial SE), fixed the overall maximum annual amount of Directors’ remuneration at EUR 1,900,000 for the duration of the Policy.
Directors’ remuneration comprises: (i) a fixed allocation, a part of which is paid on a quarterly basis and the remainder (complementary fixed allocation) in a single payment at the end of the financial year; and (ii) attendance fees for actual attendance at Board and Committee meetings. Remuneration is linked to the functions and responsibilities assigned to each Director, membership on Board Committees and other objective circumstances that the Board of Directors deems relevant, thereby ensuring their long-term independence and commitment.
On the same date these financial statements are approved, the Board of Directors approves a Remuneration Report which is published on the Company’s website as part of the Management Report. The report describes in greater detail aspects of the Company's remuneration policy applicable in the current year, providing an overview of how it has been applied in 2024. The table below shows the itemized remuneration of the members of the Board of Directors in their capacity as such accrued during 2024 and 2023.
Should more meetings be held than initially envisaged or, for any other reason, the total and joint maximum annual amount is exceeded, the difference is firstly deducted from the amount of the complementary fixed allocation proportionally for each Director proportionally to his/her condition. In accordance with the resolutions adopted by the Board of Directors, if the amount of the attendance fees plus the amount of fixed components does not reach the said maximum annual figure, the difference may be distributed among the Directors on a pro rata basis according their period of office during the year, if the Board so determines. This distribution was carried out in 2023 and 2024, adding the amount to the complementary fixed allocation.
The difference between the amounts of attendance fees and complementary fixed allocation in 2024 and 2023 is explained by the fact that: (i) there were more meetings in 2023 than in 2024; y (ii) the amount distributed to the Directors as described in the last two sentences of the previous paragraph was higher in 2024.
This table does not include remuneration received by the Executive Directors for discharging executive duties at the Company, as described in Note 6.7.2.
SECTION 6: OTHER DISCLOSURES
| | | | | | | | | | | | | | |
| 2024 |
| DIRECTOR (Thousand euro) | FIXED ALLOWANCE | PER DIEMS | ADDITIONAL FIXED REMUNERATION (a) | TOTAL |
| Rafael del Pino | 35 | 103 | 107 | 245 |
| Oscar Fanjul | 35 | 76 | 96 | 206 |
| Ignacio Madridejos | 35 | 51 | 61 | 148 |
| María del Pino | 35 | 51 | 61 | 148 |
| José Fernando Sánchez-Junco | 35 | 58 | 61 | 154 |
| Philip Bowman | 35 | 49 | 61 | 145 |
| Hanne Sorensen | 35 | 35 | 61 | 131 |
| Bruno Di Leo | 35 | 49 | 61 | 145 |
| Juan Hoyos | 35 | 51 | 61 | 148 |
| Gonzalo Urquijo | 35 | 56 | 61 | 152 |
| Hildegard Wortmann | 35 | 36 | 61 | 132 |
| Alicia Reyes | 35 | 49 | 61 | 145 |
| TOTAL | 420 | 665 | 815 | 1,900 |
(a) These amounts include the remaining amount up to the maximum annual amount of the 2024 compensation distributed pro rata among the Directors.
(*) The amounts shown are rounded.
| | | | | | | | | | | | | | |
| 2023 |
| DIRECTOR (Thousand euro) | FIXED ALLOWANCE | PER DIEMS | ADDITIONAL FIXED REMUNERATION (a) | TOTAL |
| Rafael del Pino | 35 | 119 | 99 | 253 |
| Oscar Fanjul | 35 | 86 | 87 | 208 |
| Ignacio Madridejos | 35 | 60 | 53 | 148 |
| María del Pino | 35 | 57 | 53 | 145 |
| José Fernando Sánchez-Junco | 35 | 66 | 53 | 154 |
| Philip Bowman | 35 | 55 | 53 | 143 |
| Hanne Sorensen | 35 | 47 | 53 | 135 |
| Bruno Di Leo | 35 | 55 | 53 | 143 |
| Juan Hoyos | 35 | 60 | 53 | 148 |
| Gonzalo Urquijo | 35 | 62 | 53 | 150 |
| Hildegard Wortmann | 35 | 42 | 53 | 130 |
| Alicia Reyes Revuelta | 35 | 55 | 53 | 143 |
| TOTAL | 420 | 764 | 716 | 1,900 |
(a) Includes the amount of the difference up to the maximum annual amount of the 2023 compensation distributed pro rata among the Directors.
(*) The amounts shown are rounded.
6.7.2. Individual executive directors´ remuneration
a) Remuneration accrued in 2024, 2023 and 2022
In 2024, the following remuneration accrued to the executive directors for the performance of their functions, irrespective of the remuneration referred to in the preceding section.
| | | | | | | | | | | |
| 2024 |
| EXECUTIVE DIRECTORS’ REMUNERATION * (Thousand euro) | RAFAEL DEL PINO (2) | IGNACIO MADRIDEJOS (2) | TOTAL |
| Fixed remuneration | 1,500 | 1,450 | 2,950 |
| Variable remuneration | 2,786 | 2,097 | 4,883 |
| Life insurance premiums | 11 | 7 | 18 |
| Other remuneration in kind | 3 | 36 | 39 |
| Plans linked to shares (1) | 1,946 | 1,946 | 3,892 |
| Total 2024 | 6,246 | 5,536 | 11,782 |
*Remuneration as executive directors
(1) In March 2024, a number of shares equivalent to the level of completion of the units allocated in 2021 were delivered, after the relevant withholding had been made. The shares received by Rafael del Pino and Ignacio Madridejos were reported to the Dutch regulator, the AFM (Autoriteit Financiële Markten), both on 14 March 2024.
The 2023 information is shown in the following table:
| | | | | | | | | | | |
| 2023 |
| EXECUTIVE DIRECTORS’ REMUNERATION * (Thousand euro) | RAFAEL DEL PINO | IGNACIO MADRIDEJOS (2) | TOTAL |
| Fixed remuneration | 1,500 | 1,313 | 2,813 |
| Variable remuneration | 2,809 | 1,926 | 4,735 |
| Life insurance premiums | 10 | 5 | 15 |
| Other remuneration in kind | 3 | 13 | 16 |
| Plans linked to shares (1) | 795 | 795 | 1,590 |
| Total 2023 | 5,117 | 4,052 | 9,169 |
*Remuneration as executive directors
SECTION 6: OTHER DISCLOSURES
(1) In March 2023, a number of shares equivalent to the level of completion of the units allocated in 2020 were delivered, after the relevant withholding had been made. The Spanish Regulator, the CNMV, was notified of the shares received by Rafael del Pino and by Ignacio Madridejos on 13/3/2023 and 9/3/2023, respectively (at that time, Ferrovial shares were only traded on the Spanish Stock Exchanges).
(2) EUR 1,150 thousand until June 15, 2023 and EUR 1,450 thousand from June 16, 2023 onwards.
The 2022 information is shown in the following table:
| | | | | | | | | | | |
| 2022 |
| EXECUTIVE DIRECTORS’ REMUNERATION * (Thousand euro) | RAFAEL DEL PINO | IGNACIO MADRIDEJOS (2) | TOTAL |
| Fixed remuneration | 1,500 | 1,150 | 2,650 |
| Variable remuneration | 2,609 | 1,538 | 4,147 |
| Life insurance premiums | 10 | 5 | 15 |
Share plans (1) | 883 | 183 | 1,066 |
| Total 2022 | 5,002 | 2,876 | 7,878 |
*Remuneration as executive directors
(1) In March 2022, a number of shares equivalent to the level of completion of the units allocated in 2019 were delivered, after the relevant withholding had been made. The CNMV was notified of the shares received by Rafael del Pino and by Ignacio Madridejos on 21/3/2022 and 17/3/2022, respectively.
(2) In 2022, the amount of EUR 8 thousand was allocated to Ignacio Madridejos as remuneration in kind relating to a company car.
b) Share-based remuneration schemes
There follows a breakdown of the share-based remuneration schemes linked to objectives, entitlement to which has not yet vested:
| | | | | | | | | | | | | | |
| EXECUTIVE DIRECTORS’ PLAN AT 31.12.2024 | UNITS | | NO. OF VOTING RIGHTS | % NO. OF VOTING RIGHTS |
| Rafael del Pino y Calvo-Sotelo | 2022 allocation | 56,400 | 56,400 | 0.008 | % |
| 2023 allocation | 50,680 | 50,680 | 0.007 | % |
| 2024 allocation | 39,241 | 39,241 | 0.005 | % |
| Ignacio Madridejos Fernández | 2022 allocation | 56,400 | 56,400 | 0.008 | % |
| 2023 allocation | 69,925 | 69,925 | 0.009 | % |
| 2024 allocation | 61,441 | 61,441 | 0.008 | % |
6.7.3. Pension funds and plans for life insurance premiums
As in 2023, no contributions were made in 2024 to pension plans or funds for former or current members of the Company’s Board of Directors or for directors of the Company who are members of other Boards of Directors and/or senior managers of Group companies and associates. No such commitments were made during the year.
As regards life insurance premiums, the Company has insurance policies covering death (for which premiums totaling EUR 18 thousand were paid in 2024; EUR 15 thousand in 2023), under which the executive directors are beneficiaries. No life insurance premiums were paid for Company directors who are members of other Boards of Directors and/or senior managers of Group companies or associates.
Lastly, the Company has arranged a third-party liability insurance policy covering the directors and managers of the Group companies parented by the Company. The insured parties include the Company’s directors. The premium paid in 2024 under the aforementioned insurance policy amounted to EUR 1,757 thousand (EUR 1,073 thousand in 2023).
6.7.4. Advances and loans
At 31 December 2024, no advances or loans had been granted by the Company to the directors in their capacity as such or as members of other Boards of Directors or senior managers of Group companies or associates.
6.7.5. Senior management remuneration
The overall remuneration accrued to the Company’s senior managers in 2024 is analyzed below (*):
| | | | | | | | |
| SENIOR MANAGEMENT REMUNERATION (Thousand euro) (*) | 2024 | 2023 |
| Fixed remuneration | 5,793 | 5,094 |
| Variable remuneration | 6,205 | 5,534 |
| Performance-based share plan | 5,638 | 1,934 |
| | |
| Remuneration as members of administrative bodies of other Group companies, jointly-controlled entities or associates | 39 | 33 |
| Insurance premiums | 20 | 19 |
| Other (1) | 226 | 486 |
| Other (2) | 1,433 | 533 |
| Total | 19,355 | 13,633 |
(1) Separation of members of the Non-Management Committee (amount subject to personal income tax).
(2) Expatriates´ payments
(*) The Senior Management average remuneration is not broken down by gender in order to keep it confidential, given that there are not enough incumbents in each position of equal value
The remuneration shown corresponds to the holders of the following positions in all or part of 2024: General Secretary, Chief Financial Officer, Chief Human Resources Officer, Chief Investment Officer, Chief Construction Officer, Chief Airports Officer, Chief Toll Roads Officer, Chief Energy
SECTION 6: OTHER DISCLOSURES
Officer, Chief Mobility & Services Officer, Chief Information and Innovation Systems Officer, Chief Audit and Risk Officer, Chief Communications and Corporate Responsibility Officer, Chief Strategy Officer, Chief Compliance and Risk Officer, Chief Sustainability Officer and Chief Digital Infrastructure Officer . The remuneration of the members of senior management who have been Executive Directors at the same time is not included, since it is indicated in the Note 6.7.2.
The Company has also implemented a “Flexible Remuneration Scheme”, which allows employees to voluntarily change their remuneration package based on personal needs, replacing a portion with certain benefits in kind. These products include a life and retirement savings group insurance scheme. Participants may request that a portion of their gross annual remuneration be paid by the Company in the form of a premium under a life and retirement savings group insurance policy. The senior managers requested contributions totaling EUR 137 thousand from the Company, replacing the remuneration shown in the table above (EUR 71 thousand in 2023).
6.7.6. Other disclosures on remuneration
The agreements between the Company and the senior managers specifically provide for the right to receive the indemnities referred to in Article 56 of the Spanish Labour Statute in the event of unfair dismissal.
In order to encourage loyalty and continuity, a deferred remuneration scheme was granted to thirteen senior managers, including one executive director. The scheme consists of extraordinary remuneration that will only be paid in one of the following circumstances:
•Exit of the senior manager by mutual agreement upon reaching a certain age.
•Unfair dismissal or exit at the Company’s discretion without cause for dismissal, before the senior manager reaches the age initially agreed, if the amount exceeds the figure stipulated in the Labour Statute.
•Death or disability of the senior manager.
To cover this incentive, each year the Company makes contributions to a group savings insurance policy under which the Company is both policyholder and beneficiary. The contributions are quantified on the basis of a certain percentage of each senior manager’s total monetary remuneration. Contributions made in 2024 amounted to EUR 2,391 thousand (EUR 2,076 thousand in 2023), of which EUR 582 thousand relates to the executive director (EUR 527 thousand in 2023).
6.8 RELATED-PARTY TRANSACTIONS
Related party transactions are reported following: (i) the criteria set forth in the International Accounting Standard 24 (“IAS 24”) and (ii) the General Instructions of Part I, Item 7.B. of Form 20-F. These transactions between the Company1 (or its Group companies) and related parties, carried out on an arm’s length basis and in the ordinary course of business in 2024, 20232, and 20222, are disclosed below, in four separate categories.
If the related party has been a related party for a period shorter than the financial year, the transactions during this period are disclosed.
a) Transactions between Ferrovial SE and its key management personnel3
This section includes the transactions between the Company and its key management personnel, their close family members, or companies in which one or the other holds control or joint control, or over which they could exercise significant influence. It also includes transactions with enterprises that have a member of the key management personnel in common with the Company.
At December 31, 2024:
| | | | | | | | | | | | | | |
| NAME / COMPANY NAME (Thousand euro) | TRANSACTIONS | AMOUNT | PROFIT OR LOSS | BALANCE |
| Bankinter, S.A. | Financial expenses | (65) | (65) | (65) |
| Banco Sabadell, S.A. | Bank and other guarantees received | (20,126) | — | (20,126) |
| Financial expenses | (158) | (158) | (158) |
At December 31, 2023:
| | | | | | | | | | | | | | |
| NAME / COMPANY NAME (Thousand euro) | TRANSACTIONS | AMOUNT | PROFIT OR LOSS | BALANCE |
| Bankinter, S.A. | Financial expenses | (1,268) | — | — |
| Banco Sabadell, S.A. | Bank and other guarantees received | (20,110) | — | (20,110) |
| Banco Sabadell, S.A. | Financial expenses | (1,270) | (1,270) | — |
| Bank of America | Financing agreements | (112,000) | — | (112,000) |
| Bank of America | Bank and other guarantees received | (8,127) | — | (8,127) |
| Bank of America | Financial expenses | (46) | — | — |
| Bank of America | Settlement of derivatives | 1,415 | 1,415 | — |
| KBC Bank | Financing agreements | (1,660) | — | (1,660) |
| KBC Bank | Bank and other guarantees received | (43,000) | — | (43,000) |
1 Including, for the purposes of this section with respect to 2022, Ferrovial S.A., the former parent company of the Group, and its key management personnel.
2 The transactions shown in the tables for the years 2022 and 2023 are presented in accordance with the current applicable regulatory and accounting frameworks, which frameworks differ from those applicable in 2022 and 2023. Accordingly, differences may exist in the presentation of these figures compared to the information reported in the financial statements for those periods.
3 In this note 6.8, the term “key management personnel” includes, in accordance with the applicable related party transactions regulations, the Company directors and senior managers who have the authority and responsibility for planning, directing and controlling the activities of Ferrovial.
SECTION 6: OTHER DISCLOSURES
At December 31, 2022:
| | | | | | | | | | | | | | |
| NAME / COMPANY NAME (Thousand euro) | TRANSACTIONS | AMOUNT | PROFIT OR LOSS | BALANCE |
| Bankinter, S.A. | Financing agreements | (50,000) | — | (50,000) |
| Bankinter, S.A. | Financial expenses | (253) | — | — |
| Banco Sabadell, S.A. | Financing agreements | (49,692) | — | (49,692) |
| Banco Sabadell, S.A. | Bank and other guarantees received | (19,480) | — | (19,480) |
| Banco Sabadell, S.A. | Financial expenses | (826) | — | — |
| Marsh McLennan | Services received | (253) | — | — |
b) Transactions between subsidiaries of the Company and the Company’s key management personnel3
This section includes the transactions between Group companies and the Company’s key management personnel, their close family members or companies in which one or the other holds control or joint control, or over which they could exercise significant influence. It also includes transactions with Group enterprises that have a member of the key management personnel in common with the Company.
At December 31, 2024:
| | | | | | | | | | | | | | |
| NAME / COMPANY NAME (Thousand euro) | TRANSACTIONS | AMOUNT | PROFIT OR LOSS | BALANCE |
| Juan del Pino Fdez-Fontecha | Services rendered | 554 | 97 | 188 |
| Ignacio del Pino Fdez-Fontecha | Services rendered | 554 | 97 | 29 |
| Rafael del Pino Fdez-Fontecha | Services rendered | 554 | 97 | 99 |
| EDP | Services received | (31) | — | (11) |
| EDP | Services rendered | 8,392 | 660 | 1,348 |
| Cummins | Services received | (15) | — | — |
| Cummins | Services rendered | 1,483 | 1,593 | — |
| Marsh McLennan | Services received | (2,251) | — | 9 |
| Holcim group | Services received | (10,498) | — | (1,178) |
| Bankinter, S.A. | Financing agreements | (14,286) | — | (14,286) |
| Bankinter, S.A. | Bank and other guarantees received | (40,909) | — | (40,909) |
| Bankinter, S.A. | Financial income | 294 | 294 | — |
| Bankinter, S.A. | Financial expenses | (135) | (135) | (135) |
| Banco Sabadell, S.A. | Financing agreements | (117,929) | — | (117,929) |
| Banco Sabadell, S.A. | Bank and other guarantees received | (47,404) | — | (47,404) |
| Banco Sabadell, S.A. | Financial income | 4,802 | 4,802 | — |
| Banco Sabadell, S.A. | Financial expenses | (157) | (155) | (155) |
| Banco Sabadell, S.A. | Settlement of derivatives | 435 | 435 | 435 |
| KBC Bank | Financing agreements | — | — | — |
| KBC Bank | Financial expenses | — | — | — |
| KBC Bank | Settlement of derivatives | — | — | — |
| Applus Group | Services received | (162) | — | (60) |
Note: Two contracts were entered into with a company of the Ferrovial Group in 2023 (as disclosed in the Management Report for that financial year): one between Ferrovial Construcción, S.A. and an entity controlled by the Chairman and one between Ferrovial Construcción, S.A. and certain close family members of the Chairman. Both agreements were entered into as part of the ordinary course of business of Ferrovial Construcción, S.A. The amounts invoiced in 2024 under the latter contract are shown in the table above. For more information on this latter transaction, please refer to section 2.8.3.1 of the Corporate Governance section on conflict-of-interest transactions, included in the Management Report.
At December 31, 2023:
| | | | | | | | | | | | | | |
| NAME / COMPANY NAME (Thousand euro) | TRANSACTIONS | AMOUNT | PROFIT OR LOSS | BALANCE |
| Marsh McLennan Group | Services received | (2,051) | — | (51) |
| Holcim Group | Services received | (7,478) | (7) | (2,094) |
| Juan del Pino Fdez-Fontecha | Services rendered | 25 | (12) | 27 |
| Ignacio del Pino Fdez-Fontecha | Services rendered | 25 | (12) | 27 |
| Rafael del Pino Fdez-Fontecha | Services rendered | 25 | (12) | 27 |
| Cummins Group | Services rendered | 28,012 | (666) | 833 |
| Bankinter, S.A. | Financing agreements | (27,390) | — | (27,390) |
| Bankinter, S.A. | Bank and other guarantees received | (55,279) | — | (55,279) |
| Bankinter, S.A. | Financial income | 602 | 602 | — |
| Bankinter, S.A. | Financial expenses | — | — | — |
| Sabadell, S.A. | Financing agreements | (31,011) | — | (31,011) |
| Sabadell, S.A. | Bank and other guarantees received | (48,055) | — | (48,055) |
| Sabadell, S.A. | Financial income | 410 | 410 | — |
| Sabadell, S.A. | Financial expenses | (1,536) | (1,411) | — |
| Sabadell, S.A. | Derivatives settlement | 6 | 6 | — |
| Bank of America | Financing agreements | (191,028) | — | (191,028) |
| Bank of America | Financial expenses | (8,302) | (8,250) | — |
SECTION 6: OTHER DISCLOSURES
At December 31, 2022:
| | | | | | | | | | | | | | |
| NAME / COMPANY NAME (Thousand euro) | TRANSACTIONS | AMOUNT | PROFIT OR LOSS | BALANCE |
| | | | |
| | | | |
| | | | |
| | | | |
| | | | |
| Marsh McLennan group | Services received | (1,634) | — | 126 |
| Sulzer | Services received | (145) | — | (93) |
| Holcim group | Services received | (4,826) | — | (258) |
| Bankinter, S.A. | Financing agreements | (13,149) | — | (13,149) |
| Bankinter, S.A. | Bank and other guarantees | (55,119) | — | (55,119) |
| Bankinter, S.A. | Financial expenses | — | — | — |
| Banco Sabadell, S.A. | Financing agreements | (7,459) | — | (7,459) |
| Banco Sabadell, S.A. | Bank and other guarantees | (32,410) | — | (32,410) |
| Banco Sabadell, S.A. | Financial income | 1,581 | — | — |
| Banco Sabadell, S.A. | Financial expenses | (881) | — | — |
c) Transactions with equity-accounted companies
This section includes the transactions carried out between Group companies and equity-accounted companies entered into in the ordinary course of business and on normal market terms.
| | | | | | | | | | | |
| (Million euro) | 2024 | 2023 | 2022 |
| Services received | (1) | (3) | (2) |
| Services provided | 138 | 111 | 89 |
| Net financial expenses/Income | 42 | 28 | 22 |
| Payables to related parties | 41 | 23 | 28 |
| Receivables from related parties | 331 | 294 | 252 |
d) Transactions between Group companies
This section includes the transactions carried out between the Group companies in the ordinary course of business, in terms of purpose and conditions, and were not eliminated on consolidation for the following reason.
As explained in detail in Note 1.3.2., balances and transactions relating to construction work performed by the Construction Division for the Group's infrastructure concession operators are not eliminated on consolidation since, at the consolidated level, contracts of this type are classed as construction contracts in which the work, while being executed, is deemed to be performed for third parties, as the ultimate owner of the works is the awarding entity from both a financial and a legal viewpoint.
In 2024, 2023 and 2022, Ferrovial's Construction Division billed those concession operators for EUR 206,077 thousand in 2024 (EUR 375,680 thousand in 2023 and EUR 865,487 thousand in 2022) for work performed and related advance payments and, in this respect, recognized sales for that construction work totaling EUR 303,050 thousand in 2024, EUR 489,259 thousand in 2023 and EUR 1,030,639 thousand in 2022.
In 2024, the profit from these transactions attributable to the Company’s holdings in the concession operators in question and not eliminated on consolidation, net of taxes and non-controlling interests, was EUR -14,206 thousand. In 2023, this amounted to EUR -34,942 thousand and in 2022 to EUR -60,507 thousand.
6.9 AUDIT FEES
The following table summarizes the fees for professional services provided by Ernst & Young for the fiscal years 2024 and 2023.
| | | | | | | | |
| Million euros | 2024 | 2023 |
| Fees for audit services | 13.08 | | 13.53 | |
| Fees for audit related services | 0.71 | | 0.67 |
| Tax fees | 0.02 | | — | |
| Other non-audit services | — | | — | |
| | |
“Fees for audit services” relate to the following audit services:
•Statutory consolidated financial statements;
•Subsidiaries' statutory financial statements;
•Consolidated financial statements under PCAOB standards filed with the SEC;
•Review of the half year interim consolidated financial statements performed in June.
During 2023, the principal accountant also provided non-recurrent services, which amount to EUR 4,990 thousand, related to the registration process of the Company within the SEC. Specifically, the principal auditor provided audit services under PCAOB standards in relation to the financial statements of the years 2020, 2021 and 2022 included within the registration statement with the SEC.
“Fees for audit related services” are assurance and related services that are reasonably related to the performance of the audit or review of the Group’s financial statements. This category includes fees related to the preparation of comfort letters for debt issued and verification of non- financial information among others.
"Tax fees" relate to fees incurred for tax compliance, tax advice and tax planning. "Other non-audit services" consist of services provided by the principal accountant, other than the services reported in the above-mentioned sections. During 2023 and 2024, no such services were rendered.
SECTION 6: OTHER DISCLOSURES
Approval from the Audit and Control Committee is required for non-audit services provided by the external auditor. All services described above have been approved by the Audit and Control Committee.
6.10 RESTRICTED NET ASSETS
Certain of our consolidated entities are restricted from remitting certain funds to us in the form of cash dividends or loans by a variety of regulations and contractual or statutory requirements. These restrictions are related to standard requirements to maintain restricted cash and debt service coverage ratios in our infrastructure project companies. Additionally, for certain entities, dividend payments may be restricted during construction phases. As of December 31, 2024, the net assets of these subsidiaries reached EUR 2,426 million.
The Group performed a test on the restricted net assets of consolidated subsidiaries in accordance with Securities Exchange Commission ("SEC") Regulation S-X Rule 4-08 (e) (3) 'General Notes to Financial Statements' and Rule 5-04 (c) 'what schedules are to be filed', and concluded that restricted net assets exceed 25% of Ferrovial’s consolidated net assets at December 31, 2024. Therefore, the separate condensed financial statements of Ferrovial SE (the parent company's accounting predecessor as of and for the years ended December 31, 2024, 2023 and 2022), as per SEC Regulation S-X Rule 12-04 'Condensed financial information of registrant', are presented.
6.11 EVENTS AFTER THE REPORTING DATE
Issuance of bonds
Ferrovial successfully completed the pricing of an issuance of bonds amounting to 500 million euro, with maturity date on 16 January 2030. The bonds bear interest at a rate of 3.25% per annum payable annually.
The issue price is 99.402% of the nominal value of the securities. The closing and payment of the issuance took place on 16 January 2025, once the customary conditions precedent for this type of issuance were met.
The net proceeds were approximately 495 million euro, which are expected to be used for general corporate purposes.
The bonds are listed in Euronext Dublin, the regulated market of the Irish Stock Exchange.
Corporate liquidity facility
On 16 January 2025, the corporate revolving credit facility was refinanced incorporating sustainability criteria linked to KPIs. Final maturity is January 2030 with the possibility of two extensions of 1 year each. Maximum limit of EUR 900 million with the possibility of drawing down balances in EUR, USD, CAD and GBP. No amount drawn as of the date of this document.
Treasury share buy-back program
In connection with the buy-back program for Ferrovial SE own shares explained in Note 5.1, over the course of 2025, 2,280,272 treasury shares were acquired at an average price of EUR 41.30 per share totaling EUR 94 million.
Additionally, the Board of Directors has approved the implementation of a new share buyback program of up to EUR 500 million with the purpose of reducing the share capital, which would start after the current share buyback program has ended.
AGS Divestment
On January 28, 2025, and following satisfaction of applicable regulatory conditions, Ferrovial and Macquarie completed the sale of AGS' entire share capital (100%) for a price of GBP 900 million, of which circa GBP 450 million are Ferrovial's net proceeds, together with a capital gain of EUR 297 million for Ferrovial which will affect Q1 2025 results.
HAH 5.25% stake divestment
On February 26, 2025, Ferrovial announced that a binding agreement has been reached with Ardian for the sale of its entire remaining stake (5.25%) in FGP Topco Ltd. (Topco), parent company of Heathrow Airport Holdings Ltd., for c.GBP 455 million (current book value of the asset), which will be adjusted with an interest rate to be applied until closing.
The transaction is subject to complying with the right of first offer (ROFO) which may be exercised by Topco shareholders pursuant to the Shareholders’ Agreement and the Articles of Association of the company. Full completion of the acquisition under the agreement is also subject to the satisfaction of applicable regulatory conditions.
6.12 FERROVIAL SE (PARENT COMPANY)
The separate financial statements have been prepared in accordance with the International Financial Reporting Standards (“IFRS”) as issued by the International Accounting Standards Board (“IASB”). The 2024 and 2023 Financial Statements correspond to Ferrovial SE, as parent company of the group as at 31 December, 2024, and the comparative period 2022 correspond to Ferrovial, S.A., parent company of the Group in this year. Investments in subsidiaries are valued using the equity value method.
The Parent Company’s condensed statements of financial position and related income statements, statements of comprehensive income, statements of changes in equity, and cash flow statements are as follows:
SECTION 6: OTHER DISCLOSURES
FERROVIAL SE AS OF DECEMBER 31, 2024 AND 2023 STATEMENTS OF FINANCIAL POSITION
| | | | | | | | |
| Assets (Million euro) | 2024 | 2023 |
| Non-current assets | 13,167 | 9,642 |
| Right of use | 3 | 4 |
| Long-term investments in Group companies and associates | 12,815 | 9,525 |
| Equity instruments | 12,815 | 9,525 |
| Other non-current financial assets | 264 | 20 |
| Deferred tax assets | 55 | 73 |
| Long-term financial derivatives at fair value | 30 | 20 |
| Current assets | 601 | 736 |
| Financial assets available for sale | — | — |
| Receivables | 203 | 154 |
| Group companies and associates | 129 | 83 |
| Current tax assets | 19 | 19 |
| Public administrations | 53 | 49 |
| Other receivables | 4 | 3 |
| Short-term investments in Group companies and associates | 218 | 473 |
| Short-term prepayments | 3 | 2 |
| Cash and cash equivalents | 175 | 107 |
| TOTAL ASSETS | 13,768 | 10,378 |
| | | | | | | | |
| Liabilities and equity (Million euro) | 2024 | 2023 |
| Equity | 6,422 | 4,102 |
| Share capital | 7 | 7 |
| Share and merger premium | 4,316 | 4,316 |
| Treasury shares | (79) | (78) |
| Measurement adjustments | (10) | (9) |
| Retained earnings and other reserves | 2,188 | (134) |
| Non-current liabilities | 6,090 | 5,333 |
| Long-term provisions | 89 | 89 |
| Long-term lease liabilities | | 4 |
| Debentures and borrowings | 556 | 791 |
| Long-term financial derivatives at fair value | — | 13 |
| Long-term payables to Group companies | 5,433 | 4,425 |
| Deferred taxes | — | — |
| Other non-current liabilities | 12 | 11 |
| Current liabilities | 1,256 | 943 |
| Short-term lease liabilities | — | — |
| Debentures and borrowings | 507 | 504 |
| Debentures and bonds | 255 | 504 |
| Bank borrowings | 252 | — |
| Short-term Financial derivatives at fair value | — | — |
| Short-term payables to Group companies | 686 | 374 |
| Trade and other payables | 62 | 64 |
| Trade payables | 10 | 11 |
| Other short-term payables | 24 | 10 |
| Trade payables, Group companies and associates | 10 | 18 |
| Payable relating to income tax | 19 | 25 |
| Short-term provisions | 1 | 1 |
| TOTAL LIABILITIES | 13,768 | 10,378 |
FERROVIAL SE UP TO DECEMBER 31, 2024 AND FOR THE YEAR ENDED DECEMBER 31, 2023 AND FERROVIAL, S.A. FOR THE YEAR ENDED DECEMBER 31, 2022 INCOME STATEMENTS
| | | | | | | | | | | |
| (Million euro) | 2024 | 2023 | 2022 |
| Revenue | 23 | 28 | 38 |
| Services rendered | 23 | 28 | 38 |
| Staff costs | (21) | (19) | (29) |
| Wages, salaries and similar remuneration | (21) | (19) | (28) |
| Staff welfare expenses | — | — | (1) |
| Fixed asset depreciation | — | — | (1) |
SECTION 6: OTHER DISCLOSURES
| | | | | | | | | | | |
| Other operating expenses | (61) | (61) | (18) |
| Change in provisions on financial fixed assets | — | (8) | (8) |
| Operating profit/(loss) | (59) | (60) | (18) |
| Financial income | 18 | 7 | 7 |
| From marketable securities and other financial instruments | 18 | 7 | 7 |
| Dividends received from subsidiaries | — | — | — |
| Financial expenses | (218) | (187) | (66) |
| On payables to Group companies and associates | (154) | (123) | (45) |
| On payables to third parties | (64) | (64) | (21) |
| Change in fair value of financial instruments | 38 | 30 | 60 |
| Foreign exchange differences | (16) | (3) | (5) |
| Impairment and profit/(loss) on disposals of financial instruments | 10 | 18 | 1 |
| Impairment and losses | — | — | 4 |
| Profit/(loss) on disposals | 10 | 18 | (3) |
| NET FINANCIAL INCOME/(EXPENSE) | (167) | (135) | (3) |
| PROFIT/(LOSS) BEFORE TAX | (226) | (195) | (21) |
| Share in results of participating interests | 3,439 | 482 | 309 |
| Corporate income tax | 56 | 21 | 30 |
| PROFIT/(LOSS) FOR THE YEAR FROM CONTINUING OPERATIONS | 3,270 | 308 | 318 |
FERROVIAL SE FOR THE YEAR ENDED DECEMBER 31, 2024 AND FERROVIAL, S.A. FOR THE YEARS ENDED DECEMBER 31, 2023 AND 2022, STATEMENTS OF COMPREHENSIVE INCOME
| | | | | | | | | | | |
| (Million euro) | 2024 | 2023 | 2022 |
| a) Net profit/(loss) | 3,270 | 308 | 318 |
| b) Income and expense recognized directly in equity | (1) | (1) | 37 |
| Impact on hedge reserves | (1) | (1) | 58 |
| Tax effect | — | — | (15) |
| Impact on financial assets at fair value | — | — | (8) |
| Tax effect | — | — | 2 |
| c) Transfers to income statement | — | (9) | (46) |
| Impact on hedge reserves | — | (12) | (62) |
| Tax effect | — | 3 | 16 |
| a)+ b)+ c) TOTAL COMPREHENSIVE INCOME | 3,269 | 298 | 309 |
SECTION 6: OTHER DISCLOSURES
FERROVIAL SE FOR THE YEAR ENDED DECEMBER 31, 2024 AND FERROVIAL, S.A. FOR THE YEARS ENDED DECEMBER 31, 2023 AND 2022 STATEMENTS OF CHANGES IN EQUITY
| | | | | | | | | | | | | | | | | | |
| (Million euro) | Share capital | Share/Merger premium | Treasury shares | | Retained earnings and other reserves | TOTAL |
| Balance at 01.01.2024 | 7 | 4,316 | (78) | | (143) | 4,102 |
| Consolidated profit/(loss) for the year 2024 | — | — | — | | 3,270 | 3,270 |
| Income and expense recognized directly in equity | — | — | — | | 153 | 153 |
| Transfers to income statement | — | — | — | | (15) | (15) |
| Total income and expenses recognized for the year | — | — | — | | 3,408 | 3,408 |
| Scrip dividend agreement | — | — | — | | (130) | (130) |
| Treasury share transactions | — | — | — | | (701) | (701) |
| Shareholder remuneration | — | — | — | | (831) | (831) |
| Share-based remuneration schemes | — | — | — | | 13 | 13 |
| Purchase of discretionary treasury shares | | | | | (272) | (272) |
| Other movements | — | — | — | | 2 | 2 |
| Other transactions | — | — | — | | (257) | (257) |
| Balance at 12.31.2024 | 7 | 4,316 | (78) | | 2,177 | 6,422 |
| | | | | | |
| (Million euro) | Share capital | Share/Merger premium | Treasury shares | | Retained earnings and other reserves | TOTAL |
| Balance at 01.01.2023 | 145 | — | (26) | | 4,457 | 4,576 |
| Merger impact | (138) | 4,426 | — | | (4,288) | — |
| Consolidated profit/(loss) for the year 2023 | — | — | — | | 308 | 308 |
| Income and expense recognized directly in equity | — | — | — | | (65) | (65) |
| Transfers to income statement | — | — | — | | (3) | (3) |
| Total income and expenses recognized for the year | — | — | — | | 240 | 240 |
| Scrip dividend agreement | — | (58) | — | | (78) | (136) |
| Treasury share transactions | — | (52) | (52) | | (10) | (114) |
| Shareholder remuneration | — | (110) | (52) | | (88) | (250) |
| Share-based remuneration schemes | — | — | — | | 12 | 12 |
| Other movements | — | — | — | | (476) | (476) |
| Other transactions | — | — | — | | (464) | (464) |
| Balance at 12.31.2023 | 7 | 4,316 | (78) | | (143) | 4,102 |
| | | | | | |
| (Million euro) | Share capital | Share/Merger premium | Treasury shares | | Retained earnings and other reserves | TOTAL |
| Balance at 01.01.2022 | 147 | 218 | (124) | | 4,297 | 4,538 |
| Consolidated profit/(loss) for the year 2022 | — | — | — | | 318 | 318 |
| Income and expense recognized directly in equity | — | — | — | | 317 | 317 |
| Transfers to income statement | — | — | — | | 131 | 131 |
| Total income and expenses recognized for the year | — | — | — | | 766 | 766 |
| Scrip dividend agreement | 3 | — | — | | (135) | (132) |
| Treasury share transactions | (5) | (218) | 98 | | (321) | (446) |
| Shareholder remuneration | (2) | (218) | 98 | | (456) | (578) |
| Share-based remuneration schemes | — | — | — | | — | — |
| Other movements | — | — | — | | (150) | (150) |
| Other transactions | — | — | — | | (150) | (150) |
| Balance at 12.31.2022 | 145 | — | (26) | | 4,457 | 4,576 |
SECTION 6: OTHER DISCLOSURES
FERROVIAL SE FOR THE YEAR ENDED DECEMBER 31, 2024 AND FERROVIAL, S.A. FOR THE YEARS ENDED DECEMBER 31, 2023 AND 2022 CASH FLOW STATEMENTS
| | | | | | | | | | | |
| Million Euro | 2024 | 2023 | 2022 |
| | | |
| Profit/(loss) before tax | (226) | (195) | (21) |
| Profit/(loss) adjustments: | 875 | 1,347 | 1,306 |
| Fixed asset depreciation | — | — | 1 |
| Impairment and disposal of fixed assets | 875 | (18) | (1) |
| Net financial income/(expense) | 170 | 117 | 2 |
| Other adjustments (correction of accrual/cash) | 704 | 1,248 | 1,304 |
| Changes in working capital | 19 | (32) | (216) |
| Other cash flows from operating activities: | (163) | (207) | 1 |
| Interest payments | (214) | (175) | (48) |
| Interest receipts | 21 | 9 | 1 |
| Income tax receipts/(payments) and tax consolidation | 30 | (41) | 48 |
| CASH FLOWS FROM OPERATING ACTIVITIES | 506 | 913 | 1,070 |
| | | |
| Payments on investments: | (614) | (21) | (1,586) |
| Group companies, associates and business units (Note 5) | (614) | (21) | (1,586) |
| | | |
| | | |
| Receipts from divestments: | 22 | 18 | 33 |
| Group companies, associates and business units (Note 5) | 22 | 18 | 33 |
| | | |
| CASH FLOWS FROM (USED IN) INVESTING ACTIVITIES | (593) | (3) | (1,552) |
| | | |
| Receipts and (payments) from financial liability instruments: | 1,258 | (582) | 1,003 |
| Change in Group company cash pooling accounts | 1,507 | (381) | 68 |
| Issuance, repayment and redemption | (249) | (201) | 935 |
| Payments of dividends and returns on other equity instruments | (831) | (250) | (578) |
| Scrip dividend | (130) | (136) | (132) |
| Treasury share purchases | (701) | (114) | (446) |
| Receipts and (payments) on equity instruments: | (272) | 17 | 38 |
| Lease payments | — | — | (1) |
| CASH FLOWS FROM FINANCING ACTIVITIES | 155 | (814) | 463 |
| Effect of exchange rate on cash and cash equivalents | — | — | (5) |
| Net increase/(decrease) in cash and cash equivalents | 68 | 96 | (24) |
| Cash and cash equivalents at beginning of year | 107 | 11 | 35 |
| Cash and cash equivalents at year-end | 175 | 107 | 11 |
6.13 APPENDICES
SECTION 6: OTHER DISCLOSURES
Appendix I. Subsidiaries (fully-consolidated companies) (million euro)
| | | | | | | | | | | | | | | | | |
| Entity | Type | Parent | % Ownership | Net Cost Ownership | Audit |
| CONTINUING OPERATIONS | | | | | |
| CORPORATION | | | | | |
| NETHERLANDS (Registered Office: Amsterdam) | | | | | |
| Ferrovial Netherlands B.V. | | Ferrovial SE | 100.0% | 80 | 1 |
| Ferrovial Ventures Netherlands B.V. | | Ferrovial SE | 100.0% | 9 | |
| SPAIN (Registered Office: Madrid) | | | | | |
| Ferrovial Inversiones, S.A. (a) | | Ferrovial SE | 100.0% | 2 | |
| Ferrovial Emisiones, S.A. (a) | | Ferrovial SE | 100.0% | 0 | 1 |
| Ferrovial Corporación, S.A. (a) | | Ferrovial SE | 100.0% | 5 | 1 |
| Ferrofin, S.L. (a) | | Ferrovial Construcción, S.A. (a) | 52.0% | 40 | 1 |
| Ferrovial SE | 48.0% | 33 | 1 |
| Temauri, S.L. (a) | | Ferrovial SE | 100.0% | 5 | |
| Ferrovial 008, S.L.U (a) | | Ferrovial SE | 100.0% | 0 | |
| Ferrovial 009, S.L.U (a) | | Ferrovial SE | 100.0% | 0 | |
| Ferrovial 011, S.A | | Ferrovial SE | 100.0% | 0 | |
| Ferrovial 012, S.A | | Ferrovial SE | 100.0% | 0 | |
| Ferrovial 013, S.A | | Ferrovial SE | 100.0% | 0 | |
| Ferrovial 014, S.A | | Ferrovial SE | 100.0% | 0 | |
| Ferrovial 015, S.L. | | Ferrovial SE | 100.0% | 0 | |
| Ferrovial 016, S.L. | | Ferrovial SE | 100.0% | 0 | |
| Ferrovial 017, S.L. | | Ferrovial SE | 100.0% | 0 | |
| Ferrovial Venture VI, S.A.U. (a) | | Ferrovial SE | 100.0% | 6 | |
| Ferrovial Ventures, S.A.U. (a) | | Ferrovial SE | 100.0% | 15 | |
| UNITED KINGDOM (Registered Office: Oxford) | | | | | |
| Ferrocorp UK Ltd. | | Ferrovial SE | 100.0% | 1 | 1 |
| UNITED KINGDOM (Registered Office: London) | | | | | |
| Ferrovial Ventures, Ltd. | | Ferrovial SE | 100.0% | 7 | 1 |
| IRELAND (Registered Office: Dublin) | | | | | |
| Landmille, Ltd** | | Ferrovial SE | 100.0% | 1 | 3 |
| LUXEMBOURG (Registered Office: Luxembourg) | | | | | |
| Krypton RE, S.A. | | Ferrovial SE | 100.0% | 8 | 1 |
| UNITED STATES (Registered Office: Austin) | | | | | |
| Landmille US LLC | | Ferrovial Holding US Corp | 100.0% | 0 | 3 |
| UNITED STATES (Registered Office: New York) | | | | | |
| Ferrovial IT US, LLC | | Ferrovial Holding US Corp | 100.0% | 0 | |
| CONSTRUCTION | | | | | |
| GERMANY (Registered Office: Cologne) | | | | | |
| Budimex Bau GmbH | | Budimex, S.A. | 100.0% | 0 | |
| RailBX GmbH | | Budimex, S.A. | 100.0% | 6 | |
| ARABIA (Registered Office: Riyadh) | | | | | |
| Ferrovial Agroman Company * | | Ferrovial Construcción, S.A. (a) | 97.5% | 3 | 7 |
| AUSTRALIA (Registered Office: Sydney) | | | | | |
| Ferrovial Construction (Australia) PTY LTD | | Ferrovial Construction Holdings Ltd | 100.0% | 46 | 1 |
| BRASIL (Registered Office: Bela Vista, Sao Paulo) | | | | | |
| Constructora Ferrovial Ltd. (Brazil) * | | Ferrovial Construction International S.E. | 99.0% | 1 | |
| CANADA (Registered Office: Alberta) | | | | | |
| Webber Infrastructure Management Alberta Ltd | | Webber Infrastructure Management Canada Holdings Ltd | 100.0% | 0 | |
| CANADA (Registered Office: Markham - Ontario) | | | | | |
| Ferrovial Construction CANADA Inc. | | Ferrovial Construction International S.E. | 100.0% | 66 | 1 |
| Ontario Transit FCCI (Hold Co) Inc. | | Ferrovial Construction CANADA Inc. | 100.0% | 0 | |
| Webber Infrastructure Management Canada Ltd | | Webber Infrastructure Management Canada Holdings Ltd | 100.0% | 6 | |
| Webber Infrastructue Management Ontario Limited | | Webber Infrastructure Management Canada Holdings Ltd | 100.0% | 30 | |
| CANADA (Registered Office: Toronto) | | | | | |
| Webber Infrastructure Management Canada Holdings Ltd | | Ferrovial Construction International S.E. | 100.0% | 0 | |
| CHILE (Registered Office: Santiago de Chile) | | | | | |
| Constructora Ferrovial Ltda. * | | Ferrovial Empresa Constructora Ltda. | 97.2% | 0 | 1 |
| Ferrovial Construcción Chile S.A. | | Ferrovial Empresa Constructora Ltda. | 100.0% | 63 | 1 |
| Ferrovial Empresa Constructora Ltda. | | Ferrovial Construction International S.E. | 100.0% | 0 | 1 |
| Ferrovial Energía Construcción SpA | | Ferrovial Energía, S.A. (a) | 100.0% | 0 | 1 |
SECTION 6: OTHER DISCLOSURES
| | | | | | | | | | | | | | | | | |
| COLOMBIA (Registered Office: Bogotá) | | | | | |
| Ferrovial Construcción Colombia, S.A.S | | Ferrovial Construction International S.E. | 100.0% | 0 | |
| SLOVAKIA (Registered Office: Bratislava) | | | | | |
| D4R7 Construction S.R.O. | | Ferrovial Construction Slovakia S.R.O. | 65.0% | 0 | 3 |
| Ferrovial Construction Slovakia S.R.O. * | | Ferrovial Construction Holdings Ltd | 99.0% | (2) | 3 |
| Budimex Slovakia s.r.o. | | Budimex, S.A. | 100.0% | 0 | |
| SPAIN (Registered Office: Barcelona) | | | | | |
| Conc. Prisiones Lledoners,S.A. (a) | P | Ferrovial Construcción, S.A. (a) | 100.0% | 16 | 1 |
| SPAIN (Registered Office: Bilbao) | | | | | |
| Cadagua, S.A. (a) * | | Ferrovial Construcción, S.A. (a) | 99.95% | 70 | 1 |
| SPAIN (Registered Office: Madrid) | | | | | |
| Cocsa, S.A. (a)* | | Ferrovial Construcción, S.A. (a) | 99.95% | 8 | 1 |
| Ditecpesa, S.A. (a) * | | Ferrovial Construcción, S.A. (a) | 99.95% | 1 | 1 |
| Ferroconservación, S.A. (a) | | Ferrovial Construcción, S.A. (a) | 99.0% | 19 | 1 |
| Ferrovial Construcción, S.A. (a) * | | Ferrovial SE | 99.99% | 386 | 1 |
| Ferrovial Medio Ambiente y Energía, S.A. (a) * | | Ferrovial Construcción, S.A. (a) | 99.95% | 1 | |
| Ferrovial Railway S.A. (a) * | | Ferrovial Construcción, S.A. (a) | 98.8% | 0 | |
| Urbaoeste, S.A. (a) * | | Ferrovial Construcción, S.A. (a) | 99.0% | 0 | |
| Cimentaciones Especiales y Estructurales CIMSA, S.A. * | | Ferrovial Construcción, S.A. (a) | 99.0% | 0 | 1 |
| Arena Recursos Naturales, S.A.U. (a) | | Ferrovial Construcción, S.A. (a) | 100.0% | 0 | |
| Tecpresa Structural Solutions SA (a) * | | Ferrovial Construcción, S.A. (a) | 99.1% | 2 | |
| SPAIN (Registered Office: Zaragoza) | | | | | |
| Depusa Aragón S.A. (a) | P | Cadagua, S.A. (a) | 51.7% | 2 | 1 |
| Ferrovial Construcción, S.A. (a) | 42.3% | 0 | 1 |
| UNITED STATES (Registered Office: Atlanta) | | | | | |
| Ferrovial Construction East, LLC | | Ferrovial Construction US Corp. | 100.0% | 457 | |
| UNITED STATES (Registered Office: Austin) | | | | | |
| Cadagua US LLC | | Webber, LLC | 100.0% | 14 | |
| Ferrovial Agroman 56, LLC | | Ferrovial Construction Texas, LLC | 100.0% | 35 | |
| Ferrovial Agroman Indiana, LLC | | Ferrovial Construction US Corp. | 100.0% | 0 | |
| Ferrovial Construction Texas, LLC | | Ferrovial Construction US Corp. | 100.0% | 74 | |
| Ferrovial Construction US Corp. | | Ferrovial Construction US Holding Corp. | 100.0% | 1,010 | 1 |
| Ferrovial Construction US Holding Corp. | | Ferrovial Holding US Corp. | 100.0% | 1,168 | 1 |
| Grand Parkway Infrastructure LLC | | DBW Construction LLC | 30.0% | 0 | 1 |
| Ferrovial Construction Texas, LLC | 40.0% | 0 | 1 |
| Ferrovial Energy Solutions, LLC | | Ferrovial Energy US, LLC | 100.0% | 0 | |
| Webber Infrastructure Management US Inc. | | Webber, LLC | 100.0% | 308 | 1 |
| Webber Infrastructure Management Inc. | | Webber Infrastructure Management US | 100.0% | 39 | 1 |
| Webber Infrastructure Management Holding US Corp | | Ferrovial Holding US Corp | 100.0% | (3) | 1 |
| Ferrovial Construccion JFK T1 LLC | | Ferrovial Construction US Corp. | 100.0% | 0 | |
| Tecpresa Structural Solutions, LLC | | Ferrovial Construction US Holding Corp. | 100.0% | 0 | |
| UNITED STATES (Registered Office: Charlotte) | | | | | |
| Sugar Creek Construction LLC | | Ferrovial Construction East, LLC | 70.0% | 64 | |
| UNITED STATES (Registered Office: Dallas) | | | | | |
| Trinity Infrastructure LLC | | DBW Construction LLC | 40.0% | 0 | |
| Ferrovial Construction Texas, LLC | 60.0% | 0 | |
| UNITED STATES (Registered Office: Fort Worth) | | | | | |
| North Tarrant Infrastructures | | DBW Construction LLC | 25.0% | 0 | 1 |
| Ferrovial Construction Texas, LLC | 75.0% | 0 | 1 |
| UNITED STATES (Registered Office: Georgia) | | | | | |
| North Perimeter Contractors LLC | | Ferrovial Construction East, LLC | 100.0% | 387 | 1 |
| Webber - United LLC | | Webber, LLC | 60.0% | 0 | |
| UNITED STATES (Registered Office: Los Angeles) | | | | | |
| California Rail Builders | | Ferrovial Construction West, LLC | 80.0% | 0 | 1 |
| Ferrovial Construction West, LLC | | Ferrovial Construction US Corp. | 100.0% | 0 | 1 |
| UNITED STATES (Registered Office: North Richland Hills) | | | | | |
| Bluebonnet Contractor, LLC | | DBW Construction LLC | 40.0% | 0 | |
| Ferrovial Construction Texas, LLC | 60.0% | 0 | |
| UNITED STATES (Registered Office: The Woodlands) | | | | | |
| DBW Construction LLC. | | Webber, LLC | 100.0% | (2) | 1 |
| Webber Waterworks, LLC | | Cadagua US, LLC | 50.0% | 0 | 1 |
| Webber, LLC | 50.0% | 0 | 1 |
| Webber Materials, LLC | | Webber Equipment & Materials LLC | 100.0% | 88 | 1 |
| Webber, LLC | | Ferrovial Construction US Holding Corp. | 100.0% | 653 | 1 |
| Webber Barrier Services | | Webber, LLC | 100.0% | 5 | 1 |
| Webber Commercial Construction LLC | | Webber, LLC | 100.0% | 0 | 1 |
SECTION 6: OTHER DISCLOSURES
| | | | | | | | | | | | | | | | | |
| Webber Equipment & Materials LLC | | Webber, LLC | 100.0% | 227 | 1 |
| Webber Management Group LLC | | Webber Equipment & Materials LLC | 100.0% | 41 | 1 |
| UNITED STATES (Registered Office: Virginia) | | | | | |
| FAM Construction LLC (I-66) | | Ferrovial Construction US Corp. | 70.0% | 337 | 1 |
| FRANCE (Registered Office: Paris) | | | | | |
| Ferrovial Construction France, S.A. | | Ferrovial Construction International S.E. | 100.0% | 12 | |
| NETHERLANDS (Registered Office: Amsterdam) | | | | | |
| Ferrovial Construction International S.E. | | Ferrovial SE | 100.0% | 761 | 1 |
| IRELAND (Registered Office: Dublin) | | | | | |
| Ferrovial Construction Ireland Ltd | | Ferrovial Construction Holdings Ltd | 100.0% | 8 | |
| MEXICO (Registered Office: México DF) | | | | | |
| Cadagua Ferr. Industrial MEXICO | | Cadagua, S.A. (a) | 75.1% | 0 | |
| Ferrovial Medio Ambiente y Energía, S.A. (a) | 24.9% | 0 | |
| NEW ZEALAND (Registered Office: Wellington) | | | | | |
| Ferrovial Construction (New Zealand) Limited | | Ferrovial Construcción Australia PTY LTD | 100.0% | 2 | |
| PERU (Registered Office: Lima) | | | | | |
| Ferrovial Construcción Perú, S.A.C. * | | Ferrovial Construction International S.E. | 99.99% | 0 | |
| POLAND (Registered Office: Cracow) | | | | | |
| Mostostal Kraków S.A. | | Budimex, S.A. | 100.0% | 3 | 1 |
| Mostostal Kraków Energetyka sp. z o.o. | | Mostostal Kraków SA | 100.0% | 0 | 1 |
| Fotowoltaika HIG XIV Sp. z o.o. | | Budimex, S.A. | 100.0% | 2 | |
| POLAND (Registered Office: Kamieńsk) | | | | | |
| FBSerwis Kamieńsk Sp. z o.o. | | FBSerwis SA | 80.0% | 0 | 1 |
| FBSerwis Zielony Kamieńsk Sp. z o.o. | | FBSerwis Kamieńsk Sp. z o.o. | 100.0% | 0 | |
| POLAND (Registered Office: Kąty Wrocławskie) | | | | | |
| FBSerwis Wrocław Sp. z o.o. | | FBSerwis SA | 100.0% | 0 | 1 |
| FBSerwis Zielony Wrocław Sp. z o.o. | | FBSerwis Wrocław Sp. z o.o. | 100.0% | 0 | |
| POLAND (Registered Office: Ścinawka Dolna) | | | | | |
| FBSerwis Dolny Sląsk Sp. z o.o. | | FBSerwis SA | 100.0% | 0 | 1 |
| FBSerwis Zielony Dolny Śląsk Sp. z o.o. | | FBSerwis Dolny Sląsk Sp. z o.o. | 100.0% | 0 | |
| POLAND (Registered Office: Tarnów) | | | | | |
| FBSerwis Karpatia Sp. z o.o. | | FBSerwis SA | 100.0% | 0 | 1 |
| FBSerwis Zielona Karpatia Sp. z o.o. | | FBSerwis Karpatia Sp. z o.o. | 100.0% | 0 | |
| POLAND (Registered Office: Warsaw) | | | | | |
| Budimex, S.A. | | Ferrovial Construction International S.E. | 50.1% | 83 | 1 |
| Bx Budownictwo Sp. z o.o. | | Budimex, S.A. | 100.0% | 0 | 1 |
| Bx Kolejnictwo SA | | Budimex, S.A. | 100.0% | 26 | 1 |
| Budimex Parking Wrocław Sp. z o.o. | P | Budimex, S.A. | 51.0% | 1 | 1 |
| FBSerwis SA | | Budimex, S.A. | 100.0% | 69 | 1 |
| FBSerwis A Sp. z o.o. | | FBSerwis SA | 100.0% | 0 | |
| FBSerwis B Sp. z o.o. | | FBSerwis SA | 100.0% | 0 | |
| FBSerwis Odbiór Sp. z o.o. | | FBSerwis SA | 100.0% | 0 | |
| FBSerwis Paliwa Alternatywne Sp. z o.o. | | FBSerwis SA | 100.0% | 0 | |
| JZE Sp. z o.o. | | FBSerwis SA | 100.0% | 0 | |
| Zaklad, Przetworstwa Odpadow Zawisty Sp. Z.o.o. | | JZE Sp. z.o.o.0 | 100.0% | 0 | |
| Konstalex Sp. z o.o. | | Mostostal Kraków SA | 100.0% | 0 | |
| Budimex Most Wschodni S.A. | | Budimex, S.A. | 100.0% | 0 | 1 |
| Circular Construction SA | | Budimex Most Wschodni SA | 100.0% | 0 | 1 |
| Magnolia Energy Sp. z o.o. | P | Budimex, S.A. | 100.0% | 9 | 1 |
| Budimex PPP SA | | Budimex, S.A. | 100.0% | 4 | 1 |
| Budimex F Sp. z o.o. | | Budimex, S.A. | 100.0% | 0 | |
| Budimex A Sp. z o.o. | | Budimex, S.A. | 100.0% | 0 | |
| Budimex O Sp. z o.o. | | Budimex, S.A. | 100.0% | 0 | |
| Budimex P Sp. z o.o. | | Budimex, S.A. | 100.0% | 0 | |
| Budimex R Sp. z o.o. | | Budimex, S.A. | 100.0% | 0 | |
| Budimex D Sp. z o.o. | | Budimex SA | 76.0% | 0 | |
| Budimex SA Sygnity SA sj | | Budimex, S.A. | 67.0% | 0 | |
| Budimex SA Cadagua SA IV sc | | Budimex, S.A. | 99.9% | 0 | |
| Budimex SA Cadagua SA V sc | | Budimex, S.A. | 99.9% | 0 | |
| Budimex SA Tecnicas Reunidas SA - Turów s.c. | | Budimex, S.A. | 50.0% | 0 | |
| Green Waste Management 5 Sp. z o.o. | | FBSerwis SA | 100.0% | | |
| Green Waste Management 6 Sp. z o.o. | | FBSerwis SA | 100.0% | | |
| PUERTO RICO (Registered Office: San Juan) | | | | | |
| Ditecpesa PR, LLC | | Ferrovial Construction International S.E. | 100.0% | 1 | |
| Ferrovial Construcción Puerto Rico, LLC | | Ferrovial Construction International S.E. | 100.0% | 25 | |
| UNITED KINGDOM (Registered Office: London) | | | | | |
SECTION 6: OTHER DISCLOSURES
| | | | | | | | | | | | | | | | | |
| Ferrovial Construction (UK) Limited | | Ferrovial Construction Holdings Ltd | 100.0% | 9 | 1 |
| Ferrovial Construction Holdings Limited | | Ferrovial Construction International S.E. | 100.0% | 74 | 1 |
| FC Civil Solutions Limited | | Ferrovial Construction Holdings Ltd | 100.0% | 0 | |
| TOLL ROADS | | | |
| SPAIN (Registered Office: Madrid) | | | | | |
| Cintra Infraestructuras España, S.L. (a) | | Ferrovial, SE | 100.0% | 101 | 1 |
| Cintra Inversora Autopistas de Cataluña, S.L. (a) | P | Cintra Infraestructuras España S.L. (a) | 100.0% | 0 | 1 |
| Inversora Autopistas de Cataluña, S.L. (a) | P | Cintra Inversora Autopistas de Cataluña, S.L. (a)(a) | 100.0% | 0 | 1 |
| Cintra Inversiones, S.L.U. (a) | | Cintra Infraestructuras España S.L. (a) | 100.0% | 0 | |
| Cintra Servicios de Infraestructuras, S.A. (a) * | | Cintra Infraestructuras España S.L. (a) | 99.99% | 0 | 1 |
| Autopista Alcalá-O'Donnell, S.A. (a) | | Cintra Infraestructuras España S.L. (a) | 100.0% | 3 | |
| Autovía de Aragón, Sociedad Concesionaria, S.A. | P | Ferrovial Construcción, S.A. (a) | 55.0% | 23 | 1 |
| Cintra Infraestructuras España S.L. (a) | 30.0% | 15 | 1 |
| Ferrovial, SE | 15.0% | 3 | 1 |
| Pilum, S.A. * | P | Ferrovial SE | 94.1% | 0 | |
| Ferrovial Aravia, S.A. | P | Ferrovial Construcción, S.A. (a) | 55.0% | 1 | 1 |
| Cintra Infraestructuras España S.L. (a) | 30.0% | 1 | 1 |
| Ferrovial, SE | 15.0% | 0 | 1 |
| SPAIN (Registered Office: Barcelona) | | | | | |
| Autema, S.A. (a) | P | Inversora Autopistas de Cataluña, S.L. (a) | 76.3% | 426 | 1 |
| AUSTRALIA (Registered Office: Melbourne) | | | | | |
| Cintra OSARS (Western) Holdings Unit Trust | | Cintra OSARS Western Ltd | 100.0% | 23 | |
| Cintra OSARS Western Unit Trust | | Cintra OSARS (Western) Holdings Unit Trust | 100.0% | (3) | |
| AUSTRALIA (Registered Office: Sydney) | | | | | |
| Cintra Developments Australia PTY, Ltd | | Cintra Infrastructures UK Ltd | 100.0% | 1 | 1 |
| Cintra OSARS (Western) Holdings PTY Ltd | | Cintra OSARS Western Ltd | 100.0% | 0 | 1 |
| Cintra OSARS Western PTY Ltd | | Cintra OSARS (Western) Holdings PTY Ltd | 100.0% | 0 | 1 |
| CANADA (Registered Office: Toronto) | | | | | |
| Cintra 4352238 Investments INC | | 407 Toronto Highway B.V. | 100.0% | 0 | |
| COLOMBIA (Registered Office: Bogotá) | | | | | |
| Cintra Infraestructuras Colombia, S.A.S. (a) | | Cintra Global SE | 100.0% | 23 | 1 |
| UNITED STATES (Registered Office: Austin) | | | | | |
| Ferrovial Holding US Corp | | Cintra Infrastructures, S.E. | 100.0% | 3,102 | |
| Cintra Holding US Corp | | Ferrovial Holding US Corp | 100.0% | 22 | |
| Cintra Texas Corp | | Cintra Holding US Corp | 100.0% | (22) | |
| Cintra US Services LLC | | Cintra Texas Corp | 100.0% | 1 | |
| Cintra ITR LLC * | | Cintra Holding US Corp | 49.0% | 78 | |
| Ferrovial Construction US Corp. | 44.0% | 23 | 1 |
| Cintra LBJ LLC | | Cintra Holding US Corp | 100.0% | 303 | |
| Cintra NTE LLC | | Cintra Holding US Corp | 100.0% | 240 | |
| Cintra NTE Mobility Partners Segments 3 LLC | | Cintra Holding US Corp | 100.0% | 4 | |
| Cintra Toll Services LLC | | Cintra Holding US Corp | 100.0% | 0 | |
| Cintra I-77 Mobility Partners LLC | | Cintra Holding US Corp | 100.0% | 142 | |
| Cintra 2 I-77 Mobility Partners LLC | | Cintra Holding US Corp | 100.0% | 66 | |
| Cintra 2 I-66 Express Mobility Partners | | Cintra Holding US Corp | 100.0% | 679 | |
| I-66 Express Mobility Partners Holdings LLC | P | Cintra 2 I-66 Express Mobility Partners | 50.0% | 0 | |
| I-66 Express Mobility Partners LLC | P | I-66 Express Mobility Partners Holdings LLC | 100.0% | 1,437 | |
| Cintra 3I-66 Express Mobility Partners LLC | | Cintra Holding US Corp | 100.0% | 200 | |
| Cintra 3 I-77 Mobility Partners LLC | | Cintra Holding US Corp | 100.0% | 104 | |
| Cintra Digital Business Ventures LLC | P | Cintra Holding US Corp | 100.0% | 0 | |
| Cintra North Corridor Transit Partners LLC | P | Cintra Holding US Corp | 100.0% | 0 | |
| UNITED STATES (Registered Office: Charlotte) | | | | | |
| I-77 Mobility Partners Holding LLC * | P | Cintra I-77 Mobility Partners LLC | 50.1% | 108 | |
| Cintra 2-I77 Mobility Partners Holding LLC | 15.0% | 68 | |
| I-77 Mobility Partners LLC | P | I-77 Mobility Partners Holding LLC | 100.0% | 218 | 1 |
| UNITED STATES (Registered Office: Dallas) | | | | | |
| LBJ Infrastructure Group Holding LLC | P | Cintra LBJ LLC | 54.6% | 0 | |
| LBJ Infrastructure Group LLC | P | LBJ Infrastructure Group Holding LLC | 100.0% | 521 | 1 |
| UNITED STATES (Registered Office: North Richland Hills) | | | | | |
| NTE Mobility Partners Holding LLC | P | Cintra NTE LLC | 63.0% | 240 | 1 |
| NTE Mobility Partners LLC | P | NTE Mobility Partners Holding LLC | 100.0% | 322 | 1 |
| NTE Mobility Partners Segments 3 Holding LLC | P | Cintra NTE Mobility Partners Segments 3 LLC | 53.7% | 276 | 1 |
| NTE Mobility Partners Segments 3 LLC | P | NTE Mobility Partners Segments 3 Holding LLC | 100.0% | 436 | 1 |
| NETHERLANDS (Registered Office: Amsterdam) | | | | | |
| Cintra Infrastructures SE | | Ferrovial SE | 100.0% | 3,021 | 1 |
SECTION 6: OTHER DISCLOSURES
| | | | | | | | | | | | | | | | | |
| Cintra Global SE | | Ferrovial SE | 100.0% | 3,242 | 1 |
| 407 Toronto Highway B.V. | | Cintra Global SE | 100.0% | 2,664 | 2 |
| Cintra INR Investments B.V. | | Cintra Global SE | 100.0% | 369 | 5 |
| Cintra Projects B.V. | | Cintra Global SE | 100.0% | 0 | |
| Cintra IM Investments B.V. | | Cintra Global SE | 100.0% | 0 | 1 |
| Cintra INVIT Investments B.V. | | Cintra Global SE | 100.0% | 718 | |
| Cintra Development BV | | Cintra Global SE | 100.0% | 0 | 1 |
| INDIA (Registered Office: Mumbai) | | | | | |
| Ciinfra India Private Limited* | | Cintra INR Investments BV | 99.99% | 0 | 1 |
| PORTUGAL (Registered Office: Lisbon) | | | | | |
| Vialivre, S.A. | P | Cintra Infrastructures SE | 84.0% | 0 | 1 |
| UNITED KINGDOM (Registered Office: London) | | | | | |
| Cintra Silvertown Ltd | | Cintra Infrastructures UK Ltd | 100.0% | 1 | 1 |
| UNITED KINGDOM (Registered Office: Oxford) | | | | | |
| Cintra Infrastructures UK Ltd | | Cintra Global SE | 100.0% | 42 | 1 |
| Cintra Toowoomba Ltd | | Cintra Infrastructures UK Ltd | 100.0% | 0 | |
| Cintra Slovakia Ltd | | Cintra Global SE | 100.0% | 1 | |
| Cintra OSARS Western Ltd | | Cintra Infrastructures UK Ltd | 100.0% | 23 | 1 |
| CHILE (Registered Office: Santiago de Chile) | | | | | |
| Cintra Infraestructuras Chile, S.p.A | | Cintra Global SE | 100.0% | 0 | |
| PERU (Registered Office: LIMA) | | | | | |
| Cintra Infraestructuras Perú, S.A.C* | | Cintra Infrastructures SE | 99.9% | 0 | |
| DIGITAL INFRASTRUCTURES | | | |
| SPAIN (Registered Office: Madrid) | | | | | |
| Ferrovial MAD 01, S.A. | | Ferrovial SE | 100.0% | 91 | |
| AIRPORTS | | | |
| SPAIN (Registered Office: Madrid) | | | | | |
| Ferrovial Aeropuertos España, S.A. (a) | | Ferrovial SE | 100.0% | 28 | |
| UNITED STATES (Registered Office: Austin) | | | | | |
| Ferrovial Airports Holding US Corp | | Ferrovial Holding US Corp | 100.0% | 799 | |
| UNITED STATES (Registered Office: Denver) | | | | | |
| Ferrovial Airports O&M Services LLC | | Ferrovial Airports Holding US Corp | 100.0% | 0 | |
| Ferrovial Airports US Terminal One LLC. | | Ferrovial Airports Holding US Corp | 100.0% | 734 | |
| UNITED STATES (Registered Office: New York) | | | | | |
| MARS NTO LLC. | | Ferrovial Airports US Terminal One LLC. | 96.1% | 742 | |
| Ferrovial Airports CHS MSA LLC | | Ferrovial Airports Holding US Corp | 100.0% | 0 | |
| NETHERLANDS (Registered Office: Amsterdam) | | | | | |
| Hubco Netherlands B.V. | | Ferrovial Airports International, SE | 100.0% | 807 | |
| FERROVIAL AIRPORTS FMM BV | | Ferrovial Airports International, SE | 100.0% | 5 | |
| Ferrovial Airports Turkey B.V. | | Ferrovial Airports International, SE | 100.0% | 152 | |
| UNITED KINGDOM (Registered Office: Oxford) | | | | | |
| Faero UK Holding Limited | P | Hubco Netherlands B.V. | 100.0% | 255 | 1 |
| Ferrovial Airports International, SE | | Ferrovial SE | 100.0% | 1,372 | 1 |
| TURKEY (Registered Office: Ankara) | | | | | |
| YDA HAVALIMANI YATIRIM VE (Dalaman) | P | Ferrovial Airports Turkey B.V. | 60.0% | 145 | 1 |
| ENERGY | | | |
| SPAIN (Registered Office: Madrid) | | | | | |
| Ferrovial Transco España , S.A.U. (a) | P | Ferrovial Transco International, B.V. | 100.0% | 14 | |
| Ferrovial Infraestructuras Energéticas, S.A.U. (a) | | Ferrovial SE | 100.0% | 21 | |
| Parque Solar Casilla, S.L.U. (a) | P | Ferrovial Infraestructuras Energéticas, S.A.U. (a) | 100.0% | 9 | 1 |
| Ferrovial Mobility, S.L. (a) | | Ferrovial SE | 100.0% | 15 | |
| Cea Infraestructuras Energéticas (a) | P | Ferrovial Infraestructuras Energéticas, S.A.U. (a) | 100.0% | 0 | |
| Jucar Infraestructuras Energéticas (a) | P | Ferrovial Infraestructuras Energéticas, S.A.U. (a) | 100.0% | 0 | |
| Pisuerga Infraestructuras Energéticas, S.A.U. (a) | P | Ferrovial Infraestructuras Energéticas, S.A.U. (a) | 100.0% | 0 | |
| Ferrovial Growth VI, S.L. (a) | | Ferrovial Infraestructuras Energéticas, S.A.U. (a) | 100.0% | 10 | |
| Roland Servicios Empresariales, S.L.U. | | Ferrovial Mobility, S.L. (a) | 100.0% | 15 | |
| Ferrovial 004, S.A. (a) | | Ferrovial SE | 100.0% | 17 | |
| Siemsa Control y Sistemas S.A.U. (a) | | Ferrovial Energía S.A. (a) | 100.0% | 1 | 1 |
| Ferrovial Energía S.A. (a) | | Ferrovial Construcción, S.A. (a) | 100.0% | 16 | 1 |
| CHILE (Registered Office: Santiago) | | | | | |
| Ferrovial Power Infrastructure Chile, SpA | | Ferrovial Transco International, B.V. | 100.0% | 65 | 1 |
| Ferrovial Transco Chile II SpA | P | Ferrovial Power Infraestructure Chile, SpA | 100.0% | 0 | |
SECTION 6: OTHER DISCLOSURES
| | | | | | | | | | | | | | | | | |
| Transchile Charrúa Transmisión, S.A.* | P | Ferrovial Power Infraestructure Chile, SpA | 99.9% | 0 | 1 |
| Ferrovial Transco Chile III SPA | P | Ferrovial Transco International, B.V. | 100.0% | 0 | |
| Ferrovial Transco Chile IV SpA | P | Ferrovial Power Infraestructure Chile, SpA | 100.0% | 0 | |
| Centella Transmisión, S.A.* | P | Ferrovial Power Infrastructure Chile, SpA | 99.99% | 50 | 1 |
| Centella Transmisión II, S.A. | P | Ferrovial Power Infrastructure Chile, SpA | 50.1% | 0 | 1 |
| Ferrovial Transco Chile III SPA | 49.9% | 0 | 1 |
| Alto Huemul Transmisión SPA | P | Ferrovial Power Infrastructure Chile, SpA | 100.0% | 0 | |
| Alto Huemul II SPA | P | Ferrovial Power Infrastructure Chile, SpA | 100.0% | 0 | |
| UNITED STATES (Registered Office: Austin) | | | | | |
| Ferrovial Mobility U.S., LLC | | Ferrovial Holding US Corp | 100.0% | 1 | |
| Ferrovial Energy US, LLC | | Ferrovial Holding US Corp | 100.0% | 13 | |
| Ferrovial Energy US 1, LLC | | Ferrovial Energy US, LLC | 100.0% | 0 | |
| Misae Solar IV | P | Ferrovial Energy US, LLC | 100.0% | 66 | |
| NETHERLANDS (Registered Office: Amsterdam) | | | | | |
| Ferrovial EG SE | | Ferrovial SE | 100.0% | 76 | 2 |
| Thalia Waste Treatment B.V. | | Ferrovial SE | 100.0% | 1 | |
| Ferrovial Transco International B.V. | | Ferrovial SE | 100.0% | 89 | |
| Ferrovial Services Netherlands B.V. | | Ferrovial SE | 100.0% | 26 | 1 |
| UNITED KINGDOM (Registered Office: London) | | | | | |
| Thalia Waste Management Limited | | Thalia Waste Treatment BV | 50.0% | 0 | 1 |
| Thalia MK ODC Limited | | Thalia Waste Management Limited | 100.0% | 0 | 1 |
| Thalia AWRP ODC Limited | | Thalia Waste Management Limited | 100.0% | 0 | 1 |
| Thalia WB HoldCo Limited | | Thalia Waste Management Limited | 100.0% | 0 | 1 |
| Thalia WB ODC Limited | | Thalia WB HoldCo Limited | 100.0% | 0 | 1 |
| Thalia WB Services Limited | | Thalia WB ODC Limited | 100.0% | 0 | 1 |
| Thalia WB SPV Limited | P | Thalia WB Services Limited | 100.0% | 0 | 1 |
| Thalia IOW SPV Limited | | Thalia Waste Management Limited | 100.0% | 0 | 1 |
| Thalia Services Limited | | Thalia Waste Management Limited | 100.0% | 0 | 1 |
| Thalia MK HoldCo Limited | P | Thalia Waste Management Limited | 100.0% | 0 | 1 |
| Thalia MK SPV Limited | | Thalia MK HoldCo Limited | 100.0% | 0 | 1 |
| Thalia Ventures Limited | | Thalia Holdco Ltd | 100.0% | 0 | 1 |
| Thalia IOW ODC Ltd | | Thalia Waste Management Limited | 100.0% | 0 | 1 |
| Thalia Holdco Ltd | | Thalia Waste Treatment BV | 100.0% | 0 | 1 |
| CHILE (Registered Office: Antofagasta) | | | | | |
| Berliam S.p.A.* | | Veltis, SpA | 65.1% | 0 | 1 |
| Inversiones Chile Ltda | 34.9% | 0 | 1 |
| CHILE (Registered Office: Los Andes) | | | | | |
| Steel Ingenieria, S.A.* | | Veltis, Sp.a | 99.99% | 31 | 1 |
| Veltis, S.p.A | | Ferrovial EG SE | 100.0% | 0 | 1 |
| CHILE (Registered Office: Santiago) | | | | | |
| Walvis, S.A.* | | Berliam S.p.A. | 99.7% | 0 | 2 |
| Inversiones (Chile) Holdings Limitada* | | Veltis, Sp.a | 99.99% | 3 | 1 |
| Inversiones (Chile) Limitada* | | Inversiones (Chile) Holding Limitada | 99.99% | 0 | |
| Veltis Servicios, SpA | | Veltis, S.p.A | 100.0% | 0 | |
| POLAND (Registered Office: Warsaw) | | | | | |
| BXF Energía Sp. z.o.o. | | Budimex, S.A. | 51.0% | 7 | |
| Ferrovial EG SE | 49.0% | 7 | |
| Azalia, Sp.z.o.o. | P | BXF Energía SP ZOO | 100.0% | 8 | |
| AUSTRALIA (Registered Office: Sydney) | | | | | |
| Ferrovial Energy PTY LTD | | Ferrovial EG SE | 100.0% | 0 | |
Auditor Key:
Auditors: (1) Ernst & Young, S.L., Madrid, Spain, Auditor Firm ID 1461; (2) Deloitte; (3) BDO; (4) PWC; (5) KPMG; (6) Vir Audit; (7) Elayouty
(a) Form part of the tax scope of Ferrovial SE and subsidiaries.
(*) The remaining percentage to complete the 100% Ownership in the company belongs to minority shareholders of the Ferrovial Group.
(**) In Members Voluntary Liquidation
(P) Project Company
(Net Cost Ownership: Net Cost of the parent company over subsidiary)
SECTION 6: OTHER DISCLOSURES
Appendix I. Associate companies (equity-accounted companies) (million euro)
| | | | | | | | | | | | | | | | | | | | | | | | | | | | | |
| Entity | Type | Parent | % Owner. | V. Eq. Method | Assets. | Liab. | Reven. | Results | Audit |
| CONSTRUCTION | | | | | | |
| CANADA | | | | | | | | | |
| Ontario Transit Group Inc. | | Ontario Transit FCCI (Hold Co) Inc. | 50.0% | 0 | 1,046 | 1,078 | 409 | 0 | |
| SPAIN | | | | | | | | | |
| Via Olmedo Pedralba, S.A. | | Ferrovial Construccion, S.A. | 7.2% | 1 | 5 | 2 | 5 | 0 | 3 |
| Boremer, S.A. | | Cadagua, S.A. | 50.0% | 1 | 2 | 1 | 0 | 0 | 2 |
| UNITED STATES | | | | | | | | | |
| Pepper Lawson Horizon Intl. Group | | Webber Commercial Construction LLC | 70.0% | 0 | 0 | 0 | 1 | 0 | 1 |
| ConnectedWorks, LLC | | Ferrovial Contruction US Holding Corp. | 40.0% | 0 | 0 | 0 | 0 | 0 | |
| POLAND | | | | | | | | | |
| Promos Sp. z o.o. | | Budimex SA | 26.3% | 1 | 3 | 1 | 3 | 0 | 0 |
| TOLL ROADS | | | | | | |
| AUSTRALIA | | | | | | | | | |
| Nexus Infrastructure Holdings Unit Trust | P | Cintra Toowoomba Ltd | 40.0% | 3 | 18 | 0 | 0 | 0 | |
| Nexus Infrastructure Unit Trust | P | Nexus Infrastructure Holdings Unit Trust | 100.0% | 10 | 37 | 16 | 37 | 3 | |
| Nexus Infrastructure Holdings PTY Ltd | P | Cintra Toowoomba Ltd | 40.0% | 0 | 0 | 0 | 0 | 0 | |
| Nexus Infrastructure PTY Ltd | P | Nexus Infrastructure Holdings PTY Ltd | 100.0% | 0 | 0 | 0 | 0 | 0 | |
| Netflow Osars (Western) GP | P | Cintra Osars (Western) Unit Trust | 50.0% | 38 | 151 | 74 | 25 | 3 | |
| SPAIN | | | | | | | | | |
| Bip & Drive, S.A. | P | Cintra Infraestructuras España, S.L. | 25.0% | 6 | 38 | 13 | 18 | 4 | |
| Empresa Mant. y Explotación M30, S.A. | | Ferrovial Construccion, S.A. | 50.0% | (34) | 238 | 238 | 37 | 10 | 5 |
| Madrid Calle 30, S.A. | P | Empresa Mant. y Explotación M30, S.A. | 20.0% | 56 | 730 | 169 | 158 | 68 | 8 |
| CANADA | | | | | | | | | |
| 407 International Inc | P | Cintra 4352238 Investment Inc. | 43.2% | 778 | 3,866 | 8,029 | 1,151 | 467 | 1 |
| COLOMBIA | | | | | | | | | |
| Concesionaria Ruta del Cacao S.A.S. | P | Cintra Infraestructuras Colombia S.A.S. | 30.0% | 27 | 736 | 644 | 139 | 22 | 2 |
| INDIA | | | | | | | | | |
| IRB Infrastructure Developers Limited | P | Cintra INR Investments B.V. | 19.9% | 315 | 5,025 | 3,463 | 894 | 50 | 5 |
| IRB Infrastructure Trust | P | IRB Infrastructure Developers Limited | 51.0% | 704 | 4,800 | 3,107 | 243 | (24) | |
| Cintra INVIT Investments B.V. | 24.0% | 0 | 0 | 0 | 0 | 0 | |
| MMK Toll Road Private Limited | P | IRB Infrastructure Developers Limited | 51.0% | 0 | 1 | 0 | 0 | 0 | |
| Cintra IM Investments B.V. | 24.0% | 0 | 0 | 0 | 0 | 0 | |
| UNITED KINGDOM | | | | | | | | | |
| Zero Bypass Holdings Ltd | P | Cintra Slovakia Ltd | 35.0% | 0 | 0 | 0 | 0 | 0 | |
| Zero Bypass Ltd | P | Zero Bypass Holdings Ltd | 100.0% | 13 | 944 | 908 | 36 | 3 | |
| RiverLinx Holdings Ltd | | Cintra Silvertown Ltd | 22.5% | 0 | 0 | 0 | 0 | 0 | |
| RiverLinx Ltd | P | RiverLinx Holdings Ltd | 100.0% | 65 | 1,820 | 1,528 | 204 | 7 | |
| PERU | | | | | | | | | |
| Sociedad Concesionaria Anillo Vial, S.A. | P | Cintra Infraestructuras Perú, S.A.C | 35.0% | 14 | 0 | 0 | 0 | 0 | |
| AIRPORTS | | | | | | |
| QATAR | | | | | | | | | |
| FMM Company LLC | | Ferrovial Airports FMM B.V. | 49.0% | 18 | 78 | 38 | 109 | 14 | |
| UNITED STATES | | | | | | | | | |
| JFK NTO SPONSOR AGGREGATOR LLC. | P | MARS NTO LLC | 51.0% | 1,006 | 10,436 | 8,547 | 68 | 7 | 1 |
| Total equity-accounted continuing operations | | 3,023 | | | | | |
SECTION 6: OTHER DISCLOSURES
Auditor key:
(1) EY; (2) Deloitte; (3) BDO; (4) PwC; (5) KPMG; (6) Vir Audit; (7) Mazars; (8) PKF; (9) Martins Pereira, Joao Careca & Asociados, Sroc.; (10) Grant Thornton UK LLP; (11) 3 Auditores SLP
(P) Project Company
(Value Eq. Method: Net Cost of the parent company over the equity-accounted company)