| | | | |
OMB APPROVAL |
| OMB Number: | | 3235-0570 |
| Expires: | | January 31, 2014 |
| Estimated average burden |
| hours per response | | 20.6 |
UNITED STATES
SECURITIES AND EXCHANGE COMMISSION
Washington, D.C. 20549
FORM N-CSR
CERTIFIED SHAREHOLDER REPORT OF REGISTERED
MANAGEMENT INVESTMENT COMPANIES
Investment Company Act file number: 811-22320
Russell Exchange Traded Funds Trust
(Exact name of registrant as specified in charter)
1301 2nd Avenue 18th Floor, Seattle Washington 98101
(Address of principal executive offices) (Zip code)
Mary Beth Rhoden, Secretary and Chief Legal Officer
18th Floor
Seattle, Washington 98101
206-505-4846
(Name and address of agent for service)
Registrant’s telephone number, including area code: 206-505-7877
Date of fiscal year end: March 31, 2012
Date of reporting period: April 1, 2011 – March 31, 2012
Item 1. Reports to Stockholders


2012 ANNUAL REPORT
Russell Exchange Traded Funds Trust
Russell OneFund ETFs™
MARCH 31, 2012
| | | | |
| FUND | | | | |
|
| Russell Equity ETF (formerly One Fund ETF) |
Russell Exchange Traded
Funds Trust
Russell Exchange Traded Funds Trust is a series investment company with 26 different investment portfolios referred to as Funds. These financial statements report on the Russell Equity ETF.
Russell Exchange Traded
Funds Trust
Russell OneFund ETFs™
Annual Report
March 31, 2012
Table of Contents
Russell Exchange Traded Funds Trust.
Copyright © Russell Investments 2012. All rights reserved.
Russell Investments is a Washington, USA corporation, which operates through subsidiaries worldwide and is a subsidiary of The Northwestern Mutual Life Insurance Company.
Fund objectives, risks, charges and expenses should be carefully considered before investing. A prospectus containing this and other important information must precede or accompany this material. Please read the prospectus carefully before investing.
Securities distributed through ALPS Distributors, Inc. member FINRA, not affiliated with Russell Investments.
Indices and benchmarks are unmanaged and cannot be invested in directly. Returns represent past performance, and are not a guarantee of future performance, and are not indicative of any specific investment. Index return information is provided by vendors and although deemed reliable, is not guaranteed by Russell Investments or its affiliates.
Performance quoted represents past performance and does not guarantee future results. The investment return and principal value of an investment will fluctuate so that shares, when redeemed, may be worth more or less than their original cost. Current performance may be lower or higher than the performance data quoted. Current to the most recent month-end performance may be obtained by visiting www.russelletfs.com/Products.
To Our Shareholders
I am pleased to present to you Russell Exchange Traded Funds Trust’s March 31, 2012 Annual Report for Russell Equity ETF. Inside you’ll find portfolio management discussions and fund performance information for the period December 31, 2011 to March 31, 2012.
This annual report covers the fiscal period from December 31, 2011 to March 31, 2012 and is in addition to the Russell Equity ETF’s annual report dated December 31, 2011. This additional 2012 report is a result of a change to the fiscal year end for the Russell Equity ETF. Going forward, this fund will have a fiscal year ending March 31 rather than December 31.
Although the past 12 months proved to be a challenging year for world markets, all of us at Russell remain focused on our primary mission — improving financial security for people. For over 75 years, we’ve helped clients invest in all kinds of markets throughout the market cycle. During good times and uncertain times, we are guided by the same disciplined, long-term investment approach.
During the fiscal year ended March 31, 2012, we witnessed non-stop assaults on the world economy: an earthquake, tsunami and nuclear disaster in Japan; ongoing conflicts in the Middle East; a financial crisis in Europe centered in Greece, Italy and Spain; the downgrade of U.S. debt in the summer; and continued market volatility throughout the fall and winter. Market volatility made the journey even more unsettling for many investors. Moving into 2012, however, equity markets showed improvement with strong gains. Investors reacted positively to the improved credit conditions in Europe and the Russell Global Large Cap Index rose 12.1% making it the best start to the year for equities since 1998. Equity markets within the U.S. also posted positive returns for the three months of 2012 with the Russell 1000 Index returning 12.90% for the quarter. Positive news on the U.S economy and better than expected housing and unemployment data also contributed to the early 2012 gains.
Volatile markets — like those we endured during the fiscal year — are often driven by emotions in the short-term. Longer-term, we believe underlying fundamentals drive the market. This belief, along with a thoughtful plan and globally diversified portfolio, can help you look past the day-to-day market fluctuations and help you reach your long-term goals.
From all of us at Russell Investments, thank you for the trust you have placed in our firm.
Best regards,

James G. Polisson
Managing Director
CEO, Russell Exchange Traded Funds
Russell Exchange Traded Funds Trust
Market Summary as of March 31, 2012 — (Unaudited)
Global equity markets continued the turnaround that began in the previous quarter with strong gains in January and February. Investors increasingly reacted positively to the improved credit conditions in Europe following the European Central Bank’s (ECB) successful Long-Term Refinancing Operations (LTRO). The program injected €1 trillion worth of liquidity into eurozone banks, eliminating the probability of a Lehman-like event. This provided clarity on policy and significantly reduced liquidity risk. The Russell Global Large Cap Index rose 12.1 percent, making it the best start to the year for equities since 1998. In addition to the growing relief about Europe, investors took heart from the continued flow of positive news on the U.S. economy, most notably better than expected housing and unemployment data.
Given the constructive tone of equity markets and risk assets in general, it was not surprising to see emerging markets (EM) outperforming developed markets by 2.3 percent, with Eastern Europe leading. However, there was a notable change of tone in March, as concerns about slowing Chinese growth caused EM to underperform developed markets by 4.6 percent. Within the developed markets, the U.S. was the strongest major market in U.S. dollar terms followed closely by Europe, which saw a growing divergence between core eurozone countries such as Germany and Austria, which were among the strongest markets globally, and peripheral countries such as Spain and Portugal, which barely rose.
Within Asia, Japan was the strongest market in local currency terms, but the surprise announcement by the Bank of Japan that it would target inflation prompted a significant depreciation in the Japanese yen, resulting in significantly lower U.S. dollar returns.
The improving market conditions also extended into bond markets as systemic risk dissipated, market volatility decreased and credit spreads tightened. Near-term Greek pressure was alleviated as private borrowers agreed on terms of a principal write-down (with the triggering of attendant credit default swaps realizing little-to-no market disruption) and the German parliament approved a second bailout of €130 billion. The events played out over a backdrop of ongoing global central bank easing (including the U.S. Federal Reserve’s pledge to extend its hold into 2014), positive U.S. economic data, and somewhat decreasing concerns of a China hard landing. While the end of the quarter was marked by some disappointment that eurozone finance ministers limited fresh “firewall” funds to €500 billion, overall, events drove positive sentiment in risk assets with Pan-European banks returning an astounding 24 percent and the lowest quality global credits (rated Ca to D) returning 13 percent.
Peripheral European sovereign debt, which had been struggling, rebounded with strong returns. The positive environment helped capital to continue to pour into emerging market debt funds, bolstering their solid returns of 6 percent. Subprime mortgages did well, due in part to the Federal Reserve selling the remainder of its Maiden Lane II portfolio privately and some indications that the housing market may be nearing the bottom.
The U.S. equity market produced strong returns during the first quarter of 2012. The Russell 1000 Index returned 12.90% for the quarter, posting positive returns in each of the three months. During the quarter, the Russell 1000 Growth Index was up 14.69% while the Russell 1000 Value Index returned 11.12%.
The technology sector was the best performing sector within the Russell 1000 Index. Performance within technology was led by computer technology companies, most notably Apple Inc. which returned 48.08%. After being out of favor during 2011, the financial services sector posted the second strongest return of any sector in the Russell 1000 Index for the first quarter. Diversified banks, including Bank of America and SunTrust Banks, were some of the sector’s best performers. Stocks within the utilities and energy sectors lagged the overall market. Utilities stocks struggled to keep pace with the market as many investors came to believe that the relative valuation of the sector had become excessive due to outperformance in 2011. Within the energy sector, coal stocks fared the worst, due to a combination of a warm winter in the much of the U.S., natural gas substitution, and the prospect of new regulations from the Environmental Protection Agency (EPA).
The factor environment generally favored stocks with higher growth prospects and more cyclical earnings patterns. Stocks with high beta performed well, as did stocks with above average historical earnings per share growth and high
Russell Exchange Traded Funds Trust
growth forecasts. Stocks with high dividend yields underperformed the market, as did stocks with high debt to capital ratios. The underperformance of stocks of the most leveraged companies was one factor that deviated from what many thought of as a “risk on” theme during the quarter.
Headline economic data in the United States was generally positive. Year over year GDP growth within the United States was positive and above 3.5% for the months of December 2011, January 2012 and February 2012. Unemployment in the U.S. decreased modestly during the quarter, from 8.5% in December 2011 to 8.3% in February 2012. While the price of a barrel of Brent crude oil rose 14.43% during the quarter, the price of West Texas Intermediate, a harbinger of fuel prices in the U.S., rose 4.24% to $103.02 per barrel. The general increase in gasoline prices in the U.S. was of concern for investors and politicians during the quarter, with President Obama reportedly considering actions to release strategic petroleum reserves in hopes of lowering the price of crude oil and related products. However many oil analysts and political pundits noted that the bigger problem was a shortage of refining capacity and downplayed the ultimate impact on gasoline prices from a release of crude oil.
Correlations among U.S. stocks remained at average levels relative to history and much lower levels than those reached during the third quarter of 2011. The Chicago Board Options Exchange Volatility Index (“VIX”) also remained in line with longer term average levels during the quarter, and declined from 23.4 at the beginning to 15.5 at the end of the first quarter.
Russell Exchange Traded Funds Trust
Russell One Fund ETFs™
Russell Equity ETF (formerly, One Fund®)
Portfolio Management Discussion and Analysis — March 31, 2012 (Unaudited)
| | | | | | | | | | | | | | | | |
|
| Average Annual Total Return | |
| | | Net
Asset
Value | | | Market
Value | | | Russell
Developed
Large Cap
Index** | | | S&P 500
Index*** | |
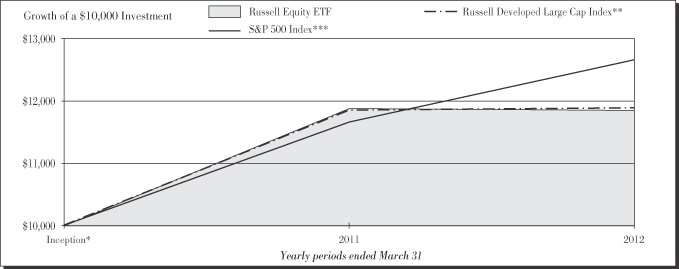
For the period 1/1/2012 to 3/31/2012 | | | 12.21 | % | | | 12.26 | % | | | 11.75 | % | | | 12.59 | % |
1 Year | | | (0.25 | )% | | | (0.24 | )% | | | 0.28 | % | | | 8.54 | %§ |
Inception* | | | 9.34 | % | | | 9.33 | % | | | 9.49 | % | | | 13.18 | %§ |
| | | | | | | | | | | | | | | | |
| | |
| Cumulative Total Return | | | | | | | |
| | | Net
Asset
Value | | | Market
Value | | | Russell
Developed
Large Cap
Index** | | | S&P 500
Index*** | |
For the period 1/1/2012 to 3/31/2012 | | | 12.21 | % | | | 12.26 | % | | | 11.75 | % | | | 12.59 | % |
1 Year | | | (0.25 | )% | | | (0.24 | )% | | | 0.28 | % | | | 8.54 | %§ |
Inception* | | | 18.39 | % | | | 18.36 | % | | | 18.70 | % | | | 26.37 | %§ |
Russell Exchange Traded Funds Trust
Russell One Fund ETFs™
Russell Equity ETF (formerly, One Fund®)
Portfolio Management Discussion and Analysis — March 31, 2012 (Unaudited)
The Fund is a “fund of funds”, which means that the Fund seeks to achieve its investment objective by investing primarily in shares of other exchange-traded funds (“Underlying ETFs”). Under normal circumstances, the Fund will invest at least 80% of the value of its net assets in shares of equity Underlying ETFs.
What is the Fund’s investment objective?
The Russell Equity ETF (“Fund”) seeks to provide long-term capital appreciation.
How did the Fund perform relative to its benchmark for the fiscal year ended March 31, 2012?
For the quarter-ended March 31, 2012 the Russell Equity ETF gained 12.21%. This is compared to the Fund’s benchmark, the Russell Developed Large Cap Index, which gained 11.75%. The Fund’s performance includes operating expenses, whereas the index returns are unmanaged and do not include expenses of any kind. Effective August 31, 2011, the Fund changed its fiscal year end from December 31, 2011 to March 31, 2012. For the period ended December 31, 2011, the Russell Equity ETF lost 6.32%. This is compared to the Fund’s benchmark, the Russell Developed Large Cap Index, which lost 5.69% and the S&P 500 Index, which gained 2.11% during the same period. From January 1, 2011 to October 31, 2011, the Fund’s benchmark was the S&P 500 Index. Effective November 1, 2011, the Fund’s benchmark changed to the Russell Developed Large Cap Index. The reason for this change was to better reflect the goals and objectives of the Russell Equity ETF. The Fund seeks to provide investors with a broad mix of stock investments across a variety of domestic and foreign markets. The higher long term growth rates experienced in many non-U.S. markets over the U.S. has increased the importance of having exposure in non-U.S. countries to capture global economic growth. The global exposure the Russell Developed Large Cap Index provides is a better representative of these goals than the S&P 500 Index, which only captures large cap U.S. stocks.
How did the market conditions described in the Market Summary report affect the Fund���s performance?
The Fund is a fund of funds and its performance is based on the performance of the Underlying ETFs in which the Fund invests.
Global equity markets started the year off with strong results in the first quarter, driven by more optimistic sentiment in Europe as well as continued positive economic trends in the U.S. In particular, better than expected housing and unemployment data improved the outlook for equity prices. Not surprisingly, the risk-on sentiment was led by emerging markets over developed markets, which benefitted the Fund’s strategic out-of-benchmark position in the emerging markets region.
How did the investment strategies and techniques employed by the Fund and its Underlying Funds affect the Fund’s performance?
The Fund’s strategic out-of-benchmark exposure to the emerging markets was the largest driver of outperformance, as the asset class generally outperformed developed markets for the first quarter. Other positive contributors included an underweight position in Canada relative to the benchmark. An underweight to the United Kingdom versus the benchmark was also positive.
Given the rebound in continental Europe due to the region’s recent improvement in credit conditions, the Fund’s underweight in the broad region detracted. While Japan had positive returns in local currency terms, a significant depreciation of the yen during the quarter resulted in much lower returns in U.S. dollar terms, which negatively impacted the Fund given its relative overweight position.
The Russell Equity ETF invests in passively managed ETFs, and employs strategic and tactical asset allocation of the underlying ETFs to outperform its benchmark. As a result of the allocation over the quarter, the Fund’s positioning in the iShares MSCI Emerging Markets ETF and iShares MSCI Canada Index Fund contributed to the Fund’s performance, while the Fund’s position in the iShares Japan Index Fund detracted.
Describe any changes to the Fund’s structure or allocation to the Underlying Funds.
As of March 31, 2012, the Russell Equity ETF holds a tactical overweight to the U.S. and Japan. Despite improved credit conditions in Europe, the Fund remained underweight Europe given the major structural economic concerns in the European Union. Finally, the Fund had an overweight position to emerging markets.
The views expressed in this report reflect those of the portfolio managers only through the end of the period covered by the report. These views do not necessarily represent the views of Russell Investment Management Company (RIMCo), or any other person in RIMCo or any other affiliated organization. These views are subject to change at any time based upon market conditions or other events, and RIMCo disclaims any responsibility to update the views contained herein. These views should not be relied on as investment advice and, because investment decisions for a Russell Exchange Traded Fund (RET) Fund are based on numerous factors, should not be relied on as an indication of investment decisions of any RET Fund.
Russell Exchange Traded Funds Trust
Russell One Fund ETFs™
Russell Equity ETF (formerly, One Fund®)
Portfolio Management Discussion and Analysis — March 31, 2012 (Unaudited)
| * | | The Fund first issued shares on May 11, 2010. |
| ** | | The Russell Developed Large Cap Index measures the performance of the large-cap segment of the developed equity Universe representing approximately 75.4% of the global equity market. |
| *** | | The S&P 500 Index is the Standard & Poor’s composite index of 500 stocks, a widely recognized, unmanaged index of common stock prices. One cannot invest directly in an index. |
Effective November 1, 2011, the Fund’s benchmark changed from the S&P 500 Index to the Russell Developed Large Cap Index.
Performance is historical and assumes reinvestment of all dividends and capital gains. Investment return and principal value will fluctuate so that an investor’s shares, when redeemed, may be worth more or less than when purchased. Past performance is not indicative of future results. The returns shown do not reflect the deduction of taxes that a shareholder would pay on Fund distributions or the redemption of Fund shares.
Russell Exchange Traded Funds Trust
Russell Equity ETF
Shareholder Expense Example — March 31, 2012 (Unaudited)
Fund Expenses
The following disclosure provides important information regarding the Fund’s Expense Example. Please refer to this information when reviewing the Expense Example for a Fund.
Example
As a shareholder of the Fund, you incur two types of costs: (1) transaction costs, including brokerage commissions on purchases and sales of your Fund shares and (2) ongoing costs, including management fees and other Fund expenses. The Example is intended to help you understand your ongoing costs (in dollars) of investing in the Fund and to compare these costs with the ongoing costs of investing in other funds. The Example is based on an investment of $1,000 invested at the beginning of the period and held for the entire period indicated, which for this Fund is from January 1, 2012 to March 31, 2012.
Actual Expenses
The information in the table under the heading “Actual Performance” provides information about actual account values and actual expenses. You may use the information in this column, together with the amount you invested, to estimate the expenses that you paid over the period. Simply divide your account value by $1,000 (for example, an $8,600 account value divided by $1,000 = 8.6), then multiply the result by the number in the first column in the row entitled “Expenses Paid During Period” to estimate the expenses you paid on your account during this period.
Hypothetical Example for Comparison Purposes
The information in the table under the heading “Hypothetical Performance (5% return before expenses)” provides information about hypothetical account values and hypothetical expenses based on the Fund’s actual expense ratio and an assumed rate of return of 5% per year before expenses, which is not the
Fund’s actual return. The hypothetical account values and expenses may not be used to estimate the actual ending account balance or expenses you paid for the period. You may use this information to compare the ongoing costs of investing in the Fund and other funds. To do so, compare this 5% hypothetical example with the 5% hypothetical examples that appear in the shareholder reports of other funds.
Please note that the expenses shown in the table are meant to highlight your ongoing costs only and do not reflect any transactional costs, such as brokerage commissions paid on purchases and sales of Fund shares. Therefore, the information under the heading “Hypothetical Performance (5% return before expenses)” is useful in comparing ongoing costs only, and will not help you determine the relative total costs of owning different funds. In addition, if these transactional costs were included, your costs would have been higher.
| | | | | | | | |
| | | Actual
Performance | | | Hypothetical
Performance
(5% return
before expenses) | |
| | | | | | | | |
Beginning Account Value | | | | | | | | |
January 1, 2012 | | $ | 1,000.00 | | | $ | 1,000.00 | |
Ending Account Value | | | | | | | | |
March 31, 2012 | | $ | 1,218.70 | | | $ | 1,023.25 | |
Expenses Paid During Period* | | $ | 0 .97 | | | $ | 1 .77 | |
| * | Actual Expenses are equal to the Fund’s annualized expense ratio of 0.35% (representing the three month period annualized), multiplied by the average account value over the period, multiplied by 91/366 (to reflect the three month period). May reflect amounts waived, reimbursed and/or other credits. Without any waivers, reimbursements and/or other credits, expenses would have been higher. Hypothetical expenses are equal to the Fund’s annualized expense ratio of 0.35% (representing the six-month period annualized), multiplied by the average account value over the period, multiplied by 183/366 (to reflect the one-half period). |
Russell Exchange Traded Funds Trust
Russell Equity ETF
Schedule of Investments — March 31, 2012
Amounts in thousands (except share amounts)
| | | | | | | | |
| | | Shares | | | Market
Value
$ | |
| | | | | | | | |
| Investments in Other ETFs - 99.6% | | | | | | | | |
iShares MSCI Canada Index Fund | | | 3,441 | | | | 98 | |
iShares MSCI EAFE Small Cap Index Fund | | | 4,118 | | | | 165 | |
iShares MSCI Japan Index Fund | | | 10,215 | | | | 104 | |
iShares Russell 1000 Growth Index Fund | | | 2,877 | | | | 190 | |
iShares Russell 1000 Index Fund | | | 32,645 | | | | 2,545 | |
Vanguard MSCI EAFE ETF | | | 32,613 | | | | 1,110 | |
Vanguard MSCI Emerging Markets ETF | | | 12,835 | | | | 558 | |
Vanguard MSCI European ETF | | | 4,729 | | | | 218 | |
Vanguard MSCI Pacific ETF | | | 5,239 | | | | 278 | |
Vanguard Russell 2000 | | | 6,337 | | | | 419 | |
| | | | | | | | |
| | |
Total Investments in Other ETFs (cost $5,564) | | | | | | | 5,685 | |
| | | | | | | | |
| |
| Short-Term Investments - 0.4% | | | | | |
Russell U.S. Cash Management Fund | | | 24,282 | (¥) | | | 24 | |
| | | | | | | | |
| |
Total Short-Term Investments (cost $24) | | | | 24 | |
| | | | | | | | |
| |
Total Investments - 100.0% (identified cost $5,588) | | | | 5,709 | |
| |
Other Assets and Liabilities, Net - (0.0%) | | | | (1 | ) |
| | | | | | | | |
| | |
| Net Assets - 100.0% | | | | | | | 5,708 | |
| | | | | | | | |
See accompanying notes which are an integral part of the financial statements.
| | | | |
| | 10 | | | Schedule of Investments |
Russell Exchange Traded Funds Trust
Russell Equity ETF
Presentation of Portfolio Holdings — March 31, 2012
Amounts in thousands
| | | | | | | | | | | | | | | | | | | | |
| | | Market Value | | | % of Net
Assets | |
| Portfolio Summary | | Level 1 | | | Level 2 | | | Level 3 | | | Total | | |
| | | | | | | | | | | | | | | | | | | | |
Investments in Other ETFs | | $ | 5,685 | | | $ | — | | | $ | — | | | $ | 5,685 | | | | 99.6 | |
Short-Term Investments | | | — | | | | 24 | | | | — | | | | 24 | | | | 0.4 | |
| | | | | | | | | | | | | | | | | | | | |
| | | | | |
Total Investments | | | 5,685 | | | | 24 | | | | — | | | | 5,709 | | | | 100.0 | |
| | | | | | | | | | | | | | | | | | | | |
| | | | | |
Other Assets and Liabilities, Net | | | | | | | | | | | | | | | | | | | — | * |
| | | | | | | | | | | | | | | | | | | | |
| | | | | |
| | | | | | | | | | | | | | | | | | | 100.0 | |
| | | | | | | | | | | | | | | | | | | | |
| * | Less than .05% of net assets. |
For a description of the levels see note 2 in the Notes to Financial Statements.
There were no significant transfers in and out of levels 1, 2 and 3 during the period ending March 31, 2012.
See accompanying notes which are an integral part of the financial statements.
| | |
Presentation of Portfolio Holdings | | 11 |
Russell Exchange Traded Funds Trust
Russell Equity ETF
Statement of Assets and Liabilities — March 31, 2012
| | | | |
| Amounts in thousands | | Russell Equity
ETF | |
| | | | |
Assets | | | | |
Investments, at identified cost | | $ | 5,588 | |
Investments, at market* | | | 5,709 | |
Receivables: | | | | |
Dividends and interest | | | 1 | |
| | | | |
Total assets | | | 5,710 | |
| | | | |
| |
Liabilities | | | | |
Payables: | | | | |
Accrued fees to affiliates | | | 2 | |
| | | | |
Total liabilities | | | 2 | |
| | | | |
| | | | |
Net Assets | | $ | 5,708 | |
| | | | |
Net Assets Consist of: | | | | |
Undistributed (overdistributed) net investment income | | $ | — | |
Accumulated net realized gain (loss) | | | (54 | ) |
Unrealized appreciation (depreciation) on investments | | | 121 | |
Additional paid-in capital | | | 5,641 | |
| | | | |
Net Assets | | $ | 5,708 | |
| | | | |
Net Asset Value, offering and redemption price per share: | | | | |
Net asset value per share: (a) | | $ | 28.54 | |
Net assets | | $ | 5,707,601 | |
Shares outstanding ($.001 par value) | | | 200,000 | |
Amounts in thousands | | | | |
| | | | |
* Investments in Affiliates, Russell U.S. Cash Management Fund | | $ | 24 | |
| (a) | Net asset value per share equals net assets divided by shares outstanding. |
See accompanying notes which are an integral part of the financial statements.
| | | | |
| | 12 | | | Statement of Assets and Liabilities |
Russell Exchange Traded Funds Trust
Russell Equity ETF
Statement of Operations — For the Periods Ended
| | | | | | | | |
| | | Russell Equity ETF | |
| Amounts in thousands | | March 31,
2012* | | | December 31,
2011 | |
| | | | | | | | |
Investment Income | | | | | | | | |
Income distributions from Underlying ETFs | | $ | 12 | | | $ | 176 | |
| | | | | | | | |
Total investment income | | | 12 | | | | 176 | |
| | | | | | | | |
| | |
Expenses | | | | | | | | |
Management fees | | | 5 | | | | 38 | |
Trustee and trustee related fees | | | 3 | | | | 32 | |
| | | | | | | | |
Expenses before reductions | | | 8 | | | | 70 | |
Expense reductions | | | (3 | ) | | | (32 | ) |
| | | | | | | | |
Net expenses | | | 5 | | | | 38 | |
| | | | | | | | |
Net investment income (loss) | | | 7 | | | | 138 | |
| | | | | | | | |
| | |
Net Realized and Unrealized Gain (Loss) | | | | | | | | |
Net realized gain (loss) on: | | | | | | | | |
Investments | | | 1 | | | | (66 | ) |
In-kind redemptions | | | — | | | | 320 | |
| | | | | | | | |
Net realized gain (loss) | | | 1 | | | | 254 | |
Net change in unrealized appreciation (depreciation) on investments | | | 621 | | | | (1,312 | ) |
| | | | | | | | |
Net realized and unrealized gain (loss) | | | 622 | | | | (1,058 | ) |
| | | | | | | | |
Net Increase (Decrease) in Net Assets from Operations | | $ | 629 | | | $ | (920 | ) |
| | | | | | | | |
| * | For the period January 1, 2012 to March 31, 2012. |
See accompanying notes which are an integral part of the financial statements.
| | |
| Statement of Operations | | 13 |
Russell Exchange Traded Funds Trust
Russell Equity ETF
Statement of Changes in Net Assets — For the Periods Ended
| | | | | | | | | | | | |
| | | Russell Equity ETF | |
| Amounts in thousands | | March 31, 2012* | | | December 31, 2011 | | | December 31, 2010** | |
| | | | | | | | | | | | |
Increase (Decrease) in Net Assets | | | | | | | | | | | | |
| | | |
Operations | | | | | | | | | | | | |
Net investment income (loss) | | $ | 7 | | | $ | 138 | | | $ | 122 | |
Net realized gain (loss) | | | 1 | | | | 254 | | | | — | |
Net change in unrealized appreciation (depreciation) | | | 621 | | | | (1,312 | ) | | | 812 | |
| | | | | | | | | | | | |
Net increase (decrease) in net assets from operations | | | 629 | | | | (920 | ) | | | 934 | |
| | | | | | | | | | | | |
| | | |
Distributions | | | | | | | | | | | | |
From net investment income | | | (8 | ) | | | (138 | ) | | | (126 | ) |
From return of capital | | | — | | | | (13 | ) | | | — | |
| | | | | | | | | | | | |
Net decrease in net assets from distributions | | | (8 | ) | | | (151 | ) | | | (126 | ) |
| | | | | | | | | | | | |
| | | |
Share Transactions | | | | | | | | | | | | |
Net increase (decrease) in net assets from share transactions | | | (3 | ) | | | (3,678 | ) | | | 8,931 | |
| | | | | | | | | | | | |
Total Net Increase (Decrease) in Net Assets | | | 618 | | | | (4,749 | ) | | | 9,739 | |
| | | |
Net Assets | | | | | | | | | | | | |
Beginning of period | | | 5,090 | | | | 9,839 | | | | 100 | |
| | | | | | | | | | | | |
End of period | | $ | 5,708 | | | $ | 5,090 | | | $ | 9,839 | |
| | | | | | | | | | | | |
Undistributed (overdistributed) net investment income included in net assets | | $ | — | | | $ | — | | | $ | (3 | ) |
| * | For the period January 1, 2012 to March 31, 2012. |
| ** | For the period May 11, 2010 (commencement of operations) to December 31, 2010. |
See accompanying notes which are an integral part of the financial statements.
| | | | |
| | 14 | | | Statement of Changes in Net Assets |
(This page intentionally left blank)
Russell Exchange Traded Funds Trust
Russell Equity ETF
Financial Highlights — For the Periods Ended
For a Share Outstanding Throughout Each Period.
| | | | | | | | | | | | | | | | | | | | | | | | |
| | |
$
Net Asset Value,
Beginning of
Period | | | $
Net
Investment
Income (Loss)(b) | | | $
Net Realized
and Unrealized
Gain (Loss) | | | $
Total from
Investment
Operations | | | $
Distributions
from Net
Investment Income | | | $
Return of
Capital | |
Russell Equity ETF | | | | | | | | | | | | | | | | | | | | | |
March 31, 2012(2) | | | 25.45 | | | | .03 | (a) | | | 3.10 | | | | 3.13 | | | | (.04 | ) | | | — | |
December 31, 2011 | | | 27.80 | | | | .36 | (a) | | | (2.13 | ) | | | (1.77 | ) | | | (.53 | ) | | | (.05 | ) |
December 31, 2010(1) | | | 25.00 | | | | .35 | | | | 2.81 | | | | 3.16 | | | | (.36 | ) | | | — | |
| (1) | For the period May 11, 2010 (commencement of operations) to December 31, 2010. |
| (2) | For the period January 1, 2012 to March 31, 2012. |
| (a) | Average daily shares outstanding were used for this calculation. |
| (b) | Recognition of net investment income by the Fund is affected by the timing of the declaration of dividends by the Underlying Fund in which the Fund invests. |
| (c) | Periods less than one year are not annualized. |
| (d) | May reflect amounts waived and/or reimbursed by RIMCo (“Russell Investment Management Company”). |
| (e) | Periods less than one year are annualized. |
| (f) | The calculation includes only those expenses charged directly to the Fund and does not include expenses charged to the Underlying Funds in which the Fund invests. |
| (g) | Portfolio turnover rate excludes securities received or delivered from in-kind creation or redemption units. |
See accompanying notes which are an integral part of the financial statements.
| | | | | | | | | | | | | | | | | | | | | | | | | | | | | | |
$
Total
Distributions | | | $
Net Asset Value,
End of
Period | | | %
Total
Return(c) | | | $
Net Assets,
End of Period
(000) | | | %
Ratio of Expenses
to Average
Net Assets,
Gross(e)(f) | | | %
Ratio of Expenses
to Average
Net Assets,
Net(e)(f) | | | %
Ratio of Net
Investment Income
to Average
Net Assets(b) | | | %
Portfolio
Turnover Rate(c)(g) | |
| | | | | | | | | | | | | | | | | | | | | | | | | | | | | | |
| | (.04 | ) | | | 28.54 | | | | 12.21 | | | | 5,708 | | | | .58 | | | | .35 | (d) | | | .48 | (e)(d) | | | — | * |
| | (.58 | ) | | | 25.45 | | | | (6.32 | ) | | | 5,090 | | | | .65 | | | | .35 | (d) | | | 1.29 | (d) | | | 6 | |
| | (.36 | ) | | | 27.80 | | | | 12.62 | | | | 9,839 | | | | .57 | | | | .53 | | | | 3.57 | (e) | | | — | |
See accompanying notes which are an integral part of the financial statements.
Russell Exchange Traded Funds Trust
Russell OneFund ETFs™
Notes to Financial Statements — March 31, 2012
Russell Exchange Traded Funds Trust (the “Investment Company” or “RET” or “Trust”) is a series investment company comprised of 26 different investment portfolios that were in operation as of March 31, 2012. These financial statements report on the Russell Equity ETF (the “Fund”). The Investment Company is registered under the Investment Company Act of 1940, as amended, as an open-end management investment company. It is organized and operates as a Delaware statutory trust. Prior to April 15, 2011, the name of the Trust was U.S. One Trust and the Fund name was One Fund ETF.
Effective August 31, 2011, the Board of Trustees (the “Board”) approved the fiscal year end change from December 31 to March 31. As a result, these financial statements reports on a three month period.
The Fund is an exchange-traded fund (“ETF”). ETFs are funds that trade like other publicly-traded securities and may be designed to track an index or to be actively managed. The Fund is a “fund of funds,” which means that the Fund seeks to achieve its investment objective by investing primarily in shares of other exchange-traded funds (“Underlying ETFs”).
Unlike shares of a mutual fund, which can be bought from and redeemed by the issuing fund by all shareholders at a price based on net asset value (“NAV”), shares of the Fund may be directly purchased from and redeemed by the Fund at NAV solely by certain large institutional investors. Also unlike shares of a mutual fund, shares of the Fund are listed on a national securities exchange and trade in the secondary market at market prices that change throughout the day. The date the shares began trading on the secondary market is the “commencement of operations” date.
The Fund issues and redeems shares at their respective NAV only in blocks of a specified number of shares or multiples thereof (“Creation Units”). Only certain large institutional investors may purchase or redeem Creation Units directly with the Fund at NAV (“Authorized Participants”). These transactions are in exchange for certain securities similar to the Fund’s portfolio and/or cash. Except when aggregated in Creation Units, shares of the Fund are not redeemable securities. Shareholders who are not Authorized Participants may not redeem shares directly from the Fund.
The Fund had not properly recoded the trustee fees and corresponding expense reduction as of and for period ended December 31, 2011 and have accordingly revised the Statement of Operations and Financial Highlights to reflect the gross up of these amounts. The trustee fees and corresponding expense reduction on the Statement of Operations was revised from $0 to $31,744 and the gross expense ratio was revised from .35 to .65 to reflect these amounts.
| 2. | | Significant Accounting Policies |
The Fund’s financial statements are prepared in accordance with accounting principles generally accepted in the United States of America (“U.S. GAAP”) which require the use of management estimates and assumptions at the date of the financial statements. Actual results could differ from those estimates. The following is a summary of the significant accounting policies consistently followed by the Fund in the preparation of its financial statements.
Security Valuation
The Fund values portfolio securities according to Board-approved securities valuation procedures which include market and fair value procedures. In addition, the Fund values the shares of the Underlying ETFs at the last reported sale or settlement price. Money market fund securities are priced using the amortized cost method of valuation unless the Board determines that amortized cost does not represent market value of short-term debt obligations. The Board has delegated the responsibility for administration of the securities valuation procedures to Russell Funds Services Company (“RFSC”).
U.S. GAAP defines fair market value as the price that a Fund would receive to sell an asset or pay to transfer a liability in an orderly transaction between market participants at the measurement date. It establishes a fair value hierarchy that prioritizes inputs to valuation methods and requires a separate disclosure of the fair value hierarchy, for each major category of assets and liabilities, that segregates fair value measurements into levels (Level 1, 2, and 3). The inputs or methodology used for valuing securities are not necessarily an indication of the risk associated with investing in those securities. Levels 1, 2 and 3 of the fair value hierarchy are defined as follows:
| | • | | Level 1 — Quoted prices (unadjusted) in active markets or exchanges for identical assets and liabilities. |
| | • | | Level 2 — Significant other observable inputs, which may include, but are not limited to, quoted prices for similar assets or liabilities in markets that are active, quoted prices for identical or similar assets or liabilities in markets that are non-active, inputs other than quoted prices that are observable for the assets or liabilities (such as interest rates, yield curves, volatilities, prepayment speeds, loss severities, credit risks and default rates) or other market corroborated inputs. |
| | • | | Level 3 — Significant unobservable inputs based on the best information available in the circumstances, to the extent observable inputs are not available, which may include assumptions made by the Board or persons acting at their direction that are used in determining the fair market value of investments. |
| | | | |
| | 18 | | | Notes to Financial Statements |
Russell Exchange Traded Funds Trust
Russell OneFund ETFs™
Notes to Financial Statements, continued — March 31, 2012
The valuation techniques and significant inputs used in determining the fair market values of financial instruments classified as Level 1 and Level 2 of the fair value hierarchy are as follows:
Exchange traded funds that are traded on a national securities exchange are stated at the last reported sale or settlement price on the day of valuation. To the extent these securities are actively traded and valuation adjustments are not applied, they are categorized as Level 1 of the fair value hierarchy.
Investments in other mutual funds (including unregistered collective vehicles) are valued at their net asset value per share, and are categorized as Level 2 of the fair value hierarchy.
Level 3 Trading Assets and Trading Liabilities, at Fair Value
The valuation techniques and significant inputs used in determining the fair values of financial instruments classified as Level 3 of the fair value hierarchy are as follows:
Securities and other assets for which market quotes are not readily available are valued at fair value as determined in good faith by the Board and are categorized as Level 3 of the fair value hierarchy. Market quotes are considered not readily available in circumstances where there is an absence of current or reliable market-based data (e.g., trade information or broker quotes). When RFSC applies fair valuation methods that use significant unobservable inputs to determine a Fund’s NAV, securities will not be priced on the basis of quotes from the primary market in which they are traded, but rather may be priced by another method that the Board or persons acting at their direction believe accurately reflects fair value and are categorized as Level 3 of the fair value hierarchy. Fair value pricing may require subjective determinations about the value of a security. While the securities valuation procedures are intended to result in a calculation of a Fund’s NAV that fairly reflects security values as of the time of pricing, the process cannot guarantee that fair values determined by the Board or persons acting at their direction would accurately reflect the price that a Fund could obtain for a security if it were to dispose of that security as of the time of pricing (for instance, in a forced or distressed sale). The prices used by a Fund may differ from the value that would be realized if the securities were sold.
For fair valuations using significant unobservable inputs, U.S. GAAP requires a reconciliation of the beginning to ending balances for reported market values that presents changes attributable to total realized and unrealized gains or losses, purchases and sales, and transfers in/out of the Level 3 category during the period. In accordance with the requirements of U.S. GAAP, a fair value hierarchy and Level 3 reconciliation, if any, have been included in the Notes to the Schedule of Investments for each respective Fund, if considered material.
In 2011, the Financial Accounting Standards Board (“FASB”) issued an update to requirements relating to fair valuation measurements which represent amendments to achieve common fair value measurements and disclosure requirements in U.S. GAAP and International Financial Reporting Standards. The amendments are of two types: (i) those that clarify the FASB’s intent about the application of existing fair value measurements and disclosure requirements and (ii) those that change a particular principle or requirement for measuring fair value or for disclosing information about fair value measurements.
The amendments that change a particular principle or requirement for measuring fair value or disclosing information about fair value measurements relate to (i) measuring the fair value of the financial instruments that are managed within a portfolio; (ii) application of premium and discount in a fair value measurement; and (iii) additional disclosures about fair value measurements. The update is effective for annual periods beginning after December 15, 2011. Management does not believe the adoption of this update will have a material impact on the Funds’ financial statements.
Investment Transactions
Investment transactions are reflected as of the trade date for financial reporting purposes. This may cause the NAV stated in the financial statements to be different from the NAV at which shareholders may transact. Realized gains and losses from securities transactions, if any, are recorded on the basis of specific identified cost.
Investment Income
Distributions of income and capital gains from the Underlying ETFs are recorded on the ex-dividend date.
Federal Income Taxes
Since the Investment Company is a Delaware statutory trust, the Fund is a separate corporate taxpayer and determines its net investment income and capital gains (or losses) and the amounts to be distributed to the Fund’s shareholders without regard to the income and capital gains (or losses) of the other Funds.
| | |
| Notes to Financial Statements | | 19 |
Russell Exchange Traded Funds Trust
Russell OneFund ETFs™
Notes to Financial Statements, continued — March 31, 2012
The Fund qualifies as a regulated investment company under sub-chapter M of the Internal Revenue Code and intends to distribute all of its taxable income and capital gains. Therefore, no federal income tax provision is required for the Fund.
The Fund files a U.S. tax return. At December 31, 2011, the Fund has recorded no liabilities for net unrecognized tax benefits relating to uncertain income tax positions they have taken or expect to take in future tax returns. While the statute of limitations remains open to examine the Fund’s U.S. tax return filed for fiscal year ending December 31, 2010, no examinations are in progress or anticipated at this time. The Fund is not aware of any tax positions for which it is reasonably possible that the total amounts of unrecognized tax benefits will significantly change in the next twelve months.
The Fund complies with the authoritative guidance for uncertainty in income taxes which requires management to determine whether a tax position of the Fund is more likely than not to be sustained upon examination, including resolution of any related appeals or litigation processes, based on the technical merits of the position. For tax positions meeting the more likely than not threshold, the tax amount recognized in the financial statements is reduced by the largest benefit that has a greater than 50% likelihood of being realized upon ultimate settlement with the relevant taxing authority. Management determined that no accruals need to be made in the financial statements due to uncertain tax positions. Management continually reviews and adjusts its liability for income taxes based on analyses of tax laws and regulations, as well as their interpretations, and other relevant factors.
Dividends and Distributions to Shareholders
Income dividends are generally declared and paid quarterly. Capital gain distributions are generally declared and paid annually. An additional distribution may be paid by the Fund to avoid imposition of federal income and excise tax on any remaining undistributed capital gains and net investment income. Dividends and distributions cannot be automatically reinvested in additional shares of the Fund.
The timing and characterization of certain income and capital gain distributions are determined in accordance with federal tax regulations which may differ from U.S. GAAP. As a result, net investment income and net realized gain (or loss) from investment transactions for a reporting period may differ significantly from distributions during such period. The differences between tax regulations and U.S. GAAP relate primarily to investments in the Underlying ETFs sold at a loss, wash sale deferrals and in-kind transactions. Accordingly, the Fund may periodically make reclassifications among certain of their capital accounts without impacting their net asset values.
Expenses
Expenses included in the accompanying financial statements reflect the expenses of the Fund and do not include those expenses incurred by the Underlying ETFs. Because the Underlying ETFs have varied expense and fee levels and the Fund may own different proportions of the Underlying ETFs at different times, the amount of the fees and expenses incurred indirectly by the Fund will vary.
Guarantees
In the normal course of business the Fund enters into contracts that contain a variety of representations which provide general indemnifications. The Fund’s maximum exposure under these arrangements is unknown as this would involve future claims that may be made against the Fund that have not yet occurred. However, the Fund expects the risk of loss to be remote.
Market, Credit and Counterparty Risk
In the normal course of business, the Underlying ETFs trade financial instruments and enter into financial transactions where risk of potential loss exists due to changes in the market (market risk) or failure of the other party to a transaction to perform (credit risk). Similar to the credit risk, the Underlying ETFs may also be exposed to counterparty risk or risk that an institution or other entity with which the Fund has unsettled or open transactions will default. The potential loss could exceed the value of the relevant assets recorded in the Underlying ETFs’ financial statements (the “Assets”). The Assets, which potentially expose the Fund to credit risk, consist principally of cash due from counterparties and investments. The extent of the Fund’s exposure to credit and counterparty risks with respect to the Assets approximates their carrying value as recorded in the Fund’s Statement of Assets and Liabilities.
ETF Specific Risk
The Fund is a “fund of funds”. The Fund seeks to achieve its investment objective by investing primarily in shares of other exchange-traded funds. The Adviser employs an asset allocation strategy that seeks to provide exposure to multiple asset classes in a variety of domestic and foreign markets. The Adviser’s asset allocation strategy establishes a target asset allocation for the Fund and the Adviser then implements the strategy by selecting Underlying ETFs that represent each of the desired asset classes, sectors and strategies.
| | | | |
| | 20 | | | Notes to Financial Statements |
Russell Exchange Traded Funds Trust
Russell OneFund ETFs™
Notes to Financial Statements, continued — March 31, 2012
The Adviser employs an active management strategy, meaning that it buys and holds Underlying ETFs based on its asset allocation views, not based on time period dependent rebalancing policies.
| 3. | | Investment Transactions |
Securities
During the period ended March 31, 2012, purchases and sales of the Underlying ETFs (excluding investments held for short-term purposes and in-kind transactions) were as follows:
| | | | | | | | |
| | | Purchases | | | Sales | |
| | | | | | | | |
Russell Equity ETF | | $ | 22,819 | | | $ | 15,486 | |
The Fund did not have in-kind transactions during the period ended March 31, 2012.
| 4. | | Related Party Transactions, Fees and Expenses |
Russell Investment Management Company (“RIMCo”) advises the Fund and RFSC is the Fund’s administrator. RFSC is a wholly-owned subsidiary of RIMCo. RIMCo is a wholly-owned subsidiary of Frank Russell Company (a subsidiary of The Northwestern Mutual Life Insurance Company). Frank Russell Company provides ongoing money manager research and trade placement services to RET and RIMCo.
The Fund may also invest its cash reserves (the “Cash Balances”) in the Russell U.S. Cash Management Fund, an unregistered fund advised by RIMCo and administered by RFSC. As of March 31, 2012, the Fund has invested $24,282 in the Russell U.S. Cash Management Fund.
The management fee of 0.35% is based upon the average daily net assets of the Fund and are payable monthly. The Adviser pays all of the expenses of the Fund other than the management fee, distribution fees pursuant to the Funds’ Supervision and Management Agreements, if any, brokerage expenses, taxes, interest fees, litigation expenses, acquired fund fees and other extraordinary expenses. Management fees paid by the Fund for the period ended March 31, 2012 were as follows:
| | | | |
| | | Management | |
| | | | |
Russell Equity ETF | | $ | 4,824 | |
Waivers and Reimbursements
Until April 29, 2014, RIMCo has contractually agreed to waive up to the full amount of its 0.35% management fee to the extent that Total Annual Fund Operating Expenses, excluding extraordinary expenses, exceed 0.51% of the average daily net assets of the Fund on an annual basis. These waivers may not be terminated during the relevant period except with Board approval. For the period ended March 31, 2012, there were no fees waived and reimbursed by RIMCo.
The Adviser has voluntarily agreed to waive trustee and trustee related expenses paid by the Fund. For the period ended March 31, 2012, the total trustee and trustee related fees waived amounted to $3,135.
RIMCo does not have the ability to recover amounts waived or reimbursed from previous periods.
Accrued Fees Payable to Affiliate
Accrued fees payable to affiliate for the period ended March 31, 2012 were as follows:
| | | | |
| | | Russell
Equity ETF | |
| | | | |
Management fees | | $ | 1,680 | |
Board of Trustees
For all Funds of the Investment Company, each independent Trustee is paid a retainer of $70,000 per year, $5,000 for each regular quarterly meeting attended in person, and $2,500 for each Audit Committee meeting and Nominating and Governance Committee meeting. Each Trustee receives a $1,250 fee for attending the quarterly meeting by phone instead of receiving the full fee had the member attended in person. The Trustees are also compensated for out of pocket expenses. The Audit Committee Chair and Nominating and Governance Chair are each paid a fee of $12,000 and $6,000, respectively per year. The Chairman of the Board receives additional annual compensation of $20,000.
At March 31, 2012, the Fund had net tax basis capital loss carryforwards which may be applied against any net realized taxable gains in each succeeding year or until their respective expiration dates, whichever occurs first. Under the Regulated Investment
| | |
| Notes to Financial Statements | | 21 |
Russell Exchange Traded Funds Trust
Russell OneFund ETFs™
Notes to Financial Statements, continued — March 31, 2012
Company Modernization Act of 2010, the Fund will be permitted to carry forward capital losses incurred in taxable years beginning after December 22, 2010 for an unlimited period. However, any losses incurred during those future taxable years will be required to be utilized prior to the losses incurred in pre-enactment taxable years. As a result of this ordering rule, pre-enactment capital loss carryforwards may be more likely to expire unused. Additionally, post-enactment capital losses that are carried forward will retain their character as either short-term or long-term capital losses rather than being considered all short-term as under previous law. Available capital loss carryforwards and expiration dates are as follows:
| | | | | | | | | | | | |
| | | No Expiration | | | | |
| | | Short-term | | | Long-term | | | Totals | |
| | | | | | | | | | | | |
Russell Equity ETF | | $ | 53,547 | | | $ | — | | | $ | 53,547 | |
At March 31, 2012, the cost of investments and net unrealized appreciation (depreciation) for income tax purposes were as follows:
| | | | |
| | | Russell Equity
ETF | |
| | | | |
Cost of Investments | | $ | 5,587,789 | |
| | | | |
Unrealized Appreciation | | $ | 268,127 | |
Unrealized Depreciation | | | (146,636 | ) |
| | | | |
Net Unrealized Appreciation (Depreciation) | | $ | 121,419 | |
| | | | |
Undistributed Ordinary Income | | $ | — | |
Undistributed Long-Term Capital Gains
(Capital Loss Carryforward) | | $ | (53,547 | ) |
Tax Composition of Distributions | | | | |
Ordinary Income | | $ | 6,655 | |
Tax-Exempt Income | | $ | — | |
Long-Term Capital Gains | | $ | — | |
Distributions in Excess | | $ | 1,352 | |
Tax Return of Capital | | $ | — | |
| 6. | | Fund Share Transactions (amounts in thousands) |
As of March 31, 2012, there were an unlimited number of $0.001 par shares of beneficial interest authorized by the Trust. Shares are created and redeemed by the Fund at their NAV only in Creation Units or multiples thereof. Except when aggregated in Creation Units, shares of the Fund are not redeemable. The Shares are listed on the New York Stock Exchange Arca (“NYSE Arca” or the “Exchange”), subject to notice of issuance. The Shares trade on the Exchange at market prices. These prices may differ from the Shares’ NAV. The Shares are also redeemable only in Creation Unit aggregations, and generally in exchange for portfolio securities and a specified cash payment. Investors purchasing and redeeming Creation Units pay a purchase transaction fee and a redemption transaction fee directly to State Street Bank and Trust Company, the Fund’s custodian. A Creation Unit of the Fund consists of at least 50,000 Shares. Transactions in shares for the Fund for the periods ended March 31, 2012, December 31, 2011 and December 31, 2010 were as follows:
| | | | | | | | | | | | | | | | | | | | | | | | |
| | | 2012* | | | 2011 | | | 2010** | |
| | | Shares | | | Dollars | | | Shares | | | Dollars | | | Shares | | | Dollars | |
| | | | | | | | | | | | | | | | | | | | | | | | |
| | | | | | | | | | | | | | | | | | | | | | | | |
Russell Equity ETF | | | | | | | | | | | | | | | | | | | | | | | | |
Shares created | | | — | | | $ | — | | | | 500 | | | $ | 13,998 | | | | 350 | | | $ | 8,931 | |
Shares redeemed | | | — | | | | (3 | ) | | | (654 | ) | | | (17,676 | ) | | | — | | | | — | |
| | | | | | | | | | | | | | | | | | | | | | | | |
Total increase (decrease) | | | — | | | $ | (3 | ) | | | (154 | ) | | $ | (3,678 | ) | | | 350 | | | $ | 8,931 | |
| | | | | | | | | | | | | | | | | | | | | | | | |
| * | For the period January 1, 2012 to March 31, 2012. |
| ** | For the period May 11, 2010 (commencement of operations) to December 31, 2010. |
Management has evaluated events or transactions that may have occurred since March 31, 2012, through the date the financial statements were issued, that would merit recognition or disclosure in the financial statements. During this review nothing was discovered which would required further disclosure within the financial statements.
| | | | |
| | 22 | | | Notes to Financial Statements |
Report of Independent Registered Public Accounting Firm
To the Board of Trustees and Shareholders:
In our opinion, the accompanying statement of assets and liabilities, including the schedule of investments, and the related statement of operations and of changes in net assets and the financial highlights present fairly, in all material respects, the financial position of the Russell Equity ETF (one of the portfolios constituting the Russell Exchange Traded Funds Trust, hereafter referred to as the “Funds”) at March 31, 2012, the results of its operations, the changes in its net assets and the financial highlights for each of the periods indicated, in conformity with accounting principles generally accepted in the United States of America. The financial statements and financial highlights (hereafter referred to as “financial statements”) are the responsibility of the Fund’s management; our responsibility is to express an opinion on the financial statements based on our audit. We conducted our audit of these financial statements in accordance with the standards of the Public Company Accounting Oversight Board (United States). Those standards require that we plan and perform the audit to obtain reasonable assurance about whether the financial statements are free of material misstatement. An audit includes examining, on a test basis, evidence supporting the amounts and disclosures in the financial statements, assessing the accounting principles used and significant estimates made by management, and evaluating the overall financial statement presentation. We believe that our audit, which included confirmation of securities at March 31, 2012 by correspondence with the custodian, provides a reasonable basis for our opinion.

PricewaterhouseCoopers LLP
Seattle, Washington
May 29, 2012
| | |
| Report of Independent Registered Public Accounting Firm | | 23 |
Russell Exchange Traded Funds Trust
Russell OneFund ETFs™
Frequency Distribution of Discounts and Premiums — March 31, 2012 (Unaudited)
The chart below presents information about differences between the per share net asset value (“NAV”) of the Fund and the market trading price of shares of the Fund. For these purposes, the “market price” is the mid-point of the highest bid and lowest offer for Fund shares as of the close of trading on the exchange where Fund shares are listed. The term “premium” is sometimes used to describe a market price in excess of NAV and the term “discount” is sometimes used to describe a market price below NAV. The chart presents information about the size and frequency of premiums or discounts. As with other exchange traded funds, the market price of Fund shares is typically slightly higher or lower than the Fund’s per share NAV. Factors that contribute to the differences between market price and NAV include the supply and demand for Fund shares and investors’ assessments of the underlying value of a Fund’s portfolio securities.
| | | | | | | | |
| | | Russell Equity ETF | |
| Premium/Discount Range* | | Number of
Days | | | Percentage of
Total Days | |
| | | | | | | | |
Greater than 0.20% and Less than 1.00% | | | 10 | | | | 1.44 | % |
Greater than 0.05% and Less than 0.20% | | | 104 | | | | 15.03 | % |
Between 0.05% and -0.05% | | | 394 | | | | 56.94 | % |
Greater than -0.05% and Less than -0.20% | | | 99 | | | | 14.31 | % |
Greater than -0.20% and less than -1.00% | | | 85 | | | | 12.28 | % |
| | | | | | | | |
| | | 692 | | | | 100.00 | % |
| | | | | | | | |
| * | For the Period May 11, 2010 (commencement of operations) through March 31, 2012 (Unaudited). |
| | | | |
| | 24 | | | Frequency Distribution of Discounts and Premiums |
Russell Exchange Traded Funds Trust
Russell OneFund ETFs™
Tax Information — March 31, 2012
For the tax year ended March 31, 2012, the Funds hereby designate 100% or the maximum amount allowable, of its net taxable income as qualified dividends taxed at individual net capital gain rates.
For the tax year ended March 31, 2012, the Funds hereby designate under Section 871(k)(2)(c) of the Code, the maximum amount allowable as a short term capital gain dividend for purposes of the tax imposed under Section 871(a)(1)(A) of the Code. This applies to nonresident alien shareholders only.
The Form 1099 you receive in January 2013 will show the tax status of all distributions paid to your account in calendar year 2012.
The Funds designate dividends distributed during the fiscal year as qualifying for the dividends received deduction for corporate shareholders as follows:
| | | | |
Russell Equity ETF | | | 100.0 | % |
Please consult a tax adviser for any questions about federal or state income tax laws.
Russell Exchange Traded Funds Trust
Russell OneFund ETFs™
Shareholder Requests for Additional Information — March 31, 2012 (Unaudited)
A complete unaudited schedule of investments is made available generally no later than 60 days after the end of the first and third quarters of each fiscal year. These reports are available (i) free of charge, upon request, by calling the Fund at (888) 775-3837, (ii) on the Securities and Exchange Commission’s website at www.sec.gov, and (iii) at the Securities and Exchange Commission’s public reference room.
The Board has delegated to RIMCo, as RET’s investment adviser, the primary responsibility for monitoring, evaluating and voting proxies solicited by or with respect to issuers of securities in which assets of the Fund may be invested. RIMCo has established a proxy voting committee (“Committee”) and has adopted written proxy voting policies and procedures (“P&P”) and proxy voting guidelines (“Guidelines”). The Fund maintains a Portfolio Holdings Disclosure Policy that governs the timing and circumstances of disclosure to shareholders and third parties of information regarding the portfolio investments held by the Fund. A description of the P&P, Guidelines, Portfolio Holdings Disclosure Policy and additional information about Fund Trustees are contained in the Fund’s Statement of Additional Information (“SAI”). The SAI is available (i) free of charge, upon request, by calling the Fund at (888) 775-3837, (ii) at www.russelletfs.com, and (iii) on the Securities and Exchange Commission’s website at www.sec.gov.
To reduce expenses, we may mail only one copy of the Fund’s prospectus and each annual and semi-annual report to those addresses shared by two or more accounts. If you wish to receive individual copies of these documents, please contact your financial institution.
Some Financial Intermediaries may offer electronic delivery of the Fund’s prospectus and annual and semi-annual reports. Please contact your Financial Intermediary for further details.
| | | | |
| | 26 | | | Shareholder Requests for Additional Information |
Russell Exchange Traded Funds Trust
Russell OneFund ETFs™
Disclosure of Information about Fund Trustees and Officers — March 31, 2012 (Unaudited)
The Trustees and executive officers of the Trust, along with their principal occupations over the past five years and their affiliations, if any with the Adviser, are listed below. Unless otherwise noted, the principal business address of each Trustee and executive officer of the Trust is 1301 Second Avenue, 18th Floor, Seattle, Washington 98101.
| | | | | | | | | | | | |
Name, Address,
and Date of Birth | | Position(s) Held
with the Fund | | Term of Office
and Length of
Time Served | | Principal Occupation(s)
During Past 5 Years | | Number of
Portfolios in
Fund
Complex
Overseen
by Trustee | | | Other
Directorships Held
by Trustee |
INTERESTED TRUSTEES | | | | | | | | | | | | |
James Polisson* Born: November 11, 1959 | | Trustee | | Since 2011 | | Managing Director and Head of Global ETF Business, Frank Russell Company (2010 to present); and Chief Marketing Officer, Barclays Global Investors/iShares ETFs (2005 to 2010). | | | 26 | | | None. |
INDEPENDENT TRUSTEES |
Evelyn S. Dilsaver Born: May 4, 1955 | | Trustee, Chair since 2012 | | Since 2011 | | Corporate Director, Charles Schwab Investment Management (2003 to 2007); and President and Chief Executive Officer, Charles Schwab Investment Management (2004 to 2007). | | | 26 | | | Aeropostale, Inc. (retailer) (2008 to present); High Mark Funds (2008 to present); and Tempur-pedic, Int’l. (retailer) (2010 to present). |
| | | | | | | | | | | | | |
Jane A. Freeman Born: July 15, 1953 | | Trustee, Chair of Audit Committee since 2011 | | Since 2011 | | Consultant (2008 to present); and Executive Vice President and Chief Financial Officer, Scientific Learning (Educational Support Services) (1999 to 2008). | | | 26 | | | Harding Loevner Funds (Lead Director since 2008). |
| | | | | | | | | | | | | |
Lee T. Kranefuss** Born: September 27, 1961 | | Trustee | | Since 2011 | | Non-Executive Chairman, iShares (since 2009); Global Chief Executive Officer, iShares/Intermediary Groups of Barclays Global Investors (“BGI”) (2008 to 2009); Chief Executive Officer, iShares Intermediary Index and Market Group of BGI (2005 to 2008); Director of Barclays Global Fund Advisors (since 2005); Director, President and Chief Executive Officer of Barclays Global Investors International, Inc. (since 2005); and Director and Chairman of Barclays Global Investors Services (since 2005). | | | 26 | | | Barclays Global Investors Funds and Master Investment Portfolio (2001 to present). |
| | | | | | | | | | | | | |
Daniel O. Leemon Born: October 25, 1953 | | Trustee | | Since 2011 | | Retired. | | | 26 | | | Director, Corporate Executive Board (2003 to present). |
| | |
| Disclosure of Information about Fund Trustees and Officers | | 27 |
Russell Exchange Traded Funds Trust
Russell OneFund ETFs™
Disclosure of Information about Fund Trustees and Officers, continued — March 31, 2012 (Unaudited)
| | | | | | | | | | | | |
Name, Address,
and Date of Birth | | Position(s) Held
with the Fund | | Term of Office
and Length of
Time Served | | Principal Occupation(s)
During Past 5 Years | | Number of
Portfolios in
Fund
Complex
Overseen
by Trustee | | | Other
Directorships Held
by Trustee |
INTERESTED TRUSTEES (continued) | | | |
| | | | | | | | | | | | | |
Ernest L. Schmider Born: July 4, 1957 | | Trustee, Chairman of Nominating and Governance Committee since 2012 | | Since 2011 | | Adjunct Professor, Argyros School of Business and Economics, Chapman University, (Spring and Fall, 2010); Managing Director, Pacific Investment Management Company (PIMCO), President, PIMCO Funds (held various positions with PIMCO from 1994 to 2009). | | | 26 | | | None. |
| | | | | | | | |
Name, Address,
and Date of Birth | | Position(s) Held
with the Fund | | Term of Office
and Length of
Time Served | | Principal Occupation(s)
During Past 5 Years | | Other
Directorships Held
by Trustee |
OFFICERS | | | | | | | | |
James Polisson* Born: November 11, 1959 | | President and Chief Executive Officer | | Since 2011; until successor is chosen and qualified by Trustees | | Managing Director and Head of Global ETF Business, FRC; Chief Marketing Officer, Barclays Global Investors/ iShares ETFs, 2005–2010 | | N/A |
| | | | | | | | | |
Cheryl Wichers Born December 16, 1966 | | Chief Compliance Officer since 2005 | | Until removed by Independent Trustees | | Chief Compliance Officer, RIC; Chief Compliance Officer, RIF; Chief Compliance Officer, RIMCo; Chief Compliance Officer, RFSC; Chief Compliance Officer, Russell Exchange Traded Funds Trust April 2002-May 2005, Manager, Global Regulatory Policy | | N/A |
| | | | | | | | | |
Mark E. Swanson Born: November 26, 1963 | | Treasurer, Chief Financial Officer and Chief Accounting Officer | | Since 2011; until successor is chosen and qualified by Trustees | | Treasurer, Chief Accounting Officer and CFO, Russell Investment Company and Russell Investment Funds; Director, Funds Administration, RIMCo, Russell Fund Services Company, Russell Trust Company (a non-depository trust company), and Russell Financial Services, Inc.; and Treasurer and Principal Accounting Officer, SSgA Funds | | N/A |
| | | | | | | | | |
Mary Beth Rhoden Born: April 25, 1969 | | Secretary and Chief Legal Officer | | Since 2011; until successor is chosen and qualified by Trustees | | Associate General Counsel, FRC; Assistant Secretary, Russell Investment Company and Russell Investment Funds, 1999–2010; Secretary, RIMCo, Russell Fund Services Company and Russell Financial Services, Inc.; and Secretary and Chief Legal Officer, Russell Investment Company and Russell Investment Funds | | N/A |
| * | Mr. Polisson is also an officer and/or director of one or more affiliates of RET and is therefore an Interested Trustee. |
| ** | Ceased to be a Trustee effective April 25, 2012 |
| | | | |
| | 28 | | | Disclosure of Information about Fund Trustees and Officers |
Russell Exchange Traded Funds Trust
Russell Equity ETF
Matters Submitted to a Vote of Shareholders — March 31, 2012 (Unaudited)
There was a Special Meeting in Lieu of an Annual Meeting of Shareholders of the Russell Exchange Traded Funds Trust (the “Investment Company”) held at One Maritime Plaza, San Francisco, CA 94111 on February 18, 2011.
THE FOLLOWING MATTERS WERE VOTED UPON AT THE MEETING
The result of each vote accompany the description of each matter
1. Approval of new investment advisory agreement between the Investment Company, on behalf of the Fund, and Russell Investment Management Company.
Vote:
| | | | | | | | |
| | | For | | | Against | |
One Fund | | | 266,870 | | | | 360 | |
There was a Special Meeting in Lieu of an Annual Meeting of Shareholder of the Russell Exchange Traded Funds Trust (the “Investment Company”) held at 1301 2nd Ave, 18th Floor, Seattle, Washington 98101 on April 27, 2011.
THE FOLLOWING MATTERS WERE VOTED UPON AT THE MEETING
The result of each vote accompany the description of each matter
2. Election of Trustees
Vote:
| | | | | | | | | | | | | | | | |
| | | For | | | % Votes Cast | | | Withhold | | | % Votes Cast | |
James G. Polisson | | | 384,712 | | | | 99.51% | | | | 1,877 | | | | 0.49% | |
Evelyn S. Dilsaver | | | 385,006 | | | | 99.59% | | | | 1,583 | | | | 0.41% | |
Jane A. Freeman | | | 385,006 | | | | 99.59% | | | | 1,583 | | | | 0.41% | |
Lee T. Kranefuss | | | 384,712 | | | | 99.51% | | | | 1,877 | | | | 0.49% | |
Daniel O. Leemon | | | 384,712 | | | | 99.51% | | | | 1,877 | | | | 0.49% | |
Ernest L. Schmider | | | 384,712 | | | | 99.51% | | | | 1,877 | | | | 0.49% | |
| | |
| Matters Submitted to a Vote of Shareholders | | 29 |
Russell Exchange Traded Funds Trust
Russell OneFund ETFs™
1301 Second Avenue, Seattle, Washington 98101
(888) 775-3837
Interested Trustee
James Polisson*
Independent Trustees
Evelyn S. Dilsaver
Jane A. Freeman
Lee T. Kranefuss**
Daniel O. Leemon
Ernest L. Schmider
Officers
James Polisson, President and Chief Executive Officer
Cheryl Wichers, Chief Compliance Officer
Mark E. Swanson, Treasurer, Chief Financial Officer and Chief Accounting Officer
Mary Beth Rhoden, Secretary and Chief Legal Officer
Adviser
Russell Investment Management Company
1301 Second Avenue
Seattle, Washington 98101
Administrator
Russell Fund Services Company
1301 Second Avenue
Seattle, Washington 98101
Transfer and Dividend Disbursing Agent
State Street Bank and Trust Company
One Lincoln Street
Boston, MA 02111
Custodian
State Street Bank and Trust Company
Josiah Quincy Building
200 Newport Avenue North
Quincy, MA 02171
Office of Shareholder Inquiries
1301 Second Avenue
Seattle, Washington 98101
(888) 775-3837
Distributor
ALPS Distributors, Inc.
1290 Broadway, Suite 1100
Denver, CO 80203
Independent Registered Public Accounting Firm
PricewaterhouseCoopers LLP
1420 Fifth Avenue, Suite 1900
Seattle, WA 98101
| * | Mr. Polisson is also an officer and/or director of one or more affiliates of RET and is therefore an Interested Trustee. |
| ** | Ceased to be a Trustee effective April 25, 2012 |
This report is prepared from the books and records of the Funds and is submitted for the general information of shareholders and is not authorized for distribution to prospective investors unless accompanied or preceded by an effective Prospectus. Nothing herein contained is to be considered an offer of sale or a solicitation of an offer to buy shares of Russell Exchange Traded Funds Trust. Such offering is made only by Prospectus, which includes details as to offering price and other material information.
| | | | |
| | 30 | | | Adviser and Service Providers |
| | | | |
| Russell Exchange Traded Funds Trust | | 1301 Second Avenue | | 888-775-3837 |
| | Seattle, Washington 98101 | | www.russelletfs.com |


2012 ANNUAL REPORT
Russell Exchange Traded Funds Trust
Russell Investment Discipline ETFs™
MARCH 31, 2012
|
| FUND |
|
| Russell Aggressive Growth ETF |
|
| Russell Consistent Growth ETF |
|
| Russell Growth at a Reasonable Price ETF |
|
| Russell Contrarian ETF |
|
| Russell Equity Income ETF |
|
| Russell Low P/E ETF |
|
| Russell Small Cap Aggressive Growth ETF |
|
| Russell Small Cap Consistent Growth ETF |
|
| Russell Small Cap Low P/E ETF |
|
| Russell Small Cap Contrarian ETF |
Russell Exchange Traded Funds Trust
Russell Exchange Traded Funds Trust is a series investment company with 26 different investment portfolios referred to as Funds. These financial statements report on 10 of these Funds.
Russell Exchange Traded Funds Trust
Russell Investment Discipline ETFsTM
Annual Report
March 31, 2012
Table of Contents
Russell Exchange Traded Funds Trust.
Copyright © Russell Investments 2012. All rights reserved.
Russell Investments is a Washington, USA corporation, which operates through subsidiaries worldwide and is a subsidiary of The Northwestern Mutual Life Insurance Company.
Fund objectives, risks, charges and expenses should be carefully considered before investing. A prospectus containing this and other important information must precede or accompany this material. Please read the prospectus carefully before investing.
Securities distributed through ALPS Distributors, Inc. member FINRA, not affiliated with Russell Investments.
Russell Investments is the owner of the trademarks, service marks, and copyrights related to its respective indexes.
Performance quoted represents past performance and does not guarantee future results. The investment return and principal value of an investment will fluctuate so that shares, when redeemed, may be worth more or less than their original cost. Current performance may be lower or higher than the performance data quoted. Current to the most recent month-end performance may be obtained by visiting www.russelletfs.com/Products.
To Our Shareholders
I am pleased to present you with Russell Exchange Traded Funds 2012 Annual Report for the fiscal year ending March 31, 2012. Inside you’ll find portfolio management discussions and fund performance information.
Although the past 12 months proved to be a challenging year for world markets, all of us at Russell remain focused on our primary mission — improving financial security for people. For over 75 years, we’ve helped clients invest in all kinds of markets throughout the market cycle. During good times and uncertain times, we are guided by the same disciplined, long-term investment approach.
During the fiscal year ended March 31, 2012, we witnessed non-stop assaults on the world economy: an earthquake, tsunami and nuclear disaster in Japan; ongoing conflicts in the Middle East; a financial crisis in Europe centered in Greece, Italy and Spain; the downgrade of U.S. debt in the summer; and continued market volatility throughout the fall and winter. Market volatility made the journey even more unsettling for many investors. Moving into 2012, however, equity markets showed improvement with strong gains. Investors reacted positively to the improved credit conditions in Europe and the Russell Global Large Cap Index rose 12.1% making it the best start to the year for equities since 1998. Equity markets within the U.S. also posted positive for the three months of 2012 with the Russell 1000 Index returning 12.90% for the quarter. Positive news on the U.S economy and better than expected housing and unemployment data also contributed to the early 2012 gains.
Volatile markets — like those we endured during the fiscal year — are often driven by emotions in the short-term. Longer-term, we believe underlying fundamentals drive the market. This belief, along with a thoughtful plan and globally diversified portfolio, can help you look past the day-to-day market fluctuations and help you reach your long-term goals.
From all of us at Russell Investments, thank you for the trust you have placed in our firm.
Best regards,

James G. Polisson
Managing Director
CEO, Russell Exchange Traded Funds
Russell Exchange Traded Funds Trust
Market Summary as of March 31, 2012 — (Unaudited)
Global equity markets continued the turnaround that began in the previous quarter with strong gains in January and February. Investors increasingly reacted positively to the improved credit conditions in Europe following the European Central Bank’s (ECB) successful Long-Term Refinancing Operations (LTRO). The program injected €1 trillion worth of liquidity into eurozone banks, eliminating the probability of a Lehman-like event. This provided clarity on policy and significantly reduced liquidity risk. The Russell Global Large Cap Index rose 12.1 percent, making it the best start to the year for equities since 1998. In addition to the growing relief about Europe, investors took heart from the continued flow of positive news on the U.S. economy, most notably better than expected housing and unemployment data.
Given the constructive tone of equity markets and risk assets in general, it was not surprising to see emerging markets (EM) outperforming developed markets by 2.3 percent, with Eastern Europe leading. However, there was a notable change of tone in March, as concerns about slowing Chinese growth caused EM to underperform developed markets by 4.6 percent. Within the developed markets, the U.S. was the strongest major market in U.S. dollar terms followed closely by Europe, which saw a growing divergence between core eurozone countries such as Germany and Austria, which were among the strongest markets globally, and peripheral countries such as Spain and Portugal, which barely rose.
Within Asia, Japan was the strongest market in local currency terms, but the surprise announcement by the Bank of Japan that it would target inflation prompted a significant depreciation in the Japanese yen, resulting in significantly lower U.S. dollar returns.
The improving market conditions also extended into bond markets as systemic risk dissipated, market volatility decreased and credit spreads tightened. Near-term Greek pressure was alleviated as private borrowers agreed on terms of a principal write-down (with the triggering of attendant credit default swaps realizing little-to-no market disruption) and the German parliament approved a second bailout of €130 billion. The events played out over a backdrop of ongoing global central bank easing (including the U.S. Federal Reserve’s pledge to extend its hold into 2014), positive U.S. economic data, and somewhat decreasing concerns of a China hard landing. While the end of the quarter was marked by some disappointment that eurozone finance ministers limited fresh “firewall” funds to €500 billion, overall, events drove positive sentiment in risk assets with Pan-European banks returning an astounding 24 percent and the lowest quality global credits (rated Ca to D) returning 13 percent.
Peripheral European sovereign debt, which had been struggling, rebounded with strong returns. The positive environment helped capital to continue to pour into emerging market debt funds, bolstering their solid returns of 6 percent. Subprime mortgages did well, due in part to the Federal Reserve selling the remainder of its Maiden Lane II portfolio privately and some indications that the housing market may be nearing the bottom.
The U.S. equity market produced strong returns during the first quarter of 2012. The Russell 1000 Index returned 12.90% for the quarter, posting positive returns in each of the three months. During the quarter, the Russell 1000 Growth Index was up 14.69% while the Russell 1000 Value Index returned 11.12%.
The technology sector was the best performing sector within the Russell 1000 Index. Performance within technology was led by computer technology companies, most notably Apple Inc. which returned 48.08%. After being out of favor during 2011, the financial services sector posted the second strongest return of any sector in the Russell 1000 Index for the first quarter. Diversified banks, including Bank of America and SunTrust Banks, were some of the sector’s best performers. Stocks within the utilities and energy sectors lagged the overall market. Utilities stocks struggled to keep pace with the market as many investors came to believe that the relative valuation of the sector had become excessive due to outperformance in 2011. Within the energy sector, coal stocks fared the worst, due to a combination of a warm winter in the much of the U.S., natural gas substitution, and the prospect of new regulations from the Environmental Protection Agency (EPA).
The factor environment generally favored stocks with higher growth prospects and more cyclical earnings patterns. Stocks with high beta performed well, as did stocks with above average historical earnings per share growth and high
Russell Exchange Traded Funds Trust
growth forecasts. Stocks with high dividend yields underperformed the market, as did stocks with high debt to capital ratios. The underperformance of stocks of the most leveraged companies was one factor that deviated from what many thought of as a “risk on” theme during the quarter.
Headline economic data in the United States was generally positive. Year over year GDP growth within the United States was positive and above 3.5% for the months of December 2011, January 2012 and February 2012. Unemployment in the U.S. decreased modestly during the quarter, from 8.5% in December 2011 to 8.3% in February 2012. While the price of a barrel of Brent crude oil rose 14.43% during the quarter, the price of West Texas Intermediate, a harbinger of fuel prices in the U.S., rose 4.24% to $103.02 per barrel. The general increase in gasoline prices in the U.S. was of concern for investors and politicians during the quarter, with President Obama reportedly considering actions to release strategic petroleum reserves in hopes of lowering the price of crude oil and related products. However many oil analysts and political pundits noted that the bigger problem was a shortage of refining capacity and downplayed the ultimate impact on gasoline prices from a release of crude oil.
Correlations among U.S. stocks remained at average levels relative to history and much lower levels than those reached during the third quarter of 2011. The Chicago Board Options Exchange Volatility Index (“VIX”) also remained in line with longer term average levels during the quarter, and declined from 23.4 at the beginning to 15.5 at the end of the first quarter.
Russell Exchange Traded Funds Trust
Russell Aggressive Growth ETF
Portfolio Management Discussion and Analysis — March 31, 2012 (Unaudited)
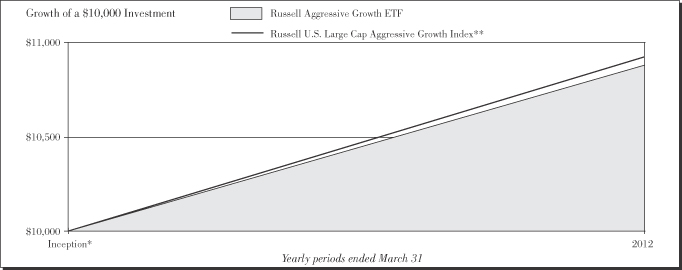
Performance as of March 31, 2012
| | | | | | | | | | | | |
|
| Average Annual Total Return | |
| | | Net Asset
Value | | | Market Value | | | Russell U.S.
Large Cap
Aggressive
Growth Index** | |
Inception* | | | 8.68 | % | | | 8.68 | % | | | 9.10 | % |
| | | | |
| | 6 | | | Russell Aggressive Growth ETF |
Russell Exchange Traded Funds Trust
Russell Aggressive Growth ETF
Portfolio Management Discussion and Analysis — March 31, 2012 (Unaudited)
The Russell Aggressive Growth ETF (the “Fund”) is an index-based exchange-traded fund that seeks investment results that closely correspond to the total return of the Russell U.S. Large Cap Aggressive Growth Index (the “Index”). Russell Investment Management Company (“RIMCo”), as the Fund’s advisor, uses a “passive” or indexing approach to try to achieve the Fund’s investment objective. Unlike many investment companies, the Fund does not try to “beat” the Index it tracks and does not seek temporary defensive positions when markets decline or appear overvalued. The Fund will normally invest at least 80% of its total assets in securities that comprise the Index.
What is the Fund’s investment objective?
The Fund seeks investment results that closely correspond to the total return of the Russell U.S. Large Cap Aggressive Growth Index, which is designed to select securities intended to produce performance that is similar to professional investment managers using an aggressive growth investment discipline.
Is the Fund replicating or sampling?
The Fund is replicating.
How did the Fund perform relative to its benchmark for the fiscal year ended March 31, 2012?
For the fiscal year ended March 31, 2012, the Fund gained 8.68%. This is compared to the Fund’s benchmark, the Russell U.S. Large Cap Aggressive Growth Index, which gained 9.10% during the same period. The Fund’s performance includes operating expenses, whereas indexes are unmanaged and index returns do not include expenses of any kind.
There were no significant changes to either the Fund or Index during the reporting period.
Did the Fund outperform or underperform the benchmark or was performance as expected based on expenses, etc.?
The Fund performed as expected against the benchmark.
Over the reporting period, please describe those sectors that outperformed or underperformed.
Sectors achieved both positive and negative returns for the Fund and the Index. Technology was the best performing sector for the Fund and the Index, while utilities was the worst performing sector. Technology, with an average weight of 32.9% was the best contributor to Fund and Index returns. Energy, with an average weight of 11.3%, was the worst contributor to Fund and Index returns.
Over the reporting period, please describe those individual securities (constituents) that outperformed or underperformed.
Apple Inc, Microsoft Corp, and International Business Machines Corp generated positive returns and contributed the most to Fund performance while Hewlett-Packard Co, Schlumberger Ltd, and Apache Corp, all declined which detracted from Fund performance.
The views expressed in this report reflect those of the portfolio managers only through the end of the period covered by the report. These views do not necessarily represent the views of RIMCo, or any other person in RIMCo or any other affiliated organization. These views are subject to change at any time based upon market conditions or other events, and RIMCo disclaims any responsibility to update the views contained herein. These views should not be relied on as investment advice and, because investment decisions for a Russell Exchange Traded Funds Trust (“RET”) Fund are based on numerous factors, should not be relied on as an indication of investment decisions of any RET Fund.
| * | | Commenced operations by issuing shares May 18, 2011. |
| ** | | The Russell U.S. Large Cap Aggressive Growth Index is designed to select securities intended to produce performance that is similar to professional investment managers using an aggressive growth investment discipline. This discipline focuses on companies with near term forecasted earnings that are expected to increase at a faster rate than those of the average company’s earnings. Starting with the Russell 1000® Index (an index comprised of U.S. stocks), the Index includes stocks that demonstrate growth potential as measured by: (1) average to high consensus forecasted earnings and (2) average to high one year historical sales growth. The Index excludes stocks with low earnings retention as measured by high dividend yields for the last four quarters. It also excludes stocks with low price to book ratios to ensure a growth orientation. |
Performance is historical and assumes reinvestment of all dividends and capital gains. Investment return and principal value will fluctuate so that an investor’s shares, when redeemed, may be worth more or less than when purchased. Past performance is not indicative of future results. The returns shown do not reflect the deduction of taxes that a shareholder would pay on Fund distributions or the redemption of Fund shares.
| | |
| Russell Aggressive Growth ETF | | 7 |
Russell Exchange Traded Funds Trust
Russell Aggressive Growth ETF
Shareholder Expense Example — March 31, 2012 (Unaudited)
Fund Expenses
The following disclosure provides important information regarding each Fund’s Expense Example, which appears on each Fund’s individual page in this Annual Report. Please refer to this information when reviewing the Expense Example for a Fund.
Example
As a shareholder of the Fund, you incur two types of costs: (1) transaction costs, including brokerage commissions on purchases and sales of your Fund shares and (2) ongoing costs, including management fees and other Fund expenses. The Example is intended to help you understand your ongoing costs (in dollars) of investing in the Fund and to compare these costs with the ongoing costs of investing in other funds. The Example is based on an investment of $1,000 invested at the beginning of the period and held for the entire period indicated, which for this Fund is from October 1, 2011 to March 31, 2012.
Actual Expenses
The information in the table under the heading “Actual Performance” provides information about actual account values and actual expenses. You may use the information in this column, together with the amount you invested, to estimate the expenses that you paid over the period. Simply divide your account value by $1,000 (for example, an $8,600 account value divided by $1,000 = 8.6), then multiply the result by the number in the first column in the row entitled “Expenses Paid During Period” to estimate the expenses you paid on your account during this period.
Hypothetical Example for Comparison Purposes
The information in the table under the heading “Hypothetical Performance (5% return before expenses)” provides information about hypothetical account values and hypothetical expenses based on the Fund’s actual expense ratio and an assumed rate of return of 5% per year before expenses, which is not the Fund’s actual return. The hypothetical account values and expenses may not be used to estimate the actual ending account balance or expenses you paid for the period. You may use this information to compare the ongoing costs of investing in the Fund and other funds. To do so, compare this 5% hypothetical example with the 5% hypothetical examples that appear in the shareholder reports of other funds.
Please note that the expenses shown in the table are meant to highlight your ongoing costs only and do not reflect any transactional costs, such as brokerage commissions paid on purchases and sales of Fund shares. Therefore, the information under the heading “Hypothetical Performance (5% return before expenses)” is useful in comparing ongoing costs only, and will not help you determine the relative total costs of owning different funds. In addition, if these transactional costs were included, your costs would have been higher.
| | | | | | | | |
| | | Actual
Performance | | | Hypothetical
Performance
(5% return
before expenses) | |
| | | | | | | | |
Beginning Account Value October 1, 2011 | | $ | 1,000.00 | | | $ | 1,000.00 | |
Ending Account Value March 31, 2012 | | $ | 1,290.50 | | | $ | 1,023.15 | |
Expenses Paid During Period* | | $ | 2.12 | | | $ | 1.87 | |
| * | Expenses are equal to the Fund’s annualized expense ratio of 0.37% (representing the six month period annualized), multiplied by the average account value over the period, multiplied by 183/366 (to reflect the one-half year period). |
| | | | |
| | 8 | | | Russell Aggressive Growth ETF |
Russell Exchange Traded Funds Trust
Russell Aggressive Growth ETF
Schedule of Investments — March 31, 2012
Amounts in thousands (except share amounts)
| | | | | | | | |
| | | Principal
Amount ($)
or Shares | | | Market
Value
$ | |
| | | | | | | | |
| Common Stocks - 99.8% | | | | | | | | |
| Consumer Discretionary - 20.0% | | | | | |
Abercrombie & Fitch Co. Class A | | | 147 | | | | 7 | |
Advance Auto Parts, Inc. | | | 112 | | | | 10 | |
Amazon.com, Inc. (Æ) | | | 281 | | | | 57 | |
Bed Bath & Beyond, Inc. (Æ) | | | 248 | | | | 16 | |
BorgWarner, Inc. (Æ) | | | 147 | | | | 12 | |
CarMax, Inc. (Æ) | | | 296 | | | | 10 | |
CBS Corp. Class B | | | 626 | | | | 21 | |
Chipotle Mexican Grill, Inc. Class A (Æ) | | | 34 | | | | 14 | |
Coach, Inc. | | | 276 | | | | 21 | |
Costco Wholesale Corp. | | | 358 | | | | 33 | |
Deckers Outdoor Corp. (Æ) | | | 82 | | | | 5 | |
Dick’s Sporting Goods, Inc. | | | 191 | | | | 9 | |
Discovery Communications, Inc. Class A (Æ) | | | 288 | | | | 15 | |
Dollar Tree, Inc. (Æ) | | | 136 | | | | 13 | |
Estee Lauder Cos., Inc. (The) Class A | | | 234 | | | | 14 | |
Family Dollar Stores, Inc. | | | 159 | | | | 10 | |
Fossil, Inc. (Æ) | | | 88 | | | | 12 | |
Gap, Inc. (The) | | | 474 | | | | 12 | |
Gentex Corp. | | | 242 | | | | 6 | |
Goodyear Tire & Rubber Co. (The) (Æ) | | | 467 | | | | 5 | |
Johnson Controls, Inc. | | | 612 | | | | 20 | |
Kohl’s Corp. | | | 263 | | | | 13 | |
Las Vegas Sands Corp. | | | 374 | | | | 22 | |
Liberty Media Corp. - Interactive (Æ) | | | 682 | | | | 13 | |
Limited Brands, Inc. | | | 279 | | | | 13 | |
LKQ Corp. (Æ) | | | 242 | | | | 8 | |
Lowe’s Cos., Inc. | | | 1,084 | | | | 34 | |
McDonald’s Corp. | | | 774 | | | | 76 | |
Netflix, Inc. (Æ) | | | 99 | | | | 11 | |
Nike, Inc. Class B | | | 295 | | | | 32 | |
Nordstrom, Inc. | | | 199 | | | | 11 | |
NVR, Inc. (Æ) | | | 10 | | | | 7 | |
Omnicom Group, Inc. | | | 292 | | | | 15 | |
O’Reilly Automotive, Inc. (Æ) | | | 143 | | | | 13 | |
Panera Bread Co. Class A (Æ) | | | 50 | | | | 8 | |
PetSmart, Inc. | | | 161 | | | | 9 | |
Polaris Industries, Inc. | | | 120 | | | | 9 | |
Priceline.com, Inc. (Æ) | | | 44 | | | | 32 | |
PVH Corp. | | | 101 | | | | 9 | |
Ralph Lauren Corp. Class A | | | 75 | | | | 13 | |
Ross Stores, Inc. | | | 254 | | | | 15 | |
Scripps Networks Interactive, Inc. Class A | | | 170 | | | | 8 | |
Sirius XM Radio, Inc. (Æ) | | | 5,077 | | | | 12 | |
Snap-on, Inc. | | | 123 | | | | 7 | |
Starbucks Corp. | | | 620 | | | | 35 | |
Target Corp. | | | 568 | | | | 33 | |
Tempur-Pedic International, Inc. (Æ) | | | 127 | | | | 11 | |
Tiffany & Co. | | | 153 | | | | 11 | |
TJX Cos., Inc. | | | 674 | | | | 27 | |
Tractor Supply Co. | | | 110 | | | | 10 | |
Tupperware Brands Corp. | | | 119 | | | | 8 | |
Ulta Salon Cosmetics & Fragrance, Inc. | | | 95 | | | | 9 | |
Urban Outfitters, Inc. (Æ) | | | 228 | | | | 7 | |
VF Corp. | | | 94 | | | | 14 | |
| | | | | | | | |
| | | Principal
Amount ($)
or Shares | | | Market
Value
$ | |
Viacom, Inc. Class B | | | 482 | | | | 23 | |
WABCO Holdings, Inc. (Æ) | | | 144 | | | | 9 | |
Wal-Mart Stores, Inc. | | | 1,323 | | | | 80 | |
Walt Disney Co. (The) | | | 1,446 | | | | 63 | |
Williams-Sonoma, Inc. | | | 182 | | | | 7 | |
| | | | | | | | |
| | | | | | | 1,059 | |
| | | | | | | | |
| | |
| Consumer Staples - 2.2% | | | | | | | | |
Corn Products International, Inc. | | | 133 | | | | 8 | |
Energizer Holdings, Inc. (Æ) | | | 103 | | | | 8 | |
Green Mountain Coffee Roasters, Inc. (Æ) | | | 180 | | | | 8 | |
Herbalife, Ltd. | | | 168 | | | | 12 | |
Hormel Foods Corp. | | | 239 | | | | 7 | |
Kroger Co. (The) | | | 576 | | | | 14 | |
Monster Beverage Corp. (Æ) | | | 190 | | | | 12 | |
Ralcorp Holdings, Inc. (Æ) | | | 90 | | | | 7 | |
Walgreen Co. | | | 772 | | | | 25 | |
Whole Foods Market, Inc. | | | 169 | | | | 14 | |
| | | | | | | | |
| | | | | | | 115 | |
| | | | | | | | |
| | |
| Energy - 7.4% | | | | | | | | |
Anadarko Petroleum Corp. | | | 406 | | | | 32 | |
Cameron International Corp. (Æ) | | | 258 | | | | 14 | |
Cimarex Energy Co. | | | 128 | | | | 10 | |
Concho Resources, Inc. (Æ) | | | 117 | | | | 12 | |
Core Laboratories NV | | | 69 | | | | 9 | |
EOG Resources, Inc. | | | 232 | | | | 26 | |
Halliburton Co. | | | 767 | | | | 25 | |
Helmerich & Payne, Inc. | | | 139 | | | | 7 | |
Noble Energy, Inc. | | | 169 | | | | 17 | |
Occidental Petroleum Corp. | | | 618 | | | | 59 | |
Oil States International, Inc. (Æ) | | | 91 | | | | 7 | |
Peabody Energy Corp. | | | 329 | | | | 10 | |
Pioneer Natural Resources Co. | | | 129 | | | | 14 | |
Plains Exploration & Production Co. (Æ) | | | 213 | | | | 9 | |
Schlumberger, Ltd. | | | 1,019 | | | | 70 | |
SM Energy Co. | | | 102 | | | | 7 | |
Southwestern Energy Co. (Æ) | | | 386 | | | | 12 | |
Sunoco, Inc. | | | 178 | | | | 7 | |
Ultra Petroleum Corp. (Æ) | | | 258 | | | | 6 | |
Walter Energy, Inc. Class A | | | 114 | | | | 7 | |
Whiting Petroleum Corp. (Æ) | | | 172 | | | | 9 | |
Williams Cos., Inc. (The) | | | 541 | | | | 17 | |
WPX Energy, Inc. (Æ) | | | 180 | | | | 3 | |
| | | | | | | | |
| | | | | | | 389 | |
| | | | | | | | |
| | |
| Financial Services - 5.7% | | | | | | | | |
Affiliated Managers Group, Inc. (Æ) | | | 80 | | | | 9 | |
Alliance Data Systems Corp. (Æ) | | | 76 | | | | 10 | |
American Express Co. | | | 830 | | | | 47 | |
American Tower Corp. Class A (ö) | | | 349 | | | | 22 | |
CBRE Group, Inc. Class A (Æ) | | | 480 | | | | 10 | |
Discover Financial Services | | | 559 | | | | 19 | |
Factset Research Systems, Inc. | | | 80 | | | | 8 | |
Franklin Resources, Inc. | | | 146 | | | | 18 | |
Global Payments, Inc. | | | 145 | | | | 7 | |
| | |
| Russell Aggressive Growth ETF | | 9 |
Russell Exchange Traded Funds Trust
Russell Aggressive Growth ETF
Schedule of Investments, continued — March 31, 2012
Amounts in thousands (except share amounts)
| | | | | | | | |
| | | Principal
Amount ($)
or Shares | | | Market
Value
$ | |
| | | | | | | | |
IntercontinentalExchange, Inc. (Æ) | | | 86 | | | | 12 | |
Mastercard, Inc. Class A | | | 87 | | | | 37 | |
MSCI, Inc. Class A (Æ) | | | 213 | | | | 8 | |
Raymond James Financial, Inc. | | | 207 | | | | 8 | |
T Rowe Price Group, Inc. | | | 257 | | | | 17 | |
TD Ameritrade Holding Corp. | | | 421 | | | | 8 | |
Visa, Inc. Class A | | | 410 | | | | 47 | |
Western Union Co. (The) | | | 675 | | | | 12 | |
| | | | | | | | |
| | | | | | | 299 | |
| | | | | | | | |
| | |
| Health Care - 12.3% | | | | | | | | |
Alexion Pharmaceuticals, Inc. (Æ) | | | 188 | | | | 17 | |
Allergan, Inc. | | | 263 | | | | 25 | |
Allscripts Healthcare Solutions, Inc. (Æ) | | | 354 | | | | 6 | |
AmerisourceBergen Corp. Class A | | | 294 | | | | 12 | |
Amgen, Inc. | | | 686 | | | | 47 | |
Baxter International, Inc. | | | 487 | | | | 29 | |
Becton Dickinson and Co. | | | 210 | | | | 16 | |
Biogen Idec, Inc. (Æ) | | | 208 | | | | 26 | |
BioMarin Pharmaceutical, Inc. (Æ) | | | 200 | | | | 7 | |
Cardinal Health, Inc. | | | 350 | | | | 15 | |
Celgene Corp. (Æ) | | | 388 | | | | 30 | |
Cerner Corp. (Æ) | | | 170 | | | | 13 | |
Cigna Corp. | | | 302 | | | | 15 | |
Cooper Cos., Inc. (The) | | | 89 | | | | 7 | |
CR Bard, Inc. | | | 108 | | | | 11 | |
DaVita, Inc. (Æ) | | | 122 | | | | 11 | |
Edwards Lifesciences Corp. (Æ) | | | 141 | | | | 10 | |
Endo Pharmaceuticals Holdings, Inc. (Æ) | | | 203 | | | | 8 | |
Express Scripts, Inc. Class A (Æ) | | | 438 | | | | 24 | |
Gilead Sciences, Inc. (Æ) | | | 658 | | | | 32 | |
Henry Schein, Inc. (Æ) | | | 135 | | | | 10 | |
IDEXX Laboratories, Inc. (Æ) | | | 95 | | | | 8 | |
Illumina, Inc. (Æ) | | | 224 | | | | 12 | |
Intuitive Surgical, Inc. (Æ) | | | 37 | | | | 20 | |
Laboratory Corp. of America
Holdings (Æ) | | | 119 | | | | 11 | |
McKesson Corp. | | | 232 | | | | 20 | |
Medco Health Solutions, Inc. (Æ) | | | 357 | | | | 25 | |
Mednax, Inc. (Æ) | | | 92 | | | | 7 | |
Perrigo Co. | | | 101 | | | | 10 | |
Regeneron Pharmaceuticals, Inc. (Æ) | | | 126 | | | | 15 | |
ResMed, Inc. (Æ) | | | 264 | | | | 8 | |
St. Jude Medical, Inc. | | | 356 | | | | 16 | |
Stryker Corp. | | | 305 | | | | 17 | |
SXC Health Solutions Corp. (Æ) | | | 120 | | | | 9 | |
UnitedHealth Group, Inc. | | | 847 | | | | 51 | |
Universal Health Services, Inc. Class B | | | 171 | | | | 7 | |
Varian Medical Systems, Inc. (Æ) | | | 145 | | | | 10 | |
Vertex Pharmaceuticals, Inc. (Æ) | | | 271 | | | | 11 | |
Watson Pharmaceuticals, Inc. Class B (Æ) | | | 160 | | | | 11 | |
Zimmer Holdings, Inc. | | | 205 | | | | 13 | |
| | | | | | | | |
| | | | | | | 652 | |
| | | | | | | | |
| |
| Materials and Processing - 5.5% | | | | | |
Air Products & Chemicals, Inc. | | | 199 | | | | 18 | |
Airgas, Inc. | | | 109 | | | | 10 | |
| | | | | | | | |
| | | Principal
Amount ($)
or Shares | | | Market
Value
$ | |
Allegheny Technologies, Inc. | | | 162 | | | | 7 | |
Aptargroup, Inc. | | | 127 | | | | 7 | |
Ball Corp. | | | 235 | | | | 10 | |
Celanese Corp. Class A | | | 204 | | | | 9 | |
CF Industries Holdings, Inc. | | | 75 | | | | 14 | |
Cliffs Natural Resources, Inc. | | | 170 | | | | 12 | |
Fastenal Co. | | | 304 | | | | 16 | |
FMC Corp. | | | 99 | | | | 10 | |
Monsanto Co. | | | 438 | | | | 35 | |
Mosaic Co. (The) | | | 277 | | | | 15 | |
Newmont Mining Corp. | | | 413 | | | | 21 | |
Post Holdings, Inc. (Æ) | | | 45 | | | | 1 | |
PPG Industries, Inc. | | | 162 | | | | 16 | |
Praxair, Inc. | | | 253 | | | | 29 | |
Precision Castparts Corp. | | | 127 | | | | 22 | |
Royal Gold, Inc. | | | 100 | | | | 7 | |
Sherwin-Williams Co. (The) | | | 110 | | | | 12 | |
Timken Co. | | | 169 | | | | 9 | |
Valspar Corp. | | | 175 | | | | 8 | |
| | | | | | | | |
| | | | | | | 288 | |
| | | | | | | | |
| |
| Producer Durables - 13.3% | | | | | |
3M Co. | | | 553 | | | | 49 | |
Accenture PLC Class A | | | 534 | | | | 34 | |
Agilent Technologies, Inc. | | | 365 | | | | 16 | |
Ametek, Inc. | | | 213 | | | | 10 | |
Automatic Data Processing, Inc. | | | 430 | | | | 24 | |
Caterpillar, Inc. | | | 501 | | | | 54 | |
CH Robinson Worldwide, Inc. | | | 177 | | | | 12 | |
Cintas Corp. | | | 199 | | | | 8 | |
CSX Corp. | | | 977 | | | | 21 | |
Cummins, Inc. | | | 186 | | | | 22 | |
Danaher Corp. | | | 476 | | | | 27 | |
Deere & Co. | | | 350 | | | | 28 | |
Donaldson Co., Inc. | | | 230 | | | | 8 | |
Dover Corp. | | | 204 | | | | 13 | |
Expeditors International of Washington, Inc. | | | 258 | | | | 12 | |
FedEx Corp. | | | 273 | | | | 25 | |
Flir Systems, Inc. | | | 268 | | | | 7 | |
IDEX Corp. | | | 171 | | | | 7 | |
IHS, Inc. Class A (Æ) | | | 83 | | | | 8 | |
JB Hunt Transport Services, Inc. | | | 157 | | | | 9 | |
Joy Global, Inc. | | | 130 | | | | 10 | |
Kansas City Southern (Æ) | | | 139 | | | | 10 | |
Kennametal, Inc. | | | 172 | | | | 8 | |
Lincoln Electric Holdings, Inc. | | | 166 | | | | 8 | |
Mettler-Toledo International, Inc. (Æ) | | | 52 | | | | 10 | |
MSC Industrial Direct Co., Inc. Class A | | | 90 | | | | 7 | |
Norfolk Southern Corp. | | | 307 | | | | 20 | |
PACCAR, Inc. | | | 369 | | | | 17 | |
Pall Corp. | | | 155 | | | | 9 | |
Pentair, Inc. | | | 195 | | | | 9 | |
Robert Half International, Inc. | | | 250 | | | | 8 | |
Rockwell Automation, Inc. | | | 159 | | | | 13 | |
Roper Industries, Inc. | | | 116 | | | | 12 | |
Stericycle, Inc. (Æ) | | | 117 | | | | 10 | |
| | | | |
| | 10 | | | Russell Aggressive Growth ETF |
Russell Exchange Traded Funds Trust
Russell Aggressive Growth ETF
Schedule of Investments, continued — March 31, 2012
Amounts in thousands (except share amounts)
| | | | | | | | |
| | | Principal
Amount ($)
or Shares | | | Market
Value
$ | |
| | | | | | | | |
Thomas & Betts Corp. (Æ) | | | 113 | | | | 8 | |
Towers Watson & Co. Class A | | | 113 | | | | 7 | |
TransDigm Group, Inc. (Æ) | | | 79 | | | | 9 | |
Trimble Navigation, Ltd. (Æ) | | | 183 | | | | 10 | |
Union Pacific Corp. | | | 386 | | | | 41 | |
United Parcel Service, Inc. Class B | | | 576 | | | | 46 | |
Wabtec Corp. | | | 94 | | | | 7 | |
Waste Connections, Inc. | | | 212 | | | | 7 | |
Waters Corp. (Æ) | | | 119 | | | | 11 | |
WW Grainger, Inc. | | | 62 | | | | 13 | |
| | | | | | | | |
| | | | | | | 704 | |
| | | | | | | | |
| Technology - 33.3% | | | | | | | | |
Adobe Systems, Inc. (Æ) | | | 504 | | | | 17 | |
Advanced Micro Devices, Inc. (Æ) | | | 1,227 | | | | 10 | |
Akamai Technologies, Inc. (Æ) | | | 261 | | | | 10 | |
Altera Corp. | | | 340 | | | | 14 | |
Amdocs, Ltd. (Æ) | | | 269 | | | | 8 | |
Amphenol Corp. Class A | | | 209 | | | | 12 | |
Analog Devices, Inc. | | | 328 | | | | 13 | |
Ansys, Inc. (Æ) | | | 138 | | | | 9 | |
Apple, Inc. (Æ) | | | 665 | | | | 398 | |
Applied Materials, Inc. | | | 1,320 | | | | 16 | |
Atmel Corp. (Æ) | | | 825 | | | | 8 | |
Autodesk, Inc. (Æ) | | | 300 | | | | 13 | |
Avago Technologies, Ltd. | | | 280 | | | | 11 | |
BMC Software, Inc. (Æ) | | | 252 | | | | 10 | |
Broadcom Corp. Class A (Æ) | | | 520 | | | | 20 | |
Cisco Systems, Inc. | | | 4,114 | | | | 87 | |
Citrix Systems, Inc. (Æ) | | | 201 | | | | 16 | |
Cognizant Technology Solutions Corp.
Class A (Æ) | | | 280 | | | | 22 | |
Crown Castle International Corp. (Æ) | | | 298 | | | | 16 | |
EMC Corp. (Æ) | | | 1,646 | | | | 49 | |
Equinix, Inc. (Æ) | | | 74 | | | | 12 | |
F5 Networks, Inc. (Æ) | | | 97 | | | | 13 | |
Gartner, Inc. (Æ) | | | 188 | | | | 8 | |
Google, Inc. Class A (Æ) | | | 185 | | | | 119 | |
Harris Corp. | | | 205 | | | | 9 | |
IAC/InterActiveCorp | | | 150 | | | | 7 | |
Informatica Corp. (Æ) | | | 188 | | | | 10 | |
International Business Machines Corp. | | | 879 | | | | 182 | |
Intuit, Inc. | | | 293 | | | | 18 | |
Jabil Circuit, Inc. | | | 348 | | | | 9 | |
Juniper Networks, Inc. (Æ) | | | 581 | | | | 13 | |
Lam Research Corp. (Æ) | | | 199 | | | | 9 | |
LSI Corp. (Æ) | | | 1,169 | | | | 10 | |
Marvell Technology Group, Ltd. (Æ) | | | 673 | | | | 11 | |
MICROS Systems, Inc. (Æ) | | | 145 | | | | 8 | |
Microsoft Corp. | | | 5,419 | | | | 175 | |
NetApp, Inc. (Æ) | | | 375 | | | | 17 | |
Novellus Systems, Inc. (Æ) | | | 150 | | | | 7 | |
Nuance Communications, Inc. (Æ) | | | 334 | | | | 9 | |
ON Semiconductor Corp. (Æ) | | | 853 | | | | 8 | |
Oracle Corp. | | | 2,874 | | | | 84 | |
| | | | | | | | |
| | | Principal
Amount ($)
or Shares | | | Market
Value
$ | |
Polycom, Inc. (Æ) | | | 380 | | | | 7 | |
QUALCOMM, Inc. | | | 1,255 | | | | 85 | |
Rackspace Hosting, Inc. (Æ) | | | 170 | | | | 10 | |
Red Hat, Inc. (Æ) | | | 237 | | | | 14 | |
Riverbed Technology, Inc. (Æ) | | | 286 | | | | 8 | |
SAIC, Inc. | | | 543 | | | | 7 | |
Salesforce.com, Inc. (Æ) | | | 136 | | | | 21 | |
SanDisk Corp. (Æ) | | | 253 | | | | 13 | |
SBA Communications Corp. Class A (Æ) | | | 177 | | | | 9 | |
Skyworks Solutions, Inc. (Æ) | | | 391 | | | | 11 | |
Solera Holdings, Inc. | | | 143 | | | | 7 | |
Symantec Corp. (Æ) | | | 814 | | | | 15 | |
Teradata Corp. (Æ) | | | 204 | | | | 14 | |
TIBCO Software, Inc. (Æ) | | | 292 | | | | 9 | |
VeriFone Systems, Inc. (Æ) | | | 188 | | | | 10 | |
VMware, Inc. Class A (Æ) | | | 112 | | | | 13 | |
Xilinx, Inc. | | | 318 | | | | 12 | |
| | | | | | | | |
| | | | | | | 1,762 | |
| | | | | | | | |
| | |
| Utilities - 0.1% | | | | | | | | |
ITC Holdings Corp. | | | 92 | | | | 7 | |
| | | | | | | | |
| | |
Total Common Stocks
(cost $4,750) | | | | | | | 5,275 | |
| | | | | | | | |
| | |
| Short-Term Investments - 0.2% | | | | | | | | |
Russell U.S. Cash Management Fund | | | 8,078 | (¥) | | | 8 | |
| | | | | | | | |
| | |
Total Short-Term Investments
(cost $8) | | | | | | | 8 | |
| | | | | | | | |
| |
Total Investments - 100.0%
(identified cost $4,758) | | | | 5,283 | |
| |
Other Assets and Liabilities,
Net - 0.0% | | | | 2 | |
| | | | | | | | |
| | |
| Net Assets - 100.0% | | | | | | | 5,285 | |
| | | | | | | | |
See accompanying notes which are an integral part of the financial statements.
| | |
| Russell Aggressive Growth ETF | | 11 |
Russell Exchange Traded Funds Trust
Russell Aggressive Growth ETF
Presentation of Portfolio Holdings — March 31, 2012
Amounts in thousands
| | | | | | | | | | | | | | | | | | | | |
| | | Market Value | | | % of Net
Assets | |
| Portfolio Summary | | Level 1 | | | Level 2 | | | Level 3 | | | Total | | |
| | | | | | | | | | | | | | | | | | | | |
Common Stocks | | | | | | | | | | | | | | | | | | | | |
Consumer Discretionary | | $ | 1,059 | | | $ | — | | | $ | — | | | $ | 1,059 | | | | 20 .0 | |
Consumer Staples | | | 115 | | | | — | | | | — | | | | 115 | | | | 2 .2 | |
Energy | | | 389 | | | | — | | | | — | | | | 389 | | | | 7 .4 | |
Financial Services | | | 292 | | | | — | | | | 7 | | | | 299 | | | | 5 .7 | |
Health Care | | | 652 | | | | — | | | | — | | | | 652 | | | | 12 .3 | |
Materials and Processing | | | 288 | | | | — | | | | — | | | | 288 | | | | 5 .5 | |
Producer Durables | | | 704 | | | | — | | | | — | | | | 704 | | | | 13 .3 | |
Technology | | | 1,762 | | | | — | | | | — | | | | 1,762 | | | | 33 .3 | |
Utilities | | | 7 | | | | — | | | | — | | | | 7 | | | | 0 .1 | |
Short-Term Investments | | | — | | | | 8 | | | | — | | | | 8 | | | | 0 .2 | |
| | | | | | | | | | | | | | | | | | | | |
| | | | | |
Total Investments | | | 5,268 | | | | 8 | | | | 7 | | | | 5,283 | | | | 100.0 | |
| | | | | | | | | | | | | | | | | | | | |
Other Assets and Liabilities, Net | | | | | | | | | | | | | | | | | | | — | * |
| | | | | | | | | | | | | | | | | | | | |
| | | | | | | | | | | | | | | | | | | 100.0 | |
| | | | | | | | | | | | | | | | | | | | |
| * | Less than .05% of net assets. |
For a description of the levels see note 2 in the Notes to Financial Statements.
Investments in which significant unobservable inputs (Level 3) were used in determining a value for the period ending March 31, 2012 were less than 1% of net assets.
There were no significant transfers in and out of levels 1, 2 and 3 during the period ending March 31, 2012.
See accompanying notes which are an integral part of the financial statements.
| | | | |
| | 12 | | | Russell Aggressive Growth ETF |
Russell Exchange Traded Funds Trust
Russell Aggressive Growth ETF
Statement of Assets and Liabilities — March 31, 2012
| | | | |
| Amounts in thousands | | Russell Aggressive
Growth ETF | |
| | | | |
Assets | | | | |
Investments, at identified cost | | $ | 4,758 | |
Investments, at market* | | | 5,283 | |
Receivables: | | | | |
Dividends | | | 4 | |
| | | | |
Total assets | | | 5,287 | |
| | | | |
| |
Liabilities | | | | |
Payables: | | | | |
Accrued fees to affiliates | | | 2 | |
| | | | |
Total liabilities | | | 2 | |
| | | | |
| | | | |
Net Assets | | $ | 5,285 | |
| | | | |
Net Assets Consist of: | | | | |
Undistributed (overdistributed) net investment income | | $ | 1 | |
Accumulated net realized gain (loss) | | | (382 | ) |
Unrealized appreciation (depreciation) on investments | | | 525 | |
Additional paid-in capital | | | 5,141 | |
| | | | |
Net Assets | | $ | 5,285 | |
| | | | |
Net Asset Value, offering and redemption price per share: | | | | |
Net asset value per share:(a) | | $ | 52.84 | |
Net assets | | $ | 5,284,554 | |
Shares outstanding ($.001 par value) | | | 100,002 | |
Amounts in thousands | | | | |
| | | | |
* Investments in Affiliates, Russell U.S. Cash Management Fund | | $ | 8 | |
| (a) | Net asset value per share equals net assets divided by shares outstanding. |
See accompanying notes which are an integral part of the financial statements.
| | |
| Statement of Assets and Liabilities | | 13 |
Russell Exchange Traded Funds Trust
Russell Aggressive Growth ETF
Statement of Operations — For the Period Ended March 31, 2012
| | | | |
| Amounts in thousands | | Russell Aggressive
Growth ETF* | |
| | | | |
Investment Income | | | | |
Dividends | | $ | 44 | |
| | | | |
Total investment income | | | 44 | |
| | | | |
| |
Expenses | | | | |
Management fees | | | 15 | |
Trustee and trustee related fees | | | 14 | |
| | | | |
Expenses before reductions | | | 29 | |
Expense reductions | | | (14 | ) |
| | | | |
Net expenses | | | 15 | |
| | | | |
Net investment income (loss) | | | 29 | |
| | | | |
| |
Net Realized and Unrealized Gain (Loss) | | | | |
Net realized gain (loss) on: | | | | |
Investments | | | (383 | ) |
In-kind redemptions | | | 86 | |
| | | | |
Net realized gain (loss) | | | (297 | ) |
| | | | |
Net change in unrealized appreciation (depreciation) on investments | | | 525 | |
| | | | |
Net realized and unrealized gain (loss) | | | 228 | |
| | | | |
Net Increase (Decrease) in Net Assets from Operations | | $ | 257 | |
| | | | |
| * | For the period May 18, 2011 (commencement of operations) to March 31, 2012. |
See accompanying notes which are an integral part of the financial statements.
| | | | |
| | 14 | | | Statement of Operations |
Russell Exchange Traded Funds Trust
Russell Aggressive Growth ETF
Statement of Changes in Net Assets — For the Period Ended March 31,
| | | | |
| | | Russell Aggressive
Growth ETF | |
| Amounts in thousands | | 2012* | |
| | | | |
Increase (Decrease) in Net Assets | | | | |
| |
Operations | | | | |
Net investment income (loss) | | $ | 29 | |
Net realized gain (loss) | | | (297 | ) |
Net change in unrealized appreciation (depreciation) | | | 525 | |
| | | | |
Net increase (decrease) in net assets from operations | | | 257 | |
| | | | |
| |
Distributions | | | | |
From net investment income | | | (28 | ) |
| | | | |
Net decrease in net assets from distributions | | | (28 | ) |
| | | | |
| |
Share Transactions | | | | |
Net increase (decrease) in net assets from share transactions | | | 5,056 | |
| | | | |
Total Net Increase (Decrease) in Net Assets | | | 5,285 | |
| |
Net Assets | | | | |
Beginning of period | | | — | |
| | | | |
End of period | | $ | 5,285 | |
| | | | |
Undistributed (overdistributed) net investment income included in net assets | | $ | 1 | |
| * | For the period May 18, 2011 (commencement of operations) to March 31, 2012. |
See accompanying notes which are an integral part of the financial statements.
| | |
| Statement of Changes in Net Assets | | 15 |
Russell Exchange Traded Funds Trust
Russell Aggressive Growth ETF
Financial Highlights — For the Period Ended
For a Share Outstanding Throughout Each Period.
| | | | | | | | | | | | | | | | | | | | | | | | |
| | |
$
Net Asset Value,
Beginning of
Period | | | $
Net
Investment
Income (Loss)(a) | | | $
Net Realized
and Unrealized
Gain (Loss) | | | $
Total from
Investment
Operations | | | $
Distributions
from Net
Investment Income | | | $
Total
Distributions | |
Russell Aggressive Growth ETF | | | | | | | | | | | | | | | | | | | | | |
March 31, 2012* | | | 48.91 | | | | .29 | | | | 3.92 | | | | 4.21 | | | | (.28 | ) | | | (.28 | ) |
| (a) | Average daily shares outstanding were used for this calculation. |
| (b) | Periods less than one year are not annualized. |
| (c) | The ratios for periods less than one year are annualized. |
| (d) | Portfolio turnover rate excludes securities received or delivered from in-kind creation or redemption units. |
| * | For the period May 18, 2011 (commencement of operations) to March 31, 2012. |
See accompanying notes which are an integral part of the financial statements.
| | | | | | | | | | | | | | | | | | | | | | | | | | |
$
Net Asset Value,
End of
Period | | | %
Total
Return(b) | | | $
Net Assets,
End of Period
(000) | | | %
Ratio of Expenses
to Average
Net Assets,
Gross(c) | | | %
Ratio of Expenses
to Average
Net Assets,
Net(c) | | | %
Ratio of Net
Investment Income
to Average
Net Assets(c) | | | %
Portfolio
Turnover Rate(b)(d) | |
| | | | | | | | | | | | | | | | | | | | | | | | | | |
| | 52.84 | | | | 8.68 | | | | 5,285 | | | | .72 | | | | .37 | | | | .70 | | | | 37 | |
See accompanying notes which are an integral part of the financial statements.
Russell Exchange Traded Funds Trust
Russell Consistent Growth ETF
Portfolio Management Discussion and Analysis — March 31, 2012 (Unaudited)
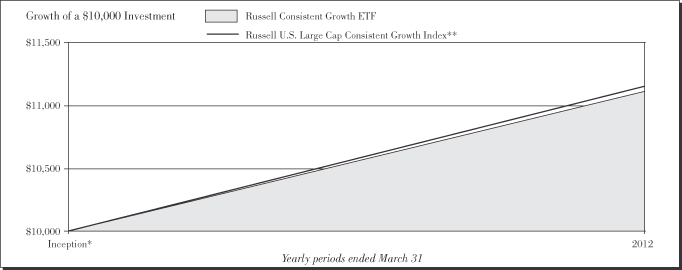
Performance as of March 31, 2012
| | | | | | | | | | | | |
|
| Average Annual Total Return | |
| | | Net Asset
Value | | | Market Value | | | Russell U.S.
Large Cap
Consistent
Growth Index** | |
Inception* | | | 10.95 | % | | | 10.93 | % | | | 11.36 | % |
| | | | |
| | 18 | | | Russell Consistent Growth ETF |
Russell Exchange Traded Funds Trust
Russell Consistent Growth ETF
Portfolio Management Discussion and Analysis — March 31, 2012 (Unaudited)
The Russell Consistent Growth ETF (the “Fund”) is an index-based exchange-traded fund that seeks investment results that closely correspond to the total return of the Russell U.S. Large Cap Consistent Growth Index (the “Index”). Russell Investment Management Company (“RIMCo”), as the Fund’s advisor, uses a “passive” or indexing approach to try to achieve the Fund’s investment objective. Unlike many investment companies, the Fund does not try to “beat” the Index it tracks and does not seek temporary defensive positions when markets decline or appear overvalued. The Fund will normally invest at least 80% of its total assets in securities that comprise the Index.
What is the Fund’s investment objective?
The Fund seeks investment results that closely correspond to the total return of the Russell U.S. Large Cap Consistent Growth Index, which is designed to select securities intended to produce performance that is similar to professional investment managers using a consistent growth investment discipline.
Is the Fund replicating or sampling?
The Fund is replicating.
How did the Fund perform relative to its benchmark for the fiscal year ended March 31, 2012?
For the fiscal year ended March 31, 2012, the Fund gained 10.95%. This is compared to the Fund’s benchmark, the Russell U.S. Large Cap Consistent Growth Index, which gained 11.36% during the same period. The Fund’s performance includes operating expenses, whereas indexes are unmanaged and index returns do not include expenses of any kind.
There were no significant changes to either the Fund or Index during the reporting period.
Did the Fund outperform or underperform the benchmark or was performance as expected based on expenses, etc.?
The Fund performed as expected against the benchmark.
Over the reporting period, please describe those sectors that outperformed or underperformed.
Sectors achieved both positive and negative returns for the Fund and the Index. Technology was the best performing sector for the Fund and the Index, while utilities was the worst performing sector. Technology, with an average weight of 29.3% was the best contributor to Fund and Index returns. Energy, with an average weight of 9.4%, was the worst contributor to Fund and Index returns.
Over the reporting period, please describe those individual securities (constituents) that outperformed or underperformed.
Apple Inc, Microsoft Corp, and International Business Machines Corp generated positive returns and contributed the most to Fund performance while Schlumberger Ltd, Oracle Corp, and Apache Corp, all declined which detracted from Fund performance.
The views expressed in this report reflect those of the portfolio managers only through the end of the period covered by the report. These views do not necessarily represent the views of RIMCo, or any other person in RIMCo or any other affiliated organization. These views are subject to change at any time based upon market conditions or other events, and RIMCo disclaims any responsibility to update the views contained herein. These views should not be relied on as investment advice and, because investment decisions for a Russell Exchange Traded Funds Trust (“RET”) Fund are based on numerous factors, should not be relied on as an indication of investment decisions of any RET Fund.
| * | | Commenced operations by issuing shares May 18, 2011. |
| ** | | The Russell U.S. Large Cap Consistent Growth Index is designed to select securities intended to produce performance that is similar to professional investment managers using a consistent growth investment discipline. This discipline focuses on companies with above average earnings expectations over a long term horizon and with consistent historical earnings growth. Starting with the Russell 1000® Index (an index comprised of U.S. stocks), the Index includes stocks that demonstrate growth potential as measured by: (1) average to high consensus forecasted earnings; (2) consistent earnings as measured by average to low earnings per share volatility over the past five years; and (3) efficient asset utilization as measured by average to high return on assets for the prior quarter. The Index excludes stocks with low anticipated growth prospects as measured by a low price-to-book ratio. |
Performance is historical and assumes reinvestment of all dividends and capital gains. Investment return and principal value will fluctuate so that an investor’s shares, when redeemed, may be worth more or less than when purchased. Past performance is not indicative of future results. The returns shown do not reflect the deduction of taxes that a shareholder would pay on Fund distributions or the redemption of Fund shares.
| | |
| Russell Consistent Growth ETF | | 19 |
Russell Exchange Traded Funds Trust
Russell Consistent Growth ETF
Shareholder Expense Example — March 31, 2012 (Unaudited)
Fund Expenses
The following disclosure provides important information regarding each Fund’s Expense Example, which appears on each Fund’s individual page in this Annual Report. Please refer to this information when reviewing the Expense Example for a Fund.
Example
As a shareholder of the Fund, you incur two types of costs: (1) transaction costs, including brokerage commissions on purchases and sales of your Fund shares and (2) ongoing costs, including management fees and other Fund expenses. The Example is intended to help you understand your ongoing costs (in dollars) of investing in the Fund and to compare these costs with the ongoing costs of investing in other funds. The Example is based on an investment of $1,000 invested at the beginning of the period and held for the entire period indicated, which for this Fund is from October 1, 2011 to March 31, 2012.
Actual Expenses
The information in the table under the heading “Actual Performance” provides information about actual account values and actual expenses. You may use the information in this column, together with the amount you invested, to estimate the expenses that you paid over the period. Simply divide your account value by $1,000 (for example, an $8,600 account value divided by $1,000 = 8.6), then multiply the result by the number in the first column in the row entitled “Expenses Paid During Period” to estimate the expenses you paid on your account during this period.
Hypothetical Example for Comparison Purposes
The information in the table under the heading “Hypothetical Performance (5% return before expenses)” provides information about hypothetical account values and hypothetical expenses based on the Fund’s actual expense ratio and an assumed rate of return of 5% per year before expenses, which is not the Fund’s actual return. The hypothetical account values and expenses may not be used to estimate the actual ending account balance or expenses you paid for the period. You may use this information to compare the ongoing costs of investing in the Fund and other funds. To do so, compare this 5% hypothetical example with the 5% hypothetical examples that appear in the shareholder reports of other funds.
Please note that the expenses shown in the table are meant to highlight your ongoing costs only and do not reflect any transactional costs, such as brokerage commissions paid on purchases and sales of Fund shares. Therefore, the information under the heading “Hypothetical Performance (5% return before expenses)” is useful in comparing ongoing costs only, and will not help you determine the relative total costs of owning different funds. In addition, if these transactional costs were included, your costs would have been higher.
| | | | | | | | |
| | | Actual
Performance | | | Hypothetical
Performance
(5% return
before expenses) | |
Beginning Account Value October 1, 2011 | | $ | 1,000.00 | | | $ | 1,000.00 | |
Ending Account Value March 31, 2012 | | $ | 1,277.50 | | | $ | 1,023.15 | |
Expenses Paid During Period* | | $ | 2.11 | | | $ | 1.87 | |
| * | Expenses are equal to the Fund’s annualized expense ratio of 0.37% (representing the six month period annualized), multiplied by the average account value over the period, multiplied by 183/366 (to reflect the one-half year period). |
| | | | |
| | 20 | | | Russell Consistent Growth ETF |
Russell Exchange Traded Funds Trust
Russell Consistent Growth ETF
Schedule of Investments — March 31, 2012
Amounts in thousands (except share amounts)
| | | | | | | | |
| | | Principal
Amount ($)
or Shares | | | Market
Value
$ | |
| | | | | | | | |
| Common Stocks - 99.9% | | | | | |
| Consumer Discretionary - 17.8% | | | | | |
Amazon.com, Inc. (Æ) | | | 1,865 | | | | 378 | |
Bed Bath & Beyond, Inc. (Æ) | | | 1,788 | | | | 118 | |
BorgWarner, Inc. (Æ) | | | 1,098 | | | | 93 | |
CarMax, Inc. (Æ) | | | 2,253 | | | | 78 | |
Chipotle Mexican Grill, Inc. Class A (Æ) | | | 253 | | | | 106 | |
Coach, Inc. | | | 1,944 | | | | 150 | |
Discovery Communications, Inc. Class A (Æ) | | | 2,120 | | | | 107 | |
Dollar Tree, Inc. (Æ) | | | 1,009 | | | | 95 | |
eBay, Inc. (Æ) | | | 6,432 | | | | 237 | |
Estee Lauder Cos., Inc. (The) Class A | | | 1,686 | | | | 104 | |
Gap, Inc. (The) | | | 3,650 | | | | 95 | |
Harley-Davidson, Inc. | | | 2,045 | | | | 100 | |
Home Depot, Inc. | | | 8,135 | | | | 409 | |
Kohl’s Corp. | | | 1,902 | | | | 95 | |
Limited Brands, Inc. | | | 2,068 | | | | 99 | |
Marriott International, Inc. Class A | | | 2,476 | | | | 94 | |
Mattel, Inc. | | | 2,939 | | | | 99 | |
McDonald’s Corp. | | | 5,068 | | | | 497 | |
McGraw-Hill Cos., Inc. (The) | | | 2,218 | | | | 108 | |
News Corp. Class A | | | 12,444 | | | | 245 | |
Nike, Inc. Class B | | | 1,999 | | | | 217 | |
Nordstrom, Inc. | | | 1,502 | | | | 84 | |
Omnicom Group, Inc. | | | 2,109 | | | | 107 | |
O’Reilly Automotive, Inc. (Æ) | | | 1,049 | | | | 96 | |
PetSmart, Inc. | | | 1,255 | | | | 72 | |
priceline.com, Inc. (Æ) | | | 306 | | | | 220 | |
Ralph Lauren Corp. Class A | | | 559 | | | | 97 | |
Ross Stores, Inc. | | | 1,850 | | | | 107 | |
Starbucks Corp. | | | 4,195 | | | | 234 | |
Starwood Hotels & Resorts Worldwide, Inc. (ö) | | | 1,663 | | | | 94 | |
Tiffany & Co. | | | 1,151 | | | | 80 | |
TJX Cos., Inc. | | | 4,650 | | | | 185 | |
VF Corp. | | | 692 | | | | 101 | |
Viacom, Inc. Class B | | | 3,309 | | | | 157 | |
Walt Disney Co. (The) | | | 9,564 | | | | 419 | |
Yum! Brands, Inc. | | | 2,737 | | | | 195 | |
| | | | | | | | |
| | | | | | | 5,772 | |
| | | | | | | | |
| |
| Consumer Staples - 5.8% | | | | | |
Church & Dwight Co., Inc. | | | 1,470 | | | | 72 | |
Colgate-Palmolive Co. | | | 2,607 | | | | 255 | |
Energizer Holdings, Inc. (Æ) | | | 807 | | | | 60 | |
General Mills, Inc. | | | 3,811 | | | | 150 | |
Green Mountain Coffee Roasters, Inc. (Æ) | | | 1,405 | | | | 66 | |
Herbalife, Ltd. | | | 1,276 | | | | 88 | |
Kraft Foods, Inc. Class A | | | 8,437 | | | | 321 | |
McCormick & Co., Inc. | | | 1,354 | | | | 74 | |
Monster Beverage Corp. (Æ) | | | 1,460 | | | | 91 | |
PepsiCo, Inc. | | | 7,716 | | | | 511 | |
Sara Lee Corp. | | | 4,649 | | | | 100 | |
Whole Foods Market, Inc. | | | 1,244 | | | | 104 | |
| | | | | | | | |
| | | | | | | 1,892 | |
| | | | | | | | |
| | | | | | | | |
| | | Principal
Amount ($)
or Shares | | | Market
Value
$ | |
| Energy - 6.8% | | | | | | | | |
Cabot Oil & Gas Corp. | | | 1,934 | | | | 60 | |
Cameron International Corp. (Æ) | | | 1,878 | | | | 99 | |
Cimarex Energy Co. | | | 1,002 | | | | 76 | |
Consol Energy, Inc. | | | 2,060 | | | | 70 | |
EQT Corp. | | | 1,301 | | | | 63 | |
FMC Technologies, Inc. (Æ) | | | 1,811 | | | | 91 | |
Halliburton Co. | | | 5,214 | | | | 173 | |
Helmerich & Payne, Inc. | | | 1,084 | | | | 58 | |
National Oilwell Varco, Inc. | | | 2,461 | | | | 196 | |
Noble Energy, Inc. | | | 1,192 | | | | 117 | |
Occidental Petroleum Corp. | | | 4,082 | | | | 389 | |
Peabody Energy Corp. | | | 2,371 | | | | 69 | |
Pioneer Natural Resources Co. | | | 947 | | | | 106 | |
Schlumberger, Ltd. | | | 6,689 | | | | 467 | |
Southwestern Energy Co. (Æ) | | | 2,759 | | | | 84 | |
Whiting Petroleum Corp. (Æ) | | | 1,347 | | | | 73 | |
| | | | | | | | |
| | | | | | | 2,191 | |
| | | | | | | | |
| |
| Financial Services - 7.0% | | | | | |
Aflac, Inc. | | | 2,983 | | | | 137 | |
Alliance Data Systems Corp. (Æ) | | | 598 | | | | 75 | |
American Express Co. | | | 5,525 | | | | 320 | |
American Tower Corp. Class A (ö) | | | 2,417 | | | | 152 | |
Aon Corp. | | | 2,301 | | | | 113 | |
Fiserv, Inc. (Æ) | | | 1,296 | | | | 90 | |
Franklin Resources, Inc. | | | 1,049 | | | | 130 | |
Marsh & McLennan Cos., Inc. | | | 3,671 | | | | 120 | |
Mastercard, Inc. Class A | | | 584 | | | | 246 | |
Public Storage (ö) | | | 915 | | | | 126 | |
Simon Property Group, Inc. (ö) | | | 1,613 | | | | 235 | |
T Rowe Price Group, Inc. | | | 1,829 | | | | 119 | |
Visa, Inc. Class A | | | 2,723 | | | | 322 | |
Western Union Co. (The) | | | 4,933 | | | | 87 | |
| | | | | | | | |
| | | | | | | 2,272 | |
| | | | | | | | |
| |
| Health Care - 9.2% | | | | | |
Alexion Pharmaceuticals, Inc. (Æ) | | | 1,360 | | | | 126 | |
Amgen, Inc. | | | 4,539 | | | | 309 | |
Baxter International, Inc. | | | 3,332 | | | | 199 | |
Becton Dickinson and Co. | | | 1,494 | | | | 116 | |
Biogen Idec, Inc. (Æ) | | | 1,432 | | | | 180 | |
Celgene Corp. (Æ) | | | 2,642 | | | | 205 | |
Cerner Corp. (Æ) | | | 1,263 | | | | 96 | |
Covidien PLC | | | 3,084 | | | | 169 | |
CR Bard, Inc. | | | 832 | | | | 82 | |
DaVita, Inc. (Æ) | | | 934 | | | | 84 | |
Edwards Lifesciences Corp. (Æ) | | | 1,056 | | | | 77 | |
Gilead Sciences, Inc. (Æ) | | | 4,466 | | | | 218 | |
Intuitive Surgical, Inc. (Æ) | | | 258 | | | | 140 | |
Laboratory Corp. of America Holdings (Æ) | | | 895 | | | | 82 | |
Medtronic, Inc. | | | 5,801 | | | | 227 | |
Perrigo Co. | | | 762 | | | | 79 | |
Quest Diagnostics, Inc. | | | 1,365 | | | | 83 | |
St. Jude Medical, Inc. | | | 2,592 | | | | 115 | |
Stryker Corp. | | | 2,177 | | | | 121 | |
Varian Medical Systems, Inc. (Æ) | | | 1,089 | | | | 75 | |
| | |
| Russell Consistent Growth ETF | | 21 |
Russell Exchange Traded Funds Trust
Russell Consistent Growth ETF
Schedule of Investments, continued — March 31, 2012
Amounts in thousands (except share amounts)
| | | | | | | | |
| | | Principal
Amount ($)
or Shares | | | Market
Value
$ | |
| | | | | | | | |
Watson Pharmaceuticals, Inc. Class B (Æ) | | | 1,202 | | | | 81 | |
Zimmer Holdings, Inc. | | | 1,518 | | | | 98 | |
| | | | | | | | |
| | | | | | | 2,962 | |
| | | | | | | | |
| |
| Materials and Processing - 5.9% | | | | | |
Air Products & Chemicals, Inc. | | | 1,400 | | | | 129 | |
Airgas, Inc. | | | 843 | | | | 75 | |
Brown-Forman Corp. Class B - ADR | | | 935 | | | | 78 | |
Celanese Corp. Class A | | | 1,555 | | | | 72 | |
CF Industries Holdings, Inc. | | | 557 | | | | 102 | |
Ecolab, Inc. | | | 2,008 | | | | 124 | |
Fastenal Co. | | | 2,190 | | | | 118 | |
FMC Corp. | | | 767 | | | | 81 | |
Monsanto Co. | | | 2,951 | | | | 235 | |
Mosaic Co. (The) | | | 2,004 | | | | 111 | |
Newmont Mining Corp. | | | 2,820 | | | | 145 | |
PPG Industries, Inc. | | | 1,168 | | | | 112 | |
Praxair, Inc. | | | 1,719 | | | | 197 | |
Precision Castparts Corp. | | | 876 | | | | 151 | |
Sherwin-Williams Co. (The) | | | 832 | | | | 90 | |
Sigma-Aldrich Corp. | | | 1,160 | | | | 85 | |
| | | | | | | | |
| | | | | | | 1,905 | |
| | | | | | | | |
| |
| Producer Durables - 15.8% | | | | | |
3M Co. | | | 3,656 | | | | 326 | |
Accenture PLC Class A | | | 3,647 | | | | 235 | |
Agilent Technologies, Inc. | | | 2,657 | | | | 118 | |
Ametek, Inc. | | | 1,619 | | | | 79 | |
Automatic Data Processing, Inc. | | | 2,950 | | | | 163 | |
Caterpillar, Inc. | | | 3,338 | | | | 355 | |
CH Robinson Worldwide, Inc. | | | 1,291 | | | | 85 | |
Cooper Industries PLC | | | 1,447 | | | | 93 | |
CSX Corp. | | | 6,765 | | | | 146 | |
Cummins, Inc. | | | 1,315 | | | | 158 | |
Danaher Corp. | | | 3,277 | | | | 184 | |
Deere & Co. | | | 2,378 | | | | 192 | |
Dover Corp. | | | 1,497 | | | | 94 | |
Eaton Corp. | | | 2,410 | | | | 120 | |
Expeditors International of Washington, Inc. | | | 1,872 | | | | 87 | |
Flowserve Corp. | | | 636 | | | | 73 | |
General Dynamics Corp. | | | 2,067 | | | | 152 | |
Goodrich Corp. | | | 870 | | | | 109 | |
Honeywell International, Inc. | | | 4,235 | | | | 259 | |
Illinois Tool Works, Inc. | | | 2,821 | | | | 161 | |
Joy Global, Inc. | | | 981 | | | | 72 | |
Kansas City Southern (Æ) | | | 1,048 | | | | 75 | |
Norfolk Southern Corp. | | | 2,110 | | | | 139 | |
Pall Corp. | | | 1,182 | | | | 70 | |
Rockwell Automation, Inc. | | | 1,162 | | | | 93 | |
Rockwell Collins, Inc. | | | 1,383 | | | | 80 | |
Roper Industries, Inc. | | | 865 | | | | 86 | |
Stericycle, Inc. (Æ) | | | 877 | | | | 73 | |
Trimble Navigation, Ltd. (Æ) | | | 1,432 | | | | 78 | |
Union Pacific Corp. | | | 2,562 | | | | 275 | |
United Parcel Service, Inc. Class B | | | 3,819 | | | | 308 | |
United Technologies Corp. | | | 4,661 | | | | 386 | |
| | | | | | | | |
| | | Principal
Amount ($)
or Shares | | | Market
Value
$ | |
Waters Corp. (Æ) | | | 928 | | | | 86 | |
WW Grainger, Inc. | | | 460 | | | | 99 | |
| | | | | | | | |
| | | | | | | 5,109 | |
| | | | | | | | |
| | |
| Technology - 31.6% | | | | | | | | |
Adobe Systems, Inc. (Æ) | | | 3,617 | | | | 124 | |
Akamai Technologies, Inc. (Æ) | | | 2,024 | | | | 74 | |
Altera Corp. | | | 2,478 | | | | 99 | |
Amphenol Corp. Class A | | | 1,587 | | | | 95 | |
Analog Devices, Inc. | | | 2,414 | | | | 98 | |
Apple, Inc. (Æ) | | | 4,264 | | | | 2,557 | |
Applied Materials, Inc. | | | 9,489 | | | | 118 | |
Autodesk, Inc. (Æ) | | | 2,293 | | | | 97 | |
BMC Software, Inc. (Æ) | | | 1,962 | | | | 79 | |
Broadcom Corp. Class A (Æ) | | | 3,709 | | | | 146 | |
CA, Inc. | | | 3,594 | | | | 99 | |
Cisco Systems, Inc. | | | 26,958 | | | | 570 | |
Citrix Systems, Inc. (Æ) | | | 1,474 | | | | 116 | |
Cognizant Technology Solutions Corp. Class A (Æ) | | | 1,956 | | | | 151 | |
EMC Corp. (Æ) | | | 11,007 | | | | 329 | |
F5 Networks, Inc. (Æ) | | | 720 | | | | 97 | |
Google, Inc. Class A (Æ) | | | 1,195 | | | | 766 | |
International Business Machines Corp. | | | 5,671 | | | | 1,184 | |
KLA-Tencor Corp. | | | 1,537 | | | | 84 | |
Linear Technology Corp. | | | 2,297 | | | | 77 | |
Marvell Technology Group, Ltd. (Æ) | | | 5,044 | | | | 79 | |
Maxim Integrated Products, Inc. | | | 2,795 | | | | 80 | |
Microsoft Corp. | | | 34,948 | | | | 1,127 | |
NetApp, Inc. (Æ) | | | 2,706 | | | | 121 | |
NVIDIA Corp. (Æ) | | | 5,456 | | | | 84 | |
Oracle Corp. | | | 18,837 | | | | 549 | |
QUALCOMM, Inc. | | | 8,240 | | | | 560 | |
Red Hat, Inc. (Æ) | | | 1,793 | | | | 107 | |
Salesforce.com, Inc. (Æ) | | | 978 | | | | 151 | |
Teradata Corp. (Æ) | | | 1,547 | | | | 105 | |
VMware, Inc. Class A (Æ) | | | 846 | | | | 95 | |
Xilinx, Inc. | | | 2,386 | | | | 87 | |
Yahoo!, Inc. (Æ) | | | 8,219 | | | | 125 | |
| | | | | | | | |
| | | | | | | 10,230 | |
| | | | | | | | |
| | |
Total Common Stocks
(cost $28,110) | | | | | | | 32,333 | |
| | | | | | | | |
| | |
| Short-Term Investments - 0.1% | | | | | | | | |
Russell U.S. Cash Management Fund | | | 21,783 | (¥) | | | 22 | |
| | | | | | | | |
| | |
Total Short-Term Investments
(cost $22) | | | | | | | 22 | |
| | | | | | | | |
| |
Total Investments - 100.0%
(identified cost $28,132) | | | | 32,355 | |
| | |
Other Assets and Liabilities,
Net - 0.0% | | | | | | | 12 | |
| | | | | | | | |
| | |
| Net Assets - 100.0% | | | | | | | 32,367 | |
| | | | | | | | |
See accompanying notes which are an integral part of the financial statements.
| | | | |
| | 22 | | | Russell Consistent Growth ETF |
Russell Exchange Traded Funds Trust
Russell Consistent Growth ETF
Presentation of Portfolio Holdings — March 31, 2012
Amounts in thousands
| | | | | | | | | | | | | | | | | | | | |
| | | Market Value | | | % of Net
Assets | |
| Portfolio Summary | | Level 1 | | | Level 2 | | | Level 3 | | | Total | | |
| | | | | | | | | | | | | | | | | | | | |
Common Stocks | | | | | | | | | | | | | | | | | | | | |
Consumer Discretionary | | $ | 5,772 | | | $ | — | | | $ | — | | | $ | 5,772 | | | | 17.8 | |
Consumer Staples | | | 1,892 | | | | — | | | | — | | | | 1,892 | | | | 5.8 | |
Energy | | | 2,191 | | | | — | | | | — | | | | 2,191 | | | | 6.8 | |
Financial Services | | | 2,272 | | | | — | | | | — | | | | 2,272 | | | | 7.0 | �� |
Health Care | | | 2,962 | | | | — | | | | — | | | | 2,962 | | | | 9.2 | |
Materials and Processing | | | 1,905 | | | | — | | | | — | | | | 1,905 | | | | 5.9 | |
Producer Durables | | | 5,109 | | | | — | | | | — | | | | 5,109 | | | | 15.8 | |
Technology | | | 10,230 | | | | — | | | | — | | | | 10,230 | | | | 31.6 | |
Short-Term Investments | | | — | | | | 22 | | | | — | | | | 22 | | | | 0.1 | |
| | | | | | | | | | | | | | | | | | | | |
| | | | | |
Total Investments | | | 32,333 | | | | 22 | | | | — | | | | 32,355 | | | | 100.0 | |
| | | | | | | | | | | | | | | | | | | | |
Other Assets and Liabilities, Net | | | | | | | | | | | | | | | | | | | — | * |
| | | | | | | | | | | | | | | | | | | | |
| | | | | |
| | | | | | | | | | | | | | | | | | | 100.0 | |
| | | | | | | | | | | | | | | | | | | | |
| * | Less than .05% of net assets. |
For a description of the levels see note 2 in the Notes to Financial Statements.
There were no significant transfers in and out of levels 1, 2 and 3 during the period ending March 31, 2012.
See accompanying notes which are an integral part of the financial statements.
| | |
| Russell Consistent Growth ETF | | 23 |
Russell Exchange Traded Funds Trust
Russell Consistent Growth ETF
Statement of Assets and Liabilities — March 31, 2012
| | | | |
| Amounts in thousands | | Russell Consistent
Growth ETF | |
| | | | |
Assets | | | | |
Investments, at identified cost | | $ | 28,132 | |
Investments, at market* | | | 32,355 | |
Receivables: | | | | |
Dividends | | | 22 | |
| | | | |
Total assets | | | 32,377 | |
| | | | |
| |
Liabilities | | | | |
Payables: | | | | |
Accrued fees to affiliates | | | 10 | |
| | | | |
Total liabilities | | | 10 | |
| | | | |
| | | | |
Net Assets | | $ | 32,367 | |
| | | | |
Net Assets Consist of: | | | | |
Undistributed (overdistributed) net investment income | | $ | 12 | |
Accumulated net realized gain (loss) | | | (447 | ) |
Unrealized appreciation (depreciation) on investments | | | 4,223 | |
Shares of beneficial interest | | | 1 | |
Additional paid-in capital | | | 28,578 | |
| | | | |
Net Assets | | $ | 32,367 | |
| | | | |
Net Asset Value, offering and redemption price per share: | | | | |
Net asset value per share: (a) | | $ | 53.95 | |
Net assets | | $ | 32,367,334 | |
Shares outstanding ($.001 par value) | | | 600,002 | |
Amounts in thousands | | | | |
| | | | |
* Investments in Affiliates, Russell U.S. Cash Management Fund | | $ | 22 | |
| (a) | Net asset value per share equals net assets divided by shares outstanding. |
See accompanying notes which are an integral part of the financial statements.
| | | | |
| | 24 | | | Statement of Assets and Liabilities |
Russell Exchange Traded Funds Trust
Russell Consistent Growth ETF
Statement of Operations — For the Period Ended March 31, 2012
| | | | |
| Amounts in thousands | | Russell Consistent
Growth ETF* | |
| | | | |
Investment Income | | | | |
Dividends | | $ | 207 | |
| | | | |
Total investment income | | | 207 | |
| | | | |
| |
Expenses | | | | |
Management fees | | | 51 | |
Trustee and trustee related fees | | | 42 | |
| | | | |
Expenses before reductions | | | 93 | |
Expense reductions | | | (42 | ) |
| | | | |
Net expenses | | | 51 | |
| | | | |
Net investment income (loss) | | | 156 | |
| | | | |
| |
Net Realized and Unrealized Gain (Loss) | | | | |
Net realized gain (loss) on: | | | | |
Investments | | | (449 | ) |
In-kind redemptions | | | 82 | |
| | | | |
Net realized gain (loss) | | | (367 | ) |
Net change in unrealized appreciation (depreciation) on investments | | | 4,223 | |
| | | | |
Net realized and unrealized gain (loss) | | | 3,856 | |
| | | | |
Net Increase (Decrease) in Net Assets from Operations | | $ | 4,012 | |
| | | | |
| * | For the period May 18, 2011 (commencement of operations) to March 31, 2012. |
See accompanying notes which are an integral part of the financial statements.
| | |
| Statement of Operations | | 25 |
Russell Exchange Traded Funds Trust
Russell Consistent Growth ETF
Statement of Changes in Net Assets — For the Period Ended March 31,
| | | | |
| | | Russell Consistent
Growth ETF | |
| Amounts in thousands | | 2012* | |
| | | | |
Increase (Decrease) in Net Assets | | | | |
| |
Operations | | | | |
Net investment income (loss) | | $ | 156 | |
Net realized gain (loss) | | | (367 | ) |
Net change in unrealized appreciation (depreciation) | | | 4,223 | |
| | | | |
Net increase (decrease) in net assets from operations | | | 4,012 | |
| | | | |
| |
Distributions | | | | |
From net investment income | | | (144 | ) |
| | | | |
Net decrease in net assets from distributions | | | (144 | ) |
| | | | |
| |
Share Transactions | | | | |
Net increase (decrease) in net assets from share transactions | | | 28,499 | |
| | | | |
Total Net Increase (Decrease) in Net Assets | | | 32,367 | |
| |
Net Assets | | | | |
Beginning of period | | | — | |
| | | | |
End of period | | $ | 32,367 | |
| | | | |
Undistributed (overdistributed) net investment income included in net assets | | $ | 12 | |
| * | For the period May 18, 2011 (commencement of operations) to March 31, 2012. |
See accompanying notes which are an integral part of the financial statements.
| | | | |
| | 26 | | | Statement of Changes in Net Assets |
(This page intentionally left blank)
Russell Exchange Traded Funds Trust
Russell Consistent Growth ETF
Financial Highlights — For the Period Ended
For a Share Outstanding Throughout Each Period.
| | | | | | | | | | | | | | | | | | | | | | | | |
| | | $ Net Asset Value,
Beginning of
Period | | | $ Net
Investment
Income (Loss)(a) | | | $ Net Realized
and Unrealized
Gain (Loss) | | | $ Total from
Investment
Operations | | |
$ Distributions from Net
Investment Income | | | $ Total
Distributions | |
Russell Consistent Growth ETF | | | | | | | | | | | | | |
March 31, 2012* | | | 49.02 | | | | .48 | | | | 4.84 | | | | 5.32 | | | | (.39 | ) | | | (.39 | ) |
| (a) | Average daily shares outstanding were used for this calculation. |
| (b) | Periods less than one year are not annualized. |
| (c) | The ratios for periods less than one year are annualized. |
| (d) | Portfolio turnover rate excludes securities received or delivered from in-kind creation or redemption units. |
| * | For the period May 18, 2011 (commencement of operations) to March 31, 2012. |
See accompanying notes which are an integral part of the financial statements.
| | | | | | | | | | | | | | | | | | | | | | | | | | |
$ Net Asset Value, End of
Period | | | % Total
Return(b) | | | $ Net Assets,
End of Period
(000) | | | % Ratio of Expenses
to Average
Net Assets,
Gross(c) | | | % Ratio of Expenses
to Average
Net Assets,
Net(c) | | | % Ratio of Net
Investment Income
to Average
Net Assets(c) | | | %
Portfolio
Turnover Rate(b)(d) | |
| | | | | | | | | | | | | | | | | | | | | | | | | | |
| | 53.95 | | | | 10.95 | | | | 32,367 | | | | .68 | | | | .37 | | | | 1.14 | | | | 22 | |
See accompanying notes which are an integral part of the financial statements.
Russell Exchange Traded Funds Trust
Russell Growth at a Reasonable Price ETF
Portfolio Management Discussion and Analysis — March 31, 2012 (Unaudited)
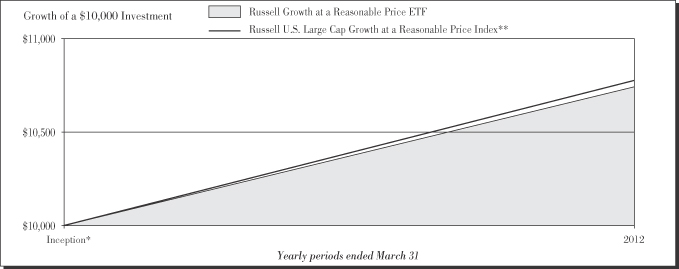
Performance as of March 31, 2012
| | | | | | | | | | | | |
|
| Average Annual Total Return | |
| | | Net Asset
Value | | | Market Value | | | Russell U.S.
Large Cap
Growth at a
Reasonable
Price Index** | |
Inception* | | | 7.38 | % | | | 7.39 | % | | | 7.72 | % |
| | | | |
| | 30 | | | Russell Growth at a Reasonable Price ETF |
Russell Exchange Traded Funds Trust
Russell Growth at a Reasonable Price ETF
Portfolio Management Discussion and Analysis — March 31, 2012 (Unaudited)
The Russell Growth at a Reasonable Price ETF (the “Fund”) is an index-based exchange-traded fund that seeks investment results that closely correspond to the total return of the Russell U.S. Large Cap Growth at a Reasonable Price Index (the “Index”). Russell Investment Management Company (“RIMCo”), as the Fund’s advisor, uses a “passive” or indexing approach to try to achieve the Fund’s investment objective. Unlike many investment companies, the Fund does not try to “beat” the Index it tracks and does not seek temporary defensive positions when markets decline or appear overvalued. The Fund will normally invest at least 80% of its total assets in securities that comprise the Index.
What is the Fund’s investment objective?
The Fund seeks investment results that closely correspond to the total return of the Russell U.S. Large Cap Growth at a Reasonable Price Index, which is designed to select securities intended to produce performance that is similar to professional investment managers using a growth at a reasonable price investment discipline.
Is the Fund replicating or sampling?
The Fund is replicating.
How did the Fund perform relative to its benchmark for the fiscal year ended March 31, 2012?
For the fiscal year ended March 31, 2012, the Fund gained 7.38%. This is compared to the Fund’s benchmark, the Russell U.S. Large Cap Growth at a Reasonable Price Index, which gained 7.72% during the same period. The Fund’s performance includes operating expenses, whereas indexes are unmanaged and index returns do not include expenses of any kind.
There were no significant changes to either the Fund or Index during the reporting period.
Did the Fund outperform or underperform the benchmark or was performance as expected based on expenses, etc.?
The Fund performed as expected against the benchmark.
Over the reporting period, please describe those sectors that outperformed or underperformed.
Sectors achieved both positive and negative returns for the Fund and the Index. Consumer discretionary was the best performing sector for the Fund and the Index, while energy was the worst performing sector. Consumer discretionary, with an average weight of 14.3% was the best contributor to Fund and Index returns. Energy, with an average weight of 13.7%, was the worst contributor to Fund and Index returns.
Over the reporting period, please describe those individual securities (constituents) that outperformed or underperformed.
Microsoft Corp, International Business Machines Corp, and Exxon Mobil Corp generated positive returns and contributed the most to Fund performance while Hewlett-Packard Co, Schlumberger Ltd, and Oracle Corp, all declined which detracted from Fund performance.
The views expressed in this report reflect those of the portfolio managers only through the end of the period covered by the report. These views do not necessarily represent the views of RIMCo, or any other person in RIMCo or any other affiliated organization. These views are subject to change at any time based upon market conditions or other events, and RIMCo disclaims any responsibility to update the views contained herein. These views should not be relied on as investment advice and, because investment decisions for a Russell Exchange Traded Funds Trust (“RET”) Fund are based on numerous factors, should not be relied on as an indication of investment decisions of any RET Fund.
| * | | Commenced operations by issuing shares May 18, 2011. |
| ** | | The Russell U.S. Large Cap Growth at a Reasonable Price Index is designed to select securities intended to produce performance that is similar to professional investment managers using a growth at a reasonable price investment discipline. This discipline focuses on stable companies that are moderately priced based on their long term forecasted earnings growth relative to their price-to-earnings ratio. Starting with the Russell 1000® Index (an index comprised of U.S. stocks), the Index includes stocks: (1) with consistent earnings as measured by average to low earnings per share volatility over the past five years; (2) that are profitable as demonstrated by an average to high return on equity over the past five years; and (3) are of high quality as measured by an S&P Quality Rank of B or above or a low debt to equity ratio. The Index excludes stocks having a high price based on a high current P/E ratio and on price to consensus one year forecasted earnings ratio divided by its consensus five year forecasted earnings growth rate. |
Performance is historical and assumes reinvestment of all dividends and capital gains. Investment return and principal value will fluctuate so that an investor’s shares, when redeemed, may be worth more or less than when purchased. Past performance is not indicative of future results. The returns shown do not reflect the deduction of taxes that a shareholder would pay on Fund distributions or the redemption of Fund shares.
| | |
| Russell Growth at a Reasonable Price ETF | | 31 |
Russell Exchange Traded Funds Trust
Russell Growth at a Reasonable Price ETF
Shareholder Expense Example — March 31, 2012 (Unaudited)
Fund Expenses
The following disclosure provides important information regarding each Fund’s Expense Example, which appears on each Fund’s individual page in this Annual Report. Please refer to this information when reviewing the Expense Example for a Fund.
Example
As a shareholder of the Fund, you incur two types of costs: (1) transaction costs, including brokerage commissions on purchases and sales of your Fund shares and (2) ongoing costs, including management fees and other Fund expenses. The Example is intended to help you understand your ongoing costs (in dollars) of investing in the Fund and to compare these costs with the ongoing costs of investing in other funds. The Example is based on an investment of $1,000 invested at the beginning of the period and held for the entire period indicated, which for this Fund is from October 1, 2011 to March 31, 2012.
Actual Expenses
The information in the table under the heading “Actual Performance” provides information about actual account values and actual expenses. You may use the information in this column, together with the amount you invested, to estimate the expenses that you paid over the period. Simply divide your account value by $1,000 (for example, an $8,600 account value divided by $1,000 = 8.6), then multiply the result by the number in the first column in the row entitled “Expenses Paid During Period” to estimate the expenses you paid on your account during this period.
Hypothetical Example for Comparison Purposes
The information in the table under the heading “Hypothetical Performance (5% return before expenses)” provides information about hypothetical account values and hypothetical expenses based on the Fund’s actual expense ratio and an assumed rate of return of 5% per year before expenses, which is not the Fund’s actual return. The hypothetical account values and expenses may not be used to estimate the actual ending account balance or expenses you paid for the period. You may use this information to compare the ongoing costs of investing in the Fund and other funds. To do so, compare this 5% hypothetical example with the 5% hypothetical examples that appear in the shareholder reports of other funds.
Please note that the expenses shown in the table are meant to highlight your ongoing costs only and do not reflect any transactional costs, such as brokerage commissions paid on purchases and sales of Fund shares. Therefore, the information under the heading “Hypothetical Performance (5% return before expenses)” is useful in comparing ongoing costs only, and will not help you determine the relative total costs of owning different funds. In addition, if these transactional costs were included, your costs would have been higher.
| | | | | | | | |
| | | Actual
Performance | | | Hypothetical
Performance
(5% return
before expenses) | |
| | | | | | | | |
Beginning Account Value October 1, 2011 | | $ | 1,000.00 | | | $ | 1,000.00 | |
Ending Account Value March 31, 2012 | | $ | 1,250.20 | | | $ | 1,023.15 | |
Expenses Paid During Period* | | $ | 2.08 | | | $ | 1.87 | |
| * | Expenses are equal to the Fund’s annualized expense ratio of 0.37% (representing the six month period annualized), multiplied by the average account value over the period, multiplied by 183/366 (to reflect the one-half year period). |
| | | | |
| | 32 | | | Russell Growth at a Reasonable Price ETF |
Russell Exchange Traded Funds Trust
Russell Growth at a Reasonable Price ETF
Schedule of Investments — March 31, 2012
Amounts in thousands (except share amounts)
| | | | | | | | |
| | | Principal
Amount ($)
or Shares | | | Market
Value
$ | |
| | | | | | | | |
| Common Stocks - 99.8% | | | | | | | | |
| Consumer Discretionary - 14.3% | | | | | | | | |
Advance Auto Parts, Inc. | | | 598 | | | | 53 | |
AutoZone, Inc. (Æ) | | | 160 | | | | 59 | |
Avon Products, Inc. | | | 2,759 | | | | 53 | |
Bed Bath & Beyond, Inc. (Æ) | | | 1,220 | | | | 80 | |
Brinker International, Inc. | | | 1,163 | | | | 32 | |
CarMax, Inc. (Æ) | | | 1,549 | | | | 54 | |
Coach, Inc. | | | 1,369 | | | | 106 | |
Darden Restaurants, Inc. | | | 960 | | | | 49 | |
DeVry, Inc. | | | 845 | | | | 29 | |
Dollar Tree, Inc. (Æ) | | | 702 | | | | 66 | |
Family Dollar Stores, Inc. | | | 850 | | | | 54 | |
Fossil, Inc. (Æ) | | | 490 | | | | 65 | |
Gap, Inc. (The) | | | 2,490 | | | | 65 | |
Gentex Corp. | | | 1,308 | | | | 32 | |
Genuine Parts Co. | | | 915 | | | | 57 | |
Hasbro, Inc. | | | 1,129 | | | | 41 | |
Home Depot, Inc. | | | 5,723 | | | | 288 | |
International Game Technology | | | 2,498 | | | | 42 | |
Kohl’s Corp. | | | 1,322 | | | | 66 | |
Lowe’s Cos., Inc. | | | 5,167 | | | | 162 | |
McDonald’s Corp. | | | 3,578 | | | | 351 | |
Nike, Inc. Class B | | | 1,417 | | | | 154 | |
Nordstrom, Inc. | | | 1,030 | | | | 57 | |
Omnicom Group, Inc. | | | 1,466 | | | | 74 | |
PetSmart, Inc. | | | 854 | | | | 49 | |
Polaris Industries, Inc. | | | 680 | | | | 49 | |
Ralph Lauren Corp. Class A | | | 380 | | | | 66 | |
Ross Stores, Inc. | | | 1,283 | | | | 75 | |
Snap-on, Inc. | | | 680 | | | | 41 | |
Stanley Black & Decker, Inc. | | | 911 | | | | 70 | |
Staples, Inc. | | | 3,983 | | | | 64 | |
Starbucks Corp. | | | 2,951 | | | | 165 | |
Target Corp. | | | 2,714 | | | | 158 | |
Tiffany & Co. | | | 775 | | | | 54 | |
TJX Cos., Inc. | | | 3,256 | | | | 129 | |
Tupperware Brands Corp. | �� | | 620 | | | | 39 | |
Urban Outfitters, Inc. (Æ) | | | 1,261 | | | | 37 | |
VF Corp. | | | 471 | | | | 69 | |
Wal-Mart Stores, Inc. | | | 6,111 | | | | 375 | |
Whirlpool Corp. | | | 750 | | | | 58 | |
Yum! Brands, Inc. | | | 1,919 | | | | 137 | |
| | | | | | | | |
| | | | | | | 3,724 | |
| | | | | | | | |
| | |
| Consumer Staples - 7.1% | | | | | | | | |
Archer-Daniels-Midland Co. | | | 3,069 | | | | 97 | |
Church & Dwight Co., Inc. | | | 975 | | | | 48 | |
Colgate-Palmolive Co. | | | 1,825 | | | | 178 | |
ConAgra Foods, Inc. | | | 2,229 | | | | 59 | |
Energizer Holdings, Inc. (Æ) | | | 535 | | | | 40 | |
General Mills, Inc. | | | 2,645 | | | | 104 | |
Herbalife, Ltd. | | | 844 | | | | 58 | |
Hormel Foods Corp. | | | 1,314 | | | | 39 | |
Kellogg Co. | | | 1,266 | | | | 68 | |
Monster Beverage Corp. (Æ) | | | 964 | | | | 60 | |
PepsiCo, Inc. | | | 5,448 | | | | 361 | |
| | | | | | | | |
| | | Principal
Amount ($)
or Shares | | | Market
Value
$ | |
Procter & Gamble Co. (The) | | | 9,328 | | | | 627 | |
Walgreen Co. | | | 3,723 | | | | 125 | |
| | | | | | | | |
| | | | | | | 1,864 | |
| | | | | | | | |
| | |
| Energy - 14.1% | | | | | | | | |
Atwood Oceanics, Inc. (Æ) | | | 789 | | | | 35 | |
Baker Hughes, Inc. | | | 1,899 | | | | 80 | |
Cameron International Corp. (Æ) | | | 1,327 | | | | 70 | |
CARBO Ceramics, Inc. | | | 255 | | | | 27 | |
Chevron Corp. | | | 6,673 | | | | 715 | |
Consol Energy, Inc. | | | 1,394 | | | | 48 | |
EQT Corp. | | | 875 | | | | 42 | |
Exxon Mobil Corp. | | | 16,082 | | | | 1,394 | |
Halliburton Co. | | | 3,705 | | | | 123 | |
Helmerich & Payne, Inc. | | | 737 | | | | 40 | |
Hubbell, Inc. Class B (Æ) | | | 569 | | | | 45 | |
Marathon Oil Corp. | | | 3,143 | | | | 100 | |
Murphy Oil Corp. | | | 1,072 | | | | 60 | |
National Oilwell Varco, Inc. | | | 1,727 | | | | 137 | |
Occidental Petroleum Corp. | | | 2,875 | | | | 274 | |
Oceaneering International, Inc. | | | 893 | | | | 48 | |
Patterson-UTI Energy, Inc. | | | 1,769 | | | | 31 | |
Peabody Energy Corp. | | | 1,603 | | | | 46 | |
QEP Resources, Inc. | | | 1,395 | | | | 43 | |
Schlumberger, Ltd. | | | 4,720 | | | | 330 | |
| | | | | | | | |
| | | | | | | 3,688 | |
| | | | | | | | |
| | |
| Financial Services - 8.1% | | | | | | | | |
ACE, Ltd. | | | 1,441 | | | | 105 | |
Aflac, Inc. | | | 2,081 | | | | 96 | |
Alliance Data Systems Corp. (Æ) | | | 412 | | | | 52 | |
Allied World Assurance Co. Holdings AG | | | 525 | | | | 36 | |
American Express Co. | | | 3,902 | | | | 226 | |
Arch Capital Group, Ltd. (Æ) | | | 1,100 | | | | 41 | |
Bank of Hawaii Corp. | | | 693 | | | | 34 | |
Brown & Brown, Inc. | | | 1,485 | | | | 35 | |
Chubb Corp. (The) | | | 1,302 | | | | 90 | |
Cullen/Frost Bankers, Inc. | | | 650 | | | | 38 | |
Eaton Vance Corp. | | | 1,383 | | | | 40 | |
Equifax, Inc. | | | 1,044 | | | | 46 | |
Factset Research Systems, Inc. | | | 420 | | | | 42 | |
Fiserv, Inc. (Æ) | | | 910 | | | | 63 | |
Franklin Resources, Inc. | | | 733 | | | | 91 | |
Global Payments, Inc. | | | 763 | | | | 36 | |
Goldman Sachs Group, Inc. (The) | | | 1,949 | | | | 241 | |
IntercontinentalExchange, Inc. (Æ) | | | 432 | | | | 59 | |
Moody’s Corp. | | | 1,381 | | | | 58 | |
Northern Trust Corp. | | | 1,339 | | | | 64 | |
SEI Investments Co. | | | 1,924 | | | | 40 | |
T Rowe Price Group, Inc. | | | 1,290 | | | | 84 | |
Torchmark Corp. | | | 917 | | | | 46 | |
Total System Services, Inc. | | | 1,874 | | | | 43 | |
Travelers Cos., Inc. (The) | | | 1,768 | | | | 105 | |
US Bancorp | | | 7,108 | | | | 225 | |
Waddell & Reed Financial, Inc. Class A | | | 1,257 | | | | 41 | |
WR Berkley Corp. | | | 1,140 | | | | 41 | |
| | | | | | | | |
| | | | | | | 2,118 | |
| | | | | | | | |
| | |
| Russell Growth at a Reasonable Price ETF | | 33 |
Russell Exchange Traded Funds Trust
Russell Growth at a Reasonable Price ETF
Schedule of Investments, continued — March 31, 2012
Amounts in thousands (except share amounts)
| | | | | | | | |
| | | Principal
Amount ($)
or Shares | | | Market
Value
$ | |
| | | | | | | | |
| Health Care - 11.3% | | | | | | | | |
Abbott Laboratories | | | 5,432 | | | | 334 | |
Aetna, Inc. | | | 1,837 | | | | 92 | |
Allscripts Healthcare Solutions, Inc. (Æ) | | | 1,884 | | | | 31 | |
AmerisourceBergen Corp. Class A | | | 1,514 | | | | 60 | |
Amgen, Inc. | | | 3,210 | | | | 219 | |
Baxter International, Inc. | | | 2,312 | | | | 138 | |
Becton Dickinson and Co. | | | 1,023 | | | | 79 | |
Cardinal Health, Inc. | | | 1,704 | | | | 73 | |
Catalyst Health Solutions, Inc. (Æ) | | | 595 | | | | 38 | |
Cigna Corp. | | | 1,489 | | | | 73 | |
Covance, Inc. (Æ) | | | 720 | | | | 34 | |
Coventry Health Care, Inc. | | | 1,265 | | | | 45 | |
CR Bard, Inc. | | | 554 | | | | 55 | |
DaVita, Inc. (Æ) | | | 655 | | | | 59 | |
Dentsply International, Inc. | | | 1,190 | | | | 48 | |
Endo Pharmaceuticals Holdings, Inc. (Æ) | | | 1,102 | | | | 43 | |
Express Scripts, Inc. Class A (Æ) | | | 2,128 | | | | 115 | |
Henry Schein, Inc. (Æ) | | | 665 | | | | 50 | |
Humana, Inc. | | | 827 | | | | 76 | |
IDEXX Laboratories, Inc. (Æ) | | | 520 | | | | 45 | |
Laboratory Corp. of America Holdings (Æ) | | | 612 | | | | 56 | |
Lincare Holdings, Inc. | | | 1,289 | | | | 33 | |
McKesson Corp. | | | 1,140 | | | | 100 | |
Mednax, Inc. (Æ) | | | 515 | | | | 38 | |
Medtronic, Inc. | | | 4,089 | | | | 161 | |
Patterson Cos., Inc. | | | 1,120 | | | | 37 | |
Perrigo Co. | | | 510 | | | | 53 | |
Quest Diagnostics, Inc. | | | 961 | | | | 59 | |
St. Jude Medical, Inc. | | | 1,758 | | | | 78 | |
Stryker Corp. | | | 1,494 | | | | 83 | |
Techne Corp. | | | 473 | | | | 33 | |
UnitedHealth Group, Inc. | | | 3,988 | | | | 236 | |
Universal Health Services, Inc. Class B | | | 945 | | | | 40 | |
Varian Medical Systems, Inc. (Æ) | | | 750 | | | | 52 | |
WellPoint, Inc. | | | 1,495 | | | | 110 | |
Zimmer Holdings, Inc. | | | 1,030 | | | | 66 | |
| | | | | | | | |
| | | | | | | 2,942 | |
| | | | | | | | |
| | |
| Materials and Processing - 4.0% | | | | | | | | |
Air Products & Chemicals, Inc. | | | 980 | | | | 90 | |
Airgas, Inc. | | | 574 | | | | 51 | |
Albemarle Corp. | | | 782 | | | | 50 | |
Ball Corp. | | | 1,274 | | | | 55 | |
Eastman Chemical Co. | | | 1,095 | | | | 57 | |
Ecolab, Inc. | | | 1,372 | | | | 85 | |
International Flavors & Fragrances, Inc. | | | 713 | | | | 42 | |
PPG Industries, Inc. | | | 820 | | | | 79 | |
Praxair, Inc. | | | 1,219 | | | | 139 | |
Precision Castparts Corp. | | | 615 | | | | 106 | |
Reliance Steel & Aluminum Co. | | | 732 | | | | 41 | |
Sealed Air Corp. | | | 2,022 | | | | 39 | |
Sherwin-Williams Co. (The) | | | 570 | | | | 62 | |
Sigma-Aldrich Corp. | | | 768 | | | | 56 | |
Sonoco Products Co. | | | 1,125 | | | | 37 | |
Southern Copper Corp. | | | 1,367 | | | | 43 | |
| | | | | | | | |
| | | | | | | 1,032 | |
| | | | | | | | |
| | | | | | | | |
| | | Principal
Amount ($)
or Shares | | | Market
Value
$ | |
| Producer Durables - 20.7% | | | | | | | | |
3M Co. | | | 2,593 | | | | 232 | |
Accenture PLC Class A | | | 2,544 | | | | 164 | |
Ametek, Inc. | | | 1,113 | | | | 54 | |
Automatic Data Processing, Inc. | | | 2,068 | | | | 114 | |
Boeing Co. (The) | | | 2,710 | | | | 203 | |
Carlisle Cos., Inc. | | | 739 | | | | 37 | |
Caterpillar, Inc. | | | 2,345 | | | | 251 | |
CH Robinson Worldwide, Inc. | | | 870 | | | | 57 | |
Cooper Industries PLC | | | 1,012 | | | | 65 | |
Copart, Inc. (Æ) | | | 1,376 | | | | 36 | |
CSX Corp. | | | 4,758 | | | | 102 | |
Cummins, Inc. | | | 910 | | | | 109 | |
Danaher Corp. | | | 2,314 | | | | 130 | |
Deere & Co. | | | 1,671 | | | | 135 | |
Donaldson Co., Inc. | | | 1,228 | | | | 44 | |
Dover Corp. | | | 1,032 | | | | 65 | |
Eaton Corp. | | | 1,672 | | | | 83 | |
Emerson Electric Co. | | | 2,933 | | | | 153 | |
Expeditors International of Washington, Inc. | | | 1,270 | | | | 59 | |
Flir Systems, Inc. | | | 1,470 | | | | 37 | |
Flowserve Corp. | | | 432 | | | | 50 | |
Fluor Corp. | | | 1,035 | | | | 62 | |
General Dynamics Corp. | | | 1,464 | | | | 107 | |
General Electric Co. | | | 35,414 | | | | 712 | |
Goodrich Corp. | | | 600 | | | | 75 | |
Graco, Inc. | | | 792 | | | | 42 | |
Honeywell International, Inc. | | | 2,987 | | | | 182 | |
Illinois Tool Works, Inc. | | | 1,979 | | | | 113 | |
Jacobs Engineering Group, Inc. (Æ) | | | 1,027 | | | | 46 | |
JB Hunt Transport Services, Inc. | | | 851 | | | | 46 | |
Joy Global, Inc. | | | 686 | | | | 50 | |
Kirby Corp. (Æ) | | | 554 | | | | 36 | |
L-3 Communications Holdings, Inc. | | | 699 | | | | 49 | |
Landstar System, Inc. | | | 653 | | | | 38 | |
Lincoln Electric Holdings, Inc. | | | 913 | | | | 41 | |
Lockheed Martin Corp. | | | 1,161 | | | | 104 | |
Mettler-Toledo International, Inc. (Æ) | | | 266 | | | | 49 | |
MSC Industrial Direct Co., Inc. Class A | | | 494 | | | | 41 | |
Norfolk Southern Corp. | | | 1,478 | | | | 97 | |
PACCAR, Inc. | | | 1,839 | | | | 86 | |
Pall Corp. | | | 812 | | | | 48 | |
Parker Hannifin Corp. | | | 815 | | | | 69 | |
Paychex, Inc. | | | 1,889 | | | | 59 | |
Raytheon Co. | | | 1,645 | | | | 87 | |
Robert Half International, Inc. | | | 1,355 | | | | 41 | |
Rockwell Collins, Inc. | | | 920 | | | | 53 | |
Roper Industries, Inc. | | | 597 | | | | 59 | |
Stericycle, Inc. (Æ) | | | 578 | | | | 48 | |
Tidewater, Inc. | | | 700 | | | | 38 | |
Towers Watson & Co. Class A | | | 580 | | | | 38 | |
Union Pacific Corp. | | | 1,810 | | | | 196 | |
United Technologies Corp. | | | 3,283 | | | | 273 | |
Wabtec Corp. | | | 514 | | | | 39 | |
Waste Management, Inc. | | | 2,244 | | | | 78 | |
Waters Corp. (Æ) | | | 619 | | | | 57 | |
| | | | |
| | 34 | | | Russell Growth at a Reasonable Price ETF |
Russell Exchange Traded Funds Trust
Russell Growth at a Reasonable Price ETF
Schedule of Investments, continued — March 31, 2012
Amounts in thousands (except share amounts)
| | | | | | | | |
| | | Principal
Amount ($)
or Shares | | | Market
Value
$ | |
| | | | | | | | |
WESCO International, Inc. (Æ) | | | 588 | | | | 38 | |
WW Grainger, Inc. | | | 317 | | | | 68 | |
| | | | | | | | |
| | | | | | | 5,445 | |
| | | | | | | | |
| | |
| Technology - 20.2% | | | | | | | | |
Adobe Systems, Inc. (Æ) | | | 2,542 | | | | 87 | |
Altera Corp. | | | 1,749 | | | | 70 | |
Amphenol Corp. Class A | | | 1,100 | | | | 66 | |
Analog Devices, Inc. | | | 1,664 | | | | 67 | |
Autodesk, Inc. (Æ) | | | 1,541 | | | | 65 | |
Cisco Systems, Inc. | | | 19,029 | | | | 402 | |
Cognizant Technology Solutions Corp. Class A (Æ) | | | 1,359 | | | | 105 | |
Dell, Inc. (Æ) | | | 6,942 | | | | 115 | |
F5 Networks, Inc. (Æ) | | | 503 | | | | 68 | |
Google, Inc. Class A (Æ) | | | 846 | | | | 542 | |
Harris Corp. | | | 1,060 | | | | 48 | |
Hewlett-Packard Co. | | | 7,348 | | | | 175 | |
Intel Corp. | | | 18,040 | | | | 507 | |
International Business Machines Corp. | | | 4,016 | | | | 837 | |
Linear Technology Corp. | | | 1,524 | | | | 51 | |
MICROS Systems, Inc. (Æ) | | | 780 | | | | 43 | |
Microsoft Corp. | | | 24,732 | | | | 798 | |
NetApp, Inc. (Æ) | | | 1,891 | | | | 85 | |
Oracle Corp. | | | 13,273 | | | | 387 | |
QUALCOMM, Inc. | | | 5,814 | | | | 395 | |
Teradata Corp. (Æ) | | | 1,035 | | | | 71 | |
Texas Instruments, Inc. | | | 4,598 | | | | 155 | |
Western Digital Corp. (Æ) | | | 1,537 | | | | 64 | |
Xilinx, Inc. | | | 1,669 | | | | 61 | |
| | | | | | | | |
| | | | | | | 5,264 | |
| | | | | | | | |
| | |
Total Common Stocks
(cost $23,369) | | | | | | | 26,077 | |
| | | | | | | | |
| | |
| Short-Term Investments - 0.1% | | | | | | | | |
Russell U.S. Cash Management Fund | | | 24,267 | (¥) | | | 24 | |
| | | | | | | | |
| | |
Total Short-Term Investments
(cost $24) | | | | | | | 24 | |
| | | | | | | | |
| | |
Total Investments - 99.9%
(identified cost $23,393) | | | | | | | 26,101 | |
| | |
Other Assets and Liabilities,
Net - 0.1% | | | | | | | 21 | |
| | | | | | | | |
| | |
| Net Assets - 100.0% | | | | | | | 26,122 | |
| | | | | | | | |
See accompanying notes which are an integral part of the financial statements.
| | |
| Russell Growth at a Reasonable Price ETF | | 35 |
Russell Exchange Traded Funds Trust
Russell Growth at a Reasonable Price ETF
Presentation of Portfolio Holdings — March 31, 2012
Amounts in thousands
| | | | | | | | | | | | | | | | | | | | |
| | | Market Value | | | % of Net
Assets | |
| Portfolio Summary | | Level 1 | | | Level 2 | | | Level 3 | | | Total | | |
| | | | | | | | | | | | | | | | | | | | |
Common Stocks | | | | | | | | | | | | | | | | | | | | |
Consumer Discretionary | | $ | 3,724 | | | $ | — | | | $ | — | | | $ | 3,724 | | | | 14.3 | |
Consumer Staples | | | 1,864 | | | | — | | | | — | | | | 1,864 | | | | 7.1 | |
Energy | | | 3,688 | | | | — | | | | — | | | | 3,688 | | | | 14.1 | |
Financial Services | | | 2,082 | | | | — | | | | 36 | | | | 2,118 | | | | 8.1 | |
Health Care | | | 2,942 | | | | — | | | | — | | | | 2,942 | | | | 11.3 | |
Materials and Processing | | | 1,032 | | | | — | | | | — | | | | 1,032 | | | | 4.0 | |
Producer Durables | | | 5,445 | | | | — | | | | — | | | | 5,445 | | | | 20.7 | |
Technology | | | 5,264 | | | | — | | | | — | | | | 5,264 | | | | 20.2 | |
Short-Term Investments | | | — | | | | 24 | | | | — | | | | 24 | | | | 0.1 | |
| | | | | | | | | | | | | | | | | | | | |
| | | | | |
Total Investments | | | 26,041 | | | | 24 | | | | 36 | | | | 26,101 | | | | 99.9 | |
| | | | | | | | | | | | | | | | | | | | |
Other Assets and Liabilities, Net | | | | | | | | | | | | | | | | | | | 0.1 | |
| | | | | | | | | | | | | | | | | | | | |
| | | | | |
| | | | | | | | | | | | | | | | | | | 100.0 | |
| | | | | | | | | | | | | | | | | | | | |
For a description of the levels see note 2 in the Notes to Financial Statements.
Investments in which significant unobservable inputs (Level 3) were used in determining a value for the period ending March 31, 2012 were less than 1% of net assets.
There were no significant transfers in and out of levels 1, 2 and 3 during the period ending March 31, 2012.
See accompanying notes which are an integral part of the financial statements.
| | | | |
| | 36 | | | Russell Growth at a Reasonable Price ETF |
Russell Exchange Traded Funds Trust
Russell Growth at a Reasonable Price ETF
Statement of Assets and Liabilities — March 31, 2012
| | | | |
| Amounts in thousands | | Russell Growth at
a Reasonable
Price ETF | |
| | | | |
Assets | | | | |
Investments, at identified cost | | $ | 23,393 | |
Investments, at market* | | | 26,101 | |
Receivables: | | | | |
Dividends | | | 29 | |
| | | | |
Total assets | | | 26,130 | |
| | | | |
| |
Liabilities | | | | |
Payables: | | | | |
Accrued fees to affiliates | | | 8 | |
| | | | |
Total liabilities | | | 8 | |
| | | | |
| | | | |
Net Assets | | $ | 26,122 | |
| | | | |
Net Assets Consist of: | | | | |
Undistributed (overdistributed) net investment income | | $ | 10 | |
Accumulated net realized gain (loss) | | | (63 | ) |
Unrealized appreciation (depreciation) on investments | | | 2,708 | |
Shares of beneficial interest | | | 1 | |
Additional paid-in capital | | | 23,466 | |
| | | | |
Net Assets | | $ | 26,122 | |
| | | | |
Net Asset Value, offering and redemption price per share: | | | | |
Net asset value per share:(a) | | $ | 52.24 | |
Net assets | | $ | 26,121,784 | |
Shares outstanding ($.001 par value) | | | 500,002 | |
Amounts in thousands | | | | |
| | | | |
* Investments in Affiliates, Russell U.S. Cash Management Fund | | $ | 24 | |
| (a) | Net asset value per share equals net assets divided by shares outstanding. |
See accompanying notes which are an integral part of the financial statements.
| | |
| Statement of Assets and Liabilities | | 37 |
Russell Exchange Traded Funds Trust
Russell Growth at a Reasonable Price ETF
Statement of Operations — For the Period Ended March 31, 2012
| | | | |
| Amounts in thousands | | Russell Growth at
a Reasonable
Price ETF* | |
| | | | |
Investment Income | | | | |
Dividends | | $ | 250 | |
| | | | |
Total investment income | | | 250 | |
| | | | |
| |
Expenses | | | | |
Management fees | | | 49 | |
Trustee and trustee related fees | | | 46 | |
| | | | |
Expenses before reductions | | | 95 | |
Expense reductions | | | (46 | ) |
| | | | |
Net expenses | | | 49 | |
| | | | |
Net investment income (loss) | | | 201 | |
| | | | |
| |
Net Realized and Unrealized Gain (Loss) | | | | |
Net realized gain (loss) on: | | | | |
Investments | | | (63 | ) |
In-kind redemptions | | | (727 | ) |
| | | | |
Net realized gain (loss) | | | (790 | ) |
| | | | |
Net change in unrealized appreciation (depreciation) on investments | | | 2,708 | |
| | | | |
Net realized and unrealized gain (loss) | | | 1,918 | |
| | | | |
Net Increase (Decrease) in Net Assets from Operations | | $ | 2,119 | |
| | | | |
| * | For the period May 18, 2011 (commencement of operations) to March 31, 2012. |
See accompanying notes which are an integral part of the financial statements.
| | | | |
| | 38 | | | Statement of Operations |
Russell Exchange Traded Funds Trust
Russell Growth at a Reasonable Price ETF
Statement of Changes in Net Assets — For the Period Ended March 31,
| | | | |
| | | Russell Growth at a
Reasonable Price
ETF | |
| Amounts in thousands | | 2012* | |
| | | | |
Increase (Decrease) in Net Assets | | | | |
| |
Operations | | | | |
Net investment income (loss) | | $ | 201 | |
Net realized gain (loss) | | | (790 | ) |
Net change in unrealized appreciation (depreciation) | | | 2,708 | |
| | | | |
Net increase (decrease) in net assets from operations | | | 2,119 | |
| | | | |
| |
Distributions | | | | |
From net investment income | | | (191 | ) |
| | | | |
Net decrease in net assets from distributions | | | (191 | ) |
| | | | |
| |
Share Transactions | | | | |
Net increase (decrease) in net assets from share transactions | | | 24,194 | |
| | | | |
| |
Total Net Increase (Decrease) in Net Assets | | | 26,122 | |
| |
Net Assets | | | | |
Beginning of period | | | — | |
| | | | |
End of period | | $ | 26,122 | |
| | | | |
Undistributed (overdistributed) net investment income included in net assets | | $ | 10 | |
| * | For the period May 18, 2011 (commencement of operations) to March 31, 2012. |
See accompanying notes which are an integral part of the financial statements.
| | |
| Statement of Changes in Net Assets | | 39 |
Russell Exchange Traded Funds Trust
Russell Growth at a Reasonable Price ETF
Financial Highlights — For the Period Ended
For a Share Outstanding Throughout Each Period.
| | | | | | | | | | | | | | | | | | | | | | | | |
| | |
$ Net Asset Value,
Beginning of
Period | | | $
Net
Investment
Income (Loss)(a) | | | $ Net Realized
and Unrealized
Gain (Loss) | | | $ Total from
Investment
Operations | | | $
Distributions
from Net
Investment Income | | | $ Total
Distributions | |
Russell Growth at a Reasonable Price ETF | | | | | | | | | | | | | |
March 31, 2012* | | | 49.34 | | | | .64 | | | | 2.91 | | | | 3.55 | | | | (.65 | ) | | | (.65 | ) |
| (a) | Average daily shares outstanding were used for this calculation. |
| (b) | Periods less than one year are not annualized. |
| (c) | The ratios for periods less than one year are annualized. |
| (d) | Portfolio turnover rate excludes securities received or delivered from in-kind creation or redemption units. |
| * | For the period May 18, 2011 (commencement of operations) to March 31, 2012. |
See accompanying notes which are an integral part of the financial statements.
| | | | | | | | | | | | | | | | | | | | | | | | | | |
$ Net Asset Value, End of
Period | | | % Total
Return(b) | | | $ Net Assets, End
of Period
(000) | | | % Ratio of Expenses
to Average
Net Assets,
Gross(c) | | | % Ratio of Expenses
to Average
Net Assets,
Net(c) | | | % Ratio of Net
Investment Income
to Average
Net Assets(c) | | | %
Portfolio
Turnover Rate(b)(d) | |
| | | | | | | | | | | | | | | | | | | | | | | | | | |
| | 52.24 | | | | 7.38 | | | | 26,122 | | | | .71 | | | | .37 | | | | 1.52 | | | | 15 | |
See accompanying notes which are an integral part of the financial statements.
Russell Exchange Traded Funds Trust
Russell Contrarian ETF
Portfolio Management Discussion and Analysis — March 31, 2012 (Unaudited)
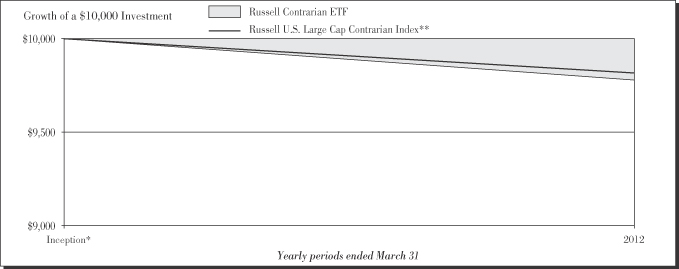
Performance as of March 31, 2012
| | | | | | | | | | | | |
|
| Average Annual Total Return | |
| | | Net Asset
Value | | | Market Value | | | Russell U.S.
Large Cap
Contrarian
Index** | |
Inception* | | | (2.20 | )% | | | (2.22 | )% | | | (1.82 | )% |
| | | | |
| | 42 | | | Russell Contrarian ETF |
Russell Exchange Traded Funds Trust
Russell Contrarian ETF
Portfolio Management Discussion and Analysis — March 31, 2012 (Unaudited)
The Russell Contrarian ETF (the “Fund”) is an index-based exchange-traded fund that seeks investment results that closely correspond to the total return of the Russell U.S. Large Cap Contrarian Index (the “Index”). Russell Investment Management Company (“RIMCo”), as the Fund’s advisor, uses a “passive” or indexing approach to try to achieve the Fund’s investment objective. Unlike many investment companies, the Fund does not try to “beat” the Index it tracks and does not seek temporary defensive positions when markets decline or appear overvalued. The Fund will normally invest at least 80% of its total assets in securities that comprise the Index.
What is the Fund’s investment objective?
The Fund seeks investment results that closely correspond to the total return of the Russell U.S. Large Cap Contrarian Index, which is designed to select securities intended to produce performance that is similar to professional investment managers following a contrarian investment discipline.
Is the Fund replicating or sampling?
The Fund is replicating.
How did the Fund perform relative to its benchmark for the fiscal year ended March 31, 2012?
For the fiscal year ended March 31, 2012, the Fund lost (2.20)%. This is compared to the Fund’s benchmark, the Russell U.S. Large Cap Contrarian Index, which lost (1.82)% during the same period. The Fund’s performance includes operating expenses, whereas indexes are unmanaged and index returns do not include expenses of any kind.
There were no significant changes to either the Fund or Index during the reporting period.
Did the Fund outperform or underperform the benchmark or was performance as expected based on expenses, etc.?
The Fund performed as expected against the benchmark.
Over the reporting period, please describe those sectors that outperformed or underperformed.
Sectors achieved both positive and negative returns for the Fund and the Index. Consumer discretionary was the best performing sector for the Fund and the Index, while energy was the worst performing sector. Consumer discretionary, with an average weight of 16.8% was the best contributor to Fund and Index returns. Energy, with an average weight of 2.1%, was the worst contributor to Fund and Index returns.
Over the reporting period, please describe those individual securities (constituents) that outperformed or underperformed.
Wells Fargo & Co, AT&T Inc, and UnitedHealth Group Inc generated positive returns and contributed the most to Fund performance while Bank of America Corp, Hewlett-Packard Co, and Baker Hughes Inc, all declined which detracted from Fund performance.
The views expressed in this report reflect those of the portfolio managers only through the end of the period covered by the report. These views do not necessarily represent the views of RIMCo, or any other person in RIMCo or any other affiliated organization. These views are subject to change at any time based upon market conditions or other events, and RIMCo disclaims any responsibility to update the views contained herein. These views should not be relied on as investment advice and, because investment decisions for a Russell Exchange Traded Funds Trust (“RET”) Fund are based on numerous factors, should not be relied on as an indication of investment decisions of any RET Fund.
| * | | Commenced operations by issuing shares May 18, 2011. |
| ** | | The Russell U.S. Large Cap Contrarian Index is designed to select securities intended to produce performance that is similar to professional investment managers following a contrarian investment discipline. This discipline focuses on companies that have consistently lagged the market and their sector peers. Starting with the Russell 1000® Index (an index comprised of U.S. stocks), the Index includes stocks where opportunities exist for the stock price to improve as measured by a low historical price to sales multiple. The Index excludes stocks that have outperformed their market and sector peers as measured by cumulative total return over the last three to five years. |
Performance is historical and assumes reinvestment of all dividends and capital gains. Investment return and principal value will fluctuate so that an investor’s shares, when redeemed, may be worth more or less than when purchased. Past performance is not indicative of future results. The returns shown do not reflect the deduction of taxes that a shareholder would pay on Fund distributions or the redemption of Fund shares.
| | |
| Russell Contrarian ETF | | 43 |
Russell Exchange Traded Funds Trust
Russell Contrarian ETF
Shareholder Expense Example — March 31, 2012 (Unaudited)
Fund Expenses
The following disclosure provides important information regarding each Fund’s Expense Example, which appears on each Fund’s individual page in this Annual Report. Please refer to this information when reviewing the Expense Example for a Fund.
Example
As a shareholder of the Fund, you incur two types of costs: (1) transaction costs, including brokerage commissions on purchases and sales of your Fund shares and (2) ongoing costs, including management fees and other Fund expenses. The Example is intended to help you understand your ongoing costs (in dollars) of investing in the Fund and to compare these costs with the ongoing costs of investing in other funds. The Example is based on an investment of $1,000 invested at the beginning of the period and held for the entire period indicated, which for this Fund is from October 1, 2011 to March 31, 2012.
Actual Expenses
The information in the table under the heading “Actual Performance” provides information about actual account values and actual expenses. You may use the information in this column, together with the amount you invested, to estimate the expenses that you paid over the period. Simply divide your account value by $1,000 (for example, an $8,600 account value divided by $1,000 = 8.6), then multiply the result by the number in the first column in the row entitled “Expenses Paid During Period” to estimate the expenses you paid on your account during this period.
Hypothetical Example for Comparison Purposes
The information in the table under the heading “Hypothetical Performance (5% return before expenses)” provides information about hypothetical account values and hypothetical expenses based on the Fund’s actual expense ratio and an assumed rate of return of 5% per year before expenses, which is not the Fund’s actual return. The hypothetical account values and expenses may not be used to estimate the actual ending account balance or expenses you paid for the period. You may use this information to compare the ongoing costs of investing in the Fund and other funds. To do so, compare this 5% hypothetical example with the 5% hypothetical examples that appear in the shareholder reports of other funds.
Please note that the expenses shown in the table are meant to highlight your ongoing costs only and do not reflect any transactional costs, such as brokerage commissions paid on purchases and sales of Fund shares. Therefore, the information under the heading “Hypothetical Performance (5% return before expenses)” is useful in comparing ongoing costs only, and will not help you determine the relative total costs of owning different funds. In addition, if these transactional costs were included, your costs would have been higher.
| | | | | | | | |
| | | Actual
Performance | | | Hypothetical
Performance
(5% return
before expenses) | |
| | | | | | | | |
Beginning Account Value October 1, 2011 | | $ | 1,000.00 | | | $ | 1,000.00 | |
Ending Account Value March 31, 2012 | | $ | 1,264.80 | | | $ | 1,023.15 | |
Expenses Paid During Period* | | $ | 2.09 | | | $ | 1.87 | |
| * | Expenses are equal to the Fund’s annualized expense ratio of 0.37% (representing the six month period), multiplied by the average account value over the period, multiplied by 183/366 (to reflect the one-half year period). |
| | | | |
| | 44 | | | Russell Contrarian ETF |
Russell Exchange Traded Funds Trust
Russell Contrarian ETF
Schedule of Investments — March 31, 2012
Amounts in thousands (except share amounts)
| | | | | | | | |
| | | Principal
Amount ($)
or Shares | | | Market
Value
$ | |
| | | | | | | | |
| Common Stocks - 99.8% | | | | | | | | |
| Consumer Discretionary - 10.5% | | | | | | | | |
Abercrombie & Fitch Co. Class A | | | 248 | | | | 12 | |
American Eagle Outfitters, Inc. | | | 724 | | | | 12 | |
Apollo Group, Inc. Class A (Æ) | | | 275 | | | | 11 | |
Avon Products, Inc. | | | 911 | | | | 18 | |
Best Buy Co., Inc. | | | 595 | | | | 14 | |
Carnival Corp. | | | 713 | | | | 23 | |
DISH Network Corp. Class A | | | 511 | | | | 17 | |
GameStop Corp. Class A | | | 464 | | | | 10 | |
Gap, Inc. (The) | | | 780 | | | | 20 | |
Goodyear Tire & Rubber Co. (The) (Æ) | | | 770 | | | | 9 | |
Hanesbrands, Inc. (Æ) | | | 396 | | | | 12 | |
Harley-Davidson, Inc. | | | 468 | | | | 23 | |
Harman International Industries, Inc. | | | 247 | | | | 12 | |
Hertz Global Holdings, Inc. (Æ) | | | 890 | | | | 13 | |
JC Penney Co., Inc. | | | 412 | | | | 15 | |
Marriott International, Inc. Class A | | | 526 | | | | 20 | |
MGM Resorts International (Æ) | | | 1,088 | | | | 15 | |
Mohawk Industries, Inc. (Æ) | | | 192 | | | | 13 | |
Newell Rubbermaid, Inc. | | | 794 | | | | 14 | |
News Corp. Class A | | | 3,096 | | | | 60 | |
Orchard Supply Hardware Stores Corp. Class A (Æ) | | | 7 | | | | — | ± |
Penn National Gaming, Inc. (Æ) | | | 263 | | | | 11 | |
Royal Caribbean Cruises, Ltd. | | | 408 | | | | 12 | |
Sears Holdings Corp. (Æ) | | | 161 | | | | 11 | |
Service Corp. International | | | 950 | | | | 11 | |
Staples, Inc. | | | 1,319 | | | | 21 | |
Starwood Hotels & Resorts Worldwide, Inc. (ö) | | | 373 | | | | 21 | |
Target Corp. | | | 946 | | | | 55 | |
Whirlpool Corp. | | | 229 | | | | 18 | |
| | | | | | | | |
| | | | | | | 503 | |
| | | | | | | | |
| | |
| Consumer Staples - 7.0% | | | | | | | | |
Archer-Daniels-Midland Co. | | | 1,030 | | | | 33 | |
Bunge, Ltd. | | | 285 | | | | 20 | |
Campbell Soup Co. | | | 420 | | | | 14 | |
Constellation Brands, Inc. Class A (Æ) | | | 567 | | | | 13 | |
Energizer Holdings, Inc. (Æ) | | | 179 | | | | 13 | |
Kroger Co. (The) | | | 1,016 | | | | 25 | |
PepsiCo, Inc. | | | 1,970 | | | | 131 | |
Safeway, Inc. | | | 762 | | | | 15 | |
Sysco Corp. | | | 932 | | | | 28 | |
Walgreen Co. | | | 1,284 | | | | 43 | |
| | | | | | | | |
| | | | | | | 335 | |
| | | | | | | | |
| | |
| Energy - 2.3% | | | | | | | | |
Arch Coal, Inc. | | | 660 | | | | 7 | |
Baker Hughes, Inc. | | | 641 | | | | 26 | |
Chesapeake Energy Corp. | | | 1,045 | | | | 24 | |
Consol Energy, Inc. | | | 430 | | | | 15 | |
Nabors Industries, Ltd. (Æ) | | | 723 | | | | 13 | |
Peabody Energy Corp. | | | 490 | | | | 14 | |
Superior Energy Services, Inc. (Æ) | | | 323 | | | | 9 | |
| | | | | | | | |
| | | | | | | 108 | |
| | | | | | | | |
| | | | | | | | |
| | | Principal
Amount ($)
or Shares | | | Market
Value
$ | |
| Financial Services - 37.7% | | | | | | | | |
Aflac, Inc. | | | 713 | | | | 33 | |
Allstate Corp. (The) | | | 877 | | | | 29 | |
American Express Co. | | | 1,384 | | | | 80 | |
American International Group, Inc. (Æ) | | | 406 | | | | 13 | |
Assurant, Inc. | | | 285 | | | | 12 | |
Axis Capital Holdings, Ltd. | | | 367 | | | | 12 | |
Bank of New York Mellon Corp. (The) | | | 1,815 | | | | 44 | |
BB&T Corp. | | | 1,121 | | | | 35 | |
Berkshire Hathaway, Inc. Class B (Æ) | | | 2,150 | | | | 174 | |
Capital One Financial Corp. | | | 696 | | | | 39 | |
Cincinnati Financial Corp. | | | 402 | | | | 14 | |
Citigroup, Inc. | | | 3,675 | | | | 134 | |
Comerica, Inc. | | | 507 | | | | 16 | |
Duke Realty Corp. (ö) | | | 430 | | | | 6 | |
E*Trade Financial Corp. (Æ) | | | 521 | | | | 6 | |
Everest Re Group, Ltd. | | | 133 | | | | 12 | |
Fifth Third Bancorp | | | 1,656 | | | | 23 | |
First Niagara Financial Group, Inc. | | | 1,130 | | | | 11 | |
Goldman Sachs Group, Inc. (The) | | | 683 | | | | 85 | |
Hartford Financial Services Group, Inc. | | | 914 | | | | 19 | |
HCC Insurance Holdings, Inc. | | | 386 | | | | 12 | |
Hudson City Bancorp, Inc. | | | 1,800 | | | | 13 | |
Huntington Bancshares, Inc. | | | 2,338 | | | | 15 | |
Jones Lang LaSalle, Inc. | | | 156 | | | | 13 | |
JPMorgan Chase & Co. | | | 4,906 | | | | 227 | |
KeyCorp | | | 2,072 | | | | 18 | |
Lazard, Ltd. Class A | | | 400 | | | | 11 | |
Legg Mason, Inc. | | | 438 | | | | 12 | |
Lincoln National Corp. | | | 707 | | | | 19 | |
Loews Corp. | | | 554 | | | | 22 | |
Markel Corp. (Æ) | | | 29 | | | | 13 | |
MetLife, Inc. | | | 1,184 | | | | 44 | |
Morgan Stanley | | | 2,296 | | | | 45 | |
NASDAQ OMX Group, Inc. (The) (Æ) | | | 404 | | | | 10 | |
NYSE Euronext | | | 555 | | | | 17 | |
Old Republic International Corp. | | | 1,150 | | | | 12 | |
PartnerRe, Ltd. - ADR | | | 182 | | | | 12 | |
PNC Financial Services Group, Inc. | | | 750 | | | | 48 | |
Principal Financial Group, Inc. | | | 666 | | | | 20 | |
Raymond James Financial, Inc. | | | 354 | | | | 13 | |
Regions Financial Corp. | | | 3,167 | | | | 21 | |
Reinsurance Group of America, Inc. Class A | | | 221 | | | | 13 | |
SLM Corp. | | | 1,148 | | | | 18 | |
State Street Corp. | | | 765 | | | | 35 | |
SunTrust Banks, Inc. | | | 1,008 | | | | 24 | |
Thomson Reuters Corp. | | | 700 | | | | 20 | |
Unum Group | | | 665 | | | | 16 | |
Wells Fargo & Co. | | | 6,065 | | | | 207 | |
Weyerhaeuser Co. (ö) | | | 1,048 | | | | 23 | |
White Mountains Insurance Group, Ltd. | | | 24 | | | | 12 | |
Zions Bancorporation | | | 643 | | | | 14 | |
| | | | | | | | |
| | | | | | | 1,796 | |
| | | | | | | | |
| | |
| Health Care - 7.1% | | | | | | | | |
Aetna, Inc. | | | 614 | | | | 31 | |
| | |
| Russell Contrarian ETF | | 45 |
Russell Exchange Traded Funds Trust
Russell Contrarian ETF
Schedule of Investments, continued — March 31, 2012
Amounts in thousands (except share amounts)
| | | | | | | | |
| | | Principal
Amount ($)
or Shares | | | Market
Value
$ | |
| | | | | | | | |
Boston Scientific Corp. (Æ) | | | 2,977 | | | | 18 | |
Covance, Inc. (Æ) | | | 219 | | | | 10 | |
Coventry Health Care, Inc. | | | 386 | | | | 14 | |
Eli Lilly & Co. | | | 1,385 | | | | 56 | |
Health Net, Inc. (Æ) | | | 328 | | | | 13 | |
Hospira, Inc. (Æ) | | | 445 | | | | 17 | |
Patterson Cos., Inc. | | | 352 | | | | 12 | |
PerkinElmer, Inc. | | | 500 | | | | 14 | |
Thermo Fisher Scientific, Inc. | | | 600 | | | | 34 | |
UnitedHealth Group, Inc. | | | 1,421 | | | | 83 | |
WellPoint, Inc. | | | 533 | | | | 39 | |
| | | | | | | | |
| | | | | | | 341 | |
| | | | | | | | |
| | |
| Materials and Processing - 4.8% | | | | | | | | |
Alcoa, Inc. | | | 1,945 | | | | 19 | |
Allegheny Technologies, Inc. | | | 263 | | | | 11 | |
Cytec Industries, Inc. | | | 206 | | | | 13 | |
Dow Chemical Co. (The) | | | 1,632 | | | | 57 | |
International Paper Co. | | | 762 | | | | 27 | |
Martin Marietta Materials, Inc. | | | 140 | | | | 12 | |
Masco Corp. | | | 1,145 | | | | 15 | |
Nucor Corp. | | | 546 | | | | 23 | |
Owens-Illinois, Inc. (Æ) | | | 550 | | | | 13 | |
Sealed Air Corp. | | | 621 | | | | 12 | |
Steel Dynamics, Inc. | | | 781 | | | | 11 | |
United States Steel Corp. | | | 207 | | | | 6 | |
Vulcan Materials Co. | | | 182 | | | | 8 | |
| | | | | | | | |
| | | | | | | 227 | |
| | | | | | | | |
| | |
| Producer Durables - 10.3% | | | | | | | | |
Corrections Corp. of America (Æ) | | | 450 | | | | 12 | |
Expeditors International of Washington, Inc. | | | 405 | | | | 19 | |
FedEx Corp. | | | 454 | | | | 43 | |
General Dynamics Corp. | | | 497 | | | | 36 | |
Illinois Tool Works, Inc. | | | 680 | | | | 40 | |
Ingersoll-Rand PLC | | | 601 | | | | 25 | |
Iron Mountain, Inc. | | | 435 | | | | 13 | |
Jacobs Engineering Group, Inc. (Æ) | | | 314 | | | | 14 | |
L-3 Communications Holdings, Inc. Class 3 | | | 228 | | | | 16 | |
Lexmark International, Inc. Class A | | | 300 | | | | 10 | |
Lockheed Martin Corp. | | | 427 | | | | 39 | |
Manpower, Inc. | | | 281 | | | | 13 | |
Northrop Grumman Corp. | | | 449 | | | | 27 | |
PACCAR, Inc. | | | 603 | | | | 28 | |
Pitney Bowes, Inc. | | | 586 | | | | 10 | |
Quanta Services, Inc. (Æ) | | | 584 | | | | 12 | |
Raytheon Co. | | | 574 | | | | 30 | |
Republic Services, Inc. Class A | | | 625 | | | | 19 | |
Rockwell Collins, Inc. | | | 309 | | | | 18 | |
RR Donnelley & Sons Co. | | | 679 | | | | 8 | |
Southwest Airlines Co. | | | 1,759 | | | | 14 | |
Thomas & Betts Corp. (Æ) | | | 196 | | | | 14 | |
URS Corp. | | | 281 | | | | 12 | |
Xerox Corp. | | | 2,501 | | | | 20 | |
| | | | | | | | |
| | | | | | | 492 | |
| | | | | | | | |
| | | | | | | | |
| | | Principal
Amount ($)
or Shares | | | Market
Value
$ | |
| Technology - 6.7% | | | | | | | | |
Advanced Micro Devices, Inc. (Æ) | | | 1,945 | | | | 16 | |
Amdocs, Ltd. (Æ) | | | 466 | | | | 15 | |
Applied Materials, Inc. | | | 2,196 | | | | 27 | |
Arrow Electronics, Inc. (Æ) | | | 320 | | | | 13 | |
Avnet, Inc. (Æ) | | | 409 | | | | 15 | |
Brocade Communications Systems, Inc. (Æ) | | | 1,846 | | | | 11 | |
Computer Sciences Corp. | | | 460 | | | | 14 | |
Dell, Inc. (Æ) | | | 2,379 | | | | 38 | |
Harris Corp. | | | 330 | | | | 15 | |
Hewlett-Packard Co. | | | 2,593 | | | | 61 | |
Ingram Micro, Inc. Class A (Æ) | | | 574 | | | | 11 | |
Micron Technology, Inc. (Æ) | | | 2,187 | | | | 18 | |
Molex, Inc. | | | 439 | | | | 12 | |
Motorola Solutions, Inc. | | | 504 | | | | 26 | |
NCR Corp. (Æ) | | | 580 | | | | 13 | |
SAIC, Inc. | | | 900 | | | | 12 | |
| | | | | | | | |
| | | | | | | 317 | |
| | | | | | | | |
| | |
| Utilities - 13.4% | | | | | | | | |
AES Corp. (The) (Æ) | | | 1,344 | | | | 18 | |
Ameren Corp. | | | 490 | | | | 16 | |
American Electric Power Co., Inc. | | | 745 | | | | 29 | |
AT&T, Inc. | | | 7,218 | | | | 224 | |
Edison International | | | 562 | | | | 24 | |
Entergy Corp. | | | 309 | | | | 21 | |
Exelon Corp. | | | 1,305 | | | | 50 | |
FirstEnergy Corp. | | | 650 | | | | 30 | |
Frontier Communications Corp. | | | 2,389 | | | | 10 | |
Great Plains Energy, Inc. | | | 490 | | | | 10 | |
Level 3 Communications, Inc. (Æ) | | | 250 | | | | 6 | |
NextEra Energy, Inc. | | | 620 | | | | 38 | |
NII Holdings, Inc. (Æ) | | | 502 | | | | 9 | |
NRG Energy, Inc. (Æ) | | | 636 | | | | 10 | |
NV Energy, Inc. | | | 717 | | | | 12 | |
Pepco Holdings, Inc. | | | 618 | | | | 12 | |
PG&E Corp. | | | 646 | | | | 28 | |
PPL Corp. | | | 911 | | | | 26 | |
Public Service Enterprise Group, Inc. | | | 808 | | | | 25 | |
Sempra Energy | | | 413 | | | | 25 | |
Sprint Nextel Corp. (Æ) | | | 3,010 | | | | 9 | |
Telephone & Data Systems, Inc. | | | 393 | | | | 9 | |
| | | | | | | | |
| | | | | | | 641 | |
| | | | | | | | |
| | |
Total Common Stocks (cost $4,638) | | | | | | | 4,760 | |
| | | | | | | | |
| | |
| Short-Term Investments - 0.1% | | | | | | | | |
Russell U.S. Cash Management Fund | | | 5,413 | (¥) | | | 5 | |
| | | | | | | | |
| | |
Total Short-Term Investments (cost $5) | | | | | | | 5 | |
| | | | | | | | |
| | | | |
| | 46 | | | Russell Contrarian ETF |
Russell Exchange Traded Funds Trust
Russell Contrarian ETF
Schedule of Investments, continued — March 31, 2012
Amounts in thousands (except share amounts)
| | | | | | |
| | | | | Market
Value
$ | |
| | | | | | |
Total Investments - 99.9% (identified cost $4,643) | | | | | 4,765 | |
| | |
Other Assets and Liabilities, Net - 0.1% | | | | | 5 | |
| | | | | | |
| | |
| Net Assets - 100.0% | | | | | 4,770 | |
| | | | | | |
See accompanying notes which are an integral part of the financial statements.
| | |
| Russell Contrarian ETF | | 47 |
Russell Exchange Traded Funds Trust
Russell Contrarian ETF
Presentation of Portfolio Holdings — March 31, 2012
Amounts in thousands
| | | | | | | | | | | | | | | | | | | | |
| | | Market Value | | | % of Net
Assets | |
| Portfolio Summary | | Level 1 | | | Level 2 | | | Level 3 | | | Total | | |
| | | | | | | | | | | | | | | | | | | | |
Common Stocks | | | | | | | | | | | | | | | | | | | | |
Consumer Discretionary | | $ | 503 | | | $ | — | | | $ | — | | | $ | 503 | | | | 10.5 | |
Consumer Staples | | | 335 | | | | — | | | | — | | | | 335 | | | | 7.0 | |
Energy | | | 108 | | | | — | | | | — | | | | 108 | | | | 2.3 | |
Financial Services | | | 1,796 | | | | — | | | | — | | | | 1,796 | | | | 37.7 | |
Health Care | | | 341 | | | | — | | | | — | | | | 341 | | | | 7.1 | |
Materials and Processing | | | 227 | | | | — | | | | — | | | | 227 | | | | 4.8 | |
Producer Durables | | | 492 | | | | — | | | | — | | | | 492 | | | | 10.3 | |
Technology | | | 317 | | | | — | | | | — | | | | 317 | | | | 6.7 | |
Utilities | | | 641 | | | | — | | | | — | | | | 641 | | | | 13.4 | |
Short-Term Investments | | | — | | | | 5 | | | | — | | | | 5 | | | | 0.1 | |
| | | | | | | | | | | | | | | | | | | | |
| | | | | |
Total Investments | | | 4,760 | | | | 5 | | | | — | | | | 4,765 | | | | 99.9 | |
| | | | | | | | | | | | | | | | | | | | |
Other Assets and Liabilities, Net | | | | | | | | | | | | | | | | | | | 0.1 | |
| | | | | | | | | | | | | | | | | | | | |
| | | | | |
| | | | | | | | | | | | | | | | | | | 100.0 | |
| | | | | | | | | | | | | | | | | | | | |
For a description of the levels see note 2 in the Notes to Financial Statements.
There were no significant transfers in and out of levels 1, 2 and 3 during the period ending March 31, 2012.
See accompanying notes which are an integral part of the financial statements.
| | | | |
| | 48 | | | Russell Contrarian ETF |
Russell Exchange Traded Funds Trust
Russell Contrarian ETF
Statement of Assets and Liabilities — March 31, 2012
| | | | |
| Amounts in thousands | | Russell
Contrarian ETF | |
| | | | |
Assets | | | | |
Investments, at identified cost | | $ | 4,643 | |
Investments, at market* | | | 4,765 | |
Receivables: | | | | |
Dividends | | | 6 | |
| | | | |
Total assets | | | 4,771 | |
| | | | |
| |
Liabilities | | | | |
Payables: | | | | |
Accrued fees to affiliates | | | 1 | |
| | | | |
Total liabilities | | | 1 | |
| | | | |
| | | | |
Net Assets | | $ | 4,770 | |
| | | | |
Net Assets Consist of: | | | | |
Undistributed (overdistributed) net investment income | | $ | 4 | |
Accumulated net realized gain (loss) | | | (405 | ) |
Unrealized appreciation (depreciation) on investments | | | 122 | |
Additional paid-in capital | | | 5,049 | |
| | | | |
Net Assets | | $ | 4,770 | |
| | | | |
Net Asset Value, offering and redemption price per share: | | | | |
Net asset value per share:(a) | | $ | 47.70 | |
Net assets | | $ | 4,769,853 | |
Shares outstanding ($.001 par value) | | | 100,002 | |
Amounts in thousands | | | | |
| | | | |
* Investments in Affiliates, Russell U.S. Cash Management Fund | | $ | 5 | |
| (a) | Net asset value per share equals net assets divided by shares outstanding. |
See accompanying notes which are an integral part of the financial statements.
| | |
| Statement of Assets and Liabilities | | 49 |
Russell Exchange Traded Funds Trust
Russell Contrarian ETF
Statement of Operations — For the Period Ended March 31, 2012
| | | | |
| Amounts in thousands | | Russell Contrarian ETF* | |
| | | | |
Investment Income | | | | |
Dividends | | $ | 83 | |
| | | | |
Total investment income | | | 83 | |
| | | | |
| |
Expenses | | | | |
Management fees | | | 14 | |
Trustee and trustee related fees | | | 14 | |
| | | | |
Expenses before reductions | | | 28 | |
Expense reductions | | | (14 | ) |
| | | | |
Net expenses | | | 14 | |
| | | | |
Net investment income (loss) | | | 69 | |
| | | | |
| |
Net Realized and Unrealized Gain (Loss) | | | | |
Net realized gain (loss) on: | | | | |
Investments | | | (406 | ) |
In-kind redemptions | | | (69 | ) |
| | | | |
Net realized gain (loss) | | | (475 | ) |
| | | | |
Net change in unrealized appreciation (depreciation) on investments | | | 122 | |
| | | | |
Net realized and unrealized gain (loss) | | | (353 | ) |
| | | | |
Net Increase (Decrease) in Net Assets from Operations | | $ | (284 | ) |
| | | | |
| * | For the period May 18, 2011 (commencement of operations) to March 31, 2012. |
See accompanying notes which are an integral part of the financial statements.
| | | | |
| | 50 | | | Statement of Operations |
Russell Exchange Traded Funds Trust
Russell Contrarian ETF
Statement of Changes in Net Assets — For the Period Ended March 31,
| | | | |
| | | Russell
Contrarian ETF | |
| Amounts in thousands | | 2012* | |
| | | | |
Increase (Decrease) in Net Assets | | | | |
| |
Operations | | | | |
Net investment income (loss) | | $ | 69 | |
Net realized gain (loss) | | | (475 | ) |
Net change in unrealized appreciation (depreciation) | | | 122 | |
| | | | |
Net increase (decrease) in net assets from operations | | | (284 | ) |
| | | | |
| |
Distributions | | | | |
From net investment income | | | (65 | ) |
| | | | |
Net decrease in net assets from distributions | | | (65 | ) |
| | | | |
| |
Share Transactions | | | | |
Net increase (decrease) in net assets from share transactions | | | 5,119 | |
| | | | |
Total Net Increase (Decrease) in Net Assets | | | 4,770 | |
| |
Net Assets | | | | |
Beginning of period | | | — | |
| | | | |
End of period | | $ | 4,770 | |
| | | | |
Undistributed (overdistributed) net investment income included in net assets | | $ | 4 | |
| * | For the period May 18, 2011 (commencement of operations) to March 31, 2012. |
See accompanying notes which are an integral part of the financial statements.
| | |
| Statement of Changes in Net Assets | | 51 |
Russell Exchange Traded Funds Trust
Russell Contrarian ETF
Financial Highlights — For the Period Ended
For a Share Outstanding Throughout Each Period.
| | | | | | | | | | | | | | | | | | | | | | | | |
| | |
$
Net Asset Value,
Beginning of
Period | | | $
Net
Investment
Income (Loss)(a) | | | $
Net Realized
and Unrealized
Gain (Loss) | | | $
Total from
Investment
Operations | | | $
Distributions
from Net
Investment Income | | | $ Total
Distributions | |
Russell Contrarian ETF | | | | | | | | | | | | | | | | | | | | | |
March 31, 2012* | | | 49.51 | | | | .69 | | | | (1.85 | ) | | | (1.16 | ) | | | (.65 | ) | | | (.65 | ) |
| (a) | Average daily shares outstanding were used for this calculation. |
| (b) | Periods less than one year are not annualized. |
| (c) | The ratios for periods less than one year are annualized. |
| (d) | Portfolio turnover rate excludes securities received or delivered from in-kind creation or redemption units. |
| * | For the period May 18, 2011 (commencement of operations) to March 31, 2012. |
See accompanying notes which are an integral part of the financial statements.
| | | | | | | | | | | | | | | | | | | | | | | | | | |
$
Net Asset Value,
End of
Period | | | % Total
Return(b) | | | $
Net Assets,
End of Period
(000) | | | %
Ratio of Expenses
to Average
Net Assets,
Gross(c) | | | %
Ratio of Expenses
to Average
Net Assets,
Net(c) | | | %
Ratio of Net
Investment Income
to Average
Net Assets(c) | | | %
Portfolio
Turnover Rate(b)(d) | |
| | | | | | | | | | | | | | | | | | | | | | | | | | |
| | 47.70 | | | | (2.20 | ) | | | 4,770 | | | | .72 | | | | .37 | | | | 1.80 | | | | 30 | |
See accompanying notes which are an integral part of the financial statements.
Russell Exchange Traded Funds Trust
Russell Equity Income ETF
Portfolio Management Discussion and Analysis — March 31, 2012 (Unaudited)
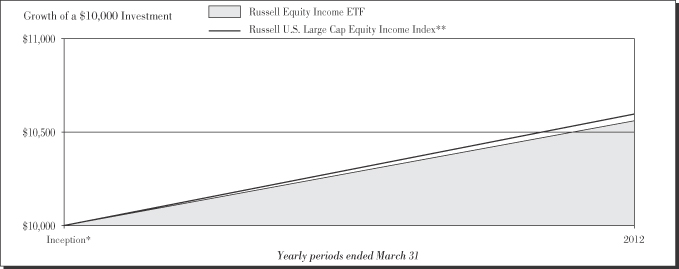
Performance as of March 31, 2012
| | | | | | | | | | | | |
|
| Average Annual Total Return | |
| | | Net Asset
Value | | | Market Value | | | Russell U.S.
Large Cap
Equity Income
Index** | |
Inception* | | | 5.57 | % | | | 5.53 | % | | | 5.93 | % |
| | | | |
| | 54 | | | Russell Equity Income ETF |
Russell Exchange Traded Funds Trust
Russell Equity Income ETF
Portfolio Management Discussion and Analysis — March 31, 2012 (Unaudited)
The Russell Equity Income ETF (the “Fund”) is an index-based exchange-traded fund that seeks investment results that closely correspond to the total return of the Russell U.S. Large Cap Equity Income Index (the “Index”). Russell Investment Management Company (“RIMCo”), as the Fund’s advisor, uses a “passive” or indexing approach to try to achieve the Fund’s investment objective. Unlike many investment companies, the Fund does not try to “beat” the Index it tracks and does not seek temporary defensive positions when markets decline or appear overvalued. The Fund will normally invest at least 80% of its total assets in securities that comprise the Index.
What is the Fund’s investment objective?
The Fund seeks investment results that closely correspond to the total return of the Russell U.S. Large Cap Equity Income Index, which is designed to select securities intended to produce performance that is similar to professional investment managers using an equity income investment discipline.
Is the Fund replicating or sampling?
The Fund is replicating.
How did the Fund perform relative to its benchmark for the fiscal year ended March 31, 2012?
For the fiscal year ended March 31, 2012, the Fund gained 5.57%. This is compared to the Fund’s benchmark, the Russell U.S. Large Cap Equity Income Index, which gained 5.93% during the same period. The Fund’s performance includes operating expenses, whereas indexes are unmanaged and index returns do not include expenses of any kind.
There were no significant changes to either the Fund or Index during the reporting period.
Did the Fund outperform or underperform the benchmark or was performance as expected based on expenses, etc.?
The Fund performed as expected against the benchmark.
Over the reporting period, please describe those sectors that outperformed or underperformed.
Sectors achieved both positive and negative returns for the Fund and the Index. Consumer discretionary was the best performing sector for the Fund and the Index, while producer durables was the worst performing sector. Consumer discretionary, with an average weight of 10.2% was the best contributor to Fund and Index returns. Producer durables, with an average weight of 13.7%, was the worst contributor to Fund and Index returns.
Over the reporting period, please describe those individual securities (constituents) that outperformed or underperformed.
Microsoft Corp, Exxon Mobil Corp, and Intel Corp generated positive returns and contributed the most to Fund performance while Hewlett-Packard Co, Oracle Corp, and Goldman Sachs Group Inc, all declined which detracted from Fund performance.
The views expressed in this report reflect those of the portfolio managers only through the end of the period covered by the report. These views do not necessarily represent the views of RIMCo, or any other person in RIMCo or any other affiliated organization. These views are subject to change at any time based upon market conditions or other events, and RIMCo disclaims any responsibility to update the views contained herein. These views should not be relied on as investment advice and, because investment decisions for a Russell Exchange Traded Funds Trust (“RET”) Fund are based on numerous factors, should not be relied on as an indication of investment decisions of any RET Fund.
| * | | Commenced operations by issuing shares May 18, 2011. |
| ** | | The Russell U.S. Large Cap Equity Income Index is designed to select securities intended to produce performance that is similar to professional investment managers using an equity income investment discipline. This discipline focuses on companies that demonstrate the ability to pay a stable dividend. Starting with the Russell 1000® Index (an index comprised of U.S. stocks), the Index includes stocks that are expected to pay a dividend based on consensus one year dividend forecasts or have paid a dividend in the past year. The Index excludes stocks with high variability in earnings as measured by high earnings per share volatility over the past five years, low profitability as demonstrated by a low return on equity over the past five years or forecasted negative earnings over the next year. |
Performance is historical and assumes reinvestment of all dividends and capital gains. Investment return and principal value will fluctuate so that an investor’s shares, when redeemed, may be worth more or less than when purchased. Past performance is not indicative of future results. The returns shown do not reflect the deduction of taxes that a shareholder would pay on Fund distributions or the redemption of Fund shares.
| | |
| Russell Equity Income ETF | | 55 |
Russell Exchange Traded Funds Trust
Russell Equity Income ETF
Shareholder Expense Example — March 31, 2012 (Unaudited)
Fund Expenses
The following disclosure provides important information regarding each Fund’s Expense Example, which appears on each Fund’s individual page in this Annual Report. Please refer to this information when reviewing the Expense Example for a Fund.
Example
As a shareholder of the Fund, you incur two types of costs: (1) transaction costs, including brokerage commissions on purchases and sales of your Fund shares and (2) ongoing costs, including management fees and other Fund expenses. The Example is intended to help you understand your ongoing costs (in dollars) of investing in the Fund and to compare these costs with the ongoing costs of investing in other funds. The Example is based on an investment of $1,000 invested at the beginning of the period and held for the entire period indicated, which for this Fund is from October 1, 2011 to March 31, 2012.
Actual Expenses
The information in the table under the heading “Actual Performance” provides information about actual account values and actual expenses. You may use the information in this column, together with the amount you invested, to estimate the expenses that you paid over the period. Simply divide your account value by $1,000 (for example, an $8,600 account value divided by $1,000 = 8.6), then multiply the result by the number in the first column in the row entitled “Expenses Paid During Period” to estimate the expenses you paid on your account during this period.
Hypothetical Example for Comparison Purposes
The information in the table under the heading “Hypothetical Performance (5% return before expenses)” provides information about hypothetical account values and hypothetical expenses based on the Fund’s actual expense ratio and an assumed rate of return of 5% per year before expenses, which is not the Fund’s actual return. The hypothetical account values and expenses may not be used to estimate the actual ending account balance or expenses you paid for the period. You may use this information to compare the ongoing costs of investing in the Fund and other funds. To do so, compare this 5% hypothetical example with the 5% hypothetical examples that appear in the shareholder reports of other funds.
Please note that the expenses shown in the table are meant to highlight your ongoing costs only and do not reflect any transactional costs, such as brokerage commissions paid on purchases and sales of Fund shares. Therefore, the information under the heading “Hypothetical Performance (5% return before expenses)” is useful in comparing ongoing costs only, and will not help you determine the relative total costs of owning different funds. In addition, if these transactional costs were included, your costs would have been higher.
| | | | | | | | |
| | | Actual
Performance | | | Hypothetical
Performance
(5% return
before expenses) | |
| | | | | | | | |
Beginning Account Value October 1, 2011 | | $ | 1,000.00 | | | $ | 1,000.00 | |
Ending Account Value March 31, 2012 | | $ | 1,247.60 | | | $ | 1,023.15 | |
Expenses Paid During Period* | | $ | 2.08 | | | $ | 1.87 | |
| * | Expenses are equal to the Fund’s annualized expense ratio of 0.37% (representing the six month period annualized), multiplied by the average account value over the period, multiplied by 183/366 (to reflect the one-half year period). |
| | | | |
| | 56 | | | Russell Equity Income ETF |
Russell Exchange Traded Funds Trust
Russell Equity Income ETF
Schedule of Investments — March 31, 2012
Amounts in thousands (except share amounts)
| | | | | | | | |
| | | Principal
Amount ($)
or Shares | | | Market
Value
$ | |
| | | | | | | | |
| Common Stocks - 99.7% | | | | | | | | |
| Consumer Discretionary - 10.9% | | | | | | | | |
American Eagle Outfitters, Inc. | | | 5,057 | | | | 87 | |
Autoliv, Inc. | | | 1,628 | | | | 109 | |
Best Buy Co., Inc. | | | 4,222 | | | | 100 | |
Carnival Corp. | | | 4,197 | | | | 135 | |
Comcast Corp. Class A | | | 17,644 | | | | 530 | |
Costco Wholesale Corp. | | | 3,145 | | | | 286 | |
Darden Restaurants, Inc. | | | 2,084 | | | | 107 | |
Dick’s Sporting Goods, Inc. | | | 2,170 | | | | 104 | |
Gap, Inc. (The) | | | 5,221 | | | | 136 | |
Garmin, Ltd. | | | 2,119 | | | | 99 | |
Genuine Parts Co. | | | 1,855 | | | | 116 | |
Hasbro, Inc. | | | 2,544 | | | | 93 | |
Home Depot, Inc. | | | 10,183 | | | | 512 | |
International Game Technology | | | 5,187 | | | | 87 | |
Interpublic Group of Cos., Inc. (The) | | | 8,792 | | | | 100 | |
JC Penney Co., Inc. | | | 2,638 | | | | 93 | |
Kohl’s Corp. | | | 2,620 | | | | 131 | |
Leggett & Platt, Inc. | | | 3,430 | | | | 79 | |
Lowe’s Cos., Inc. | | | 9,596 | | | | 301 | |
Mattel, Inc. | | | 4,096 | | | | 138 | |
Newell Rubbermaid, Inc. | | | 5,370 | | | | 96 | |
News Corp. Class A | | | 16,083 | | | | 317 | |
Omnicom Group, Inc. | | | 2,904 | | | | 147 | |
PVH Corp. | | | 1,192 | | | | 106 | |
Ralph Lauren Corp. Class A | | | 785 | | | | 137 | |
Signet Jewelers, Ltd. | | | 1,862 | | | | 88 | |
Staples, Inc. | | | 8,287 | | | | 134 | |
Target Corp. | | | 4,996 | | | | 291 | |
Tiffany & Co. | | | 1,619 | | | | 112 | |
VF Corp. | | | 955 | | | | 139 | |
Wal-Mart Stores, Inc. | | | 10,777 | | | | 661 | |
Walt Disney Co. (The) | | | 11,955 | | | | 524 | |
Williams-Sonoma, Inc. | | | 2,159 | | | | 81 | |
| | | | | | | | |
| | | | | | | 6,176 | |
| | | | | | | | |
| | |
| Consumer Staples - 6.5% | | | | | | | | |
Beam, Inc. | | | 2,033 | | | | 119 | |
Church & Dwight Co., Inc. | | | 2,115 | | | | 104 | |
Coca-Cola Enterprises, Inc. | | | 4,142 | | | | 118 | |
ConAgra Foods, Inc. | | | 4,543 | | | | 119 | |
CVS Caremark Corp. | | | 8,893 | | | | 398 | |
Dr Pepper Snapple Group, Inc. | | | 2,754 | | | | 111 | |
Hormel Foods Corp. | | | 2,834 | | | | 84 | |
JM Smucker Co. (The) | | | 1,414 | | | | 115 | |
Kraft Foods, Inc. Class A | | | 10,653 | | | | 405 | |
Kroger Co. (The) | | | 5,640 | | | | 137 | |
McCormick & Co., Inc. | | | 1,934 | | | | 105 | |
Molson Coors Brewing Co. Class B | | | 2,135 | | | | 97 | |
Procter & Gamble Co. (The) | | | 16,191 | | | | 1,088 | |
Reynolds American, Inc. | | | 3,302 | | | | 137 | |
Safeway, Inc. | | | 4,833 | | | | 98 | |
Sysco Corp. | | | 5,265 | | | | 157 | |
Tyson Foods, Inc. Class A | | | 4,600 | | | | 88 | |
Walgreen Co. | | | 6,904 | | | | 231 | |
| | | | | | | | |
| | | | | | | 3,711 | |
| | | | | | | | |
| | | | | | | | |
| | | Principal
Amount ($)
or Shares | | | Market
Value
$ | |
| Energy - 9.3% | | | | | | | | |
Chevron Corp. | | | 11,577 | | | | 1,242 | |
ConocoPhillips | | | 8,095 | | | | 615 | |
Diamond Offshore Drilling, Inc. | | | 1,480 | | | | 99 | |
Exxon Mobil Corp. | | | 28,550 | | | | 2,475 | |
Hubbell, Inc. Class B (Æ) | | | 1,241 | | | | 98 | |
Marathon Oil Corp. | | | 6,026 | | | | 191 | |
Murphy Oil Corp. | | | 2,151 | | | | 121 | |
National Oilwell Varco, Inc. | | | 3,235 | | | | 257 | |
Spectra Energy Corp. | | | 5,531 | | | | 175 | |
| | | | | | | | |
| | | | | | | 5,273 | |
| | | | | | | | |
| | |
| Financial Services - 19.5% | | | | | | | | |
ACE, Ltd. | | | 2,736 | | | | 200 | |
Aflac, Inc. | | | 3,999 | | | | 184 | |
Allstate Corp. (The) | | | 5,080 | | | | 167 | |
American Capital Agency Corp. (ö) | | | 3,398 | | | | 100 | |
American Express Co. | | | 7,029 | | | | 407 | |
American Financial Group, Inc. | | | 2,093 | | | | 81 | |
Ameriprise Financial, Inc. | | | 2,465 | | | | 141 | |
Annaly Capital Management, Inc. (ö) | | | 9,014 | | | | 143 | |
Aon Corp. | | | 3,108 | | | | 152 | |
Ares Capital Corp. | | | 5,069 | | | | 83 | |
Arthur J Gallagher & Co. | | | 2,429 | | | | 87 | |
Assurant, Inc. | | | 2,013 | | | | 82 | |
AvalonBay Communities, Inc. (ö) | | | 980 | | | | 139 | |
Axis Capital Holdings, Ltd. | | | 2,617 | | | | 87 | |
Bank of New York Mellon Corp. (The) | | | 9,931 | | | | 240 | |
BB&T Corp. | | | 6,224 | | | | 195 | |
BlackRock, Inc. Class A | | | 817 | | | | 167 | |
Boston Properties, Inc. (ö) | | | 1,408 | | | | 148 | |
BRE Properties, Inc. Class A (ö) | | | 1,617 | | | | 82 | |
Capital One Financial Corp. | | | 3,984 | | | | 222 | |
Charles Schwab Corp. (The) | | | 11,136 | | | | 160 | |
Chubb Corp. (The) | | | 2,477 | | | | 171 | |
Cincinnati Financial Corp. | | | 2,803 | | | | 97 | |
CME Group, Inc. Class A | | | 617 | | | | 179 | |
Commerce Bancshares, Inc. | | | 2,025 | | | | 82 | |
Digital Realty Trust, Inc. (ö) | | | 1,465 | | | | 108 | |
Discover Financial Services | | | 5,520 | | | | 184 | |
East West Bancorp, Inc. | | | 3,904 | | | | 90 | |
Equifax, Inc. | | | 2,247 | | | | 99 | |
Everest Re Group, Ltd. | | | 977 | | | | 90 | |
Fidelity National Information Services, Inc. | | | 3,727 | | | | 123 | |
First Niagara Financial Group, Inc. | | | 8,974 | | | | 88 | |
Franklin Resources, Inc. | | | 1,426 | | | | 177 | |
Global Payments, Inc. | | | 1,726 | | | | 82 | |
Goldman Sachs Group, Inc. (The) | | | 3,502 | | | | 436 | |
HCC Insurance Holdings, Inc. | | | 2,802 | | | | 87 | |
Hudson City Bancorp, Inc. | | | 12,353 | | | | 90 | |
Invesco, Ltd. | | | 5,560 | | | | 148 | |
JPMorgan Chase & Co. | | | 23,584 | | | | 1,084 | |
M&T Bank Corp. | | | 1,484 | | | | 129 | |
Marsh & McLennan Cos., Inc. | | | 4,923 | | | | 161 | |
MetLife, Inc. | | | 6,498 | | | | 243 | |
Morgan Stanley | | | 12,574 | | | | 247 | |
New York Community Bancorp, Inc. | | | 7,322 | | | | 102 | |
| | |
| Russell Equity Income ETF | | 57 |
Russell Exchange Traded Funds Trust
Russell Equity Income ETF
Schedule of Investments, continued — March 31, 2012
Amounts in thousands (except share amounts)
| | | | | | | | |
| | | Principal
Amount ($)
or Shares | | | Market
Value
$ | |
| | | | | | | | |
Northern Trust Corp. | | | 2,724 | | | | 129 | |
NYSE Euronext | | | 3,768 | | | | 113 | |
PartnerRe, Ltd. - ADR | | | 1,320 | | | | 90 | |
PNC Financial Services Group, Inc. | | | 3,966 | | | | 256 | |
Progressive Corp. (The) | | | 6,516 | | | | 151 | |
Raymond James Financial, Inc. | | | 2,528 | | | | 92 | |
Realty Income Corp. (ö) | | | 2,474 | | | | 96 | |
RenaissanceRe Holdings, Ltd. | | | 1,103 | | | | 84 | |
Senior Housing Properties Trust (ö) | | | 3,609 | | | | 80 | |
State Street Corp. | | | 4,264 | | | | 194 | |
TD Ameritrade Holding Corp. | | | 5,096 | | | | 101 | |
Thomson Reuters Corp. | | | 4,342 | | | | 125 | |
Torchmark Corp. | | | 1,981 | | | | 99 | |
Total System Services, Inc. | | | 4,006 | | | | 92 | |
Travelers Cos., Inc. (The) | | | 3,347 | | | | 198 | |
Unum Group | | | 4,493 | | | | 110 | |
US Bancorp | | | 12,771 | | | | 405 | |
Wells Fargo & Co. | | | 29,135 | | | | 995 | |
WR Berkley Corp. | | | 2,400 | | | | 87 | |
| | | | | | | | |
| | | | | | | 11,061 | |
| | | | | | | | |
| | |
| Health Care - 13.1% | | | | | | | | |
Abbott Laboratories | | | 9,580 | | | | 587 | |
Aetna, Inc. | | | 3,517 | | | | 176 | |
AmerisourceBergen Corp. Class A | | | 3,051 | | | | 121 | |
Amgen, Inc. | | | 5,747 | | | | 391 | |
Becton Dickinson and Co. | | | 2,011 | | | | 156 | |
Bristol-Myers Squibb Co. | | | 11,038 | | | | 373 | |
Cardinal Health, Inc. | | | 3,416 | | | | 147 | |
Cigna Corp. | | | 3,011 | | | | 148 | |
Cooper Cos., Inc. (The) | | | 1,118 | | | | 91 | |
Covidien PLC | | | 4,098 | | | | 224 | |
Dentsply International, Inc. | | | 2,513 | | | | 101 | |
Eli Lilly & Co. | | | 7,110 | | | | 286 | |
Humana, Inc. | | | 1,616 | | | | 149 | |
Johnson & Johnson | | | 15,932 | | | | 1,052 | |
McKesson Corp. | | | 2,159 | | | | 189 | |
Medtronic, Inc. | | | 7,502 | | | | 294 | |
Merck & Co., Inc. | | | 18,498 | | | | 711 | |
Pfizer, Inc. | | | 46,058 | | | | 1,045 | |
Quest Diagnostics, Inc. | | | 1,909 | | | | 117 | |
St. Jude Medical, Inc. | | | 3,575 | | | | 158 | |
Stryker Corp. | | | 2,939 | | | | 163 | |
UnitedHealth Group, Inc. | | | 7,116 | | | | 419 | |
Universal Health Services, Inc. Class B | | | 2,064 | | | | 87 | |
WellPoint, Inc. | | | 2,845 | | | | 210 | |
| | | | | | | | |
| | | | | | | 7,395 | |
| | | | | | | | |
| | |
| Materials and Processing - 5.8% | | | | | | | | |
Air Products & Chemicals, Inc. | | | 1,873 | | | | 172 | |
Airgas, Inc. | | | 1,210 | | | | 108 | |
Albemarle Corp. | | | 1,686 | | | | 108 | |
Aptargroup, Inc. | | | 1,536 | | | | 84 | |
Bemis Co., Inc. | | | 2,605 | | | | 84 | |
Eastman Chemical Co. | | | 2,339 | | | | 121 | |
EI du Pont de Nemours & Co. | | | 6,458 | | | | 341 | |
Freeport-McMoRan Copper & Gold, Inc. | | | 6,890 | | | | 262 | |
| | | | | | | | |
| | | Principal
Amount ($)
or Shares | | | Market
Value
$ | |
International Flavors & Fragrances, Inc. | | | 1,603 | | | | 94 | |
Martin Marietta Materials, Inc. | | | 1,059 | | | | 91 | |
MeadWestvaco Corp. | | | 2,965 | | | | 94 | |
Monsanto Co. | | | 3,829 | | | | 304 | |
Newmont Mining Corp. | | | 3,705 | | | | 190 | |
Nucor Corp. | | | 3,267 | | | | 140 | |
PPG Industries, Inc. | | | 1,594 | | | | 153 | |
Precision Castparts Corp. | | | 1,164 | | | | 201 | |
Reliance Steel & Aluminum Co. | | | 1,663 | | | | 94 | |
Rock-Tenn Co. Class A | | | 1,436 | | | | 97 | |
RPM International, Inc. | | | 3,199 | | | | 84 | |
Sealed Air Corp. | | | 4,596 | | | | 89 | |
Sigma-Aldrich Corp. | | | 1,642 | | | | 120 | |
Sonoco Products Co. | | | 2,397 | | | | 80 | |
Steel Dynamics, Inc. | | | 5,835 | | | | 85 | |
Valspar Corp. | | | 2,090 | | | | 101 | |
| | | | | | | | |
| | | | | | | 3,297 | |
| | | | | | | | |
| | |
| Producer Durables - 12.9% | | | | | | | | |
3M Co. | | | 4,626 | | | | 412 | |
Ametek, Inc. | | | 2,327 | | | | 113 | |
Avery Dennison Corp. | | | 2,712 | | | | 82 | |
Cintas Corp. | | | 2,370 | | | | 93 | |
Cooper Industries PLC | | | 2,028 | | | | 130 | |
CSX Corp. | | | 8,915 | | | | 192 | |
Danaher Corp. | | | 4,334 | | | | 243 | |
Dover Corp. | | | 2,070 | | | | 130 | |
Eaton Corp. | | | 3,264 | | | | 163 | |
Emerson Electric Co. | | | 5,460 | | | | 285 | |
FedEx Corp. | | | 2,476 | | | | 228 | |
Flir Systems, Inc. | | | 3,307 | | | | 84 | |
Fluor Corp. | | | 2,166 | | | | 130 | |
General Dynamics Corp. | | | 2,756 | | | | 202 | |
General Electric Co. | | | 61,460 | | | | 1,233 | |
Honeywell International, Inc. | | | 5,466 | | | | 334 | |
IDEX Corp. | | | 2,098 | | | | 88 | |
Illinois Tool Works, Inc. | | | 3,774 | | | | 216 | |
Iron Mountain, Inc. | | | 2,892 | | | | 83 | |
KBR, Inc. | | | 3,018 | | | | 107 | |
Kennametal, Inc. | | | 2,118 | | | | 94 | |
L-3 Communications Holdings, Inc. Class 3 | | | 1,461 | | | | 103 | |
Manpower, Inc. | | | 2,157 | | | | 102 | |
Norfolk Southern Corp. | | | 2,790 | | | | 184 | |
Northrop Grumman Corp. | | | 2,469 | | | | 151 | |
Parker Hannifin Corp. | | | 1,626 | | | | 137 | |
Pentair, Inc. | | | 2,371 | | | | 113 | |
Raytheon Co. | | | 3,204 | | | | 169 | |
Republic Services, Inc. Class A | | | 3,967 | | | | 121 | |
Roper Industries, Inc. | | | 1,226 | | | | 122 | |
Southwest Airlines Co. | | | 11,453 | | | | 94 | |
SPX Corp. | | | 1,291 | | | | 100 | |
Towers Watson & Co. Class A | | | 1,332 | | | | 88 | |
Union Pacific Corp. | | | 3,252 | | | | 350 | |
United Technologies Corp. | | | 5,834 | | | | 483 | |
Wabtec Corp. | | | 1,137 | | | | 86 | |
Waste Connections, Inc. | | | 2,462 | | | | 80 | |
| | | | |
| | 58 | | | Russell Equity Income ETF |
Russell Exchange Traded Funds Trust
Russell Equity Income ETF
Schedule of Investments, continued — March 31, 2012
Amounts in thousands (except share amounts)
| | | | | | | | |
| | | Principal
Amount ($)
or Shares | | | Market
Value
$ | |
| | | | | | | | |
Waste Management, Inc. | | | 4,454 | | | | 156 | |
| | | | | | | | |
| | | | | | | 7,281 | |
| | | | | | | | |
| | |
| Technology - 12.0% | | | | | | | | |
Activision Blizzard, Inc. | | | 7,267 | | | | 93 | |
Amphenol Corp. Class A | | | 2,249 | | | | 134 | |
Analog Devices, Inc. | | | 3,342 | | | | 135 | |
Applied Materials, Inc. | | | 12,893 | | | | 160 | |
Avago Technologies, Ltd. | | | 3,159 | | | | 123 | |
Broadcom Corp. Class A (Æ) | | | 5,004 | | | | 197 | |
CA, Inc. | | | 5,114 | | | | 141 | |
Cisco Systems, Inc. | | | 33,436 | | | | 707 | |
Computer Sciences Corp. | | | 3,422 | | | | 102 | |
Corning, Inc. | | | 13,269 | | | | 187 | |
Harris Corp. | | | 2,342 | | | | 106 | |
Hewlett-Packard Co. | | | 13,331 | | | | 318 | |
Intel Corp. | | | 31,518 | | | | 886 | |
KLA-Tencor Corp. | | | 2,181 | | | | 119 | |
Maxim Integrated Products, Inc. | | | 3,957 | | | | 113 | |
Microchip Technology, Inc. | | | 2,707 | | | | 101 | |
Microsoft Corp. | | | 42,261 | | | | 1,363 | |
Oracle Corp. | | | 23,490 | | | | 685 | |
QUALCOMM, Inc. | | | 10,244 | | | | 697 | |
Texas Instruments, Inc. | | | 8,509 | | | | 286 | |
Xilinx, Inc. | | | 3,354 | | | | 122 | |
| | | | | | | | |
| | | | | | | 6,775 | |
| | | | | | | | |
| | |
| Utilities - 9.7% | | | | | | | | |
AGL Resources, Inc. | | | 2,081 | | | | 82 | |
Alliant Energy Corp. | | | 1,990 | | | | 86 | |
Ameren Corp. | | | 3,158 | | | | 103 | |
American Electric Power Co., Inc. | | | 4,105 | | | | 158 | |
Aqua America, Inc. | | | 3,523 | | | | 79 | |
AT&T, Inc. | | | 34,430 | | | | 1,074 | |
CenterPoint Energy, Inc. | | | 5,360 | | | | 106 | |
CenturyLink, Inc. | | | 5,025 | | | | 194 | |
CMS Energy Corp. | | | 4,142 | | | | 91 | |
Consolidated Edison, Inc. | | | 2,581 | | | | 151 | |
DTE Energy Co. | | | 2,045 | | | | 113 | |
Entergy Corp. | | | 1,806 | | | | 121 | |
Exelon Corp. | | | 7,443 | | | | 291 | |
FirstEnergy Corp. | | | 3,660 | | | | 167 | |
Frontier Communications Corp. | | | 17,287 | | | | 72 | |
Great Plains Energy, Inc. | | | 3,545 | | | | 72 | |
Integrys Energy Group, Inc. | | | 1,555 | | | | 82 | |
MDU Resources Group, Inc. | | | 3,875 | | | | 87 | |
NextEra Energy, Inc. | | | 3,335 | | | | 204 | |
NiSource, Inc. | | | 4,090 | | | | 100 | |
Northeast Utilities | | | 2,657 | | | | 99 | |
NSTAR | | | 1,865 | | | | 91 | |
NV Energy, Inc. | | | 5,022 | | | | 81 | |
PG&E Corp. | | | 3,653 | | | | 159 | |
Pinnacle West Capital Corp. | | | 1,862 | | | | 89 | |
Public Service Enterprise Group, Inc. | | | 4,610 | | | | 141 | |
| | | | | | | | |
| | | Principal
Amount ($)
or Shares | | | Market
Value
$ | |
Questar Corp. | | | 4,043 | | | | 78 | |
Southern Co. | | | 6,005 | | | | 270 | |
TECO Energy, Inc. | | | 4,363 | | | | 77 | |
UGI Corp. | | | 2,686 | | | | 73 | |
Verizon Communications, Inc. | | | 16,990 | | | | 649 | |
Wisconsin Energy Corp. | | | 3,021 | | | | 106 | |
Xcel Energy, Inc. | | | 4,850 | | | | 128 | |
| | | | | | | | |
| | | | | | | 5,474 | |
| | | | | | | | |
| | |
Total Common Stocks (cost $50,630) | | | | | | | 56,443 | |
| | | | | | | | |
| | |
Short-Term Investments - 0.2% Russell U.S. Cash Management Fund | | | 134,457 | (¥) | | | 134 | |
| | | | | | | | |
| | |
Total Short-Term Investments (cost $134) | | | | | | | 134 | |
| | | | | | | | |
| | |
Total Investments - 99.9% (identified cost $50,764) | | | | | | | 56,577 | |
| | |
Other Assets and Liabilities, Net - 0.1% | | | | | | | 78 | |
| | | | | | | | |
| | |
| Net Assets - 100.0% | | | | | | | 56,655 | |
| | | | | | | | |
See accompanying notes which are an integral part of the financial statements.
| | |
| Russell Equity Income ETF | | 59 |
Russell Exchange Traded Funds Trust
Russell Equity Income ETF
Presentation of Portfolio Holdings — March 31, 2012
Amounts in thousands
| | | | | | | | | | | | | | | | | | | | |
| | | Market Value | | | % of Net
Assets | |
| Portfolio Summary | | Level 1 | | | Level 2 | | | Level 3 | | | Total | | |
| | | | | | | | | | | | | | | | | | | | |
Common Stocks | | | | | | | | | | | | | | | | | | | | |
Consumer Discretionary | | $ | 6,176 | | | $ | — | | | $ | — | | | $ | 6,176 | | | | 10.9 | |
Consumer Staples | | | 3,711 | | | | — | | | | — | | | | 3,711 | | | | 6.5 | |
Energy | | | 5,273 | | | | — | | | | — | | | | 5,273 | | | | 9.3 | |
Financial Services | | | 10,979 | | | | — | | | | 82 | | | | 11,061 | | | | 19.5 | |
Health Care | | | 7,395 | | | | — | | | | — | | | | 7,395 | | | | 13.1 | |
Materials and Processing | | | 3,297 | | | | — | | | | — | | | | 3,297 | | | | 5.8 | |
Producer Durables | | | 7,281 | | | | — | | | | — | | | | 7,281 | | | | 12.9 | |
Technology | | | 6,775 | | | | — | | | | — | | | | 6,775 | | | | 12.0 | |
Utilities | | | 5,474 | | | | — | | | | — | | | | 5,474 | | | | 9.7 | |
Short-Term Investments | | | — | | | | 134 | | | | — | | | | 134 | | | | 0.2 | |
| | | | | | | | | | | | | | | | | | | | |
| | | | | |
Total Investments | | | 56,361 | | | | 134 | | | | 82 | | | | 56,577 | | | | 99.9 | |
| | | | | | | | | | | | | | | | | | | | |
Other Assets and Liabilities, Net | | | | | | | | | | | | | | | | | | | 0.1 | |
| | | | | | | | | | | | | | | | | | | | |
| | | | | |
| | | | | | | | | | | | | | | | | | | 100.0 | |
| | | | | | | | | | | | | | | | | | | | |
For a description of the levels see note 2 in the Notes to Financial Statements.
Investments in which significant unobservable inputs (Level 3) were used in determining a value for the period ending March 31, 2012 were less than 1% of net assets.
There were no significant transfers in and out of levels 1, 2 and 3 during the period ending March 31, 2012.
See accompanying notes which are an integral part of the financial statements.
| | | | |
| | 60 | | | Russell Equity Income ETF |
Russell Exchange Traded Funds Trust
Russell Equity Income ETF
Statement of Assets and Liabilities — March 31, 2012
| | | | |
| Amounts in thousands | | Russell Equity
Income ETF | |
| | | | |
Assets | | | | |
Investments, at identified cost | | $ | 50,764 | |
Investments, at market* | | | 56,577 | |
Receivables: | | | | |
Dividends | | | 97 | |
| | | | |
Total assets | | | 56,674 | |
| | | | |
| |
Liabilities | | | | |
Payables: | | | | |
Accrued fees to affiliates | | | 19 | |
| | | | |
Total liabilities | | | 19 | |
| | | | |
| | | | |
Net Assets | | $ | 56,655 | |
| | | | |
Net Assets Consist of: | | | | |
Undistributed (overdistributed) net investment income | | $ | 38 | |
Accumulated net realized gain (loss) | | | (680 | ) |
Unrealized appreciation (depreciation) on investments | | | 5,813 | |
Shares of beneficial interest | | | 1 | |
Additional paid-in capital | | | 51,483 | |
| | | | |
Net Assets | | $ | 56,655 | |
| | | | |
Net Asset Value, offering and redemption price per share: | | | | |
Net asset value per share:(a) | | $ | 51.50 | |
Net assets | | $ | 56,654,703 | |
Shares outstanding ($.001 par value) | | | 1,100,002 | |
Amounts in thousands | | | | |
| | | | |
* Investments in Affiliates, Russell U.S. Cash Management Fund | | $ | 134 | |
| (a) | Net asset value per share equals net assets divided by shares outstanding. |
See accompanying notes which are an integral part of the financial statements.
| | |
| Statement of Assets and Liabilities | | 61 |
Russell Exchange Traded Funds Trust
Russell Equity Income ETF
Statement of Operations — For the Period Ended March 31, 2012
| | | | |
| Amounts in thousands | | Russell Equity
Income ETF* | |
| | | | |
Investment Income | | | | |
Dividends | | $ | 749 | |
| | | | |
Total investment income | | | 749 | |
| | | | |
| |
Expenses | | | | |
Management fees | | | 99 | |
Trustee and trustee related fees | | | 79 | |
| | | | |
Expenses before reductions | | | 178 | |
Expense reductions | | | (79 | ) |
| | | | |
Net expenses | | | 99 | |
| | | | |
Net investment income (loss) | | | 650 | |
| | | | |
| |
Net Realized and Unrealized Gain (Loss) | | | | |
Net realized gain (loss) on: | | | | |
Investments | | | (685 | ) |
In-kind redemptions | | | 1,850 | |
| | | | |
Net realized gain (loss) | | | 1,165 | |
| | | | |
Net change in unrealized appreciation (depreciation) on investments | | | 5,813 | |
| | | | |
Net realized and unrealized gain (loss) | | | 6,978 | |
| | | | |
Net Increase (Decrease) in Net Assets from Operations | | $ | 7,628 | |
| | | | |
| * | For the period May 18, 2011 (commencement of operations) to March 31, 2012. |
See accompanying notes which are an integral part of the financial statements.
| | | | |
| | 62 | | | Statement of Operations |
Russell Exchange Traded Funds Trust
Russell Equity Income ETF
Statement of Changes in Net Assets — For the Period Ended March 31,
| | | | |
| | | Russell Equity
Income ETF | |
| Amounts in thousands | | 2012* | |
| | | | |
Increase (Decrease) in Net Assets | | | | |
| |
Operations | | | | |
Net investment income (loss) | | $ | 650 | |
Net realized gain (loss) | | | 1,165 | |
Net change in unrealized appreciation (depreciation) | | | 5,813 | |
| | | | |
Net increase (decrease) in net assets from operations | | | 7,628 | |
| | | | |
| |
Distributions | | | | |
From net investment income | | | (612 | ) |
| | | | |
Net decrease in net assets from distributions | | | (612 | ) |
| | | | |
| |
Share Transactions | | | | |
Net increase (decrease) in net assets from share transactions | | | 49,639 | |
| | | | |
Total Net Increase (Decrease) in Net Assets | | | 56,655 | |
| |
Net Assets | | | | |
Beginning of period | | | — | |
| | | | |
End of period | | $ | 56,655 | |
| | | | |
Undistributed (overdistributed) net investment income included in net assets | | $ | 38 | |
| * | For the period May 18, 2011 (commencement of operations) to March 31, 2012. |
See accompanying notes which are an integral part of the financial statements.
| | |
| Statement of Changes in Net Assets | | 63 |
Russell Exchange Traded Funds Trust
Russell Equity Income ETF
Financial Highlights — For the Period Ended
For a Share Outstanding Throughout Each Period.
| | | | | | | | | | | | | | | | | | | | | | | | |
| | |
$
Net Asset Value,
Beginning of
Period | | | $
Net
Investment
Income (Loss)(a) | | | $
Net Realized
and Unrealized
Gain (Loss) | | | $
Total from
Investment
Operations | | | $
Distributions
from Net
Investment Income | | | $
Total
Distributions | |
Russell Equity Income ETF | | | | | | | | | | | | | | | | | | | | | |
March 31, 2012* | | | 49.57 | | | | 1.00 | | | | 1.69 | | | | 2.69 | | | | (.76 | ) | | | (.76 | ) |
| (a) | Average daily shares outstanding were used for this calculation. |
| (b) | Periods less than one year are not annualized. |
| (c) | The ratios for periods less than one year are annualized. |
| (d) | Portfolio turnover rate excludes securities received or delivered from in-kind creation or redemption units. |
| * | For the period May 18, 2011 (commencement of operations) to March 31, 2012. |
See accompanying notes which are an integral part of the financial statements.
| | | | | | | | | | | | | | | | | | | | | | | | | | |
$
Net Asset Value,
End of
Period | | | %
Total
Return(b) | | | $
Net Assets,
End of Period
(000) | | | %
Ratio of Expenses
to Average
Net Assets,
Gross(c) | | | %
Ratio of Expenses
to Average
Net Assets,
Net(c) | | | %
Ratio of Net
Investment Income
to Average
Net Assets(c) | | | %
Portfolio
Turnover Rate(b)(d) | |
| | | | | | | | | | | | | | | | | | | | | | | | | | |
| | 51.50 | | | | 5.57 | | | | 56,655 | | | | .67 | | | | .37 | | | | 2.43 | | | | 27 | |
See accompanying notes which are an integral part of the financial statements.
Russell Exchange Traded Funds Trust
Russell Low P/E ETF
Portfolio Management Discussion and Analysis — March 31, 2012 (Unaudited)
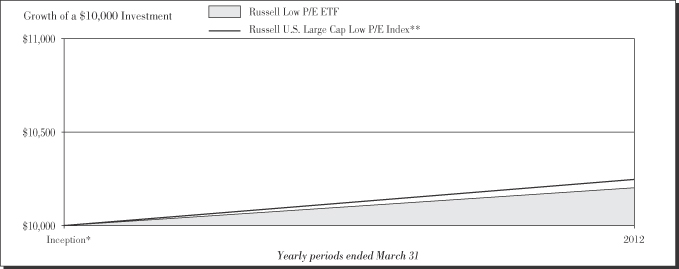
Performance as of March 31, 2012
| | | | | | | | | | | | |
|
| Average Annual Total Return | |
| | | Net Asset
Value | | | Market Value | | | Russell U.S.
Large Cap Low
P/E Index** | |
Inception* | | | 2.02 | % | | | 2.09 | % | | | 2.45 | % |
Russell Exchange Traded Funds Trust
Russell Low P/E ETF
Portfolio Management Discussion and Analysis — March 31, 2012 (Unaudited)
The Russell Low P/E ETF (the “Fund”) is an index-based exchange-traded fund that seeks investment results that closely correspond to the total return of the Russell U.S. Large Cap Low P/E Index (the “Index”). Russell Investment Management Company (“RIMCo”), as the Fund’s advisor, uses a “passive” or indexing approach to try to achieve the Fund’s investment objective. Unlike many investment companies, the Fund does not try to “beat” the Index it tracks and does not seek temporary defensive positions when markets decline or appear overvalued. The Fund will normally invest at least 80% of its total assets in securities that comprise the Index.
What is the Fund’s investment objective?
The Fund seeks investment results that closely correspond to the total return of the Russell U.S. Large Cap Low P/E Index, which is designed to select securities intended to produce performance that is similar to professional investment managers using a low price to earnings investment discipline.
Is the Fund replicating or sampling?
The Fund is replicating.
How did the Fund perform relative to its benchmark for the fiscal year ended March 31, 2012?
For the fiscal year ended March 31, 2012, the Fund gained 2.02%. This is compared to the Fund’s benchmark, the Russell U.S. Large Cap Low P/E Index, which gained 2.45% during the same period. The Fund’s performance includes operating expenses, whereas indexes are unmanaged and index returns do not include expenses of any kind.
There were no significant changes to either the Fund or Index during the reporting period.
Did the Fund outperform or underperform the benchmark or was performance as expected based on expenses, etc.?
The Fund performed as expected against the benchmark.
Over the reporting period, please describe those sectors that outperformed or underperformed.
Sectors achieved both positive and negative returns for the Fund and the Index. Consumer discretionary was the best performing sector for the Fund and the Index, while Technology was the worst performing sector. Consumer discretionary, with an average weight of 10.5% was the best contributor to Fund and Index returns. Financial services, with an average weight of 28.1%, was the worst contributor to Fund and Index returns.
Over the reporting period, please describe those individual securities (constituents) that outperformed or underperformed.
Wells Fargo & Co, Pfizer Inc, and Chevron Corp generated positive returns and contributed the most to Fund performance while Bank of America Corp, Hewlett-Packard Co, and Goldman Sachs Group Inc, all declined which detracted from Fund performance.
The views expressed in this report reflect those of the portfolio managers only through the end of the period covered by the report. These views do not necessarily represent the views of RIMCo, or any other person in RIMCo or any other affiliated organization. These views are subject to change at any time based upon market conditions or other events, and RIMCo disclaims any responsibility to update the views contained herein. These views should not be relied on as investment advice and, because investment decisions for a Russell Exchange Traded Funds Trust (“RET”) Fund are based on numerous factors, should not be relied on as an indication of investment decisions of any RET Fund.
| * | | Commenced operations by issuing shares May 18, 2011. |
| ** | | The Russell U.S. Large Cap Low P/E Index is designed to select securities intended to produce performance that is similar to professional investment managers following a low price to earnings investment discipline. This discipline focuses on companies that are trading at lower multiples relative to their prior level and/or their sector peers. Starting with the Russell 1000® Value Index (an index comprised of U.S. stocks), the Index includes stocks that have a price to one year forecasted earnings, price to trailing earnings and/or price to cash flow multiple below their five year historical average. The Index excludes stocks that have a price to sales and/or price to book multiple that exceeds their sector peers, when all three inclusionary criteria are not met. |
Performance is historical and assumes reinvestment of all dividends and capital gains. Investment return and principal value will fluctuate so that an investor’s shares, when redeemed, may be worth more or less than when purchased. Past performance is not indicative of future results. The returns shown do not reflect the deduction of taxes that a shareholder would pay on Fund distributions or the redemption of Fund shares.
Russell Exchange Traded Funds Trust
Russell Low P/E ETF
Shareholder Expense Example — March 31, 2012 (Unaudited)
Fund Expenses
The following disclosure provides important information regarding each Fund’s Expense Example, which appears on each Fund’s individual page in this Annual Report. Please refer to this information when reviewing the Expense Example for a Fund.
Example
As a shareholder of the Fund, you incur two types of costs: (1) transaction costs, including brokerage commissions on purchases and sales of your Fund shares and (2) ongoing costs, including management fees and other Fund expenses. The Example is intended to help you understand your ongoing costs (in dollars) of investing in the Fund and to compare these costs with the ongoing costs of investing in other funds. The Example is based on an investment of $1,000 invested at the beginning of the period and held for the entire period indicated, which for this Fund is from October 1, 2011 to March 31, 2012.
Actual Expenses
The information in the table under the heading “Actual Performance” provides information about actual account values and actual expenses. You may use the information in this column, together with the amount you invested, to estimate the expenses that you paid over the period. Simply divide your account value by $1,000 (for example, an $8,600 account value divided by $1,000 = 8.6), then multiply the result by the number in the first column in the row entitled “Expenses Paid During Period” to estimate the expenses you paid on your account during this period.
Hypothetical Example for Comparison Purposes
The information in the table under the heading “Hypothetical Performance (5% return before expenses)” provides information about hypothetical account values and hypothetical expenses based on the Fund’s actual expense ratio and an assumed rate of return of 5% per year before expenses, which is not the Fund’s actual return. The hypothetical account values and expenses may not be used to estimate the actual ending account balance or expenses you paid for the period. You may use this information to compare the ongoing costs of investing in the Fund and other funds. To do so, compare this 5% hypothetical example with the 5% hypothetical examples that appear in the shareholder reports of other funds.
Please note that the expenses shown in the table are meant to highlight your ongoing costs only and do not reflect any transactional costs, such as brokerage commissions paid on purchases and sales of Fund shares. Therefore, the information under the heading “Hypothetical Performance (5% return before expenses)” is useful in comparing ongoing costs only, and will not help you determine the relative total costs of owning different funds. In addition, if these transactional costs were included, your costs would have been higher.
| | | | | | | | |
| | | Actual
Performance | | | Hypothetical
Performance
(5% return
before expenses) | |
| | | | | | | | |
Beginning Account Value October 1, 2011 | | $ | 1,000.00 | | | $ | 1,000.00 | |
Ending Account Value March 31, 2012 | | $ | 1,269.40 | | | $ | 1,023.15 | |
Expenses Paid During Period* | | $ | 2.10 | | | $ | 1.87 | |
| * | Expenses are equal to the Fund’s annualized expense ratio of 0.37% (representing the six month period annualized), multiplied by the average account value over the period, multiplied by 183/366 (to reflect the one-half year period). |
Russell Exchange Traded Funds Trust
Russell Low P/E ETF
Schedule of Investments — March 31, 2012
Amounts in thousands (except share amounts)
| | | | | | | | |
| | | Principal
Amount ($)
or Shares | | | Market
Value
$ | |
| | | | | | | | |
| Common Stocks - 99.8% | | | | | | | | |
| Consumer Discretionary - 11.4% | | | | | | | | |
Abercrombie & Fitch Co. Class A | | | 66 | | | | 3 | |
Autoliv, Inc. | | | 115 | | | | 8 | |
Best Buy Co., Inc. | | | 329 | | | | 8 | |
Brinker International, Inc. | | | 109 | | | | 3 | |
Career Education Corp. (Æ) | | | 378 | | | | 3 | |
CarMax, Inc. (Æ) | | | 215 | | | | 7 | |
Carnival Corp. | | | 394 | | | | 13 | |
CBS Corp. Class B | | | 511 | | | | 17 | |
Chico’s FAS, Inc. | | | 270 | | | | 4 | |
Comcast Corp. Class A | | | 1,256 | | | | 38 | |
DeVry, Inc. | | | 78 | | | | 3 | |
Dillard’s, Inc. Class A | | | 79 | | | | 5 | |
DISH Network Corp. Class A | | | 135 | | | | 4 | |
DR Horton, Inc. | | | 425 | | | | 6 | |
DreamWorks Animation SKG, Inc. Class A (Æ) | | | 212 | | | | 4 | |
DSW, Inc. Class A | | | 61 | | | | 3 | |
Education Management Corp. (Æ) | | | 113 | | | | 2 | |
Expedia, Inc. | | | 126 | | | | 4 | |
Federal-Mogul Corp. (Æ) | | | 194 | | | | 3 | |
Foot Locker, Inc. | | | 230 | | | | 7 | |
Ford Motor Co. | | | 1,444 | | | | 18 | |
GameStop Corp. Class A | | | 214 | | | | 5 | |
Gannett Co., Inc. | | | 386 | | | | 6 | |
Gap, Inc. (The) | | | 395 | | | | 10 | |
General Motors Co. (Æ) | | | 690 | | | | 18 | |
Harman International Industries, Inc. | | | 84 | | | | 4 | |
Hyatt Hotels Corp. Class A (Æ) | | | 94 | | | | 4 | |
Interpublic Group of Cos., Inc. (The) | | | 471 | | | | 5 | |
Jarden Corp. | | | 156 | | | | 6 | |
JC Penney Co., Inc. | | | 190 | | | | 7 | |
Johnson Controls, Inc. | | | 456 | | | | 15 | |
KAR Auction Services, Inc. (Æ) | | | 197 | | | | 3 | |
Kohl’s Corp. | | | 85 | | | | 4 | |
Lear Corp. | | | 147 | | | | 7 | |
Liberty Media Corp.—Interactive (Æ) | | | 604 | | | | 12 | |
Liberty Media Corp.—Liberty Capital Class A (Æ) | | | 117 | | | | 10 | |
Macy’s, Inc. | | | 356 | | | | 14 | |
MGM Resorts International (Æ) | | | 455 | | | | 6 | |
Mohawk Industries, Inc. (Æ) | | | 88 | | | | 6 | |
Newell Rubbermaid, Inc. | | | 375 | | | | 7 | |
Penn National Gaming, Inc. (Æ) | | | 123 | | | | 5 | |
PulteGroup, Inc. (Æ) | | | 643 | | | | 6 | |
PVH Corp. | | | 71 | | | | 6 | |
RadioShack Corp. | | | 346 | | | | 2 | |
Royal Caribbean Cruises, Ltd. | | | 140 | | | | 4 | |
Sears Holdings Corp. (Æ) | | | 112 | | | | 7 | |
Service Corp. International | | | 395 | | | | 4 | |
Signet Jewelers, Ltd. | | | 122 | | | | 6 | |
Snap-on, Inc. | | | 90 | | | | 6 | |
Stanley Black & Decker, Inc. | | | 162 | | | | 13 | |
Staples, Inc. | | | 713 | | | | 12 | |
Target Corp. | | | 532 | | | | 31 | |
Thor Industries, Inc. | | | 124 | | | | 4 | |
| | | | | | | | |
| | | Principal
Amount ($)
or Shares | | | Market
Value
$ | |
Time Warner, Inc. | | | 806 | | | | 30 | |
Toll Brothers, Inc. (Æ) | | | 243 | | | | 6 | |
TRW Automotive Holdings Corp. (Æ) | | | 156 | | | | 7 | |
Wal-Mart Stores, Inc. | | | 358 | | | | 22 | |
Walt Disney Co. (The) | | | 1,451 | | | | 64 | |
Washington Post Co. (The) Class B | | | 10 | | | | 4 | |
Wendy’s Co. (The) | | | 672 | | | | 3 | |
Whirlpool Corp. | | | 112 | | | | 9 | |
WMS Industries, Inc. (Æ) | | | 162 | | | | 4 | |
| | | | | | | | |
| | | | | | | 567 | |
| | | | | | | | |
| | |
| Consumer Staples - 7.0% | | | | | | | | |
Archer-Daniels-Midland Co. | | | 588 | | | | 19 | |
Beam, Inc. | | | 165 | | | | 10 | |
Bunge, Ltd. | | | 126 | | | | 9 | |
Coca-Cola Enterprises, Inc. | | | 159 | | | | 4 | |
Colgate-Palmolive Co. | | | 64 | | | | 6 | |
ConAgra Foods, Inc. | | | 362 | | | | 9 | |
Constellation Brands, Inc. Class A (Æ) | | | 269 | | | | 6 | |
Corn Products International, Inc. | | | 58 | | | | 3 | |
CVS Caremark Corp. | | | 1,053 | | | | 47 | |
Dean Foods Co. (Æ) | | | 379 | | | | 5 | |
Energizer Holdings, Inc. (Æ) | | | 85 | | | | 6 | |
Kraft Foods, Inc. Class A | | | 1,285 | | | | 49 | |
Kroger Co. (The) | | | 222 | | | | 5 | |
Molson Coors Brewing Co. Class B | | | 159 | | | | 7 | |
Procter & Gamble Co. (The) | | | 1,944 | | | | 131 | |
Ralcorp Holdings, Inc. (Æ) | | | 71 | | | | 5 | |
Safeway, Inc. | | | 385 | | | | 8 | |
Smithfield Foods, Inc. (Æ) | | | 221 | | | | 5 | |
SUPERVALU, Inc. | | | 475 | | | | 3 | |
Tyson Foods, Inc. Class A | | | 349 | | | | 7 | |
Walgreen Co. | | | 118 | | | | 4 | |
| | | | | | | | |
| | | | | | | 348 | |
| | | | | | | | |
| | |
| Energy - 11.7% | | | | | | | | |
Alpha Natural Resources, Inc. (Æ) | | | 189 | | | | 3 | |
Apache Corp. | | | 230 | | | | 23 | |
Arch Coal, Inc. | | | 321 | | | | 3 | |
Atwood Oceanics, Inc. (Æ) | | | 90 | | | | 4 | |
Baker Hughes, Inc. | | | 246 | | | | 10 | |
Chesapeake Energy Corp. | | | 603 | | | | 14 | |
Chevron Corp. | | | 1,411 | | | | 151 | |
ConocoPhillips | | | 1,011 | | | | 77 | |
Denbury Resources, Inc. (Æ) | | | 234 | | | | 4 | |
Devon Energy Corp. | | | 355 | | | | 25 | |
Diamond Offshore Drilling, Inc. | | | 74 | | | | 5 | |
EQT Corp. | | | 108 | | | | 5 | |
Exxon Mobil Corp. | | | 978 | | | | 85 | |
Forest Oil Corp. (Æ) | | | 214 | | | | 3 | |
Hess Corp. | | | 269 | | | | 16 | |
Marathon Oil Corp. | | | 612 | | | | 19 | |
Murphy Oil Corp. | | | 168 | | | | 10 | |
Nabors Industries, Ltd. (Æ) | | | 367 | | | | 6 | |
Newfield Exploration Co. (Æ) | | | 112 | | | | 4 | |
Occidental Petroleum Corp. | | | 454 | | | | 43 | |
Oil States International, Inc. (Æ) | | | 38 | | | | 3 | |
Russell Exchange Traded Funds Trust
Russell Low P/E ETF
Schedule of Investments, continued — March 31, 2012
Amounts in thousands (except share amounts)
| | | | | | | | |
| | | Principal
Amount ($)
or Shares | | | Market
Value
$ | |
| | | | | | | | |
Patterson-UTI Energy, Inc. | | | 216 | | | | 4 | |
Plains Exploration & Production Co. (Æ) | | | 171 | | | | 7 | |
QEP Resources, Inc. | | | 123 | | | | 4 | |
Quicksilver Resources, Inc. (Æ) | | | 476 | | | | 2 | |
Rowan Cos., Inc. (Æ) | | | 169 | | | | 6 | |
SEACOR Holdings, Inc. (Æ) | | | 47 | | | | 5 | |
SunPower Corp. Class A (Æ) | | | 498 | | | | 3 | |
Tesoro Corp. (Æ) | | | 207 | | | | 6 | |
Valero Energy Corp. | | | 543 | | | | 14 | |
Williams Cos., Inc. (The) | | | 511 | | | | 16 | |
WPX Energy, Inc. (Æ) | | | 157 | | | | 3 | |
| | | | | | | | |
| | | | | | | 583 | |
| | | | | | | | |
| | |
| Financial Services - 29.4% | | | | | | | | |
ACE, Ltd. | | | 287 | | | | 21 | |
Aflac, Inc. | | | 404 | | | | 19 | |
Alleghany Corp. (Æ) | | | 26 | | | | 9 | |
Allied World Assurance Co. Holdings AG | | | 65 | | | | 4 | |
Allstate Corp. (The) | | | 480 | | | | 16 | |
American Capital, Ltd. (Æ) | | | 652 | | | | 6 | |
American Financial Group, Inc. | | | 123 | | | | 5 | |
American International Group, Inc. (Æ) | | | 438 | | | | 14 | |
Ameriprise Financial, Inc. | | | 215 | | | | 12 | |
Annaly Capital Management, Inc. (ö) | | | 863 | | | | 14 | |
Aon Corp. | | | 299 | | | | 15 | |
Aspen Insurance Holdings, Ltd. | | | 141 | | | | 4 | |
Associated Banc-Corp. | | | 348 | | | | 5 | |
Assurant, Inc. | | | 135 | | | | 5 | |
Assured Guaranty, Ltd. | | | 319 | | | | 5 | |
Axis Capital Holdings, Ltd. | | | 169 | | | | 6 | |
Bank of America Corp. | | | 7,915 | | | | 76 | |
Bank of New York Mellon Corp. (The) | | | 1,045 | | | | 25 | |
BB&T Corp. | | | 615 | | | | 19 | |
Berkshire Hathaway, Inc. Class B (Æ) | | | 1,314 | | | | 107 | |
BlackRock, Inc. Class A | | | 46 | | | | 9 | |
Capital One Financial Corp. | | | 401 | | | | 22 | |
Capitol Federal Financial, Inc. | | | 366 | | | | 4 | |
Chimera Investment Corp. (ö) | | | 1,808 | | | | 5 | |
Cincinnati Financial Corp. | | | 194 | | | | 7 | |
CIT Group, Inc. (Æ) | | | 223 | | | | 9 | |
Citigroup, Inc. | | | 2,224 | | | | 81 | |
City National Corp. | | | 90 | | | | 5 | |
CME Group, Inc. Class A | | | 60 | | | | 17 | |
CNA Financial Corp. | | | 111 | | | | 3 | |
Comerica, Inc. | | | 250 | | | | 8 | |
Commerce Bancshares, Inc. | | | 121 | | | | 5 | |
CoreLogic, Inc. (Æ) | | | 270 | | | | 4 | |
Cullen/Frost Bankers, Inc. | | | 92 | | | | 5 | |
Discover Financial Services | | | 471 | | | | 16 | |
E*Trade Financial Corp. (Æ) | | | 517 | | | | 6 | |
East West Bancorp, Inc. | | | 237 | | | | 5 | |
Endurance Specialty Holdings, Ltd. | | | 90 | | | | 4 | |
Everest Re Group, Ltd. | | | 65 | | | | 6 | |
Federated Investors, Inc. Class B | | | 181 | | | | 4 | |
Fidelity National Financial, Inc. Class A | | | 330 | | | | 6 | |
Fidelity National Information Services, Inc. | | | 292 | | | | 10 | |
Fifth Third Bancorp | | | 881 | | | | 12 | |
| | | | | | | | |
| | | Principal
Amount ($)
or Shares | | | Market
Value
$ | |
First Citizens BancShares, Inc. Class A (Æ) | | | 19 | | | | 3 | |
First Horizon National Corp. | | | 509 | | | | 5 | |
First Niagara Financial Group, Inc. | | | 562 | | | | 6 | |
First Republic Bank (Æ) | | | 135 | | | | 4 | |
Fiserv, Inc. (Æ) | | | 62 | | | | 4 | |
Forest City Enterprises, Inc. Class A (Æ) | | | 337 | | | | 5 | |
Fulton Financial Corp. | | | 427 | | | | 4 | |
Genworth Financial, Inc. Class A (Æ) | | | 784 | | | | 7 | |
Hartford Financial Services Group, Inc. | | | 489 | | | | 10 | |
HCC Insurance Holdings, Inc. | | | 180 | | | | 6 | |
HCP, Inc. (ö) | | | 361 | | | | 14 | |
Hudson City Bancorp, Inc. | | | 692 | | | | 5 | |
Huntington Bancshares, Inc. | | | 1,115 | | | | 7 | |
Invesco, Ltd. | | | 471 | | | | 13 | |
Janus Capital Group, Inc. | | | 556 | | | | 5 | |
Jefferies Group, Inc. | | | 282 | | | | 5 | |
Jones Lang LaSalle, Inc. | | | 48 | | | | 4 | |
JPMorgan Chase & Co. | | | 2,986 | | | | 137 | |
Kemper Corp. | | | 124 | | | | 4 | |
KeyCorp | | | 1,062 | | | | 9 | |
Legg Mason, Inc. | | | 213 | | | | 6 | |
Liberty Property Trust (ö) | | | 170 | | | | 6 | |
Lincoln National Corp. | | | 373 | | | | 10 | |
Loews Corp. | | | 302 | | | | 12 | |
M&T Bank Corp. | | | 127 | | | | 11 | |
Mack-Cali Realty Corp. (ö) | | | 168 | | | | 5 | |
Marsh & McLennan Cos., Inc. | | | 486 | | | | 16 | |
MetLife, Inc. | | | 689 | | | | 26 | |
Morgan Stanley | | | 1,314 | | | | 26 | |
NASDAQ OMX Group, Inc. (The) (Æ) | | | 188 | | | | 5 | |
New York Community Bancorp, Inc. | | | 534 | | | | 7 | |
NYSE Euronext | | | 234 | | | | 7 | |
People’s United Financial, Inc. | | | 431 | | | | 6 | |
Piedmont Office Realty Trust, Inc. Class A (ö) | | | 282 | | | | 5 | |
PNC Financial Services Group, Inc. | | | 434 | | | | 28 | |
Popular, Inc. (Æ) | | | 2,657 | | | | 5 | |
Principal Financial Group, Inc. | | | 331 | | | | 10 | |
Protective Life Corp. | | | 175 | | | | 5 | |
Prudential Financial, Inc. | | | 411 | | | | 26 | |
Raymond James Financial, Inc. | | | 151 | | | | 6 | |
Regions Financial Corp. | | | 1,513 | | | | 10 | |
Reinsurance Group of America, Inc. Class A | | | 105 | | | | 6 | |
SLM Corp. | | | 594 | | | | 9 | |
StanCorp Financial Group, Inc. | | | 101 | | | | 4 | |
State Street Corp. | | | 435 | | | | 20 | |
SunTrust Banks, Inc. | | | 543 | | | | 13 | |
Synovus Financial Corp. | | | 2,394 | | | | 5 | |
TCF Financial Corp. | | | 346 | | | | 4 | |
Thomson Reuters Corp. | | | 245 | | | | 7 | |
Torchmark Corp. | | | 132 | | | | 7 | |
Unum Group | | | 340 | | | | 8 | |
US Bancorp | | | 1,514 | | | | 48 | |
Visa, Inc. Class A | | | 284 | | | | 34 | |
Vornado Realty Trust (ö) | | | 152 | | | | 13 | |
Washington Federal, Inc. | | | 281 | | | | 5 | |
Russell Exchange Traded Funds Trust
Russell Low P/E ETF
Schedule of Investments, continued — March 31, 2012
Amounts in thousands (except share amounts)
| | | | | | | | |
| | | Principal
Amount ($)
or Shares | | | Market
Value
$ | |
| | | | | | | | |
Wells Fargo & Co. | | | 3,451 | | | | 118 | |
Weyerhaeuser Co. (ö) | | | 422 | | | | 9 | |
White Mountains Insurance Group, Ltd. | | | 11 | | | | 6 | |
XL Group PLC Class A | | | 361 | | | | 8 | |
| | | | | | | | |
| | | | | | | 1,459 | |
| | | | | | | | |
| | |
| Health Care - 12.2% | | | | | | | | |
Abbott Laboratories | | | 117 | | | | 7 | |
Aetna, Inc. | | | 341 | | | | 17 | |
Alere, Inc. (Æ) | | | 167 | | | | 4 | |
AMERIGROUP Corp. Class A (Æ) | | | 53 | | | | 4 | |
Baxter International, Inc. | | | 95 | | | | 6 | |
Bio-Rad Laboratories, Inc. Class A (Æ) | | | 42 | | | | 4 | |
Bristol-Myers Squibb Co. | | | 1,329 | | | | 45 | |
Cardinal Health, Inc. | | | 194 | | | | 8 | |
CareFusion Corp. (Æ) | | | 217 | | | | 6 | |
Cigna Corp. | | | 274 | | | | 13 | |
Community Health Systems, Inc. (Æ) | | | 229 | | | | 5 | |
Cooper Cos., Inc. (The) | | | 60 | | | | 5 | |
Coventry Health Care, Inc. | | | 196 | | | | 7 | |
Covidien PLC | | | 228 | | | | 12 | |
Eli Lilly & Co. | | | 567 | | | | 23 | |
Forest Laboratories, Inc. (Æ) | | | 283 | | | | 10 | |
Health Net, Inc. (Æ) | | | 146 | | | | 6 | |
Henry Schein, Inc. (Æ) | | | 73 | | | | 5 | |
Hill-Rom Holdings, Inc. | | | 77 | | | | 3 | |
Hologic, Inc. (Æ) | | | 343 | | | | 7 | |
Hospira, Inc. (Æ) | | | 107 | | | | 4 | |
Humana, Inc. | | | 154 | | | | 14 | |
Life Technologies Corp. (Æ) | | | 188 | | | | 9 | |
LifePoint Hospitals, Inc. (Æ) | | | 107 | | | | 4 | |
Medtronic, Inc. | | | 177 | | | | 7 | |
Merck & Co., Inc. | | | 2,335 | | | | 90 | |
Mylan, Inc. (Æ) | | | 153 | | | | 4 | |
Omnicare, Inc. | | | 162 | | | | 6 | |
Patterson Cos., Inc. | | | 136 | | | | 5 | |
PerkinElmer, Inc. | | | 215 | | | | 6 | |
Pfizer, Inc. | | | 5,901 | | | | 134 | |
Qiagen NV (Æ) | | | 363 | | | | 6 | |
Teleflex, Inc. | | | 67 | | | | 4 | |
Tenet Healthcare Corp. (Æ) | | | 818 | | | | 4 | |
Thermo Fisher Scientific, Inc. | | | 342 | | | | 19 | |
UnitedHealth Group, Inc. | | | 848 | | | | 50 | |
VCA Antech, Inc. (Æ) | | | 190 | | | | 4 | |
Warner Chilcott PLC Class A (Æ) | | | 196 | | | | 3 | |
WellPoint, Inc. | | | 295 | | | | 22 | |
Zimmer Holdings, Inc. | | | 181 | | | | 12 | |
| | | | | | | | |
| | | | | | | 604 | |
| | | | | | | | |
| | |
| Materials and Processing - 4.1% | | | | | | | | |
Alcoa, Inc. | | | 1,085 | | | | 11 | |
Armstrong World Industries, Inc. (Æ) | | | 73 | | | | 4 | |
Ashland, Inc. | | | 104 | | | | 6 | |
Bemis Co., Inc. | | | 170 | | | | 5 | |
Cabot Corp. | | | 132 | | | | 6 | |
CF Industries Holdings, Inc. | | | 25 | | | | 5 | |
Commercial Metals Co. | | | 266 | | | | 4 | |
| | | | | | | | |
| | | Principal
Amount ($)
or Shares | | | Market
Value
$ | |
Cytec Industries, Inc. | | | 94 | | | | 6 | |
Domtar Corp. | | | 57 | | | | 5 | |
Dow Chemical Co. (The) | | | 958 | | | | 33 | |
Greif, Inc. Class A | | | 86 | | | | 5 | |
Huntsman Corp. | | | 379 | | | | 5 | |
International Paper Co. | | | 342 | | | | 12 | |
LyondellBasell Industries NV Class A | | | 295 | | | | 13 | |
MeadWestvaco Corp. | | | 218 | | | | 7 | |
Newmont Mining Corp. | | | 403 | | | | 21 | |
Nucor Corp. | | | 298 | | | | 13 | |
Owens Corning (Æ) | | | 183 | | | | 7 | |
Owens-Illinois, Inc. (Æ) | | | 252 | | | | 6 | |
Post Holdings, Inc. (Æ) | | | 35 | | | | 1 | |
Reliance Steel & Aluminum Co. | | | 98 | | | | 5 | |
Rockwood Holdings, Inc. (Æ) | | | 67 | | | | 3 | |
Schnitzer Steel Industries, Inc. Class A | | | 70 | | | | 3 | |
Sealed Air Corp. | | | 294 | | | | 6 | |
Steel Dynamics, Inc. | | | 234 | | | | 3 | |
Timken Co. | | | 75 | | | | 4 | |
WR Grace & Co. (Æ) | | | 60 | | | | 3 | |
| | | | | | | | |
| | | | | | | 202 | |
| | | | | | | | |
| | |
| Producer Durables - 11.0% | | | | | | | | |
AECOM Technology Corp. (Æ) | | | 168 | | | | 4 | |
AGCO Corp. (Æ) | | | 130 | | | | 6 | |
Alexander & Baldwin, Inc. | | | 95 | | | | 5 | |
Alliant Techsystems, Inc. | | | 69 | | | | 3 | |
Avery Dennison Corp. | | | 166 | | | | 5 | |
BE Aerospace, Inc. (Æ) | | | 69 | | | | 3 | |
Boeing Co. (The) | | | 97 | | | | 7 | |
Booz Allen Hamilton Holding Corp. Class A | | | 148 | | | | 2 | |
Chicago Bridge & Iron Co. NV | | | 97 | | | | 4 | |
CNH Global NV (Æ) | | | 89 | | | | 4 | |
Con-way, Inc. | | | 132 | | | | 4 | |
Copa Holdings SA Class A | | | 50 | | | | 4 | |
Corrections Corp. of America (Æ) | | | 203 | | | | 6 | |
Covanta Holding Corp. | | | 281 | | | | 5 | |
Delta Air Lines, Inc. (Æ) | | | 575 | | | | 6 | |
Eaton Corp. | | | 216 | | | | 11 | |
FedEx Corp. | | | 250 | | | | 23 | |
Flowserve Corp. | | | 29 | | | | 3 | |
General Cable Corp. (Æ) | | | 129 | | | | 4 | |
General Dynamics Corp. | | | 283 | | | | 21 | |
General Electric Co. | | | 7,906 | | | | 159 | |
Genpact, Ltd. (Æ) | | | 208 | | | | 3 | |
GrafTech International, Ltd. (Æ) | | | 283 | | | | 3 | |
Harsco Corp. | | | 189 | | | | 4 | |
Ingersoll-Rand PLC | | | 138 | | | | 6 | |
Itron, Inc. (Æ) | | | 101 | | | | 5 | |
ITT Corp. | | | 212 | | | | 5 | |
Jacobs Engineering Group, Inc. (Æ) | | | 151 | | | | 7 | |
KBR, Inc. | | | 199 | | | | 7 | |
Kennametal, Inc. | | | 129 | | | | 6 | |
L-3 Communications Holdings, Inc. Class 3 | | | 113 | | | | 8 | |
Lexmark International, Inc. Class A | | | 133 | | | | 4 | |
Lockheed Martin Corp. | | | 54 | | | | 5 | |
Manpower, Inc. | | | 134 | | | | 6 | |
Russell Exchange Traded Funds Trust
Russell Low P/E ETF
Schedule of Investments, continued — March 31, 2012
Amounts in thousands (except share amounts)
| | | | | | | | |
| | | Principal
Amount ($)
or Shares | | | Market
Value
$ | |
| | | | | | | | |
McDermott International, Inc. (Æ) | | | 264 | | | | 3 | |
Monster Worldwide, Inc. (Æ) | | | 389 | | | | 4 | |
Navistar International Corp. (Æ) | | | 90 | | | | 4 | |
Northrop Grumman Corp. | | | 237 | | | | 14 | |
Oshkosh Corp. (Æ) | | | 199 | | | | 5 | |
Parker Hannifin Corp. | | | 102 | | | | 9 | |
Pentair, Inc. | | | 152 | | | | 7 | |
Pitney Bowes, Inc. | | | 277 | | | | 5 | |
Quanta Services, Inc. (Æ) | | | 281 | | | | 6 | |
Raytheon Co. | | | 316 | | | | 17 | |
Regal-Beloit Corp. | | | 83 | | | | 5 | |
Republic Services, Inc. Class A | | | 331 | | | | 10 | |
RR Donnelley & Sons Co. | | | 321 | | | | 4 | |
Ryder System, Inc. | | | 84 | | | | 4 | |
Shaw Group, Inc. (The) (Æ) | | | 153 | | | | 5 | |
Southwest Airlines Co. | | | 787 | | | | 6 | |
Spirit Aerosystems Holdings, Inc. Class A (Æ) | | | 202 | | | | 5 | |
SPX Corp. | | | 72 | | | | 6 | |
Teekay Corp. | | | 128 | | | | 4 | |
Textron, Inc. | | | 334 | | | | 9 | |
Towers Watson & Co. Class A | | | 80 | | | | 5 | |
Tyco International, Ltd. | | | 402 | | | | 23 | |
United Continental Holdings, Inc. (Æ) | | | 177 | | | | 4 | |
URS Corp. | | | 137 | | | | 6 | |
UTi Worldwide, Inc. | | | 217 | | | | 4 | |
Verisk Analytics, Inc. Class A (Æ) | | | 75 | | | | 3 | |
Xerox Corp. | | | 1,359 | | | | 11 | |
| | | | | | | | |
| | | | | | | 546 | |
| | | | | | | | |
| | |
| Technology - 6.1% | | | | | | | | |
Activision Blizzard, Inc. | | | 525 | | | | 7 | |
Akamai Technologies, Inc. (Æ) | | | 89 | | | | 3 | |
Amdocs, Ltd. (Æ) | | | 221 | | | | 7 | |
AOL, Inc. (Æ) | | | 252 | | | | 5 | |
Applied Materials, Inc. | | | 1,152 | | | | 14 | |
Arrow Electronics, Inc. (Æ) | | | 144 | | | | 6 | |
Atmel Corp. (Æ) | | | 349 | | | | 4 | |
Avnet, Inc. (Æ) | | | 202 | | | | 7 | |
AVX Corp. | | | 243 | | | | 3 | |
Brocade Communications Systems, Inc. (Æ) | | | 809 | | | | 5 | |
Computer Sciences Corp. | | | 226 | | | | 7 | |
Corning, Inc. | | | 1,359 | | | | 19 | |
Cree, Inc. (Æ) | | | 196 | | | | 6 | |
Dell, Inc. (Æ) | | | 498 | | | | 8 | |
Diebold, Inc. | | | 131 | | | | 5 | |
DST Systems, Inc. | | | 79 | | | | 4 | |
EchoStar Corp. Class A (Æ) | | | 155 | | | | 4 | |
Fairchild Semiconductor International, Inc. Class A (Æ) | | | 325 | | | | 5 | |
Harris Corp. | | | 137 | | | | 6 | |
Hewlett-Packard Co. | | | 1,558 | | | | 37 | |
IAC/InterActiveCorp | | | 118 | | | | 6 | |
Ingram Micro, Inc. Class A (Æ) | | | 272 | | | | 5 | |
International Rectifier Corp. (Æ) | | | 188 | | | | 4 | |
Intersil Corp. Class A | | | 300 | | | | 3 | |
Jabil Circuit, Inc. | | | 166 | | | | 4 | |
| | | | | | | | |
| | | Principal
Amount ($)
or Shares | | | Market
Value
$ | |
KLA-Tencor Corp. | | | 82 | | | | 5 | |
LSI Corp. (Æ) | | | 759 | | | | 7 | |
Marvell Technology Group, Ltd. (Æ) | | | 563 | | | | 9 | |
MEMC Electronic Materials, Inc. (Æ) | | | 742 | | | | 3 | |
Micron Technology, Inc. (Æ) | | | 1,034 | | | | 8 | |
Molex, Inc. | | | 216 | | | | 6 | |
Motorola Solutions, Inc. | | | 277 | | | | 14 | |
NCR Corp. (Æ) | | | 186 | | | | 4 | |
Novellus Systems, Inc. (Æ) | | | 110 | | | | 6 | |
PMC - Sierra, Inc. (Æ) | | | 642 | | | | 5 | |
QLogic Corp. (Æ) | | | 185 | | | | 3 | |
SAIC, Inc. | | | 359 | | | | 5 | |
Tech Data Corp. (Æ) | | | 81 | | | | 4 | |
Teradyne, Inc. (Æ) | | | 314 | | | | 5 | |
Vishay Intertechnology, Inc. (Æ) | | | 401 | | | | 5 | |
Western Digital Corp. (Æ) | | | 256 | | | | 11 | |
Yahoo!, Inc. (Æ) | | | 1,118 | | | | 17 | |
| | | | | | | | |
| | | | | | | 301 | |
| | | | | | | | |
| | |
| Utilities - 6.9% | | | | | | | | |
AES Corp. (The) (Æ) | | | 705 | | | | 9 | |
Ameren Corp. | | | 256 | | | | 8 | |
American Electric Power Co., Inc. | | | 419 | | | | 16 | |
Atmos Energy Corp. | | | 146 | | | | 5 | |
Calpine Corp. (Æ) | | | 444 | | | | 8 | |
CenterPoint Energy, Inc. | | | 451 | | | | 9 | |
DTE Energy Co. | | | 173 | | | | 10 | |
Duke Energy Corp. | | | 1,100 | | | | 23 | |
Edison International | | | 302 | | | | 13 | |
Entergy Corp. | | | 167 | | | | 11 | |
Exelon Corp. | | | 737 | | | | 29 | |
FirstEnergy Corp. | | | 368 | | | | 17 | |
Frontier Communications Corp. | | | 1,286 | | | | 5 | |
GenOn Energy, Inc. (Æ) | | | 1,581 | | | | 3 | |
Hawaiian Electric Industries, Inc. | | | 170 | | | | 4 | |
Integrys Energy Group, Inc. | | | 106 | | | | 6 | |
National Fuel Gas Co. | | | 102 | | | | 5 | |
NII Holdings, Inc. (Æ) | | | 140 | | | | 3 | |
Northeast Utilities | | | 203 | | | | 8 | |
NRG Energy, Inc. (Æ) | | | 323 | | | | 5 | |
NV Energy, Inc. | | | 335 | | | | 5 | |
Pepco Holdings, Inc. | | | 296 | | | | 6 | |
PG&E Corp. | | | 352 | | | | 15 | |
Pinnacle West Capital Corp. | | | 135 | | | | 6 | |
Public Service Enterprise Group, Inc. | | | 451 | | | | 14 | |
Sempra Energy | | | 224 | | | | 13 | |
Sprint Nextel Corp. (Æ) | | | 3,324 | | | | 9 | |
Telephone & Data Systems, Inc. | | | 181 | | | | 4 | |
Time Warner Telecom, Inc. Class A (Æ) | | | 147 | | | | 3 | |
UGI Corp. | | | 172 | | | | 5 | |
US Cellular Corp. (Æ) | | | 64 | | | | 3 | |
Verizon Communications, Inc. | | | 1,674 | | | | 64 | |
| | | | | | | | |
| | | | | | | 344 | |
| | | | | | | | |
| | |
Total Common Stocks
(cost $4,967) | | | | | | | 4,954 | |
| | | | | | | | |
Russell Exchange Traded Funds Trust
Russell Low P/E ETF
Schedule of Investments, continued — March 31, 2012
Amounts in thousands (except share amounts)
| | | | | | | | |
| | | Principal
Amount ($)
or Shares | | | Market
Value
$ | |
| | | | | | | | |
| Short-Term Investments - 0.1% | | | | | | | | |
Russell U.S. Cash Management Fund | | | 4,768 | (¥) | | | 5 | |
| | | | | | | | |
| | |
Total Short-Term Investments
(cost $5) | | | | | | | 5 | |
| | | | | | | | |
| | |
Total Investments - 99.9%
(identified cost $4,972) | | | | | | | 4,959 | |
| | |
Other Assets and Liabilities,
Net - 0.1% | | | | | | | 7 | |
| | | | | | | | |
| | |
| Net Assets - 100.0% | | | | | | | 4,966 | |
| | | | | | | | |
See accompanying notes which are an integral part of the financial statements.
Russell Exchange Traded Funds Trust
Russell Low P/E ETF
Presentation of Portfolio Holdings — March 31, 2012
Amounts in thousands
| | | | | | | | | | | | | | | | | | | | |
| | | Market Value | | | % of Net
Assets | |
| Portfolio Summary | | Level 1 | | | Level 2 | | | Level 3 | | | Total | | |
| | | | | | | | | | | | | | | | | | | | |
Common Stocks | | | | | | | | | | | | | | | | | | | | |
Consumer Discretionary | | $ | 567 | | | $ | — | | | $ | — | | | $ | 567 | | | | 11.4 | |
Consumer Staples | | | 348 | | | | — | | | | — | | | | 348 | | | | 7.0 | |
Energy | | | 583 | | | | — | | | | — | | | | 583 | | | | 11.7 | |
Financial Services | | | 1,459 | | | | — | | | | — | | | | 1,459 | | | | 29.4 | |
Health Care | | | 604 | | | | — | | | | — | | | | 604 | | | | 12.2 | |
Materials and Processing | | | 202 | | | | — | | | | — | | | | 202 | | | | 4.1 | |
Producer Durables | | | 546 | | | | — | | | | — | | | | 546 | | | | 11.0 | |
Technology | | | 301 | | | | — | | | | — | | | | 301 | | | | 6.1 | |
Utilities | | | 344 | | | | — | | | | — | | | | 344 | | | | 6.9 | |
Short-Term Investments | | | — | | | | 5 | | | | — | | | | 5 | | | | 0.1 | |
| | | | | | | | | | | | | | | | | | | | |
| | | | | |
Total Investments | | | 4,954 | | | | 5 | | | | — | | | | 4,959 | | | | 99.9 | |
| | | | | | | | | | | | | | | | | | | | |
Other Assets and Liabilities, Net | | | | | | | | | | | | | | | | 0.1 | |
| | | | | | | | | | | | | | | | | | | | |
| | | | | |
| | | | | | | | | | | | | | | | | | | 100.0 | |
| | | | | | | | | | | | | | | | | | | | |
For a description of the levels see note 2 in the Notes to Financial Statements.
There were no significant transfers in and out of levels 1, 2 and 3 during the period ending March 31, 2012.
See accompanying notes which are an integral part of the financial statements.
Russell Exchange Traded Funds Trust
Russell Low P/E ETF
Statement of Assets and Liabilities — March 31, 2012
| | | | |
| Amounts in thousands | | Russell Low
P/E ETF | |
| | | | |
Assets | | | | |
Investments, at identified cost | | $ | 4,972 | |
Investments, at market* | | | 4,959 | |
Receivables: | | | | |
Dividends | | | 9 | |
| | | | |
Total assets | | | 4,968 | |
| | | | |
| |
Liabilities | | | | |
Payables: | | | | |
Accrued fees to affiliates | | | 2 | |
| | | | |
Total liabilities | | | 2 | |
| | | | |
| | | | |
Net Assets | | $ | 4,966 | |
| | | | |
Net Assets Consist of: | | | | |
Undistributed (overdistributed) net investment income | | $ | 4 | |
Accumulated net realized gain (loss) | | | (304 | ) |
Unrealized appreciation (depreciation) on investments | | | (13 | ) |
Additional paid-in capital | | | 5,279 | |
| | | | |
Net Assets | | $ | 4,966 | |
| | | | |
Net Asset Value, offering and redemption price per share: | | | | |
Net asset value per share:(a) | | $ | 49.66 | |
Net assets | | $ | 4,966,173 | |
Shares outstanding ($.001 par value) | | | 100,002 | |
Amounts in thousands | | | | |
| | | | |
* Investments in Affiliates, Russell U.S. Cash Management Fund | | $ | 5 | |
| (a) | Net asset value per share equals net assets divided by shares outstanding. |
See accompanying notes which are an integral part of the financial statements.
| | |
| Statement of Assets and Liabilities | | 75 |
Russell Exchange Traded Funds Trust
Russell Low P/E ETF
Statement of Operations — For the Period Ended March 31, 2012
| | | | |
| Amounts in thousands | | Russell Low
P/E ETF* | |
| | | | |
Investment Income | | | | |
Dividends | | $ | 151 | |
| | | | |
Total investment income | | | 151 | |
| | | | |
| |
Expenses | | | | |
Management fees | | | 24 | |
Trustee and trustee related fees | | | 21 | |
| | | | |
Expenses before reductions | | | 45 | |
Expense reductions | | | (21 | ) |
| | | | |
Net expenses | | | 24 | |
| | | | |
Net investment income (loss) | | | 127 | |
| | | | |
| |
Net Realized and Unrealized Gain (Loss) | | | | |
Net realized gain (loss) on: | | | | |
Investments | | | (315 | ) |
In-kind redemptions | | | (48 | ) |
| | | | |
Net realized gain (loss) | | | (363 | ) |
Net change in unrealized appreciation (depreciation) on investments | | | (13 | ) |
| | | | |
Net realized and unrealized gain (loss) | | | (376 | ) |
| | | | |
Net Increase (Decrease) in Net Assets from Operations | | $ | (249 | ) |
| | | | |
| * | For the period May 18, 2011 (commencement of operations) to March 31, 2012. |
See accompanying notes which are an integral part of the financial statements.
| | | | |
| | 76 | | | Statement of Operations |
Russell Exchange Traded Funds Trust
Russell Low P/E ETF
Statement of Changes in Net Assets — For the Period Ended March 31,
| | | | |
| | | Russell Low
P/E ETF | |
| Amounts in thousands | | 2012* | |
| | | | |
Increase (Decrease) in Net Assets | | | | |
| |
Operations | | | | |
Net investment income (loss) | | $ | 127 | |
Net realized gain (loss) | | | (363 | ) |
Net change in unrealized appreciation (depreciation) | | | (13 | ) |
| | | | |
Net increase (decrease) in net assets from operations | | | (249 | ) |
| | | | |
| |
Distributions | | | | |
From net investment income | | | (122 | ) |
| | | | |
Net decrease in net assets from distributions | | | (122 | ) |
| | | | |
| |
Share Transactions | | | | |
Net increase (decrease) in net assets from share transactions | | | 5,337 | |
| | | | |
Total Net Increase (Decrease) in Net Assets | | | 4,966 | |
| |
Net Assets | | | | |
Beginning of period | | | — | |
| | | | |
End of period | | $ | 4,966 | |
| | | | |
Undistributed (overdistributed) net investment income included in net assets | | $ | 4 | |
| * | For the period May 18, 2011 (commencement of operations) to March 31, 2012. |
See accompanying notes which are an integral part of the financial statements.
| | |
| Statement of Changes in Net Assets | | 77 |
Russell Exchange Traded Funds Trust
Russell Low P/E ETF
Financial Highlights — For the Period Ended
For a Share Outstanding Throughout Each Period.
| | | | | | | | | | | | | | | | | | | | | | | | |
| | | $
Net Asset Value,
Beginning of
Period | | | $
Net
Investment
Income (Loss)(a) | | | $
Net Realized
and Unrealized
Gain (Loss) | | | $
Total from
Investment
Operations | | | $
Distributions
from Net
Investment Income | | | $
Total
Distributions | |
Russell Low P/E ETF | | | | | | | | | | | | | | | | | |
March 31, 2012* | | | 49.51 | | | | .77 | | | | .15 | | | | .92 | | | | (.77 | ) | | | (.77 | ) |
| (a) | Average daily shares outstanding were used for this calculation. |
| (b) | Periods less than one year are not annualized. |
| (c) | The ratios for periods less than one year are annualized. |
| (d) | Portfolio turnover rate excludes securities received or delivered from in-kind creation or redemption units. |
| * | For the period May 18, 2011 (commencement of operations) to March 31, 2012. |
See accompanying notes which are an integral part of the financial statements.
| | | | | | | | | | | | | | | | | | | | | | | | | | |
$
Net Asset Value,
End of
Period | | | %
Total
Return(b) | | | $
Net Assets,
End of Period
(000) | | | %
Ratio of Expenses
to Average
Net Assets,
Gross(c) | | | %
Ratio of Expenses
to Average
Net Assets,
Net(c) | | | %
Ratio of Net
Investment Income
to Average
Net Assets(c) | | | %
Portfolio
Turnover Rate(b)(d) | |
| | | | | | | | | | | | | | | | | | | | | | | | | | |
| | 49.66 | | | | 2.02 | | | | 4,966 | | | | .70 | | | | .37 | | | | 1.98 | | | | 48 | |
See accompanying notes which are an integral part of the financial statements.
Russell Exchange Traded Funds Trust
Russell Small Cap Aggressive Growth ETF
Portfolio Management Discussion and Analysis — March 31, 2012 (Unaudited)
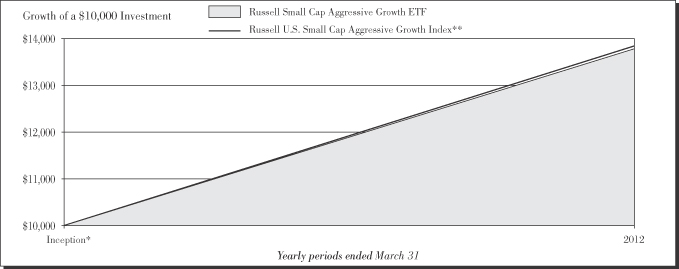
Performance as of March 31, 2012
| | | | | | | | | | | | |
|
| Average Annual Total Return | |
| | | Net Asset
Value | | | Market Value | | | Russell U.S.
Small Cap
Aggressive
Growth Index** | |
Inception* | | | 37.52 | % | | | 37.06 | % | | | 38.14 | % |
| | | | |
| | 80 | | | Russell Small Cap Aggressive Growth ETF |
Russell Exchange Traded Funds Trust
Russell Small Cap Aggressive Growth ETF
Portfolio Management Discussion and Analysis — March 31, 2012 (Unaudited)
The Russell Small Cap Aggressive Growth ETF (the “Fund”) is an index-based exchange-traded fund that seeks investment results that closely correspond to the total return of the Russell U.S. Small Cap Aggressive Growth Index (the “Index”). Russell Investment Management Company (“RIMCo”), as the Fund’s advisor, uses a “passive” or indexing approach to try to achieve the Fund’s investment objective. Unlike many investment companies, the Fund does not try to “beat” the Index it tracks and does not seek temporary defensive positions when markets decline or appear overvalued. The Fund will normally invest at least 80% of its total assets in securities that comprise the Index.
What is the Fund’s investment objective?
The Fund seeks investment results that closely correspond to the total return of the Russell U.S. Small Cap Aggressive Growth Index, which is designed to select securities intended to produce performance that is similar to professional investment managers using a small cap aggressive growth investment discipline.
Is the Fund replicating or sampling?
The Fund is replicating.
How did the Fund perform relative to its benchmark for the fiscal year ended March 31, 2012?
For the fiscal year ended March 31, 2012, the Fund gained 37.52%. This is compared to the Fund’s benchmark, the Russell U.S. Small Cap Aggressive Growth Index, which gained 38.14% during the same period. The Fund’s performance includes operating expenses, whereas indexes are unmanaged and index returns do not include expenses of any kind.
There were no significant changes to either the Fund or Index during the reporting period.
Did the Fund outperform or underperform the benchmark or was performance as expected based on expenses, etc.?
The Fund performed as expected against the benchmark.
Over the reporting period, please describe those sectors that outperformed or underperformed.
All sectors had positive returns for the Fund and the Index. Energy was the best performing sector for the Fund and the Index, while consumer staples was the worst performing sector. Technology, with an average weight of 26.2% was the best contributor to Fund and Index returns. Consumer staples, with an average weight of 1.5%, contributed the least to Fund and Index returns.
Over the reporting period, please describe those individual securities (constituents) that outperformed or underperformed.
Cheniere Energy Inc, Flotek Industries Inc, and Ista Pharmaceuticals Inc generated positive returns and contributed the most to Fund performance while Houston American Energy Corp, BioSante Pharmaceuticals Inc, and Diamond Foods Inc, all declined which detracted from Fund performance.
The views expressed in this report reflect those of the portfolio managers only through the end of the period covered by the report. These views do not necessarily represent the views of RIMCo, or any other person in RIMCo or any other affiliated organization. These views are subject to change at any time based upon market conditions or other events, and RIMCo disclaims any responsibility to update the views contained herein. These views should not be relied on as investment advice and, because investment decisions for a Russell Exchange Traded Funds Trust (“RET”) Fund are based on numerous factors, should not be relied on as an indication of investment decisions of any RET Fund.
| * | | Commenced operations by issuing shares October 4, 2011. |
| ** | | The Russell U.S. Small Cap Aggressive Growth Index is designed to select securities intended to produce performance that is similar to professional investment managers using a small cap aggressive growth investment discipline. This discipline focuses on companies with near term forecasted earnings that are expected to increase at a faster rate than those of the average company’s earnings. Starting with the Russell 2500® Index (an index comprised of U.S. stocks), the Index includes stocks that demonstrate growth potential as measured by: (1) average to high consensus forecasted earnings and (2) average to high one year historical sales growth. The Index excludes stocks with low earnings retention as measured by high dividend yields for the last four quarters. It also excludes stocks with low price to book ratios to ensure a growth orientation. The Index constituents are weighted based on a composite score of their growth and momentum characteristics. The Index is reconstituted quarterly. |
Performance is historical and assumes reinvestment of all dividends and capital gains. Investment return and principal value will fluctuate so that an investor’s shares, when redeemed, may be worth more or less than when purchased. Past performance is not indicative of future results. The returns shown do not reflect the deduction of taxes that a shareholder would pay on Fund distributions or the redemption of Fund shares.
| | |
| Russell Small Cap Aggressive Growth ETF | | 81 |
Russell Exchange Traded Funds Trust
Russell Small Cap Aggressive Growth ETF
Shareholder Expense Example — March 31, 2012 (Unaudited)
Fund Expenses
The following disclosure provides important information regarding each Fund’s Expense Example, which appears on each Fund’s individual page in this Annual Report. Please refer to this information when reviewing the Expense Example for a Fund.
Example
As a shareholder of the Fund, you incur two types of costs: (1) transaction costs, including brokerage commissions on purchases and sales of your Fund shares and (2) ongoing costs, including management fees and other Fund expenses. The Example is intended to help you understand your ongoing costs (in dollars) of investing in the Fund and to compare these costs with the ongoing costs of investing in other funds. The Example is based on an investment of $1,000 invested at the beginning of the period and held for the entire period indicated, which for this Fund is from October 4, 2011 (commencement of operations) to March 31, 2012.
Actual Expenses
The information in the table under the heading “Actual Performance” provides information about actual account values and actual expenses. You may use the information in this column, together with the amount you invested, to estimate the expenses that you paid over the period. Simply divide your account value by $1,000 (for example, an $8,600 account value divided by $1,000 = 8.6), then multiply the result by the number in the first column in the row entitled “Expenses Paid During Period” to estimate the expenses you paid on your account during this period.
Hypothetical Example for Comparison Purposes
The information in the table under the heading “Hypothetical Performance (5% return before expenses)” provides information about hypothetical account values and hypothetical expenses based on the Fund’s actual expense ratio and an assumed rate of return of 5% per year before expenses, which is not the Fund’s actual return. The hypothetical account values and expenses may not be used to estimate the actual ending account balance or expenses you paid for the period. You may use this information to compare the ongoing costs of investing in the Fund and other funds. To do so, compare this 5% hypothetical example with the 5% hypothetical examples that appear in the shareholder reports of other funds.
Please note that the expenses shown in the table are meant to highlight your ongoing costs only and do not reflect any transactional costs, such as brokerage commissions paid on purchases and sales of Fund shares. Therefore, the information under the heading “Hypothetical Performance (5% return before expenses)” is useful in comparing ongoing costs only, and will not help you determine the relative total costs of owning different funds. In addition, if these transactional costs were included, your costs would have been higher.
| | | | | | | | |
| | | Actual
Performance | | | Hypothetical
Performance
(5% return
before expenses) | |
| | | | | | | | |
Beginning Account Value October 4, 2011 | | $ | 1,000.00 | | | $ | 1,000.00 | |
Ending Account Value March 31, 2012 | | $ | 1,375.20 | | | $ | 1,022.75 | |
Expenses Paid During Period* | | $ | 2.63 | | | $ | 2.28 | |
| * | Actual expenses are equal to the Fund’s annualized expense ratio of 0.45% (representing the 180-day period annualized), multiplied by the average account value over the period, multiplied by 180/366 (to reflect the period since commencement of operations). Hypothetical expenses are equal to the Fund’s annualized expense ratio of 0.45% (representing the six month period annualized) multiplied by the average amount value over the period, multiplied by 183/366 (to reflect the one-half year period). |
| | | | |
| | 82 | | | Russell Small Cap Aggressive Growth ETF |
Russell Exchange Traded Funds Trust
Russell Small Cap Aggressive Growth ETF
Schedule of Investments — March 31, 2012
Amounts in thousands (except share amounts)
| | | | | | | | |
| | | Principal
Amount ($)
or Shares | | | Market
Value
$ | |
| | | | | | | | |
| Common Stocks - 99.7% | | | | | | | | |
| Consumer Discretionary - 13.3% | | | | | | | | |
Ancestry.com, Inc. (Æ) | | | 640 | | | | 15 | |
Arbitron, Inc. | | | 435 | | | | 16 | |
Asbury Automotive Group, Inc. (Æ) | | | 686 | | | | 19 | |
Ascena Retail Group, Inc. (Æ) | | | 497 | | | | 22 | |
Big Lots, Inc. (Æ) | | | 392 | | | | 17 | |
Blue Nile, Inc. (Æ) | | | 363 | | | | 12 | |
Brunswick Corp. | | | 817 | | | | 21 | |
Caribou Coffee Co., Inc. (Æ) | | | 1,978 | | | | 37 | |
Carter’s, Inc. (Æ) | | | 370 | | | | 18 | |
Cheesecake Factory, Inc. (The) (Æ) | | | 510 | | | | 15 | |
Cost Plus, Inc. (Æ) | | | 1,506 | | | | 27 | |
Deckers Outdoor Corp. (Æ) | | | 196 | | | | 12 | |
Drew Industries, Inc. (Æ) | | | 604 | | | | 16 | |
Fossil, Inc. (Æ) | | | 347 | | | | 46 | |
Gentex Corp. | | | 917 | | | | 22 | |
Goodyear Tire & Rubber Co. (The) (Æ) | | | 1,057 | | | | 12 | |
HSN, Inc. | | | 413 | | | | 16 | |
Jack in the Box, Inc. (Æ) | | | 709 | | | | 17 | |
Kirkland’s, Inc. (Æ) | | | 1,110 | | | | 18 | |
Knology, Inc. (Æ) | | | 1,041 | | | | 19 | |
La-Z-Boy, Inc. Class Z (Æ) | | | 1,242 | | | | 19 | |
Leapfrog Enterprises, Inc. Class A (Æ) | | | 2,644 | | | | 22 | |
Monro Muffler Brake, Inc. | | | 701 | | | | 29 | |
Nu Skin Enterprises, Inc. Class A | | | 305 | | | | 18 | |
NVR, Inc. (Æ) | | | 21 | | | | 15 | |
Penn National Gaming, Inc. (Æ) | | | 388 | | | | 17 | |
PVH Corp. | | | 210 | | | | 19 | |
Revlon, Inc. Class A (Æ) | | | 997 | | | | 17 | |
Sinclair Broadcast Group, Inc. Class A | | | 2,439 | | | | 27 | |
Six Flags Entertainment Corp. | | | 672 | | | | 31 | |
Smith & Wesson Holding Corp. (Æ) | | | 6,332 | | | | 49 | |
Stamps.com, Inc. (Æ) | | | 565 | | | | 16 | |
Steven Madden, Ltd. (Æ) | | | 800 | | | | 34 | |
Tempur-Pedic International, Inc. (Æ) | | | 521 | | | | 44 | |
Travelzoo, Inc. (Æ) | | | 599 | | | | 14 | |
Under Armour, Inc. Class A (Æ) | | | 385 | | | | 36 | |
Warnaco Group, Inc. (The) (Æ) | | | 295 | | | | 17 | |
Zagg, Inc. (Æ) | | | 3,902 | | | | 41 | |
| | | | | | | | |
| | | | | | | 862 | |
| | | | | | | | |
| | |
| Consumer Staples - 1.0% | | | | | | | | |
Casey’s General Stores, Inc. | | | 286 | | | | 16 | |
Coca-Cola Bottling Co. Consolidated | | | 253 | | | | 16 | |
Hain Celestial Group, Inc. (The) (Æ) | | | 403 | | | | 18 | |
Heckmann Corp. (Æ) | | | 4,100 | | | | 17 | |
| | | | | | | | |
| | | | | | | 67 | |
| | | | | | | | |
| | |
| Energy - 11.3% | | | | | | | | |
Approach Resources, Inc. (Æ) | | | 938 | | | | 35 | |
Basic Energy Services, Inc. (Æ) | | | 760 | | | | 13 | |
Berry Petroleum Co. Class A | | | 657 | | | | 31 | |
Capstone Turbine Corp. (Æ) | | | 23,383 | | | | 24 | |
CARBO Ceramics, Inc. | | | 219 | | | | 23 | |
Carrizo Oil & Gas, Inc. (Æ) | | | 1,030 | | | | 29 | |
Cheniere Energy, Inc. (Æ) | | | 3,171 | | | | 49 | |
| | | | | | | | |
| | | Principal
Amount ($)
or Shares | | | Market
Value
$ | |
Clean Energy Fuels Corp. (Æ) | | | 2,214 | | | | 48 | |
CVR Energy, Inc. (Æ) | | | 784 | | | | 21 | |
Dawson Geophysical Co. (Æ) | | | 687 | | | | 24 | |
FX Energy, Inc. (Æ) | | | 5,750 | | | | 31 | |
GeoResources, Inc. (Æ) | | | 927 | | | | 30 | |
Goodrich Petroleum Corp. (Æ) | | | 2,009 | | | | 38 | |
Gulfport Energy Corp. (Æ) | | | 937 | | | | 27 | |
Houston American Energy Corp. (Æ) | | | 2,267 | | | | 12 | |
Key Energy Services, Inc. (Æ) | | | 968 | | | | 15 | |
Kodiak Oil & Gas Corp. | | | 2,857 | | | | 28 | |
Lufkin Industries, Inc. | | | 410 | | | | 33 | |
Magnum Hunter Resources Corp. (Æ) | | | 5,121 | | | | 33 | |
Mitcham Industries, Inc. (Æ) | | | 685 | | | | 15 | |
Newpark Resources, Inc. (Æ) | | | 2,857 | | | | 23 | |
Northern Oil and Gas, Inc. (Æ) | | | 1,157 | | | | 24 | |
Oasis Petroleum, Inc. (Æ) | | | 949 | | | | 29 | |
Oil States International, Inc. (Æ) | | | 196 | | | | 15 | |
OYO Geospace Corp. (Æ) | | | 191 | | | | 20 | |
Rex Energy Corp. (Æ) | | | 971 | | | | 10 | |
Rosetta Resources, Inc. (Æ) | | | 635 | | | | 31 | |
RPC, Inc. | | | 2,224 | | | | 24 | |
| | | | | | | | |
| | | | | | | 735 | |
| | | | | | | | |
| | |
| Financial Services - 5.3% | | | | | | | | |
Advent Software, Inc. (Æ) | | | 607 | | | | 16 | |
Cardtronics, Inc. (Æ) | | | 553 | | | | 15 | |
Cohen & Steers, Inc. | | | 509 | | | | 16 | |
eHealth, Inc. (Æ) | | | 1,017 | | | | 17 | |
Euronet Worldwide, Inc. (Æ) | | | 810 | | | | 17 | |
Fair Isaac Corp. | | | 414 | | | | 18 | |
Financial Engines, Inc. (Æ) | | | 1,215 | | | | 27 | |
Global Cash Access Holdings, Inc. (Æ) | | | 6,203 | | | | 47 | |
Global Payments, Inc. | | | 316 | | | | 15 | |
Heartland Payment Systems, Inc. | | | 1,134 | | | | 32 | |
Investors Bancorp, Inc. (Æ) | | | 1,100 | | | | 17 | |
MSCI, Inc. Class A (Æ) | | | 450 | | | | 17 | |
Raymond James Financial, Inc. | | | 477 | | | | 17 | |
Signature Bank NY (Æ) | | | 247 | | | | 16 | |
Texas Capital Bancshares, Inc. (Æ) | | | 483 | | | | 17 | |
World Acceptance Corp. (Æ) | | | 376 | | | | 23 | |
Wright Express Corp. (Æ) | | | 271 | | | | 18 | |
| | | | | | | | |
| | | | | | | 345 | |
| | | | | | | | |
| | |
| Health Care - 22.4% | | | | | | | | |
Accretive Health, Inc. (Æ) | | | 1,202 | | | | 24 | |
Acorda Therapeutics, Inc. (Æ) | | | 627 | | | | 17 | |
Air Methods Corp. (Æ) | | | 327 | | | | 29 | |
Akorn, Inc. (Æ) | | | 2,494 | | | | 29 | |
Align Technology, Inc. (Æ) | | | 1,169 | | | | 32 | |
Alkermes PLC (Æ) | | | 1,598 | | | | 30 | |
AMAG Pharmaceuticals, Inc. (Æ) | | | 1,437 | | | | 23 | |
Analogic Corp. | | | 474 | | | | 32 | |
Ariad Pharmaceuticals, Inc. (Æ) | | | 2,253 | | | | 36 | |
Arqule, Inc. (Æ) | | | 2,605 | | | | 18 | |
Arthrocare Corp. (Æ) | | | 858 | | | | 23 | |
athenahealth, Inc. (Æ) | | | 562 | | | | 42 | |
Auxilium Pharmaceuticals, Inc. (Æ) | | | 1,363 | | | | 25 | |
| | |
| Russell Small Cap Aggressive Growth ETF | | 83 |
Russell Exchange Traded Funds Trust
Russell Small Cap Aggressive Growth ETF
Schedule of Investments, continued — March 31, 2012
Amounts in thousands (except share amounts)
| | | | | | | | |
| | | Principal
Amount ($)
or Shares | | | Market
Value
$ | |
| | | | | | | | |
AVANIR Pharmaceuticals, Inc. Class A (Æ) | | | 13,452 | | | | 46 | |
Cell Therapeutics, Inc. (Æ) | | | 23,459 | | | | 30 | |
Conceptus, Inc. (Æ) | | | 2,152 | | | | 31 | |
Cooper Cos., Inc. (The) | | | 210 | | | | 17 | |
Covance, Inc. (Æ) | | | 327 | | | | 16 | |
Cyberonics, Inc. (Æ) | | | 828 | | | | 32 | |
DexCom, Inc. (Æ) | | | 2,965 | | | | 31 | |
Endo Pharmaceuticals Holdings, Inc. (Æ) | | | 426 | | | | 16 | |
Endologix, Inc. (Æ) | | | 2,405 | | | | 35 | |
Genomic Health, Inc. (Æ) | | | 1,088 | | | | 33 | |
Gen-Probe, Inc. (Æ) | | | 251 | | | | 17 | |
HeartWare International, Inc. (Æ) | | | 400 | | | | 26 | |
Impax Laboratories, Inc. (Æ) | | | 1,374 | | | | 34 | |
Incyte Corp., Ltd. (Æ) | | | 1,840 | | | | 36 | |
Insulet Corp. (Æ) | | | 1,473 | | | | 28 | |
ISTA Pharmaceuticals, Inc. (Æ) | | | 3,932 | | | | 35 | |
Jazz Pharmaceuticals PLC (Æ) | | | 708 | | | | 34 | |
Luminex Corp. (Æ) | | | 1,279 | | | | 30 | |
MAKO Surgical Corp. (Æ) | | | 1,082 | | | | 46 | |
Medicis Pharmaceutical Corp. Class A | | | 450 | | | | 17 | |
Medidata Solutions, Inc. (Æ) | | | 659 | | | | 18 | |
Merge Healthcare, Inc. (Æ) | | | 5,713 | | | | 33 | |
Momenta Pharmaceuticals, Inc. (Æ) | | | 825 | | | | 13 | |
Neurocrine Biosciences, Inc. (Æ) | | | 1,739 | | | | 14 | |
NxStage Medical, Inc. (Æ) | | | 1,559 | | | | 30 | |
Omnicell, Inc. (Æ) | | | 1,680 | | | | 26 | |
Opko Health, Inc. (Æ) | | | 5,536 | | | | 26 | |
Orexigen Therapeutics, Inc. (Æ) | | | 9,106 | | | | 37 | |
PAREXEL International Corp. (Æ) | | | 1,336 | | | | 36 | |
PDL BioPharma, Inc. | | | 2,414 | | | | 15 | |
Regeneron Pharmaceuticals, Inc. (Æ) | | | 493 | | | | 57 | |
Rigel Pharmaceuticals, Inc. (Æ) | | | 3,499 | | | | 28 | |
Select Medical Holdings Corp. (Æ) | | | 1,767 | | | | 14 | |
Spectrum Pharmaceuticals, Inc. (Æ) | | | 1,898 | | | | 24 | |
SXC Health Solutions Corp. (Æ) | | | 489 | | | | 37 | |
Transcept Pharmaceuticals, Inc. (Æ) | | | 1,894 | | | | 20 | |
Volcano Corp. (Æ) | | | 1,165 | | | | 33 | |
Zoll Medical Corp. (Æ) | | | 437 | | | | 40 | |
| | | | | | | | |
| | | | | | | 1,451 | |
| | | | | | | | |
| | |
| Materials and Processing - 5.4% | | | | | | | | |
Allied Nevada Gold Corp. (Æ) | | | 896 | | | | 29 | |
American Vanguard Corp. | | | 1,108 | | | | 24 | |
Beacon Roofing Supply, Inc. (Æ) | | | 731 | | | | 19 | |
Cabot Microelectronics Corp. | | | 575 | | | | 22 | |
Calgon Carbon Corp. (Æ) | | | 944 | | | | 15 | |
Carpenter Technology Corp. | | | 539 | | | | 28 | |
Haynes International, Inc. | | | 274 | | | | 17 | |
Jaguar Mining, Inc. (Æ) | | | 4,348 | | | | 20 | |
NCI Building Systems, Inc. (Æ) | | | 1,360 | | | | 16 | |
Polypore International, Inc. (Æ) | | | 615 | | | | 22 | |
Royal Gold, Inc. | | | 410 | | | | 27 | |
Titanium Metals Corp. | | | 999 | | | | 14 | |
Tredegar Corp. | | | 1,248 | | | | 24 | |
Trex Co., Inc. (Æ) | | | 1,210 | | | | 39 | |
Universal Stainless & Alloy (Æ) | | | 401 | | | | 17 | |
| | | | | | | | |
| | | Principal
Amount ($)
or Shares | | | Market
Value
$ | |
Valspar Corp. | | | 380 | | | | 18 | |
| | | | | | | | |
| | | | | | | 351 | |
| | | | | | | | |
| | |
| Producer Durables - 13.5% | | | | | | | | |
ACCO Brands Corp. (Æ) | | | 1,533 | | | | 19 | |
Advisory Board Co. (The) (Æ) | | | 372 | | | | 33 | |
Allegiant Travel Co. Class A (Æ) | | | 277 | | | | 15 | |
Barnes Group, Inc. | | | 613 | | | | 16 | |
BE Aerospace, Inc. (Æ) | | | 380 | | | | 18 | |
Blount International, Inc. (Æ) | | | 1,018 | | | | 17 | |
Carlisle Cos., Inc. | | | 334 | | | | 17 | |
Colfax Corp. (Æ) | | | 969 | | | | 34 | |
Copa Holdings SA Class A | | | 252 | | | | 20 | |
DXP Enterprises, Inc. (Æ) | | | 857 | | | | 36 | |
Dycom Industries, Inc. (Æ) | | | 707 | | | | 17 | |
ExlService Holdings, Inc. (Æ) | | | 663 | | | | 18 | |
FARO Technologies, Inc. (Æ) | | | 600 | | | | 35 | |
Forward Air Corp. | | | 461 | | | | 17 | |
Franklin Electric Co., Inc. | | | 338 | | | | 17 | |
FTI Consulting, Inc. (Æ) | | | 353 | | | | 13 | |
GenCorp, Inc. (Æ) | | | 5,101 | | | | 35 | |
Graco, Inc. | | | 361 | | | | 19 | |
Insperity, Inc. | | | 583 | | | | 18 | |
Lincoln Electric Holdings, Inc. | | | 379 | | | | 17 | |
Liquidity Services, Inc. (Æ) | | | 748 | | | | 34 | |
LoopNet, Inc. (Æ) | | | 1,487 | | | | 28 | |
MasTec, Inc. (Æ) | | | 861 | | | | 16 | |
Maxwell Technologies, Inc. (Æ) | | | 1,699 | | | | 31 | |
Measurement Specialties, Inc. (Æ) | | | 526 | | | | 18 | |
National Instruments Corp. | | | 1,069 | | | | 30 | |
Nordson Corp. | | | 359 | | | | 20 | |
Old Dominion Freight Line, Inc. (Æ) | | | 365 | | | | 17 | |
OSI Systems, Inc. (Æ) | | | 569 | | | | 35 | |
Raven Industries, Inc. | | | 242 | | | | 15 | |
Robert Half International, Inc. | | | 526 | | | | 16 | |
Rush Enterprises, Inc. Class A (Æ) | | | 707 | | | | 15 | |
Ryder System, Inc. | | | 282 | | | | 15 | |
Spirit Aerosystems Holdings, Inc. Class A (Æ) | | | 713 | | | | 17 | |
Team, Inc. (Æ) | | | 503 | | | | 16 | |
Tennant Co. | | | 382 | | | | 17 | |
Titan International, Inc. | | | 1,418 | | | | 34 | |
Titan Machinery, Inc. (Æ) | | | 680 | | | | 19 | |
Toro Co. (The) | | | 243 | | | | 17 | |
Triumph Group, Inc. | | | 252 | | | | 16 | |
Zebra Technologies Corp. Class A (Æ) | | | 414 | | | | 17 | |
| | | | | | | | |
| | | | | | | 874 | |
| | | | | | | | |
| | |
| Technology - 25.2% | | | | | | | | |
3D Systems Corp. (Æ) | | | 1,020 | | | | 24 | |
AboveNet, Inc. (Æ) | | | 230 | | | | 19 | |
Acacia Research Corp. (Æ) | | | 760 | | | | 32 | |
ACI Worldwide, Inc. (Æ) | | | 516 | | | | 21 | |
Acme Packet, Inc. (Æ) | | | 480 | | | | 13 | |
Anixter International, Inc. (Æ) | | | 248 | | | | 18 | |
Ariba, Inc. (Æ) | | | 988 | | | | 32 | |
Cadence Design Systems, Inc. (Æ) | | | 2,666 | | | | 32 | |
| | | | |
| | 84 | | | Russell Small Cap Aggressive Growth ETF |
Russell Exchange Traded Funds Trust
Russell Small Cap Aggressive Growth ETF
Schedule of Investments, continued — March 31, 2012
Amounts in thousands (except share amounts)
| | | | | | | | |
| | | Principal
Amount ($)
or Shares | | | Market
Value
$ | |
| | | | | | | | |
Cavium, Inc. (Æ) | | | 520 | | | | 16 | |
Ciena Corp. (Æ) | | | 2,280 | | | | 37 | |
Cirrus Logic, Inc. (Æ) | | | 931 | | | | 22 | |
Cognex Corp. | | | 413 | | | | 17 | |
Coherent, Inc. (Æ) | | | 283 | | | | 17 | |
CommVault Systems, Inc. (Æ) | | | 646 | | | | 32 | |
comScore, Inc. (Æ) | | | 1,308 | | | | 28 | |
Concur Technologies, Inc. (Æ) | | | 546 | | | | 31 | |
DealerTrack Holdings, Inc. (Æ) | | | 544 | | | | 16 | |
Equinix, Inc. (Æ) | | | 272 | | | | 44 | |
Extreme Networks (Æ) | | | 5,118 | | | | 20 | |
GSI Group, Inc. (Æ) | | | 1,445 | | | | 17 | |
IAC/InterActiveCorp | | | 637 | | | | 31 | |
iGate Corp. (Æ) | | | 940 | | | | 16 | |
Interactive Intelligence Group, Inc. (Æ) | | | 643 | | | | 20 | |
InterDigital, Inc. | | | 635 | | | | 22 | |
IPG Photonics Corp. (Æ) | | | 432 | | | | 22 | |
JDA Software Group, Inc. (Æ) | | | 840 | | | | 23 | |
Keynote Systems, Inc. | | | 1,324 | | | | 26 | |
Kulicke & Soffa Industries, Inc. (Æ) | | | 2,984 | | | | 38 | |
LivePerson, Inc. (Æ) | | | 2,209 | | | | 37 | |
LogMeIn, Inc. (Æ) | | | 720 | | | | 25 | |
LSI Corp. (Æ) | | | 2,469 | | | | 21 | |
MicroStrategy, Inc. Class A (Æ) | | | 251 | | | | 35 | |
MKS Instruments, Inc. | | | 531 | | | | 16 | |
Monolithic Power Systems, Inc. (Æ) | | | 991 | | | | 19 | |
NCR Corp. (Æ) | | | 898 | | | | 19 | |
NetSuite, Inc. (Æ) | | | 684 | | | | 34 | |
NeuStar, Inc. Class A (Æ) | | | 433 | | | | 16 | |
OpenTable, Inc. (Æ) | | | 376 | | | | 15 | |
Opnet Technologies, Inc. | | | 741 | | | | 21 | |
Parametric Technology Corp. (Æ) | | | 804 | | | | 22 | |
Pegasystems, Inc. | | | 923 | | | | 35 | |
Polycom, Inc. (Æ) | | | 906 | | | | 17 | |
Power Integrations, Inc. | | | 444 | | | | 16 | |
Rackspace Hosting, Inc. (Æ) | | | 644 | | | | 38 | |
RealPage, Inc. (Æ) | | | 1,074 | | | | 21 | |
Riverbed Technology, Inc. (Æ) | | | 1,175 | | | | 33 | |
Sapient Corp. | | | 2,154 | | | | 27 | |
ShoreTel, Inc. (Æ) | | | 4,243 | | | | 24 | |
Silicon Graphics International Corp. (Æ) | | | 2,361 | | | | 23 | |
Silicon Laboratories, Inc. (Æ) | | | 639 | | | | 27 | |
SolarWinds, Inc. (Æ) | | | 987 | | | | 39 | |
Solera Holdings, Inc. | | | 333 | | | | 15 | |
Sonus Networks, Inc. (Æ) | | | 6,226 | | | | 18 | |
Stratasys, Inc. (Æ) | | | 485 | | | | 18 | |
Super Micro Computer, Inc. (Æ) | | | 1,761 | | | | 31 | |
Synchronoss Technologies, Inc. (Æ) | | | 899 | | | | 29 | |
Take-Two Interactive Software, Inc. (Æ) | | | 2,038 | | | | 31 | |
TIBCO Software, Inc. (Æ) | | | 1,159 | | | | 35 | |
TNS, Inc. (Æ) | | | 836 | | | | 18 | |
Ultimate Software Group, Inc. (Æ) | | | 417 | | | | 31 | |
VeriFone Systems, Inc. (Æ) | | | 416 | | | | 22 | |
VirnetX Holding Corp. (Æ) | | | 1,087 | | | | 26 | |
Vocus, Inc. (Æ) | | | 671 | | | | 9 | |
| | | | | | | | |
| | | Principal
Amount ($)
or Shares | | | Market
Value
$ | |
Volterra Semiconductor Corp. (Æ) | | | 1,082 | | | | 38 | |
Web.com Group, Inc. (Æ) | | | 2,421 | | | | 35 | |
Websense, Inc. (Æ) | | | 803 | | | | 17 | |
| | | | | | | | |
| | | | | | | 1,639 | |
| | | | | | | | |
| | |
| Utilities - 2.3% | | | | | | | | |
8x8, Inc. (Æ) | | | 8,701 | | | | 37 | |
Cincinnati Bell, Inc. (Æ) | | | 4,873 | | | | 20 | |
Cogent Communications Group, Inc. (Æ) | | | 1,642 | | | | 31 | |
Towerstream Corp. (Æ) | | | 13,145 | | | | 62 | |
| | | | | | | | |
| | | | | | | 150 | |
| | | | | | | | |
| | |
Total Common Stocks
(cost $5,747) | | | | | | | 6,474 | |
| | | | | | | | |
| | |
| Short-Term Investments - 0.3% | | | | | | | | |
Russell U.S. Cash Management Fund | | | 19,684 | (¥) | | | 20 | |
| | | | | | | | |
| | |
Total Short-Term Investments
(cost $20) | | | | | | | 20 | |
| | | | | | | | |
| | |
Total Investments - 100.0%
(identified cost $5,767) | | | | | | | 6,494 | |
| | |
Other Assets and Liabilities,
Net - (0.0%) | | | | | | | (2 | ) |
| | | | | | | | |
| | |
| Net Assets - 100.0% | | | | | | | 6,492 | |
| | | | | | | | |
See accompanying notes which are an integral part of the financial statements.
| | |
| Russell Small Cap Aggressive Growth ETF | | 85 |
Russell Exchange Traded Funds Trust
Russell Small Cap Aggressive Growth ETF
Presentation of Portfolio Holdings — March 31, 2012
Amounts in thousands
| | | | | | | | | | | | | | | | | | | | |
| | | Market Value | | | % of Net
Assets | |
| Portfolio Summary | | Level 1 | | | Level 2 | | | Level 3 | | | Total | | |
| | | | | | | | | | | | | | | | | | | | |
Common Stocks | | | | | | | | | | | | | | | | | | | | |
Consumer Discretionary | | $ | 862 | | | $ | — | | | $ | — | | | $ | 862 | | | | 13.3 | |
Consumer Staples | | | 67 | | | | — | | | | — | | | | 67 | | | | 1.0 | |
Energy | | | 735 | | | | — | | | | — | | | | 735 | | | | 11.3 | |
Financial Services | | | 330 | | | | — | | | | 15 | | | | 345 | | | | 5.3 | |
Health Care | | | 1,451 | | | | — | | | | — | | | | 1,451 | | | | 22.4 | |
Materials and Processing | | | 351 | | | | — | | | | — | | | | 351 | | | | 5.4 | |
Producer Durables | | | 874 | | | | — | | | | — | | | | 874 | | | | 13.5 | |
Technology | | | 1,639 | | | | — | | | | — | | | | 1,639 | | | | 25.2 | |
Utilities | | | 150 | | | | — | | | | — | | | | 150 | | | | 2.3 | |
Short-Term Investments | | | — | | | | 20 | | | | — | | | | 20 | | | | 0.3 | |
| | | | | | | | | | | | | | | | | | | | |
| | | | | |
Total Investments | | | 6,459 | | | | 20 | | | | 15 | | | | 6,494 | | | | 100.0 | |
| | | | | | | | | | | | | | | | | | | | |
Other Assets and Liabilities, Net | | | | | | | | | | | | | | | | | | | (— | )* |
| | | | | | | | | | | | | | | | | | | | |
| | | | | |
| | | | | | | | | | | | | | | | | | | 100.0 | |
| | | | | | | | | | | | | | | | | | | | |
| * | Less than .05% of net assets. |
For a description of the levels see note 2 in the Notes to Financial Statements.
Investments in which significant unobservable inputs (Level 3) were used in determining a value for the period ending March 31, 2012 were less than 1% of net assets.
There were no significant transfers in and out of levels 1, 2 and 3 during the period ending March 31, 2012.
See accompanying notes which are an integral part of the financial statements.
| | | | |
| | 86 | | | Russell Small Cap Aggressive Growth ETF |
Russell Exchange Traded Funds Trust
Russell Small Cap Aggressive Growth ETF
Statement of Assets and Liabilities — March 31, 2012
| | | | |
| Amounts in thousands | | Russell Small
Cap Aggressive
Growth ETF | |
| | | | |
Assets | | | | |
Investments, at identified cost | | $ | 5,767 | |
Investments, at market* | | | 6,494 | |
| | | | |
Total assets | | | 6,494 | |
| | | | |
| |
Liabilities | | | | |
Payables: | | | | |
Accrued fees to affiliates | | | 2 | |
| | | | |
Total liabilities | | | 2 | |
| | | | |
| | | | |
Net Assets | | $ | 6,492 | |
| | | | |
Net Assets Consist of: | | | | |
Undistributed (overdistributed) net investment income | | $ | 1 | |
Accumulated net realized gain (loss) | | | (142 | ) |
Unrealized appreciation (depreciation) on investments | | | 727 | |
Additional paid-in capital | | | 5,906 | |
| | | | |
Net Assets | | $ | 6,492 | |
| | | | |
Net Asset Value, offering and redemption price per share: | | | | |
Net asset value per share:(a) | | $ | 64.92 | |
Net assets | | $ | 6,491,795 | |
Shares outstanding ($.001 par value) | | | 100,002 | |
Amounts in Thousands | | | | |
| | | | |
* Investments in Affiliates, Russell U.S. Cash Management Fund | | $ | 20 | |
| (a) | Net asset value per share equals net assets divided by shares outstanding. |
See accompanying notes which are an integral part of the financial statements.
| | |
| Statements of Assets and Liabilities | | 87 |
Russell Exchange Traded Funds Trust
Russell Small Cap Aggressive Growth ETF
Statement of Operations — For the Period Ended March 31, 2012
| | | | |
| Amounts in thousands | | Russell Small
Cap Aggressive
Growth ETF* | |
| | | | |
Investment Income | | | | |
Dividends | | $ | 17 | |
| | | | |
Total investment income | | | 17 | |
| | | | |
| |
Expenses | | | | |
Management fees | | | 13 | |
Trustee and trustee related fees | | | 8 | |
| | | | |
Expenses before reductions | | | 21 | |
Expense reductions | | | (8 | ) |
| | | | |
Net expenses | | | 13 | |
| | | | |
Net investment income (loss) | | | 4 | |
| | | | |
| |
Net Realized and Unrealized Gain (Loss) | | | | |
Net realized gain (loss) on: | | | | |
Investments | | | (142 | ) |
In-kind redemptions | | | 1,226 | |
| | | | |
Net realized gain (loss) | | | 1,084 | |
| | | | |
Net change in unrealized appreciation (depreciation) on investments | | | 727 | |
| | | | |
Net realized and unrealized gain (loss) | | | 1,811 | |
| | | | |
Net Increase (Decrease) in Net Assets from Operations | | $ | 1,815 | |
| | | | |
| * | For the period October 4, 2011 (commencement of operations) to March 31, 2012. |
See accompanying notes which are an integral part of the financial statements.
| | | | |
| | 88 | | | Statements of Operations |
Russell Exchange Traded Funds Trust
Russell Small Cap Aggressive Growth ETF
Statement of Changes in Net Assets — For the Periods Ended March 31,
| | | | |
| | | Russell Small
Cap Aggressive
Growth ETF | |
| Amounts in thousands | | 2012* | |
| | | | |
Increase (Decrease) in Net Assets | | | | |
| |
Operations | | | | |
Net investment income (loss) | | $ | 4 | |
Net realized gain (loss) | | | 1,084 | |
Net change in unrealized appreciation (depreciation) | | | 727 | |
| | | | |
Net increase (decrease) in net assets from operations | | | 1,815 | |
| | | | |
| |
Distributions | | | | |
From net investment income | | | (3 | ) |
| | | | |
Net decrease in net assets from distributions | | | (3 | ) |
| | | | |
| |
Share Transactions | | | | |
Net increase (decrease) in net assets from share transactions | | | 4,680 | |
| | | | |
Total Net Increase (Decrease) in Net Assets | | | 6,492 | |
| |
Net Assets | | | | |
Beginning of period | | | — | |
| | | | |
End of period | | $ | 6,492 | |
| | | | |
Undistributed (overdistributed) net investment income included in net assets | | $ | 1 | |
| * | For the period October 4, 2011 (commencement of operations) to March 31, 2012. |
See accompanying notes which are an integral part of the financial statements.
| | |
| Statements of Changes in Net Assets | | 89 |
Russell Exchange Traded Funds Trust
Russell Small Cap Aggressive Growth ETF
Financial Highlights — For the Period Ended
For a Share Outstanding Throughout Each Period.
| | | | | | | | | | | | | | | | | | | | | | | | |
| | | | | | |
| | | $
Net Asset Value,
Beginning of
Period | | | $
Net
Investment
Income (Loss)(a) | | | $
Net Realized
and Unrealized
Gain (Loss) | | | $
Total from
Investment
Operations | | | $
Distributions
from Net
Investment Income | | | $
Total
Distributions | |
Russell Small Cap Aggressive Growth ETF | | | | | | | | | | | | | |
March 31, 2012* | | | 47.22 | | | | .04 | | | | 17.68 | | | | 17.72 | | | | (.02 | ) | | | (.02 | ) |
| (a) | Average daily shares outstanding were used for this calculation. |
| (b) | Periods less than one year are not annualized. |
| (c) | The ratios for periods less than one year are annualized. |
| (d) | Portfolio turnover rate excludes securities received or delivered from in-kind creation or redemption units. |
| * | For the period October 4, 2011 (commencement of operations) to March 31, 2012. |
See accompanying notes which are an integral part of the financial statements.
| | | | | | | | | | | | | | | | | | | | | | | | | | |
$
Net Asset Value,
End of
Period | | | %
Total
Return(b) | | | $
Net Assets,
End of Period
(000) | | | %
Ratio of Expenses
to Average
Net Assets,
Gross(c) | | | %
Ratio of Expenses
to Average
Net Assets,
Net(c) | | | %
Ratio of Net
Investment Income
to Average
Net Assets(c) | | | % Portfolio
Turnover Rate(b)(d) | |
| | | | | | | | | | | | | | | | | | | | | | | | | | |
| | 64.92 | | | | 37.52 | | | | 6,492 | | | | .72 | | | | .45 | | | | .13 | | | | 35 | |
See accompanying notes which are an integral part of the financial statements.
Russell Exchange Traded Funds Trust
Russell Small Cap Consistent Growth ETF
Portfolio Management Discussion and Analysis — March 31, 2012 (Unaudited)
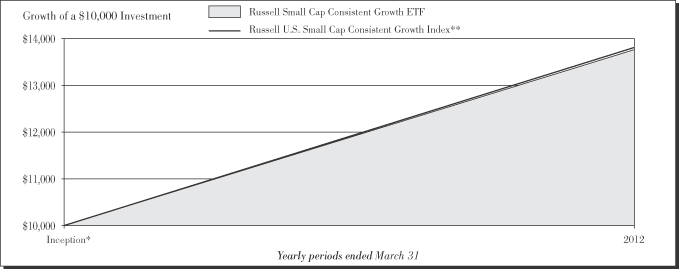
Performance as of March 31, 2012
| | | | | | | | | | | | |
| | |
| Average Annual Total Return | | | | | | | |
| | | Net Asset
Value | | | Market Value | | | Russell U.S.
Small Cap
Consistent
Growth Index** | |
Inception* | | | 37.62 | % | | | 37.68 | % | | | 38.11 | % |
| | | | |
| | 92 | | | Russell Small Cap Consistent Growth ETF |
Russell Exchange Traded Funds Trust
Russell Small Cap Consistent Growth ETF
Portfolio Management Discussion and Analysis — March 31, 2012 (Unaudited)
The Russell Small Cap Consistent Growth ETF (the “Fund”) is an index-based exchange-traded fund that seeks investment results that closely correspond to the total return of the Russell U.S. Small Cap Consistent Growth Index (the “Index”). Russell Investment Management Company (“RIMCo”), as the Fund’s advisor, uses a “passive” or indexing approach to try to achieve the Fund’s investment objective. Unlike many investment companies, the Fund does not try to “beat” the Index it tracks and does not seek temporary defensive positions when markets decline or appear overvalued. The Fund will normally invest at least 80% of its total assets in securities that comprise the Index.
What is the Fund’s investment objective?
The Fund seeks investment results that closely correspond to the total return of the Russell U.S. Small Cap Consistent Growth Index, which is designed to select securities intended to produce performance that is similar to professional investment managers using a small cap consistent growth investment discipline.
Is the Fund replicating or sampling?
The Fund is replicating.
How did the Fund perform relative to its benchmark for the fiscal year ended March 31, 2012?
For the fiscal year ended March 31, 2012, the Fund gained 37.62%. This is compared to the Fund’s benchmark, the Russell U.S. Small Cap Consistent Growth Index, which gained 38.11% during the same period. The Fund’s performance includes operating expenses, whereas indexes are unmanaged and index returns do not include expenses of any kind.
There were no significant changes to either the Fund or Index during the reporting period.
Did the Fund outperform or underperform the benchmark or was performance as expected based on expenses, etc.?
The Fund performed as expected against the benchmark.
Over the reporting period, please describe those sectors that outperformed or underperformed.
Sectors achieved both positive and negative returns for the Fund and the Index. Energy was the best performing sector for the Fund and the Index, while utilities was the worst performing sector. Producer durables, with an average weight of 22.5% was the best contributor to Fund and Index returns. Utilities, with an average weight of 0.7%, was the worst contributor to Fund and Index returns.
Over the reporting period, please describe those individual securities (constituents) that outperformed or underperformed.
Zoll Medical Corp, Zumiez Inc, and Stratasys Inc generated positive returns and contributed the most to Fund performance while Diamond Foods Inc, Superior Energy Services Inc, and CARBO Ceramics Inc, all declined which detracted from Fund performance.
The views expressed in this report reflect those of the portfolio managers only through the end of the period covered by the report. These views do not necessarily represent the views of RIMCo, or any other person in RIMCo or any other affiliated organization. These views are subject to change at any time based upon market conditions or other events, and RIMCo disclaims any responsibility to update the views contained herein. These views should not be relied on as investment advice and, because investment decisions for a Russell Exchange Traded Funds Trust (“RET”) Fund are based on numerous factors, should not be relied on as an indication of investment decisions of any RET Fund.
| * | | Commenced operations by issuing shares October 4, 2011. |
| ** | | The Russell U.S. Small Cap Consistent Growth Index is designed to select securities intended to produce performance that is similar to professional investment managers using a small cap consistent growth investment discipline. This discipline focuses on companies with above average earnings expectations over a long term horizon and with consistent historical earnings growth. Starting with the Russell 2500® Index (an index comprised of U.S. stocks), the Index includes stocks that demonstrate growth potential as measured by: (1) average to high consensus forecasted earnings and (2) consistent earnings as measured by average to low earnings per share volatility over the past five years. The Index excludes stocks with low anticipated growth prospects as measured by a low price to book ratio, low price to cash flow and low price to sales. The Index constituents are weighted based on a composite score of their growth and quality characteristics. The Index is reconstituted quarterly. |
Performance is historical and assumes reinvestment of all dividends and capital gains. Investment return and principal value will fluctuate so that an investor’s shares, when redeemed, may be worth more or less than when purchased. Past performance is not indicative of future results. The returns shown do not reflect the deduction of taxes that a shareholder would pay on Fund distributions or the redemption of Fund shares.
| | |
| Russell Small Cap Consistent Growth ETF | | 93 |
Russell Exchange Traded Funds Trust
Russell Small Cap Consistent Growth ETF
Shareholder Expense Example — March 31, 2012 (Unaudited)
Fund Expenses
The following disclosure provides important information regarding each Fund’s Expense Example, which appears on each Fund’s individual page in this Annual Report. Please refer to this information when reviewing the Expense Example for a Fund.
Example
As a shareholder of the Fund, you incur two types of costs: (1) transaction costs, including brokerage commissions on purchases and sales of your Fund shares and (2) ongoing costs, including management fees and other Fund expenses. The Example is intended to help you understand your ongoing costs (in dollars) of investing in the Fund and to compare these costs with the ongoing costs of investing in other funds. The Example is based on an investment of $1,000 invested at the beginning of the period and held for the entire period indicated, which for this Fund is from October 4, 2011 (commencement of operations) to March 31, 2012.
Actual Expenses
The information in the table under the heading “Actual Performance” provides information about actual account values and actual expenses. You may use the information in this column, together with the amount you invested, to estimate the expenses that you paid over the period. Simply divide your account value by $1,000 (for example, an $8,600 account value divided by $1,000 = 8.6), then multiply the result by the number in the first column in the row entitled “Expenses Paid During Period” to estimate the expenses you paid on your account during this period.
Hypothetical Example for Comparison Purposes
The information in the table under the heading “Hypothetical Performance (5% return before expenses)” provides information about hypothetical account values and hypothetical expenses based on the Fund’s actual expense ratio and an assumed rate of return of 5% per year before expenses, which is not the Fund’s actual return. The hypothetical account values and expenses may not be used to estimate the actual ending account balance or expenses you paid for the period. You may use this information to compare the ongoing costs of investing in the Fund and other funds. To do so, compare this 5% hypothetical example with the 5% hypothetical examples that appear in the shareholder reports of other funds.
Please note that the expenses shown in the table are meant to highlight your ongoing costs only and do not reflect any transactional costs, such as brokerage commissions paid on purchases and sales of Fund shares. Therefore, the information under the heading “Hypothetical Performance (5% return before expenses)” is useful in comparing ongoing costs only, and will not help you determine the relative total costs of owning different funds. In addition, if these transactional costs were included, your costs would have been higher.
| | | | | | | | |
| | | Actual
Performance | | | Hypothetical
Performance
(5% return
before expenses) | |
| | | | | | | | |
Beginning Account Value October 4, 2011 | | $ | 1,000.00 | | | $ | 1,000.00 | |
Ending Account Value March 31, 2012 | | $ | 1,376.20 | | | $ | 1,022.75 | |
Expenses Paid During Period* | | $ | 2.63 | | | $ | 2.28 | |
| * | Actual expenses are equal to the Fund’s annualized expense ratio of 0.45% (representing the 180-day period annualized), multiplied by the average account value over the period, multiplied by 180/366 (to reflect the period since commencement of operations). Hypothetical expenses are equal to the Fund’s annualized expense ratio of 0.45% (representing the six month period annualized) multiplied by the average amount value over the period, multiplied by 183/366 (to reflect the one-half year period). |
| | | | |
| | 94 | | | Russell Small Cap Consistent Growth ETF |
Russell Exchange Traded Funds Trust
Russell Small Cap Consistent Growth ETF
Schedule of Investments — March 31, 2012
Amounts in thousands (except share amounts)
| | | | | | | | |
| | | Principal
Amount ($)
or Shares | | | Market
Value
$ | |
| | | | | | | | |
| Common Stocks - 99.7% | | | | | | | | |
| Consumer Discretionary - 22.5% | | | | | | | | |
Aaron’s, Inc. Class A | | | 561 | | | | 15 | |
American Public Education, Inc. (Æ) | | | 650 | | | | 25 | |
Ancestry.com, Inc. (Æ) | | | 1,227 | | | | 28 | |
Arbitron, Inc. | | | 820 | | | | 30 | |
Ascena Retail Group, Inc. (Æ) | | | 948 | | | | 43 | |
Bally Technologies, Inc. (Æ) | | | 715 | | | | 33 | |
Bebe Stores, Inc. | | | 3,391 | | | | 31 | |
BJ’s Restaurants, Inc. (Æ) | | | 621 | | | | 31 | |
Blue Nile, Inc. (Æ) | | | 691 | | | | 23 | |
Body Central Corp. (Æ) | | | 1,134 | | | | 33 | |
Brinker International, Inc. | | | 559 | | | | 15 | |
Buckle, Inc. (The) | | | 366 | | | | 18 | |
Buffalo Wild Wings, Inc. (Æ) | | | 419 | | | | 38 | |
Capella Education Co. (Æ) | | | 427 | | | | 15 | |
Carter’s, Inc. (Æ) | | | 376 | | | | 19 | |
Chico’s FAS, Inc. | | | 2,535 | | | | 38 | |
Children’s Place Retail Stores, Inc. (The) (Æ) | | | 282 | | | | 15 | |
Columbia Sportswear Co. | | | 607 | | | | 29 | |
Crocs, Inc. (Æ) | | | 1,907 | | | | 40 | |
DeVry, Inc. | | | 389 | | | | 13 | |
Dorman Products, Inc. (Æ) | | | 764 | | | | 39 | |
Drew Industries, Inc. (Æ) | | | 610 | | | | 17 | |
Education Management Corp. (Æ) | | | 535 | | | | 7 | |
Ethan Allen Interiors, Inc. | | | 649 | | | | 16 | |
Grand Canyon Education, Inc. (Æ) | | | 1,767 | | | | 31 | |
Guess?, Inc. | | | 502 | | | | 16 | |
HealthStream, Inc. (Æ) | | | 1,543 | | | | 36 | |
Hibbett Sports, Inc. (Æ) | | | 624 | | | | 34 | |
Inter Parfums, Inc. | | | 961 | | | | 15 | |
Interval Leisure Group, Inc. | | | 1,099 | | | | 19 | |
JOS A Bank Clothiers, Inc. (Æ) | | | 578 | | | | 29 | |
K12, Inc. (Æ) | | | 1,572 | | | | 37 | |
Life Time Fitness, Inc. (Æ) | | | 320 | | | | 16 | |
Lumber Liquidators Holdings, Inc. (Æ) | | | 1,597 | | | | 40 | |
Madison Square Garden Co. (The) Class A (Æ) | | | 523 | | | | 18 | |
Maidenform Brands, Inc. (Æ) | | | 818 | | | | 18 | |
Matthews International Corp. Class A | | | 476 | | | | 15 | |
Monro Muffler Brake, Inc. | | | 727 | | | | 30 | |
Nu Skin Enterprises, Inc. Class A | | | 580 | | | | 34 | |
Papa John’s International, Inc. (Æ) | | | 397 | | | | 15 | |
Rue21, Inc. (Æ) | | | 1,307 | | | | 38 | |
Stamps.com, Inc. (Æ) | | | 1,079 | | | | 30 | |
Steiner Leisure, Ltd. (Æ) | | | 330 | | | | 16 | |
Steven Madden, Ltd. (Æ) | | | 818 | | | | 35 | |
Sturm Ruger & Co., Inc. | | | 843 | | | | 41 | |
Texas Roadhouse, Inc. Class A | | | 1,004 | | | | 17 | |
True Religion Apparel, Inc. (Æ) | | | 816 | | | | 22 | |
Under Armour, Inc. Class A (Æ) | | | 393 | | | | 37 | |
Vera Bradley, Inc. (Æ) | | | 875 | | | | 26 | |
VistaPrint NV (Æ) | | | 922 | | | | 36 | |
Vitamin Shoppe, Inc. (Æ) | | | 705 | | | | 31 | |
Warnaco Group, Inc. (The) (Æ) | | | 307 | | | | 18 | |
WMS Industries, Inc. (Æ) | | | 750 | | | | 18 | |
| | | | | | | | |
| | | Principal
Amount ($)
or Shares | | | Market
Value
$ | |
Wolverine World Wide, Inc. | | | 420 | | | | 16 | |
Zagg, Inc. (Æ) | | | 3,988 | | | | 43 | |
Zumiez, Inc. (Æ) | | | 1,016 | | | | 37 | |
| | | | | | | | |
| | | | | | | 1,475 | |
| | | | | | | | |
| | |
| Consumer Staples - 3.5% | | | | | | | | |
Diamond Foods, Inc. | | | 464 | | | | 11 | |
Fresh Market, Inc. (The) (Æ) | | | 709 | | | | 34 | |
Hain Celestial Group, Inc. (The) (Æ) | | | 420 | | | | 18 | |
J&J Snack Foods Corp. | | | 280 | | | | 15 | |
Lancaster Colony Corp. | | | 216 | | | | 14 | |
Medifast, Inc. (Æ) | | | 2,055 | | | | 35 | |
Peet’s Coffee & Tea, Inc. (Æ) | | | 449 | | | | 33 | |
TreeHouse Foods, Inc. (Æ) | | | 229 | | | | 14 | |
USANA Health Sciences, Inc. (Æ) | | | 929 | | | | 35 | |
WD-40 Co. | | | 370 | | | | 17 | |
| | | | | | | | |
| | | | | | | 226 | |
| | | | | | | | |
| | |
| Energy - 5.8% | | | | | | | | |
Ameresco, Inc. Class A (Æ) | | | 2,059 | | | | 28 | |
Atwood Oceanics, Inc. (Æ) | | | 709 | | | | 32 | |
Berry Petroleum Co. Class A | | | 670 | | | | 32 | |
CARBO Ceramics, Inc. | | | 229 | | | | 24 | |
Dril-Quip, Inc. (Æ) | | | 429 | | | | 28 | |
GeoResources, Inc. (Æ) | | | 964 | | | | 32 | |
Key Energy Services, Inc. (Æ) | | | 967 | | | | 15 | |
Lufkin Industries, Inc. | | | 419 | | | | 34 | |
Mitcham Industries, Inc. (Æ) | | | 685 | | | | 15 | |
Newpark Resources, Inc. (Æ) | | | 2,999 | | | | 25 | |
OYO Geospace Corp. (Æ) | | | 194 | | | | 20 | |
RPC, Inc. | | | 2,341 | | | | 25 | |
Superior Energy Services, Inc. (Æ) | | | 1,788 | | | | 46 | |
Vaalco Energy, Inc. (Æ) | | | 2,541 | | | | 24 | |
| | | | | | | | |
| | | | | | | 380 | |
| | | | | | | | |
| | |
| Financial Services - 9.2% | | | | | | | | |
Advent Software, Inc. (Æ) | | | 1,159 | | | | 30 | |
Amtrust Financial Services, Inc. | | | 648 | | | | 17 | |
Brown & Brown, Inc. | | | 661 | | | | 16 | |
CBOE Holdings, Inc. | | | 578 | | | | 16 | |
Credit Acceptance Corp. (Æ) | | | 343 | | | | 35 | |
Duff & Phelps Corp. Class A | | | 1,953 | | | | 30 | |
eHealth, Inc. (Æ) | | | 1,018 | | | | 17 | |
Encore Capital Group, Inc. (Æ) | | | 1,327 | | | | 30 | |
Extra Space Storage, Inc. (ö) | | | 1,164 | | | | 34 | |
Ezcorp, Inc. Class A (Æ) | | | 1,071 | | | | 35 | |
Fair Isaac Corp. | | | 790 | | | | 35 | |
First Cash Financial Services, Inc. (Æ) | | | 804 | | | | 34 | |
FleetCor Technologies, Inc. (Æ) | | | 945 | | | | 36 | |
Green Dot Corp. Class A (Æ) | | | 905 | | | | 24 | |
Greenhill & Co., Inc. | | | 423 | | | | 18 | |
Higher One Holdings, Inc. (Æ) | | | 1,531 | | | | 23 | |
Jones Lang LaSalle, Inc. | | | 251 | | | | 21 | |
Morningstar, Inc. | | | 475 | | | | 30 | |
Netspend Holdings, Inc. (Æ) | | | 3,482 | | | | 27 | |
Texas Capital Bancshares, Inc. (Æ) | | | 489 | | | | 17 | |
| | |
| Russell Small Cap Consistent Growth ETF | | 95 |
Russell Exchange Traded Funds Trust
Russell Small Cap Consistent Growth ETF
Schedule of Investments, continued — March 31, 2012
Amounts in thousands (except share amounts)
| | | | | | | | |
| | | Principal
Amount ($)
or Shares | | | Market
Value
$ | |
| | | | | | | | |
TFS Financial Corp. (Æ) | | | 1,670 | | | | 16 | |
Waddell & Reed Financial, Inc. Class A | | | 621 | | | | 20 | |
World Acceptance Corp. (Æ) | | | 383 | | | | 23 | |
Wright Express Corp. (Æ) | | | 276 | | | | 18 | |
| | | | | | | | |
| | | | | | | 602 | |
| | | | | | | | |
| | |
| Health Care - 11.5% | | | | | | | | |
Abaxis, Inc. (Æ) | | | 1,020 | | | | 30 | |
Air Methods Corp. (Æ) | | | 335 | | | | 29 | |
Align Technology, Inc. (Æ) | | | 1,190 | | | | 33 | |
Analogic Corp. | | | 494 | | | | 33 | |
Bruker Corp. (Æ) | | | 2,272 | | | | 35 | |
Cantel Medical Corp. | | | 804 | | | | 20 | |
Chemed Corp. | | | 299 | | | | 19 | |
Cubist Pharmaceuticals, Inc. (Æ) | | | 712 | | | | 31 | |
Cyberonics, Inc. (Æ) | | | 845 | | | | 32 | |
Emergent Biosolutions, Inc. (Æ) | | | 1,682 | | | | 27 | |
Ensign Group, Inc. (The) | | | 610 | | | | 17 | |
Haemonetics Corp. (Æ) | | | 250 | | | | 17 | |
Hanger Orthopedic Group, Inc. (Æ) | | | 800 | | | | 17 | |
HMS Holdings Corp. (Æ) | | | 882 | | | | 28 | |
ICU Medical, Inc. (Æ) | | | 332 | | | | 16 | |
IPC The Hospitalist Co., Inc. (Æ) | | | 624 | | | | 23 | |
Masimo Corp. (Æ) | | | 1,515 | | | | 35 | |
Medicis Pharmaceutical Corp. Class A | | | 450 | | | | 17 | |
Merit Medical Systems, Inc. (Æ) | | | 1,118 | | | | 14 | |
Myriad Genetics, Inc. (Æ) | | | 714 | | | | 17 | |
Neogen Corp. (Æ) | | | 922 | | | | 36 | |
Omnicell, Inc. (Æ) | | | 1,723 | | | | 26 | |
PAREXEL International Corp. (Æ) | | | 1,361 | | | | 37 | |
Quality Systems, Inc. | | | 763 | | | | 33 | |
Sirona Dental Systems, Inc. (Æ) | | | 350 | | | | 18 | |
Thoratec Corp. (Æ) | | | 446 | | | | 15 | |
VCA Antech, Inc. (Æ) | | | 779 | | | | 18 | |
Viropharma, Inc. (Æ) | | | 562 | | | | 17 | |
West Pharmaceutical Services, Inc. | | | 406 | | | | 17 | |
Zoll Medical Corp. (Æ) | | | 446 | | | | 42 | |
| | | | | | | | |
| | | | | | | 749 | |
| | | | | | | | |
| | |
| Materials and Processing - 7.5% | | | | | | | | |
Acuity Brands, Inc. | | | 290 | | | | 18 | |
AMCOL International Corp. | | | 573 | | | | 17 | |
American Vanguard Corp. | | | 1,152 | | | | 25 | |
Armstrong World Industries, Inc. (Æ) | | | 351 | | | | 17 | |
Balchem Corp. | | | 702 | | | | 21 | |
Cabot Microelectronics Corp. | | | 597 | | | | 23 | |
Calgon Carbon Corp. (Æ) | | | 953 | | | | 15 | |
Carpenter Technology Corp. | | | 550 | | | | 29 | |
Clarcor, Inc. | | | 306 | | | | 15 | |
Compass Minerals International, Inc. | | | 217 | | | | 16 | |
Dynamic Materials Corp. | | | 777 | | | | 16 | |
Globe Specialty Metals, Inc. | | | 2,109 | | | | 32 | |
Haynes International, Inc. | | | 282 | | | | 18 | |
HB Fuller Co. | | | 665 | | | | 22 | |
Innophos Holdings, Inc. | | | 308 | | | | 15 | |
Innospec, Inc. (Æ) | | | 533 | | | | 16 | |
Intrepid Potash, Inc. (Æ) | | | 1,246 | | | | 30 | |
| | | | | | | | |
| | | Principal
Amount ($)
or Shares | | | Market
Value
$ | |
KapStone Paper and Packaging Corp. (Æ) | | | 1,791 | | | | 36 | |
NewMarket Corp. | | | 76 | | | | 14 | |
RBC Bearings, Inc. (Æ) | | | 369 | | | | 17 | |
Schweitzer-Mauduit International, Inc. | | | 225 | | | | 16 | |
Simpson Manufacturing Co., Inc. | | | 444 | | | | 14 | |
Tredegar Corp. | | | 674 | | | | 13 | |
Universal Stainless & Alloy (Æ) | | | 401 | | | | 17 | |
Valmont Industries, Inc. | | | 165 | | | | 19 | |
| | | | | | | | |
| | | | | | | 491 | |
| | | | | | | | |
| | |
| Producer Durables - 19.4% | | | | | | | | |
Actuant Corp. Class A | | | 678 | | | | 20 | |
Advisory Board Co. (The) (Æ) | | | 383 | | | | 34 | |
Aerovironment, Inc. (Æ) | | | 905 | | | | 24 | |
Allegiant Travel Co. Class A (Æ) | | | 281 | | | | 15 | |
Altra Holdings, Inc. (Æ) | | | 817 | | | | 16 | |
AO Smith Corp. | | | 704 | | | | 32 | |
Astec Industries, Inc. (Æ) | | | 478 | | | | 17 | |
Babcock & Wilcox Co. (The) (Æ) | | | 620 | | | | 16 | |
Barnes Group, Inc. | | | 1,171 | | | | 31 | |
Carlisle Cos., Inc. | | | 348 | | | | 17 | |
Chart Industries, Inc. (Æ) | | | 520 | | | | 39 | |
Colfax Corp. (Æ) | | | 526 | | | | 19 | |
Copa Holdings SA Class A | | | 262 | | | | 21 | |
Copart, Inc. (Æ) | | | 624 | | | | 16 | |
Corporate Executive Board Co. (The) | | | 392 | | | | 17 | |
Cubic Corp. | | | 353 | | | | 17 | |
Dice Holdings, Inc. (Æ) | | | 3,401 | | | | 32 | |
ExlService Holdings, Inc. (Æ) | | | 1,262 | | | | 35 | |
Exponent, Inc. (Æ) | | | 325 | | | | 16 | |
FARO Technologies, Inc. (Æ) | | | 334 | | | | 19 | |
Forrester Research, Inc. | | | 835 | | | | 27 | |
Forward Air Corp. | | | 466 | | | | 17 | |
Franklin Electric Co., Inc. | | | 353 | | | | 17 | |
FTI Consulting, Inc. (Æ) | | | 353 | | | | 13 | |
Genesee & Wyoming, Inc. Class A (Æ) | | | 466 | | | | 25 | |
Genpact, Ltd. (Æ) | | | 1,894 | | | | 31 | |
Graco, Inc. | | | 690 | | | | 37 | |
GrafTech International, Ltd. (Æ) | | | 1,127 | | | | 13 | |
Heartland Express, Inc. | | | 1,046 | | | | 15 | |
HEICO Corp. | | | 483 | | | | 25 | |
Knight Transportation, Inc. | | | 1,804 | | | | 32 | |
Korn/Ferry International (Æ) | | | 877 | | | | 15 | |
Landstar System, Inc. | | | 589 | | | | 34 | |
Lindsay Corp. | | | 273 | | | | 18 | |
Liquidity Services, Inc. (Æ) | | | 763 | | | | 34 | |
MAXIMUS, Inc. | | | 362 | | | | 15 | |
Measurement Specialties, Inc. (Æ) | | | 1,009 | | | | 34 | |
Middleby Corp. (Æ) | | | 302 | | | | 31 | |
National Instruments Corp. | | | 1,089 | | | | 31 | |
Nordson Corp. | | | 373 | | | | 20 | |
Old Dominion Freight Line, Inc. (Æ) | | | 380 | | | | 18 | |
On Assignment, Inc. (Æ) | | | 1,339 | | | | 23 | |
OSI Systems, Inc. (Æ) | | | 579 | | | | 35 | |
Raven Industries, Inc. | | | 456 | | | | 28 | |
Regal-Beloit Corp. | | | 301 | | | | 20 | |
Rollins, Inc. | | | 673 | | | | 14 | |
| | | | |
| | 96 | | | Russell Small Cap Consistent Growth ETF |
Russell Exchange Traded Funds Trust
Russell Small Cap Consistent Growth ETF
Schedule of Investments, continued — March 31, 2012
Amounts in thousands (except share amounts)
| | | | | | | | |
| | | Principal
Amount ($)
or Shares | | | Market
Value
$ | |
| | | | | | | | |
Sun Hydraulics Corp. | | | 656 | | | | 17 | |
Team, Inc. (Æ) | | | 952 | | | | 29 | |
TeleTech Holdings, Inc. (Æ) | | | 924 | | | | 15 | |
Tennant Co. | | | 385 | | | | 17 | |
Tetra Tech, Inc. (Æ) | | | 1,307 | | | | 34 | |
Toro Co. (The) | | | 247 | | | | 18 | |
Triumph Group, Inc. | | | 263 | | | | 16 | |
Wesco Aircraft Holdings, Inc. (Æ) | | | 1,070 | | | | 17 | |
Woodward, Inc. | | | 365 | | | | 16 | |
Zebra Technologies Corp. Class A (Æ) | | | 430 | | | | 18 | |
| | | | | | | | |
| | | | | | | 1,272 | |
| | | | | | | | |
| | |
| Technology - 19.3% | | | | | | | | |
Actuate Corp. (Æ) | | | 2,554 | | | | 16 | |
ADTRAN, Inc. | | | 510 | | | | 16 | |
American Science & Engineering, Inc. | | | 226 | | | | 15 | |
Blackbaud, Inc. | | | 1,014 | | | | 34 | |
Cognex Corp. | | | 430 | | | | 18 | |
Coherent, Inc. (Æ) | | | 295 | | | | 17 | |
Compuware Corp. (Æ) | | | 1,799 | | | | 17 | |
Daktronics, Inc. | | | 1,563 | | | | 14 | |
Diodes, Inc. (Æ) | | | 722 | | | | 17 | |
DTS, Inc. (Æ) | | | 1,037 | | | | 31 | |
Ebix, Inc. | | | 1,276 | | | | 30 | |
FEI Co. (Æ) | | | 377 | | | | 19 | |
Hittite Microwave Corp. (Æ) | | | 303 | | | | 16 | |
iGate Corp. (Æ) | | | 1,795 | | | | 30 | |
II-VI, Inc. (Æ) | | | 1,536 | | | | 36 | |
Interactive Intelligence Group, Inc. (Æ) | | | 1,230 | | | | 38 | |
IPG Photonics Corp. (Æ) | | | 831 | | | | 42 | |
iRobot Corp. (Æ) | | | 945 | | | | 26 | |
JDA Software Group, Inc. (Æ) | | | 462 | | | | 13 | |
Micrel, Inc. | | | 1,479 | | | | 15 | |
Microsemi Corp. (Æ) | | | 917 | | | | 20 | |
MicroStrategy, Inc. Class A (Æ) | | | 261 | | | | 37 | |
Monolithic Power Systems, Inc. (Æ) | | | 1,872 | | | | 37 | |
Monotype Imaging Holdings, Inc. (Æ) | | | 960 | | | | 14 | |
Netgear, Inc. (Æ) | | | 839 | | | | 32 | |
Netscout Systems, Inc. (Æ) | | | 874 | | | | 18 | |
NeuStar, Inc. Class A (Æ) | | | 822 | | | | 31 | |
NIC, Inc. | | | 2,129 | | | | 26 | |
NVE Corp. (Æ) | | | 512 | | | | 27 | |
Parametric Technology Corp. (Æ) | | | 840 | | | | 23 | |
Power Integrations, Inc. | | | 464 | | | | 17 | |
PROS Holdings, Inc. (Æ) | | | 1,896 | | | | 35 | |
QLogic Corp. (Æ) | | | 998 | | | | 18 | |
Quest Software, Inc. (Æ) | | | 1,517 | | | | 35 | |
Rofin-Sinar Technologies, Inc. (Æ) | | | 1,235 | | | | 33 | |
Rogers Corp. (Æ) | | | 418 | | | | 16 | |
Sapient Corp. | | | 2,248 | | | | 28 | |
Semtech Corp. (Æ) | | | 603 | | | | 17 | |
Silicon Laboratories, Inc. (Æ) | | | 651 | | | | 28 | |
Stratasys, Inc. (Æ) | | | 927 | | | | 34 | |
Synaptics, Inc. (Æ) | | | 935 | | | | 34 | |
Syntel, Inc. | | | 606 | | | | 34 | |
| | | | | | | | |
| | | Principal
Amount ($)
or Shares | | | Market
Value
$ | |
TeleNav, Inc. (Æ) | | | 3,627 | | | | 25 | |
Tyler Technologies, Inc. (Æ) | | | 936 | | | | 36 | |
Ultratech, Inc. (Æ) | | | 626 | | | | 18 | |
VASCO Data Security International, Inc. (Æ) | | | 2,353 | | | | 25 | |
Viasat, Inc. (Æ) | | | 617 | | | | 30 | |
Virtusa Corp. (Æ) | | | 1,950 | | | | 34 | |
Volterra Semiconductor Corp. (Æ) | | | 1,102 | | | | 38 | |
| | | | | | | | |
| | | | | | | 1,260 | |
| | | | | | | | |
| | |
| Utilities - 1.0% | | | | | | | | |
8x8, Inc. (Æ) | | | 8,898 | | | | 38 | |
Atlantic Tele-Network, Inc. | | | 725 | | | | 26 | |
| | | | | | | | |
| | | | | | | 64 | |
| | | | | | | | |
| | |
Total Common Stocks
(cost $5,874) | | | | | | | 6,519 | |
| | | | | | | | |
| | |
| Short-Term Investments - 0.3% | | | | | | | | |
Russell U.S. Cash Management Fund | | | 16,312 | (¥) | | | 16 | |
| | | | | | | | |
| | |
Total Short-Term Investments
(cost $16) | | | | | | | 16 | |
| | | | | | | | |
| | |
Total Investments - 100.0%
(identified cost $5,890) | | | | | | | 6,535 | |
| | |
Other Assets and Liabilities,
Net - 0.0% | | | | | | | 3 | |
| | | | | | | | |
| | |
| Net Assets - 100.0% | | | | | | | 6,538 | |
| | | | | | | | |
See accompanying notes which are an integral part of the financial statements.
| | |
| Russell Small Cap Consistent Growth ETF | | 97 |
Russell Exchange Traded Funds Trust
Russell Small Cap Consistent Growth ETF
Presentation of Portfolio Holdings — March 31, 2012
Amounts in thousands
| | | | | | | | | | | | | | | | | | | | |
| | | Market Value | | | % of Net
Assets | |
| Portfolio Summary | | Level 1 | | | Level 2 | | | Level 3 | | | Total | | |
| | | | | | | | | | | | | | | | | | | | |
Common Stocks | | | | | | | | | | | | | | | | | | | | |
Consumer Discretionary | | $ | 1,475 | | | $ | — | | | $ | — | | | $ | 1,475 | | | | 22.5 | |
Consumer Staples | | | 226 | | | | — | | | | — | | | | 226 | | | | 3.5 | |
Energy | | | 380 | | | | — | | | | — | | | | 380 | | | | 5.8 | |
Financial Services | | | 602 | | | | — | | | | — | | | | 602 | | | | 9.2 | |
Health Care | | | 749 | | | | — | | | | — | | | | 749 | | | | 11.5 | |
Materials and Processing | | | 491 | | | | — | | | | — | | | | 491 | | | | 7.5 | |
Producer Durables | | | 1,272 | | | | — | | | | — | | | | 1,272 | | | | 19.4 | |
Technology | | | 1,260 | | | | — | | | | — | | | | 1,260 | | | | 19.3 | |
Utilities | | | 64 | | | | — | | | | — | | | | 64 | | | | 1.0 | |
Short-Term Investments | | | — | | | | 16 | | | | — | | | | 16 | | | | 0.3 | |
| | | | | | | | | | | | | | | | | | | | |
| | | | | |
Total Investments | | | 6,519 | | | | 16 | | | | — | | | | 6,535 | | | | 100.0 | |
| | | | | | | | | | | | | | | | | | | | |
Other Assets and Liabilities, Net | | | | | | | | | | | | | | | | | | | — | * |
| | | | | | | | | | | | | | | | | | | | |
| | | | | |
| | | | | | | | | | | | | | | | | | | 100.0 | |
| | | | | | | | | | | | | | | | | | | | |
| * | Less than .05% of net assets. |
For a description of the levels see note 2 in the Notes to Financial Statements.
There were no significant transfers in and out of levels 1, 2 and 3 during the period ending March 31, 2012.
See accompanying notes which are an integral part of the financial statements.
| | | | |
| | 98 | | | Russell Small Cap Consistent Growth ETF |
Russell Exchange Traded Funds Trust
Russell Small Cap Consistent Growth ETF
Statement of Assets and Liabilities — March 31, 2012
| | | | |
| Amounts in thousands | | Russell Small
Cap Consistent
Growth ETF | |
| | | | |
Assets | | | | |
Investments, at identified cost | | $ | 5,890 | |
Investments, at market* | | | 6,535 | |
Receivables: | | | | |
Dividends | | | 5 | |
| | | | |
Total assets | | | 6,540 | |
| | | | |
| |
Liabilities | | | | |
Payables: | | | | |
Accrued fees to affiliates | | | 2 | |
| | | | |
Total liabilities | | | 2 | |
| | | | |
| | | | |
Net Assets | | $ | 6,538 | |
| | | | |
Net Assets Consist of: | | | | |
Undistributed (overdistributed) net investment income | | $ | 5 | |
Accumulated net realized gain (loss) | | | (97 | ) |
Unrealized appreciation (depreciation) on investments | | | 645 | |
Additional paid-in capital | | | 5,985 | |
| | | | |
Net Assets | | $ | 6,538 | |
| | | | |
Net Asset Value, offering and redemption price per share: | | | | |
Net asset value per share:(a) | | $ | 65.37 | |
Net assets | | $ | 6,537,567 | |
Shares outstanding ($.001 par value) | | | 100,002 | |
Amounts in thousands | | | | |
| | | | |
* Investments in Affiliates, Russell U.S. Cash Management Fund | | $ | 16 | |
| (a) | Net asset value per share equals net assets divided by shares outstanding. |
See accompanying notes which are an integral part of the financial statements.
| | |
| Statement of Assets and Liabilities | | 99 |
Russell Exchange Traded Funds Trust
Russell Small Cap Consistent Growth ETF
Statement of Operations — For the Period Ended March 31, 2012
| | | | |
| Amounts in thousands | | Russell Small
Cap Consistent
Growth ETF* | |
| | | | |
Investment Income | | | | |
Dividends | | $ | 27 | |
| | | | |
Total investment income | | | 27 | |
| | | | |
| |
Expenses | | | | |
Management fees | | | 14 | |
Trustee and trustee related fees | | | 8 | |
| | | | |
Expenses before reductions | | | 22 | |
Expense reductions | | | (8 | ) |
| | | | |
Net expenses | | | 14 | |
| | | | |
Net investment income (loss) | | | 13 | |
| | | | |
| |
Net Realized and Unrealized Gain (Loss) | | | | |
Net realized gain (loss) on: | | | | |
Investments | | | (97 | ) |
In-kind redemptions | | | 1,233 | |
| | | | |
Net realized gain (loss) | | | 1,136 | |
| | | | |
Net change in unrealized appreciation (depreciation) on investments | | | 645 | |
| | | | |
Net realized and unrealized gain (loss) | | | 1,781 | |
| | | | |
Net Increase (Decrease) in Net Assets from Operations | | $ | 1,794 | |
| | | | |
| * | For the period October 4, 2011 (commencement of operations) to March 31, 2012. |
See accompanying notes which are an integral part of the financial statements.
| | | | |
| | 100 | | | Statement of Operations |
Russell Exchange Traded Funds Trust
Russell Small Cap Consistent Growth ETF
Statement of Changes in Net Assets — For the Period Ended March 31,
| | | | |
| | | Russell Small Cap
Consistent Growth
ETF | |
| Amounts in thousands | | 2012* | |
| | | | |
Increase (Decrease) in Net Assets | | | | |
| |
Operations | | | | |
Net investment income (loss) | | $ | 13 | |
Net realized gain (loss) | | | 1,136 | |
Net change in unrealized appreciation (depreciation) | | | 645 | |
| | | | |
Net increase (decrease) in net assets from operations | | | 1,794 | |
| | | | |
| |
Distributions | | | | |
From net investment income | | | (8 | ) |
| | | | |
Net decrease in net assets from distributions | | | (8 | ) |
| | | | |
| |
Share Transactions | | | | |
Net increase (decrease) in net assets from share transactions | | | 4,752 | |
| | | | |
Total Net Increase (Decrease) in Net Assets | | | 6,538 | |
| |
Net Assets | | | | |
Beginning of period | | | — | |
| | | | |
End of period | | $ | 6,538 | |
| | | | |
Undistributed (overdistributed) net investment income included in net assets | | $ | 5 | |
| * | For the period October 4, 2011 (commencement of operations) to March 31, 2012. |
See accompanying notes which are an integral part of the financial statements.
| | |
| Statement of Changes in Net Assets | | 101 |
Russell Exchange Traded Funds Trust
Russell Small Cap Consistent Growth ETF
Financial Highlights — For the Period Ended
For a Share Outstanding Throughout Each Period.
| | | | | | | | | | | | | | | | | | | | | | | | |
| | |
$
Net Asset Value,
Beginning of
Period | | | $
Net
Investment
Income (Loss)(a) | | | $
Net Realized
and Unrealized
Gain (Loss) | | | $
Total from
Investment
Operations | | | $
Distributions
from Net
Investment Income | | | $
Total
Distributions | |
Russell Small Cap Consistent Growth ETF | | | | | | | | | | | | | | | | | |
March 31, 2012* | | | 47.56 | | | | .12 | | | | 17.77 | | | | 17.89 | | | | (.08 | ) | | | (.08 | ) |
| (a) | Average daily shares outstanding were used for this calculation. |
| (b) | Periods less than one year are not annualized. |
| (c) | The ratios for periods less than one year are annualized. |
| (d) | Portfolio turnover rate excludes securities received or delivered from in-kind creation or redemption units. |
| * | For the period October 4, 2011 (commencement of operations) to March 31, 2012. |
See accompanying notes which are an integral part of the financial statements.
| | | | | | | | | | | | | | | | | | | | | | | | | | |
$
Net Asset Value,
End of
Period | | | %
Total
Return(b) | | | $
Net Assets,
End of Period
(000) | | | %
Ratio of Expenses
to Average
Net Assets,
Gross(c) | | | %
Ratio of Expenses
to Average
Net Assets,
Net(c) | | | %
Ratio of Net
Investment Income
to Average
Net Assets(c) | | | %
Portfolio
Turnover Rate(b)(d) | |
| | | | | | | | | | | | | | | | | | | | | | | | | | |
| | 65.37 | | | | 37.62 | | | | 6,538 | | | | .72 | | | | .45 | | | | .42 | | | | 21 | |
See accompanying notes which are an integral part of the financial statements.
Russell Exchange Traded Funds Trust
Russell Small Cap Low P/E ETF
Portfolio Management Discussion and Analysis — March 31, 2012 (Unaudited)

Performance as of March 31, 2012
| | | | | | | | | | | | |
| |
| Average Annual Total Return | | | | |
| | | Net Asset
Value | | | Market Value | | | Russell U.S.
Small Cap Low
P/E Index** | |
Inception* | | | 29.37 | % | | | 29.10 | % | | | 29.88 | % |
| | | | |
| | 104 | | | Russell Small Cap Low P/E ETF |
Russell Exchange Traded Funds Trust
Russell Small Cap Low P/E ETF
Portfolio Management Discussion and Analysis — March 31, 2012 (Unaudited)
The Russell Small Cap Low P/E ETF (the “Fund”) is an index-based exchange-traded fund that seeks investment results that closely correspond to the total return of the Russell U.S. Small Cap Low P/E Index (the “Index”). Russell Investment Management Company (“RIMCo”), as the Fund’s advisor, uses a “passive” or indexing approach to try to achieve the Fund’s investment objective. Unlike many investment companies, the Fund does not try to “beat” the Index it tracks and does not seek temporary defensive positions when markets decline or appear overvalued. The Fund will normally invest at least 80% of its total assets in securities that comprise the Index.
What is the Fund’s investment objective?
The Fund seeks investment results that closely correspond to the total return of the Russell U.S. Small Cap Low P/E Index, which is designed to select securities intended to produce performance that is similar to professional investment managers following a small cap low price to earnings investment discipline.
Is the Fund replicating or sampling?
The Fund is replicating.
How did the Fund perform relative to its benchmark for the fiscal year ended March 31, 2012?
For the fiscal year ended March 31, 2012, the Fund gained 29.37%. This is compared to the Fund’s benchmark, the Russell U.S. Small Cap Low P/E Index, which gained 29.88% during the same period. The Fund’s performance includes operating expenses, whereas indexes are unmanaged and index returns do not include expenses of any kind.
There were no significant changes to either the Fund or Index during the reporting period.
Did the Fund outperform or underperform the benchmark or was performance as expected based on expenses, etc.?
The Fund performed as expected against the benchmark.
Over the reporting period, please describe those sectors that outperformed or underperformed.
All sectors had positive returns for the Fund and the Index. Energy was the best performing sector for the Fund and the Index, while utilities was the worst performing sector. Producer durables, with an average weight of 20.9% was the best contributor to Fund and Index returns. Utilities, with an average weight of 6.2%, contributed the least to Fund and Index returns.
Over the reporting period, please describe those individual securities (constituents) that outperformed or underperformed.
Georgia Gulf Corp, Delphi Financial Group Inc Cl A, and Winn-Dixie Stores Inc Wi generated positive returns and contributed the most to Fund performance while IDT Corp Cl B, RF Micro Devices Inc, and McMoRan Exploration Co, all declined which detracted from Fund performance.
The views expressed in this report reflect those of the portfolio managers only through the end of the period covered by the report. These views do not necessarily represent the views of RIMCo, or any other person in RIMCo or any other affiliated organization. These views are subject to change at any time based upon market conditions or other events, and RIMCo disclaims any responsibility to update the views contained herein. These views should not be relied on as investment advice and, because investment decisions for a Russell Exchange Traded Funds Trust (“RET”) Fund are based on numerous factors, should not be relied on as an indication of investment decisions of any RET Fund.
| * | | Commenced operations by issuing shares on October 5, 2011. |
| ** | | The Russell U.S. Small Cap Low P/E Index is designed to select securities intended to produce performance that is similar to professional investment managers following a small cap low price to earnings investment discipline. This discipline focuses on companies that are trading at lower multiples relative to their prior level and/or their industry peers. Starting with the Russell 2500® Index (an index comprised of U.S. stocks), the Index includes stocks that have three or more of the following characteristics which are below their industry average: price to one year forecasted earnings, price to trailing earnings or price to cash flow below their five year historical average and price to book or price to sales below their industry average. The Index excludes stocks with high price to cash flow or price to sales relative to their industry. The Index constituents are equally weighted. The Index is reconstituted semi-annually. |
Performance is historical and assumes reinvestment of all dividends and capital gains. Investment return and principal value will fluctuate so that an investor’s shares, when redeemed, may be worth more or less than when purchased. Past performance is not indicative of future results. The returns shown do not reflect the deduction of taxes that a shareholder would pay on Fund distributions or the redemption of Fund shares.
| | |
| Russell Small Cap Low P/E ETF | | 105 |
Russell Exchange Traded Funds Trust
Russell Small Cap Low P/E ETF
Shareholder Expense Example — March 31, 2012 (Unaudited)
Fund Expenses
The following disclosure provides important information regarding each Fund’s Expense Example, which appears on each Fund’s individual page in this Annual Report. Please refer to this information when reviewing the Expense Example for a Fund.
Example
As a shareholder of the Fund, you incur two types of costs: (1) transaction costs, including brokerage commissions on purchases and sales of your Fund shares and (2) ongoing costs, including management fees and other Fund expenses. The Example is intended to help you understand your ongoing costs (in dollars) of investing in the Fund and to compare these costs with the ongoing costs of investing in other funds. The Example is based on an investment of $1,000 invested at the beginning of the period and held for the entire period indicated, which for this Fund is from October 5, 2011 (commencement of operations) to March 31, 2012.
Actual Expenses
The information in the table under the heading “Actual Performance” provides information about actual account values and actual expenses. You may use the information in this column, together with the amount you invested, to estimate the expenses that you paid over the period. Simply divide your account value by $1,000 (for example, an $8,600 account value divided by $1,000 = 8.6), then multiply the result by the number in the first column in the row entitled “Expenses Paid During Period” to estimate the expenses you paid on your account during this period.
Hypothetical Example for Comparison Purposes
The information in the table under the heading “Hypothetical Performance (5% return before expenses)” provides information about hypothetical account values and hypothetical expenses based on the Fund’s actual expense ratio and an assumed rate of return of 5% per year before expenses, which is not the Fund’s actual return. The hypothetical account values and expenses may not be used to estimate the actual ending account balance or expenses you paid for the period. You may use this information to compare the ongoing costs of investing in the Fund and other funds. To do so, compare this 5% hypothetical example with the 5% hypothetical examples that appear in the shareholder reports of other funds.
Please note that the expenses shown in the table are meant to highlight your ongoing costs only and do not reflect any transactional costs, such as brokerage commissions paid on purchases and sales of Fund shares. Therefore, the information under the heading “Hypothetical Performance (5% return before expenses)” is useful in comparing ongoing costs only, and will not help you determine the relative total costs of owning different funds. In addition, if these transactional costs were included, your costs would have been higher.
| | | | | | | | |
| | | Actual
Performance | | | Hypothetical
Performance
(5% return
before expenses) | |
| | | | | | | | |
Beginning Account Value October 5, 2011 | | $ | 1,000.00 | | | $ | 1,000.00 | |
Ending Account Value March 31, 2012 | | $ | 1,293.70 | | | $ | 1,022.75 | |
Expenses Paid During Period* | | $ | 2.52 | | | $ | 2.28 | |
| * | Actual expenses are equal to the Fund’s annualized expense ratio of 0.45% (representing the 179-day period annualized), multiplied by the average account value over the period, multiplied by 179/366 (to reflect the period since commencement of operations). Hypothetical expenses are equal to the Fund’s annualized expense ratio of 0.45% (representing the six month period annualized) multiplied by the average amount value over the period, multiplied by 183/366 (to reflect the one-half year period). |
| | | | |
| | 106 | | | Russell Small Cap Low P/E ETF |
Russell Exchange Traded Funds Trust
Russell Small Cap Low P/E ETF
Schedule of Investments — March 31, 2012
Amounts in thousands (except share amounts)
| | | | | | | | |
| | | Principal
Amount ($)
or Shares | | | Market
Value
$ | |
| | | | | | | | |
| Common Stocks - 99.7% | | | | | | | | |
| Consumer Discretionary - 14.6% | | | | | | | | |
American Greetings Corp. Class A | | | 885 | | | | 14 | |
ANN, Inc. (Æ) | | | 641 | | | | 18 | |
Ascena Retail Group, Inc. (Æ) | | | 559 | | | | 26 | |
Biglari Holdings, Inc. (Æ) | | | 44 | | | | 18 | |
Brinker International, Inc. | | | 640 | | | | 18 | |
Carter’s, Inc. (Æ) | | | 388 | | | | 19 | |
Cato Corp. (The) Class A | | | 588 | | | | 16 | |
Chico’s FAS, Inc. | | | 1,479 | | | | 22 | |
Children’s Place Retail Stores, Inc. (The) (Æ) | | | 279 | | | | 14 | |
Churchill Downs, Inc. | | | 310 | | | | 17 | |
Cinemark Holdings, Inc. | | | 768 | | | | 17 | |
Clear Channel Outdoor Holdings, Inc. Class A (Æ) | | | 1,363 | | | | 11 | |
DeVry, Inc. | | | 436 | | | | 15 | |
Dorman Products, Inc. (Æ) | | | 399 | | | | 20 | |
DR Horton, Inc. | | | 1,285 | | | | 19 | |
Drew Industries, Inc. (Æ) | | | 707 | | | | 19 | |
Ethan Allen Interiors, Inc. | | | 754 | | | | 19 | |
Finish Line, Inc. (The) Class A | | | 714 | | | | 15 | |
Foot Locker, Inc. | | | 653 | | | | 20 | |
Fred’s, Inc. Class A | | | 1,118 | | | | 16 | |
GameStop Corp. Class A | | | 651 | | | | 14 | |
Helen of Troy, Ltd. (Æ) | | | 504 | | | | 17 | |
Iconix Brand Group, Inc. (Æ) | | | 872 | | | | 15 | |
Inter Parfums, Inc. | | | 878 | | | | 14 | |
International Speedway Corp. Class A | | | 612 | | | | 17 | |
Jack in the Box, Inc. (Æ) | | | 734 | | | | 18 | |
Jakks Pacific, Inc. | | | 788 | | | | 14 | |
Jarden Corp. | | | 495 | | | | 20 | |
John Wiley & Sons, Inc. Class A | | | 313 | | | | 15 | |
Kirkland’s, Inc. (Æ) | | | 1,235 | | | | 20 | |
Leggett & Platt, Inc. | | | 672 | | | | 15 | |
Live Nation Entertainment, Inc. (Æ) | | | 1,741 | | | | 16 | |
Matthews International Corp. Class A | | | 454 | | | | 14 | |
Men’s Wearhouse, Inc. (The) | | | 553 | | | | 21 | |
Meredith Corp. | | | 519 | | | | 17 | |
New York Times Co. (The) Class A (Æ) | | | 2,066 | | | | 14 | |
NVR, Inc. (Æ) | | | 23 | | | | 17 | |
Oxford Industries, Inc. | | | 397 | | | | 20 | |
Penske Automotive Group, Inc. | | | 760 | | | | 19 | |
PEP Boys-Manny Moe & Jack (The) | | | 1,355 | | | | 20 | |
Pier 1 Imports, Inc. (Æ) | | | 1,133 | | | | 21 | |
Regis Corp. | | | 927 | | | | 17 | |
Ryland Group, Inc. (The) | | | 1,019 | | | | 20 | |
Scholastic Corp. | | | 556 | | | | 20 | |
Service Corp. International | | | 1,468 | | | | 17 | |
Shoe Carnival, Inc. (Æ) | | | 633 | | | | 20 | |
Snap-on, Inc. | | | 299 | | | | 18 | |
Stage Stores, Inc. | | | 1,229 | | | | 20 | |
Steiner Leisure, Ltd. (Æ) | | | 327 | | | | 16 | |
Stewart Enterprises, Inc. Class A | | | 2,419 | | | | 15 | |
Texas Roadhouse, Inc. Class A | | | 1,151 | | | | 19 | |
Toll Brothers, Inc. (Æ) | | | 741 | | | | 18 | |
Tupperware Brands Corp. | | | 263 | | | | 17 | |
| | | | | | | | |
| | | Principal
Amount ($)
or Shares | | | Market
Value
$ | |
Vail Resorts, Inc. | | | 338 | | | | 15 | |
WABCO Holdings, Inc. (Æ) | | | 328 | | | | 20 | |
Warnaco Group, Inc. (The) (Æ) | | | 297 | | | | 17 | |
Wolverine World Wide, Inc. | | | 408 | | | | 15 | |
| | | | | | | | |
| | | | | | | 995 | |
| | | | | | | | |
| | |
| Consumer Staples - 3.5% | | | | | | | | |
Boston Beer Co., Inc. Class A (Æ) | | | 151 | | | | 16 | |
Casey’s General Stores, Inc. | | | 282 | | | | 16 | |
Constellation Brands, Inc. Class A (Æ) | | | 773 | | | | 18 | |
Core-Mark Holding Co., Inc. | | | 390 | | | | 16 | |
Flowers Foods, Inc. | | | 761 | | | | 16 | |
Fresh Del Monte Produce, Inc. | | | 600 | | | | 14 | |
Hain Celestial Group, Inc. (The) (Æ) | | | 403 | | | | 18 | |
Harris Teeter Supermarkets, Inc. | | | 378 | | | | 15 | |
J&J Snack Foods Corp. | | | 290 | | | | 15 | |
Snyders-Lance, Inc. | | | 712 | | | | 18 | |
Spartan Stores, Inc. | | | 834 | | | | 15 | |
Tootsie Roll Industries, Inc. | | | 643 | | | | 15 | |
TreeHouse Foods, Inc. (Æ) | | | 228 | | | | 14 | |
United Natural Foods, Inc. (Æ) | | | 400 | | | | 18 | |
WD-40 Co. | | | 363 | | | | 16 | |
| | | | | | | | |
| | | | | | | 240 | |
| | | | | | | | |
| | |
| Energy - 3.8% | | | | | | | | |
Atwood Oceanics, Inc. (Æ) | | | 367 | | | | 16 | |
Basic Energy Services, Inc. (Æ) | | | 798 | | | | 14 | |
Dawson Geophysical Co. (Æ) | | | 440 | | | | 15 | |
Energy Partners, Ltd. (Æ) | | | 1,115 | | | | 19 | |
Energy XXI Bermuda, Ltd. (Æ) | | | 488 | | | | 18 | |
Helix Energy Solutions Group, Inc. (Æ) | | | 848 | | | | 15 | |
Key Energy Services, Inc. (Æ) | | | 996 | | | | 15 | |
Matrix Service Co. (Æ) | | | 1,635 | | | | 23 | |
McMoRan Exploration Co. (Æ) | | | 941 | | | | 10 | |
OYO Geospace Corp. (Æ) | | | 169 | | | | 18 | |
Petroquest Energy, Inc. (Æ) | | | 2,190 | | | | 13 | |
RPC, Inc. | | | 1,156 | | | | 12 | |
SEACOR Holdings, Inc. (Æ) | | | 177 | | | | 17 | |
Tesco Corp. (Æ) | | | 1,129 | | | | 16 | |
Unit Corp. (Æ) | | | 297 | | | | 13 | |
Vaalco Energy, Inc. (Æ) | | | 2,447 | | | | 23 | |
| | | | | | | | |
| | | | | | | 257 | |
| | | | | | | | |
| | |
| Financial Services - 15.5% | | | | | | | | |
Advent Software, Inc. (Æ) | | | 557 | | | | 14 | |
Allied World Assurance Co. Holdings AG | | | 253 | | | | 17 | |
Alterra Capital Holdings, Ltd. | | | 669 | | | | 15 | |
American Capital, Ltd. (Æ) | | | 2,210 | | | | 19 | |
American Financial Group, Inc. | | | 418 | | | | 16 | |
Ares Capital Corp. | | | 967 | | | | 16 | |
Associated Banc-Corp. | | | 1,473 | | | | 21 | |
Banner Corp. | | | 952 | | | | 22 | |
BBCN Bancorp, Inc. (Æ) | | | 1,606 | | | | 18 | |
BGC Partners, Inc. Class A | | | 2,441 | | | | 18 | |
Boston Private Financial Holdings, Inc. | | | 1,984 | | | | 20 | |
Brookline Bancorp, Inc. | | | 1,871 | | | | 18 | |
| | |
| Russell Small Cap Low P/E ETF | | 107 |
Russell Exchange Traded Funds Trust
Russell Small Cap Low P/E ETF
Schedule of Investments, continued — March 31, 2012
Amounts in thousands (except share amounts)
| | | | | | | | |
| | | Principal
Amount ($)
or Shares | | | Market
Value
$ | |
| | | | | | | | |
Capitol Federal Financial, Inc. | | | 1,329 | | | | 16 | |
Cash America International, Inc. | | | 303 | | | | 15 | |
Cathay General Bancorp | | | 1,085 | | | | 19 | |
Cohen & Steers, Inc. | | | 553 | | | | 18 | |
Cousins Properties, Inc. (ö) | | | 2,572 | | | | 19 | |
Credit Acceptance Corp. (Æ) | | | 187 | | | | 19 | |
Delphi Financial Group, Inc. Class A | | | 555 | | | | 26 | |
DuPont Fabros Technology, Inc. (ö) | | | 668 | | | | 16 | |
Eaton Vance Corp. | | | 626 | | | | 18 | |
Encore Capital Group, Inc. (Æ) | | | 690 | | | | 16 | |
Euronet Worldwide, Inc. (Æ) | | | 836 | | | | 17 | |
Ezcorp, Inc. Class A (Æ) | | | 517 | | | | 17 | |
First Citizens BancShares, Inc. Class A (Æ) | | | 88 | | | | 16 | |
First Financial Bancorp | | | 947 | | | | 16 | |
First Potomac Realty Trust (ö) | | | 1,182 | | | | 14 | |
FirstMerit Corp. | | | 1,030 | | | | 17 | |
GFI Group, Inc. | | | 3,540 | | | | 13 | |
Global Payments, Inc. | | | 349 | | | | 17 | |
Heartland Payment Systems, Inc. | | | 683 | | | | 20 | |
Hercules Technology Growth Capital, Inc. | | | 1,628 | | | | 18 | |
Independent Bank Corp. | | | 587 | | | | 17 | |
Infinity Property & Casualty Corp. | | | 262 | | | | 14 | |
Jack Henry & Associates, Inc. | | | 453 | | | | 15 | |
Main Street Capital Corp. | | | 790 | | | | 19 | |
Meadowbrook Insurance Group, Inc. | | | 1,475 | | | | 14 | |
NASDAQ OMX Group, Inc. (The) (Æ) | | | 573 | | | | 15 | |
National Financial Partners Corp. (Æ) | | | 1,090 | | | | 17 | |
Navigators Group, Inc. (The) (Æ) | | | 322 | | | | 15 | |
NBT Bancorp, Inc. | | | 720 | | | | 16 | |
Northwest Bancshares, Inc. | | | 1,211 | | | | 15 | |
Old National Bancorp | | | 1,341 | | | | 18 | |
Oritani Financial Corp. | | | 1,156 | | | | 17 | |
PacWest Bancorp | | | 820 | | | | 20 | |
Park National Corp. | | | 247 | | | | 17 | |
Provident Financial Services, Inc. | | | 1,149 | | | | 17 | |
RAIT Financial Trust (ö) | | | 3,430 | | | | 17 | |
St. Joe Co. (The) (Æ) | | | 1,065 | | | | 20 | |
StanCorp Financial Group, Inc. | | | 427 | | | | 17 | |
Sterling Financial Corp. (Æ) | | | 964 | | | | 20 | |
Susquehanna Bancshares, Inc. | | | 1,948 | | | | 19 | |
TFS Financial Corp. (Æ) | | | 1,625 | | | | 15 | |
TICC Capital Corp. | | | 1,694 | | | | 16 | |
Total System Services, Inc. | | | 751 | | | | 17 | |
Triangle Capital Corp. | | | 831 | | | | 16 | |
Trustco Bank Corp. NY | | | 2,855 | | | | 16 | |
Waddell & Reed Financial, Inc. Class A | | | 564 | | | | 18 | |
Washington Federal, Inc. | | | 1,178 | | | | 20 | |
Wintrust Financial Corp. | | | 552 | | | | 20 | |
Zions Bancorporation | | | 959 | | | | 21 | |
| | | | | | | | |
| | | | | | | 1,059 | |
| | | | | | | | |
| |
| Health Care - 10.6% | | | | | |
Affymetrix, Inc. (Æ) | | | 3,328 | | | | 14 | |
AMERIGROUP Corp. Class A (Æ) | | | 268 | | | | 18 | |
AMN Healthcare Services, Inc. (Æ) | | | 3,277 | | | | 20 | |
Amsurg Corp. Class A (Æ) | | | 577 | | | | 16 | |
Analogic Corp. | | | 269 | | | | 18 | |
| | | | | | | | |
| | | Principal
Amount ($)
or Shares | | | Market
Value
$ | |
AngioDynamics, Inc. (Æ) | | | 995 | | | | 12 | |
Arthrocare Corp. (Æ) | | | 505 | | | | 14 | |
Bio-Rad Laboratories, Inc. Class A (Æ) | | | 160 | | | | 17 | |
Chemed Corp. | | | 286 | | | | 18 | |
CONMED Corp. | | | 587 | | | | 18 | |
Cooper Cos., Inc. (The) | | | 246 | | | | 20 | |
Covance, Inc. (Æ) | | | 328 | | | | 16 | |
Greatbatch, Inc. (Æ) | | | 680 | | | | 17 | |
Haemonetics Corp. (Æ) | | | 254 | | | | 18 | |
Hanger Orthopedic Group, Inc. (Æ) | | | 957 | | | | 21 | |
Health Net, Inc. (Æ) | | | 492 | | | | 20 | |
ICU Medical, Inc. (Æ) | | | 342 | | | | 17 | |
LifePoint Hospitals, Inc. (Æ) | | | 383 | | | | 15 | |
Lincare Holdings, Inc. | | | 635 | | | | 16 | |
Magellan Health Services, Inc. (Æ) | | | 297 | | | | 14 | |
Medicis Pharmaceutical Corp. Class A | | | 461 | | | | 17 | |
Merit Medical Systems, Inc. (Æ) | | | 1,083 | | | | 13 | |
Molina Healthcare, Inc. (Æ) | | | 701 | | | | 23 | |
Myriad Genetics, Inc. (Æ) | | | 726 | | | | 17 | |
Orthofix International NV (Æ) | | | 450 | | | | 17 | |
Owens & Minor, Inc. | | | 488 | | | | 15 | |
PAREXEL International Corp. (Æ) | | | 768 | | | | 21 | |
Patterson Cos., Inc. | | | 499 | | | | 17 | |
PerkinElmer, Inc. | | | 809 | | | | 21 | |
Prestige Brands Holdings, Inc. (Æ) | | | 1,549 | | | | 26 | |
PSS World Medical, Inc. (Æ) | | | 617 | | | | 16 | |
Qiagen NV (Æ) | | | 1,009 | | | | 16 | |
Sciclone Pharmaceuticals, Inc. (Æ) | | | 3,336 | | | | 20 | |
Sirona Dental Systems, Inc. (Æ) | | | 339 | | | | 17 | |
STERIS Corp. | | | 500 | | | | 16 | |
Symmetry Medical, Inc. (Æ) | | | 1,921 | | | | 14 | |
Techne Corp. | | | 223 | | | | 16 | |
Teleflex, Inc. | | | 247 | | | | 15 | |
Thoratec Corp. (Æ) | | | 495 | | | | 17 | |
Universal Health Services, Inc. Class B | | | 374 | | | | 16 | |
VCA Antech, Inc. (Æ) | | | 765 | | | | 18 | |
West Pharmaceutical Services, Inc. | | | 390 | | | | 17 | |
| | | | | | | | |
| | | | | | | 724 | |
| | | | | | | | |
| |
| Materials and Processing - 12.3% | | | | | |
A Schulman, Inc. | | | 746 | | | | 20 | |
Acuity Brands, Inc. | | | 305 | | | | 19 | |
AMCOL International Corp. | | | 454 | | | | 13 | |
Aptargroup, Inc. | | | 296 | | | | 16 | |
Beacon Roofing Supply, Inc. (Æ) | | | 784 | | | | 20 | |
Belden, Inc. | | | 464 | | | | 18 | |
Bemis Co., Inc. | | | 510 | | | | 16 | |
Calgon Carbon Corp. (Æ) | | | 1,011 | | | | 16 | |
Coeur d’Alene Mines Corp. (Æ) | | | 514 | | | | 12 | |
Comfort Systems USA, Inc. | | | 1,468 | | | | 16 | |
Commercial Metals Co. | | | 1,076 | | | | 16 | |
Compass Minerals International, Inc. | | | 196 | | | | 14 | |
Cytec Industries, Inc. | | | 327 | | | | 20 | |
Eagle Materials, Inc. | | | 665 | | | | 24 | |
Encore Wire Corp. | | | 595 | | | | 18 | |
Georgia Gulf Corp. (Æ) | | | 797 | | | | 29 | |
Gibraltar Industries, Inc. (Æ) | | | 1,131 | | | | 17 | |
| | | | |
| | 108 | | | Russell Small Cap Low P/E ETF |
Russell Exchange Traded Funds Trust
Russell Small Cap Low P/E ETF
Schedule of Investments, continued — March 31, 2012
Amounts in thousands (except share amounts)
| | | | | | | | |
| | | Principal
Amount ($)
or Shares | | | Market
Value
$ | |
| | | | | | | | |
HB Fuller Co. | | | 664 | | | | 22 | |
Innospec, Inc. (Æ) | | | 518 | | | | 16 | |
Interface, Inc. Class A | | | 1,308 | | | | 18 | |
Jaguar Mining, Inc. (Æ) | | | 2,104 | | | | 10 | |
Kaiser Aluminum Corp. | | | 323 | | | | 15 | |
KapStone Paper and Packaging Corp. (Æ) | | | 929 | | | | 18 | |
LB Foster Co. Class A | | | 524 | | | | 15 | |
Louisiana-Pacific Corp. (Æ) | | | 1,885 | | | | 18 | |
LSB Industries, Inc. (Æ) | | | 493 | | | | 19 | |
Martin Marietta Materials, Inc. | | | 196 | | | | 17 | |
Minerals Technologies, Inc. | | | 265 | | | | 17 | |
Mueller Industries, Inc. | | | 402 | | | | 18 | |
Myers Industries, Inc. | | | 1,227 | | | | 18 | |
Neenah Paper, Inc. | | | 818 | | | | 25 | |
Packaging Corp. of America | | | 589 | | | | 17 | |
PH Glatfelter Co. | | | 1,037 | | | | 16 | |
PolyOne Corp. | | | 1,421 | | | | 20 | |
Quaker Chemical Corp. | | | 387 | | | | 15 | |
Reliance Steel & Aluminum Co. | | | 312 | | | | 18 | |
RPM International, Inc. | | | 637 | | | | 17 | |
Sensient Technologies Corp. | | | 398 | | | | 15 | |
Silgan Holdings, Inc. | | | 394 | | | | 17 | |
Simpson Manufacturing Co., Inc. | | | 464 | | | | 15 | |
Sonoco Products Co. | | | 463 | | | | 15 | |
Stepan Co. | | | 189 | | | | 17 | |
Tredegar Corp. | | | 689 | | | | 13 | |
Universal Stainless & Alloy (Æ) | | | 398 | | | | 17 | |
Valmont Industries, Inc. | | | 177 | | | | 21 | |
Wausau Paper Corp. | | | 1,997 | | | | 19 | |
Worthington Industries, Inc. | | | 855 | | | | 16 | |
Zoltek Cos., Inc. (Æ) | | | 1,869 | | | | 21 | |
| | | | | | | | |
| | | | | | | 839 | |
| | | | | | | | |
| |
| Producer Durables - 19.6% | | | | | |
ABM Industries, Inc. | | | 709 | | | | 17 | |
Actuant Corp. Class A | | | 672 | | | | 19 | |
AECOM Technology Corp. (Æ) | | | 701 | | | | 16 | |
Alaska Air Group, Inc. (Æ) | | | 434 | | | | 16 | |
Allegiant Travel Co. Class A (Æ) | | | 289 | | | | 16 | |
Altra Holdings, Inc. (Æ) | | | 848 | | | | 16 | |
Applied Industrial Technologies, Inc. | | | 436 | | | | 18 | |
Astec Industries, Inc. (Æ) | | | 450 | | | | 16 | |
AZZ, Inc. | | | 362 | | | | 19 | |
BE Aerospace, Inc. (Æ) | | | 396 | | | | 18 | |
Brady Corp. Class A | | | 512 | | | | 17 | |
Briggs & Stratton Corp. | | | 998 | | | | 18 | |
Brink’s Co. (The) | | | 611 | | | | 15 | |
Bristow Group, Inc. | | | 327 | | | | 16 | |
Carlisle Cos., Inc. | | | 344 | | | | 17 | |
Cascade Corp. | | | 346 | | | | 17 | |
Cintas Corp. | | | 507 | | | | 20 | |
Consolidated Graphics, Inc. (Æ) | | | 295 | | | | 13 | |
Convergys Corp. (Æ) | | | 1,164 | | | | 16 | |
Copa Holdings SA Class A | | | 233 | | | | 18 | |
Corrections Corp. of America (Æ) | | | 734 | | | | 20 | |
Covanta Holding Corp. | | | 1,008 | | | | 16 | |
Curtiss-Wright Corp. | | | 457 | | | | 17 | |
| | | | | | | | |
| | | Principal
Amount ($)
or Shares | | | Market
Value
$ | |
Electronics for Imaging, Inc. (Æ) | | | 1,017 | | | | 17 | |
EMCOR Group, Inc. | | | 587 | | | | 16 | |
EnerSys (Æ) | | | 640 | | | | 22 | |
Ennis, Inc. | | | 1,013 | | | | 16 | |
EnPro Industries, Inc. (Æ) | | | 459 | | | | 19 | |
Forward Air Corp. | | | 469 | | | | 17 | |
Franklin Electric Co., Inc. | | | 320 | | | | 16 | |
FTI Consulting, Inc. (Æ) | | | 351 | | | | 13 | |
G&K Services, Inc. Class A | | | 503 | | | | 17 | |
Genpact, Ltd. (Æ) | | | 966 | | | | 16 | |
Granite Construction, Inc. | | | 604 | | | | 17 | |
Great Lakes Dredge & Dock Corp. | | | 2,487 | | | | 18 | |
Greenbrier Cos., Inc. (Æ) | | | 678 | | | | 13 | |
Harsco Corp. | | | 729 | | | | 17 | |
Heartland Express, Inc. | | | 1,094 | | | | 16 | |
Heidrick & Struggles International, Inc. | | | 706 | | | | 16 | |
HNI Corp. | | | 574 | | | | 16 | |
HUB Group, Inc. Class A (Æ) | | | 518 | | | | 19 | |
ICF International, Inc. (Æ) | | | 592 | | | | 15 | |
Kadant, Inc. (Æ) | | | 736 | | | | 18 | |
Kelly Services, Inc. Class A | | | 1,039 | | | | 17 | |
Kennametal, Inc. | | | 395 | | | | 18 | |
Korn/Ferry International (Æ) | | | 894 | | | | 15 | |
Lindsay Corp. | | | 272 | | | | 18 | |
MasTec, Inc. (Æ) | | | 940 | | | | 17 | |
MAXIMUS, Inc. | | | 362 | | | | 15 | |
Measurement Specialties, Inc. (Æ) | | | 537 | | | | 18 | |
Moog, Inc. Class A (Æ) | | | 360 | | | | 15 | |
Navigant Consulting, Inc. (Æ) | | | 1,368 | | | | 19 | |
Old Dominion Freight Line, Inc. (Æ) | | | 388 | | | | 18 | |
Pentair, Inc. | | | 396 | | | | 19 | |
Regal-Beloit Corp. | | | 286 | | | | 19 | |
RR Donnelley & Sons Co. | | | 1,002 | | | | 12 | |
Rush Enterprises, Inc. Class A (Æ) | | | 799 | | | | 17 | |
Ryder System, Inc. | | | 288 | | | | 15 | |
SPX Corp. | | | 242 | | | | 19 | |
Standex International Corp. | | | 480 | | | | 20 | |
Steelcase, Inc. Class A | | | 1,919 | | | | 18 | |
SYKES Enterprises, Inc. (Æ) | | | 941 | | | | 15 | |
Teledyne Technologies, Inc. (Æ) | | | 271 | | | | 17 | |
TeleTech Holdings, Inc. (Æ) | | | 854 | | | | 14 | |
Tetra Tech, Inc. (Æ) | | | 672 | | | | 18 | |
Textainer Group Holdings, Ltd. | | | 569 | | | | 19 | |
Thomas & Betts Corp. (Æ) | | | 295 | | | | 21 | |
Towers Watson & Co. Class A | | | 231 | | | | 15 | |
Trinity Industries, Inc. | | | 537 | | | | 18 | |
Triumph Group, Inc. | | | 253 | | | | 16 | |
Tutor Perini Corp. (Æ) | | | 912 | | | | 14 | |
Unifirst Corp. | | | 260 | | | | 16 | |
United Stationers, Inc. | | | 449 | | | | 14 | |
URS Corp. | | | 424 | | | | 18 | |
Waste Connections, Inc. | | | 459 | | | | 15 | |
Watts Water Technologies, Inc. Class A | | | 394 | | | | 16 | |
Werner Enterprises, Inc. | | | 642 | | | | 16 | |
WESCO International, Inc. (Æ) | | | 301 | | | | 20 | |
Zebra Technologies Corp. Class A (Æ) | | | 397 | | | | 16 | |
| | | | | | | | |
| | | | | | | 1,332 | |
| | | | | | | | |
| | |
| Russell Small Cap Low P/E ETF | | 109 |
Russell Exchange Traded Funds Trust
Russell Small Cap Low P/E ETF
Schedule of Investments, continued — March 31, 2012
Amounts in thousands (except share amounts)
| | | | | | | | |
| | | Principal
Amount ($)
or Shares | | | Market
Value
$ | |
| | | | | | | | |
| Technology - 13.6% | | | | | |
AboveNet, Inc. (Æ) | | | 252 | | | | 21 | |
Acacia Research Corp. (Æ) | | | 440 | | | | 18 | |
ACI Worldwide, Inc. (Æ) | | | 512 | | | | 21 | |
ADTRAN, Inc. | | | 455 | | | | 14 | |
Anaren, Inc. (Æ) | | | 899 | | | | 16 | |
Anixter International, Inc. (Æ) | | | 245 | | | | 18 | |
Arris Group, Inc. (Æ) | | | 1,399 | | | | 16 | |
ATMI, Inc. (Æ) | | | 727 | | | | 17 | |
Benchmark Electronics, Inc. (Æ) | | | 1,108 | | | | 18 | |
Brightpoint, Inc. (Æ) | | | 1,506 | | | | 12 | |
Brocade Communications Systems, Inc. (Æ) | | | 2,796 | | | | 16 | |
Brooks Automation, Inc. | | | 1,615 | | | | 20 | |
CACI International, Inc. Class A (Æ) | | | 267 | | | | 17 | |
Compuware Corp. (Æ) | | | 1,860 | | | | 17 | |
Comtech Telecommunications Corp. | | | 497 | | | | 16 | |
CSG Systems International, Inc. (Æ) | | | 992 | | | | 15 | |
DealerTrack Holdings, Inc. (Æ) | | | 581 | | | | 18 | |
Extreme Networks (Æ) | | | 5,117 | | | | 20 | |
GSI Group, Inc. (Æ) | | | 1,365 | | | | 16 | |
Harmonic, Inc. (Æ) | | | 2,801 | | | | 15 | |
II-VI, Inc. (Æ) | | | 783 | | | | 19 | |
Ingram Micro, Inc. Class A (Æ) | | | 835 | | | | 15 | |
Insight Enterprises, Inc. (Æ) | | | 1,051 | | | | 23 | |
Integrated Silicon Solution, Inc. (Æ) | | | 1,612 | | | | 18 | |
Intersil Corp. Class A | | | 1,415 | | | | 16 | |
JDA Software Group, Inc. (Æ) | | | 477 | | | | 13 | |
JDS Uniphase Corp. (Æ) | | | 1,404 | | | | 20 | |
Kulicke & Soffa Industries, Inc. (Æ) | | | 1,682 | | | | 21 | |
LeCroy Corp. (Æ) | | | 1,692 | | | | 18 | |
LSI Corp. (Æ) | | | 2,720 | | | | 23 | |
Mentor Graphics Corp. (Æ) | | | 1,210 | | | | 18 | |
Micrel, Inc. | | | 1,446 | | | | 15 | |
Microsemi Corp. (Æ) | | | 868 | | | | 19 | |
Molex, Inc. | | | 603 | | | | 17 | |
Monotype Imaging Holdings, Inc. (Æ) | | | 1,014 | | | | 15 | |
Multi-Fineline Electronix, Inc. (Æ) | | | 736 | | | | 20 | |
NCR Corp. (Æ) | | | 881 | | | | 19 | |
Netgear, Inc. (Æ) | | | 396 | | | | 15 | |
Plantronics, Inc. | | | 437 | | | | 18 | |
Plexus Corp. (Æ) | | | 564 | | | | 20 | |
Progress Software Corp. (Æ) | | | 739 | | | | 17 | |
QLogic Corp. (Æ) | | | 1,026 | | | | 18 | |
RF Micro Devices, Inc. (Æ) | | | 2,415 | | | | 12 | |
Rogers Corp. (Æ) | | | 379 | | | | 15 | |
Sanmina-SCI Corp. (Æ) | | | 1,808 | | | | 21 | |
Scansource, Inc. (Æ) | | | 437 | | | | 16 | |
Solera Holdings, Inc. | | | 318 | | | | 15 | |
Super Micro Computer, Inc. (Æ) | | | 1,126 | | | | 20 | |
Synaptics, Inc. (Æ) | | | 472 | | | | 17 | |
SYNNEX Corp. (Æ) | | | 524 | | | | 20 | |
VASCO Data Security International, Inc. (Æ) | | | 1,785 | | | | 19 | |
| | | | | | | | |
| | | Principal
Amount ($)
or Shares | | | Market
Value
$ | |
Websense, Inc. (Æ) | | | 831 | | | | 18 | |
Xyratex, Ltd. | | | 1,131 | | | | 18 | |
| | | | | | | | |
| | | | | | | 929 | |
| | | | | | | | |
| | |
| Utilities - 6.2% | | | | | | | | |
AGL Resources, Inc. | | | 598 | | | | 24 | |
Allete, Inc. | | | 378 | | | | 16 | |
Aqua America, Inc. | | | 687 | | | | 15 | |
Atlantic Tele-Network, Inc. | | | 372 | | | | 14 | |
Atmos Energy Corp. | | | 440 | | | | 14 | |
Black Hills Corp. | | | 459 | | | | 15 | |
California Water Service Group | | | 816 | | | | 15 | |
CH Energy Group, Inc. | | | 274 | | | | 18 | |
Chesapeake Utilities Corp. | | | 350 | | | | 14 | |
Empire District Electric Co. (The) | | | 715 | | | | 15 | |
Great Plains Energy, Inc. | | | 715 | | | | 14 | |
Hawaiian Electric Industries, Inc. | | | 581 | | | | 15 | |
IDT Corp. Class B | | | 1,157 | | | | 11 | |
j2 Global, Inc. | | | 555 | | | | 16 | |
Laclede Group, Inc. (The) | | | 375 | | | | 15 | |
Northwest Natural Gas Co. | | | 320 | | | | 15 | |
NorthWestern Corp. | | | 431 | | | | 15 | |
NV Energy, Inc. | | | 981 | | | | 16 | |
Otter Tail Corp. | | | 694 | | | | 15 | |
Piedmont Natural Gas Co., Inc. | | | 456 | | | | 14 | |
Premiere Global Services, Inc. (Æ) | | | 1,819 | | | | 16 | |
South Jersey Industries, Inc. | | | 268 | | | | 13 | |
Southwest Gas Corp. | | | 372 | | | | 16 | |
UGI Corp. | | | 502 | | | | 14 | |
UIL Holdings Corp. | | | 432 | | | | 15 | |
Vectren Corp. | | | 517 | | | | 15 | |
Westar Energy, Inc. | | | 545 | | | | 15 | |
WGL Holdings, Inc. | | | 351 | | | | 14 | |
| | | | | | | | |
| | | | | | | 424 | |
| | | | | | | | |
| | |
Total Common Stocks
(cost $5,954) | | | | | | | 6,799 | |
| | | | | | | | |
| | |
| Short-Term Investments - 0.3% | | | | | | | | |
Russell U.S. Cash Management Fund | | | 20,553 | (¥) | | | 21 | |
| | | | | | | | |
| | |
Total Short-Term Investments
(cost $21) | | | | | | | 21 | |
| | | | | | | | |
| | |
Total Investments - 100.0%
(identified cost $5,975) | | | | | | | 6,820 | |
| | |
Other Assets and Liabilities,
Net - 0.0% | | | | | | | 2 | |
| | | | | | | | |
| | |
| Net Assets - 100.0% | | | | | | | 6,822 | |
| | | | | | | | |
See accompanying notes which are an integral part of the financial statements.
| | | | |
| | 110 | | | Russell Small Cap Low P/E ETF |
Russell Exchange Traded Funds Trust
Russell Small Cap Low P/E ETF
Presentation of Portfolio Holdings — March 31, 2012
Amounts in thousands
| | | | | | | | | | | | | | | | | | | | |
| | | Market Value | | | % of Net
Assets | |
| Portfolio Summary | | Level 1 | | | Level 2 | | | Level 3 | | | Total | | |
| | | | | | | | | | | | | | | | | | | | |
Common Stocks | | | | | | | | | | | | | | | | | | | | |
Consumer Discretionary | | $ | 995 | | | $ | — | | | $ | — | | | $ | 995 | | | | 14.6 | |
Consumer Staples | | | 240 | | | | — | | | | — | | | | 240 | | | | 3.5 | |
Energy | | | 257 | | | | — | | | | — | | | | 257 | | | | 3.8 | |
Financial Services | | | 1,042 | | | | — | | | | 17 | | | | 1,059 | | | | 15.5 | |
Health Care | | | 724 | | | | — | | | | — | | | | 724 | | | | 10.6 | |
Materials and Processing | | | 839 | | | | — | | | | — | | | | 839 | | | | 12.3 | |
Producer Durables | | | 1,332 | | | | — | | | | — | | | | 1,332 | | | | 19.6 | |
Technology | | | 929 | | | | — | | | | — | | | | 929 | | | | 13.6 | |
Utilities | | | 424 | | | | — | | | | — | | | | 424 | | | | 6.2 | |
Short-Term Investments | | | — | | | | 21 | | | | — | | | | 21 | | | | 0.3 | |
| | | | | | | | | | | | | | | | | | | | |
| | | | | |
Total Investments | | | 6,782 | | | | 21 | | | | 17 | | | | 6,820 | | | | 100.0 | |
| | | | | | | | | | | | | | | | | | | | |
Other Assets and Liabilities, Net | | | | | | | | | | | | | | | | | | | — | * |
| | | | | | | | | | | | | | | | | | | | |
| | | | | |
| | | | | | | | | | | | | | | | | | | 100.0 | |
| | | | | | | | | | | | | | | | | | | | |
| * | Less than .05% of net assets. |
For a description of the levels see note 2 in the Notes to Financial Statements.
Investments in which significant unobservable inputs (Level 3) were used in determining a value for the period ending March 31, 2012 were less than 1% of net assets.
There were no significant transfers in and out of levels 1, 2 and 3 during the period ending March 31, 2012.
See accompanying notes which are an integral part of the financial statements.
| | |
| Russell Small Cap Low P/E ETF | | 111 |
Russell Exchange Traded Funds Trust
Russell Small Cap Low P/E ETF
Statement of Assets and Liabilities — March 31, 2012
| | | | |
| Amounts in thousands | | Russell Small Cap
Low P/E ETF | |
| | | | |
Assets | | | | |
Investments, at identified cost | | $ | 5,975 | |
Investments, at market* | | | 6,820 | |
Receivables: | | | | |
Dividends | | | 5 | |
| | | | |
Total assets | | | 6,825 | |
| | | | |
| |
Liabilities | | | | |
Payables: | | | | |
Accrued fees to affiliates | | | 3 | |
| | | | |
Total liabilities | | | 3 | |
| | | | |
| | | | |
Net Assets | | $ | 6,822 | |
| | | | |
Net Assets Consist of: | | | | |
Undistributed (overdistributed) net investment income | | $ | 2 | |
Accumulated net realized gain (loss) | | | (77 | ) |
Unrealized appreciation (depreciation) on investments | | | 845 | |
Additional paid-in capital | | | 6,052 | |
| | | | |
Net Assets | | $ | 6,822 | |
| | | | |
Net Asset Value, offering and redemption price per share: | | | | |
Net asset value per share:(a) | | $ | 68.22 | |
Net assets | | $ | 6,822,367 | |
Shares outstanding ($.001 par value) | | | 100,002 | |
Amounts in thousands | | | | |
| | | | |
* Investments in Affiliates, Russell U.S. Cash Management Fund | | $ | 21 | |
| (a) | Net asset value per share equals net assets divided by shares outstanding. |
See accompanying notes which are an integral part of the financial statements.
| | | | |
| | 112 | | | Statement of Assets and Liabilities |
Russell Exchange Traded Funds Trust
Russell Small Cap Low P/E ETF
Statement of Operations — For the Period Ended March 31, 2012
| | | | |
| Amounts in thousands | | Russell Small Cap
Low P/E ETF* | |
| | | | |
Investment Income | | | | |
Dividends | | $ | 42 | |
| | | | |
Total investment income | | | 42 | |
| | | | |
| |
Expenses | | | | |
Management fees | | | 14 | |
Trustee and trustee related fees | | | 9 | |
| | | | |
Expenses before reductions | | | 23 | |
Expense reductions | | | (9 | ) |
| | | | |
Net expenses | | | 14 | |
| | | | |
Net investment income (loss) | | | 28 | |
| | | | |
| |
Net Realized and Unrealized Gain (Loss) | | | | |
Net realized gain (loss) on: | | | | |
Investments | | | (79 | ) |
In-kind redemptions | | | 574 | |
| | | | |
Net realized gain (loss) | | | 495 | |
| | | | |
Net change in unrealized appreciation (depreciation) on investments | | | 845 | |
| | | | |
Net realized and unrealized gain (loss) | | | 1,340 | |
| | | | |
Net Increase (Decrease) in Net Assets from Operations | | $ | 1,368 | |
| | | | |
| * | For the period October 5, 2011 (commencement of operations) to March 31, 2012. |
See accompanying notes which are an integral part of the financial statements.
| | |
| Statement of Operations | | 113 |
Russell Exchange Traded Funds Trust
Russell Small Cap Low P/E ETF
Statement of Changes in Net Assets — For the Period Ended March 31,
| | | | |
| | | Russell Small Cap
Low P/E ETF | |
| Amounts in thousands | | 2012* | |
| | | | |
Increase (Decrease) in Net Assets | | | | |
| |
Operations | | | | |
Net investment income (loss) | | $ | 28 | |
Net realized gain (loss) | | | 495 | |
Net change in unrealized appreciation (depreciation) | | | 845 | |
| | | | |
Net increase (decrease) in net assets from operations | | | 1,368 | |
| | | | |
| |
Distributions | | | | |
From net investment income | | | (25 | ) |
| | | | |
Net decrease in net assets from distributions | | | (25 | ) |
| | | | |
| |
Share Transactions | | | | |
Net increase (decrease) in net assets from share transactions | | | 5,479 | |
| | | | |
Total Net Increase (Decrease) in Net Assets | | | 6,822 | |
| |
Net Assets | | | | |
Beginning of period | | | — | |
| | | | |
End of period | | $ | 6,822 | |
| | | | |
Undistributed (overdistributed) net investment income included in net assets | | $ | 2 | |
| * | For the period October 5, 2011 (commencement of operations) to March 31, 2012. |
See accompanying notes which are an integral part of the financial statements.
| | | | |
| | 114 | | | Statement of Changes in Net Assets |
(This page intentionally left blank)
Russell Exchange Traded Funds Trust
Russell Small Cap Low P/E ETF
Financial Highlights — For the Period Ended March 31, 2012
For a Share Outstanding Throughout Each Period.
| | | | | | | | | | | | | | | | | | | | | | | | |
| | | | | | |
| | | $
Net Asset Value,
Beginning of
Period | | | $
Net
Investment
Income (Loss)(a) | | | $
Net Realized
and Unrealized
Gain (Loss) | | | $
Total from
Investment
Operations | | | $
Distributions
from Net
Investment Income | | | $
Total
Distributions | |
Russell Small Cap Low P/E ETF | | | | | | | | | | | | | |
March 31, 2012* | | | 52.94 | | | | .28 | | | | 15.25 | | | | 15.53 | | | | (.25 | ) | | | (.25 | ) |
| (a) | Average daily shares outstanding were used for this calculation. |
| (b) | Periods less than one year are not annualized. |
| (c) | The ratios for periods less than one year are annualized. |
| (d) | Portfolio turnover rate excludes securities received or delivered from in-kind creation or redemption units. |
| * | For the period October 5, 2011 (commencement of operations) to March 31, 2012. |
See accompanying notes which are an integral part of the financial statements.
| | | | | | | | | | | | | | | | | | | | | | | | | | |
$
Net Asset Value,
End of Period | | | %
Total
Return(b) | | | $
Net Assets,
End of Period
(000) | | | %
Ratio of Expenses
to Average
Net Assets,
Gross(c) | | | %
Ratio of Expenses
to Average
Net Assets,
Net(c) | | | %
Ratio of Net
Investment Income
to Average
Net Assets(c) | | | % Portfolio
Turnover Rate(b)(d) | |
| | | | | | | | | | | | | | | | | | | | | | | | | | |
| | 68.22 | | | | 29.37 | | | | 6,822 | | | | .73 | | | | .45 | | | | .91 | | | | 43 | |
See accompanying notes which are an integral part of the financial statements.
Russell Exchange Traded Funds Trust
Russell Small Cap Contrarian ETF
Portfolio Management Discussion and Analysis — March 31, 2012 (Unaudited)
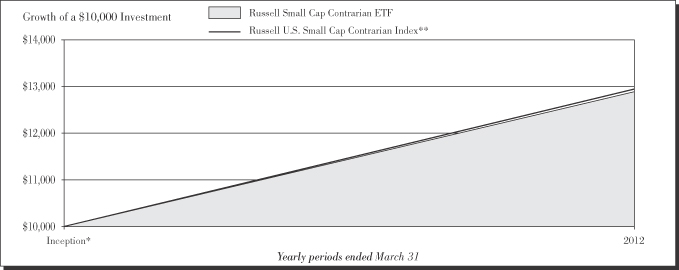
Performance as of March 31, 2012
| | | | | | | | | | | | |
|
| Average Annual Total Return | |
| | | Net Asset
Value | | | Market Value | | | Russell U.S.
Small Cap
Contrarian
Index** | |
Inception* | | | 28.19 | % | | | 28.72 | % | | | 28.71 | % |
| | | | |
| | 118 | | | Russell Small Cap Contrarian ETF |
Russell Exchange Traded Funds Trust
Russell Small Cap Contrarian ETF
Portfolio Management Discussion and Analysis — March 31, 2012 (Unaudited)
The Russell Small Cap Contrarian ETF (the “Fund”) is an index-based exchange-traded fund that seeks investment results that closely correspond to the total return of the Russell U.S. Small Cap Contrarian Index (the “Index”). Russell Investment Management Company (“RIMCo”), as the Fund’s advisor, uses a “passive” or indexing approach to try to achieve the Fund’s investment objective. Unlike many investment companies, the Fund does not try to “beat” the Index it tracks and does not seek temporary defensive positions when markets decline or appear overvalued. The Fund will normally invest at least 80% of its total assets in securities that comprise the Index.
What is the Fund’s investment objective?
The Fund seeks investment results that closely correspond to the total return of the Russell U.S. Small Cap Contrarian Index, which is designed to select securities intended to produce performance that is similar to professional investment managers following a small cap contrarian, deep value investment discipline.
Is the Fund replicating or sampling?
The Fund is replicating.
How did the Fund perform relative to its benchmark for the fiscal year ended March 31, 2012?
For the fiscal year ended March 31, 2012, the Fund gained 28.19%. This is compared to the Fund’s benchmark, the Russell U.S. Small Cap Contrarian Index, which gained 28.71% during the same period. The Fund’s performance includes operating expenses, whereas indexes are unmanaged and index returns do not include expenses of any kind.
There were no significant changes to either the Fund or Index during the reporting period.
Did the Fund outperform or underperform the benchmark or was performance as expected based on expenses, etc.?
The Fund performed as expected against the benchmark.
Over the reporting period, please describe those sectors that outperformed or underperformed.
All sectors had positive returns for the Fund and the Index. Health care was the best performing sector for the Fund and the Index, while utilities was the worst performing sector. Financial services, with an average weight of 24.8% was the best contributor to Fund and Index returns. Energy, with an average weight of 3.1%, contributed the least to Fund and Index returns.
Over the reporting period, please describe those individual securities (constituents) that outperformed or underperformed.
Global Cash Access Holdings Inc, Molina Healthcare Inc, and Prestige Brands Holdings Inc generated positive returns and contributed the most to Fund performance while RadioShack Corp, DHT Holdings Inc, and Bill Barrett Corp, all declined which detracted from Fund performance.
The views expressed in this report reflect those of the portfolio managers only through the end of the period covered by the report. These views do not necessarily represent the views of RIMCo, or any other person in RIMCo or any other affiliated organization. These views are subject to change at any time based upon market conditions or other events, and RIMCo disclaims any responsibility to update the views contained herein. These views should not be relied on as investment advice and, because investment decisions for a Russell Exchange Traded Funds Trust (“RET”) Fund are based on numerous factors, should not be relied on as an indication of investment decisions of any RET Fund.
| * | | Commenced operations by issuing shares October 5, 2011. |
| ** | | The Russell U.S. Small Cap Contrarian Index is designed to select securities intended to produce performance that is similar to professional investment managers following a small cap contrarian, deep value investment discipline. This discipline focuses on companies that have lagged the market but where opportunities exist for the stock price to improve. Starting with the Russell 2500® Index (an index comprised of U.S. stocks), the Index includes stocks with low historical price to sales and low book and cash flow multiples. The Index excludes stocks that have significantly outperformed the market as measured by cumulative total return over the last one to three years. The Index constituents are equally weighted. The Index is reconstituted semi-annually. |
Performance is historical and assumes reinvestment of all dividends and capital gains. Investment return and principal value will fluctuate so that an investor’s shares, when redeemed, may be worth more or less than when purchased. Past performance is not indicative of future results. The returns shown do not reflect the deduction of taxes that a shareholder would pay on Fund distributions or the redemption of Fund shares.
| | |
| Russell Small Cap Contrarian ETF | | 119 |
Russell Exchange Traded Funds Trust
Russell Small Cap Contrarian ETF
Shareholder Expense Example — March 31, 2012 (Unaudited)
Fund Expenses
The following disclosure provides important information regarding each Fund’s Expense Example, which appears on each Fund’s individual page in this Annual Report. Please refer to this information when reviewing the Expense Example for a Fund.
Example
As a shareholder of the Fund, you incur two types of costs: (1) transaction costs, including brokerage commissions on purchases and sales of your Fund shares and (2) ongoing costs, including management fees and other Fund expenses. The Example is intended to help you understand your ongoing costs (in dollars) of investing in the Fund and to compare these costs with the ongoing costs of investing in other funds. The Example is based on an investment of $1,000 invested at the beginning of the period and held for the entire period indicated, which for this Fund is from October 5, 2011 (commencement of operations) to March 31, 2012.
Actual Expenses
The information in the table under the heading “Actual Performance” provides information about actual account values and actual expenses. You may use the information in this column, together with the amount you invested, to estimate the expenses that you paid over the period. Simply divide your account value by $1,000 (for example, an $8,600 account value divided by $1,000 = 8.6), then multiply the result by the number in the first column in the row entitled “Expenses Paid During Period” to estimate the expenses you paid on your account during this period.
Hypothetical Example for Comparison Purposes
The information in the table under the heading “Hypothetical Performance (5% return before expenses)” provides information about hypothetical account values and hypothetical expenses based on the Fund’s actual expense ratio and an assumed rate of return of 5% per year before expenses, which is not the Fund’s actual return. The hypothetical account values and expenses may not be used to estimate the actual ending account balance or expenses you paid for the period. You may use this information to compare the ongoing costs of investing in the Fund and other funds. To do so, compare this 5% hypothetical example with the 5% hypothetical examples that appear in the shareholder reports of other funds.
Please note that the expenses shown in the table are meant to highlight your ongoing costs only and do not reflect any transactional costs, such as brokerage commissions paid on purchases and sales of Fund shares. Therefore, the information under the heading “Hypothetical Performance (5% return before expenses)” is useful in comparing ongoing costs only, and will not help you determine the relative total costs of owning different funds. In addition, if these transactional costs were included, your costs would have been higher.
| | | | | | | | |
| | | Actual
Performance | | | Hypothetical
Performance
(5% return
before expenses) | |
| | | | | | | | |
Beginning Account Value | | | | | | | | |
October 5, 2011 | | $ | 1,000.00 | | | $ | 1,000.00 | |
Ending Account Value | | | | | | | | |
March 31, 2012 | | $ | 1.281.90 | | | $ | 1,022.75 | |
Expenses Paid During Period* | | $ | 2.51 | | | $ | 2.28 | |
| * | Expenses are equal to the Fund’s annualized expense ratio of 0.45% (representing the 179-day period annualized), multiplied by the average account value over the period, multiplied by 179/366 (to reflect the period since commencement of operations). Hypothetical expenses are equal to the Fund’s annualized expense ratio of 0.45% (representing the six month period annualized) multiplied by the average amount value over the period, multiplied by 183/366 (to reflect the one-half year period). |
| | | | |
| | 120 | | | Russell Small Cap Contrarian ETF |
Russell Exchange Traded Funds Trust
Russell Small Cap Contrarian ETF
Schedule of Investments — March 31, 2012
Amounts in thousands (except share amounts)
| | | | | | | | |
| | | Principal
Amount ($)
or Shares | | | Market
Value
$ | |
| | | | | | | | |
| Common Stocks - 99.7% | | | | | | | | |
| Consumer Discretionary - 13.4% | | | | | | | | |
American Eagle Outfitters, Inc. | | | 1,928 | | | | 33 | |
American Greetings Corp. Class A | | | 1,592 | | | | 24 | |
Brown Shoe Co., Inc. | | | 3,224 | | | | 30 | |
Citi Trends, Inc. (Æ) | | | 3,025 | | | | 35 | |
Collective Brands, Inc. (Æ) | | | 1,923 | | | | 38 | |
Corinthian Colleges, Inc. (Æ) | | | 10,188 | | | | 43 | |
Dolan Co. (The) (Æ) | | | 2,980 | | | | 27 | |
DreamWorks Animation SKG, Inc. Class A (Æ) | | | 1,444 | | | | 27 | |
Drew Industries, Inc. (Æ) | | | 1,236 | | | | 34 | |
Fred’s, Inc. Class A | | | 1,995 | | | | 29 | |
Fuel Systems Solutions, Inc. (Æ) | | | 1,508 | | | | 39 | |
GameStop Corp. Class A | | | 1,159 | | | | 25 | |
Harris Teeter Supermarkets, Inc. | | | 672 | | | | 27 | |
Harte-Hanks, Inc. | | | 2,972 | | | | 27 | |
Helen of Troy, Ltd. (Æ) | | | 897 | | | | 31 | |
International Speedway Corp. Class A | | | 1,100 | | | | 31 | |
PF Chang’s China Bistro, Inc. | | | 884 | | | | 35 | |
RadioShack Corp. | | | 2,335 | | | | 15 | |
Regis Corp. | | | 1,668 | | | | 31 | |
Rent-A-Center, Inc. Class A | | | 745 | | | | 28 | |
Scientific Games Corp. Class A (Æ) | | | 3,116 | | | | 36 | |
Service Corp. International | | | 2,615 | | | | 29 | |
Skechers U.S.A., Inc. Class A (Æ) | | | 1,991 | | | | 25 | |
Stewart Enterprises, Inc. Class A | | | 4,309 | | | | 26 | |
Superior Industries International, Inc. | | | 1,661 | | | | 32 | |
Thor Industries, Inc. | | | 1,118 | | | | 35 | |
Vail Resorts, Inc. | | | 601 | | | | 26 | |
Viad Corp. | | | 1,445 | | | | 28 | |
Washington Post Co. (The) Class B | | | 75 | | | | 28 | |
WMS Industries, Inc. (Æ) | | | 1,278 | | | | 30 | |
| | | | | | | | |
| | | | | | | 904 | |
| | | | | | | | |
| | |
| Consumer Staples - 2.8% | | | | | | | | |
Cal-Maine Foods, Inc. | | | 792 | | | | 31 | |
Core-Mark Holding Co., Inc. | | | 696 | | | | 28 | |
Diamond Foods, Inc. | | | 975 | | | | 22 | |
Fresh Del Monte Produce, Inc. | | | 1,078 | | | | 25 | |
Nash Finch Co. | | | 975 | | | | 28 | |
Pantry, Inc. (The) (Æ) | | | 2,167 | | | | 28 | |
Spartan Stores, Inc. | | | 1,500 | | | | 27 | |
| | | | | | | | |
| | | | | | | 189 | |
| | | | | | | | |
| | |
| Energy - 2.8% | | | | | | | | |
Basic Energy Services, Inc. (Æ) | | | 1,423 | | | | 25 | |
Bill Barrett Corp. (Æ) | | | 687 | | | | 18 | |
Cal Dive International, Inc. (Æ) | | | 11,371 | | | | 37 | |
Dawson Geophysical Co. (Æ) | | | 775 | | | | 27 | |
SEACOR Holdings, Inc. (Æ) | | | 313 | | | | 29 | |
Tesco Corp. (Æ) | | | 2,011 | | | | 29 | |
Unit Corp. (Æ) | | | 530 | | | | 23 | |
| | | | | | | | |
| | | | | | | 188 | |
| | | | | | | | |
| | |
| Financial Services - 23.9% | | | | | | | | |
Allied World Assurance Co. Holdings AG | | | 451 | | | | 31 | |
| | | | | | | | |
| | | Principal
Amount ($)
or Shares | | | Market
Value
$ | |
American Equity Investment Life Holding Co. | | | 2,423 | | | | 31 | |
American Financial Group, Inc. | | | 745 | | | | 29 | |
Anworth Mortgage Asset Corp. (ö) | | | 4,231 | | | | 28 | |
Argo Group International Holdings, Ltd. | | | 923 | | | | 28 | |
Aspen Insurance Holdings, Ltd. | | | 1,020 | | | | 28 | |
Associated Banc-Corp. | | | 2,601 | | | | 36 | |
Astoria Financial Corp. | | | 3,556 | | | | 35 | |
BancorpSouth, Inc. | | | 2,741 | | | | 37 | |
BBCN Bancorp, Inc. (Æ) | | | 2,861 | | | | 32 | |
BGC Partners, Inc. Class A | | | 4,300 | | | | 32 | |
BlackRock Kelso Capital Corp. | | | 3,081 | | | | 30 | |
Capstead Mortgage Corp. (ö) | | | 2,151 | | | | 28 | |
City National Corp. | | | 632 | | | | 33 | |
Dime Community Bancshares, Inc. | | | 2,264 | | | | 33 | |
Dynex Capital, Inc. (ö) | | | 3,056 | | | | 29 | |
East West Bancorp, Inc. | | | 1,370 | | | | 32 | |
Endurance Specialty Holdings, Ltd. | | | 741 | | | | 30 | |
Euronet Worldwide, Inc. (Æ) | | | 1,489 | | | | 31 | |
Fidelity National Financial, Inc. Class A | | | 1,704 | | | | 31 | |
First Citizens BancShares, Inc. Class A (Æ) | | | 156 | | | | 28 | |
First Commonwealth Financial Corp. | | | 5,778 | | | | 35 | |
First Niagara Financial Group, Inc. | | | 3,046 | | | | 30 | |
Flagstone Reinsurance Holdings SA | | | 3,307 | | | | 26 | |
GFI Group, Inc. | | | 6,365 | | | | 24 | |
Glacier Bancorp, Inc. | | | 2,252 | | | | 34 | |
Hercules Technology Growth Capital, Inc. | | | 2,866 | | | | 32 | |
Horace Mann Educators Corp. | | | 2,198 | | | | 39 | |
Hudson City Bancorp, Inc. | | | 4,797 | | | | 35 | |
Iberiabank Corp. | | | 543 | | | | 29 | |
Infinity Property & Casualty Corp. | | | 467 | | | | 24 | |
Investment Technology Group, Inc. (Æ) | | | 2,540 | | | | 30 | |
Jefferies Group, Inc. | | | 2,348 | | | | 45 | |
KBW, Inc. | | | 1,985 | | | | 37 | |
Kemper Corp. | | | 982 | | | | 30 | |
Knight Capital Group, Inc. Class A (Æ) | | | 2,122 | | | | 27 | |
MB Financial, Inc. | | | 1,593 | | | | 33 | |
Montpelier Re Holdings, Ltd. | | | 1,589 | | | | 31 | |
NASDAQ OMX Group, Inc. (The) (Æ) | | | 1,021 | | | | 26 | |
Navigators Group, Inc. (The) (Æ) | | | 574 | | | | 27 | |
Park National Corp. | | | 444 | | | | 31 | |
Piper Jaffray Cos. (Æ) | | | 1,296 | | | | 34 | |
Platinum Underwriters Holdings, Ltd. | | | 778 | | | | 28 | |
Provident Financial Services, Inc. | | | 2,067 | | | | 30 | |
Safety Insurance Group, Inc. | | | 641 | | | | 27 | |
Selective Insurance Group, Inc. | | | 1,629 | | | | 29 | |
Susquehanna Bancshares, Inc. | | | 3,416 | | | | 34 | |
TCF Financial Corp. | | | 2,689 | | | | 32 | |
Umpqua Holdings Corp. | | | 2,164 | | | | 29 | |
Validus Holdings, Ltd. | | | 891 | | | | 28 | |
Washington Federal, Inc. | | | 2,079 | | | | 35 | |
Wintrust Financial Corp. | | | 973 | | | | 35 | |
| | | | | | | | |
| | | | | | | 1,618 | |
| | | | | | | | |
| | |
| Health Care - 7.5% | | | | | | | | |
Almost Family, Inc. (Æ) | | | 1,807 | | | | 47 | |
Community Health Systems, Inc. (Æ) | | | 1,349 | | | | 30 | |
| | |
| Russell Small Cap Contrarian ETF | | 121 |
Russell Exchange Traded Funds Trust
Russell Small Cap Contrarian ETF
Schedule of Investments, continued — March 31, 2012
Amounts in thousands (except share amounts)
| | | | | | | | |
| | | Principal
Amount ($)
or Shares | | | Market
Value
$ | |
| | | | | | | | |
CONMED Corp. | | | 1,019 | | | | 30 | |
Greatbatch, Inc. (Æ) | | | 1,212 | | | | 30 | |
Hanger Orthopedic Group, Inc. (Æ) | | | 1,677 | | | | 37 | |
Kindred Healthcare, Inc. (Æ) | | | 2,162 | | | | 19 | |
Magellan Health Services, Inc. (Æ) | | | 529 | | | | 26 | |
Molina Healthcare, Inc. (Æ) | | | 1,238 | | | | 42 | |
Natus Medical, Inc. (Æ) | | | 3,210 | | | | 38 | |
Owens & Minor, Inc. | | | 870 | | | | 26 | |
PerkinElmer, Inc. | | | 1,430 | | | | 40 | |
Prestige Brands Holdings, Inc. (Æ) | | | 2,720 | | | | 48 | |
Symmetry Medical, Inc. (Æ) | | | 3,455 | | | | 24 | |
Triple-S Management Corp. Class B (Æ) | | | 1,389 | | | | 32 | |
Wright Medical Group, Inc. (Æ) | | | 1,828 | | | | 35 | |
| | | | | | | | |
| | | | | | | 504 | |
| | | | | | | | |
| | |
| Materials and Processing - 9.4% | | | | | | | | |
A Schulman, Inc. | | | 1,298 | | | | 35 | |
Apogee Enterprises, Inc. | | | 2,530 | | | | 33 | |
Beacon Roofing Supply, Inc. (Æ) | | | 1,373 | | | | 35 | |
Cabot Corp. | | | 815 | | | | 35 | |
Comfort Systems USA, Inc. | | | 2,568 | | | | 28 | |
Commercial Metals Co. | | | 1,935 | | | | 29 | |
Cytec Industries, Inc. | | | 576 | | | | 35 | |
Encore Wire Corp. | | | 1,044 | | | | 31 | |
HB Fuller Co. | | | 1,173 | | | | 39 | |
Interline Brands, Inc. (Æ) | | | 1,714 | | | | 37 | |
Minerals Technologies, Inc. | | | 462 | | | | 30 | |
Mueller Industries, Inc. | | | 703 | | | | 32 | |
OM Group, Inc. (Æ) | | | 1,178 | | | | 32 | |
PH Glatfelter Co. | | | 1,866 | | | | 29 | |
Quanex Building Products Corp. | | | 1,777 | | | | 31 | |
Schnitzer Steel Industries, Inc. Class A | | | 577 | | | | 23 | |
Sealed Air Corp. | | | 1,543 | | | | 30 | |
Tredegar Corp. | | | 1,239 | | | | 24 | |
Universal Forest Products, Inc. | | | 963 | | | | 33 | |
Wausau Paper Corp. | | | 3,472 | | | | 33 | |
| | | | | | | | |
| | | | | | | 634 | |
| | | | | | | | |
| | |
| Producer Durables - 19.8% | | | | | | | | |
ABM Industries, Inc. | | | 1,234 | | | | 30 | |
AECOM Technology Corp. (Æ) | | | 1,250 | | | | 28 | |
Albany International Corp. Class A | | | 1,105 | | | | 25 | |
Alexander & Baldwin, Inc. | | | 717 | | | | 35 | |
Brady Corp. Class A | | | 903 | | | | 29 | |
Brink’s Co. (The) | | | 1,099 | | | | 26 | |
Bristow Group, Inc. | | | 582 | | | | 28 | |
Ceradyne, Inc. | | | 901 | | | | 29 | |
CIRCOR International, Inc. | | | 832 | | | | 28 | |
Convergys Corp. (Æ) | | | 2,094 | | | | 28 | |
EMCOR Group, Inc. | | | 1,055 | | | | 29 | |
EnergySolutions, Inc. (Æ) | | | 8,499 | | | | 42 | |
EnPro Industries, Inc. (Æ) | | | 808 | | | | 33 | |
G&K Services, Inc. Class A | | | 896 | | | | 31 | |
Genco Shipping & Trading, Ltd. (Æ) | | | 3,536 | | | | 22 | |
General Cable Corp. (Æ) | | | 1,011 | | | | 29 | |
Granite Construction, Inc. | | | 1,086 | | | | 31 | |
Great Lakes Dredge & Dock Corp. | | | 4,430 | | | | 32 | |
| | | | | | | | |
| | | Principal
Amount ($)
or Shares | | | Market
Value
$ | |
H&E Equipment Services, Inc. (Æ) | | | 2,113 | | | | 40 | |
Harsco Corp. | | | 1,311 | | | | 31 | |
Heidrick & Struggles International, Inc. | | | 1,270 | | | | 28 | |
ICF International, Inc. (Æ) | | | 1,043 | | | | 26 | |
Kadant, Inc. (Æ) | | | 1,313 | | | | 31 | |
Kelly Services, Inc. Class A | | | 1,851 | | | | 30 | |
Korn/Ferry International (Æ) | | | 1,592 | | | | 27 | |
Layne Christensen Co. (Æ) | | | 1,071 | | | | 24 | |
Metalico, Inc. (Æ) | | | 7,664 | | | | 33 | |
Mobile Mini, Inc. (Æ) | | | 1,486 | | | | 31 | |
MYR Group, Inc. (Æ) | | | 1,542 | | | | 28 | |
Orbital Sciences Corp. (Æ) | | | 1,805 | | | | 24 | |
Orion Marine Group, Inc. (Æ) | | | 4,462 | | | | 32 | |
Powell Industries, Inc. (Æ) | | | 884 | | | | 30 | |
Republic Airways Holdings, Inc. (Æ) | | | 7,063 | | | | 35 | |
RR Donnelley & Sons Co. | | | 1,784 | | | | 22 | |
Rush Enterprises, Inc. Class A (Æ) | | | 1,412 | | | | 30 | |
Ryder System, Inc. | | | 518 | | | | 27 | |
SkyWest, Inc. | | | 2,213 | | | | 24 | |
SPX Corp. | | | 423 | | | | 33 | |
SYKES Enterprises, Inc. (Æ) | | | 1,645 | | | | 26 | |
Teekay Tankers, Ltd. Class A | | | 7,053 | | | | 44 | |
Tetra Tech, Inc. (Æ) | | | 1,197 | | | | 32 | |
Trinity Industries, Inc. | | | 946 | | | | 31 | |
Tutor Perini Corp. (Æ) | | | 1,625 | | | | 25 | |
URS Corp. | | | 752 | | | | 32 | |
Werner Enterprises, Inc. | | | 1,144 | | | | 28 | |
| | | | | | | | |
| | | | | | | 1,339 | |
| | | | | | | | |
| | |
| Technology - 9.3% | | | | | | | | |
Acxiom Corp. (Æ) | | | 2,175 | | | | 32 | |
Anaren, Inc. (Æ) | | | 1,599 | | | | 29 | |
Arris Group, Inc. (Æ) | | | 2,493 | | | | 28 | |
AVX Corp. | | | 2,091 | | | | 28 | |
Benchmark Electronics, Inc. (Æ) | | | 1,959 | | | | 32 | |
Brocade Communications Systems, Inc. (Æ) | | | 5,028 | | | | 29 | |
CACI International, Inc. Class A (Æ) | | | 475 | | | | 30 | |
Checkpoint Systems, Inc. (Æ) | | | 2,219 | | | | 25 | |
Comtech Telecommunications Corp. | | | 885 | | | | 29 | |
CSG Systems International, Inc. (Æ) | | | 1,783 | | | | 27 | |
Digital River, Inc. (Æ) | | | 1,676 | | | | 31 | |
Earthlink, Inc. | | | 4,294 | | | | 34 | |
Harmonic, Inc. (Æ) | | | 4,991 | | | | 27 | |
Ingram Micro, Inc. Class A (Æ) | | | 1,502 | | | | 28 | |
International Rectifier Corp. (Æ) | | | 1,275 | | | | 29 | |
Multi-Fineline Electronix, Inc. (Æ) | | | 1,293 | | | | 35 | |
Plexus Corp. (Æ) | | | 996 | | | | 35 | |
Sigma Designs, Inc. (Æ) | | | 3,845 | | | | 20 | |
TeleCommunication Systems, Inc. Class A(Æ) | | | 9,964 | | | | 28 | |
TriQuint Semiconductor, Inc. (Æ) | | | 6,143 | | | | 43 | |
United Online, Inc. | | | 5,124 | | | | 25 | |
| | | | | | | | |
| | | | | | | 624 | |
| | | | | | | | |
| | |
| Utilities - 10.8% | | | | | | | | |
AGL Resources, Inc. | | | 656 | | | | 26 | |
Allete, Inc. | | | 679 | | | | 28 | |
| | | | |
| | 122 | | | Russell Small Cap Contrarian ETF |
Russell Exchange Traded Funds Trust
Russell Small Cap Contrarian ETF
Schedule of Investments, continued — March 31, 2012
Amounts in thousands (except share amounts)
| | | | | | | | |
| | | Principal
Amount ($)
or Shares | | | Market
Value
$ | |
| | | | | | | | |
Atlantic Tele-Network, Inc. | | | 648 | | | | 24 | |
Atmos Energy Corp. | | | 791 | | | | 25 | |
Avista Corp. | | | 1,082 | | | | 28 | |
Black Hills Corp. | | | 826 | | | | 28 | |
CH Energy Group, Inc. | | | 482 | | | | 32 | |
Chesapeake Utilities Corp. | | | 624 | | | | 26 | |
Cleco Corp. | | | 741 | | | | 29 | |
El Paso Electric Co. | | | 776 | | | | 25 | |
Empire District Electric Co. (The) | | | 1,285 | | | | 26 | |
Energen Corp. | | | 529 | | | | 26 | |
Great Plains Energy, Inc. | | | 1,286 | | | | 26 | |
Hawaiian Electric Industries, Inc. | | | 1,033 | | | | 26 | |
Laclede Group, Inc. (The) | | | 668 | | | | 26 | |
NorthWestern Corp. | | | 775 | | | | 27 | |
NV Energy, Inc. | | | 1,763 | | | | 28 | |
Ormat Technologies, Inc. | | | 1,412 | | | | 28 | |
Otter Tail Corp. | | | 1,248 | | | | 27 | |
Portland General Electric Co. | | | 1,080 | | | | 27 | |
Southwest Gas Corp. | | | 669 | | | | 29 | |
UGI Corp. | | | 903 | | | | 25 | |
UIL Holdings Corp. | | | 769 | | | | 27 | |
Unisource Energy Corp. | | | 727 | | | | 27 | |
US Cellular Corp. (Æ) | | | 613 | | | | 25 | |
Vectren Corp. | | | 929 | | | | 27 | |
Westar Energy, Inc. | | | 979 | | | | 27 | |
| | | | | | | | |
| | | | | | | 725 | |
| | | | | | | | |
| | |
Total Common Stocks
(cost $5,775) | | | | | | | 6,725 | |
| | | | | | | | |
| | |
| Short-Term Investments - 0.2% | | | | | | | | |
Russell U.S. Cash Management Fund | | | 10,860 | (¥) | | | 11 | |
| | | | | | | | |
| | |
Total Short-Term Investments
(cost $11) | | | | | | | 11 | |
| | | | | | | | |
| | |
Total Investments - 99.9%
(identified cost $5,786) | | | | | | | 6,736 | |
| | |
Other Assets and Liabilities,
Net - 0.1% | | | | | | | 4 | |
| | | | | | | | |
| | |
| Net Assets - 100.0% | | | | | | | 6,740 | |
| | | | | | | | |
See accompanying notes which are an integral part of the financial statements.
| | |
| Russell Small Cap Contrarian ETF | | 123 |
Russell Exchange Traded Funds Trust
Russell Small Cap Contrarian ETF
Presentation of Portfolio Holdings — March 31, 2012
Amounts in thousands
| | | | | | | | | | | | | | | | | | | | |
| | | Market Value | | | % of Net
Assets | |
| Portfolio Summary | | Level 1 | | | Level 2 | | | Level 3 | | | Total | | |
| | | | | | | | | | | | | | | | | | | | |
Common Stocks | | | | | | | | | | | | | | | | | | | | |
Consumer Discretionary | | $ | 904 | | | $ | — | | | $ | — | | | $ | 904 | | | | 13.4 | |
Consumer Staples | | | 189 | | | | — | | | | — | | | | 189 | | | | 2.8 | |
Energy | | | 188 | | | | — | | | | — | | | | 188 | | | | 2.8 | |
Financial Services | | | 1,618 | | | | — | | | | — | | | | 1,618 | | | | 23.9 | |
Health Care | | | 504 | | | | — | | | | — | | | | 504 | | | | 7.5 | |
Materials and Processing | | | 634 | | | | — | | | | — | | | | 634 | | | | 9.4 | |
Producer Durables | | | 1,339 | | | | — | | | | — | | | | 1,339 | | | | 19.8 | |
Technology | | | 624 | | | | — | | | | — | | | | 624 | | | | 9.3 | |
Utilities | | | 725 | | | | — | | | | — | | | | 725 | | | | 10.8 | |
Short-Term Investments | | | — | | | | 11 | | | | — | | | | 11 | | | | 0.2 | |
| | | | | | | | | | | | | | | | | | | | |
Total Investments | | | 6,725 | | | | 11 | | | | — | | | | 6,736 | | | | 99.9 | |
| | | | | | | | | | | | | | | | | | | | |
Other Assets and Liabilities, Net | | | | | | | | | | | | | | | | | | | 0.1 | |
| | | | | | | | | | | | | | | | | | | | |
| | | | | | | | | | | | | | | | | | | 100.0 | |
| | | | | | | | | | | | | | | | | | | | |
For a description of the levels see note 2 in the Notes to Financial Statements.
There were no significant transfers in and out of levels 1, 2 and 3 during the period ending March 31, 2012.
See accompanying notes which are an integral part of the financial statements.
| | | | |
| | 124 | | | Russell Small Cap Contrarian ETF |
Russell Exchange Traded Funds Trust
Russell Small Cap Contrarian ETF
Statement of Assets and Liabilities — March 31, 2012
| | | | |
| Amounts in thousands | | Russell Small
Cap Contrarian
ETF | |
| | | | |
Assets | | | | |
Investments, at identified cost | | $ | 5,786 | |
Investments, at market* | | | 6,736 | |
Receivables: | | | | |
Dividends | | | 7 | |
| | | | |
Total assets | | | 6,743 | |
| | | | |
| |
Liabilities | | | | |
Payables: | | | | |
Accrued fees to affiliates | | | 3 | |
| | | | |
Total liabilities | | | 3 | |
| | | | |
| | | | |
Net Assets | | $ | 6,740 | |
| | | | |
Net Assets Consist of: | | | | |
Undistributed (overdistributed) net investment income | | $ | 3 | |
Accumulated net realized gain (loss) | | | (93 | ) |
Unrealized appreciation (depreciation) on investments | | | 950 | |
Additional paid-in capital | | | 5,880 | |
| | | | |
Net Assets | | $ | 6,740 | |
| | | | |
Net Asset Value, offering and redemption price per share: | | | | |
Net asset value per share:(a) | | $ | 67.40 | |
Net assets | | $ | 6,740,111 | |
Shares outstanding ($.001 par value) | | | 100,002 | |
Amounts in thousands | | | | |
| | | | |
* Investments in Affiliates, Russell U.S. Cash Management Fund | | $ | 11 | |
| (a) | Net asset value per share equals net assets divided by shares outstanding. |
See accompanying notes which are an integral part of the financial statements.
| | |
| Statement of Assets and Liabilities | | 125 |
Russell Exchange Traded Funds Trust
Russell Small Cap Contrarian ETF
Statement of Operations — For the Period Ended March 31, 2012
| | | | |
| Amounts in thousands | | Russell Small
Cap Contrarian
ETF* | |
| | | | |
Investment Income | | | | |
Dividends | | $ | 94 | |
| | | | |
Total investment income | | | 94 | |
| | | | |
| |
Expenses | | | | |
Management fees | | | 23 | |
Trustee and trustee related fees | | | 15 | |
| | | | |
Expenses before reductions | | | 38 | |
Expense reductions | | | (15 | ) |
| | | | |
Net expenses | | | 23 | |
| | | | |
Net investment income (loss) | | | 71 | |
| | | | |
| |
Net Realized and Unrealized Gain (Loss) | | | | |
Net realized gain (loss) on: | | | | |
Investments | | | (94 | ) |
In-kind redemptions | | | 1,664 | |
| | | | |
Net realized gain (loss) | | | 1,570 | |
| | | | |
Net change in unrealized appreciation (depreciation) on investments | | | 950 | |
| | | | |
Net realized and unrealized gain (loss) | | | 2,520 | |
| | | | |
Net Increase (Decrease) in Net Assets from Operations | | $ | 2,591 | |
| | | | |
| * | For the period October 5, 2011 (commencement of operations) to March 31, 2012. |
See accompanying notes which are an integral part of the financial statements.
| | | | |
| | 126 | | | Statements of Operations |
Russell Exchange Traded Funds Trust
Russell Small Cap Contrarian ETF
Statement of Changes in Net Assets — For the Periods Ended March 31,
| | | | |
| | | Russell Small Cap
Contrarian ETF | |
| Amounts in thousands | | 2012* | |
| | | | |
Increase (Decrease) in Net Assets | | | | |
| |
Operations | | | | |
Net investment income (loss) | | $ | 71 | |
Net realized gain (loss) | | | 1,570 | |
Net change in unrealized appreciation (depreciation) | | | 950 | |
| | | | |
Net increase (decrease) in net assets from operations | | | 2,591 | |
| | | | |
| |
Distributions | | | | |
From net investment income | | | (67 | ) |
| | | | |
Net decrease in net assets from distributions | | | (67 | ) |
| | | | |
| |
Share Transactions | | | | |
Net increase (decrease) in net assets from share transactions | | | 4,216 | |
| | | | |
Total Net Increase (Decrease) in Net Assets | | | 6,740 | |
| |
Net Assets | | | | |
Beginning of period | | | — | |
| | | | |
End of period | | $ | 6,740 | |
| | | | |
Undistributed (overdistributed) net investment income included in net assets | | $ | 3 | |
| * | For the period October 5, 2011 (commencement of operations) to March 31, 2012. |
See accompanying notes which are an integral part of the financial statements.
| | |
| Statements of Changes in Net Assets | | 127 |
Russell Exchange Traded Funds Trust
Russell Small Cap Contrarian ETF
Financial Highlights — For the Period Ended
For a Share Outstanding Throughout Each Period.
| | | | | | | | | | | | | | | | | | | | | | | | |
| | | $
Net Asset Value,
Beginning of
Period | | | $
Net
Investment
Income (Loss)(a) | | | $
Net Realized
and Unrealized
Gain (Loss) | | | $
Total from
Investment
Operations | | |
$
Distributions
from Net
Investment Income | | | $
Total
Distributions | |
Russell Small Cap Contrarian ETF | | | | | | | | | | | | | | | | | |
March 31, 2012* | | | 52.93 | | | | .43 | | | | 14.48 | | | | 14.91 | | | | (.44 | ) | | | (.44 | ) |
| (a) | Average daily shares outstanding were used for this calculation. |
| (b) | Periods less than one year are not annualized. |
| (c) | The ratios for periods less than one year are annualized. |
| (d) | Portfolio turnover rate excludes securities received or delivered from in-kind creation or redemption units. |
| * | For the period October 5, 2011 (commencement of operations) to March 31, 2012. |
See accompanying notes which are an integral part of the financial statements.
| | | | | | | | | | | | | | | | | | | | | | | | | | |
$
Net Asset Value,
End of
Period | | | %
Total
Return(b) | | | $
Net Assets,
End of Period
(000) | | | %
Ratio of Expenses
to Average
Net Assets,
Gross(c) | | | %
Ratio of Expenses
to Average
Net Assets,
Net(c) | | | %
Ratio of Net Investment Income
to Average
Net Assets(c) | | | %
Portfolio
Turnover Rate(b)(d) | |
| | | | | | | | | | | | | | | | | | | | | | | | | | |
| | 67.40 | | | | 28.19 | | | | 6,740 | | | | .74 | | | | .45 | | | | 1.40 | | | | 57 | |
See accompanying notes which are an integral part of the financial statements.
Russell Exchange Traded Funds Trust
Russell Investment Discipline ETFsTM
Notes to Schedules of Investments — March 31, 2012
Footnotes:
| (Æ) | Nonincome-producing security. |
| (ö) | Real Estate Investment Trust (REIT). |
Abbreviations:
ADR - American Depositary Receipt
| | | | |
| | 130 | | | Notes to Schedules of Investments |
Russell Exchange Traded Funds Trust
Russell Investment Discipline ETFs™
Notes to Financial Statements — March 31, 2012
Russell Exchange Traded Funds Trust (the “Investment Company” or “RET”) is a series investment company comprised of 26 different investment portfolios that were in operation as of March 31, 2012. These financial statements report on 10 of these Funds (each a “Fund” and collectively, the “Funds”). The Investment Company is registered under the Investment Company Act of 1940, as amended, as an open-end management investment company. It is organized and operated as a Delaware statutory trust under an Amended and Restated Agreement and Declaration of Trust dated August 31, 2011 (“Master Trust Agreement”). The Investment Company’s Master Trust Agreement permits the Board of Trustees (the “Board”) to issue an unlimited number of shares of beneficial interest.
Each Fund is an exchange-traded fund (“ETF”). ETFs are funds that trade like other publicly-traded securities and may be designed to track an index or to be actively managed. The investment objective of the Funds is to seek investment results that correspond generally to the price and yield performance, before fees and expenses, of its underlying index. The investment adviser uses a “passive” or index approach to try to achieve each Fund’s investment objective.
Unlike shares of a mutual fund, which can be bought from and redeemed by the issuing fund by all shareholders at a price based on net asset value (“NAV”), shares of a Fund may be directly purchased from and redeemed by a Fund at NAV solely by certain large institutional investors. Also unlike shares of a mutual fund, shares of each Fund are listed on a national securities exchange and trade in the secondary market at market prices that change throughout the day. The date the shares began trading on the secondary market is the “commencement of operations” date.
The Funds issue and redeem shares at their respective NAV only in blocks of a specified number of shares or multiples thereof (“Creation Units”). Only certain large institutional investors may purchase or redeem Creation Units directly with the Funds at NAV (“Authorized Participants”). These transactions are in exchange for certain securities similar to a Fund’s portfolio and/or cash. Except when aggregated in Creation Units, shares of a Fund are not redeemable securities. Shareholders who are not Authorized Participants may not redeem shares directly from a Fund.
| 2. | | Significant Accounting Policies |
The Funds’ financial statements are prepared in accordance with accounting principles generally accepted in the United States of America (“U.S. GAAP”) which require the use of management estimates and assumptions at the date of the financial statements. Actual results could differ from those estimates. The following is a summary of the significant accounting policies consistently followed by each Fund in the preparation of its financial statements.
Security Valuation
The Funds value portfolio securities according to Board-approved securities valuation procedures which include market and fair value procedures. The Board has delegated the responsibility for administration of the securities valuation procedures to Russell Funds Services Company (“RFSC”).
U.S. GAAP defines fair market value as the price that a Fund would receive to sell an asset or pay to transfer a liability in an orderly transaction between market participants at the measurement date. It establishes a fair value hierarchy that prioritizes inputs to valuation methods and requires a separate disclosure of the fair value hierarchy, for each major category of assets and liabilities, that segregates fair value measurements into levels (Level 1, 2, and 3). The inputs or methodology used for valuing securities are not necessarily an indication of the risk associated with investing in those securities. Levels 1, 2 and 3 of the fair value hierarchy are defined as follows:
| | • | | Level 1 — Quoted prices (unadjusted) in active markets or exchanges for identical assets and liabilities. |
| | • | | Level 2 — Significant other observable inputs, which may include, but are not limited to, quoted prices for similar assets or liabilities in markets that are active, quoted prices for identical or similar assets or liabilities in markets that are non-active, inputs other than quoted prices that are observable for the assets or liabilities (such as interest rates, yield curves, volatilities, prepayment speeds, loss severities, credit risks and default rates) or other market corroborated inputs. |
| | • | | Level 3 — Significant unobservable inputs based on the best information available in the circumstances, to the extent observable inputs are not available, which may include assumptions made by the Board or persons acting at their direction that are used in determining the fair market value of investments. |
The valuation techniques and significant inputs used in determining the fair market values of financial instruments classified as Level 1 and Level 2 of the fair value hierarchy are as follows:
Common stocks and exchange traded funds that are traded on a national securities exchange are stated at the last reported sale or settlement price on the day of valuation. To the extent these securities are actively traded and valuation adjustments are not applied, they are categorized as Level 1 of the fair value hierarchy.
| | |
| Notes to Financial Statements | | 131 |
Russell Exchange Traded Funds Trust
Russell Investment Discipline ETFs™
Notes to Financial Statements, continued — March 31, 2012
Investments in other mutual funds (including unregistered collective vehicles) are valued at their net asset value per share, and are categorized as Level 2 of the fair value hierarchy.
Events or circumstances affecting the values of Fund securities that occur between the closing of the principal markets on which they trade and the time the NAV of Fund shares is determined may be reflected in the calculation of NAVs for each applicable Fund when the Funds deem that the particular event or circumstance would materially affect such Fund’s NAV. Funds that invest primarily in frequently traded exchange-listed securities will use fair value pricing in limited circumstances since reliable market quotations will often be readily available. Funds that invest in foreign securities are likely to use fair value pricing more often since significant events may occur between the close of foreign markets and the time of pricing which would trigger fair value pricing of the foreign securities. Although there are observable inputs assigned on a security level, prices are derived from factors using proprietary models or matrix pricing. For this reason, significant events will cause movement between Levels 1 and 2. Examples of events that could trigger fair value pricing of one or more securities are: a company development; a natural disaster; or an armed conflict.
Preferred stock and other equities traded on inactive markets or valued by reference to similar instruments are also categorized as Level 2 of the fair value hierarchy.
The NAV of a Fund’s portfolio that includes foreign securities may change on days when shareholders will not be able to purchase or redeem fund shares, since foreign securities can trade on non-business days.
Level 3 Trading Assets and Trading Liabilities, at Fair Value
The valuation techniques and significant inputs used in determining the fair values of financial instruments classified as Level 3 of the fair value hierarchy are as follows:
Securities and other assets for which market quotes are not readily available are valued at fair value as determined in good faith by the Board and are categorized as Level 3 of the fair value hierarchy. Market quotes are considered not readily available in circumstances where there is an absence of current or reliable market-based data (e.g., trade information or broker quotes). When
RFSC applies fair valuation methods that use significant unobservable inputs to determine a Fund’s NAV, securities will not be priced on the basis of quotes from the primary market in which they are traded, but rather may be priced by another method that the Board or persons acting at their direction believe accurately reflects fair value and are categorized as Level 3 of the fair value hierarchy. Fair value pricing may require subjective determinations about the value of a security. While the securities valuation procedures are intended to result in a calculation of a Fund’s NAV that fairly reflects security values as of the time of pricing, the process cannot guarantee that fair values determined by the Board or persons acting at their direction would accurately reflect the price that a Fund could obtain for a security if it were to dispose of that security as of the time of pricing (for instance, in a forced or distressed sale). The prices used by a Fund may differ from the value that would be realized if the securities were sold.
For fair valuations using significant unobservable inputs, U.S. GAAP requires a reconciliation of the beginning to ending balances for reported market values that presents changes attributable to total realized and unrealized gains or losses, purchases and sales, and transfers in/out of the Level 3 category during the period. In accordance with the requirements of U.S. GAAP, a fair value hierarchy and Level 3 reconciliation, if any, have been included in the Notes to the Schedule of Investments for each respective Fund, if considered material.
In 2011, the Financial Accounting Standards Board (“FASB”) issued an update to requirements relating to fair valuation measurements which represent amendments to achieve common fair value measurements and disclosure requirements in U.S. GAAP and International Financial Reporting Standards. The amendments are of two types: (i) those that clarify the FASB’s intent about the application of existing fair value measurements and disclosure requirements and (ii) those that change a particular principle or requirement for measuring fair value or for disclosing information about fair value measurements.
The amendments that change a particular principle or requirement for measuring fair value or disclosing information about fair value measurements relate to (i) measuring the fair value of the financial instruments that are managed within a portfolio; (ii) application of premium and discount in a fair value measurement; and (iii) additional disclosures about fair value measurements. The update is effective for annual periods beginning after December 15, 2011. Management does not believe the adoption of this update will have a material impact on the Funds’ financial statements.
Investment Transactions
Investment transactions are reflected as of the trade date for financial reporting purposes. This may cause the NAV stated in the financial statements to be different from the NAV at which shareholders may transact. Realized gains and losses from securities transactions, if any, are recorded on the basis of specific identified cost.
| | | | |
| | 132 | | | Notes to Financial Statements |
Russell Exchange Traded Funds Trust
Russell Investment Discipline ETFs™
Notes to Financial Statements, continued — March 31, 2012
Investment Income
Dividend income is recorded net of applicable withholding taxes on the ex-dividend date.
Federal Income Taxes
Since the Investment Company is a Delaware statutory trust, each Fund is a separate corporate taxpayer and determines its net investment income and capital gains (or losses) and the amounts to be distributed to each Fund’s shareholders without regard to the income and capital gains (or losses) of the other Funds.
Each Fund qualifies as a regulated investment company under sub-chapter M of the Internal Revenue Code and intends to distribute all of its taxable income and capital gains. Therefore, no federal income tax provision is required for the Funds.
The Funds comply with the authoritative guidance for uncertainty in income taxes which requires management to determine whether a tax position of the Funds is more likely than not to be sustained upon examination, including resolution of any related appeals or litigation processes, based on the technical merits of the position. For tax positions meeting the more likely than not threshold, the tax amount recognized in the financial statements is reduced by the largest benefit that has a greater than 50% likelihood of being realized upon ultimate settlement with the relevant taxing authority. Management determined that no accruals need to be made in the financial statements due to uncertain tax positions. Management continually reviews and adjusts its liability if any, for income taxes based on analyses of tax laws and regulations, as well as their interpretations, and other relevant factors.
Dividends and Distributions to Shareholders
For all Funds, income dividends, capital gain distributions and return of capital, if any, are recorded on the ex-dividend date. Income dividends are generally declared and paid quarterly. Capital gain distributions are generally declared and paid annually. An additional distribution may be paid by the Funds to avoid imposition of federal income and excise tax on any remaining undistributed capital gains and net investment income. Dividends and distributions cannot be automatically reinvested in additional shares of the Funds.
The timing and characterization of certain income and capital gain distributions are determined in accordance with federal tax regulations which may differ from U.S. GAAP. As a result, net investment income and net realized gain (or loss) from investment and foreign currency-related transactions for a reporting period may differ significantly from distributions during such period. The differences between tax regulations and U.S. GAAP relate primarily to investments in wash sale deferrals and certain securities sold at a loss. Accordingly, the Funds may periodically make reclassifications among certain of their capital accounts without impacting their net asset values.
Guarantees
In the normal course of business the Funds enter into contracts that contain a variety of representations which provide general indemnifications. The Funds’ maximum exposure under these arrangements is unknown as this would involve future claims that may be made against the Funds that have not yet occurred. However, the Funds expect the risk of loss to be remote.
Market, Credit and Counterparty Risk
In the normal course of business, the Funds trade financial instruments and enter into financial transactions where risk of potential loss exists due to changes in the market (market risk) or failure of the other party to a transaction to perform (credit risk). Similar to the credit risk, the Funds may also be exposed to counterparty risk or risk that an institution or other entity with which the Funds have unsettled or open transactions will default. The potential loss could exceed the value of the relevant assets recorded in the Funds’ financial statements (the “Assets”). The Assets, which potentially expose the Funds to credit risk, consist principally of cash due from counterparties and investments. The extent of the Funds’ exposure to credit and counterparty risks with respect to the Assets approximates their carrying value as recorded in the Funds’ Statements of Assets and Liabilities.
ETF Specific Risk
The Funds are managed with a passive investment strategy, attempting to track the performance of an unmanaged index of securities. This differs from an actively managed fund, which typically seeks to outperform a benchmark index. As a result, the Funds may hold constituent securities of the Index regardless of the current or projected performance of a specific security or a particular industry, market sector, country or currency. Maintaining investments in securities regardless of market conditions or the performance of individual securities could cause the Funds’ return to be lower or higher than if the Fund employed an active strategy.
| | |
| Notes to Financial Statements | | 133 |
Russell Exchange Traded Funds Trust
Russell Investment Discipline ETFs™
Notes to Financial Statements, continued — March 31, 2012
The Funds’ return may not match or achieve a high degree of correlation with the return of the Index due to security mismatches, operating expenses, transaction costs, cash flows and operational inefficiencies.
| 3. | | Investment Transactions |
Securities
During the period ended March 31, 2012, purchases and sales of the Funds (excluding investments held for short-term purposes and in-kind transactions) were as follows:
| | | | | | | | |
| | | Purchases | | | Sales | |
| | | | | | | | |
Russell Aggressive Growth ETF | | $ | 1,923,389 | | | $ | 3,329,495 | |
Russell Consistent Growth ETF | | | 3,838,224 | | | | 5,205,130 | |
Russell Growth at a Reasonable Price ETF | | | 2,459,509 | | | | 2,457,112 | |
Russell Contrarian ETF | | | 1,475,634 | | | | 3,186,988 | |
Russell Equity Income ETF | | | 8,882,817 | | | | 8,933,325 | |
Russell Low P/E ETF | | | 3,527,444 | | | | 5,335,469 | |
Russell Small Cap Aggressive Growth ETF | | | 2,090,064 | | | | 2,074,992 | |
Russell Small Cap Consistent Growth ETF | | | 1,324,378 | | | | 1,297,203 | |
Russell Small Cap Low P/E ETF | | | 2,736,631 | | | | 2,738,327 | |
Russell Small Cap Contrarian ETF | | | 5,296,959 | | | | 5,315,931 | |
For the period ended March 31, 2012, the purchases and sales of the Funds resulting from in-kind transactions were:
| | | | | | | | |
| | | Purchases | | | Sales | |
| | | | | | | | |
Russell Aggressive Growth ETF | | $ | 9,730,005 | | | $ | 3,276,600 | |
Russell Consistent Growth ETF | | | 42,530,029 | | | | 12,685,936 | |
Russell Growth at a Reasonable Price ETF | | | 38,231,279 | | | | 14,074,144 | |
Russell Contrarian ETF | | | 9,566,240 | | | | 2,742,655 | |
Russell Equity Income ETF | | | 73,685,171 | | | | 24,166,020 | |
Russell Low P/E ETF | | | 14,514,266 | | | | 7,376,573 | |
Russell Small Cap Aggressive Growth ETF | | | 16,187,070 | | | | 11,538,379 | |
Russell Small Cap Consistent Growth ETF | | | 16,515,218 | | | | 11,805,036 | |
Russell Small Cap Low P/E ETF | | | 11,385,973 | | | | 5,916,471 | |
Russell Small Cap Contrarian ETF | | | 16,648,413 | | | | 12,424,640 | |
Because gains and losses resulting from such in-kind transactions are not taxable to the Funds and are not distributed to existing fund shareholders, the gains or losses are reclassified from accumulated net realized gains or losses to paid-in capital at the end of the Funds’ tax year. These reclassifications have no effect on net assets or net assets per share. The realized in-kind gains or losses for the period ended March 31, 2012 are disclosed in the Funds’ Statements of Operations.
| 4. | | Related Party Transactions, Fees and Expenses |
Russell Investment Management Company (“RIMCo”) advises the Funds and RFSC is the Funds’ administrator. RFSC is a wholly-owned subsidiary of RIMCo. RIMCo is a wholly-owned subsidiary of Frank Russell Company (a subsidiary of The Northwestern Mutual Life Insurance Company). Frank Russell Company provides ongoing money manager research and trade placement services to RET and RIMCo.
The Funds may also invest their cash reserves (the “Cash Balances”) in the Russell U.S. Cash Management Fund, an unregistered fund advised by RIMCo and administered by RFSC. As of March 31, 2012, the Funds presented herein have invested $266,175 in the Russell U.S. Cash Management Fund.
The management fees specified in the table below are based upon the average daily net assets of the Funds and are payable monthly. The Adviser pays all of the expenses of the Funds other than the management fee and distribution fees pursuant to the Funds’ Supervision and Management Agreements, if any, brokerage expenses, taxes, interest fees, litigation expenses, acquired fund fees and other extraordinary expenses.
| | | | |
| | | Annual Rate | |
| | | | |
Russell Aggressive Growth ETF | | | 0.37 | % |
Russell Consistent Growth ETF | | | 0.37 | |
Russell Growth at a Reasonable Price ETF | | | 0.37 | |
Russell Contrarian ETF | | | 0.37 | |
Russell Equity Income ETF | | | 0.37 | |
| | | | |
| | 134 | | | Notes to Financial Statements |
Russell Exchange Traded Funds Trust
Russell Investment Discipline ETFs™
Notes to Financial Statements, continued — March 31, 2012
| | | | |
| | | Annual Rate | |
| | | | |
Russell Low P/E ETF | | | 0.37 | % |
Russell Small Cap Aggressive Growth ETF | | | 0.45 | |
Russell Small Cap Consistent Growth ETF | | | 0.45 | |
Russell Small Cap Low P/E ETF | | | 0.45 | |
Russell Small Cap Contrarian ETF | | | 0.45 | |
The following shows the amount of the management fees paid by the Funds for the period ended March 31, 2012:
| | | | |
| | | Management | |
| | | | |
Russell Aggressive Growth ETF | | $ | 15,274 | |
Russell Consistent Growth ETF | | | 50,530 | |
Russell Growth at a Reasonable Price ETF | | | 48,969 | |
Russell Contrarian ETF | | | 14,296 | |
Russell Equity Income ETF | | | 99,065 | |
Russell Low P/E ETF | | | 23,716 | |
Russell Small Cap Aggressive Growth ETF | | | 13,353 | |
Russell Small Cap Consistent Growth ETF | | | 13,534 | |
Russell Small Cap Low P/E ETF | | | 14,071 | |
Russell Small Cap Contrarian ETF | | | 22,701 | |
Waivers and Reimbursements
The Adviser has voluntarily agreed to waive trustee and trustee related expenses paid by the Funds. For the period ended March 31, 2012, the total trustee and trustee related fees waived amounted to:
| | | | |
| | | Trustee | |
| | | | |
Russell Aggressive Growth ETF | | $ | 14,339 | |
Russell Consistent Growth ETF | | | 42,460 | |
Russell Growth at a Reasonable Price ETF | | | 45,627 | |
Russell Contrarian ETF | | | 13,618 | |
Russell Equity Income ETF | | | 79,429 | |
Russell Low P/E ETF | | | 21,106 | |
Russell Small Cap Aggressive Growth ETF | | | 8,133 | |
Russell Small Cap Consistent Growth ETF | | | 8,255 | |
Russell Small Cap Low P/E ETF | | | 8,793 | |
Russell Small Cap Contrarian ETF | | | 14,544 | |
Accrued Fees Payable to Affiliate
Accrued fees payable to affiliate for the period ended March 31, 2012 were as follows:
| | | | | | | | | | | | | | | | | | | | |
| | | Russell
Aggressive
Growth ETF | | | Russell
Consistent
Growth ETF | | | Russell Growth
at a Reasonable
Price ETF | | | Russell
Contrarian ETF | | | Russell Equity
Income ETF | |
| | | | | | | | | | | | | | | | | | | | |
Management fees | | $ | 1,631 | | | $ | 9,997 | | | $ | 8,116 | | | $ | 1,479 | | | $ | 19,024 | |
| | | | | | | | | | | | | | | | | | | | |
| | | Russell Low
P/E ETF | | | Russell Small
Cap Aggressive
Growth ETF | | | Russell Small
Cap Consistent
Growth ETF | | | Russell
Small Cap
Low P/E ETF | | | Russell Small
Cap Contrarian
ETF | |
| | | | | | | | | | | | | | | | | | | | |
Management fees | | $ | 1,545 | | | $ | 2,441 | | | $ | 2,457 | | | $ | 2,572 | | | $ | 2,548 | |
Concentration of Secondary Market Shareholder Interests
As of March 31, 2012, the Russell Equity I Fund, a Russell Trust Company Fund and a related party to the Funds, holds investments in the secondary market of the following funds and amounts:
| | | | |
| Fund | | Market Value | |
Russell Equity Income ETF | | $ | 51,676,206 | |
Russell Growth at a Reasonable Price ETF | | | 23,038,329 | |
Russell Consistent Growth ETF | | | 24,830,773 | |
Such concentration of shareholder interests could have a material impact on the Funds.
| | |
| Notes to Financial Statements | | 135 |
Russell Exchange Traded Funds Trust
Russell Investment Discipline ETFs™
Notes to Financial Statements, continued — March 31, 2012
Board of Trustees
For all Funds of the Investment Company, each independent Trustee is paid a retainer of $70,000 per year, $5,000 for each regular quarterly meeting attended in person, and $2,500 for each Audit Committee meeting and Nominating and Governance Committee meeting. Each Trustee receives a $1,250 fee for attending the quarterly meeting by phone instead of receiving the full fee had the member attended in person. The Trustees are also compensated for out of pocket expenses. The Audit Committee Chair and Nominating and Governance Chair are each paid a fee of $12,000 and $6,000, respectively, per year. The Chairman of the Board receives additional annual compensation of $20,000.
At March 31, 2012, the following Funds had net tax basis capital loss carryforwards which may be applied against any net realized taxable gains in each succeeding year or until their respective expiration dates, whichever occurs first. Available capital loss carryforwards and expiration dates are as follows:
| | | | | | | | | | | | |
| | | No Expiration | | | | |
| | | Short-term | | | Long-term | | | Totals | |
| | | | | | | | | | | | |
Russell Aggressive Growth ETF | | $ | 339,370 | | | $ | — | | | $ | 339,370 | |
Russell Consistent Growth ETF | | | 417,131 | | | | — | | | | 417,131 | |
Russell Growth at a Reasonable Price ETF | | | 59,771 | | | | — | | | | 59,771 | |
Russell Contrarian ETF | | | 252,193 | | | | — | | | | 252,193 | |
Russell Equity Income ETF | | | 160,077 | | | | — | | | | 160,077 | |
Russell Low P/E ETF | | | 299,575 | | | | — | | | | 229,575 | |
At March 31, 2012, the cost of investments and net unrealized appreciation (depreciation) for income tax purposes were as follows:
| | | | | | | | | | | | | | | | | | | | |
| | Russell Aggressive
Growth ETF | | | Russell Consistent
Growth ETF | | | Russell Growth
at a Reasonable
Price ETF | | | Russell
Contrarian ETF | | | Russell Equity
Income ETF | |
| | | | | | | | | | | | | | | | | | | | |
Cost of Investments | | $ | 4,759,219 | | | $ | 28,133,061 | | | $ | 23,396,464 | | | $ | 4,645,462 | | | $ | 50,769,439 | |
| | | | | | | | | | | | | | | | | | | | |
Unrealized Appreciation | | $ | 677,183 | | | $ | 4,503,929 | | | $ | 2,950,944 | | | $ | 342,878 | | | $ | 6,088,155 | |
Unrealized Depreciation | | | (153,673 | ) | | | (282,273 | ) | | | (245,990 | ) | | | (223,112 | ) | | | (280,934 | ) |
| | | | | | | | | | | | | | | | | | | | |
Net Unrealized Appreciation (Depreciation) | | $ | 523,510 | | | $ | 4,221,656 | | | $ | 2,704,954 | | | $ | 119,766 | | | $ | 5,807,221 | |
| | | | | | | | | | | | | | | | | | | | |
Undistributed Ordinary Income | | $ | 1,397 | | | $ | 11,693 | | | $ | 10,351 | | | $ | 3,741 | | | $ | 37,528 | |
Undistributed Long-Term Capital Gains
(Capital Loss Carryforward) | | $ | (339,370 | ) | | $ | (417,131 | ) | | $ | (59,771 | ) | | $ | (252,193 | ) | | $ | (160,077 | ) |
Tax Composition of Distributions | | | | | | | | | | | | | | | | | | | | |
Ordinary Income | | $ | 27,513 | | | $ | 144,226 | | | $ | 191,046 | | | $ | 65,111 | | | $ | 612,115 | |
Tax-Exempt Income | | $ | — | | | $ | — | | | $ | — | | | $ | — | | | $ | — | |
Long-Term Capital Gains | | $ | — | | | $ | — | | | $ | — | | | $ | — | | | $ | — | |
Distributions in Excess | | $ | — | | | $ | — | | | $ | — | | | $ | — | | | $ | — | |
Tax Return of Capital | | $ | — | | | $ | — | | | $ | — | | | $ | — | | | $ | — | |
| | | | | |
| | | Russell Low P/E
ETF | | | Russell Small
Cap Aggressive
Growth ETF | | | Russell Small Cap
Consistent Growth
ETF | | | Russell Small Cap
Low P/E ETF | | | Russell Small
Cap Contrarian ETF | |
Cost of Investments | | $ | 4,976,176 | | | $ | 5,768,028 | | | $ | 5,890,635 | | | $ | 5,975,213 | | | $ | 5,787,197 | |
| | | | | | | | | | | | | | | | | | | | |
Unrealized Appreciation | | $ | 378,356 | | | $ | 914,870 | | | $ | 775,420 | | | $ | 911,513 | | | $ | 1,034,909 | |
Unrealized Depreciation | | | (395,577 | ) | | | (189,246 | ) | | | (130,759 | ) | | | (66,880 | ) | | | (85,738 | ) |
| | | | | | | | | | | | | | | | | | | | |
Net Unrealized Appreciation (Depreciation) | | $ | (17,221 | ) | | $ | 725,624 | | | $ | 644,661 | | | $ | 844,633 | | | $ | 949,171 | |
| | | | | | | | | | | | | | | | | | | | |
Undistributed Ordinary Income | | $ | 3,800 | | | $ | 1,368 | | | $ | 5,083 | | | $ | 1,910 | | | $ | 3,280 | |
Undistributed Long-Term Capital Gains
(Capital Loss Carryforward) | | $ | (299,575 | ) | | $ | — | | | $ | — | | | $ | — | | | $ | — | |
Tax Composition of Distributions | | | | | | | | | | | | | | | | | | | | |
Ordinary Income | | $ | 121,934 | | | $ | 2,448 | | | $ | 7,582 | | | $ | 25,452 | | | $ | 67,009 | |
Tax-Exempt Income | | $ | — | | | $ | — | | | $ | — | | | $ | — | | | $ | — | |
Long-Term Capital Gains | | $ | — | | | $ | — | | | $ | — | | | $ | — | | | $ | — | |
Distributions in Excess | | $ | — | | | $ | — | | | $ | — | | | $ | — | | | $ | — | |
Tax Return of Capital | | $ | — | | | $ | — | | | $ | — | | | $ | — | | | $ | — | |
| | | | |
| | 136 | | | Notes to Financial Statements |
Russell Exchange Traded Funds Trust
Russell Investment Discipline ETFs™
Notes to Financial Statements, continued — March 31, 2012
As permitted by tax regulations, the Funds intend to defer a net realized capital loss incurred from November 1, 2011 to March 31, 2012, and treat it as arising in the fiscal year 2012. As of March 31, 2012, the Funds had realized capital losses as follows:
| | | | |
Fund | |
Russell Aggressive Growth ETF | | $ | 42,147 | |
Russell Consistent Growth ETF | | | 29,449 | |
Russell Contrarian ETF | | | 150,809 | |
Russell Equity Income ETF | | | 514,346 | |
Russell Small Cap Aggressive Growth ETF | | | 140,923 | |
Russell Small Cap Consistent Growth ETF | | | 96,191 | |
Russell Small Cap Low P/E ETF | | | 77,142 | |
Russell Small Cap Contrarian ETF | | | 91,590 | |
| 6. | | Fund Share Transactions (amounts in thousands) |
As of March 31, 2012, there were an unlimited number of $0.001 par value shares of beneficial interest authorized by the Investment Company. Shares are created and redeemed by the Funds at their NAV only in Creation Units or multiples thereof. Except when aggregated in Creation Units, shares of the Funds are not redeemable. The Shares are listed on either the New York Stock Exchange (“NYSE”) Arca (“NYSE Arca” or the “Exchange”), or the NASDAQ Stock Market LLC (“NASDAQ” or the “Exchange”) subject to notice of issuance. The Shares trade on the Exchange at market prices. These prices may differ from the Shares’ NAV. The Shares are also redeemable only in Creation Unit aggregations, and generally in exchange for portfolio securities and a specified cash payment. Investors purchasing and redeeming Creation Units pay a purchase transaction fee and a redemption transaction fee directly to State Street Bank and Trust Company, the Funds’ Custodian. A Creation Unit of a Fund consists of at least 50,000 Shares. Transactions in shares for the Funds for the period ended March 31, 2012 were as follows:
| | | | | | | | |
| | | 2012* | |
| | | Shares | | | Dollars | |
| | | | | | | | |
| | | | | | | | |
Russell Aggressive Growth ETF | | | | | | | | |
Shares created | | | 200 | | | $ | 9,753 | |
Shares redeemed | | | (100 | ) | | | (4,697 | ) |
| | | | | | | | |
Total increase (decrease) | | | 100 | | | | 5,056 | |
| | | | | | | | |
| |
| | | 2012* | |
| | | Shares | | | Dollars | |
| | | | | | | | |
| | | | | | | | |
Russell Consistent Growth ETF | | | | | | | | |
Shares created | | | 900 | | | $ | 42,625 | |
Shares redeemed | | | (300 | ) | | | (14,126 | ) |
| | | | | | | | |
Total increase (decrease) | | | 600 | | | | 28,499 | |
| | | | | | | | |
| |
| | | 2012* | |
| | | Shares | | | Dollars | |
| | | | | | | | |
Russell Growth at a Reasonable Price ETF | | | | | | | | |
Shares created | | | 800 | | | $ | 38,314 | |
Shares redeemed | | | (300 | ) | | | (14,120 | ) |
| | | | | | | | |
Total increase (decrease) | | | 500 | | | | 24,194 | |
| | | | | | | | |
| |
| | | 2012* | |
| | | Shares | | | Dollars | |
| | | | | | | | |
Russell Contrarian ETF | | | | | | | | |
Shares created | | | 200 | | | $ | 9,585 | |
Shares redeemed | | | (100 | ) | | | (4,466 | ) |
| | | | | | | | |
Total increase (decrease) | | | 100 | | | | 5,119 | |
| | | | | | | | |
| | |
| Notes to Financial Statements | | 137 |
Russell Exchange Traded Funds Trust
Russell Investment Discipline ETFs™
Notes to Financial Statements, continued — March 31, 2012
| 6. | | Fund Share Transactions (amounts in thousands) (continued) |
| | | | | | | | |
| | | 2012* | |
| | | Shares | | | Dollars | |
| | | | | | | | |
Russell Equity Income ETF | | | | | | | | |
Shares created | | | 1,600 | | | $ | 73,801 | |
Shares redeemed | | | (500 | ) | | | (24,162 | ) |
| | | | | | | | |
Total increase (decrease) | | | 1,100 | | | | 49,639 | |
| | | | | | | | |
| |
| | | 2012* | |
| | | Shares | | | Dollars | |
| | | | | | | | |
Russell Low P/E ETF | | | | | | | | |
Shares created | | | 400 | | | $ | 19,467 | |
Shares redeemed | | | (300 | ) | | | (14,130 | ) |
| | | | | | | | |
Total increase (decrease) | | | 100 | | | | 5,337 | |
| | | | | | | | |
| |
| | | 2012** | |
| | | Shares | | | Dollars | |
| | | | | | | | |
Russell Small Cap Aggressive Growth ETF | | | | | | | | |
Shares created | | | 300 | | | $ | 16,219 | |
Shares redeemed | | | (200 | ) | | | (11,539 | ) |
| �� | | | | | | | |
Total increase (decrease) | | | 100 | | | | 4,680 | |
| | | | | | | | |
| |
| | | 2012** | |
| | | Shares | | | Dollars | |
| | | | | | | | |
Russell Small Cap Consistent Growth ETF | | | | | | | | |
Shares created | | | 300 | | | $ | 16,547 | |
Shares redeemed | | | (200 | ) | | | (11,795 | ) |
| | | | | | | | |
Total increase (decrease) | | | 100 | | | | 4,752 | |
| | | | | | | | |
| |
| | | 2012*** | |
| | | Shares | | | Dollars | |
| | | | | | | | |
| | | | | | | | |
Russell Small Cap Low P/E ETF | | | | | | | | |
Shares created | | | 200 | | | $ | 11,409 | |
Shares redeemed | | | (100 | ) | | | (5,930 | ) |
| | | | | | | | |
Total increase (decrease) | | | 100 | | | | 5,479 | |
| | | | | | | | |
| |
| | | 2012*** | |
| | | Shares | | | Dollars | |
| | | | | | | | |
Russell Small Cap Contrarian ETF | | | | | | | | |
Shares created | | | 300 | | | $ | 16,681 | |
Shares redeemed | | | (200 | ) | | | (12,465 | ) |
| | | | | | | | |
Total increase (decrease) | | | 100 | | | | 4,216 | |
| | | | | | | | |
| * | For the period May 18, 2011 (commencement of operations) to March 31, 2012. |
| ** | For the period October 4, 2011 (commencement of operations) to March 31, 2012. |
| *** | For the period October 5, 2011 (commencement of operations) to March 31, 2012. |
| | | | |
| | 138 | | | Notes to Financial Statements |
Russell Exchange Traded Funds Trust
Russell Investment Discipline ETFs™
Notes to Financial Statements, continued — March 31, 2012
Restricted securities are subject to contractual limitations on resale, are often issued in private placement transactions, and are not registered under the Securities Act of 1933, as amended (the “Act”). The most common types of restricted securities are those sold under Rule 144A of the Act and commercial paper sold under Section 4(2) of the Act.
A Fund may invest a portion of its net assets not to exceed 15% in securities that are illiquid. This limitation is applied at the time of purchase. Illiquid securities are securities that may not be readily marketable, and that cannot be sold within seven days in the ordinary course of business at the approximate amount at which the Fund has valued the securities. Restricted securities are generally considered to be illiquid.
As of March 31, 2012, there were no restricted securities held by a fund that were illiquid.
Illiquid securities and restricted securities may be priced by the Funds using the Fair Value Procedures approved by the Board.
Management has evaluated events or transactions that may have occurred since March 31, 2012, through the date the financial statements were issued, that would merit recognition or disclosure in the financial statements. During this review nothing was discovered which would required further disclosure within the financial statements.
| | |
| Notes to Financial Statements | | 139 |
Report of Independent Registered Public Accounting Firm
To the Board of Trustees and Shareholders:
In our opinion, the accompanying statements of assets and liabilities, including the schedule of investments, and the related statements of operations and of changes in net assets and the financial highlights present fairly, in all material respects, the financial position of Russell Aggressive Growth ETF, Russell Consistent Growth ETF, Russell Growth at a Reasonable Price ETF, Russell Contrarian ETF, Russell Equity Income ETF, Russell Low P/E ETF, Russell Small Cap Aggressive Growth ETF, Russell Small Cap Consistent Growth ETF, Russell Small Cap Low P/E ETF and Russell Small Cap Contrarian ETF (ten of the portfolios constituting the Russell Exchange Traded Funds Trust, hereafter referred to as the “Funds”) at March 31, 2012, the results of each of their operations, the changes in each of their net assets and the financial highlights for each of the periods indicated, in conformity with accounting principles generally accepted in the United States of America. These financial statements and financial highlights (hereafter referred to as “financial statements”) are the responsibility of the Fund’s management; our responsibility is to express an opinion on these financial statements based on our audits. We conducted our audits of these financial statements in accordance with the standards of the Public Company Accounting Oversight Board (United States). Those standards require that we plan and perform the audit to obtain reasonable assurance about whether the financial statements are free of material misstatement. An audit includes examining, on a test basis, evidence supporting the amounts and disclosures in the financial statements, assessing the accounting principles used and significant estimates made by management, and evaluating the overall financial statement presentation. We believe that our audits, which included confirmation of securities at March 31, 2012 by correspondence with the custodian, provide a reasonable basis for our opinion.

PricewaterhouseCoopers LLP
Seattle, Washington
May 29, 2012
| | | | |
| | 140 | | | Report of Independent Registered Public Accounting Firm |
Russell Exchange Traded Funds Trust
Russell Investment Discipline ETFsTM
Frequency Distribution of Discounts and Premiums — March 31, 2012 (Unaudited)
The chart below presents information about differences between the per share NAV of the Funds and the market trading price of shares of the Funds. For these purposes, the “market price” is the mid-point of the highest bid and lowest offer for Fund shares as of the close of trading on the exchange where Fund shares are listed. The term “premium” is sometimes used to describe a market price in excess of NAV and the term “discount” is sometimes used to describe a market price below NAV. The chart presents information about the size and frequency of premiums or discounts. As with other exchange traded funds, the market price of Fund shares is typically slightly higher or lower than the Fund’s per share NAV. Factors that contribute to the differences between market price and NAV include the supply and demand for Fund shares and investors’ assessments of the underlying value of a Fund’s portfolio securities.
| | | | | | | | | | | | | | | | |
| | | Russell Aggressive Growth
ETF | | | Russell Consistent Growth
ETF | |
| Premium/Discount Range | | Number of
Days* | | | Percentage of
Total Days | | | Number of
Days* | | | Percentage of
Total Days | |
| | | | | | | | | | | | | | | | |
Greater than 0.20% and Less than 1.00% | | | 3 | | | | 0.94% | | | | 3 | | | | 0.94% | |
Greater than 0.05% and Less than 0.20% | | | 24 | | | | 7.50% | | | | 47 | | | | 14.69% | |
Between 0.05% and -0.05% | | | 244 | | | | 76.25% | | | | 226 | | | | 70.62% | |
Greater than -0.05% and Less than -0.20% | | | 49 | | | | 15.31% | | | | 44 | | | | 13.75% | |
Greater than -0.20% and less than -1.00% | | | — | | | | 0.00% | | | | — | | | | 0.00% | |
| | | | | | | | | | | | | | | | |
| | | 320 | | | | 100.00% | | | | 320 | | | | 100.00% | |
| | | | | | | | | | | | | | | | |
| | | | | | | | | | | | | | | | |
| | | Growth at a Reasonable Price
ETF | | | Russell Contrarian ETF | |
| Premium/Discount Range | | Number of
Days* | | | Percentage of
Total Days | | | Number of
Days* | | | Percentage of
Total Days | |
| | | | | | | | | | | | | | | | |
Greater than 0.20% and Less than 1.00% | | | 4 | | | | 1.25% | | | | 1 | | | | 0.31% | |
Greater than 0.05% and Less than 0.20% | | | 78 | | | | 24.37% | | | | 7 | | | | 2.19% | |
Between 0.05% and -0.05% | | | 208 | | | | 65.00% | | | | 269 | | | | 84.06% | |
Greater than -0.05% and Less than -0.20% | | | 30 | | | | 9.38% | | | | 42 | | | | 13.13% | |
Greater than -0.20% and Less than -1.00% | | | — | | | | 0.00% | | | | 1 | | | | 0.31% | |
| | | | | | | | | | | | | | | | |
| | | 320 | | | | 100.00% | | | | 320 | | | | 100.00% | |
| | | | | | | | | | | | | | | | |
| | | | | | | | | | | | | | | | |
| | | Russell Equity Income ETF | | | Russell Low P/E ETF | |
| Premium/Discount Range | | Number of
Days* | | | Percentage of
Total Days | | | Number of
Days | | | Percentage of
Total Days | |
| | | | | | | | | | | | | | | | |
Greater than 0.20% and Less than 1.00% | | | 3 | | | | 0.94% | | | | 7 | | | | 2.19% | |
Greater than 0.05% and Less than 0.20% | | | 47 | | | | 14.69% | | | | 77 | | | | 24.06% | |
Between 0.05% and -0.05% | | | 232 | | | | 72.50% | | | | 195 | | | | 60.94% | |
Greater than -0.05% and Less than -0.20% | | | 34 | | | | 10.62% | | | | 41 | | | | 12.81% | |
Greater than -0.20% and Less than -1.00% | | | 4 | | | | 1.25% | | | | — | | | | 0.00% | |
| | | | | | | | | | | | | | | | |
| | | 320 | | | | 100.00% | | | | 320 | | | | 100.00% | |
| | | | | | | | | | | | | | | | |
| | | | | | | | | | | | | | | | |
| | | Russell Small Cap Aggressive
Growth ETF | | | Russell Small Cap Consistent
Growth ETF | |
| Premium/Discount Range | | Number of
Days* | | | Percentage of
Total Days | | | Number of
Days | | | Percentage of
Total Days | |
| | | | | | | | | | | | | | | | |
Greater than 1.00% | | | 1 | | | | 0.55% | | | | — | | | | 0.00% | |
Greater than 0.20% and Less than 1.00% | | | — | | | | 0.00% | | | | — | | | | 0.00% | |
Greater than 0.05% and Less than 0.20% | | | 6 | | | | 3.31% | | | | 14 | | | | 7.73% | |
Between 0.05% and -0.05% | | | 27 | | | | 14.92% | | | | 44 | | | | 24.31% | |
Greater than -0.05% and Less than -0.20% | | | 31 | | | | 17.13% | | | | 63 | | | | 34.81% | |
Greater than -0.20% and Less than -1.00% | | | 116 | | | | 64.09% | | | | 60 | | | | 33.15% | |
| | | | | | | | | | | | | | | | |
| | | 181 | | | | 100.00% | | | | 181 | | | | 100.00% | |
| | | | | | | | | | | | | | | | |
| | |
| Frequency Distribution of Discounts and Premiums | �� | 141 |
Russell Exchange Traded Funds Trust
Russell Investment Discipline ETFsTM
Frequency Distribution of Discounts and Premiums, continued — March 31, 2012 (Unaudited)
| | | | | | | | | | | | | | | | |
| | | Russell Small Cap Low P/E
ETF | | | Russell Small Cap Contrarian
ETF | |
| Premium/Discount Range | | Number of
Days* | | | Percentage of
Total Days | | | Number of
Days | | | Percentage of
Total Days | |
| | | | | | | | | | | | | | | | |
Greater than 0.20% and Less than 1.00% | | | — | | | | 0.00% | | | | 33 | | | | 18.33% | |
Greater than 0.05% and Less than 0.20% | | | 9 | | | | 5.00% | | | | 45 | | | | 25.00% | |
Between 0.05% and -0.05% | | | 42 | | | | 23.33% | | | | 81 | | | | 45.00% | |
Greater than -0.05% and Less than -0.20% | | | 31 | | | | 17.22% | | | | 20 | | | | 11.11% | |
Greater than -0.20% and Less than -1.00% | | | 98 | | | | 54.45% | | | | 1 | | | | 0.56% | |
| | | | | | | | | | | | | | | | |
| | | 180 | | | | 100.00% | | | | 180 | | | | 100.00% | |
| | | | | | | | | | | | | | | | |
| * | Number of days are based on inception date which is one day prior to commencement of operations. |
| | | | |
| | 142 | | | Frequency Distribution of Discounts and Premiums |
Russell Exchange Traded Funds Trust
Russell Investment Discipline ETFsTM
Tax Information — March 31, 2012 (Unaudited)
For the tax year ended March 31, 2012, the Funds hereby designate 100% or the maximum amount allowable, of its net taxable income as qualified dividends taxed at individual net capital gain rates.
For the tax year ended March 31, 2012, the Funds hereby designate under Section 871(k)(2)(c) of the Code, the maximum amount allowable as a short term capital gain dividend for purposes of the tax imposed under Section 871(a)(1)(A) of the Code. This applies to nonresident alien shareholders only.
The Form 1099 you receive in January 2013 will show the tax status of all distributions paid to your account in calendar year 2012.
The Funds designate dividends distributed during the fiscal year as qualifying for the dividends received deduction for corporate shareholders as follows:
| | | | |
Russell Aggressive Growth ETF | | | 100.0 | % |
Russell Consistent Growth ETF | | | 100.0 | % |
Russell Growth at a Reasonable Price ETF | | | 100.0 | % |
Russell Equity Income ETF | | | 100.0 | % |
Russell Low P/E ETF | | | 100.0 | % |
Russell Contrarian ETF | | | 100.0 | % |
Russell Small Cap Aggressive Growth ETF | | | 100.0 | % |
Russell Small Cap Consistent Growth ETF | | | 100.0 | % |
Russell Small Cap Low P/E ETF | | | 100.0 | % |
Russell Small Cap Contrarian ETF | | | 100.0 | % |
Please consult a tax adviser for any questions about federal or state income tax laws.
Russell Exchange Traded Funds Trust
Russell Investment Discipline ETFsTM
Shareholder Requests for Additional Information — March 31, 2012 (Unaudited)
A complete unaudited schedule of investments is made available generally no later than 60 days after the end of the first and third quarters of each year. These reports are available (i) free of charge, upon request, by calling the Funds at (888) 775-7837, (ii) on the Securities and Exchange Commission’s website at www.sec.gov, and (iii) at the Securities and Exchange Commission’s public reference room.
The Board has delegated to RIMCo, as RET’s investment adviser, the primary responsibility for monitoring, evaluating and voting proxies solicited by or with respect to issuers of securities in which assets of the Funds may be invested. RIMCo has established a proxy voting committee (“Committee”) and has adopted written proxy voting policies and procedures (“P&P”) and proxy voting guidelines (“Guidelines”). The Funds maintain a Portfolio Holdings Disclosure Policy that governs the timing and circumstances of disclosure to shareholders and third parties of information regarding the portfolio investments held by the Funds. A description of the P&P, Guidelines, Portfolio Holdings Disclosure Policy and additional information about Fund Trustees are contained in the Funds’ Statement of Additional Information (“SAI”). The SAI is available (i) free of charge, upon request, by calling the Funds at (888) 775-3837, (ii) at www.russelletfs.com, and (iii) on the Securities and Exchange Commission’s website at www.sec.gov.
To reduce expenses, we may mail only one copy of the Funds’ prospectus and each annual and semi-annual report to those addresses shared by two or more accounts. If you wish to receive individual copes of these documents, please contact your financial institution.
Some Financial Intermediaries may offer electronic delivery of the Funds’ prospectus and annual and semi-annual reports. Please contact your Financial Intermediary for further details.
| | | | |
| | 144 | | | Shareholder Requests for Additional Information |
Russell Exchange Traded Funds Trust
Russell Investment Discipline ETFsTM
Basis for Approval of Investment Advisory Contracts (Unaudited)
The Board of Trustees, including all of the Independent Trustees, considered and approved the management agreement with RIMCo (the “RIMCo Agreement”) with respect to Russell Small Cap Aggressive Growth ETF, Russell Small Cap Consistent Growth ETF, Russell Small Cap Low P/E ETF and Russell Small Cap Contrarian ETF (the “Funds”) at a meeting held in person on August 31, 2011 (the “Agreement Evaluation Meeting”). In preparation for the Agreement Evaluation Meeting, the Board considered (1) information, reports and analyses prepared by RIMCo relating to the services provided by RIMCo (and its affiliates) to the Funds at this and prior meetings; and (2) information (the “Comparative Information”) received from RIMCo comparing the operating expenses of each of the Funds with other peer funds not managed by RIMCo within a subset of US equity ETFs chosen by RIMCo using data provided by National Stock Exchange and industry information provided by Morningstar, each an independent third party. In the case of each Fund its other peer funds are collectively hereinafter referred to as the Fund’s “Comparable Funds,” and such Comparable Funds are collectively hereinafter referred to as the Fund’s “Expense Universe.” The foregoing information provided by RIMCo is collectively called the “Agreement Evaluation Information.” In connection with their consideration of the RIMCo Agreement, the Trustees had previously received and reviewed a memorandum from counsel to the Funds discussing the legal standards for their consideration of the adoption of the RIMCo Agreement.
At the Agreement Evaluation Meeting, the Board, including the Independent Trustees, reviewed the proposed approval of the RIMCo Agreement with management and counsel to the Funds. Presentations made by RIMCo to the Board as part of this review encompassed the Funds. The discussion below reflects these reviews.
The Board considered that RIMCo is responsible under the RIMCo Agreement for determining, implementing and maintaining the investment program for each Fund. Assets are managed directly by RIMCo pursuant to authority provided by the RIMCo Agreement. RIMCo is responsible for investing the assets of each Fund in accordance with such Fund’s investment objective and policies.
The Board considered that each Fund is passively managed, which means that the investment objective of each Fund is to seek investment results that closely correspond to the total return of such Fund’s corresponding index (each, an “Underlying Index”).
In addition to these general factors relating to the Funds, the Trustees considered, with respect to each Fund, various specific factors in evaluating the RIMCo Agreement, including the following:
| 1. | The nature, scope and overall quality of the investment management and other services provided, and expected to be provided, to the Fund by RIMCo; |
| 2. | The management fee to be paid by the Fund to RIMCo (the “Management Fee”) and the fact that it encompasses fees paid by the Fund for other services provided by RIMCo, its affiliates and other parties to the Fund, including services provided under the Supervision and Operational, Administrative, Fund Accounting, Master Custodian, Transfer Agency and Service, and Distribution Agreements; |
| 3. | Information provided by RIMCo as to other fees and benefits received by RIMCo or its affiliates from the Fund, including soft dollar arrangements and commissions in connection with portfolio securities transactions; |
| 4. | Information provided by RIMCo as to expenses to be incurred by the Fund; and |
| 5. | Information provided by RIMCo at prior meetings as to the profits that RIMCo expects to derive from the Fund’s operations. |
In evaluating the nature, scope and overall quality of the investment management and other services provided and which are expected to be provided to the Funds, including Fund portfolio management services, the Board considered that RIMCo’s investment management functions would consist of two primary roles: managing each Fund’s portfolio and producing the daily creation and redemption baskets.
With respect to managing the Funds’ portfolios, RIMCo reported, and the Board considered, that to meet the investment objective of each Fund, RIMCo intends to employ a full replication strategy. In this strategy, a Fund generally invests in all of the stocks comprising its Underlying Index. However, under various circumstances, it may not be possible or practicable to purchase all of those stocks in the same weighting as the Underlying Index. In those circumstances, a Fund may purchase a sample of stocks in the Underlying Index. RIMCo reported, and the Board considered, that there may also be instances in which RIMCo may choose to overweight another stock in the Underlying Index, purchase securities not in the Underlying Index which RIMCo believes are appropriate to substitute for certain securities in the Underlying Index or utilize various combinations of other available investment techniques.
With respect to producing the daily creation and redemption baskets, RIMCo reported, and the Board considered, that RIMCo will instruct the Funds’ custodian as to the basket of securities for each Fund’s creation and redemption file. RIMCo will review the creation and redemption files that are published to the exchange by the custodian on a daily basis for reasonableness and accuracy.
| | |
| Basis for Approval of Investment Advisory Contracts | | 145 |
Russell Exchange Traded Funds Trust
Russell Investment Discipline ETFsTM
Basis for Approval of Investment Advisory Contracts, continued — (Unaudited)
RIMCo also reported, and the Board considered, that on an ongoing basis, RIMCo will provide rebalancing, trade execution and account reconciliation services for the Funds.
RIMCo reported, and the Board considered, that at the time of the Agreement Evaluation Meeting, the Funds had not yet commenced operations and, therefore, no performance data was available for the Funds.
With respect to the Management Fee for each of Russell Small Cap Aggressive Growth ETF, Russell Small Cap Consistent Growth ETF, Russell Small Cap Low P/E ETF and Russell Small Cap Contrarian ETF, the Comparative Information showed that the Management Fee for each Fund was ranked in the third quintile of its Expense Universe. RIMCo reported, and the Board considered, that RIMCo believes these Funds track indexes that are representative of the analysis done by active managers and therefore merit fees that are higher than those of the more traditional passively managed ETFs contained in the Funds’ Expense Universe. The comparisons were based upon the latest fiscal years for the Expense Universe Funds.
The Board considered for each Fund whether economies of scale would be realized and whether the Management Fees for such Fund appropriately reflect or should be revised to reflect any such economies. The Board considered that RIMCo does not expect that economies of scale will be experienced in the near-term and that RIMCo expects to initially operate the Funds at a loss.
On the basis of the Agreement Evaluation Information, other information presented at or in connection with the Agreement Evaluation Meeting by RIMCo and information provided at prior meetings, the Board, in respect of each Fund, determined, after giving effect to any applicable waivers and/or reimbursements and considering differences in the composition and investment strategies of their respective Comparable Funds (1) the Management Fee charged by RIMCo was reasonable in light of the nature, scope and overall quality of the investment management and other services provided, and expected to be provided, to the Funds; (2) the relative expense ratio of each Fund was comparable to those of its Comparable Funds; (3) other benefits and fees received by RIMCo or its affiliates from the Funds were not excessive; and (4) RIMCo’s anticipated profitability with respect to the Funds was not excessive in light of the nature, scope and overall quality of the investment management and other services provided by RIMCo.
In their deliberations, the Trustees did not identify any particular information as to the RIMCo Agreement that was all-important or controlling, and each Trustee may have attributed different weights to the various factors considered. The Trustees evaluated all information available to them on a Fund-by-Fund basis and their determinations were made in respect of each Fund.
| | | | |
| | 146 | | | Basis for Approval of Investment Advisory Contracts |
Russell Exchange Traded Funds Trust
Russell Investment Discipline ETFsTM
Disclosure of Information about Fund Trustees and Officers — March 31, 2012
(Unaudited)
The Trustees and executive officers of the Trust, along with their principal occupations over the past five years and their affiliations, if any with the Adviser, are listed below. Unless otherwise noted, the principal business address of each Trustee and executive officer of the Trust is 1301 Second Avenue, 18th Floor, Seattle, Washington 98101.
| | | | | | | | | | | | |
Name, Address,
and Date of Birth | | Position(s) Held
with the Fund | | Term of Office
and Length of
Time Served | | Principal Occupation(s)
During Past 5 Years | | Number of
Portfolios in
Fund
Complex
Overseen
by Trustee | | | Other
Directorships Held
by Trustee |
INTERESTED TRUSTEES | | | | | | |
James Polisson* Born: November 11, 1959 | | Trustee | | Since 2011 | | Managing Director and Head of Global ETF Business, Frank Russell Company (2010 to present); and Chief Marketing Officer, Barclays Global Investors/iShares ETFs (2005 to 2010). | | | 26 | | | None. |
INDEPENDENT TRUSTEES | | | | | | |
Evelyn S. Dilsaver Born: May 4, 1955 | | Trustee, Chair since 2012 | | Since 2011 | | Corporate Director, Charles Schwab Investment Management (2003 to 2007); and President and Chief Executive Officer, Charles Schwab Investment Management (2004 to 2007). | | | 26 | | | Aeropostale, Inc. (retailer) (2008 to present); High Mark Funds (2008 to present); and Tempur-pedic, Int’l. (retailer) (2010 to present). |
| | | | | | | | | | | | | |
Jane A. Freeman Born: July 15, 1953 | | Trustee, Chair of Audit Committee since 2011 | | Since 2011 | | Consultant (2008 to present); and Executive Vice President and Chief Financial Officer, Scientific Learning (Educational Support Services) (1999 to 2008). | | | 26 | | | Harding Loevner Funds (Lead Director since 2008). |
| | | | | | | | | | | | | |
Lee T. Kranefuss** Born: September 27, 1961 | | Trustee | | Since 2011 | | Non-Executive Chairman, iShares (since 2009); Global Chief Executive Officer, iShares/Intermediary Groups of Barclays Global Investors (“BGI”) (2008 to 2009); Chief Executive Officer, iShares Intermediary Index and Market Group of BGI (2005 to 2008); Director of Barclays Global Fund Advisors (since 2005); Director, President and Chief Executive Officer of Barclays Global Investors International, Inc. (since 2005); and Director and Chairman of Barclays Global Investors Services (since 2005). | | | 26 | | | Barclays Global Investors Funds and Master Investment Portfolio (2001 to present). |
| | | | | | | | | | | | | |
Daniel O. Leemon Born: October 25, 1953 | | Trustee | | Since 2011 | | Retired. | | | 26 | | | Director, Corporate Executive Board (2003 to present). |
| | |
| Disclosure of Information about Fund Trustees and Officer | | 147 |
Russell Exchange Traded Funds Trust
Russell Investment Discipline ETFsTM
Disclosure of Information about Fund Trustees and Officers, continued — March 31, 2012
(Unaudited)
| | | | | | | | | | | | |
Name, Address,
and Date of Birth | | Position(s) Held
with the Fund | | Term of Office
and Length of
Time Served | | Principal Occupation(s)
During Past 5 Years | | Number of
Portfolios
in Fund
Complex
Overseen
by Trustee | | | Other
Directorships Held
by Trustee |
INDEPENDENT TRUSTEES (continued) | | | | | | |
Ernest L. Schmider Born: July 4, 1957 | | Trustee, Chairman of Nominating and Governance Committee since 2012 | | Since 2011 | | Adjunct Professor, Argyros School of Business and Economics, Chapman University, (Spring and Fall, 2010); Managing Director, Pacific Investment Management Company (PIMCO), President, PIMCO Funds (held various positions with PIMCO from 1994 to 2009). | | | 26 | | | None. |
| | | | |
| | 148 | | | Disclosure of Information about Fund Trustees and Officer |
Russell Exchange Traded Funds Trust
Russell Investment Discipline ETFsTM
Disclosure of Information about Fund Trustees and Officers, continued — March 31, 2012
(Unaudited)
| | | | | | | | |
| | | Position(s) Held
with the Fund | | Term of Office
and Length of
Time Served | | Principal Occupation(s)
During Past 5 Years | | Other
Directorships Held
by Trustee |
OFFICERS | | | | | | | | |
James Polisson* Born: November 11, 1959 | | President and Chief Executive Officer | | Since 2011; until successor is chosen and qualified by Trustees | | Managing Director and Head of Global ETF Business, FRC; Chief Marketing Officer, Barclays Global Investors/ iShares ETFs, 2005–2010 | | N/A |
Mark E. Swanson Born: November 26, 1963 | | Treasurer, Chief Financial Officer and Chief Accounting Officer | | Since 2011; until successor is chosen and qualified by Trustees | | Treasurer, Chief Accounting Officer and CFO, Russell Investment Company and Russell Investment Funds; Director, Funds Administration, RIMCo, Russell Fund Services Company, Russell Trust Company (a non-depository trust company), and Russell Financial Services, Inc.; and Treasurer and Principal Accounting Officer, SSgA Funds | | N/A |
Mary Beth Rhoden Born: April 25, 1969 | | Secretary and Chief Legal Officer | | Since 2011; until successor is chosen and qualified by Trustees | | Associate General Counsel, FRC; Assistant Secretary, Russell Investment Company and Russell Investment Funds, 1999–2010; Secretary, RIMCo, Russell Fund Services Company and Russell Financial Services, Inc.; and Secretary and Chief Legal Officer, Russell Investment Company and Russell Investment Funds | | N/A |
Cheryl Wichers Born December 16, 1966 | | Chief Compliance Officer since 2005 | | Until removed by Independent Trustees | | Chief Compliance Officer, RIC; Chief Compliance Officer, RIF; Chief Compliance Officer, RIMCo; Chief Compliance Officer, RFSC; Chief Compliance Officer, Russell Exchange Traded Funds Trust April 2002–May 2005, Manager, Global Regulatory Policy | | N/A |
| * | Mr. Polisson is also an officer and/or director of one or more affiliates of RET and is therefore an Interested Trustee. |
| ** | Ceased to be a Trustee effective April 25, 2012. |
| | |
| Disclosure of Information about Fund Trustees and Officer | | 149 |
Russell Exchange Traded Funds Trust
Russell Investment Discipline ETFsTM
1301 Second Avenue, Seattle, Washington 98101
(888) 775-3837
Interested Trustee
James Polisson*
Independent Trustees
Evelyn S. Dilsaver
Jane A. Freeman
Lee T. Kranefuss**
Daniel O. Leemon
Ernest L. Schmider
Officers
James Polisson, President and Chief Executive Officer
Mark E. Swanson, Treasurer, Chief Financial Officer and Chief Accounting Officer
Mary Beth Rhoden, Secretary and Chief Legal Officer
Cheryl Wichres, Chief Compliance Officer
Adviser
Russell Investment Management Company
1301 Second Avenue
Seattle, Washington 98101
Administrator
Russell Fund Services Company
1301 Second Avenue
Seattle, Washington 98101
Transfer and Dividend Disbursing Agent
State Street Bank and Trust Company
One Lincoln Street
Boston, MA 02111
Custodian
State Street Bank and Trust Company
Josiah Quincy Building
200 Newport Avenue
North Quincy, MA 02171
Office of Shareholder Inquiries
1301 Second Avenue
Seattle, Washington 98101
(888) 775-3837
Distributor
ALPS Distributors, Inc.
1290 Broadway, Suite 1100
Denver, CO 80203
Independent Registered Public Accounting Firm
PricewaterhouseCoopers LLP
1420 Fifth Avenue, Suite 1900
Seattle, WA 98101
| * | Mr. Polisson is also an officer and/or director of one or more affiliates of RET and is therefore an Interested Trustee. |
| ** | Ceased to be a Trustee effective April 25, 2012. |
This report is prepared from the books and records of the Funds and is submitted for the general information of shareholders and is not authorized for distribution to prospective investors unless accompanied or preceded by an effective Prospectus. Nothing herein contained is to be considered an offer of sale or a solicitation of an offer to buy shares of Russell Exchange Traded Funds Trust. Such offering is made only by Prospectus, which includes details as to offering price and other material information.
| | | | |
| | 150 | | | Adviser and Service Providers |
| | | | |
| Russell Exchange Traded Funds Trust | | 1301 Second Avenue | | 888-775-3837 |
| | Seattle, Washington 98101 | | www.russelletfs.com |


2012 ANNUAL REPORT
Russell Exchange
Traded Funds Trust
Russell Factor ETFs™
MARCH 31, 2012
|
| FUND |
|
| Russell 1000 Low Beta ETF |
|
| Russell 1000 High Beta ETF |
|
| Russell 1000 Low Volatility ETF |
|
| Russell 1000 High Volatility ETF |
|
| Russell 1000 High Momentum ETF |
|
| Russell 2000 Low Beta ETF |
|
| Russell 2000 High Beta ETF |
|
| Russell 2000 Low Volatility ETF |
|
| Russell 2000 High Volatility ETF |
|
| Russell 2000 High Momentum ETF |
|
| Russell Developed ex-U.S. Low Beta ETF |
|
| Russell Developed ex-U.S. Low Volatility ETF |
|
| Russell Developed ex-U.S. High Momentum ETF |
Russell Exchange Traded Funds Trust
Russell Exchange Traded Funds Trust is a series investment company with 26 different investment portfolios referred to as Funds. These financial statements report on 13 of these Funds.
Russell Exchange Traded Funds Trust
Russell Factor ETFs™
Annual Report
March 31, 2012
Table of Contents
Russell Exchange Traded Funds Trust.
Copyright © Russell Investments 2012. All rights reserved.
Russell Investments is a Washington, USA corporation, which operates through subsidiaries worldwide and is a subsidiary of The Northwestern Mutual Life Insurance Company.
Fund objectives, risks, charges and expenses should be carefully considered before investing. A prospectus containing this and other important information must precede or accompany this material. Please read the prospectus carefully before investing.
Securities distributed through ALPS Distributors, Inc. member FINRA, not affiliated with Russell Investments.
Russell Investments is the owner of the trademarks, service marks, and copyrights related to its respective indexes.
Performance quoted represents past performance and does not guarantee future results. The investment return and principal value of an investment will fluctuate so that shares, when redeemed, may be worth more or less than their original cost. Current performance may be lower or higher than the performance data quoted. Current to the most recent month-end performance may be obtained by visiting www.russelletfs.com/Products.
To Our Shareholders
I am pleased to present you with Russell Exchange Traded Funds 2012 Annual Report for the fiscal year ending March 31, 2012. Inside you’ll find portfolio management discussions and fund performance information.
Although the past 12 months proved to be a challenging year for world markets, all of us at Russell remain focused on our primary mission — improving financial security for people. For over 75 years, we’ve helped clients invest in all kinds of markets throughout the market cycle. During good times and uncertain times, we are guided by the same disciplined, long-term investment approach.
During the fiscal year ended March 31, 2012, we witnessed non-stop assaults on the world economy: an earthquake, tsunami and nuclear disaster in Japan; ongoing conflicts in the Middle East; a financial crisis in Europe centered in Greece, Italy and Spain; the downgrade of U.S. debt in the summer; and continued market volatility throughout the fall and winter. Market volatility made the journey even more unsettling for many investors. Moving into 2012, however, equity markets showed improvement with strong gains. Investors reacted positively to the improved credit conditions in Europe and the Russell Global Large Cap Index rose 12.1% making it the best start to the year for equities since 1998. Equity markets within the U.S. also posted positive returns for the three months of 2012 with the Russell 1000 Index returning 12.90% for the quarter. Positive news on the U.S economy and better than expected housing and unemployment data also contributed to the early 2012 gains.
Volatile markets — like those we endured during the fiscal year — are often driven by emotions in the short-term. Longer-term, we believe underlying fundamentals drive the market. This belief, along with a thoughtful plan and globally diversified portfolio, can help you look past the day-to-day market fluctuations and help you reach your long-term goals.
From all of us at Russell Investments, thank you for the trust you have placed in our firm.
Best regards,

James G. Polisson
Managing Director
CEO, Russell Exchange Traded Funds
Russell Exchange Traded Funds Trust
Market Summary as of March 31, 2012 — (Unaudited)
Global equity markets continued the turnaround that began in the previous quarter with strong gains in January and February. Investors increasingly reacted positively to the improved credit conditions in Europe following the European Central Bank’s (ECB) successful Long-Term Refinancing Operations (LTRO). The program injected €1 trillion worth of liquidity into eurozone banks, eliminating the probability of a Lehman-like event. This provided clarity on policy and significantly reduced liquidity risk. The Russell Global Large Cap Index rose 12.1 percent, making it the best start to the year for equities since 1998. In addition to the growing relief about Europe, investors took heart from the continued flow of positive news on the U.S. economy, most notably better than expected housing and unemployment data.
Given the constructive tone of equity markets and risk assets in general, it was not surprising to see emerging markets (EM) outperforming developed markets by 2.3 percent, with Eastern Europe leading. However, there was a notable change of tone in March, as concerns about slowing Chinese growth caused EM to underperform developed markets by 4.6 percent. Within the developed markets, the U.S. was the strongest major market in U.S. dollar terms followed closely by Europe, which saw a growing divergence between core eurozone countries such as Germany and Austria, which were among the strongest markets globally, and peripheral countries such as Spain and Portugal, which barely rose.
Within Asia, Japan was the strongest market in local currency terms, but the surprise announcement by the Bank of Japan that it would target inflation prompted a significant depreciation in the Japanese yen, resulting in significantly lower U.S. dollar returns.
The improving market conditions also extended into bond markets as systemic risk dissipated, market volatility decreased and credit spreads tightened. Near-term Greek pressure was alleviated as private borrowers agreed on terms of a principal write-down (with the triggering of attendant credit default swaps realizing little-to-no market disruption) and the German parliament approved a second bailout of €130 billion. The events played out over a backdrop of ongoing global central bank easing (including the U.S. Federal Reserve’s pledge to extend its hold into 2014), positive U.S. economic data, and somewhat decreasing concerns of a China hard landing. While the end of the quarter was marked by some disappointment that eurozone finance ministers limited fresh “firewall” funds to €500 billion, overall, events drove positive sentiment in risk assets with Pan-European banks returning an astounding 24 percent and the lowest quality global credits (rated Ca to D) returning 13 percent.
Peripheral European sovereign debt, which had been struggling, rebounded with strong returns. The positive environment helped capital to continue to pour into emerging market debt funds, bolstering their solid returns of 6 percent. Subprime mortgages did well, due in part to the Federal Reserve selling the remainder of its Maiden Lane II portfolio privately and some indications that the housing market may be nearing the bottom.
The U.S. equity market produced strong returns during the first quarter of 2012. The Russell 1000 Index returned 12.90% for the quarter, posting positive returns in each of the three months. During the quarter, the Russell 1000 Growth Index was up 14.69% while the Russell 1000 Value Index returned 11.12%.
The technology sector was the best performing sector within the Russell 1000 Index. Performance within technology was led by computer technology companies, most notably Apple Inc. which returned 48.08%. After being out of favor during 2011, the financial services sector posted the second strongest return of any sector in the Russell 1000 Index for the first quarter. Diversified banks, including Bank of America and SunTrust Banks, were some of the sector’s best performers. Stocks within the utilities and energy sectors lagged the overall market. Utilities stocks struggled to keep pace with the market as many investors came to believe that the relative valuation of the sector had become excessive due to outperformance in 2011. Within the energy sector, coal stocks fared the worst, due to a combination of a warm winter in the much of the U.S., natural gas substitution, and the prospect of new regulations from the Environmental Protection Agency (EPA).
The factor environment generally favored stocks with higher growth prospects and more cyclical earnings patterns. Stocks with high beta performed well, as did stocks with above average historical earnings per share growth and high
Russell Exchange Traded Funds Trust
growth forecasts. Stocks with high dividend yields underperformed the market, as did stocks with high debt to capital ratios. The underperformance of stocks of the most leveraged companies was one factor that deviated from what many thought of as a “risk on” theme during the quarter.
Headline economic data in the United States was generally positive. Year over year GDP growth within the United States was positive and above 3.5% for the months of December 2011, January 2012 and February 2012. Unemployment in the U.S. decreased modestly during the quarter, from 8.5% in December 2011 to 8.3% in February 2012. While the price of a barrel of Brent crude oil rose 14.43% during the quarter, the price of West Texas Intermediate, a harbinger of fuel prices in the U.S., rose 4.24% to $103.02 per barrel. The general increase in gasoline prices in the U.S. was of concern for investors and politicians during the quarter, with President Obama reportedly considering actions to release strategic petroleum reserves in hopes of lowering the price of crude oil and related products. However many oil analysts and political pundits noted that the bigger problem was a shortage of refining capacity and downplayed the ultimate impact on gasoline prices from a release of crude oil.
Correlations among U.S. stocks remained at average levels relative to history and much lower levels than those reached during the third quarter of 2011. The Chicago Board Options Exchange Volatility Index (“VIX”) also remained in line with longer term average levels during the quarter, and declined from 23.4 at the beginning to 15.5 at the end of the first quarter.
Russell Exchange Traded Funds Trust
Russell 1000 Low Beta ETF
Portfolio Management Discussion and Analysis — March 31, 2012 (Unaudited)
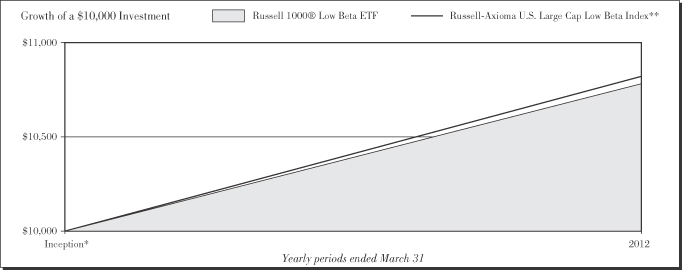
Performance as of March 31, 2012
| | | | | | | | | | | | |
|
| Average Annual Total Return | |
| | | Net Asset
Value | | | Market Value | | | Russell-Axioma
U.S. Large Cap
Low Beta
Index** | |
Inception* | | | 7.76 | % | | | 7.76 | % | | | 8.16 | % |
| | | | |
| | 6 | | | Russell 1000 Low Beta ETF |
Russell Exchange Traded Funds Trust
Russell 1000® Low Beta ETF
Portfolio Management Discussion and Analysis — March 31, 2012 (Unaudited)
The Russell 1000® Low Beta ETF (the “Fund”) is an index-based exchange-traded fund that seeks investment results that closely correspond to the total return of the Russell-Axioma U.S. Large Cap Low Beta Index (the “Index”). Russell Investment Management Company (“RIMCo”), as the Fund’s advisor, uses a “passive” or indexing approach to try to achieve the Fund’s investment objective. Unlike many investment companies, the Fund does not try to “beat” the Index it tracks and does not seek temporary defensive positions when markets decline or appear overvalued. The Fund seeks to gain exposure to the factor exhibited in its Index. The Fund will normally invest at least 80% of its total assets in securities that comprise the Index.
What is the Fund’s investment objective?
The Fund seeks investment results that closely correspond to the total return of the Russell-Axioma U.S. Large Cap Low Beta Index, which is designed to deliver exposure to stocks that are predicted to have a low beta as determined by a screening and ranking methodology applied to the output of the Axioma U.S. Equity Medium Horizon Fundamental Factor Risk model.
Is the Fund replicating or sampling?
The Fund is replicating.
How did the Fund perform relative to its benchmark for the fiscal year ended March 31, 2012?
For the fiscal year ended March 31, 2012, the Fund gained 7.76%. This is compared to the Fund’s benchmark, the Russell-Axioma U.S. Large Cap Low Beta Index, which gained 8.16% during the same period. The Fund’s performance includes operating expenses, whereas indexes are unmanaged and index returns do not include expenses of any kind.
There were no significant changes to either the Fund or Index during the reporting period.
Did the Fund outperform or underperform the benchmark or was performance as expected based on expenses, etc.?
The Fund performed as expected against the benchmark.
Over the reporting period, please describe those sectors that outperformed or underperformed.
Sectors achieved both positive and negative returns for the Fund and the Index. Technology was the best performing sector for the Fund and the Index, while producer durables was the worst performing sector. Health care, with an average weight of 25.1% was the best contributor to Fund and Index returns. Energy, with an average weight of 4.2%, was the worst contributor to Fund and Index returns.
Over the reporting period, please describe those individual securities (constituents) that outperformed or underperformed.
Apple Inc, Philip Morris International Inc, and Bristol-Myers Squibb Co generated positive returns and contributed the most to Fund performance while Peabody Energy Corp, Walgreen Co, and Avon Products Inc, all declined which detracted from Fund performance.
The views expressed in this report reflect those of the portfolio managers only through the end of the period covered by the report. These views do not necessarily represent the views of RIMCo, or any other person in RIMCo or any other affiliated organization. These views are subject to change at any time based upon market conditions or other events, and RIMCo disclaims any responsibility to update the views contained herein. These views should not be relied on as investment advice and, because investment decisions for a Russell Exchange Traded Funds Trust (“RET”) Fund are based on numerous factors, should not be relied on as an indication of investment decisions of any RET Fund.
| * | | Commenced operations by issuing shares May 26, 2011. |
| ** | | The Russell-Axioma U.S. Large Cap Low Beta Index is designed to deliver exposure to stocks that have low predicted betas as determined by a screening and ranking methodology applied to the output of the Axioma U.S. Equity Medium Horizon Fundamental Factor Risk model. Beta is a measure of the sensitivity of a stock’s price to a change in the broad market price level, as represented by the Russell 1000® Index (an index comprised of U.S. large capitalization stocks). Low beta stocks are considered to have a lower risk profile than the overall market and can be used by investors to adjust beta exposure in a portfolio. |
Performance is historical and assumes reinvestment of all dividends and capital gains. Investment return and principal value will fluctuate so that an investor’s shares, when redeemed, may be worth more or less than when purchased. Past performance is not indicative of future results. The returns shown do not reflect the deduction of taxes that a shareholder would pay on Fund distributions or the redemption of Fund shares.
| | |
| Russell 1000® Low Beta ETF | | 7 |
Russell Exchange Traded Funds Trust
Russell 1000 Low Beta ETF
Shareholder Expense Example — March 31, 2012 (Unaudited)
Fund Expenses
The following disclosure provides important information regarding each Fund’s Expense Example, which appears on each Fund’s individual page in this Annual Report. Please refer to this information when reviewing the Expense Example for a Fund.
Example
As a shareholder of the Fund, you incur two types of costs: (1) transaction costs, including brokerage commissions on purchases and sales of your Fund shares and (2) ongoing costs, including management fees and other Fund expenses. The Example is intended to help you understand your ongoing costs (in dollars) of investing in the Fund and to compare these costs with the ongoing costs of investing in other funds. The Example is based on an investment of $1,000 invested at the beginning of the period and held for the entire period indicated, which for this Fund is from October 1, 2011 to March 31, 2012.
Actual Expenses
The information in the table under the heading “Actual Performance” provides information about actual account values and actual expenses. You may use the information in this column, together with the amount you invested, to estimate the expenses that you paid over the period. Simply divide your account value by $1,000 (for example, an $8,600 account value divided by $1,000 = 8.6), then multiply the result by the number in the first column in the row entitled “Expenses Paid During Period” to estimate the expenses you paid on your account during this period.
Hypothetical Example for Comparison Purposes
The information in the table under the heading “Hypothetical Performance (5% return before expenses)” provides information about hypothetical account values and hypothetical expenses based on the Fund’s actual expense ratio and an assumed rate of return of 5% per year before expenses, which is not the Fund’s actual return. The hypothetical account values and expenses may not be used to estimate the actual ending account balance or expenses you paid for the period. You may use this information to compare the ongoing costs of investing in the Fund and other funds. To do so, compare this 5% hypothetical example with the 5% hypothetical examples that appear in the shareholder reports of other funds.
Please note that the expenses shown in the table are meant to highlight your ongoing costs only and do not reflect any transactional costs, such as brokerage commissions paid on purchases and sales of Fund shares. Therefore, the information under the heading “Hypothetical Performance (5% return before expenses)” is useful in comparing ongoing costs only, and will not help you determine the relative total costs of owning different funds. In addition, if these transactional costs were included, your costs would have been higher.
| | | | | | | | |
| | | Actual
Performance | | | Hypothetical
Performance
(5% return
before expenses) | |
| | | | | | | | |
Beginning Account Value October 1, 2011 | | $ | 1,000.00 | | | $ | 1,000.00 | |
Ending Account Value March 31, 2012 | | $ | 1,187.30 | | | $ | 1,023.85 | |
Expenses Paid During Period* | | $ | 1.26 | | | $ | 1.16 | |
| * | Expenses are equal to the Fund’s annualized expense ratio of 0.23% (representing the six month period annualized), multiplied by the average account value over the period, multiplied by 183/366 (to reflect the one-half year period). Effective November 3, 2011, the annualized expense ratio is 0.20%, as contractually agreed to by the adviser. May reflect amounts waived and/or reimbursed. Without any waivers and/or reimbursements, expenses would have been higher. |
| | | | |
| | 8 | | | Russell 1000 Low Beta ETF |
Russell Exchange Traded Funds Trust
Russell 1000 Low Beta ETF
Schedule of Investments — March 31, 2012
Amounts in thousands (except share amounts)
| | | | | | | | |
| | | Principal
Amount ($)
or Shares | | | Market
Value
$ | |
| | | | | | | | |
| Common Stocks - 99.8% | | | | | | | | |
| Consumer Discretionary - 13.7% | | | | | | | | |
Apollo Group, Inc. Class A (Æ) | | | 8,925 | | | | 345 | |
Avon Products, Inc. | | | 11,840 | | | | 229 | |
Best Buy Co., Inc. | | | 4,665 | | | | 110 | |
Career Education Corp. (Æ) | | | 1,644 | | | | 13 | |
Chico’s FAS, Inc. | | | 7,308 | | | | 110 | |
Costco Wholesale Corp. | | | 7,245 | | | | 658 | |
Dollar General Corp. (Æ) | | | 6,769 | | | | 313 | |
Education Management Corp. (Æ) | | | 3,538 | | | | 48 | |
Family Dollar Stores, Inc. | | | 6,671 | | | | 422 | |
Gap, Inc. (The) | | | 8,722 | | | | 228 | |
H&R Block, Inc. | | | 11,707 | | | | 193 | |
ITT Educational Services, Inc. (Æ) | | | 1,582 | | | | 105 | |
JC Penney Co., Inc. | | | 6,552 | | | | 232 | |
McDonald’s Corp. | | | 1,680 | | | | 165 | |
MGM Resorts International (Æ) | | | 2,734 | | | | 37 | |
Pandora Media, Inc. (Æ) | | | 3,484 | | | | 36 | |
priceline.com, Inc. (Æ) | | | 847 | | | | 608 | |
Royal Caribbean Cruises, Ltd. | | | 7,175 | | | | 211 | |
Sears Holdings Corp. (Æ) | | | 2,090 | | | | 138 | |
Starwood Hotels & Resorts Worldwide,
Inc. (ö) | | | 924 | | | | 52 | |
TripAdvisor, Inc. (Æ) | | | 2,697 | | | | 96 | |
Wal-Mart Stores, Inc. | | | 11,177 | | | | 685 | |
| | | | | | | | |
| | | | | | | 5,034 | |
| | | | | | | | |
| | |
| Consumer Staples - 28.2% | | | | | | | | |
Altria Group, Inc. | | | 23,892 | | | | 737 | |
Archer-Daniels-Midland Co. | | | 12,694 | | | | 402 | |
Clorox Co. (The) | | | 1,372 | | | | 94 | |
Coca-Cola Co. (The) | | | 9,242 | | | | 684 | |
Coca-Cola Enterprises, Inc. | | | 6,282 | | | | 180 | |
Colgate-Palmolive Co. | | | 4,945 | | | | 484 | |
ConAgra Foods, Inc. | | | 16,689 | | | | 438 | |
CVS Caremark Corp. | | | 4,588 | | | | 206 | |
Dean Foods Co. (Æ) | | | 32,034 | | | | 388 | |
Dr Pepper Snapple Group, Inc. | | | 427 | | | | 17 | |
General Mills, Inc. | | | 12,960 | | | | 511 | |
Hershey Co. (The) | | | 3,504 | | | | 215 | |
HJ Heinz Co. | | | 7,883 | | | | 422 | |
Kellogg Co. | | | 7,679 | | | | 412 | |
Kimberly-Clark Corp. | | | 8,446 | | | | 624 | |
Kraft Foods, Inc. Class A | | | 5,351 | | | | 203 | |
Kroger Co. (The) | | | 8,225 | | | | 199 | |
Lorillard, Inc. | | | 4,827 | | | | 625 | |
Mead Johnson Nutrition Co. Class A | | | 3,126 | | | | 258 | |
Molson Coors Brewing Co. Class B | | | 2,958 | | | | 134 | |
PepsiCo, Inc. | | | 9,859 | | | | 654 | |
Philip Morris International, Inc. | | | 8,323 | | | | 738 | |
Procter & Gamble Co. (The) | | | 9,674 | | | | 650 | |
Ralcorp Holdings, Inc. (Æ) | | | 2,552 | | | | 189 | |
Reynolds American, Inc. | | | 16,015 | | | | 664 | |
Safeway, Inc. | | | 2,069 | | | | 42 | |
SUPERVALU, Inc. | | | 4,070 | | | | 23 | |
Sysco Corp. | | | 2,713 | | | | 81 | |
Walgreen Co. | | | 1,316 | | | | 44 | |
| | | | | | | | |
| | | | | | | 10,318 | |
| | | | | | | | |
| | | | | | | | |
| | | Principal
Amount ($)
or Shares | | | Market
Value
$ | |
| Energy - 2.8% | | | | | | | | |
Consol Energy, Inc. | | | 49 | | | | 2 | |
EOG Resources, Inc. | | | 1,253 | | | | 139 | |
Exxon Mobil Corp. | | | 7,609 | | | | 660 | |
First Solar, Inc. (Æ) | | | 838 | | | | 21 | |
Occidental Petroleum Corp. | | | 1,309 | | | | 125 | |
Southwestern Energy Co. (Æ) | | | 2,944 | | | | 90 | |
| | | | | | | | |
| | | | | | | 1,037 | |
| | | | | | | | |
| | |
| Financial Services - 9.0% | | | | | | | | |
Aflac, Inc. | | | 7,763 | | | | 357 | |
American International Group, Inc. (Æ) | | | 6,380 | | | | 197 | |
Berkshire Hathaway, Inc. Class B (Æ) | | | 5,071 | | | | 411 | |
CBRE Group, Inc. Class A (Æ) | | | 955 | | | | 19 | |
Fifth Third Bancorp | | | 38,122 | | | | 535 | |
First Republic Bank (Æ) | | | 21,585 | | | | 711 | |
Green Dot Corp. Class A (Æ) | | | 1,225 | | | | 32 | |
Hartford Financial Services Group, Inc. | | | 3,825 | | | | 81 | |
Host Hotels & Resorts, Inc. (ö) | | | 6,387 | | | | 105 | |
Jefferies Group, Inc. | | | 7,010 | | | | 132 | |
JPMorgan Chase & Co. | | | 938 | | | | 43 | |
Morgan Stanley | | | 3,343 | | | | 66 | |
St. Joe Co. (The) (Æ) | | | 14,032 | | | | 267 | |
Visa, Inc. Class A | | | 1,274 | | | | 150 | |
Wells Fargo & Co. | | | 5,701 | | | | 195 | |
| | | | | | | | |
| | | | | | | 3,301 | |
| | | | | | | | |
| | |
| Health Care - 24.8% | | | | | | | | |
Abbott Laboratories | | | 10,807 | | | | 662 | |
Aetna, Inc. | | | 1,358 | | | | 68 | |
Alexion Pharmaceuticals, Inc. (Æ) | | | 2,370 | | | | 220 | |
Allergan, Inc. | | | 7,518 | | | | 718 | |
Amylin Pharmaceuticals, Inc. (Æ) | | | 7,504 | | | | 187 | |
Baxter International, Inc. | | | 7,196 | | | | 430 | |
Biogen Idec, Inc. (Æ) | | | 5,701 | | | | 719 | |
Bristol-Myers Squibb Co. | | | 19,680 | | | | 665 | |
Celgene Corp. (Æ) | | | 161 | | | | 12 | |
Cigna Corp. | | | 1,148 | | | | 57 | |
Eli Lilly & Co. | | | 11,616 | | | | 468 | |
Endo Pharmaceuticals Holdings, Inc. (Æ) | | | 6,776 | | | | 262 | |
Express Scripts, Inc. Class A (Æ) | | | 1,866 | | | | 101 | |
Forest Laboratories, Inc. (Æ) | | | 10,245 | | | | 355 | |
Gilead Sciences, Inc. (AE) | | | 3,427 | | | | 167 | |
Human Genome Sciences, Inc. (Æ) | | | 3,860 | | | | 32 | |
Illumina, Inc. (Æ) | | | 1,141 | | | | 60 | |
Johnson & Johnson | | | 10,288 | | | | 680 | |
Medco Health Solutions, Inc. (Æ) | | | 959 | | | | 67 | |
Merck & Co., Inc. | | | 17,053 | | | | 655 | |
Mylan, Inc. (Æ) | | | 6,072 | | | | 142 | |
Myriad Genetics, Inc. (Æ) | | | 5,008 | | | | 118 | |
Perrigo Co. | | | 4,644 | | | | 480 | |
Pfizer, Inc. | | | 31,669 | | | | 719 | |
Regeneron Pharmaceuticals, Inc. (Æ) | | | 1,204 | | | | 140 | |
Stryker Corp. | | | 1,043 | | | | 58 | |
UnitedHealth Group, Inc. | | | 10,161 | | | | 599 | |
VCA Antech, Inc. (Æ) | | | 3,462 | | | | 80 | |
Vertex Pharmaceuticals, Inc. (Æ) | | | 595 | | | | 24 | |
| | |
| Russell 1000 Low Beta ETF | | 9 |
Russell Exchange Traded Funds Trust
Russell 1000 Low Beta ETF
Schedule of Investments, continued — March 31, 2012
Amounts in thousands (except share amounts)
| | | | | | | | |
| | | Principal
Amount ($)
or Shares | | | Market
Value
$ | |
| | | | | | | | |
WebMD Health Corp. Class A (Æ) | | | 1,694 | | | | 43 | |
WellPoint, Inc. | | | 112 | | | | 8 | |
Zimmer Holdings, Inc. | | | 1,838 | | | | 118 | |
| | | | | | | | |
| | | | | | | 9,114 | |
| | | | | | | | |
| |
| Materials and Processing - 1.0% | | | | | |
Polypore International, Inc. (Æ) | | | 391 | | | | 14 | |
Southern Copper Corp. | | | 7,336 | | | | 232 | |
Westlake Chemical Corp. | | | 1,866 | | | | 121 | |
| | | | | | | | |
| | | | | | | 367 | |
| | | | | | | | |
| | |
| Producer Durables - 2.2% | | | | | | | | |
Delta Air Lines, Inc. (Æ) | | | 31,270 | | | | 310 | |
Goodrich Corp. | | | 2,929 | | | | 368 | |
Monster Worldwide, Inc. (Æ) | | | 4,331 | | | | 42 | |
Terex Corp. (Æ) | | | 3,915 | | | | 88 | |
| | | | | | | | |
| | | | | | | 808 | |
| | | | | | | | |
| | |
| Technology - 7.2% | | | | | | | | |
Apple, Inc. (Æ) | | | 1,209 | | | | 725 | |
Atmel Corp. (Æ) | | | 1,295 | | | | 13 | |
Google, Inc. Class A (Æ) | | | 364 | | | | 233 | |
International Business Machines Corp. | | | 3,538 | | | | 738 | |
LinkedIn Corp. Class A (Æ) | | | 1,190 | | | | 121 | |
MEMC Electronic Materials, Inc. (Æ) | | | 27,329 | | | | 99 | |
Micron Technology, Inc. (Æ) | | | 1,610 | | | | 13 | |
Motorola Mobility Holdings, Inc. (Æ) | | | 6,141 | | | | 241 | |
Skyworks Solutions, Inc. (Æ) | | | 8,498 | | | | 235 | |
Tellabs, Inc. | | | 52,350 | | | | 212 | |
| | | | | | | | |
| | | | | | | 2,630 | |
| | | | | | | | |
| | |
| Utilities - 10.9% | | | | | | | | |
AT&T, Inc. | | | 21,869 | | | | 682 | |
CenturyLink, Inc. | | | 1,852 | | | | 72 | |
Entergy Corp. | | | 4,105 | | | | 276 | |
Exelon Corp. | | | 4,497 | | | | 176 | |
FirstEnergy Corp. | | | 13,128 | | | | 599 | |
NextEra Energy, Inc. | | | 4,028 | | | | 246 | |
PPL Corp. | | | 22,134 | | | | 626 | |
Southern Co. | | | 14,661 | | | | 659 | |
Sprint Nextel Corp. (Æ) | | | 1,631 | | | | 5 | |
Verizon Communications, Inc. | | | 17,337 | | | | 662 | |
| | | | | | | | |
| | | | | | | 4,003 | |
| | | | | | | | |
| | |
Total Common Stocks
(cost $35,576) | | | | | | | 36,612 | |
| | | | | | | | |
| | | | | | | | |
| | | Principal
Amount ($)
or Shares | | | Market
Value
$ | |
| Short-Term Investments - 0.1% | | | | | | | | |
Russell U.S. Cash Management Fund | | | 52,880 | (¥) | | | 53 | |
| | | | | | | | |
| | |
Total Short-Term Investments
(cost $53) | | | | | | | 53 | |
| | | | | | | | |
| |
Total Investments - 99.9%
(identified cost $35,629) | | | | 36,665 | |
| |
Other Assets and Liabilities,
Net - 0.1% | | | | 19 | |
| | | | | | | | |
| | |
| Net Assets - 100.0% | | | | | | | 36,684 | |
| | | | | | | | |
See accompanying notes which are an integral part of the financial statements.
| | | | |
| | 10 | | | Russell 1000 Low Beta ETF |
Russell Exchange Traded Funds Trust
Russell 1000 Low Beta ETF
Presentation of Portfolio Holdings — March 31, 2012
Amounts in thousands
| | | | | | | | | | | | | | | | | | | | |
| | | Market Value | | | % of Net
Assets | |
| Portfolio Summary | | Level 1 | | | Level 2 | | | Level 3 | | | Total | | |
| | | | | | | | | | | | | | | | | | | | |
Common Stocks | | | | | | | | | | | | | | | | | | | | |
Consumer Discretionary | | $ | 5,034 | | | $ | — | | | $ | — | | | $ | 5,034 | | | | 13.7 | |
Consumer Staples | | | 10,318 | | | | — | | | | — | | | | 10,318 | | | | 28.2 | |
Energy | | | 1,037 | | | | — | | | | — | | | | 1,037 | | | | 2.8 | |
Financial Services | | | 3,301 | | | | — | | | | — | | | | 3,301 | | | | 9.0 | |
Health Care | | | 9,114 | | | | — | | | | — | | | | 9,114 | | | | 24.8 | |
Materials and Processing | | | 367 | | | | — | | | | — | | | | 367 | | | | 1.0 | |
Producer Durables | | | 808 | | | | — | | | | — | | | | 808 | | | | 2.2 | |
Technology | | | 2,630 | | | | — | | | | — | | | | 2,630 | | | | 7.2 | |
Utilities | | | 4,003 | | | | — | | | | — | | | | 4,003 | | | | 10.9 | |
Short-Term Investments | | | — | | | | 53 | | | | — | | | | 53 | | | | 0.1 | |
| | | | | | | | | | | | | | | | | | | | |
| | | | | |
Total Investments | | | 36,612 | | | | 53 | | | | — | | | | 36,665 | | | | 99.9 | |
| | | | | | | | | | | | | | | | | | | | |
Other Assets and Liabilities, Net | | | | | | | | | | | | | | | | | | | 0.1 | |
| | | | | | | | | | | | | | | | | | | | |
| | | | | |
| | | | | | | | | | | | | | | | | | | 100.0 | |
| | | | | | | | | | | | | | | | | | | | |
For a description of the levels see note 2 in the Notes to Financial Statements.
There were no significant transfers in and out of levels 1, 2 and 3 during the period ending March 31, 2012.
See accompanying notes which are an integral part of the financial statements.
| | |
| Russell 1000 Low Beta ETF | | 11 |
Russell Exchange Traded Funds Trust
Russell 1000 Low Beta ETF
Statement of Assets and Liabilities — March 31, 2012
| | | | |
| Amounts in thousands | | Russell 1000 Low
Beta ETF | |
| | | | |
Assets | | | | |
Investments, at identified cost | | $ | 35,629 | |
Investments, at market* | | | 36,665 | |
Receivables: | | | | |
Dividends | | | 37 | |
Investments sold | | | 909 | |
| | | | |
Total assets | | | 37,611 | |
| | | | |
| |
Liabilities | | | | |
Payables: | | | | |
Investments purchased | | | 923 | |
Accrued fees to affiliates | | | 4 | |
| | | | |
Total liabilities | | | 927 | |
| | | | |
| | | | |
Net Assets | | $ | 36,684 | |
| | | | |
Net Assets Consist of: | | | | |
Undistributed (overdistributed) net investment income | | $ | 16 | |
Accumulated net realized gain (loss) | | | (146 | ) |
Unrealized appreciation (depreciation) on investments | | | 1,036 | |
Shares of beneficial interest | | | 1 | |
Additional paid-in capital | | | 35,777 | |
| | | | |
Net Assets | | $ | 36,684 | |
| | | | |
Net Asset Value, offering and redemption price per share: | | | | |
Net asset value per share:(a) | | $ | 52.40 | |
Net assets | | $ | 36,683,583 | |
Shares outstanding ($.001 par value) | | | 700,002 | |
Amounts in thousands | | | | |
| | | | |
* Investments in Affiliates, Russell U.S. Cash Management Fund | | $ | 53 | |
| (a) | Net asset value per share equals net assets divided by shares outstanding. |
See accompanying notes which are an integral part of the financial statements.
| | | | |
| | 12 | | | Statement of Assets and Liabilities |
Russell Exchange Traded Funds Trust
Russell 1000 Low Beta ETF
Statement of Operations — For the Period Ended March 31, 2012
| | | | |
| Amounts in thousands | | Russell 1000 Low
Beta ETF* | |
| | | | |
Investment Income | | | | |
Dividends | | $ | 132 | |
| | | | |
Total investment income | | | 132 | |
| | | | |
| |
Expenses | | | | |
Management fees | | | 27 | |
Trustee and trustee related fees | | | 16 | |
| | | | |
Expenses before reductions | | | 43 | |
Expense reductions | | | (26 | ) |
| | | | |
Net expenses | | | 17 | |
| | | | |
Net investment income (loss) | | | 115 | |
| | | | |
| |
Net Realized and Unrealized Gain (Loss) | | | | |
Net realized gain (loss) on: | | | | |
Investments | | | (146 | ) |
In-kind redemptions | | | — | |
| | | | |
Net realized gain (loss) | | | (146 | ) |
| | | | |
Net change in unrealized appreciation (depreciation) on investments | | | 1,036 | |
| | | | |
Net realized and unrealized gain (loss) | | | 890 | |
| | | | |
Net Increase (Decrease) in Net Assets from Operations | | $ | 1,005 | |
| | | | |
| * | For the period May 26, 2011 (commencement of operations) to March 31, 2012. |
See accompanying notes which are an integral part of the financial statements.
| | |
| Statement of Operations | | 13 |
Russell Exchange Traded Funds Trust
Russell 1000 Low Beta ETF
Statement of Changes in Net Assets — For the Periods Ended March 31,
| | | | |
| | | Russell 1000 Low
Beta ETF | |
| Amounts in thousands | | 2012* | |
| | | | |
Increase (Decrease) in Net Assets | | | | |
| |
Operations | | | | |
Net investment income (loss) | | $ | 115 | |
Net realized gain (loss) | | | (146 | ) |
Net change in unrealized appreciation (depreciation) | | | 1,036 | |
| | | | |
Net increase (decrease) in net assets from operations | | | 1,005 | |
| | | | |
| |
Distributions | | | | |
From net investment income | | | (99 | ) |
| | | | |
Net decrease in net assets from distributions | | | (99 | ) |
| | | | |
| |
Share Transactions | | | | |
Net increase (decrease) in net assets from share transactions | | | 35,778 | |
| | | | |
Total Net Increase (Decrease) in Net Assets | | | 36,684 | |
| |
Net Assets | | | | |
Beginning of period | | | — | |
| | | | |
End of period | | $ | 36,684 | |
| | | | |
Undistributed (overdistributed) net investment income included in net assets | | $ | 16 | |
| * | For the period May 26, 2011 (commencement of operations) to March 31, 2012. |
See accompanying notes which are an integral part of the financial statements.
| | | | |
| | 14 | | | Statement of Changes in Net Assets |
(This page intentionally left blank)
Russell Exchange Traded Funds Trust
Russell 1000 Low Beta ETF
Financial Highlights — For the Period Ended
For a Share Outstanding Throughout Each Period.
| | | | | | | | | | | | | | | | | | | | | | | | |
| | |
$
Net Asset Value,
Beginning of
Period | | | $
Net
Investment
Income (Loss)(a)(e) | | | $
Net Realized
and Unrealized
Gain (Loss) | | | $
Total from
Investment
Operations | | | $
Distributions
from Net
Investment Income | | | $
Total
Distributions | |
Russell 1000 Low Beta ETF | | | | | | | | | | | | | | | | | | | | | |
March 31, 2012* | | | 49.35 | | | | .87 | | | | 2.88 | | | | 3.75 | | | | (.70 | ) | | | (.70 | ) |
| (a) | Average daily shares outstanding were used for this calculation. |
| (b) | Periods less than one year are not annualized. |
| (c) | The ratios for periods less than one year are annualized. |
| (d) | Portfolio turnover rate excludes securities received or delivered from in-kind creation or redemption units. |
| (e) | Reflects amounts waived by Russell Investment Management Company (“RIMCo”). |
| * | For the period May 26, 2011 (commencement of operations) to March 31, 2012. |
See accompanying notes which are an integral part of the financial statements.
| | | | | | | | | | | | | | | | | | | | | | | | | | |
$
Net Asset Value,
End of
Period | | | %
Total
Return(b) | | | $
Net Assets,
End of Period
(000) | | | %
Ratio of Expenses
to Average
Net Assets,
Gross(c) | | | %
Ratio of Expenses
to Average
Net Assets,
Net(c)(e) | | | %
Ratio of Net
Investment Income
to Average
Net Assets(c)(e) | | | %
Portfolio
Turnover Rate(b)(d) | |
| | | | | | | | | | | | | | | | | | | | | | | | | | |
| | 52.40 | | | | 7.76 | | | | 36,684 | | | | .79 | | | | .31 | | | | 2.13 | | | | 39 | |
See accompanying notes which are an integral part of the financial statements.
Russell Exchange Traded Funds Trust
Russell 1000 High Beta ETF
Portfolio Management Discussion and Analysis — March 31, 2012 (Unaudited)
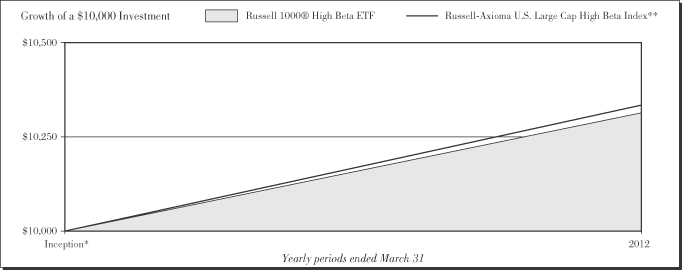
Performance as of March 31, 2012
| | | | | | | | | | | | |
|
| Average Annual Total Return | |
| | | Net Asset
Value | | | Market Value | | | Russell-Axioma
U.S. Large Cap
High Beta
Index** | |
Inception* | | | 1.95 | % | | | 2.07 | % | | | 2.39 | % |
| | | | |
| | 18 | | | Russell 1000 High Beta ETF |
Russell Exchange Traded Funds Trust
Russell 1000® High Beta ETF
Portfolio Management Discussion and Analysis — March 31, 2012 (Unaudited)
The Russell 1000® High Beta ETF (the “Fund”) is an index-based exchange-traded fund that seeks investment results that closely correspond to the total return of the Russell-Axioma U.S. Large Cap High Beta Index (the “Index”). Russell Investment Management Company (“RIMCo”), as the Fund’s advisor, uses a “passive” or indexing approach to try to achieve the Fund’s investment objective. Unlike many investment companies, the Fund does not try to “beat” the Index it tracks and does not seek temporary defensive positions when markets decline or appear overvalued. The Fund seeks to gain exposure to the factor exhibited in its Index. The Fund will normally invest at least 80% of its total assets in securities that comprise the Index.
What is the Fund’s investment objective?
The Fund seeks investment results that closely correspond to the total return of the Russell-Axioma U.S. Large Cap High Beta Index, which is designed to deliver exposure to stocks that are predicted to have a high beta as determined by a screening and ranking methodology applied to the output of the Axioma U.S. Equity Medium Horizon Fundamental Factor Risk model.
Is the Fund replicating or sampling?
The Fund is replicating.
How did the Fund perform relative to its benchmark for the fiscal year ended March 31, 2012?
For the fiscal year ended March 31, 2012, the Fund gained 1.95%. This is compared to the Fund’s benchmark, the Russell-Axioma U.S. Large Cap High Beta Index, which gained 2.39% during the same period. The Fund’s performance includes operating expenses, whereas indexes are unmanaged and index returns do not include expenses of any kind.
There were no significant changes to either the Fund or Index during the reporting period.
Did the Fund outperform or underperform the benchmark or was performance as expected based on expenses, etc.?
The Fund performed as expected against the benchmark.
Over the reporting period, please describe those sectors that outperformed or underperformed.
Sectors achieved both positive and negative returns for the Fund and the Index. Technology was the best performing sector for the Fund and the Index, while consumer staples was the worst performing sector. Technology, with an average weight of 16.1% was the best contributor to Fund and Index returns. Producer durables, with an average weight of 35.9%, was the worst contributor to Fund and Index returns.
Over the reporting period, please describe those individual securities (constituents) that outperformed or underperformed.
Apple Inc, Western Digital Corp, and Sherwin-Williams Co generated positive returns and contributed the most to Fund performance while Harsco Corp, Ingersoll-Rand Plc, and Walt Disney Co, all declined which detracted from Fund performance.
The views expressed in this report reflect those of the portfolio managers only through the end of the period covered by the report. These views do not necessarily represent the views of RIMCo, or any other person in RIMCo or any other affiliated organization. These views are subject to change at any time based upon market conditions or other events, and RIMCo disclaims any responsibility to update the views contained herein. These views should not be relied on as investment advice and, because investment decisions for a Russell Exchange Traded Funds Trust (“RET”) Fund are based on numerous factors, should not be relied on as an indication of investment decisions of any RET Fund.
| * | | Commenced operations by issuing shares May 26, 2011. |
| ** | | The Russell-Axioma U.S. Large Cap High Beta Index is designed to deliver exposure to stocks that have high predicted betas as determined by a screening and ranking methodology applied to the output of the Axioma U.S. Equity Medium Horizon Fundamental Factor Risk model. Beta is a measure of the sensitivity of a stock’s price to a change in the broad market price level, as represented by the Russell 1000® Index (an index comprised of U.S. large capitalization stocks). High beta stocks are considered to have a higher risk profile than the overall market and can be used by investors to adjust beta exposure in a portfolio. |
Performance is historical and assumes reinvestment of all dividends and capital gains. Investment return and principal value will fluctuate so that an investor’s shares, when redeemed, may be worth more or less than when purchased. Past performance is not indicative of future results. The returns shown do not reflect the deduction of taxes that a shareholder would pay on Fund distributions or the redemption of Fund shares.
| | |
| Russell 1000® High Beta ETF | | 19 |
Russell Exchange Traded Funds Trust
Russell 1000 High Beta ETF
Shareholder Expense Example — March 31, 2012 (Unaudited)
Fund Expenses
The following disclosure provides important information regarding each Fund’s Expense Example, which appears on each Fund’s individual page in this Annual Report. Please refer to this information when reviewing the Expense Example for a Fund.
Example
As a shareholder of the Fund, you incur two types of costs: (1) transaction costs, including brokerage commissions on purchases and sales of your Fund shares and (2) ongoing costs, including management fees and other Fund expenses. The Example is intended to help you understand your ongoing costs (in dollars) of investing in the Fund and to compare these costs with the ongoing costs of investing in other funds. The Example is based on an investment of $1,000 invested at the beginning of the period and held for the entire period indicated, which for this Fund is from October 1, 2011 to March 31, 2012.
Actual Expenses
The information in the table under the heading “Actual Performance” provides information about actual account values and actual expenses. You may use the information in this column, together with the amount you invested, to estimate the expenses that you paid over the period. Simply divide your account value by $1,000 (for example, an $8,600 account value divided by $1,000 = 8.6), then multiply the result by the number in the first column in the row entitled “Expenses Paid During Period” to estimate the expenses you paid on your account during this period.
Hypothetical Example for Comparison Purposes
The information in the table under the heading “Hypothetical Performance (5% return before expenses)” provides information about hypothetical account values and hypothetical expenses based on the Fund’s actual expense ratio and an assumed rate of return of 5% per year before expenses, which is not the Fund’s actual return. The hypothetical account values and expenses may not be used to estimate the actual ending account balance or expenses you paid for the period. You may use this information to compare the ongoing costs of investing in the Fund and other funds. To do so, compare this 5% hypothetical example with the 5% hypothetical examples that appear in the shareholder reports of other funds.
Please note that the expenses shown in the table are meant to highlight your ongoing costs only and do not reflect any transactional costs, such as brokerage commissions paid on purchases and sales of Fund shares. Therefore, the information under the heading “Hypothetical Performance (5% return before expenses)” is useful in comparing ongoing costs only, and will not help you determine the relative total costs of owning different funds. In addition, if these transactional costs were included, your costs would have been higher.
| | | | | | | | |
| | | Actual
Performance | | | Hypothetical
Performance
(5% return
before expenses) | |
| | | | | | | | |
Beginning Account Value October 1, 2011 | | $ | 1,000.00 | | | $ | 1,000.00 | |
Ending Account Value March 31, 2012 | | $ | 1,332.60 | | | $ | 1,023.60 | |
Expenses Paid During Period* | | $ | 1.63 | | | $ | 1.42 | |
| * | Expenses are equal to the Fund’s annualized expense ratio of 0.28% (representing the six month period annualized), multiplied by the average account value over the period, multiplied by 183/366 (to reflect the one-half year period). Effective November 3, 2011, the annualized expense ratio was 0.20%, as agreed to by the adviser. May reflect amounts waived and/or reimbursed. Without any waivers and/or reimbursements, expenses would have been higher. |
| | | | |
| | 20 | | | Russell 1000 High Beta ETF |
Russell Exchange Traded Funds Trust
Russell 1000 High Beta ETF
Schedule of Investments — March 31, 2012
Amounts in thousands (except share amounts)
| | | | | | | | |
| | | Principal
Amount ($)
or Shares | | | Market
Value
$ | |
| | | | | | | | |
| Common Stocks - 99.8% | | | | | |
| Consumer Discretionary - 10.9% | | | | | |
Ford Motor Co. | | | 8,023 | | | | 100 | |
Fortune Brands Home & Security, Inc. (Æ) | | | 548 | | | | 12 | |
Garmin, Ltd. | | | 1,070 | | | | 50 | |
General Motors Co. (Æ) | | | 3,914 | | | | 101 | |
Harley-Davidson, Inc. | | | 901 | | | | 44 | |
Home Depot, Inc. | | | 210 | | | | 11 | |
Jarden Corp. | | | 2,269 | | | | 91 | |
Leggett & Platt, Inc. | | | 1,833 | | | | 42 | |
Lennar Corp. Class A | | | 150 | | | | 4 | |
McDonald’s Corp. | | | 405 | | | | 40 | |
Newell Rubbermaid, Inc. | | | 441 | | | | 8 | |
Stanley Black & Decker, Inc. | | | 64 | | | | 5 | |
Tempur-Pedic International, Inc. (Æ) | | | 170 | | | | 14 | |
Thor Industries, Inc. | | | 580 | | | | 18 | |
| | | | | | | | |
| | | | | | | 540 | |
| | | | | | | | |
| |
| Energy - 14.5% | | | | | |
Alpha Natural Resources, Inc. (Æ) | | | 41 | | | | 1 | |
Baker Hughes, Inc. | | | 299 | | | | 13 | |
Chevron Corp. | | | 878 | | | | 94 | |
ConocoPhillips | | | 870 | | | | 66 | |
Dresser-Rand Group, Inc. (Æ) | | | 1,080 | | | | 50 | |
Exxon Mobil Corp. | | | 1,013 | | | | 88 | |
Halliburton Co. | | | 2,930 | | | | 96 | |
Helmerich & Payne, Inc. | | | 113 | | | | 6 | |
Nabors Industries, Ltd. (Æ) | | | 1,146 | | | | 20 | |
National Oilwell Varco, Inc. | | | 896 | | | | 71 | |
Oil States International, Inc. (Æ) | | | 239 | | | | 19 | |
Patterson-UTI Energy, Inc. | | | 1,371 | | | | 24 | |
Schlumberger, Ltd. | | | 1,228 | | | | 86 | |
SEACOR Holdings, Inc. (Æ) | | | 362 | | | | 35 | |
Valero Energy Corp. | | | 1,360 | | | | 35 | |
Walter Energy, Inc. Class A | | | 329 | | | | 19 | |
| | | | | | | | |
| | | | | | | 723 | |
| | | | | | | | |
| |
| Financial Services - 12.3% | | | | | |
American Capital Agency Corp. (ö) | | | 41 | | | | 1 | |
American Capital, Ltd. (Æ) | | | 1,452 | | | | 13 | |
Annaly Capital Management, Inc. (ö) | | | 1,892 | | | | 30 | |
Ares Capital Corp. | | | 164 | | | | 3 | |
Bank of America Corp. | | | 8,137 | | | | 78 | |
Berkshire Hathaway, Inc. Class B (Æ) | | | 399 | | | | 32 | |
Citigroup, Inc. | | | 2,390 | | | | 87 | |
Goldman Sachs Group, Inc. (The) | | | 645 | | | | 80 | |
JPMorgan Chase & Co. | | | 2,168 | | | | 100 | |
KeyCorp | | | 11,835 | | �� | | 101 | |
PNC Financial Services Group, Inc. | | | 617 | | | | 40 | |
SunTrust Banks, Inc. | | | 387 | | | | 9 | |
Wells Fargo & Co. | | | 1,155 | | | | 39 | |
| | | | | | | | |
| | | | | | | 613 | |
| | | | | | | | |
| |
| Materials and Processing - 16.7% | | | | | |
Air Products & Chemicals, Inc. | | | 50 | | | | 5 | |
Alcoa, Inc. | | | 1,397 | | | | 14 | |
CF Industries Holdings, Inc. | | | 194 | | | | 35 | |
| | | | | | | | |
| | | Principal
Amount ($)
or Shares | | | Market
Value
$ | |
Cliffs Natural Resources, Inc. | | | 1,069 | | | | 74 | |
Commercial Metals Co. | | | 712 | | | | 11 | |
Ecolab, Inc. | | | 1,623 | | | | 100 | |
EI du Pont de Nemours & Co. | | | 973 | | | | 51 | |
Fastenal Co. | | | 565 | | | | 31 | |
Freeport-McMoRan Copper & Gold, Inc. | | | 442 | | | | 17 | |
Monsanto Co. | | | 1,077 | | | | 86 | |
Mosaic Co. (The) | | | 326 | | | | 18 | |
Newmont Mining Corp. | | | 982 | | | | 50 | |
Nucor Corp. | | | 2,288 | | | | 98 | |
Owens Corning (Æ) | | | 944 | | | | 34 | |
Praxair, Inc. | | | 878 | | | | 102 | |
Royal Gold, Inc. | | | 84 | | | | 5 | |
Sherwin-Williams Co. (The) | | | 914 | | | | 99 | |
| | | | | | | | |
| | | | | | | 830 | |
| | | | | | | | |
| |
| Producer Durables - 25.7% | | | | | |
3M Co. | | | 1,052 | | | | 94 | |
Boeing Co. (The) | | | 206 | | | | 15 | |
Caterpillar, Inc. | | | 920 | | | | 98 | |
Cummins, Inc. | | | 158 | | | | 19 | |
Danaher Corp. | | | 1,776 | | | | 99 | |
Deere & Co. | | | 1,209 | | | | 98 | |
Dover Corp. | | | 348 | | | | 22 | |
Eaton Corp. | | | 1,992 | | | | 99 | |
Gardner Denver, Inc. | | | 57 | | | | 4 | |
General Electric Co. | | | 4,994 | | | | 100 | |
Goodrich Corp. | | | 801 | | | | 100 | |
GrafTech International, Ltd. (Æ) | | | 54 | | | | 1 | |
Illinois Tool Works, Inc. | | | 1,727 | | | | 99 | |
Itron, Inc. (Æ) | | | 129 | | | | 6 | |
L-3 Communications Holdings, Inc. Class 3 | | | 22 | | | | 2 | |
McDermott International, Inc. (Æ) | | | 773 | | | | 10 | |
Norfolk Southern Corp. | | | 844 | | | | 56 | |
Pentair, Inc. | | | 464 | | | | 22 | |
Thomas & Betts Corp. (Æ) | | | 141 | | | | 10 | |
Tyco International, Ltd. | | | 1,788 | | | | 100 | |
Union Pacific Corp. | | | 829 | | | | 89 | |
United Continental Holdings, Inc. (Æ) | | | 770 | | | | 17 | |
United Parcel Service, Inc. Class B | | | 24 | | | | 2 | |
WW Grainger, Inc. | | | 244 | | | | 52 | |
Xerox Corp. | | | 7,749 | | | | 63 | |
| | | | | | | | |
| | | | | | | 1,277 | |
| | | | | | | | |
| |
| Technology - 19.6% | | | | | |
Activision Blizzard, Inc. | | | 1,034 | | | | 13 | |
Apple, Inc. (Æ) | | | 155 | | | | 93 | |
Fusion-io, Inc. (Æ) | | | 527 | | | | 15 | |
Hewlett-Packard Co. | | | 707 | | | | 17 | |
Ingram Micro, Inc. Class A (Æ) | | | 1,357 | | | | 25 | |
Intel Corp. | | | 3,551 | | | | 100 | |
International Business Machines Corp. | | | 446 | | | | 93 | |
KLA-Tencor Corp. | | | 655 | | | | 36 | |
Lam Research Corp. (Æ) | | | 543 | | | | 24 | |
Maxim Integrated Products, Inc. | | | 1,494 | | | | 43 | |
Microchip Technology, Inc. | | | 2,708 | | | | 101 | |
Micron Technology, Inc. (Æ) | | | 1,355 | | | | 11 | |
| | |
| Russell 1000 High Beta ETF | | 21 |
Russell Exchange Traded Funds Trust
Russell 1000 High Beta ETF
Schedule of Investments, continued — March 31, 2012
Amounts in thousands (except share amounts)
| | | | | | | | |
| | | Principal
Amount ($)
or Shares | | | Market
Value
$ | |
| | | | | | | | |
Microsoft Corp. | | | 3,071 | | | | 99 | |
Motorola Mobility Holdings, Inc. (Æ) | | | 949 | | | | 37 | |
ON Semiconductor Corp. (Æ) | | | 1,717 | | | | 15 | |
Oracle Corp. | | | 2,576 | | | | 75 | |
QUALCOMM, Inc. | | | 634 | | | | 43 | |
SanDisk Corp. (Æ) | | | 795 | | | | 39 | |
Skyworks Solutions, Inc. (Æ) | | | 294 | | | | 8 | |
Texas Instruments, Inc. | | | 230 | | | | 8 | |
VMware, Inc. Class A (Æ) | | | 148 | | | | 17 | |
Western Digital Corp. (Æ) | | | 1,105 | | | | 46 | |
Yahoo!, Inc. (Æ) | | | 937 | | | | 14 | |
| | | | | | | | |
| | | | | | | 972 | |
| | | | | | | | |
| |
| Utilities - 0.1% | | | | | |
Xylem, Inc. | | | 176 | | | | 5 | |
| | | | | | | | |
| | |
Total Common Stocks
(cost $4,797) | | | | | | | 4,960 | |
| | | | | | | | |
| | |
| Short-Term Investments - 0.2% | | | | | | | | |
Russell U.S. Cash Management Fund | | | 10,797 | (¥) | | | 11 | |
| | | | | | | | |
| | |
Total Short-Term Investments
(cost $11) | | | | | | | 11 | |
| | | | | | | | |
| | |
Total Investments - 100.0%
(identified cost $4,808) | | | | | | | 4,971 | |
| | |
Other Assets and Liabilities,
Net - (0.0%) | | | | | | | (2 | ) |
| | | | | | | | |
| | |
| Net Assets - 100.0% | | | | | | | 4,969 | |
| | | | | | | | |
See accompanying notes which are an integral part of the financial statements.
| | | | |
| | 22 | | | Russell 1000 High Beta ETF |
Russell Exchange Traded Funds Trust
Russell 1000 High Beta ETF
Presentation of Portfolio Holdings — March 31, 2012
Amounts in thousands
| | | | | | | | | | | | | | | | | | | | |
| | | Market Value | | | % of Net
Assets | |
| Portfolio Summary | | Level 1 | | | Level 2 | | | Level 3 | | | Total | | |
| | | | | | | | | | | | | | | | | | | | |
Common Stocks | | | | | | | | | | | | | | | | | | | | |
Consumer Discretionary | | $ | 540 | | | $ | — | | | $ | — | | | $ | 540 | | | | 10.9 | |
Energy | | | 723 | | | | — | | | | — | | | | 723 | | | | 14.5 | |
Financial Services | | | 613 | | | | — | | | | — | | | | 613 | | | | 12.3 | |
Materials and Processing | | | 830 | | | | — | | | | — | | | | 830 | | | | 16.7 | |
Producer Durables | | | 1,277 | | | | — | | | | — | | | | 1,277 | | | | 25.7 | |
Technology | | | 972 | | | | — | | | | — | | | | 972 | | | | 19.6 | |
Utilities | | | 5 | | | | — | | | | — | | | | 5 | | | | 0.1 | |
Short-Term Investments | | | — | | | | 11 | | | | — | | | | 11 | | | | 0.2 | |
| | | | | | | | | | | | | | | | | | | | |
| | | | | |
Total Investments | | | 4,960 | | | | 11 | | | | — | | | | 4,971 | | | | 100.0 | |
| | | | | | | | | | | | | | | | | | | | |
Other Assets and Liabilities, Net | | | | | | | | | | | | | | | | | | | (— | )* |
| | | | | | | | | | | | | | | | | | | | |
| | | | | |
| | | | | | | | | | | | | | | | | | | 100.0 | |
| | | | | | | | | | | | | | | | | | | | |
| * | Less than .05% of net assets. |
For a description of the levels see note 2 in the Notes to Financial Statements.
There were no significant transfers in and out of levels 1, 2 and 3 during the period ending March 31, 2012.
See accompanying notes which are an integral part of the financial statements.
| | |
| Russell 1000 High Beta ETF | | 23 |
Russell Exchange Traded Funds Trust
Russell 1000 High Beta ETF
Statement of Assets and Liabilities — March 31, 2012
| | | | |
| Amounts in thousands | | Russell 1000
High Beta ETF | |
| | | | |
Assets | | | | |
Investments, at identified cost | | $ | 4,808 | |
Investments, at market* | | | 4,971 | |
Receivables: | | | | |
Dividends | | | 6 | |
Investments sold | | | 612 | |
| | | | |
Total assets | | | 5,589 | |
| | | | |
| |
Liabilities | | | | |
Payables: | | | | |
Investments purchased | | | 619 | |
Accrued fees to affiliates | | | 1 | |
| | | | |
Total liabilities | | | 620 | |
| | | | |
| | | | |
Net Assets | | $ | 4,969 | |
| | | | |
Net Assets Consist of: | | | | |
Undistributed (overdistributed) net investment income | | $ | 3 | |
Accumulated net realized gain (loss) | | | (1,090 | ) |
Unrealized appreciation (depreciation) on investments | | | 163 | |
Additional paid-in capital | | | 5,893 | |
| | | | |
Net Assets | | $ | 4,969 | |
| | | | |
Net Asset Value, offering and redemption price per share: | | | | |
Net asset value per share:(a) | | $ | 49.69 | |
Net assets | | $ | 4,968,667 | |
Shares outstanding ($.001 par value) | | | 100,002 | |
Amounts in thousands | | | | |
| | | | |
* Investments in Affiliates, Russell U.S. Cash Management Fund | | $ | 11 | |
| (a) | Net asset value per share equals net assets divided by shares outstanding. |
See accompanying notes which are an integral part of the financial statements.
| | | | |
| | 24 | | | Statement of Assets and Liabilities |
Russell Exchange Traded Funds Trust
Russell 1000 High Beta ETF
Statement of Operations — For the Period Ended March 31, 2012
| | | | |
| Amounts in thousands | | Russell 1000
High Beta ETF* | |
| | | | |
Investment Income | | | | |
Dividends | | $ | 181 | |
| | | | |
Total investment income | | | 181 | |
| | | | |
| |
Expenses | | | | |
Management fees | | | 51 | |
Trustee and trustee related fees | | | 33 | |
| | | | |
Expenses before reductions | | | 84 | |
Expense reductions | | | (43 | ) |
| | | | |
Net expenses | | | 41 | |
| | | | |
Net investment income (loss) | | | 140 | |
| | | | |
| |
Net Realized and Unrealized Gain (Loss) | | | | |
Net realized gain (loss) on: | | | | |
Investments | | | (1,188 | ) |
In-kind redemptions | | | (168 | ) |
| | | | |
Net realized gain (loss) | | | (1,356 | ) |
| | | | |
Net change in unrealized appreciation (depreciation) on investments | | | 163 | |
| | | | |
Net realized and unrealized gain (loss) | | | (1,193 | ) |
| | | | |
Net Increase (Decrease) in Net Assets from Operations | | $ | (1,053 | ) |
| | | | |
| * | For the period May 26, 2011 (commencement of operations) to March 31, 2012. |
See accompanying notes which are an integral part of the financial statements.
| | |
| Statement of Operations | | 25 |
Russell Exchange Traded Funds Trust
Russell 1000 High Beta ETF
Statement of Changes in Net Assets — For the Period Ended March 31,
| | | | |
| | | Russell 1000 High
Beta ETF | |
| Amounts in thousands | | 2012* | |
| | | | |
Increase (Decrease) in Net Assets | | | | |
| |
Operations | | | | |
Net investment income (loss) | | $ | 140 | |
Net realized gain (loss) | | | (1,356 | ) |
Net change in unrealized appreciation (depreciation) | | | 163 | |
| | | | |
Net increase (decrease) in net assets from operations | | | (1,053 | ) |
| | | | |
| |
Distributions | | | | |
From net investment income | | | (137 | ) |
| | | | |
Net decrease in net assets from distributions | | | (137 | ) |
| | | | |
| |
Share Transactions | | | | |
Net increase (decrease) in net assets from share transactions | | | 6,159 | |
| | | | |
Total Net Increase (Decrease) in Net Assets | | | 4,969 | |
| |
Net Assets | | | | |
Beginning of period | | | — | |
| | | | |
End of period | | $ | 4,969 | |
| | | | |
Undistributed (overdistributed) net investment income included in net assets | | $ | 3 | |
| * | For the period May 26, 2011 (commencement of operations) to March 31, 2012. |
See accompanying notes which are an integral part of the financial statements.
| | | | |
| | 26 | | | Statement of Changes in Net Assets |
(This page intentionally left blank)
Russell Exchange Traded Funds Trust
Russell 1000 High Beta ETF
Financial Highlights — For the Period Ended
For a Share Outstanding Throughout Each Period.
| | | | | | | | | | | | | | | | | | | | | | | | |
| | | | | | |
| | | $
Net Asset Value,
Beginning of
Period | | | $
Net
Investment
Income (Loss)(a)(e) | | | $
Net Realized
and Unrealized
Gain (Loss) | | | $
Total from
Investment
Operations | | | $
Distributions
from Net
Investment Income | | | $
Total
Distributions | |
Russell 1000 High Beta ETF | | | | | | | | | | | | | | | | | |
March 31, 2012* | | | 49.48 | | | | .50 | | | | .38 | | | | .88 | | | | (.67 | ) | | | (.67 | ) |
| (a) | Average daily shares outstanding were used for this calculation. |
| (b) | Periods less than one year are not annualized. |
| (c) | The ratios for periods less than one year are annualized. |
| (d) | Portfolio turnover rate excludes securities received or delivered from in-kind creation or redemption units. |
| (e) | Reflects amounts waived by Russell Investment Management Company (“RIMCo”). |
| * | For the period May 26, 2011 (commencement of operations) to March 31, 2012. |
See accompanying notes which are an integral part of the financial statements.
| | | | | | | | | | | | | | | | | | | | | | | | | | |
$
Net Asset Value,
End of
Period | | | %
Total
Return(b) | | | $
Net Assets,
End of Period
(000) | | | %
Ratio of Expenses
to Average
Net Assets,
Gross(c) | | | %
Ratio of Expenses
to Average
Net Assets,
Net(c)(e) | | | %
Ratio of Net
Investment Income
to Average
Net Assets(c)(e) | | | %
Portfolio
Turnover Rate(b)(d) | |
| | | | | | | | | | | | | | | | | | | | | | | | | | |
| | 49.69 | | | | 1.95 | | | | 4,969 | | | | .80 | | | | .39 | | | | 1.34 | | | | 122 | |
See accompanying notes which are an integral part of the financial statements.
Russell Exchange Traded Funds Trust
Russell 1000 Low Volatility ETF
Portfolio Management Discussion and Analysis — March 31, 2012 (Unaudited)
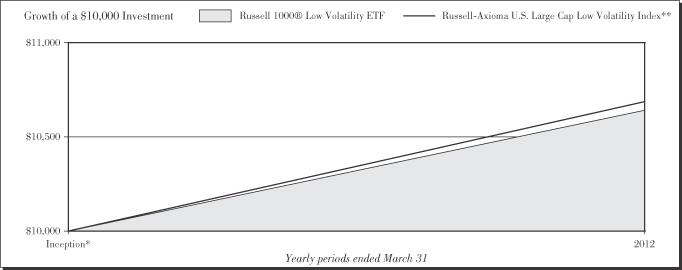
Performance as of March 31, 2012
| | | | | | | | | | | | |
|
| Average Annual Total Return | |
| | | Net Asset
Value | | | Market Value | | | Russell-Axioma
U.S. Large Cap
Low Volatility
Index** | |
Inception* | | | 6.41 | % | | | 6.25 | % | | | 6.87 | % |
| | | | |
| | 30 | | | Russell 1000 Low Volatility ETF |
Russell Exchange Traded Funds Trust
Russell 1000® Low Volatility ETF
Portfolio Management Discussion and Analysis — March 31, 2012 (Unaudited)
The Russell 1000® Low Volatility ETF (the “Fund”) is an index-based exchange-traded fund that seeks investment results that closely correspond to the total return of the Russell-Axioma U.S. Large Cap Low Volatility Index (the “Index”). Russell Investment Management Company (“RIMCo”), as the Fund’s advisor, uses a “passive” or indexing approach to try to achieve the Fund’s investment objective. Unlike many investment companies, the Fund does not try to “beat” the Index it tracks and does not seek temporary defensive positions when markets decline or appear overvalued. The Fund seeks to gain exposure to the factor exhibited in its Index. The Fund will normally invest at least 80% of its total assets in common stocks that comprise the Index.
What is the Fund’s investment objective?
The Fund seeks investment results that closely correspond to the total return of the Russell-Axioma U.S. Large Cap Low Volatility Index, which is designed to deliver exposure to stocks with low volatility as determined by a screening and ranking methodology applied to the output of the Axioma U.S. Equity Medium Horizon Fundamental Factor Risk model.
Is the Fund replicating or sampling?
The Fund is replicating.
How did the Fund perform relative to its benchmark for the fiscal year ended March 31, 2012?
For the fiscal year ended March 31, 2012, the Fund gained 6.41%. This is compared to the Fund’s benchmark, the Russell-Axioma U.S. Large Cap Low Volatility Index, which gained 6.87% during the same period. The Fund’s performance includes operating expenses, whereas indexes are unmanaged and index returns do not include expenses of any kind.
There were no significant changes to either the Fund or Index during the reporting period.
Did the Fund outperform or underperform the benchmark or was performance as expected based on expenses, etc.?
The Fund performed as expected against the benchmark.
Over the reporting period, please describe those sectors that outperformed or underperformed.
Sectors reported both positive and negative returns for the Fund and the Index. Consumer discretionary was the best performing sector for the Fund and the Index, while financial services was the worst performing sector. Consumer staples, with an average weight of over 22%, was the best contributor to Fund and Index returns. Energy, with an average weight of over 9%, was the worst contributor to Fund and Index returns.
Over the reporting period, please describe those individual securities (constituents) that outperformed or underperformed.
Philip Morris International Inc, International Business Machines Corp, and McDonald’s Corp. generated positive returns and contributed the most to Fund performance while Oracle, Peabody Energy Corp, and Harsco Corp. all declined which detracted from Fund performance.
The views expressed in this report reflect those of the portfolio managers only through the end of the period covered by the report. These views do not necessarily represent the views of RIMCo, or any other person in RIMCo or any other affiliated organization. These views are subject to change at any time based upon market conditions or other events, and RIMCo disclaims any responsibility to update the views contained herein. These views should not be relied on as investment advice and, because investment decisions for a Russell Exchange Traded Funds Trust (“RET”) Fund are based on numerous factors, should not be relied on as an indication of investment decisions of any RET Fund.
| * | | Commenced operations by issuing shares May 26, 2011. |
| ** | | The Russell-Axioma U.S. Large Cap Low Volatility Index is designed to deliver exposure to stocks with low volatility as determined by a screening and ranking methodology applied to the output of the Axioma U.S. Equity Medium Horizon Fundamental Factor Risk model. Volatility is a measure of a stock’s variability in total returns based on its historical behavior over the last sixty days. Stocks exhibiting high or low volatility can be used by investors to adjust volatility exposure in a portfolio. |
Performance is historical and assumes reinvestment of all dividends and capital gains. Investment return and principal value will fluctuate so that an investor’s shares, when redeemed, may be worth more or less than when purchased. Past performance is not indicative of future results. The returns shown do not reflect the deduction of taxes that a shareholder would pay on Fund distributions or the redemption of Fund shares.
| | |
| Russell 1000® Low Volatility ETF | | 31 |
Russell Exchange Traded Funds Trust
Russell 1000 Low Volatility ETF
Shareholder Expense Example — March 31, 2012 (Unaudited)
Fund Expenses
The following disclosure provides important information regarding each Fund’s Expense Example, which appears on each Fund’s individual page in this Annual Report. Please refer to this information when reviewing the Expense Example for a Fund.
Example
As a shareholder of the Fund, you incur two types of costs: (1) transaction costs, including brokerage commissions on purchases and sales of your Fund shares and (2) ongoing costs, including management fees and other Fund expenses. The Example is intended to help you understand your ongoing costs (in dollars) of investing in the Fund and to compare these costs with the ongoing costs of investing in other funds. The Example is based on an investment of $1,000 invested at the beginning of the period and held for the entire period indicated, which for this Fund is from October 1, 2011 to March 31, 2012.
Actual Expenses
The information in the table under the heading “Actual Performance” provides information about actual account values and actual expenses. You may use the information in this column, together with the amount you invested, to estimate the expenses that you paid over the period. Simply divide your account value by $1,000 (for example, an $8,600 account value divided by $1,000 = 8.6), then multiply the result by the number in the first column in the row entitled “Expenses Paid During Period” to estimate the expenses you paid on your account during this period.
Hypothetical Example for Comparison Purposes
The information in the table under the heading “Hypothetical Performance (5% return before expenses)” provides information about hypothetical account values and hypothetical expenses based on the Fund’s actual expense ratio and an assumed rate of return of 5% per year before expenses, which is not the Fund’s actual return. The hypothetical account values and expenses may not be used to estimate the actual ending account balance or expenses you paid for the period. You may use this information to compare the ongoing costs of investing in the Fund and other funds. To do so, compare this 5% hypothetical example with the 5% hypothetical examples that appear in the shareholder reports of other funds.
Please note that the expenses shown in the table are meant to highlight your ongoing costs only and do not reflect any transactional costs, such as brokerage commissions paid on purchases and sales of Fund shares. Therefore, the information under the heading “Hypothetical Performance (5% return before expenses)” is useful in comparing ongoing costs only, and will not help you determine the relative total costs of owning different funds. In addition, if these transactional costs were included, your costs would have been higher.
| | | | | | | | |
| | | Actual
Performance | | | Hypothetical
Performance
(5% return
before expenses) | |
| | | | | | | | |
Beginning Account Value October 1, 2011 | | $ | 1,000.00 | | | $ | 1,000.00 | |
Ending Account Value March 31, 2012 | | $ | 1,184.00 | | | $ | 1,023.80 | |
Expenses Paid During the Period* | | $ | 1.31 | | | $ | 1.21 | |
| * | Expenses are equal to the Fund’s annualized expense ratio of 0.24% (representing the six month period annualized), multiplied by the average account value over the period, multiplied by 183/366 (to reflect the one-half year period). Effective November 3, 2011, the annualized expense ratio is 0.20%, as contractually agreed to by the adviser. May reflect amounts waived and/or reimbursed. Without any waivers and/or reimbursements, expenses would have been higher. |
| | | | |
| | 32 | | | Russell 1000 Low Volatility ETF |
Russell Exchange Traded Funds Trust
Russell 1000 Low Volatility ETF
Schedule of Investments — March 31, 2012
Amounts in thousands (except share amounts)
| | | | | | | | |
| | | Principal
Amount ($)
or Shares | | | Market
Value
$ | |
| | | | | | | | |
| Common Stocks - 99.7% | | | | | |
| Consumer Discretionary - 11.1% | | | | | |
Costco Wholesale Corp. | | | 14,138 | | | | 1,284 | |
Discovery Communications, Inc. Class A (Æ) | | | 586 | | | | 30 | |
Fossil, Inc. (Æ) | | | 1,972 | | | | 260 | |
Genuine Parts Co. | | | 10,620 | | | | 666 | |
Interpublic Group of Cos., Inc. (The) | | | 5,904 | | | | 67 | |
Marriott International, Inc. Class A | | | 16,486 | | | | 624 | |
McDonald’s Corp. | | | 13,726 | | | | 1,347 | |
News Corp. Class A | | | 20,478 | | | | 403 | |
priceline.com, Inc. (Æ) | | | 966 | | | | 693 | |
Time Warner, Inc. | | | 3,982 | | | | 150 | |
Wal-Mart Stores, Inc. | | | 22,579 | | | | 1,382 | |
Walt Disney Co. (The) | | | 26,125 | | | | 1,144 | |
| | | | | | | | |
| | | | | | | 8,050 | |
| | | | | | | | |
| |
| Consumer Staples - 19.3% | | | | | |
Altria Group, Inc. | | | 46,383 | | | | 1,432 | |
Clorox Co. (The) | | | 6,350 | | | | 437 | |
Coca-Cola Co. (The) | | | 19,731 | | | | 1,460 | |
Colgate-Palmolive Co. | | | 6,075 | | | | 594 | |
ConAgra Foods, Inc. | | | 18,837 | | | | 495 | |
CVS Caremark Corp. | | | 16,628 | | | | 745 | |
General Mills, Inc. | | | 9,886 | | | | 390 | |
HJ Heinz Co. | | | 24,832 | | | | 1,330 | |
JM Smucker Co. (The) | | | 2,696 | | | | 219 | |
Kellogg Co. | | | 11,333 | | | | 608 | |
Kimberly-Clark Corp. | | | 17,826 | | | | 1,317 | |
Kraft Foods, Inc. Class A | | | 9,465 | | | | 360 | |
PepsiCo, Inc. | | | 19,016 | | | | 1,262 | |
Philip Morris International, Inc. | | | 16,447 | | | | 1,457 | |
Procter & Gamble Co. (The) | | | 20,264 | | | | 1,362 | |
Reynolds American, Inc. | | | 7,719 | | | | 320 | |
Sysco Corp. | | | 6,108 | | | | 182 | |
| | | | | | | | |
| | | | | | | 13,970 | |
| | | | | | | | |
| | |
| Energy - 6.5% | | | | | | | | |
Anadarko Petroleum Corp. | | | 6,965 | | | | 546 | |
Apache Corp. | | | 5,964 | | | | 599 | |
Devon Energy Corp. | | | 677 | | | | 48 | |
El Paso Corp. | | | 12,029 | | | | 355 | |
Exxon Mobil Corp. | | | 16,315 | | | | 1,415 | |
Marathon Oil Corp. | | | 14,643 | | | | 464 | |
Murphy Oil Corp. | | | 2,524 | | | | 142 | |
Occidental Petroleum Corp. | | | 9,035 | | | | 860 | |
Peabody Energy Corp. | | | 7,863 | | | | 228 | |
Spectra Energy Corp. | | | 1,073 | | | | 34 | |
Williams Cos., Inc. (The) | | | 320 | | | | 10 | |
| | | | | | | | |
| | | | | | | 4,701 | |
| | | | | | | | |
| |
| Financial Services - 5.4% | | | | | |
Aon Corp. | | | 7,741 | | | | 380 | |
Franklin Resources, Inc. | | | 2,180 | | | | 270 | |
Host Hotels & Resorts, Inc. (ö) | | | 71,898 | | | | 1,180 | |
Invesco, Ltd. | | | 2,681 | | | | 72 | |
| | | | | | | | |
| | | Principal
Amount ($)
or Shares | | | Market
Value
$ | |
Janus Capital Group, Inc. | | | 7,846 | | | | 70 | |
Jones Lang LaSalle, Inc. | | | 6,373 | | | | 531 | |
Legg Mason, Inc. | | | 35,260 | | | | 985 | |
MetLife, Inc. | | | 9,363 | | | | 350 | |
Taubman Centers, Inc. (ö) | | | 828 | | | | 60 | |
| | | | | | | | |
| | | | | | | 3,898 | |
| | | | | | | | |
| | |
| Health Care - 16.1% | | | | | | | | |
Abbott Laboratories | | | 23,773 | | | | 1,457 | |
Bristol-Myers Squibb Co. | | | 34,782 | | | | 1,174 | |
Brookdale Senior Living, Inc. Class A (Æ) | | | 1,940 | | | | 36 | |
CR Bard, Inc. | | | 5,913 | | | | 584 | |
Dentsply International, Inc. | | | 36,202 | | | | 1,453 | |
Eli Lilly & Co. | | | 33,427 | | | | 1,346 | |
Forest Laboratories, Inc. (Æ) | | | 41,676 | | | | 1,446 | |
Henry Schein, Inc. (Æ) | | | 14,973 | | | | 1,133 | |
Johnson & Johnson | | | 22,249 | | | | 1,467 | |
Merck & Co., Inc. | | | 8,156 | | | | 313 | |
Mylan, Inc. (Æ) | | | 18,491 | | | | 434 | |
Pfizer, Inc. | | | 11,107 | | | | 252 | |
Stryker Corp. | | | 2,506 | | | | 139 | |
UnitedHealth Group, Inc. | | | 7,571 | | | | 446 | |
| | | | | | | | |
| | | | | | | 11,680 | |
| | | | | | | | |
| |
| Materials and Processing - 4.8% | | | | | |
Dow Chemical Co. (The) | | | 6,659 | | | | 231 | |
Eastman Chemical Co. | | | 7,399 | | | | 382 | |
Solutia, Inc. | | | 51,949 | | | | 1,451 | |
WR Grace & Co. (Æ) | | | 24,785 | | | | 1,433 | |
| | | | | | | | |
| | | | | | | 3,497 | |
| | | | | | | | |
| |
| Producer Durables - 12.0% | | | | | |
Accenture PLC Class A | | | 1,213 | | | | 78 | |
Agilent Technologies, Inc. | | | 4,409 | | | | 196 | |
Automatic Data Processing, Inc. | | | 14,088 | | | | 778 | |
Caterpillar, Inc. | | | 12,302 | | | | 1,310 | |
General Electric Co. | | | 18,875 | | | | 379 | |
Goodrich Corp. | | | 11,604 | | | | 1,455 | |
Manitowoc Co., Inc. (The) | | | 28,238 | | | | 391 | |
Paychex, Inc. | | | 5,233 | | | | 162 | |
Terex Corp. (Æ) | | | 16,963 | | | | 382 | |
Textron, Inc. | | | 10,884 | | | | 303 | |
Thomas & Betts Corp. (Æ) | | | 20,236 | | | | 1,455 | |
United Parcel Service, Inc. Class B | | | 17,995 | | | | 1,453 | |
United Technologies Corp. | | | 4,699 | | | | 390 | |
| | | | | | | | |
| | | | | | | 8,732 | |
| | | | | | | | |
| | |
| Technology - 8.4% | | | | | | | | |
Cisco Systems, Inc. | | | 44,555 | | | | 942 | |
EMC Corp. (Æ) | | | 3,115 | | | | 93 | |
Google, Inc. Class A (Æ) | | | 154 | | | | 99 | |
International Business Machines Corp. | | | 6,979 | | | | 1,456 | |
Jabil Circuit, Inc. | | | 23,242 | | | | 584 | |
Microsoft Corp. | | | 33,394 | | | | 1,077 | |
Motorola Mobility Holdings, Inc. (Æ) | | | 36,893 | | | | 1,448 | |
QUALCOMM, Inc. | | | 3,208 | | | | 218 | |
| | |
| Russell 1000 Low Volatility ETF | | 33 |
Russell Exchange Traded Funds Trust
Russell 1000 Low Volatility ETF
Schedule of Investments, continued — March 31, 2012
Amounts in thousands (except share amounts)
| | | | | | | | |
| | | Principal
Amount ($)
or Shares | | | Market
Value
$ | |
| | | | | | | | |
SBA Communications Corp. Class A (Æ) | | | 508 | | | | 26 | |
VeriSign, Inc. | | | 3,972 | | | | 152 | |
| | | | | | | | |
| | | | | | | 6,095 | |
| | | | | | | | |
| | |
| Utilities - 16.1% | | | | | | | | |
American Electric Power Co., Inc. | | | 408 | | | | 16 | |
AT&T, Inc. | | | 45,606 | | | | 1,425 | |
CenturyLink, Inc. | | | 17,404 | | | | 673 | |
Consolidated Edison, Inc. | | | 14,096 | | | | 823 | |
Dominion Resources, Inc. | | | 18,577 | | | | 951 | |
Duke Energy Corp. | | | 61,875 | | | | 1,300 | |
Edison International | | | 2,542 | | | | 108 | |
Entergy Corp. | | | 4,006 | | | | 269 | |
Great Plains Energy, Inc. | | | 14,435 | | | | 293 | |
ONEOK, Inc. | | | 9,232 | | | | 754 | |
Public Service Enterprise Group, Inc. | | | 1,318 | | | | 40 | |
SCANA Corp. | | | 3,313 | | | | 151 | |
Sempra Energy | | | 4,786 | | | | 287 | |
Southern Co. | | | 30,267 | | | | 1,360 | |
Verizon Communications, Inc. | | | 34,589 | | | | 1,322 | |
Windstream Corp. | | | 13,171 | | | | 154 | |
Wisconsin Energy Corp. | | | 11,989 | | | | 422 | |
Xcel Energy, Inc. | | | 50,685 | | | | 1,342 | |
| | | | | | | | |
| | | | | | | 11,690 | |
| | | | | | | | |
| | |
Total Common Stocks
(cost $70,483) | | | | | | | 72,313 | |
| | | | | | | | |
| | |
| Short-Term Investments - 0.2% | | | | | | | | |
Russell U.S. Cash Management Fund | | | 149,317 | (¥) | | | 149 | |
| | | | | | | | |
| | |
Total Short-Term Investments
(cost $149) | | | | | | | 149 | |
| | | | | | | | |
| | |
Total Investments - 99.9%
(identified cost $70,632) | | | | | | | 72,462 | |
| |
Other Assets and Liabilities,
Net - 0.1% | | | | 73 | |
| | | | | | | | |
| | |
| Net Assets - 100.0% | | | | | | | 72,535 | |
| | | | | | | | |
See accompanying notes which are an integral part of the financial statements.
| | | | |
| | 34 | | | Russell 1000 Low Volatility ETF |
Russell Exchange Traded Funds Trust
Russell 1000 Low Volatility ETF
Presentation of Portfolio Holdings — March 31, 2012
Amounts in thousands
| | | | | | | | | | | | | | | | | | | | |
| | | Market Value | | | % of Net
Assets | |
| Portfolio Summary | | Level 1 | | | Level 2 | | | Level 3 | | | Total | | |
| | | | | | | | | | | | | | | | | | | | |
Common Stocks | | | | | | | | | | | | | | | | | | | | |
Consumer Discretionary | | $ | 8,050 | | | $ | — | | | $ | — | | | $ | 8,050 | | | | 11 .1 | |
Consumer Staples | | | 13,970 | | | | — | | | | — | | | | 13,970 | | | | 19 .3 | |
Energy | | | 4,701 | | | | — | | | | — | | | | 4,701 | | | | 6 .5 | |
Financial Services | | | 3,898 | | | | — | | | | — | | | | 3,898 | | | | 5 .4 | |
Health Care | | | 11,680 | | | | — | | | | — | | | | 11,680 | | | | 16 .1 | |
Materials and Processing | | | 3,497 | | | | — | | | | — | | | | 3,497 | | | | 4 .8 | |
Producer Durables | | | 8,732 | | | | — | | | | — | | | | 8,732 | | | | 12 .0 | |
Technology | | | 6,095 | | | | — | | | | — | | | | 6,095 | | | | 8 .4 | |
Utilities | | | 11,690 | | | | — | | | | — | | | | 11,690 | | | | 16 .1 | |
Short-Term Investments | | | — | | | | 149 | | | | — | | | | 149 | | | | 0 .2 | |
| | | | | | | | | | | | | | | | | | | | |
| | | | | |
Total Investments | | | 72,313 | | | | 149 | | | | — | | | | 72,462 | | | | 99 .9 | |
| | | | | | | | | | | | | | | | | | | | |
Other Assets and Liabilities, Net | | | | | | | | | | | | | | | | | | | 0 .1 | |
| | | | | | | | | | | | | | | | | | | | |
| | | | | |
| | | | | | | | | | | | | | | | | | | 100 .0 | |
| | | | | | | | | | | | | | | | | | | | |
For a description of the levels see note 2 in the Notes to Financial Statements.
There were no significant transfers in and out of levels 1, 2 and 3 during the period ending March 31, 2012.
See accompanying notes which are an integral part of the financial statements.
| | |
| Russell 1000 Low Volatility ETF | | 35 |
Russell Exchange Traded Funds Trust
Russell 1000 Low Volatility ETF
Statement of Assets and Liabilities — March 31, 2012
| | | | |
| Amounts in thousands | | Russell 1000 Low
Volatility ETF | |
| | | | |
Assets | | | | |
Investments, at identified cost | | $ | 70,632 | |
Investments, at market* | | | 72,462 | |
Receivables: | | | | |
Dividends | | | 137 | |
Investments sold | | | 4,278 | |
| | | | |
Total assets | | | 76,877 | |
| | | | |
| |
Liabilities | | | | |
Payables: | | | | |
Investments purchased | | | 4,331 | |
Accrued fees to affiliates | | | 11 | |
| | | | |
Total liabilities | | | 4,342 | |
| | | | |
| | | | |
Net Assets | | $ | 72,535 | |
| | | | |
Net Assets Consist of: | | | | |
Undistributed (overdistributed) net investment income | | $ | 49 | |
Accumulated net realized gain (loss) | | | (1,272 | ) |
Unrealized appreciation (depreciation) on investments | | | 1,830 | |
Shares of beneficial interest | | | 1 | |
Additional paid-in capital | | | 71,927 | |
| | | | |
Net Assets | | $ | 72,535 | |
| | | | |
Net Asset Value, offering and redemption price per share: | | | | |
Net asset value per share:(a) | | $ | 51.81 | |
Net assets | | $ | 72,535,428 | |
Shares outstanding ($.001 par value) | | | 1,400,002 | |
Amounts in thousands | | | | |
| | | | |
* Investments in Affiliates, Russell U.S. Cash Management Fund | | $ | 149 | |
| (a) | Net asset value per share equals net assets divided by shares outstanding. |
See accompanying notes which are an integral part of the financial statements.
| | | | |
| | 36 | | | Statement of Assets and Liabilities |
Russell Exchange Traded Funds Trust
Russell 1000 Low Volatility ETF
Statement of Operation — For the Period Ended March 31, 2012
| | | | |
| Amounts in thousands | | Russell 1000 Low
Volatility ETF* | |
| | | | |
Investment Income | | | | |
Dividends | | $ | 838 | |
| | | | |
Total investment income | | | 838 | |
| | | | |
| |
Expenses | | | | |
Management fees | | | 144 | |
Trustee and trustee related fees | | | 82 | |
| | | | |
Expenses before reductions | | | 226 | |
Expense reductions | | | (129 | ) |
| | | | |
Net expenses | | | 97 | |
| | | | |
Net investment income (loss) | | | 741 | |
| | | | |
| |
Net Realized and Unrealized Gain (Loss) | | | | |
Net realized gain (loss) on: | | | | |
Investments | | | (1,506 | ) |
In-kind redemptions | | | (305 | ) |
| | | | |
Net realized gain (loss) | | | (1,811 | ) |
| | | | |
Net change in unrealized appreciation (depreciation) on investments | | | 1,830 | |
| | | | |
Net realized and unrealized gain (loss) | | | 19 | |
| | | | |
Net Increase (Decrease) in Net Assets from Operations | | $ | 760 | |
| | | | |
| * | For the period May 26, 2011 (commencement of operations) to March 31, 2012. |
See accompanying notes which are an integral part of the financial statements.
| | |
| Statement of Operation | | 37 |
Russell Exchange Traded Funds Trust
Russell 1000 Low Volatility ETF
Statement of Changes in Net Assets — For the Period Ended March 31,
| | | | |
| | | Russell 1000 Low
Volatility ETF | |
| Amounts in thousands | | 2012* | |
| | | | |
Increase (Decrease) in Net Assets | | | | |
| |
Operations | | | | |
Net investment income (loss) | | $ | 741 | |
Net realized gain (loss) | | | (1,811 | ) |
Net change in unrealized appreciation (depreciation) | | | 1,830 | |
| | | | |
Net increase (decrease) in net assets from operations | | | 760 | |
| | | | |
| |
Distributions | | | | |
From net investment income | | | (692 | ) |
| | | | |
Net decrease in net assets from distributions | | | (692 | ) |
| | | | |
| |
Share Transactions | | | | |
Net increase (decrease) in net assets from share transactions | | | 72,467 | |
| | | | |
Total Net Increase (Decrease) in Net Assets | | | 72,535 | |
| |
Net Assets | | | | |
Beginning of period | | | — | |
| | | | |
End of period | | $ | 72,535 | |
| | | | |
Undistributed (overdistributed) net investment income included in net assets | | $ | 49 | |
| * | For the period May 26, 2011 (commencement of operations) to March 31, 2012. |
See accompanying notes which are an integral part of the financial statements.
| | | | |
| | 38 | | | Statement of Changes in Net Assets |
(This page intentionally left blank)
Russell Exchange Traded Funds Trust
Russell 1000 Low Volatility ETF
Financial Highlights — For the Period Ended
For a Share Outstanding Throughout Each Period.
| | | | | | | | | | | | | | | | | | | | | | | | |
| | |
$
Net Asset Value,
Beginning of
Period | | | $
Net
Investment
Income (Loss)(a)(e) | | | $
Net Realized
and Unrealized
Gain (Loss) | | | $
Total from
Investment
Operations | | | $
Distributions
from Net
Investment Income | | | $
Total
Distributions | |
March 31, 2012* | | | 49.51 | | | | 1.03 | | | | 2.08 | | | | 3.11 | | | | (.81 | ) | | | (.81 | ) |
| (a) | Average daily shares outstanding were used for this calculation. |
| (b) | Periods less than one year are not annualized. |
| (c) | The ratios for periods less than one year are annualized. |
| (d) | Portfolio turnover rate excludes securities received or delivered from in-kind creation or redemption units. |
| (e) | Reflects amounts waived by Russell Investment Management Company (“RIMCo”). |
| * | For the period May 26, 2011 (commencement of operations) to March 31, 2012. |
See accompanying notes which are an integral part of the financial statements.
| | | | | | | | | | | | | | | | | | | | | | | | | | |
$
Net Asset Value,
End of
Period | | | %
Total
Return(b) | | | $
Net Assets,
End of Period
(000) | | | %
Ratio of Expenses
to Average
Net Assets,
Gross(c) | | | %
Ratio of Expenses
to Average
Net Assets,
Net(c)(e) | | | %
Ratio of Net
Investment Income
to Average
Net Assets(c)(e) | | | %
Portfolio
Turnover Rate(b)(d) | |
| | 51.81 | | | | 6.41 | | | | 72,535 | | | | .77 | | | | .33 | | | | 2.52 | | | | 79 | |
See accompanying notes which are an integral part of the financial statements.
Russell Exchange Traded Funds Trust
Russell 1000 High Volatility ETF
Portfolio Management Discussion and Analysis — March 31, 2012 (Unaudited)
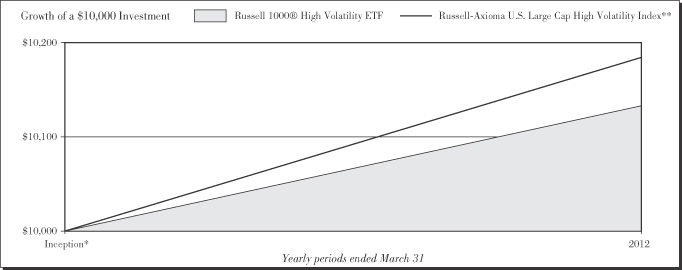
Performance as of March 31, 2012
| | | | | | | | | | | | |
|
| Average Annual Total Return | |
| | | Net Asset
Value | | | Market Value | | | Russell-Axioma
U.S. Large Cap
High Volatility
Index** | |
Inception* | | | 1.32 | % | | | 1.33 | % | | | 1.83 | % |
| | | | |
| | 42 | | | Russell 1000 High Volatility ETF |
Russell Exchange Traded Funds Trust
Russell 1000® High Volatility ETF
Portfolio Management Discussion and Analysis — March 31, 2012 (Unaudited)
The Russell 1000® High Volatility ETF (the “Fund”) is an index-based exchange-traded fund that seeks investment results that closely correspond to the total return of the Russell-Axioma U.S. Large Cap High Volatility Index (the “Index”). Russell Investment Management Company (“RIMCo”), as the Fund’s advisor, uses a “passive” or indexing approach to try to achieve the Fund’s investment objective. Unlike many investment companies, the Fund does not try to “beat” the Index it tracks and does not seek temporary defensive positions when markets decline or appear overvalued. The Fund seeks to gain exposure to the factor exhibited in its Index. The Fund will normally invest at least 80% of its total assets in securities that comprise the Index.
What is the Fund’s investment objective?
The Fund seeks investment results that closely correspond to the total return of the Russell–Axioma U.S. Large Cap High Volatility Index, which is designed to deliver exposure to stocks with high volatility as determined by a screening and ranking methodology applied to the output of the Axioma U.S. Equity Medium Horizon Fundamental Factor Risk model.
Is the Fund replicating or sampling?
The Fund is replicating.
How did the Fund perform relative to its benchmark for the fiscal year ended March 31, 2012?
For the fiscal year ended March 31, 2012, the Fund gained 1.32%. This is compared to the Fund’s benchmark, the Russell-Axioma U.S. Large Cap High Volatility Index, which gained 1.83% during the same period. The Fund’s performance includes operating expenses, whereas indexes are unmanaged and index returns do not include expenses of any kind.
There were no significant changes to either the Fund or Index during the reporting period.
Did the Fund outperform or underperform the benchmark or was performance as expected based on expenses, etc.?
The Fund performed as expected against the benchmark.
Over the reporting period, please describe those sectors that outperformed or underperformed.
Sectors achieved both positive and negative returns for the Fund and the Index. Health care was the best performing sector for the Fund and the Index, while utilities was the worst performing sector. Health care, with an average weight of 5.1% was the best contributor to Fund and Index returns. Materials & processing, with an average weight of 10.4%, was the worst contributor to Fund and Index returns.
Over the reporting period, please describe those individual securities (constituents) that outperformed or underperformed.
Pharmasset, Apple Inc, and Regeneron Pharmaceuticals Inc generated positive returns and contributed the most to Fund performance while Molycorp Inc, Sprint Nextel Corp, and Acme Packet Inc, all declined which detracted from Fund performance.
The views expressed in this report reflect those of the portfolio managers only through the end of the period covered by the report. These views do not necessarily represent the views of RIMCo, or any other person in RIMCo or any other affiliated organization. These views are subject to change at any time based upon market conditions or other events, and RIMCo disclaims any responsibility to update the views contained herein. These views should not be relied on as investment advice and, because investment decisions for a Russell Exchange Traded Funds Trust (“RET”) Fund are based on numerous factors, should not be relied on as an indication of investment decisions of any RET Fund.
| * | | Commenced operations by issuing shares May 26, 2011. |
| ** | | The Russell-Axioma U.S. Large Cap High Volatility Index is designed to deliver exposure to stocks with high volatility as determined by a screening and ranking methodology applied to the output of the Axioma U.S. Equity Medium Horizon Fundamental Factor Risk model. Volatility is a measure of a stock’s variability in total returns based on its historical behavior over the last sixty days. Stocks exhibiting high or low volatility can be used by investors to adjust volatility exposure in a portfolio. |
Performance is historical and assumes reinvestment of all dividends and capital gains. Investment return and principal value will fluctuate so that an investor’s shares, when redeemed, may be worth more or less than when purchased. Past performance is not indicative of future results. The returns shown do not reflect the deduction of taxes that a shareholder would pay on Fund distributions or the redemption of Fund shares.
| | |
| Russell 1000® High Volatility ETF | | 43 |
Russell Exchange Traded Funds Trust
Russell 1000 High Volatility ETF
Shareholder Expense Example — March 31, 2012 (Unaudited)
Fund Expenses
The following disclosure provides important information regarding each Fund’s Expense Example, which appears on each Fund’s individual page in this Annual Report. Please refer to this information when reviewing the Expense Example for a Fund.
Example
As a shareholder of the Fund, you incur two types of costs: (1) transaction costs, including brokerage commissions on purchases and sales of your Fund shares and (2) ongoing costs, including management fees and other Fund expenses. The Example is intended to help you understand your ongoing costs (in dollars) of investing in the Fund and to compare these costs with the ongoing costs of investing in other funds. The Example is based on an investment of $1,000 invested at the beginning of the period and held for the entire period indicated, which for this Fund is from October 1, 2011 to March 31, 2012.
Actual Expenses
The information in the table under the heading “Actual Performance” provides information about actual account values and actual expenses. You may use the information in this column, together with the amount you invested, to estimate the expenses that you paid over the period. Simply divide your account value by $1,000 (for example, an $8,600 account value divided by $1,000 = 8.6), then multiply the result by the number in the first column in the row entitled “Expenses Paid During Period” to estimate the expenses you paid on your account during this period.
Hypothetical Example for Comparison Purposes
The information in the table under the heading “Hypothetical Performance (5% return before expenses)” provides information about hypothetical account values and hypothetical expenses based on the Fund’s actual expense ratio and an assumed rate of return of 5% per year before expenses, which is not the Fund’s actual return. The hypothetical account values and expenses may not be used to estimate the actual ending account balance or expenses you paid for the period. You may use this information to compare the ongoing costs of investing in the Fund and other funds. To do so, compare this 5% hypothetical example with the 5% hypothetical examples that appear in the shareholder reports of other funds.
Please note that the expenses shown in the table are meant to highlight your ongoing costs only and do not reflect any transactional costs, such as brokerage commissions paid on purchases and sales of Fund shares. Therefore, the information under the heading “Hypothetical Performance (5% return before expenses)” is useful in comparing ongoing costs only, and will not help you determine the relative total costs of owning different funds. In addition, if these transactional costs were included, your costs would have been higher.
| | | | | | | | |
| | | Actual
Performance | | | Hypothetical
Performance
(5% return
before expenses) | |
| | | | | | | | |
Beginning Account Value October 1, 2011 | | $ | 1,000.00 | | | $ | 1,000.00 | |
Ending Account Value March 31, 2012 | | $ | 1,276.90 | | | $ | 1,023.75 | |
Expenses Paid During Period* | | $ | 1.42 | | | $ | 1.26 | |
| * | Expenses are equal to the Fund’s annualized expense ratio of 0.25% (representing the six month period annualized), multiplied by the average account value over the period, multiplied by 183/366 (to reflect the one-half year period). Effective November 3, 2011, the annualized expense ratio is 0.20%, as contractually agreed to by the adviser. May reflect amounts waived and/or reimbursed. Without any waivers and/or reimbursements, expenses would have been higher. |
| | | | |
| | 44 | | | Russell 1000 High Volatility ETF |
Russell Exchange Traded Funds Trust
Russell 1000 High Volatility ETF
Schedule of Investments — March 31, 2012
Amounts in thousands (except share amounts)
| | | | | | | | |
| | | Principal
Amount ($)
or Shares | | | Market
Value
$ | |
| | | | | | | | |
| Common Stocks - 99.8% | | | | | | | | |
| Consumer Discretionary - 14.6% | | | | | | | | |
Amazon.com, Inc. (Æ) | | | 499 | | | | 101 | |
DIRECTV, Inc. Class A (Æ) | | | 429 | | | | 21 | |
Dunkin’ Brands Group, Inc. | | | 1,527 | | | | 46 | |
Education Management Corp. (Æ) | | | 1,208 | | | | 17 | |
Ford Motor Co. | | | 4,559 | | | | 57 | |
Fortune Brands Home & Security, Inc. (Æ) | | | 1,827 | | | | 40 | |
General Motors Co. (Æ) | | | 3,660 | | | | 94 | |
Las Vegas Sands Corp. | | | 683 | | | | 39 | |
Lowe’s Cos., Inc. | | | 2,655 | | | | 83 | |
Netflix, Inc. (Æ) | | | 219 | | | | 25 | |
Nielsen Holdings NV (Æ) | | | 182 | | | | 5 | |
Pandora Media, Inc. (Æ) | | | 7,018 | | | | 72 | |
Sears Holdings Corp. (Æ) | | | 382 | | | | 25 | |
Sirius XM Radio, Inc. (Æ) | | | 1,796 | | | | 4 | |
Tesla Motors, Inc. (Æ) | | | 848 | | | | 32 | |
Toll Brothers, Inc. (Æ) | | | 37 | | | | 1 | |
Ulta Salon Cosmetics & Fragrance, Inc. | | | 496 | | | | 46 | |
Wal-Mart Stores, Inc. | | | 226 | | | | 14 | |
Wynn Resorts, Ltd. | | | 62 | | | | 8 | |
| | | | | | | | |
| | | | | | | 730 | |
| | | | | | | | |
| | |
| Consumer Staples - 3.9% | | | | | | | | |
Green Mountain Coffee Roasters, Inc. (Æ) | | | 592 | | | | 28 | |
Monster Beverage Corp. (Æ) | | | 1,258 | | | | 78 | |
Walgreen Co. | | | 2,711 | | | | 91 | |
| | | | | | | | |
| | | | | | | 197 | |
| | | | | | | | |
| | |
| Energy - 13.2% | | | | | | | | |
Baker Hughes, Inc. | | | 572 | | | | 24 | |
Cabot Oil & Gas Corp. | | | 1,604 | | | | 50 | |
Chesapeake Energy Corp. | | | 27 | | | | 1 | |
Chevron Corp. | | | 873 | | | | 95 | |
Core Laboratories NV | | | 333 | | | | 44 | |
EOG Resources, Inc. | | | 174 | | | | 19 | |
EQT Corp. | | | 91 | | | | 4 | |
Exxon Mobil Corp. | | | 944 | | | | 82 | |
First Solar, Inc. (Æ) | | | 560 | | | | 14 | |
FMC Technologies, Inc. (Æ) | | | 299 | | | | 15 | |
Halliburton Co. | | | 188 | | | | 6 | |
HollyFrontier Corp. | | | 801 | | | | 26 | |
Kinder Morgan, Inc. | | | 865 | | | | 33 | |
Kosmos Energy, Ltd. (Æ) | | | 1,231 | | | | 16 | |
Marathon Petroleum Corp. | | | 284 | | | | 12 | |
National Oilwell Varco, Inc. | | | 37 | | | | 3 | |
Occidental Petroleum Corp. | | | 628 | | | | 60 | |
Range Resources Corp. | | | 605 | | | | 35 | |
RPC, Inc. | | | 1,482 | | | | 16 | |
Schlumberger, Ltd. | | | 1,234 | | | | 87 | |
SunPower Corp. Class A (Æ) | | | 852 | | | | 5 | |
Ultra Petroleum Corp. (Æ) | | | 462 | | | | 10 | |
| | | | | | | | |
| | | | | | | 657 | |
| | | | | | | | |
| | |
| Financial Services - 26.5% | | | | | | | | |
Bank of America Corp. | | | 10,204 | | | | 98 | |
Bank of New York Mellon Corp. (The) | | | 4,121 | | | | 99 | |
| | | | | | | | |
| | | Principal
Amount ($)
or Shares | | | Market
Value
$ | |
BankUnited, Inc. | | | 2,059 | | | | 51 | |
Berkshire Hathaway, Inc. Class B (Æ) | | | 448 | | | | 36 | |
Citigroup, Inc. | | | 2,707 | | | | 99 | |
CME Group, Inc. Class A | | | 340 | | | | 98 | |
Discover Financial Services | | | 1,223 | | | | 41 | |
Fifth Third Bancorp | | | 2,000 | | | | 28 | |
Goldman Sachs Group, Inc. (The) | | | 791 | | | | 98 | |
JPMorgan Chase & Co. | | | 2,195 | | | | 102 | |
Mastercard, Inc. Class A | | | 233 | | | | 98 | |
Morgan Stanley | | | 2,487 | | | | 49 | |
PNC Financial Services Group, Inc. | | | 1,162 | | | | 75 | |
St. Joe Co. (The) (Æ) | | | 1,235 | | | | 23 | |
State Street Corp. | | | 1,014 | | | | 46 | |
US Bancorp | | | 2,520 | | | | 80 | |
Visa, Inc. Class A | | | 841 | | | | 99 | |
Wells Fargo & Co. | | | 2,946 | | | | 101 | |
| | | | | | | | |
| | | | | | | 1,321 | |
| | | | | | | | |
| | |
| Health Care - 5.4% | | | | | | | | |
Alexion Pharmaceuticals, Inc. (Æ) | | | 488 | | | | 45 | |
Cooper Cos., Inc. (The) | | | 55 | | | | 4 | |
Dendreon Corp. (Æ) | | | 1,270 | | | | 14 | |
HCA Holdings, Inc. | | | 761 | | | | 19 | |
Hospira, Inc. (Æ) | | | 54 | | | | 2 | |
Human Genome Sciences, Inc. (Æ) | | | 1,148 | | | | 9 | |
Regeneron Pharmaceuticals, Inc. (Æ) | | | 843 | | | | 99 | |
Vertex Pharmaceuticals, Inc. (Æ) | | | 1,700 | | | | 70 | |
Watson Pharmaceuticals, Inc. Class B (Æ) | | | 139 | | | | 9 | |
| | | | | | | | |
| | | | | | | 271 | |
| | | | | | | | |
| | |
| Materials and Processing - 7.7% | | | | | | | | |
Allied Nevada Gold Corp. (Æ) | | | 1,299 | | | | 42 | |
CF Industries Holdings, Inc. | | | 161 | | | | 29 | |
Molycorp, Inc. (Æ) | | | 208 | | | | 7 | |
Monsanto Co. | | | 1,149 | | | | 92 | |
Newmont Mining Corp. | | | 1,545 | | | | 79 | |
Polypore International, Inc. (Æ) | | | 189 | | | | 7 | |
Royal Gold, Inc. | | | 1,300 | | | | 85 | |
Southern Copper Corp. | | | 1,391 | | | | 44 | |
| | | | | | | | |
| | | | | | | 385 | |
| | | | | | | | |
| | |
| Producer Durables - 8.3% | | | | | | | | |
3M Co. | | | 527 | | | | 47 | |
Caterpillar, Inc. | | | 275 | | | | 29 | |
Danaher Corp. | | | 607 | | | | 34 | |
Emerson Electric Co. | | | 1,920 | | | | 100 | |
General Electric Co. | | | 4,929 | | | | 99 | |
McDermott International, Inc. (Æ) | | | 314 | | | | 4 | |
Union Pacific Corp. | | | 687 | | | | 74 | |
United Continental Holdings, Inc. (Æ) | | | 1,287 | | | | 28 | |
| | | | | | | | |
| | | | | | | 415 | |
| | | | | | | | |
| | |
| Technology - 17.9% | | | | | | | | |
Apple, Inc. (Æ) | | | 167 | | | | 100 | |
Broadcom Corp. Class A (Æ) | | | 213 | | | | 8 | |
Brocade Communications Systems, Inc. (Æ) | | | 3,806 | | | | 22 | |
| | |
| Russell 1000 High Volatility ETF | | 45 |
Russell Exchange Traded Funds Trust
Russell 1000 High Volatility ETF
Schedule of Investments, continued — March 31, 2012
Amounts in thousands (except share amounts)
| | | | | | | | |
| | | Principal
Amount ($)
or Shares | | | Market
Value
$ | |
| | | | | | | | |
Corning, Inc. | | | 2,565 | | | | 36 | |
Electronic Arts, Inc. (Æ) | | | 1,797 | | | | 30 | |
Fortinet, Inc. (Æ) | | | 1,980 | | | | 55 | |
Google, Inc. Class A (Æ) | | | 110 | | | | 71 | |
Groupon, Inc. Class A (Æ) | | | 1,000 | | | | 18 | |
Hewlett-Packard Co. | | | 1,699 | | | | 40 | |
Intel Corp. | | | 3,497 | | | | 98 | |
International Business Machines Corp. | | | 129 | | | | 27 | |
Marvell Technology Group, Ltd. (Æ) | | | 4,308 | | | | 68 | |
MEMC Electronic Materials, Inc. (Æ) | | | 840 | | | | 3 | |
Microsoft Corp. | | | 3,104 | | | | 100 | |
Nuance Communications, Inc. (Æ) | | | 803 | | | | 21 | |
Oracle Corp. | | | 3,398 | | | | 99 | |
Texas Instruments, Inc. | | | 1,933 | | | | 65 | |
VMware, Inc. Class A (Æ) | | | 30 | | | | 3 | |
Western Digital Corp. (Æ) | | | 743 | | | | 31 | |
| | | | | | | | |
| | | | | | | 895 | |
| | | | | | | | |
| | |
| Utilities - 2.3% | | | | | | | | |
Clearwire Corp. Class A (Æ) | | | 5,150 | | | | 12 | |
GenOn Energy, Inc. (Æ) | | | 11,416 | | | | 24 | |
MetroPCS Communications, Inc. (Æ) | | | 2,371 | | | | 21 | |
NII Holdings, Inc. (Æ) | | | 1,620 | | | | 29 | |
Sprint Nextel Corp. (Æ) | | | 9,657 | | | | 28 | |
| | | | | | | | |
| | | | | | | 114 | |
| | | | | | | | |
| | |
Total Common Stocks
(cost $4,730) | | | | | | | 4,985 | |
| | | | | | | | |
| | |
| Short-Term Investments - 0.1% | | | | | | | | |
Russell U.S. Cash Management Fund | | | 6,132 | (¥) | | | 6 | |
| | | | | | | | |
| | |
Total Short-Term Investments
(cost $6) | | | | | | | 6 | |
| | | | | | | | |
| | |
Total Investments - 99.9%
(identified cost $4,736) | | | | | | | 4,991 | |
| | |
Other Assets and Liabilities,
Net - 0.1% | | | | | | | 3 | |
| | | | | | | | |
| | |
| Net Assets - 100.0% | | | | | | | 4,994 | |
| | | | | | | | |
See accompanying notes which are an integral part of the financial statements.
| | | | |
| | 46 | | | Russell 1000 High Volatility ETF |
Russell Exchange Traded Funds Trust
Russell 1000 High Volatility ETF
Presentation of Portfolio Holdings — March 31, 2012
Amounts in thousands
| | | | | | | | | | | | | | | | | | | | |
| | | Market Value | | | % of Net
Assets | |
| Portfolio Summary | | Level 1 | | | Level 2 | | | Level 3 | | | Total | | |
| | | | | | | | | | | | | | | | | | | | |
Common Stocks | | | | | | | | | | | | | | | | | | | | |
Consumer Discretionary | | $ | 730 | | | $ | — | | | $ | — | | | $ | 730 | | | | 14.6 | |
Consumer Staples | | | 197 | | | | — | | | | — | | | | 197 | | | | 3.9 | |
Energy | | | 657 | | | | — | | | | — | | | | 657 | | | | 13.2 | |
Financial Services | | | 1,321 | | | | — | | | | — | | | | 1,321 | | | | 26.5 | |
Health Care | | | 271 | | | | — | | | | — | | | | 271 | | | | 5.4 | |
Materials and Processing | | | 385 | | | | — | | | | — | | | | 385 | | | | 7.7 | |
Producer Durables | | | 415 | | | | — | | | | — | | | | 415 | | | | 8.3 | |
Technology | | | 895 | | | | — | | | | — | | | | 895 | | | | 17.9 | |
Utilities | | | 114 | | | | — | | | | — | | | | 114 | | | | 2.3 | |
Short-Term Investments | | | — | | | | 6 | | | | — | | | | 6 | | | | 0.1 | |
| | | | | | | | | | | | | | | | | | | | |
| | | | | |
Total Investments | | | 4,985 | | | | 6 | | | | — | | | | 4,991 | | | | 99.9 | |
| | | | | | | | | | | | | | | | | | | | |
Other Assets and Liabilities, Net | | | | | | | | | | | | | | | | | | | 0.1 | |
| | | | | | | | | | | | | | | | | | | | |
| | | | | |
| | | | | | | | | | | | | | | | | | | 100.0 | |
| | | | | | | | | | | | | | | | | | | | |
For a description of the levels see note 2 in the Notes to Financial Statements.
There were no significant transfers in and out of levels 1, 2 and 3 during the period ending March 31, 2012.
See accompanying notes which are an integral part of the financial statements.
| | |
| Russell 1000 High Volatility ETF | | 47 |
Russell Exchange Traded Funds Trust
Russell 1000 High Volatility ETF
Statement of Assets and Liabilities — March 31, 2012
| | | | |
| Amounts in thousands | | Russell 1000
High Volatility
ETF | |
| | | | |
Assets | | | | |
Investments, at identified cost | | $ | 4,736 | |
Investments, at market* | | | 4,991 | |
Receivables: | | | | |
Dividends | | | 4 | |
Investments sold | | | 261 | |
| | | | |
Total assets | | | 5,256 | |
| | | | |
| |
Liabilities | | | | |
Payables: | | | | |
Investments purchased | | | 261 | |
Accrued fees to affiliates | | | 1 | |
| | | | |
Total liabilities | | | 262 | |
| | | | |
| | | | |
Net Assets | | $ | 4,994 | |
| | | | |
Net Assets Consist of: | | | | |
Undistributed (overdistributed) net investment income | | $ | 2 | |
Accumulated net realized gain (loss) | | | (643 | ) |
Unrealized appreciation (depreciation) on investments | | | 255 | |
Additional paid-in capital | | | 5,380 | |
| | | | |
Net Assets | | $ | 4,994 | |
| | | | |
Net Asset Value, offering and redemption price per share: | | | | |
Net asset value per share:(a) | | $ | 49.94 | |
Net assets | | $ | 4,993,877 | |
Shares outstanding ($.001 par value) | | | 100,002 | |
Amounts in thousands | | | | |
| | | | |
* Investments in Affiliates, Russell U.S. Cash Management Fund | | $ | 6 | |
| (a) | Net asset value per share equals net assets divided by shares outstanding. |
See accompanying notes which are an integral part of the financial statements.
| | | | |
| | 48 | | | Statement of Assets and Liabilities |
Russell Exchange Traded Funds Trust
Russell 1000 High Volatility ETF
Statement of Operations — For the Period Ended March 31, 2012
| | | | |
| Amounts in thousands | | Russell 1000
High Volatility
ETF* | |
| | | | |
Investment Income | | | | |
Dividends | | $ | 69 | |
| | | | |
Total investment income | | | 69 | |
| | | | |
| |
Expenses | | | | |
Management fees | | | 25 | |
Trustee and trustee related fees | | | 17 | |
| | | | |
Expenses before reductions | | | 42 | |
Expense reductions | | | (23 | ) |
| | | | |
Net expenses | | | 19 | |
| | | | |
Net investment income (loss) | | | 50 | |
| | | | |
| |
Net Realized and Unrealized Gain (Loss) | | | | |
Net realized gain (loss) on: | | | | |
Investments | | | (654 | ) |
In-kind redemptions | | | (600 | ) |
| | | | |
Net realized gain (loss) | | | (1,254 | ) |
Net change in unrealized appreciation (depreciation) on investments | | | 255 | |
| | | | |
Net realized and unrealized gain (loss) | | | (999 | ) |
| | | | |
Net Increase (Decrease) in Net Assets from Operations | | $ | (949 | ) |
| | | | |
| | | | |
* For the period May 26, 2011 (commencement of operations) to March 31, 2012. | | | | |
See accompanying notes which are an integral part of the financial statements.
| | |
| Statement of Operations | | 49 |
Russell Exchange Traded Funds Trust
Russell 1000 High Volatility ETF
Statement of Changes in Net Assets — For the Periods Ended March 31, 2012
| | | | |
| | | Russell 1000 High
Volatility ETF | |
| Amounts in thousands | | 2012* | |
| | | | |
Increase (Decrease) in Net Assets | | | | |
| |
Operations | | | | |
Net investment income (loss) | | $ | 50 | |
Net realized gain (loss) | | | (1,254 | ) |
Net change in unrealized appreciation (depreciation) | | | 255 | |
| | | | |
Net increase (decrease) in net assets from operations | | | (949 | ) |
| | | | |
| |
Distributions | | | | |
From net investment income | | | (48 | ) |
| | | | |
Net decrease in net assets from distributions | | | (48 | ) |
| | | | |
| |
Share Transactions | | | | |
Net increase (decrease) in net assets from share transactions | | | 5,991 | |
| | | | |
Total Net Increase (Decrease) in Net Assets | | | 4,994 | |
| |
Net Assets | | | | |
Beginning of period | | | — | |
| | | | |
End of period | | $ | 4,994 | |
| | | | |
Undistributed (overdistributed) net investment income included in net assets | | $ | 2 | |
| * | For the period May 26, 2011 (commencement of operations) to March 31, 2012. |
See accompanying notes which are an integral part of the financial statements.
| | | | |
| | 50 | | | Statement of Changes in Net Assets |
(This page intentionally left blank)
Russell Exchange Traded Funds Trust
Russell 1000 High Volatility ETF
Financial Highlights — For the Period Ended
For a Share Outstanding Throughout Each Period.
| | | | | | | | | | | | | | | | | | | | | | | | |
| | | | | | |
| | | $
Net Asset Value,
Beginning of
Period | | | $
Net Investment
Income (Loss)(a)(e) | | | $
Net Realized
and Unrealized
Gain (Loss) | | | $
Total from
Investment
Operations | | | $
Distributions
from Net
Investment Income | | | $
Total
Distributions | |
Russell 1000 High Volatility ETF | | | | | | | | | | | | | | | | | |
March 31, 2012* | | | 49.82 | | | | .39 | | | | .21 | | | | .60 | | | | (.48 | ) | | | (.48 | ) |
| (a) | Average daily shares outstanding were used for this calculation. |
| (b) | Periods less than one year are not annualized. |
| (c) | The ratios for periods less than one year are annualized. |
| (d) | Portfolio turnover rate excludes securities received or delivered from in-kind creation or redemption units. |
| (e) | Reflects amounts waived by Russell Investment Management Company (“RIMCo”). |
| * | For the period May 26, 2011 (commencement of operations) to March 31, 2012. |
See accompanying notes which are an integral part of the financial statements.
| | | | | | | | | | | | | | | | | | | | | | | | | | |
$
Net Asset Value,
End of
Period | | | %
Total
Return(b) | | | $
Net Assets,
End of Period
(000) | | | %
Ratio of Expenses
to Average
Net Assets,
Gross(c) | | | %
Ratio of Expenses
to Average
Net Assets,
Net(c)(e) | | | %
Ratio of Net
Investment Income
to Average
Net Assets(c)(e) | | | %
Portfolio
Turnover Rate(b)(d) | |
| | | | | | | | | | | | | | | | | | | | | | | | | | |
| | 49.94 | | | | 1.32 | | | | 4,994 | | | | .83 | | | | .38 | | | | 1.00 | | | | 102 | |
See accompanying notes which are an integral part of the financial statements.
Russell Exchange Traded Funds Trust
Russell 1000 High Momentum ETF
Portfolio Management Discussion and Analysis — March 31, 2012 (Unaudited)
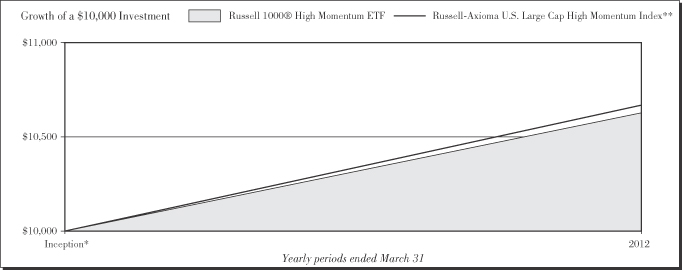
Performance as of March 31, 2012
| | | | | | | | | | | | |
|
| Average Annual Total Return | |
| | | Net Asset
Value | | | Market Value | | | Russell-Axioma
U.S. Large Cap
High Momentum
Index** | |
Inception* | | | 6.23 | % | | | 6.21 | % | | | 6.64 | % |
| | | | |
| | 54 | | | Russell 1000 High Momentum ETF |
Russell Exchange Traded Funds Trust
Russell 1000® High Momentum ETF
Portfolio Management Discussion and Analysis — March 31, 2012 (Unaudited)
The Russell 1000® High Momentum ETF (the “Fund”) is an index-based exchange-traded fund that seeks investment results that closely correspond to the total return of the Russell-Axioma U.S. Large Cap High Momentum Index (the “Index”). Russell Investment Management Company (“RIMCo”), as the Fund’s advisor, uses a “passive” or indexing approach to try to achieve the Fund’s investment objective. Unlike many investment companies, the Fund does not try to “beat” the Index it tracks and does not seek temporary defensive positions when markets decline or appear overvalued. The Fund seeks to gain exposure to the factor exhibited in its Index. The Fund will normally invest at least 80% of its total assets in securities that comprise the Index.
What is the Fund’s investment objective?
The Fund seeks investment results that closely correspond to the total return of the Russell-Axioma U.S. Large Cap High Momentum Index, which is designed to deliver exposure to stocks with high medium-term momentum as determined by a screening and ranking methodology applied to the output of the Axioma U.S. Equity Medium Horizon Fundamental Factor Risk model.
Is the Fund replicating or sampling?
The Fund is replicating.
How did the Fund perform relative to its benchmark for the fiscal year ended March 31, 2012?
For the fiscal year ended March 31, 2012, the Fund gained 6.23%. This is compared to the Fund’s benchmark, the Russell-Axioma U.S. Large Cap High Momentum Index, which gained 6.64% during the same period. The Fund’s performance includes operating expenses, whereas indexes are unmanaged and index returns do not include expenses of any kind.
There were no significant changes to either the Fund or Index during the reporting period.
Did the Fund outperform or underperform the benchmark or was performance as expected based on expenses, etc.?
The Fund performed as expected against the benchmark.
Over the reporting period, please describe those sectors that outperformed or underperformed.
Sectors achieved both positive and negative returns for the Fund and the Index. Consumer staples was the best performing sector for the Fund and the Index, while energy was the worst performing sector. Health care, with an average weight of 9.1% was the best contributor to Fund and Index returns. Producer durables, with an average weight of 11.3%, was the worst contributor to Fund and Index returns.
Over the reporting period, please describe those individual securities (constituents) that outperformed or underperformed.
Apple Inc, Philip Morris International Inc, and Intel Corp generated positive returns and contributed the most to Fund performance while Netflix Inc, Patterson-UTI Energy Inc, and HollyFrontier Corp, all declined which detracted from Fund performance.
The views expressed in this report reflect those of the portfolio managers only through the end of the period covered by the report. These views do not necessarily represent the views of RIMCo, or any other person in RIMCo or any other affiliated organization. These views are subject to change at any time based upon market conditions or other events, and RIMCo disclaims any responsibility to update the views contained herein. These views should not be relied on as investment advice and, because investment decisions for a Russell Exchange Traded Funds Trust (“RET”) Fund are based on numerous factors, should not be relied on as an indication of investment decisions of any RET Fund.
| * | | Commenced operations by issuing shares May 26, 2011. |
| ** | | The Russell-Axioma U.S. Large Cap High Momentum Index is designed to deliver exposure to stocks with high medium-term momentum as determined by a screening and ranking methodology applied to the output of the Axioma U.S. Equity Medium Horizon Fundamental Factor Risk model. Medium-term momentum is a measure of a stock’s past price performance as measured by cumulative return over the last 250 trading days, excluding the last 20 trading days. Stocks exhibiting high momentum can be used by investors to adjust momentum exposure in a portfolio. |
Performance is historical and assumes reinvestment of all dividends and capital gains. Investment return and principal value will fluctuate so that an investor’s shares, when redeemed, may be worth more or less than when purchased. Past performance is not indicative of future results. The returns shown do not reflect the deduction of taxes that a shareholder would pay on Fund distributions or the redemption of Fund shares.
| | |
| Russell 1000® High Momentum ETF | | 55 |
Russell Exchange Traded Funds Trust
Russell 1000 High Momentum ETF
Shareholder Expense Example — March 31, 2012 (Unaudited)
Fund Expenses
The following disclosure provides important information regarding each Fund’s Expense Example, which appears on each Fund’s individual page in this Annual Report. Please refer to this information when reviewing the Expense Example for a Fund.
Example
As a shareholder of the Fund, you incur two types of costs: (1) transaction costs, including brokerage commissions on purchases and sales of your Fund shares and (2) ongoing costs, including management fees and other Fund expenses. The Example is intended to help you understand your ongoing costs (in dollars) of investing in the Fund and to compare these costs with the ongoing costs of investing in other funds. The Example is based on an investment of $1,000 invested at the beginning of the period and held for the entire period indicated, which for this Fund is from October 1, 2011 to March 31, 2012.
Actual Expenses
The information in the table under the heading “Actual Performance” provides information about actual account values and actual expenses. You may use the information in this column, together with the amount you invested, to estimate the expenses that you paid over the period. Simply divide your account value by $1,000 (for example, an $8,600 account value divided by $1,000 = 8.6), then multiply the result by the number in the first column in the row entitled “Expenses Paid During Period” to estimate the expenses you paid on your account during this period.
Hypothetical Example for Comparison Purposes
The information in the table under the heading “Hypothetical Performance (5% return before expenses)” provides information about hypothetical account values and hypothetical expenses based on the Fund’s actual expense ratio and an assumed rate of return of 5% per year before expenses, which is not the Fund’s actual return. The hypothetical account values and expenses may not be used to estimate the actual ending account balance or expenses you paid for the period. You may use this information to compare the ongoing costs of investing in the Fund and other funds. To do so, compare this 5% hypothetical example with the 5% hypothetical examples that appear in the shareholder reports of other funds.
Please note that the expenses shown in the table are meant to highlight your ongoing costs only and do not reflect any transactional costs, such as brokerage commissions paid on purchases and sales of Fund shares. Therefore, the information under the heading “Hypothetical Performance (5% return before expenses)” is useful in comparing ongoing costs only, and will not help you determine the relative total costs of owning different funds. In addition, if these transactional costs were included, your costs would have been higher.
| | | | | | | | |
| | | Actual
Performance | | | Hypothetical
Performance
(5% return
before expenses) | |
| | | | | | | | |
Beginning Account Value October 1, 2011 | | $ | 1,000.00 | | | $ | 1,000.00 | |
Ending Account Value March 31, 2012 | | $ | 1,290.90 | | | $ | 1,023.60 | |
Expenses Paid During Period* | | $ | 1.60 | | | $ | 1.42 | |
| * | Expenses are equal to the Fund’s annualized expense ratio of 0.28% (representing the six month period annualized), multiplied by the average account value over the period, multiplied by 183/366 (to reflect the one-half year period). Effective November 3, 2011, the annualized expense ratio is 0.20%, as contractually agreed to by the adviser. May reflect amounts waived and/or reimbursed. Without any waivers and/or reimbursements, expenses would have been higher. |
| | | | |
| | 56 | | | Russell 1000 High Momentum ETF |
Russell Exchange Traded Funds Trust
Russell 1000 High Momentum ETF
Schedule of Investments — March 31, 2012
Amounts in thousands (except share amounts)
| | | | | | | | |
| | | Principal
Amount ($)
or Shares | | | Market
Value
$ | |
| | | | | | | | |
| Common Stocks - 99.7% | | | | | | | | |
| Consumer Discretionary - 25.8% | | | | | | | | |
AutoZone, Inc. (Æ) | | | 57 | | | | 21 | |
CBS Corp. Class B | | | 1,878 | | | | 64 | |
Chipotle Mexican Grill, Inc. Class A (Æ) | | | 106 | | | | 44 | |
Clear Channel Outdoor Holdings, Inc. Class A (Æ) | | | 715 | | | | 6 | |
Coach, Inc. | | | 291 | | | | 22 | |
Comcast Corp. Class A | | | 2,058 | | | | 62 | |
Costco Wholesale Corp. | | | 252 | | | | 23 | |
Dollar Tree, Inc. (Æ) | | | 493 | | | | 47 | |
Estee Lauder Cos., Inc. (The) Class A | | | 257 | | | | 16 | |
Expedia, Inc. | | | 267 | | | | 9 | |
Foot Locker, Inc. | | | 58 | | | | 2 | |
Fossil, Inc. (Æ) | | | 123 | | | | 16 | |
GateHouse Media, Inc. A (Æ) | | | 138 | | | | 7 | |
Home Depot, Inc. | | | 480 | | | | 24 | |
Hyatt Hotels Corp. Class A (Æ) | | | 554 | | | | 24 | |
Interpublic Group of Cos., Inc. (The) | | | 835 | | | | 10 | |
Liberty Media Corp. - Interactive (Æ) | | | 915 | | | | 17 | |
Liberty Media Corp. - Liberty Capital Class A (Æ) | | | 719 | | | | 63 | |
Limited Brands, Inc. | | | 1,369 | | | | 66 | |
LKQ Corp. (Æ) | | | 2,932 | | | | 91 | |
Lowe’s Cos., Inc. | | | 6 | | | | — | ± |
Macy’s, Inc. | | | 1,739 | | | | 69 | |
McDonald’s Corp. | | | 934 | | | | 91 | |
News Corp. Class A | | | 3,356 | | | | 66 | |
O’Reilly Automotive, Inc. (Æ) | | | 113 | | | | 10 | |
priceline.com, Inc. (Æ) | | | 110 | | | | 79 | |
PVH Corp. | | | 114 | | | | 10 | |
Ralph Lauren Corp. Class A | | | 284 | | | | 50 | |
Sally Beauty Holdings, Inc. (Æ) | | | 469 | | | | 12 | |
Sirius XM Radio, Inc. (Æ) | | | 5,346 | | | | 12 | |
Starbucks Corp. | | | 1,394 | | | | 78 | |
TJX Cos., Inc. | | | 1,250 | | | | 50 | |
Tractor Supply Co. | | | 181 | | | | 16 | |
Ulta Salon Cosmetics & Fragrance, Inc. | | | 29 | | | | 3 | |
VF Corp. | | | 339 | | | | 49 | |
Viacom, Inc. Class B | | | 377 | | | | 18 | |
Walt Disney Co. (The) | | | 1,140 | | | | 50 | |
Wyndham Worldwide Corp. | | | 374 | | | | 17 | |
Yum! Brands, Inc. | | | 374 | | | | 27 | |
| | | | | | | | |
| | | | | | | 1,341 | |
| | | | | | | | |
| | |
| Consumer Staples - 13.0% | | | | | | | | |
Altria Group, Inc. | | | 3,152 | | | | 97 | |
Archer-Daniels-Midland Co. | | | 467 | | | | 15 | |
Corn Products International, Inc. | | | 550 | | | | 32 | |
CVS Caremark Corp. | | | 1,105 | | | | 50 | |
Herbalife, Ltd. | | | 1,029 | | | | 71 | |
Kraft Foods, Inc. Class A | | | 771 | | | | 29 | |
Lorillard, Inc. | | | 602 | | | | 78 | |
Monster Beverage Corp. (Æ) | | | 1,114 | | | | 69 | |
Philip Morris International, Inc. | | | 1,185 | | | | 105 | |
Procter & Gamble Co. (The) | | | 542 | | | | 36 | |
Ralcorp Holdings, Inc. (Æ) | | | 53 | | | | 4 | |
| | | | | | | | |
| | | Principal
Amount ($)
or Shares | | | Market
Value
$ | |
Reynolds American, Inc. | | | 2,215 | | | | 92 | |
| | | | | | | | |
| | | | | | | 678 | |
| | | | | | | | |
| | |
| Energy - 3.1% | | | | | | | | |
Anadarko Petroleum Corp. | | | 101 | | | | 8 | |
Cabot Oil & Gas Corp. | | | 780 | | | | 24 | |
Chevron Corp. | | | 436 | | | | 48 | |
El Paso Corp. | | | 430 | | | | 13 | |
Marathon Oil Corp. | | | 954 | | | | 30 | |
Occidental Petroleum Corp. | | | 236 | | | | 22 | |
SM Energy Co. | | | 88 | | | | 6 | |
Tesoro Corp. (Æ) | | | 121 | | | | 3 | |
Williams Cos., Inc. (The) | | | 324 | | | | 10 | |
| | | | | | | | |
| | | | | | | 164 | |
| | | | | | | | |
| | |
| Financial Services - 11.4% | | | | | | | | |
Alliance Data Systems Corp. (Æ) | | | 232 | | | | 29 | |
American Express Co. | | | 441 | | | | 26 | |
Arch Capital Group, Ltd. (Æ) | | | 1,437 | | | | 54 | |
Berkshire Hathaway, Inc. Class B (Æ) | | | 48 | | | | 4 | |
Capital One Financial Corp. | | | 59 | | | | 3 | |
Discover Financial Services | | | 268 | | | | 9 | |
Duke Realty Corp. (ö) | | | 1,238 | | | | 18 | |
Equity Residential (ö) | | | 195 | | | | 12 | |
Franklin Resources, Inc. | | | 143 | | | | 18 | |
General Growth Properties, Inc. (ö) | | | 1,342 | | | | 23 | |
Genworth Financial, Inc. Class A (Æ) | | | 469 | | | | 4 | |
Health Care REIT, Inc. (ö) | | | 171 | | | | 9 | |
JPMorgan Chase & Co. | | | 198 | | | | 9 | |
Kimco Realty Corp. (ö) | | | 214 | | | | 4 | |
Lincoln National Corp. | | | 290 | | | | 8 | |
Mastercard, Inc. Class A | | | 217 | | | | 91 | |
Morgan Stanley | | | 221 | | | | 4 | |
ProLogis, Inc. (ö) | | | 395 | | | | 14 | |
Prudential Financial, Inc. | | | 136 | | | | 9 | |
Public Storage (ö) | | | 80 | | | | 11 | |
Simon Property Group, Inc. (ö) | | | 256 | | | | 37 | |
SL Green Realty Corp. (ö) | | | 445 | | | | 35 | |
Taubman Centers, Inc. (ö) | | | 325 | | | | 24 | |
Travelers Cos., Inc. (The) | | | 754 | | | | 45 | |
UDR, Inc. (ö) | | | 378 | | | | 10 | |
US Bancorp | | | 752 | | | | 24 | |
Ventas, Inc. (ö) | | | 216 | | | | 12 | |
Visa, Inc. Class A | | | 231 | | | | 27 | |
Wells Fargo & Co. | | | 364 | | | | 12 | |
XL Group PLC Class A | | | 482 | | | | 10 | |
| | | | | | | | |
| | | | | | | 595 | |
| | | | | | | | |
| | |
| Health Care - 18.2% | | | | | | | | |
Abbott Laboratories | | | 1,151 | | | | 71 | |
Aetna, Inc. | | | 166 | | | | 8 | |
Alexion Pharmaceuticals, Inc. (Æ) | | | 562 | | | | 52 | |
Allergan, Inc. | | | 688 | | | | 66 | |
AMERIGROUP Corp. Class A (Æ) | | | 384 | | | | 26 | |
Biogen Idec, Inc. (Æ) | | | 468 | | | | 59 | |
Bristol-Myers Squibb Co. | | | 2,230 | | | | 75 | |
Cerner Corp. (Æ) | | | 87 | | | | 7 | |
| | |
| Russell 1000 High Momentum ETF | | 57 |
Russell Exchange Traded Funds Trust
Russell 1000 High Momentum ETF
Schedule of Investments, continued — March 31, 2012
Amounts in thousands (except share amounts)
| | | | | | | | |
| | | Principal
Amount ($)
or Shares | | | Market
Value
$ | |
| | | | | | | | |
Cooper Cos., Inc. (The) | | | 79 | | | | 6 | |
Covidien PLC | | | 15 | | | | 1 | |
Dentsply International, Inc. | | | 716 | | | | 29 | |
Eli Lilly & Co. | | | 237 | | | | 10 | |
Hill-Rom Holdings, Inc. | | | 54 | | | | 2 | |
Humana, Inc. | | | 256 | | | | 24 | |
Intuitive Surgical, Inc. (Æ) | | | 73 | | | | 40 | |
Johnson & Johnson | | | 1,483 | | | | 97 | |
Merck & Co., Inc. | | | 2,509 | | | | 95 | |
Omnicare, Inc. | | | 735 | | | | 26 | |
Perrigo Co. | | | 92 | | | | 10 | |
Pfizer, Inc. | | | 3,955 | | | | 90 | |
Regeneron Pharmaceuticals, Inc. (Æ) | | | 287 | | | | 33 | |
SXC Health Solutions Corp. (Æ) | | | 211 | | | | 16 | |
UnitedHealth Group, Inc. | | | 1,750 | | | | 102 | |
WellPoint, Inc. | | | 63 | | | | 5 | |
| | | | | | | | |
| | | | | | | 950 | |
| | | | | | | | |
| | |
| Materials and Processing - 2.6% | | | | | | | | |
Air Products & Chemicals, Inc. | | | 13 | | | | 1 | |
Airgas, Inc. | | | 44 | | | | 4 | |
Brown-Forman Corp. Class B - ADR | | | 259 | | | | 22 | |
Celanese Corp. Class A | | | 540 | | | | 25 | |
Fastenal Co. | | | 380 | | | | 21 | |
LyondellBasell Industries NV Class A | | | 299 | | | | 13 | |
Praxair, Inc. | | | 181 | | | | 21 | |
WR Grace & Co. (Æ) | | | 478 | | | | 27 | |
| | | | | | | | |
| | | | | | | 134 | |
| | | | | | | | |
| | |
| Producer Durables - 3.9% | | | | | | | | |
Accenture PLC Class A | | | 462 | | | | 30 | |
Agilent Technologies, Inc. | | | 191 | | | | 9 | |
Automatic Data Processing, Inc. | | | 651 | | | | 35 | |
Caterpillar, Inc. | | | 304 | | | | 32 | |
Copa Holdings SA Class A | | | 65 | | | | 5 | |
Goodrich Corp. | | | 92 | | | | 12 | |
Kansas City Southern (Æ) | | | 303 | | | | 22 | |
Kirby Corp. (Æ) | | | 59 | | | | 4 | |
Northrop Grumman Corp. | | | 389 | | | | 24 | |
Trimble Navigation, Ltd. (Æ) | | | 93 | | | | 5 | |
WW Grainger, Inc. | | | 132 | | | | 28 | |
| | | | | | | | |
| | | | | | | 206 | |
| | | | | | | | |
| | |
| Technology - 14.8% | | | | | | | | |
Altera Corp. | | | 59 | | | | 2 | |
Apple, Inc. (Æ) | | | 172 | | | | 103 | |
Cisco Systems, Inc. | | | 1,343 | | | | 28 | |
Dell, Inc. (Æ) | | | 2,159 | | | | 36 | |
EchoStar Corp. Class A (Æ) | | | 981 | | | | 28 | |
EMC Corp. (Æ) | | | 845 | | | | 25 | |
Equinix, Inc. (Æ) | | | 523 | | | | 82 | |
F5 Networks, Inc. (Æ) | | | 23 | | | | 3 | |
IAC/InterActiveCorp | | | 344 | | | | 17 | |
Intel Corp. | | | 3,705 | | | | 105 | |
| | | | | | | | |
| | | Principal
Amount ($)
or Shares | | | Market
Value
$ | |
International Business Machines Corp. | | | 503 | | | | 106 | |
Intuit, Inc. | | | 329 | | | | 20 | |
Microsoft Corp. | | | 3,205 | | | | 103 | |
Motorola Solutions, Inc. | | | 48 | | | | 2 | |
NCR Corp. (Æ) | | | 696 | | | | 15 | |
Nuance Communications, Inc. (Æ) | | | 281 | | | | 7 | |
QUALCOMM, Inc. | | | 794 | | | | 54 | |
Rackspace Hosting, Inc. (Æ) | | | 323 | | | | 19 | |
Symantec Corp. (Æ) | | | 154 | | | | 3 | |
Teradyne, Inc. (Æ) | | | 137 | | | | 2 | |
VeriSign, Inc. | | | 56 | | | | 2 | |
Xilinx, Inc. | | | 239 | | | | 9 | |
| | | | | | | | |
| | | | | | | 771 | |
| | | | | | | | |
| | |
| Utilities - 6.9% | | | | | | | | |
AES Corp. (The) (Æ) | | | 1,537 | | | | 20 | |
AT&T, Inc. | | | 2,171 | | | | 68 | |
Consolidated Edison, Inc. | | | 676 | | | | 39 | |
Duke Energy Corp. | | | 3,660 | | | | 77 | |
MDU Resources Group, Inc. | | | 348 | | | | 8 | |
MetroPCS Communications, Inc. (Æ) | | | 172 | | | | 2 | |
ONEOK, Inc. | | | 105 | | | | 9 | |
Sempra Energy | | | 155 | | | | 9 | |
Southern Co. | | | 1,972 | | | | 88 | |
Verizon Communications, Inc. | | | 1,102 | | | | 42 | |
| | | | | | | | |
| | | | | | | 362 | |
| | | | | | | | |
| | |
Total Common Stocks
(cost $4,632) | | | | | | | 5,201 | |
| | | | | | | | |
| | |
| Short-Term Investments - 0.1% | | | | | | | | |
Russell U.S. Cash Management Fund | | | 3,946 | (¥) | | | 4 | |
| | | | | | | | |
| | |
Total Short-Term Investments
(cost $4) | | | | | | | 4 | |
| | | | | | | | |
| | |
Total Investments - 99.8%
(identified cost $4,636) | | | | | | | 5,205 | |
| | |
Other Assets and Liabilities,
Net - 0.2% | | | | | | | 12 | |
| | | | | | | | |
| | |
| Net Assets - 100.0% | | | | | | | 5,217 | |
| | | | | | | | |
See accompanying notes which are an integral part of the financial statements.
| | | | |
| | 58 | | | Russell 1000 High Momentum ETF |
Russell Exchange Traded Funds Trust
Russell 1000 High Momentum ETF
Presentation of Portfolio Holdings — March 31, 2012
Amounts in thousands
| | | | | | | | | | | | | | | | | | | | |
| | | Market Value | | | % of Net
Assets | |
| Portfolio Summary | | Level 1 | | | Level 2 | | | Level 3 | | | Total | | |
| | | | | | | | | | | | | | | | | | | | |
Common Stocks | | | | | | | | | | | | | | | | | | | | |
Consumer Discretionary | | $ | 1,341 | | | $ | — | | | $ | — | | | | 1,341 | | | | 25.8 | |
Consumer Staples | | | 678 | | | | — | | | | — | | | | 678 | | | | 13.0 | |
Energy | | | 164 | | | | — | | | | — | | | | 164 | | | | 3.1 | |
Financial Services | | | 595 | | | | — | | | | — | | | | 595 | | | | 11.4 | |
Health Care | | | 950 | | | | — | | | | — | | | | 950 | | | | 18.2 | |
Materials and Processing | | | 134 | | | | — | | | | — | | | | 134 | | | | 2.6 | |
Producer Durables | | | 206 | | | | — | | | | — | | | | 206 | | | | 3.9 | |
Technology | | | 771 | | | | — | | | | — | | | | 771 | | | | 14.8 | |
Utilities | | | 362 | | | | — | | | | — | | | | 362 | | | | 6.9 | |
Short-Term Investments | | | — | | | | 4 | | | | — | | | | 4 | | | | 0.1 | |
| | | | | | | | | | | | | | | | | | | | |
| | | | | |
Total Investments | | | 5,201 | | | | 4 | | | | — | | | | 5,205 | | | | 99.8 | |
| | | | | | | | | | | | | | | | | | | | |
Other Assets and Liabilities, Net | | | | | | | | | | | | | | | | | | | 0.2 | |
| | | | | | | | | | | | | | | | | | | | |
| | | | | |
| | | | | | | | | | | | | | | | | | | 100.0 | |
| | | | | | | | | | | | | | | | | | | | |
For a description of the levels see note 2 in the Notes to Financial Statements.
There were no significant transfers in and out of levels 1, 2 and 3 during the period ending March 31, 2012.
See accompanying notes which are an integral part of the financial statements.
| | |
| Russell 1000 High Momentum ETF | | 59 |
Russell Exchange Traded Funds Trust
Russell 1000 High Momentum ETF
Statement of Assets and Liabilities — March 31, 2012
| | | | |
| Amounts in thousands | | Russell 1000
High Momentum
ETF | |
| | | | |
Assets | | | | |
Investments, at identified cost | | $ | 4,636 | |
Investments, at market* | | | 5,205 | |
Receivables: | | | | |
Dividends | | | 7 | |
Investments sold | | | 305 | |
| | | | |
Total assets | | | 5,517 | |
| | | | |
| |
Liabilities | | | | |
Payables: | | | | |
Investments purchased | | | 299 | |
Accrued fees to affiliates | | | 1 | |
| | | | |
Total liabilities | | | 300 | |
| | | | |
| | | | |
Net Assets | | $ | 5,217 | |
| | | | |
Net Assets Consist of: | | | | |
Undistributed (overdistributed) net investment income | | $ | 1 | |
Accumulated net realized gain (loss) | | | (680 | ) |
Unrealized appreciation (depreciation) on investments | | | 569 | |
Additional paid-in capital | | | 5,327 | |
| | | | |
Net Assets | | $ | 5,217 | |
| | | | |
Net Asset Value, offering and redemption price per share: | | | | |
Net asset value per share:(a) | | $ | 52.17 | |
Net assets | | $ | 5,217,484 | |
Shares outstanding ($.001 par value) | | | 100,002 | |
Amounts in thousands | | | | |
| | | | |
* Investments in Affiliates, Russell U.S. Cash Management Fund | | $ | 4 | |
| (a) | Net asset value per share equals net assets divided by shares outstanding. |
See accompanying notes which are an integral part of the financial statements.
| | | | |
| | 60 | | | Statement of Assets and Liabilities |
Russell Exchange Traded Funds Trust
Russell 1000 High Momentum ETF
Statement of Operations — For the Period Ended March 31, 2012
| | | | |
| Amounts in thousands | | Russell 1000
High Momentum
ETF* | |
| | | | |
Investment Income | | | | |
Dividends | | $ | 121 | |
| | | | |
Total investment income | | | 121 | |
| | | | |
| |
Expenses | | | | |
Management fees | | | 30 | |
Trustee and trustee related fees | | | 20 | |
| | | | |
Expenses before reductions | | | 50 | |
Expense reductions | | | (26 | ) |
| | | | |
Net expenses | | | 24 | |
| | | | |
Net investment income (loss) | | | 97 | |
| | | | |
| |
Net Realized and Unrealized Gain (Loss) | | | | |
Net realized gain (loss) on: | | | | |
Investments | | | (702 | ) |
In-kind redemptions | | | 18 | |
| | | | |
Net realized gain (loss) | | | (684 | ) |
| | | | |
Net change in unrealized appreciation (depreciation) on investments | | | 569 | |
| | | | |
Net realized and unrealized gain (loss) | | | (115 | ) |
| | | | |
Net Increase (Decrease) in Net Assets from Operations | | $ | (18 | ) |
| | | | |
| * | For the period May 26, 2011 (commencement of operations) to March 31, 2012. |
See accompanying notes which are an integral part of the financial statements.
| | |
| Statement of Operations | | 61 |
Russell Exchange Traded Funds Trust
Russell 1000 High Momentum ETF
Statement of Changes in Net Assets — For the Period Ended March 31,
| | | | |
| | | Russell 1000
High Momentum
ETF | |
| Amounts in thousands | | 2012* | |
| | | | |
Increase (Decrease) in Net Assets | | | | |
| |
Operations | | | | |
Net investment income (loss) | | $ | 97 | |
Net realized gain (loss) | | | (684 | ) |
Net change in unrealized appreciation (depreciation) | | | 569 | |
| | | | |
Net increase (decrease) in net assets from operations | | | (18 | ) |
| | | | |
| |
Distributions | | | | |
From net investment income | | | (95 | ) |
| | | | |
Net decrease in net assets from distributions | | | (95 | ) |
| | | | |
| |
Share Transactions | | | | |
Net increase (decrease) in net assets from share transactions | | | 5,330 | |
| | | | |
Total Net Increase (Decrease) in Net Assets | | | 5,217 | |
| |
Net Assets | | | | |
Beginning of period | | | — | |
| | | | |
End of period | | $ | 5,217 | |
| | | | |
Undistributed (overdistributed) net investment income included in net assets | | $ | 1 | |
| * | For the period May 26, 2011 (commencement of operations) to March 31, 2012. |
See accompanying notes which are an integral part of the financial statements.
| | | | |
| | 62 | | | Statement of Changes in Net Assets |
(This page intentionally left blank)
Russell Exchange Traded Funds Trust
Russell 1000 High Momentum ETF
Financial Highlights — For the Period Ended
For a Share Outstanding Throughout Each Period.
| | | | | | | | | | | | | | | | | | | | | | | | |
| | |
$
Net Asset Value,
Beginning of
Period | | | $
Net
Investment
Income (Loss)(a)(e) | | | $
Net Realized
and Unrealized
Gain (Loss) | | | $
Total from
Investment
Operations | | | $
Distributions
from Net
Investment Income | | | $
Total
Distributions | |
Russell 1000 High Momentum ETF | | | | | | | | | | | | | | | | | |
March 31, 2012* | | | 49.89 | | | | .65 | | | | 2.38 | | | | 3.03 | | | | (.75 | ) | | | (.75 | ) |
| (a) | Average daily shares outstanding were used for this calculation. |
| (b) | Periods less than one year are not annualized. |
| (c) | The ratios for periods less than one year are annualized. |
| (d) | Portfolio turnover rate excludes securities received or delivered from in-kind creation or redemption units. |
| (e) | Reflects amounts waived by Russell Investment Management Company (“RIMCo”). |
| * | For the period May 26, 2011 (commencement of operations) to March 31, 2012. |
See accompanying notes which are an integral part of the financial statements.
| | | | | | | | | | | | | | | | | | | | | | | | | | |
$
Net Asset Value,
End of
Period | | | %
Total
Return(b) | | | $
Net Assets,
End of Period
(000) | | | %
Ratio of Expenses
to Average
Net Assets,
Gross(c) | | | %
Ratio of Expenses
to Average
Net Assets,
Net(c)(e) | | | %
Ratio of Net
Investment Income
to Average
Net Assets(c)(e) | | | %
Portfolio
Turnover Rate(b)(d) | |
| | | | | | | | | | | | | | | | | | | | | | | | | | |
| | 52.17 | | | | 6.23 | | | | 5,217 | | | | .82 | | | | .39 | | | | 1.61 | | | | 93 | |
See accompanying notes which are an integral part of the financial statements.
Russell Exchange Traded Funds Trust
Russell 2000 Low Beta ETF
Portfolio Management Discussion and Analysis — March 31, 2012 (Unaudited)
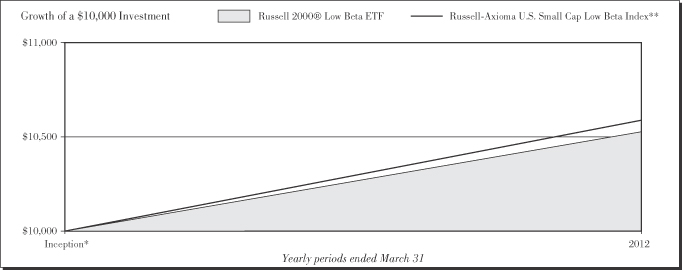
Performance as of March 31, 2012
| | | | | | | | | | | | |
|
| Average Annual Total Return | |
| | | Net Asset
Value | | | Market Value | | | Russell-Axioma
U.S. Small Cap
Low Beta Index** | |
Inception* | | | 5.24 | % | | | 5.29 | % | | | 5.84 | % |
| | | | |
| | 66 | | | Russell 2000 Low Beta ETF |
Russell Exchange Traded Funds Trust
Russell 2000® Low Beta ETF
Portfolio Management Discussion and Analysis — March 31, 2012 (Unaudited)
The Russell 2000® Low Beta ETF (the “Fund”) is an index-based exchange-traded fund that seeks investment results that closely correspond to the total return of the Russell-Axioma U.S. Small Cap Low Beta Index (the “Index”). Russell Investment Management Company (“RIMCo”), as the Fund’s advisor, uses a “passive” or indexing approach to try to achieve the Fund’s investment objective. Unlike many investment companies, the Fund does not try to “beat” the Index it tracks and does not seek temporary defensive positions when markets decline or appear overvalued. The Fund seeks to gain exposure to the factor exhibited in its Index. The Fund will normally invest at least 80% of its total assets in securities that comprise the Index.
What is the Fund’s investment objective?
The Fund seeks investment results that closely correspond to the total return of the Russell-Axioma U.S. Small Cap Low Beta Index, which is designed to deliver exposure to stocks that are predicted to have a low beta as determined by a screening and ranking methodology applied to the output of the Axioma U.S. Equity Medium Horizon Fundamental Factor Risk model.
Is the Fund replicating or sampling?
The Fund is replicating.
How did the Fund perform relative to its benchmark for the fiscal year ended March 31, 2012?
For the fiscal year ended March 31, 2012, the Fund gained 5.24%. This is compared to the Fund’s benchmark, the Russell-Axioma U.S. Small Cap Low Beta Index, which gained 5.84% during the same period. The Fund’s performance includes operating expenses, whereas indexes are unmanaged and index returns do not include expenses of any kind.
There were no significant changes to either the Fund or Index during the reporting period.
Did the Fund outperform or underperform the benchmark or was performance as expected based on expenses, etc.?
The Fund performed as expected against the benchmark.
Over the reporting period, please describe those sectors that outperformed or underperformed.
Sectors achieved both positive and negative returns for the Fund and the Index. Materials & processing was the best performing sector for the Fund and the Index, while energy was the worst performing sector. Financial services, with an average weight of 22.9% was the best contributor to Fund and Index returns. Energy, with an average weight of 1.0%, was the worst contributor to Fund and Index returns.
Over the reporting period, please describe those individual securities (constituents) that outperformed or underperformed.
Inhibitex Inc, Nu Skin Enterprises Inc Cl A, and Questcor Pharmaceuticals Inc generated positive returns and contributed the most to Fund performance while Zoll Medical Corp, Anthera Pharmaceuticals Inc, and Imperial Sugar Co, all declined which detracted from Fund performance.
The views expressed in this report reflect those of the portfolio managers only through the end of the period covered by the report. These views do not necessarily represent the views of RIMCo, or any other person in RIMCo or any other affiliated organization. These views are subject to change at any time based upon market conditions or other events, and RIMCo disclaims any responsibility to update the views contained herein. These views should not be relied on as investment advice and, because investment decisions for a Russell Exchange Traded Funds Trust (“RET”) Fund are based on numerous factors, should not be relied on as an indication of investment decisions of any RET Fund.
| * | | Commenced operations by issuing shares May 26, 2011. |
| ** | | The Russell-Axioma U.S. Small Cap Low Beta Index is designed to deliver exposure to stocks that have low predicted betas as determined by a screening and ranking methodology applied to the output of the Axioma U.S. Equity Medium Horizon Fundamental Factor Risk model. Beta is a measure of the sensitivity of a stock’s price to a change in the broad market price level, as represented by the Russell 2000® Index (an index comprised of U.S. small capitalization stocks). Low beta stocks are considered to have a lower risk profile than the overall market and can be used by investors to adjust beta exposure in a portfolio. |
Performance is historical and assumes reinvestment of all dividends and capital gains. Investment return and principal value will fluctuate so that an investor’s shares, when redeemed, may be worth more or less than when purchased. Past performance is not indicative of future results. The returns shown do not reflect the deduction of taxes that a shareholder would pay on Fund distributions or the redemption of Fund shares.
| | |
| Russell 2000® Low Beta ETF | | 67 |
Russell Exchange Traded Funds Trust
Russell 2000 Low Beta ETF
Shareholder Expense Example — March 31, 2012 (Unaudited)
Fund Expenses
The following disclosure provides important information regarding each Fund’s Expense Example, which appears on each Fund’s individual page in this Annual Report. Please refer to this information when reviewing the Expense Example for a Fund.
Example
As a shareholder of the Fund, you incur two types of costs: (1) transaction costs, including brokerage commissions on purchases and sales of your Fund shares and (2) ongoing costs, including management fees and other Fund expenses. The Example is intended to help you understand your ongoing costs (in dollars) of investing in the Fund and to compare these costs with the ongoing costs of investing in other funds. The Example is based on an investment of $1,000 invested at the beginning of the period and held for the entire period indicated, which for this Fund is from October 1, 2011 to March 31, 2012.
Actual Expenses
The information in the table under the heading “Actual Performance” provides information about actual account values and actual expenses. You may use the information in this column, together with the amount you invested, to estimate the expenses that you paid over the period. Simply divide your account value by $1,000 (for example, an $8,600 account value divided by $1,000 = 8.6), then multiply the result by the number in the first column in the row entitled “Expenses Paid During Period” to estimate the expenses you paid on your account during this period.
Hypothetical Example for Comparison Purposes
The information in the table under the heading “Hypothetical Performance (5% return before expenses)” provides information about hypothetical account values and hypothetical expenses based on the Fund’s actual expense ratio and an assumed rate of return of 5% per year before expenses, which is not the Fund’s actual return. The hypothetical account values and expenses may not be used to estimate the actual ending account balance or expenses you paid for the period. You may use this information to compare the ongoing costs of investing in the Fund and other funds. To do so, compare this 5% hypothetical example with the 5% hypothetical examples that appear in the shareholder reports of other funds.
Please note that the expenses shown in the table are meant to highlight your ongoing costs only and do not reflect any transactional costs, such as brokerage commissions paid on purchases and sales of Fund shares. Therefore, the information under the heading “Hypothetical Performance (5% return before expenses)” is useful in comparing ongoing costs only, and will not help you determine the relative total costs of owning different funds. In addition, if these transactional costs were included, your costs would have been higher.
| | | | | | | | |
| | | Actual
Performance | | | Hypothetical
Performance
(5% return
before expenses) | |
| | | | | | | | |
Beginning Account Value October 1, 2011 | | $ | 1,000.00 | | | $ | 1,000.00 | |
Ending Account Value March 31, 2012 | | $ | 1,220.30 | | | $ | 1,023.20 | |
Expenses Paid During Period* | | $ | 2.05 | | | $ | 1.82 | |
| * | Expenses are equal to the Fund’s annualized expense ratio of 0.37% (representing the six month period annualized), multiplied by the average account value over the period, multiplied by 183/366 (to reflect the one-half year period). Effective November 3, 2011, the annualized expense ratio is 0.30%, as contractually agreed to by the adviser. May reflect amounts waived and/or reimbursed. Without any waivers and/or reimbursements, expenses would have been higher. |
| | | | |
| | 68 | | | Russell 2000 Low Beta ETF |
Russell Exchange Traded Funds Trust
Russell 2000 Low Beta ETF
Schedule of Investments — March 31, 2012
Amounts in thousands (except share amounts)
| | | | | | | | |
| | | Principal
Amount ($)
or Shares | | | Market
Value
$ | |
| | | | | | | | |
| Common Stocks - 99.7% | | | | | | | | |
| Consumer Discretionary - 9.9% | | | | | | | | |
Barnes & Noble, Inc. (Æ) | | | 548 | | | | 7 | |
Bon-Ton Stores, Inc. (The) | | | 2,510 | | | | 23 | |
Bridgepoint Education, Inc. (Æ) | | | 1,041 | | | | 26 | |
Buckle, Inc. (The) | | | 119 | | | | 6 | |
Capella Education Co. (Æ) | | | 125 | | | | 5 | |
Caribou Coffee Co., Inc. (Æ) | | | 220 | | | | 4 | |
Carter’s, Inc. (Æ) | | | 586 | | | | 29 | |
Cato Corp. (The) Class A | | | 132 | | | | 4 | |
Children’s Place Retail Stores, Inc. (The) (Æ) | | | 643 | | | | 33 | |
Citi Trends, Inc. (Æ) | | | 354 | | | | 4 | |
Coinstar, Inc. (Æ) | | | 386 | | | | 25 | |
Coldwater Creek, Inc. (Æ) | | | 2,028 | | | | 2 | |
Conn’s, Inc. (Æ) | | | 822 | | | | 13 | |
Elizabeth Arden, Inc. (Æ) | | | 88 | | | | 3 | |
Francesca’s Holdings Corp. (Æ) | | | 469 | | | | 15 | |
Fred’s, Inc. Class A | | | 1,354 | | | | 20 | |
Fuel Systems Solutions, Inc. (Æ) | | | 138 | | | | 4 | |
Gordmans Stores, Inc. (Æ) | | | 206 | | | | 5 | |
HealthStream, Inc. (Æ) | | | 80 | | | | 2 | |
hhgregg, Inc. (Æ) | | | 384 | | | | 4 | |
HOT Topic, Inc. | | | 1,408 | | | | 14 | |
HSN, Inc. | | | 78 | | | | 3 | |
Leapfrog Enterprises, Inc. Class A (Æ) | | | 639 | | | | 5 | |
Lincoln Educational Services Corp. | | | 753 | | | | 6 | |
Lions Gate Entertainment Corp. (Æ) | | | 692 | | | | 10 | |
Marchex, Inc. Class A | | | 2,346 | | | | 10 | |
MarineMax, Inc. (Æ) | | | 88 | | | | 1 | |
Matthews International Corp. Class A | | | 439 | | | | 14 | |
Mattress Firm Holding Corp. (Æ) | | | 402 | | | | 15 | |
Monro Muffler Brake, Inc. | | | 234 | | | | 10 | |
New York & Co., Inc. (Æ) | | | 625 | | | | 2 | |
Nu Skin Enterprises, Inc. Class A | | | 1,269 | | | | 73 | |
Nutrisystem, Inc. | | | 115 | | | | 1 | |
Orbitz Worldwide, Inc. (Æ) | | | 370 | | | | 1 | |
Regis Corp. | | | 261 | | | | 5 | |
Rent-A-Center, Inc. Class A | | | 63 | | | | 2 | |
Saks, Inc. (Æ) | | | 1,004 | | | | 12 | |
Sinclair Broadcast Group, Inc. Class A | | | 2,286 | | | | 25 | |
Stamps.com, Inc. (Æ) | | | 513 | | | | 14 | |
Stein Mart, Inc. (Æ) | | | 927 | | | | 6 | |
Stewart Enterprises, Inc. Class A | | | 359 | | | | 2 | |
Teavana Holdings, Inc. (Æ) | | | 247 | | | | 5 | |
Town Sports International Holdings, Inc. (Æ) | | | 435 | | | | 6 | |
Universal Technical Institute, Inc. | | | 1,266 | | | | 17 | |
US Auto Parts Network, Inc. (Æ) | | | 1,230 | | | | 4 | |
Valassis Communications, Inc. (Æ) | | | 46 | | | | 1 | |
Valuevision Media, Inc. Class A (Æ) | | | 161 | | | | — | ± |
Viad Corp. | | | 109 | | | | 2 | |
Wolverine World Wide, Inc. | | | 181 | | | | 7 | |
| | | | | | | | |
| | | | | | | 507 | |
| | | | | | | | |
| | |
| Consumer Staples - 12.8% | | | | | | | | |
Andersons, Inc. (The) | | | 382 | | | | 19 | |
B&G Foods, Inc. Class A | | | 1,011 | | | | 23 | |
| | | | | | | | |
| | | Principal
Amount ($)
or Shares | | | Market
Value
$ | |
Casey’s General Stores, Inc. | | | 699 | | | | 39 | |
Chiquita Brands International, Inc. (Æ) | | | 122 | | | | 1 | |
Farmer Bros Co. (Æ) | | | 141 | | | | 2 | |
Fresh Del Monte Produce, Inc. | | | 977 | | | | 22 | |
Hain Celestial Group, Inc. (The) (Æ) | | | 1,311 | | | | 57 | |
Harris Teeter Supermarkets, Inc. | | | 232 | | | | 9 | |
J&J Snack Foods Corp. | | | 378 | | | | 20 | |
Lancaster Colony Corp. | | | 565 | | | | 38 | |
Medifast, Inc. (Æ) | | | 367 | | | | 6 | |
Nash Finch Co. | | | 491 | | | | 14 | |
National Beverage Corp. (Æ) | | | 907 | | | | 15 | |
Peet’s Coffee & Tea, Inc. (Æ) | | | 367 | | | | 27 | |
PetMed Express, Inc. | | | 1,650 | | | | 20 | |
Rite Aid Corp. (Æ) | | | 1,488 | | | | 3 | |
Sanderson Farms, Inc. | | | 1,501 | | | | 80 | |
Schiff Nutrition International, Inc. (Æ) | | | 728 | | | | 9 | |
Snyders-Lance, Inc. | | | 326 | | | | 8 | |
Spartan Stores, Inc. | | | 195 | | | | 3 | |
Star Scientific, Inc. (Æ) | | | 1,435 | | | | 5 | |
TreeHouse Foods, Inc. (Æ) | | | 69 | | | | 4 | |
United Natural Foods, Inc. (Æ) | | | 626 | | | | 29 | |
Universal Corp. | | | 1,572 | | | | 73 | |
USANA Health Sciences, Inc. (Æ) | | | 417 | | | | 16 | |
Vector Group, Ltd. | | | 5,052 | | | | 89 | |
WD-40 Co. | | | 636 | | | | 29 | |
| | | | | | | | |
| | | | | | | 660 | |
| | | | | | | | |
| | |
| Energy - 0.3% | | | | | | | | |
Rex Energy Corp. (Æ) | | | 326 | | | | 3 | |
Syntroleum Corp. (Æ) | | | 8,334 | | | | 8 | |
Venoco, Inc. (Æ) | | | 518 | | | | 6 | |
| | | | | | | | |
| | | | | | | 17 | |
| | | | | | | | |
| | |
| Financial Services - 29.0% | | | | | | | | |
American Campus Communities, Inc. (ö) | | | 1,723 | | | | 77 | |
Amtrust Financial Services, Inc. | | | 961 | | | | 26 | |
Argo Group International Holdings, Ltd. | | | 104 | | | | 3 | |
ARMOUR Residential REIT, Inc. (ö) | | | 780 | | | | 5 | |
Ashford Hospitality Trust, Inc. (ö) | | | 4,092 | | | | 37 | |
Beneficial Mutual Bancorp, Inc. (Æ) | | | 868 | | | | 8 | |
BofI Holding, Inc. (Æ) | | | 11 | | | | — | ± |
Capstead Mortgage Corp. (ö) | | | 3,804 | | | | 50 | |
Cardtronics, Inc. (Æ) | | | 2,408 | | | | 63 | |
CBL & Associates Properties, Inc. (ö) | | | 1,758 | | | | 33 | |
Centerstate Banks, Inc. | | | 2,575 | | | | 21 | |
City Holding Co. | | | 95 | | | | 3 | |
Colony Financial, Inc. (ö) | | | 1,550 | | | | 25 | |
Columbia Banking System, Inc. | | | 30 | | | | 1 | |
Coresite Realty Corp. (ö) | | | 129 | | | | 3 | |
CreXus Investment Corp. (ö) | | | 2,175 | | | | 23 | |
DCT Industrial Trust, Inc. (ö) | | | 4,028 | | | | 24 | |
DiamondRock Hospitality Co. (ö) | | | 1,260 | | | | 13 | |
DuPont Fabros Technology, Inc. (ö) | | | 675 | | | | 17 | |
Dynex Capital, Inc. (ö) | | | 3,332 | | | | 32 | |
eHealth, Inc. (Æ) | | | 518 | | | | 8 | |
Employers Holdings, Inc. | | | 830 | | | | 15 | |
Encore Bancshares, Inc. (Æ) | | | 475 | | | | 10 | |
| | |
| Russell 2000 Low Beta ETF | | 69 |
Russell Exchange Traded Funds Trust
Russell 2000 Low Beta ETF
Schedule of Investments, continued — March 31, 2012
Amounts in thousands (except share amounts)
| | | | | | | | |
| | | Principal
Amount ($)
or Shares | | | Market
Value
$ | |
| | | | | | | | |
Entertainment Properties Trust (ö) | | | 138 | | | | 6 | |
Excel Trust, Inc. (ö) | | | 1,634 | | | | 20 | |
Extra Space Storage, Inc. (ö) | | | 354 | | | | 10 | |
Federal Agricultural Mortgage Corp. Class C | | | 56 | | | | 1 | |
FelCor Lodging Trust, Inc. (Æ)(ö) | | | 530 | | | | 2 | |
First Community Bancshares, Inc. | | | 601 | | | | 8 | |
First Financial Bancorp | | | 309 | | | | 5 | |
First Financial Bankshares, Inc. | | | 948 | | | | 33 | |
Getty Realty Corp. (ö) | | | 286 | | | | 4 | |
Glacier Bancorp, Inc. | | | 1,068 | | | | 16 | |
Gladstone Commercial Corp. (ö) | | | 114 | | | | 2 | |
Glimcher Realty Trust (ö) | | | 1,492 | | | | 15 | |
Government Properties Income Trust (ö) | | | 973 | | | | 23 | |
Greenlight Capital Re, Ltd. Class A (Æ) | | | 47 | | | | 1 | |
Hancock Holding Co. | | | 812 | | | | 29 | |
Hatteras Financial Corp. (ö) | | | 408 | | | | 11 | |
Higher One Holdings, Inc. (Æ) | | | 768 | | | | 11 | |
Hilltop Holdings, Inc. (Æ) | | | 514 | | | | 4 | |
Home Properties, Inc. (ö) | | | 378 | | | | 23 | |
Inland Real Estate Corp. (ö) | | | 259 | | | | 2 | |
Investors Bancorp, Inc. (Æ) | | | 955 | | | | 14 | |
Kilroy Realty Corp. (ö) | | | 1,193 | | | | 56 | |
Ladenburg Thalmann Financial Services, Inc. (Æ) | | | 865 | | | | 2 | |
Meadowbrook Insurance Group, Inc. | | | 723 | | | | 7 | |
MGIC Investment Corp. (Æ) | | | 2,419 | | | | 12 | |
Mid-America Apartment Communities, Inc. (ö) | | | 70 | | | | 5 | |
MoneyGram International, Inc. (Æ) | | | 141 | | | | 3 | |
Monmouth Real Estate Investment Corp. Class A (ö) | | | 4,712 | | | | 46 | |
MPG Office Trust, Inc. (Æ)(ö) | | | 13,185 | | | | 31 | |
National Health Investors, Inc. (ö) | | | 720 | | | | 35 | |
National Retail Properties, Inc. (ö) | | | 2,269 | | | | 62 | |
NBT Bancorp, Inc. | | | 122 | | | | 3 | |
Newcastle Investment Corp. (ö) | | | 625 | | | | 4 | |
Northfield Bancorp, Inc. | | | 431 | | | | 6 | |
Northwest Bancshares, Inc. | | | 1,253 | | | | 16 | |
Ocwen Financial Corp. (Æ) | | | 338 | | | | 5 | |
Oritani Financial Corp. | | | 807 | | | | 12 | |
Pacific Capital Bancorp NA (Æ) | | | 195 | | | | 9 | |
Park Sterling Corp. (Æ) | | | 3,039 | | | | 15 | |
Pebblebrook Hotel Trust (ö) | | | 635 | | | | 14 | |
Pennsylvania Real Estate Investment Trust (ö) | | | 866 | | | | 13 | |
PennyMac Mortgage Investment Trust (ö) | | | 305 | | | | 6 | |
Post Properties, Inc. (ö) | | | 12 | | | | 1 | |
Potlatch Corp. (ö) | | | 803 | | | | 25 | |
Prosperity Bancshares, Inc. | | | 1,177 | | | | 54 | |
RAIT Financial Trust (ö) | | | 645 | | | | 3 | |
Ramco-Gershenson Properties Trust (ö) | | | 238 | | | | 3 | |
Resource Capital Corp. (ö) | | | 2,380 | | | | 13 | |
RLJ Lodging Trust (ö) | | | 597 | | | | 11 | |
Sabra Health Care REIT, Inc. (ö) | | | 921 | | | | 15 | |
Saul Centers, Inc. (ö) | | | 110 | | | | 4 | |
Signature Bank NY (Æ) | | | 1,245 | | | | 78 | |
| | | | | | | | |
| | | Principal
Amount ($)
or Shares | | | Market
Value
$ | |
Sterling Financial Corp. (Æ) | | | 948 | | | | 20 | |
Strategic Hotels & Resorts,
Inc. (Æ)(ö) | | | 3,771 | | | | 25 | |
Sunstone Hotel Investors, Inc. (Æ)(ö) | | | 170 | | | | 2 | |
Tanger Factory Outlet Centers (ö) | | | 2,166 | | | | 64 | |
Terreno Realty Corp. (ö) | | | 915 | | | | 13 | |
UMB Financial Corp. | | | 107 | | | | 5 | |
Universal Insurance Holdings, Inc. | | | 3,769 | | | | 15 | |
Urstadt Biddle Properties, Inc. Class A (ö) | | | 1,002 | | | | 20 | |
ViewPoint Financial Group | | | 357 | | | | 6 | |
Westfield Financial, Inc. | | | 379 | | | | 3 | |
Wilshire Bancorp, Inc. (Æ) | | | 857 | | | | 4 | |
World Acceptance Corp. (Æ) | | | 181 | | | | 11 | |
| | | | | | | | |
| | | | | | | 1,494 | |
| | | | | | | | |
| | |
| Health Care - 25.5% | | | | | | | | |
Accelrys, Inc. (Æ) | | | 1,232 | | | | 10 | |
Accretive Health, Inc. (Æ) | | | 305 | | | | 6 | |
Accuray, Inc. (Æ) | | | 755 | | | | 5 | |
Achillion Pharmaceuticals, Inc. (Æ) | | | 129 | | | | 1 | |
Acorda Therapeutics, Inc. (Æ) | | | 426 | | | | 11 | |
Acura Pharmaceuticals, Inc. (Æ) | | | 1,459 | | | | 5 | |
Air Methods Corp. (Æ) | | | 105 | | | | 9 | |
Akorn, Inc. (Æ) | | | 67 | | | | 1 | |
Alkermes PLC (Æ) | | | 1,689 | | | | 31 | |
Allos Therapeutics, Inc. (Æ) | | | 1,296 | | | | 2 | |
Alnylam Pharmaceuticals, Inc. (Æ) | | | 285 | | | | 3 | |
AMN Healthcare Services, Inc. (Æ) | | | 1,164 | | | | 7 | |
Amsurg Corp. Class A (Æ) | | | 2,532 | | | | 71 | |
AngioDynamics, Inc. (Æ) | | | 659 | | | | 8 | |
Antares Pharma, Inc. (Æ) | | | 5,482 | | | | 18 | |
Anthera Pharmaceuticals, Inc. (Æ) | | | 2,313 | | | | 5 | |
Ardea Biosciences, Inc. (Æ) | | | 310 | | | | 7 | |
Arena Pharmaceuticals, Inc. (Æ) | | | 7,307 | | | | 22 | |
Arqule, Inc. (Æ) | | | 877 | | | | 6 | |
athenahealth, Inc. (Æ) | | | 37 | | | | 3 | |
Auxilium Pharmaceuticals, Inc. (Æ) | | | 264 | | | | 5 | |
AVEO Pharmaceuticals, Inc. (Æ) | | | 653 | | | | 8 | |
Biolase Technology, Inc. (Æ) | | | 146 | | | | — | ± |
Bio-Reference Labs, Inc. (Æ) | | | 3,246 | | | | 76 | |
BioScrip, Inc. (Æ) | | | 333 | | | | 2 | |
Cadence Pharmaceuticals, Inc. (Æ) | | | 234 | | | | 1 | |
Cambrex Corp. (Æ) | | | 138 | | | | 1 | |
Cell Therapeutics, Inc. (Æ) | | | 8,935 | | | | 12 | |
Centene Corp. (Æ) | | | 1,210 | | | | 59 | |
Cerus Corp. (Æ) | | | 2,537 | | | | 10 | |
Chelsea Therapeutics International, Ltd. (Æ) | | | 465 | | | | 1 | |
Cleveland Biolabs, Inc. (Æ) | | | 3,044 | | | | 8 | |
Computer Programs & Systems, Inc. | | | 261 | | | | 15 | |
Corvel Corp. (Æ) | | | 545 | | | | 22 | |
Cubist Pharmaceuticals, Inc. (Æ) | | | 829 | | | | 36 | |
Cytori Therapeutics, Inc. (Æ) | | | 1,024 | | | | 3 | |
Depomed, Inc. (Æ) | | | 4,447 | | | | 28 | |
Emeritus Corp. (Æ) | | | 185 | | | | 3 | |
Endocyte, Inc. (Æ) | | | 1,233 | | | | 6 | |
Ensign Group, Inc. (The) | | | 25 | | | | 1 | |
Enzon Pharmaceuticals, Inc. (Æ) | | | 1,184 | | | | 8 | |
| | | | |
| | 70 | | | Russell 2000 Low Beta ETF |
Russell Exchange Traded Funds Trust
Russell 2000 Low Beta ETF
Schedule of Investments, continued — March 31, 2012
Amounts in thousands (except share amounts)
| | | | | | | | |
| | | Principal
Amount ($)
or Shares | | | Market
Value
$ | |
| | | | | | | | |
Epocrates, Inc. (Æ) | | | 238 | | | | 2 | |
Exact Sciences Corp. (Æ) | | | 2,693 | | | | 30 | |
ExamWorks Group, Inc. (Æ) | | | 273 | | | | 3 | |
Exelixis, Inc. (Æ) | | | 1,825 | | | | 9 | |
Genomic Health, Inc. (Æ) | | | 340 | | | | 10 | |
Greatbatch, Inc. (Æ) | | | 93 | | | | 2 | |
Hansen Medical, Inc. (Æ) | | | 1,439 | | | | 4 | |
HeartWare International, Inc. (Æ) | | | 128 | | | | 8 | |
Immunogen, Inc. (Æ) | | | 322 | | | | 5 | |
Impax Laboratories, Inc. (Æ) | | | 205 | | | | 5 | |
Incyte Corp., Ltd. (Æ) | | | 527 | | | | 10 | |
Infinity Pharmaceuticals, Inc. (Æ) | | | 407 | | | | 5 | |
Integra LifeSciences Holdings Corp. (Æ) | | | 22 | | | | 1 | |
Invacare Corp. | | | 85 | | | | 1 | |
IPC The Hospitalist Co., Inc. (Æ) | | | 273 | | | | 10 | |
IRIS International, Inc. (Æ) | | | 473 | | | | 6 | |
Isis Pharmaceuticals, Inc. (Æ) | | | 232 | | | | 2 | |
Jazz Pharmaceuticals PLC (Æ) | | | 492 | | | | 24 | |
Landauer, Inc. | | | 170 | | | | 9 | |
Lexicon Pharmaceuticals, Inc. (Æ) | | | 12,235 | | | | 23 | |
LHC Group, Inc. (Æ) | | | 331 | | | | 6 | |
Luminex Corp. (Æ) | | | 434 | | | | 10 | |
Magellan Health Services, Inc. (Æ) | | | 1,609 | | | | 79 | |
MannKind Corp. (Æ) | | | 2,952 | | | | 7 | |
Masimo Corp. (Æ) | | | 1,366 | | | | 32 | |
Maxygen, Inc. (Æ) | | | 1,015 | | | | 6 | |
Medicis Pharmaceutical Corp. Class A | | | 1,327 | | | | 50 | |
Medivation, Inc. (Æ) | | | 115 | | | | 9 | |
Merge Healthcare, Inc. (Æ) | | | 1,128 | | | | 7 | |
Merit Medical Systems, Inc. (Æ) | | | 62 | | | | 1 | |
Molina Healthcare, Inc. (Æ) | | | 754 | | | | 25 | |
Momenta Pharmaceuticals, Inc. (Æ) | | | 183 | | | | 3 | |
MWI Veterinary Supply, Inc. (Æ) | | | 176 | | | | 16 | |
Natus Medical, Inc. (Æ) | | | 193 | | | | 2 | |
NPS Pharmaceuticals, Inc. (Æ) | | | 1,573 | | | | 11 | |
NxStage Medical, Inc. (Æ) | | | 104 | | | | 2 | |
Oncothyreon, Inc. (Æ) | | | 1,119 | | | | 5 | |
Owens & Minor, Inc. | | | 1,816 | | | | 55 | |
Par Pharmaceutical Cos., Inc. (Æ) | | | 665 | | | | 26 | |
PAREXEL International Corp. (Æ) | | | 92 | | | | 3 | |
PDL BioPharma, Inc. | | | 220 | | | | 1 | |
Providence Service Corp. (The) (Æ) | | | 51 | | | | 1 | |
Quality Systems, Inc. | | | 665 | | | | 29 | |
Questcor Pharmaceuticals, Inc. (Æ) | | | 768 | | | | 29 | |
RadNet, Inc. (Æ) | | | 3,992 | | | | 13 | |
Raptor Pharmaceutical Corp. (Æ) | | | 202 | | | | 1 | |
Salix Pharmaceuticals, Ltd. (Æ) | | | 215 | | | | 11 | |
Santarus, Inc. (Æ) | | | 2,258 | | | | 13 | |
Seattle Genetics, Inc. (Æ) | | | 192 | | | | 4 | |
Spectranetics Corp. (Æ) | | | 238 | | | | 3 | |
Staar Surgical Co. (Æ) | | | 2,791 | | | | 30 | |
STERIS Corp. | | | 146 | | | | 5 | |
Sunesis Pharmaceuticals, Inc. (Æ) | | | 1,528 | | | | 4 | |
SurModics, Inc. (Æ) | | | 252 | | | | 4 | |
Symmetry Medical, Inc. (Æ) | | | 1,197 | | | | 9 | |
Theravance, Inc. (Æ) | | | 131 | | | | 3 | |
Transcend Services, Inc. (Æ) | | | 245 | | | | 7 | |
| | | | | | | | |
| | | Principal
Amount ($)
or Shares | | | Market
Value
$ | |
Trius Therapeutics, Inc. (Æ) | | | 861 | | | | 5 | |
Vical, Inc. (Æ) | | | 1,727 | | | | 6 | |
Volcano Corp. (Æ) | | | 1,020 | | | | 29 | |
Wright Medical Group, Inc. (Æ) | | | 1,037 | | | | 20 | |
XenoPort, Inc. (Æ) | | | 234 | | | | 1 | |
ZIOPHARM Oncology, Inc. (Æ) | | | 3,358 | | | | 18 | |
Zoll Medical Corp. (Æ) | | | 68 | | | | 6 | |
| | | | | | | | |
| | | | | | | 1,312 | |
| | | | | | | | |
| | |
| Materials and Processing - 0.4% | | | | | | | | |
Schweitzer-Mauduit International, Inc. | | | 280 | | | | 20 | |
| | | | | | | | |
| | |
| Producer Durables - 4.2% | | | | | | | | |
Allegiant Travel Co. Class A (Æ) | | | 283 | | | | 15 | |
Corporate Executive Board Co. (The) | | | 629 | | | | 27 | |
Geo Group, Inc. (The) (Æ) | | | 120 | | | | 2 | |
Heartland Express, Inc. | | | 1,776 | | | | 26 | |
HEICO Corp. | | | 28 | | | | 2 | |
Huron Consulting Group, Inc. (Æ) | | | 116 | | | | 4 | |
InnerWorkings, Inc. (Æ) | | | 928 | | | | 11 | |
Knight Transportation, Inc. | | | 1,056 | | | | 19 | |
Liquidity Services, Inc. (Æ) | | | 48 | | | | 2 | |
MasTec, Inc. (Æ) | | | 66 | | | | 1 | |
Mine Safety Appliances Co. | | | 1,608 | | | | 66 | |
Navigant Consulting, Inc. (Æ) | | | 585 | | | | 8 | |
Swisher Hygiene, Inc. (Æ)(Þ) | | | 718 | | | | 2 | |
Teledyne Technologies, Inc. (Æ) | | | 169 | | | | 11 | |
US Airways Group, Inc. (Æ) | | | 181 | | | | 1 | |
Werner Enterprises, Inc. | | | 846 | | | | 21 | |
| | | | | | | | |
| | | | | | | 218 | |
| | | | | | | | |
| | |
| Technology - 5.6% | | | | | | | | |
Carbonite, Inc. (Æ) | | | 729 | | | | 8 | |
comScore, Inc. (Æ) | | | 256 | | | | 5 | |
Comtech Telecommunications Corp. | | | 305 | | | | 10 | |
DDi Corp. | | | 1,148 | | | | 14 | |
Deltek, Inc. (Æ) | | | 1,182 | | | | 13 | |
Digital River, Inc. (Æ) | | | 129 | | | | 2 | |
Earthlink, Inc. | | | 1,677 | | | | 13 | |
Emcore Corp. (Æ) | | | 2,534 | | | | 12 | |
EPIQ Systems, Inc. | | | 389 | | | | 5 | |
Finisar Corp. (Æ) | | | 405 | | | | 8 | |
Iridium Communications, Inc. (Æ) | | | 1,250 | | | | 11 | |
JDA Software Group, Inc. (Æ) | | | 387 | | | | 11 | |
Kenexa Corp. (Æ) | | | 145 | | | | 5 | |
Loral Space & Communications, Inc. (Æ) | | | 191 | | | | 15 | |
Monolithic Power Systems, Inc. (Æ) | | | 245 | | | | 5 | |
Multi-Fineline Electronix, Inc. (Æ) | | | 203 | | | | 6 | |
Oclaro, Inc. (Æ) | | | 5,624 | | | | 22 | |
Openwave Systems, Inc. (Æ) | | | 2,813 | | | | 6 | |
Pegasystems, Inc. | | | 159 | | | | 6 | |
Plantronics, Inc. | | | 411 | | | | 17 | |
Quest Software, Inc. (Æ) | | | 938 | | | | 22 | |
Semtech Corp. (Æ) | | | 453 | | | | 13 | |
Sycamore Networks, Inc. (Æ) | | | 406 | | | | 7 | |
Synaptics, Inc. (Æ) | | | 469 | | | | 17 | |
TNS, Inc. (Æ) | | | 691 | | | | 15 | |
| | |
| Russell 2000 Low Beta ETF | | 71 |
Russell Exchange Traded Funds Trust
Russell 2000 Low Beta ETF
Schedule of Investments, continued — March 31, 2012
Amounts in thousands (except share amounts)
| | | | | | | | |
| | | Principal
Amount ($)
or Shares | | | Market
Value
$ | |
| | | | | | | | |
Ubiquiti Networks, Inc. (Æ) | | | 52 | | | | 2 | |
Ultratech, Inc. (Æ) | | | 17 | | | | — | ± |
Viasat, Inc. (Æ) | | | 105 | | | | 5 | |
Websense, Inc. (Æ) | | | 517 | | | | 11 | |
| | | | | | | | |
| | | | | | | 286 | |
| | | | | | | | |
| | |
| Utilities - 12.0% | | | | | | | | |
Alaska Communications Systems Group, Inc. | | | 1,489 | | | | 5 | |
Allete, Inc. | | | 576 | | | | 24 | |
Avista Corp. | | | 1,407 | | | | 36 | |
Black Hills Corp. | | | 929 | | | | 31 | |
Boingo Wireless, Inc. (Æ) | | | 809 | | | | 10 | |
California Water Service Group | | | 2,003 | | | | 36 | |
Cbeyond, Inc. (Æ) | | | 98 | | | | 1 | |
Central Vermont Public Service Corp. | | | 1,136 | | | | 40 | |
CH Energy Group, Inc. | | | 462 | | | | 31 | |
Cleco Corp. | | | 196 | | | | 8 | |
Cogent Communications Group, Inc. (Æ) | | | 195 | | | | 4 | |
Consolidated Communications Holdings, Inc. | | | 384 | | | | 7 | |
Idacorp, Inc. | | | 900 | | | | 37 | |
IDT Corp. Class B | | | 101 | | | | 1 | |
MGE Energy, Inc. | | | 835 | | | | 37 | |
Neutral Tandem, Inc. (Æ) | | | 646 | | | | 8 | |
New Jersey Resources Corp. | | | 379 | | | | 17 | |
Northwest Natural Gas Co. | | | 300 | | | | 14 | |
NorthWestern Corp. | | | 209 | | | | 7 | |
NTELOS Holdings Corp. | | | 67 | | | | 1 | |
Pendrell Corp. (Æ) | | | 2,863 | | | | 7 | |
PNM Resources, Inc. | | | 1,157 | | | | 21 | |
Portland General Electric Co. | | | 2,353 | | | | 59 | |
Premiere Global Services, Inc. (Æ) | | | 1,764 | | | | 16 | |
South Jersey Industries, Inc. | | | 636 | | | | 32 | |
UIL Holdings Corp. | | | 505 | | | | 18 | |
Unisource Energy Corp. | | | 2,391 | | | | 87 | |
WGL Holdings, Inc. | | | 624 | | | | 25 | |
| | | | | | | | |
| | | | | | | 620 | |
| | | | | | | | |
| | |
Total Common Stocks
(cost $4,850) | | | | | | | 5,134 | |
| | | | | | | | |
| | |
| Short-Term Investments - 0.2% | | | | | | | | |
Russell U.S. Cash Management Fund | | | 8,324 | (¥) | | | 8 | |
| | | | | | | | |
| | |
Total Short-Term Investments
(cost $8) | | | | | | | 8 | |
| | | | | | | | |
| | |
Total Investments - 99.9%
(identified cost $4,858) | | | | | | | 5,142 | |
| | |
Other Assets and Liabilities,
Net - 0.1% | | | | | | | 6 | |
| | | | | | | | |
| | |
| Net Assets - 100.0% | | | | | | | 5,148 | |
| | | | | | | | |
See accompanying notes which are an integral part of the financial statements.
| | | | |
| | 72 | | | Russell 2000 Low Beta ETF |
Russell Exchange Traded Funds Trust
Russell 2000 Low Beta ETF
Presentation of Portfolio Holdings — March 31, 2012
Amounts in thousands
| | | | | | | | | | | | | | | | | | | | |
| | | Market Value | | | % of Net
Assets | |
| Portfolio Summary | | Level 1 | | | Level 2 | | | Level 3 | | | Total | | |
| | | | | | | | | | | | | | | | | | | | |
Common Stocks | | | | | | | | | | | | | | | | | | | | |
Consumer Discretionary | | $ | 507 | | | $ | — | | | $ | — | | | $ | 507 | | | | 9.9 | |
Consumer Staples | | | 660 | | | | — | | | | — | | | | 660 | | | | 12.8 | |
Energy | | | 17 | | | | — | | | | — | | | | 17 | | | | 0.3 | |
Financial Services | | | 1,494 | | | | — | | | | — | | | | 1,494 | | | | 29.0 | |
Health Care | | | 1,312 | | | | — | | | | — | | | | 1,312 | | | | 25.5 | |
Materials and Processing | | | 20 | | | | — | | | | — | | | | 20 | | | | 0.4 | |
Producer Durables | | | 218 | | | | — | | | | — | | | | 218 | | | | 4.2 | |
Technology | | | 286 | | | | — | | | | — | | | | 286 | | | | 5.6 | |
Utilities | | | 620 | | | | — | | | | — | | | | 620 | | | | 12.0 | |
Short-Term Investments | | | — | | | | 8 | | | | — | | | | 8 | | | | 0.2 | |
| | | | | | | | | | | | | | | | | | | | |
| | | | | |
Total Investments | | | 5,134 | | | | 8 | | | | — | | | | 5,142 | | | | 99.9 | |
| | | | | | | | | | | | | | | | | | | | |
Other Assets and Liabilities, Net | | | | | | | | | | | | | | | | | | | 0.1 | |
| | | | | |
| | | | | |
| | | | | | | | | | | | | | | | | | | 100.0 | |
| | | | | |
For a description of the levels see note 2 in the Notes to Financial Statements.
There were no significant transfers in and out of levels 1, 2 and 3 during the period ending March 31, 2012.
See accompanying notes which are an integral part of the financial statements.
| | |
| Russell 2000 Low Beta ETF | | 73 |
Russell Exchange Traded Funds Trust
Russell 2000 Low Beta ETF
Statement of Assets and Liabilities — March 31, 2012
| | | | |
| Amounts in thousands | | Russell 2000 Low
Beta ETF | |
| | | | |
Assets | | | | |
Investments, at identified cost | | $ | 4,858 | |
Investments, at market* | | | 5,142 | |
Receivables: | | | | |
Dividends | | | 10 | |
Investments sold | | | 266 | |
| | | | |
Total assets | | | 5,418 | |
| | | | |
| |
Liabilities | | | | |
Payables: | | | | |
Investments purchased | | | 269 | |
Accrued fees to affiliates | | | 1 | |
| | | | |
Total liabilities | | | 270 | |
| | | | |
| | | | |
Net Assets | | $ | 5,148 | |
| | | | |
Net Assets Consist of: | | | | |
Undistributed (overdistributed) net investment income | | $ | 6 | |
Accumulated net realized gain (loss) | | | (89 | ) |
Unrealized appreciation (depreciation) on investments | | | 284 | |
Additional paid-in capital | | | 4,947 | |
| | | | |
Net Assets | | $ | 5,148 | |
| | | | |
Net Asset Value, offering and redemption price per share: | | | | |
Net asset value per share:(a) | | $ | 51.48 | |
Net assets | | $ | 5,148,427 | |
Shares outstanding ($.001 par value) | | | 100,002 | |
Amounts in thousands | | | | |
| | | | |
* Investments in Affiliates, Russell U.S. Cash Management Fund | | $ | 8 | |
| (a) | Net asset value per share equals net assets divided by shares outstanding. |
See accompanying notes which are an integral part of the financial statements.
| | | | |
| | 74 | | | Statement of Assets and Liabilities |
Russell Exchange Traded Funds Trust
Russell 2000 Low Beta ETF
Statement of Operations — For the Period Ended March 31, 2012
| | | | |
| Amounts in thousands | | Russell 2000 Low
Beta ETF* | |
| | | | |
Investment Income | | | | |
Dividends | | $ | 80 | |
| | | | |
Total investment income | | | 80 | |
| | | | |
| |
Expenses | | | | |
Management fees | | | 28 | |
Trustee and trustee related fees | | | 14 | |
| | | | |
Expenses before reductions | | | 42 | |
Expense reductions | | | (22 | ) |
| | | | |
Net expenses | | | 20 | |
| | | | |
Net investment income (loss) | | | 60 | |
| | | | |
| |
Net Realized and Unrealized Gain (Loss) | | | | |
Net realized gain (loss) on: | | | | |
Investments | | | (89 | ) |
In-kind redemptions | | | — | |
| | | | |
Net realized gain (loss) | | | (89 | ) |
Net change in unrealized appreciation (depreciation) on investments | | | 284 | |
| | | | |
Net realized and unrealized gain (loss) | | | 195 | |
| | | | |
Net Increase (Decrease) in Net Assets from Operations | | $ | 255 | |
| | | | |
| * | For the period May 26, 2011 (commencement of operations) to March 31, 2012. |
See accompanying notes which are an integral part of the financial statements.
| | |
| Statement of Operations | | 75 |
Russell Exchange Traded Funds Trust
Russell 2000 Low Beta ETF
Statement of Changes in Net Assets — For the Periods Ended March 31,
| | | | |
| | | Russell 2000 Low
Beta ETF | |
| Amounts in thousands | | 2012* | |
| | | | |
Increase (Decrease) in Net Assets | | | | |
| |
Operations | | | | |
Net investment income (loss) | | $ | 60 | |
Net realized gain (loss) | | | (89 | ) |
Net change in unrealized appreciation (depreciation) | | | 284 | |
| | | | |
Net increase (decrease) in net assets from operations | | | 255 | |
| | | | |
| |
Distributions | | | | |
From net investment income | | | (54 | ) |
| | | | |
Net decrease in net assets from distributions | | | (54 | ) |
| | | | |
| |
Share Transactions | | | | |
Net increase (decrease) in net assets from share transactions | | | 4,947 | |
| | | | |
Total Net Increase (Decrease) in Net Assets | | | 5,148 | |
| |
Net Assets | | | | |
Beginning of period | | | — | |
| | | | |
End of period | | $ | 5,148 | |
| | | | |
Undistributed (overdistributed) net investment income included in net assets | | $ | 6 | |
| * | For the period May 26, 2011 (commencement of operations) to March 31, 2012. |
See accompanying notes which are an integral part of the financial statements.
| | | | |
| | 76 | | | Statement of Changes in Net Assets |
(This page intentionally left blank)
Russell Exchange Traded Funds Trust
Russell 2000 Low Beta ETF
Financial Highlights — For the Period Ended
For a Share Outstanding Throughout Each Period.
| | | | | | | | | | | | | | | | | | | | | | | | |
| | | | | | |
| | | $
Net Asset Value,
Beginning of
Period | | | $
Net Investment
Income (Loss)(a)(e) | | | $
Net Realized
and Unrealized
Gain (Loss) | | | $
Total from
Investment
Operations | | | $
Distributions
from Net
Investment Income | | | $
Total
Distributions | |
Russell 2000 Low Beta ETF | | | | | | | | | | | | | | | | | |
March 31, 2012* | | | 49.47 | | | | .60 | | | | 1.95 | | | | 2.55 | | | | (.54 | ) | | | (.54 | ) |
| (a) | Average daily shares outstanding were used for this calculation. |
| (b) | Periods less than one year are not annualized. |
| (c) | The ratios for periods less than one year are annualized. |
| (d) | Portfolio turnover rate excludes securities received or delivered from in-kind creation or redemption units. |
| (e) | Reflects amounts waived by Russell Investment Management Company (“RIMCo”). |
| * | For the period May 26, 2011 (commencement of operations) to March 31, 2012. |
See accompanying notes which are an integral part of the financial statements.
| | | | | | | | | | | | | | | | | | | | | | | | | | |
$
Net Asset Value,
End of
Period | | | %
Total
Return(b) | | | $
Net Assets,
End of Period
(000) | | | %
Ratio of Expenses
to Average
Net Assets,
Gross(c) | | | %
Ratio of Expenses
to Average
Net Assets,
Net(c)(e) | | | %
Ratio of Net
Investment Income
to Average
Net Assets(c)(e) | | | %
Portfolio
Turnover Rate(b)(d) | |
| | | | | | | | | | | | | | | | | | | | | | | | | | |
| | 51.48 | | | | 5.24 | | | | 5,148 | | | | 1.05 | | | | .50 | | | | 1.49 | | | | 38 | |
See accompanying notes which are an integral part of the financial statements.
Russell Exchange Traded Funds Trust
Russell 2000 High Beta ETF
Portfolio Management Discussion and Analysis — March 31, 2012 (Unaudited)
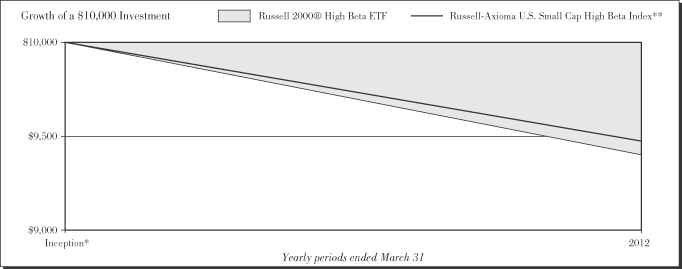
Performance as of March 31, 2012
| | | | | | | | | | | | |
|
| Average Annual Total Return | |
| | | Net Asset
Value | | | Market Value | | | Russell-Axioma
U.S. Small Cap
High Beta
Index** | |
Inception* | | | (5.95 | )% | | | (5.97 | )% | | | (5.23 | )% |
| | | | |
| | 80 | | | Russell 2000 High Beta ETF |
Russell Exchange Traded Funds Trust
Russell 2000® High Beta ETF
Portfolio Management Discussion and Analysis — March 31, 2012 (Unaudited)
The Russell 2000® High Beta ETF (the “Fund”) is an index-based exchange-traded fund that seeks investment results that closely correspond to the total return of the Russell-Axioma U.S. Small Cap High Beta Index (the “Index”). Russell Investment Management Company (“RIMCo”), as the Fund’s advisor, uses a “passive” or indexing approach to try to achieve the Fund’s investment objective. Unlike many investment companies, the Fund does not try to “beat” the Index it tracks and does not seek temporary defensive positions when markets decline or appear overvalued. The Fund seeks to gain exposure to the factor exhibited in its Index. The Fund will normally invest at least 80% of its total assets in securities that comprise the Index.
What is the Fund’s investment objective?
The Fund seeks investment results that closely correspond to the total return of the Russell-Axioma U.S. Small Cap High Beta Index, which is designed to deliver exposure to stocks that are predicted to have a high beta as determined by a screening and ranking methodology applied to the output of the Axioma U.S. Equity Medium Horizon Fundamental Factor Risk model.
Is the Fund replicating or sampling?
The Fund is replicating.
How did the Fund perform relative to its benchmark for the fiscal year ended March 31, 2012?
For the fiscal year ended March 31, 2012, the Fund lost (5.95)%. This is compared to the Fund’s benchmark, the Russell-Axioma U.S. Small Cap High Beta Index, which lost (5.23)% during the same period. The Fund’s performance includes operating expenses, whereas indexes are unmanaged and index returns do not include expenses of any kind.
There were no significant changes to either the Fund or Index during the reporting period.
Did the Fund outperform or underperform the benchmark or was performance as expected based on expenses, etc.?
The Fund performed as expected against the benchmark.
Over the reporting period, please describe those sectors that outperformed or underperformed.
Sectors achieved both positive and negative returns for the Fund and the Index. Health care was the best performing sector for the Fund and the Index, while consumer discretionary was the worst performing sector. Producer durables, with an average weight of 32.8% was the best contributor to Fund and Index returns. Technology, with an average weight of 19.4%, was the worst contributor to Fund and Index returns.
Over the reporting period, please describe those individual securities (constituents) that outperformed or underperformed.
United Rentals Inc, Taleo Corp Cl A, and Hornbeck Offshore Services Inc generated positive returns and contributed the most to Fund performance while Willbros Group Inc, Century Aluminum Co, and Meritor Inc, all declined which detracted from Fund performance.
The views expressed in this report reflect those of the portfolio managers only through the end of the period covered by the report. These views do not necessarily represent the views of RIMCo, or any other person in RIMCo or any other affiliated organization. These views are subject to change at any time based upon market conditions or other events, and RIMCo disclaims any responsibility to update the views contained herein. These views should not be relied on as investment advice and, because investment decisions for a Russell Exchange Traded Funds Trust (“RET”) Fund are based on numerous factors, should not be relied on as an indication of investment decisions of any RET Fund.
| * | | Commenced operations by issuing shares May 26, 2011. |
| ** | | The Russell-Axioma U.S. Small Cap High Beta Index is designed to deliver exposure to stocks that have high predicted betas as determined by a screening and ranking methodology applied to the output of the Axioma U.S. Equity Medium Horizon Fundamental Factor Risk model. Beta is a measure of the sensitivity of a stock’s price to a change in the broad market price level, as represented by the Russell 2000® Index (an index comprised of U.S. small capitalization stocks). High beta stocks are considered to have a higher risk profile than the overall market and can be used by investors to adjust beta exposure in a portfolio. |
Performance is historical and assumes reinvestment of all dividends and capital gains. Investment return and principal value will fluctuate so that an investor’s shares, when redeemed, may be worth more or less than when purchased. Past performance is not indicative of future results. The returns shown do not reflect the deduction of taxes that a shareholder would pay on Fund distributions or the redemption of Fund shares.
| | |
| Russell 2000® High Beta ETF | | 81 |
Russell Exchange Traded Funds Trust
Russell 2000 High Beta ETF
Shareholder Expense Example — March 31, 2012 (Unaudited)
Fund Expenses
The following disclosure provides important information regarding each Fund’s Expense Example, which appears on each Fund’s individual page in this Annual Report. Please refer to this information when reviewing the Expense Example for a Fund.
Example
As a shareholder of the Fund, you incur two types of costs: (1) transaction costs, including brokerage commissions on purchases and sales of your Fund shares and (2) ongoing costs, including management fees and other Fund expenses. The Example is intended to help you understand your ongoing costs (in dollars) of investing in the Fund and to compare these costs with the ongoing costs of investing in other funds. The Example is based on an investment of $1,000 invested at the beginning of the period and held for the entire period indicated, which for this Fund is from October 1, 2011 to March 31, 2012.
Actual Expenses
The information in the table under the heading “Actual Performance” provides information about actual account values and actual expenses. You may use the information in this column, together with the amount you invested, to estimate the expenses that you paid over the period. Simply divide your account value by $1,000 (for example, an $8,600 account value divided by $1,000 = 8.6), then multiply the result by the number in the first column in the row entitled “Expenses Paid During Period” to estimate the expenses you paid on your account during this period.
Hypothetical Example for Comparison Purposes
The information in the table under the heading “Hypothetical Performance (5% return before expenses)” provides information about hypothetical account values and hypothetical expenses based on the Fund’s actual expense ratio and an assumed rate of return of 5% per year before expenses, which is not the Fund’s actual return. The hypothetical account values and expenses may not be used to estimate the actual ending account balance or expenses you paid for the period. You may use this information to compare the ongoing costs of investing in the Fund and other funds. To do so, compare this 5% hypothetical example with the 5% hypothetical examples that appear in the shareholder reports of other funds.
Please note that the expenses shown in the table are meant to highlight your ongoing costs only and do not reflect any transactional costs, such as brokerage commissions paid on purchases and sales of Fund shares. Therefore, the information under the heading “Hypothetical Performance (5% return before expenses)” is useful in comparing ongoing costs only, and will not help you determine the relative total costs of owning different funds. In addition, if these transactional costs were included, your costs would have been higher.
| | | | | | | | |
| | | Actual
Performance | | | Hypothetical
Performance
(5% return
before expenses) | |
| | | | | | | | |
Beginning Account Value | | | | | | | | |
October 1, 2011 | | $ | 1,000 .00 | | | $ | 1,000 .00 | |
Ending Account Value | | | | | | | | |
March 31, 2012 | | $ | 1,369 .00 | | | $ | 1,023 .20 | |
Expenses Paid During Period* | | $ | 2 .13 | | | $ | 1 .82 | |
| * | Expenses are equal to the Fund’s annualized expense ratio of 0.36% (representing the six month period annualized), multiplied by the average account value over the period, multiplied by 183/366 (to reflect the one-half year period). Effective November 3, 2011, the annualized expense ratio is 0.30%, as contractually agreed to by the adviser. May reflect amounts waived and/or reimbursed. Without any waivers and/or reimbursements, expenses would have been higher. |
| | | | |
| | 82 | | | Russell 2000 High Beta ETF |
Russell Exchange Traded Funds Trust
Russell 2000 High Beta ETF
Schedule of Investments — March 31, 2012
Amounts in thousands (except share amounts)
| | | | | | | | |
| | | Principal
Amount ($)
or Shares | | | Market
Value
$ | |
| | | | | | | | |
| Common Stocks - 99.8% | | | | | | | | |
| Consumer Discretionary - 5.3% | | | | | |
Aeropostale, Inc. (Æ) | | | 275 | | | | 6 | |
Blyth, Inc. | | | 56 | | | | 4 | |
Casella Waste Systems, Inc. Class A (Æ) | | | 201 | | | | 1 | |
Corinthian Colleges, Inc. (Æ) | | | 747 | | | | 3 | |
Crocs, Inc. (Æ) | | | 43 | | | | 1 | |
Dana Holding Corp. | | | 3,463 | | | | 53 | |
Dollar Thrifty Automotive Group, Inc. (Æ) | | | 469 | | | | 38 | |
G-III Apparel Group, Ltd. (Æ) | | | 136 | | | | 4 | |
Jones Group, Inc. (The) | | | 383 | | | | 5 | |
KB Home | | | 345 | | | | 3 | |
Meritor, Inc. (Æ) | | | 452 | | | | 4 | |
Movado Group, Inc. | | | 252 | | | | 6 | |
Perry Ellis International, Inc. (Æ) | | | 96 | | | | 2 | |
Ruby Tuesday, Inc. (Æ) | | | 1,449 | | | | 13 | |
Steven Madden, Ltd. (Æ) | | | 1,120 | | | | 48 | |
Stoneridge, Inc. (Æ) | | | 229 | | | | 2 | |
Tenneco, Inc. (Æ) | | | 423 | | | | 16 | |
Winnebago Industries, Inc. (Æ) | | | 3,867 | | | | 38 | |
| | | | | | | | |
| | | | | | | 247 | |
| | | | | | | | |
| | |
| Energy - 14.6% | | | | | | | | |
Alon USA Energy, Inc. | | | 768 | | | | 7 | |
Basic Energy Services, Inc. (Æ) | | | 1,700 | | | | 29 | |
Cloud Peak Energy, Inc. (Æ) | | | 1,029 | | | | 16 | |
CVR Energy, Inc. (Æ) | | | 1,281 | | | | 34 | |
Delek US Holdings, Inc. | | | 1,893 | | | | 29 | |
Dril-Quip, Inc. (Æ) | | | 1,247 | | | | 81 | |
Exterran Holdings, Inc. (Æ) | | | 326 | | | | 4 | |
Flotek Industries, Inc. (Æ) | | | 893 | | | | 11 | |
Global Geophysical Services, Inc. (Æ) | | | 2,154 | | | | 23 | |
GT Advanced Technologies, Inc. (Æ) | | | 435 | | | | 4 | |
Gulf Island Fabrication, Inc. | | | 29 | | | | 1 | |
Helix Energy Solutions Group, Inc. (Æ) | | | 3,407 | | | | 61 | |
Hornbeck Offshore Services, Inc. (Æ) | | | 1,509 | | | | 63 | |
ION Geophysical Corp. (Æ) | | | 266 | | | | 2 | |
Key Energy Services, Inc. (Æ) | | | 2,837 | | | | 44 | |
Mitcham Industries, Inc. (Æ) | | | 1,199 | | | | 27 | |
Newpark Resources, Inc. (Æ) | | | 11,390 | | �� | | 92 | |
OYO Geospace Corp. (Æ) | | | 150 | | | | 16 | |
Parker Drilling Co. (Æ) | | | 3,493 | | | | 21 | |
Patriot Coal Corp. (Æ) | | | 1,602 | | | | 10 | |
Tesco Corp. (Æ) | | | 187 | | | | 3 | |
Tetra Technologies, Inc. (Æ) | | | 1,971 | | | | 19 | |
Union Drilling, Inc. (Æ) | | | 281 | | | | 2 | |
Vantage Drilling Co. (Æ) | | | 1,297 | | | | 2 | |
Western Refining, Inc. | | | 843 | | | | 16 | |
Willbros Group, Inc. (Æ) | | | 15,473 | | | | 50 | |
World Fuel Services Corp. | | | 265 | | | | 11 | |
| | | | | | | | |
| | | | | | | 678 | |
| | | | | | | | |
| | |
| Financial Services - 5.8% | | | | | | | | |
Advent Software, Inc. (Æ) | | | 447 | | | | 11 | |
Apollo Investment Corp. | | | 1,505 | | | | 11 | |
Delphi Financial Group, Inc. Class A | | | 770 | | | | 34 | |
Encore Capital Group, Inc. (Æ) | | | 726 | | | | 16 | |
| | | | | | | | |
| | | Principal
Amount ($)
or Shares | | | Market
Value
$ | |
Fifth Street Finance Corp. | | | 618 | | | | 6 | |
FXCM, Inc. Class A | | | 138 | | | | 2 | |
Investment Technology Group, Inc. (Æ) | | | 2,769 | | | | 33 | |
Knight Capital Group, Inc. Class A (Æ) | | | 430 | | | | 6 | |
Medallion Financial Corp. | | | 2,470 | | | | 28 | |
New Mountain Finance Corp. | | | 1,587 | | | | 22 | |
PennantPark Investment Corp. | | | 1,228 | | | | 13 | |
SeaBright Holdings, Inc. | | | 524 | | | | 5 | |
Solar Capital, Ltd. | | | 1,630 | | | | 36 | |
SWS Group, Inc. (Æ) | | | 2,292 | | | | 13 | |
Walter Investment Management Corp. | | | 1,519 | | | | 34 | |
Webster Financial Corp. | | | 63 | | | | 1 | |
| | | | | | | | |
| | | | | | | 271 | |
| | | | | | | | |
| | |
| Health Care - 0.1% | | | | | | | | |
Transcept Pharmaceuticals, Inc. (Æ) | | | 342 | | | | 4 | |
| | | | | | | | |
| |
| Materials and Processing - 21.2% | | | | | |
Aceto Corp. | | | 915 | | | | 9 | |
Acuity Brands, Inc. | | | 1,011 | | | | 64 | |
Ampco-Pittsburgh Corp. | | | 1,581 | | | | 32 | |
Apogee Enterprises, Inc. | | | 2,186 | | | | 28 | |
Balchem Corp. | | | 71 | | | | 2 | |
Beacon Roofing Supply, Inc. (Æ) | | | 275 | | | | 7 | |
Belden, Inc. | | | 946 | | | | 36 | |
Century Aluminum Co. (Æ) | | | 2,602 | | | | 23 | |
Clarcor, Inc. | | | 974 | | | | 48 | |
Coeur d’Alene Mines Corp. (Æ) | | | 674 | | | | 16 | |
Ferro Corp. (Æ) | | | 3,591 | | | | 21 | |
Georgia Gulf Corp. (Æ) | | | 226 | | | | 8 | |
Gibraltar Industries, Inc. (Æ) | | | 769 | | | | 12 | |
Globe Specialty Metals, Inc. | | | 874 | | | | 13 | |
Gold Resource Corp. | | | 126 | | | | 3 | |
Golden Star Resources, Ltd. (Æ) | | | 2,964 | | | | 6 | |
Griffon Corp. | | | 1,306 | | | | 14 | |
Hecla Mining Co. | | | 141 | | | | 1 | |
Innospec, Inc. (Æ) | | | 576 | | | | 17 | |
Interline Brands, Inc. (Æ) | | | 10 | | | | — | ± |
Jaguar Mining, Inc. (Æ) | | | 1,314 | | | | 6 | |
Kaiser Aluminum Corp. | | | 1,173 | | | | 55 | |
Kaydon Corp. | | | 1,502 | | | | 38 | |
LB Foster Co. Class A | | | 584 | | | | 17 | |
Louisiana-Pacific Corp. (Æ) | | | 998 | | | | 9 | |
Mueller Industries, Inc. | | | 586 | | | | 27 | |
Mueller Water Products, Inc. Class A | | | 3,728 | | | | 12 | |
NCI Building Systems, Inc. (Æ) | | | 913 | | | | 11 | |
Olin Corp. | | | 1,627 | | | | 35 | |
Olympic Steel, Inc. | | | 637 | | | | 15 | |
OM Group, Inc. (Æ) | | | 1,166 | | | | 32 | |
Paramount Gold and Silver Corp. (Æ) | | | 732 | | | | 2 | |
PolyOne Corp. | | | 993 | | | | 14 | |
Quanex Building Products Corp. | | | 754 | | | | 13 | |
RBC Bearings, Inc. (Æ) | | | 576 | | | | 27 | |
RTI International Metals, Inc. (Æ) | | | 434 | | | | 10 | |
Simpson Manufacturing Co., Inc. | | | 1,176 | | | | 38 | |
Texas Industries, Inc. | | | 788 | | | | 28 | |
Thompson Creek Metals Co., Inc. - ADR (Æ) | | | 13,578 | | | | 92 | |
| | |
| Russell 2000 High Beta ETF | | 83 |
Russell Exchange Traded Funds Trust
Russell 2000 High Beta ETF
Schedule of Investments, continued — March 31, 2012
Amounts in thousands (except share amounts)
| | | | | | | | |
| | | Principal
Amount ($)
or Shares | | | Market
Value
$ | |
| | | | | | | | |
TMS International Corp. Class A (Æ) | | | 1,360 | | | | 16 | |
Universal Forest Products, Inc. | | | 240 | | | | 8 | |
Universal Stainless & Alloy (Æ) | | | 782 | | | | 33 | |
USG Corp. (Æ) | | | 3,472 | | | | 60 | |
Worthington Industries, Inc. | | | 1,354 | | | | 26 | |
| | | | | | | | |
| | | | | | | 984 | |
| | | | | | | | |
| |
| Producer Durables - 35.0% | | | | | |
Actuant Corp. Class A | | | 3,225 | | | | 94 | |
Aegion Corp. Class A (Æ) | | | 728 | | | | 13 | |
Aircastle, Ltd. | | | 6,834 | | | | 85 | |
Alaska Air Group, Inc. (Æ) | | | 1,104 | | | | 40 | |
Albany International Corp. Class A | | | 2,254 | | | | 52 | |
AM Castle & Co. (Æ) | | | 793 | | | | 10 | |
AO Smith Corp. | | | 544 | | | | 24 | |
Arkansas Best Corp. | | | 1,168 | | | | 22 | |
Badger Meter, Inc. | | | 268 | | | | 9 | |
Barnes Group, Inc. | | | 2,091 | | | | 55 | |
Briggs & Stratton Corp. | | | 3,273 | | | | 59 | |
Bristow Group, Inc. | | | 251 | | | | 12 | |
Chart Industries, Inc. (Æ) | | | 780 | | | | 57 | |
Colfax Corp. (Æ) | | | 577 | | | | 20 | |
Commercial Vehicle Group, Inc. (Æ) | | | 620 | | | | 8 | |
Douglas Dynamics, Inc. | | | 394 | | | | 5 | |
DXP Enterprises, Inc. (Æ) | | | 193 | | | | 8 | |
Dycom Industries, Inc. (Æ) | | | 87 | | | | 2 | |
EMCOR Group, Inc. | | | 48 | | | | 1 | |
EnerSys (Æ) | | | 1,213 | | | | 42 | |
EnPro Industries, Inc. (Æ) | | | 2,370 | | | | 98 | |
ESCO Technologies, Inc. | | | 2,261 | | | | 83 | |
Franklin Electric Co., Inc. | | | 216 | | | | 11 | |
Genesee & Wyoming, Inc. Class A (Æ) | | | 576 | | | | 31 | |
Geo Group, Inc. (The) (Æ) | | | 2,511 | | | | 48 | |
Great Lakes Dredge & Dock Corp. | | | 1,238 | | | | 9 | |
Greenbrier Cos., Inc. (Æ) | | | 932 | | | | 18 | |
Gulfmark Offshore, Inc. Class A (Æ) | | | 522 | | | | 24 | |
JetBlue Airways Corp. (Æ) | | | 7,628 | | | | 37 | |
MasTec, Inc. (Æ) | | | 571 | | | | 10 | |
Middleby Corp. (Æ) | | | 246 | | | | 25 | |
Mistras Group, Inc. (Æ) | | | 993 | | | | 24 | |
Modine Manufacturing Co. (Æ) | | | 1,598 | | | | 14 | |
Old Dominion Freight Line, Inc. (Æ) | | | 832 | | | | 40 | |
OSI Systems, Inc. (Æ) | | | 615 | | | | 38 | |
Roadrunner Transportation Systems, Inc. (Æ) | | | 940 | | | | 16 | |
Robbins & Myers, Inc. | | | 1,386 | | | | 72 | |
RSC Holdings, Inc. (Æ) | | | 922 | | | | 21 | |
Rush Enterprises, Inc. Class A (Æ) | | | 229 | | | | 5 | |
Saia, Inc. (Æ) | | | 231 | | | | 4 | |
Standex International Corp. | | | 218 | | | | 9 | |
Swift Transportation Co. Class A (Æ) | | | 2,725 | | | | 31 | |
Titan International, Inc. | | | 643 | | | | 15 | |
Titan Machinery, Inc. (Æ) | | | 1,993 | | | | 56 | |
Tutor Perini Corp. (Æ) | | | 2,747 | | | | 43 | |
Twin Disc, Inc. | | | 325 | | | | 8 | |
United Rentals, Inc. (Æ) | | | 1,467 | | | | 63 | |
Wabash National Corp. (Æ) | | | 3,132 | | | | 32 | |
| | | | | | | | |
| | | Principal
Amount ($)
or Shares | | | Market
Value
$ | |
Watts Water Technologies, Inc. Class A | | | 2,043 | | | | 84 | |
Woodward, Inc. | | | 896 | | | | 38 | |
| | | | | | | | |
| | | | | | | 1,625 | |
| | | | | | | | |
| | |
| Technology - 17.3% | | | | | | | | |
Acacia Research Corp. (Æ) | | | 75 | | | | 3 | |
Anadigics, Inc. (Æ) | | | 7,137 | | | | 17 | |
Anixter International, Inc. (Æ) | | | 220 | | | | 16 | |
Applied Micro Circuits Corp. (Æ) | | | 1,215 | | | | 8 | |
Aruba Networks, Inc. (Æ) | | | 683 | | | | 15 | |
AXT, Inc. (Æ) | | | 3,220 | | | | 20 | |
Cavium, Inc. (Æ) | | | 1,525 | | | | 47 | |
Ceva, Inc. (Æ) | | | 127 | | | | 3 | |
Checkpoint Systems, Inc. (Æ) | | | 544 | | | | 6 | |
CIBER, Inc. (Æ) | | | 244 | | | | 1 | |
CommVault Systems, Inc. (Æ) | | | 54 | | | | 3 | |
DSP Group, Inc. (Æ) | | | 3,448 | | | | 23 | |
Entegris, Inc. (Æ) | | | 5,470 | | | | 51 | |
Exar Corp. (Æ) | | | 691 | | | | 6 | |
FSI International, Inc. (Æ) | | | 1,051 | | | | 5 | |
Hittite Microwave Corp. (Æ) | | | 1,374 | | | | 76 | |
Inphi Corp. (Æ) | | | 311 | | | | 4 | |
Intevac, Inc. (Æ) | | | 206 | | | | 2 | |
iRobot Corp. (Æ) | | | 2,728 | | | | 75 | |
Kenexa Corp. (Æ) | | | 89 | | | | 3 | |
Kulicke & Soffa Industries, Inc. (Æ) | | | 1,221 | | | | 15 | |
Monolithic Power Systems, Inc. (Æ) | | | 294 | | | | 6 | |
NetSuite, Inc. (Æ) | | | 184 | | | | 9 | |
OCZ Technology Group, Inc. (Æ) | | | 866 | | | | 6 | |
Omnivision Technologies, Inc. (Æ) | | | 2,339 | | | | 47 | |
Photronics, Inc. (Æ) | | | 2,293 | | | | 15 | |
QLIK Technologies, Inc. (Æ) | | | 476 | | | | 15 | |
Rambus, Inc. (Æ) | | | 1,174 | | | | 8 | |
RealPage, Inc. (Æ) | | | 427 | | | | 8 | |
RF Micro Devices, Inc. (Æ) | | | 2,011 | | | | 10 | |
Semtech Corp. (Æ) | | | 3,005 | | | | 86 | |
Silicon Image, Inc. (Æ) | | | 1,932 | | | | 11 | |
Standard Microsystems Corp. (Æ) | | | 66 | | | | 2 | |
Supertex, Inc. (Æ) | | | 53 | | | | 1 | |
Taleo Corp. Class A (Æ) | | | 662 | | | | 30 | |
TeleCommunication Systems, Inc. Class A (Æ) | | | 908 | | | | 3 | |
Tessera Technologies, Inc. | | | 2,829 | | | | 49 | |
TriQuint Semiconductor, Inc. (Æ) | | | 2,378 | | | | 16 | |
TTM Technologies, Inc. (Æ) | | | 766 | | | | 9 | |
Ultra Clean Holdings (Æ) | | | 4,696 | | | | 35 | |
Unisys Corp. (Æ) | | | 510 | | | | 10 | |
Universal Display Corp. (Æ) | | | 198 | | | | 7 | |
VirnetX Holding Corp. (Æ) | | | 932 | | | | 22 | |
| | | | | | | | |
| | | | | | | 804 | |
| | | | | | | | |
| | |
| Utilities - 0.5% | | | | | | | | |
Central Vermont Public Service Corp. | | | 687 | | | | 24 | |
| | | | | | | | |
| | |
Total Common Stocks
(cost $4,788) | | | | | | | 4,637 | |
| | | | | | | | |
| | | | |
| | 84 | | | Russell 2000 High Beta ETF |
Russell Exchange Traded Funds Trust
Russell 2000 High Beta ETF
Schedule of Investments, continued — March 31, 2012
Amounts in thousands (except share amounts)
| | | | | | | | |
| | | Principal
Amount ($)
or Shares | | | Market
Value
$ | |
| | | | | | | | |
| Short-Term Investments - 0.5% | | | | | |
Russell U.S. Cash Management Fund | | | 20,800 | (¥) | | | 21 | |
| | | | | | | | |
| | |
Total Short-Term Investments
(cost $21) | | | | | | | 21 | |
| | | | | | | | |
| | |
Total Investments - 100.3%
(identified cost $4,809) | | | | | | | 4,658 | |
| | |
Other Assets and Liabilities,
Net - (0.3%) | | | | | | | (12 | ) |
| | | | | | | | |
| | |
| Net Assets - 100.0% | | | | | | | 4,646 | |
| | | | | | | | |
See accompanying notes which are an integral part of the financial statements.
| | |
| Russell 2000 High Beta ETF | | 85 |
Russell Exchange Traded Funds Trust
Russell 2000 High Beta ETF
Presentation of Portfolio Holdings — March 31, 2012
Amounts in thousands
| | | | | | | | | | | | | | | | | | | | |
| | | Market Value | | | % of Net
Assets | |
| Portfolio Summary | | Level 1 | | | Level 2 | | | Level 3 | | | Total | | |
| | | | | | | | | | | | | | | | | | | | |
Common Stocks | | | | | | | | | | | | | | | | | | | | |
Consumer Discretionary | | $ | 247 | | | $ | — | | | $ | — | | | $ | 247 | | | | 5 .3 | |
Energy | | | 678 | | | | — | | | | — | | | | 678 | | | | 14.6 | |
Financial Services | | | 271 | | | | — | | | | — | | | | 271 | | | | 5 .8 | |
Health Care | | | 4 | | | | — | | | | — | | | | 4 | | | | 0 .1 | |
Materials and Processing | | | 984 | | | | — | | | | — | | | | 984 | | | | 21 .2 | |
Producer Durables | | | 1,625 | | | | — | | | | — | | | | 1,625 | | | | 35 .0 | |
Technology | | | 804 | | | | — | | | | — | | | | 804 | | | | 17 .3 | |
Utilities | | | 24 | | | | — | | | | — | | | | 24 | | | | 0 .5 | |
Short-Term Investments | | | — | | | | 21 | | | | — | | | | 21 | | | | 0 .5 | |
| | | | | | | | | | | | | | | | | | | | |
| | | | | |
Total Investments | | | 4,637 | | | | 21 | | | | — | | | | 4,658 | | | | 100.3 | |
| | | | | | | | | | | | | | | | | | | | |
Other Assets and Liabilities, Net | | | | | | | | | | | | | | | | | | | (0 .3 | ) |
| | | | | | | | | | | | | | | | | | | | |
| | | | | |
| | | | | | | | | | | | | | | | | | | 100.0 | |
| | | | | | | | | | | | | | | | | | | | |
For a description of the levels see note 2 in the Notes to Financial Statements.
There were no significant transfers in and out of levels 1, 2 and 3 during the period ending March 31, 2012.
See accompanying notes which are an integral part of the financial statements.
| | | | |
| | 86 | | | Russell 2000 High Beta ETF |
Russell Exchange Traded Funds Trust
Russell 2000 High Beta ETF
Statement of Assets and Liabilities — March 31, 2012
| | | | |
| Amounts in thousands | | Russell 2000 High Beta ETF | |
| | | | |
Assets | | | | |
Investments, at identified cost | | $ | 4,809 | |
Investments, at market* | | | 4,658 | |
Receivables: | | | | |
Dividends | | | 4 | |
Investments sold | | | 568 | |
| | | | |
Total assets | | | 5,230 | |
| | | | |
| |
Liabilities | | | | |
Payables: | | | | |
Investments purchased | | | 583 | |
Accrued fees to affiliates | | | 1 | |
| | | | |
Total liabilities | | | 584 | |
| | | | |
| | | | |
Net Assets | | $ | 4,646 | |
| | | | |
Net Assets Consist of: | | | | |
Undistributed (overdistributed) net investment income | | $ | 17 | |
Accumulated net realized gain (loss) | | | (716 | ) |
Unrealized appreciation (depreciation) on investments | | | (151 | ) |
Additional paid-in capital | | | 5,496 | |
| | | | |
Net Assets | | $ | 4,646 | |
| | | | |
Net Asset Value, offering and redemption price per share: | | | | |
Net asset value per share:(a) | | $ | 46.46 | |
Net assets | | $ | 4,645,669 | |
Shares outstanding ($.001 par value) | | | 100,002 | |
Amounts in thousands | | | | |
| | | | |
* Investments in Affiliates, Russell U.S. Cash Management Fund | | $ | 21 | |
| (a) | Net asset value per share equals net assets divided by shares outstanding. |
See accompanying notes which are an integral part of the financial statements.
| | |
| Statement of Assets and Liabilities | | 87 |
Russell Exchange Traded Funds Trust
Russell 2000 High Beta ETF
Statement of Operations — For the Period Ended March 31, 2012
| | | | |
| Amounts in thousands | | Russell 2000
High Beta ETF* | |
| | | | |
Investment Income | | | | |
Dividends | | $ | 48 | |
| | | | |
Total investment income | | | 48 | |
| | | | |
| |
Expenses | | | | |
Management fees | | | 28 | |
Trustee and trustee related fees | | | 14 | |
| | | | |
Expenses before reductions | | | 42 | |
Expense reductions | | | (21 | ) |
| | | | |
Net expenses | | | 21 | |
| | | | |
Net investment income (loss) | | | 27 | |
| | | | |
| |
Net Realized and Unrealized Gain (Loss) | | | | |
Net realized gain (loss) on: | | | | |
Investments | | | (762 | ) |
In-kind redemptions | | | 333 | |
| | | | |
Net realized gain (loss) | | | (429 | ) |
Net change in unrealized appreciation (depreciation) on investments | | | (151 | ) |
| | | | |
Net realized and unrealized gain (loss) | | | (580 | ) |
| | | | |
Net Increase (Decrease) in Net Assets from Operations | | $ | (553 | ) |
| | | | |
| * | For the period May 26, 2011 (commencement of operations) to March 31, 2012. |
See accompanying notes which are an integral part of the financial statements.
| | | | |
| | 88 | | | Statement of Operations |
Russell Exchange Traded Funds Trust
Russell 2000 High Beta ETF
Statement of Changes in Net Assets — For the Period Ended March 31,
| | | | |
| | | Russell 2000
High Beta ETF | |
| Amounts in thousands | | 2012* | |
| | | | |
Increase (Decrease) in Net Assets | | | | |
| |
Operations | | | | |
Net investment income (loss) | | $ | 27 | |
Net realized gain (loss) | | | (429 | ) |
Net change in unrealized appreciation (depreciation) | | | (151 | ) |
| | | | |
Net increase (decrease) in net assets from operations | | | (553 | ) |
| | | | |
| |
Distributions | | | | |
From net investment income | | | (9 | ) |
| | | | |
Net decrease in net assets from distributions | | | (9 | ) |
| | | | |
| |
Share Transactions | | | | |
Net increase (decrease) in net assets from share transactions | | | 5,208 | |
| | | | |
Total Net Increase (Decrease) in Net Assets | | | 4,646 | |
| |
Net Assets | | | | |
Beginning of period | | | — | |
| | | | |
End of period | | $ | 4,646 | |
| | | | |
Undistributed (overdistributed) net investment income included in net assets | | $ | 17 | |
| * | For the period May 26, 2011 (commencement of operations) to March 31, 2012. |
See accompanying notes which are an integral part of the financial statements.
| | |
| Statement of Changes in Net Assets | | 89 |
Russell Exchange Traded Funds Trust
Russell 2000 High Beta ETF
Financial Highlights — For the Period Ended
For a Share Outstanding Throughout Each Period.
| | | | | | | | | | | | | | | | | | | | | | | | |
| | |
$
Net Asset Value,
Beginning of
Period | | | $
Net
Investment
Income (Loss)(a)(e) | | | $
Net Realized
and Unrealized
Gain (Loss) | | | $
Total from
Investment
Operations | | | $
Distributions
from Net
Investment Income | | | $
Total
Distributions | |
Russell 2000 High Beta ETF | | | | | | | | | | | | | | | | | | | | | | | | |
March 31, 2012* | | | 49.51 | | | | .25 | | | | (3.20 | ) | | | (2.95 | ) | | | (.10 | ) | | | (.10 | ) |
| (a) | Average daily shares outstanding were used for this calculation. |
| (b) | Periods less than one year are not annualized. |
| (c) | The ratios for periods less than one year are annualized. |
| (d) | Portfolio turnover rate excludes securities received or delivered from in-kind creation or redemption units. |
| (e) | Reflects amounts waived by Russell Investment Management Company (“RIMCo”). |
| * | For the period May 26, 2011 (commencement of operations) to March 31, 2012. |
See accompanying notes which are an integral part of the financial statements.
| | | | | | | | | | | | | | | | | | | | | | | | | | |
$
Net Asset Value,
End of
Period | | | %
Total
Return(b) | | | $
Net Assets,
End of Period
(000) | | | %
Ratio of Expenses
to Average
Net Assets,
Gross(c) | | | %
Ratio of Expenses
to Average
Net Assets,
Net(c)(e) | | | %
Ratio of Net
Investment Income
to Average
Net Assets(c)(e) | | | %
Portfolio
Turnover Rate(b)(d) | |
| | | | | | | | | | | | | | | | | | | | | | | | | | |
| | 46.46 | | | | (5.95 | ) | | | 4,646 | | | | 1.05 | | | | .52 | | | | .68 | | | | 126 | |
See accompanying notes which are an integral part of the financial statements.
Russell Exchange Traded Funds Trust
Russell 2000 Low Volatility ETF
Portfolio Management Discussion and Analysis — March 31, 2012 (Unaudited)
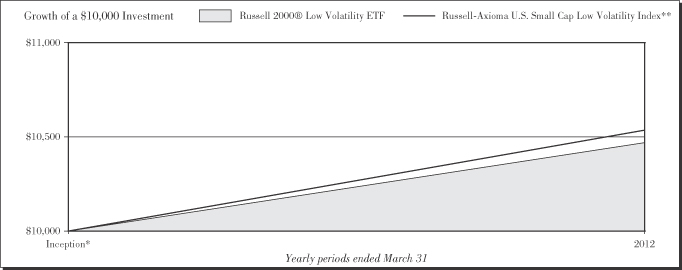
Performance as of March 31, 2012
| | | | | | | | | | | | |
|
| Average Annual Total Return | |
| | | Net Asset
Value | | | Market Value | | | Russell-Axioma
U.S. Small Cap
Low Volatility
Index** | |
Inception* | | | 4.69 | % | | | 4.74 | % | | | 5.36 | % |
| | | | |
| | 92 | | | Russell 2000 Low Volatility ETF |
Russell Exchange Traded Funds Trust
Russell 2000® Low Volatility ETF
Portfolio Management Discussion and Analysis — March 31, 2012 (Unaudited)
The Russell 2000® Low Volatility ETF (the “Fund”) is an index-based exchange-traded fund that seeks investment results that closely correspond to the total return of the Russell-Axioma U.S. Small Cap Low Volatility Index (the “Index”). Russell Investment Management Company (“RIMCo”), as the Fund’s advisor, uses a “passive” or indexing approach to try to achieve the Fund’s investment objective. Unlike many investment companies, the Fund does not try to “beat” the Index it tracks and does not seek temporary defensive positions when markets decline or appear overvalued. The Fund seeks to gain exposure to the factor exhibited in its Index. The Fund will normally invest at least 80% of its total assets in securities that comprise the Index.
What is the Fund’s investment objective?
The Fund seeks investment results that closely correspond to the total return of the Russell–Axioma U.S. Small Cap Low Volatility Index, which is designed to deliver exposure to stocks with low volatility as determined by a screening and ranking methodology applied to the output of the Axioma U.S. Equity Medium Horizon Fundamental Factor Risk model.
Is the Fund replicating or sampling?
The Fund is replicating.
How did the Fund perform relative to its benchmark for the fiscal year ended March 31, 2012?
For the fiscal year ended March 31, 2012, the Fund gained 4.69%. This is compared to the Fund’s benchmark, the Russell-Axioma U.S. Small Cap Low Volatility Index, which gained 5.36% during the same period. The Fund’s performance includes operating expenses, whereas indexes are unmanaged and index returns do not include expenses of any kind.
There were no significant changes to either the Fund or Index during the reporting period.
Did the Fund outperform or underperform the benchmark or was performance as expected based on expenses, etc.?
The Fund performed as expected against the benchmark.
Over the reporting period, please describe those sectors that outperformed or underperformed.
Sectors achieved both positive and negative returns for the Fund and the Index. Consumer staples was the best performing sector for the Fund and the Index, while energy was the worst performing sector. Utilities, with an average weight of 20.5% was the best contributor to Fund and Index returns. Energy, with an average weight of 0.6%, was the worst contributor to Fund and Index returns.
Over the reporting period, please describe those individual securities (constituents) that outperformed or underperformed.
Sunstone Hotel Investors Inc, Pool Corp, and CH Energy Group Inc (Holding Co) generated positive returns and contributed the most to Fund performance while Willbros Group Inc, Black Box Corp, and Ashford Hospitality Trust, all declined which detracted from Fund performance.
The views expressed in this report reflect those of the portfolio managers only through the end of the period covered by the report. These views do not necessarily represent the views of RIMCo, or any other person in RIMCo or any other affiliated organization. These views are subject to change at any time based upon market conditions or other events, and RIMCo disclaims any responsibility to update the views contained herein. These views should not be relied on as investment advice and, because investment decisions for a Russell Exchange Traded Funds Trust (“RET”) Fund are based on numerous factors, should not be relied on as an indication of investment decisions of any RET Fund.
| * | | Commenced operations by issuing shares May 26, 2011. |
| ** | | The Russell-Axioma U.S. Small Cap Low Volatility Index is designed to deliver exposure to stocks with low volatility as determined by a screening and ranking methodology applied to the output of the Axioma U.S. Equity Medium Horizon Fundamental Factor Risk model. Volatility is a measure of a stock’s variability in total returns based on its historical behavior over the last sixty days. Stocks exhibiting high or low volatility can be used by investors to adjust volatility exposure in a portfolio. |
Performance is historical and assumes reinvestment of all dividends and capital gains. Investment return and principal value will fluctuate so that an investor’s shares, when redeemed, may be worth more or less than when purchased. Past performance is not indicative of future results. The returns shown do not reflect the deduction of taxes that a shareholder would pay on Fund distributions or the redemption of Fund shares.
| | |
| Russell 2000® Low Volatility ETF | | 93 |
Russell Exchange Traded Funds Trust
Russell 2000 Low Volatility ETF
Shareholder Expense Example — March 31, 2012 (Unaudited)
Fund Expenses
The following disclosure provides important information regarding each Fund’s Expense Example, which appears on each Fund’s individual page in this Annual Report. Please refer to this information when reviewing the Expense Example for a Fund.
Example
As a shareholder of the Fund, you incur two types of costs: (1) transaction costs, including brokerage commissions on purchases and sales of your Fund shares and (2) ongoing costs, including management fees and other Fund expenses. The Example is intended to help you understand your ongoing costs (in dollars) of investing in the Fund and to compare these costs with the ongoing costs of investing in other funds. The Example is based on an investment of $1,000 invested at the beginning of the period and held for the entire period indicated, which for this Fund is from October 1, 2011 to March 31, 2012.
Actual Expenses
The information in the table under the heading “Actual Performance” provides information about actual account values and actual expenses. You may use the information in this column, together with the amount you invested, to estimate the expenses that you paid over the period. Simply divide your account value by $1,000 (for example, an $8,600 account value divided by $1,000 = 8.6), then multiply the result by the number in the first column in the row entitled “Expenses Paid During Period” to estimate the expenses you paid on your account during this period.
Hypothetical Example for Comparison Purposes
The information in the table under the heading “Hypothetical Performance (5% return before expenses)” provides information about hypothetical account values and hypothetical expenses based on the Fund’s actual expense ratio and an assumed rate of return of 5% per year before expenses, which is not the Fund’s actual return. The hypothetical account values and expenses may not be used to estimate the actual ending account balance or expenses you paid for the period. You may use this information to compare the ongoing costs of investing in the Fund and other funds. To do so, compare this 5% hypothetical example with the 5% hypothetical examples that appear in the shareholder reports of other funds.
Please note that the expenses shown in the table are meant to highlight your ongoing costs only and do not reflect any transactional costs, such as brokerage commissions paid on purchases and sales of Fund shares. Therefore, the information under the heading “Hypothetical Performance (5% return before expenses)” is useful in comparing ongoing costs only, and will not help you determine the relative total costs of owning different funds. In addition, if these transactional costs were included, your costs would have been higher.
| | | | | | | | |
| | | Actual
Performance | | | Hypothetical
Performance
(5% return
before expenses) | |
| | | | | | | | |
Beginning Account Value | | | | | | | | |
October 1, 2011 | | $ | 1,000.00 | | | $ | 1,000.00 | |
Ending Account Value | | | | | | | | |
March 31, 2012 | | $ | 1,228.30 | | | $ | 1,023.20 | |
Expenses Paid During Period* | | $ | 2.01 | | | $ | 1.82 | |
| * | Expenses are equal to the Fund’s annualized expense ratio of 0.36% (representing the six month period annualized), multiplied by the average account value over the period, multiplied by 183/366 (to reflect the one-half year period). Effective November 3, 2011, the annualized expense ratio is 0.30%, as contractually agreed to by the adviser. May reflect amounts waived and/or reimbursed. Without any waivers and/or reimbursements, expenses would have been higher. |
| | | | |
| | 94 | | | Russell 2000 Low Volatility ETF |
Russell Exchange Traded Funds Trust
Russell 2000 Low Volatility ETF
Schedule of Investments — March 31, 2012
Amounts in thousands (except share amounts)
| | | | | | | | |
| | | Principal
Amount ($)
or Shares | | | Market
Value
$ | |
| | | | | | | | |
| Common Stocks - 97.8% | | | | | |
| Consumer Discretionary - 9.1% | | | | | |
Belo Corp. Class A | | | 1,493 | | | | 11 | |
Carter’s, Inc. (Æ) | | | 1,057 | | | | 53 | |
CEC Entertainment, Inc. | | | 24 | | | | 1 | |
Central European Media Enterprises, Ltd. Class A (Æ) | | | 4,424 | | | | 31 | |
Charming Shoppes, Inc. (Æ) | | | 330 | | | | 2 | |
Dana Holding Corp. | | | 1,007 | | | | 16 | |
Destination Maternity Corp. | | | 939 | | | | 17 | |
Exide Technologies (Æ) | | | 1,484 | | | | 5 | |
Gaylord Entertainment Co. (Æ) | | | 2,447 | | | | 75 | |
Gerber Scientific, Inc. (Æ)(Å) | | | 245 | | | | — | ± |
Harris Teeter Supermarkets, Inc. | | | 866 | | | | 35 | |
Jack in the Box, Inc. (Æ) | | | 109 | | | | 3 | |
Jones Group, Inc. (The) | | | 173 | | | | 2 | |
La-Z-Boy, Inc. (Æ) | | | 1,852 | | | | 28 | |
Matthews International Corp. Class A | | | 129 | | | | 4 | |
Meritor, Inc. (Æ) | | | 450 | | | | 4 | |
Pool Corp. | | | 2,664 | | | | 99 | |
Sinclair Broadcast Group, Inc. Class A | | | 150 | | | | 2 | |
Sotheby’s Class A | | | 367 | | | | 14 | |
Stoneridge, Inc. (Æ) | | | 2,749 | | | | 27 | |
Warnaco Group, Inc. (The) (Æ) | | | 85 | | | | 5 | |
Wolverine World Wide, Inc. | | | 760 | | | | 28 | |
| | | | | | | | |
| | | | | | | 462 | |
| | | | | | | | |
| |
| Consumer Staples - 5.0% | | | | | |
Boston Beer Co., Inc. Class A (Æ) | | | 50 | | | | 5 | |
Cal-Maine Foods, Inc. | | | 1,301 | | | | 50 | |
Casey’s General Stores, Inc. | | | 531 | | | | 29 | |
Hain Celestial Group, Inc. (The) (Æ) | | | 636 | | | | 28 | |
Lancaster Colony Corp. | | | 528 | | | | 35 | |
Snyders-Lance, Inc. | | | 109 | | | | 3 | |
Tootsie Roll Industries, Inc. | | | 32 | | | | 1 | |
Universal Corp. | | | 464 | | | | 22 | |
Vector Group, Ltd. | | | 4,098 | | | | 72 | |
Weis Markets, Inc. | | | 232 | | | | 10 | |
| | | | | | | | |
| | | | | | | 255 | |
| | | | | | | | |
| | |
| Energy - 0.3% | | | | | | | | |
Gulfport Energy Corp. (Æ) | | | 175 | | | | 5 | |
Petroleum Development Corp. (Æ) | | | 36 | | | | 1 | |
Triangle Petroleum Corp. (Æ) | | | 1,247 | | | | 9 | |
Willbros Group, Inc. (Æ) | | | 375 | | | | 1 | |
| | | | | | | | |
| | | | | | | 16 | |
| | | | | | | | |
| |
| Financial Services - 31.3% | | | | | |
Apollo Commercial Real Estate Finance, Inc. (ö) | | | 305 | | | | 5 | |
ARMOUR Residential REIT, Inc. (ö) | | | 14,090 | | | | 96 | |
Ashford Hospitality Trust, Inc. (ö) | | | 4,609 | | | | 42 | |
BioMed Realty Trust, Inc. (ö) | | | 2,846 | | | | 54 | |
BofI Holding, Inc. (Æ) | | | 1,582 | | | | 27 | |
Capstead Mortgage Corp. (ö) | | | 117 | | | | 2 | |
Cash America International, Inc. | | | 1,050 | | | | 50 | |
| | | | | | | | |
| | | Principal
Amount ($)
or Shares | | | Market
Value
$ | |
Cohen & Steers, Inc. | | | 2,534 | | | | 81 | |
Colony Financial, Inc. (ö) | | | 1,569 | | | | 26 | |
Delphi Financial Group, Inc. Class A | | | 2,302 | | | | 104 | |
DiamondRock Hospitality Co. (ö) | | | 1,935 | | | | 20 | |
Dynex Capital, Inc. (ö) | | | 360 | | | | 3 | |
Euronet Worldwide, Inc. (Æ) | | | 473 | | | | 10 | |
FelCor Lodging Trust, Inc. (Æ)(ö) | | | 9,277 | | | | 33 | |
First Financial Bancorp | | | 1,871 | | | | 32 | |
First Industrial Realty Trust, Inc. (Æ)(ö) | | | 328 | | | | 4 | |
Franklin Financial Corp. (Æ) | | | 974 | | | | 13 | |
Glimcher Realty Trust (ö) | | | 1,524 | | | | 16 | |
Harleysville Group, Inc. | | | 1,128 | | | | 65 | |
Healthcare Realty Trust, Inc. (ö) | | | 634 | | | | 14 | |
Jack Henry & Associates, Inc. | | | 2,012 | | | | 69 | |
LaSalle Hotel Properties (ö) | | | 900 | | | | 25 | |
Medical Properties Trust, Inc. (ö) | | | 697 | | | | 6 | |
Navigators Group, Inc. (The) (Æ) | | | 606 | | | | 29 | |
Parkway Properties, Inc. (ö) | | | 4,127 | | | | 43 | |
Pebblebrook Hotel Trust (ö) | | | 2,646 | | | | 60 | |
PennantPark Investment Corp. | | | 1,489 | | | | 15 | |
Pennsylvania Real Estate Investment Trust (ö) | | | 3,348 | | | | 51 | |
PennyMac Mortgage Investment Trust (ö) | | | 2,295 | | | | 43 | |
Platinum Underwriters Holdings, Ltd. | | | 3 | | | | — | ± |
Post Properties, Inc. (ö) | | | 470 | | | | 22 | |
ProAssurance Corp. | | | 544 | | | | 48 | |
Prospect Capital Corp. | | | 1,076 | | | | 12 | |
Prosperity Bancshares, Inc. | | | 43 | | | | 2 | |
PS Business Parks, Inc. (ö) | | | 279 | | | | 18 | |
Resource Capital Corp. (ö) | | | 9,355 | | | | 50 | |
Retail Opportunity Investments Corp. (ö) | | | 3,761 | | | | 45 | |
RLI Corp. | | | 873 | | | | 63 | |
Starwood Property Trust, Inc. (ö) | | | 3,044 | | | | 64 | |
Strategic Hotels & Resorts, Inc. (Æ)(ö) | | | 5,366 | | | | 35 | |
Sunstone Hotel Investors, Inc. (Æ)(ö) | | | 7,954 | | | | 77 | |
SVB Financial Group (Æ) | | | 1,529 | | | | 99 | |
Universal Health Realty Income Trust (ö) | | | 35 | | | | 1 | |
Wright Express Corp. (Æ) | | | 393 | | | | 25 | |
| | | | | | | | |
| | | | | | | 1,599 | |
| | | | | | | | |
| | |
| Health Care - 8.6% | | | | | | | | |
Abaxis, Inc. (Æ) | | | 56 | | | | 2 | |
Amsurg Corp. Class A (Æ) | | | 743 | | | | 21 | |
Analogic Corp. | | | 60 | | | | 4 | |
Cepheid, Inc. (Æ) | | | 1,044 | | | | 44 | |
Chemed Corp. | | | 401 | | | | 25 | |
CONMED Corp. | | | 2,666 | | | | 79 | |
Exact Sciences Corp. (Æ) | | | 270 | | | | 3 | |
Greatbatch, Inc. (Æ) | | | 355 | | | | 9 | |
Haemonetics Corp. (Æ) | | | 446 | | | | 31 | |
HealthSouth Corp. (Æ) | | | 276 | | | | 6 | |
Integra LifeSciences Holdings Corp. (Æ) | | | 373 | | | | 13 | |
Invacare Corp. | | | 132 | | | | 2 | |
ISTA Pharmaceuticals, Inc. (Æ) | | | 175 | | | | 2 | |
Magellan Health Services, Inc. (Æ) | | | 912 | | | | 44 | |
Owens & Minor, Inc. | | | 2,235 | | | | 67 | |
Savient Pharmaceuticals, Inc. (Æ) | | | 4,984 | | | | 11 | |
| | |
| Russell 2000 Low Volatility ETF | | 95 |
Russell Exchange Traded Funds Trust
Russell 2000 Low Volatility ETF
Schedule of Investments, continued — March 31, 2012
Amounts in thousands (except share amounts)
| | | | | | | | |
| | | Principal
Amount ($)
or Shares | | | Market
Value
$ | |
| | | | | | | | |
STERIS Corp. | | | 189 | | | | 6 | |
Sunrise Senior Living, Inc. (Æ) | | | 5,039 | | | | 32 | |
West Pharmaceutical Services, Inc. | | | 803 | | | | 34 | |
| | | | | | | | |
| | | | | | | 435 | |
| | | | | | | | |
| |
| Materials and Processing - 7.4% | | | | | |
Acuity Brands, Inc. | | | 1,481 | | | | 93 | |
AMCOL International Corp. | | | 339 | | | | 10 | |
Boise, Inc. | | | 3,589 | | | | 29 | |
Century Aluminum Co. (Æ) | | | 1,420 | | | | 13 | |
HB Fuller Co. | | | 117 | | | | 4 | |
Innospec, Inc. (Æ) | | | 1,158 | | | | 35 | |
Kaydon Corp. | | | 707 | | | | 18 | |
Koppers Holdings, Inc. | | | 589 | | | | 23 | |
Minerals Technologies, Inc. | | | 484 | | | | 32 | |
NewMarket Corp. | | | 460 | | | | 86 | |
Olin Corp. | | | 51 | | | | 1 | |
Sensient Technologies Corp. | | | 84 | | | | 3 | |
Watsco, Inc. | | | 284 | | | | 21 | |
Worthington Industries, Inc. | | | 152 | | | | 3 | |
Zoltek Cos., Inc. (Æ) | | | 418 | | | | 5 | |
| | | | | | | | |
| | | | | | | 376 | |
| | | | | | | | |
| |
| Producer Durables - 11.9% | | | | | |
AAR Corp. | | | 225 | | | | 4 | |
Aircastle, Ltd. | | | 1,548 | | | | 19 | |
Applied Industrial Technologies, Inc. | | | 1,522 | | | | 63 | |
Atlas Air Worldwide Holdings, Inc. (Æ) | | | 26 | | | | 1 | |
Commercial Vehicle Group, Inc. (Æ) | | | 8,239 | | | | 100 | |
CoStar Group, Inc. (Æ) | | | 432 | | | | 30 | |
EMCOR Group, Inc. | | | 261 | | | | 7 | |
Esterline Technologies Corp. (Æ) | | | 343 | | | | 25 | |
Forward Air Corp. | | | 38 | | | | 1 | |
Genesee & Wyoming, Inc. Class A (Æ) | | | 126 | | | | 7 | |
Greenbrier Cos., Inc. (Æ) | | | 1,072 | | | | 21 | |
Gulfmark Offshore, Inc. Class A (Æ) | | | 15 | | | | 1 | |
HEICO Corp. | | | 216 | | | | 11 | |
Heidrick & Struggles International, Inc. | | | 61 | | | | 1 | |
Kaman Corp. Class A | | | 590 | | | | 20 | |
Knight Transportation, Inc. | | | 40 | | | | 1 | |
LoopNet, Inc. (Æ) | | | 4,891 | | | | 92 | |
MAXIMUS, Inc. | | | 874 | | | | 36 | |
Middleby Corp. (Æ) | | | 130 | | | | 13 | |
Moog, Inc. Class A (Æ) | | | 20 | | | | 1 | |
Orbital Sciences Corp. (Æ) | | | 267 | | | | 4 | |
Rollins, Inc. | | | 4 | | | | — | ± |
RSC Holdings, Inc. (Æ) | | | 164 | | | | 4 | |
Teledyne Technologies, Inc. (Æ) | | | 129 | | | | 8 | |
Titan Machinery, Inc. (Æ) | | | 1,206 | | | | 34 | |
Unifirst Corp. | | | 263 | | | | 16 | |
United Rentals, Inc. (Æ) | | | 34 | | | | 1 | |
United Stationers, Inc. | | | 2,084 | | | | 65 | |
US Ecology, Inc. | | | 180 | | | | 4 | |
Wabash National Corp. (Æ) | | | 608 | | | | 6 | |
Werner Enterprises, Inc. | | | 170 | | | | 4 | |
| | | | | | | | |
| | | Principal
Amount ($)
or Shares | | | Market
Value
$ | |
Woodward, Inc. | | | 132 | | | | 6 | |
| | | | | | | | |
| | | | | | | 606 | |
| | | | | | | | |
| | |
| Technology - 6.3% | | | | | | | | |
Anixter International, Inc. (Æ) | | | 72 | | | | 5 | |
Arris Group, Inc. (Æ) | | | 192 | | | | 2 | |
ATMI, Inc. (Æ) | | | 86 | | | | 2 | |
Blackbaud, Inc. | | | 916 | | | | 30 | |
CACI International, Inc. Class A (Æ) | | | 423 | | | | 26 | |
Cognex Corp. | | | 136 | | | | 6 | |
Coherent, Inc. (Æ) | | | 273 | | | | 16 | |
Hittite Microwave Corp. (Æ) | | | 1,111 | | | | 60 | |
II-VI, Inc. (Æ) | | | 175 | | | | 4 | |
Microsemi Corp. (Æ) | | | 327 | | | | 7 | |
Netscout Systems, Inc. (Æ) | | | 192 | | | | 4 | |
Power Integrations, Inc. | | | 123 | | | | 5 | |
Progress Software Corp. (Æ) | | | 2,657 | | | | 63 | |
Quest Software, Inc. (Æ) | | | 631 | | | | 15 | |
Syntel, Inc. | | | 1,299 | | | | 73 | |
| | | | | | | | |
| | | | | | | 318 | |
| | | | | | | | |
| | |
| Utilities - 17.9% | | | | | | | | |
Avista Corp. | | | 117 | | | | 3 | |
Black Hills Corp. | | | 632 | | | | 21 | |
Central Vermont Public Service Corp. | | | 2,877 | | | | 102 | |
CH Energy Group, Inc. | | | 1,230 | | | | 82 | |
Cleco Corp. | | | 2,461 | | | | 98 | |
Empire District Electric Co. (The) | | | 2,951 | | | | 60 | |
Idacorp, Inc. | | | 2,204 | | | | 91 | |
Laclede Group, Inc. (The) | | | 856 | | | | 33 | |
Middlesex Water Co. | | | 309 | | | | 6 | |
New Jersey Resources Corp. | | | 1,615 | | | | 72 | |
Northwest Natural Gas Co. | | | 1,924 | | | | 87 | |
NorthWestern Corp. | | | 1,195 | | | | 42 | |
PNM Resources, Inc. | | | 76 | | | | 1 | |
Portland General Electric Co. | | | 1,153 | | | | 29 | |
South Jersey Industries, Inc. | | | 761 | | | | 38 | |
UIL Holdings Corp. | | | 1,892 | | | | 66 | |
Unisource Energy Corp. | | | 2,170 | | | | 79 | |
| | | | | | | | |
| | | | | | | 910 | |
| | | | | | | | |
| | |
Total Common Stocks
(cost $5,059) | | | | | | | 4,977 | |
| | | | | | | | |
| |
| Short-Term Investments - 0.3% | | | | | |
Russell U.S. Cash Management Fund | | | 16,312 | (¥) | | | 16 | |
| | | | | | | | |
| |
Total Short-Term Investments
(cost $16) | | | | 16 | |
| | | | | | | | |
| |
Total Investments - 98.1%
(identified cost $5,075) | | | | 4,993 | |
| |
Other Assets and Liabilities,
Net - 1.9% | | | | 95 | |
| | | | | | | | |
| | |
| Net Assets - 100.0% | | | | | | | 5,088 | |
| | | | | | | | |
See accompanying notes which are an integral part of the financial statements.
| | | | |
| | 96 | | | Russell 2000 Low Volatility ETF |
Russell Exchange Traded Funds Trust
Russell 2000 Low Volatility ETF
Presentation of Portfolio Holdings — March 31, 2012
Amounts in thousands
| | | | | | | | | | | | | | | | | | | | |
| | | Market Value | | | % of Net
Assets | |
| Portfolio Summary | | Level 1 | | | Level 2 | | | Level 3 | | | Total | | |
| | | | | | | | | | | | | | | | | | | | |
Common Stocks | | | | | | | | | | | | | | | | | | | | |
Consumer Discretionary | | $ | 462 | | | $ | — | | | $ | — | | | $ | 462 | | | | 9.1 | |
Consumer Staples | | | 255 | | | | — | | | | — | | | | 255 | | | | 5.0 | |
Energy | | | 16 | | | | — | | | | — | | | | 16 | | | | 0.3 | |
Financial Services | | | 1,599 | | | | — | | | | — | | | | 1,599 | | | | 31.3 | |
Health Care | | | 435 | | | | — | | | | — | | | | 435 | | | | 8.6 | |
Materials and Processing | | | 376 | | | | — | | | | — | | | | 376 | | | | 7.4 | |
Producer Durables | | | 606 | | | | — | | | | — | | | | 606 | | | | 11.9 | |
Technology | | | 318 | | | | — | | | | — | | | | 318 | | | | 6.3 | |
Utilities | | | 910 | | | | — | | | | — | | | | 910 | | | | 17.9 | |
Short-Term Investments | | | — | | | | 16 | | | | — | | | | 16 | | | | 0.3 | |
| | | | | | | | | | | | | | | | | | | | |
| | | | | |
Total Investments | | | 4,977 | | | | 16 | | | | — | | | | 4,993 | | | | 98.1 | |
| | | | | | | | | | | | | | | | | | | | |
Other Assets and Liabilities, Net | | | | | | | | | | | | | | | | | | | 1.9 | |
| | | | | | | | | | | | | | | | | | | | |
| | | | | |
| | | | | | | | | | | | | | | | | | | 100.0 | |
| | | | | | | | | | | | | | | | | | | | |
For a description of the levels see note 2 in the Notes to Financial Statements.
There were no significant transfers in and out of levels 1, 2 and 3 during the period ending March 31, 2012.
See accompanying notes which are an integral part of the financial statements.
| | |
| Russell 2000 Low Volatility ETF | | 97 |
Russell Exchange Traded Funds Trust
Russell 2000 Low Volatility ETF
Statement of Assets and Liabilities — March 31, 2012
| | | | |
| Amounts in thousands | | Russell 2000
Low Volatility ETF | |
| | | | |
Assets | | | | |
Investments, at identified cost | | $ | 5,075 | |
Investments, at market* | | | 4,993 | |
Receivables: | | | | |
Dividends | | | 14 | |
Investments sold | | | 189 | |
| | | | |
Total assets | | | 5,196 | |
| | | | |
| |
Liabilities | | | | |
Payables: | | | | |
Investments purchased | | | 107 | |
Accrued fees to affiliates | | | 1 | |
| | | | |
Total liabilities | | | 108 | |
| | | | |
| | | | |
Net Assets | | $ | 5,088 | |
| | | | |
Net Assets Consist of: | | | | |
Undistributed (overdistributed) net investment income | | $ | 13 | |
Accumulated net realized gain (loss) | | | (165 | ) |
Unrealized appreciation (depreciation) on investments | | | (82 | ) |
Additional paid-in capital | | | 5,322 | |
| | | | |
Net Assets | | $ | 5,088 | |
| | | | |
Net Asset Value, offering and redemption price per share: | | | | |
Net asset value per share:(a) | | $ | 50.87 | |
Net assets | | $ | 5,087,569 | |
Shares outstanding ($.001 par value) | | | 100,002 | |
Amounts in thousands | | | | |
| | | | |
* Investments in Affiliates, Russell U.S. Cash Management Fund | | $ | 16 | |
| (a) | Net asset value per share equals net assets divided by shares outstanding. |
See accompanying notes which are an integral part of the financial statements.
| | | | |
| | 98 | | | Statement of Assets and Liabilities |
Russell Exchange Traded Funds Trust
Russell 2000 Low Volatility ETF
Statement of Operations — For the Period Ended March 31, 2012
| | | | |
| Amounts in thousands | | Russell 2000
Low Volatility ETF* | |
| | | | |
Investment Income | | | | |
Dividends | | $ | 106 | |
| | | | |
Total investment income | | | 106 | |
| | | | |
| |
Expenses | | | | |
Management fees | | | 28 | |
Trustee and trustee related fees | | | 14 | |
| | | | |
Expenses before reductions | | | 42 | |
Expense reductions | | | (22 | ) |
| | | | |
Net expenses | | | 20 | |
| | | | |
Net investment income (loss) | | | 86 | |
| | | | |
| |
Net Realized and Unrealized Gain (Loss) | | | | |
Net realized gain (loss) on: | | | | |
Investments | | | (216 | ) |
In-kind redemptions | | | 364 | |
| | | | |
Net realized gain (loss) | | | 148 | |
| | | | |
Net change in unrealized appreciation (depreciation) on investments | | | (82 | ) |
| | | | |
Net realized and unrealized gain (loss) | | | 66 | |
| | | | |
Net Increase (Decrease) in Net Assets from Operations | | $ | 152 | |
| | | | |
| * | For the period May 26, 2011 (commencement of operations) to March 31, 2012. |
See accompanying notes which are an integral part of the financial statements.
| | |
| Statement of Operations | | 99 |
Russell Exchange Traded Funds Trust
Russell 2000 Low Volatility ETF
Statement of Changes in Net Assets — For the Periods Ended March 31,
| | | | |
| | | Russell 2000
Low Volatility ETF | |
| Amounts in thousands | | 2012* | |
| | | | |
Increase (Decrease) in Net Assets | | | | |
| |
Operations | | | | |
Net investment income (loss) | | $ | 86 | |
Net realized gain (loss) | | | 148 | |
Net change in unrealized appreciation (depreciation) | | | (82 | ) |
| | | | |
Net increase (decrease) in net assets from operations | | | 152 | |
| | | | |
| |
Distributions | | | | |
From net investment income | | | (73 | ) |
| | | | |
Net decrease in net assets from distributions | | | (73 | ) |
| | | | |
| |
Share Transactions | | | | |
Net increase (decrease) in net assets from share transactions | | | 5,009 | |
| | | | |
Total Net Increase (Decrease) in Net Assets | | | 5,088 | |
| |
Net Assets | | | | |
Beginning of period | | | — | |
| | | | |
End of period | | $ | 5,088 | |
| | | | |
Undistributed (overdistributed) net investment income included in net assets | | $ | 13 | |
| * | For the period May 26, 2011 (commencement of operations) to March 31, 2012. |
See accompanying notes which are an integral part of the financial statements.
| | | | |
| | 100 | | | Statement of Changes in Net Assets |
(This page intentionally left blank)
Russell Exchange Traded Funds Trust
Russell 2000 Low Volatility ETF
Financial Highlights — For the Period Ended
For a Share Outstanding Throughout Each Period.
| | | | | | | | | | | | | | | | | | | | | | | | |
| | |
$
Net Asset Value,
Beginning of
Period | | | $
Net
Investment
Income (Loss)(a)(e) | | | $
Net Realized
and Unrealized
Gain (Loss) | | | $
Total from
Investment
Operations | | | $
Distributions
from Net
Investment Income | | | $
Total
Distributions | |
Russell 2000 Low Volatility ETF | | | | | | | | | | | | | |
March 31, 2012* | | | 49.36 | | | | .86 | | | | 1.38 | | | | 2.24 | | | | (.73 | ) | | | (.73 | ) |
| (a) | Average daily shares outstanding were used for this calculation. |
| (b) | Periods less than one year are not annualized. |
| (c) | The ratios for periods less than one year are annualized. |
| (d) | Portfolio turnover rate excludes securities received or delivered from in-kind creation or redemption units. |
| (e) | Reflects amounts waived by Russell Investment Management Company (“RIMCo”). |
| * | For the period May 26, 2011 (commencement of operations) to March 31, 2012. |
See accompanying notes which are an integral part of the financial statements.
| | | | | | | | | | | | | | | | | | | | | | | | | | |
$
Net Asset Value,
End of
Period | | | %
Total
Return(b) | | | $
Net Assets,
End of Period
(000) | | | %
Ratio of Expenses
to Average
Net Assets,
Gross(c) | | | %
Ratio of Expenses
to Average
Net Assets,
Net(c)(e) | | | %
Ratio of Net
Investment Income
to Average
Net Assets(c)(e) | | | %
Portfolio
Turnover Rate(b)(d) | |
| | | | | | | | | | | | | | | | | | | | | | | | | | |
| | 50.87 | | | | 4.69 | | | | 5,088 | | | | 1.05 | | | | .50 | | | | 2.13 | | | | 98 | |
See accompanying notes which are an integral part of the financial statements.
Russell Exchange Traded Funds Trust
Russell 2000 High Volatility ETF
Portfolio Management Discussion and Analysis — March 31, 2012 (Unaudited)
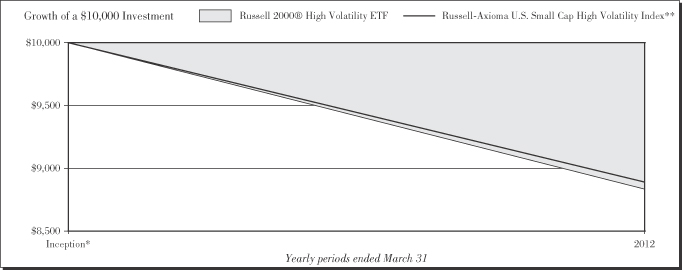
Performance as of March 31, 2012
| | | | | | | | | | | | |
|
| Average Annual Total Return | |
| | | Net Asset
Value | | | Market Value | | | Russell-Axioma
U.S. Small Cap
High Volatility
Index** | |
Inception* | | | (11.67 | )% | | | (11.62 | )% | | | (11.10 | )% |
| | | | |
| | 104 | | | Russell 2000 High Volatility ETF |
Russell Exchange Traded Funds Trust
Russell 2000® High Volatility ETF
Portfolio Management Discussion and Analysis — March 31, 2012 (Unaudited)
The Russell 2000® High Volatility ETF (the “Fund”) is an index-based exchange-traded fund that seeks investment results that closely correspond to the total return of the Russell-Axioma U.S. Small Cap High Volatility Index (the “Index”). Russell Investment Management Company (“RIMCo”), as the Fund’s advisor, uses a “passive” or indexing approach to try to achieve the Fund’s investment objective. Unlike many investment companies, the Fund does not try to “beat” the Index it tracks and does not seek temporary defensive positions when markets decline or appear overvalued. The Fund seeks to gain exposure to the factor exhibited in its Index. The Fund will normally invest at least 80% of its total assets in securities that comprise the Index.
What is the Fund’s investment objective?
The Fund seeks investment results that closely correspond to the total return of the Russell-Axioma U.S. Small Cap High Volatility Index, which is designed to deliver exposure to stocks with high volatility as determined by a screening and ranking methodology applied to the output of the Axioma U.S. Equity Medium Horizon Fundamental Factor Risk model.
Is the Fund replicating or sampling?
The Fund is replicating.
How did the Fund perform relative to its benchmark for the fiscal year ended March 31, 2012?
For the fiscal year ended March 31, 2012, the Fund lost (11.67)%. This is compared to the Fund’s benchmark, the Russell-Axioma U.S. Small Cap High Volatility Index, which lost (11.10)% during the same period. The Fund’s performance includes operating expenses, whereas indexes are unmanaged and index returns do not include expenses of any kind.
There were no significant changes to either the Fund or Index during the reporting period.
Did the Fund outperform or underperform the benchmark or was performance as expected based on expenses, etc.?
The Fund performed as expected against the benchmark.
Over the reporting period, please describe those sectors that outperformed or underperformed.
Sectors achieved both positive and negative returns for the Fund and the Index. Consumer discretionary was the best performing sector for the Fund and the Index, while utilities was the worst performing sector. Financial services, with an average weight of 8.9% was the best contributor to Fund and Index returns. Technology, with an average weight of 18.1%, was the worst contributor to Fund and Index returns.
Over the reporting period, please describe those individual securities (constituents) that outperformed or underperformed.
Qlik Technologies Inc, Sterling Financial Corp (Washington), and Old Dominion Freight Line Inc generated positive returns and contributed the most to Fund performance while Eastman Kodak Co, Epocrates Inc, and MF Global Holdings Ltd, all declined which detracted from Fund performance.
The views expressed in this report reflect those of the portfolio managers only through the end of the period covered by the report. These views do not necessarily represent the views of RIMCo, or any other person in RIMCo or any other affiliated organization. These views are subject to change at any time based upon market conditions or other events, and RIMCo disclaims any responsibility to update the views contained herein. These views should not be relied on as investment advice and, because investment decisions for a Russell Exchange Traded Funds Trust (“RET”) Fund are based on numerous factors, should not be relied on as an indication of investment decisions of any RET Fund.
| * | | Commenced operations by issuing shares May 26, 2011. |
| ** | | The Russell-Axioma U.S. Small Cap High Volatility Index is designed to deliver exposure to stocks with high volatility as determined by a screening and ranking methodology applied to the output of the Axioma U.S. Equity Medium Horizon Fundamental Factor Risk model. Volatility is a measure of a stock’s variability in total returns based on its historical behavior over the last sixty days. Stocks exhibiting high or low volatility can be used by investors to adjust volatility exposure in a portfolio. |
Performance is historical and assumes reinvestment of all dividends and capital gains. Investment return and principal value will fluctuate so that an investor’s shares, when redeemed, may be worth more or less than when purchased. Past performance is not indicative of future results. The returns shown do not reflect the deduction of taxes that a shareholder would pay on Fund distributions or the redemption of Fund shares.
| | |
| Russell 2000® High Volatility ETF | | 105 |
Russell Exchange Traded Funds Trust
Russell 2000 High Volatility ETF
Shareholder Expense Example — March 31, 2012 (Unaudited)
Fund Expenses
The following disclosure provides important information regarding each Fund’s Expense Example, which appears on each Fund’s individual page in this Annual Report. Please refer to this information when reviewing the Expense Example for a Fund.
Example
As a shareholder of the Fund, you incur two types of costs: (1) transaction costs, including brokerage commissions on purchases and sales of your Fund shares and (2) ongoing costs, including management fees and other Fund expenses. The Example is intended to help you understand your ongoing costs (in dollars) of investing in the Fund and to compare these costs with the ongoing costs of investing in other funds. The Example is based on an investment of $1,000 invested at the beginning of the period and held for the entire period indicated, which for this Fund is from October 1, 2011 to March 31, 2012.
Actual Expenses
The information in the table under the heading “Actual Performance” provides information about actual account values and actual expenses. You may use the information in this column, together with the amount you invested, to estimate the expenses that you paid over the period. Simply divide your account value by $1,000 (for example, an $8,600 account value divided by $1,000 = 8.6), then multiply the result by the number in the first column in the row entitled “Expenses Paid During Period” to estimate the expenses you paid on your account during this period.
Hypothetical Example for Comparison Purposes
The information in the table under the heading “Hypothetical Performance (5% return before expenses)” provides information about hypothetical account values and hypothetical expenses based on the Fund’s actual expense ratio and an assumed rate of return of 5% per year before expenses, which is not the Fund’s actual return. The hypothetical account values and expenses may not be used to estimate the actual ending account balance or expenses you paid for the period. You may use this information to compare the ongoing costs of investing in the Fund and other funds. To do so, compare this 5% hypothetical example with the 5% hypothetical examples that appear in the shareholder reports of other funds.
Please note that the expenses shown in the table are meant to highlight your ongoing costs only and do not reflect any transactional costs, such as brokerage commissions paid on purchases and sales of Fund shares. Therefore, the information under the heading “Hypothetical Performance (5% return before expenses)” is useful in comparing ongoing costs only, and will not help you determine the relative total costs of owning different funds. In addition, if these transactional costs were included, your costs would have been higher.
| | | | | | | | |
| | | Actual
Performance | | | Hypothetical
Performance
(5% return
before expenses) | |
| | | | | | | | |
Beginning Account Value | | | | | | | | |
October 1, 2011 | | $ | 1,000.00 | | | $ | 1,000.00 | |
Ending Account Value | | | | | | | | |
March 31, 2012 | | $ | 1,282.90 | | | $ | 1,022.90 | |
Expenses Paid During Period* | | $ | 2.40 | | | $ | 2.12 | |
| * | Expenses are equal to the Fund’s annualized expense ratio of 0.42% (representing the six month period annualized), multiplied by the average account value over the period, multiplied by 183/366 (to reflect the one-half year period). Effective November 3, 2011, the annualized expense ratio is 0.30%, as contractually agreed to by the adviser. May reflect amounts waived and/or reimbursed. Without any waivers and/or reimbursements, expenses would have been higher. |
| | | | |
| | 106 | | | Russell 2000 High Volatility ETF |
Russell Exchange Traded Funds Trust
Russell 2000 High Volatility ETF
Schedule of Investments — March 31, 2012
Amounts in thousands (except share amounts)
| | | | | | | | |
| | | Principal
Amount ($)
or Shares | | | Market
Value
$ | |
| | | | | | | | |
| Common Stocks - 99.8% | | | | | |
| Consumer Discretionary - 13.9% | | | | | |
Amerco, Inc. | | | 30 | | | | 3 | |
Ancestry.com, Inc. (Æ) | | | 91 | | | | 2 | |
Archipelago Learning, Inc. (Æ) | | | 925 | | | | 10 | |
Arctic Cat, Inc. (Æ) | | | 182 | | | | 8 | |
Avis Budget Group, Inc. (Æ) | | | 1,083 | | | | 15 | |
Barnes & Noble, Inc. (Æ) | | | 1,612 | | | | 21 | |
Beazer Homes USA, Inc. (Æ) | | | 155 | | | | 1 | |
Blyth, Inc. | | | 149 | | | | 11 | |
Boyd Gaming Corp. (Æ) | | | 958 | | | | 8 | |
Brunswick Corp. | | | 280 | | | | 7 | |
Buckle, Inc. (The) | | | 505 | | | | 24 | |
Cabela’s, Inc. (Æ) | | | 434 | | | | 17 | |
Caribou Coffee Co., Inc. (Æ) | | | 446 | | | | 8 | |
Casual Male Retail Group, Inc. (Æ) | | | 1,035 | | | | 3 | |
Coinstar, Inc. (Æ) | | | 306 | | | | 19 | |
Coldwater Creek, Inc. (Æ) | | | 1,190 | | | | 1 | |
Collective Brands, Inc. (Æ) | | | 696 | | | | 14 | |
Conn’s, Inc. (Æ) | | | 453 | | | | 7 | |
Cooper Tire & Rubber Co. | | | 1,548 | | | | 24 | |
Crocs, Inc. (Æ) | | | 1,177 | | | | 25 | |
Dana Holding Corp. | | | 105 | | | | 2 | |
Digital Generation, Inc. (Æ) | | | 777 | | | | 8 | |
Dorman Products, Inc. (Æ) | | | 253 | | | | 13 | |
Drew Industries, Inc. (Æ) | | | 515 | | | | 14 | |
Express, Inc. (Æ) | | | 92 | | | | 2 | |
Finish Line, Inc. (The) Class A | | | 731 | | | | 16 | |
Fuel Systems Solutions, Inc. (Æ) | | | 513 | | | | 13 | |
Furniture Brands International, Inc. (Æ) | | | 6,351 | | | | 11 | |
Group 1 Automotive, Inc. | | | 127 | | | | 7 | |
hhgregg, Inc. (Æ) | | | 668 | | | | 8 | |
Hovnanian Enterprises, Inc. Class A (Æ) | | | 281 | | | | 1 | |
HSN, Inc. | | | 80 | | | | 3 | |
Jones Group, Inc. (The) | | | 650 | | | | 8 | |
KB Home | | | 420 | | | | 4 | |
K-Swiss, Inc. Class A (Æ) | | | 202 | | | | 1 | |
Lions Gate Entertainment Corp. (Æ) | | | 1,080 | | | | 15 | |
Live Nation Entertainment, Inc. (Æ) | | | 1,239 | | | | 12 | |
Marchex, Inc. Class A | | | 320 | | | | 1 | |
Men’s Wearhouse, Inc. (The) | | | 409 | | | | 16 | |
Meritage Homes Corp. (Æ) | | | 484 | | | | 13 | |
Monro Muffler Brake, Inc. | | | 626 | | | | 25 | |
Penske Automotive Group, Inc. | | | 92 | | | | 2 | |
Pier 1 Imports, Inc. | | | 1,680 | | | | 30 | |
Pinnacle Entertainment, Inc. (Æ) | | | 1,402 | | | | 16 | |
RealD, Inc. (Æ) | | | 722 | | | | 10 | |
Ryland Group, Inc. (The) | | | 1,268 | | | | 24 | |
Shutterfly, Inc. (Æ) | | | 217 | | | | 7 | |
Skechers U.S.A., Inc. Class A (Æ) | | | 1,285 | | | | 16 | |
Skullcandy, Inc. (Æ) | | | 425 | | | | 7 | |
Stamps.com, Inc. (Æ) | | | 45 | | | | 1 | |
Standard Pacific Corp. (Æ) | | | 535 | | | | 2 | |
Strayer Education, Inc. | | | 16 | | | | 2 | |
Sturm Ruger & Co., Inc. | | | 273 | | | | 13 | |
Teavana Holdings, Inc. (Æ) | | | 38 | | | | 1 | |
Tenneco, Inc. (Æ) | | | 182 | | | | 7 | |
| | | | | | | | |
| | | Principal
Amount ($)
or Shares | | | Market
Value
$ | |
TiVo, Inc. (Æ) | | | 170 | | | | 2 | |
Travelzoo, Inc. (Æ) | | | 370 | | | | 9 | |
Tuesday Morning Corp. (Æ) | | | 438 | | | | 2 | |
Valuevision Media, Inc. Class A (Æ) | | | 245 | | | | 1 | |
Vera Bradley, Inc. (Æ) | | | 74 | | | | 2 | |
Wet Seal, Inc. (The) Class A (Æ) | | | 1,995 | | | | 7 | |
Zagg, Inc. (Æ) | | | 1,999 | | | | 21 | |
Zipcar, Inc. (Æ) | | | 282 | | | | 4 | |
| | | | | | | | |
| | | | | | | 607 | |
| | | | | | | | |
| |
| Consumer Staples - 2.1% | | | | | |
Central European Distribution Corp. (Æ) | | | 369 | | | | 2 | |
Diamond Foods, Inc. | | | 804 | | | | 18 | |
Farmer Bros Co. (Æ) | | | 409 | | | | 4 | |
Fresh Market, Inc. (The) (Æ) | | | 104 | | | | 5 | |
GNC Holdings, Inc. Class A | | | 188 | | | | 7 | |
Heckmann Corp. (Æ) | | | 172 | | | | 1 | |
Imperial Sugar Co. | | | 1,828 | | | | 9 | |
Pilgrim’s Pride Corp. (Æ) | | | 3,340 | | | | 24 | |
Star Scientific, Inc. (Æ) | | | 2,408 | | | | 8 | |
Susser Holdings Corp. (Æ) | | | 566 | | | | 15 | |
| | | | | | | | |
| | | | | | | 93 | |
| | | | | | | | |
| | |
| Energy - 15.1% | | | | | | | | |
Alon USA Energy, Inc. | | | 881 | | | | 8 | |
Ameresco, Inc. Class A (Æ) | | | 232 | | | | 3 | |
Amyris, Inc. (Æ) | | | 347 | | | | 2 | |
Approach Resources, Inc. (Æ) | | | 56 | | | | 2 | |
ATP Oil & Gas Corp. (Æ) | | | 634 | | | | 5 | |
Basic Energy Services, Inc. (Æ) | | | 431 | | | | 7 | |
Berry Petroleum Co. Class A | | | 257 | | | | 12 | |
Bill Barrett Corp. (Æ) | | | 210 | | | | 5 | |
BPZ Resources, Inc. (Æ) | | | 4,418 | | | | 18 | |
C&J Energy Services, Inc. (Æ) | | | 34 | | | | 1 | |
Cal Dive International, Inc. (Æ) | | | 3,310 | | | | 11 | |
Capstone Turbine Corp. (Æ) | | | 6,318 | | | | 6 | |
Carrizo Oil & Gas, Inc. (Æ) | | | 39 | | | | 1 | |
Cheniere Energy, Inc. (Æ) | | | 39 | | | | 1 | |
Clean Energy Fuels Corp. (Æ) | | | 784 | | | | 17 | |
Comstock Resources, Inc. (Æ) | | | 116 | | | | 2 | |
Crosstex Energy, Inc. | | | 524 | | | | 7 | |
CVR Energy, Inc. (Æ) | | | 1,254 | | | | 34 | |
Delek US Holdings, Inc. | | | 1,878 | | | | 29 | |
Dril-Quip, Inc. (Æ) | | | 463 | | | | 30 | |
Energy XXI Bermuda, Ltd. (Æ) | | | 119 | | | | 4 | |
GMX Resources, Inc. (Æ) | | | 2,418 | | | | 3 | |
Golar LNG, Ltd. | | | 431 | | | | 16 | |
Goodrich Petroleum Corp. (Æ) | | | 497 | | | | 9 | |
GT Advanced Technologies, Inc. (Æ) | | | 3,285 | | | | 27 | |
Helix Energy Solutions Group, Inc. (Æ) | | | 96 | | | | 2 | |
Hercules Offshore, Inc. (Æ) | | | 1,120 | | | | 5 | |
Hornbeck Offshore Services, Inc. (Æ) | | | 754 | | | | 32 | |
Houston American Energy Corp. (Æ) | | | 1,604 | | | | 8 | |
Hyperdynamics Corp. (Æ) | | | 622 | | | | 1 | |
ION Geophysical Corp. (Æ) | | | 3,159 | | | | 20 | |
Key Energy Services, Inc. (Æ) | | | 1,716 | | | | 27 | |
KiOR, Inc. Class A (Æ) | | | 2,030 | | | | 27 | |
| | |
| Russell 2000 High Volatility ETF | | 107 |
Russell Exchange Traded Funds Trust
Russell 2000 High Volatility ETF
Schedule of Investments, continued — March 31, 2012
Amounts in thousands (except share amounts)
| | | | | | | | |
| | | Principal
Amount ($)
or Shares | | | Market
Value
$ | |
| | | | | | | | |
Kodiak Oil & Gas Corp. (Æ) | | | 2,561 | | | | 26 | |
L&L Energy, Inc. (Æ) | | | 3,172 | | | | 8 | |
Lufkin Industries, Inc. | | | 837 | | | | 68 | |
McMoRan Exploration Co. (Æ) | | | 1,275 | | | | 14 | |
Newpark Resources, Inc. (Æ) | | | 1,457 | | | | 12 | |
Northern Oil and Gas, Inc. (Æ) | | | 1,040 | | | | 22 | |
Oasis Petroleum, Inc. (Æ) | | | 504 | | | | 16 | |
Parker Drilling Co. (Æ) | | | 1,474 | | | | 9 | |
Patriot Coal Corp. (Æ) | | | 497 | | | | 3 | |
Penn Virginia Corp. | | | 704 | | | | 3 | |
PowerSecure International, Inc. (Æ) | | | 860 | | | | 5 | |
Rosetta Resources, Inc. (Æ) | | | 491 | | | | 24 | |
Solazyme, Inc. (Æ) | | | 46 | | | | 1 | |
STR Holdings, Inc. (Æ) | | | 504 | | | | 2 | |
SunCoke Energy, Inc. (Æ) | | | 394 | | | | 6 | |
Swift Energy Co. (Æ) | | | 562 | | | | 16 | |
USEC, Inc. (Æ) | | | 1,792 | | | | 2 | |
Vantage Drilling Co. (Æ) | | | 10,856 | | | | 17 | |
W&T Offshore, Inc. | | | 92 | | | | 2 | |
Western Refining, Inc. | | | 1,407 | | | | 26 | |
| | | | | | | | |
| | | | | | | 664 | |
| | | | | | | | |
| |
| Financial Services - 11.6% | | | | | |
Astoria Financial Corp. | | | 4,904 | | | | 49 | |
Cathay General Bancorp | | | 241 | | | | 4 | |
CBL & Associates Properties, Inc. (ö) | | | 947 | | | | 18 | |
CNO Financial Group, Inc. (Æ) | | | 864 | | | | 7 | |
CVB Financial Corp. | | | 951 | | | | 11 | |
Doral Financial Corp. (Æ) | | | 4,114 | | | | 6 | |
First Commonwealth Financial Corp. | | | 4,541 | | | | 29 | |
First Midwest Bancorp, Inc. | | | 803 | | | | 10 | |
Flagstar Bancorp, Inc. (Æ) | | | 9,058 | | | | 8 | |
FNB Corp. | | | 1,229 | | | | 15 | |
Global Cash Access Holdings, Inc. (Æ) | | | 955 | | | | 7 | |
Higher One Holdings, Inc. (Æ) | | | 123 | | | | 2 | |
Highwoods Properties, Inc. (ö) | | | 268 | | | | 9 | |
Home Properties, Inc. (ö) | | | 365 | | | | 22 | |
Hudson Valley Holding Corp. | | | 120 | | | | 2 | |
International Bancshares Corp. | | | 443 | | | | 9 | |
Intersections, Inc. | | | 719 | | | | 9 | |
iStar Financial, Inc. (Æ)(ö) | | | 2,269 | | | | 16 | |
Knight Capital Group, Inc. Class A (Æ) | | | 1,016 | | | | 13 | |
Ladenburg Thalmann Financial Services, Inc. (Æ) | | | 9,185 | | | | 16 | |
Lakeland Bancorp, Inc. | | | 1,642 | | | | 16 | |
Lexington Realty Trust (ö) | | | 1,813 | | | | 16 | |
MB Financial, Inc. | | | 123 | | | | 3 | |
MGIC Investment Corp. (Æ) | | | 1,641 | | | | 8 | |
National Penn Bancshares, Inc. | | | 1,160 | | | | 10 | |
Netspend Holdings, Inc. (Æ) | | | 393 | | | | 3 | |
Park National Corp. | | | 246 | | | | 17 | |
Phoenix Cos., Inc. (The)(Æ) | | | 6,149 | | | | 15 | |
Piper Jaffray Cos. (Æ) | | | 182 | | | | 5 | |
Radian Group, Inc. | | | 3,051 | | | | 13 | |
Signature Bank (Æ) | | | 100 | | | | 6 | |
Sterling Financial Corp. (Æ) | | | 3,147 | | | | 67 | |
Strategic Hotels & Resorts,
Inc. (Æ)(ö) | | | 816 | | | | 5 | |
| | | | | | | | |
| | | Principal
Amount ($)
or Shares | | | Market
Value
$ | |
Susquehanna Bancshares, Inc. | | | 1,675 | | | | 17 | |
Umpqua Holdings Corp. | | | 461 | | | | 6 | |
United Community Banks, Inc. (Æ) | | | 1,746 | | | | 17 | |
Zillow, Inc. Class A (Æ) | | | 577 | | | | 21 | |
| | | | | | | | |
| | | | | | | 507 | |
| | | | | | | | |
| | |
| Health Care - 10.8% | | | | | | | | |
Achillion Pharmaceuticals, Inc. (Æ) | | | 57 | | | | 1 | |
Acura Pharmaceuticals, Inc. (Æ) | | | 1,750 | | | | 6 | |
Akorn, Inc. (Æ) | | | 1,758 | | | | 21 | |
Alimera Sciences, Inc. | | | 179 | | | | 1 | |
Alkermes PLC (Æ) | | | 142 | | | | 3 | |
Ampio Pharmaceuticals, Inc. (Æ) | | | 1,036 | | | | 4 | |
Anthera Pharmaceuticals, Inc. (Æ) | | | 2,870 | | | | 6 | |
AVEO Pharmaceuticals, Inc. (Æ) | | | 1,056 | | | | 13 | |
AVI BioPharma, Inc. (Æ) | | | 3,063 | | | | 5 | |
Cadence Pharmaceuticals, Inc. (Æ) | | | 980 | | | | 4 | |
Cambrex Corp. (Æ) | | | 1,381 | | | | 10 | |
Cell Therapeutics, Inc. (Æ) | | | 466 | | | | 1 | |
Clovis Oncology, Inc. (Æ) | | | 26 | | | | 1 | |
Complete Genomics, Inc. (Æ) | | | 9,720 | | | | 26 | |
Cubist Pharmaceuticals, Inc. (Æ) | | | 81 | | | | 4 | |
Curis, Inc. (Æ) | | | 695 | | | | 3 | |
Cytori Therapeutics, Inc. (Æ) | | | 208 | | | | 1 | |
Delcath Systems, Inc. (Æ) | | | 570 | | | | 2 | |
Endologix, Inc. (Æ) | | | 827 | | | | 12 | |
Exelixis, Inc. (Æ) | | | 4,117 | | | | 21 | |
Hansen Medical, Inc. (Æ) | | | 3,986 | | | | 12 | |
Idenix Pharmaceuticals, Inc. (Æ) | | | 2,602 | | | | 24 | |
Incyte Corp., Ltd. (Æ) | | | 497 | | | | 10 | |
InterMune, Inc. (Æ) | | | 772 | | | | 11 | |
Jazz Pharmaceuticals PLC (Æ) | | | 52 | | | | 3 | |
Keryx Biopharmaceuticals, Inc. (Æ) | | | 104 | | | | 1 | |
KV Pharmaceutical Co. Class A (Æ) | | | 475 | | | | 1 | |
Lexicon Pharmaceuticals, Inc. (Æ) | | | 14,783 | | | | 26 | |
MAKO Surgical Corp. (Æ) | | | 310 | | | | 13 | |
MannKind Corp. (Æ) | | | 12,267 | | | | 29 | |
Medivation, Inc. (Æ) | | | 73 | | | | 5 | |
Merge Healthcare, Inc. (Æ) | | | 1,479 | | | | 9 | |
Metabolix, Inc. (Æ) | | | 233 | | | | 1 | |
Metropolitan Health Networks, Inc. (Æ) | | | 516 | | | | 5 | |
MModal, Inc. (Æ) | | | 550 | | | | 6 | |
Momenta Pharmaceuticals, Inc. (Æ) | | | 505 | | | | 8 | |
NxStage Medical, Inc. (Æ) | | | 226 | | | | 4 | |
Nymox Pharmaceutical Corp. (Æ) | | | 2,159 | | | | 17 | |
Oncothyreon, Inc. (Æ) | | | 164 | | | | 1 | |
Onyx Pharmaceuticals, Inc. (Æ) | | | 75 | | | | 3 | |
Optimer Pharmaceuticals, Inc. (Æ) | | | 1,480 | | | | 21 | |
Pacific Biosciences of California, Inc. (Æ) | | | 941 | | | | 3 | |
Pacira Pharmaceuticals, Inc. (Æ) | | | 366 | | | | 4 | |
Pharmacyclics, Inc. (Æ) | | | 1,434 | | | | 39 | |
Questcor Pharmaceuticals, Inc. (Æ) | | | 511 | | | | 19 | |
Rigel Pharmaceuticals, Inc. (Æ) | | | 1,107 | | | | 9 | |
Sangamo Biosciences, Inc. (Æ) | | | 430 | | | | 2 | |
Sequenom, Inc. (Æ) | | | 1,397 | | | | 6 | |
Skilled Healthcare Group, Inc. Class A (Æ) | | | 1,802 | | | | 14 | |
Solta Medical, Inc. (Æ) | | | 453 | | | | 1 | |
| | | | |
| | 108 | | | Russell 2000 High Volatility ETF |
Russell Exchange Traded Funds Trust
Russell 2000 High Volatility ETF
Schedule of Investments, continued — March 31, 2012
Amounts in thousands (except share amounts)
| | | | | | | | |
| | | Principal
Amount ($)
or Shares | | | Market
Value
$ | |
| | | | | | | | |
Sunesis Pharmaceuticals, Inc. (Æ) | | | 277 | | | | 1 | |
Synta Pharmaceuticals Corp. (Æ) | | | 191 | | | | 1 | |
Tornier NV (Æ) | | | 41 | | | | 1 | |
Transcept Pharmaceuticals, Inc. (Æ) | | | 719 | | | | 8 | |
Vanguard Health Systems, Inc. | | | 348 | | | | 3 | |
WellCare Health Plans, Inc. (Æ) | | | 41 | | | | 3 | |
Zogenix, Inc. | | | 774 | | | | 2 | |
| | | | | | | | |
| | | | | | | 471 | |
| | | | | | | | |
| |
| Materials and Processing - 9.2% | | | | | |
AMCOL International Corp. | | | 288 | | | | 8 | |
American Vanguard Corp. | | | 825 | | | | 18 | |
Calgon Carbon Corp. (Æ) | | | 1,008 | | | | 16 | |
Coeur d’Alene Mines Corp. (Æ) | | | 1,695 | | | | 40 | |
General Moly, Inc. (Æ) | | | 827 | | | | 3 | |
Georgia Gulf Corp. (Æ) | | | 273 | | | | 10 | |
Gibraltar Industries, Inc. (Æ) | | | 155 | | | | 2 | |
Globe Specialty Metals, Inc. | | | 73 | | | | 1 | |
Gold Resource Corp. | | | 93 | | | | 2 | |
Golden Minerals Co. (Æ) | | | 151 | | | | 1 | |
Golden Star Resources, Ltd. (Æ) | | | 11,196 | | | | 21 | |
Graphic Packaging Holding Co. (Æ) | | | 2,127 | | | | 12 | |
Griffon Corp. | | | 384 | | | | 4 | |
Headwaters, Inc. (Æ) | | | 1,722 | | | | 7 | |
Hecla Mining Co. | | | 7,073 | | | | 33 | |
Jaguar Mining, Inc. (Æ) | | | 2,864 | | | | 13 | |
Kraton Performance Polymers, Inc. (Æ) | | | 39 | | | | 1 | |
McEwen Mining, Inc. (Æ) | | | 7,240 | | | | 32 | |
Midway Gold Corp. (Æ) | | | 6,865 | | | | 10 | |
NCI Building Systems, Inc. (Æ) | | | 584 | | | | 7 | |
Olin Corp. | | | 81 | | | | 2 | |
Omnova Solutions, Inc. (Æ) | | | 717 | | | | 5 | |
Paramount Gold and Silver Corp. (Æ) | | | 550 | | | | 1 | |
Rentech, Inc. (Æ) | | | 10,697 | | | | 22 | |
RTI International Metals, Inc. (Æ) | | | 50 | | | | 1 | |
Schweitzer-Mauduit International, Inc. | | | 206 | | | | 14 | |
Senomyx, Inc. (Æ) | | | 877 | | | | 2 | |
Simpson Manufacturing Co., Inc. | | | 1,400 | | | | 46 | |
Stillwater Mining Co. (Æ) | | | 1,495 | | | | 19 | |
Texas Industries, Inc. | | | 607 | | | | 21 | |
Universal Forest Products, Inc. | | | 135 | | | | 5 | |
Uranium Energy Corp. (Æ) | | | 1,268 | | | | 5 | |
Uranium Resources, Inc. | | | 571 | | | | 1 | |
Vista Gold Corp. (Æ) | | | 4,096 | | | | 13 | |
Zep, Inc. | | | 223 | | | | 3 | |
| | | | | | | | |
| | | | | | | 401 | |
| | | | | | | | |
| |
| Producer Durables - 14.8% | | | | | |
A123 Systems, Inc. (Æ) | | | 3,240 | | | | 4 | |
ACCO Brands Corp. (Æ) | | | 738 | | | | 9 | |
Active Power, Inc. (Æ) | | | 700 | | | | 1 | |
Advisory Board Co. (The) (Æ) | | | 48 | | | | 4 | |
Alaska Air Group, Inc. (Æ) | | | 568 | | | | 20 | |
AM Castle & Co. (Æ) | | | 930 | | | | 12 | |
American Superconductor Corp. (Æ) | | | 3,356 | | | | 14 | |
Brady Corp. Class A | | | 395 | | | | 13 | |
Briggs & Stratton Corp. | | | 571 | | | | 10 | |
| | | | | | | | |
| | | Principal
Amount ($)
or Shares | | | Market
Value
$ | |
Bristow Group, Inc. | | | 147 | | | | 7 | |
Broadwind Energy, Inc. (Æ) | | | 17,546 | | | | 8 | |
CAI International, Inc. (Æ) | | | 873 | | | | 16 | |
Chart Industries, Inc. (Æ) | | | 61 | | | | 4 | |
Clean Harbors, Inc. (Æ) | | | 57 | | | | 4 | |
Coleman Cable, Inc. (Æ) | | | 998 | | | | 10 | |
Colfax Corp. (Æ) | | | 596 | | | | 21 | |
CRA International, Inc. (Æ) | | | 219 | | | | 6 | |
Darling International, Inc. (Æ) | | | 242 | | | | 4 | |
DHT Holdings, Inc. | | | 10,467 | | | | 10 | |
DXP Enterprises, Inc. (Æ) | | | 406 | | | | 18 | |
Eagle Bulk Shipping, Inc. (Æ) | | | 580 | | | | 1 | |
Energy Recovery, Inc. (Æ) | | | 1,705 | | | | 4 | |
EnergySolutions, Inc. (Æ) | | | 5,449 | | | | 27 | |
ESCO Technologies, Inc. | | | 490 | | | | 18 | |
Excel Maritime Carriers, Ltd. Class A (Æ) | | | 2,396 | | | | 5 | |
Frontline, Ltd. | | | 1,607 | | | | 12 | |
Genco Shipping & Trading, Ltd. (Æ) | | | 2,036 | | | | 13 | |
Generac Holdings, Inc. (Æ) | | | 291 | | | | 7 | |
Gorman-Rupp Co. (The) | | | 28 | | | | 1 | |
Graham Corp. | | | 412 | | | | 9 | |
Great Lakes Dredge & Dock Corp. | | | 700 | | | | 5 | |
Herman Miller, Inc. | | | 454 | | | | 10 | |
Hill International, Inc. (Æ) | | | 2,251 | | | | 9 | |
HUB Group, Inc. Class A (Æ) | | | 235 | | | | 8 | |
InnerWorkings, Inc. (Æ) | | | 1,112 | | | | 13 | |
Kimball International, Inc. Class B | | | 1,717 | | | | 12 | |
MasTec, Inc. (Æ) | | | 164 | | | | 3 | |
Measurement Specialties, Inc. (Æ) | | | 245 | | | | 8 | |
Mistras Group, Inc. (Æ) | | | 150 | | | | 4 | |
Modine Manufacturing Co. (Æ) | | | 721 | | | | 6 | |
Old Dominion Freight Line, Inc. (Æ) | | | 1,328 | | | | 63 | |
Overseas Shipholding Group, Inc. | | | 1,104 | | | | 14 | |
PMFG, Inc. (Æ) | | | 634 | | | | 10 | |
Power-One, Inc. (Æ) | | | 2,133 | | | | 10 | |
Quad/Graphics, Inc. | | | 1,287 | | | | 18 | |
Raven Industries, Inc. | | | 19 | | | | 1 | |
Robbins & Myers, Inc. | | | 43 | | | | 2 | |
RPX Corp. (Æ) | | | 146 | | | | 2 | |
RSC Holdings, Inc. (Æ) | | | 95 | | | | 2 | |
Satcon Technology Corp. (Æ) | | | 12,919 | | | | 5 | |
Sauer-Danfoss, Inc. | | | 58 | | | | 3 | |
ServiceSource International, Inc. (Æ) | | | 140 | | | | 2 | |
Standex International Corp. | | | 731 | | | | 30 | |
Swift Transportation Co. Class A (Æ) | | | 1,488 | | | | 17 | |
Swisher Hygiene, Inc. (Æ)(Þ) | | | 6,548 | | | | 16 | |
Tecumseh Products Co. Class A (Æ) | | | 293 | | | | 1 | |
Trimas Corp. (Æ) | | | 899 | | | | 20 | |
United Rentals, Inc. (Æ) | | | 67 | | | | 3 | |
US Airways Group, Inc. (Æ) | | | 5,253 | | | | 40 | |
Vicor Corp. | | | 154 | | | | 1 | |
Wesco Aircraft Holdings, Inc. (Æ) | | | 322 | | | | 5 | |
Woodward, Inc. | | | 252 | | | | 11 | |
| | | | | | | | |
| | | | | | | 646 | |
| | | | | | | | |
| | |
| Technology - 21.2% | | | | | | | | |
3D Systems Corp. (Æ) | | | 1,283 | | | | 30 | |
| | |
| Russell 2000 High Volatility ETF | | 109 |
Russell Exchange Traded Funds Trust
Russell 2000 High Volatility ETF
Schedule of Investments, continued — March 31, 2012
Amounts in thousands (except share amounts)
| | | | | | | | |
| | | Principal
Amount ($)
or Shares | | | Market
Value
$ | |
| | | | | | | | |
Acacia Research Corp. (Æ) | | | 49 | | | | 2 | |
ADTRAN, Inc. | | | 62 | | | | 2 | |
Amkor Technology, Inc. (Æ) | | | 790 | | | | 5 | |
Angie’s List. Inc. (Æ) | | | 40 | | | | 1 | |
Aruba Networks, Inc. (Æ) | | | 713 | | | | 16 | |
AXT, Inc. (Æ) | | | 1,092 | | | | 7 | |
Bankrate, Inc. (Æ) | | | 1,535 | | | | 37 | |
BroadSoft, Inc. (Æ) | | | 632 | | | | 24 | |
Carbonite, Inc. (Æ) | | | 898 | | | | 10 | |
CIBER, Inc. (Æ) | | | 3,318 | | | | 14 | |
Cohu, Inc. | | | 503 | | | | 6 | |
CommVault Systems, Inc. (Æ) | | | 131 | | | | 7 | |
Computer Task Group, Inc. (Æ) | | | 905 | | | | 14 | |
Cymer, Inc. (Æ) | | | 35 | | | | 2 | |
Deltek, Inc. (Æ) | | | 1,953 | | | | 21 | |
Demand Media, Inc. (Æ) | | | 1,812 | | | | 13 | |
Echelon Corp. (Æ) | | | 860 | | | | 4 | |
Emcore Corp. (Æ) | | | 113 | | | | 1 | |
Emulex Corp. (Æ) | | | 3,802 | | | | 38 | |
Entropic Communications, Inc. (Æ) | | | 1,337 | | | | 8 | |
Envestnet, Inc. (Æ) | | | 1,169 | | | | 15 | |
Fabrinet (Æ) | | | 889 | | | | 16 | |
Finisar Corp. (Æ) | | | 586 | | | | 12 | |
FriendFinder Networks, Inc. (Æ) | | | 424 | | | | 1 | |
GeoEye, Inc. (Æ) | | | 213 | | | | 5 | |
iGate Corp. (Æ) | | | 409 | | | | 7 | |
Insight Enterprises, Inc. (Æ) | | | 261 | | | | 6 | |
InterDigital, Inc. | | | 1,022 | | | | 36 | |
Intevac, Inc. (Æ) | | | 341 | | | | 3 | |
IntraLinks Holdings, Inc. (Æ) | | | 181 | | | | 1 | |
InvenSense, Inc. Class A (Æ) | | | 36 | | | | 1 | |
KEYW Holding Corp. (The) (Æ) | | | 1,003 | | | | 8 | |
KIT Digital, Inc. (Æ) | | | 146 | | | | 1 | |
Kopin Corp. (Æ) | | | 4,213 | | | | 17 | |
Kulicke & Soffa Industries, Inc. (Æ) | | | 2,586 | | | | 32 | |
LogMeIn, Inc. (Æ) | | | 48 | | | | 2 | |
Mercury Computer Systems, Inc. (Æ) | | | 651 | | | | 9 | |
Meru Networks, Inc. (Æ) | | | 528 | | | | 2 | |
Microvision, Inc. (Æ) | | | 1,687 | | | | 5 | |
Motricity, Inc. (Æ) | | | 1,323 | | | | 1 | |
NetSuite, Inc. (Æ) | | | 62 | | | | 3 | |
OCZ Technology Group, Inc. (Æ) | | | 157 | | | | 1 | |
Omnivision Technologies, Inc. (Æ) | | | 1,306 | | | | 26 | |
OpenTable, Inc. (Æ) | | | 357 | | | | 14 | |
Openwave Systems, Inc. (Æ) | | | 2,178 | | | | 5 | |
PC Connection, Inc. | | | 483 | | | | 4 | |
Photronics, Inc. (Æ) | | | 912 | | | | 6 | |
Plexus Corp. (Æ) | | | 310 | | | | 11 | |
Powerwave Technologies, Inc. (Æ) | | | 18,205 | | | | 36 | |
PROS Holdings, Inc. (Æ) | | | 560 | | | | 10 | |
QLIK Technologies, Inc. (Æ) | | | 2,625 | | | | 83 | |
Quantum Corp. (Æ) | | | 2,018 | | | | 5 | |
Quepasa Corp. (Æ) | | | 139 | | | | 1 | |
Radisys Corp. (Æ) | | | 307 | | | | 2 | |
RealPage, Inc. (Æ) | | | 523 | | | | 10 | |
| | | | | | | | |
| | | Principal
Amount ($)
or Shares | | | Market
Value
$ | |
RF Micro Devices, Inc. (Æ) | | | 5,144 | | | | 26 | |
Rogers Corp. (Æ) | | | 145 | | | | 6 | |
Rubicon Technology, Inc. (Æ) | | | 1,098 | | | | 11 | |
SciQuest, Inc. (Æ) | | | 209 | | | | 3 | |
Smith Micro Software, Inc. (Æ) | | | 320 | | | | 1 | |
SolarWinds, Inc. (Æ) | | | 39 | | | | 2 | |
Sonus Networks, Inc. (Æ) | | | 3,994 | | | | 12 | |
Sourcefire, Inc. (Æ) | | | 181 | | | | 9 | |
STEC, Inc. (Æ) | | | 1,532 | | | | 14 | |
Synchronoss Technologies, Inc. (Æ) | | | 46 | | | | 1 | |
Take-Two Interactive Software, Inc. (Æ) | | | 1,158 | | | | 18 | |
Tangoe, Inc. (Æ) | | | 736 | | | | 14 | |
TeleNav, Inc. (Æ) | | | 147 | | | | 1 | |
THQ, Inc. (Æ) | | | 2,510 | | | | 1 | |
TriQuint Semiconductor, Inc. (Æ) | | | 4,079 | | | | 28 | |
Ubiquiti Networks, Inc. (Æ) | | | 1,204 | | | | 38 | |
Universal Display Corp. (Æ) | | | 546 | | | | 20 | �� |
Veeco Instruments, Inc. (Æ) | | | 739 | | | | 21 | |
VirnetX Holding Corp. (Æ) | | | 1,365 | | | | 33 | |
Wave Systems Corp. Class A (Æ) | | | 754 | | | | 1 | |
Web.com Group, Inc. (Æ) | | | 846 | | | | 12 | |
| | | | | | | | |
| | | | | | | 931 | |
| | | | | | | | |
| | |
| Utilities - 1.1% | | | | | | | | |
8x8, Inc. (Æ) | | | 4,458 | | | | 19 | |
Dynegy, Inc. Class A (Æ) | | | 3,865 | | | | 2 | |
Fairpoint Communications, Inc. (Æ) | | | 444 | | | | 2 | |
IDT Corp. Class B | | | 572 | | | | 5 | |
Leap Wireless International, Inc. (Æ) | | | 210 | | | | 2 | |
Pendrell Corp. (Æ) | | | 7,213 | | | | 19 | |
| | | | | | | | |
| | | | | | | 49 | |
| | | | | | | | |
| | |
Total Common Stocks
(cost $4,641) | | | | | | | 4,369 | |
| | | | | | | | |
| |
| Warrants & Rights - 0.0% | | | | | |
Magnum Hunter Resources,
Inc. (Æ)(Å) | | | 442 | | | | — | ± |
| | | | | | | | |
| | |
Total Warrants & Rights (cost $—) | | | | | | | — | ± |
| | | | | | | | |
| |
| Short-Term Investments - 0.2% | | | | | |
Russell U.S. Cash Management Fund | | | 9,157 | (¥) | | | 9 | |
| | | | | | | | |
| |
Total Short-Term Investments (cost $9) | | | | 9 | |
| | | | | | | | |
| |
104Total Investments - 100.0% (identified cost $4,650) | | | | 4,378 | |
| |
Other Assets and Liabilities, Net - (0.0%) | | | | — | ± |
| | | | | | | | |
| | |
| Net Assets - 100.0% | | | | | | | 4,378 | |
| | | | | | | | |
See accompanying notes which are an integral part of the financial statements.
| | | | |
| | 110 | | | Russell 2000 High Volatility ETF |
Russell Exchange Traded Funds Trust
Russell 2000 High Volatility ETF
Presentation of Portfolio Holdings — March 31, 2012
Amounts in thousands
| | | | | | | | | | | | | | | | | | | | |
| | | Market Value | | | % of Net
Assets | |
| Portfolio Summary | | Level 1 | | | Level 2 | | | Level 3 | | | Total | | |
| | | | | | | | | | | | | | | | | | | | |
Common Stocks | | | | | | | | | | | | | | | | | | | | |
Consumer Discretionary | | $ | 607 | | | $ | — | | | $ | — | | | $ | 607 | | | | 13.9 | |
Consumer Staples | | | 93 | | | | — | | | | — | | | | 93 | | | | 2.1 | |
Energy | | | 664 | | | | — | | | | — | | | | 664 | | | | 15.1 | |
Financial Services | | | 507 | | | | — | | | | — | | | | 507 | | | | 11.6 | |
Health Care | | | 471 | | | | — | | | | — | | | | 471 | | | | 10.8 | |
Materials and Processing | | | 401 | | | | — | | | | — | | | | 401 | | | | 9.2 | |
Producer Durables | | | 646 | | | | — | | | | — | | | | 646 | | | | 14.8 | |
Technology | | | 931 | | | | — | | | | — | | | | 931 | | | | 21.2 | |
Utilities | | | 49 | | | | — | | | | — | | | | 49 | | | | 1.1 | |
Warrants & Rights | | | — | | | | — | | | | — | ** | | | — | ** | | | — | * |
Short-Term Investments | | | — | | | | 9 | | | | — | | | | 9 | | | | 0.2 | |
| | | | | | | | | | | | | | | | | | | | |
| | | | | |
Total Investments | | | 4,369 | | | | 9 | | | | — | | | | 4,378 | | | | 100.0 | |
| | | | | | | | | | | | | | | | | | | | |
Other Assets and Liabilities, Net | | | | | | | | | | | | | | | | | | | (— | )* |
| | | | | | | | | | | | | | | | | | | | |
| | | | | |
| | | | | | | | | | | | | | | | | | | 100.0 | |
| | | | | | | | | | | | | | | | | | | | |
| * | | Less than .05% of net assets. |
For a description of the levels see note 2 in the Notes to Financial Statements.
There were no significant transfers in and out of levels 1, 2 and 3 during the period ending March 31, 2012.
See accompanying notes which are an integral part of the financial statements.
| | |
| Russell 2000 High Volatility ETF | | 111 |
Russell Exchange Traded Funds Trust
Russell 2000 High Volatility ETF
Statement of Assets and Liabilities — March 31, 2012
| | | | |
| Amounts in thousands | | Russell 2000
High Volatility
ETF | |
| | | | |
Assets | | | | |
Investments, at identified cost | | $ | 4,650 | |
Investments, at market* | | | 4,378 | |
Receivables: | | | | |
Dividends | | | 2 | |
Investments sold | | | 210 | |
| | | | |
Total assets | | | 4,590 | |
| | | | |
| |
Liabilities | | | | |
Payables: | | | | |
Investments purchased | | | 211 | |
Accrued fees to affiliates | | | 1 | |
| | | | |
Total liabilities | | | 212 | |
| | | | |
| | | | |
Net Assets | | $ | 4,378 | |
| | | | |
Net Assets Consist of: | | | | |
Undistributed (overdistributed) net investment income | | $ | — | |
Accumulated net realized gain (loss) | | | (1,017 | ) |
Unrealized appreciation (depreciation) on investments | | | (272 | ) |
Additional paid-in capital | | | 5,667 | |
| | | | |
Net Assets | | $ | 4,378 | |
| | | | |
Net Asset Value, offering and redemption price per share: | | | | |
Net asset value per share:(a) | | $ | 43.78 | |
Net assets | | $ | 4,377,918 | |
Shares outstanding ($.001 par value) | | | 100,002 | |
Amounts in thousands | | | | |
| | | | |
* Investments in Affiliates, Russell U.S. Cash Management Fund | | $ | 9 | |
| (a) | Net asset value per share equals net assets divided by shares outstanding. |
See accompanying notes which are an integral part of the financial statements.
| | | | |
| | 112 | | | Statement of Assets and Liabilities |
Russell Exchange Traded Funds Trust
Russell 2000 High Volatility ETF
Statement of Operations — For the Period Ended March 31, 2012
| | | | |
| Amounts in thousands | | Russell 2000
High Volatility
ETF* | |
| | | | |
Investment Income | | | | |
Dividends | | $ | 35 | |
| | | | |
Total investment income | | | 35 | |
| | | | |
| |
Expenses | | | | |
Management fees | | | 53 | |
Trustee and trustee related fees | | | 24 | |
| | | | |
Expenses before reductions | | | 77 | |
Expense reductions | | | (32 | ) |
| | | | |
Net expenses | | | 45 | |
| | | | |
Net investment income (loss) | | | (10 | ) |
| | | | |
| |
Net Realized and Unrealized Gain (Loss) | | | | |
Net realized gain (loss) on: | | | | |
Investments | | | (1,050 | ) |
In-kind redemptions | | | (1,484 | ) |
| | | | |
Net realized gain (loss) | | | (2,534 | ) |
Net change in unrealized appreciation (depreciation) on investments | | | (272 | ) |
| | | | |
Net realized and unrealized gain (loss) | | | (2,806 | ) |
| | | | |
Net Increase (Decrease) in Net Assets from Operations | | $ | (2,816 | ) |
| | | | |
| * | For the period May 26, 2011 (commencement of operations) to March 31, 2012. |
See accompanying notes which are an integral part of the financial statements.
| | |
| Statement of Operations | | 113 |
Russell Exchange Traded Funds Trust
Russell 2000 High Volatility ETF
Statement of Changes in Net Assets — For the Periods Ended March 31,
| | | | |
| | | Russell 2000 High
Volatility ETF | |
| Amounts in thousands | | 2012* | |
| | | | |
Increase (Decrease) in Net Assets | | | | |
| |
Operations | | | | |
Net investment income (loss) | | $ | (10 | ) |
Net realized gain (loss) | | | (2,534 | ) |
Net change in unrealized appreciation (depreciation) | | | (272 | ) |
| | | | |
Net increase (decrease) in net assets from operations | | | (2,816 | ) |
| | | | |
| |
Share Transactions | | | | |
Net increase (decrease) in net assets from share transactions | | | 7,194 | |
| | | | |
Total Net Increase (Decrease) in Net Assets | | | 4,378 | |
| |
Net Assets | | | | |
Beginning of period | | | — | |
| | | | |
End of period | | $ | 4,378 | |
| | | | |
Undistributed (overdistributed) net investment income included in net assets | | $ | — | |
| * | For the period May 26, 2011 (commencement of operations) to March 31, 2012. |
See accompanying notes which are an integral part of the financial statements.
| | | | |
| | 114 | | | Statement of Changes in Net Assets |
(This page intentionally left blank)
Russell Exchange Traded Funds Trust
Russell 2000 High Volatility ETF
Financial Highlights — For the Period Ended
For a Share Outstanding Throughout Each Period.
| | | | | | | | | | | | | | | | |
| | |
$
Net Asset Value,
Beginning of
Period | | | $
Net
Investment
Income (Loss)(a)(e) | | | $
Net Realized
and Unrealized
Gain (Loss) | | | $
Total from
Investment
Operations | |
Russell 2000 High Volatility ETF | | | | | | | | | | | | | | | | |
March 31, 2012* | | | 49.57 | | | | (.05 | ) | | | (5.74 | ) | | | (5.79 | ) |
| (a) | Average daily shares outstanding were used for this calculation. |
| (b) | Periods less than one year are not annualized. |
| (c) | The ratios for periods less than one year are annualized. |
| (d) | Portfolio turnover rate excludes securities received or delivered from in-kind creation or redemption units. |
| (e) | Reflects amounts waived by Russell Investment Management Company (“RIMCo”). |
| * | For the period May 26, 2011 (commencement of operations) to March 31, 2012. |
See accompanying notes which are an integral part of the financial statements.
| | | | | | | | | | | | | | | | | | | | | | | | | | |
$
Net Asset Value,
End of
Period | | | %
Total
Return(b) | | | $
Net Assets,
End of Period
(000) | | | %
Ratio of Expenses
to Average
Net Assets,
Gross(c) | | | %
Ratio of Expenses
to Average
Net Assets,
Net(c)(e) | | | %
Ratio of Net
Investment Income
to Average
Net Assets(c)(e) | | | %
Portfolio
Turnover Rate(b)(d) | |
| | | | | | | | | | | | | | | | | | | | | | | | | | |
| | 43.78 | | | | (11.67 | ) | | | 4,378 | | | | 1.01 | | | | .59 | | | | (.13 | ) | | | 85 | |
See accompanying notes which are an integral part of the financial statements.
Russell Exchange Traded Funds Trust
Russell 2000 High Momentum ETF
Portfolio Management Discussion and Analysis — March 31, 2012 (Unaudited)
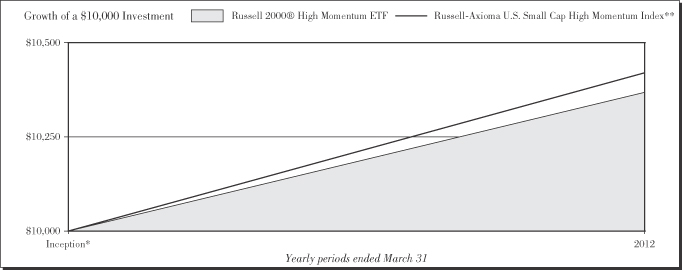
Performance as of March 31, 2012
| | | | | | | | | | | | |
|
| Average Annual Total Return | |
| | | Net Asset
Value | | | Market Value | | | Russell-Axioma
U.S. Small Cap
High Momentum
Index** | |
Inception* | | | 3.68 | % | | | 3.63 | % | | | 4.20 | % |
| | | | |
| | 118 | | | Russell 2000 High Momentum ETF |
Russell Exchange Traded Funds Trust
Russell 2000® High Momentum ETF
Portfolio Management Discussion and Analysis — March 31, 2012 (Unaudited)
The Russell 2000® High Momentum ETF (the “Fund”) is an index-based exchange-traded fund that seeks investment results that closely correspond to the total return of the Russell-Axioma U.S. Small Cap High Momentum Index (the “Index”). Russell Investment Management Company (“RIMCo”), as the Fund’s advisor, uses a “passive” or indexing approach to try to achieve the Fund’s investment objective. Unlike many investment companies, the Fund does not try to “beat” the Index it tracks and does not seek temporary defensive positions when markets decline or appear overvalued. The Fund seeks to gain exposure to the factor exhibited in its Index. The Fund will normally invest at least 80% of its total assets in securities that comprise the Index.
What is the Fund’s investment objective?
The Fund seeks investment results that closely correspond to the total return of the Russell-Axioma U.S. Small Cap High Momentum Index, which is designed to deliver exposure to stocks with high medium-term momentum as determined by a screening and ranking methodology applied to the output of the Axioma U.S. Equity Medium Horizon Fundamental Factor Risk model.
Is the Fund replicating or sampling?
The Fund is replicating.
How did the Fund perform relative to its benchmark for the fiscal year ended March 31, 2012?
For the fiscal year ended March 31, 2012, the Fund gained 3.68%. This is compared to the Fund’s benchmark, the Russell-Axioma U.S. Small Cap High Momentum Index, which gained 4.20% during the same period. The Fund’s performance includes operating expenses, whereas indexes are unmanaged and index returns do not include expenses of any kind.
There were no significant changes to either the Fund or Index during the reporting period.
Did the Fund outperform or underperform the benchmark or was performance as expected based on expenses, etc.?
The Fund performed as expected against the benchmark.
Over the reporting period, please describe those sectors that outperformed or underperformed.
Sectors achieved both positive and negative returns for the Fund and the Index. Health care was the best performing sector for the Fund and the Index, while consumer staples was the worst performing sector. Health care, with an average weight of 15.7% was the best contributor to Fund and Index returns. Technology, with an average weight of 13.0%, was the worst contributor to Fund and Index returns.
Over the reporting period, please describe those individual securities (constituents) that outperformed or underperformed.
Jazz Pharmaceuticals Plc, Domino’s Pizza Inc, and Kodiak Oil & Gas Corp generated positive returns and contributed the most to Fund performance while TPC Group Inc, Diamond Foods Inc, and Pioneer Drilling Co, all declined which detracted from Fund performance.
The views expressed in this report reflect those of the portfolio managers only through the end of the period covered by the report. These views do not necessarily represent the views of RIMCo, or any other person in RIMCo or any other affiliated organization. These views are subject to change at any time based upon market conditions or other events, and RIMCo disclaims any responsibility to update the views contained herein. These views should not be relied on as investment advice and, because investment decisions for a Russell Exchange Traded Funds Trust (“RET”) Fund are based on numerous factors, should not be relied on as an indication of investment decisions of any RET Fund.
| * | | Commenced operations by issuing shares May 26, 2011. |
| ** | | The Russell-Axioma U.S. Small Cap High Momentum Index is designed to deliver exposure to stocks with high medium-term momentum as determined by a screening and ranking methodology applied to the output of the Axioma U.S. Equity Medium Horizon Fundamental Factor Risk model. Medium-term momentum is a measure of a stock’s past price performance as measured by cumulative return over the last 250 trading days, excluding the last 20 trading days. Stocks exhibiting high momentum can be used by investors to adjust momentum exposure in a portfolio. |
Performance is historical and assumes reinvestment of all dividends and capital gains. Investment return and principal value will fluctuate so that an investor’s shares, when redeemed, may be worth more or less than when purchased. Past performance is not indicative of future results. The returns shown do not reflect the deduction of taxes that a shareholder would pay on Fund distributions or the redemption of Fund shares.
| | |
| Russell 2000® High Momentum ETF | | 119 |
Russell Exchange Traded Funds Trust
Russell 2000 High Momentum ETF
Shareholder Expense Example — March 31, 2012 (Unaudited)
Fund Expenses
The following disclosure provides important information regarding each Fund’s Expense Example, which appears on each Fund’s individual page in this Annual Report. Please refer to this information when reviewing the Expense Example for a Fund.
Example
As a shareholder of the Fund, you incur two types of costs: (1) transaction costs, including brokerage commissions on purchases and sales of your Fund shares and (2) ongoing costs, including management fees and other Fund expenses. The Example is intended to help you understand your ongoing costs (in dollars) of investing in the Fund and to compare these costs with the ongoing costs of investing in other funds. The Example is based on an investment of $1,000 invested at the beginning of the period and held for the entire period indicated, which for this Fund is from October 1, 2011 to March 31, 2012.
Actual Expenses
The information in the table under the heading “Actual Performance” provides information about actual account values and actual expenses. You may use the information in this column, together with the amount you invested, to estimate the expenses that you paid over the period. Simply divide your account value by $1,000 (for example, an $8,600 account value divided by $1,000 = 8.6), then multiply the result by the number in the first column in the row entitled “Expenses Paid During Period” to estimate the expenses you paid on your account during this period.
Hypothetical Example for Comparison Purposes
The information in the table under the heading “Hypothetical Performance (5% return before expenses)” provides information about hypothetical account values and hypothetical expenses based on the Fund’s actual expense ratio and an assumed rate of return of 5% per year before expenses, which is not the Fund’s actual return. The hypothetical account values and expenses may not be used to estimate the actual ending account balance or expenses you paid for the period. You may use this information to compare the ongoing costs of investing in the Fund and other funds. To do so, compare this 5% hypothetical example with the 5% hypothetical examples that appear in the shareholder reports of other funds.
Please note that the expenses shown in the table are meant to highlight your ongoing costs only and do not reflect any transactional costs, such as brokerage commissions paid on purchases and sales of Fund shares. Therefore, the information under the heading “Hypothetical Performance (5% return before expenses)” is useful in comparing ongoing costs only, and will not help you determine the relative total costs of owning different funds. In addition, if these transactional costs were included, your costs would have been higher.
| | | | | | | | |
| | | Actual
Performance | | | Hypothetical
Performance
(5% return
before expenses) | |
| | | | | | | | |
Beginning Account Value | | | | | | | | |
October 1, 2011 | | $ | 1,000.00 | | | $ | 1,000.00 | |
Ending Account Value | | | | | | | | |
March 31, 2012 | | $ | 1,296.40 | | | $ | 1,023.10 | |
Expenses Paid During the Period* | | $ | 2.19 | | | $ | 1.92 | |
| * | Expenses are equal to the Fund’s annualized expense ratio of 0.38% (representing the six month period annualized), multiplied by the average account value over the period, multiplied by 183/366 (to reflect the one-half year period). Effective November 3, 2011, the annualized expense ratio is 0.30%, as contractually agreed to by the adviser. May reflect amounts waived and/or reimbursed. Without any waivers and/or reimbursements, expenses would have been higher. |
| | | | |
| | 120 | | | Russell 2000 High Momentum ETF |
Russell Exchange Traded Funds Trust
Russell 2000 High Momentum ETF
Schedule of Investments — March 31, 2012
Amounts in thousands (except share amounts)
| | | | | | | | |
| | | Principal
Amount ($)
or Shares | | | Market
Value
$ | |
| | | | | | | | |
| Common Stocks - 99.6% | | | | | | | | |
| Consumer Discretionary - 19.6% | | | | | | | | |
AH Belo Corp. Class A | | | 400 | | | | 2 | |
Amerco, Inc. | | | 164 | | | | 17 | |
American Greetings Corp. Class A | | | 254 | | | | 4 | |
America’s Car-Mart, Inc. (Æ) | | | 320 | | | | 14 | |
Ameristar Casinos, Inc. | | | 295 | | | | 5 | |
Asbury Automotive Group, Inc. (Æ) | | | 625 | | | | 17 | |
Ascena Retail Group, Inc. (Æ) | | | 760 | | | | 34 | |
Avis Budget Group, Inc. (Æ) | | | 79 | | | | 1 | |
BJ’s Restaurants, Inc. (Æ) | | | 147 | | | | 7 | |
Buffalo Wild Wings, Inc. (Æ) | | | 184 | | | | 17 | |
Callaway Golf Co. | | | 619 | | | | 4 | |
Caribou Coffee Co., Inc. (Æ) | | | 1,036 | | | | 19 | |
Carter’s, Inc. (Æ) | | | 560 | | | | 28 | |
Central Garden and Pet Co. Class A (Æ) | | | 498 | | | | 5 | |
Cheesecake Factory, Inc. (The) (Æ) | | | 810 | | | | 24 | |
Conn’s, Inc. (Æ) | | | 229 | | | | 4 | |
Cracker Barrel Old Country Store, Inc. | | | 82 | | | | 5 | |
Crocs, Inc. (Æ) | | | 1,944 | | | | 41 | |
DineEquity, Inc. (Æ) | | | 202 | | | | 10 | |
Dollar Thrifty Automotive Group, Inc. (Æ) | | | 924 | | | | 74 | |
Domino’s Pizza, Inc. | | | 2,842 | | | | 102 | |
Elizabeth Arden, Inc. (Æ) | | | 784 | | | | 27 | |
EW Scripps Co. Class A (Æ) | | | 1,832 | | | | 18 | |
Genesco, Inc. (Æ) | | | 430 | | | | 31 | |
G-III Apparel Group, Ltd. (Æ) | | | 355 | | | | 10 | |
HealthStream, Inc. (Æ) | | | 1,238 | | | | 29 | |
Hibbett Sports, Inc. (Æ) | | | 908 | | | | 50 | |
Iconix Brand Group, Inc. (Æ) | | | 195 | | | | 3 | |
Inter Parfums, Inc. | | | 420 | | | | 7 | |
JOS A Bank Clothiers, Inc. (Æ) | | | 120 | | | | 6 | |
Kirkland’s, Inc. (Æ) | | | 657 | | | | 11 | |
Krispy Kreme Doughnuts, Inc. (Æ) | | | 192 | | | | 1 | |
Libbey, Inc. (Æ) | | | 447 | | | | 6 | |
Lithia Motors, Inc. Class A | | | 974 | | | | 26 | |
Marchex, Inc. Class A | | | 1,184 | | | | 5 | |
Men’s Wearhouse, Inc. (The) | | | 349 | | | | 14 | |
Monro Muffler Brake, Inc. | | | 460 | | | | 19 | |
Motorcar Parts of America, Inc. (Æ) | | | 232 | | | | 2 | |
New York & Co., Inc. (Æ) | | | 838 | | | | 3 | |
Nu Skin Enterprises, Inc. Class A | | | 476 | | | | 28 | |
PF Chang’s China Bistro, Inc. | | | 84 | | | | 3 | |
Pool Corp. | | | 282 | | | | 11 | |
Pricesmart, Inc. | | | 1,441 | | | | 104 | |
Rent-A-Center, Inc. Class A | | | 383 | | | | 14 | |
Ruby Tuesday, Inc. (Æ) | | | 909 | | | | 8 | |
Ruth’s Hospitality Group, Inc. (Æ) | | | 1,942 | | | | 15 | |
Six Flags Entertainment Corp. | | | 792 | | | | 37 | |
Sotheby’s Class A | | | 132 | | | | 5 | |
Standard Motor Products, Inc. | | | 462 | | | | 8 | |
Steiner Leisure, Ltd. (Æ) | | | 154 | | | | 8 | |
Steven Madden, Ltd. (Æ) | | | 612 | | | | 26 | |
Sturm Ruger & Co., Inc. | | | 397 | | | | 19 | |
Summer Infant, Inc. (Æ) | | | 294 | | | | 2 | |
Town Sports International Holdings, Inc. (Æ) | | | 300 | | | | 4 | |
| | | | | | | | |
| | | Principal
Amount ($)
or Shares | | | Market
Value
$ | |
Travelzoo, Inc. (Æ) | | | 69 | | | | 2 | |
VOXX International Corp. Class A (Æ) | | | 427 | | | | 6 | |
Zagg, Inc. (Æ) | | | 149 | | | | 2 | |
| | | | | | | | |
| | | | | | | 1,004 | |
| | | | | | | | |
| | |
| Consumer Staples - 5.1% | | | | | | | | |
Boston Beer Co., Inc. Class A (Æ) | | | 107 | | | | 11 | |
Casey’s General Stores, Inc. | | | 518 | | | | 29 | |
GNC Holdings, Inc. Class A | | | 719 | | | | 25 | |
J&J Snack Foods Corp. | | | 366 | | | | 19 | |
Lancaster Colony Corp. | | | 338 | | | | 22 | |
National Beverage Corp. (Æ) | | | 1,066 | | | | 17 | |
Omega Protein Corp. (Æ) | | | 2,134 | | | | 16 | |
Peet’s Coffee & Tea, Inc. (Æ) | | | 93 | | | | 7 | |
Schiff Nutrition International, Inc. (Æ) | | | 486 | | | | 6 | |
Smart Balance, Inc. (Æ) | | | 3,617 | | | | 24 | |
Susser Holdings Corp. (Æ) | | | 799 | | | | 21 | |
TreeHouse Foods, Inc. (Æ) | | | 224 | | | | 13 | |
United Natural Foods, Inc. (Æ) | | | 386 | | | | 18 | |
Vector Group, Ltd. | | | 1,751 | | | | 32 | |
| | | | | | | | |
| | | | | | | 260 | |
| | | | | | | | |
| | |
| Energy - 7.9% | | | | | | | | |
Approach Resources, Inc. (Æ) | | | 819 | | | | 30 | |
Basic Energy Services, Inc. (Æ) | | | 43 | | | | 1 | |
Berry Petroleum Co. Class A | | | 280 | | | | 13 | |
Capstone Turbine Corp. (Æ) | | | 10,478 | | | | 11 | |
CVR Energy, Inc. (Æ) | | | 1,281 | | | | 34 | |
Delek US Holdings, Inc. | | | 312 | | | | 5 | |
Dril-Quip, Inc. (Æ) | | | 100 | | | | 7 | |
Energy XXI Bermuda, Ltd. (Æ) | | | 54 | | | | 2 | |
Golar LNG, Ltd. | | | 1,956 | | | | 74 | |
Gulfport Energy Corp. (Æ) | | | 1,185 | | | | 35 | |
Hornbeck Offshore Services, Inc. (Æ) | | | 69 | | | | 3 | |
Kodiak Oil & Gas Corp. (Æ) | | | 5,722 | | | | 57 | |
Lufkin Industries, Inc. | | | 28 | | | | 2 | |
Mitcham Industries, Inc. (Æ) | | | 148 | | | | 3 | |
Northern Oil and Gas, Inc. (Æ) | | | 443 | | | | 9 | |
Oasis Petroleum, Inc. (Æ) | | | 64 | | | | 2 | |
REX American Resources Corp. (Æ) | | | 1,441 | | | | 44 | |
Rosetta Resources, Inc. (Æ) | | | 468 | | | | 23 | |
Stone Energy Corp. (Æ) | | | 71 | | | | 2 | |
W&T Offshore, Inc. | | | 1,366 | | | | 29 | |
Western Refining, Inc. | | | 479 | | | | 9 | |
World Fuel Services Corp. | | | 192 | | | | 8 | |
| | | | | | | | |
| | | | | | | 403 | |
| | | | | | | | |
| | |
| Financial Services - 20.4% | | | | | | | | |
Advance America Cash Advance Centers, Inc. | | | 1,044 | | | | 11 | |
Advent Software, Inc. (Æ) | | | 358 | | | | 9 | |
Ameris Bancorp (Æ) | | | 188 | | | | 2 | |
Amtrust Financial Services, Inc. | | | 105 | | | | 3 | |
Anworth Mortgage Asset Corp. (ö) | | | 1,305 | | | | 9 | |
Apollo Investment Corp. | | | 743 | | | | 5 | |
Arrow Financial Corp. | | | 303 | | | | 7 | |
Ashford Hospitality Trust, Inc. (ö) | | | 1,496 | | | | 13 | |
| | |
| Russell 2000 High Momentum ETF | | 121 |
Russell Exchange Traded Funds Trust
Russell 2000 High Momentum ETF
Schedule of Investments, continued — March 31, 2012
Amounts in thousands (except share amounts)
| | | | | | | | |
| | | Principal
Amount ($)
or Shares | | | Market
Value
$ | |
| | | | | | | | |
Associated Estates Realty Corp. (ö) | | | 495 | | | | 8 | |
Bank of the Ozarks, Inc. | | | 118 | | | | 4 | |
BGC Partners, Inc. Class A | | | 1,148 | | | | 8 | |
BlackRock Kelso Capital Corp. | | | 2,021 | | | | 20 | |
Cardtronics, Inc. (Æ) | | | 2,013 | | | | 54 | |
CBL & Associates Properties, Inc. (ö) | | | 1,269 | | | | 24 | |
Colonial Properties Trust (ö) | | | 559 | | | | 12 | |
Coresite Realty Corp. (ö) | | | 1,171 | | | | 28 | |
Delphi Financial Group, Inc. Class A | | | 332 | | | | 15 | |
DuPont Fabros Technology, Inc. (ö) | | | 647 | | | | 16 | |
Dynex Capital, Inc. (ö) | | | 1,830 | | | | 17 | |
Entertainment Properties Trust (ö) | | | 707 | | | | 33 | |
Epoch Holding Corp. | | | 1,893 | | | | 45 | |
Evercore Partners, Inc. Class A | | | 232 | | | | 7 | |
Extra Space Storage, Inc. (ö) | | | 766 | | | | 22 | |
Ezcorp, Inc. Class A (Æ) | | | 585 | | | | 19 | |
Financial Engines, Inc. (Æ) | | | 79 | | | | 2 | |
First Cash Financial Services, Inc. (Æ) | | | 507 | | | | 22 | |
First Industrial Realty Trust, Inc. (Æ)(ö) | | | 224 | | | | 3 | |
First Interstate Bancsystem, Inc. Class A | | | 213 | | | | 3 | |
First Midwest Bancorp, Inc. | | | 377 | | | | 5 | |
Getty Realty Corp. (ö) | | | 150 | | | | 2 | |
Gladstone Commercial Corp. (ö) | | | 435 | | | | 7 | |
Glimcher Realty Trust (ö) | | | 3,451 | | | | 35 | |
Government Properties Income Trust (ö) | | | 366 | | | | 9 | |
Greenlight Capital Re, Ltd. Class A (Æ) | | | 298 | | | | 7 | |
Hatteras Financial Corp. (ö) | | | 188 | | | | 5 | |
Hersha Hospitality Trust Class A (ö) | | | 3,007 | | | | 16 | |
HFF, Inc. Class A (Æ) | | | 171 | | | | 3 | |
Hudson Valley Holding Corp. | | | 85 | | | | 1 | |
Intersections, Inc. | | | 412 | | | | 5 | |
iStar Financial, Inc. (Æ)(ö) | | | 1,399 | | | | 10 | |
Kennedy-Wilson Holdings, Inc. | | | 777 | | | | 10 | |
Kohlberg Capital Corp. | | | 221 | | | | 2 | |
Ladenburg Thalmann Financial Services, Inc. (Æ) | | | 5,203 | | | | 9 | |
LaSalle Hotel Properties (ö) | | | 354 | | | | 10 | |
MarketAxess Holdings, Inc. | | | 481 | | | | 18 | |
MCG Capital Corp. | | | 3,193 | | | | 14 | |
Meadowbrook Insurance Group, Inc. | | | 1,020 | | | | 10 | |
Medical Properties Trust, Inc. (ö) | | | 446 | | | | 4 | |
MFA Financial, Inc. (ö) | | | 2,897 | | | | 22 | |
National Financial Partners Corp. (Æ) | | | 290 | | | | 4 | |
National Health Investors, Inc. (ö) | | | 395 | | | | 19 | |
Nelnet, Inc. Class A | | | 232 | | | | 6 | |
New Mountain Finance Corp. | | | 801 | | | | 11 | |
NewStar Financial, Inc. (Æ) | | | 2,437 | | | | 27 | |
NorthStar Realty Finance Corp. (ö) | | | 1,811 | | | | 10 | |
Ocwen Financial Corp. (Æ) | | | 391 | | | | 6 | |
Omega Healthcare Investors, Inc. (ö) | | | 394 | | | | 8 | |
OneBeacon Insurance Group, Ltd. Class A | | | 245 | | | | 4 | |
Oriental Financial Group, Inc. | | | 861 | | | | 10 | |
PennantPark Investment Corp. | | | 1,850 | | | | 19 | |
Peoples Bancorp, Inc. | | | 708 | | | | 12 | |
Post Properties, Inc. (ö) | | | 660 | | | | 31 | |
Presidential Life Corp. | | | 227 | | | | 3 | |
Resource Capital Corp. (ö) | | | 679 | | | | 4 | |
Retail Opportunity Investments Corp. (ö) | | | 1,808 | | | | 22 | |
| | | | | | | | |
| | | Principal
Amount ($)
or Shares | | | Market
Value
$ | |
RLI Corp. | | | 534 | | | | 38 | |
Signature Bank NY (Æ) | | | 85 | | | | 5 | |
Sovran Self Storage, Inc. (ö) | | | 80 | | | | 4 | |
Strategic Hotels & Resorts, Inc. (Æ)(ö) | | | 794 | | | | 5 | |
Sun Communities, Inc. (ö) | | | 559 | | | | 24 | |
Susquehanna Bancshares, Inc. | | | 381 | | | | 4 | |
TICC Capital Corp. | | | 1,401 | | | | 14 | |
Trustmark Corp. | | | 743 | | | | 19 | |
Two Harbors Investment Corp. (ö) | | | 182 | | | | 2 | |
Virtus Investment Partners, Inc. (Æ) | | | 804 | | | | 70 | |
Walter Investment Management Corp. | | | 53 | | | | 1 | |
Webster Financial Corp. | | | 469 | | | | 11 | |
Wintrust Financial Corp. | | | 225 | | | | 8 | |
World Acceptance Corp. (Æ) | | | 233 | | | | 14 | |
Wright Express Corp. (Æ) | | | 32 | | | | 2 | |
| | | | | | | | |
| | | | | | | 1,042 | |
| | | | | | | | |
| | |
| Health Care - 20.7% | | | | | | | | |
Air Methods Corp. (Æ) | | | 45 | | | | 4 | |
Akorn, Inc. (Æ) | | | 2,176 | | | | 25 | |
Align Technology, Inc. (Æ) | | | 63 | | | | 2 | |
Alkermes PLC (Æ) | | | 174 | | | | 3 | |
Ariad Pharmaceuticals, Inc. (Æ) | | | 3,966 | | | | 63 | |
AtriCure, Inc. (Æ) | | | 194 | | | | 2 | |
Cantel Medical Corp. | | | 555 | | | | 14 | |
Cardiovascular Systems, Inc. (Æ) | | | 1,839 | | | | 17 | |
Computer Programs & Systems, Inc. | | | 259 | | | | 15 | |
DexCom, Inc. (Æ) | | | 126 | | | | 1 | |
Endologix, Inc. (Æ) | | | 2,232 | | | | 33 | |
Ensign Group, Inc. (The) | | | 2,779 | | | | 76 | |
Exact Sciences Corp. (Æ) | | | 1,264 | | | | 14 | |
Exelixis, Inc. (Æ) | | | 159 | | | | 1 | |
HeartWare International, Inc. (Æ) | | | 444 | | | | 29 | |
Hi-Tech Pharmacal Co., Inc. (Æ) | | | 800 | | | | 29 | |
HMS Holdings Corp. (Æ) | | | 881 | | | | 27 | |
Idenix Pharmaceuticals, Inc. (Æ) | | | 1,809 | | | | 18 | |
Infinity Pharmaceuticals, Inc. (Æ) | | | 8,546 | | | | 103 | |
IPC The Hospitalist Co., Inc. (Æ) | | | 37 | | | | 1 | |
ISTA Pharmaceuticals, Inc. (Æ) | | | 436 | | | | 4 | |
Jazz Pharmaceuticals PLC (Æ) | | | 1,364 | | | | 67 | |
Ligand Pharmaceuticals, Inc. Class B (Æ) | | | 95 | | | | 2 | |
MAKO Surgical Corp. (Æ) | | | 885 | | | | 37 | |
Medivation, Inc. (Æ) | | | 469 | | | | 35 | |
Merit Medical Systems, Inc. (Æ) | | | 625 | | | | 8 | |
MWI Veterinary Supply, Inc. (Æ) | | | 24 | | | | 2 | |
Navidea Biopharmaceuticals, Inc. (Æ) | | | 1,166 | | | | 4 | |
NxStage Medical, Inc. (Æ) | | | 1,620 | | | | 31 | |
Obagi Medical Products, Inc. (Æ) | | | 508 | | | | 7 | |
Oncothyreon, Inc. (Æ) | | | 1,431 | | | | 6 | |
Opko Health, Inc. (Æ) | | | 652 | | | | 3 | |
OraSure Technologies, Inc. (Æ) | | | 1,229 | | | | 14 | |
Pain Therapeutics, Inc. (Æ) | | | 3,588 | | | | 13 | |
PDL BioPharma, Inc. | | | 299 | | | | 2 | |
Pharmacyclics, Inc. (Æ) | | | 1,616 | | | | 45 | |
Quality Systems, Inc. | | | 549 | | | | 24 | |
Questcor Pharmaceuticals, Inc. ( Æ) | | | 1,432 | | | | 54 | |
Rockwell Medical Technologies, Inc. (Æ) | | | 2,376 | | | | 22 | |
| | | | |
| | 122 | | | Russell 2000 High Momentum ETF |
Russell Exchange Traded Funds Trust
Russell 2000 High Momentum ETF
Schedule of Investments, continued — March 31, 2012
Amounts in thousands (except share amounts)
| | | | | | | | |
| | | Principal
Amount ($)
or Shares | | | Market
Value
$ | |
| | | | | | | | |
RTI Biologics, Inc. (Æ) | | | 847 | | | | 3 | |
Salix Pharmaceuticals, Ltd. (Æ) | | | 580 | | | | 30 | |
Sciclone Pharmaceuticals, Inc. (Æ) | | | 2,883 | | | | 18 | |
Spectrum Pharmaceuticals, Inc. (Æ) | | | 4,454 | | | | 56 | |
Theravance, Inc. (Æ) | | | 202 | | | | 4 | |
Transcend Services, Inc. (Æ) | | | 84 | | | | 2 | |
Universal American Corp. | | | 309 | | | | 3 | |
Viropharma, Inc. (Æ) | | | 935 | | | | 28 | |
Vivus, Inc. (Æ) | | | 365 | | | | 8 | |
WellCare Health Plans, Inc. (Æ) | | | 595 | | | | 43 | |
ZIOPHARM Oncology, Inc. (Æ) | | | 1,957 | | | | 11 | |
Zoll Medical Corp. (Æ) | | | 38 | | | | 4 | |
| | | | | | | | |
| | | | | | | 1,067 | |
| | | | | | | | |
| | |
| Materials and Processing - 6.3% | | | | | | | | |
Acuity Brands, Inc. | | | 204 | | | | 13 | |
American Vanguard Corp. | | | 332 | | | | 7 | |
Beacon Roofing Supply, Inc. (Æ) | | | 622 | | | | 16 | |
Belden, Inc. | | | 350 | | | | 13 | |
Boise, Inc. | | | 2,585 | | | | 21 | |
Buckeye Technologies, Inc. | | | 463 | | | | 16 | |
Clearwater Paper Corp. (Æ) | | | 1,407 | | | | 47 | |
Globe Specialty Metals, Inc. | | | 101 | | | | 2 | |
Haynes International, Inc. | | | 76 | | | | 5 | |
Hexcel Corp. (Æ) | | | 696 | | | | 17 | |
Innospec, Inc. (Æ) | | | 374 | | | | 11 | |
Interface, Inc. Class A | | | 96 | | | | 1 | |
Interline Brands, Inc. (Æ) | | | 1,389 | | | | 30 | |
KapStone Paper and Packaging Corp. (Æ) | | | 739 | | | | 15 | |
Kraton Performance Polymers, Inc. (Æ) | | | 13 | | | | — | ± |
LSB Industries, Inc. (Æ) | | | 82 | | | | 3 | |
NewMarket Corp. | | | 27 | | | | 5 | |
PolyOne Corp. | | | 2,442 | | | | 35 | |
Quaker Chemical Corp. | | | 83 | | | | 3 | |
Quanex Building Products Corp. | | | 201 | | | | 4 | |
Schweitzer-Mauduit International, Inc. | | | 635 | | | | 44 | |
Trex Co., Inc. (Æ) | | | 196 | | | | 6 | |
Unifi, Inc. (Æ) | | | 722 | | | | 7 | |
| | | | | | | | |
| | | | | | | 321 | |
| | | | | | | | |
| | |
| Producer Durables - 7.5% | | | | | | | | |
Actuant Corp. Class A | | | 125 | | | | 4 | |
Advisory Board Co. (The) (Æ) | | | 68 | | | | 6 | |
Alamo Group, Inc. | | | 385 | | | | 12 | |
Alaska Air Group, Inc. (Æ) | | | 726 | | | | 26 | |
Argan, Inc. | | | 173 | | | | 3 | |
Astronics Corp. (Æ) | | | 253 | | | | 9 | |
AT Cross Co. Class A (Æ) | | | 422 | | | | 5 | |
Blount International, Inc. (Æ) | | | 281 | | | | 5 | |
Briggs & Stratton Corp. | | | 481 | | | | 9 | |
Bristow Group, Inc. | | | 188 | | | | 9 | |
CAI International, Inc. (Æ) | | | 188 | | | | 3 | |
Ceradyne, Inc. | | | 53 | | | | 2 | |
Chart Industries, Inc. (Æ) | | | 330 | | | | 24 | |
Coleman Cable, Inc. (Æ) | | | 1,070 | | | | 10 | |
Colfax Corp. (Æ) | | | 80 | | | | 3 | |
CoStar Group, Inc. (Æ) | | | 32 | | | | 2 | |
| | | | | | | | |
| | | Principal
Amount ($)
or Shares | | | Market
Value
$ | |
Cubic Corp. | | | 287 | | | | 14 | |
Darling International, Inc. (Æ) | | | 268 | | | | 5 | |
Douglas Dynamics, Inc. | | | 232 | | | | 3 | |
Electronics for Imaging, Inc. (Æ) | | | 179 | | | | 3 | |
EnPro Industries, Inc. (Æ) | | | 383 | | | | 16 | |
Generac Holdings, Inc. (Æ) | | | 13 | | | | — | ± |
Global Power Equipment Group, Inc. (Æ) | | | 150 | | | | 4 | |
Gorman-Rupp Co. (The) | | | 177 | | | | 5 | |
Huron Consulting Group, Inc. (Æ) | | | 128 | | | | 5 | |
Insperity, Inc. | | | 286 | | | | 9 | |
Kaman Corp. Class A | | | 382 | | | | 13 | |
Kforce, Inc. (Æ) | | | 1,068 | | | | 16 | |
Liquidity Services, Inc. (Æ) | | | 73 | | | | 3 | |
Littelfuse, Inc. | | | 39 | | | | 2 | |
LoopNet, Inc. (Æ) | | | 1,341 | | | | 25 | |
MasTec, Inc. (Æ) | | | 170 | | | | 3 | |
Measurement Specialties, Inc. (Æ) | | | 89 | | | | 3 | |
Middleby Corp. (Æ) | | | 100 | | | | 10 | |
Miller Industries, Inc. | | | 596 | | | | 10 | |
Mistras Group, Inc. (Æ) | | | 368 | | | | 9 | |
Odyssey Marine Exploration, Inc. (Æ) | | | 1,227 | | | | 4 | |
Primoris Services Corp. | | | 235 | | | | 4 | |
Quality Distribution, Inc. (Æ) | | | 126 | | | | 2 | |
Sauer-Danfoss, Inc. | | | 455 | | | | 21 | |
Spirit Airlines, Inc. (Æ) | | | 218 | | | | 4 | |
Sun Hydraulics Corp. | | | 49 | | | | 1 | |
SYKES Enterprises, Inc. (Æ) | | | 123 | | | | 2 | |
Textainer Group Holdings, Ltd. | | | 161 | | | | 5 | |
Titan International, Inc. | | | 289 | | | | 7 | |
Trimas Corp. (Æ) | | | 1,272 | | | | 28 | |
Twin Disc, Inc. | | | 537 | | | | 14 | |
| | | | | | | | |
| | | | | | | 382 | |
| | | | | | | | |
| | |
| Technology - 8.4% | | | | | | | | |
3D Systems Corp. (Æ) | | | 66 | | | | 2 | |
Acacia Research Corp. (Æ) | | | 185 | | | | 8 | |
ACI Worldwide, Inc. (Æ) | | | 46 | | | | 2 | |
ADTRAN, Inc. | | | 38 | | | | 1 | |
Anixter International, Inc. (Æ) | | | 31 | | | | 2 | |
Arris Group, Inc. (Æ) | | | 1,801 | | | | 20 | |
Aruba Networks, Inc. (Æ) | | | 403 | | | | 9 | |
Cavium, Inc. (Æ) | | | 19 | | | | 1 | |
Ceva, Inc. (Æ) | | | 162 | | | | 4 | |
Checkpoint Systems, Inc. (Æ) | | | 226 | | | | 3 | |
CIBER, Inc. (Æ) | | | 718 | | | | 3 | |
CommVault Systems, Inc. (Æ) | | | 764 | | | | 39 | |
Computer Task Group, Inc. (Æ) | | | 1,210 | | | | 19 | |
Comtech Telecommunications Corp. | | | 63 | | | | 2 | |
Digital River, Inc. (Æ) | | | 413 | | | | 8 | |
Ebix, Inc. | | | 555 | | | | 13 | |
Entegris, Inc. (Æ) | | | 108 | | | | 1 | |
Fabrinet (Æ) | | | 558 | | | | 10 | |
FEI Co. (Æ) | | | 50 | | | | 2 | |
Finisar Corp. (Æ) | | | 854 | | | | 17 | |
GeoEye, Inc. (Æ) | | | 167 | | | | 4 | |
II-VI, Inc. (Æ) | | | 310 | | | | 7 | |
Insight Enterprises, Inc. (Æ) | | | 960 | | | | 21 | |
| | |
| Russell 2000 High Momentum ETF | | 123 |
Russell Exchange Traded Funds Trust
Russell 2000 High Momentum ETF
Schedule of Investments, continued — March 31, 2012
Amounts in thousands (except share amounts)
| | | | | | | | |
| | | Principal
Amount ($)
or Shares | | | Market
Value
$ | |
| | | | | | | | |
IntraLinks Holdings, Inc. (Æ) | | | 110 | | | | 1 | |
Kenexa Corp. (Æ) | | | 122 | | | | 4 | |
Lattice Semiconductor Corp. (Æ) | | | 3,138 | | | | 20 | |
LeCroy Corp. (Æ) | | | 36 | | | | — | ± |
LogMeIn, Inc. (Æ) | | | 263 | | | | 9 | |
MicroStrategy, Inc. Class A (Æ) | | | 9 | | | | 1 | |
Netgear, Inc. (Æ) | | | 32 | | | | 1 | |
Netscout Systems, Inc. (Æ) | | | 55 | | | | 1 | |
NetSuite, Inc. (Æ) | | | 127 | | | | 6 | |
NIC, Inc. | | | 198 | | | | 2 | |
OpenTable, Inc. (Æ) | | | 36 | | | | 1 | |
Opnet Technologies, Inc. | | | 484 | | | | 14 | |
Parametric Technology Corp. (Æ) | | | 512 | | | | 14 | |
PROS Holdings, Inc. (Æ) | | | 134 | | | | 3 | |
QLIK Technologies, Inc. (Æ) | | | 146 | | | | 5 | |
Quest Software, Inc. (Æ) | | | 767 | | | | 18 | |
RealPage, Inc. (Æ) | | | 71 | | | | 1 | |
Richardson Electronics, Ltd. | | | 458 | | | | 5 | |
Semtech Corp. (Æ) | | | 189 | | | | 5 | |
SolarWinds, Inc. (Æ) | | | 54 | | | | 2 | |
Sourcefire, Inc. (Æ) | | | 666 | | | | 33 | |
Sycamore Networks, Inc. (Æ) | | | 101 | | | | 2 | |
Synaptics, Inc. (Æ) | | | 336 | | | | 12 | |
Synchronoss Technologies, Inc. (Æ) | | | 245 | | | | 8 | |
Syntel, Inc. | | | 210 | | | | 12 | |
Take-Two Interactive Software, Inc. (Æ) | | | 111 | | | | 2 | |
Tyler Technologies, Inc. (Æ) | | | 445 | | | | 17 | |
Veeco Instruments, Inc. (Æ) | | | 10 | | | | — | ± |
Virtusa Corp. (Æ) | | | 232 | | | | 4 | |
Web.com Group, Inc. (Æ) | | | 1,074 | | | | 15 | |
Westell Technologies, Inc. Class A (Æ) | | | 6,204 | | | | 14 | |
| | | | | | | | |
| | | | | | | 430 | |
| | | | | | | | |
| | |
| Utilities - 3.7% | | | | | | | | |
8x8, Inc. (Æ) | | | 340 | | | | 1 | |
Atlantic Power Corp. | | | 240 | | | | 3 | |
Central Vermont Public Service Corp. | | | 2,534 | | | | 90 | |
Cogent Communications Group, Inc. (Æ) | | | 360 | | | | 7 | |
El Paso Electric Co. | | | 97 | | | | 3 | |
IDT Corp. Class B | | | 1,211 | | | | 11 | |
Middlesex Water Co. | | | 586 | | | | 11 | |
Neutral Tandem, Inc. (Æ) | | | 170 | | | | 2 | |
NorthWestern Corp. | | | 559 | | | | 20 | |
PNM Resources, Inc. | | | 1,820 | | | | 33 | |
Portland General Electric Co. | | | 110 | | | | 3 | |
UIL Holdings Corp. | | | 88 | | | | 3 | |
| | | | | | | | |
| | | | | | | 187 | |
| | | | | | | | |
| | |
Total Common Stocks (cost $4,689) | | | | | | | 5,096 | |
| | | | | | | | |
| | | | | | | | |
| | | Principal
Amount ($)
or Shares | | | Market
Value
$ | |
| | |
| Warrants & Rights - 0.0% | | | | | | | | |
| Warrants and Rights - 0.0% | | | | | | | | |
Magnum Hunter Resources, Inc. 2013 Warrants (Æ)(Å) | | | 430 | | | | — | ± |
| | | | | | | | |
| | |
Total Warrants & Rights (cost $—) | | | | | | | — | ± |
| | | | | | | | |
| | |
| Short-Term Investments - 0.1% | | | | | | | | |
Russell U.S. Cash Management Fund | | | 6,602 | (¥) | | | 7 | |
| | | | | | | | |
| | | | | | | | |
| | |
Total Short-Term Investments (cost $7) | | | | | | | 7 | |
| | | | | | | | |
| | |
| | | | | | | | |
| | |
Total Investments - 99.7% (identified cost $4,696) | | | | | | | 5,103 | |
| | |
Other Assets and Liabilities,
Net - 0.3% | | | | | | | 15 | |
| | | | | | | | |
| | |
| Net Assets - 100.0% | | | | | | | 5,118 | |
| | | | | | | | |
See accompanying notes which are an integral part of the financial statements.
| | | | |
| | 124 | | | Russell 2000 High Momentum ETF |
Russell Exchange Traded Funds Trust
Russell 2000 High Momentum ETF
Presentation of Portfolio Holdings — March 31, 2012
Amounts in thousands
| | | | | | | | | | | | | | | | | | | | |
| | | Market Value | | | % of Net
Assets | |
| Portfolio Summary | | Level 1 | | | Level 2 | | | Level 3 | | | Total | | |
| | | | | | | | | | | | | | | | | | | | |
Common Stocks | | | | | | | | | | | | | | | | | | | | |
Consumer Discretionary | | $ | 1,004 | | | $ | — | | | $ | — | | | $ | 1,004 | | | | 19.6 | |
Consumer Staples | | | 260 | | | | — | | | | — | | | | 260 | | | | 5.1 | |
Energy | | | 403 | | | | — | | | | — | | | | 403 | | | | 7.9 | |
Financial Services | | | 1,042 | | | | — | | | | — | | | | 1,042 | | | | 20.4 | |
Health Care | | | 1,067 | | | | — | | | | — | | | | 1,067 | | | | 20.7 | |
Materials and Processing | | | 321 | | | | — | | | | — | | | | 321 | | | | 6.3 | |
Producer Durables | | | 382 | | | | — | | | | — | | | | 382 | | | | 7.5 | |
Technology | | | 430 | | | | — | | | | — | | | | 430 | | | | 8.4 | |
Utilities | | | 187 | | | | — | | | | — | | | | 187 | | | | 3.7 | |
Warrants & Rights | | | — | | | | — | | | | — | ** | | | — | ** | | | — | * |
Short-Term Investments | | | — | | | | 7 | | | | — | | | | 7 | | | | 0.1 | |
| | | | | | | | | | | | | | | | | | | | |
| | | | | |
Total Investments | | | 5,096 | | | | 7 | | | | — | | | | 5,103 | | | | 99.7 | |
| | | | | | | | | | | | | | | | | | | | |
Other Assets and Liabilities, Net | | | | | | | | | | | | | | | | | | | 0.3 | |
| | | | | | | | | | | | | | | | | | | | |
| | | | | |
| | | | | | | | | | | | | | | | | | | 100.0 | |
| | | | | | | | | | | | | | | | | | | | |
| * | | Less than 0.05% of net assets. |
For a description of the levels see note 2 in the Notes to Financial Statements.
There were no significant transfers in and out of levels 1, 2 and 3 during the period ending March 31, 2012.
See accompanying notes which are an integral part of the financial statements.
| | |
| Russell 2000 High Momentum ETF | | 125 |
Russell Exchange Traded Funds Trust
Russell 2000 High Momentum ETF
Statement of Asset and Liabilities — March 31, 2012
| | | | |
| Amounts in thousands | | Russell 2000
High Momentum
ETF | |
| | | | |
Assets | | | | |
Investments, at identified cost | | $ | 4,696 | |
Investments, at market* | | | 5,103 | |
Receivables: | | | | |
Dividends | | | 14 | |
Investments sold | | | 212 | |
| | | | |
Total assets | | | 5,329 | |
| | | | |
| |
Liabilities | | | | |
Payables: | | | | |
Investments purchased | | | 210 | |
Accrued fees to affiliates | | | 1 | |
| | | | |
Total liabilities | | | 211 | |
| | | | |
| | | | |
Net Assets | | $ | 5,118 | |
| | | | |
Net Assets Consist of: | | | | |
Undistributed (overdistributed) net investment income | | $ | 11 | |
Accumulated net realized gain (loss) | | | (719 | ) |
Unrealized appreciation (depreciation) on investments | | | 407 | |
Additional paid-in capital | | | 5,419 | |
| | | | |
Net Assets | | $ | 5,118 | |
| | | | |
Net Asset Value, offering and redemption price per share: | | | | |
Net asset value per share:(a) | | $ | 51.18 | |
Net assets | | $ | 5,117,852 | |
Shares outstanding ($.001 par value) | | | 100,002 | |
Amounts in thousands | | | | |
| | | | |
* Investments in Affiliates, Russell U.S. Cash Management Fund | | $ | 7 | |
| (a) | Net asset value per share equals net assets divided by shares outstanding. |
See accompanying notes which are an integral part of the financial statements.
| | | | |
| | 126 | | | Statement of Assets and Liabilities |
Russell Exchange Traded Funds Trust
Russell 2000 High Momentum ETF
Statement of Operations — For the Period Ended March 31, 2012
| | | | |
| Amounts in thousands | | Russell 2000
High Momentum
ETF* | |
| | | | |
Investment Income | | | | |
Dividends | | $ | 91 | |
| | | | |
Total investment income | | | 91 | |
| | | | |
| |
Expenses | | | | |
Management fees | | | 47 | |
Trustee and trustee related fees | | | 23 | |
| | | | |
Expenses before reductions | | | 70 | |
Expense reductions | | | (34 | ) |
| | | | |
Net expenses | | | 36 | |
| | | | |
Net investment income (loss) | | | 55 | |
| | | | |
| |
Net Realized and Unrealized Gain (Loss) | | | | |
Net realized gain (loss) on: | | | | |
Investments | | | (741 | ) |
In-kind redemptions | | | 291 | |
| | | | |
Net realized gain (loss) | | | (450 | ) |
Net change in unrealized appreciation (depreciation) on investments | | | 407 | |
| | | | |
Net realized and unrealized gain (loss) | | | (43 | ) |
| | | | |
Net Increase (Decrease) in Net Assets from Operations | | $ | 12 | |
| | | | |
| * | For the period May 26, 2011 (commencement of operations) to March 31, 2012. |
See accompanying notes which are an integral part of the financial statements.
| | |
| Statement of Operations | | 127 |
Russell Exchange Traded Funds Trust
Russell 2000 High Momentum ETF
Statement of Changes in Net Assets — For the Periods Ended March 31,
| | | | |
| | | Russell 2000 High
Momentum ETF | |
| Amounts in thousands | | 2012* | |
| | | | |
Increase (Decrease) in Net Assets | | | | |
| |
Operations | | | | |
Net investment income (loss) | | $ | 55 | |
Net realized gain (loss) | | | (450 | ) |
Net change in unrealized appreciation (depreciation) | | | 407 | |
| | | | |
Net increase (decrease) in net assets from operations | | | 12 | |
| | | | |
| |
Distributions | | | | |
From net investment income | | | (44 | ) |
| | | | |
Net decrease in net assets from distributions | | | (44 | ) |
| | | | |
| |
Share Transactions | | | | |
Net increase (decrease) in net assets from share transactions | | | 5,150 | |
| | | | |
Total Net Increase (Decrease) in Net Assets | | | 5,118 | |
| |
Net Assets | | | | |
Beginning of period | | | — | |
| | | | |
End of period | | $ | 5,118 | |
| | | | |
Undistributed (overdistributed) net investment income included in net assets | | $ | 11 | |
| * | For the period May 26, 2011 (commencement of operations) to March 31, 2012. |
See accompanying notes which are an integral part of the financial statements.
| | | | |
| | 128 | | | Statement of Changes in Net Assets |
(This page intentionally left blank)
Russell Exchange Traded Funds Trust
Russell 2000 High Momentum ETF
Financial Highlights — For the Period Ended
For a Share Outstanding Throughout Each Period.
| | | | | | | | | | | | | | | | | | | | | | | | |
| | |
$
Net Asset Value,
Beginning of
Period | | | $
Net
Investment
Income (Loss)(a)(e) | | | $
Net Realized
and Unrealized
Gain (Loss) | | | $
Total from
Investment
Operations | | | $
Distributions
from Net
Investment Income | | | $
Total
Distributions | |
Russell 2000 High Momentum ETF | |
March 31, 2012* | | | 49.67 | | | | .32 | | | | 1.49 | | | | 1.81 | | | | (.30 | ) | | | (.30 | ) |
| (a) | Average daily shares outstanding were used for this calculation. |
| (b) | Periods less than one year are not annualized. |
| (c) | The ratios for periods less than one year are annualized. |
| (d) | Portfolio turnover rate excludes securities received or delivered from in-kind creation or redemption units. |
| (e) | Reflects amounts waived by Russell Investment Management Company (“RIMCo”). |
| * | For the period May 26, 2011 (commencement of operations) to March 31, 2012. |
See accompanying notes which are an integral part of the financial statements.
| | | | | | | | | | | | | | | | | | | | | | | | | | |
$
Net Asset Value,
End of
Period | | | %
Total
Return(b) | | | $
Net Assets,
End of Period
(000) | | | %
Ratio of Expenses
to Average
Net Assets,
Gross(c) | | | %
Ratio of Expenses
to Average
Net Assets,
Net(c)(e) | | | %
Ratio of Net
Investment Income
to Average
Net Assets(c)(e) | | | %
Portfolio
Turnover Rate(b)(d) | |
| | | | | | | | | | | | | | | | | | | | | | | | | | |
| | 51.18 | | | | 3.68 | | | | 5,118 | | | | 1.02 | | | | .52 | | | | .81 | | | | 88 | |
See accompanying notes which are an integral part of the financial statements.
Russell Exchange Traded Funds Trust
Russell Developed ex-U.S. Low Beta ETF
Portfolio Management Discussion and Analysis — March 31, 2012 (Unaudited)
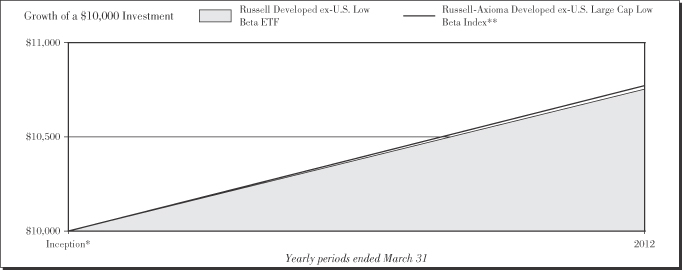
Performance as of March 31, 2012
| | | | | | | | | | | | |
|
| Average Annual Total Return | |
| | | Net Asset
Value | | | Market Value | | | Russell-Axioma
Developed ex-
U.S. Large Cap
Low Beta Index** | |
Inception* | | | 7.53 | % | | | 4.76 | % | | | 7.71 | % |
| | | | |
| | 132 | | | Russell Developed ex-U.S. Low Beta ETF |
Russell Exchange Traded Funds Trust
Russell Developed ex-U.S. Low Beta ETF
Portfolio Management Discussion and Analysis — March 31, 2012 (Unaudited)
The Russell Developed ex-U.S. Low Beta ETF (the “Fund”) is an index-based exchange-traded fund that seeks investment results that closely correspond to the total return of the Russell-Axioma Developed ex-U.S. Large Cap Low Beta Index (the “Index”). Russell Investment Management Company (“RIMCo”), as the Fund’s advisor, uses a “passive” or indexing approach to try to achieve the Fund’s investment objective. Unlike many investment companies, the Fund does not try to “beat” the Index it tracks and does not seek temporary defensive positions when markets decline or appear overvalued. The Fund seeks to gain exposure to the factor exhibited in its Index. The Fund will normally invest at least 80% of its total assets in securities that comprise the Index.
What is the Fund’s investment objective?
The Fund seeks investment results that closely correspond to the total return of the Russell-Axioma Developed ex-U.S. Large Cap Low Beta Index, which is designed to deliver exposure to stocks that have low predicted betas as determined by a screening and ranking methodology applied to the output of the Axioma AX-WW 2.1 World-Wide ex-USA Equity Factor Risk model.
Is the Fund replicating or sampling?
The Fund is replicating.
How did the Fund perform relative to its benchmark for the fiscal year ended March 31, 2012?
For the fiscal year ended March 31, 2012, the Fund gained 7.53%. This is compared to the Fund’s benchmark, the Russell-Axioma Developed ex-U.S. Large Cap Low Beta Index, which gained 7.71% during the same period. The Fund’s performance includes operating expenses, whereas indexes are unmanaged and index returns do not include expenses of any kind.
There were no significant changes to either the Fund or Index during the reporting period.
Did the Fund outperform or underperform the benchmark or was performance as expected based on expenses, etc.?
The Fund performed as expected against the benchmark.
Over the reporting period, please describe those sectors that outperformed or underperformed.
Sectors achieved both positive and negative returns for the Fund and the Index. Consumer discretionary was the best performing sector for the Fund and the Index, while energy was the worst performing sector. Consumer staples, with an average weight of 20.0% was the best contributor to Fund and Index returns. Telecommunication services, with an average weight of 14.6%, was the worst contributor to Fund and Index returns.
Over the reporting period, please describe those individual securities (constituents) that outperformed or underperformed.
Reinet Investments SCA, Toyota Motor Corp, and Anheuser-Busch InBev generated positive returns and contributed the most to Fund performance while Koninklijke KPN NV, France Telecom, and Nippon Telegraph & Telephone Corp, all declined which detracted from Fund performance.
The views expressed in this report reflect those of the portfolio managers only through the end of the period covered by the report. These views do not necessarily represent the views of RIMCo, or any other person in RIMCo or any other affiliated organization. These views are subject to change at any time based upon market conditions or other events, and RIMCo disclaims any responsibility to update the views contained herein. These views should not be relied on as investment advice and, because investment decisions for a Russell Exchange Traded Funds Trust (“RET”) Fund are based on numerous factors, should not be relied on as an indication of investment decisions of any RET Fund.
| * | | Commenced operations by issuing shares November 3, 2011. |
| ** | | The Russell-Axioma Developed ex-U.S. Low Beta Index is designed to deliver exposure to stocks that have low predicted betas as determined by a screening and ranking methodology applied to the output of the Axioma AX-WW 2.1 World-Wide ex-USA Equity Factor Risk model. Beta is a measure of the sensitivity of a stock’s price to a change in the broad market price level, as represented by the Russell Developed ex-U.S. Large Cap Index. Low beta stocks are considered to have a lower risk profile than the overall market and can be used by investors to adjust beta exposure in a portfolio. |
Performance is historical and assumes reinvestment of all dividends and capital gains. Investment return and principal value will fluctuate so that an investor’s shares, when redeemed, may be worth more or less than when purchased. Past performance is not indicative of future results. The returns shown do not reflect the deduction of taxes that a shareholder would pay on Fund distributions or the redemption of Fund shares.
| | |
| Russell Developed ex-U.S. Low Beta ETF | | 133 |
Russell Exchange Traded Funds Trust
Russell Developed ex-U.S. Low Beta ETF
Shareholder Expense Example — March 31, 2012 (Unaudited)
Fund Expenses
The following disclosure provides important information regarding each Fund’s Expense Example, which appears on each Fund’s individual page in this Annual Report. Please refer to this information when reviewing the Expense Example for a Fund.
Example
As a shareholder of the Fund, you incur two types of costs: (1) transaction costs, including brokerage commissions on purchases and sales of your Fund shares and (2) ongoing costs, including management fees and other Fund expenses. The Example is intended to help you understand your ongoing costs (in dollars) of investing in the Fund and to compare these costs with the ongoing costs of investing in other funds. The Example is based on an investment of $1,000 invested at the beginning of the period and held for the entire period indicated, which for this Fund is from November 3, 2011 (commencement of operations) to March 31, 2012.
Actual Expenses
The information in the table under the heading “Actual Performance” provides information about actual account values and actual expenses. You may use the information in this column, together with the amount you invested, to estimate the expenses that you paid over the period. Simply divide your account value by $1,000 (for example, an $8,600 account value divided by $1,000 = 8.6), then multiply the result by the number in the first column in the row entitled “Expenses Paid During Period” to estimate the expenses you paid on your account during this period.
Hypothetical Example for Comparison Purposes
The information in the table under the heading “Hypothetical Performance (5% return before expenses)” provides information about hypothetical account values and hypothetical expenses based on the Fund’s actual expense ratio and an assumed rate of return of 5% per year before expenses, which is not the Fund’s actual return. The hypothetical account values and expenses may not be used to estimate the actual ending account balance or expenses you paid for the period. You may use this information to compare the ongoing costs of investing in the Fund and other funds. To do so, compare this 5% hypothetical example with the 5% hypothetical examples that appear in the shareholder reports of other funds.
Please note that the expenses shown in the table are meant to highlight your ongoing costs only and do not reflect any transactional costs, such as brokerage commissions paid on purchases and sales of Fund shares. Therefore, the information under the heading “Hypothetical Performance (5% return before expenses)” is useful in comparing ongoing costs only, and will not help you determine the relative total costs of owning different funds. In addition, if these transactional costs were included, your costs would have been higher.
| | | | | | | | |
| | | Actual
Performance | | | Hypothetical
Performance
(5% return
before expenses) | |
| | | | | | | | |
Beginning Account Value | | | | | | | | |
November 3, 2011 | | $ | 1,000.00 | | | $ | 1,000.00 | |
Ending Account Value | | | | | | | | |
March 31, 2012 | | $ | 1,075.30 | | | $ | 1,023.75 | |
Expenses Paid During Period* | | $ | 1.06 | | | $ | 1.26 | |
| * | Actual expenses are equal to the Fund’s annualized expense ratio of 0.25% (representing the 150-day period annualized), multiplied by the average account value over the period, multiplied by 150/366 (to reflect the period since commencement of operations). May reflect amounts waived and/or reimbursed. Without the waivers and reimbursements, expenses would have been higher. Hypothetical expenses are equal to the Fund’s annualized expense ratio of 0.25% (representing the six month period annualized), multiplied by the average account value over the period, multiplied by 183/366 (to reflect the one-half period). |
| | | | |
| | 134 | | | Russell Developed ex-U.S. Low Beta ETF |
Russell Exchange Traded Funds Trust
Russell Developed ex-U.S. Low Beta ETF
Schedule of Investments — March 31, 2012
Amounts in thousands (except share amounts)
| | | | | | | | |
| | | Principal
Amount ($)
or Shares | | | Market
Value
$ | |
| | | | | | | | |
| Common Stocks - 98.2% | | | | | | | | |
| Australia - 0.4% | | | | | | | | |
AGL Energy, Ltd. | | | 542 | | | | 8 | |
Myer Holdings, Ltd. | | | 1,323 | | | | 3 | |
Telstra Corp., Ltd. | | | 2,864 | | | | 10 | |
| | | | | | | | |
| | | | | | | 21 | |
| | | | | | | | |
| | |
| Austria - 0.8% | | | | | | | | |
EVN AG | | | 238 | | | | 3 | |
Oesterreichische Post AG | | | 62 | | | | 2 | |
Telekom Austria AG - ADR | | | 2,661 | | | | 31 | |
Verbund AG Class A | | | 96 | | | | 3 | |
| | | | | | | | |
| | | | | | | 39 | |
| | | | | | | | |
| | |
| Belgium - 1.7% | | | | | | | | |
Anheuser-Busch InBev NV | | | 1,015 | | | | 75 | |
Delhaize Group SA | | | 81 | | | | 4 | |
Elia System Operator SA | | | 127 | | | | 5 | |
UCB SA | | | 72 | | | | 3 | |
| | | | | | | | |
| | | | | | | 87 | |
| | | | | | | | |
| | |
| Bermuda - 1.9% | | | | | | | | |
Cheung Kong Infrastructure Holdings, Ltd. | | | 3,000 | | | | 19 | |
Chinese Estates Holdings, Ltd. | | | 2,500 | | | | 3 | |
Dairy Farm International Holdings, Ltd. | | | 900 | | | | 9 | |
Esprit Holdings, Ltd. | | | 3,600 | | | | 7 | |
Genting Hong Kong, Ltd. (Æ) | | | 44,000 | | | | 17 | |
Kerry Properties, Ltd. | | | 3,000 | | | | 14 | |
Li & Fung, Ltd. | | | 8,000 | | | | 19 | |
VTech Holdings, Ltd. | | | 800 | | | | 10 | |
| | | | | | | | |
| | | | | | | 98 | |
| | | | | | | | |
| | |
| Canada - 11.8% | | | | | | | | |
Agrium, Inc. | | | 88 | | | | 8 | |
Alimentation Couche Tard, Inc. Class B | | | 241 | | | | 8 | |
Atco, Ltd. Class I | | | 190 | | | | 13 | |
BCE, Inc. | | | 1,758 | | | | 71 | |
Bell Aliant, Inc. | | | 905 | | | | 25 | |
Bombardier, Inc. Class B | | | 2,822 | | | | 12 | |
Brookfield Asset Management, Inc. Class A | | | 326 | | | | 10 | |
Brookfield Office Properties, Inc. | | | 601 | | | | 10 | |
Cameco Corp. | | | 38 | | | | 1 | |
Canadian National Railway Co. | | | 466 | | | | 37 | |
Canadian Pacific Railway, Ltd. | | | 468 | | | | 35 | |
Canadian Utilities, Ltd. Class A | | | 474 | | | | 31 | |
Celestica, Inc. (Æ) | | | 200 | | | | 2 | |
Emera, Inc. | | | 229 | | | | 8 | |
Enbridge, Inc. | | | 74 | | | | 3 | |
Encana Corp. | | | 125 | | | | 2 | |
Fortis, Inc. | | | 1,154 | | | | 37 | |
George Weston, Ltd. | | | 81 | | | | 5 | |
Groupe Aeroplan, Inc. | | | 180 | | | | 2 | |
IGM Financial, Inc. | | | 149 | | | | 7 | |
InterOil Corp. (Æ) | | | 9 | | | | —± | |
Jean Coutu Group PJC, Inc. (The) Class A | | | 834 | | | | 12 | |
Loblaw Cos., Ltd. | | | 143 | | | | 5 | |
| | | | | | | | |
| | | Principal
Amount ($)
or Shares | | | Market
Value
$ | |
Magna International, Inc. Class A | | | 221 | | | | 11 | |
Manitoba Telecom Services, Inc. - ADR | | | 766 | | | | 27 | |
Metro, Inc. Class A | | | 398 | | | | 21 | |
Nexen, Inc. | | | 188 | | | | 3 | |
Niko Resources, Ltd. | | | 7 | | | | —± | |
Open Text Corp. (Æ) | | | 151 | | | | 9 | |
Potash Corp. of Saskatchewan, Inc. | | | 130 | | | | 6 | |
Rogers Communications, Inc. Class B | | | 679 | | | | 27 | |
Royal Bank of Canada - GDR | | | 575 | | | | 33 | |
Saputo, Inc. - ADR | | | 359 | | | | 16 | |
Shaw Communications, Inc. Class B | | | 334 | | | | 7 | |
Shoppers Drug Mart Corp. | | | 251 | | | | 11 | |
SouthGobi Resources, Ltd. (Æ) | | | 125 | | | | 1 | |
Talisman Energy, Inc. | | | 250 | | | | 3 | |
TELUS Corp. Class A | | | 458 | | | | 26 | |
TELUS Corp. | | | 328 | | | | 19 | |
Tim Hortons, Inc. | | | 104 | | | | 6 | |
TransAlta Corp. | | | 499 | | | | 9 | |
Valeant Pharmaceuticals International, Inc. (Æ) | | | 602 | | | | 32 | |
Viterra, Inc. Class Common Subscription Recei | | | 350 | | | | 6 | |
| | | | | | | | |
| | | | | | | 617 | |
| | | | | | | | |
| | |
| Cayman Islands - 0.5% | | | | | | | | |
MGM China Holdings, Ltd. | | | 2,400 | | | | 4 | |
Sands China, Ltd. | | | 5,200 | | | | 20 | |
Wynn Macau, Ltd. | | | 1,200 | | | | 4 | |
| | | | | | | | |
| | | | | | | 28 | |
| | | | | | | | |
| | |
| Denmark - 0.1% | | | | | | | | |
Novo Nordisk A/S Class B | | | 44 | | | | 6 | |
| | | | | | | | |
| | |
| Finland - 0.5% | | | | | | | | |
Elisa OYJ Class A | | | 119 | | | | 3 | |
Fortum OYJ | | | 127 | | | | 3 | |
Nokia OYJ | | | 650 | | | | 4 | |
Nokian Renkaat OYJ | | | 210 | | | | 10 | |
Orion OYJ Class B | | | 359 | | | | 7 | |
| | | | | | | | |
| | | | | | | 27 | |
| | | | | | | | |
| | |
| France - 2.7% | | | | | | | | |
Alcatel-Lucent - ADR (Æ) | | | 1,238 | | | | 3 | |
Casino Guichard Perrachon SA (Æ) | | | 116 | | | | 11 | |
Cie Generale d’Optique Essilor International SA | | | 146 | | | | 13 | |
Danone | | | 83 | | | | 6 | |
Faurecia | | | 129 | | | | 3 | |
France Telecom SA - ADR | | | 1,977 | | | | 29 | |
Iliad SA | | | 12 | | | | 2 | |
Ipsen SA | | | 139 | | | | 4 | |
L’Oreal SA | | | 74 | | | | 9 | |
Pernod-Ricard SA | | | 110 | | | | 11 | |
Safran SA | | | 174 | | | | 6 | |
Sanofi - ADR | | | 414 | | | | 33 | |
Suez Environnement Co. | | | 313 | | | | 5 | |
| | |
| Russell Developed ex-U.S. Low Beta ETF | | 135 |
Russell Exchange Traded Funds Trust
Russell Developed ex-U.S. Low Beta ETF
Schedule of Investments, continued — March 31, 2012
Amounts in thousands (except share amounts)
| | | | | | | | |
| | | Principal
Amount ($)
or Shares | | | Market
Value
$ | |
| | | | | | | | |
Vivendi SA - ADR | | | 176 | | | | 3 | |
| | | | | | | | |
| | | | | | | 138 | |
| | | | | | | | |
| | |
| Germany - 6.2% | | | | | | | | |
Bayer AG | | | 382 | | | | 27 | |
Beiersdorf AG (Æ) | | | 23 | | | | 1 | |
Celesio AG | | | 4 | | | | — | ± |
Continental AG | | | 221 | | | | 21 | |
Daimler AG | | | 158 | | | | 10 | |
Deutsche Telekom AG | | | 2,489 | | | | 30 | |
E.ON AG | | | 33 | | | | 1 | |
Fresenius Medical Care AG & Co. KGaA | | | 393 | | | | 28 | |
Fresenius SE & Co. KGaA | | | 138 | | | | 14 | |
Henkel AG & Co. KGaA | | | 652 | | | | 41 | |
Linde AG | | | 61 | | | | 11 | |
Merck KGaA | | | 108 | | | | 12 | |
Metro AG | | | 180 | | | | 7 | |
MTU Aero Engines Holding AG | | | 379 | | | | 30 | |
Rhoen Klinikum AG | | | 526 | | | | 11 | |
RWE AG | | | 320 | | | | 15 | |
SAP AG - ADR | | | 537 | | | | 37 | |
Stada Arzneimittel AG | | | 9 | | | | — | ± |
TUI AG (Æ) | | | 474 | | | | 4 | |
United Internet AG | | | 659 | | | | 12 | |
Volkswagen AG | | | 56 | | | | 9 | |
Wincor Nixdorf AG | | | 77 | | | | 4 | |
| | | | | | | | |
| | | | | | | 325 | |
| | | | | | | | |
| | |
| Greece - 0.2% | | | | | | | | |
Coca Cola Hellenic Bottling Co. SA - ADR (Æ) | | | 331 | | | | 6 | |
Hellenic Telecommunication Org | | | 1,800 | | | | 4 | |
| | | | | | | | |
| | | | | | | 10 | |
| | | | | | | | |
| | |
| Hong Kong - 8.7% | | | | | | | | |
AIA Group, Ltd. | | | 5,800 | | | | 21 | |
Bank of East Asia, Ltd. | | | 2,600 | | | | 10 | |
Cathay Pacific Airways, Ltd. | | | 1,000 | | | | 2 | |
Cheung Kong Holdings, Ltd. | | | 3,000 | | | | 39 | |
CLP Holdings, Ltd. | | | 4,500 | | | | 39 | |
Galaxy Entertainment Group, Ltd. (Æ) | | | 3,000 | | | | 8 | |
Hang Lung Group, Ltd. | | | 2,000 | | | | 13 | |
Hang Lung Properties, Ltd. - ADR | | | 5,000 | | | | 18 | |
Hang Seng Bank, Ltd. | | | 700 | | | | 9 | |
Henderson Land Development Co., Ltd. | | | 3,000 | | | | 17 | |
HKT Trust / HKT, Ltd. (Æ) | | | 1,717 | | | | 1 | |
Hong Kong & China Gas Co., Ltd. | | | 17,000 | | | | 45 | |
Hong Kong Aircraft Engineering Co., Ltd. | | | 400 | | | | 5 | |
Hong Kong Exchanges and Clearing, Ltd. | | | 500 | | | | 8 | |
Hysan Development Co., Ltd. | | | 5,000 | | | | 20 | |
MTR Corp. | | | 3,000 | | | | 11 | |
New World Development Co., Ltd. | | | 19,000 | | | | 23 | |
PCCW, Ltd. | | | 78,000 | | | | 28 | |
Power Assets Holdings, Ltd. | | | 4,000 | | | | 29 | |
Sino Land Co., Ltd. | | | 10,000 | | | | 16 | |
SJM Holdings, Ltd. | | | 5,000 | | | | 10 | |
Sun Hung Kai Properties, Ltd. | | | 3,000 | | | | 37 | |
| | | | | | | | |
| | | Principal
Amount ($)
or Shares | | | Market
Value
$ | |
Swire Pacific, Ltd. Class A | | | 500 | | | | 6 | |
Television Broadcasts, Ltd. | | | 1,000 | | | | 7 | |
Wharf Holdings, Ltd. | | | 3,000 | | | | 16 | |
Wing Hang Bank, Ltd. | | | 1,500 | | | | 15 | |
| | | | | | | | |
| | | | | | | 453 | |
| | | | | | | | |
| | |
| Ireland - 0.4% | | | | | | | | |
Elan Corp. PLC (Æ) | | | 216 | | | | 3 | |
Kerry Group PLC Class A | | | 365 | | | | 17 | |
| | | | | | | | |
| | | | | | | 20 | |
| | | | | | | | |
| | |
| Israel - 1.1% | | | | | | | | |
Teva Pharmaceutical Industries, Ltd. | | | 1,245 | | | | 55 | |
| | | | | | | | |
| | |
| Japan - 27.8% | | | | | | | | |
Acom Co., Ltd. (Æ) | | | 80 | | | | 2 | |
Advantest Corp. | | | 200 | | | | 3 | |
Aeon Co., Ltd. | | | 1,200 | | | | 16 | |
Aeon Credit Service Co., Ltd. | | | 2,100 | | | | 33 | |
Aisin Seiki Co., Ltd. | | | 400 | | | | 14 | |
Ajinomoto Co., Inc. | | | 1,000 | | | | 13 | |
Asahi Group Holdings, Ltd. | | | 400 | | | | 9 | |
Astellas Pharma, Inc. | | | 700 | | | | 29 | |
Bridgestone Corp. | | | 400 | | | | 10 | |
Canon, Inc. | | | 1,400 | | | | 67 | |
Casio Computer Co., Ltd. (Æ) | | | 900 | | | | 6 | |
Chubu Electric Power Co., Inc. | | | 900 | | | | 16 | |
Chugai Pharmaceutical Co., Ltd. | | | 300 | | | | 6 | |
Chugoku Electric Power Co., Inc. (The) | | | 1,100 | | | | 21 | |
Citizen Holdings Co., Ltd. | | | 2,200 | | | | 14 | |
Credit Saison Co., Ltd. (Æ) | | | 1,300 | | | | 26 | |
Daiichi Sankyo Co., Ltd. | | | 1,100 | | | | 20 | |
Dena Co., Ltd. (Æ) | | | 100 | | | | 3 | |
Denso Corp. | | | 600 | | | | 20 | |
Eisai Co., Ltd. | | | 700 | | | | 28 | |
Electric Power Development Co., Ltd. | | | 100 | | | | 3 | |
FamilyMart Co., Ltd. | | | 500 | | | | 21 | |
FANUC Corp. | | | 100 | | | | 18 | |
Fast Retailing Co., Ltd. | | | 100 | | | | 23 | |
FUJIFILM Holdings Corp. | | | 400 | | | | 9 | |
Fujitsu, Ltd. | | | 3,000 | | | | 16 | |
Hirose Electric Co., Ltd. | | | 200 | | | | 21 | |
Hitachi High-Technologies Corp. | | | 100 | | | | 2 | |
Hitachi, Ltd. | | | 4,000 | | | | 26 | |
Hokkaido Electric Power Co., Inc. | | | 800 | | | | 12 | |
Hokuriku Electric Power Co. | | | 500 | | | | 9 | |
Honda Motor Co., Ltd. | | | 1,200 | | | | 46 | |
Hoya Corp. | | | 500 | | | | 11 | |
Ibiden Co., Ltd. | | | 500 | | | | 13 | |
Japan Tobacco, Inc. | | | 3 | | | | 17 | |
Kansai Electric Power Co., Inc. (The) | | | 1,100 | | | | 17 | |
Kirin Holdings Co., Ltd. | | | 1,000 | | | | 13 | |
Komatsu, Ltd. | | | 100 | | | | 3 | |
Kyocera Corp. | | | 100 | | | | 9 | |
Kyowa Hakko Kirin Co., Ltd. | | | 1,000 | | | | 11 | |
Kyushu Electric Power Co., Inc. | | | 900 | | | | 13 | |
Lawson, Inc. | | | 100 | | | | 6 | |
| | | | |
| | 136 | | | Russell Developed ex-U.S. Low Beta ETF |
Russell Exchange Traded Funds Trust
Russell Developed ex-U.S. Low Beta ETF
Schedule of Investments, continued — March 31, 2012
Amounts in thousands (except share amounts)
| | | | | | | | |
| | | Principal
Amount ($)
or Shares | | | Market
Value
$ | |
| | | | | | | | |
Mitsubishi Estate Co., Ltd. | | | 1,000 | | | | 18 | |
Mitsubishi Motors Corp. (Æ) | | | 2,000 | | | | 2 | |
Mitsubishi UFJ Financial Group, Inc. | | | 6,600 | | | | 33 | |
Mizuho Financial Group, Inc. | | | 11,400 | | | | 19 | |
Murata Manufacturing Co., Ltd. | | | 300 | | | | 18 | |
NEC Corp. (Æ) | | | 2,000 | | | | 4 | |
Nintendo Co., Ltd. | | | 100 | | | | 15 | |
Nippon Telegraph & Telephone Corp. | | | 1,200 | | | | 55 | |
Nissan Motor Co., Ltd. | | | 1,500 | | | | 16 | |
Nisshin Seifun Group, Inc. | | | 500 | | | | 6 | |
Nissin Foods Holdings Co., Ltd. | | | 200 | | | | 8 | |
NOK Corp. | | | 100 | | | | 2 | |
Nomura Research Institute, Ltd. | | | 200 | | | | 5 | |
NTT DoCoMo, Inc. | | | 20 | | | | 33 | |
Omron Corp. | | | 100 | | | | 2 | |
Oracle Corp. Japan | | | 400 | | | | 15 | |
Osaka Gas Co., Ltd. | | | 4,000 | | | | 16 | |
Otsuka Holdings Co., Ltd. | | | 200 | | | | 6 | |
Panasonic Corp. | | | 100 | | | | 1 | |
Secom Co., Ltd. | | | 200 | | | | 10 | |
Seiko Epson Corp. | | | 400 | | | | 6 | |
Seven & I Holdings Co., Ltd. | | | 1,000 | | | | 30 | |
Shikoku Electric Power Co., Inc. | | | 500 | | | | 14 | |
Shin-Etsu Chemical Co., Ltd. | | | 300 | | | | 17 | |
Shionogi & Co., Ltd. | | | 1,300 | | | | 18 | |
Softbank Corp. (Æ) | | | 1,100 | | | | 33 | |
Stanley Electric Co., Ltd. | | | 800 | | | | 13 | |
Sumitomo Mitsui Financial Group, Inc. | | | 700 | | | | 23 | |
Suzuken Co., Ltd. | | | 100 | | | | 3 | |
Suzuki Motor Corp. | | | 400 | | | | 10 | |
Sysmex Corp. | | | 100 | | | | 4 | |
Takeda Pharmaceutical Co., Ltd. | | | 1,700 | | | | 75 | |
TDK Corp. | | | 300 | | | | 17 | |
Terumo Corp. | | | 300 | | | | 14 | |
Toho Gas Co., Ltd. | | | 1,000 | | | | 6 | |
Tokyo Gas Co., Ltd. | | | 6,000 | | | | 28 | |
Toshiba Corp. | | | 4,000 | | | | 18 | |
Toyoda Gosei Co., Ltd. | | | 200 | | | | 4 | |
Toyota Industries Corp. | | | 100 | | | | 3 | |
Toyota Motor Corp. | | | 2,400 | | | | 105 | |
Trend Micro, Inc. | | | 400 | | | | 12 | |
Unicharm Corp. | | | 100 | | | | 5 | |
USS Co., Ltd. | | | 70 | | | | 7 | |
Yahoo! Japan Corp. (Æ) | | | 39 | | | | 13 | |
Yaskawa Electric Corp. | | | 1,000 | | | | 9 | |
| | | | | | | | |
| | | | | | | 1,446 | |
| | | | | | | | |
| | |
| Luxembourg - 0.6% | | | | | | | | |
L’Occitane International SA | | | 2,500 | | | | 6 | |
Samsonite International SA (Æ) | | | 7,800 | | | | 15 | |
Ternium SA - ADR | | | 355 | | | | 8 | |
| | | | | | | | |
| | | | | | | 29 | |
| | | | | | | | |
| | |
| Netherlands - 3.8% | | | | | | | | |
ASML Holding NV Class G | | | 278 | | | | 14 | |
European Aeronautic Defence and Space Co. NV | | | 378 | | | | 15 | |
| | | | | | | | |
| | | Principal
Amount ($)
or Shares | | | Market
Value
$ | |
Gemalto NV | | | 14 | | | | 1 | |
Heineken Holding NV | | | 207 | | | | 10 | |
Heineken NV | | | 411 | | | | 23 | |
Koninklijke Ahold NV | | | 2,217 | | | | 31 | |
Koninklijke KPN NV | | | 3,158 | | | | 35 | |
Nutreco NV | | | 66 | | | | 5 | |
NXP Semiconductor NV (Æ) | | | 69 | | | | 2 | |
Unilever NV | | | 1,913 | | | | 64 | |
| | | | | | | | |
| | | | | | | 200 | |
| | | | | | | | |
| | |
| New Zealand - 0.3% | | | | | | | | |
Contact Energy, Ltd. (Æ) | | | 1,976 | | | | 8 | |
Telecom Corp. of New Zealand, Ltd. | | | 5,075 | | | | 10 | |
| | | | | | | | |
| | | | | | | 18 | |
| | | | | | | | |
| | |
| Singapore - 2.5% | | | | | | | | |
CapitaLand, Ltd. | | | 4,000 | | | | 10 | |
CapitaMalls Asia, Ltd. | | | 5,000 | | | | 7 | |
City Developments, Ltd. | | | 1,000 | | | | 9 | |
Singapore Press Holdings, Ltd. | | | 5,000 | | | | 16 | |
Singapore Technologies Engineering, Ltd. | | | 4,000 | | | | 10 | |
Singapore Telecommunications, Ltd. | | | 23,000 | | | | 57 | |
StarHub, Ltd. | | | 8,000 | | | | 20 | |
Wilmar International, Ltd. | | | 1,000 | | | | 4 | |
| | | | | | | | |
| | | | | | | 133 | |
| | | | | | | | |
| | |
| Switzerland - 13.3% | | | | | | | | |
Actelion, Ltd. (Æ) | | | 952 | | | | 35 | |
Adecco SA (Æ) | | | 176 | | | | 9 | |
Aryzta AG (Æ) | | | 103 | | | | 5 | |
Bank Sarasin & Cie AG | | | 42 | | | | 1 | |
BKW SA (Æ) | | | 475 | | | | 17 | |
Cie Financiere Richemont SA | | | 346 | | | | 22 | |
Clariant AG (Æ) | | | 922 | | | | 13 | |
Credit Suisse Group AG (Æ) | | | 300 | | | | 9 | |
Dufry AG (Æ) | | | 26 | | | | 3 | |
EFG International AG (Æ) | | | 419 | | | | 4 | |
Galenica AG | | | 24 | | | | 16 | |
Logitech International SA (Æ) | | | 942 | | | | 7 | |
Lonza Group AG (Æ) | | | 349 | | | | 18 | |
Nestle SA | | | 1,669 | | | | 104 | |
Nobel Biocare Holding AG (Æ) | | | 1,093 | | | | 14 | |
Novartis AG | | | 1,876 | | | | 104 | |
Panalpina Welttransport Holding AG | | | 13 | | | | 1 | |
Roche Holding AG | | | 684 | | | | 119 | |
Sonova Holding AG (Æ) | | | 82 | | | | 9 | |
Straumann Holding AG | | | 230 | | | | 39 | |
Sulzer AG | | | 5 | | | | 1 | |
Swatch Group AG (The) | | | 122 | | | | 10 | |
Swatch Group AG (The) Class B | | | 28 | | | | 13 | |
Swiss Prime Site AG Class A (Æ) | | | 191 | | | | 16 | |
Swisscom AG | | | 204 | | | | 82 | |
Syngenta AG | | | 41 | | | | 14 | |
UBS AG (Æ) | | | 300 | | | | 4 | |
Vontobel Holding AG (Æ) | | | 100 | | | | 3 | |
| | | | | | | | |
| | | | | | | 692 | |
| | | | | | | | |
| | |
| Russell Developed ex-U.S. Low Beta ETF | | 137 |
Russell Exchange Traded Funds Trust
Russell Developed ex-U.S. Low Beta ETF
Schedule of Investments, continued — March 31, 2012
Amounts in thousands (except share amounts)
| | | | | | | | |
| | | Principal
Amount ($)
or Shares | | | Market
Value
$ | |
| | | | | | | | |
| | |
| United Kingdom - 12.9% | | | | | | | | |
AstraZeneca PLC - ADR (Æ) | | | 1,414 | | | | 63 | |
British American Tobacco PLC | | | 2,020 | | | | 102 | |
BT Group PLC | | | 900 | | | | 3 | |
Cobham PLC | | | 1,700 | | | | 6 | |
Diageo PLC | | | 885 | | | | 21 | |
GlaxoSmithKline PLC - ADR | | | 4,228 | | | | 94 | |
Imperial Tobacco Group PLC | | | 1,375 | | | | 56 | |
Inmarsat PLC | | | 414 | | | | 3 | |
Meggitt PLC | | | 1,891 | | | | 12 | |
National Grid PLC | | | 1,927 | | | | 19 | |
Pennon Group PLC | | | 1,278 | | | | 15 | |
Provident Financial PLC | | | 766 | | | | 14 | |
Reckitt Benckiser Group PLC | | | 544 | | | | 31 | |
Rolls-Royce Holdings PLC (Æ) | | | 1,868 | | | | 24 | |
SABMiller PLC - ADR | | | 246 | | | | 10 | |
Scottish & Southern Energy PLC | | | 695 | | | | 15 | |
Severn Trent PLC Class H | | | 1,366 | | | | 34 | |
Shire PLC - ADR (Æ) | | | 614 | | | | 20 | |
Smith & Nephew PLC | | | 238 | | | | 2 | |
United Utilities Group PLC | | | 2,628 | | | | 25 | |
Vodafone Group PLC - ADR (Æ) | | | 37,472 | | | | 103 | |
| | | | | | | | |
| | | | | | | 672 | |
| | | | | | | | |
| | |
| United States - 0.0% | | | | | | | | |
Lululemon Athletica, Inc. Class 3 | | | 20 | | | | 1 | |
| | | | | | | | |
| | |
Total Common Stocks
(cost $4,806) | | | | | | | 5,115 | |
| | | | | | | | |
| | |
| Preferred Stocks - 1.0% | | | | | | | | |
| Germany - 1.0% | | | | | | | | |
Bayerische Motoren Werke AG | | | 64 | | | | 4 | |
Henkel AG & Co. KGaA | | | 543 | | | | 40 | |
Volkswagen AG | | | 52 | | | | 9 | |
| | | | | | | | |
| | | | | | | 53 | |
| | | | | | | | |
| | |
Total Preferred Stocks
(cost $45) | | | | | | | 53 | |
| | | | | | | | |
| | |
| Short-Term Investments - 0.4% | | | | | | | | |
| United States - 0.4% | | | | | | | | |
Russell U.S. Cash Management Fund | | | 19,749 | (¥) | | | 20 | |
| | | | | | | | |
| | |
Total Short-Term Investments
(cost $20) | | | | | | | 20 | |
| | | | | | | | |
| | |
Total Investments - 99.6%
(identified cost $4,871) | | | | | | | 5,188 | |
| | |
Other Assets and Liabilities,
Net - 0.4% | | | | | | | 20 | |
| | | | | | | | |
| | |
| Net Assets - 100.0% | | | | | | | 5,208 | |
| | | | | | | | |
| | | | |
| | 138 | | | Russell Developed ex-U.S. Low Beta ETF |
Russell Exchange Traded Funds Trust
Russell Developed ex-U.S. Low Beta ETF
Schedule of Investments, continued — March 31, 2012
Amounts in thousands
| | | | | | | | | | | | | | | | | | |
| Foreign Currency Exchange Contracts | |
| | | | | | | | | | | | | | | | | | |
Counter
party | | Amount
Sold | | | Amount
Bought | | Settlement
Date | | | Unrealized
Appreciation
(Depreciation)
$ | |
| | | | | | | | | | | | | | | | | | |
UBS AG | | USD | | | 97 | | | CAD | | 97 | | | 04/04/12 | | | | — | * |
UBS AG | | USD | | | 27 | | | GBP | | 17 | | | 04/04/12 | | | | (— | )* |
UBS AG | | USD | | | 14 | | | HKD | | 112 | | | 04/03/12 | | | | (— | )* |
UBS AG | | CHF | | | 56 | | | USD | | 63 | | | 04/04/12 | | | | — | * |
UBS AG | | EUR | | | 6 | | | USD | | 8 | | | 04/03/12 | | | | — | * |
UBS AG | | EUR | | | 7 | | | USD | | 10 | | | 04/04/12 | | | | — | * |
UBS AG | | JPY | | | 4,058 | | | USD | | 49 | | | 04/04/12 | | | | (— | )* |
| | | | | | | | | | | | | | | | | | |
| |
Total Unrealized Appreciation (Depreciation) on Open Foreign Currency Exchange Contracts | | | | — | * |
| | | | | | | | | | | | | | | | | | |
See accompanying notes which are an integral part of the financial statements.
| | |
| Russell Developed ex-U.S. Low Beta ETF | | 139 |
Russell Exchange Traded Funds Trust
Russell Developed ex-U.S. Low Beta ETF
Presentation of Portfolio Holdings — March 31, 2012
Amounts in thousands
| | | | | | | | | | | | | | | | | | | | |
| | | Market Value | | | % of Net
Assets | |
| Portfolio Summary | | Level 1 | | | Level 2 | | | Level 3 | | | Total | | |
| | | | | | | | | | | | | | | | | | | | |
Common Stocks | | | | | | | | | | | | | | | | | | | | |
Australia | | $ | 21 | | | $ | — | | | $ | — | | | $ | 21 | | | | 0.4 | |
Austria | | | 39 | | | | — | | | | — | | | | 39 | | | | 0.8 | |
Belgium | | | 87 | | | | — | | | | — | | | | 87 | | | | 1.7 | |
Bermuda | | | 98 | | | | — | | | | — | | | | 98 | | | | 1.9 | |
Canada | | | 617 | | | | — | | | | — | | | | 617 | | | | 11.8 | |
Cayman Islands | | | 28 | | | | — | | | | — | | | | 28 | | | | 0.5 | |
Denmark | | | 6 | | | | — | | | | — | | | | 6 | | | | 0.1 | |
Finland | | | 27 | | | | — | | | | — | | | | 27 | | | | 0.5 | |
France | | | 138 | | | | — | | | | — | | | | 138 | | | | 2.7 | |
Germany | | | 325 | | | | — | | | | — | | | | 325 | | | | 6.2 | |
Greece | | | 10 | | | | — | | | | — | | | | 10 | | | | 0.2 | |
Hong Kong | | | 453 | | | | — | | | | — | | | | 453 | | | | 8.7 | |
Ireland | | | 20 | | | | — | | | | — | | | | 20 | | | | 0.4 | |
Israel | | | 55 | | | | — | | | | — | | | | 55 | | | | 1.1 | |
Japan | | | 1,446 | | | | — | | | | — | | | | 1,446 | | | | 27.8 | |
Luxembourg | | | 29 | | | | — | | | | — | | | | 29 | | | | 0.6 | |
Netherlands | | | 200 | | | | — | | | | — | | | | 200 | | | | 3.8 | |
New Zealand | | | 18 | | | | — | | | | — | | | | 18 | | | | 0.3 | |
Singapore | | | 133 | | | | — | | | | — | | | | 133 | | | | 2.5 | |
Switzerland | | | 692 | | | | — | | | | — | | | | 692 | | | | 13.3 | |
United Kingdom | | | 672 | | | | — | | | | — | | | | 672 | | | | 12.9 | |
United States | | | 1 | | | | — | | | | — | | | | 1 | | | | — | * |
Preferred Stocks | | | 53 | | | | — | | | | — | | | | 53 | | | | 1.0 | |
Short-Term Investments | | | — | | | | 20 | | | | — | | | | 20 | | | | 0.4 | |
| | | | | | | | | | | | | | | | | | | | |
| | | | | |
Total Investments | | | 5,168 | | | | 20 | | | | — | | | | 5,188 | | | | 99.6 | |
| | | | | | | | | | | | | | | | | | | | |
Other Assets and Liabilities, Net | | | | | | | | | | | | | | | | | | | 0.4 | |
| | | | | | | | | | | | | | | | | | | | |
| | | | | | | | | | | | | | | | | | | 100.0 | |
| | | | | | | | | | | | | | | | | | | | |
| | | | | |
Other Financial Instruments | | | | | | | | | | | | | | | | | | | | |
Foreign Currency Exchange Contracts | | | — | *** | | | — | | | | — | | | | — | *** | | | — | * |
| | | | | | | | | | | | | | | | | | | | |
Total Other Financial Instruments** | | $ | — | | | $ | — | | | $ | — | | | $ | — | | | | | |
| | | | | | | | | | | | | | | | | | | | |
| * | Less than .05% of net assets. |
| ** | Other financial instruments reflected, such as futures, forwards, interest rate swaps, and credit default swaps are valued at the unrealized appreciation/depreciation on the instruments. |
For a description of the levels see note 2 in the Notes to Financial Statements.
There were no significant transfers in and out of levels 1, 2 and 3 during the period ending March 31, 2012.
See accompanying notes which are an integral part of the financial statements.
| | | | |
| | 140 | | | Russell Developed ex-U.S. Low Beta ETF |
Russell Exchange Traded Funds Trust
Russell Developed ex-U.S. Low Beta ETF
Fair Value of Derivative Instruments — March 31, 2012
Amounts in thousands
| | | | |
| Derivatives not accounted for as hedging instruments | | Foreign
Currency
Contracts | |
| | | | |
Location: Statement of Assets and Liabilities - Assets | | | | |
Unrealized appreciation on foreign currency exchange contracts | | $ | — | * |
| | | | |
Location: Statement of Assets and Liabilities - Liabilities | | | | |
Unrealized depreciation on foreign currency exchange contracts | | $ | — | * |
| | | | |
| |
| Derivatives not accounted for as hedging instruments | | Foreign
Currency
Contracts | |
Location: Statement of Operations - Net realized gain (loss) | | | | |
Foreign currency-related transactions | | $ | (1 | ) |
| | | | |
Location: Statement of Operations - Net change in unrealized appreciation (depreciation) | | | | |
Foreign currency-related transactions | | $ | — | * |
| | | | |
For further disclosure on derivatives see note 2 in Notes to Financial Statements.
See accompanying notes which are an integral part of the financial statements.
| | |
| Russell Developed ex-U.S. Low Beta ETF | | 141 |
Russell Exchange Traded Funds Trust
Russell Developed ex-U.S. Low Beta ETF
Statement of Assets and Liabilities — March 31, 2012
| | | | |
| Amounts in thousands | | Russell
Developed ex-
U.S. Low Beta
ETF | |
| | | | |
Assets | | | | |
Investments, at identified cost | | $ | 4,871 | |
Investments, at market* | | | 5,188 | |
Foreign currency holdings** | | | 6 | |
Unrealized appreciation on foreign currency exchange contracts | | | — | |
Receivables: | | | | |
Dividends | | | 29 | |
Investments sold | | | 229 | |
Foreign taxes recoverable | | | 2 | |
| | | | |
Total assets | | | 5,454 | |
| | | | |
| |
Liabilities | | | | |
Payables: | | | | |
Investments purchased | | | 245 | |
Accrued fees to affiliates | | | 1 | |
Unrealized depreciation on foreign currency exchange contracts | | | — | |
| | | | |
Total liabilities | | | 246 | |
| | | | |
| | | | |
Net Assets | | $ | 5,208 | |
| | | | |
Net Assets Consist of: | | | | |
Undistributed (overdistributed) net investment income | | $ | 20 | |
Accumulated net realized gain (loss) | | | (9 | ) |
Unrealized appreciation (depreciation) on: | | | | |
Investments | | | 317 | |
Foreign currency-related transactions | | | — | |
Additional paid-in capital | | | 4,880 | |
| | | | |
Net Assets | | $ | 5,208 | |
| | | | |
Net Asset Value, offering and redemption price per share: | | | | |
Net asset value per share:(a) | | $ | 52.08 | |
Net assets | | $ | 5,208,361 | |
Shares outstanding ($.001 par value) | | | 100,002 | |
Amounts in thousands | | | | |
| | | | |
* Investments in Affiliates, Russell U.S. Cash Management Fund | | $ | 20 | |
** Foreign currency holdings - cost | | $ | 6 | |
| (a) | | Net asset value per share equals net assets divided by shares outstanding. |
See accompanying notes which are an integral part of the financial statements.
| | | | |
| | 142 | | | Statement of Assets and Liabilities |
Russell Exchange Traded Funds Trust
Russell Developed ex-U.S. Low Beta ETF
Statement of Operations — For the Period Ended March 31, 2012
| | | | |
| Amounts in thousands | | Russell
Developed ex-
U.S. Low Beta
ETF* | |
| | | | |
Investment Income | | | | |
Dividends | | $ | 69 | |
Less foreign taxes withheld | | | (5 | ) |
| | | | |
Total investment income | | | 64 | |
| | | | |
| |
Expenses | | | | |
Management fees | | | 12 | |
Trustee and trustee related fees | | | 6 | |
| | | | |
Expenses before reductions | | | 18 | |
Expense reductions | | | (13 | ) |
| | | | |
Net expenses | | | 5 | |
| | | | |
Net investment income (loss) | | | 59 | |
| | | | |
| |
Net Realized and Unrealized Gain (Loss) | | | | |
Net realized gain (loss) on: | | | | |
Investments | | | (9 | ) |
In-kind redemptions | | | — | |
Foreign currency-related transactions | | | (1 | ) |
| | | | |
Net realized gain (loss) | | | (10 | ) |
| | | | |
Net change in unrealized appreciation (depreciation) on: | | | | |
Investments | | | 317 | |
Foreign currency-related transactions | | | — | |
| | | | |
Net change in unrealized appreciation (depreciation) | | | 317 | |
| | | | |
Net realized and unrealized gain (loss) | | | 307 | |
| | | | |
Net Increase (Decrease) in Net Assets from Operations | | $ | 366 | |
| | | | |
| * | For the period November 3, 2011 (commencement of operations) to March 31, 2012. |
See accompanying notes which are an integral part of the financial statements.
| | |
| Statement of Operations | | 143 |
Russell Exchange Traded Funds Trust
Russell Developed ex-U.S. Low Beta ETF
Statement of Changes in Net Assets — For the Periods Ended March 31,
| | | | |
| | | Russell Developed
ex-U.S. Low Beta
ETF | |
| | | | |
| Amounts in thousands | | 2012* | |
Increase (Decrease) in Net Assets | | | | |
| |
Operations | | | | |
Net investment income (loss) | | $ | 59 | |
Net realized gain (loss) | | | (10 | ) |
Net change in unrealized appreciation (depreciation) | | | 317 | |
| | | | |
Net increase (decrease) in net assets from operations | | | 366 | |
| | | | |
| |
Distributions | | | | |
From net investment income | | | (38 | ) |
| | | | |
Net decrease in net assets from distributions | | | (38 | ) |
| | | | |
| |
Share Transactions | | | | |
Net increase (decrease) in net assets from share transactions | | | 4,880 | |
| | | | |
Total Net Increase (Decrease) in Net Assets | | | 5,208 | |
| |
Net Assets | | | | |
Beginning of period | | | — | |
| | | | |
End of period | | $ | 5,208 | |
| | | | |
Undistributed (overdistributed) net investment income included in net assets | | $ | 20 | |
| * | For the period November 3, 2011 (commencement of operations) to March 31, 2012. |
See accompanying notes which are an integral part of the financial statements.
| | | | |
| | 144 | | | Statement of Changes in Net Assets |
(This page intentionally left blank)
Russell Exchange Traded Funds Trust
Russell Developed ex-U.S. Low Beta ETF
Financial Highlights — For the Period Ended
For a Share Outstanding Throughout Each Period.
| | | | | | | | | | | | | | | | | | | | |
| | | | | |
| | | $
Net Asset Value,
Beginning of
Period | | | $
Net
Investment
Income (Loss)(a)(e) | | | $
Net Realized
and Unrealized
Gain (Loss) | | | $
Total from
Investment
Operations | | | $
Distributions
from Net
Investment Income | |
Russell Developed ex-U.S. Low Beta ETF | |
March 31, 2012* | | | 48.80 | | | | .59 | | | | 3.07 | | | | 3.66 | | | | (.38 | ) |
| (a) | Average daily shares outstanding were used for this calculation. |
| (b) | Periods less than one year are not annualized. |
| (c) | The ratios for periods less than one year are annualized. |
| (d) | Portfolio turnover rate excludes securities received or delivered from in-kind creation or redemption units. |
| (e) | Reflects amounts waived by Russell Investment Management Company (“RIMCo”). |
| * | For the period November 3, 2011 (commencement of operations) to March 31, 2012. |
See accompanying notes which are an integral part of the financial statements.
| | | | | | | | | | | | | | | | | | | | | | | | | | | | | | |
$
Total
Distributions | | | $
Net Asset Value,
End of
Period | | | %
Total
Return(b) | | | $
Net Assets,
End of Period
(000) | | | %
Ratio of Expenses
to Average
Net Assets,
Gross(c) | | | %
Ratio of Expenses
to Average
Net Assets,
Net(c)(e) | | | %
Ratio of Net
Investment Income
to Average
Net Assets(c)(e) | | | %
Portfolio
Turnover Rate(b)(d) | |
| | | | | | | | | | | | | | | | | | | | | | | | | | | | | | |
| | (.38 | ) | | | 52.08 | | | | 7.53 | | | | 5,208 | | | | .87 | | | | .25 | | | | 2.91 | | | | 26 | |
See accompanying notes which are an integral part of the financial statements.
Russell Exchange Traded Funds Trust
Russell Developed ex-U.S. Low Volatility ETF
Portfolio Management Discussion and Analysis — March 31, 2012 (Unaudited)
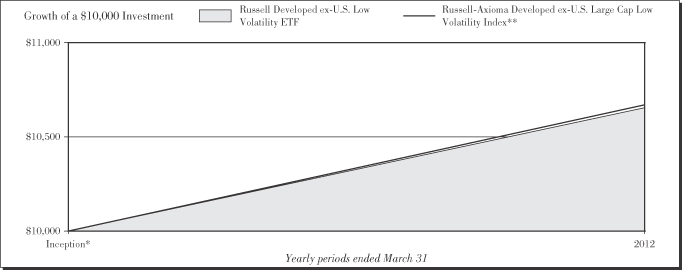
Performance as of March 31, 2012
| | | | | | | | | | | | |
|
| Average Annual Total Return | |
| | | Net Asset
Value | | | Market Value | | | Russell-Axioma
Developed ex-
U.S. Large Cap
Low Volatility
Index** | |
Inception* | | | 6.55 | % | | | 7.43 | % | | | 6.70 | % |
| | | | |
| | 148 | | | Russell Developed ex-U.S. Low Volatility ETF |
Russell Exchange Traded Funds Trust
Russell Developed ex-U.S. Low Volatility ETF
Portfolio Management Discussion and Analysis — March 31, 2012 (Unaudited)
The Russell Developed ex-U.S. Low Volatility ETF (the “Fund”) is an index-based exchange-traded fund that seeks investment results that closely correspond to the total return of the Russell-Axioma Developed ex-U.S. Large Cap Low Volatility Index (the “Index”). Russell Investment Management Company (“RIMCo”), as the Fund’s advisor, uses a “passive” or indexing approach to try to achieve the Fund’s investment objective. Unlike many investment companies, the Fund does not try to “beat” the Index it tracks and does not seek temporary defensive positions when markets decline or appear overvalued. The Fund seeks to gain exposure to the factor exhibited in its Index. The Fund will normally invest at least 80% of its total assets in securities that comprise the Index.
What is the Fund’s investment objective?
The Fund seeks investment results that closely correspond to the total return of the Russell-Axioma Developed ex-U.S. Large Cap Low Volatility Index, which is designed to deliver exposure to stocks with low volatility as determined by a screening and ranking methodology applied to the output of the Axioma AX-WW 2.1 World-Wide ex-USA Equity Factor Risk model.
Is the Fund replicating or sampling?
The Fund is replicating.
How did the Fund perform relative to its benchmark for the fiscal year ended March 31, 2012?
For the fiscal year ended March 31, 2012, the Fund gained 6.55%. This is compared to the Fund’s benchmark, the Russell-Axioma Developed ex-U.S. Large Cap Low Volatility Index, which gained 6.70% during the same period. The Fund’s performance includes operating expenses, whereas indexes are unmanaged and index returns do not include expenses of any kind.
There were no significant changes to either the Fund or Index during the reporting period.
Did the Fund outperform or underperform the benchmark or was performance as expected based on expenses, etc.?
The Fund performed as expected against the benchmark.
Over the reporting period, please describe those sectors that outperformed or underperformed.
Sectors achieved both positive and negative returns for the Fund and the Index. Information technology was the best performing sector for the Fund and the Index, while telecommunication services was the worst performing sector. Consumer staples, with an average weight of 24.8% was the best contributor to Fund and Index returns. Telecommunication services, with an average weight of 9.6%, was the worst contributor to Fund and Index returns.
Over the reporting period, please describe those individual securities (constituents) that outperformed or underperformed.
Royal Bank of Canada, Anheuser-Busch InBev, and Toronto-Dominion Bank generated positive returns and contributed the most to Fund performance while Tesco PLC, France Telecom, and Koninklijke KPN NV, all declined which detracted from Fund performance.
The views expressed in this report reflect those of the portfolio managers only through the end of the period covered by the report. These views do not necessarily represent the views of RIMCo, or any other person in RIMCo or any other affiliated organization. These views are subject to change at any time based upon market conditions or other events, and RIMCo disclaims any responsibility to update the views contained herein. These views should not be relied on as investment advice and, because investment decisions for a Russell Exchange Traded Funds Trust (“RET”) Fund are based on numerous factors, should not be relied on as an indication of investment decisions of any RET Fund.
| * | | Commenced operations by issuing shares November 3, 2011. |
| ** | | The Russell-Axioma Developed ex-U.S. Low Volatility Index is designed to deliver exposure to stocks with low volatility as determined by a screening and ranking methodology applied to the output of the Axioma AX-WW 2.1 World-Wide ex-USA Equity Factor Risk model. Volatility is a measure of a stock’s variability in total returns based on its historical behavior over the last sixty days. Stocks exhibiting high or low volatility can be used by investors to adjust volatility exposure in a portfolio. |
Performance is historical and assumes reinvestment of all dividends and capital gains. Investment return and principal value will fluctuate so that an investor’s shares, when redeemed, may be worth more or less than when purchased. Past performance is not indicative of future results. The returns shown do not reflect the deduction of taxes that a shareholder would pay on Fund distributions or the redemption of Fund shares.
| | |
| Russell Developed ex-U.S. Low Volatility ETF | | 149 |
Russell Exchange Traded Funds Trust
Russell Developed ex-U.S. Low Volatility ETF
Shareholder Expense Example — March 31, 2012 (Unaudited)
Fund Expenses
The following disclosure provides important information regarding each Fund’s Expense Example, which appears on each Fund’s individual page in this Annual Report. Please refer to this information when reviewing the Expense Example for a Fund.
Example
As a shareholder of the Fund, you incur two types of costs: (1) transaction costs, including brokerage commissions on purchases and sales of your Fund shares and (2) ongoing costs, including management fees and other Fund expenses. The Example is intended to help you understand your ongoing costs (in dollars) of investing in the Fund and to compare these costs with the ongoing costs of investing in other funds. The Example is based on an investment of $1,000 invested at the beginning of the period and held for the entire period indicated, which for this Fund is from November 3, 2011 (commencement of operations) to March 31, 2012.
Actual Expenses
The information in the table under the heading “Actual Performance” provides information about actual account values and actual expenses. You may use the information in this column, together with the amount you invested, to estimate the expenses that you paid over the period. Simply divide your account value by $1,000 (for example, an $8,600 account value divided by $1,000 = 8.6), then multiply the result by the number in the first column in the row entitled “Expenses Paid During Period” to estimate the expenses you paid on your account during this period.
Hypothetical Example for Comparison Purposes
The information in the table under the heading “Hypothetical Performance (5% return before expenses)” provides information about hypothetical account values and hypothetical expenses based on the Fund’s actual expense ratio and an assumed rate of return of 5% per year before expenses, which is not the Fund’s actual return. The hypothetical account values and expenses may not be used to estimate the actual ending account balance or expenses you paid for the period. You may use this information to compare the ongoing costs of investing in the Fund and other funds. To do so, compare this 5% hypothetical example with the 5% hypothetical examples that appear in the shareholder reports of other funds.
Please note that the expenses shown in the table are meant to highlight your ongoing costs only and do not reflect any transactional costs, such as brokerage commissions paid on purchases and sales of Fund shares. Therefore, the information under the heading “Hypothetical Performance (5% return before expenses)” is useful in comparing ongoing costs only, and will not help you determine the relative total costs of owning different funds. In addition, if these transactional costs were included, your costs would have been higher.
| | | | | | | | |
| | | Actual
Performance | | | Hypothetical
Performance
(5% return
before expenses) | |
| | | | | | | | |
Beginning Account Value | | | | | | | | |
November 3, 2011 | | $ | 1,000.00 | | | $ | 1,000.00 | |
Ending Account Value | | | | | | | | |
March 31, 2012 | | $ | 1,065.50 | | | $ | 1,023.75 | |
Expenses Paid During Period* | | $ | 1.06 | | | $ | 1.26 | |
| * | Actual expenses are equal to the Fund’s annualized expense ratio of 0.25% (representing the 150-day period annualized), multiplied by the average account value over the period, multiplied by 150/366 (to reflect the period since commencement of operations). May reflect amounts waived and/or reimbursed. Without the waivers and reimbursements, expenses would have been higher. Hypothetical expenses are equal to the Fund’s annualized expense ratio of 0.25% (representing the six month period annualized), multiplied by the average account value over the period, multiplied by 183/366 (to reflect the one-half period). |
| | | | |
| | 150 | | | Russell Developed ex-U.S. Low Volatility ETF |
Russell Exchange Traded Funds Trust
Russell Developed ex-U.S. Low Volatility ETF
Schedule of Investments — March 31, 2012
Amounts in thousands (except share amounts)
| | | | | | | | |
| | | Principal
Amount ($)
or Shares | | | Market
Value
$ | |
| | | | | | | | |
| Common Stocks - 98.9% | |
| Australia - 6.9% | | | | | | | | |
AGL Energy, Ltd. | | | 161 | | | | 2 | |
Amcor, Ltd. (Æ) | | | 636 | | | | 5 | |
ASX, Ltd. - ADR | | | 197 | | | | 7 | |
Australia & New Zealand Banking Group, Ltd. - ADR | | | 1,003 | | | | 24 | |
BHP Billiton, Ltd. - ADR | | | 330 | | | | 12 | |
CFS Retail Property Trust (ö) | | | 3,581 | | | | 7 | |
Coca-Cola Amatil, Ltd. | | | 119 | | | | 2 | |
Commonwealth Bank of Australia - ADR | | | 1,805 | | | | 95 | |
CSL, Ltd. | | | 594 | | | | 22 | |
Dexus Property Group (ö) | | | 4,918 | | | | 4 | |
GPT Group (ö) | | | 1,467 | | | | 5 | |
Insurance Australia Group, Ltd. | | | 462 | | | | 2 | |
Metcash, Ltd. | | | 1,847 | | | | 8 | |
National Australia Bank, Ltd. - ADR | | | 291 | | | | 7 | |
Orica, Ltd. | | | 127 | | | | 4 | |
Origin Energy, Ltd. | | | 236 | | | | 3 | |
Qantas Airways, Ltd. (Æ) | | | 3 | | | | — | ± |
Rio Tinto, Ltd. - ADR | | | 93 | | | | 6 | |
TABCORP Holdings, Ltd. | | | 1,501 | | | | 4 | |
Telstra Corp., Ltd. | | | 7,754 | | | | 26 | |
Toll Holdings, Ltd. | | | 334 | | | | 2 | |
Wesfarmers, Ltd. | | | 585 | | | | 18 | |
Westfield Group (ö) | | | 1,854 | | | | 17 | |
Westfield Retail Trust (ö) | | | 2,429 | | | | 6 | |
Westpac Banking Corp. | | | 488 | | | | 11 | |
Woolworths, Ltd. | | | 2,052 | | | | 55 | |
| | | | | | | | |
| | | | | | | 354 | |
| | | | | | | | |
| | |
| Belgium - 1.7% | | | | | | | | |
Anheuser-Busch InBev NV | | | 960 | | | | 70 | |
Belgacom SA | | | 174 | | | | 6 | |
Colruyt SA | | | 101 | | | | 4 | |
Delhaize Group SA | | | 59 | | | | 3 | |
Groupe Bruxelles Lambert SA | | | 21 | | | | 1 | |
Mobistar SA | | | 63 | | | | 3 | |
| | | | | | | | |
| | | | | | | 87 | |
| | | | | | | | |
| | |
| Canada - 13.5% | | | | | | | | |
Agrium, Inc. | | | 33 | | | | 3 | |
Atco, Ltd. | | | 16 | | | | 1 | |
Bank of Montreal | | | 689 | | | | 41 | |
Bank of Nova Scotia | | | 919 | | | | 51 | |
BCE, Inc. | | | 989 | | | | 40 | |
Bell Aliant, Inc. | | | 684 | | | | 19 | |
Canadian Imperial Bank of Commerce | | | 580 | | | | 44 | |
Canadian National Railway Co. | | | 302 | | | | 24 | |
Canadian Natural Resources, Ltd. | | | 22 | | | | 1 | |
Canadian Pacific Railway, Ltd. | | | 28 | | | | 2 | |
Canadian Utilities, Ltd. Class A | | | 132 | | | | 9 | |
Crescent Point Energy Corp. | | | 192 | | | | 8 | |
Empire Co., Ltd. Class A | | | 92 | | | | 5 | |
Enbridge, Inc. | | | 1,289 | | | | 50 | |
Enerplus Corp. | | | 115 | | | | 3 | |
George Weston, Ltd. | | | 99 | | | | 6 | |
| | | | | | | | |
| | | Principal
Amount ($)
or Shares | | | Market
Value
$ | |
Great-West Lifeco, Inc. | | | 324 | | | | 8 | |
Husky Energy, Inc. | | | 93 | | | | 2 | |
Imperial Oil, Ltd. | | | 222 | | | | 10 | |
Industrial Alliance Insurance & Financial Services, Inc. (Þ) | | | 81 | | | | 2 | |
Intact Financial Corp. | | | 65 | | | | 4 | |
Loblaw Cos., Ltd. | | | 145 | | | | 5 | |
Magna International, Inc. Class A | | | 189 | | | | 9 | |
Manitoba Telecom Services, Inc. - ADR | | | 266 | | | | 9 | |
Manulife Financial Corp. | | | 639 | | | | 9 | |
Metro, Inc. Class A | | | 525 | | | | 28 | |
National Bank of Canada | | | 108 | | | | 9 | |
Potash Corp. of Saskatchewan, Inc. | | | 116 | | | | 5 | |
Research In Motion, Ltd. (Æ) | | | 53 | | | | 1 | |
Rogers Communications, Inc. Class B | | | 405 | | | | 16 | |
Royal Bank of Canada - GDR | | | 1,422 | | | | 82 | |
Saputo, Inc. - ADR | | | 378 | | | | 16 | |
Shaw Communications, Inc. Class B | | | 157 | | | | 3 | |
Shoppers Drug Mart Corp. | | | 383 | | | | 17 | |
Sun Life Financial, Inc. | | | 214 | | | | 5 | |
Suncor Energy, Inc. | | | 74 | | | | 2 | |
TELUS Corp. | | | 219 | | | | 13 | |
TELUS Corp. Class A | | | 18 | | | | 1 | |
Toronto-Dominion Bank (The) | | | 1,007 | | | | 86 | |
TransCanada Corp. | | | 1,012 | | | | 43 | |
Valeant Pharmaceuticals International, Inc. (Æ) | | | 21 | | | | 1 | |
| | | | | | | | |
| | | | | | | 693 | |
| | | | | | | | |
| | |
| Denmark - 1.2% | | | | | | | | |
Coloplast A/S Class B | | | 8 | | | | 1 | |
FLSmidth & Co. A/S | | | 28 | | | | 2 | |
Novo Nordisk A/S Class B | | | 419 | | | | 59 | |
Pandora A/S | | | 125 | | | | 1 | |
TDC A/S | | | 197 | | | | 1 | |
| | | | | | | | |
| | | | | | | 64 | |
| | | | | | | | |
| | |
| Finland - 0.2% | | | | | | | | |
Fortum OYJ | | | 182 | | | | 5 | |
Orion OYJ Class B | | | 161 | | | | 3 | |
Outokumpu OYJ (Æ) | | | 50 | | | | — | ± |
Stora Enso OYJ Class R | | | 550 | | | | 4 | |
| | | | | | | | |
| | | | | | | 12 | |
| | | | | | | | |
| | |
| France - 7.8% | | | | | | | | |
Air France-KLM (Æ) | | | 70 | | | | — | ± |
Air Liquide SA Class A | | | 164 | | | | 22 | |
Alcatel-Lucent - ADR (Æ) | | | 573 | | | | 1 | |
BioMerieux | | | 37 | | | | 3 | |
Casino Guichard Perrachon SA (Æ) | | | 60 | | | | 6 | |
Cie Generale d’Optique Essilor International SA | | | 345 | | | | 31 | |
Danone | | | 654 | | | | 46 | |
France Telecom SA - ADR | | | 2,822 | | | | 42 | |
Iliad SA | | | 5 | | | | 1 | |
L’Oreal SA | | | 304 | | | | 37 | |
| | |
| Russell Developed ex-U.S. Low Volatility ETF | | 151 |
Russell Exchange Traded Funds Trust
Russell Developed ex-U.S. Low Volatility ETF
Schedule of Investments, continued — March 31, 2012
Amounts in thousands (except share amounts)
| | | | | | | | |
| | | Principal
Amount ($)
or Shares | | | Market
Value
$ | |
| | | | | | | | |
LVMH Moet Hennessy Louis Vuitton SA - ADR | | | 4 | | | | 1 | |
Pernod-Ricard SA | | | 152 | | | | 16 | |
Peugeot SA | | | 225 | | | | 4 | |
PPR | | | 3 | | | | 1 | |
Sanofi - ADR | | | 1,022 | | | | 78 | |
Societe BIC SA | | | 30 | | | | 3 | |
Suez Environnement Co. | | | 195 | | | | 3 | |
Total SA | | | 1,782 | | | | 90 | |
Unibail-Rodamco SE (ö) | | | 35 | | | | 7 | |
Vivendi SA - ADR | | | 470 | | | | 9 | |
| | | | | | | | |
| | | | | | | 401 | |
| | | | | | | | |
| | |
| Germany - 6.0% | | | | | | | | |
Adidas AG | | | 33 | | | | 3 | |
Aixtron SE NA | | | 200 | | | | 3 | |
BASF SE | | | 193 | | | | 17 | |
Bayer AG | | | 73 | | | | 5 | |
Beiersdorf AG (Æ) | | | 265 | | | | 17 | |
Daimler AG | | | 46 | | | | 3 | |
Deutsche Lufthansa AG | | | 400 | | | | 6 | |
Deutsche Telekom AG | | | 2,335 | | | | 28 | |
E.ON AG | | | 24 | | | | 1 | |
Fresenius Medical Care AG & Co. KGaA | | | 116 | | | | 8 | |
Fresenius SE & Co. KGaA | | | 11 | | | | 1 | |
Henkel AG & Co. KGaA | | | 204 | | | | 13 | |
Infineon Technologies AG - ADR | | | 600 | | | | 6 | |
K+S AG | | | 7 | | | | — | ± |
Kloeckner & Co. SE | | | 100 | | | | 1 | |
Linde AG | | | 52 | | | | 9 | |
Merck KGaA | | | 182 | | | | 20 | |
Metro AG | | | 42 | | | | 2 | |
MTU Aero Engines Holding AG | | | 85 | | | | 7 | |
Rhoen Klinikum AG | | | 525 | | | | 11 | |
RWE AG | | | 20 | | | | 1 | |
SAP AG - ADR | | | 855 | | | | 60 | |
Siemens AG | | | 894 | | | | 89 | |
| | | | | | | | |
| | | | | | | 311 | |
| | | | | | | | |
| | |
| Hong Kong - 1.7% | | | | | | | | |
Champion REIT (AE)(ö) | | | 4,000 | | | | 2 | |
CLP Holdings, Ltd. | | | 2,000 | | | | 17 | |
Hang Seng Bank, Ltd. | | | 200 | | | | 3 | |
Hong Kong & China Gas Co., Ltd. | | | 9,000 | | | | 22 | |
Link REIT (The) (ö) | | | 2,500 | | | | 9 | |
MTR Corp. | | | 5,500 | | | | 20 | |
Power Assets Holdings, Ltd. | | | 2,000 | | | | 15 | |
| | | | | | | | |
| | | | | | | 88 | |
| | | | | | | | |
| | |
| Ireland - 0.1% | | | | | | | | |
Kerry Group PLC Class A | | | 116 | | | | 5 | |
| | | | | | | | |
| | |
| Isle of Man - 0.1% | | | | | | | | |
Genting Singapore PLC (Æ) | | | 3,000 | | | | 4 | |
| | | | | | | | |
| | |
| Israel - 1.0% | | | | | | | | |
Cellcom Israel, Ltd. | | | 48 | | | | 1 | |
| | | | | | | | |
| | | Principal
Amount ($)
or Shares | | | Market
Value
$ | |
Check Point Software Technologies, Ltd. (Æ) | | | 98 | | | | 6 | |
Partner Communications Co., Ltd. | | | 79 | | | | 1 | |
Teva Pharmaceutical Industries, Ltd. | | | 1,010 | | | | 44 | |
| | | | | | | | |
| | | | | | | 52 | |
| | | | | | | | |
| | |
| Italy - 1.7% | | | | | | | | |
Autogrill SpA (Æ) | | | 908 | | | | 10 | |
Banca Monte dei Paschi di Siena SpA | | | 1,583 | | | | 1 | |
Buzzi Unicem SpA (Æ) | | | 550 | | | | 6 | |
Edison SpA (Æ) | | | 4,499 | | | | 5 | |
ENI SpA - ADR | | | 2,070 | | | | 49 | |
Finmeccanica SpA | | | 625 | | | | 3 | |
Parmalat SpA | | | 499 | | | | 1 | |
Snam Rete Gas SpA | | | 1,055 | | | | 5 | |
Terna Rete Elettrica Nazionale SpA | | | 750 | | | | 3 | |
Tod’s SpA | | | 39 | | | | 4 | |
| | | | | | | | |
| | | | | | | 87 | |
| | | | | | | | |
| | |
| Japan - 11.4% | | | | | | | | |
Aeon Co., Ltd. | | | 600 | | | | 8 | |
Ajinomoto Co., Inc. | | | 1,000 | | | | 13 | |
Asahi Group Holdings, Ltd. | | | 600 | | | | 13 | |
Asahi Kasei Corp. | | | 1,000 | | | | 6 | |
Astellas Pharma, Inc. | | | 800 | | | | 32 | |
Canon, Inc. | | | 100 | | | | 5 | |
Chugai Pharmaceutical Co., Ltd. | | | 500 | | | | 9 | |
Coca-Cola West Co., Ltd. | | | 200 | | | | 4 | |
Dentsu, Inc. | | | 100 | | | | 3 | |
East Japan Railway Co. | | | 200 | | | | 13 | |
Eisai Co., Ltd. | | | 600 | | | | 24 | |
FamilyMart Co., Ltd. | | | 300 | | | | 13 | |
Hisamitsu Pharmaceutical Co., Inc. | | | 100 | | | | 5 | |
Isuzu Motors, Ltd. | | | 1,000 | | | | 6 | |
Kao Corp. | | | 1,200 | | | | 32 | |
Kirin Holdings Co., Ltd. | | | 1,000 | | | | 13 | |
Lawson, Inc. | | | 200 | | | | 13 | |
McDonald’s Holdings Co. Japan, Ltd. | | | 1,100 | | | | 29 | |
Medipal Holdings Corp. | | | 100 | | | | 1 | |
MEIJI Holdings Co., Ltd. | | | 100 | | | | 4 | |
Nagoya Railroad Co., Ltd. (Æ) | | | 2,000 | | | | 6 | |
Namco Bandai Holdings, Inc. | | | 100 | | | | 1 | |
Nippon Telegraph & Telephone Corp. | | | 200 | | | | 9 | |
Nisshin Seifun Group, Inc. | | | 1,000 | | | | 12 | |
Nissin Foods Holdings Co., Ltd. | | | 400 | | | | 15 | |
Nitori Holdings Co., Ltd. | | | 50 | | | | 5 | |
NTT DoCoMo, Inc. | | | 18 | | | | 30 | |
Odakyu Electric Railway Co., Ltd. | | | 1,000 | | | | 10 | |
Oriental Land Co., Ltd. | | | 100 | | | | 11 | |
Osaka Gas Co., Ltd. | | | 3,000 | | | | 12 | |
Otsuka Holdings Co., Ltd. | | | 600 | | | | 18 | |
Secom Co., Ltd. (Æ) | | | 300 | | | | 15 | |
Seven & I Holdings Co., Ltd. | | | 900 | | | | 27 | |
Shin-Etsu Chemical Co., Ltd. | | | 100 | | | | 6 | |
Shiseido Co., Ltd. | | | 1,100 | | | | 19 | |
Sumitomo Mitsui Financial Group, Inc. | | | 100 | | | | 3 | |
Suzuken Co., Ltd. | | | 100 | | | | 3 | |
| | | | |
| | 152 | | | Russell Developed ex-U.S. Low Volatility ETF |
Russell Exchange Traded Funds Trust
Russell Developed ex-U.S. Low Volatility ETF
Schedule of Investments, continued — March 31, 2012
Amounts in thousands (except share amounts)
| | | | | | | | |
| | | Principal
Amount ($)
or Shares | | | Market
Value
$ | |
| | | | | | | | |
Takeda Pharmaceutical Co., Ltd. | | | 1,300 | | | | 57 | |
Tobu Railway Co., Ltd. | | | 3,000 | | | | 16 | |
Toho Co., Ltd. | | | 600 | | | | 11 | |
Tokyo Gas Co., Ltd. | | | 4,000 | | | | 19 | |
Tsumura & Co. | | | 400 | | | | 12 | |
Unicharm Corp. | | | 200 | | | | 11 | |
USS Co., Ltd. | | | 70 | | | | 7 | |
West Japan Railway Co. | | | 200 | | | | 8 | |
| | | | | | | | |
| | | | | | | 589 | |
| | | | | | | | |
| | |
| Jersey - 0.5% | | | | | | | | |
Experian PLC | | | 1,193 | | | | 19 | |
United Business Media, Ltd. | | | 329 | | | | 3 | |
WPP PLC | | | 252 | | | | 3 | |
| | | | | | | | |
| | | | | | | 25 | |
| | | | | | | | |
| | |
| Netherlands - 3.9% | | | | | | | | |
Akzo Nobel NV | | | 161 | | | | 9 | |
Heineken Holding NV | | | 155 | | | | 7 | |
Heineken NV | | | 287 | | | | 16 | |
Koninklijke Ahold NV | | | 1,601 | | | | 22 | |
Koninklijke DSM NV | | | 63 | | | | 4 | |
Koninklijke KPN NV | | | 2,873 | | | | 33 | |
Nutreco NV | | | 12 | | | | 1 | |
Reed Elsevier NV (Æ) | | | 334 | | | | 4 | |
TNT NV - ADR (Æ) | | | 700 | | | | 4 | |
Unilever NV | | | 2,456 | | | | 84 | |
Wereldhave NV (ö) | | | 94 | | | | 7 | |
Wolters Kluwer NV | | | 447 | | | | 8 | |
| | | | | | | | |
| | | | | | | 199 | |
| | | | | | | | |
| | |
| New Zealand - 0.0% | | | | | | | | |
Fletcher Building, Ltd. | | | 344 | | | | 2 | |
| | | | | | | | |
| | |
| Norway - 0.2% | | | | | | | | |
Marine Harvest ASA | | | 3,500 | | | | 2 | |
Orkla ASA | | | 270 | | | | 2 | |
Renewable Energy Corp. ASA (Æ) | | | 1,500 | | | | 1 | |
Statoil ASA Class N | | | 114 | | | | 3 | |
| | | | | | | | |
| | | | | | | 8 | |
| | | | | | | | |
| | |
| Portugal - 0.2% | | | | | | | | |
Redes Energeticas Nacionais SA | | | 2,763 | | | | 8 | |
| | | | | | | | |
| | |
| Singapore - 0.8% | | | | | | | | |
Ascendas Real Estate Investment Trust (Æ)(ö) | | | 9,000 | | | | 14 | |
Oversea-Chinese Banking Corp., Ltd. | | | 1,000 | | | | 7 | |
Singapore Technologies Engineering, Ltd. | | | 1,000 | | | | 3 | |
Singapore Telecommunications, Ltd. | | | 1,000 | | | | 3 | |
United Overseas Bank, Ltd. | | | 1,000 | | | | 14 | |
| | | | | | | | |
| | | | | | | 41 | |
| | | | | | | | |
| | |
| Spain - 2.3% | | | | | | | | |
Amadeus IT Holding SA Class A | | | 290 | | | | 5 | |
Bankia SA (Æ) | | | 2,590 | | | | 9 | |
| | | | | | | | |
| | | Principal
Amount ($)
or Shares | | | Market
Value
$ | |
Enagas SA | | | 161 | | | | 3 | |
Iberdrola SA | | | 1,083 | | | | 6 | |
Inditex SA | | | 81 | | | | 8 | |
Indra Sistemas SA | | | 415 | | | | 5 | |
Red Electrica Corp. SA | | | 217 | | | | 11 | |
Tecnicas Reunidas SA (Æ) | | | 252 | | | | 10 | |
Telefonica SA - ADR | | | 3,776 | | | | 63 | |
| | | | | | | | |
| | | | | | | 120 | |
| | | | | | | | |
| | |
| Sweden - 0.8% | | | | | | | | |
Hennes & Mauritz AB Class B | | | 679 | | | | 23 | |
Holmen AB Class B (Æ) | | | 137 | | | | 4 | |
Securitas AB Class B | | | 250 | | | | 2 | |
Svenska Cellulosa AB Class A | | | 30 | | | | 1 | |
Svenska Cellulosa AB Class B | | | 29 | | | | 1 | |
Swedish Match AB | | | 65 | | | | 3 | |
TeliaSonera AB | | | 658 | | | | 5 | |
| | | | | | | | |
| | | | | | | 39 | |
| | | | | | | | |
| | |
| Switzerland - 10.6% | | | | | | | | |
ABB, Ltd. (Æ) | | | 167 | | | | 3 | |
Actelion, Ltd. (Æ) | | | 189 | | | | 7 | |
Adecco SA (Æ) | | | 9 | | | | — | ± |
Aryzta AG (Æ) | | | 58 | | | | 3 | |
Bank Sarasin & Cie AG | | | 200 | | | | 6 | |
Cie Financiere Richemont SA | | | 96 | | | | 6 | |
Clariant AG (Æ) | | | 85 | | | | 1 | |
Geberit AG (Æ) | | | 60 | | | | 13 | |
Givaudan SA (Æ) | | | 5 | | | | 5 | |
Kuehne & Nagel International AG | | | 11 | | | | 1 | |
Lonza Group AG (Æ) | | | 64 | | | | 3 | |
Nestle SA | | | 1,657 | | | | 105 | |
Nobel Biocare Holding AG (Æ) | | | 297 | | | | 4 | |
Novartis AG | | | 1,864 | | | | 104 | |
Roche Holding AG | | | 720 | | | | 127 | |
Sonova Holding AG (Æ) | | | 102 | | | | 11 | |
Swiss Life Holding AG (Æ) | | | 44 | | | | 5 | |
Swiss Prime Site AG Class A (Æ) | | | 221 | | | | 18 | |
Swisscom AG | | | 129 | | | | 52 | |
Syngenta AG | | | 68 | | | | 23 | |
Zurich Financial Services AG (Æ) | | | 178 | | | | 48 | |
| | | | | | | | |
| | | | | | | 545 | |
| | | | | | | | |
|
| United Kingdom - 26.3% | |
AMEC PLC - GDR | | | 315 | | | | 6 | |
Asos PLC | | | 50 | | | | 1 | |
Associated British Foods PLC | | | 1,526 | | | | 30 | |
AstraZeneca PLC - ADR (Æ) | | | 2,039 | | | | 91 | |
BAE Systems PLC | | | 562 | | | | 3 | |
BG Group PLC | | | 552 | | | | 13 | |
BP PLC | | | 4,933 | | | | 36 | |
British American Tobacco PLC | | | 2,031 | | | | 103 | |
British Land Co. PLC (ö) | | | 119 | | | | 1 | |
British Sky Broadcasting Group PLC | | | 1,805 | | | | 19 | |
BT Group PLC | | | 1,765 | | | | 6 | |
Bunzl PLC | | | 314 | | | | 5 | |
| | |
| Russell Developed ex-U.S. Low Volatility ETF | | 153 |
Russell Exchange Traded Funds Trust
Russell Developed ex-U.S. Low Volatility ETF
Schedule of Investments, continued — March 31, 2012
Amounts in thousands (except share amounts)
| | | | | | | | |
| | | Principal
Amount ($)
or Shares | | | Market
Value
$ | |
| | | | | | | | |
Cable & Wireless Communications PLC | | | 406 | | | | — | ± |
Capita PLC | | | 412 | | | | 5 | |
Capital Shopping Centres Group PLC Class H (ö) | | | 157 | | | | 1 | |
Centrica PLC | | | 4,037 | | | | 20 | |
Cobham PLC | | | 762 | | | | 3 | |
Compass Group PLC | | | 2,294 | | | | 24 | |
Diageo PLC | | | 2,558 | | | | 61 | |
G4S PLC | | | 2,176 | | | | 9 | |
GlaxoSmithKline PLC - ADR | | | 4,296 | | | | 97 | |
HSBC Holdings PLC | | | 10,407 | | | | 92 | |
Imperial Tobacco Group PLC | | | 1,036 | | | | 42 | |
Inchcape PLC | | | 67 | | | | — | ± |
Inmarsat PLC | | | 309 | | | | 2 | |
Intercontinental Hotels Group PLC | | | 250 | | | | 6 | |
J Sainsbury PLC | | | 2,684 | | | | 13 | |
John Wood Group PLC | | | 38 | | | | — | ± |
Marks & Spencer Group PLC | | | 183 | | | | 1 | |
National Grid PLC | | | 4,017 | | | | 40 | |
Next PLC | | | 91 | | | | 4 | |
Pearson PLC | | | 1,712 | | | | 32 | |
Reckitt Benckiser Group PLC | | | 805 | | | | 45 | |
Reed Elsevier PLC | | | 1,401 | | | | 12 | |
Rexam PLC | | | 535 | | | | 4 | |
Royal Dutch Shell PLC Class A | | | 2,915 | | | | 103 | |
Royal Dutch Shell PLC Class B | | | 2,561 | | | | 90 | |
RSA Insurance Group PLC | | | 507 | | | | 1 | |
SABMiller PLC - ADR | | | 395 | | | | 16 | |
Scottish & Southern Energy PLC | | | 1,798 | | | | 38 | |
Serco Group PLC | | | 591 | | | | 5 | |
Severn Trent PLC Class H | | | 599 | | | | 15 | |
Shire PLC - ADR (Æ) | | | 493 | | | | 16 | |
Smith & Nephew PLC | | | 782 | | | | 8 | |
Smiths Group PLC | | | 278 | | | | 5 | |
Tate & Lyle PLC | | | 523 | | | | 6 | |
Tesco PLC | | | 3,019 | | | | 16 | |
Unilever PLC | | | 1,659 | | | | 55 | |
United Utilities Group PLC | | | 1,810 | | | | 17 | |
Vodafone Group PLC - ADR (Æ) | | | 36,550 | | | | 102 | |
Whitbread PLC | | | 353 | | | | 10 | |
William Hill PLC | | | 159 | | | | 1 | |
WM Morrison Supermarkets PLC | | | 4,887 | | | | 23 | |
| | | | | | | | |
| | | | | | | 1,354 | |
| | | | | | | | |
| | |
Total Common Stocks
(cost $4,839) | | | | | | | 5,088 | |
| | | | | | | | |
| |
| Preferred Stocks - 0.4% | | | | | |
| Germany - 0.4% | | | | | | | | |
Henkel AG & Co. KGaA | | | 258 | | | | 19 | |
Porsche Automobil Holding SE | | | 30 | | | | 2 | |
RWE AG | | | 22 | | | | 1 | |
| | | | | | | | |
| | | | | | | 22 | |
| | | | | | | | |
| | |
Total Preferred Stocks
(cost $18) | | | | | | | 22 | |
| | | | | | | | |
| | | | | | | | |
| | | Principal
Amount ($)
or Shares | | | Market
Value
$ | |
| Short-Term Investments - 0.2% | | | | | |
| United States - 0.2% | | | | | | | | |
Russell U.S. Cash Management Fund | | | 10,606 | (¥) | | | 11 | |
| | | | | | | | |
| | |
Total Short-Term Investments
(cost $11) | | | | | | | 11 | |
| | | | | | | | |
| |
Total Investments - 99.5%
(identified cost $4,868) | | | | 5,121 | |
| |
Other Assets and Liabilities,
Net - 0.5% | | | | 26 | |
| | | | | | | | |
| | |
| Net Assets - 100.0% | | | | | | | 5,147 | |
| | | | | | | | |
See accompanying notes which are an integral part of the financial statements.
| | | | |
| | 154 | | | Russell Developed ex-U.S. Low Volatility ETF |
Russell Exchange Traded Funds Trust
Russell Developed ex-U.S. Low Volatility ETF
Schedule of Investments, continued — March 31, 2012
Amounts in thousands
| | | | | | | | | | | | | | | | | | |
| Foreign Currency Exchange Contracts | | | | | | | | | | | | | | | |
Counter
party | | Amount
Sold | | | Amount
Bought | | Settlement
Date | | | Unrealized
Appreciation
(Depreciation)
$ | |
| | | | | | | | | | | | | | | | | | |
UBS AG | | USD | | | 2 | | | EUR | | 2 | | | 04/03/12 | | | | (— | )* |
UBS AG | | USD | | | 103 | | | EUR | | 77 | | | 04/04/12 | | | | (— | )* |
UBS AG | | USD | | | 2 | | | GBP | | 1 | | | 04/04/12 | | | | (— | )* |
UBS AG | | USD | | | 5 | | | HKD | | 43 | | | 04/03/12 | | | | (— | )* |
UBS AG | | USD | | | 4 | | | SEK | | 25 | | | 04/04/12 | | | | (— | )* |
UBS AG | | CHF | | | 73 | | | USD | | 81 | | | 04/04/12 | | | | — | * |
UBS AG | | JPY | | | 2,147 | | | USD | | 26 | | | 04/04/12 | | | | (— | )* |
| | | | | | | | | | | | | | | | | | |
| |
Total Unrealized Appreciation (Depreciation) on Open Foreign Currency Exchange Contracts | | | | (— | )* |
| | | | | | | | | | | | | | | | | | |
See accompanying notes which are an integral part of the financial statements.
| | |
| Russell Developed ex-U.S. Low Volatility ETF | | 155 |
Russell Exchange Traded Funds Trust
Russell Developed ex-U.S. Low Volatility ETF
Presentation of Portfolio Holdings — March 31, 2012
Amounts in thousands
| | | | | | | | | | | | | | | | | | | | |
| | | Market Value | | | % of Net
Assets | |
| Portfolio Summary | | Level 1 | | | Level 2 | | | Level 3 | | | Total | | |
| | | | | | | | | | | | | | | | | | | | |
Common Stocks | | | | | | | | | | | | | | | | | | | | |
Australia | | $ | 346 | | | $ | — | | | $ | 8 | | | $ | 354 | | | | 6.9 | |
Belgium | | | 87 | | | | — | | | | — | | | | 87 | | | | 1.7 | |
Canada | | | 693 | | | | — | | | | — | | | | 693 | | | | 13.5 | |
Denmark | | | 64 | | | | — | | | | — | | | | 64 | | | | 1.2 | |
Finland | | | 12 | | | | — | | | | — | | | | 12 | | | | 0.2 | |
France | | | 401 | | | | — | | | | — | | | | 401 | | | | 7.8 | |
Germany | | | 311 | | | | — | | | | — | | | | 311 | | | | 6.0 | |
Hong Kong | | | 88 | | | | — | | | | — | | | | 88 | | | | 1.7 | |
Ireland | | | 5 | | | | — | | | | — | | | | 5 | | | | 0.1 | |
Isle of Man | | | 4 | | | | — | | | | — | | | | 4 | | | | 0.1 | |
Israel | | | 52 | | | | — | | | | — | | | | 52 | | | | 1.0 | |
Italy | | | 87 | | | | — | | | | — | | | | 87 | | | | 1.7 | |
Japan | | | 589 | | | | — | | | | — | | | | 589 | | | | 11.4 | |
Jersey | | | 25 | | | | — | | | | — | | | | 25 | | | | 0.5 | |
Netherlands | | | 199 | | | | — | | | | — | | | | 199 | | | | 3.9 | |
New Zealand | | | 2 | | | | — | | | | — | | | | 2 | | | | — | * |
Norway | | | 8 | | | | — | | | | — | | | | 8 | | | | 0.2 | |
Portugal | | | 8 | | | | — | | | | — | | | | 8 | | | | 0.2 | |
Singapore | | | 41 | | | | — | | | | — | | | | 41 | | | | 0.8 | |
Spain | | | 120 | | | | — | | | | — | | | | 120 | | | | 2.3 | |
Sweden | | | 39 | | | | — | | | | — | | | | 39 | | | | 0.8 | |
Switzerland | | | 545 | | | | — | | | | — | | | | 545 | | | | 10.6 | |
United Kingdom | | | 1,354 | | | | — | | | | — | | | | 1,354 | | | | 26.3 | |
Preferred Stocks | | | 22 | | | | — | | | | — | | | | 22 | | | | 0.4 | |
Short-Term Investments | | | — | | | | 11 | | | | — | | | | 11 | | | | 0.2 | |
| | | | | | | | | | | | | | | | | | | | |
| | | | | |
Total Investments | | | 5,102 | | | | 11 | | | | 8 | | | | 5,121 | | | | 99.5 | |
| | | | | | | | | | | | | | | | | | | | |
Other Assets and Liabilities, Net | | | | | | | | | | | | | | | | | | | 0.5 | |
| | | | | | | | | | | | | | | | | | | | |
| | | | | |
| | | | | | | | | | | | | | | | | | | 100.0 | |
| | | | | | | | | | | | | | | | | | | | |
Other Financial Instruments | | | | | | | | | | | | | | | | | | | | |
Foreign Currency Exchange Contracts | | | (— | )*** | | | — | | | | — | | | | (— | )*** | | | (— | )* |
| | | | | | | | | | | | | | | | | | | | |
| | | | | |
Total Other Financial Instruments** | | $ | (— | ) | | $ | — | | | $ | — | | | $ | (— | ) | | | | |
| | | | | | | | | | | | | | | | | | | | |
| * | | Less than .05% of net assets. |
| ** | | Other financial instruments reflected, such as futures, forwards, interest rate swaps, and credit default swaps are valued at the unrealized appreciation/depreciation on the instruments. |
For a description of the levels see note 2 in the Notes to Financial Statements.
Investments in which significant unobservable inputs (Level 3) used in determining a value for the period ending March 31, 2012 were less than 1% of net assets.
There were no significant transfers in and out of levels 1, 2 and 3 during the period ending March 31, 2012.
See accompanying notes which are an integral part of the financial statements.
| | | | |
| | 156 | | | Russell Developed ex-U.S. Low Volatility ETF |
Russell Exchange Traded Funds Trust
Russell Developed ex-U.S. Low Volatility ETF
Fair Value of Derivative Instruments — March 31, 2012
Amounts in thousands
| | | | |
| Derivatives not accounted for as hedging instruments | | Foreign
Currency
Contracts | |
| | | | |
| Location: Statement of Assets and Liabilities - Assets | | | | |
Unrealized appreciation on foreign currency exchange contracts | | $ | — | * |
| | | | |
| Location: Statement of Assets and Liabilities - Liabilities | | | | |
Unrealized depreciation on foreign currency exchange contracts | | $ | — | * |
| | | | |
| |
| Derivatives not accounted for as hedging instruments | | Foreign
Currency
Contracts | |
| Location: Statement of Operations - Net realized gain (loss) | | | | |
Foreign currency-related transactions | | $ | (1 | ) |
| | | | |
| Location: Statement of Operations - Net change in unrealized appreciation (depreciation) | | | | |
Foreign currency-related transactions | | $ | (— | )* |
| | | | |
For further disclosure on derivatives see note 2 in Notes to Financial Statements.
See accompanying notes which are an integral part of the financial statements.
| | |
| Russell Developed ex-U.S. Low Volatility ETF | | 157 |
Russell Exchange Traded Funds Trust
Russell Developed ex-U.S. Low Volatility ETF
Statement of Assets and Liabilities — March 31, 2012
| | | | |
| Amounts in thousands | | Russell
Developed ex-
U.S. Low
Volatility ETF | |
| | | | |
Assets | | | | |
Investments, at identified cost | | $ | 4,868 | |
Investments, at market* | | | 5,121 | |
Foreign currency holdings** | | | 9 | |
Unrealized appreciation on foreign currency exchange contracts | | | — | |
Receivables: | | | | |
Dividends | | | 24 | |
Investments sold | | | 187 | |
Foreign taxes recoverable | | | 3 | |
| | | | |
Total assets | | | 5,344 | |
| | | | |
| |
Liabilities | | | | |
Payables: | | | | |
Investments purchased | | | 196 | |
Accrued fees to affiliates | | | 1 | |
Unrealized depreciation on foreign currency exchange contracts | | | — | |
| | | | |
Total liabilities | | | 197 | |
| | | | |
| | | | |
Net Assets | | $ | 5,147 | |
| | | | |
Net Assets Consist of: | | | | |
Undistributed (overdistributed) net investment income | | $ | 14 | |
Accumulated net realized gain (loss) | | | (3 | ) |
Unrealized appreciation (depreciation) on: | | | | |
Investments | | | 253 | |
Foreign currency-related transactions | | | — | |
Additional paid-in capital | | | 4,883 | |
| | | | |
Net Assets | | $ | 5,147 | |
| | | | |
Net Asset Value, offering and redemption price per share: | | | | |
Net asset value per share:(a) | | $ | 51.47 | |
Net assets | | $ | 5,146,830 | |
Shares outstanding ($.001 par value) | | | 100,002 | |
Amounts in thousands | | | | |
| | | | |
* Investments in Affiliates, Russell U.S. Cash Management Fund | | $ | 11 | |
** Foreign currency holdings - cost | | $ | 9 | |
| (a) | Net asset value per share equals net assets divided by shares outstanding. |
See accompanying notes which are an integral part of the financial statements.
| | | | |
| | 158 | | | Statement of Assets and Liabilities |
Russell Exchange Traded Funds Trust
Russell Developed ex-U.S. Low Volatility ETF
Statement of Operations — For the Period Ended March 31, 2012
| | | | |
| Amounts in thousands | | Russell
Developed ex-
U.S. Low
Volatility ETF* | |
| | | | |
Investment Income | | | | |
Dividends | | $ | 81 | |
Less foreign taxes withheld | | | (6 | ) |
| | | | |
Total investment income | | | 75 | |
| | | | |
| |
Expenses | | | | |
Management fees | | | 12 | |
Trustee and trustee related fees | | | 6 | |
| | | | |
Expenses before reductions | | | 18 | |
Expense reductions | | | (13 | ) |
| | | | |
Net expenses | | | 5 | |
| | | | |
Net investment income (loss) | | | 70 | |
| | | | |
| |
Net Realized and Unrealized Gain (Loss) | | | | |
Net realized gain (loss) on: | | | | |
Investments | | | (2 | ) |
In-kind redemptions | | | — | |
Foreign currency-related transactions | | | (2 | ) |
| | | | |
Net realized gain (loss) | | | (4 | ) |
| | | | |
Net change in unrealized appreciation (depreciation) on: | | | | |
Investments | | | 253 | |
Foreign currency-related transactions | | | — | |
| | | | |
Net change in unrealized appreciation (depreciation) | | | 253 | |
| | | | |
Net realized and unrealized gain (loss) | | | 249 | |
| | | | |
Net Increase (Decrease) in Net Assets from Operations | | $ | 319 | |
| | | | |
| * | For the period November 3, 2011 (commencement of operations) to March 31, 2012. |
See accompanying notes which are an integral part of the financial statements.
| | |
| Statement of Operations | | 159 |
Russell Exchange Traded Funds Trust
Russell Developed ex-U.S. Low Volatility ETF
Statement of Changes in Net Assets — For the Period Ended March 31,
| | | | |
| | | Russell Developed
ex-U.S. Low
Volatility ETF | |
| Amounts in thousands | | 2012* | |
| | | | |
Increase (Decrease) in Net Assets | | | | |
| |
Operations | | | | |
Net investment income (loss) | | $ | 70 | |
Net realized gain (loss) | | | (4 | ) |
Net change in unrealized appreciation (depreciation) | | | 253 | |
| | | | |
Net increase (decrease) in net assets from operations | | | 319 | |
| | | | |
| |
Distributions | | | | |
From net investment income | | | (55 | ) |
| | | | |
Net decrease in net assets from distributions | | | (55 | ) |
| | | | |
| |
Share Transactions | | | | |
Net increase (decrease) in net assets from share transactions | | | 4,883 | |
| | | | |
Total Net Increase (Decrease) in Net Assets | | | 5,147 | |
| |
Net Assets | | | | |
Beginning of period | | | — | |
| | | | |
End of period | | $ | 5,147 | |
| | | | |
Undistributed (overdistributed) net investment income included in net assets | | $ | 14 | |
| * | For the period November 3, 2011 (commencement of operations) to March 31, 2012. |
See accompanying notes which are an integral part of the financial statements.
| | | | |
| | 160 | | | Statement of Changes in Net Assets |
(This page intentionally left blank)
Russell Exchange Traded Funds Trust
Russell Developed ex-U.S. Low Volatility ETF
Financial Highlights — For the Period Ended
For a Share Outstanding Throughout Each Period.
| | | | | | | | | | | | | | | | | | | | | | | | |
| | | $
Net Asset Value,
Beginning of
Period | | | $
Net
Investment
Income (Loss)(a)(e) | | | $
Net Realized
and Unrealized
Gain (Loss) | | | $
Total from
Investment
Operations | | |
$
Distributions
from Net
Investment Income | | |
$
Total
Distributions | |
Russell Developed ex-U.S. Low Volatility ETF | | | | | | | | | | | | | | | | | |
March 31, 2012* | | | 48.83 | | | | .70 | | | | 2.48 | | | | 3.18 | | | | (.54 | ) | | | (.54 | ) |
| (a) | Average daily shares outstanding were used for this calculation. |
| (b) | Periods less than one year are not annualized. |
| (c) | The ratios for periods less than one year are annualized. |
| (d) | Portfolio turnover rate excludes securities received or delivered from in-kind creation or redemption units. |
| (e) | Reflects amounts waived by Russell Investment Management Company (“RIMCo”). |
| * | For the period November 3, 2011 (commencement of operations) to March 31, 2012. |
See accompanying notes which are an integral part of the financial statements.
| | | | | | | | | | | | | | | | | | | | | | | | | | |
$
Net Asset Value,
End of
Period | | | %
Total
Return(b) | | | $
Net Assets,
End of Period
(000) | | | %
Ratio of Expenses
to Average
Net Assets,
Gross(c) | | | %
Ratio of Expenses
to Average
Net Assets,
Net(c)(e) | | | %
Ratio of Net
Investment Income
to Average
Net Assets(c)(e) | | | %
Portfolio
Turnover Rate(b)(d) | |
| | | | | | | | | | | | | | | | | | | | | | | | | | |
| | 51.47 | | | | 6.55 | | | | 5,147 | | | | .87 | | | | .25 | | | | 3.44 | | | | 25 | |
See accompanying notes which are an integral part of the financial statements.
Russell Exchange Traded Funds Trust
Russell Developed ex-U.S. High Momentum ETF
Portfolio Management Discussion and Analysis — March 31, 2012 (Unaudited)
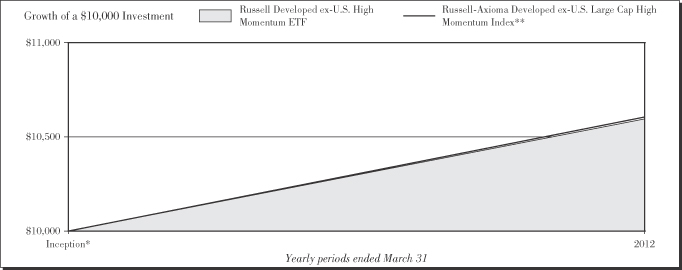
Performance as of March 31, 2012
| | | | | | | | | | | | |
|
| Average Annual Total Return | |
| | | Net Asset
Value | | | Market Value | | | Russell-Axioma
Developed
ex-U.S. Large
Cap High
Momentum
Index** | |
Inception* | | | 5.95 | % | | | 6.48 | % | | | 6.05 | % |
| | | | |
| | 164 | | | Russell Developed ex-U.S. High Momentum ETF |
Russell Exchange Traded Funds Trust
Russell Developed ex-U.S. High Momentum ETF
Portfolio Management Discussion and Analysis — March 31, 2012 (Unaudited)
The Russell Developed ex-U.S. High Momentum ETF (the “Fund”) is an index-based exchange-traded fund that seeks investment results that closely correspond to the total return of the Russell-Axioma Developed ex-U.S. Large Cap High Momentum Index (the “Index”). Russell Investment Management Company (“RIMCo”), as the Fund’s advisor, uses a “passive” or indexing approach to try to achieve the Fund’s investment objective. Unlike many investment companies, the Fund does not try to “beat” the Index it tracks and does not seek temporary defensive positions when markets decline or appear overvalued. The Fund seeks to gain exposure to the factor exhibited in its Index. The Fund will normally invest at least 80% of its total assets in securities that comprise the Index.
What is the Fund’s investment objective?
The Fund seeks investment results that closely correspond to the total return of the Russell — Axioma Developed ex-U.S. Large Cap High Momentum Index, which is designed to deliver exposure to stocks with high medium-term momentum as determined by a screening and ranking methodology applied to the output of the Axioma AX-WW 2.1 World-Wide ex-USA Equity Factor Risk model.
Is the Fund replicating or sampling?
The Fund is replicating.
How did the Fund perform relative to its benchmark for the fiscal year ended March 31, 2012?
For the fiscal year ended March 31, 2012, the Fund gained 5.95%. This is compared to the Fund’s benchmark, the Russell-Axioma Developed ex-U.S. Large Cap High Momentum Index, which gained 6.05% during the same period. The Fund’s performance includes operating expenses, whereas indexes are unmanaged and index returns do not include expenses of any kind.
There were no significant changes to either the Fund or Index during the reporting period.
Did the Fund outperform or underperform the benchmark or was performance as expected based on expenses, etc.?
The Fund performed as expected against the benchmark.
Over the reporting period, please describe those sectors that outperformed or underperformed.
Sectors achieved both positive and negative returns for the Fund and the Index. Financials was the best performing sector for the Fund and the Index, while utilities was the worst performing sector. Financials, with an average weight of 14.7% was the best contributor to Fund and Index returns. Telecommunication services, with an average weight of 9.9%, was the worst contributor to Fund and Index returns.
Over the reporting period, please describe those individual securities (constituents) that outperformed or underperformed.
Scor SE, Euler Hermes SA, and Novo Nordisk A/S generated positive returns and contributed the most to Fund performance while Telefonica SA, Trilogy Energy Corp, and Sanrio Co Ltd, all declined which detracted from Fund performance.
The views expressed in this report reflect those of the portfolio managers only through the end of the period covered by the report. These views do not necessarily represent the views of RIMCo, or any other person in RIMCo or any other affiliated organization. These views are subject to change at any time based upon market conditions or other events, and RIMCo disclaims any responsibility to update the views contained herein. These views should not be relied on as investment advice and, because investment decisions for a Russell Exchange Traded Funds Trust (“RET”) Fund are based on numerous factors, should not be relied on as an indication of investment decisions of any RET Fund.
| * | | Commenced operations by issuing shares November 3, 2011. |
| ** | | The Russell-Axioma Developed ex-U.S. High Momentum Index is designed to deliver exposure to stocks with high medium-term momentum as determined by a screening and ranking methodology applied to the output of the Axioma AX-WW 2.1 World-Wide ex-USA Equity Factor Risk model. Medium-term momentum is a measure of a stock’s past price performance as measured by cumulative return over the last 250 trading days, excluding the last 20 trading days. Stocks exhibiting high momentum can be used by investors to adjust momentum exposure in a portfolio. |
Performance is historical and assumes reinvestment of all dividends and capital gains. Investment return and principal value will fluctuate so that an investor’s shares, when redeemed, may be worth more or less than when purchased. Past performance is not indicative of future results. The returns shown do not reflect the deduction of taxes that a shareholder would pay on Fund distributions or the redemption of Fund shares.
| | |
| Russell Developed ex-U.S. High Momentum ETF | | 165 |
Russell Exchange Traded Funds Trust
Russell Developed ex-U.S. High Momentum ETF
Shareholder Expense Example — March 31, 2012 (Unaudited)
Fund Expenses
The following disclosure provides important information regarding each Fund’s Expense Example, which appears on each Fund’s individual page in this Annual Report. Please refer to this information when reviewing the Expense Example for a Fund.
Example
As a shareholder of the Fund, you incur two types of costs: (1) transaction costs, including brokerage commissions on purchases and sales of your Fund shares and (2) ongoing costs, including management fees and other Fund expenses. The Example is intended to help you understand your ongoing costs (in dollars) of investing in the Fund and to compare these costs with the ongoing costs of investing in other funds. The Example is based on an investment of $1,000 invested at the beginning of the period and held for the entire period indicated, which for this Fund is from November 3, 2011 (commencement of operations) to March 31, 2012.
Actual Expenses
The information in the table under the heading “Actual Performance” provides information about actual account values and actual expenses. You may use the information in this column, together with the amount you invested, to estimate the expenses that you paid over the period. Simply divide your account value by $1,000 (for example, an $8,600 account value divided by $1,000 = 8.6), then multiply the result by the number in the first column in the row entitled “Expenses Paid During Period” to estimate the expenses you paid on your account during this period.
Hypothetical Example for Comparison Purposes
The information in the table under the heading “Hypothetical Performance (5% return before expenses)” provides information about hypothetical account values and hypothetical expenses based on the Fund’s actual expense ratio and an assumed rate of return of 5% per year before expenses, which is not the Fund’s actual return. The hypothetical account values and expenses may not be used to estimate the actual ending account balance or expenses you paid for the period. You may use this information to compare the ongoing costs of investing in the Fund and other funds. To do so, compare this 5% hypothetical example with the 5% hypothetical examples that appear in the shareholder reports of other funds.
Please note that the expenses shown in the table are meant to highlight your ongoing costs only and do not reflect any transactional costs, such as brokerage commissions paid on purchases and sales of Fund shares. Therefore, the information under the heading “Hypothetical Performance (5% return before expenses)” is useful in comparing ongoing costs only, and will not help you determine the relative total costs of owning different funds. In addition, if these transactional costs were included, your costs would have been higher.
| | | | | | | | |
| | | Actual
Performance | | | Hypothetical
Performance
(5% return
before expenses) | |
| | | | | | | | |
Beginning Account Value | | | | | | | | |
November 3, 2011 | | $ | 1,000.00 | | | $ | 1,000.00 | |
Ending Account Value | | | | | | | | |
March 31, 2012 | | $ | 1,059.50 | | | $ | 1,023.75 | |
Ending Account Value | | | | | | | | |
Expenses Paid During the Period* | | $ | 1.06 | | | $ | 1.26 | |
| * | Actual expenses are equal to the Fund’s annualized expense ratio of 0.25% (representing the 150-day period annualized), multiplied by the average account value over the period, multiplied by 150/366 (to reflect the period since commencement of operations). May reflect amounts waived and/or reimbursed. Without the waivers and reimbursements, expenses would have been higher. Hypothetical expenses are equal to the Fund’s annualized expense ratio of 0.25% (representing the six month period annualized), multiplied by the average account value over the period, multiplied by 183/366 (to reflect the one-half period). |
| | | | |
| | 166 | | | Russell Developed ex-U.S. High Momentum ETF |
Russell Exchange Traded Funds Trust
Russell Developed ex-U.S. High Momentum ETF
Schedule of Investments — March 31, 2012
Amounts in thousands (except share amounts)
| | | | | | | | |
| | | Principal
Amount ($)
or Shares | | | Market
Value
$ | |
| | | | | | | | |
| Common Stocks - 98.0% | | | | | | | | |
| Australia - 5.5% | | | | | | | | |
AGL Energy, Ltd. | | | 562 | | | | 9 | |
Australia & New Zealand Banking Group, Ltd. - ADR | | | 1,095 | | | | 26 | |
CFS Retail Property Trust (ö) | | | 2,320 | | | | 4 | |
Coca-Cola Amatil, Ltd. | | | 929 | | | | 12 | |
Commonwealth Bank of Australia - ADR | | | 738 | | | | 38 | |
GPT Group (ö) | | | 5,455 | | | | 18 | |
Iluka Resources, Ltd. | | | 1,660 | | | | 31 | |
Mirvac Group Class REIT (ö) | | | 874 | | | | 1 | |
National Australia Bank, Ltd. - ADR | | | 75 | | | | 2 | |
New Hope Corp., Ltd. | | | 955 | | | | 5 | |
QR National, Ltd. | | | 3,426 | | | | 13 | |
Tatts Group, Ltd. | | | 3,492 | | | | 9 | |
Telstra Corp., Ltd. | | | 14,270 | | | | 49 | |
Treasury Wine Estates, Ltd. | | | 1,547 | | | | 7 | |
Washington H Soul Pattinson & Co., Ltd. | | | 326 | | | | 5 | |
Wesfarmers, Ltd. | | | 867 | | | | 27 | |
Westfield Group (ö) | | | 261 | | | | 2 | |
Westpac Banking Corp. | | | 126 | | | | 3 | |
Woolworths, Ltd. | | | 685 | | | | 18 | |
| | | | | | | | |
| | | | | | | 279 | |
| | | | | | | | |
| | |
| Austria - 0.0% | | | | | | | | |
Raiffeisen Bank International AG | | | 60 | | | | 2 | |
| | | | | | | | |
| | |
| Belgium - 0.7% | | | | | | | | |
Anheuser-Busch InBev NV | | | 251 | | | | 18 | |
Colruyt SA | | | 65 | | | | 3 | |
Delhaize Group SA | | | 44 | | | | 2 | |
D’ieteren SA | | | 253 | | | | 12 | |
Mobistar SA | | | 35 | | | | 2 | |
| | | | | | | | |
| | | | | | | 37 | |
| | | | | | | | |
| | |
| Bermuda - 1.3% | | | | | | | | |
Dairy Farm International Holdings, Ltd. | | | 900 | | | | 9 | |
First Pacific Co., Ltd./Hong Kong | | | 18,000 | | | | 20 | |
Jardine Matheson Holdings, Ltd. | | | 400 | | | | 21 | |
Jardine Strategic Holdings, Ltd. | | | 500 | | | | 15 | |
| | | | | | | | |
| | | | | | | 65 | |
| | | | | | | | |
| | |
| Canada - 12.8% | | | | | | | | |
ARC Resources, Ltd. | | | 276 | | | | 6 | |
Atco, Ltd. Class I | | | 10 | | | | 1 | |
Bank of Montreal | | | 386 | | | | 23 | |
Bank of Nova Scotia | | | 623 | | | | 35 | |
Baytex Energy Corp. | | | 601 | | | | 31 | |
BCE, Inc. | | | 1,963 | | | | 79 | |
Bell Aliant, Inc. | | | 1,049 | | | | 29 | |
Canadian Imperial Bank of Commerce | | | 37 | | | | 3 | |
Canadian National Railway Co. | | | 153 | | | | 12 | |
Canadian Utilities, Ltd. Class A | | | 127 | | | | 8 | |
Centerra Gold, Inc. | | | 238 | | | | 4 | |
CGI Group, Inc. Class A (Æ) | | | 558 | | | | 12 | |
Crescent Point Energy Corp. | | | 314 | | | | 13 | |
Empire Co., Ltd. Class A | | | 211 | | | | 12 | |
| | | | | | | | |
| | | Principal
Amount ($)
or Shares | | | Market
Value
$ | |
Fairfax Financial Holdings, Ltd. | | | 31 | | | | 12 | |
Genworth MI Canada, Inc. | | | 324 | | | | 7 | |
H&R Real Estate Investment Trust (ö) | | | 1,089 | | | | 26 | |
Jean Coutu Group PJC, Inc. (The) Class A | | | 5,378 | | | | 76 | |
Keyera Corp. | | | 453 | | | | 19 | |
Manitoba Telecom Services, Inc. - ADR | | | 236 | | | | 8 | |
National Bank of Canada | | | 335 | | | | 27 | |
New Gold, Inc. (Æ) | | | 1,632 | | | | 16 | |
Power Corp. of Canada | | | 81 | | | | 2 | |
Royal Bank of Canada - GDR | | | 891 | | | | 52 | |
TELUS Corp. Class A | | | 458 | | | | 26 | |
TELUS Corp. | | | 350 | | | | 20 | |
Tim Hortons, Inc. | | | 39 | | | | 2 | |
Toronto-Dominion Bank (The) | | | 342 | | | | 29 | |
Tourmaline Oil Corp. (Æ) | | | 78 | | | | 2 | |
TransCanada Corp. | | | 99 | | | | 4 | |
Trilogy Energy Corp. | | | 1,068 | | | | 28 | |
Valeant Pharmaceuticals International, Inc. (Æ) | | | 588 | | | | 31 | |
| | | | | | | | |
| | | | | | | 655 | |
| | | | | | | | |
| | |
| Cayman Islands - 0.4% | | | | | | | | |
Sands China, Ltd. | | | 2,400 | | | | 9 | |
Wynn Macau, Ltd. | | | 4,400 | | | | 13 | |
| | | | | | | | |
| | | | | | | 22 | |
| | | | | | | | |
| | |
| Denmark - 2.5% | | | | | | | | |
Carlsberg A/S Class B | | | 150 | | | | 12 | |
Coloplast A/S Class B | | | 120 | | | | 21 | |
Novo Nordisk A/S Class B | | | 673 | | | | 93 | |
Novozymes A/S Class B | | | 45 | | | | 1 | |
| | | | | | | | |
| | | | | | | 127 | |
| | | | | | | | |
| | |
| Finland - 0.4% | | | | | | | | |
Fortum OYJ | | | 285 | | | | 7 | |
Kone OYJ Class B | | | 26 | | | | 1 | |
Nokian Renkaat OYJ | | | 82 | | | | 4 | |
Sampo OYJ Class A | | | 365 | | | | 11 | |
| | | | | | | | |
| | | | | | | 23 | |
| | | | | | | | |
| | |
| France - 6.4% | | | | | | | | |
Air Liquide SA Class A | | | 106 | | | | 14 | |
Arkema SA | | | 55 | | | | 5 | |
Christian Dior SA | | | 46 | | | | 7 | |
Cie Generale d’Optique Essilor International SA | | | 82 | | | | 7 | |
Danone | | | 352 | | | | 25 | |
France Telecom SA - ADR | | | 1,617 | | | | 24 | |
GDF Suez | | | 135 | | | | 3 | |
Hermes International | | | 217 | | | | 73 | |
L’Oreal SA | | | 71 | | | | 9 | |
LVMH Moet Hennessy Louis Vuitton SA -ADR | | | 129 | | | | 22 | |
Pernod-Ricard SA | | | 144 | | | | 15 | |
Sanofi - ADR | | | 659 | | | | 51 | |
SCOR SE - ADR | | | 118 | | | | 3 | |
| | |
| Russell Developed ex-U.S. High Momentum ETF | | 167 |
Russell Exchange Traded Funds Trust
Russell Developed ex-U.S. High Momentum ETF
Schedule of Investments, continued — March 31, 2012
Amounts in thousands (except share amounts)
| | | | | | | | |
| | | Principal
Amount ($)
or Shares | | | Market
Value
$ | |
| | | | | | | | |
Sodexo | | | 81 | | | | 7 | |
Total SA | | | 864 | | | | 44 | |
Unibail-Rodamco SE (ö) | | | 19 | | | | 4 | |
Vivendi SA - ADR | | | 140 | | | | 3 | |
Zodiac Aerospace | | | 114 | | | | 12 | |
| | | | | | | | |
| | | | | | | 328 | |
| | | | | | | | |
| | |
| Germany - 6.0% | | | | | | | | |
BASF SE | | | 490 | | | | 42 | |
Bayer AG | | | 197 | | | | 14 | |
Bayerische Motoren Werke AG | | | 496 | | | | 44 | |
Continental AG | | | 6 | | | | 1 | |
Deutsche Telekom AG | | | 1,711 | | | | 21 | |
E.ON AG | | | 255 | | | | 6 | |
Fresenius Medical Care AG & Co. KGaA | | | 212 | | | | 15 | |
Fresenius SE & Co. KGaA | | | 92 | | | | 9 | |
Henkel AG & Co. KGaA | | | 311 | | | | 19 | |
Infineon Technologies AG - ADR | | | 839 | | | | 9 | |
Merck KGaA | | | 280 | | | | 31 | |
MTU Aero Engines Holding AG | | | 74 | | | | 6 | |
Muenchener Rueckversicherungs AG | | | 64 | | | | 10 | |
SAP AG - ADR | | | 294 | | | | 20 | |
Siemens AG | | | 354 | | | | 36 | |
Sky Deutschland AG (Æ) | | | 1,500 | | | | 4 | |
Volkswagen AG | | | 110 | | | | 18 | |
| | | | | | | | |
| | | | | | | 305 | |
| | | | | | | | |
| | |
| Guernsey - 0.2% | | | | | | | | |
Resolution, Ltd. | | | 2,200 | | | | 9 | |
| | | | | | | | |
| | |
| Hong Kong - 1.5% | | | | | | | | |
Galaxy Entertainment Group, Ltd. (Æ) | | | 6,000 | | | | 17 | |
Hang Lung Group, Ltd. | | | 1,000 | | | | 6 | |
Hang Lung Properties, Ltd. - ADR | | | 1,000 | | | | 4 | |
Link REIT (The) (ö) | | | 3,000 | | | | 11 | |
SJM Holdings, Ltd. | | | 8,000 | | | | 16 | |
Sun Hung Kai Properties, Ltd. | | | 1,000 | | | | 12 | |
Wharf Holdings, Ltd. | | | 2,000 | | | | 11 | |
| | | | | | | | |
| | | | | | | 77 | |
| | | | | | | | |
| | |
| Ireland - 1.2% | | | | | | | | |
CRH PLC | | | 475 | | | | 10 | |
Elan Corp. PLC (Æ) | | | 3,351 | | | | 49 | |
| | | | | | | | |
| | | | | | | 59 | |
| | | | | | | | |
| | |
| Israel - 0.4% | | | | | | | | |
Check Point Software Technologies, Ltd. (Æ) | | | 324 | | | | 21 | |
| | | | | | | | |
| | |
| Italy - 1.2% | | | | | | | | |
Banca Monte dei Paschi di Siena SpA | | | 4,322 | | | | 2 | |
ENI SpA - ADR | | | 1,092 | | | | 25 | |
Lottomatica SpA | | | 105 | | | | 2 | |
Pirelli & C SpA - ADR | | | 975 | | | | 12 | |
Prada SpA (Æ) | | | 1,500 | | | | 10 | |
Salvatore Ferragamo Italia SpA (Æ) | | | 525 | | | | 11 | |
| | | | | | | | |
| | | | | | | 62 | |
| | | | | | | | |
| | | | | | | | |
| | | Principal
Amount ($)
or Shares | | | Market
Value
$ | |
| Japan - 15.1% | | | | | | | | |
Acom Co., Ltd. (Æ) | | | 2,340 | | | | 53 | |
Aozora Bank, Ltd. (Æ) | | | 2,000 | | | | 6 | |
Bridgestone Corp. | | | 300 | | | | 7 | |
Coca-Cola West Co., Ltd. | | | 100 | | | | 2 | |
Dainippon Sumitomo Pharma Co., Ltd. | | | 1,300 | | | | 14 | |
Eisai Co., Ltd. | | | 500 | | | | 20 | |
Fast Retailing Co., Ltd. | | | 200 | | | | 46 | |
Fukuoka Financial Group, Inc. | | | 1,000 | | | | 4 | |
Gree, Inc. | | | 1,200 | | | | 30 | |
Hino Motors, Ltd. | | | 5,000 | | | | 36 | |
Hisamitsu Pharmaceutical Co., Inc. | | | 300 | | | | 14 | |
Hitachi, Ltd. | | | 3,000 | | | | 19 | |
Isuzu Motors, Ltd. | | | 10,000 | | | | 59 | |
Itochu Techno-Solutions Corp. | | | 200 | | | | 9 | |
JX Holdings, Inc. | | | 400 | | | | 2 | |
Keisei Electric Railway Co., Ltd. | | | 1,000 | | | | 8 | |
Konami Corp. | | | 900 | | | | 26 | |
Lawson, Inc. | | | 400 | | | | 25 | |
Medipal Holdings Corp. | | | 3,900 | | | | 51 | |
Mitsubishi Heavy Industries, Ltd. | | | 1,000 | | | | 5 | |
Mitsubishi UFJ Lease & Finance Co., Ltd. | | | 60 | | | | 3 | |
Namco Bandai Holdings, Inc. | | | 800 | | | | 12 | |
Nikon Corp. | | | 800 | | | | 24 | |
Nippon Paper Group, Inc. | | | 100 | | | | 2 | |
Nippon Telegraph & Telephone Corp. | | | 300 | | | | 14 | |
Nissan Motor Co., Ltd. | | | 300 | | | | 3 | |
Nitori Holdings Co., Ltd. | | | 50 | | | | 5 | |
NOK Corp. | | | 400 | | | | 9 | |
NTT DoCoMo, Inc. | | | 7 | | | | 12 | |
OJI Paper Co., Ltd. | | | 1,000 | | | | 5 | |
Ono Pharmaceutical Co., Ltd. | | | 1,000 | | | | 57 | |
Otsuka Holdings Co., Ltd. | | | 1,000 | | | | 30 | |
Rakuten, Inc. | | | 20 | | | | 21 | |
Sanrio Co., Ltd. | | | 700 | | | | 27 | |
Santen Pharmaceutical Co., Ltd. | | | 300 | | | | 13 | |
Secom Co., Ltd. (Æ) | | | 100 | | | | 5 | |
Sega Sammy Holdings, Inc. | | | 200 | | | | 4 | |
Seven & I Holdings Co., Ltd. | | | 300 | | | | 9 | |
Taisho Pharmaceutical Holdings Co., Ltd. (Æ) | | | 100 | | | | 8 | |
Takeda Pharmaceutical Co., Ltd. | | | 500 | | | | 22 | |
Tokyo Gas Co., Ltd. | | | 2,000 | | | | 9 | |
Toray Industries, Inc. | | | 1,000 | | | | 7 | |
Unicharm Corp. | | | 600 | | | | 32 | |
Yamato Holdings Co., Ltd. | | | 300 | | | | 5 | |
| | | | | | | | |
| | | | | �� | | 774 | |
| | | | | | | | |
| | |
| Jersey - 0.6% | | | | | | | | |
Experian PLC | | | 1,022 | | | | 16 | |
Petrofac, Ltd. | | | 215 | | | | 6 | |
Randgold Resources, Ltd. | | | 49 | | | | 4 | |
Wolseley PLC | | | 166 | | | | 6 | |
| | | | | | | | |
| | | | | | | 32 | |
| | | | | | | | |
| | |
| Netherlands - 1.6% | | | | | | | | |
ASML Holding NV Class G | | | 272 | | | | 13 | |
| | | | |
| | 168 | | | Russell Developed ex-U.S. High Momentum ETF |
Russell Exchange Traded Funds Trust
Russell Developed ex-U.S. High Momentum ETF
Schedule of Investments, continued — March 31, 2012
Amounts in thousands (except share amounts)
| | | | | | | | |
| | | Principal
Amount ($)
or Shares | | | Market
Value
$ | |
| | | | | | | | |
European Aeronautic Defence and Space Co. NV | | | 92 | | | | 4 | |
Gemalto NV | | | 39 | | | | 3 | |
Koninklijke Ahold NV | | | 789 | | | | 11 | |
Koninklijke Boskalis Westminster NV | | | 95 | | | | 4 | |
Koninklijke DSM NV | | | 65 | | | | 4 | |
Nutreco NV | | | 32 | | | | 2 | |
NXP Semiconductor NV (Æ) | | | 102 | | | | 3 | |
Unilever NV | | | 1,153 | | | | 38 | |
| | | | | | | | |
| | | | | | | 82 | |
| | | | | | | | |
| | |
| Norway - 0.4% | | | | | | | | |
Kongsberg Gruppen AS | | | 590 | | | | 11 | |
Statoil ASA Class N | | | 404 | | | | 11 | |
| | | | | | | | |
| | | | | | | 22 | |
| | | | | | | | |
| | |
| Singapore - 0.2% | | | | | | | | |
Keppel Land, Ltd. | | | 3,000 | | | | 8 | |
| | | | | | | | |
| | |
| Spain - 2.7% | | | | | | | | |
Acciona SA | | | 169 | | | | 12 | |
ACS Actividades de Construccion y Servicios SA | | | 7 | | | | — | ± |
Endesa SA - ADR | | | 154 | | | | 3 | |
Gas Natural SDG SA | | | 1,438 | | | | 23 | |
Iberdrola SA | | | 857 | | | | 5 | |
Inditex SA | | | 157 | | | | 15 | |
Mapfre SA | | | 2,150 | | | | 7 | |
Repsol YPF SA - ADR | | | 1,171 | | | | 29 | |
Telefonica SA - ADR | | | 2,799 | | | | 46 | |
| | | | | | | | |
| | | | | | | 140 | |
| | | | | | | | |
| | |
| Sweden - 1.7% | | | | | | | | |
Assa Abloy AB Class B | | | 108 | | | | 3 | |
Atlas Copco AB Class A | | | 290 | | | | 7 | |
Elekta AB Class B | | | 5 | | | | — | ± |
Hennes & Mauritz AB Class B | | | 711 | | | | 27 | |
Lundin Petroleum AB (Æ) | | | 772 | | | | 16 | |
Meda AB Class A | | | 1,950 | | | | 19 | |
Svenska Handelsbanken AB Class A (Æ) | | | 30 | | | | 1 | |
Swedish Match AB | | | 160 | | | | 6 | |
Telefonaktiebolaget LM Ericsson Class B | | | 548 | | | | 6 | |
TeliaSonera AB | | | 341 | | | | 2 | |
| | | | | | | | |
| | | | | | | 87 | |
| | | | | | | | |
| | |
| Switzerland - 6.7% | | | | | | | | |
ABB, Ltd. (Æ) | | | 503 | | | | 10 | |
Actelion, Ltd. (Æ) | | | 65 | | | | 2 | |
Cie Financiere Richemont SA | | | 184 | | | | 12 | |
Nestle SA | | | 1,641 | | | | 103 | |
Novartis AG | | | 1,236 | | | | 68 | |
Roche Holding AG | | | 574 | | | | 100 | |
Swiss Re AG | | | 542 | | | | 35 | |
Syngenta AG | | | 10 | | | | 3 | |
Zurich Financial Services AG (Æ) | | | 44 | | | | 12 | |
| | | | | | | | |
| | | | | | | 345 | |
| | | | | | | | |
| | | | | | | | |
| | | Principal
Amount ($)
or Shares | | | Market
Value
$ | |
| United Kingdom - 27.8% | | | | | |
Aggreko PLC | | | 1,399 | | | | 50 | |
AMEC PLC - GDR | | | 291 | | | | 5 | |
Amlin PLC | | | 2,001 | | | | 11 | |
Anglo American PLC | | | 493 | | | | 18 | |
ARM Holdings PLC | | | 1,386 | | | | 13 | |
Associated British Foods PLC | | | 535 | | | | 10 | |
AstraZeneca PLC - ADR (Æ) | | | 515 | | | | 23 | |
Aviva PLC | | | 600 | | | | 3 | |
BAE Systems PLC | | | 661 | | | | 3 | |
BG Group PLC | | | 2,505 | | | | 58 | |
BHP Billiton PLC | | | 1,135 | | | | 35 | |
BP PLC | | | 6,598 | | | | 49 | |
British American Tobacco PLC | | | 2,012 | | | | 102 | |
British Land Co. PLC (ö) | | | 1,539 | | | | 12 | |
British Sky Broadcasting Group PLC | | | 844 | | | | 9 | |
Burberry Group PLC | | | 1,212 | | | | 29 | |
Compass Group PLC | | | 3,188 | | | | 33 | |
Diageo PLC | | | 1,297 | | | | 31 | |
Drax Group PLC | | | 2,026 | | | | 18 | |
GlaxoSmithKline PLC - ADR | | | 4,228 | | | | 95 | |
Hammerson PLC (ö) | | | 342 | | | | 2 | |
HSBC Holdings PLC | | | 5,345 | | | | 47 | |
IMI PLC - ADR | | | 854 | | | | 13 | |
Imperial Tobacco Group PLC | | | 1,042 | | | | 42 | |
Inchcape PLC | | | 1,049 | | | | 6 | |
Investec PLC | | | 434 | | | | 3 | |
J Sainsbury PLC | | | 1,330 | | | | 7 | |
Johnson Matthey PLC Class H | | | 38 | | | | 1 | |
Kingfisher PLC | | | 4,370 | | | | 21 | |
Land Securities Group PLC (ö) | | | 715 | | | | 8 | |
Meggitt PLC | | | 954 | | | | 6 | |
Mondi PLC | | | 3,049 | | | | 29 | |
National Grid PLC | | | 1,425 | | | | 14 | |
Next PLC | | | 289 | | | | 14 | |
Pearson PLC | | | 917 | | | | 17 | |
Provident Financial PLC | | | 14 | | | | — | ± |
Prudential PLC | | | 541 | | | | 6 | |
Reed Elsevier PLC | | | 1,529 | | | | 14 | |
Rexam PLC | | | 792 | | | | 5 | |
Rio Tinto PLC (Æ) | | | 26 | | | | 1 | |
Rolls-Royce Holdings PLC (Æ) | | | 1,371 | | | | 18 | |
Royal Bank of Scotland Group PLC -ADR (Æ) | | | 8,500 | | | | 4 | |
Royal Dutch Shell PLC Class A | | | 2,785 | | | | 98 | |
Royal Dutch Shell PLC Class B | | | 2,520 | | | | 90 | |
RSA Insurance Group PLC | | | 5,346 | | | | 9 | |
SABMiller PLC - ADR | | | 1,187 | | | | 48 | |
Sage Group PLC (The) | | | 498 | | | | 2 | |
Scottish & Southern Energy PLC | | | 1,118 | | | | 24 | |
Shire PLC - ADR (Æ) | | | 1,112 | | | | 36 | |
Smith & Nephew PLC | | | 1,072 | | | | 11 | |
Standard Chartered PLC | | | 1,038 | | | | 26 | |
Standard Life PLC | | | 942 | | | | 3 | |
Tate & Lyle PLC | | | 276 | | | | 3 | |
Tesco PLC | | | 905 | | | | 5 | |
Travis Perkins PLC | | | 837 | | | | 14 | |
| | |
| Russell Developed ex-U.S. High Momentum ETF | | 169 |
Russell Exchange Traded Funds Trust
Russell Developed ex-U.S. High Momentum ETF
Schedule of Investments, continued — March 31, 2012
Amounts in thousands (except share amounts)
| | | | | | | | |
| | | Principal
Amount ($)
or Shares | | | Market
Value
$ | |
| | | | | | | | |
TUI Travel PLC | | | 348 | | | | 1 | |
Tullow Oil PLC | | | 410 | | | | 10 | |
Unilever PLC | | | 1,089 | | | | 36 | |
Vodafone Group PLC - ADR (Æ) | | | 35,418 | | | | 98 | |
Weir Group PLC (The) | | | 656 | | | | 18 | |
| | | | | | | | |
| | | | | | | 1,417 | |
| | | | | | | | |
| | |
| United States - 0.7% | | | | | | | | |
Lululemon Athletica, Inc. Class 3 | | | 512 | | | | 38 | |
| | | | | | | | |
| | |
Total Common Stocks (cost $4,778) | | | | | | | 5,016 | |
| | | | | | | | |
| |
| Preferred Stocks - 1.2% | | | | | |
| Germany - 1.2% | | | | | | | | |
Henkel AG & Co. KGaA | | | 349 | | | | 26 | |
Hugo Boss AG | | | 11 | | | | 1 | |
Porsche Automobil Holding SE | | | 87 | | | | 5 | |
Volkswagen AG | | | 179 | | | | 31 | |
| | | | | | | | |
| | | | | | | 63 | |
| | | | | | | | |
| |
Total Preferred Stocks (cost $58) | | | | 63 | |
| | | | | | | | |
| |
| Short-Term Investments - 0.3% | | | | | |
| United States - 0.3% | | | | | | | | |
Russell U.S. Cash Management Fund | | | 12,974 | (¥) | | | 13 | |
| | | | | | | | |
| |
Total Short-Term Investments (cost $13) | | | | 13 | |
| | | | | | | | |
| |
Total Investments - 99.5% (identified cost $4,849) | | | | 5,092 | |
| |
Other Assets and Liabilities, Net - 0.5% | | | | 26 | |
| | | | | | | | |
| | |
| Net Assets - 100.0% | | | | | | | 5,118 | |
| | | | | | | | |
See accompanying notes which are an integral part of the financial statements.
| | | | |
| | 170 | | | Russell Developed ex-U.S. High Momentum ETF |
Russell Exchange Traded Funds Trust
Russell Developed ex-U.S. High Momentum ETF
Schedule of Investments, continued — March 31, 2012
Amounts in thousands
| | | | | | | | | | | | | | | | | | | | | | |
| Foreign Currency Exchange Contracts | | | | | | | |
Counterparty | | Amount
Sold | | | Amount
Bought | | | Settlement
Date | | | Unrealized
Appreciation
(Depreciation)
$ | |
| | | | | | | | | | | | | | | | | | | | | | |
UBS AG | | USD | | | 283 | | | | JPY | | | | 23,278 | | | | 04/04/12 | | | | — | * |
UBS AG | | AUD | | | 24 | | | | USD | | | | 24 | | | | 04/04/12 | | | | (— | )* |
UBS AG | | CAD | | | 91 | | | | USD | | | | 91 | | | | 04/04/12 | | | | — | * |
UBS AG | | CHF | | | 92 | | | | USD | | | | 102 | | | | 04/04/12 | | | | — | * |
UBS AG | | DKK | | | 2 | | | | USD | | | | — | | | | 04/04/12 | | | | — | * |
UBS AG | | EUR | | | 20 | | | | USD | | | | 27 | | | | 04/03/12 | | | | — | * |
UBS AG | | EUR | | | 8 | | | | USD | | | | 11 | | | | 04/04/12 | | | | — | * |
UBS AG | | GBP | | | 7 | | | | USD | | | | 10 | | | | 04/04/12 | | | | — | * |
UBS AG | | HKD | | | 12 | | | | USD | | | | 2 | | | | 04/03/12 | | | | — | * |
UBS AG | | SEK | | | 31 | | | | USD | | | | 5 | | | | 04/04/12 | | | | — | * |
UBS AG | | SGD | | | 8 | | | | USD | | | | 7 | | | | 04/04/12 | | | | (— | )* |
| | | | | | | | | | | | | | | | | | | | | | |
| | | | |
Total Unrealized Appreciation (Depreciation) on Open Foreign Currency Exchange Contracts | | | | | | | | | | | | | | | | — | * |
| | | | | | | | | | | | | | | | | | | | | | |
See accompanying notes which are an integral part of the financial statements.
| | |
| Russell Developed ex-U.S. High Momentum ETF | | 171 |
Russell Exchange Traded Funds Trust
Russell Developed ex-U.S. High Momentum ETF
Presentation of Portfolio Holdings — March 31, 2012
Amounts in thousands
| | | | | | | | | | | | | | | | | | | | |
| | | Market Value | | | % of Net
Assets | |
| Portfolio Summary | | Level 1 | | | Level 2 | | | Level 3 | | | Total | | |
| | | | | | | | | | | | | | | | | | | | |
Common Stocks | | | | | | | | | | | | | | | | | | | | |
Australia | | $ | 279 | | | $ | — | | | $ | — | | | $ | 279 | | | | 5.5 | |
Austria | | | 2 | | | | — | | | | — | | | | 2 | | | | — | * |
Belgium | | | 37 | | | | — | | | | — | | | | 37 | | | | 0.7 | |
Bermuda | | | 65 | | | | — | | | | — | | | | 65 | | | | 1.3 | |
Canada | | | 655 | | | | — | | | | — | | | | 655 | | | | 12.8 | |
Cayman Islands | | | 22 | | | | — | | | | — | | | | 22 | | | | 0.4 | |
Denmark | | | 127 | | | | — | | | | — | | | | 127 | | | | 2.5 | |
Finland | | | 23 | | | | — | | | | — | | | | 23 | | | | 0.4 | |
France | | | 328 | | | | — | | | | — | | | | 328 | | | | 6.4 | |
Germany | | | 305 | | | | — | | | | — | | | | 305 | | | | 6.0 | |
Guernsey | | | 9 | | | | — | | | | — | | | | 9 | | | | 0.2 | |
Hong Kong | | | 77 | | | | — | | | | — | | | | 77 | | | | 1.5 | |
Ireland | | | 59 | | | | — | | | | — | | | | 59 | | | | 1.2 | |
Israel | | | 21 | | | | — | | | | — | | | | 21 | | | �� | 0.4 | |
Italy | | | 62 | | | | — | | | | — | | | | 62 | | | | 1.2 | |
Japan | | | 774 | | | | — | | | | — | | | | 774 | | | | 15.1 | |
Jersey | | | 32 | | | | — | | | | — | | | | 32 | | | | 0.6 | |
Netherlands | | | 82 | | | | — | | | | — | | | | 82 | | | | 1.6 | |
Norway | | | 22 | | | | — | | | | — | | | | 22 | | | | 0.4 | |
Singapore | | | 8 | | | | — | | | | — | | | | 8 | | | | 0.2 | |
Spain | | | 140 | | | | — | | | | — | | | | 140 | | | | 2.7 | |
Sweden | | | 87 | | | | — | | | | — | | | | 87 | | | | 1.7 | |
Switzerland | | | 345 | | | | — | | | | — | | | | 345 | | | | 6.7 | |
United Kingdom | | | 1,417 | | | | — | | | | — | | | | 1,417 | | | | 27.8 | |
United States | | | 38 | | | | — | | | | — | | | | 38 | | | | 0.7 | |
Preferred Stocks | | | 63 | | | | — | | | | — | | | | 63 | | | | 1.2 | |
Short-Term Investments | | | — | | | | 13 | | | | — | | | | 13 | | | | 0.3 | |
| | | | | | | | | | | | | | | | | | | | |
| | | | | |
Total Investments | | | 5,079 | | | | 13 | | | | — | | | | 5,092 | | | | 99.5 | |
| | | | | | | | | | | | | | | | | | | | |
Other Assets and Liabilities, Net | | | | | | | | | | | | | | | | | | | 0.5 | |
| | | | | | | | | | | | | | | | | | | | |
| | | | | |
| | | | | | | | | | | | | | | | | | | 100.0 | |
| | | | | | | | | | | | | | | | | | | | |
Other Financial Instruments | | | | | | | | | | | | | | | | | | | | |
Foreign Currency Exchange Contracts | | | — | *** | | | — | | | | — | | | | — | *** | | | — | * |
| | | | | | | | | | | | | | | | | | | | |
| | | | | |
Total Other Financial Instruments** | | $ | — | | | $ | — | | | $ | — | | | $ | — | | | | | |
| | | | | | | | | | | | | | | | | | | | |
| * | | Less than .05% of net assets. |
| ** | | Other financial instruments reflected, such as futures, forwards, interest rate swaps, and credit default swaps are valued at the unrealized appreciation/depreciation on the instruments. |
For a description of the levels see note 2 in the Notes to Financial Statements.
There were no significant transfers in and out of levels 1, 2 and 3 during the period ending March 31, 2012.
See accompanying notes which are an integral part of the financial statements.
| | | | |
| | 172 | | | Russell Developed ex-U.S. High Momentum ETF |
Russell Exchange Traded Funds Trust
Russell Developed ex-U.S. High Momentum ETF
Fair Value of Derivative Instruments — March 31, 2012
Amounts in thousands
| | | | |
| Derivatives not accounted for as hedging instruments | | | |
| | | | |
Location: Statement of Assets and Liabilities - Assets | | | | |
Unrealized appreciation on foreign currency exchange contracts | | $ | — | * |
| | | | |
Location: Statement of Assets and Liabilities - Liabilities | | | | |
Unrealized depreciation on foreign currency exchange contracts | | $ | — | * |
| | | | |
| | | | |
| Derivatives not accounted for as hedging instruments | | Foreign
Currency
Contracts | |
| | | | |
Location: Statement of Operations - Net realized gain (loss) | | | | |
Foreign currency-related transactions | | $ | — | * |
| | | | |
Location: Statement of Operations - Net change in unrealized appreciation (depreciation) | | | | |
Foreign currency-related transactions | | $ | — | * |
| | | | |
For further disclosure on derivatives see note 2 in Notes to Financial Statements.
See accompanying notes which are an integral part of the financial statements.
| | |
| Russell Developed ex-U.S. High Momentum ETF | | 173 |
Russell Exchange Traded Funds Trust
Russell Developed ex-U.S. High Momentum ETF
Statement of Assets and Liabilities — March 31, 2012
| | | | |
| Amounts in thousands | | Russell Developed
ex-U.S. High
Momentum ETF | |
| | | | |
Assets | | | | |
Investments, at identified cost | | $ | 4,849 | |
Investments, at market* | | | 5,092 | |
Foreign currency holdings** | | | 8 | |
Unrealized appreciation on foreign currency exchange contracts | | | — | |
Receivables: | | | | |
Dividends | | | 21 | |
Investments sold | | | 399 | |
Foreign taxes recoverable | | | 3 | |
| | | | |
Total assets | | | 5,523 | |
| | | | |
| |
Liabilities | | | | |
Payables: | | | | |
Investments purchased | | | 404 | |
Accrued fees to affiliates | | | 1 | |
Unrealized depreciation on foreign currency exchange contracts | | | — | |
| | | | |
Total liabilities | | | 405 | |
| | | | |
| | | | |
Net Assets | | $ | 5,118 | |
| | | | |
Net Assets Consist of: | | | | |
Undistributed (overdistributed) net investment income | | $ | 13 | |
Accumulated net realized gain (loss) | | | (16 | ) |
Unrealized appreciation (depreciation) on: | | | | |
Investments | | | 243 | |
Foreign currency-related transactions | | | — | |
Additional paid-in capital | | | 4,878 | |
| | | | |
Net Assets | | $ | 5,118 | |
| | | | |
Net Asset Value, offering and redemption price per share: | | | | |
Net asset value per share:(a) | | $ | 51.17 | |
Net assets | | $ | 5,117,553 | |
Shares outstanding ($.001 par value) | | | 100,002 | |
Amounts in thousands | | | | |
| | | | |
* Investments in Affiliates, Russell U.S. Cash Management Fund | | $ | 13 | |
** Foreign currency holdings - cost | | $ | 8 | |
| (a) | Net asset value per share equals net assets divided by shares outstanding. |
See accompanying notes which are an integral part of the financial statements.
| | | | |
| | 174 | | | Statements of Assets and Liabilities |
Russell Exchange Traded Funds Trust
Russell Developed ex-U.S. High Momentum ETF
Statement of Operations — For the Period Ended March 31, 2012
| | | | |
| Amounts in thousands | | Russell Developed
ex-U.S. High
Momentum ETF* | |
| | | | |
Investment Income | | | | |
Dividends | | $ | 73 | |
Less foreign taxes withheld | | | (6 | ) |
| | | | |
Total investment income | | | 67 | |
| | | | |
| |
Expenses | | | | |
Management fees | | | 12 | |
Trustee and trustee related fees | | | 6 | |
| | | | |
Expenses before reductions | | | 18 | |
Expense reductions | | | (13 | ) |
| | | | |
Net expenses | | | 5 | |
| | | | |
Net investment income (loss) | | | 62 | |
| | | | |
| |
Net Realized and Unrealized Gain (Loss) | | | | |
Net realized gain (loss) on: | | | | |
Investments | | | (16 | ) |
In-kind redemptions | | | — | |
Foreign currency-related transactions | | | (1 | ) |
| | | | |
Net realized gain (loss) | | | (17 | ) |
| | | | |
Net change in unrealized appreciation (depreciation) on: | | | | |
Investments | | | 243 | |
Foreign currency-related transactions | | | — | |
| | | | |
Net change in unrealized appreciation (depreciation) | | | 243 | |
| | | | |
Net realized and unrealized gain (loss) | | | 226 | |
| | | | |
Net Increase (Decrease) in Net Assets from Operations | | $ | 288 | |
| | | | |
| * | For the period November 3, 2011 (commencement of operations) to March 31, 2012. |
See accompanying notes which are an integral part of the financial statements.
| | |
| Statements of Operations | | 175 |
Russell Exchange Traded Funds Trust
Russell Developed ex-U.S. High Momentum ETF
Statement of Changes in Net Assets — For the Periods Ended March 31,
| | | | |
| | | Russell Developed
ex-U.S. High
Momentum ETF | |
| Amounts in thousands | | 2012* | |
| | | | |
Increase (Decrease) in Net Assets | | | | |
| |
Operations | | | | |
Net investment income (loss) | | $ | 62 | |
Net realized gain (loss) | | | (17 | ) |
Net change in unrealized appreciation (depreciation) | | | 243 | |
| | | | |
Net increase (decrease) in net assets from operations | | | 288 | |
| | | | |
| |
Distributions | | | | |
From net investment income | | | (48 | ) |
| | | | |
Net decrease in net assets from distributions | | | (48 | ) |
| | | | |
| |
Share Transactions | | | | |
Net increase (decrease) in net assets from share transactions | | | 4,878 | |
| | | | |
Total Net Increase (Decrease) in Net Assets | | | 5,118 | |
| |
Net Assets | | | | |
Beginning of period | | | — | |
| | | | |
End of period | | $ | 5,118 | |
| | | | |
Undistributed (overdistributed) net investment income included in net assets | | $ | 13 | |
| * | For the period November 3, 2011 (commencement of operations) to March 31, 2012. |
See accompanying notes which are an integral part of the financial statements.
| | | | |
| | 176 | | | Statements of Changes in Net Assets |
(This page intentionally left blank)
Russell Exchange Traded Funds Trust
Russell Developed ex-U.S. High Momentum ETF
Financial Highlights — For the Period Ended
For a Share Outstanding Throughout Each Period.
| | | | | | | | | | | | | | | | | | | | | | | | |
| | |
$
Net Asset Value,
Beginning of
Period | | | $
Net
Investment
Income (Loss)(a)(e) | | | $
Net Realized
and Unrealized
Gain (Loss) | | | $
Total from
Investment
Operations | | | $
Distributions
from Net
Investment Income | | | $
Total
Distributions | |
Russell Developed ex-U.S. High Momentum ETF | | | | | | | | | |
March 31, 2012* | | | 48.77 | | | | .63 | | | | 2.25 | | | | 2.88 | | | | (.48 | ) | | | (.48 | ) |
| (a) | Average daily shares outstanding were used for this calculation. |
| (b) | Periods less than one year are not annualized. |
| (c) | The ratios for periods less than one year are annualized. |
| (d) | Portfolio turnover rate excludes securities received or delivered from in-kind creation or redemption units. |
| (e) | Reflects amounts waived by Russell Investment Management Company (“RIMCo”). |
| * | For the period November 3, 2011 (commencement of operations) to March 31, 2012. |
See accompanying notes which are an integral part of the financial statements.
| | | | | | | | | | | | | | | | | | | | | | | | | | |
$
Net Asset Value,
End of
Period | | | %
Total
Return(b) | | | $
Net Assets,
End of Period
(000) | | | %
Ratio of Expenses
to Average
Net Assets,
Gross(c) | | | %
Ratio of Expenses
to Average
Net Assets,
Net(c)(e) | | | %
Ratio of Net
Investment Income
to Average
Net Assets(c)(e) | | | %
Portfolio
Turnover Rate(b)(d) | |
| | | | | | | | | | | | | | | | | | | | | | | | | | |
| | 51.17 | | | | 5.95 | | | | 5,118 | | | | .87 | | | | .25 | | | | 3.09 | | | | 32 | |
See accompanying notes which are an integral part of the financial statements.
Russell Exchange Traded Funds Trust
Russell Factor ETFs™
Notes to Schedules of Investments — March 31, 2012
Footnotes:
| (Æ) | Non-income producing security. |
| (ö) | Real Estate Investment Trust (REIT). |
| (Þ) | Restricted security. Security may have contractual restrictions on resale, may have been offered in a private placement transaction, and may not be registered under the Securities Act of 1933. |
| (Å) | Illiquid and restricted security. |
Abbreviations:
ADR - American Depositary Receipt
GDR - Global Depositary Receipt
| | | | |
| | 180 | | | Notes to Schedules of Investments |
Russell Exchange Traded Funds Trust
Russell Factor ETFs™
Notes to Financial Statements — March 31, 2012
Russell Exchange Traded Funds Trust (the “Investment Company” or “RET”) is a series investment company comprised of 26 different investment portfolios that were in operation as of March 31, 2012. These financial statements report on 13 of these Funds (each a “Fund” and collectively, the “Funds”). The Investment Company is registered under the Investment Company Act of 1940, as amended, as an open-end management investment company. It is organized and operates as a Delaware statutory trust under an Amended and Restated Agreement and Declaration of Trust dated August 31, 2011 (“Master Trust Agreement”). The Investment Company’s Master Trust Agreement permits the Board of Trustees (the “Board”) to issue an unlimited number of shares of beneficial interest.
Each Fund is an exchange-traded fund (“ETF”). ETFs are funds that trade like other publicly-traded securities and may be designed to track an index or to be actively managed. The investment objective of the Funds is to seek investment results that correspond generally to the price and yield performance, before fees and expenses, of its underlying index. The investment adviser uses a “passive” or index approach to try to achieve each Fund’s investment objective.
Unlike shares of a mutual fund, which can be bought from and redeemed by the issuing fund by all shareholders at a price based on net asset value (“NAV”), shares of a Fund may be directly purchased from and redeemed by a Fund at NAV solely by certain large institutional investors. Also unlike shares of a mutual fund, shares of each Fund are listed on a national securities exchange and trade in the secondary market at market prices that change throughout the day. The date the shares began trading on the secondary market is the “commencement of operations” date.
The Funds issue and redeem shares at their respective NAV only in blocks of a specified number of shares or multiples thereof (“Creation Units”). Only certain large institutional investors may purchase or redeem Creation Units directly with the Funds at NAV (“Authorized Participants”). These transactions are in exchange for certain securities similar to a Fund’s portfolio and/or cash. Except when aggregated in Creation Units, shares of a Fund are not redeemable securities. Shareholders who are not Authorized Participants may not redeem shares directly from a Fund.
| 2. | | Significant Accounting Policies |
The Funds’ financial statements are prepared in accordance with accounting principles generally accepted in the United States of America (“U.S. GAAP”) which require the use of management estimates and assumptions at the date of the financial statements. Actual results could differ from those estimates. The following is a summary of the significant accounting policies consistently followed by the Funds in the preparation of its financial statements.
Security Valuation
The Funds value portfolio securities according to Board-approved securities valuation procedures which include market and fair value procedures. The Board has delegated the administration responsibility of the securities valuation procedures to Russell Funds Services Company (“RFSC”).
U.S. GAAP defines fair market value as the price that a Fund would receive to sell an asset or pay to transfer a liability in an orderly transaction between market participants at the measurement date. It establishes a fair value hierarchy that prioritizes inputs to valuation methods and requires a separate disclosure of the fair value hierarchy, for each major category of assets and liabilities, that segregates fair value measurements into levels (Level 1, 2, and 3). The inputs or methodology used for valuing securities are not necessarily an indication of the risk associated with investing in those securities. Levels 1, 2 and 3 of the fair value hierarchy are defined as follows:
| | • | | Level 1 — Quoted prices (unadjusted) in active markets or exchanges for identical assets and liabilities. |
| | • | | Level 2 — Significant other observable inputs, which may include, but are not limited to, quoted prices for similar assets or liabilities in markets that are active, quoted prices for identical or similar assets or liabilities in markets that are non-active, inputs other than quoted prices that are observable for the assets or liabilities (such as interest rates, yield curves, volatilities, prepayment speeds, loss severities, credit risks and default rates) or other market corroborated inputs. |
| | • | | Level 3 — Significant unobservable inputs based on the best information available in the circumstances, to the extent observable inputs are not available, which may include assumptions made by the Board or persons acting at their direction that are used in determining the fair market value of investments. |
| | |
| Notes to Financial Statements | | 181 |
Russell Exchange Traded Funds Trust
Russell Factor ETFs™
Notes to Financial Statements, continued — March 31, 2012
The valuation techniques and significant inputs used in determining the fair market values of financial instruments classified as Level 1 and Level 2 of the fair value hierarchy are as follows:
Common stocks, exchange traded funds and derivatives that are traded on a national securities exchange are stated at the last reported sale or settlement price on the day of valuation. To the extent these securities are actively traded and valuation adjustments are not applied, they are categorized as Level 1 of the fair value hierarchy.
Financial over-the-counter derivative instruments are instruments such as foreign currency contracts, futures contracts, options contracts, or swap agreements that derive their value from underlying asset prices, indices, reference rates, and other inputs or a combination of these factors. These contracts are normally valued on the basis of broker-dealer quotations or pricing service providers. Depending on the product and the terms of the transaction, the value of the derivative contracts can be estimated by a pricing service provider using a series of techniques, including simulation pricing models. The pricing models use inputs that are observed from actively quoted markets such as issuer details, indices, spreads, interest rates, curves, dividends and exchange rates. Derivatives that use similar valuation techniques and inputs as described above are categorized as Level 2 of the fair value hierarchy.
Investments in other mutual funds (including unregistered collective vehicles) are valued at their net asset value per share, and are categorized as Level 2 of the fair value hierarchy.
Events or circumstances affecting the values of Fund securities that occur between the closing of the principal markets on which they trade and the time the NAV of Fund shares is determined may be reflected in the calculation of NAVs for each applicable Fund when the Funds deem that the particular event or circumstance would materially affect such Fund’s NAV. Funds that invest primarily in frequently traded exchange-listed securities will use fair value pricing in limited circumstances since reliable market quotations will often be readily available. Funds that invest in foreign securities are likely to use fair value pricing more often since significant events may occur between the close of foreign markets and the time of pricing which would trigger fair value pricing of the foreign securities. Although there are observable inputs assigned on a security level, prices are derived from factors using proprietary models or matrix pricing. For this reason, significant events will cause movement between Levels 1 and 2. Examples of events that could trigger fair value pricing of one or more securities are: a company development; a natural disaster; or an armed conflict.
Preferred stock and other equities traded on inactive markets or valued by reference to similar instruments are also categorized as Level 2 of the fair value hierarchy.
The NAV of a Fund’s portfolio that includes foreign securities may change on days when shareholders will not be able to purchase or redeem fund shares, since foreign securities can trade on non-business days.
Level 3 Trading Assets and Trading Liabilities, at Fair Value
The valuation techniques and significant inputs used in determining the fair values of financial instruments classified as Level 3 of the fair value hierarchy are as follows:
Securities and other assets for which market quotes are not readily available are valued at fair value as determined in good faith by the Board and are categorized as Level 3 of the fair value hierarchy. Market quotes are considered not readily available in circumstances where there is an absence of current or reliable market-based data (e.g., trade information or broker quotes). When RFSC applies fair valuation methods that use significant unobservable inputs to determine a Fund’s NAV, securities will not be priced on the basis of quotes from the primary market in which they are traded, but rather may be priced by another method that the Board or persons acting at their direction believe accurately reflects fair value and are categorized as Level 3 of the fair value hierarchy. Fair value pricing may require subjective determinations about the value of a security. While the securities valuation procedures are intended to result in a calculation of a Fund’s NAV that fairly reflects security values as of the time of pricing, the process cannot guarantee that fair values determined by the Board or persons acting at their direction would accurately reflect the price that a Fund could obtain for a security if it were to dispose of that security as of the time of pricing (for instance, in a forced or distressed sale). The prices used by a Fund may differ from the value that would be realized if the securities were sold.
For fair valuations using significant unobservable inputs, U.S. GAAP requires a reconciliation of the beginning to ending balances for reported market values that presents changes attributable to total realized and unrealized gains or losses, purchases and sales, and transfers in/out of the Level 3 category during the period. In accordance with the requirements of U.S. GAAP, a fair value hierarchy and Level 3 reconciliation, if any, have been included in the Notes to the Schedule of Investments for each respective Fund, if considered material.
In 2011, the Financial Accounting Standards Board (“FASB”) issued an update to requirements relating to fair valuation measurements which represent amendments to achieve common fair value measurements and disclosure requirements in U.S.
| | | | |
| | 182 | | | Notes to Financial Statements |
Russell Exchange Traded Funds Trust
Russell Factor ETFs™
Notes to Financial Statements, continued — March 31, 2012
GAAP and International Financial Reporting Standards. The amendments are of two types: (i) those that clarify the FASB’s intent about the application of existing fair value measurements and disclosure requirements and (ii) those that change a particular principle or requirement for measuring fair value or for disclosing information about fair value measurements.
The amendments that change a particular principle or requirement for measuring fair value or disclosing information about fair value measurements relate to (i) measuring the fair value of the financial instruments that are managed within a portfolio; (ii) application of premium and discount in a fair value measurement; and (iii) additional disclosures about fair value measurements. The update is effective for annual periods beginning after December 15, 2011. Management does not believe the adoption of this update will have a material impact on the Funds’ financial statements.
Investment Transactions
Investment transactions are reflected as of the trade date for financial reporting purposes. This may cause the NAV stated in the financial statements to be different from the NAV at which shareholders may transact. Realized gains and losses from securities transactions, if any, are recorded on the basis of specific identified cost.
Investment Income
Dividend income is recorded net of applicable withholding taxes on the ex-dividend date, except that certain dividends from foreign securities are recorded as soon thereafter as the Funds are informed of the ex-dividend date.
Federal Income Taxes
Since the Investment Company is a Delaware statutory trust, each Fund is a separate corporate taxpayer and determines its net investment income and capital gains (or losses) and the amounts to be distributed to each Fund’s shareholders without regard to the income and capital gains (or losses) of the other Funds.
Each Fund qualifies as a regulated investment company under sub-chapter M of the Internal Revenue Code and intends to distribute all of its taxable income and capital gains. Therefore, no federal income tax provision is required for the Funds. The Funds comply with the authoritative guidance for uncertainty in income taxes which requires management to determine whether a tax position of the Funds is more likely than not to be sustained upon examination, including resolution of any related appeals or litigation processes, based on the technical merits of the position. For tax positions meeting the more likely than not threshold, the tax amount recognized in the financial statements is reduced by the largest benefit that has a greater than 50% likelihood of being realized upon ultimate settlement with the relevant taxing authority. Management determined that no accruals need to be made in the financial statements due to uncertain tax positions. Management continually reviews and adjusts its liability for income taxes based on analyses of tax laws and regulations, as well as their interpretations, and other relevant factors.
Dividends and Distributions to Shareholders
For all Funds, income dividends, capital gain distributions and return of capital, if any, are recorded on the ex-dividend date. Income dividends are generally declared and paid quarterly. Capital gain distributions are generally declared and paid annually. An additional distribution may be paid by the Funds to avoid imposition of federal income and excise tax on any remaining undistributed capital gains and net investment income. Dividends and distributions cannot be automatically reinvested in additional shares of the Funds.
The timing and characterization of certain income and capital gain distributions are determined in accordance with federal tax regulations which may differ from U.S. GAAP. As a result, net investment income and net realized gain (or loss) from investment and foreign currency-related transactions for a reporting period may differ significantly from distributions during such period. The differences between tax regulations and U.S. GAAP relate primarily to investments in forward contracts, wash sale deferrals, certain securities sold at a loss and capital loss carryforwards. Accordingly, the Funds may periodically make reclassifications among certain of their capital accounts without impacting their net asset values.
Foreign Currency Translations
The books and records of the Funds are maintained in U.S. dollars. Foreign currency amounts and transactions of the Funds are translated into U.S. dollars on the following basis:
| | (a) | Market value of investment securities, other assets and liabilities at the closing rate of exchange on the valuation date. |
| | (b) | Purchases and sales of investment securities and income at the closing rate of exchange prevailing on the respective trade dates of such transactions. |
| | |
| Notes to Financial Statements | | 183 |
Russell Exchange Traded Funds Trust
Russell Factor ETFs™
Notes to Financial Statements, continued — March 31, 2012
Net realized gains or losses from foreign currency-related transactions arise from: sales of foreign currencies; currency gains or losses realized between the trade and settlement dates on securities transactions; the difference between the amounts of dividends, and foreign withholding taxes recorded on the Funds books and the U.S. dollar equivalent of the amounts actually received or paid. Net unrealized gains or losses from foreign currency-related transactions arise from changes in the value of assets and liabilities, other than investments in securities, as a result of changes in the exchange rates.
The Funds do not isolate that portion of the results of operations of the Funds that arises as a result of changes in exchange rates from that portion that arises from changes in market prices of investments during the year. Such fluctuations are included within the net realized and unrealized gain or loss from investments. However, for federal income tax purposes the Funds do isolate the effects of changes in foreign exchange rates from the fluctuations arising from changes in market prices for realized gain (or loss) on debt obligations.
Capital Gains Taxes
The Russell Developed ex-U.S. Low Beta ETF, Russell Developed ex-U.S. Low Volatility ETF and Russell Developed ex-U.S. High Momentum ETF may be subject to capital gains taxes and repatriation taxes imposed by certain countries in which they invest. The Russell Developed ex-U.S. Low Beta ETF, Russell Developed ex-U.S. Low Volatility ETF and Russell Developed ex-U.S. High Momentum ETF may record a deferred tax liability with respect to the unrealized appreciation on foreign securities for potential capital gains and repatriation taxes at March 31, 2012. The accrual for capital gains and repatriation taxes is included in net unrealized appreciation (depreciation) on investments in the Statements of Assets and Liabilities for the Funds. The amounts related to capital gains and repatriation taxes are included in net realized gain (loss) on investments in the Statements of Operations for the Funds. The Russell Developed ex-U.S. Low Beta ETF, Russell Developed ex-U.S. Low Volatility ETF and Russell Developed ex-U.S. High Momentum ETF had no deferred tax liability as of March 31, 2012. None of the Funds had a realized gain (loss) on investments for capital gains taxes for the period ended March 31, 2012.
Foreign Currency Exchange Contracts
In connection with investment transactions consistent with the Funds’ investment objectives and strategies, certain Funds may enter into foreign currency exchange spot contracts and forward foreign currency exchange contracts (“FX contracts”). From time to time the Funds may enter into FX contracts to hedge certain foreign currency-denominated assets. FX contracts are recorded at market value. Certain risks may arise upon entering into these FX contracts from the potential inability of counterparties to meet the terms of their FX contracts and are generally limited to the amount of unrealized gain on the FX contracts, if any, that are disclosed in the Statements of Assets and Liabilities. Realized gains or losses arising from such transactions are included in net realized gain (or loss) from foreign currency-related transactions.
For the period ended March 31, 2012, the following Funds entered into foreign currency exchange contracts primarily for the strategies listed below:
| | | | |
| Funds | | Strategies | |
Russell Developed ex-U.S. Low Beta ETF | | | Trade Settlement | |
Russell Developed ex-U.S. Low Volatility ETF | | | Trade Settlement | |
Russell Developed ex-U.S. High Momentum ETF | | | Trade Settlement | |
The Funds’ foreign currency contract notional dollar values fluctuate throughout the operating year as required to meet strategic requirements. The following tables illustrate the quarterly volume of foreign currency contracts. For the purpose of this disclosure, volume is measured by the amounts bought and sold in USD.
| | | | | | | | |
| | | Outstanding Contract Amounts Sold | |
| Quarter Ended | | December 31, 2011 | | | March 31, 2012 | |
Russell Developed ex-U.S. Low Beta ETF | | | 235,361 | | | | 267,034 | |
Russell Developed ex-U.S. Low Volatility ETF | | | 385,021 | | | | 222,513 | |
Russell Developed ex-U.S. High Momentum ETF | | | 463,451 | | | | 560,998 | |
| |
| | | Outstanding Contract Amounts Bought | |
| Quarter Ended | | December 31, 2011 | | | March 31, 2012 | |
Russell Developed ex-U.S. Low Beta ETF | | | 235,361 | | | | 267,084 | |
Russell Developed ex-U.S. Low Volatility ETF | | | 385,020 | | | | 222,473 | |
Russell Developed ex-U.S. High Momentum ETF | | | 463,459 | | | | 560,999 | |
| | | | |
| | 184 | | | Notes to Financial Statements |
Russell Exchange Traded Funds Trust
Russell Factor ETFs™
Notes to Financial Statements, continued — March 31, 2012
Guarantees
In the normal course of business the Funds enter into contracts that contain a variety of representations which provide general indemnifications. The Funds maximum exposure under these arrangements is unknown as this would involve future claims that may be made against the Funds that have not yet occurred. However, the Funds expect the risk of loss to be remote.
Market, Credit and Counterparty Risk
In the normal course of business, the Funds trade financial instruments and enter into financial transactions where risk of potential loss exists due to changes in the market (market risk) or failure of the other party to a transaction to perform (credit risk). Similar to the credit risk, the Funds may also be exposed to counterparty risk or risk that an institution or other entity with which the Funds have unsettled or open transactions will default. The potential loss could exceed the value of the relevant assets recorded in the Funds’ financial statements (the “Assets”). The Assets, which potentially expose the Funds to credit risk, consist principally of cash due from counterparties and investments. The extent of the Funds’ exposure to credit and counterparty risks with respect to the Assets approximates their carrying value as recorded in the Funds’ Statements of Assets and Liabilities.
ETF Specific Risk
The Funds are managed with a passive investment strategy, attempting to track the performance of an unmanaged index of securities. This differs from an actively managed fund, which typically seeks to outperform a benchmark index. As a result, the Funds may hold constituent securities of the Index regardless of the current or projected performance of a specific security or a particular industry, market sector, country or currency. Maintaining investments in securities regardless of market conditions or the performance of individual securities could cause the Funds’ return to be lower or higher than if the Fund employed an active strategy.
The Funds’ return may not match or achieve a high degree of correlation with the return of the Index due to security mismatches, operating expenses, transaction costs, cash flows and operational inefficiencies.
| 3. | | Investment Transactions |
Securities
During the period ended March 31, 2012, purchases and sales of the Funds (excluding investments held for short-term purposes and in-kind transactions) were as follows:
| | | | | | | | |
| | | Purchases | | | Sales | |
| | | | | | | | |
Russell 1000 Low Beta ETF | | $ | 3,000,593 | | | $ | 2,975,403 | |
Russell 1000 High Beta ETF | | | 14,357,156 | | | | 14,350,971 | |
Russell 1000 Low Volatility ETF | | | 28,252,374 | | | | 28,294,819 | |
Russell 1000 High Volatility ETF | | | 6,091,521 | | | | 6,087,000 | |
Russell 1000 High Momentum ETF | | | 6,392,164 | | | | 6,391,578 | |
Russell 2000 Low Beta ETF | | | 1,898,860 | | | | 1,892,458 | |
Russell 2000 High Beta ETF | | | 5,989,742 | | | | 5,969,263 | |
Russell 2000 Low Volatility ETF | | | 4,696,792 | | | | 4,828,164 | |
Russell 2000 High Volatility ETF | | | 7,468,865 | | | | 7,471,542 | |
Russell 2000 High Momentum ETF | | | 6,816,130 | | | | 6,807,715 | |
Russell Developed ex-U.S. Low Beta ETF | | | 1,304,443 | | | | 1,304,564 | |
Russell Developed ex-U.S. Low Volatility ETF | | | 1,260,722 | | | | 1,269,813 | |
Russell Developed ex-U.S. High Momentum ETF | | | 1,574,347 | | | | 1,578,949 | |
For the period ended March 31, 2012, purchases and sales of the Funds resulting from in-kind redemptions were:
| | | | | | | | |
| | | Purchases | | | Sales | |
| | | | | | | | |
Russell 1000 Low Beta ETF | | $ | 35,696,994 | | | $ | — | |
Russell 1000 High Beta ETF | | | 23,507,181 | | | | 17,360,431 | |
Russell 1000 Low Volatility ETF | | | 109,666,095 | | | | 37,329,657 | |
Russell 1000 High Volatility ETF | | | 14,689,049 | | | | 8,709,380 | |
Russell 1000 High Momentum ETF | | | 9,902,980 | | | | 4,587,945 | |
Russell 2000 Low Beta ETF | | | 4,936,678 | | | | — | |
Russell 2000 High Beta ETF | | | 13,255,514 | | | | 8,058,750 | |
Russell 2000 Low Volatility ETF | | | 9,994,229 | | | | 4,939,544 | |
Russell 2000 High Volatility ETF | | | 18,419,119 | | | | 11,239,508 | |
| | |
| Notes to Financial Statements | | 185 |
Russell Exchange Traded Funds Trust
Russell Factor ETFs™
Notes to Financial Statements, continued — March 31, 2012
| | | | | | | | |
| | | Purchases | | | Sales | |
| | | | | | | | |
Russell 2000 High Momentum ETF | | $ | 9,866,757 | | | $ | 4,726,143 | |
Russell Developed ex-U.S. Low Beta ETF | | | 4,861,695 | | | | — | |
Russell Developed ex-U.S. Low Volatility ETF | | | 4,870,371 | | | | — | |
Russell Developed ex-U.S. High Momentum ETF | | | 4,856,312 | | | | — | |
Because gains and losses resulting from such in-kind transactions are not taxable to the Funds and are not distributed to existing fund shareholders, the gains or losses are reclassified from accumulated net realized gains or losses to paid-in capital at the end of the Funds’ tax year. These reclassifications have no effect on net assets or net assets per share. The realized in-kind gains or losses for the period ended March 31, 2012, are disclosed in the Funds’ Statements of Operations.
| 4. | | Related Party Transactions, Fees and Expenses |
Russell Investment Management Company (“RIMCo”) advises the Funds and RFSC is the Funds’ administrator. RFSC is a wholly-owned subsidiary of RIMCo. RIMCo is a wholly-owned subsidiary of Frank Russell Company (a subsidiary of The Northwestern Mutual Life Insurance Company). Frank Russell Company provides ongoing money manager research and trade placement services to RET and RIMCo.
The Funds may also invest their cash reserves (the “Cash Balances”) in the Russell U.S. Cash Management Fund, an unregistered fund advised by RIMCo and administered by RFSC. As of March 31, 2012, the Funds presented herein have invested $327,596 in the Russell U.S. Cash Management Fund.
The management fees specified in the table below are based upon the average daily net assets of the Funds and are payable monthly. The Adviser pays all of the expenses of the Funds other than the management fee, distribution fees pursuant to the Funds’ Supervision and Management Agreements, if any, brokerage expenses, taxes, interest fees, litigation expenses, acquired fund fees and other extraordinary expenses.
| | | | |
| | | Annual Rate | |
| | | | |
Russell 1000 Low Beta ETF | | | 0.49% | |
Russell 1000 High Beta ETF | | | 0.49% | |
Russell 1000 Low Volatility ETF | | | 0.49% | |
Russell 1000 High Volatility ETF | | | 0.49% | |
Russell 1000 High Momentum ETF | | | 0.49% | |
Russell 2000 Low Beta ETF | | | 0.69% | |
Russell 2000 High Beta ETF | | | 0.69% | |
Russell 2000 Low Volatility ETF | | | 0.69% | |
Russell 2000 High Volatility ETF | | | 0.69% | |
Russell 2000 High Momentum ETF | | | 0.69% | |
Russell Developed ex-U.S. Low Beta ETF | | | 0.59% | |
Russell Developed ex-U.S. Low Volatility ETF | | | 0.59% | |
Russell Developed ex-U.S. High Momentum ETF | | | 0.59% | |
The following shows the amount of the management fees paid by the Funds for the period ended March 31, 2012:
| | | | |
| | | Management | |
| | | | |
Russell 1000 Low Beta ETF | | $ | 26,577 | |
Russell 1000 High Beta ETF | | | 51,481 | |
Russell 1000 Low Volatility ETF | | | 144,022 | |
Russell 1000 High Volatility ETF | | | 24,527 | |
Russell 1000 High Momentum ETF | | | 29,559 | |
Russell 2000 Low Beta ETF | | | 27,902 | |
Russell 2000 High Beta ETF | | | 27,719 | |
Russell 2000 Low Volatility ETF | | | 27,908 | |
Russell 2000 High Volatility ETF | | | 52,675 | |
Russell 2000 High Momentum ETF | | | 46,999 | |
Russell Developed ex-U.S. Low Beta ETF | | | 11,942 | |
Russell Developed ex-U.S. Low Volatility ETF | | | 11,955 | |
Russell Developed ex-U.S. High Momentum ETF | | | 11,923 | |
| | | | |
| | 186 | | | Notes to Financial Statements |
Russell Exchange Traded Funds Trust
Russell Factor ETFs™
Notes to Financial Statements, continued — March 31, 2012
Waivers and Reimbursements
For the Russell 1000 Low Beta ETF, Russell 1000 High Beta ETF, Russell 1000 Low Volatility ETF, Russell 1000 High Volatility ETF and Russell 1000 High Momentum ETF, RIMCo has contractually agreed, until July 29, 2014, to waive up to 0.29% of its 0.49% management fee. These waivers cannot be terminated during the relevant period except with Board approval. The total amount of the waivers for the period ended March 31, 2012 was:
| | | | |
| | | Waiver | |
| | | | |
Russell 1000 Low Beta ETF | | $ | 9,726 | |
Russell 1000 High Beta ETF | | | 10,296 | |
Russell 1000 Low Volatility ETF | | | 46,738 | |
Russell 1000 High Volatility ETF | | | 5,517 | |
Russell 1000 High Momentum ETF | | | 6,113 | |
For the Russell 2000 Low Beta ETF, Russell 2000 High Beta ETF, Russell 2000 Low Volatility ETF, Russell 2000 High Volatility ETF and Russell 2000 High Momentum ETF, RIMCo has contractually agreed, until July 29, 2014, to waive up to 0.39% of its 0.69% management fee. These waivers cannot be terminated during the relevant period except with Board approval. The total amount of the waivers for the period ended March 31, 2012 was:
| | | | |
| | | Waiver | |
| | | | |
Russell 2000 Low Beta ETF | | $ | 7,758 | |
Russell 2000 High Beta ETF | | | 7,002 | |
Russell 2000 Low Volatility ETF | | | 7,825 | |
Russell 2000 High Volatility ETF | | | 7,882 | |
Russell 2000 High Momentum ETF | | | 11,343 | |
For the Russell Developed ex-U.S. Low Beta ETF, Russell Developed ex-U.S. Low Volatility ETF and Russell Developed ex-U.S. High Momentum ETF, RIMCo has contractually agreed, until July 29, 2014, to waive up to 0.34% of its 0.59% management fee. These waivers cannot be terminated during the relevant period except with Board approval. The total amount of the waivers for the period ended March 31, 2012 was:
| | | | |
| | | Waiver | |
| | | | |
Russell Developed ex-U.S. Low Beta ETF | | $ | 6,882 | |
Russell Developed ex-U.S. Low Volatility ETF | | | 6,889 | |
Russell Developed ex-U.S. High Momentum ETF | | | 6,871 | |
The Adviser has voluntarily agreed to waive trustee and trustee related expenses paid by the Funds. For the period ended March 31, 2012, the total trustee and trustee related fees waived amounted to:
| | | | |
| | | Trustee | |
| | | | |
Russell 1000 Low Beta ETF | | $ | 16,392 | |
Russell 1000 High Beta ETF | | | 32,771 | |
Russell 1000 Low Volatility ETF | | | 82,235 | |
Russell 1000 High Volatility ETF | | | 17,144 | |
Russell 1000 High Momentum ETF | | | 19,878 | |
Russell 2000 Low Beta ETF | | | 14,443 | |
Russell 2000 High Beta ETF | | | 14,332 | |
Russell 2000 Low Volatility ETF | | | 14,422 | |
Russell 2000 High Volatility ETF | | | 24,258 | |
Russell 2000 High Momentum ETF | | | 22,506 | |
Russell Developed ex-U.S. Low Beta ETF | | | 5,612 | |
Russell Developed ex-U.S. Low Volatility ETF | | | 5,628 | |
Russell Developed ex-U.S. High Momentum ETF | | | 5,608 | |
| | |
| Notes to Financial Statements | | 187 |
Russell Exchange Traded Funds Trust
Russell Factor ETFs™
Notes to Financial Statements, continued — March 31, 2012
Accrued Fees Payable to Affiliates
Accrued fees payable to affiliates for the period ended March 31, 2012 were as follows:
| | | | | | | | | | | | | | | | | | | | |
| | | Russell
1000 Low
Beta ETF | | | Russell
1000 High
Beta ETF | | | Russell 1000
Low
Volatility
ETF | | | Russell
1000 High
Volatility
ETF | | | Russell 1000
High
Momentum
ETF | |
| | | | | | | | | | | | | | | | | | | | |
Management fees | | $ | 3,560 | | | $ | 836 | | | $ | 10,696 | | | $ | 839 | | | $ | 871 | |
| | | | | | | | | | | | | | | | | | | | |
| | | Russell
2000 Low
Beta ETF | | | Russell
2000 High
Beta ETF | | | Russell
2000 Low
Volatility
ETF | | | Russell
2000 High
Volatility
ETF | | | Russell 2000
High
Momentum
ETF | |
| | | | | | | | | | | | | | | | | | | | |
Management fees | | $ | 1,291 | | | $ | 1,216 | | | $ | 1,325 | | | $ | 1,103 | | | $ | 1,289 | |
| | | | | | | | | | | | |
| | | Russell
Developed
ex-U.S. Low
Beta ETF | | | Russell
Developed
ex-U.S. Low
Volatility
ETF | | | Russell
Developed
ex-U.S. High
Momentum
ETF | |
| | | | | | | | | | | | |
Management fees | | $ | 1,099 | | | $ | 1,074 | | | $ | 1,101 | |
Concentration of Secondary Market Shareholder Interests
As of March 31, 2012, the Russell Equity I Fund, a Russell Trust Company Fund and a related party to the Funds, holds investments in the secondary market of the following funds and amounts:
| | | | |
| Fund | | Market Value | |
Russell 1000 Low Volatility Fund ETF | | $ | 51,906,955 | |
Russell 1000 Low Beta ETF | | | 31,443,359 | |
Such concentration of shareholder interests could have a material impact on the Funds.
Board of Trustees
For all Funds of the Investment Company, each independent Trustee is paid a retainer of $70,000 per year, $5,000 for each regular quarterly meeting attended in person, and $2,500 for each Audit Committee meeting and Nominating and Governance Committee meeting. Each Trustee receives a $1,250 fee for attending the quarterly meeting by phone instead of receiving the full fee had the member attended in person. The Trustees are also compensated for out of pocket expenses. The Audit Committee Chair and Nominating and Governance Chair are each paid a fee of $12,000 and $6,000, respectively, per year. The Chairman of the Board receives additional annual compensation of $20,000.
At March 31, 2012, the following Funds had net tax basis capital loss carryforwards which may be applied against any net realized taxable gains in each succeeding year.
| | | | | | | | | | | | |
| | | No Expiration | | | | |
| | | Short-term | | | Long-term | | | Totals | |
| | | | | | | | | | | | |
Russell 1000 Low Beta ETF | | $ | 134,564 | | | $ | — | | | $ | 134,564 | |
Russell 1000 High Beta ETF | | $ | 1,014,615 | | | $ | — | | | $ | 1,014,615 | |
Russell 1000 Low Volatility ETF | | $ | 577,609 | | | $ | — | | | $ | 577,609 | |
Russell 1000 High Volatility ETF | | $ | 398,426 | | | $ | — | | | $ | 398,426 | |
Russell 1000 High Momentum ETF | | $ | 629,747 | | | $ | — | | | $ | 629,747 | |
Russell 2000 Low Beta ETF | | $ | 68,852 | | | $ | — | | | $ | 68,852 | |
Russell 2000 High Beta ETF | | $ | 390,222 | | | $ | — | | | $ | 390,222 | |
Russell 2000 Low Volatility ETF | | $ | 70,626 | | | $ | — | | | $ | 70,626 | |
Russell 2000 High Volatility ETF | | $ | 640,821 | | | $ | — | | | $ | 640,821 | |
Russell 2000 High Momentum ETF | | $ | 477,363 | | | $ | — | | | $ | 477,363 | |
Russell Development ex-U.S. Low Beta ETF | | $ | — | | | $ | — | | | $ | — | |
Russell Development ex-U.S. Low Volatility ETF | | $ | — | | | $ | — | | | $ | — | |
Russell Development ex-U.S. High Momentum ETF | | $ | — | | | $ | — | | | $ | — | |
| | | | |
| | 188 | | | Notes to Financial Statements |
Russell Exchange Traded Funds Trust
Russell Factor ETFs™
Notes to Financial Statements, continued — March 31, 2012
At March 31, 2012, the cost of investments and net unrealized appreciation (depreciation) for income tax purposes were as follows:
| | | | | | | | | | | | | | | | | | | | |
| | Russell 1000
Low Beta ETF | | | Russell 1000
High Beta ETF | | | Russell 1000
Low Volatility
ETF | | | Russell 1000
High Volatility
ETF | | | Russell 1000
High Momentum
ETF | |
| | | | | | | | | | | | | | | | | | | | |
Cost of Investments | | $ | 35,633,567 | | | $ | 4,825,950 | | | $ | 70,714,179 | | | $ | 4,747,765 | | | $ | 4,643,346 | |
| | | | | | | | | | | | | | | | | | | | |
Unrealized Appreciation | | | 1,189,288 | | | | 265,408 | | | | 2,170,916 | | | | 380,110 | | | | 583,670 | |
Unrealized Depreciation | | | (158,053 | ) | | | (120,492 | ) | | | (422,631 | ) | | | (136,474 | ) | | | (21,897 | ) |
| | | | | | | | | | | | | | | | | | | | |
Net Unrealized Appreciation (Depreciation) | | $ | 1,031,235 | | | $ | 144,916 | | | $ | 1,748,285 | | | $ | 243,636 | | | $ | 561,773 | |
| | | | | | | | | | | | | | | | | | | | |
Undistributed Ordinary Income | | $ | 16,160 | | | $ | 2,926 | | | $ | 49,011 | | | $ | 1,878 | | | $ | 1,389 | |
Undistributed Long-Term Capital Gains (Capital Loss Carry Forward) | | $ | (134,564 | ) | | $ | (1,014,615 | ) | | $ | (577,609 | ) | | $ | (398,426 | ) | | $ | (629,747 | ) |
Tax Composition of Distributions: | | | | | | | | | | | | | | | | | | | | |
Ordinary Income | | $ | 99,317 | | | $ | 137,326 | | | $ | 691,838 | | | $ | 48,188 | | | $ | 94,963 | |
Tax Exempt Income | | $ | — | | | $ | — | | | $ | — | | | $ | — | | | $ | — | |
Long-Term Capital Gains | | $ | — | | | $ | — | | | $ | — | | | $ | — | | | $ | — | |
Distributions in Excess | | $ | — | | | $ | — | | | $ | — | | | $ | — | | | $ | — | |
Tax Return of Capital | | $ | — | | | $ | — | | | $ | — | | | $ | — | | | $ | — | |
| | | | | |
| | Russell 2000
Low Beta ETF | | | Russell 2000
High Beta ETF | | | Russell 2000
Low Volatility
ETF | | | Russell 2000
High Volatility
ETF | | | Russell 2000
High Momentum
ETF | |
| | | | | | | | | | | | | | | | | | | | |
Cost of Investments | | $ | 4,870,919 | | | $ | 4,871,910 | | | $ | 5,096,043 | | | $ | 4,673,680 | | | $ | 4,704,322 | |
| | | | | | | | | | | | | | | | | | | | |
Unrealized Appreciation | | | 505,015 | | | | 126,433 | | | | 113,339 | | | | 522,373 | | | | 602,169 | |
Unrealized Depreciation | | | (234,105 | ) | | | (340,706 | ) | | | (216,109 | ) | | | (817,727 | ) | | | (203,544 | ) |
| | | | | | | | | | | | | | | | | | | | |
Net Unrealized Appreciation (Depreciation) | | $ | 270,910 | | | $ | (214,273 | ) | | $ | (102,770 | ) | | $ | (295,354 | ) | | $ | 398,625 | |
| | | | | | | | | | | | | | | | | | | | |
Undistributed Ordinary Income | | $ | 6,495 | | | $ | 17,429 | | | $ | 12,836 | | | $ | — | | | $ | 11,124 | |
Undistributed Long-Term Capital Gains (Capital Loss Carry Forward) | | $ | (68,852 | ) | | $ | (390,222 | ) | | $ | (70,626 | ) | | $ | (640,821 | ) | | $ | (477,363 | ) |
Tax Composition of Distributions: | | | | | | | | | | | | | | | | | | | | |
Ordinary Income | | $ | 53,587 | | | $ | 9,576 | | | $ | 73,135 | | | $ | — | | | $ | 44,124 | |
Tax Exempt Income | | $ | — | | | $ | — | | | $ | — | | | $ | — | | | $ | — | |
Long-Term Capital Gains | | $ | — | | | $ | — | | | $ | — | | | $ | — | | | $ | — | |
Distributions in Excess | | $ | — | | | $ | — | | | $ | — | | | $ | — | | | $ | — | |
Tax Return of Capital | | $ | — | | | $ | — | | | $ | — | | | $ | — | | | $ | — | |
| | | | | |
| | Russell
Developed ex-
U.S. Low Beta
ETF | | | Russell
Developed ex-
U.S. Low
Volatility ETF | | | Russell
Developed ex-
U.S. High
Momentum ETF | | | | | | | |
| | | | | | | | | | | | | | | | | | | | |
Cost of Investments | | $ | 4,876,362 | | | $ | 4,872,186 | | | $ | 4,851,687 | | | | | | | | | |
| | | | | | | | | | | | | | | | | | | | |
Unrealized Appreciation | | | 380,013 | | | | 305,281 | | | | 341,504 | | | | | | | | | |
Unrealized Depreciation | | | (62,438 | ) | | | (56,051 | ) | | | (93,700 | ) | | | | | | | | |
| | | | | | | | | | | | | | | | | | | | |
Net Unrealized Appreciation (Depreciation) | | $ | 317,575 | | | $ | 249,230 | | | $ | 247,804 | | | | | | | | | |
| | | | | | | | | | | | | | | | | | | | |
Undistributed Ordinary Income | | $ | 25,748 | | | $ | 17,114 | | | $ | 15,779 | | | | | | | | | |
Undistributed Long-Term Capital Gains (Capital Loss Carry Forward) | | $ | — | | | $ | — | | | $ | — | | | | | | | | | |
Tax Composition of Distributions: | | | | | | | | | | | | | | | | | | | | |
Ordinary Income | | $ | 37,748 | | | $ | 54,465 | | | $ | 48,210 | | | | | | | | | |
Tax Exempt Income | | $ | — | | | $ | — | | | $ | — | | | | | | | | | |
Long-Term Capital Gains | | $ | — | | | $ | — | | | $ | — | | | | | | | | | |
Distributions in Excess | | $ | — | | | $ | — | | | $ | — | | | | | | | | | |
Tax Return of Capital | | $ | — | | | $ | — | | | $ | — | | | | | | | | | |
| | |
| Notes to Financial Statements | | 189 |
Russell Exchange Traded Funds Trust
Russell Factor ETFs™
Notes to Financial Statements, continued — March 31, 2012
As permitted by tax regulations, the Funds intend to defer a net realized capital loss incurred from November 1, 2011 to March 31, 2012, and treat it as arising in the fiscal year 2012. As of March 31, 2012, the Funds had realized capital losses as follows:
| | | | |
| Fund | | | |
Russell 1000 Low Beta ETF | | $ | 6,926 | |
Russell 1000 High Beta ETF | | | 56,771 | |
Russell 1000 Low Volatility ETF | | | 612,476 | |
Russell 1000 High Volatility ETF | | | 232,819 | |
Russell 1000 High Momentum ETF | | | 43,157 | |
Russell 2000 Low Beta ETF | | | 7,012 | |
Russell 2000 High Beta ETF | | | 263,679 | |
Russell 2000 Low Volatility ETF | | | 72,651 | |
Russell 2000 High Volatility ETF | | | 352,855 | |
Russell 2000 High Momentum ETF | | | 234,388 | |
Russell Developed ex-U.S. Low Beta ETF | | | 6,493 | |
Russell Developed ex-U.S. Low Volatility ETF | | | 2,185 | |
Russell Developed ex-U.S. High Momentum ETF | | | 15,952 | |
| 6. | | Fund Share Transactions (amounts in thousands) |
As of March 31, 2012, there were an unlimited number of $0.001 par value shares of beneficial interest authorized by the Investment Company. Shares are created and redeemed by the Funds at their NAV only in Creation Units or multiples thereof. Except when aggregated in Creation Units, shares of the Funds are not redeemable. The Shares are listed on the New York Stock Exchange (“NYSE”) Arca (“NYSE Arca” or the “Exchange”), subject to notice of issuance. The Shares trade on the Exchange at market prices. These prices may differ from the Shares’ NAV. The Shares are also redeemable only in Creation Unit aggregations, and generally in exchange for portfolio securities and a specified cash payment. Investors purchasing and redeeming Creation Units pay a purchase transaction fee and a redemption transaction fee directly to State Street Bank and Trust Company, the Funds’ Custodian. A Creation Unit of a Fund consists of at least 50,000 Shares. Transactions in shares for the Funds for the period ended March 31, 2012 were as follows:
| | | | | | | | |
| | | 2012* | |
| | | Shares | | | Dollars | |
| | | | | | | | |
| | | | | | | | |
Russell 1000 Low Beta ETF | | | | | | | | |
Shares created | | | 700 | | | $ | 35,778 | |
Shares redeemed | | | — | | | | — | |
| | | | | | | | |
Total increase (decrease) | | | 700 | | | $ | 35,778 | |
| | | | | | | | |
| |
| | | 2012* | |
| | | Shares | | | Dollars | |
| | | | | | | | |
Russell 1000 High Beta ETF | | | | | | | | |
Shares created | | | 500 | | | $ | 23,556 | |
Shares redeemed | | | (400 | ) | | | (17,397 | ) |
| | | | | | | | |
Total increase (decrease) | | | 100 | | | $ | 6,159 | |
| | | | | | | | |
| |
| | | 2012* | |
| | | Shares | | | Dollars | |
| | | | | | | | |
Russell 1000 Low Volatility ETF | | | | | | | | |
Shares created | | | 2,200 | | | $ | 109,901 | |
Shares redeemed | | | (800 | ) | | | (37,434 | ) |
| | | | | | | | |
Total increase (decrease) | | | 1,400 | | | $ | 72,467 | |
| | | | | | | | |
| | | | |
| | 190 | | | Notes to Financial Statements |
Russell Exchange Traded Funds Trust
Russell Factor ETFs™
Notes to Financial Statements, continued — March 31, 2012
| | | | | | | | |
| | | 2012* | |
| | | Shares | | | Dollars | |
| | | | | | | | |
| | | | | | | | |
Russell 1000 High Volatility ETF | | | | | | | | |
Shares created | | | 300 | | | $ | 14,720 | |
Shares redeemed | | | (200 | ) | | | (8,729 | ) |
| | | | | | | | |
Total increase (decrease) | | | 100 | | | $ | 5,991 | |
| | | | | | | | |
| |
| | | 2012* | |
| | | Shares | | | Dollars | |
| | | | | | | | |
Russell 1000 High Momentum ETF | | | | | | | | |
Shares created | | | 200 | | | $ | 9,926 | |
Shares redeemed | | | (100 | ) | | | (4,596 | ) |
| | | | | | | | |
Total increase (decrease) | | | 100 | | | $ | 5,330 | |
| | | | | | | | |
| |
| | | 2012* | |
| | | Shares | | | Dollars | |
| | | | | | | | |
Russell 2000 Low Beta ETF | | | | | | | | |
Shares created | | | 100 | | | $ | 4,947 | |
Shares redeemed | | | — | | | | — | |
| | | | | | | | |
Total increase (decrease) | | | 100 | | | $ | 4,947 | |
| | | | | | | | |
| |
| | | 2012* | |
| | | Shares | | | Dollars | |
| | | | | | | | |
Russell 2000 High Beta ETF | | | | | | | | |
Shares created | | | 300 | | | $ | 13,283 | |
Shares redeemed | | | (200 | ) | | | (8,075 | ) |
| | | | | | | | |
Total increase (decrease) | | | 100 | | | $ | 5,208 | |
| | | | | | | | |
| |
| | | 2012* | |
| | | Shares | | | Dollars | |
| | | | | | | | |
Russell 2000 Low Volatility ETF | | | | | | | | |
Shares created | | | 200 | | | $ | 10,016 | |
Shares redeemed | | | (100 | ) | | | (5,007 | ) |
| | | | | | | | |
Total increase (decrease) | | | 100 | | | $ | 5,009 | |
| | | | | | | | |
| |
| | | 2012* | |
| | | Shares | | | Dollars | |
| | | | | | | | |
Russell 2000 High Volatility ETF | | | | | | | | |
Shares created | | | 400 | | | $ | 18,455 | |
Shares redeemed | | | (300 | ) | | | (11,261 | ) |
| | | | | | | | |
Total increase (decrease) | | | 100 | | | $ | 7,194 | |
| | | | | | | | |
| |
| | | 2012* | |
| | | Shares | | | Dollars | |
| | | | | | | | |
Russell 2000 High Momentum ETF | | | | | | | | |
Shares created | | | 200 | | | $ | 9,886 | |
Shares redeemed | | | (100 | ) | | | (4,736 | ) |
| | | | | | | | |
Total increase (decrease) | | | 100 | | | $ | 5,150 | |
| | | | | | | | |
| | |
| Notes to Financial Statements | | 191 |
Russell Exchange Traded Funds Trust
Russell Factor ETFs™
Notes to Financial Statements, continued — March 31, 2012
| | | | | | | | |
| | | 2012** | |
| | | Shares | | | Dollars | |
| | | | | | | | |
| | | | | | | | |
Russell Developed ex-U.S. Low Beta ETF | | | | | | | | |
Shares created | | | 100 | | | $ | 4,880 | |
Shares redeemed | | | — | | | | — | |
| | | | | | | | |
Total increase (decrease) | | | 100 | | | $ | 4,880 | |
| | | | | | | | |
| |
| | | 2012** | |
| | | Shares | | | Dollars | |
| | | | | | | | |
Russell Developed ex-U.S. Low Volatility ETF | | | | | | | | |
Shares created | | | 100 | | | $ | 4,883 | |
Shares redeemed | | | — | | | | — | |
| | | | | | | | |
Total increase (decrease) | | | 100 | | | $ | 4,883 | |
| | | | | | | | |
| |
| | | 2012** | |
| | | Shares | | | Dollars | |
| | | | | | | | |
Russell Developed ex-U.S. High Momentum ETF | | | | | | | | |
Shares created | | | 100 | | | $ | 4,878 | |
Shares redeemed | | | — | | | | — | |
| | | | | | | | |
Total increase (decrease) | | | 100 | | | $ | 4,878 | |
| | | | | | | | |
| * | For the period May 26, 2011 (commencement of operations) to March 31, 2012. |
| ** | For the period November 3, 2011 (commencement of operations) to March 31, 2012. |
Restricted securities are subject to contractual limitations on resale, are often issued in private placement transactions, and are not registered under the Securities Act of 1933, as amended (the “Act”). The most common types of restricted securities are those sold under Rule 144A of the Act and commercial paper sold under Section 4(2) of the Act.
A Fund may invest a portion of its net assets not to exceed 15% in securities that are illiquid. This limitation is applied at the time of purchase. Illiquid securities are securities that may not be readily marketable, and that cannot be sold within seven days in the ordinary course of business at the approximate amount at which the Fund has valued the securities. Restricted securities are generally considered to be illiquid.
The following table lists restricted securities held by a Fund that are illiquid. The following table does not include (1) securities deemed liquid by RIMCo or a money manager pursuant to Board approved policies and procedures or (2) illiquid securities that are not restricted securities as designated on a Fund’s Schedule of Investments.
| | | | | | | | | | | | | | | | | | | | |
Fund - % of Net Assets
Securities | | Acquisition
Date | | | Principal
Amount ($)
or Shares | | | Cost per
Unit
$ | | | Cost
(000)
$ | | | Market Value
(000)
$ | |
| | | | | | | | | | | | | | | | | | | | |
Russell 2000 High Momentum ETF - 0.0% | | | | | | | | | | | | | | | | | | | | |
Magnum Hunter Resources, Inc. | | | 08/29/11 | | | | 430 | | | | — | | | | — | | | | — | |
| | | | | | | | | | | | | | | | | | | | |
| | | | | | | | | | | | | | | | | | | — | |
| | | | | | | | | | | | | | | | | | | | |
Russell 2000 High Volatility ETF - 0.0% | | | | | | | | | | | | | | | | | | | | |
Magnum Hunter Resources, Inc. | | | 08/29/11 | | | | 442 | | | | — | | | | — | | | | — | |
| | | | | | | | | | | | | | | | | | | | |
| | | | | | | | | | | | | | | | | | | — | |
| | | | | | | | | | | | | | | | | | | | |
Russell 2000 Low Volatility ETF - 0.0% | | | | | | | | | | | | | | | | | | | | |
Gerber Scientific, Inc. | | | 08/23/11 | | | | 245 | | | | — | | | | — | | | | — | |
| | | | | | | | | | | | | | | | | | | | |
| | | | | | | | | | | | | | | | | | | — | |
| | | | | | | | | | | | | | | | | | | | |
Management has evaluated events and/or transactions that have occurred since March 31, 2012, through the date the financial statements were issued, that would merit recognition or disclosure in the financial statements. During this review nothing was discovered which would require further disclosure within the financial statements.
| | | | |
| | 192 | | | Notes to Financial Statements |
Report of Independent Registered Public Accounting Firm
To the Board of Trustees and Shareholders:
In our opinion, the accompanying statements of assets and liabilities, including the schedule of investments, and the related statements of operations and of changes in net assets and the financial highlights present fairly, in all material respects, the financial position of Russell 1000 Low Beta ETF, Russell 1000 High Beta ETF, Russell 1000 Low Volatility ETF, Russell 1000 High Volatility ETF, Russell 1000 High Momentum ETF, Russell 2000 Low Beta ETF, Russell 2000 High Beta ETF, Russell 2000 Low Volatility ETF, Russell 2000 High Volatility ETF, Russell 2000 High Momentum ETF, Russell Developed ex-U.S. Low Beta ETF, Russell Developed ex-U.S. Low Volatility ETF, Russell Developed ex-U.S. High Momentum ETF (thirteen of the portfolios constituting the Russell Exchange Traded Funds Trust, hereafter referred to as the “Funds”) at March 31, 2012, the results of each of their operations, the changes in each of their net assets and the financial highlights for each of the periods indicated, in conformity with accounting principles generally accepted in the United States of America. These financial statements and financial highlights (hereafter referred to as “financial statements”) are the responsibility of the Fund’s management; our responsibility is to express an opinion on these financial statements based on our audits. We conducted our audits of these financial statements in accordance with the standards of the Public Company Accounting Oversight Board (United States). Those standards require that we plan and perform the audit to obtain reasonable assurance about whether the financial statements are free of material misstatement. An audit includes examining, on a test basis, evidence supporting the amounts and disclosures in the financial statements, assessing the accounting principles used and significant estimates made by management, and evaluating the overall financial statement presentation. We believe that our audits, which included confirmation of securities at March 31, 2012 by correspondence with the custodian and brokers or by other appropriate auditing procedures where replies from brokers were not received, provide a reasonable basis for our opinion.

PricewaterhouseCoopers LLP
Seattle, Washington
May 29, 2012
| | |
| Report of Independent Registered Public Accounting Firm | | 193 |
Russell Exchange Traded Funds Trust
Russell Factor ETFs™
Frequency Distribution of Discounts and Premiums — March 31, 2012 (Unaudited)
The chart below presents information about differences between the per share NAV of the Funds and the market trading price of shares of the Funds. For these purposes, the “market price” is the mid-point of the highest bid and lowest offer for Fund shares as of the close of trading on the exchange where Fund shares are listed. The term “premium” is sometimes used to describe a market price in excess of NAV and the term “discount” is sometimes used to describe a market price below NAV. The chart presents information about the size and frequency of premiums or discounts. As with other exchange traded funds, the market price of Fund shares is typically slightly higher or lower than the Fund’s per share NAV. Factors that contribute to the differences between market price and NAV include the supply and demand for Fund shares and investors’ assessments of the underlying value of a Fund’s portfolio securities.
| | | | | | | | | | | | | | | | |
| | | Russell 1000 Low Beta ETF | | | Russell 1000 High Beta
ETF | |
| Premium/Discount Range | | Number of Days* | | | Percentage of
Total Days | | | Number of
Days* | | | Percentage of
Total Days | |
| | | | | | | | | | | | | | | | |
Greater than 1.00% | | | 1 | | | | 0.32 | % | | | 1 | | | | 0.32 | % |
Greater than 0.20% and Less than 1.00% | | | 13 | | | | 4.17 | % | | | 5 | | | | 1.60 | % |
Greater than 0.05% and Less than 0.20% | | | 33 | | | | 10.58 | % | | | 56 | | | | 17.95 | % |
Between 0.05% and -0.05% | | | 235 | | | | 75.32 | % | | | 134 | | | | 42.95 | % |
Greater than -0.05% and Less than -0.20% | | | 28 | | | | 8.97 | % | | | 107 | | | | 34.29 | % |
Greater than -0.20% and Less than -1.00% | | | 2 | | | | 0.64 | % | | | 8 | | | | 2.57 | % |
Greater than -1.00% | | | — | | | | 0.00 | % | | | 1 | | | | 0.32 | % |
| | | | | | | | | | | | | | | | |
| | | 312 | | | | 100.00 | % | | | 312 | | | | 100.00 | % |
| | | | | | | | | | | | | | | | |
| | | | | | | | | | | | | | | | |
| | | Russell 1000 Low Volatility
ETF | | | Russell 1000 High
Volatility ETF | |
| Premium/Discount Range | | Number of Days* | | | Percentage of
Total Days | | | Number of
Days* | | | Percentage of
Total Days | |
| | | | | | | | | | | | | | | | |
Greater than 1.00% | | | 3 | | | | 0.96 | % | | | 3 | | | | 0.96 | % |
Greater than 0.20% and Less than 1.00% | | | 52 | | | | 16.67 | % | | | 16 | | | | 5.13 | % |
Greater than 0.05% and Less than 0.20% | | | 77 | | | | 24.68 | % | | | 8 | | | | 2.56 | % |
Between 0.05% and -0.05% | | | 89 | | | | 28.52 | % | | | 166 | | | | 53.21 | % |
Greater than -0.05% and Less than -0.20% | | | 74 | | | | 23.72 | % | | | 94 | | | | 30.13 | % |
Greater than -0.20% and Less than -1.00% | | | 17 | | | | 5.45 | % | | | 19 | | | | 6.09 | % |
Greater than -1.00% | | | — | | | | 0.00 | % | | | 6 | | | | 1.92 | % |
| | | | | | | | | | | | | | | | |
| | | 312 | | | | 100.00 | % | | | 312 | | | | 100.00 | % |
| | | | | | | | | | | | | | | | |
| | | | | | | | | | | | | | | | |
| | | Russell 1000 High
Momentum ETF | | | Russell 2000 Low Beta
ETF | |
| Premium/Discount Range | | Number of
Days* | | | Percentage of
Total Days | | | Number of
Days* | | | Percentage of
Total Days | |
| | | | | | | | | | | | | | | | |
Greater than 1.00% | | | — | | | | 0.00 | % | | | — | | | | 0.00 | % |
Greater than 0.20% and Less than 1.00% | | | 14 | | | | 4.49 | % | | | 20 | | | | 6.41 | % |
Greater than 0.05% and Less than 0.20% | | | 12 | | | | 3.85 | % | | | 105 | | | | 33.65 | % |
Between 0.05% and -0.05% | | | 228 | | | | 73.08 | % | | | 100 | | | | 32.05 | % |
Greater than -0.05% and Less than -0.20% | | | 51 | | | | 16.34 | % | | | 71 | | | | 22.76 | % |
Greater than -0.20% and Less than -1.00% | | | 7 | | | | 2.24 | % | | | 16 | | | | 5.13 | % |
| | | | | | | | | | | | | | | | |
| | | 312 | | | | 100.00 | % | | | 312 | | | | 100.00 | % |
| | | | | | | | | | | | | | | | |
| | | | | | | | | | | | | | | | |
| | | Russell 2000 High Beta ETF | | | Russell 2000 Low
Volatility ETF | |
| Premium/Discount Range | | Number of
Days* | | | Percentage of
Total Days | | | Number of
Days* | | | Percentage of
Total Days | |
| | | | | | | | | | | | | | | | |
Greater than 1.00% | | | 3 | | | | 0.96 | % | | | — | | | | 0.00 | % |
Greater than 0.20% and Less than 1.00% | | | 4 | | | | 1.28 | % | | | 1 | | | | 0.32 | % |
Greater than 0.05% and Less than 0.20% | | | 63 | | | | 20.19 | % | | | 66 | | | | 21.16 | % |
Between 0.05% and -0.05% | | | 169 | | | | 54.17 | % | | | 201 | | | | 64.42 | % |
Greater than -0.05% and Less than -0.20% | | | 72 | | | | 23.08 | % | | | 41 | | | | 13.14 | % |
Greater than -0.20% and Less than -1.00% | | | 1 | | | | 0.32 | % | | | 3 | | | | 0.96 | % |
| | | | | | | | | | | | | | | | |
| | | 312 | | | | 100.00 | % | | | 312 | | | | 100.00 | % |
| | | | | | | | | | | | | | | | |
| | | | |
| | 194 | | | Frequency Distribution of Discounts and Premiums |
Russell Exchange Traded Funds Trust
Russell Factor ETFs™
Frequency Distribution of Discounts and Premiums, continued — March 31, 2012 (Unaudited)
| | | | | | | | | | | | | | | | |
| | | Russell 2000 High Volatility
ETF | | | Russell 2000 High
Momentum ETF | |
| Premium/Discount Range | | Number of
Days* | | | Percentage of
Total Days | | | Number of
Days* | | | Percentage of
Total Days | |
| | | | | | | | | | | | | | | | |
Greater than 1.00% | | | 3 | | | | 0.96 | % | | | — | | | | 0.00 | % |
Greater than 0.20% and Less than 1.00% | | | 15 | | | | 4.81 | % | | | 1 | | | | 0.32 | % |
Greater than 0.05% and Less than 0.20% | | | 81 | | | | 25.96 | % | | | 55 | | | | 17.63 | % |
Between 0.05% and -0.05% | | | 115 | | | | 36.86 | % | | | 158 | | | | 50.64 | % |
Greater than -0.05% and Less than -0.20% | | | 72 | | | | 23.08 | % | | | 76 | | | | 24.36 | % |
Greater than -0.20% and Less than -1.00% | | | 26 | | | | 8.33 | % | | | 22 | | | | 7.05 | % |
| | | | | | | | | | | | | | | | |
| | | 312 | | | | 100.00 | % | | | 312 | | | | 100.00 | % |
| | | | | | | | | | | | | | | | |
| | | | | | | | | | | | | | | | |
| | | Russell Developed ex-U.S.
Low Beta ETF | | | Russell Developed ex-U.S. Low
Volatility ETF | |
| Premium/Discount Range | | Number of
Days* | | | Percentage of
Total Days | | | Number of
Days* | | | Percentage of
Total Days | |
| | | | | | | | | | | | | | | | |
Greater than 1.00% | | | 114 | | | | 75.50 | % | | | 50 | | | | 33.11 | % |
Greater than 0.20% and Less than 1.00% | | | 10 | | | | 6.62 | % | | | 58 | | | | 38.41 | % |
Greater than 0.05% and Less than 0.20% | | | 4 | | | | 2.65 | % | | | 14 | | | | 9.27 | % |
Between 0.05% and -0.05% | | | 2 | | | | 1.32 | % | | | 9 | | | | 5.96 | % |
Greater than -0.05% and Less than -0.20% | | | 2 | | | | 1.32 | % | | | 4 | | | | 2.65 | % |
Greater than -0.20% and Less than -1.00% | | | 1 | | | | 0.67 | % | | | 9 | | | | 5.96 | % |
Greater than -1.00% | | | 18 | | | | 11.92 | % | | | 7 | | | | 4.64 | % |
| | | | | | | | | | | | | | | | |
| | | 151 | | | | 100.00 | % | | | 151 | | | | 100.00 | % |
| | | | | | | | | | | | | | | | |
| | | | | | | | |
| | | Russell Developed ex-U.S.
High Momentum ETF | |
| Premium/Discount Range | | Number of
Days* | | | Percentage of
Total Days | |
| | | | | | | | |
Greater than 1.00% | | | 19 | | | | 12.58 | % |
Greater than 0.20% and Less than 1.00% | | | 93 | | | | 61.59 | % |
Greater than 0.05% and Less than 0.20% | | | 6 | | | | 3.97 | % |
Between 0.05% and -0.05% | | | 9 | | | | 5.96 | % |
Greater than -0.05% and Less than -0.20% | | | 7 | | | | 4.64 | % |
Greater than -0.20% and Less than -1.00% | | | 14 | | | | 9.27 | % |
Greater than -1.00% | | | 3 | | | | 1.99 | % |
| | | | | | | | |
| | | 151 | | | | 100.00 | % |
| | | | | | | | |
| * | Number of days are based on inception date which is one day prior to commencement of operations. |
| | |
| Frequency Distribution of Discounts and Premiums | | 195 |
Russell Exchange Traded Funds Trust
Russell Factor ETFs™
Tax Information — March 31, 2012 (Unaudited)
For the tax year ended March 31, 2012, the Funds hereby designate 100% or the maximum amount allowable, of its net taxable income as qualified dividends taxed at individual net capital gain rates.
For the tax year ended March 31, 2012, the Funds hereby designate under Section 871(k)(2)(c) of the Code, the maximum amount allowable as a short term capital gain dividend for purposes of the tax imposed under Section 871(a)(1)(A) of the Code. This applies to nonresident alien shareholders only.
The Form 1099 you receive in January 2013 will show the tax status of all distributions paid to your account in calendar year 2012.
The Funds designate dividends distributed during the fiscal year as qualifying for the dividends received deduction for corporate shareholders as follows:
| | | | |
Russell 1000 High Beta ETF | | | 100.0 | % |
Russell 1000 Low Beta ETF | | | 100.0 | % |
Russell 1000 High Volatility ETF | | | 100.0 | % |
Russell 1000 Low Volatility ETF | | | 100.0 | % |
Russell 1000 High Momentum ETF | | | 100.0 | % |
Russell 2000 High Beta ETF | | | 100.0 | % |
Russell 2000 Low Beta ETF | | | 92.8 | % |
Russell 2000 High Volatility ETF | | | 0 | % |
Russell 2000 Low Volatility ETF | | | 93.9 | % |
Russell 2000 High Momentum ETF | | | 100.0 | % |
Russell Developed ex-US Low Beta ETF | | | 0 | % |
Russell Developed ex-US Low Volatility ETF | | | 0 | % |
Russell Developed ex-US High Momentum ETF | | | 0 | % |
Please consult a tax adviser for any questions about federal or state income tax laws.
The Funds listed below paid foreign taxes and recognized foreign source income during the taxable year ended March 31, 2012. Pursuant to Section 853 of the Internal Revenue Code, the Funds designate the following per share amounts of foreign taxes paid and income earned from foreign sources:
| | | | | | | | | | | | | | | | |
Fund Name | | Foreign Taxes
Paid | | | Foreign Taxes
Paid Per Share | | | Foreign Source
Income | | | Foreign Source
Income Per Share | |
| | | | | | | | | | | | | | | | |
Russell Developed ex-US Low Beta ETF Fund | | $ | 5,005 | | | $ | 0.0500 | | | $ | 68,781 | | | $ | 0.6878 | |
Russell Developed ex-US Low Volatility ETF Fund | | | 5,716 | | | | 0.0572 | | | | 80,442 | | | | 0.8044 | |
Russell Developed ex-US High Momentum ETF Fund | | | 6,024 | | | | 0.0602 | | | | 70,823 | | | | 0.7082 | |
Russell Exchange Traded Fund Trust
Russell Factor ETFs™
Basis for Approval of Investment Advisory Contracts (Unaudited)
The Board of Trustees, including all of the Independent Trustees, considered and approved the management agreement with RIMCo (the “RIMCo Agreement”) with respect to Russell Developed ex-U.S. Low Beta ETF, Russell Developed ex-U.S. High Beta ETF, Russell Developed ex-U.S. Low Volatility ETF, Russell Developed ex-U.S. High Volatility ETF, and Russell Developed ex-U.S. High Momentum ETF (the “Funds”) at a meeting held in person on August 31, 2011 (the “Agreement Evaluation Meeting”). In preparation for the Agreement Evaluation Meeting, the Board considered (1) information, reports and analyses prepared by RIMCo relating to the services provided by RIMCo (and its affiliates) to the Funds at this and prior meetings; and (2) information (the “Comparative Information”) received from RIMCo comparing the operating expenses of each of the Funds with other peer funds not managed by RIMCo within a subset of developed ex-US equity ETFs chosen by RIMCo using data provided by National Stock Exchange and industry information provided by Morningstar, each an independent third party. In the case of each Fund, its other peer funds are collectively hereinafter referred to as the Fund’s “Comparable Funds,” and such Comparable Funds are collectively hereinafter referred to as the Fund’s “Expense Universe.” The foregoing information provided by RIMCo is collectively called the “Agreement Evaluation Information.” In connection with their consideration of the RIMCo Agreement, the Trustees had previously received and reviewed a memorandum from counsel to the Funds discussing the legal standards for their consideration of the adoption of the RIMCo Agreement.
At the Agreement Evaluation Meeting, the Board, including the Independent Trustees, reviewed the proposed approval of the RIMCo Agreement with management and counsel to the Funds. Presentations made by RIMCo to the Board as part of this review encompassed the Funds. The discussion below reflects these reviews.
The Board considered that RIMCo is responsible under the RIMCo Agreement for determining, implementing and maintaining the investment program for each Fund. Assets are managed directly by RIMCo pursuant to authority provided by the RIMCo Agreement. RIMCo is responsible for investing the assets of each Fund in accordance with such Fund’s investment objective and policies.
The Board considered that each Fund is passively managed, which means that the investment objective of each Fund is to seek investment results that closely correspond to the total return of such Fund’s corresponding index (each, an “Underlying Index”).
In addition to these general factors relating to the Funds, the Trustees considered, with respect to each Fund, various specific factors in evaluating the RIMCo Agreement, including the following:
| 1. | The nature, scope and overall quality of the investment management and other services provided, and expected to be provided, to the Fund by RIMCo; |
| 2. | The management fee to be paid by the Fund to RIMCo (the “Management Fee”) and the fact that it encompasses fees paid by the Fund for other services provided by RIMCo, its affiliates and other parties to the Fund, including services provided under the Supervision and Operational, Administrative, Fund Accounting, Master Custodian, Transfer Agency and Service, and Distribution Agreements; |
| 3. | Information provided by RIMCo as to other fees and benefits received by RIMCo or its affiliates from the Fund, including soft dollar arrangements and commissions in connection with portfolio securities transactions; |
| 4. | Information provided by RIMCo as to expenses to be incurred by the Fund; and |
| 5. | Information provided by RIMCo at prior meetings as to the profits that RIMCo expects to derive from the Fund’s operations. |
In evaluating the nature, scope and overall quality of the investment management and other services provided and which are expected to be provided to the Funds, including Fund portfolio management services, the Board considered that RIMCo’s investment management functions would consist of two primary roles: managing each Fund’s portfolio and producing the daily creation and redemption baskets.
With respect to managing the Funds’ portfolios, RIMCo reported, and the Board considered, that to meet the investment objective of each Fund, RIMCo intends to employ a full replication strategy. In this strategy, a Fund generally invests in all of the stocks comprising its Underlying Index. However, under various circumstances, it may not be possible or practicable to purchase all of those stocks in the same weighting as the Underlying Index. In those circumstances, a Fund may purchase a sample of stocks in the Underlying Index. RIMCo reported, and the Board considered, that there may also be instances in which RIMCo may choose to overweight another stock in the Underlying Index, purchase securities not in the Underlying Index which RIMCo believes are appropriate to substitute for certain securities in the Underlying Index or utilize various combinations of other available investment techniques.
With respect to producing the daily creation and redemption baskets, RIMCo reported, and the Board considered, that RIMCo will instruct the Funds’ custodian as to the basket of securities for each Fund’s creation and redemption file. RIMCo will review the creation and redemption files that are published to the exchange by the custodian on a daily basis for reasonableness and accuracy.
| | |
| Basis for Approval of Investment Advisory Contracts | | 197 |
Russell Exchange Traded Fund Trust
Russell Factor ETFs™
Basis for Approval of Investment Advisory Contracts, continued (Unaudited)
RIMCo also reported, and the Board considered, that on an ongoing basis, RIMCo will provide rebalancing, trade execution and account reconciliation services for the Funds.
RIMCo reported, and the Board considered, that at the time of the Agreement Evaluation Meeting, the Funds had not yet commenced operations and, therefore, no performance data was available for the Funds.
With respect to the Management Fee for each of Russell Developed ex-U.S. Low Beta ETF, Russell Developed ex-U.S. High Beta ETF, Russell Developed ex-U.S. Low Volatility ETF, Russell Developed ex-U.S. High Volatility ETF, and Russell Developed ex-U.S. High Momentum ETF, the Comparative Information showed that the Management Fee for each Fund was ranked in the fourth quintile of its Expense Universe. RIMCo reported, and the Board considered, that RIMCo believes these Funds track indexes that are representative of the analysis done by active managers and therefore merit fees that are higher than those of the more traditional passively managed ETFs contained in the Funds’ Expense Universe. The comparisons were based on developed ex-U.S. ETFs using data from the monthly ETF Dashboard created by Russell.
The Board considered for each Fund whether economies of scale would be realized and whether the Management Fees for such Fund appropriately reflect or should be revised to reflect any such economies. The Board considered that RIMCo does not expect that economies of scale will be experienced in the near-term and that RIMCo expects to initially operate the Funds at a loss.
On the basis of the Agreement Evaluation Information, other information presented at or in connection with the Agreement Evaluation Meeting by RIMCo and information provided at prior meetings, the Board, in respect of each Fund, determined, after giving effect to any applicable waivers and/or reimbursements and considering differences in the composition and investment strategies of their respective Comparable Funds (1) the Management Fee charged by RIMCo was reasonable in light of the nature, scope and overall quality of the investment management and other services provided, and expected to be provided, to the Funds; (2) the relative expense ratio of each Fund was comparable to those of its Comparable Funds; (3) other benefits and fees received by RIMCo or its affiliates from the Funds were not excessive; and (4) RIMCo’s anticipated profitability with respect to the Funds was not excessive in light of the nature, scope and overall quality of the investment management and other services provided by RIMCo.
In their deliberations, the Trustees did not identify any particular information as to the RIMCo Agreement that was all-important or controlling, and each Trustee may have attributed different weights to the various factors considered. The Trustees evaluated all information available to them on a Fund-by-Fund basis and their determinations were made in respect of each Fund.
| | | | |
| | 198 | | | Basis for Approval of Investment Advisory Contracts |
Russell Exchange Traded Fund Trust
Russell Factor ETFs™
Shareholder Requests for Additional Information — March 31, 2012 (Unaudited)
A complete unaudited schedule of investments is made available generally no later than 60 days after the end of the first and third quarters of each year. These reports are available (i) free of charge, upon request, by calling the Funds at (888) 775-3837, (ii) on the Securities and Exchange Commission’s website at www.sec.gov, and (iii) at the Securities and Exchange Commission’s public reference room.
The Board has delegated to RIMCo, as RET’s investment adviser, the primary responsibility for monitoring, evaluating and voting proxies solicited by or with respect to issuers of securities in which assets of the Funds may be invested. RIMCo has established a proxy voting committee (“Committee”) and has adopted written proxy voting policies and procedures (“P&P”) and proxy voting guidelines (“Guidelines”). The Funds maintain a Portfolio Holdings Disclosure Policy that governs the timing and circumstances of disclosure to shareholders and third parties of information regarding the portfolio investments held by the Funds. A description of the P&P, Guidelines, Portfolio Holdings Disclosure Policy and additional information about Fund Trustees are contained in the Funds’ Statement of Additional Information (“SAI”). The SAI is available (i) free of charge, upon request, by calling the Funds at (888) 775-3837, (ii) at www.russelletfs.com, and (iii) on the Securities and Exchange Commission’s website at www.sec.gov.
To reduce expenses, we may mail only one copy of the Funds’ prospectus and each annual and semi-annual report to those addresses shared by two or more accounts. If you wish to receive individual copies of these documents, please contact your financial institution.
Some Financial Intermediaries may offer electronic delivery of the Funds’ prospectus and annual and semi-annual reports. Please contact your Financial Intermediary for further details.
| | |
| Shareholder Requests for Additional Information | | 199 |
Russell Exchange Traded Funds Trust
Russell Factor ETFs™
Disclosure of Information about Fund Trustees and Officers — March 31, 2012 (Unaudited)
The Trustees and executive officers of the Trust, along with their principal occupations over the past five years and their affiliations, if any with the Adviser, are listed below. Unless otherwise noted, the principal business address of each Trustee and executive officer of the Trust is 1301 Second Avenue, 18th Floor, Seattle, Washington 98101.
| | | | | | | | | | | | |
Name, Address,
and Date of Birth | | Position(s) Held
with the Fund | | Term of Office
and Length of
Time Served | | Principal Occupation(s)
During Past 5 Years | | Number of
Portfolios in
Fund
Complex
Overseen
by Trustee | | | Other
Directorships Held
by Trustee |
INTERESTED TRUSTEES |
James Polisson* Born: November 11, 1959 | | Trustee | | Since 2011 | | Managing Director and Head of Global ETF Business, Frank Russell Company (2010 to present); and Chief Marketing Officer, Barclays Global Investors/iShares ETFs (2005 to 2010). | | | 26 | | | None. |
INDEPENDENT TRUSTEES |
Evelyn S. Dilsaver Born: May 4, 1955 | | Trustee, Chair since 2012 | | Since 2011 | | Corporate Director, Charles Schwab Investment Management (2003 to 2007); and President and Chief Executive Officer, Charles Schwab Investment Management (2004 to 2007). | | | 26 | | | Aeropostale, Inc. (retailer) (2008 to present); High Mark Funds (2008 to present); and Tempur-pedic, Int’l. (retailer) (2010 to present). |
| | | | | | | | | | | | | |
Jane A. Freeman Born: July 15, 1953 | | Trustee, Chair of Audit Committee since 2011 | | Since 2011 | | Consultant (2008 to present); and Executive Vice President and Chief Financial Officer, Scientific Learning (Educational Support Services) (1999 to 2008). | | | 26 | | | Harding Loevner Funds (Lead Director since 2008). |
| | | | | | | | | | | | | |
Lee T. Kranefuss** Born: September 27, 1961 | | Trustee | | Since 2011 | | Non-Executive Chairman, iShares (since 2009); Global Chief Executive Officer, iShares/Intermediary Groups of Barclays Global Investors (“BGI”) (2008 to 2009); Chief Executive Officer, iShares Intermediary Index and Market Group of BGI (2005 to 2008); Director of Barclays Global Fund Advisors (since 2005); Director, President and Chief Executive Officer of Barclays Global Investors International, Inc. (since 2005); and Director and Chairman of Barclays Global Investors Services (since 2005). | | | 26 | | | Barclays Global Investors Funds and Master Investment Portfolio (2001 to present). |
| | | | | | | | | | | | | |
Daniel O. Leemon Born: October 25, 1953 | | Trustee | | Since 2011 | | Retired. | | | 26 | | | Director, Corporate Executive Board (2003 to present). |
Ernest L. Schmider Born: July 4, 1957 | | Trustee, Chairman of Nominating and Governance Committee since 2012 | | Since 2011 | | Adjunct Professor, Argyros School of Business and Economics, Chapman University, (Spring and Fall, 2010); Managing Director, Pacific Investment Management Company (PIMCO), President, PIMCO Funds (held various positions with PIMCO from 1994 to 2009). | | | 26 | | | None. |
| | | | |
| | 200 | | | Disclosure of Information about Fund Trustees and Officers |
Russell Exchange Traded Funds Trust
Russell Factor ETFs™
Disclosure of Information about Fund Trustees and Officers, continued — March 31, 2012 (Unaudited)
| | | | | | | | |
| | | Position(s) Held
with the Fund | | Term of Office
and Length of
Time Served | | Principal Occupation(s)
During Past 5 Years | | Other
Directorships Held
by Trustee |
OFFICERS | | | | | | | | |
James Polisson* Born: November 11, 1959 | | President and Chief Executive Officer | | Since 2011; until successor is chosen and qualified by Trustees | | Managing Director and Head of Global ETF Business, FRC; Chief Marketing Officer, Barclays Global Investors/ iShares ETFs, 2005–2010 | | N/A |
| | | | | | | | | |
Mark E. Swanson Born: November 26, 1963 | | Treasurer, Chief Financial Officer and Chief Accounting Officer | | Since 2011; until successor is chosen and qualified by Trustees | | Treasurer, Chief Accounting Officer and CFO, Russell Investment Company and Russell Investment Funds; Director, Funds Administration, RIMCo, Russell Fund Services Company, Russell Trust Company (a non-depository trust company), and Russell Financial Services, Inc.; and Treasurer and Principal Accounting Officer, SSgA Funds | | N/A |
| | | | | | | | | |
Mary Beth Rhoden Born: April 25, 1969 | | Secretary and Chief Legal Officer | | Since 2011; until successor is chosen and qualified by Trustees | | Associate General Counsel, FRC; Assistant Secretary, Russell Investment Company and Russell Investment Funds, 1999–2010; Secretary, RIMCo, Russell Fund Services Company and Russell Financial Services, Inc.; and Secretary and Chief Legal Officer, Russell Investment Company and Russell Investment Funds | | N/A |
| | | | | | | | | |
Cheryl Wichers Born: December 16, 1966 | | Chief Compliance Officer since 2005 | | Until removed by Independent Trustees | | Chief Compliance Officer, RIC; Chief Compliance Officer, RIF; Chief Compliance Officer, RIMCo; Chief Compliance Officer, RFSC; Chief Compliance Officer, Russell Exchange Traded Funds Trust April 2002-May 2005, Manager, Global Regulatory Policy | | N/A |
| * | Mr. Polisson is also an officer and/or director of one or more affiliates of RET and is therefore an Interested Trustee. |
| ** | Ceased to be a Trustee effective April 25, 2012. |
| | |
| Disclosure of Information about Fund Trustees and Officers | | 201 |
Russell Exchange Traded Funds Trust
Russell Factor ETFs™
1301 Second Avenue, Seattle, Washington 98101
(888) 775-3837
Interested Trustee
James Polisson*
Independent Trustees
Evelyn S. Dilsaver
Jane A. Freeman
Lee T. Kranefuss**
Daniel O. Leemon
Ernest L. Schmider
Officers
James Polisson, President and Chief Executive Officer
Mark E. Swanson, Treasurer, Chief Financial Officer and Chief Accounting Officer
Mary Beth Rhoden, Secretary and Chief Legal Officer
Cheryl Wichers, Chief Compliance Officer
Adviser
Russell Investment Management Company
1301 Second Avenue
Seattle, Washington 98101
Administrator
Russell Fund Services Company
1301 Second Avenue
Seattle, Washington 98101
Transfer and Dividend Disbursing Agent
State Street Bank and Trust Company
One Lincoln Street
Boston, MA 02111
Custodian
State Street Bank and Trust Company
Josiah Quincy Building
200 Newport Avenue
North Quincy, MA 02171
Office of Shareholder Inquiries
1301 Second Avenue
Seattle, Washington 98101
(888) 775-3837
Distributor
ALPS Distributors, Inc.
1290 Broadway, Suite 1100
Denver, CO 80203
Independent Registered Public Accounting Firm
PricewaterhouseCoopers LLP
1420 Fifth Avenue, Suite 1900
Seattle, WA 98101
| * | Mr. Polisson is also an officer and/or director of one or more affiliates of RET and is therefore an Interested Trustee. |
| ** | Ceased to be a Trustee effective April 25, 2012. |
This report is prepared from the books and records of the Funds and is submitted for the general information of shareholders and is not authorized for distribution to prospective investors unless accompanied or preceded by an effective Prospectus. Nothing herein contained is to be considered an offer of sale or a solicitation of an offer to buy shares of Russell Exchange Traded Funds Trust. Such offering is made only by Prospectus, which includes details as to offering price and other material information.
| | | | |
| | 202 | | | Adviser and Service Providers |
| | | | |
| Russell Exchange Traded Funds Trust | | 1301 Second Avenue | | 888-775-3837 |
| | Seattle, Washington 98101 | | www.russelletfs.com |


2012 ANNUAL REPORT
Russell Exchange
Traded Funds Trust
Russell High Dividend Yield ETFs™
MARCH 31, 2012
|
| FUND |
|
| Russell High Dividend Yield ETF |
|
| Russell Small Cap High Dividend Yield ETF |
Russell Exchange Traded
Funds Trust
Russell Exchange Traded Funds Trust is a series investment company with 26 different investment portfolios referred to as Funds. These financial statements report on 2 of these Funds.
Russell Exchange Traded
Funds Trust
Russell High Dividend Yield ETFs™
Annual Report
March 31, 2012
Table of Contents
Russell Exchange Traded Funds Trust.
Copyright © Russell Investments 2012. All rights reserved.
Russell Investments is a Washington, USA corporation, which operates through subsidiaries worldwide and is a subsidiary of The Northwestern Mutual Life Insurance Company.
Fund objectives, risks, charges and expenses should be carefully considered before investing. A prospectus containing this and other important information must precede or accompany this material. Please read the prospectus carefully before investing.
Securities distributed through ALPS Distributors, Inc. member FINRA, not affiliated with Russell Investments.
Performance quoted represents past performance and does not guarantee future results. The investment return and principal value of an investment will fluctuate so that shares, when redeemed, may be worth more or less than their original cost. Current performance may be lower or higher than the performance data quoted. Current to the most recent month-end performance may be obtained by visiting www.russelletfs.com/Products.
To Our Shareholders
I am pleased to present you with Russell Exchange Traded Funds 2012 Annual Report for the fiscal year ending March 31, 2012. Inside you’ll find portfolio management discussions and fund performance information.
Although the past 12 months proved to be a challenging year for world markets, all of us at Russell remain focused on our primary mission — improving financial security for people. For over 75 years, we’ve helped clients invest in all kinds of markets throughout the market cycle. During good times and uncertain times, we are guided by the same disciplined, long-term investment approach.
During the fiscal year ended March 31, 2012, we witnessed non-stop assaults on the world economy: an earthquake, tsunami and nuclear disaster in Japan; ongoing conflicts in the Middle East; a financial crisis in Europe centered in Greece, Italy and Spain; the downgrade of U.S. debt in the summer; and continued market volatility throughout the fall and winter. Market volatility made the journey even more unsettling for many investors. Moving into 2012, however, equity markets showed improvement with strong gains. Investors reacted positively to the improved credit conditions in Europe and the Russell Global Large Cap Index rose 12.1% making it the best start to the year for equities since 1998. Equity markets within the U.S. also posted positive returns for the three months of 2012 with the Russell 1000 Index returning 12.90% for the quarter. Positive news on the U.S economy and better than expected housing and unemployment data also contributed to the early 2012 gains.
Volatile markets — like those we endured during the fiscal year — are often driven by emotions in the short-term. Longer-term, we believe underlying fundamentals drive the market. This belief, along with a thoughtful plan and globally diversified portfolio, can help you look past the day-to-day market fluctuations and help you reach your long-term goals.
From all of us at Russell Investments, thank you for the trust you have placed in our firm.
Best regards,

James G. Polisson
Managing Director
CEO, Russell Exchange Traded Funds
Russell Exchange Traded Funds Trust
Market Summary as of March 31, 2012 — (Unaudited)
Global equity markets continued the turnaround that began in the previous quarter with strong gains in January and February. Investors increasingly reacted positively to the improved credit conditions in Europe following the European Central Bank’s (ECB) successful Long-Term Refinancing Operations (LTRO). The program injected €1 trillion worth of liquidity into eurozone banks, eliminating the probability of a Lehman-like event. This provided clarity on policy and significantly reduced liquidity risk. The Russell Global Large Cap Index rose 12.1 percent, making it the best start to the year for equities since 1998. In addition to the growing relief about Europe, investors took heart from the continued flow of positive news on the U.S. economy, most notably better than expected housing and unemployment data.
Given the constructive tone of equity markets and risk assets in general, it was not surprising to see emerging markets (EM) outperforming developed markets by 2.3 percent, with Eastern Europe leading. However, there was a notable change of tone in March, as concerns about slowing Chinese growth caused EM to underperform developed markets by 4.6 percent. Within the developed markets, the U.S. was the strongest major market in U.S. dollar terms followed closely by Europe, which saw a growing divergence between core eurozone countries such as Germany and Austria, which were among the strongest markets globally, and peripheral countries such as Spain and Portugal, which barely rose.
Within Asia, Japan was the strongest market in local currency terms, but the surprise announcement by the Bank of Japan that it would target inflation prompted a significant depreciation in the Japanese yen, resulting in significantly lower U.S. dollar returns.
The improving market conditions also extended into bond markets as systemic risk dissipated, market volatility decreased and credit spreads tightened. Near-term Greek pressure was alleviated as private borrowers agreed on terms of a principal write-down (with the triggering of attendant credit default swaps realizing little-to-no market disruption) and the German parliament approved a second bailout of €130 billion. The events played out over a backdrop of ongoing global central bank easing (including the U.S. Federal Reserve’s pledge to extend its hold into 2014), positive U.S. economic data, and somewhat decreasing concerns of a China hard landing. While the end of the quarter was marked by some disappointment that eurozone finance ministers limited fresh “firewall” funds to €500 billion, overall, events drove positive sentiment in risk assets with Pan-European banks returning an astounding 24 percent and the lowest quality global credits (rated Ca to D) returning 13 percent.
Peripheral European sovereign debt, which had been struggling, rebounded with strong returns. The positive environment helped capital to continue to pour into emerging market debt funds, bolstering their solid returns of 6 percent. Subprime mortgages did well, due in part to the Federal Reserve selling the remainder of its Maiden Lane II portfolio privately and some indications that the housing market may be nearing the bottom.
The U.S. equity market produced strong returns during the first quarter of 2012. The Russell 1000 Index returned 12.90% for the quarter, posting positive returns in each of the three months. During the quarter, the Russell 1000 Growth Index was up 14.69% while the Russell 1000 Value Index returned 11.12%.
The technology sector was the best performing sector within the Russell 1000 Index. Performance within technology was led by computer technology companies, most notably Apple Inc. which returned 48.08%. After being out of favor during 2011, the financial services sector posted the second strongest return of any sector in the Russell 1000 Index for the first quarter. Diversified banks, including Bank of America and SunTrust Banks, were some of the sector’s best performers. Stocks within the utilities and energy sectors lagged the overall market. Utilities stocks struggled to keep pace with the market as many investors came to believe that the relative valuation of the sector had become excessive due to outperformance in 2011. Within the energy sector, coal stocks fared the worst, due to a combination of a warm winter in the much of the U.S., natural gas substitution, and the prospect of new regulations from the Environmental Protection Agency (EPA).
The factor environment generally favored stocks with higher growth prospects and more cyclical earnings patterns. Stocks with high beta performed well, as did stocks with above average historical earnings per share growth and high growth forecasts. Stocks with high dividend yields underperformed the market, as did stocks with high debt to capital
Russell Exchange Traded Funds Trust
ratios. The underperformance of stocks of the most leveraged companies was one factor that deviated from what many thought of as a “risk on” theme during the quarter.
Headline economic data in the United States was generally positive. Year over year GDP growth within the United States was positive and above 3.5% for the months of December 2011, January 2012 and February 2012. Unemployment in the U.S. decreased modestly during the quarter, from 8.5% in December 2011 to 8.3% in February 2012. While the price of a barrel of Brent crude oil rose 14.43% during the quarter, the price of West Texas Intermediate, a harbinger of fuel prices in the U.S., rose 4.24% to $103.02 per barrel. The general increase in gasoline prices in the U.S. was of concern for investors and politicians during the quarter, with President Obama reportedly considering actions to release strategic petroleum reserves in hopes of lowering the price of crude oil and related products. However many oil analysts and political pundits noted that the bigger problem was a shortage of refining capacity and downplayed the ultimate impact on gasoline prices from a release of crude oil.
Correlations among U.S. stocks remained at average levels relative to history and much lower levels than those reached during the third quarter of 2011. The Chicago Board Options Exchange Volatility Index (“VIX”) also remained in line with longer term average levels during the quarter, and declined from 23.4 at the beginning to 15.5 at the end of the first quarter.
Russell Exchange Traded Funds Trust
Russell High Dividend Yield ETFs
Portfolio Management Discussions and Analysis — March 31, 2012 (Unaudited)
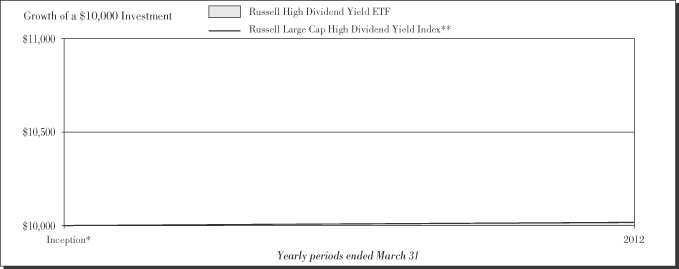
| | | | | | | | | | | | |
|
| Average Annual Total Return | |
| | | Net Asset
Value | | | Market
Value | | | Russell Large
Cap High
Dividend
Yield Index** | |
Inception* | | | 0.16 | % | | | 0.21 | % | | | 0.17 | % |
| | | | |
| | 6 | | | Russell High Dividend Yield ETFs |
Russell Exchange Traded Funds Trust
Russell High Dividend Yield ETF
Portfolio Management Discussion and Analysis — March 31, 2012 (Unaudited)
The Russell High Dividend Yield ETF (the “Fund”) is an index-based exchange-traded fund that seeks investment results that closely correspond to the total return of the Russell U.S. Large Cap High Dividend Yield Index (the “Index”). Russell Investment Management Company (“RIMCo”), as the Fund’s advisor, uses a “passive” or indexing approach to try to achieve the Fund’s investment objective. Unlike many investment companies, the Fund does not try to “beat” the Index it tracks and does not seek temporary defensive positions when markets decline or appear overvalued. The Fund will normally invest at least 80% of its total assets in securities that comprise the Index.
What is the Fund’s investment objective?
The Fund seeks investment results that closely correspond to the total return of the Russell U.S. Large Cap High Dividend Yield Index, which is designed to select securities with high dividend yields.
Is the Fund replicating or sampling?
The Fund is replicating.
How did the Fund perform relative to its benchmark for the fiscal year ended March 31, 2012?
For the fiscal year ended March 31, 2012, the Fund gained 0.16%. This is compared to the Fund’s benchmark, the Russell U.S. Large Cap High Dividend Yield Index, which gained 0.17% during the same period. The Fund’s performance includes operating expenses, whereas indexes are unmanaged and index returns do not include expenses of any kind.
There were no significant changes to either the Fund or Index during the reporting period.
Did the Fund outperform or underperform the benchmark or was performance as expected based on expenses, etc.?
The Fund performed as expected against the benchmark.
Over the reporting period, please describe those sectors that outperformed or underperformed.
Sectors achieved both positive and negative returns for the Fund and the Index. Consumer discretionary was the best performing sector for the Fund and the Index, while energy was the worst performing sector. Health care, with an average weight of 19.4% was the best contributor to Fund and Index returns. Energy, with an average weight of 7.7%, was the worst contributor to Fund and Index returns.
Over the reporting period, please describe those individual securities (constituents) that outperformed or underperformed.
Johnson & Johnson, FirstEnergy Corp, and M&T Bank Corp generated positive returns and contributed the most to Fund performance while Verizon Communications Inc, ConocoPhillips, and CenturyLink Inc, all declined which detracted from Fund performance.
The views expressed in this report reflect those of the portfolio managers only through the end of the period covered by the report. These views do not necessarily represent the views of RIMCo, or any other person in RIMCo or any other affiliated organization. These views are subject to change at any time based upon market conditions or other events, and RIMCo disclaims any responsibility to update the views contained herein. These views should not be relied on as investment advice and, because investment decisions for a Russell Exchange Traded Funds Trust (“RET”) Fund are based on numerous factors, should not be relied on as an indication of investment decisions of any RET Fund.
| * | | Commenced operations by issuing shares March 15, 2012. |
| ** | | The Russell U.S. Large Cap High Dividend Yield Index is designed to select securities with high dividend yields. The Index includes securities in the Russell 1000® Index (an index comprised of U.S. large capitalization securities) with high dividend yields and quality characteristics such as dividend growth, earnings stability and sustained profitability. The Index is market-cap weighted and reconstituted quarterly. |
Performance is historical and assumes reinvestment of all dividends and capital gains. Investment return and principal value will fluctuate so that an investor’s shares, when redeemed, may be worth more or less than when purchased. Past performance is not indicative of future results. The returns shown do not reflect the deduction of taxes that a shareholder would pay on Fund distributions or the redemption of Fund shares.
| | |
| Russell High Dividend Yield ETF | | 7 |
Russell Exchange Traded Funds Trust
Russell High Dividend Yield ETF
Shareholder Expense Example — March 31, 2012 (Unaudited)
Fund Expenses
The following disclosure provides important information regarding each Fund’s Expense Example, which appears on each Fund’s individual page in this Annual Report. Please refer to this information when reviewing the Expense Example for a Fund.
Example
As a shareholder of the Fund, you incur two types of costs: (1) transaction costs, including brokerage commissions on purchases and sales of your Fund shares and (2) ongoing costs, including management fees and other Fund expenses. The Example is intended to help you understand your ongoing costs (in dollars) of investing in the Fund and to compare these costs with the ongoing costs of investing in other funds. The Example is based on an investment of $1,000 invested at the beginning of the period and held for the entire period indicated, which for this Fund is from March 15, 2012 (commencement of operations) to March 31, 2012.
Actual Expenses
The information in the table under the heading “Actual Performance” provides information about actual account values and actual expenses. You may use the information in this column, together with the amount you invested, to estimate the expenses that you paid over the period. Simply divide your account value by $1,000 (for example, an $8,600 account value divided by $1,000 = 8.6), then multiply the result by the number in the first column in the row entitled “Expenses Paid During Period” to estimate the expenses you paid on your account during this period.
Hypothetical Example for Comparison Purposes
The information in the table under the heading “Hypothetical Performance (5% return before expenses)” provides information about hypothetical account values and hypothetical expenses based on the Fund’s actual expense ratio and an assumed rate of return of 5% per year before expenses, which is not the Fund’s actual return. The hypothetical account values and expenses may not be used to estimate the actual ending account balance or expenses you paid for the period. You may use this information to compare the ongoing costs of investing in the Fund and other funds. To do so, compare this 5% hypothetical example with the 5% hypothetical examples that appear in the shareholder reports of other funds.
Please note that the expenses shown in the table are meant to highlight your ongoing costs only and do not reflect any transactional costs, such as brokerage commissions paid on purchases and sales of Fund shares. Therefore, the information under the heading “Hypothetical Performance (5% return before expenses)” is useful in comparing ongoing costs only, and will not help you determine the relative total costs of owning different funds. In addition, if these transactional costs were included, your costs would have been higher.
| | | | | | | | |
| | | Actual
Performance | | | Hypothetical
Performance
(5% return
before expenses) | |
| | | | | | | | |
Beginning Account Value March 15, 2012 | | $ | 1,000.00 | | | $ | 1,000.00 | |
Ending Account Value March 31, 2012 | | $ | 1,001.60 | | | $ | 1,023.15 | |
Expenses Paid During Period* | | $ | 0.15 | | | $ | 1.67 | |
| * | Actual Expenses are equal to the Fund’s annualized expense ratio of 0.33% (representing the 17-day period annualized), multiplied by the average account value over the period, multiplied by 17/366 (to reflect the period since commencement of operations). Hypothetical expenses are equal to the Fund’s annualized expense ratio of 0.33% (representing the six-month period annualized), multiplied by the average account value over the period, multiplied by 183/366 (to reflect the one-half period). |
| | | | |
| | 8 | | | Russell High Dividend Yield ETF |
Russell Exchange Traded Funds Trust
Russell High Dividend Yield ETF
Schedule of Investments — March 31, 2012
Amounts in thousands (except share amounts)
| | | | | | | | |
| | | Principal
Amount ($)
or Shares | | | Market
Value
$ | |
| | | | | | | | |
| Common Stocks - 99.8% | | | | | | | | |
| Consumer Discretionary - 0.8% | | | | | | | | |
Hasbro, Inc. | | | 616 | | | | 22 | |
Leggett & Platt, Inc. | | | 762 | | | | 18 | |
| | | | | | | | |
| | | | | | | 40 | |
| | | | | | | | |
| | |
| Consumer Staples - 7.6% | | | | | | | | |
ConAgra Foods, Inc. | | | 2,184 | | | | 57 | |
HJ Heinz Co. | | | 1,718 | | | | 92 | |
Kimberly-Clark Corp. | | | 2,098 | | | | 156 | |
Reynolds American, Inc. | | | 1,790 | | | | 74 | |
| | | | | | | | |
| | | | | | | 379 | |
| | | | | | | | |
| | |
| Energy - 7.6% | | | | | | | | |
ConocoPhillips | | | 3,198 | | | | 243 | |
Diamond Offshore Drilling, Inc. | | | 368 | | | | 25 | |
Spectra Energy Corp. | | | 3,470 | | | | 109 | |
| | | | | | | | |
| | | | | | | 377 | |
| | | | | | | | |
| | |
| Financial Services - 10.2% | | | | | | | | |
Ares Capital Corp. | | | 1,126 | | | | 18 | |
Arthur J Gallagher & Co. | | | 562 | | | | 20 | |
Capitol Federal Financial, Inc. | | | 852 | | | | 10 | |
Chimera Investment Corp. (ö) | | | 2,018 | | | | 6 | |
Cincinnati Financial Corp. | | | 744 | | | | 26 | |
Cullen/Frost Bankers, Inc. | | | 272 | | | | 16 | |
Digital Realty Trust, Inc. (ö) | | | 198 | | | | 15 | |
Equity Residential (ö) | | | 578 | | | | 36 | |
HCP, Inc. (ö) | | | 798 | | | | 31 | |
Health Care REIT, Inc. (ö) | | | 376 | | | | 21 | |
Kimco Realty Corp. (ö) | | | 800 | | | | 15 | |
Liberty Property Trust (ö) | | | 226 | | | | 8 | |
M&T Bank Corp. | | | 638 | | | | 56 | |
Macerich Co. (The) (ö) | | | 258 | | | | 15 | |
Mack-Cali Realty Corp. (ö) | | | 170 | | | | 5 | |
Mercury General Corp. | | | 136 | | | | 6 | |
NYSE Euronext | | | 1,332 | | | | 41 | |
Old Republic International Corp. | | | 1,318 | | | | 14 | |
PartnerRe, Ltd. - ADR | | | 344 | | | | 23 | |
People’s United Financial, Inc. | | | 1,916 | | | | 25 | |
Piedmont Office Realty Trust, Inc.
Class A (ö) | | | 340 | | | | 6 | |
Rayonier, Inc. (ö) | | | 240 | | | | 11 | |
Realty Income Corp. (ö) | | | 262 | | | | 10 | |
Regency Centers Corp. (ö) | | | 176 | | | | 8 | |
Senior Housing Properties Trust (ö) | | | 320 | | | | 7 | |
Ventas, Inc. (ö) | | | 498 | | | | 28 | |
Vornado Realty Trust (ö) | | | 362 | | | | 30 | |
| | | | | | | | |
| | | | | | | 507 | |
| | | | | | | | |
| | |
| Health Care - 19.5% | | | | | | | | |
Bristol-Myers Squibb Co. | | | 7,609 | | | | 257 | |
Eli Lilly & Co. | | | 5,459 | | | | 220 | |
| | | | | | | | |
| | | Principal
Amount ($)
or Shares | | | Market
Value
$ | |
Johnson & Johnson | | | 3,760 | | | | 248 | |
Merck & Co., Inc. | | | 6,413 | | | | 246 | |
| | | | | | | | |
| | | | | | | 971 | |
| | | | | | | | |
| | |
| Materials and Processing - 9.8% | | | | | | | | |
EI du Pont de Nemours & Co. | | | 4,813 | | | | 255 | |
Greif, Inc. Class A | | | 204 | | | | 11 | |
International Paper Co. | | | 2,334 | | | | 82 | |
Nucor Corp. | | | 1,688 | | | | 72 | |
RPM International, Inc. | | | 696 | | | | 18 | |
Sonoco Products Co. | | | 532 | | | | 18 | |
Southern Copper Corp. | | | 918 | | | | 29 | |
| | | | | | | | |
| | | | | | | 485 | |
| | | | | | | | |
| | |
| Producer Durables - 4.9% | | | | | | | | |
Paychex, Inc. | | | 1,726 | | | | 53 | |
Raytheon Co. | | | 1,902 | | | | 100 | |
Waste Management, Inc. | | | 2,532 | | | | 89 | |
| | | | | | | | |
| | | | | | | 242 | |
| | | | | | | | |
| | |
| Technology - 1.0% | | | | | | | | |
Diebold, Inc. | | | 348 | | | | 13 | |
Microchip Technology, Inc. | | | 1,016 | | | | 38 | |
| | | | | | | | |
| | | | | | | 51 | |
| | | | | | | | |
| | |
| Utilities - 38.4% | | | | | | | | |
AGL Resources, Inc. | | | 622 | | | | 24 | |
Alliant Energy Corp. | | | 592 | | | | 26 | |
Ameren Corp. | | | 1,288 | | | | 42 | |
American Electric Power Co., Inc. | | | 2,572 | | | | 99 | |
AT&T, Inc. | | | 8,001 | | | | 249 | |
CenturyLink, Inc. | | | 3,266 | | | | 126 | |
Consolidated Edison, Inc. | | | 1,562 | | | | 91 | |
DTE Energy Co. | | | 904 | | | | 50 | |
Exelon Corp. | | | 3,536 | | | | 139 | |
FirstEnergy Corp. | | | 2,232 | | | | 102 | |
Hawaiian Electric Industries, Inc. | | | 508 | | | | 13 | |
Integrys Energy Group, Inc. | | | 418 | | | | 22 | |
NextEra Energy, Inc. | | | 2,252 | | | | 138 | |
NSTAR LLC | | | 554 | | | | 27 | |
Pinnacle West Capital Corp. | | | 582 | | | | 28 | |
PPL Corp. | | | 3,082 | | | | 87 | |
Public Service Enterprise Group, Inc. | | | 2,700 | | | | 83 | |
Southern Co. | | | 4,535 | | | | 204 | |
TECO Energy, Inc. | | | 1,148 | | | | 20 | |
UGI Corp. | | | 596 | | | | 16 | |
Vectren Corp. | | | 436 | | | | 13 | |
Verizon Communications, Inc. | | | 6,423 | | | | 246 | |
Xcel Energy, Inc. | | | 2,584 | | | | 68 | |
| | | | | | | | |
| | | | | | | 1,913 | |
| | | | | | | | |
| | |
Total Common Stocks
(cost $4,952) | | | | | | | 4,965 | |
| | | | | | | | |
| | |
| Russell High Dividend Yield ETF | | 9 |
Russell Exchange Traded Funds Trust
Russell High Dividend Yield ETF
Schedule of Investments, continued — March 31, 2012
Amounts in thousands (except share amounts)
| | | | | | | | |
| | | Principal
Amount ($)
or Shares | | | Market
Value
$ | |
| | | | | | | | |
| Short-Term Investments - 0.2% | | | | | | | | |
Russell U.S. Cash Management Fund | | | 10,852 | (¥) | | | 11 | |
| | | | | | | | |
| | |
Total Short-Term Investments
(cost $11) | | | | | | | 11 | |
| | | | | | | | |
| | |
Total Investments - 100.0%
(identified cost $4,963) | | | | | | | 4,976 | |
| | |
Other Assets and Liabilities,
Net - 0.0% | | | | | | | 2 | |
| | | | | | | | |
| | |
| Net Assets - 100.0% | | | | | | | 4,978 | |
| | | | | | | | |
| | | | |
| | 10 | | | Russell High Dividend Yield ETF |
See accompanying notes which are an integral part of the financial statements.
Russell Exchange Traded Funds Trust
Russell High Dividend Yield ETF
Presentation of Portfolio Holdings — March 31, 2012
Amounts in thousands
| | | | | | | | | | | | | | | | | | | | |
| | | Market Value | | | | |
| Portfolio Summary | | Level 1 | | | Level 2 | | | Level 3 | | | Total | | | % of Net
Assets | |
| | | | | | | | | | | | | | | | | | | | |
Common Stocks | | | | | | | | | | | | | | | | | | | | |
Consumer Discretionary | | $ | 40 | | | $ | — | | | $ | — | | | $ | 40 | | | | 0.8 | |
Consumer Staples | | | 379 | | | | — | | | | — | | | | 379 | | | | 7.6 | |
Energy | | | 377 | | | | — | | | | — | | | | 377 | | | | 7.6 | |
Financial Services | | | 507 | | | | — | | | | — | | | | 507 | | | | 10.2 | |
Health Care | | | 971 | | | | — | | | | — | | | | 971 | | | | 19.5 | |
Materials and Processing | | | 485 | | | | — | | | | — | | | | 485 | | | | 9.8 | |
Producer Durables | | | 242 | | | | — | | | | — | | | | 242 | | | | 4.9 | |
Technology | | | 51 | | | | — | | | | — | | | | 51 | | | | 1.0 | |
Utilities | | | 1,913 | | | | — | | | | — | | | | 1,913 | | | | 38.4 | |
Short-Term Investments | | | — | | | | 11 | | | | — | | | | 11 | | | | 0.2 | |
| | | | | | | | | | | | | | | | | | | | |
Total Investments | | | 4,965 | | | | 11 | | | | — | | | | 4,976 | | | | 100.0 | |
| | | | | | | | | | | | | | | | | | | | |
Other Assets and Liabilities, Net | | | | | | | | | | | | | | | | | | | — | * |
| | | | | | | | | | | | | | | | | | | | |
| | | | | | | | | | | | | | | | | | | 100.0 | |
| | | | | | | | | | | | | | | | | | | | |
| * | Less than .05% of net assets. |
| For | a description of the levels see note 2 in the Notes to Financial Statements. |
| There | were no significant transfers in and out of levels 1, 2 and 3 during the period ending March 31, 2012. |
| | |
| Russell High Dividend Yield ETF | | 11 |
See accompanying notes which are an integral part of the financial statements.
Russell Exchange Traded Funds Trust
Russell High Dividend Yield ETF
Statement of Assets and Liabilities — March 31, 2012
| | | | |
| Amounts in thousands | | Russell High
Dividend Yield
ETF | |
| | | | |
Assets | | | | |
Investments, at identified cost | | $ | 4,963 | |
Investments, at market* | | | 4,976 | |
Receivables: | | | | |
Dividends and interest | | | 3 | |
| | | | |
Total assets | | | 4,979 | |
| | | | |
| |
Liabilities | | | | |
Payables: | | | | |
Accrued fees to affiliates | | | 1 | |
| | | | |
Total liabilities | | | 1 | |
| | | | |
| | | | |
Net Assets | | $ | 4,978 | |
| | | | |
Net Assets Consist of: | | | | |
Undistributed (overdistributed) net investment income | | $ | 2 | |
Unrealized appreciation (depreciation) on investments | | | 13 | |
Shares of beneficial interest | | | — | ** |
Additional paid-in capital | | | 4,963 | |
| | | | |
Net Assets | | $ | 4,978 | |
| | | | |
Net Asset Value, offering and redemption price per share: | | | | |
Net asset value per share:(a) | | $ | 24.89 | |
Net assets | | $ | 4,977,792 | |
Shares outstanding ($.001 par value) | | | 200,004 | |
Amounts in thousands | | | | |
| | | | |
* Investments in Affiliates, Russell U.S. Cash Management Fund | | $ | 11 | |
| (a) | Net asset value per share equals net assets divided by shares outstanding. |
See accompanying notes which are an integral part of the financial statements.
| | | | |
| | 12 | | | Statement of Assets and Liabilities |
Russell Exchange Traded Funds Trust
Russell High Dividend Yield ETF
Statement of Operations — For the Period Ended March 31, 2012
| | | | |
| Amounts in thousands | | Russell High
Dividend Yield
ETF* | |
| | | | |
Investment Income | | | | |
Dividends | | $ | 3 | |
| | | | |
Total investment income | | | 3 | |
| | | | |
| |
Expenses | | | | |
Management fees | | | 1 | |
Trustee and trustee related fees | | | — | ** |
| | | | |
Expenses before reductions | | | 1 | |
Expense reductions | | | — | ** |
| | | | |
Net expenses | | | 1 | |
| | | | |
Net investment income (loss) | | | 2 | |
| | | | |
| |
Net Realized and Unrealized Gain (Loss) | | | | |
Net change in unrealized appreciation (depreciation) on investments | | | 13 | |
| | | | |
Net realized and unrealized gain (loss) | | | 13 | |
| | | | |
Net Increase (Decrease) in Net Assets from Operations | | $ | 15 | |
| | | | |
| * | For the period March 15, 2012 (commencement of operations) to March 31, 2012. |
See accompanying notes which are an integral part of the financial statements.
| | |
| Statement of Operations | | 13 |
Russell Exchange Traded Funds Trust
Russell High Dividend Yield ETF
Statement of Changes in Net Assets — For the Period Ended March 31,
| | | | |
| | | Russell High
Dividend Yield ETF | |
| Amounts in thousands | | 2012* | |
| | | | |
Increase (Decrease) in Net Assets | | | | |
| |
Operations | | | | |
Net investment income (loss) | | $ | 2 | |
Net change in unrealized appreciation (depreciation) | | | 13 | |
| | | | |
Net increase (decrease) in net assets from operations | | | 15 | |
| | | | |
| |
Share Transactions | | | | |
Net increase (decrease) in net assets from share transactions | | | 4,963 | |
| | | | |
Total Net Increase (Decrease) in Net Assets | | | 4,978 | |
| |
Net Assets | | | | |
Beginning of period | | | — | |
| | | | |
End of period | | $ | 4,978 | |
| | | | |
Undistributed (overdistributed) net investment income included in net assets | | $ | 2 | |
| * | For the period March 15, 2012 (commencement of operations) to March 31, 2012. |
See accompanying notes which are an integral part of the financial statements.
| | | | |
| | 14 | | | Statement of Changes in Net Assets |
(This page intentionally left blank)
Russell Exchange Traded Funds Trust
Russell High Dividend Yield ETF
Financial Highlights — For the Period Ended
For a Share Outstanding Throughout Each Period.
| | | | | | | | | | | | | | | | |
| | |
$
Net Asset Value,
Beginning of
Period | | | $
Net
Investment
Income (Loss)(a) | | | $
Net Realized
and Unrealized
Gain (Loss) | | | $
Total from
Investment
Operations | |
Russell High Dividend Yield ETF | | | | | | | | | | | | | | | | |
March 31, 2012* | | | 24.85 | | | | .01 | | | | .03 | | | | .04 | |
| (a) | Average daily shares outstanding were used for this calculation. |
| (b) | Periods less than one year are not annualized. |
| (c) | The ratios for periods less than one year are annualized. |
| (d) | Portfolio turnover rate excludes securities received or delivered from in-kind creation or redemption units. |
| * | For the period March 15, 2012 (commencement of operations) to March 31, 2012. |
See accompanying notes which are an integral part of the financial statements.
| | | | | | | | | | | | | | | | | | | | | | | | | | |
$
Net Asset Value,
End of
Period | | | %
Total
Return(b) | | | $
Net Assets,
End of Period
(000) | | | %
Ratio of Expenses
to Average
Net Assets,
Gross(c) | | | %
Ratio of Expenses
to Average
Net Assets,
Net(c) | | | %
Ratio of Net
Investment Income
to Average
Net Assets(c) | | | %
Portfolio
Turnover Rate(b)(d) | |
| | | | | | | | | | | | | | | | | | | | | | | | | | |
| | 24.89 | | | | 0.16 | | | | 4,978 | | | | .59 | | | | .33 | | | | 1.04 | | | | — | |
See accompanying notes which are an integral part of the financial statements.
Russell Exchange Traded Funds Trust
Russell Small Cap High Dividend Yield ETF
Portfolio Management Discussion and Analysis — March 31, 2012 (Unaudited)
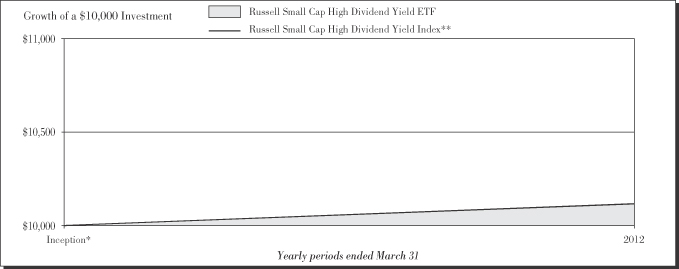
| | | | | | | | | | | | |
|
| Average Annual Total Return | |
| | | Net Asset
Value | | | Market
Value | | | Russell Small
Cap High
Dividend Yield
Index** | |
Inception* | | | 1.14 | % | | | 1.26 | % | | | 1.16 | % |
| | | | |
| | 18 | | | Russell Small Cap High Dividend Yield ETF |
Russell Exchange Traded Funds Trust
Russell Small Cap High Dividend Yield ETF
Portfolio Management Discussion and Analysis — March 31, 2012 (Unaudited)
The Russell Small Cap High Dividend Yield ETF (the “Fund”) is an index-based exchange-traded fund that seeks investment results that closely correspond to the total return of the Russell U.S. Small Cap High Dividend Yield Index (the “Index”). Russell Investment Management Company (“RIMCo”), as the Fund’s advisor, uses a “passive” or indexing approach to try to achieve the Fund’s investment objective. Unlike many investment companies, the Fund does not try to “beat” the Index it tracks and does not seek temporary defensive positions when markets decline or appear overvalued. The Fund will normally invest at least 80% of its total assets in securities that comprise the Index.
What is the Fund’s investment objective?
The Fund seeks investment results that closely correspond to the total return of the Russell U.S. Small Cap High Dividend Yield Index, which is designed to select securities with high dividend yields.
Is the Fund replicating or sampling?
The Fund is replicating.
How did the Fund perform relative to its benchmark for the fiscal year ended March 31, 2012?
For the fiscal year ended March 31, 2012, the Fund gained 1.14%. This is compared to the Fund’s benchmark, the Russell U.S. Small Cap High Dividend Yield Index, which gained 1.16% during the same period. The Fund’s performance includes operating expenses, whereas indexes are unmanaged and index returns do not include expenses of any kind.
There were no significant changes to either the Fund or Index during the reporting period.
Did the Fund outperform or underperform the benchmark or was performance as expected based on expenses, etc.?
The Fund performed as expected against the benchmark.
Over the reporting period, please describe those sectors that outperformed or underperformed.
Sectors achieved both positive and negative returns for the Fund and the Index. Materials & processing was the best performing sector for the Fund and the Index, while technology was the worst performing sector. Financial services, with an average weight of 55.8% was the best contributor to Fund and Index returns. Technology, with an average weight of 0.5%, was the worst contributor to Fund and Index returns.
Over the reporting period, please describe those individual securities (constituents) that outperformed or underperformed.
Extra Space Storage Inc, Highwoods Properties Inc, and Snyders-Lance Inc generated positive returns and contributed the most to Fund performance while United Bankshares Inc, Cal-Maine Foods Inc, and Alterra Capital Holdings Ltd, all declined which detracted from Fund performance.
The views expressed in this report reflect those of the portfolio managers only through the end of the period covered by the report. These views do not necessarily represent the views of RIMCo, or any other person in RIMCo or any other affiliated organization. These views are subject to change at any time based upon market conditions or other events, and RIMCo disclaims any responsibility to update the views contained herein. These views should not be relied on as investment advice and, because investment decisions for a Russell Exchange Traded Funds Trust (“RET”) Fund are based on numerous factors, should not be relied on as an indication of investment decisions of any RET Fund.
| * | | Commenced operations by issuing shares March 15, 2012. |
| ** | | The Russell U.S. Small Cap High Dividend Yield Index is designed to select securities with high dividend yields. The Index includes securities in the Russell 2000® Index (an index comprised of U.S. small capitalization securities) with high dividend yields and quality characteristics such as dividend growth, earnings stability and sustained profitability. The Index is market-cap weighted and reconstituted quarterly. |
Performance is historical and assumes reinvestment of all dividends and capital gains. Investment return and principal value will fluctuate so that an investor’s shares, when redeemed, may be worth more or less than when purchased. Past performance is not indicative of future results. The returns shown do not reflect the deduction of taxes that a shareholder would pay on Fund distributions or the redemption of Fund shares.
| | |
| Russell Small Cap High Dividend Yield ETF | | 19 |
Russell Exchange Traded Funds Trust
Russell Small Cap High Dividend Yield ETF
Shareholder Expense Example — March 31, 2012 (Unaudited)
Fund Expenses
The following disclosure provides important information regarding each Fund’s Expense Example, which appears on each Fund’s individual page in this Annual Report. Please refer to this information when reviewing the Expense Example for a Fund.
Example
As a shareholder of the Fund, you incur two types of costs: (1) transaction costs, including brokerage commissions on purchases and sales of your Fund shares and (2) ongoing costs, including management fees and other Fund expenses. The Example is intended to help you understand your ongoing costs (in dollars) of investing in the Fund and to compare these costs with the ongoing costs of investing in other funds. The Example is based on an investment of $1,000 invested at the beginning of the period and held for the entire period indicated, which for this Fund is from March 15, 2012 (commencement of operations) to March 31, 2012.
Actual Expenses
The information in the table under the heading “Actual Performance” provides information about actual account values and actual expenses. You may use the information in this column, together with the amount you invested, to estimate the expenses that you paid over the period. Simply divide your account value by $1,000 (for example, an $8,600 account value divided by $1,000 = 8.6), then multiply the result by the number in the first column in the row entitled “Expenses Paid During Period” to estimate the expenses you paid on your account during this period.
Hypothetical Example for Comparison Purposes
The information in the table under the heading “Hypothetical Performance (5% return before expenses)” provides information about hypothetical account values and hypothetical expenses based on the Fund’s actual expense ratio and an assumed rate of return of 5% per year before expenses, which is not the Fund’s actual return. The hypothetical account values and expenses may not be used to estimate the actual ending account balance or expenses you paid for the period. You may use this information to compare the ongoing costs of investing in the Fund and other funds. To do so, compare this 5% hypothetical example with the 5% hypothetical examples that appear in the shareholder reports of other funds.
Please note that the expenses shown in the table are meant to highlight your ongoing costs only and do not reflect any transactional costs, such as brokerage commissions paid on purchases and sales of Fund shares. Therefore, the information under the heading “Hypothetical Performance (5% return before expenses)” is useful in comparing ongoing costs only, and will not help you determine the relative total costs of owning different funds. In addition, if these transactional costs were included, your costs would have been higher.
| | | | | | | | |
| | Actual
Performance | | | Hypothetical
Performance
(5% return
before expenses) | |
| | | | | | | | |
Beginning Account Value | | | | | | | | |
March 15, 2012 | | $ | 1,000.00 | | | $ | 1,000.00 | |
Ending Account Value | | | | | | | | |
March 31, 2012 | | $ | 1,011.40 | | | $ | 1,023.10 | |
Expenses Paid During Period* | | $ | 0.18 | | | $ | 1.92 | |
| * | Actual Expenses are equal to the Fund’s annualized expense ratio of 0.38% (representing the 17-day period annualized), multiplied by the average account value over the period, multiplied by 17/366 (to reflect the period since commencement of operations). Hypothetical expenses are equal to the Fund’s annualized expense ratio of 0.38% (representing the six-month period annualized), multiplied by the average account value over the period, multiplied by 183/366 (to reflect the one-half period). |
| | | | |
| | 20 | | | Russell Small Cap High Dividend Yield ETF |
Russell Exchange Traded Funds Trust
Russell Small Cap High Dividend Yield ETF
Schedule of Investments — March 31, 2012
Amounts in thousands (except share amounts)
| | | | | | | | |
| | | Principal
Amount ($)
or Shares | | | Market
Value
$ | |
| | | | | | | | |
| Common Stocks - 99.6% | | | | | | | | |
| Consumer Discretionary - 6.0% | | | | | | | | |
Bob Evans Farms, Inc. | | | 538 | | | | 20 | |
Cato Corp. (The) Class A | | | 491 | | | | 14 | |
Cinemark Holdings, Inc. | | | 1,663 | | | | 36 | |
CSS Industries, Inc. | | | 144 | | | | 3 | |
Hillenbrand, Inc. | | | 1,114 | | | | 26 | |
Marcus Corp. | | | 362 | | | | 5 | |
Meredith Corp. | | | 645 | | | | 21 | |
Nutrisystem, Inc. | | | 479 | | | | 5 | |
Speedway Motorsports, Inc. | | | 210 | | | | 4 | |
Stage Stores, Inc. | | | 553 | | | | 9 | |
Stewart Enterprises, Inc. Class A | | | 1,399 | | | | 8 | |
| | | | | | | | |
| | | | | | | 151 | |
| | | | | | | | |
| | |
| Consumer Staples - 3.6% | | | | | | | | |
Calavo Growers, Inc. | | | 210 | | | | 6 | |
Cal-Maine Foods, Inc. | | | 252 | | | | 10 | |
Lancaster Colony Corp. | | | 332 | | | | 21 | |
Snyders-Lance, Inc. | | | 839 | | | | 22 | |
Universal Corp. | | | 411 | | | | 19 | |
WD-40 Co. | | | 284 | | | | 13 | |
| | | | | | | | |
| | | | | | | 91 | |
| | | | | | | | |
| | |
| Financial Services - 55.7% | | | | | | | | |
Advance America Cash Advance Centers, Inc. | | | 979 | | | | 10 | |
Agree Realty Corp. (ö) | | | 175 | | | | 4 | |
Alterra Capital Holdings, Ltd. | | | 1,624 | | | | 37 | |
American Campus Communities, Inc. (ö) | | | 1,215 | | | | 55 | |
Arrow Financial Corp. | | | 180 | | | | 4 | |
Bancfirst Corp. | | | 119 | | | | 5 | |
Berkshire Hills Bancorp, Inc. | | | 368 | | | | 8 | |
BioMed Realty Trust, Inc. (ö) | | | 2,751 | | | | 53 | |
BlackRock Kelso Capital Corp. | | | 1,297 | | | | 13 | |
Brookline Bancorp, Inc. | | | 1,204 | | | | 11 | |
Bryn Mawr Bank Corp. | | | 193 | | | | 4 | |
Chemical Financial Corp. | | | 488 | | | | 11 | |
Citizens & Northern Corp. | | | 216 | | | | 4 | |
City Holding Co. | | | 271 | | | | 9 | |
Community Bank System, Inc. | | | 653 | | | | 19 | |
CVB Financial Corp. | | | 1,587 | | | | 19 | |
Entertainment Properties Trust (ö) | | | 835 | | | | 39 | |
Epoch Holding Corp. | | | 262 | | | | 6 | |
Equity One, Inc. (ö) | | | 953 | | | | 19 | |
Extra Space Storage, Inc. (ö) | | | 1,679 | | | | 48 | |
Financial Institutions, Inc. | | | 245 | | | | 4 | |
First Community Bancshares, Inc. | | | 282 | | | | 4 | |
First Financial Bancorp | | | 1,035 | | | | 18 | |
First Financial Bankshares, Inc. | | | 558 | | | | 20 | |
First Financial Corp. | | | 198 | | | | 6 | |
FirstMerit Corp. | | | 1,955 | | | | 33 | |
Flushing Financial Corp. | | | 558 | | | | 8 | |
FNB Corp. | | | 2,414 | | | | 29 | |
GAMCO Investors, Inc. Class A | | | 121 | | | | 6 | |
Glacier Bancorp, Inc. | | | 1,277 | | | | 19 | |
Hancock Holding Co. | | | 1,365 | | | | 49 | |
| | | | | | | | |
| | | Principal
Amount ($)
or Shares | | | Market
Value
$ | |
Hercules Technology Growth Capital, Inc. | | | 778 | | | | 9 | |
Highwoods Properties, Inc. (ö) | | | 1,290 | | | | 43 | |
Horace Mann Educators Corp. | | | 708 | | | | 12 | |
Iberiabank Corp. | | | 525 | | | | 28 | |
Independent Bank Corp. | | | 381 | | | | 11 | |
Inland Real Estate Corp. (ö) | | | 1,370 | | | | 12 | |
International Bancshares Corp. | | | 942 | | | | 20 | |
Kohlberg Capital Corp. | | | 340 | | | | 2 | |
Lakeland Financial Corp. | | | 288 | | | | 7 | |
LTC Properties, Inc. (ö) | | | 539 | | | | 17 | |
Main Street Capital Corp. | | | 407 | | | | 10 | |
Medical Properties Trust, Inc. (ö) | | | 1,984 | | | | 18 | |
Montpelier Re Holdings, Ltd. | | | 1,108 | | | | 21 | |
MVC Capital, Inc. | | | 426 | | | | 6 | |
National Health Investors, Inc. (ö) | | | 433 | | | | 21 | |
National Retail Properties, Inc. (ö) | | | 1,868 | | | | 52 | |
NBT Bancorp, Inc. | | | 612 | | | | 14 | |
Northwest Bancshares, Inc. | | | 1,732 | | | | 22 | |
OceanFirst Financial Corp. | | | 260 | | | | 4 | |
Old National Bancorp | | | 1,683 | | | | 22 | |
Omega Healthcare Investors, Inc. (ö) | | | 1,818 | | | | 39 | |
OneBeacon Insurance Group, Ltd. Class A | | | 394 | | | | 6 | |
Park National Corp. | | | 229 | | | | 16 | |
PennantPark Investment Corp. | | | 810 | | | | 8 | |
Peoples Bancorp, Inc. | | | 188 | | | | 3 | |
Prospect Capital Corp. | | | 1,936 | | | | 21 | |
Provident Financial Services, Inc. | | | 1,074 | | | | 16 | |
Provident New York Bancorp | | | 676 | | | | 6 | |
PS Business Parks, Inc. (ö) | | | 331 | | | | 22 | |
Ramco-Gershenson Properties Trust (ö) | | | 684 | | | | 8 | |
Renasant Corp. | | | 445 | | | | 7 | |
RLI Corp. | | | 324 | | | | 23 | |
Rockville Financial, Inc. | | | 524 | | | | 6 | |
S&T Bancorp, Inc. | | | 498 | | | | 11 | |
Safety Insurance Group, Inc. | | | 224 | | | | 9 | |
Sandy Spring Bancorp, Inc. | | | 428 | | | | 8 | |
SCBT Financial Corp. | | | 248 | | | | 8 | |
Selective Insurance Group, Inc. | | | 959 | | | | 17 | |
Simmons First National Corp. Class A | | | 308 | | | | 8 | |
Sovran Self Storage, Inc. (ö) | | | 492 | | | | 25 | |
State Auto Financial Corp. | | | 260 | | | | 4 | |
Sterling Bancorp | | | 549 | | | | 5 | |
TICC Capital Corp. | | | 573 | | | | 6 | |
Tompkins Financial Corp. | | | 144 | | | | 6 | |
Triangle Capital Corp. | | | 393 | | | | 8 | |
Trico Bancshares | | | 250 | | | | 4 | |
Trustco Bank Corp. | | | 1,652 | | | | 9 | |
Trustmark Corp. | | | 1,137 | | | | 28 | |
UMB Financial Corp. | | | 569 | | | | 25 | |
Umpqua Holdings Corp. | | | 2,036 | | | | 28 | |
United Bankshares, Inc. | | | 892 | | | | 26 | |
United Financial Bancorp, Inc. | | | 286 | | | | 5 | |
Univest Corp. of Pennsylvania | | | 298 | | | | 5 | |
Urstadt Biddle Properties, Inc. Class A (ö) | | | 409 | | | | 8 | |
WesBanco, Inc. | | | 410 | | | | 8 | |
Westamerica Bancorporation | | | 513 | | | | 25 | |
Westfield Financial, Inc. | | | 498 | | | | 4 | |
| | | | | | | | |
| | | | | | | 1,396 | |
| | | | | | | | |
| | |
| Russell Small Cap High Dividend Yield ETF | | 21 |
Russell Exchange Traded Funds Trust
Russell Small Cap High Dividend Yield ETF
Schedule of Investments, continued — March 31, 2012
Amounts in thousands (except share amounts)
| | | | | | | | |
| | | Principal
Amount ($)
or Shares | | | Market
Value
$ | |
| | | | | | | | |
| Health Care - 3.1% | | | | | | | | |
Computer Programs & Systems, Inc. | | | 197 | | | | 11 | |
Landauer, Inc. | | | 167 | | | | 9 | |
Meridian Bioscience, Inc. | | | 728 | | | | 14 | |
National Healthcare Corp. | | | 182 | | | | 8 | |
National Research Corp. | | | 32 | | | | 1 | |
Owens & Minor, Inc. | | | 1,141 | | | | 35 | |
| | | | | | | | |
| | | | | | | 78 | |
| | | | | | | | |
|
| Materials and Processing - 5.6% | |
A Schulman, Inc. | | | 548 | | | | 15 | |
Aceto Corp. | | | 473 | | | | 4 | |
Innophos Holdings, Inc. | | | 385 | | | | 19 | |
Kaydon Corp. | | | 579 | | | | 15 | |
Olin Corp. | | | 1,427 | | | | 31 | |
PH Glatfelter Co. | | | 775 | | | | 12 | |
Quaker Chemical Corp. | | | 227 | | | | 9 | |
Sensient Technologies Corp. | | | 896 | | | | 35 | |
| | | | | | | | |
| | | | | | | 140 | |
| | | | | | | | |
|
| Producer Durables - 8.6% | |
ABM Industries, Inc. | | | 942 | | | | 23 | |
Applied Industrial Technologies, Inc. | | | 753 | | | | 31 | |
Brady Corp. Class A | | | 844 | | | | 27 | |
Briggs & Stratton Corp. | | | 896 | | | | 16 | |
Granite Construction, Inc. | | | 686 | | | | 20 | |
Healthcare Services Group, Inc. | | | 1,179 | | | | 25 | |
Houston Wire & Cable Co. | | | 316 | | | | 4 | |
Insperity, Inc. | | | 407 | | | | 12 | |
Kaman Corp. Class A | | | 467 | | | | 16 | |
Mine Safety Appliances Co. | | | 482 | | | | 20 | |
MTS Systems Corp. | | | 277 | | | | 15 | |
US Ecology, Inc. | | | 325 | | | | 7 | |
| | | | | | | | |
| | | | | | | 216 | |
| | | | | | | | |
| | |
| Technology - 0.5% | | | | | | | | |
American Software, Inc. Class A (Æ) | | | 404 | | | | 3 | |
United Online, Inc. | | | 1,574 | | | | 8 | |
| | | | | | | | |
| | | | | | | 11 | |
| | | | | | | | |
| | |
| Utilities - 16.5% | | | | | | | | |
Allete, Inc. | | | 566 | | | | 23 | |
Avista Corp. | | | 1,024 | | | | 26 | |
Central Vermont Public Service Corp. | | | 238 | | | | 8 | |
CH Energy Group, Inc. | | | 276 | | | | 18 | |
Chesapeake Utilities Corp. | | | 170 | | | | 7 | |
Cleco Corp. | | | 1,091 | | | | 44 | |
Empire District Electric Co. (The) | | | 742 | | | | 15 | |
Laclede Group, Inc. (The) | | | 398 | | | | 16 | |
MGE Energy, Inc. | | | 411 | | | | 18 | |
New Jersey Resources Corp. | | | 735 | | | | 33 | |
Northwest Natural Gas Co. | | | 474 | | | | 22 | |
NorthWestern Corp. | | | 644 | | | | 23 | |
Otter Tail Corp. | | | 640 | | | | 14 | |
| | | | | | | | |
| | | Principal
Amount ($)
or Shares | | | Market
Value
$ | |
Piedmont Natural Gas Co., Inc. | | | 1,284 | | | | 40 | |
Portland General Electric Co. | | | 1,348 | | | | 34 | |
Southwest Gas Corp. | | | 821 | | | | 35 | |
WGL Holdings, Inc. | | | 917 | | | | 37 | |
| | | | | | | | |
| | | | | | | 413 | |
| | | | | | | | |
| | |
Total Common Stocks
(cost $2,478) | | | | | | | 2,496 | |
| | | | | | | | |
|
| Short-Term Investments - 0.5% | |
Russell U.S. Cash Management Fund | | | 12,022 | (¥) | | | 12 | |
| | | | | | | | |
| | |
Total Short-Term Investments
(cost $12) | | | | | | | 12 | |
| | | | | | | | |
| | |
Total Investments - 100.1%
(identified cost $2,490) | | | | | | | 2,508 | |
| | |
Other Assets and Liabilities,
Net - (0.1%) | | | | | | | (2 | ) |
| | | | | | | | |
| | |
| Net Assets - 100.0% | | | | | | | 2,506 | |
| | | | | | | | |
See accompanying notes which are an integral part of the financial statements.
| | | | |
| | 22 | | | Russell Small Cap High Dividend Yield ETF |
Russell Exchange Traded Funds Trust
Russell Small Cap High Dividend Yield ETF
Presentation of Portfolio Holdings — March 31, 2012
Amounts in thousands
| | | | | | | | | | | | | | | | | | | | |
| | | Market Value | | | | |
| Portfolio Summary | | Level 1 | | | Level 2 | | | Level 3 | | | Total | | | % of Net
Assets | |
| | | | | | | | | | | | | | | | | | | | |
Common Stocks | | | | | | | | | | | | | | | | | | | | |
Consumer Discretionary | | $ | 151 | | | $ | — | | | $ | — | | | $ | 151 | | | | 6.0 | |
Consumer Staples | | | 91 | | | | — | | | | — | | | | 91 | | | | 3.6 | |
Financial Services | | | 1,396 | | | | — | | | | — | | | | 1,396 | | | | 55.7 | |
Health Care | | | 78 | | | | — | | | | — | | | | 78 | | | | 3.1 | |
Materials and Processing | | | 140 | | | | — | | | | — | | | | 140 | | | | 5.6 | |
Producer Durables | | | 216 | | | | — | | | | — | | | | 216 | | | | 8.6 | |
Technology | | | 11 | | | | — | | | | — | | | | 11 | | | | 0.5 | |
Utilities | | | 413 | | | | — | | | | — | | | | 413 | | | | 16.5 | |
Short-Term Investments | | | — | | | | 12 | | | | — | | | | 12 | | | | 0.5 | |
| | | | | | | | | | | | | | | | | | | | |
Total Investments | | | 2,496 | | | | 12 | | | | — | | | | 2,508 | | | | 100.1 | |
| | | | | | | | | | | | | | | | | | | | |
Other Assets and Liabilities, Net | | | | | | | | | | | | | | | | | | | (0.1 | ) |
| | | | | | | | | | | | | | | | | | | | |
| | | | | | | | | | | | | | | | | | | 100.0 | |
| | | | | | | | | | | | | | | | | | | | |
| For | a description of the levels see note 2 in the Notes to Financial Statements. |
| There | were no significant transfers in and out of levels 1, 2 and 3 during the period ending March 31, 2012. |
See accompanying notes which are an integral part of the financial statements.
| | |
| Russell Small Cap High Dividend Yield ETF | | 23 |
Russell Exchange Traded Funds Trust
Russell Small Cap High Dividend Yield ETF
Statement of Assets and Liabilities — March 31, 2012
| | | | |
| Amounts in thousands | | Russell Small
Cap High
Dividend Yield
ETF | |
Assets | | | | |
Investments, at identified cost | | $ | 2,490 | |
Investments, at market* | | | 2,508 | |
Receivables: | | | | |
Dividends and interest | | | 4 | |
| | | | |
Total assets | | | 2,512 | |
| | | | |
| |
Liabilities | | | | |
Payables: | | | | |
Investments purchased | | | 6 | |
Accrued fees to affiliates | | | — | ** |
| | | | |
Total liabilities | | | 6 | |
| | | | |
| | | | |
Net Assets | | $ | 2,506 | |
| | | | |
Net Assets Consist of: | | | | |
Undistributed (overdistributed) net investment income | | $ | 10 | |
Unrealized appreciation (depreciation) on investments | | | 18 | |
Shares of beneficial interest | | | — | ** |
Additional paid-in capital | | | 2,478 | |
| | | | |
Net Assets | | $ | 2,506 | |
| | | | |
Net Asset Value, offering and redemption price per share: | | | | |
Net asset value per share:(a) | | $ | 25.06 | |
Net assets | | $ | 2,506,189 | |
Shares outstanding ($.001 par value) | | | 100,004 | |
Amounts in thousands | | | | |
| | | | |
* Investments in Affiliates, Russell U.S. Cash Management Fund | | $ | 12 | |
| (a) | Net asset value per share equals net assets divided by shares outstanding. |
See accompanying notes which are an integral part of the financial statements.
| | | | |
| | 24 | | | Statement of Assets and Liabilities |
Russell Exchange Traded Funds Trust
Russell Small Cap High Dividend Yield ETF
Statement of Operations — For the Period Ended March 31, 2012
| | | | |
| Amounts in thousands | | Russell Small
Cap High
Dividend Yield
ETF* | |
| | | | |
Investment Income | | | | |
Dividends | | $ | 10 | |
| | | | |
Total investment income | | | 10 | |
| | | | |
| |
Expenses | | | | |
Management fees | | | — | ** |
Trustee and trustee related fees | | | — | ** |
| | | | |
Expenses before reductions | | | — | ** |
Expense reductions | | | (— | )** |
| | | | |
Net expenses | | | — | ** |
| | | | |
Net investment income (loss) | | | 10 | |
| | | | |
| |
Net Realized and Unrealized Gain (Loss) | | | | |
Net change in unrealized appreciation (depreciation) on investments | | | 18 | |
| | | | |
Net realized and unrealized gain (loss) | | | 18 | |
| | | | |
Net Increase (Decrease) in Net Assets from Operations | | $ | 28 | |
| | | | |
| * | For the period March 15, 2012 (commencement of operations) to March 31, 2012. |
See accompanying notes which are an integral part of the financial statements.
| | |
| Statement of Operations | | 25 |
Russell Exchange Traded Funds Trust
Russell Small Cap High Dividend Yield ETF
Statement of Changes in Net Assets — For the Period Ended March 31,
| | | | |
| | | Russell Small Cap
High Dividend Yield
ETF | |
| | | | |
| Amounts in thousands | | 2012* | |
Increase (Decrease) in Net Assets | | | | |
| |
Operations | | | | |
Net investment income (loss) | | $ | 10 | |
Net change in unrealized appreciation (depreciation) | | | 18 | |
| | | | |
Net increase (decrease) in net assets from operations | | | 28 | |
| | | | |
| |
Share Transactions | | | | |
Net increase (decrease) in net assets from share transactions | | | 2,478 | |
| | | | |
Total Net Increase (Decrease) in Net Assets | | | 2,506 | |
| |
Net Assets | | | | |
Beginning of period | | | — | |
| | | | |
End of period | | $ | 2,506 | |
| | | | |
Undistributed (overdistributed) net investment income included in net assets | | $ | 10 | |
| * | For the period March 15, 2012 (commencement of operations) to March 31, 2012. |
See accompanying notes which are an integral part of the financial statements.
| | | | |
| | 26 | | | Statement of Changes in Net Assets |
(This page intentionally left blank)
Russell Exchange Traded Funds Trust
Russell Small Cap High Dividend Yield ETF
Financial Highlights — For the Period Ended
For a Share Outstanding Throughout Each Period.
| | | | | | | | | | | | | | | | |
| | |
$
Net Asset Value,
Beginning of
Period | | | $
Net
Investment
Income (Loss)(a) | | | $
Net Realized
and Unrealized
Gain (Loss) | | | $
Total from
Investment
Operations | |
Russell Small Cap High Dividend Yield ETF | | | | | | | | | | | | | | | | |
March 31, 2012* | | | 24.78 | | | | .11 | | | | .17 | | | | .28 | |
| (a) | Average daily shares outstanding were used for this calculation. |
| (b) | Periods less than one year are not annualized. |
| (c) | The ratios for periods less than one year are annualized. |
| (d) | Portfolio turnover rate excludes securities received or delivered from in-kind creation or redemption units. |
| * | For the period March 15, 2012 (commencement of operations) to March 31, 2012. |
See accompanying notes which are an integral part of the financial statements.
| | | | | | | | | | | | | | | | | | | | | | | | | | |
$
Net Asset Value,
End of
Period | | | %
Total
Return(b) | | | $
Net Assets,
End of Period
(000) | | | %
Ratio of Expenses
to Average
Net Assets,
Gross(c) | | | %
Ratio of Expenses
to Average
Net Assets,
Net(c) | | | %
Ratio of Net
Investment Income
to Average
Net Assets(c) | | | %
Portfolio
Turnover Rate(b)(d) | |
| | | | | | | | | | | | | | | | | | | | | | | | | | |
| | 25.06 | | | | 1.14 | | | | 2,506 | | | | .63 | | | | .38 | | | | 8.89 | | | | — | |
See accompanying notes which are an integral part of the financial statements.
Russell Exchange Traded Funds Trust
Russell High Dividend Yield ETFs™
Notes to Schedules of Investments — March 31, 2012
Footnotes:
| (Æ) | Nonincome-producing security. |
| (ö) | Real Estate Investment Trust (REIT). |
Abbreviations:
ADR - American Depositary Receipt
| | | | |
| | 30 | | | Notes to Schedules of Investments |
Russell Exchange Traded Funds Trust
Russell High Dividend Yield ETFs™
Notes to Financial Statements — March 31, 2012
Russell Exchange Traded Funds Trust (the “Investment Company” or “RET”) is a series investment company comprised of 26 different investment portfolios that were in operation as of March 31, 2012. These financial statements report on 2 of these Funds (each a “Fund” and collectively, the “Funds”). The Investment Company is registered under the Investment Company Act of 1940, as amended, as an open-end management investment company. It is organized and operates as a Delaware statutory trust.
Each Fund is an exchange-traded fund (“ETF”). ETFs are funds that trade like other publicly-traded securities and may be designed to track an index or to be actively managed. The investment objective of the Funds is to seek investment results that correspond generally to the price and yield performance, before fees and expenses, of its underlying index. The investment adviser uses a “passive” or index approach to try to achieve each Fund’s investment objective.
Unlike shares of a mutual fund, which can be bought from and redeemed by the issuing fund by all shareholders at a price based on net asset value (“NAV”), shares of a Fund may be directly purchased from and redeemed by a Fund at NAV solely by certain large institutional investors. Also unlike shares of a mutual fund, shares of each Fund are listed on a national securities exchange and trade in the secondary market at market prices that change throughout the day. The date the shares began trading on the secondary market is the “commencement of operations” date.
The Funds issue and redeem shares at their respective NAV only in blocks of a specified number of shares or multiples thereof (“Creation Units”). Only certain large institutional investors may purchase or redeem Creation Units directly with the Funds at NAV (“Authorized Participants”). These transactions are in exchange for certain securities similar to a Fund’s portfolio and/or cash. Except when aggregated in Creation Units, shares of a Fund are not redeemable securities. Shareholders who are not Authorized Participants may not redeem shares directly from a Fund.
| 2. | | Significant Accounting Policies |
The Funds’ financial statements are prepared in accordance with accounting principles generally accepted in the United States of America (“U.S. GAAP”) which require the use of management estimates and assumptions at the date of the financial statements. Actual results could differ from those estimates. The following is a summary of the significant accounting policies consistently followed by each Fund in the preparation of its financial statements.
Security Valuation
The Funds value portfolio securities according to Board-approved securities valuation procedures which include market and fair value procedures. The Board has delegated the responsibility for administration of the securities valuation procedures to Russell Funds Services Company (“RFSC”).
U.S. GAAP defines fair market value as the price that a Fund would receive to sell an asset or pay to transfer a liability in an orderly transaction between market participants at the measurement date. It establishes a fair value hierarchy that prioritizes inputs to valuation methods and requires a separate disclosure of the fair value hierarchy, for each major category of assets and liabilities, that segregates fair value measurements into levels (Level 1, 2, and 3). The inputs or methodology used for valuing securities are not necessarily an indication of the risk associated with investing in those securities. Levels 1, 2 and 3 of the fair value hierarchy are defined as follows:
| | • | | Level 1 — Quoted prices (unadjusted) in active markets or exchanges for identical assets and liabilities. |
| | • | | Level 2 — Significant other observable inputs, which may include, but are not limited to, quoted prices for similar assets or liabilities in markets that are active, quoted prices for identical or similar assets or liabilities in markets that are non-active, inputs other than quoted prices that are observable for the assets or liabilities (such as interest rates, yield curves, volatilities, prepayment speeds, loss severities, credit risks and default rates) or other market corroborated inputs. |
| | • | | Level 3 — Significant unobservable inputs based on the best information available in the circumstances, to the extent observable inputs are not available, which may include assumptions made by the Board of Trustees (the “Board”) or persons acting at their direction that are used in determining the fair market value of investments. |
The valuation techniques and significant inputs used in determining the fair market values of financial instruments classified as Level 1 and Level 2 of the fair value hierarchy are as follows:
Common stocks and exchange traded funds that are traded on a national securities exchange are stated at the last reported sale or settlement price on the day of valuation. To the extent these securities are actively traded and valuation adjustments are not applied, they are categorized as Level 1 of the fair value hierarchy.
| | |
| Notes to Financial Statements | | 31 |
Russell Exchange Traded Funds Trust
Russell High Dividend Yield ETFs™
Notes to Financial Statements, continued — March 31, 2012
Investments in other mutual funds (including unregistered collective vehicles) are valued at their net asset value per share, and are categorized as Level 2 of the fair value hierarchy.
Events or circumstances affecting the values of Fund securities that occur between the closing of the principal markets on which they trade and the time the NAV of Fund shares is determined may be reflected in the calculation of NAVs for each applicable Fund when the Funds deem that the particular event or circumstance would materially affect such Fund’s NAV. Funds that invest primarily in frequently traded exchange-listed securities will use fair value pricing in limited circumstances since reliable market quotations will generally be readily available. Funds that invest in foreign securities are likely to use fair value pricing more often since significant events may occur between the close of foreign markets and the time of pricing which would trigger fair value pricing of the foreign securities. Although there are observable inputs assigned on a security level, prices are derived from factors using proprietary models or matrix pricing. For this reason, significant events will cause movement between Levels 1 and 2. Examples of events that could trigger fair value pricing of one or more securities are: a company development; a natural disaster; or an armed conflict.
Preferred stock and other equities traded on inactive markets or valued by reference to similar instruments are also categorized as Level 2 of the fair value hierarchy.
Level 3 Trading Assets and Trading Liabilities, at Fair Value
The valuation techniques and significant inputs used in determining the fair values of financial instruments classified as Level 3 of the fair value hierarchy are as follows:
Securities and other assets for which market quotes are not readily available are valued at fair value as determined in good faith by the Board and are categorized as Level 3 of the fair value hierarchy. Market quotes are considered not readily available in circumstances where there is an absence of current or reliable market-based data (e.g., trade information or broker quotes). When RFSC applies fair valuation methods that use significant unobservable inputs to determine a Fund’s NAV, securities will not be priced on the basis of quotes from the primary market in which they are traded, but rather may be priced by another method that the Board or persons acting at their direction believe accurately reflects fair value and are categorized as Level 3 of the fair value hierarchy. Fair value pricing may require subjective determinations about the value of a security. While the securities valuation procedures are intended to result in a calculation of a Fund’s NAV that fairly reflects security values as of the time of pricing, the process cannot guarantee that fair values determined by the Board or persons acting at their direction would accurately reflect the price that a Fund could obtain for a security if it were to dispose of that security as of the time of pricing (for instance, in a forced or distressed sale). The prices used by a Fund may differ from the value that would be realized if the securities were sold.
For fair valuations using significant unobservable inputs, U.S. GAAP requires a reconciliation of the beginning to ending balances for reported market values that presents changes attributable to total realized and unrealized gains or losses, purchases and sales, and transfers in/out of the Level 3 category during the period. In accordance with the requirements of U.S. GAAP, a fair value hierarchy and Level 3 reconciliation, if any, have been included in the Notes to the Schedule of Investments for each respective Fund, if considered material.
In 2011, the Financial Accounting Standards Board (“FASB”) issued an update to requirements relating to fair valuation measurements which represent amendments to achieve common fair value measurements and disclosure requirements in U.S. GAAP and International Financial Reporting Standards. The amendments are of two types: (i) those that clarify the FASB’s intent about the application of existing fair value measurements and disclosure requirements and (ii) those that change a particular
principle or requirement for measuring fair value or for disclosing information about fair value measurements.
The amendments that change a particular principle or requirement for measuring fair value or disclosing information about fair value measurements relate to (i) measuring the fair value of the financial instruments that are managed within a portfolio; (ii) application of premium and discount in a fair value measurement; and (iii) additional disclosures about fair value measurements. The update is effective for annual periods beginning after December 15, 2011. Management does not believe the adoption of this update will have a material impact on the Funds’ financial statements.
Investment Transactions
Investment transactions are reflected as of the trade date for financial reporting purposes. This may cause the NAV stated in the financial statements to be different from the NAV at which shareholders may transact. Realized gains and losses from securities transactions, if any, are recorded on the basis of specific identified cost.
Investment Income
Dividend income is recorded net of applicable withholding taxes on the ex-dividend date.
| | | | |
| | 32 | | | Notes to Financial Statements |
Russell Exchange Traded Funds Trust
Russell High Dividend Yield ETFs™
Notes to Financial Statements, continued — March 31, 2012
Federal Income Taxes
Since the Investment Company is a Delaware statutory trust, each Fund is a separate corporate taxpayer and determines its net investment income and capital gains (or losses) and the amounts to be distributed to each Fund’s shareholders without regard to the income and capital gains (or losses) of the other Funds.
Each Fund qualifies as a regulated investment company under sub-chapter M of the Internal Revenue Code and intends to distribute all of its taxable income and capital gains. Therefore, no federal income tax provision is required for the Funds.
The Funds comply with the authoritative guidance for uncertainty in income taxes which requires management to determine whether a tax position of the Funds is more likely than not to be sustained upon examination, including resolution of any related appeals or litigation processes, based on the technical merits of the position. For tax positions meeting the more likely than not threshold, the tax amount recognized in the financial statements is reduced by the largest benefit that has a greater than 50% likelihood of being realized upon ultimate settlement with the relevant taxing authority. Management determined that no accruals need to be made in the financial statements due to uncertain tax positions. Management continually reviews and adjusts its liability for income taxes based on analyses of tax laws and regulations, as well as their interpretations, and other relevant factors.
Dividends and Distributions to Shareholders
For all Funds, income dividends, capital gain distributions and return of capital, if any, are recorded on the ex-dividend date. Income dividends are generally declared and paid quarterly. Capital gain distributions are generally declared and paid annually. An additional distribution may be paid by the Funds to avoid imposition of federal income and excise tax on any remaining undistributed capital gains and net investment income. Dividends and distributions cannot be automatically reinvested in additional shares of the Funds.
The timing and characterization of certain income and capital gain distributions are determined in accordance with federal tax regulations which may differ from U.S. GAAP. As a result, net investment income and net realized gain (or loss) from investment transactions for a reporting period may differ significantly from distributions during such period. The differences between tax regulations and U.S. GAAP relate primarily to wash sale deferrals and certain securities sold at a loss. Accordingly, the Funds may periodically make reclassifications among certain of their capital accounts without impacting their net asset values.
Guarantees
In the normal course of business, the Funds enter into contracts that contain a variety of representations which provide general indemnifications. The Funds’ maximum exposure under these arrangements is unknown as this would involve future claims that may be made against the Funds that have not yet occurred. However, the Funds expect the risk of loss to be remote.
Market, Credit and Counterparty Risk
In the normal course of business, the Funds trade financial instruments and enter into financial transactions where risk of potential loss exists due to changes in the market (market risk) or failure of the other party to a transaction to perform (credit risk). Similar to the credit risk, the Funds may also be exposed to counterparty risk or risk that an institution or other entity with which the Funds have unsettled or open transactions will default. The potential loss could exceed the value of the relevant assets recorded in the Funds’ financial statements (the “Assets”). The Assets, which potentially expose the Funds to credit risk, consist principally of cash due from counterparties and investments. The extent of the Funds’ exposure to credit and counterparty risks with respect to the Assets approximates their carrying value as recorded in the Funds’ Statements of Assets and Liabilities.
ETF Specific Risk
The Funds are managed with a passive investment strategy, attempting to track the performance of an unmanaged index of securities. This differs from an actively managed fund, which typically seeks to outperform a benchmark index. As a result, the Funds may hold constituent securities of the Index regardless of the current or projected performance of a specific security or a particular industry, market sector, country or currency. Maintaining investments in securities regardless of market conditions or the performance of individual securities could cause the Funds’ return to be lower or higher than if the Fund employed an active strategy.
The Funds’ return may not match or achieve a high degree of correlation with the return of the Index due to security mismatches, operating expenses, transaction costs, cash flows and operational inefficiencies.
| | |
| Notes to Financial Statements | | 33 |
Russell Exchange Traded Funds Trust
Russell High Dividend Yield ETFs™
Notes to Financial Statements, continued — March 31, 2012
| 3. | | Investment Transactions |
Securities
During the period ended March 31, 2012, purchases and sales of the Funds (excluding investments held for short-term purposes and in-kind transactions) were as follows:
| | | | | | | | |
| | | Purchases | | | Sales | |
| | | | | | | | |
Russell Small Cap High Dividend Yield ETF | | $ | 5,680 | | | $ | — | |
For the period ended March 31, 2012, the Funds’ purchases and sales resulting from in-kind redemptions were as follows:
| | | | | | | | |
| | | Purchases | | | Sales | |
| | | | | | | | |
Russell High Dividend Yield ETF | | $ | 4,952,521 | | | $ | — | |
Russell Small Cap High Dividend Yield ETF | | | 2,472,357 | | | | — | |
| 4. | | Related Party Transactions, Fees and Expenses |
Russell Investment Management Company (“RIMCo”) advises the Funds and RFSC is the Funds’ administrator. RFSC is a wholly-owned subsidiary of RIMCo. RIMCo is a wholly-owned subsidiary of Frank Russell Company (a subsidiary of The Northwestern Mutual Life Insurance Company). Frank Russell Company provides ongoing money manager research and trade placement services to RET and RIMCo.
The Funds may also invest their cash reserves (the “Cash Balances”) in the Russell U.S. Cash Management Fund, an unregistered fund advised by RIMCo and administered by RFSC. As of March 31, 2012, the Funds have invested $22,874 in the Russell U.S. Cash Management Fund.
The management fees specified in the table below are based upon the average daily net assets of the Funds and are payable monthly. The Adviser pays all of the expenses of the Funds other than the management fee, distribution fees pursuant to the Funds’ Supervision and Management Agreements, if any, brokerage expenses, taxes, interest fees, litigation expenses, acquired fund fees and other extraordinary expenses.
| | |
| | | Annual Rate |
| | |
Russell High Dividend Yield ETF | | 0.33% |
Russell Small Cap High Dividend Yield ETF | | 0.38% |
The following shows the respective totals for management fees for the period ended March 31, 2012:
| | | | |
| | | Management | |
| | | | |
Russell High Dividend Yield ETF | | $ | 581 | |
Russell Small Cap High Dividend Yield ETF | | | 440 | |
Waivers and Reimbursements
The Adviser has voluntarily agreed to waive trustee and trustee related expenses paid by the Funds. For the period ended March 31, 2012, the total trustee and trustee related fees waived amounted to:
| | | | |
| | | Trustee | |
| | | | |
Russell High Dividend Yield ETF | | $ | 464 | |
Russell Small Cap High Dividend Yield ETF | | | 294 | |
Accrued Fees Payable to Affiliate
Accrued fees payable to affiliate for the period ended March 31, 2012 were as follows:
| | | | | | | | |
| | | Russell High
Dividend
Yield ETF | | | Russell Small Cap High
Dividend
Yield ETF | |
| | | | | | | | |
Management fees | | $ | 581 | | | $ | 440 | |
Board of Trustees
For all Funds of the Investment Company, each independent Trustee is paid a retainer of $70,000 per year, $5,000 for each regular quarterly meeting attended in person, and $2,500 for each Audit Committee meeting and Nominating and Governance Committee meeting. Each Trustee receives a $1,250 fee for attending the quarterly meeting by phone instead of receiving the full fee had the member attended in person. The Trustees are also compensated for out of pocket expenses. The Audit Committee
| | | | |
| | 34 | | | Notes to Financial Statements |
Russell Exchange Traded Funds Trust
Russell High Dividend Yield ETFs™
Notes to Financial Statements, continued — March 31, 2012
Chair and Nominating and Governance Chair are each paid a fee of $12,000 and $6,000, respectively, per year. The Chairman of the Board receives additional annual compensation of $20,000.
At March 31, 2012, the Funds did not have a net tax basis capital loss carryforwards which may be applied against any net realized taxable gains in each succeeding year or until their respective expiration dates, whichever occurs first.
At March 31, 2012, the cost of investments and net unrealized appreciation (depreciation) for income tax purposes were as follows:
| | | | | | | | |
| | | Russell High
Dividend Yield
ETF | | | Russell Small
Cap High
Dividend Yield
ETF | |
| | | | | | | | |
Cost of Investments | | $ | 4,963,373 | | | $ | 2,490,059 | |
| | | | | | | | |
Unrealized Appreciation | | $ | 41,552 | | | $ | 38,933 | |
Unrealized Depreciation | | | (29,031 | ) | | | (21,015 | ) |
| | | | | | | | |
Net Unrealized Appreciation (Depreciation) | | $ | 12,521 | | | $ | 17,918 | |
| | | | | | | | |
Undistributed Ordinary Income | | $ | 1,890 | | | $ | 9,817 | |
Undistributed Long-Term Capital Gains (Capital Loss Carryforward) | | $ | — | | | $ | — | |
Tax Composition of Distributions | | | | | | | | |
Ordinary Income | | $ | — | | | $ | — | |
Tax-Exempt Income | | $ | — | | | $ | — | |
Long-Term Capital Gains | | $ | — | | | $ | — | |
Distributions in Excess | | $ | — | | | $ | — | |
Tax Return of Capital | | $ | — | | | $ | — | |
| 6. | | Fund Share Transactions (amounts in thousands) |
As of March 31, 2012, there were an unlimited number of $0.001 par value shares of beneficial interest authorized by the Investment Company. Shares are created and redeemed by the Funds at their NAV only in Creation Units or multiples thereof. Except when aggregated in Creation Units, shares of the Funds are not redeemable. The Shares are listed on the New York Stock Exchange Arca (“NYSE Arca” or the “Exchange”), subject to notice of issuance. The Shares trade on the Exchange at market prices. These prices may differ from the Shares’ NAV. The Shares are also redeemable only in Creation Unit aggregations, and generally in exchange for portfolio securities and a specified cash payment. Investors purchasing and redeeming Creation Units pay a purchase transaction fee and a redemption transaction fee directly to State Street Bank and Trust Company, the Funds’ Custodian. A Creation Unit of a Fund consists of at least 50,000 Shares. Transactions in shares for the Funds for the period ended March 31, 2012 were as follows:
| | | | | | | | |
| | | 2012* | |
| | | Shares | | | Dollars | |
| | | | | | | | |
Russell High Dividend Yield ETF | | | | | | | | |
Shares created | | | 200 | | | $ | 4,963 | |
Shares redeemed | | | — | | | | — | |
| | | | | | | | |
Total increase (decrease) | | | 200 | | | $ | 4,963 | |
| | | | | | | | |
| |
| | | 2012* | |
| | | Shares | | | Dollars | |
Russell Small Cap High Dividend Yield ETF | | | | | | | | |
Shares created | | | 100 | | | $ | 2,478 | |
Shares redeemed | | | — | | | | — | |
| | | | | | | | |
Total increase (decrease) | | | 100 | | | $ | 2,478 | |
| | | | | | | | |
| * | For the period March 15, 2012 (commencement of operations) to March 31, 2012. |
Management has evaluated events and/or transactions that have occurred since March 31, 2012, through the date the financial statements were issued, that would merit recognition or disclosure in the financial statements. During this review nothing was discovered which would require further disclosure within the financial statements.
| | |
| Notes to Financial Statements | | 35 |
Report of Independent Registered Public Accounting Firm
To the Board of Trustees and Shareholders:
In our opinion, the accompanying statements of assets and liabilities, including the schedule of investments, and the related statements of operations and of changes in net assets and the financial highlights present fairly, in all material respects, the financial position of Russell High Dividend Yield ETF and Russell Small Cap High Dividend Yield ETF (two of the portfolios constituting the Russell Exchange Traded Funds Trust, hereafter referred to as the “Funds”) at March 31, 2012, the results of each of their operations, the changes in each of their net assets and the financial highlights for each of the periods indicated, in conformity with accounting principles generally accepted in the United States of America. These financial statements and financial highlights (hereafter referred to as “financial statements”) are the responsibility of the Fund’s management; our responsibility is to express an opinion on these financial statements based on our audits. We conducted our audits of these financial statements in accordance with the standards of the Public Company Accounting Oversight Board (United States). Those standards require that we plan and perform the audit to obtain reasonable assurance about whether the financial statements are free of material misstatement. An audit includes examining, on a test basis, evidence supporting the amounts and disclosures in the financial statements, assessing the accounting principles used and significant estimates made by management, and evaluating the overall financial statement presentation. We believe that our audits, which included confirmation of securities at March 31, 2012 by correspondence with the custodian and brokers or by other appropriate auditing procedures where replies from brokers were not received, provide a reasonable basis for our opinion.

PricewaterhouseCoopers LLP
Seattle, Washington
May 29, 2012
| | | | |
| | 36 | | | Report of Independent Registered Public Accounting Firm |
Russell Exchange Traded Funds Trust
Russell High Dividend Yield ETFs™
Frequency Distribution of Discounts and Premiums (Unaudited)
The chart below presents information about differences between the per share NAV of the Funds and the market trading price of shares of the Funds. For these purposes, the “market price” is the mid-point of the highest bid and lowest offer for Fund shares as of the close of trading on the exchange where Fund shares are listed. The term “premium” is sometimes used to describe a market price in excess of NAV and the term “discount” is sometimes used to describe a market price below NAV. The chart presents information about the size and frequency of premiums or discounts. As with other exchange traded funds, the market price of Fund shares is typically slightly higher or lower than the Fund’s per share NAV. Factors that contribute to the differences between market price and NAV include the supply and demand for Fund shares and investors’ assessments of the underlying value of a Fund’s portfolio securities.
| | | | | | | | | | | | | | | | |
| | | Russell High Dividend Yield ETF | | | Russell Small Cap High
Dividend Yield ETF | |
| Premium/Discount Range | | Number of
Days* | | | Percentage of
Total Days | | | Number of
Days* | | | Percentage of
Total Days | |
| | | | | | | | | | | | | | | | |
Greater than 0.20% and Less than 1.00% | | | 1 | | | | 5.56 | % | | | 0 | | | | 0.00 | % |
Greater than 0.05% and Less than 0.20% | | | 9 | | | | 50.00 | % | | | 15 | | | | 83.33 | % |
Between 0.05% and -0.05% | | | 8 | | | | 44.44 | % | | | 3 | | | | 16.67 | % |
Greater than -0.05% and Less than -0.20% | | | 0 | | | | 0.00 | % | | | 0 | | | | 0.00 | % |
Greater than -0.20% and less than -1.00% | | | 0 | | | | 0.00 | % | | | 0 | | | | 0.00 | % |
| | | | | | | | | | | | | | | | |
| | | 18 | | | | 100.00 | % | | | 18 | | | | 100.00 | % |
| | | | | | | | | | | | | | | | |
| * | Number of days are based on inception date which is one day prior to commencement of operations. |
| | |
| Frequency Distribution of Discounts and Premiums | | 37 |
Russell Exchange Traded Funds Trust
Russell High Dividend Yield ETFs™
Tax Information — March 31, 2012 (Unaudited)
For the tax year ended March 31, 2012, the Funds hereby designate 100% or the maximum amount allowable, of its net taxable income as qualified dividends taxed at individual net capital gain rates.
For the tax year ended March 31, 2012, the Funds hereby designate under Section 871(k)(2)(c) of the Code, the maximum amount allowable as a short term capital gain dividend for purposes of the tax imposed under Section 871(a)(1)(A) of the Code. This applies to nonresident alien shareholders only.
The Form 1099 you receive in January 2013 will show the tax status of all distributions paid to your account in calendar year 2012.
The Funds designate dividends distributed during the fiscal year as qualifying for the dividends received deduction for corporate shareholders as follows:
| | | | |
Russell High Dividend Yield ETF | | | 0.0 | % |
Russell Small Cap High Dividend Yield ETF | | | 0.0 | % |
Please consult a tax adviser for any questions about federal or state income tax laws.
Russell Exchange Traded Funds Trust
Russell High Dividend Yield ETFs™
Shareholder Requests for Additional Information — March 31, 2012 (Unaudited)
A complete unaudited schedule of investments is made available generally no later than 60 days after the end of the first and third quarters of each year. These reports are available (i) free of charge, upon request, by calling the Funds at (888) 775-7837, (ii) on the Securities and Exchange Commission’s website at www.sec.gov, and (iii) at the Securities and Exchange Commission’s public reference room.
The Board has delegated to RIMCo, as RET’s investment adviser, the primary responsibility for monitoring, evaluating and voting proxies solicited by or with respect to issuers of securities in which assets of the Funds may be invested. RIMCo has established a proxy voting committee (“Committee”) and has adopted written proxy voting policies and procedures (“P&P”) and proxy voting guidelines (“Guidelines”). The Funds maintain a Portfolio Holdings Disclosure Policy that governs the timing and circumstances of disclosure to shareholders and third parties of information regarding the portfolio investments held by the Funds. A description of the P&P, Guidelines, Portfolio Holdings Disclosure Policy and additional information about Fund Trustees are contained in the Funds’ Statement of Additional Information (“SAI”). The SAI is available (i) free of charge, upon request, by calling the Funds at (888) 775-3837, (ii) at www.russelletfs.com, and (iii) on the Securities and Exchange Commission’s website at www.sec.gov.
To reduce expenses, we may mail only one copy of the Funds’ prospectus and each annual and semi-annual report to those addresses shared by two or more accounts. If you wish to receive individual copies of these documents, please contact your financial institution.
Some Financial Intermediaries may offer electronic delivery of the Funds’ prospectus and annual and semi-annual reports. Please contact your Financial Intermediary for further details.
| | |
| Shareholder Requests for Additional Information | | 39 |
Russell Investment Company
Russell Funds
Basis for Approval of Investment Advisory Contracts — (Unaudited)
The Board of Trustees, including all of the Independent Trustees, considered and approved the adoption of the management agreement with RIMCo (the “RIMCo Agreement”) with respect to Russell High Dividend Yield ETF and Russell Small Cap High Dividend Yield ETF (the “Funds”) at a meeting held in person on December 9, 2011 (the “Agreement Evaluation Meeting”). In preparation for the Agreement Evaluation Meeting, the Independent Trustees, with the advice and assistance of their counsel, requested and the Board considered (1) information, reports and analyses prepared by RIMCo relating to the services provided by RIMCo (and its affiliates) to the Funds at this and prior meetings; and (2) information (the “Comparative Information”) received from RIMCo comparing the operating expenses of each of the Funds with other peer funds not managed by RIMCo within a subset of dividend yield ETFs chosen by RIMCo using industry information provided by Morningstar, an independent third party. In the case of each Fund its other peer funds are collectively hereinafter referred to as the Fund’s “Comparable Funds,” and, with the Fund, such Comparable Funds are collectively hereinafter referred to as the Fund’s “Expense Universe.” The foregoing information provided by RIMCo is collectively called the “Agreement Evaluation Information.” In connection with their consideration of the RIMCo Agreement, the Trustees had previously received and reviewed a memorandum from counsel to the Funds discussing the legal standards for their consideration of the adoption of the RIMCo Agreement.
At the Agreement Evaluation Meeting, the Board, including the Independent Trustees, reviewed the proposed approval of the RIMCo Agreement with management and counsel to the Funds. Presentations made by RIMCo to the Board as part of this review encompassed the Funds. The discussion below reflects these reviews.
The Board considered that RIMCo is responsible under the RIMCo Agreement for determining, implementing and maintaining the investment program for each Fund. Assets are managed directly by RIMCo pursuant to authority provided by the RIMCo Agreement. RIMCo is responsible for investing the assets of each Fund in accordance with such Fund’s investment objective and policies.
The Board considered that each Fund is passively managed, which means that the investment objective of each Fund is to seek investment results that closely correspond to the total return of such Fund’s corresponding index (each, an “Underlying Index”).
In addition to these general factors relating to the Funds, the Trustees considered, with respect to each Fund, various specific factors in evaluating the adoption of the RIMCo Agreement, including the following:
| 1. | The nature, scope and overall quality of the investment management and other services provided, and expected to be provided, to the Fund by RIMCo; |
| 2. | The management fee to be paid by the Fund to RIMCo (the “Management Fee”) and the fact that it encompasses fees paid by the Fund for other services provided by RIMCo, its affiliates and other parties to the Fund, including services provided under the Supervision and Operational, Administrative, Fund Accounting, Master Custodian, Transfer Agency and Service, and Distribution Agreements; |
| 3. | Information provided by RIMCo as to other fees and benefits received by RIMCo or its affiliates from the Fund, including soft dollar arrangements and commissions in connection with portfolio securities transactions; |
| 4. | Information provided by RIMCo as to expenses to be incurred by the Fund; and |
| 5. | Information provided by RIMCo at prior meetings as to the profits that RIMCo expects to derive from the Fund’s operations. |
In evaluating the nature, scope and overall quality of the investment management and other services provided and which are expected to be provided to the Funds, including Fund portfolio management services, the Board considered that RIMCo’s investment management functions would consist of two primary roles: managing each Fund’s portfolio and producing the daily creation and redemption baskets.
With respect to managing the Funds’ portfolios, RIMCo reported, and the Board considered, that to meet the investment objective of each Fund, RIMCo intends to employ a full replication strategy. In this strategy, a Fund generally invests in all of the stocks comprising its Underlying Index. However, under various circumstances, it may not be possible or practicable to purchase all of those stocks in the same weighting as the Underlying Index. In those circumstances, a Fund may purchase a sample of stocks in the Underlying Index. RIMCo reported, and the Board considered, that there may also be instances in which RIMCo may choose to overweight another stock in the Underlying Index, purchase securities not in the Underlying Index which RIMCo believes are appropriate to substitute for certain securities in the Underlying Index or utilize various combinations of other available investment techniques.
With respect to producing the daily creation and redemption baskets, RIMCo reported, and the Board considered, that RIMCo will instruct the Funds’ custodian as to the basket of securities for each Fund’s creation and redemption file. RIMCo will review the creation and redemption files that are published to the exchange by the custodian on a daily basis for reasonableness and accuracy.
| | | | |
| | 40 | | | Basis for Approval of Investment Advisory Contracts |
Russell Investment Company
Russell Funds
Basis for Approval of Investment Advisory Contracts, continued — (Unaudited)
RIMCo also reported, and the Board considered, that on an ongoing basis, RIMCo will provide rebalancing, trade execution and account reconciliation services for the Funds.
RIMCo reported, and the Board considered, that at the time of the Agreement Evaluation Meeting, the Funds had not yet commenced operations and, therefore, no performance data was available for the Funds.
With respect to the Management Fee for each of Russell High Dividend Yield ETF and Russell Small Cap High Dividend Yield ETF, the Comparative Information showed that the Management Fee for each Fund was ranked in the second quintile of its Expense Universe. RIMCo reported, and the Board considered, that RIMCo believes these Funds track indexes that are representative of the analysis done by active managers and therefore merit fees that are higher than those of the more traditional passively managed ETFs contained in the Funds’ Expense Universe. The comparisons were based upon the latest fiscal years for the Expense Universe Funds.
The Board considered for each Fund whether economies of scale would be realized and whether the Management Fees for such Fund appropriately reflect or should be revised to reflect any such economies. The Board considered that RIMCo does not expect that economies of scale will be experienced in the near-term and that RIMCo expects to initially operate the Funds at a loss.
On the basis of the Agreement Evaluation Information, other information presented at or in connection with the Agreement Evaluation Meeting by RIMCo and information provided at prior meetings, the Board, in respect of each Fund, determined, after giving effect to any applicable waivers and/or reimbursements and considering differences in the composition and investment strategies of their respective Comparable Funds (1) the Management Fee charged by RIMCo was reasonable in light of the nature, scope and overall quality of the investment management and other services provided, and expected to be provided, to the Funds; (2) the relative expense ratio of each Fund was comparable to those of its Comparable Funds; (3) other benefits and fees received by RIMCo or its affiliates from the Funds were not excessive; and (4) RIMCo’s anticipated profitability with respect to the Funds was not excessive in light of the nature, scope and overall quality of the investment management and other services provided by RIMCo.
In their deliberations, the Trustees did not identify any particular information as to the RIMCo Agreement that was all-important or controlling, and each Trustee attributed different weights to the various factors considered. The Trustees evaluated all information available to them on a Fund-by-Fund basis and their determinations were made in respect of each Fund.
| | |
| Basis for Approval of Investment Advisory Contracts | | 41 |
Russell Exchange Traded Funds Trust
Russell High Dividend Yield ETFs™
Disclosure of Information about Fund Trustees and Officers — March 31, 2012 (Unaudited)
The Trustees and executive officers of the Trust, along with their principal occupations over the past five years and their affiliations, if any with the Adviser, are listed below. Unless otherwise noted, the principal business address of each Trustee and executive officer of the Trust is 1301 Second Avenue, 18th Floor, Seattle, Washington 98101.
| | | | | | | | | | | | |
Name, Address,
and Date of Birth | | Position(s) Held
with the Fund | | Term of Office
and Length of
Time Served | | Principal Occupation(s)
During Past 5 Years | | Number of
Portfolios in
Fund
Complex
Overseen
by Trustee | | | Other
Directorships Held
by Trustee |
INTERESTED TRUSTEES | | | | | | | | |
James Polisson* Born: November 11, 1959 | | Trustee | | Since 2011 | | Managing Director and Head of Global ETF Business, Frank Russell Company (2010 to present); and Chief Marketing Officer, Barclays Global Investors/iShares ETFs (2005 to 2010). | | | 26 | | | None. |
INDEPENDENT TRUSTEES |
Evelyn S. Dilsaver Born: May 4, 1955 | | Trustee, Chair since 2012 | | Since 2011 | | Corporate Director, Charles Schwab Investment Management (2003 to 2007); and President and Chief Executive Officer, Charles Schwab Investment Management (2004 to 2007). | | | 26 | | | Aeropostale, Inc. (retailer) (2008 to present); High Mark Funds (2008 to present); and Tempur-pedic, Int’l. (retailer) (2010 to present). |
| | | | | | | | | | | | | |
Jane A. Freeman Born: July 15, 1953 | | Trustee, Chair of Audit Committee since 2011 | | Since 2011 | | Consultant (2008 to present); and Executive Vice President and Chief Financial Officer, Scientific Learning (Educational Support Services) (1999 to 2008). | | | 26 | | | Harding Loevner Funds (Lead Director since 2008). |
| | | | | | | | | | | | | |
Lee T. Kranefuss** Born: September 27, 1961 | | Trustee | | Since 2011 | | Non-Executive Chairman, iShares (since 2009); Global Chief Executive Officer, iShares/Intermediary Groups of Barclays Global Investors (“BGI”) (2008 to 2009); Chief Executive Officer, iShares Intermediary Index and Market Group of BGI (2005 to 2008); Director of Barclays Global Fund Advisors (since 2005); Director, President and Chief Executive Officer of Barclays Global Investors International, Inc. (since 2005); and Director and Chairman of Barclays Global Investors Services (since 2005). | | | 26 | | | Barclays Global Investors Funds and Master Investment Portfolio (2001 to present). |
| | | | | | | | | | | | | |
Daniel O. Leemon Born: October 25, 1953 | | Trustee | | Since 2011 | | Retired. | | | 26 | | | Director, Corporate Executive Board (2003 to present). |
| | | | | | | | | | | | | |
Ernest L. Schmider Born: July 4, 1957 | | Trustee, Chairman of Nominating and Governance Committee since 2012 | | Since 2011 | | Adjunct Professor, Argyros School of Business and Economics, Chapman University, (Spring and Fall, 2010); Managing Director, Pacific Investment Management Company (PIMCO), President, PIMCO Funds (held various positions with PIMCO from 1994 to 2009). | | | 26 | | | None. |
| | | | |
| | 42 | | | Disclosure of Information about Fund Trustees and Officers |
Russell Exchange Traded Funds Trust
Russell High Dividend Yield ETFs™
Disclosure of Information about Fund Trustees and Officers, continued — March 31, 2012 (Unaudited)
| | | | | | | | |
| | | Position(s) Held
with the Fund | | Term of Office
and Length of
Time Served | | Principal Occupation(s)
During Past 5 Years | | Other
Directorships Held
by Trustee |
OFFICERS | | | | | | | | |
James Polisson* Born: November 11, 1959 | | President and Chief Executive Officer | | Since 2011; until successor is chosen and qualified by Trustees | | Managing Director and Head of Global ETF Business, FRC; Chief Marketing Officer, Barclays Global Investors/ iShares ETFs, 2005–2010 | | N/A |
| | | | | | | | | |
Mark E. Swanson Born: November 26, 1963 | | Treasurer, Chief Financial Officer and Chief Accounting Officer | | Since 2011; until successor is chosen and qualified by Trustees | | Treasurer, Chief Accounting Officer and CFO, Russell Investment Company and Russell Investment Funds; Director, Funds Administration, RIMCo, Russell Fund Services Company, Russell Trust Company (a non-depository trust company), and Russell Financial Services, Inc.; and Treasurer and Principal Accounting Officer, SSgA Funds | | N/A |
| | | | | | | | | |
Mary Beth Rhoden Born: April 25, 1969 | | Secretary and Chief Legal Officer | | Since 2011; until successor is chosen and qualified by Trustees | | Associate General Counsel, FRC; Assistant Secretary, Russell Investment Company and Russell Investment Funds, 1999–2010; Secretary, RIMCo, Russell Fund Services Company and Russell Financial Services, Inc.; and Secretary and Chief Legal Officer, Russell Investment Company and Russell Investment Funds | | N/A |
| | | | | | | | | |
Cheryl Wichers Born December 16, 1966 | | Chief Compliance Officer since 2005 | | Until removed by Independent Trustees | | Chief Compliance Officer, RIC; Chief Compliance Officer, RIF; Chief Compliance Officer, RIMCo; Chief Compliance Officer, RFSC; Chief Compliance Officer, Russell Exchange Traded Funds Trust April 2002-May 2005, Manager, Global Regulatory Policy | | N/A |
| * | Mr. Polisson is also an officer and/or director of one or more affiliates of RET and is therefore an Interested Trustee. |
| ** | Ceased to be a Trustee effective April 25, 2012. |
| | |
| Disclosure of Information about Fund Trustees and Officers | | 43 |
Russell Exchange Traded Funds Trust
Russell High Dividend Yield ETFs™
1301 Second Avenue, Seattle, Washington 98101
(888) 775-3837
Interested Trustee
James Polisson*
Independent Trustees
Evelyn S. Dilsaver
Jane A. Freeman
Lee T. Kranefuss**
Daniel O. Leemon
Ernest L. Schmider
Officers
James Polisson, President and Chief Executive Officer
Mark E. Swanson, Treasurer, Chief Financial Officer and Chief Accounting Officer
Mary Beth Rhoden, Secretary and Chief Legal Officer
Cheryl Wichers, Chief Compliance Officer
Adviser
Russell Investment Management Company
1301 Second Avenue
Seattle, Washington 98101
Administrator
Russell Fund Services Company
1301 Second Avenue
Seattle, Washington 98101
Transfer and Dividend Disbursing Agent
State Street Bank and Trust Company
One Lincoln Street
Boston, MA 02111
Custodian
State Street Bank and Trust Company
Josiah Quincy Building
200 Newport Avenue
North Quincy, MA 02171
Office of Shareholder Inquiries
1301 Second Avenue
Seattle, Washington 98101
(888) 775-3837
Distributor
ALPS Distributors, Inc.
1290 Broadway, Suite 1100
Denver, CO 80203
Independent Registered Public Accounting Firm
PricewaterhouseCoopers LLP
1420 Fifth Avenue, Suite 1900
Seattle, WA 98101
| * | Mr. Polisson is also an officer and/or director of one or more affiliates of RET and is therefore an Interested Trustee. |
| ** | Ceased to be a Trustee effective April 25, 2012. |
This report is prepared from the books and records of the Funds and is submitted for the general information of shareholders and is not authorized for distribution to prospective investors unless accompanied or preceded by an effective Prospectus. Nothing herein contained is to be considered an offer of sale or a solicitation of an offer to buy shares of Russell Exchange Traded Funds Trust. Such offering is made only by Prospectus, which includes details as to offering price and other material information.
| | | | |
| | 44 | | | Adviser and Service Providers |
| | | | |
| Russell Exchange Traded Funds Trust | | 1301 Second Avenue | | 888-775-3837 |
| | Seattle, Washington 98101 | | www.russelletfs.com |

Item 2. Code of Ethics. [Annual Report Only]
| (a) | As of the end of the period covered by the report, the registrant has adopted a code of ethics that applies to the registrant’s principal executive officer and principal financial officer (“Code”). |
| (b) | That Code comprises written standards that are reasonably designed to deter wrongdoing and to promote: |
| | 1) | honest and ethical conduct, including the ethical handling of actual or apparent conflicts of interest between personal and professional relationships; |
| | 2) | full, fair, accurate, timely and understandable disclosure in reports and documents that a registrant files with, or submits to, the Securities and Exchange Commission (“SEC”) and in other public communications made by each Mutual Fund; |
| | 3) | compliance with applicable laws and governmental rules and regulations; |
| | 4) | the prompt internal reporting to an appropriate person or persons identified in the Code of violations of the Code; and |
| | 5) | accountability for adherence to the Code. |
| (c) | The Code was restated as of December 6, 2004; the restatement did not involve any material change. |
| (d) | As of the end of the period covered by the report, there have been no waivers granted from a provision of the Code that applies to the registrant’s principal executive officer and principal financial officer. |
| (f) | The registrant has filed with the SEC, pursuant to Item 12(a)(1), a copy of the Code that applies to the registrant’s principal executive officer, principal financial officer, principal accounting officer or controller, or persons performing similar functions, as an exhibit to its annual report on this Form N-CSR. |
Item 3. Audit Committee Financial Expert. [Annual Report Only]
Registrant’s board of trustees has determined at a meeting held on December 9, 2011, that the Registrant has at least one audit committee financial expert serving on its audit committee. Jane Freeman was determined to be the Audit Committee Financial Expert and is also determined to be “independent” for purposes of Item 3, paragraph (a)(2)(i) and (ii) of Form N-CSR.
Item 4. Principal Accountant Fees and Services. [Annual Report Only]
The aggregate fees billed for each of the last two fiscal years for professional services rendered by the principal accountant for the audit of the registrant’s annual financial statements or services that are normally provided by the accountant in connection with statutory and regulatory filings or engagements for those fiscal years were as follows:
Audit-Related Fees
(b) The aggregate fees billed in each of the last two fiscal years for assurance and related services by the principal accountant that are reasonably related to the performance of the audit of the registrant’s financial statements and are not reported under paragraph (a) of this Item and the nature of the services comprising those fees were as follows:
| | | | |
| | | Fees | | Nature of Services |
| 2011 | | $0 | | Performance of the audit of the Trust’s financial statements |
| 2012 | | $0 | | Performance of the audit of the Trust’s financial statements |
Tax Fees
(c) The aggregate fees billed in each of the last two fiscal years for professional services rendered by the principal accountant for tax compliance, tax advice, and tax planning and the nature of the services comprising the fees were as follows:
| | | | |
| | | Fees | | Nature of Services |
| 2011 | | $0 | | Tax services |
| 2012 | | $43,110 | | Tax services |
All Other Fees
(d) The aggregate fees billed in each of the last two fiscal years for products and services provided by the principal accountant, other than the services reported in paragraphs (a) through (c) of this Item and the nature of the services comprising those fees were as follows:
| | | | |
| | | Fees | | Nature of Services |
| 2011 | | $0 | | Review excise reconciliations, transfer agent internal controls analysis, overhead/travel |
| 2012 | | $0 | | Review excise reconciliations, transfer agent internal controls analysis, overhead/travel |
(e) (1) Registrant’s audit committee has adopted the following pre-approval policies and procedures for certain services provided by Registrant’s accountants:
Russell Exchange Traded Fund Trust (“RET”)
Audit and Non-Audit Services Pre-Approval Policy
Effective Date: August 31, 2011
This Policy has been adopted by the Audit Committee (the “Audit Committee”) of Russell Exchange Traded Fund Trust (“RET”) to apply to any and all engagements of the independent auditor to RET for audit, non-audit, tax or other services. The term “Fund” shall collectively refer to RET. The term “Investment Adviser” shall refer to the Fund’s advisor, Russell Investment Management Company (“RIMCo”). This Policy does not delegate to management the responsibilities set forth herein for the pre-approval of services performed by the Fund’s independent auditor.
| II. | Statement of Principles. |
Under the Sarbanes-Oxley Act of 2002 (the “Act”), the Audit Committee of a Fund’s Board of Trustees (the “Audit Committee”) is charged with responsibility for the appointment, compensation and oversight of the work of the independent auditor for the fund. As part of these responsibilities, the Audit Committee is required to pre-approve the audit services and permissible non-audit services (“non-audit services”) performed by the independent auditor for the fund to assure that the independence of the auditor is not in any way compromised or impaired. In determining whether an auditor is independent, there are three guiding principles under the Act that must be considered. In general, the independence of the auditor to the fund would be deemed impaired if the auditor provides a service whereby it:
| | • | | Functions in the role of management of the fund, the adviser of the fund or any other affiliate* of the fund; |
| | • | | Is in the position of auditing its own work; or |
| | • | | Serves in an advocacy role for the fund, the adviser of the fund or any other affiliate of the fund. |
Accordingly, it is the Fund’s policy that the independent auditor for the Fund must not be engaged to perform any service that contravenes any of the three guidelines set forth above, or which in any way could be deemed to impair or compromise the independence of the auditor for the Fund. This Policy is designed to accomplish those requirements and will henceforth be applied to all engagements by the Fund of its independent auditor, whether for audit, audit-related, tax, or other non-audit services.
Rules adopted by the United States Securities and Exchange Commission (the “SEC”) establish two distinct approaches to the pre-approval of services by the Audit Committee. The proposed services either may receive general pre-approval through adoption by the Audit Committee of a list of authorized services for the fund, together with a budget of expected costs for those services (“general pre-approval”), or specific pre-approval by the Audit Committee of all services provided to the fund on a case-by-case basis (“specific pre-approval”).
* For purposes of this Policy, an affiliate of the Fund is defined as the Fund’s investment adviser (but not a sub-adviser whose role is primarily portfolio management and whose activities are overseen by the principal investment adviser), and any entity controlling, controlled by, or under common control with the investment adviser that provides ongoing services to the Fund.
The Fund’s Audit Committee believes that the combination of these two approaches reflected in this Policy will result in an effective and efficient procedure for the pre-approval of permissible services performed by the Fund’s independent audit. The Fund’s Audit and Non-Audit Pre-Approved Services Schedule lists the audit, audit-related, tax and other services that have the general pre-approval of the Audit Committee. As set forth in this Policy, unless a particular service has received general pre-approval, those services will require specific pre-approval by the Audit Committee before any such services can be provided by the independent auditor. Any proposed service to the Fund that exceeds the pre-approved budget for those services will also require specific pre-approval by the appropriate Audit Committee.
In assessing whether a particular audit or non-audit service should be approved, the Audit Committee will take into account the ratio between the total amounts paid for audit, audit-related, tax and other services, based on historical patterns, with a view toward assuring that the level of fees paid for non-audit services as they relate to the fees paid for audit services does not compromise or impair the independence of the auditor. The Audit Committee will review the list of general pre-approved services, including the pre-approved budget for those services, at least annually and more frequently if deemed appropriate by the Audit Committee, and may implement changes thereto from time to time.
As provided in the Act and in the SEC’s rules, the Audit Committee from time to time may delegate either general or specific pre-approval authority to one or more of its members. Any member to whom such authority is delegated must report, for informational purposes only, any pre-approval decisions to the Audit Committee at its next scheduled meeting.
The annual audit services engagement terms and fees for the independent auditor for the Fund require specific pre-approval of the Audit Committee. Audit services include the annual financial statement audit and other procedures required to be performed by the independent auditor in order to be able to form an opinion on the financial statements for the Fund for that year. These other procedures include reviews of information systems, procedural reviews and testing performed in order to understand and rely on the Fund’s systems of internal control, and consultations relating to the audit. Audit services also include the attestation engagement for the independent auditor’s report on the report from management on financial reporting internal controls. The Audit Committee will review the audit services engagement as necessary or appropriate in the sole judgment of the Audit Committee.
In addition to the pre-approval by the Audit Committee of the annual engagement of the independent auditor to perform audit services, the Audit Committee may grant general pre-approval to other audit services, which are those services that only the independent auditor reasonably can provide. These may include statutory audits and services associated with the Fund’s SEC registration statement on Form N-1A, periodic reports and documents filed with the SEC or other documents issued in connection with the Fund’s securities offerings.
The Audit Committee has pre-approved the audit services set forth in Schedule A of the Audit and Non-Audit Pre-Approved Services Schedule. All other audit services not listed in Schedule A of the Audit and Non-Audit Pre-Approved Services Schedule must be specifically pre-approved by the Audit Committee.
| V. | Audit-Related Services. |
Audit-related services are assurance and related services that are reasonably related to the performance of the audit or review of the financial statements for the Fund, or the separate financial statements for a series of the Fund that are traditionally performed by the independent auditor. Because the Audit Committee believes that the provision of audit-related services does not compromise or impair the independence of the auditor and is consistent with the SEC’s rules on auditor independence, the Audit Committee may grant pre-approval to audit related services. “Audit related services” include, among others, accounting consultations related to accounting, financial reporting or disclosure matters not classified as “audit services;” assistance with understanding and implementing new accounting and financial report or disclosure matters not classified as “audit services;” assistance with understanding and implementing new accounting and financial reporting guidance from rulemaking authorities; agreed upon or expanded audit procedures related to accounting and/or billing records required to respond to or comply with financial, accounting or regulatory reporting matters; and assistance with internal reporting requirements under Form N-SAR and Form N-CSR.
The Audit Committee has pre-approved the audit-related services set forth in Schedule B of the Audit and Non-Audit Pre-Approved Services Schedule. All other audit-related services not listed in Schedule B of the Audit and Non-Audit Pre-Approved Services Schedule must be specifically pre-approved by the Audit Committee.
The Audit Committee believes that the independent auditor can provide tax services to the Fund, such as tax compliance, tax planning and tax advice, without impairing the auditor’s independence and the SEC has stated that the independent auditor may provide such services. Consequently, the Audit Committee believes that it may grant general pre-approval to those tax services that have historically been provided by the auditor, that the Audit Committee has reviewed and believes would not impair the independence of the auditor, and that are consistent with the SEC’s rules on auditor independence. However, the Audit Committee will not permit the retention of the independent auditor to provide
tax advice in connection with any transaction recommended by the independent auditor, the sole business purpose of which may be tax avoidance and the tax treatment of which may not be supported by the United States Internal Revenue Code and related regulations or the applicable tax statutes and regulations that apply to the Fund’s investments outside the United States. The Audit Committees will consult with the Treasurer of the Fund or outside counsel to determine that the Fund’s tax planning and reporting positions are consistent with this policy.
The Audit Committee has pre-approved the tax services set forth in Schedule C of the Audit and Non-Audit Pre-Approved Services Schedule. All other tax services not listed in Schedule C of the Audit and Non-Audit Pre-Approved Services Schedule must be specifically pre-approved by the Audit Committee.
The Audit Committee believes, based on the SEC’s rules prohibiting the independent auditor from providing specific non-audit services, that other types of non-audit services are permitted. Accordingly, the Audit Committee believes that it may grant general pre-approval to those permissible non-audit services classified as “all other” services that the Audit Committee believes are routine and recurring services, would not impair or compromise the independence of the auditor and are consistent with the SEC’s rules on auditor independence.
The Audit Committee has pre-approved the permissible “all other services” set forth in Schedule D of the Audit and Non-Audit Pre-Approved Services Schedule. Permissible “all other services” not listed in Schedule D of the Audit and Non-Audit Pre-Approved Services Schedule must be specifically pre-approved by the Audit Committee.
A list of the SEC’s prohibited non-audit services are as follows:
| | • | | Bookkeeping or other services relating to the accounting records or financial statements of the Funds |
| | • | | Financial information system design and implementation |
| | • | | Appraisal or valuation services, fairness opinions or contribution-in-kind reports |
| | • | | Internal audit outsourcing services |
| | • | | Human resources services |
| | • | | Broker-dealer, investment adviser or investment banking services |
| | • | | Expert services unrelated to the audit |
The SEC’s rules and relevant official interpretations and guidance should be consulted to determine the scope of these prohibited services and the applicability of any exceptions to certain of the prohibitions. Under no circumstance may an executive, manager or associate of the Fund, or the Investment Advisor, authorize the independent auditor for the Fund to provide prohibited non-audit services.
| VIII. | Pre-Approval Fee Levels or Budgeted Amounts. |
Pre-Approval fee levels or budgeted amounts for all services to be provided by the independent auditor will be established annually by the Audit Committee and shall be subject to periodic subsequent review during the year if deemed appropriate by the Audit Committee (separate amounts may be specified for the Fund and for other affiliates in the investment company complex subject to pre-approval). Any proposed services exceeding these levels or amounts will require specific pre-approval by the Audit Committee. The Audit Committee will be mindful of the overall relationship of fees for audit and non-audit services in determining whether to pre-approve any such services. For each fiscal year, the Audit Committee may determine the appropriateness of the ratio between the total amount of fees for Audit, Audit-related, and Tax services for the Fund (including any Audit-related or Tax services fees for affiliates subject to pre-approval), and the total amount of fees for certain permissible non-audit services classified as “all other services” for the Fund (including any such services for affiliates subject to pre-approval by the Audit Committee).
All requests or applications for services to be provided by the independent auditor that do not require specific pre-approval by the Audit Committee will be submitted to the “RET Clearance Committee” (the “Clearance Committee”) (which shall be comprised of not less than three members, including the Treasurer of the Fund who shall serve as its Chairperson) and must include a detailed description of the services to be rendered and the estimated costs of those services. The Clearance Committee will determine whether such services are included within the list of services that have received general pre-approval by the Audit Committee. The Audit Committee will be informed not less frequently than quarterly by the Chairperson of the Clearance Committee of any such services rendered by the independent auditor for the Fund and the fees paid to the independent auditors for such services.
Requests or applications to provide services that require specific pre-approval by the Audit Committee will be submitted to the Audit Committee by both the independent auditor and the Clearance Committee and must include a joint certification by the engagement partner of the independent auditor and the Chairperson of the Clearing Committee that, in their view, the request or application is consistent with the SEC’s rules governing auditor independence.
The Internal Audit Department of Frank Russell Company, the parent company of RIMCo, and the officers of RET will report to the Chairman of the Audit Committee any breach of this Policy that comes to the attention of the Internal Audit Department of Frank Russell Company or an officer of RET.
| X. | Additional Requirements. |
The Audit Committee has determined to take additional measures on an annual basis to meet its responsibility to oversee the work performed by the independent auditor and to assure the independent auditor’s continuing independence from the Fund and its affiliates, including Frank Russell Company. Such efforts will include, but not be limited to, reviewing a written annual statement from the independent auditor delineating all relationships between the independent auditor and RET and Franks Russell Company and its subsidiaries and affiliates, consistent with Independence Standards Board Standard No. 1, and discussing with the independent auditor its methods and procedures for ensuring its independence.
(e) (2) The percentage of services described in each of paragraphs (b) through (d) of this Item that were approved by the audit committee pursuant to paragraph (c)(7)(i)(C) of Rule 2-01 of Regulation S-X is as follows:
| | | | |
Audit Fees | | | 0 | % |
Audit-Related Fees | | | 0 | % |
Tax Fees | | | 0 | % |
All Other Fees | | | 0 | % |
(f) For services, 50 percent or more of which were pre-approved, the percentage of hours expended on the principal accountant’s engagement to audit the registrant’s financial statements for the most recent fiscal year that were attributed to work performed by persons other than the principal accountant’s full-time, permanent employees was 0%.
(g) The aggregate non-audit fees billed by registrant’s accountant for services rendered to the registrant, and rendered to the registrant’s investment adviser (not including any sub-adviser whose role is primarily portfolio management and is subcontracted with or overseen by another investment adviser), and any entity controlling, controlled by, or under common control with the adviser that provides ongoing services to the registrant for each of the last two fiscal years of the registrant were as follows:
(h) The registrant’s audit committee of the board of trustees has considered whether the provision of nonaudit services that were rendered to the registrant’s investment adviser (not including any subadviser whose role is primarily portfolio management and is subcontracted with or overseen by another investment adviser), and any entity controlling, controlled by, or under common control with the investment adviser that provides ongoing services to the registrant that were not pre-approved pursuant to paragraph (c)(7)(ii) of Rule 2-01 of Regulation S-X is compatible with maintaining the principal accountant’s independence.
Items 5. Audit Committee of Listed Registrants. [Not Applicable]
Item 6. [Schedule of investments is included as part of the report to shareholders filed under Item 1 of this form]
Items 7-9. [Not Applicable]
Item 10. Submission of Matters to a Vote of Security Holders
There have been no changes to the procedures by which shareholders may recommend nominees to the Registrant’s Board of Trustees that would require disclosure herein.
Item 11. Controls and Procedures
(a) Registrant’s principal executive officer and principal financial officer have concluded that Registrant’s disclosure controls and procedures (as defined in Rule 30a-2(c) under the Investment Company Act of 1940 (the “Act”)) are effective, based on their evaluation of these controls and procedures as of a date within 90 days of the date this report is filed with the Securities and Exchange Commission.
(b) There were no significant changes in Registrant’s internal control over financial reporting that occurred during the period covered by this report that has materially affected or is likely to materially affect Registrant’s internal control over financial reporting.
Item 12. Exhibit List
(a) Certification for principal executive officer of Registrant as required by Rule 30a-2(a) under the Act and certification for principal financial officer of Registrant as required by Rule 30a-2(a) under the Act.
(b) Certification for principal executive officer and principal financial officer of Registrant as required by Section 906 of the Sarbanes-Oxley Act of 2002.
SIGNATURES
Pursuant to the requirements of the Securities Exchange Act of 1934 and the Investment Company Act of 1940, the Registrant has duly caused this report to be signed on its behalf by the undersigned, thereunto duly authorized.
Russell Exchange Traded Funds Trust
| | |
| By: | | /s/ James G. Polisson |
| | James G. Polisson |
| | Principal Executive Officer and Chief Executive Officer |
Date: June 7, 2012
Pursuant to the requirements of the Securities Exchange Act of 1934 and the Investment Company Act of 1940, this report has been signed below by the following persons on behalf of the Registrant and in the capacities and on the dates indicated.
| | |
| By: | | /s/ James G. Polisson |
| | James G. Polisson |
| | Principal Executive Officer and Chief Executive Officer |
Date: June 7, 2012
| | |
| By: | | /s/ Mark E. Swanson |
| | Mark E. Swanson |
| | Principal Financial Officer, Principal Accounting Officer and Treasurer |
Date: June 7, 2012