UNITED STATES
SECURITIES AND EXCHANGE COMMISSION
Washington, D.C. 20549
Form N-CSR
CERTIFIED SHAREHOLDER REPORT OF REGISTERED MANAGEMENT
INVESTMENT COMPANIES
Investment Company Act File Number 811-22321
MAINSTAY FUNDS TRUST
(Exact name of Registrant as specified in charter)
51 Madison Avenue, New York, NY 10010
(Address of principal executive offices) (Zip code)
J. Kevin Gao, Esq.
30 Hudson Street
Jersey City, New Jersey 070302
(Name and address of agent for service)
Registrant’s telephone number, including area code: (212) 576-7000
Date of fiscal year end: April 30
(MainStay Absolute Return Multi-Strategy Fund and MainStay Tax Advantaged Short Term Bond Fund)
Date of reporting period: April 30, 2016
FORM N-CSR
| Item 1. | Reports to Stockholders. |
MainStay Absolute Return Multi-Strategy Fund
Message from the President and Annual Report
April 30, 2016


This page intentionally left blank
Message from the President
The U.S. stock market experienced substantial volatility during the period from June 18, 2015, through April 30, 2016. After holding relatively steady through early August 2015, many stock markets around the world dropped substantially after the People’s Bank of China devalued the Chinese yuan on August 11, 2015. Some took months to recover. U.S. stock prices sank again in the early weeks of 2016. Oil prices continued their long-standing descent through mid-January 2016, and slowing economic growth in China continued to be a major concern for equity investors. In February, U.S. stocks began a relatively steady recovery, but they closed the reporting period slightly below where they began.
According to FTSE Russell data, U.S. stocks at most capitalization levels provided negative returns over the reporting period (the 50 and 200 largest-cap stocks were exceptions). Large-cap stocks tended to outperform mid- and small-cap stocks, and growth and value stocks had mixed results depending on company size.
International and global stocks tended to provide negative returns for the reporting period, and emerging-market stocks as an asset class experienced double-digit declines. Slowing growth in China, weaker commodity prices and Brazil’s economic woes all took a toll on emerging-market stock performance.
Many sectors of the bond market showed relatively strong performance during the reporting period. U.S. Treasury and agency securities, as well as municipal bonds and high-grade corporate bonds, provided positive overall performance. On the other hand, high yield bonds, convertible bonds and leveraged loans generally had negative returns for the reporting period.
While stock and bond markets may go up or down in ways that are hard to predict, staying the course requires a long-term view. It may also require an ability to remain optimistic, even through periods of market volatility. During the reporting period,
our managers sought to maintain a long-term perspective and generally did not make decisions based on short-term volatility. For some managers this may have proved beneficial. For example, although oil prices declined substantially in a period of supply-and-demand imbalance, they eventually recovered toward levels that were more familiar and reasonable. A similar pattern was seen in the stock market.
While our portfolio managers may closely consider daily market movements, they seek to make long-term decisions on the basis of the investment objectives of their respective Funds and the investment strategies outlined in each Fund’s prospectus. In this way, they seek to offer a consistent basis for their decisions, wherever the markets may move.
The annual report that follows provides more detailed information about the market changes, investment decisions and individual securities that affected MainStay Absolute Return Multi-Strategy Fund during the period from June 18, 2015, through April 30, 2016. We hope that you will read it carefully and use the information as part of your long-term investment planning and decision making.
At MainStay, we’re honored that you have chosen to invest with us, and we hope that our Funds will remain a valuable part of your investment portfolio for many years to come.
Sincerely,

Stephen P. Fisher
President
The opinions expressed are as of the date of this report and are subject to change. There is no guarantee that any forecast made will come to pass. This material does not constitute investment advice and is not intended as an endorsement of any specific investment. Past performance is no guarantee of future results.
Not part of the Annual Report
Investors should refer to the Fund’s Summary Prospectus and/or Prospectus and consider the Fund’s investment objectives, strategies, risks, charges and expenses carefully before investing. The Summary Prospectus and/or Prospectus contain this and other information about the Fund. You may obtain copies of the Fund’s Summary Prospectus, Prospectus and Statement of Additional Information free of charge, upon request, by calling toll-free 800-MAINSTAY (624-6782), by writing to NYLIFE Distributors LLC, Attn: MainStay Marketing Department, 30 Hudson Street, Jersey City, NJ 07302 or by sending an e-mail to MainStayShareholderServices@nylim.com. These documents are also available via the MainStay Funds’ website at mainstayinvestments.com/documents. Please read the Summary Prospectus and/or Prospectus carefully before investing.
Investment and Performance Comparison1 (Unaudited)
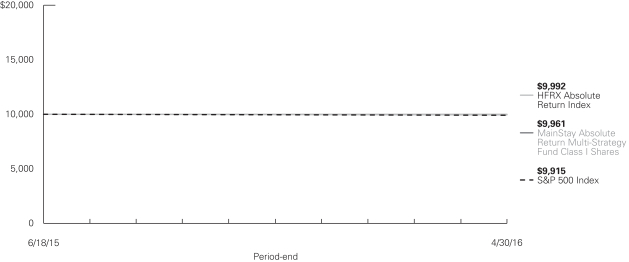
Performance data quoted represents past performance. Past performance is no guarantee of future results. Because of market volatility, current performance may be lower or higher than the figures shown. Investment return and principal value will fluctuate, and as a result, when shares are redeemed, they may be worth more or less than their original cost. The graph below depicts the historical performance of Class I shares of the Fund. Performance will vary from class to class based on differences in class-specific expenses and sales charges. For performance information current to the most recent month-end, please call 800-MAINSTAY (624-6782) or visit mainstayinvestments.com.
Average Annual Total Returns for the Period Ended April 30, 2016
| Class | Sales Charge | Since Inception (6/18/15) | Gross Expense Ratio2 | |||||||||
| Class A Shares | Maximum 5.5% Initial Sales Charge | With sales charges Excluding sales charges |
| –5.96 –0.49 | %
|
| 2.51 2.51 | %
| ||||
| Investor Class Shares | Maximum 5.5% Initial Sales Charge | With sales charges Excluding sales charges |
| –6.15 –0.69 |
| | 2.67 2.67 | | ||||
| Class C Shares | Maximum 1% CDSC if Redeemed Within One Year of Purchase | With sales charges Excluding sales charges |
| –2.38 –1.39 |
| | 3.42 3.42 | | ||||
| Class I Shares | No Sales Charge | –0.39 | 2.26 | |||||||||
| Benchmark Performance | Since Inception (6/18/15) | |||
HFRX Absolute Return Index3 | –0.08 | % | ||
S&P 500 Index4 | –0.85 | |||
Average Lipper Alternative Multi-Strategy Fund5 | –3.59 | |||
| 1. | The performance table and graph do not reflect the deduction of taxes that a shareholder would pay on distributions or Fund share redemptions. Total returns reflect maximum applicable sales charges as indicated in the table above, changes in share price, and reinvestment of dividend and capital gain distributions. The graph assumes the initial investment amount shown above and reflects the deduction of all sales charges that would have applied for the periods of investment. Performance figures may reflect certain fee waivers and/or expense limitations, without which total returns may have been lower. For more information on share classes and current fee waivers and/or expense limitations (if any), please refer to the notes to the consolidated financial statements. |
| 2. | The gross expense ratios presented reflect the Fund’s “Total Annual Fund Operating Expenses” from the most recent Prospectus and may differ from other expense ratios disclosed in this report. |
| 3. | The HFRX Absolute Return Index is designed to be representative of the overall composition of the hedge fund universe. It is comprised of eligible hedge fund strategies; including but not limited to convertible arbitrage, distressed securities, equity hedge, equity market neutral, event driven, macro, merger arbitrage, and relative value arbitrage. The HFRX Absolute |
| Return Index is the Fund’s broad-based securities market index for comparison purposes. Results assume reinvestment of all dividends and capital gains. An investment cannot be made directly in an index |
| 4. | “S&P 500®” is a trademark of the McGraw-Hill Companies, Inc. The S&P 500® Index is widely regarded as the standard index for measuring large-cap U.S. stock market performance. The S&P 500® Index is the Fund’s secondary benchmark index for comparison purposes. Results assume reinvestment of all dividends and capital gains. An investment cannot be made directly in an index. |
| 5. | The Average Lipper Alternative Multi-Strategy Fund is representative of the funds that seek total returns through the management of several different hedge- like strategies. These funds are typically quantitatively driven to measure the existing relationship between instruments and in some cases to identify positions in which the risk-adjusted spread between these instruments represents an opportunity for the investment manager. This benchmark is a product of Lipper Inc. Lipper Inc. is an independent monitor of the fund performance. Results are based on average total returns of similar funds with all dividend and capital gain distributions reinvested. |
The footnotes are an integral part of the table and graph and should be carefully read in conjunction with them.
| 5 |
Cost in Dollars of a $1,000 Investment in MainStay Absolute Return Multi-Strategy Fund (Unaudited)
The example below is intended to describe the fees and expenses borne by shareholders during the six-month period from November 1, 2015, to April 30, 2016, and the impact of those costs on your investment.
Example
As a shareholder of the Fund, you incur two types of costs: (1) transaction costs, including exchange fees and sales charges (loads) on purchases (as applicable), and (2) ongoing costs, including management fees, distribution and/or service (12b-1) fees, and other Fund expenses (as applicable). This example is intended to help you understand your ongoing costs (in dollars) of investing in the Fund and to compare these costs with the ongoing costs of investing in other mutual funds. The example is based on an investment of $1,000 made at the beginning of the six-month period and held for the entire period from November 1, 2015, to April 30, 2016.
This example illustrates your Fund’s ongoing costs in two ways:
Actual Expenses
The second and third data columns in the table below provide information about actual account values and actual expenses. You may use the information in these columns, together with the amount you invested, to estimate the expenses that you paid during the six months ended April 30, 2016. Simply divide your account value by $1,000 (for example, an $8,600 account value divided by $1,000 = 8.6), then
multiply the result by the number under the heading entitled “Expenses Paid During Period” to estimate the expenses you paid on your account during this period.
Hypothetical Example for Comparison Purposes
The fourth and fifth data columns in the table below provide information about hypothetical account values and hypothetical expenses based on the Fund’s actual expense ratio and an assumed rate of return of 5% per year before expenses, which is not the Fund’s actual return. The hypothetical account values and expenses may not be used to estimate the actual ending account balances or expenses you paid for the six-month period shown. You may use this information to compare the ongoing costs of investing in the Fund with the ongoing costs of investing in other Funds. To do so, compare this 5% hypothetical example with the 5% hypothetical examples that appear in the shareholder reports of the other Funds.
Please note that the expenses shown in the table are meant to highlight your ongoing costs only and do not reflect any transactional costs, such as exchange fees or sales charges (loads). Therefore, the fourth and fifth data columns of the table are useful in comparing ongoing costs only and will not help you determine the relative total costs of owning different funds. In addition, if these transactional costs were included, your costs would have been higher.
| Share Class | Beginning Account Value 11/1/15 | Ending Account Value (Based on Actual Returns and Expenses) 4/30/16 | Expenses Paid During Period1 | Ending Account Value (Based on Hypothetical 5% Annualized Return and Actual Expenses) 4/30/16 | Expenses Paid During Period1 | |||||||||||||||
| Class A Shares | $ | 1,000.00 | $ | 997.10 | $ | 13.80 | $ | 1,011.00 | $ | 13.90 | ||||||||||
| Investor Class Shares | $ | 1,000.00 | $ | 997.10 | $ | 14.45 | $ | 1,010.40 | $ | 14.55 | ||||||||||
| Class C Shares | $ | 1,000.00 | $ | 993.00 | $ | 17.89 | $ | 1,006.90 | $ | 18.01 | ||||||||||
| Class I Shares | $ | 1,000.00 | $ | 999.10 | $ | 12.58 | $ | 1,012.30 | $ | 12.66 | ||||||||||
| 1. | Expenses are equal to the Fund’s annualized expense ratio of each class (2.78% for Class A, 2.91% for Investor Class, 3.61% for Class C and 2.53% for Class I) multiplied by the average account value over the period, divided by 366 and multiplied by 182 (to reflect the six-month period). The table above represents the actual expenses incurred during the six-month period. |
| 6 | MainStay Absolute Return Multi-Strategy Fund |
Strategy Allocation as of April 30, 20161 (Unaudited)
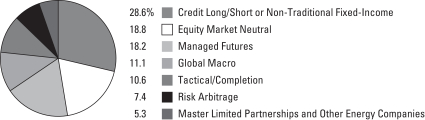
| 1 | Percentages based on total net assets. |
Strategy Overview:
Equity Market Neutral: This strategy seeks to profit by detecting and exploiting perceived pricing inefficiencies in individual equity securities and neutralizing exposure to market risk by maintaining approximately equal value exposure in long and short positions. The strategy will identify investment opportunities based on a model that reflects the input of relevant factors, including relative value, market sentiment, and the Subadvisor’s forecasts as to anticipated market volatility. The strategy may engage in short sales in order to generate returns that are independent of the direction of the market.
Risk Arbitrage: This strategy implements event-driven arbitrage strategies on securities of companies that experience certain “special situations,” which are corporate events that are likely to create discontinuity in the price of a given security. The Fund’s risk arbitrage strategy consists primarily of an announced merger arbitrage strategy. An announced merger arbitrage strategy buys or sells the securities of companies involved in a merger based on the Subadvisor’s anticipation of the merger’s outcome. The strategy may also invest in securities of companies based on other event-driven strategies, such as holding discount arbitrage, share class arbitrage, spin-offs, asset sales, initial public offerings, minority buyouts, auctions or rights issues. Share class arbitrage involves capitalizing on perceived pricing inefficiencies of a particular share class in a multiple share class issuer. Discount arbitrage is when a discount option is purchased while an opposite transaction is taken in the underlying security.
Managed Futures: This strategy primarily takes long and short positions in futures contracts (directly or through derivatives, including total return swaps) across asset classes globally. The strategy seeks to exploit market trends and generate absolute returns utilizing a quantitative and systematic investment approach, which consists of analyzing financial markets through statistical models. These quantitative models produce buy or sell signals looking to benefit from the upward and downward movements of the asset classes covered based on market trends and patterns and contrarian views (i.e., instruments and strategies that may be out of favor in the broader market). The managed futures strategy will be implemented through (i) investment in derivative instruments, including swap agreements, exchange-traded futures and option and forward contracts, to gain exposure to a wide variety of global markets for currencies, interest rates, stock market indices, energy resources, metals and agricultural products and to hedge price risk, (ii) investment in swap agreements that reflect the return of securities, derivatives and commodity interests selected by the Subadvisor, or (iii) investment in some combination of (i) and (ii). This strategy will
involve the use of one or more wholly-owned subsidiaries formed under the laws of the Cayman Islands (each, a “Cayman Subsidiary”). See “Subsidiary Risk” below for more information.
Master Limited Partnerships (“MLPs”) and Other Energy Companies: This strategy seeks to deliver both high current income and total return by investing in a portfolio of domestic and foreign publicly traded partnerships and/or other issuers (including U.S. and Canadian royalty trusts and Canadian energy companies) engaged in the transportation, storage, processing, refining, marketing, exploration, production or mining of crude oil, natural gas, natural gas liquids, minerals or other natural resources (“Energy Companies”). The Subadvisor implements this strategy by identifying companies it believes will benefit from increased crude oil, natural gas or natural gas liquids production resulting in greater energy infrastructure needs. The Fund will invest no more than 25% of its total assets in securities of MLPs that are qualified publicly traded partnerships (“QPTPs”), which are treated as partnerships for U.S. federal income tax purposes.
Credit Long/Short or Non-Traditional Fixed-Income: This strategy seeks to exploit opportunities in the global fixed-income markets based on top-down and bottom-up analysis. The strategy may invest in various credit strategies that involve being long and short different financial instruments, and the credit instruments involved will range from high grade to high yield (known as “junk bonds”) and distressed debt. The strategy may also invest in credit derivatives, including credit default swaps, options and indices. The Subadvisors responsible for this strategy dynamically allocate capital to the sectors and securities that they believe offer the best balance of risk and return, unrestricted by benchmark constraints.
Global Macro: This strategy seeks to obtain exposure to a broad spectrum of investments and countries or regions, based on discrete strategies that employ a variety of techniques, both discretionary and systematic analysis, combinations of top down and bottom up theses, and quantitative and fundamental approaches, designed to effectively identify and assess factors that affect businesses and economies broadly (e.g., monetary and fiscal policy, regulatory changes, demographics) and their impact on securities markets. The strategy may also employ arbitrage techniques and seek long and short exposure (directly or through derivatives, including total return swaps) across diversified asset classes globally. The strategy may be exposed significantly to interest rate and foreign currency futures. In addition, the strategy may involve the use of one or more Cayman Subsidiaries to obtain certain commodities market exposure.
| 7 |
Tactical/Completion: This strategy, which is managed by New York Life Investment Management LLC, the Fund’s Manager, may invest in a range of asset classes, including equity securities, fixed-income instruments, futures, options, currency forward contracts and swaps (including total return swaps) and affiliated and unaffiliated open-end funds, closed-end funds and exchange-traded funds, to manage or gain access to certain market exposures, including exposure to asset classes or strategies in which the Fund is not otherwise invested, to exploit perceived structural inefficiencies in the markets or to manage cash flows. Additionally, positions may be pursued on a long or short basis either to take advantage of perceived investment opportunities or to counter exposure from other strategies in the Fund.
Other Strategies: The Manager may modify the strategies summarized above and allocate the Fund’s assets among or to other strategies developed or implemented to further optimize risk reward expectations based on, among other factors, changing market conditions. In addition to the instruments described above, such other strategies may include taking long and/or short positions in a wide range of instruments, including, but not limited to, commodities and real estate investment trusts (“REITs”). Such investments may be made without restriction as to issuer capitalization, country (including emerging markets), currency, maturity or credit rating and within the context of a range of investment programs or strategies, including, but not limited to, carry strategies, relative value strategies, and various forms of arbitrage.
| 8 | MainStay Absolute Return Multi-Strategy Fund |
Manager Allocation as of April 30, 20161 (Unaudited)

| 1 | Percentages based on total net assets. |
Top Ten Holdings or Issuers Held as of April 30, 2016 (excluding short-term investments) (Unaudited)
| 1. | United States Treasury Inflation—Indexed Bonds, 0.375%, due 7/15/25 |
| 2. | CCO Holdings LLC / CCO Holdings Capital Corp., 6.50%–7.375%, due 6/1/20–1/31/22 |
| 3. | Trionista Holdco GmbH, 5.00%, due 4/30/20 |
| 4. | Veolia Environnement S.A., 4.85%, due 1/29/49 |
| 5. | Techem GmbH, 6.125%, due 10/1/19 |
| 6. | R&R Ice Cream PLC, 4.75%, due 5/15/20 |
| 7. | Altice Financing S.A., 7.875%–8.00%, due 12/15/19 |
| 8. | Agrokor D.D., 9.875%, due 5/1/19 |
| 9. | Time Warner Cable, Inc. |
| 10. | Ball Corp., 4.375%, due 12/15/23 |
Top Five Short Positions as of April 30, 2016 (Unaudited)
| 1. | United States Oil Fund, L.P. |
| 2. | SPDR S&P 500 ETF Trust |
| 3. | Cliffs Natural Resources, Inc. |
| 4. | Royal Gold, Inc. |
| 5. | Chocoladefabriken Lindt & Sprungli A.G. |
| 9 |
Portfolio Management Discussion and Analysis (Unaudited)
Questions answered by Jae S. Yoon, CFA, Jonathan Swaney, Poul Kristensen, CFA, and Amit Soni, CFA, of New York Life Investments,1 the Fund’s Manager.
How did MainStay Absolute Return Multi-Strategy Fund perform relative to its primary benchmark and peers during the period from June 18, 2015, through April 30, 2016?
MainStay Absolute Return Multi-Strategy Fund commenced operations on June 18, 2015. Excluding all sales charges, the Fund returned –0.49% for Class A shares, –0.69% for Investor Class shares and –1.39% for Class C shares from June 18, 2015, through April 30, 2016. Over the same period, Class I shares returned –0.39%. From June 18, 2015, through April 30, 2016, all share classes underperformed the –0.08% return of the HFRX Absolute Return Index,2 which is the Fund’s broad-based securities-market index. From June 18, 2015, through April 30, 2016, Class A, Investor Class and Class I shares outperformed—and Class C shares underperformed—the –0.85% return of the S&P 500® Index,2 which is a secondary benchmark of the Fund. Over the same period, all share classes outperformed the –3.59% return of the Average Lipper3 Alternative Multi-Strategy Fund. See page 5 for Fund returns with sales charges.
Were there any changes to the Fund during the reporting period?
Effective January 19, 2016, a global macro strategy was added to the Fund. Effective January 15, 2016, Candriam France S.A.S., a Subadvisor to the Fund, added three portfolio managers: Charles de Courcel, Myriam Guervin and Michel Le Bras. On that same date, Cornerstone Capital Management Holdings LLC, another Subadvisor to the Fund, added Mona Patni as portfolio manager. Effective December 7, 2015, Daniel L. Spears no longer serves as portfolio manager of the Fund. Jerry V. Swank, Libby F. Toudouze, Judd B. Cryer, and John Musgrave continue to manage the “Master Limited Partnerships and Other Energy Companies” strategy of the Fund for Cushing Asset Management, LP, a Subadvisor to the Fund.
What factors affected the Fund’s relative performance during the reporting period?
Several factors affected the Fund’s performance relative to the HFRX Absolute Return Index. Equity market neutral was the Fund’s best performing strategy, which advanced on the back of strong sentiment and momentum factors. Managed futures strategy also performed well, as it was able to capture—and
benefit from—the negative trends in the equity and the energy markets in early 2016. The Fund’s greatest detractor was its investment in hedged master limited partnerships (“MLPs”), a sector that was negatively affected by concerns over overbuilt infrastructure and falling energy prices. From a risk perspective, the Fund remained at a long-term annualized volatility level of less than 6% (as measured by annualized standard deviation of the Fund’s returns).
During the reporting period, how did the Fund’s performance correlate with traditional equity and fixed-income indices?
The Fund maintained low correlation to traditional equity and fixed-income indices during the reporting period, as designed. The correlation of the Fund’s overall portfolio to the S&P 500® Index was 26%, and the correlation to the Barclays U.S. Aggregate Bond Index4 was 24%.
During the reporting period, how did the Fund’s volatility compare to that of traditional fixed-income indices?
During the reporting period, the Fund’s volatility (as measured by annualized standard deviation of the Fund’s returns) was closer to that of traditional fixed-income indices than it was to that of traditional equity indices. The Fund’s volatility was 4.5%, compared to a volatility of 3.6% for the Barclays U.S. Aggregate Bond Index and a volatility of 6.2% for the BofA Merrill Lynch High Yield Master II Index.5 During the reporting period, the volatility of the S&P 500® Index was 17.7%.
How did the Fund use derivatives during the reporting period?
Derivatives were used in the Fund for alpha generation,6 hedging and operational efficiency. For example, we used total return swaps for alpha generation in the tactical sleeve to gain exposure to certain alternative beta indices.6 The non-traditional fixed-income managers used interest-rate derivatives for hedging specific exposures in their sleeves. Also, in the tactical sleeve, certain exposures were assumed through total return swaps because of operational efficiency (leveraging better trading and operational infrastructure of external providers for cost efficiency). We believe that measuring the impact of derivatives on performance as positive or negative does not properly reflect the utility of derivatives to the Fund because of the functions they perform within the Fund. For example, a
| 1. | “New York Life Investments” is a service mark used by New York Life Investment Management Holdings LLC and its subsidiary New York Life Investment Management LLC. |
| 2. | See footnote on page 5 for more information on this index. |
| 3. | See footnote on page 5 for more information on Lipper Inc. |
| 4. | The Barclays U.S. Aggregate Bond Index is a broad-based benchmark that measures the investment grade, U.S. dollar-denominated, fixed-rate taxable bond market, including Treasurys, government-related and corporate securities (agency fixed-rate and hybrid adjustable-rate mortgage pass-throughs), asset-backed securities and commercial mortgage-backed securities. Results assume reinvestment of all dividends and capital gains. An investment cannot be made directly in an index. |
| 5. | The BofA Merrill Lynch High Yield Master II Index monitors the performance of below investment-grade U.S. dollar-denominated corporate bonds publicly issued in the U.S. domestic market. An investment cannot be made directly in an index. |
| 6. | Alpha measures the relationship between a mutual fund’s return and its beta over a three-year period. Often, alpha is viewed as the excess return (positive or negative) or the value added by the portfolio manager. Beta is a measure of volatility in relation to the market as a whole. A beta higher than 1 indicates that a security or portfolio will tend to exhibit higher volatility than the market. A beta lower than 1 indicates that a security or portfolio will tend to exhibit lower volatility than the market. |
| 10 | MainStay Absolute Return Multi-Strategy Fund |
hedge performing as expected might have a negative contribution to return even as it serves its intended function to reduce a risk or an exposure. (Contributions take weightings and total returns into account.) Nevertheless, the use of derivatives contributed positively to the Fund’s performance during the reporting period, primarily from the managed futures strategy.
How did you allocate the Fund’s assets among each of the strategies during the reporting period and why?
The Fund’s allocations are based on the estimated optimal distribution of assets taking into account both the risk and return expectations. (It is generally not possible to increase return without taking additional risk, and the Fund generally cannot reduce risk without also reducing return.) These estimates of risk and return are long term in nature; and as a result, asset allocations tend to be quite stable over time. The Fund’s allocation to an individual strategy may change if there is a statistically significant change in the risk-return characteristics of a strategy, if the outlook of a strategy improves substantially or if an attractive new strategy that we believe would likely further support the Fund’s investment goal becomes available for investment. Any portfolio allocation changes that occurred during the reporting period are mentioned and explained in the following paragraphs.
How did the tactical allocation among the strategies affect the Fund’s performance during the reporting period?
Given the significant rise of volatility in the MLP space, the Fund reduced its exposure to the MLP strategies to appropriately
manage risk, including reducing the Fund’s allocation to the MLP Royalty strategy to zero. As an offset, the weight in the flexible bond strategy was increased, since the yields on higher-yielding bonds had climbed to levels that we believed to be quite attractive. Both of these strategies have advanced since the reallocation, but the net effect at the Fund level has not been significant.
During the reporting period, how did each strategy either contribute to or detract from the Fund’s absolute performance?
During the reporting period, the Fund saw its greatest positive contribution to gross performance from equity market neutral (+1.70%), followed by managed futures (+1.62%), credit opportunities7 (+0.73%), flexible bond7 (+0.42%), global alpha8 (+0.24%) and tactical/completion (+0.16%). The most substantial negative contribution to gross performance came from MLP alpha9 (–2.45%), followed by risk arbitrage (–0.86%), MLP royalty9 (–0.42%) and global opportunities8 (–0.12%).
How did the Fund’s strategy weightings change during the reporting period?
During the reporting period, the Fund added a global macro strategy. The weights of the tactical/completion and risk arbitrage strategies were reduced to raise capital for the global macro strategy. As previously noted, the weight of the MLP strategy was reduced and the allocation to the flexible bond strategy was increased during the reporting period.
| 7. | The credit long/short or non-traditional fixed-income portion of the Fund consists of two underlying strategies: the flexible bond strategy and the credit opportunities strategy. |
| 8. | The global macro portion of the Fund consists of two underlying strategies: the global alpha strategy and the global opportunities strategy. |
| 9. | The Master Limited Partnerships and other energy companies portion of the Fund consists of two underlying strategies: the MLP alpha strategy and the MLP royalty strategy. |
The opinions expressed are those of the portfolio managers as of the date of this report and are subject to change. There is no guarantee that any forecasts will come to pass. This material does not constitute investment advice and is not intended as an endorsement of any specific investment.
| 11 |
Consolidated Portfolio of Investments April 30, 2016
| Principal Amount | Value | |||||||
Long-Term Bonds 16.0%† Corporate Bonds 6.6% |
| |||||||
Auto Parts & Equipment 0.3% | ||||||||
Goodyear Tire & Rubber Co. (The) | ||||||||
6.50%, due 3/1/21 | $ | 110,000 | $ | 115,844 | ||||
7.00%, due 5/15/22 | 50,000 | 54,000 | ||||||
ZF North America Capital, Inc. | 150,000 | 153,559 | ||||||
|
| |||||||
| 323,403 | ||||||||
|
| |||||||
Banks 0.5% | ||||||||
Bank of America Corp. | ||||||||
4.20%, due 8/26/24 | 85,000 | 86,566 | ||||||
5.625%, due 7/1/20 | 75,000 | 84,280 | ||||||
Goldman Sachs Group, Inc. (The) | ||||||||
5.375%, due 3/15/20 | 75,000 | 83,359 | ||||||
6.75%, due 10/1/37 | 70,000 | 84,859 | ||||||
Morgan Stanley | ||||||||
5.00%, due 11/24/25 | 80,000 | 87,076 | ||||||
5.50%, due 1/26/20 | 75,000 | 83,348 | ||||||
|
| |||||||
| 509,488 | ||||||||
|
| |||||||
Beverages 0.3% | ||||||||
Constellation Brands, Inc. | 300,000 | 316,125 | ||||||
|
| |||||||
Building Materials 0.2% | ||||||||
Cemex Finance LLC | 215,000 | 236,285 | ||||||
|
| |||||||
Commercial Services 0.2% | ||||||||
Nielsen Co. Luxembourg S.A.R.L. (The) | 200,000 | 208,500 | ||||||
|
| |||||||
Distribution & Wholesale 0.1% | ||||||||
LKQ Corp. | 84,000 | 84,420 | ||||||
|
| |||||||
Electric 0.3% | ||||||||
EDP Finance B.V. | 274,000 | 289,070 | ||||||
|
| |||||||
Entertainment 0.0%‡ | ||||||||
Isle of Capri Casinos, Inc. | 50,000 | 52,125 | ||||||
|
| |||||||
Food 0.2% | ||||||||
Kraft Heinz Foods Co. | 95,000 | 97,760 | ||||||
| Principal Amount | Value | |||||||
Food (continued) | ||||||||
Tyson Foods, Inc. | $ | 105,000 | $ | 113,362 | ||||
|
| |||||||
| 211,122 | ||||||||
|
| |||||||
Food Services 0.3% | ||||||||
Aramark Services, Inc. | ||||||||
5.125%, due 1/15/24 | 160,000 | 169,200 | ||||||
5.75%, due 3/15/20 | 146,000 | 150,745 | ||||||
|
| |||||||
| 319,945 | ||||||||
|
| |||||||
Forest Products & Paper 0.2% | ||||||||
Sappi Papier Holding GmbH | 210,000 | 219,975 | ||||||
|
| |||||||
Health Care—Products 0.3% | ||||||||
Boston Scientific Corp. | 100,000 | 102,299 | ||||||
Hologic, Inc. | 180,000 | 188,550 | ||||||
Thermo Fisher Scientific, Inc. | 53,000 | 53,716 | ||||||
|
| |||||||
| 344,565 | ||||||||
|
| |||||||
Health Care—Services 0.4% | ||||||||
Fresenius Medical Care U.S. Finance II, Inc. | 155,000 | 160,812 | ||||||
HCA, Inc. | ||||||||
5.00%, due 3/15/24 | 25,000 | 25,875 | ||||||
5.875%, due 3/15/22 | 125,000 | 136,563 | ||||||
Laboratory Corporation of America Holdings | 100,000 | 101,013 | ||||||
|
| |||||||
| 424,263 | ||||||||
|
| |||||||
Home Builders 0.0%‡ | ||||||||
TRI Pointe Group, Inc. / TRI Pointe Homes, Inc. | 40,000 | 40,200 | ||||||
|
| |||||||
Housewares 0.0%‡ | ||||||||
Newell Brands, Inc. | 22,000 | 23,214 | ||||||
|
| |||||||
Media 1.1% | ||||||||
¨Altice Financing S.A. | 200,000 | 208,340 | ||||||
¨CCO Holdings LLC / CCO Holdings Capital Corp. | ||||||||
6.50%, due 4/30/21 | 20,000 | 20,696 | ||||||
6.625%, due 1/31/22 | 185,000 | 196,562 | ||||||
7.375%, due 6/1/20 | 250,000 | 259,250 | ||||||
| † | Percentages indicated are based on Fund net assets. |
| ¨ | Among the Fund’s 10 largest holdings or issuers held, as of April 30, 2016, excluding short-term investments. May be subject to change daily. |
| n | Among the Fund’s 5 largest short positions as of April 30, 2016. May be subject to change daily. |
| 12 | MainStay Absolute Return Multi-Strategy Fund | The notes to the consolidated financial statements are an integral part of, and should be read in conjunction with, the consolidated financial statements. |
| Principal Amount | Value | |||||||
| Corporate Bonds (continued) | ||||||||
Media (continued) | ||||||||
Nielsen Finance LLC / Nielsen Finance Co. | $ | 100,000 | $ | 102,000 | ||||
Numericable-SFR S.A. | 200,000 | 203,000 | ||||||
Sirius XM Radio, Inc. | 28,000 | 29,050 | ||||||
Virgin Media Secured Finance PLC | 200,000 | 204,500 | ||||||
|
| |||||||
| 1,223,398 | ||||||||
|
| |||||||
Packaging & Containers 0.9% | ||||||||
¨Ball Corp. | EUR | 325,000 | 404,704 | |||||
Kloeckner Pentaplast of America, Inc. | 250,000 | 302,580 | ||||||
Sealed Air Corp. | 230,000 | 281,528 | ||||||
|
| |||||||
| 988,812 | ||||||||
|
| |||||||
Pharmaceuticals 0.1% | ||||||||
AbbVie, Inc. | $ | 100,000 | 101,709 | |||||
|
| |||||||
Private Equity 0.0%‡ | ||||||||
Icahn Enterprises, L.P. / Icahn Enterprises Finance Corp. | 50,000 | 47,688 | ||||||
|
| |||||||
Real Estate Investment Trusts 0.4% | ||||||||
Equinix, Inc. | ||||||||
5.375%, due 1/1/22 | 27,000 | 28,215 | ||||||
5.375%, due 4/1/23 | 40,000 | 41,800 | ||||||
5.875%, due 1/15/26 | 150,000 | 158,718 | ||||||
MPT Operating Partnership, L.P. / MPT Finance Corp. | ||||||||
5.75%, due 10/1/20 | EUR | 100,000 | 120,717 | |||||
6.375%, due 2/15/22 | $ | 35,000 | 36,750 | |||||
|
| |||||||
| 386,200 | ||||||||
|
| |||||||
Retail 0.8% | ||||||||
1011778 B.C. ULC / New Red Finance, Inc. | 300,000 | 307,500 | ||||||
Dollar Tree, Inc. | 210,000 | 224,238 | ||||||
Dufry Finance SCA | 200,000 | 208,000 | ||||||
O’Reilly Automotive, Inc. | 80,000 | 84,523 | ||||||
|
| |||||||
| 824,261 | ||||||||
|
| |||||||
| Principal Amount | Value | |||||||
Telecommunications 0.0%‡ | ||||||||
T-Mobile USA, Inc. | $ | 50,000 | $ | 52,500 | ||||
|
| |||||||
Total Corporate Bonds | 7,227,268 | |||||||
|
| |||||||
| Foreign Bonds 8.8% | ||||||||
Austria 0.1% | ||||||||
Sappi Papier Holding GmbH | EUR | 100,000 | 116,509 | |||||
|
| |||||||
Belgium 0.2% | ||||||||
Ontex Group N.V. | 100,000 | 121,765 | ||||||
Solvay Finance S.A. | 100,000 | 121,028 | ||||||
|
| |||||||
| 242,793 | ||||||||
|
| |||||||
Croatia 0.4% | ||||||||
¨Agrokor D.D. | 360,000 | 434,231 | ||||||
|
| |||||||
France 3.0% | ||||||||
Accor S.A. | 200,000 | 228,438 | ||||||
Autodis S.A. | 180,000 | 213,216 | ||||||
Cerba European Lab S.A.S. | 300,000 | 355,538 | ||||||
Crown European Holdings S.A. | 315,000 | 362,945 | ||||||
Elior Finance & Co. SCA | 172,429 | 207,410 | ||||||
Elis S.A. | 170,000 | 197,374 | ||||||
Engie S.A. | 100,000 | 119,486 | ||||||
Faurecia | 220,000 | 256,320 | ||||||
HomeVi S.A.S. | 275,000 | 334,727 | ||||||
La Financiere Atalian S.A.S. | 120,000 | 146,942 | ||||||
Orange S.A. | ||||||||
4.00%, due 10/29/49 (b) | 100,000 | 117,081 | ||||||
5.875%, due 2/28/49 (b) | GBP | 100,000 | 150,822 | |||||
SMCP S.A.S. | EUR | 100,000 | 120,562 | |||||
¨Veolia Environnement S.A. | GBP | 300,000 | 450,933 | |||||
|
| |||||||
| 3,261,794 | ||||||||
|
| |||||||
| The notes to the consolidated financial statements are an integral part of, and should be read in conjunction with, the consolidated financial statements. | 13 |
Consolidated Portfolio of Investments April 30, 2016 (continued)
| Principal Amount | Value | |||||||
| Foreign Bonds (continued) | ||||||||
Germany 1.9% | ||||||||
CeramTec Group GmbH | EUR | 230,000 | $ | 283,482 | ||||
Kirk Beauty One GmbH | 100,000 | 120,047 | ||||||
Schaeffler Finance B.V. | 100,000 | 116,022 | ||||||
Schaeffler Holding Finance B.V. | 270,000 | 319,212 | ||||||
¨Techem GmbH | 375,000 | 449,425 | ||||||
¨Trionista Holdco GmbH | 400,000 | 469,471 | ||||||
Vonovia Finance B.V. | 300,000 | 357,788 | ||||||
|
| |||||||
| 2,115,447 | ||||||||
|
| |||||||
Italy 0.2% | ||||||||
Enel S.p.A. | GBP | 100,000 | 160,146 | |||||
|
| |||||||
Luxembourg 0.6% | ||||||||
¨Altice Financing S.A. | EUR | 192,000 | 228,753 | |||||
SIG Combibloc Holdings SCA | 100,000 | 122,807 | ||||||
Telenet Finance Ill Luxembourg SCA | 270,000 | 320,371 | ||||||
|
| |||||||
| 671,931 | ||||||||
|
| |||||||
Mexico 0.1% | ||||||||
CEMEX Espana S.A. | 100,000 | 120,230 | ||||||
|
| |||||||
Netherlands 0.3% | ||||||||
InterXion Holding N.V. | 150,000 | 180,818 | ||||||
United Group B.V. | 100,000 | 121,375 | ||||||
|
| |||||||
| 302,193 | ||||||||
|
| |||||||
Poland 0.3% | ||||||||
Play Topco S.A. | 275,000 | 321,187 | ||||||
|
| |||||||
Romania 0.1% | ||||||||
Cable Communications Systems N.V. | 100,000 | 121,089 | ||||||
|
| |||||||
| Principal Amount | Value | |||||||
Spain 0.7% | ||||||||
Campofrio Food Group S.A. | EUR | 170,000 | $ | 200,033 | ||||
Grupo Antolin Dutch B.V. | 200,000 | 243,231 | ||||||
Iberdrola International B.V. | 200,000 | 245,094 | ||||||
Telefonica Europe B.V. | 100,000 | 120,211 | ||||||
|
| |||||||
| 808,569 | ||||||||
|
| |||||||
Sweden 0.2% | ||||||||
Verisure Holding AB | 210,000 | 257,702 | ||||||
|
| |||||||
United Kingdom 0.7% | ||||||||
Alliance Automotive Finance PLC | 140,000 | 171,682 | ||||||
¨R&R Ice Cream PLC | 382,000 | 447,251 | ||||||
Worldpay Finance PLC | 100,000 | 119,944 | ||||||
|
| |||||||
| 738,877 | ||||||||
|
| |||||||
Total Foreign Bonds | 9,672,698 | |||||||
|
| |||||||
| U.S. Government 0.6% | ||||||||
¨United States Treasury Inflation—Indexed Bonds 0.6% |
| |||||||
0.375%, due 7/15/25 | 699,881 | 718,718 | ||||||
|
| |||||||
Total U.S. Government | 718,718 | |||||||
|
| |||||||
Total Long-Term Bonds | 17,618,684 | |||||||
|
| |||||||
| Shares | ||||||||
| Common Stocks 24.4% | ||||||||
Aerospace & Defense 0.1% | ||||||||
Spirit AeroSystems Holdings, Inc. Class A (e) | 1,900 | 89,585 | ||||||
|
| |||||||
Airlines 0.4% | ||||||||
Air New Zealand, Ltd. | 35,320 | 60,669 | ||||||
International Consolidated Airlines Group S.A. | 11,502 | 88,439 | ||||||
Qantas Airways, Ltd. (e) | 25,701 | 62,924 | ||||||
SAS AB (e) | 30,938 | 88,610 | ||||||
Singapore Airlines, Ltd. | 400 | 3,420 | ||||||
SkyWest, Inc. (f) | 4,100 | 96,350 | ||||||
|
| |||||||
| 400,412 | ||||||||
|
| |||||||
| 14 | MainStay Absolute Return Multi-Strategy Fund | The notes to the consolidated financial statements are an integral part of, and should be read in conjunction with, the consolidated financial statements. |
| Shares | Value | |||||||
| Common Stocks (continued) | ||||||||
Apparel 0.2% | ||||||||
Carter’s, Inc. | 200 | $ | 21,334 | |||||
Michael Kors Holdings, Ltd. (e) | 1,600 | 82,656 | ||||||
Pacific Brands, Ltd. | 102,554 | 89,284 | ||||||
Puma S.E. | 153 | 34,863 | ||||||
Ralph Lauren Corp. | 200 | 18,642 | ||||||
|
| |||||||
| 246,779 | ||||||||
|
| |||||||
Auto Manufacturers 0.0%‡ | ||||||||
Wabash National Corp. (e) | 3,000 | 42,750 | ||||||
|
| |||||||
Auto Parts & Equipment 0.1% | ||||||||
Autoneum Holding A.G. | 125 | 29,800 | ||||||
Goodyear Tire & Rubber Co. (The) | 2,600 | 75,322 | ||||||
|
| |||||||
| 105,122 | ||||||||
|
| |||||||
Banks 0.3% | ||||||||
Banco Santander S.A. | 13,237 | 67,009 | ||||||
Customers Bancorp, Inc. (e) | 2,500 | 64,950 | ||||||
First NBC Bank Holding Co. (e)(f) | 2,600 | 56,524 | ||||||
KeyCorp | 5,300 | 65,137 | ||||||
SunTrust Banks, Inc. | 1,600 | 66,784 | ||||||
SVB Financial Group (e)(f) | 600 | 62,568 | ||||||
|
| |||||||
| 382,972 | ||||||||
|
| |||||||
Beverages 0.1% | ||||||||
Coca-Cola Bottling Co. Consolidated | 400 | 63,748 | ||||||
|
| |||||||
Biotechnology 0.2% | ||||||||
Acorda Therapeutics, Inc. (e) | 500 | 12,925 | ||||||
Five Prime Therapeutics, Inc. (e)(f) | 2,100 | 99,939 | ||||||
MacroGenics, Inc. (e) | 1,500 | 30,840 | ||||||
Medivation, Inc. (e) | 2,146 | 124,039 | ||||||
|
| |||||||
| 267,743 | ||||||||
|
| |||||||
Building Materials 0.6% | ||||||||
Armstrong Flooring, Inc. (e) | 600 | 8,736 | ||||||
Armstrong World Industries, Inc. (e) | 1,200 | 48,972 | ||||||
Builders FirstSource, Inc. (e) | 2,500 | 27,725 | ||||||
Buzzi Unicem S.p.A. | 6,207 | 70,291 | ||||||
CSR, Ltd. | 32,486 | 84,477 | ||||||
Fletcher Building, Ltd. | 3,002 | 17,482 | ||||||
Gibraltar Industries, Inc. (e) | 3,000 | 79,350 | ||||||
NCI Building Systems, Inc. (e) | 2,700 | 39,798 | ||||||
Owens Corning | 700 | 32,249 | ||||||
Patrick Industries, Inc. (e) | 900 | 41,265 | ||||||
U.S. Concrete, Inc. (e) | 1,300 | 80,288 | ||||||
Universal Forest Products, Inc. | 800 | 61,320 | ||||||
USG Corp. (e) | 1,600 | 43,216 | ||||||
Wienerberger A.G. | 1,744 | 34,458 | ||||||
|
| |||||||
| 669,627 | ||||||||
|
| |||||||
| Shares | Value | |||||||
Chemicals 0.5% | ||||||||
Borregaard ASA | 2,647 | $ | 19,807 | |||||
Cabot Corp. | 800 | 39,032 | ||||||
Huntsman Corp. (f) | 6,800 | 107,032 | ||||||
Koppers Holdings, Inc. (e)(f) | 1,800 | 45,234 | ||||||
Kraton Performance Polymers, Inc. (e) | 2,400 | 54,504 | ||||||
Lenzing A.G. | 420 | 32,544 | ||||||
Mosaic Co. (The) | 1,400 | 39,186 | ||||||
Valspar Corp. (The) | 1,528 | 163,022 | ||||||
Westlake Chemical Corp. | 900 | 45,171 | ||||||
|
| |||||||
| 545,532 | ||||||||
|
| |||||||
Commercial Services 0.9% | ||||||||
Aaron’s, Inc. | 1,600 | 41,936 | ||||||
Apollo Education Group, Inc. (e) | 9,400 | 73,320 | ||||||
Avis Budget Group, Inc. (e) | 800 | 20,080 | ||||||
Cross Country Healthcare, Inc. (e) | 3,700 | 45,991 | ||||||
ExamWorks Group, Inc. (e) | 4,528 | 163,235 | ||||||
Hackett Group, Inc. (The) | 2,200 | 32,736 | ||||||
Heidrick & Struggles International, Inc. | 700 | 13,811 | ||||||
HMS Holdings Corp. (e) | 6,000 | 101,340 | ||||||
ManpowerGroup, Inc. (f) | 1,100 | 84,733 | ||||||
Monster Worldwide, Inc. (e)(f) | 14,400 | 46,080 | ||||||
R.R. Donnelley & Sons Co. | 2,500 | 43,500 | ||||||
Ramirent Oyj | 4,652 | 32,493 | ||||||
Robert Half International, Inc. | 2,000 | 76,620 | ||||||
TrueBlue, Inc. (e) | 2,300 | 42,987 | ||||||
United Rentals, Inc. (e) | 600 | 40,158 | ||||||
WEX, Inc. (e)(f) | 1,100 | 103,939 | ||||||
|
| |||||||
| 962,959 | ||||||||
|
| |||||||
Computers 0.5% | ||||||||
Brocade Communications Systems, Inc. | 8,044 | 77,303 | ||||||
Cray, Inc. (e) | 1,900 | 71,953 | ||||||
EMC Corp. | 8,893 | 232,196 | ||||||
Leidos Holdings, Inc. | 1,800 | 89,298 | ||||||
Silver Spring Networks, Inc. (e) | 200 | 2,810 | ||||||
Super Micro Computer, Inc. (e) | 2,400 | 64,584 | ||||||
Teradata Corp. (e) | 1,500 | 37,950 | ||||||
|
| |||||||
| 576,094 | ||||||||
|
| |||||||
Distribution & Wholesale 0.2% | ||||||||
D’ieteren S.A. | 896 | 39,669 | ||||||
HD Supply Holdings, Inc. (e) | 2,700 | 92,556 | ||||||
WESCO International, Inc. (e)(f) | 1,700 | 99,943 | ||||||
|
| |||||||
| 232,168 | ||||||||
|
| |||||||
Electric 0.1% | ||||||||
MDU Resources Group, Inc. | 4,500 | 90,270 | ||||||
|
| |||||||
Electrical Components & Equipment 0.2% |
| |||||||
Encore Wire Corp. | 1,600 | 61,200 | ||||||
Gamesa Corp. Tecnologica S.A. | 4,130 | 81,316 | ||||||
Insteel Industries, Inc. | 2,700 | 78,273 | ||||||
|
| |||||||
| 220,789 | ||||||||
|
| |||||||
| The notes to the consolidated financial statements are an integral part of, and should be read in conjunction with, the consolidated financial statements. | 15 |
Consolidated Portfolio of Investments April 30, 2016 (continued)
| Shares | Value | |||||||
| Common Stocks (continued) | ||||||||
Electronics 0.7% | ||||||||
Arrow Electronics, Inc. (e) | 1,400 | $ | 86,940 | |||||
Austria Technologie & Systemtechnik A.G. | 2,215 | 30,638 | ||||||
Avnet, Inc. | 2,000 | 82,240 | ||||||
Checkpoint Systems, Inc. (e) | 22,986 | 232,618 | ||||||
Fingerprint Cards AB Class B (e) | 1,432 | 85,773 | ||||||
Jabil Circuit, Inc. (f) | 4,700 | 81,592 | ||||||
Multi-Fineline Electronix, Inc. (e)(f) | 1,300 | 29,900 | ||||||
Mycronic AB | 4,454 | 34,804 | ||||||
Plexus Corp. (e) | 1,300 | 54,288 | ||||||
Sanmina Corp. (e) | 1,800 | 42,570 | ||||||
TTM Technologies, Inc. (e) | 4,800 | 31,296 | ||||||
|
| |||||||
| 792,659 | ||||||||
|
| |||||||
Energy—Alternate Sources 0.1% | ||||||||
Vestas Wind Systems A/S | 1,267 | 90,643 | ||||||
|
| |||||||
Engineering & Construction 0.4% | ||||||||
ACS Actividades De Construccion y Servicios S.A. | 606 | 20,036 | ||||||
Bouygues S.A. | 4,609 | 153,682 | ||||||
Broadspectrum, Ltd. (e) | 14,914 | 16,783 | ||||||
Comfort Systems USA, Inc. (f) | 2,500 | 73,725 | ||||||
Downer EDI, Ltd. | 13,985 | 39,557 | ||||||
Fomento de Construcciones y Contratas S.A. (e) | 9,250 | 80,306 | ||||||
Mistras Group, Inc. (e) | 400 | 9,748 | ||||||
Mota-Engil SGPS S.A. | 4,179 | 8,652 | ||||||
Obrascon Huarte Lain S.A. | 7,653 | 54,164 | ||||||
Tutor Perini Corp. (e) | 300 | 4,746 | ||||||
|
| |||||||
| 461,399 | ||||||||
|
| |||||||
Entertainment 0.3% | ||||||||
Carmike Cinemas, Inc. (e) | 2,610 | 78,274 | ||||||
DreamWorks Animation SKG, Inc. Class A (e) | 3,946 | 157,524 | ||||||
Isle of Capri Casinos, Inc. (e)(f) | 2,424 | 36,118 | ||||||
Village Roadshow, Ltd. | 4,513 | 18,049 | ||||||
|
| |||||||
| 289,965 | ||||||||
|
| |||||||
Environmental Controls 0.1% | ||||||||
Clean Harbors, Inc. (e) | 1,800 | 88,920 | ||||||
|
| |||||||
Finance—Credit Card 0.0%‡ | ||||||||
Alliance Data Systems Corp. (e) | 100 | 20,331 | ||||||
|
| |||||||
Finance—Investment Banker/Broker 0.2% |
| |||||||
GAIN Capital Holdings, Inc. (f) | 5,500 | 37,675 | ||||||
INTL. FCStone, Inc. (e) | 2,900 | 79,170 | ||||||
Investment Technology Group, Inc. | 3,800 | 74,176 | ||||||
LPL Financial Holdings, Inc. | 600 | 15,840 | ||||||
|
| |||||||
| 206,861 | ||||||||
|
| |||||||
| Shares | Value | |||||||
Finance—Leasing Companies 0.1% | ||||||||
AerCap Holdings N.V. (e) | 2,300 | $ | 92,023 | |||||
|
| |||||||
Finance—Mortgage Loan/Banker 0.1% | ||||||||
CoreLogic, Inc. (e) | 2,700 | 95,796 | ||||||
|
| |||||||
Food 0.7% | ||||||||
Austevoll Seafood ASA | 9,453 | 79,540 | ||||||
Bellamy’s Australia, Ltd. | 9,641 | 73,818 | ||||||
Cal-Maine Foods, Inc. | 200 | 10,152 | ||||||
Dean Foods Co. (f) | 4,600 | 79,258 | ||||||
Flowers Foods, Inc. | 4,800 | 91,968 | ||||||
John B. Sanfilippo & Son, Inc. | 1,100 | 60,863 | ||||||
Leroy Seafood Group ASA | 550 | 26,845 | ||||||
Metcash, Ltd. (e) | 59,406 | 79,498 | ||||||
Pilgrim’s Pride Corp. (e) | 1,600 | 43,056 | ||||||
Salmar ASA | 254 | 6,309 | ||||||
Seaboard Corp. (e) | 10 | 30,030 | ||||||
SpartanNash Co. | 2,200 | 60,940 | ||||||
Tyson Foods, Inc. Class A | 500 | 32,910 | ||||||
Wilmar International, Ltd. | 32,100 | 88,553 | ||||||
|
| |||||||
| 763,740 | ||||||||
|
| |||||||
Forest Products & Paper 0.1% | ||||||||
Altri SGPS S.A. | 14,701 | 57,301 | ||||||
Stora Enso Oyj Class R | 3,794 | 33,104 | ||||||
|
| |||||||
| 90,405 | ||||||||
|
| |||||||
Hand & Machine Tools 0.1% | ||||||||
Kennametal, Inc. | 4,100 | 95,858 | ||||||
Regal Beloit Corp. | 500 | 32,210 | ||||||
|
| |||||||
| 128,068 | ||||||||
|
| |||||||
Health Care—Products 0.4% | ||||||||
Accuray, Inc. (e) | 14,600 | 78,256 | ||||||
Cepheid, Inc. (e) | 1,300 | 37,102 | ||||||
Genomic Health, Inc. (e) | 2,000 | 52,560 | ||||||
Hill-Rom Holdings, Inc. | 1,300 | 62,855 | ||||||
Invacare Corp. (f) | 2,200 | 24,728 | ||||||
Merit Medical Systems, Inc. (e)(f) | 4,400 | 89,100 | ||||||
Orthofix International N.V. (e) | 1,900 | 83,144 | ||||||
|
| |||||||
| 427,745 | ||||||||
|
| |||||||
Health Care—Services 0.5% | ||||||||
Centene Corp. (e) | 1,400 | 86,744 | ||||||
Civitas Solutions, Inc. (e) | 1,500 | 30,060 | ||||||
LHC Group, Inc. (e) | 1,600 | 64,544 | ||||||
Magellan Health, Inc. (e) | 1,200 | 84,552 | ||||||
Molina Healthcare, Inc. (e) | 1,200 | 62,112 | ||||||
Primary Health Care, Ltd. | 27,528 | 72,630 | ||||||
Triple-S Management Corp. Class B (e) | 3,200 | 83,328 | ||||||
WellCare Health Plans, Inc. (e) | 900 | 80,991 | ||||||
|
| |||||||
| 564,961 | ||||||||
|
| |||||||
| 16 | MainStay Absolute Return Multi-Strategy Fund | The notes to the consolidated financial statements are an integral part of, and should be read in conjunction with, the consolidated financial statements. |
| Shares | Value | |||||||
| Common Stocks (continued) | ||||||||
Holding Company—Diversified 0.0%‡ | ||||||||
Schouw & Co. | 490 | $ | 28,647 | |||||
|
| |||||||
Home Builders 0.1% | ||||||||
D.R. Horton, Inc. | 3,000 | 90,180 | ||||||
YIT Oyj | 9,379 | 64,007 | ||||||
|
| |||||||
| 154,187 | ||||||||
|
| |||||||
Home Furnishing 0.2% | ||||||||
American Woodmark Corp. (e) | 700 | 50,988 | ||||||
Harman International Industries, Inc. | 800 | 61,408 | ||||||
La-Z-Boy, Inc. | 2,700 | 69,849 | ||||||
Whirlpool Corp. | 100 | 17,414 | ||||||
|
| |||||||
| 199,659 | ||||||||
|
| |||||||
Household Products & Wares 0.3% | ||||||||
Central Garden & Pet Co. Class A (e) | 4,900 | 79,821 | ||||||
Henkel A.G. & Co. KGaA | 1,452 | 147,524 | ||||||
Tumi Holdings, Inc. (e) | 5,799 | 154,717 | ||||||
|
| |||||||
| 382,062 | ||||||||
|
| |||||||
Insurance 0.1% | ||||||||
AmTrust Financial Services, Inc. | 1,200 | 29,820 | ||||||
Assured Guaranty, Ltd. | 3,100 | 80,197 | ||||||
|
| |||||||
| 110,017 | ||||||||
|
| |||||||
Internet 0.9% | ||||||||
1-800-Flowers.com, Inc. Class A (e) | 7,100 | 55,735 | ||||||
AVG Technologies N.V. (e) | 2,800 | 55,440 | ||||||
DHI Group, Inc. (e) | 8,100 | 57,591 | ||||||
Expedia, Inc. | 800 | 92,616 | ||||||
IAC/InterActiveCorp | 1,900 | 88,046 | ||||||
LinkedIn Corp. Class A (e) | 800 | 100,248 | ||||||
New Media Investment Group, Inc. | 1,300 | 20,865 | ||||||
RetailMeNot, Inc. (e) | 3,600 | 30,348 | ||||||
Rubicon Project, Inc. (The) (e) | 4,500 | 87,165 | ||||||
Textura Corp. (e) | 6,240 | 164,674 | ||||||
Yahoo!, Inc. (e) | 6,600 | 241,560 | ||||||
Yelp, Inc. (e) | 2,100 | 44,100 | ||||||
|
| |||||||
| 1,038,388 | ||||||||
|
| |||||||
Investment Company 0.1% | ||||||||
EXOR S.p.A. | 4,310 | 161,874 | ||||||
|
| |||||||
Investment Management/Advisory Services 0.0%‡ |
| |||||||
Legg Mason, Inc. | 100 | 3,211 | ||||||
Waddell & Reed Financial, Inc. Class A | 700 | 14,238 | ||||||
|
| |||||||
| 17,449 | ||||||||
|
| |||||||
Iron & Steel 0.3% | ||||||||
BlueScope Steel, Ltd. | 17,262 | 84,920 | ||||||
Steel Dynamics, Inc. (f) | 4,000 | 100,840 | ||||||
United States Steel Corp. | 1,200 | 22,932 | ||||||
| Shares | Value | |||||||
Iron & Steel (continued) | ||||||||
Voestalpine A.G. | 2,858 | $ | 103,020 | |||||
|
| |||||||
| 311,712 | ||||||||
|
| |||||||
Leisure Time 0.3% | ||||||||
Ardent Leisure Group | 11,484 | 18,948 | ||||||
Brunswick Corp. | 400 | 19,212 | ||||||
Kuoni Reisen Holding AG (e) | 710 | 273,106 | ||||||
Royal Caribbean Cruises, Ltd. | 300 | 23,220 | ||||||
|
| |||||||
| 334,486 | ||||||||
|
| |||||||
Lodging 0.1% | ||||||||
MGM Resorts International (e)(f) | 4,300 | 91,590 | ||||||
|
| |||||||
Machinery—Construction & Mining 0.2% | ||||||||
Danieli & C Officine Meccaniche S.p.A. | 3,082 | 50,112 | ||||||
Joy Global, Inc. (f) | 5,700 | 121,410 | ||||||
|
| |||||||
| 171,522 | ||||||||
|
| |||||||
Machinery—Diversified 0.2% | ||||||||
AGCO Corp. | 1,800 | 96,246 | ||||||
Briggs & Stratton Corp. | 2,300 | 48,691 | ||||||
MAN S.E. | 804 | 87,229 | ||||||
Valmet Oyj | 1,323 | 16,588 | ||||||
|
| |||||||
| 248,754 | ||||||||
|
| |||||||
Media 0.6% | ||||||||
Nine Entertainment Co. Holdings, Ltd. | 16,818 | 14,450 | ||||||
Seven West Media, Ltd. | 87,658 | 70,650 | ||||||
Southern Cross Media Group, Ltd. | 14,500 | 11,907 | ||||||
Starz Class A (e)(f) | 2,200 | 59,862 | ||||||
¨Time Warner Cable, Inc. | 1,997 | 423,584 | ||||||
Time, Inc. | 3,300 | 48,510 | ||||||
|
| |||||||
| 628,963 | ||||||||
|
| |||||||
Metal Fabricate & Hardware 0.1% |
| |||||||
Global Brass & Copper Holdings, Inc. | 2,400 | 65,040 | ||||||
Granges AB | 2,159 | 15,929 | ||||||
|
| |||||||
| 80,969 | ||||||||
|
| |||||||
Mining 0.6% | ||||||||
Boliden AB | 1,218 | 21,234 | ||||||
Century Aluminum Co. (e) | 11,100 | 97,902 | ||||||
Coeur Mining, Inc. (e) | 7,200 | 58,320 | ||||||
Goldcorp, Inc. | 4,581 | 92,299 | ||||||
Northern Star Resources, Ltd. | 8,627 | 25,385 | ||||||
OZ Minerals, Ltd. | 20,755 | 92,793 | ||||||
Regis Resources, Ltd. | 42,756 | 94,278 | ||||||
Rio Tinto, Ltd. | 809 | 31,709 | ||||||
St. Barbara, Ltd. (e) | 52,042 | 91,803 | ||||||
|
| |||||||
| 605,723 | ||||||||
|
| |||||||
Miscellaneous—Manufacturing 0.4% |
| |||||||
AGFA-Gevaert N.V. (e) | 17,969 | 71,376 | ||||||
Carlisle Cos., Inc. | 900 | 91,710 | ||||||
Textron, Inc. (f) | 2,500 | 96,700 | ||||||
| The notes to the consolidated financial statements are an integral part of, and should be read in conjunction with, the consolidated financial statements. | 17 |
Consolidated Portfolio of Investments April 30, 2016 (continued)
| Shares | Value | |||||||
| Common Stocks (continued) | ||||||||
Miscellaneous—Manufacturing (continued) |
| |||||||
Trinity Industries, Inc. | 2,200 | $ | 42,922 | |||||
Trinseo S.A. (e) | 2,200 | 94,138 | ||||||
|
| |||||||
| 396,846 | ||||||||
|
| |||||||
Multi-National 0.1% |
| |||||||
Banco Latinoamericano de Comercio Exterior S.A. Class E | 2,500 | 64,650 | ||||||
|
| |||||||
Office Equipment/Supplies 0.0%‡ |
| |||||||
Xerox Corp. (f) | 3,700 | 35,520 | ||||||
|
| |||||||
Oil & Gas 1.3% |
| |||||||
Alon USA Energy, Inc. | 5,400 | 56,700 | ||||||
Antero Midstream Partners, L.P. (f) | 9,000 | 229,860 | ||||||
Beach Energy, Ltd. | 124,217 | 69,892 | ||||||
Cheniere Energy, Inc. (e)(f) | 3,500 | 136,080 | ||||||
Delek U.S. Holdings, Inc. | 3,900 | 61,971 | ||||||
EQT GP Holdings, L.P. (f) | 7,500 | 198,450 | ||||||
Murphy USA, Inc. (e) | 600 | 34,452 | ||||||
Nabors Industries, Ltd. | 2,300 | 22,540 | ||||||
PBF Energy, Inc. Class A | 1,200 | 38,616 | ||||||
QEP Resources, Inc. | 1,200 | 21,516 | ||||||
SM Energy Co. | 1,100 | 34,276 | ||||||
Suncor Energy, Inc. | 6,000 | 176,122 | ||||||
Valero Energy Partners, L.P. (f) | 3,300 | 157,377 | ||||||
VTTI Energy Partners, L.P. (f) | 7,700 | 154,000 | ||||||
|
| |||||||
| 1,391,852 | ||||||||
|
| |||||||
Oil & Gas Services 0.6% | ||||||||
Halliburton Co. | 2,000 | 82,620 | ||||||
McDermott International, Inc. (e) | 5,100 | 23,154 | ||||||
MRC Global, Inc. (e) | 6,000 | 83,880 | ||||||
NOW, Inc. (e)(f) | 4,900 | 88,494 | ||||||
Prosafe S.E. | 7,152 | 4,326 | ||||||
Superior Energy Services, Inc. | 1,500 | 25,290 | ||||||
Targa Resources Corp. (f) | 7,900 | 319,634 | ||||||
|
| |||||||
| 627,398 | ||||||||
|
| |||||||
Packaging & Containers 0.0%‡ | ||||||||
AEP Industries, Inc. | 800 | 49,304 | ||||||
|
| |||||||
Pharmaceuticals 1.3% |
| |||||||
AmerisourceBergen Corp. | 1,000 | 85,100 | ||||||
Amphastar Pharmaceuticals, Inc. (e) | 5,800 | 71,340 | ||||||
Australian Pharmaceutical Industries, Ltd. | 38,601 | 57,526 | ||||||
Celesio A.G. | 3,242 | 93,549 | ||||||
Enanta Pharmaceuticals, Inc. (e) | 2,900 | 84,680 | ||||||
FibroGen, Inc. (e) | 4,100 | 73,800 | ||||||
Herbalife, Ltd. (e) | 1,500 | 86,925 | ||||||
Horizon Pharma PLC (e) | 10,353 | 159,126 | ||||||
Mylan N.V. (e) | 2,097 | 87,466 | ||||||
Omega Protein Corp. (e) | 3,500 | 65,065 | ||||||
| Shares | Value | |||||||
Pharmaceuticals (continued) | ||||||||
Phibro Animal Health Corp. Class A | 1,100 | $ | 22,814 | |||||
SciClone Pharmaceuticals, Inc. (e)(f) | 8,300 | 109,560 | ||||||
Sigma Pharmaceuticals, Ltd. | 90,265 | 75,496 | ||||||
Sucampo Pharmaceuticals, Inc. Class A (e)(f) | 7,800 | 84,084 | ||||||
Supernus Pharmaceuticals, Inc. (e)(f) | 5,600 | 96,096 | ||||||
Taro Pharmaceutical Industries, Ltd. (e)(f) | 600 | 83,844 | ||||||
Valeant Pharmaceuticals International, Inc. (e) | 1,740 | 58,046 | ||||||
|
| |||||||
| 1,394,517 | ||||||||
|
| |||||||
Pipelines 3.9% | ||||||||
Buckeye Partners, L.P. (f) | 2,000 | 144,000 | ||||||
Dominion Midstream Partners, L.P. (f) | 6,600 | 221,364 | ||||||
Energy Transfer Equity, L.P. (f) | 22,600 | 280,918 | ||||||
Energy Transfer Partners, L.P. (f) | 8,600 | 304,698 | ||||||
Enterprise Products Partners, L.P. (f) | 12,600 | 336,294 | ||||||
EQT Midstream Partners, L.P. (f) | 2,100 | 166,509 | ||||||
Genesis Energy, L.P. (f) | 8,300 | 269,086 | ||||||
Kinder Morgan, Inc. (f) | 5,300 | 94,128 | ||||||
Magellan Midstream Partners, L.P. (f) | 3,400 | 245,038 | ||||||
MPLX, L.P. (f) | 9,000 | 289,710 | ||||||
NGL Energy Partners, L.P. | 15,800 | 201,924 | ||||||
ONEOK, Inc. (f) | 5,700 | 206,055 | ||||||
Phillips 66 Partners, L.P. (f) | 3,300 | 188,892 | ||||||
Plains All American Pipeline, L.P. (f) | 2,600 | 59,644 | ||||||
SemGroup Corp. Class A (f) | 7,800 | 239,148 | ||||||
Shell Midstream Partners, L.P. (f) | 6,500 | 245,505 | ||||||
Sunoco Logistics Partners, L.P. (f) | 9,800 | 286,944 | ||||||
Tesoro Logistics, L.P. (f) | 4,100 | 189,584 | ||||||
Western Gas Partners, L.P. (f) | 4,100 | 200,326 | ||||||
Williams Partners, L.P. | 3,000 | 90,690 | ||||||
|
| |||||||
| 4,260,457 | ||||||||
|
| |||||||
Real Estate Investment Trusts 0.3% | ||||||||
Rouse Properties, Inc. | 16,037 | 296,203 | ||||||
|
| |||||||
Retail 1.2% |
| |||||||
Abercrombie & Fitch Co. Class A | 2,500 | 66,825 | ||||||
Best Buy Co., Inc. | 586 | 18,799 | ||||||
Bilia AB Class A | 1,782 | 42,606 | ||||||
Brinker International, Inc. | 1,900 | 88,008 | ||||||
Byggmax Group AB | 3,445 | 27,884 | ||||||
Carrols Restaurant Group, Inc. (e) | 5,800 | 80,678 | ||||||
Coach, Inc. | 500 | 20,135 | ||||||
Dick’s Sporting Goods, Inc. | 400 | 18,536 | ||||||
Fred’s, Inc. Class A | 5,500 | 80,685 | ||||||
GameStop Corp. Class A | 700 | 22,960 | ||||||
GNC Holdings, Inc. Class A | 1,300 | 31,668 | ||||||
Harvey Norman Holdings, Ltd. | 22,304 | 75,976 | ||||||
Liberty Interactive Corp. QVC Group Class A (e) | 1,700 | 44,540 | ||||||
Movado Group, Inc. | 900 | 25,389 | ||||||
Myer Holdings, Ltd. | 36,652 | 28,844 | ||||||
| 18 | MainStay Absolute Return Multi-Strategy Fund | The notes to the consolidated financial statements are an integral part of, and should be read in conjunction with, the consolidated financial statements. |
| Shares | Value | |||||||
| Common Stocks (continued) | ||||||||
Retail (continued) | ||||||||
Office Depot, Inc. (e) | 19,199 | $ | 112,890 | |||||
PVH Corp. | 200 | 19,120 | ||||||
Rallye S.A. | 3,743 | 72,003 | ||||||
Regis Corp. (e) | 5,300 | 72,451 | ||||||
RONA, Inc. | 11,336 | 215,752 | ||||||
Ruby Tuesday, Inc. (e)(f) | 3,500 | 15,400 | ||||||
Staples, Inc. | 1,800 | 18,360 | ||||||
Urban Outfitters, Inc. (e) | 2,700 | 81,864 | ||||||
|
| |||||||
| 1,281,373 | ||||||||
|
| |||||||
Savings & Loans 0.1% | ||||||||
EverBank Financial Corp. | 700 | 10,556 | ||||||
Flagstar Bancorp, Inc. (e) | 2,100 | 49,707 | ||||||
New York Community Bancorp, Inc. | 3,800 | 57,114 | ||||||
|
| |||||||
| 117,377 | ||||||||
|
| |||||||
Semiconductors 0.3% | ||||||||
Amkor Technology, Inc. (e) | 6,500 | 37,115 | ||||||
Cree, Inc. (e) | 3,000 | 73,530 | ||||||
ON Semiconductor Corp. (e)(f) | 9,400 | 89,018 | ||||||
Rovi Corp. (e) | 2,700 | 47,574 | ||||||
Synaptics, Inc. (e) | 1,100 | 78,705 | ||||||
|
| |||||||
| 325,942 | ||||||||
|
| |||||||
Shipbuilding 0.1% | ||||||||
Huntington Ingalls Industries, Inc. | 600 | 86,862 | ||||||
Yangzijiang Shipbuilding Holdings, Ltd. | 56,000 | 41,224 | ||||||
|
| |||||||
| 128,086 | ||||||||
|
| |||||||
Software 0.7% | ||||||||
Akamai Technologies, Inc. (e) | 700 | 35,693 | ||||||
Allscripts Healthcare Solutions, Inc. (e)(f) | 7,300 | 97,820 | ||||||
Altium, Ltd. | 3,898 | 18,228 | ||||||
Citrix Systems, Inc. (e)(f) | 1,200 | 98,208 | ||||||
GameLoft S.E. (e) | 27,608 | 233,933 | ||||||
InnerWorkings, Inc. (e) | 200 | 1,634 | ||||||
Kudelski S.A. | 4,048 | 68,993 | ||||||
Nuance Communications, Inc. (e) | 4,900 | 84,182 | ||||||
Quality Systems, Inc. | 5,500 | 77,440 | ||||||
Rackspace Hosting, Inc. (e) | 1,900 | 43,453 | ||||||
Silverlake Axis, Ltd. | 70,600 | 29,660 | ||||||
|
| |||||||
| 789,244 | ||||||||
|
| |||||||
Telecommunications 1.3% | ||||||||
Chorus, Ltd. | 15,294 | 42,716 | ||||||
Cincinnati Bell, Inc. (e) | 6,200 | 23,684 | ||||||
EarthLink Holdings Corp. (f) | 7,100 | 41,251 | ||||||
EchoStar Corp. Class A (e) | 2,000 | 81,840 | ||||||
Extreme Networks, Inc. (e) | 17,400 | 61,074 | ||||||
General Communication, Inc. Class A (e)(f) | 4,400 | 74,360 | ||||||
Gigamon, Inc. (e) | 2,500 | 81,475 | ||||||
IDT Corp. Class B (f) | 2,600 | 39,884 | ||||||
| Shares | Value | |||||||
Telecommunications (continued) | ||||||||
Inteliquent, Inc. | 4,300 | $ | 71,337 | |||||
Koninklijke KPN N.V. | 47,069 | 185,134 | ||||||
NeoPhotonics Corp. (e) | 5,900 | 70,741 | ||||||
Ruckus Wireless, Inc. (e) | 8,355 | 114,798 | ||||||
Spark New Zealand, Ltd. | 32,714 | 84,746 | ||||||
T-Mobile U.S., Inc. (e) | 2,516 | 98,829 | ||||||
Telenor ASA | 5,512 | 94,880 | ||||||
Telephone & Data Systems, Inc. | 1,400 | 41,398 | ||||||
United States Cellular Corp. (e)(f) | 2,100 | 89,544 | ||||||
Vonage Holdings Corp. (e) | 17,900 | 83,593 | ||||||
|
| |||||||
| 1,381,284 | ||||||||
|
| |||||||
Transportation 0.5% | ||||||||
Ansaldo STS S.p.A. | 5,640 | 68,456 | ||||||
Aurizon Holdings, Ltd. | 26,283 | 85,333 | ||||||
BW LPG, Ltd. (a) | 6,213 | 37,347 | ||||||
Dfds A/S | 2,153 | 85,958 | ||||||
Euronav N.V. | 5,408 | 59,447 | ||||||
Gategroup Holding A.G. (e) | 3,719 | 204,888 | ||||||
Ryder System, Inc. | 400 | 27,568 | ||||||
Ship Finance International, Ltd. | 2,300 | 34,891 | ||||||
|
| |||||||
| 603,888 | ||||||||
|
| |||||||
Trucking & Leasing 0.0%‡ | ||||||||
Greenbrier Cos., Inc. (The) | 1,500 | 44,985 | ||||||
|
| |||||||
Total Common Stocks | 26,764,994 | |||||||
|
| |||||||
| Principal Amount | ||||||||
| Short-Term Investments 55.0% | ||||||||
Repurchase Agreements 39.2% | ||||||||
Fixed Income Clearing Corp. | $ | 39,104,487 | 39,104,487 | |||||
State Street Bank and Trust Co. | 3,997,226 | 3,997,226 | ||||||
|
| |||||||
Total Repurchase Agreements | 43,101,713 | |||||||
|
| |||||||
| The notes to the consolidated financial statements are an integral part of, and should be read in conjunction with, the consolidated financial statements. | 19 |
Consolidated Portfolio of Investments April 30, 2016 (continued)
| Principal Amount | Value | |||||||
| Short-Term Investments (continued) | ||||||||
U.S. Government 15.8% | ||||||||
United States Treasury Bills 15.8% |
| |||||||
0.00%, due 5/26/16 (g)(h) | $ | 14,704,000 | $ | 14,702,383 | ||||
0.00%, due 6/16/16 (g)(h) | 2,650,000 | 2,649,531 | ||||||
|
| |||||||
Total U.S. Government | 17,351,914 | |||||||
|
| |||||||
Total Short-Term Investments (Cost $60,451,810) | 60,453,627 | |||||||
|
| |||||||
Total Investments, Before Investments Sold Short | 95.4 | % | 104,837,305 | |||||
|
| |||||||
| Shares | ||||||||
Investments Sold Short (17.7%) Common Stocks Sold Short (14.5%) |
| |||||||
Aerospace & Defense (0.4%) | ||||||||
Aerovironment, Inc. (e) | (2,800 | ) | (80,864 | ) | ||||
B/E Aerospace, Inc. | (1,900 | ) | (92,397 | ) | ||||
Rockwell Collins, Inc. | (300 | ) | (26,457 | ) | ||||
TransDigm Group, Inc. (e) | (400 | ) | (91,148 | ) | ||||
Triumph Group, Inc. | (2,900 | ) | (104,922 | ) | ||||
|
| |||||||
| (395,788 | ) | |||||||
|
| |||||||
Airlines (0.1%) | ||||||||
Copa Holdings S.A. Class A | (1,300 | ) | (82,875 | ) | ||||
Spirit Airlines, Inc. (e) | (200 | ) | (8,786 | ) | ||||
|
| |||||||
| (91,661 | ) | |||||||
|
| |||||||
Apparel (0.1%) | ||||||||
Iconix Brand Group, Inc. (e) | (4,400 | ) | (37,312 | ) | ||||
Sequential Brands Group, Inc. (e) | (5,300 | ) | (29,415 | ) | ||||
|
| |||||||
| (66,727 | ) | |||||||
|
| |||||||
Auto Manufacturers (0.1%) | ||||||||
Navistar International Corp. (e) | (5,700 | ) | (86,013 | ) | ||||
|
| |||||||
Auto Parts & Equipment (0.1%) | ||||||||
Allison Transmission Holdings, Inc. | (3,300 | ) | (95,073 | ) | ||||
ARB Corp., Ltd. | (2,742 | ) | (33,608 | ) | ||||
|
| |||||||
| (128,681 | ) | |||||||
|
| |||||||
Banks (0.3%) | ||||||||
Banco Popular Espanol S.A. | (31,319 | ) | (85,172 | ) | ||||
BOK Financial Corp. | (1,000 | ) | (60,180 | ) | ||||
First Financial Bankshares, Inc. | (500 | ) | (16,190 | ) | ||||
First Horizon National Corp. | (3,600 | ) | (50,688 | ) | ||||
M&T Bank Corp. | (500 | ) | (59,160 | ) | ||||
Park National Corp. | (600 | ) | (55,080 | ) | ||||
Westamerica Bancorp. | (1,200 | ) | (58,464 | ) | ||||
|
| |||||||
| (384,934 | ) | |||||||
|
| |||||||
Beverages (0.1%) | ||||||||
Brown-Forman Corp. Class B | (100 | ) | (9,632 | ) | ||||
Monster Beverage Corp. (e) | (700 | ) | (100,954 | ) | ||||
|
| |||||||
| (110,586 | ) | |||||||
|
| |||||||
| Shares | Value | |||||||
Biotechnology (0.3%) | ||||||||
Advaxis, Inc. (e) | (1,500 | ) | $ | (11,610 | ) | |||
Aratana Therapeutics, Inc. (e) | (1,100 | ) | (6,611 | ) | ||||
Atara Biotherapeutics, Inc. (e) | (1,100 | ) | (19,811 | ) | ||||
Basilea Pharmaceutica A.G. Registered (e) | (281 | ) | (23,009 | ) | ||||
Bavarian Nordic A/S (e) | (530 | ) | (20,222 | ) | ||||
Esperion Therapeutics, Inc. (e) | (600 | ) | (9,834 | ) | ||||
Evolva Holding S.A. (e) | (53,279 | ) | (37,211 | ) | ||||
Genmab A/S (e) | (153 | ) | (22,669 | ) | ||||
Idera Pharmaceuticals, Inc. (e) | (5,000 | ) | (8,300 | ) | ||||
Innoviva, Inc. | (1,600 | ) | (19,744 | ) | ||||
Insmed, Inc. (e) | (1,200 | ) | (14,580 | ) | ||||
Karyopharm Therapeutics, Inc. (e) | (1,200 | ) | (11,160 | ) | ||||
Loxo Oncology, Inc. (e) | (800 | ) | (18,440 | ) | ||||
Mesoblast, Ltd. (e) | (9,797 | ) | (16,314 | ) | ||||
Omeros Corp. (e) | (1,300 | ) | (17,225 | ) | ||||
Organovo Holdings, Inc. (e) | (3,800 | ) | (10,336 | ) | ||||
Otonomy, Inc. (e) | (1,000 | ) | (14,260 | ) | ||||
OvaScience, Inc. (e) | (1,200 | ) | (10,056 | ) | ||||
Paratek Pharmaceuticals, Inc. (e) | (700 | ) | (9,534 | ) | ||||
Versartis, Inc. (e) | (1,200 | ) | (10,872 | ) | ||||
|
| |||||||
| (311,798 | ) | |||||||
|
| |||||||
Building Materials (0.3%) | ||||||||
AAON, Inc. | (300 | ) | (7,956 | ) | ||||
AFG Arbonia-Forster Holding A.G. Registered (e) | (799 | ) | (11,119 | ) | ||||
Caesarstone Sdot-Yam, Ltd. (e) | (2,300 | ) | (85,169 | ) | ||||
Fortune Brands Home & Security, Inc. | (500 | ) | (27,705 | ) | ||||
James Hardie Industries PLC | (5,880 | ) | (82,845 | ) | ||||
Trex Co., Inc. (e) | (1,700 | ) | (80,665 | ) | ||||
|
| |||||||
| (295,459 | ) | |||||||
|
| |||||||
Chemicals (0.4%) | ||||||||
FMC Corp. | (2,200 | ) | (95,172 | ) | ||||
Novozymes A/S Class B | (2,009 | ) | (96,282 | ) | ||||
Nufarm, Ltd. | (10,305 | ) | (55,005 | ) | ||||
Olin Corp. | (2,800 | ) | (61,012 | ) | ||||
Syngenta A.G. Registered | (217 | ) | (86,863 | ) | ||||
Tronox, Ltd. Class A | (7,400 | ) | (53,872 | ) | ||||
|
| |||||||
| (448,206 | ) | |||||||
|
| |||||||
Coal (0.1%) | ||||||||
Whitehaven Coal, Ltd. (e) | (102,558 | ) | (60,045 | ) | ||||
|
| |||||||
Commercial Services (0.8%) | ||||||||
Applus Services S.A. | (2,573 | ) | (23,747 | ) | ||||
Ezion Holdings, Ltd. (e) | (180,800 | ) | (73,941 | ) | ||||
HealthEquity, Inc. (e) | (3,500 | ) | (88,025 | ) | ||||
InvoCare, Ltd. | (5,334 | ) | (49,723 | ) | ||||
IPH, Ltd. | (5,430 | ) | (28,571 | ) | ||||
LifeLock, Inc. (e) | (6,800 | ) | (79,152 | ) | ||||
Macquarie Infrastructure Corp. | (1,400 | ) | (98,546 | ) | ||||
Monro Muffler Brake, Inc. | (1,100 | ) | (76,142 | ) | ||||
Qube Holdings, Ltd. | (33,770 | ) | (63,936 | ) | ||||
Recall Holdings, Ltd. (c)(i) | (6,099 | ) | (38,629 | ) | ||||
| 20 | MainStay Absolute Return Multi-Strategy Fund | The notes to the consolidated financial statements are an integral part of, and should be read in conjunction with, the consolidated financial statements. |
| Shares | Value | |||||||
| Common Stocks Sold Short (continued) | ||||||||
Commercial Services (continued) | ||||||||
Team, Inc. (e) | (1,400 | ) | $ | (40,222 | ) | |||
Transurban Group | (9,290 | ) | (81,797 | ) | ||||
Verisk Analytics, Inc. (e) | (1,100 | ) | (85,338 | ) | ||||
Weight Watchers International, Inc. (e) | (2,900 | ) | (37,555 | ) | ||||
|
| |||||||
| (865,324 | ) | |||||||
|
| |||||||
Computers (0.2%) | ||||||||
3D Systems Corp. (e) | (5,900 | ) | (104,371 | ) | ||||
Arcam AB (e) | (2,818 | ) | (61,410 | ) | ||||
Stratasys, Ltd. (e) | (1,700 | ) | (41,599 | ) | ||||
|
| |||||||
| (207,380 | ) | |||||||
|
| |||||||
Cosmetics & Personal Care (0.1%) | ||||||||
Coty, Inc. Class A | (3,000 | ) | (91,200 | ) | ||||
|
| |||||||
Distribution & Wholesale (0.1%) | ||||||||
Fastenal Co. | (1,800 | ) | (84,222 | ) | ||||
|
| |||||||
Diversified Financial Services (0.0%)‡ |
| |||||||
Julius Baer Group, Ltd. (e) | (878 | ) | (37,534 | ) | ||||
|
| |||||||
Electric (0.1%) | ||||||||
Red Electrica Corp. S.A. | (990 | ) | (88,387 | ) | ||||
|
| |||||||
Electrical Components & Equipment (0.0%)‡ |
| |||||||
Daetwyler Holding A.G. | (19 | ) | (2,824 | ) | ||||
|
| |||||||
Electronics (0.4%) |
| |||||||
Allegion PLC | (200 | ) | (13,090 | ) | ||||
FLIR Systems, Inc. | (2,700 | ) | (81,567 | ) | ||||
Garmin, Ltd. | (2,300 | ) | (98,049 | ) | ||||
Knowles Corp. (e) | (3,100 | ) | (41,447 | ) | ||||
National Instruments Corp. | (3,000 | ) | (82,710 | ) | ||||
TASER International, Inc. (e) | (2,100 | ) | (38,346 | ) | ||||
Trimble Navigation, Ltd. (e) | (2,200 | ) | (52,690 | ) | ||||
|
| |||||||
| (407,899 | ) | |||||||
|
| |||||||
Energy—Alternate Sources (0.1%) | ||||||||
Clean Energy Fuels Corp. (e) | (12,400 | ) | (35,464 | ) | ||||
Pattern Energy Group, Inc. | (4,200 | ) | (88,200 | ) | ||||
Plug Power, Inc. (e) | (12,900 | ) | (26,574 | ) | ||||
|
| |||||||
| (150,238 | ) | |||||||
|
| |||||||
Engineering & Construction (0.4%) |
| |||||||
Argan, Inc. | (2,200 | ) | (75,196 | ) | ||||
Chicago Bridge & Iron Co. N.V. | (1,400 | ) | (56,350 | ) | ||||
Exponent, Inc. | (300 | ) | (14,952 | ) | ||||
Sacyr S.A. | (24,012 | ) | (51,113 | ) | ||||
SBA Communications Corp. Class A (e) | (900 | ) | (92,736 | ) | ||||
Singapore Technologies Engineering, Ltd. | (34,200 | ) | (81,886 | ) | ||||
Sydney Airport | (15,659 | ) | (81,082 | ) | ||||
|
| |||||||
| (453,315 | ) | |||||||
|
| |||||||
| Shares | Value | |||||||
Entertainment (0.1%) | ||||||||
DreamWorks Animation SKG, Inc. Class A (e) | (700 | ) | $ | (27,944 | ) | |||
Lions Gate Entertainment Corp. | (2,800 | ) | (62,160 | ) | ||||
Scientific Games Corp. Class A (e) | (4,300 | ) | (42,656 | ) | ||||
|
| |||||||
| (132,760 | ) | |||||||
|
| |||||||
Environmental Controls (0.1%) | ||||||||
SIIC Environment Holdings, Ltd. (e) | (54,400 | ) | (28,315 | ) | ||||
Stericycle, Inc. (e) | (500 | ) | (47,780 | ) | ||||
|
| |||||||
| (76,095 | ) | |||||||
|
| |||||||
Finance—Auto Loans (0.1%) | ||||||||
Credit Acceptance Corp. (e) | (300 | ) | (58,881 | ) | ||||
|
| |||||||
Finance—Consumer Loans (0.2%) | ||||||||
Navient Corp. | (7,500 | ) | (102,525 | ) | ||||
Nelnet, Inc. Class A | (2,000 | ) | (83,820 | ) | ||||
|
| |||||||
| (186,345 | ) | |||||||
|
| |||||||
Finance—Investment Banker/Broker (0.0%)‡ |
| |||||||
Interactive Brokers Group, Inc. Class A | (400 | ) | (15,200 | ) | ||||
|
| |||||||
Finance—Leasing Companies (0.1%) | ||||||||
Aircastle, Ltd. | (3,700 | ) | (80,290 | ) | ||||
|
| |||||||
Finance—Mortgage Loan/Banker (0.1%) | ||||||||
Arlington Asset Investment Corp. Class A | (3,700 | ) | (47,878 | ) | ||||
Nationstar Mortgage Holdings, Inc. (e) | (4,500 | ) | (52,155 | ) | ||||
|
| |||||||
| (100,033 | ) | |||||||
|
| |||||||
Finance—Other Services (0.1%) |
| |||||||
CBOE Holdings, Inc. | (1,300 | ) | (80,548 | ) | ||||
WageWorks, Inc. (e) | (1,600 | ) | (86,176 | ) | ||||
|
| |||||||
| (166,724 | ) | |||||||
|
| |||||||
Food (0.5%) |
| |||||||
Barry Callebaut A.G. Registered (e) | (84 | ) | (98,684 | ) | ||||
Chefs’ Warehouse, Inc. (The) (e) | (4,000 | ) | (77,080 | ) | ||||
n Chocoladefabriken Lindt & Sprungli A.G. | (15 | ) | (91,786 | ) | ||||
n Chocoladefabriken Lindt & Sprungli A.G. Registered | (1 | ) | (73,168 | ) | ||||
GrainCorp, Ltd. Class A | (7,115 | ) | (44,307 | ) | ||||
Tootsie Roll Industries, Inc. | (2,269 | ) | (80,867 | ) | ||||
Woolworths, Ltd. | (4,659 | ) | (78,324 | ) | ||||
|
| |||||||
| (544,216 | ) | |||||||
|
| |||||||
Forest Products & Paper (0.1%) |
| |||||||
Deltic Timber Corp. | (1,300 | ) | (81,250 | ) | ||||
|
| |||||||
Health Care—Products (0.6%) | ||||||||
Accelerate Diagnostics, Inc. (e) | (1,400 | ) | (17,570 | ) | ||||
Bio-Techne Corp. | (200 | ) | (18,636 | ) | ||||
Cerus Corp. (e) | (13,600 | ) | (85,136 | ) | ||||
Endologix, Inc. (e) | (7,500 | ) | (84,075 | ) | ||||
GenMark Diagnostics, Inc. (e) | (3,800 | ) | (22,458 | ) | ||||
Henry Schein, Inc. (e) | (500 | ) | (84,350 | ) | ||||
Intuitive Surgical, Inc. (e) | (100 | ) | (62,636 | ) | ||||
| The notes to the consolidated financial statements are an integral part of, and should be read in conjunction with, the consolidated financial statements. | 21 |
Consolidated Portfolio of Investments April 30, 2016 (continued)
| Shares | Value | |||||||
| Common Stocks Sold Short (continued) | ||||||||
Health Care—Products (continued) | ||||||||
Nevro Corp. (e) | (700 | ) | $ | (47,075 | ) | |||
Patterson Cos., Inc. | (2,000 | ) | (86,700 | ) | ||||
QIAGEN N.V. (e) | (300 | ) | (6,738 | ) | ||||
Rockwell Medical, Inc. (e) | (4,800 | ) | (44,400 | ) | ||||
TransEnterix, Inc. (e) | (11,300 | ) | (16,950 | ) | ||||
Zimmer Biomet Holdings, Inc. | (800 | ) | (92,616 | ) | ||||
|
| |||||||
| (669,340 | ) | |||||||
|
| |||||||
Health Care—Services (0.7%) | ||||||||
AAC Holdings, Inc. (e) | (4,300 | ) | (88,537 | ) | ||||
Acadia Healthcare Co., Inc. (e) | (1,700 | ) | (107,423 | ) | ||||
Adeptus Health, Inc. Class A (e) | (1,500 | ) | (102,180 | ) | ||||
Brookdale Senior Living, Inc. (e) | (4,900 | ) | (90,454 | ) | ||||
Capital Senior Living Corp. (e) | (500 | ) | (10,030 | ) | ||||
Community Health Systems, Inc. (e) | (900 | ) | (17,172 | ) | ||||
Envision Healthcare Holdings, Inc. (e) | (4,200 | ) | (95,046 | ) | ||||
Healthscope, Ltd. | (39,926 | ) | (82,573 | ) | ||||
Laboratory Corporation of America Holdings (e) | (700 | ) | (87,724 | ) | ||||
MEDNAX, Inc. (e) | (1,400 | ) | (99,806 | ) | ||||
Raffles Medical Group, Ltd. | (10,100 | ) | (35,298 | ) | ||||
|
| |||||||
| (816,243 | ) | |||||||
|
| |||||||
Home Builders (0.1%) | ||||||||
LGI Homes, Inc. (e) | (1,700 | ) | (47,617 | ) | ||||
William Lyon Homes Class A (e) | (5,800 | ) | (81,780 | ) | ||||
|
| |||||||
| (129,397 | ) | |||||||
|
| |||||||
Household Products & Wares (0.1%) | ||||||||
OSIM International, Ltd. | (61,400 | ) | (63,461 | ) | ||||
|
| |||||||
Housewares (0.1%) | ||||||||
Newell Brands, Inc. | (1,300 | ) | (59,202 | ) | ||||
Toro Co. (The) | (200 | ) | (17,290 | ) | ||||
|
| |||||||
| (76,492 | ) | |||||||
|
| |||||||
Insurance (0.4%) | ||||||||
Ambac Financial Group, Inc. (e) | (5,000 | ) | (81,150 | ) | ||||
Gjensidige Forsikring ASA | (1,963 | ) | (33,620 | ) | ||||
Greenlight Capital Re, Ltd. Class A (e) | (3,700 | ) | (79,661 | ) | ||||
MBIA, Inc. (e) | (9,100 | ) | (70,980 | ) | ||||
ProAssurance Corp. | (1,600 | ) | (76,368 | ) | ||||
Tryg A/S | (4,548 | ) | (85,856 | ) | ||||
|
| |||||||
| (427,635 | ) | |||||||
|
| |||||||
Internet (0.7%) | ||||||||
Box, Inc. Class A (e) | (6,300 | ) | (81,459 | ) | ||||
Chegg, Inc. (e) | (14,700 | ) | (66,738 | ) | ||||
FireEye, Inc. (e) | (2,200 | ) | (38,170 | ) | ||||
GrubHub, Inc. (e) | (3,400 | ) | (89,148 | ) | ||||
Quotient Technology, Inc. (e) | (1,900 | ) | (22,078 | ) | ||||
SEEK, Ltd. | (6,658 | ) | (82,872 | ) | ||||
Splunk, Inc. (e) | (1,900 | ) | (98,762 | ) | ||||
| Shares | Value | |||||||
Internet (continued) | ||||||||
TripAdvisor, Inc. (e) | (1,400 | ) | $ | (90,426 | ) | |||
TrueCar, Inc. (e) | (12,100 | ) | (82,764 | ) | ||||
Wayfair, Inc. Class A (e) | (300 | ) | (11,325 | ) | ||||
Wix.com, Ltd. (e) | (4,000 | ) | (98,880 | ) | ||||
|
| |||||||
| (762,622 | ) | |||||||
|
| |||||||
Investment Company (0.0%)‡ | ||||||||
Investment AB Kinnevik Class B | (726 | ) | (20,884 | ) | ||||
|
| |||||||
Iron & Steel (0.2%) | ||||||||
Acerinox S.A. | (3,631 | ) | (42,887 | ) | ||||
n Cliffs Natural Resources, Inc. (e) | (28,200 | ) | (148,614 | ) | ||||
Outokumpu Oyj (e) | (14,842 | ) | (62,235 | ) | ||||
|
| |||||||
| (253,736 | ) | |||||||
|
| |||||||
Leisure Time (0.1%) | ||||||||
Corporate Travel Management, Ltd. | (4,811 | ) | (52,164 | ) | ||||
Harley-Davidson, Inc. | (1,200 | ) | (57,396 | ) | ||||
|
| |||||||
| (109,560 | ) | |||||||
|
| |||||||
Lodging (0.3%) | ||||||||
Belmond, Ltd. Class A (e) | (3,100 | ) | (28,396 | ) | ||||
Choice Hotels International, Inc. | (600 | ) | (30,396 | ) | ||||
Crown Resorts, Ltd. | (5,490 | ) | (49,299 | ) | ||||
Diamond Resorts International, Inc. (e) | (1,000 | ) | (21,210 | ) | ||||
La Quinta Holdings, Inc. (e) | (6,500 | ) | (83,005 | ) | ||||
Wynn Resorts, Ltd. | (900 | ) | (79,470 | ) | ||||
|
| |||||||
| (291,776 | ) | |||||||
|
| |||||||
Machinery—Construction & Mining (0.1%) |
| |||||||
Outotec Oyj (e) | (21,211 | ) | (84,472 | ) | ||||
|
| |||||||
Machinery—Diversified (0.3%) | ||||||||
Cognex Corp. | (2,400 | ) | (85,272 | ) | ||||
FLSmidth & Co. A/S | (1,936 | ) | (75,180 | ) | ||||
Graco, Inc. | (100 | ) | (7,839 | ) | ||||
Lindsay Corp. | (1,000 | ) | (76,460 | ) | ||||
Manitowoc Co., Inc. (The) | (4,200 | ) | (23,940 | ) | ||||
Power Solutions International, Inc. (e) | (1,700 | ) | (22,015 | ) | ||||
Zebra Technologies Corp. Class A (e) | (1,300 | ) | (81,328 | ) | ||||
|
| |||||||
| (372,034 | ) | |||||||
|
| |||||||
Media (0.1%) | ||||||||
Liberty Broadband Corp. | ||||||||
Class A (e) | (800 | ) | (45,856 | ) | ||||
Class C (e) | (600 | ) | (34,350 | ) | ||||
Promotora de Informaciones S.A. Class A (e) | (5,529 | ) | (39,138 | ) | ||||
Singapore Press Holdings, Ltd. | (2,800 | ) | (8,453 | ) | ||||
|
| |||||||
| (127,797 | ) | |||||||
|
| |||||||
Metal Fabricate & Hardware (0.1%) | ||||||||
RBC Bearings, Inc. (e) | (500 | ) | (36,650 | ) | ||||
Valmont Industries, Inc. | (700 | ) | (98,266 | ) | ||||
|
| |||||||
| (134,916 | ) | |||||||
|
| |||||||
| 22 | MainStay Absolute Return Multi-Strategy Fund | The notes to the consolidated financial statements are an integral part of, and should be read in conjunction with, the consolidated financial statements. |
| Shares | Value | |||||||
| Common Stocks Sold Short (continued) | ||||||||
Mining (0.4%) | ||||||||
Compass Minerals International, Inc. | (1,200 | ) | $ | (89,952 | ) | |||
Ferroglobe PLC | (9,200 | ) | (93,748 | ) | ||||
Independence Group NL | (37,094 | ) | (86,306 | ) | ||||
Nyrstar N.V. (e) | (33,505 | ) | (26,472 | ) | ||||
n Royal Gold, Inc. | (1,800 | ) | (112,716 | ) | ||||
Sandfire Resources NL | (3,245 | ) | (14,631 | ) | ||||
Syrah Resources, Ltd. (e) | (13,311 | ) | (47,872 | ) | ||||
U.S. Silica Holdings, Inc. | (500 | ) | (12,775 | ) | ||||
|
| |||||||
| (484,472 | ) | |||||||
|
| |||||||
Miscellaneous—Manufacturing (0.2%) | ||||||||
Ansell, Ltd. | (5,920 | ) | (89,710 | ) | ||||
AptarGroup, Inc. | (400 | ) | (30,400 | ) | ||||
Orica, Ltd. | (1,909 | ) | (22,208 | ) | ||||
Proto Labs, Inc. (e) | (700 | ) | (41,881 | ) | ||||
Raven Industries, Inc. | (4,600 | ) | (74,014 | ) | ||||
|
| |||||||
| (258,213 | ) | |||||||
|
| |||||||
Oil & Gas (0.3%) | ||||||||
Antero Resources Corp. (e) | (400 | ) | (11,320 | ) | ||||
Atwood Oceanics, Inc. | (1,200 | ) | (11,592 | ) | ||||
Cabot Oil & Gas Corp. | (400 | ) | (9,360 | ) | ||||
Caltex Australia, Ltd. | (733 | ) | (18,114 | ) | ||||
Cimarex Energy Co. | (100 | ) | (10,888 | ) | ||||
Concho Resources, Inc. (e) | (100 | ) | (11,617 | ) | ||||
Continental Resources, Inc. (e) | (200 | ) | (7,452 | ) | ||||
Diamond Offshore Drilling, Inc. | (400 | ) | (9,704 | ) | ||||
Diamondback Energy, Inc. (e) | (100 | ) | (8,658 | ) | ||||
DNO ASA (e) | (30,205 | ) | (34,868 | ) | ||||
EQT Corp. | (200 | ) | (14,020 | ) | ||||
Fairmount Santrol Holdings, Inc. (e) | (3,900 | ) | (15,600 | ) | ||||
Gulfport Energy Corp. (e) | (400 | ) | (12,520 | ) | ||||
Kosmos Energy, Ltd. (e) | (1,700 | ) | (11,016 | ) | ||||
Laredo Petroleum, Inc. (e) | (1,300 | ) | (15,834 | ) | ||||
Liquefied Natural Gas, Ltd. (e) | (42,559 | ) | (19,739 | ) | ||||
Oil Search, Ltd. | (11,536 | ) | (61,663 | ) | ||||
Pioneer Natural Resources Co. | (100 | ) | (16,610 | ) | ||||
Range Resources Corp. | (300 | ) | (13,233 | ) | ||||
Rice Energy, Inc. (e) | (800 | ) | (13,848 | ) | ||||
RSP Permian, Inc. (e) | (400 | ) | (12,244 | ) | ||||
|
| |||||||
| (339,900 | ) | |||||||
|
| |||||||
Oil & Gas Services (0.2%) | ||||||||
Flotek Industries, Inc. (e) | (3,500 | ) | (33,075 | ) | ||||
Frank’s International N.V. | (600 | ) | (9,990 | ) | ||||
Petroleum Geo-Services ASA | (8,652 | ) | (30,613 | ) | ||||
Schoeller-Bleckmann Oilfield Equipment A.G. | (1,323 | ) | (89,213 | ) | ||||
SEACOR Holdings, Inc. (e) | (100 | ) | (5,877 | ) | ||||
|
| |||||||
| (168,768 | ) | |||||||
|
| |||||||
Pharmaceuticals (0.6%) | ||||||||
Aerie Pharmaceuticals, Inc. (e) | (1,000 | ) | (15,860 | ) | ||||
Amicus Therapeutics, Inc. (e) | (2,700 | ) | (20,169 | ) | ||||
| Shares | Value | |||||||
Pharmaceuticals (continued) | ||||||||
Cempra, Inc. (e) | (1,300 | ) | $ | (22,009 | ) | |||
Clovis Oncology, Inc. (e) | (1,100 | ) | (15,301 | ) | ||||
Cosmo Pharmaceuticals S.A. (e) | (86 | ) | (14,200 | ) | ||||
DexCom, Inc. (e) | (1,500 | ) | (96,570 | ) | ||||
Flexion Therapeutics, Inc. (e) | (1,100 | ) | (11,440 | ) | ||||
Greencross, Ltd. | (14,098 | ) | (76,215 | ) | ||||
Heron Therapeutics, Inc. (e) | (1,100 | ) | (23,584 | ) | ||||
Intra-Cellular Therapies, Inc. (e) | (600 | ) | (20,592 | ) | ||||
Mirati Therapeutics, Inc. (e) | (800 | ) | (16,576 | ) | ||||
Natural Grocers by Vitamin Cottage, Inc. (e) | (500 | ) | (6,680 | ) | ||||
Northwest Biotherapeutics, Inc. (e) | (4,500 | ) | (6,300 | ) | ||||
Ocular Therapeutix, Inc. (e) | (1,200 | ) | (14,736 | ) | ||||
Premier, Inc. Class A (e) | (2,700 | ) | (91,287 | ) | ||||
Radius Health, Inc. (e) | (700 | ) | (24,920 | ) | ||||
Relypsa, Inc. (e) | (1,500 | ) | (27,150 | ) | ||||
Revance Therapeutics, Inc. (e) | (1,200 | ) | (22,056 | ) | ||||
Santhera Pharmaceutical Holding A.G. Registered (e) | (265 | ) | (19,365 | ) | ||||
Sarepta Therapeutics, Inc. (e) | (1,100 | ) | (15,609 | ) | ||||
TG Therapeutics, Inc. (e) | (2,200 | ) | (20,042 | ) | ||||
TherapeuticsMD, Inc. (e) | (3,100 | ) | (25,575 | ) | ||||
VCA, Inc. (e) | (1,600 | ) | (100,752 | ) | ||||
Vital Therapies, Inc. (e) | (900 | ) | (7,713 | ) | ||||
|
| |||||||
| (714,701 | ) | |||||||
|
| |||||||
Pipelines (0.0%)‡ | ||||||||
APA Group | (2,920 | ) | (19,427 | ) | ||||
|
| |||||||
Real Estate (0.0%)‡ | ||||||||
REA Group, Ltd. | (500 | ) | (19,359 | ) | ||||
|
| |||||||
Retail (0.7%) | ||||||||
BMC Stock Holdings, Inc. (e) | (1,000 | ) | (17,550 | ) | ||||
CarMax, Inc. (e) | (1,800 | ) | (95,310 | ) | ||||
Conn’s, Inc. (e) | (2,500 | ) | (34,350 | ) | ||||
Container Store Group, Inc. (The) (e) | (1,700 | ) | (12,070 | ) | ||||
Dollar Tree, Inc. (e) | (1,100 | ) | (87,681 | ) | ||||
Dunkin’ Brands Group, Inc. | (700 | ) | (32,550 | ) | ||||
El Pollo Loco Holdings, Inc. (e) | (2,100 | ) | (27,699 | ) | ||||
Five Below, Inc. (e) | (1,900 | ) | (79,230 | ) | ||||
Habit Restaurants, Inc. (The) Class A (e) | (4,300 | ) | (72,025 | ) | ||||
Hennes & Mauritz AB Class B | (1,094 | ) | (38,894 | ) | ||||
MarineMax, Inc. (e) | (2,300 | ) | (43,723 | ) | ||||
Sears Holdings Corp. (e) | (5,200 | ) | (85,150 | ) | ||||
Shake Shack, Inc. Class A (e) | (2,400 | ) | (87,648 | ) | ||||
Zoe’s Kitchen, Inc. (e) | (900 | ) | (33,741 | ) | ||||
|
| |||||||
| (747,621 | ) | |||||||
|
| |||||||
Semiconductors (0.1%) | ||||||||
IPG Photonics Corp. (e) | (900 | ) | (78,003 | ) | ||||
Nordic Semiconductor ASA (e) | (4,783 | ) | (27,830 | ) | ||||
|
| |||||||
| (105,833 | ) | |||||||
|
| |||||||
| The notes to the consolidated financial statements are an integral part of, and should be read in conjunction with, the consolidated financial statements. | 23 |
Consolidated Portfolio of Investments April 30, 2016 (continued)
| Shares | Value | |||||||
| Common Stocks Sold Short (continued) | ||||||||
Shipbuilding (0.0%)‡ | ||||||||
Vard Holdings, Ltd. (e) | (73,200 | ) | $ | (9,906 | ) | |||
|
| |||||||
Software (1.1%) | ||||||||
2U, Inc. (e) | (2,100 | ) | (58,863 | ) | ||||
Actua Corp. (e) | (5,000 | ) | (47,400 | ) | ||||
Autodesk, Inc. (e) | (1,400 | ) | (83,748 | ) | ||||
Benefitfocus, Inc. (e) | (1,300 | ) | (49,270 | ) | ||||
Castlight Health, Inc. Class B (e) | (17,300 | ) | (62,280 | ) | ||||
CyberArk Software, Ltd. (e) | (1,900 | ) | (77,596 | ) | ||||
Hortonworks, Inc. (e) | (7,600 | ) | (87,932 | ) | ||||
IGG, Inc. | (30,000 | ) | (13,072 | ) | ||||
inContact, Inc. (e) | (4,200 | ) | (39,102 | ) | ||||
Inovalon Holdings, Inc. Class A (e) | (300 | ) | (5,130 | ) | ||||
MobileIron, Inc. (e) | (7,300 | ) | (27,959 | ) | ||||
NetSuite, Inc. (e) | (1,300 | ) | (105,352 | ) | ||||
New Relic, Inc. (e) | (2,900 | ) | (74,762 | ) | ||||
OPOWER, Inc. (e) | (7,700 | ) | (60,830 | ) | ||||
pdvWireless, Inc. (e) | (400 | ) | (16,152 | ) | ||||
ServiceNow, Inc. (e) | (1,100 | ) | (78,628 | ) | ||||
SimCorp A/S | (1,516 | ) | (68,153 | ) | ||||
SS&C Technologies Holding, Inc. | (1,400 | ) | (85,610 | ) | ||||
TubeMogul, Inc. (e) | (5,400 | ) | (69,984 | ) | ||||
Workday, Inc. Class A (e) | (1,200 | ) | (89,976 | ) | ||||
|
| |||||||
| (1,201,799 | ) | |||||||
|
| |||||||
Storage & Warehousing (0.0%)‡ | ||||||||
Mobile Mini, Inc. | (700 | ) | (22,575 | ) | ||||
|
| |||||||
Telecommunications (0.9%) | ||||||||
Arista Networks, Inc. (e) | (1,500 | ) | (99,930 | ) | ||||
CommScope Holding Co., Inc. (e) | (3,300 | ) | (100,353 | ) | ||||
Globalstar, Inc. (e) | (26,700 | ) | (52,065 | ) | ||||
Loral Space & Communications, Inc. (e) | (2,100 | ) | (77,028 | ) | ||||
Oclaro, Inc. (e) | (15,700 | ) | (79,285 | ) | ||||
ORBCOMM, Inc. (e) | (8,700 | ) | (86,217 | ) | ||||
Palo Alto Networks, Inc. (e) | (600 | ) | (90,522 | ) | ||||
StarHub, Ltd. | (17,600 | ) | (43,318 | ) | ||||
TDC A/S | (18,260 | ) | (93,439 | ) | ||||
Tele2 AB Class B | (9,831 | ) | (93,775 | ) | ||||
TPG Telecom, Ltd. | (9,136 | ) | (74,398 | ) | ||||
Ubiquiti Networks, Inc. (e) | (2,200 | ) | (78,364 | ) | ||||
West Corp. | (3,400 | ) | (72,862 | ) | ||||
|
| |||||||
| (1,041,556 | ) | |||||||
|
| |||||||
Transportation (0.1%) | ||||||||
CAI International, Inc. (e) | (1,100 | ) | (11,242 | ) | ||||
Construcciones y Auxiliar de Ferrocarriles S.A. | (9 | ) | (2,927 | ) | ||||
Dorian LPG, Ltd. (e) | (800 | ) | (8,128 | ) | ||||
GasLog, Ltd. | (1,100 | ) | (14,091 | ) | ||||
Golden Ocean Group, Ltd. (e) | (15,100 | ) | (13,092 | ) | ||||
| Shares | Value | |||||||
Transportation (continued) | ||||||||
Panalpina Welttransport Holding A.G. Registered | (208 | ) | $ | (24,306 | ) | |||
Scorpio Bulkers, Inc. (e) | (4,825 | ) | (18,576 | ) | ||||
Tidewater, Inc. | (1,200 | ) | (10,512 | ) | ||||
TORM A/S (e)(i) | (298 | ) | (3,782 | ) | ||||
TORM PLC (e) | (1,758 | ) | (22,314 | ) | ||||
XPO Logistics, Inc. (e) | (1,300 | ) | (39,182 | ) | ||||
|
| |||||||
| (168,152 | ) | |||||||
|
| |||||||
Trucking & Leasing (0.1%) | ||||||||
Textainer Group Holdings, Ltd. | (5,900 | ) | (91,037 | ) | ||||
|
| |||||||
Total Common Stocks Sold Short | (15,943,699 | ) | ||||||
|
| |||||||
| Exchange-Traded Funds Sold Short (3.2%) (j) | ||||||||
n SPDR S&P 500 ETF Trust | (2,800 | ) | (577,640 | ) | ||||
n United States Oil Fund, L.P. (e) | (261,000 | ) | (2,949,300 | ) | ||||
|
| |||||||
Total Exchange-Traded Funds Sold Short | (3,526,940 | ) | ||||||
|
| |||||||
| Warrants Sold Short (0.0%)‡ | ||||||||
Commercial Banks (0.0%)‡ | ||||||||
Ezion Holdings, Ltd. | (36,160 | ) | (4,302 | ) | ||||
|
| |||||||
Total Warrants Sold Short | (4,302 | ) | ||||||
|
| |||||||
Total Investments Sold Short | (17.7 | )% | (19,474,941 | ) | ||||
|
| |||||||
Total Investments, Net of Investments Sold Short | 77.7 | 85,362,364 | ||||||
Other Assets, Less Liabilities | 22.3 | 24,435,074 | ||||||
Net Assets | 100.0 | % | $ | 109,797,438 | ||||
| ‡ | Less than one-tenth of a percent. |
| (a) | May be sold to institutional investors only under Rule 144A or securities offered pursuant to Section 4(a)(2) of the Securities Act of 1933, as amended. |
| (b) | Floating rate—Rate shown was the rate in effect as of April 30, 2016. |
| (c) | Illiquid security—As of April 30, 2016, the total market value of these securities deemed illiquid under procedures approved by the Board of Trustees was $736,262, which represented 0.7% of the Fund’s net assets. |
| (d) | PIK (“Payment-in-Kind”)—issuer may pay interest or dividends with additional securities and/or in cash. |
| (e) | Non-income producing security. |
| 24 | MainStay Absolute Return Multi-Strategy Fund | The notes to the consolidated financial statements are an integral part of, and should be read in conjunction with, the consolidated financial statements. |
| (f) | Security, or a portion thereof, was maintained in a segregated account at the Fund’s custodian as collateral for securities sold short (See Note 2(O)). |
| (g) | Interest rate shown represents yield to maturity. |
| (h) | Security, or a portion thereof, was maintained in a segregated account at the Fund’s custodian as collateral for swap contracts. (See Note 2(J)) |
| (i) | Fair valued security—Represents fair value as measured in good faith under procedures approved by the Board of Trustees. As of April 30, 2016, the total market value of these securities was $(42,411), which represented less than one-tenth of a percent of the Fund’s net assets. |
| (j) | Exchange-Traded Fund—An investment vehicle that represents a basket of securities that is traded on an exchange. |
| (k) | As of April 30, 2016, cash in the amount of $20,103,870 was on deposit with brokers for short sale transactions. |
| (l) | As of April 30, 2016, cost was $104,377,153 for federal income tax purposes and net unrealized appreciation was as follows: |
Gross unrealized appreciation | $ | 1,722,028 | ||
Gross unrealized depreciation | (1,261,876 | ) | ||
|
| |||
Net unrealized appreciation | $ | 460,152 | ||
|
|
As of April 30, 2016, the Fund held the following foreign currency forward contracts:
Foreign Currency Buy Contracts | Expiration Date | Counterparty | Contract Amount Purchased | Contract Amount Sold | Unrealized Appreciation (Depreciation) | |||||||||||||||||
Euro vs. U.S. Dollar | 5/27/16 | Societe Generale | EUR | 523,758 | $ | 592,423 | $ | 7,720 | ||||||||||||||
Foreign Currency Sales Contracts | Contract Amount Sold | Contract Amount Purchased | ||||||||||||||||||||
Canadian Dollar vs. U.S. Dollar | 6/17/16 | Societe Generale | CAD | 600,000 | 455,503 | (22,702 | ) | |||||||||||||||
Euro vs. U.S. Dollar | 6/17/16 | Societe Generale | EUR | 1,450,000 | 1,611,762 | (50,808 | ) | |||||||||||||||
Euro vs. U.S. Dollar | 5/27/16 | Societe Generale | 9,050,000 | 10,229,146 | (140,705 | ) | ||||||||||||||||
Pound Sterling vs. U.S. Dollar | 5/27/16 | Societe Generale | GBP | 518,000 | 741,474 | (15,443 | ) | |||||||||||||||
Swiss Franc vs. U.S. Dollar | 6/17/16 | Societe Generale | CHF | 470,000 | 481,015 | (9,871 | ) | |||||||||||||||
Net unrealized appreciation (depreciation) on foreign currency forward contracts |
| $ | (231,809 | ) | ||||||||||||||||||
As of April 30, 2016, the Fund held the following futures contracts1:
Type | Number of Contracts (Short) | Expiration Date | Notional Amount | Unrealized Appreciation (Depreciation)2 | ||||||||||||
| 10-Year United States Treasury Note | (1 | ) | June 2016 | $ | (130,062 | ) | $ | 334 | ||||||||
| Euro-Bobl | (30 | ) | June 2016 | (4,494,895 | ) | 24,334 | ||||||||||
| Euro-Bund | (2 | ) | June 2016 | (370,722 | ) | 4,096 | ||||||||||
|
|
|
| |||||||||||||
| $ | (4,995,679 | ) | $ | 28,764 | ||||||||||||
|
|
|
| |||||||||||||
| 1. | As of April 30, 2016, cash in the amount of $46,651 was on deposit with a broker for futures transactions. |
| 2. | Represents the difference between the value of the contracts at the time they were opened and the value as of April 30, 2016. |
| The notes to the consolidated financial statements are an integral part of, and should be read in conjunction with, the consolidated financial statements. | 25 |
Consolidated Portfolio of Investments April 30, 2016 (continued)
As of April 30, 2016, the Fund held the following centrally cleared interest rate swap contracts1:
Notional | Currency | Expiration Date | Payments made by Fund | Payments Received by Fund | Upfront Premiums Received/ (Paid) | Value | Unrealized Appreciation / (Depreciation) | |||||||||||||||||||||||
| $9,500,000 | USD | 6/23/2017 | Fixed 0.877 | % | 3-Month USD-LIBOR | $ | — | $ | (8,647 | ) | $ | (8,647 | ) | |||||||||||||||||
| 3,250,000 | USD | 1/22/2018 | Fixed 0.870 | % | 3-Month USD-LIBOR | — | 463 | 463 | ||||||||||||||||||||||
| 1,250,000 | USD | 2/25/2018 | Fixed 0.800 | % | 3-Month USD-LIBOR | — | 2,064 | 2,064 | ||||||||||||||||||||||
| 2,300,000 | USD | 6/23/2025 | 3-Month USD-LIBOR | Fixed 2.366 | % | — | 146,525 | 146,525 | ||||||||||||||||||||||
| 750,000 | USD | 1/22/2026 | 3-Month USD-LIBOR | Fixed 1.836 | % | — | 12,468 | 12,468 | ||||||||||||||||||||||
| $ | — | $ | 152,873 | $ | 152,873 | |||||||||||||||||||||||||
As of April 30, 2016, the Fund held the following centrally cleared credit default swap contracts1:
Reference Entity | Termination Date | Buy/Sell Protection2 | Notional Amount (000)3 | (Pay)/ Receive Fixed Rate4 | Upfront Premiums Received/ (Paid) | Value | Unrealized Appreciation/ (Depreciation)5 | |||||||||||||||||||||
Markit iTraxx Europe Crossover Series 23 | 6/20/2020 | Buy | EUR 2,000 | (5.00 | )% | $ | (156,802 | ) | $ | (165,246 | ) | $ | (8,444 | ) | ||||||||||||||
Markit iTraxx Europe Crossover Series 23 | 6/20/2020 | Sell | 2,000 | 5.00 | % | 149,472 | 165,246 | 15,774 | ||||||||||||||||||||
Markit iTraxx Europe Crossover Series 24 | 12/20/2020 | Buy | 2,850 | (5.00 | )% | (179,039 | ) | (223,751 | ) | (44,712 | ) | |||||||||||||||||
Markit iTraxx Europe Crossover Series 24 | 12/20/2020 | Sell | 2,850 | 5.00 | % | 210,428 | 223,751 | 13,323 | ||||||||||||||||||||
Markit iTraxx Europe Crossover Series 25 | 6/20/2021 | Buy | 2,000 | (5.00 | )% | (210,305 | ) | (197,021 | ) | 13,284 | ||||||||||||||||||
Markit iTraxx Europe Crossover Series 25 | 6/20/2021 | Buy | 300 | (5.00 | )% | (32,437 | ) | (29,553 | ) | 2,884 | ||||||||||||||||||
Markit iTraxx Europe Senior Financials Series 24 | 12/20/2020 | Buy | 700 | (1.00 | )% | 874 | (5,963 | ) | (6,837 | ) | ||||||||||||||||||
Markit iTraxx Europe Senior Financials Series 24 | 12/20/2020 | Sell | 700 | 1.00 | % | 7,194 | 5,963 | (1,231 | ) | |||||||||||||||||||
Markit iTraxx Europe Senior Financials Series 25 | 6/20/2021 | Buy | 700 | (1.00 | )% | (4,547 | ) | (4,186 | ) | 361 | ||||||||||||||||||
Markit CDX North American High Yield Series 26 | 6/20/2021 | Sell | $ 9,800 | 5.00 | % | 207,948 | 278,177 | 70,229 | ||||||||||||||||||||
Markit CDX North American Investment Grade Series 26 | 6/20/2021 | Sell | 3,000 | 1.00 | % | 27,664 | 32,378 | 4,714 | ||||||||||||||||||||
| $ | 20,450 | $ | 79,795 | $ | 59,345 | |||||||||||||||||||||||
| 26 | MainStay Absolute Return Multi-Strategy Fund | The notes to the consolidated financial statements are an integral part of, and should be read in conjunction with, the consolidated financial statements. |
As of April 30, 2016, the Fund held the following OTC credit default swap contracts:
Reference Entity | Counterparty | Termination Date | Buy/Sell Protection2 | Notional Amount (000)3 | (Pay)/ Receive Fixed Rate4 | Upfront Premiums Received/ (Paid) | Value | Unrealized Appreciation/ (Depreciation)5 | ||||||||||||||||||||||||
Bayer A.G. | Societe Generale S.A. | 6/20/2021 | Buy | EUR 150 | (1.00 | )% | $ | (3,978 | ) | $ | (5,390 | ) | $ | (1,412 | ) | |||||||||||||||||
E.ON International Finance B.V. | BNP Paribas S.A. | 6/20/2021 | Buy | 125 | (1.00 | )% | 488 | (214 | ) | (702 | ) | |||||||||||||||||||||
Electricite de France S.A. | Societe Generale S.A. | 6/20/2021 | Buy | 250 | (1.00 | )% | (1,432 | ) | (3,363 | ) | (1,931 | ) | ||||||||||||||||||||
Fiat Chrysler Finance North America, Inc. | BNP Paribas S.A. | 6/20/2021 | Sell | 120 | 5.00 | % | 10,350 | 9,656 | (694 | ) | ||||||||||||||||||||||
Fortum Oyj | BNP Paribas S.A. | 6/20/2021 | Buy | 150 | (1.00 | )% | (941 | ) | (2,342 | ) | (1,401 | ) | ||||||||||||||||||||
Koninklijke KPN N.V. | Societe Generale S.A. | 6/20/2021 | Buy | 250 | (1.00 | )% | (3,426 | ) | (3,760 | ) | (334 | ) | ||||||||||||||||||||
Orange S.A. | BNP Paribas S.A. | 6/20/2021 | Buy | 250 | (1.00 | )% | (4,314 | ) | (4,416 | ) | (102 | ) | ||||||||||||||||||||
Total Capital S.A. | BNP Paribas S.A. | 6/20/2021 | Buy | 200 | (1.00 | )% | (4,048 | ) | (5,180 | ) | (1,132 | ) | ||||||||||||||||||||
| $ | (7,301 | ) | $ | (15,009 | ) | $ | (7,708 | ) | ||||||||||||||||||||||||
| 1. | As of April 30, 2016, cash in the amount of $814,747 was on deposit with a broker for centrally cleared swap agreements. |
| 2. | Buy—Fund pays premium and buys credit protection. If a credit event occurs, as defined under the terms of that particular swap agreement, the Fund will either (i) receive from the seller of protection an amount equal to the notional amount of the swap and deliver the referenced obligation or underlying securities comprising the referenced index or (ii) receive a net settlement amount in the form of cash or securities equal to the notional amount of the swap less the recovery value of the referenced obligation or underlying securities comprising the referenced index. |
| Sell—Fund receives premium and sells credit protection. If a credit event occurs, as defined under the terms of that particular swap agreement, the Fund will either (i) pay to the buyer of protection an amount equal to the notional amount of the swap and take delivery of the referenced obligation or underlying securities comprising the referenced index or (ii) pay a net settlement amount in the form of cash or securities equal to the notional amount of the swap less the recovery value of the referenced obligation or underlying securities comprising the referenced index. |
| 3. | The maximum potential amount the Fund could be required to pay as a seller of credit protection or receive as a buyer of credit protection if a credit event occurs as defined under the terms of that particular swap contract. |
| 4. | The annual fixed rate represents the interest received by the Fund (as a seller of protection) or paid by the Fund (as a buyer of protection) annually on the notional amount of the credit default swap contract. |
| 5. | Represents the difference between the value of the credit default swap contracts at the time they were opened and the value at April 30, 2016. |
| The notes to the consolidated financial statements are an integral part of, and should be read in conjunction with, the consolidated financial statements. | 27 |
Consolidated Portfolio of Investments April 30, 2016 (continued)
Total Return Swap Contracts
Open OTC total return equity swap contracts as of April 30, 2016 were as follows1:
Swap Counterparty | Reference Obligation | Rate(s) (Paid)/Received by the Fund2 | Termination Date(s) | Notional Amount (000)* | Unrealized Appreciation | |||||||||||
Deutsche Bank | Aareal Bank A.G. | 1 Month LIBOR BBA plus 0.45% | 7/20/2016 | $ | 1 | $ | 180 | |||||||||
UBS AG | Airgas, Inc. | 1 Month LIBOR BBA plus 0.35% | 6/24/2016 | 316 | 975 | |||||||||||
Citibank NA | Alibaba Group Holding, Ltd. | 1 Month LIBOR BBA minus 0.35% | 6/24/2016 | (89 | ) | 2,028 | ||||||||||
Deutsche Bank | Allied Minds PLC | 1 Month LIBOR BBA minus 8.00% | 7/20/2016 | (36 | ) | 7,597 | ||||||||||
Deutsche Bank | Altice N.V. | 1 Month LIBOR BBA minus 0.45% | 8/9/2016 | (93 | ) | 11,556 | ||||||||||
Deutsche Bank | Amerisur Resources PLC | 1 Month LIBOR BBA minus 9.00% | 7/7/2016 | (7 | ) | 649 | ||||||||||
Deutsche Bank | Anglo American PLC | 1 Month LIBOR BBA plus 0.45% | 7/20/2016 | 95 | 38,465 | |||||||||||
Deutsche Bank | APERAM S.A. | 1 Month LIBOR BBA plus 0.45% | 8/9/2016 | 79 | 7,860 | |||||||||||
Deutsche Bank | Arcadis N.V. | 1 Month LIBOR BBA minus 1.25% | 8/9/2016 | (11 | ) | 1,032 | ||||||||||
Deutsche Bank | Associated British Foods PLC | 1 Month LIBOR BBA minus 0.45% | 7/7/2016 | (22 | ) | 1,626 | ||||||||||
Deutsche Bank | AVEVA Group PLC | 1 Month LIBOR BBA minus 0.45% | 7/20/2016 | (107 | ) | 15,293 | ||||||||||
Deutsche Bank | Banca IFIS S.p.A. | 1 Month LIBOR BBA plus 0.45% | 7/20/2016 | 55 | 14,781 | |||||||||||
Deutsche Bank | Banca Monte dei Paschi di Siena S.p.A. | 1 Month LIBOR BBA minus 7.00% | 7/20/2016 | (116 | ) | 38,940 | ||||||||||
Deutsche Bank | BE Semiconductor Industries N.V. | 1 Month LIBOR BBA plus 0.45% | 8/9/2016 | 58 | 29,683 | |||||||||||
Deutsche Bank | Cairn Energy PLC | 1 Month LIBOR BBA plus 0.45% | 7/7/2016 | 23 | 9,988 | |||||||||||
Deutsche Bank | Carl Zeiss Meditec A.G. | 1 Month LIBOR BBA plus 0.45% | 7/20/2016 | 17 | 1,481 | |||||||||||
Morgan Stanley Capital Services LLC | Cisco Systems, Inc. | US Federal Funds Rate minus 0.30% | 5/18/2016 | (78 | ) | 1,967 | ||||||||||
Deutsche Bank | Cobham PLC | 1 Month LIBOR BBA minus 0.45% | 7/7/2016 | (102 | ) | 41,643 | ||||||||||
Deutsche Bank | Coface S.A. | 1 Month LIBOR BBA plus 0.45% | 7/20/2016 | 10 | 1,329 | |||||||||||
Morgan Stanley Capital Services LLC | Darty PLC | Sterling Overnight Interbank Average Rate plus 0.55% | 5/13/2016 | 253 | 79,995 | |||||||||||
Citibank NA | Darty PLC | 1 Month LIBOR BBA plus 0.40% | 6/24/2016 | 69 | 30,768 | |||||||||||
Deutsche Bank | Debenhams PLC | 1 Month LIBOR BBA plus 0.45% | 7/7/2016 | 85 | 3,052 | |||||||||||
Deutsche Bank | Deutsche Lufthansa A.G. | 1 Month LIBOR BBA plus 0.45% | 7/20/2016 | 87 | 1,504 | |||||||||||
Deutsche Bank | Dignity PLC | 1 Month LIBOR BBA minus 0.45% | 7/7/2016 | (12 | ) | 128 | ||||||||||
Deutsche Bank | Entertainment One, Ltd. | 1 Month LIBOR BBA plus 0.45% | 7/7/2016 | 22 | 3,382 | |||||||||||
Citibank NA | Fairchild Semiconductor International, Inc. | 1 Month LIBOR BBA plus 0.35% | 6/24/2016 | 445 | — | |||||||||||
Deutsche Bank | Fevertree Drinks PLC | 1 Month LIBOR BBA plus 0.45% | 7/20/2016 | 18 | 688 | |||||||||||
Deutsche Bank | G4S PLC | 1 Month LIBOR BBA minus 0.45% | 7/7/2016 | (93 | ) | 1,034 | ||||||||||
Deutsche Bank | Gaztransport Et Technigaz S.A. | 1 Month LIBOR BBA plus 0.45% | 7/20/2016 | 15 | 3,503 | |||||||||||
Deutsche Bank | Geox S.p.A. | 1 Month LIBOR BBA minus 3.00% | 7/20/2016 | (26 | ) | 301 | ||||||||||
Deutsche Bank | Glencore PLC | 1 Month LIBOR BBA plus 0.45% | 7/20/2016 | 91 | 6,940 | |||||||||||
Morgan Stanley Capital Services LLC | Home Retail Group PLC | Sterling Overnight Interbank Average Rate plus 0.55% | 5/13/2016 | 205 | 8,294 | |||||||||||
UBS AG | Home Retail Group PLC | 1 Month LIBOR BBA plus 0.40% | 6/24/2016 | 92 | 3,737 | |||||||||||
Citibank NA | iShares Nasdaq Biotechnology ETF | 1 Month LIBOR BBA minus 1.40% | 6/24/2016 | (61 | ) | 82 | ||||||||||
Deutsche Bank | J S.A.insbury PLC | 1 Month LIBOR BBA plus 0.45% | 7/20/2016 | 93 | 2,165 | |||||||||||
Deutsche Bank | Just Eat PLC | 1 Month LIBOR BBA plus 0.45% | 7/7/2016 | 79 | 1,866 | |||||||||||
Deutsche Bank | Kabel Deutschland Holding A.G. | 1 Month LIBOR BBA minus 0.45% | 7/20/2016 | (1 | ) | 42 | ||||||||||
Morgan Stanley Capital Services LLC | Koninklijke Ahold N.V. | Euro OverNight Index Average minus 0.35% | 7/22/2016 | (206 | ) | 8,480 | ||||||||||
| 28 | MainStay Absolute Return Multi-Strategy Fund | The notes to the consolidated financial statements are an integral part of, and should be read in conjunction with, the consolidated financial statements. |
Swap Counterparty | Reference Obligation | Rate(s) (Paid)/Received by the Fund2 | Termination Date(s) | Notional Amount (000)* | Unrealized Appreciation | |||||||||||
Deutsche Bank | Laird PLC | 1 Month LIBOR BBA plus 0.45% | 7/20/2016 | $ | 28 | $ | 576 | |||||||||
Deutsche Bank | Luxottica Group S.p.A. | 1 Month LIBOR BBA minus 0.45% | 7/20/2016 | (91 | ) | 3,310 | ||||||||||
Deutsche Bank | Manz A.G. | 1 Month LIBOR BBA minus 13.00% | 7/20/2016 | (14 | ) | 5,632 | ||||||||||
Deutsche Bank | Marie Brizard Wine & Spirits S.A. | 1 Month LIBOR BBA minus 3.00% | 7/20/2016 | (38 | ) | 3,501 | ||||||||||
Deutsche Bank | Meggitt PLC | 1 Month LIBOR BBA plus 0.45% | 7/7/2016 | 57 | 981 | |||||||||||
Deutsche Bank | METRO A.G. | 1 Month LIBOR BBA plus 0.45% | 7/20/2016 | 42 | 2,675 | |||||||||||
Deutsche Bank | Mondi PLC | 1 Month LIBOR BBA plus 0.45% | 7/7/2016 | 85 | 3,255 | |||||||||||
Deutsche Bank | MorphoSys A.G. | 1 Month LIBOR BBA minus 1.50% | 7/20/2016 | (23 | ) | 1,370 | ||||||||||
Deutsche Bank | Nanoco Group PLC | 1 Month LIBOR BBA minus 7.00% | 7/7/2016 | (29 | ) | 14,136 | ||||||||||
Deutsche Bank | NN Group N.V. | 1 Month LIBOR BBA plus 0.45% | 8/9/2016 | 71 | 10,424 | |||||||||||
Deutsche Bank | Numericable-SFR S.A. | 1 Month LIBOR BBA minus 0.45% | 7/20/2016 | (88 | ) | 16,547 | ||||||||||
UBS AG | Orange S.A. | 1 Month EURIBOR minus 0.45% | 6/24/2016 | (60 | ) | 4,092 | ||||||||||
Deutsche Bank | OSRAM Licht A.G. | 1 Month LIBOR BBA plus 0.45% | 7/20/2016 | 86 | 6,311 | |||||||||||
Deutsche Bank | Oxford Instruments PLC | 1 Month LIBOR BBA minus 0.45% | 7/7/2016 | (19 | ) | 6,289 | ||||||||||
Deutsche Bank | Petra Diamonds, Ltd. | 1 Month LIBOR BBA plus 0.45% | 7/7/2016 | 7 | 2,780 | |||||||||||
Deutsche Bank | Porsche Automobil Holding SE | 1 Month LIBOR BBA plus 0.45% | 7/20/2016 | 86 | 10,473 | |||||||||||
Deutsche Bank | Premier Farnell PLC | 1 Month LIBOR BBA plus 0.45% | 7/20/2016 | 47 | 5,872 | |||||||||||
Deutsche Bank | Rallye S.A. | 1 Month LIBOR BBA plus 0.45% | 7/20/2016 | 24 | 4,169 | |||||||||||
Deutsche Bank | Renault S.A. | 1 Month LIBOR BBA plus 0.45% | 7/20/2016 | 83 | 7,183 | |||||||||||
Deutsche Bank | Rheinmetall A.G. | 1 Month LIBOR BBA plus 0.45% | 7/20/2016 | 72 | 7,785 | |||||||||||
Deutsche Bank | RIB Software A.G. | 1 Month LIBOR BBA minus 11.00% | 7/20/2016 | (38 | ) | 3,616 | ||||||||||
Deutsche Bank | Rizzoli Corriere Della Sera Mediagroup S.p.A. | 1 Month LIBOR BBA minus 9.00% | 7/20/2016 | (32 | ) | 10,200 | ||||||||||
Deutsche Bank | Royal Mail PLC | 1 Month LIBOR BBA plus 0.45% | 7/7/2016 | 83 | 10,415 | |||||||||||
Deutsche Bank | Safilo Group S.p.A. | 1 Month LIBOR BBA minus 3.50% | 7/20/2016 | (15 | ) | 581 | ||||||||||
Deutsche Bank | Salvatore Ferragamo S.p.A. | 1 Month LIBOR BBA minus 1.25% | 7/20/2016 | (21 | ) | 1,545 | ||||||||||
Deutsche Bank | Schroders PLC | 1 Month LIBOR BBA minus 0.45% | 7/7/2016 | (76 | ) | 4,519 | ||||||||||
Deutsche Bank | Senior PLC | 1 Month LIBOR BBA minus 0.45% | 7/7/2016 | (3 | ) | 139 | ||||||||||
Deutsche Bank | Serco Group PLC | 1 Month LIBOR BBA minus 0.45% | 7/7/2016 | (91 | ) | 11,547 | ||||||||||
Deutsche Bank | SGL Carbon S.E. | 1 Month LIBOR BBA minus 9.00% | 7/20/2016 | (118 | ) | 25,422 | ||||||||||
UBS AG | Shire PLC | 1 Month LIBOR BBA plus 0.40% | 6/24/2016 | 71 | 4,551 | |||||||||||
Deutsche Bank | SIG PLC | 1 Month LIBOR BBA plus 0.45% | 7/20/2016 | 30 | 2,309 | |||||||||||
Deutsche Bank | SMA Solar Technology A.G. | 1 Month LIBOR BBA plus 0.45% | 7/20/2016 | 79 | 12,552 | |||||||||||
Deutsche Bank | Societe BIC S.A. | 1 Month LIBOR BBA minus 0.45% | 7/20/2016 | (77 | ) | 5,631 | ||||||||||
Deutsche Bank | Software A.G. | 1 Month LIBOR BBA plus 0.45% | 7/20/2016 | 75 | 5,573 | |||||||||||
UBS AG | Staples, Inc. | US Federal Funds Rate minus 0.40% | 6/24/2016 | (76 | ) | 6,704 | ||||||||||
UBS AG | Starwood Hotels & Resorts Worldwide, Inc. | 1 Month LIBOR BBA plus 0.35% | 6/24/2016 | 488 | 15,375 | |||||||||||
Deutsche Bank | STMicroelectronics N.V. | 1 Month LIBOR BBA plus 0.45% | 7/20/2016 | 79 | 3,318 | |||||||||||
Citibank NA | Swatch Group A.G. | 1 Month LIBOR BBA plus 0.40% | 6/24/2016 | 83 | 1,416 | |||||||||||
Deutsche Bank | Tarkett S.A. | 1 Month LIBOR BBA plus 0.45% | 7/20/2016 | 52 | 5,522 | |||||||||||
Deutsche Bank | Technicolor S.A. | 1 Month LIBOR BBA plus 0.45% | 7/20/2016 | 20 | 1,866 | |||||||||||
Deutsche Bank | Technip S.A. | 1 Month LIBOR BBA plus 0.45% | 7/20/2016 | 91 | 4,622 | |||||||||||
UBS AG | Telecom Italia S.p.A. | 1 Month EURIBOR minus 1.00% | 6/24/2016 | (64 | ) | 5,219 | ||||||||||
Deutsche Bank | TomTom N.V. | 1 Month LIBOR BBA minus 0.45% | 8/9/2016 | (44 | ) | 5,644 | ||||||||||
| The notes to the consolidated financial statements are an integral part of, and should be read in conjunction with, the consolidated financial statements. | 29 |
Consolidated Portfolio of Investments April 30, 2016 (continued)
Swap Counterparty | Reference Obligation | Rate(s) (Paid)/Received by the Fund2 | Termination Date(s) | Notional Amount (000)* | Unrealized Appreciation | |||||||||||
Deutsche Bank | UBISOFT Entertainment | 1 Month LIBOR BBA plus 0.45% | 7/20/2016 | $ | 71 | $ | 4,024 | |||||||||
Deutsche Bank | UniCredit S.p.A. | 1 Month LIBOR BBA plus 0.45% | 7/20/2016 | 57 | 1,147 | |||||||||||
Citibank NA | USG People N.V. | 1 Month LIBOR BBA plus 0.40% | 12/6/2016 | 436 | 573 | |||||||||||
UBS AG | Vinci S.A. | 1 Month EURIBOR minus 0.45% | 6/24/2016 | (46 | ) | 33 | ||||||||||
Deutsche Bank | Virbac S.A. | 1 Month LIBOR BBA minus 1.50% | 7/20/2016 | (7 | ) | 647 | ||||||||||
Morgan Stanley Capital Services LLC | Western Digital Corp. | US Federal Funds Rate minus 0.30% | 5/18/2016 | (68 | ) | 5,944 | ||||||||||
Deutsche Bank | Whitbread PLC | 1 Month LIBOR BBA minus 0.45% | 7/7/2016 | (92 | ) | 1,273 | ||||||||||
| $ | 2,321 | $ | 662,322 | |||||||||||||
| Unrealized Depreciation | ||||||||||||||||
Deutsche Bank | AB Science S.A. | 1 Month LIBOR BBA minus 13.00% | 7/20/2016 | $ | (18 | ) | $ | (4,379 | ) | |||||||
Deutsche Bank | ADVA Optical Networking S.E. | 1 Month LIBOR BBA plus 0.45% | 7/20/2016 | 31 | (3,772 | ) | ||||||||||
Deutsche Bank | Air France-KLM | 1 Month LIBOR BBA plus 0.45% | 7/20/2016 | 80 | (2,496 | ) | ||||||||||
Deutsche Bank | AIXTRON S.E. | 1 Month LIBOR BBA minus 3.00% | 7/20/2016 | (82 | ) | (9,538 | ) | |||||||||
Deutsche Bank | Aldermore Group PLC | 1 Month LIBOR BBA plus 0.45% | 7/7/2016 | 13 | (1,727 | ) | ||||||||||
Deutsche Bank | Anima Holding S.p.A. | 1 Month LIBOR BBA minus 0.45% | 7/20/2016 | (75 | ) | (4,925 | ) | |||||||||
Deutsche Bank | AO World PLC | 1 Month LIBOR BBA minus 6.00% | 7/7/2016 | (22 | ) | (8,087 | ) | |||||||||
Deutsche Bank | ASTM S.p.A. | 1 Month LIBOR BBA plus 0.45% | 7/20/2016 | 30 | (963 | ) | ||||||||||
Deutsche Bank | Banca Carige S.p.A. | 1 Month LIBOR BBA minus 12.00% | 7/20/2016 | (52 | ) | (28,090 | ) | |||||||||
Deutsche Bank | Beiersdorf A.G. | 1 Month LIBOR BBA minus 0.45% | 7/20/2016 | (55 | ) | (642 | ) | |||||||||
Deutsche Bank | Berkeley Group Holdings PLC | 1 Month LIBOR BBA plus 0.45% | 7/7/2016 | 90 | (4,848 | ) | ||||||||||
Deutsche Bank | Bertrandt A.G. | 1 Month LIBOR BBA minus 1.25% | 7/20/2016 | (52 | ) | (3,621 | ) | |||||||||
Deutsche Bank | Biesse S.p.A. | 1 Month LIBOR BBA plus 0.45% | 7/20/2016 | 76 | (8,690 | ) | ||||||||||
Deutsche Bank | BinckBank N.V. | 1 Month LIBOR BBA plus 0.45% | 8/9/2016 | 7 | (2,079 | ) | ||||||||||
Deutsche Bank | Biotest A.G. | 1 Month LIBOR BBA minus 1.25% | 7/20/2016 | (18 | ) | (4,412 | ) | |||||||||
Deutsche Bank | Brunello Cucinelli S.p.A. | 1 Month LIBOR BBA minus 6.00% | 7/20/2016 | (59 | ) | (3,464 | ) | |||||||||
UBS AG | Buzzi Unicem S.p.A. | 1 Month EURIBOR minus 0.45% | 6/24/2016 | (57 | ) | (5,153 | ) | |||||||||
Morgan Stanley Capital Services LLC | Carmike Cinemas, Inc. | US Federal Funds Rate plus 0.45% | 5/18/2016 | 157 | (104 | ) | ||||||||||
Deutsche Bank | Carnival PLC | 1 Month LIBOR BBA plus 0.45% | 7/20/2016 | 77 | (3,931 | ) | ||||||||||
UBS AG | Casino Guichard Perrachon S.A. | 1 Month EURIBOR minus 2.50% | 6/24/2016 | (6 | ) | (333 | ) | |||||||||
Deutsche Bank | Cementir Holding S.p.A. | 1 Month LIBOR BBA plus 0.45% | 7/20/2016 | 21 | (3,934 | ) | ||||||||||
Deutsche Bank | Cerved Information Solutions S.p.A. | 1 Month LIBOR BBA minus 0.45% | 7/20/2016 | (39 | ) | (3,165 | ) | |||||||||
Deutsche Bank | CGG S.A. | 1 Month LIBOR BBA minus 2.00% | 7/20/2016 | (12 | ) | (3,651 | ) | |||||||||
UBS AG | Charter Communications, Inc. | US Federal Funds Rate minus 1.46% | 6/24/2016 | (221 | ) | (9,507 | ) | |||||||||
Citibank NA | CNH Industrial N.V. | 1 Month LIBOR BBA minus 0.40% | 12/6/2016 | (13 | ) | (2,502 | ) | |||||||||
UBS AG | Danieli & C Officine Meccaniche S.p.A. | 1 Month EURIBOR minus 0.45% | 6/24/2016 | (37 | ) | (2,164 | ) | |||||||||
Morgan Stanley Capital Services LLC | Delhaize Group | Euro OverNight Index Average plus 0.55% | 7/22/2016 | 201 | (75 | ) | ||||||||||
Deutsche Bank | Eramet | 1 Month LIBOR BBA minus 12.00% | 7/20/2016 | (25 | ) | (19,845 | ) | |||||||||
Deutsche Bank | Essentra PLC | 1 Month LIBOR BBA minus 0.45% | 7/7/2016 | (49 | ) | (1,606 | ) | |||||||||
Citibank NA | Ferrari N.V. | 1 Month LIBOR BBA minus 0.40% | 12/6/2016 | (7 | ) | (732 | ) | |||||||||
Citibank NA | Fiat Chrysler Automobiles N.V. | 1 Month LIBOR BBA minus 0.40% | 12/6/2016 | (23 | ) | (966 | ) | |||||||||
| 30 | MainStay Absolute Return Multi-Strategy Fund | The notes to the consolidated financial statements are an integral part of, and should be read in conjunction with, the consolidated financial statements. |
Swap Counterparty | Reference Obligation | Rate(s) (Paid)/Received by the Fund2 | Termination Date(s) | Notional Amount (000)* | Unrealized Depreciation | |||||||||||
Deutsche Bank | Fresnillo PLC | 1 Month LIBOR BBA minus 0.45% | 7/7/2016 | $ | (28 | ) | $ | (18,170 | ) | |||||||
Deutsche Bank | Gerry Weber International A.G. | 1 Month LIBOR BBA minus 4.00% | 7/20/2016 | (60 | ) | (10,017 | ) | |||||||||
Deutsche Bank | Groupe Eurotunnel SE | 1 Month LIBOR BBA minus 0.45% | 7/20/2016 | (89 | ) | (13,620 | ) | |||||||||
Deutsche Bank | Guerbet | 1 Month LIBOR BBA plus 0.45% | 7/20/2016 | 23 | (3,541 | ) | ||||||||||
Deutsche Bank | GVC Holdings PLC | 1 Month LIBOR BBA minus 0.45% | 7/20/2016 | (76 | ) | (11,859 | ) | |||||||||
Deutsche Bank | Hargreaves Lansdown PLC | 1 Month LIBOR BBA minus 0.45% | 7/7/2016 | (90 | ) | (1,501 | ) | |||||||||
Deutsche Bank | Heidelberger Druckmaschinen A.G. | 1 Month LIBOR BBA minus 2.50% | 7/20/2016 | (59 | ) | (4,325 | ) | |||||||||
Morgan Stanley Capital Services LLC | Henkel A.G. & Co. K.G.a.A. | 1 Month LIBOR BBA minus 0.40% | 12/6/2016 | (121 | ) | (5,387 | ) | |||||||||
Deutsche Bank | Hikma Pharmaceuticals PLC | 1 Month LIBOR BBA minus 0.45% | 7/7/2016 | (21 | ) | (2,750 | ) | |||||||||
Deutsche Bank | Iliad S.A. | 1 Month LIBOR BBA minus 0.45% | 7/20/2016 | (31 | ) | (2,097 | ) | |||||||||
Deutsche Bank | Imagination Technologies Group PLC | 1 Month LIBOR BBA minus 2.00% | 7/7/2016 | (43 | ) | (13,700 | ) | |||||||||
Deutsche Bank | IMCD Group N.V. | 1 Month LIBOR BBA minus 0.45% | 8/9/2016 | (54 | ) | (5,994 | ) | |||||||||
Deutsche Bank | Indivior PLC | 1 Month LIBOR BBA plus 0.45% | 7/20/2016 | 84 | (3,769 | ) | ||||||||||
Deutsche Bank | Ingenico Group S.A. | 1 Month LIBOR BBA minus 0.45% | 7/20/2016 | (33 | ) | (360 | ) | |||||||||
Deutsche Bank | Investec PLC | 1 Month LIBOR BBA plus 0.45% | 7/20/2016 | 98 | (412 | ) | ||||||||||
Deutsche Bank | Italcementi S.p.A. | 1 Month LIBOR BBA minus 0.45% | 7/20/2016 | (80 | ) | (1,175 | ) | |||||||||
UBS AG | J S.A.insbury PLC | 1 Month LIBOR BBA minus 1.50% | 6/24/2016 | (127 | ) | (8,220 | ) | |||||||||
Deutsche Bank | John Menzies PLC | 1 Month LIBOR BBA plus 0.45% | 7/7/2016 | 7 | (452 | ) | ||||||||||
Deutsche Bank | Johnson Matthey PLC | 1 Month LIBOR BBA minus 0.45% | 7/20/2016 | (81 | ) | (16,441 | ) | |||||||||
Deutsche Bank | KAZ Minerals PLC | 1 Month LIBOR BBA minus 0.45% | 7/20/2016 | (30 | ) | (1,154 | ) | |||||||||
Deutsche Bank | Legrand S.A. | 1 Month LIBOR BBA minus 0.45% | 7/20/2016 | (5 | ) | (51 | ) | |||||||||
Deutsche Bank | Maire Tecnimont S.p.A. | 1 Month LIBOR BBA minus 6.00% | 7/20/2016 | (34 | ) | (3,969 | ) | |||||||||
Deutsche Bank | Majestic Wine PLC | 1 Month LIBOR BBA minus 0.75% | 7/7/2016 | (15 | ) | (717 | ) | |||||||||
Deutsche Bank | Manz A.G. Rights | 1 Month LIBOR BBA minus 0.45% | 7/20/2016 | — | (207 | ) | ||||||||||
UBS AG | Marriott International, Inc. | US Federal Funds Rate minus 1.15% | 6/24/2016 | (110 | ) | (4,854 | ) | |||||||||
UBS AG | Merck K.G.a.A. | 1 Month EURIBOR minus 0.45% | 6/24/2016 | (43 | ) | (6,018 | ) | |||||||||
UBS AG | Mylan N.V. | 1 Month LIBOR BBA plus 0.35% | 6/24/2016 | 40 | (4,898 | ) | ||||||||||
Deutsche Bank | Ocado Group PLC | 1 Month LIBOR BBA minus 10.00% | 7/7/2016 | (73 | ) | (4,730 | ) | |||||||||
Deutsche Bank | Old Mutual PLC | 1 Month LIBOR BBA plus 0.45% | 7/7/2016 | 96 | (7,351 | ) | ||||||||||
Deutsche Bank | OneSavings Bank PLC | 1 Month LIBOR BBA plus 0.45% | 7/7/2016 | 51 | (13,789 | ) | ||||||||||
Deutsche Bank | Persimmon PLC | 1 Month LIBOR BBA plus 0.45% | 7/7/2016 | 83 | (819 | ) | ||||||||||
Deutsche Bank | Poundland Group PLC | 1 Month LIBOR BBA minus 0.45% | 7/20/2016 | (14 | ) | (787 | ) | |||||||||
Deutsche Bank | Randgold Resources, Ltd. | 1 Month LIBOR BBA minus 0.45% | 7/7/2016 | (74 | ) | (27,795 | ) | |||||||||
Deutsche Bank | Rolls-Royce Holdings PLC | 1 Month LIBOR BBA minus 0.45% | 7/20/2016 | (82 | ) | (8,005 | ) | |||||||||
Deutsche Bank | Rolls-Royce Holdings PLC Rights | 1 Month LIBOR BBA plus 3.25% | 7/20/2016 | — | (956 | ) | ||||||||||
Deutsche Bank | Rotork PLC | 1 Month LIBOR BBA minus 0.45% | 7/7/2016 | (15 | ) | (1,703 | ) | |||||||||
Citibank NA | SABMiller PLC | 1 Month LIBOR BBA plus 0.40% | 6/24/2016 | 328 | (6,543 | ) | ||||||||||
Morgan Stanley Capital Services LLC | SanDisk Corp. | US Federal Funds Rate plus 0.45% | 5/18/2016 | 382 | (5,842 | ) | ||||||||||
Citibank NA | SanDisk Corp. | 1 Month LIBOR BBA plus 0.35% | 6/24/2016 | 104 | (1,454 | ) | ||||||||||
Deutsche Bank | Societe Generale S.A. | 1 Month LIBOR BBA plus 0.45% | 7/20/2016 | 72 | (8,588 | ) | ||||||||||
Deutsche Bank | Standard Chartered PLC | 1 Month LIBOR BBA minus 0.45% | 7/20/2016 | (71 | ) | (5,518 | ) | |||||||||
Deutsche Bank | Suedzucker A.G. | 1 Month LIBOR BBA plus 0.45% | 7/20/2016 | 74 | (4,139 | ) | ||||||||||
Citibank NA | Swatch Group A.G. | 1 Month LIBOR BBA minus 0.40% | 6/24/2016 | (83 | ) | (424 | ) | |||||||||
Deutsche Bank | Taylor Wimpey PLC | 1 Month LIBOR BBA plus 0.45% | 7/20/2016 | 27 | (1,729 | ) | ||||||||||
| The notes to the consolidated financial statements are an integral part of, and should be read in conjunction with, the consolidated financial statements. | 31 |
Consolidated Portfolio of Investments April 30, 2016 (continued)
Swap Counterparty | Reference Obligation | Rate(s) (Paid)/Received by the Fund2 | Termination Date(s) | Notional Amount (000)* | Unrealized Depreciation | |||||||||||
UBS AG | Telecom Italia S.p.A. | 1 Month LIBOR BBA plus 0.40% | 6/24/2016 | $ | 138 | $ | (13,179 | ) | ||||||||
Deutsche Bank | Telecom Italia S.p.A. | 1 Month LIBOR BBA plus 0.45% | 7/20/2016 | 143 | (1,543 | ) | ||||||||||
Deutsche Bank | Television Francaise 1 | 1 Month LIBOR BBA minus 0.45% | 7/20/2016 | (73 | ) | (1,899 | ) | |||||||||
Deutsche Bank | Tesco PLC | 1 Month LIBOR BBA minus 0.45% | 7/7/2016 | (76 | ) | (6,901 | ) | |||||||||
Deutsche Bank | Thyssenkrupp A.G. | 1 Month LIBOR BBA minus 0.45% | 7/20/2016 | (85 | ) | (14,389 | ) | |||||||||
Deutsche Bank | Trigano S.A. | 1 Month LIBOR BBA plus 0.45% | 7/20/2016 | 48 | (5,040 | ) | ||||||||||
Deutsche Bank | TUI A.G. | 1 Month LIBOR BBA plus 0.45% | 7/20/2016 | 95 | (3,681 | ) | ||||||||||
Morgan Stanley Capital Services LLC | Tumi Holdings, Inc. | US Federal Funds Rate plus 0.45% | 5/18/2016 | 155 | (1,450 | ) | ||||||||||
UBS AG | VMware, Inc. | US Federal Funds Rate minus 2.50% | 6/24/2016 | (57 | ) | (6,121 | ) | |||||||||
Deutsche Bank | Weir Group PLC | 1 Month LIBOR BBA minus 0.45% | 7/7/2016 | (13 | ) | (1,080 | ) | |||||||||
Deutsche Bank | Zalando S.E. | 1 Month LIBOR BBA minus 0.45% | 7/20/2016 | (91 | ) | (1,303 | ) | |||||||||
Deutsche Bank | Zodiac Aerospace | 1 Month LIBOR BBA minus 0.45% | 7/20/2016 | (90 | ) | (13,585 | ) | |||||||||
| $ | (218 | ) | $ | (465,402 | ) | |||||||||||
Open OTC total return basket swap contracts as of April 30, 2016 were as follows:
Swap Counterparty | Reference Obligation | Rate (Paid)/Received by the Fund | Termination Date | Notional Amount (000)* | Unrealized Appreciation / (Depreciation) | |||||||||||
Credit Suisse | Credit Suisse Backwardation Long/Short Excess Return Index** | 0.60% | 5/31/2016 | $ | 1,307 | $ | 702 | |||||||||
Credit Suisse | Credit Suisse Custom 24A Excess Return Index** | 1.50% | 5/31/2016 | 1,638 | 2,123 | |||||||||||
Credit Suisse | Credit Suisse Custom 88 Enhanced Excess Return Index** | 0.60% | 5/31/2016 | 2,424 | 1,322 | |||||||||||
Credit Suisse | Credit Suisse Dividend Alpha ER Index | 0.25% | 5/31/2016 | 1,813 | (2,679 | ) | ||||||||||
Credit Suisse | Credit Suisse GAINS 01E Long/Short Excess Return Index** | 1.25% | 5/31/2016 | 1,508 | 1,636 | |||||||||||
JPMorgan Chase Bank | JPMorgan Sigma TY Index | 0.00% | 10/31/2016 | 1,285 | 2 | |||||||||||
JPMorgan Chase Bank | JPMorgan Volemont Strategy Index | 0.00% | 10/31/2016 | 1,304 | — | |||||||||||
Societe Generale | SGI BOSS 3% Index | 0.60% | 6/3/2016 | 2,165 | (3 | ) | ||||||||||
Societe Generale | SGI FX Smile Premium G4 Index | 0.60% | 6/3/2016 | 2,127 | 14 | |||||||||||
Societe Generale | SGI Smart Market Neutral Commodity 2 Index** | 0.60% | 6/3/2016 | 2,133 | 1,113 | |||||||||||
Societe Generale | SGI US Gravity Index | 0.60% | 6/3/2016 | 1,574 | — | |||||||||||
| $ | 19,278 | $ | 4,230 | |||||||||||||
| 32 | MainStay Absolute Return Multi-Strategy Fund | The notes to the consolidated financial statements are an integral part of, and should be read in conjunction with, the consolidated financial statements. |
Open OTC Candriam proprietary total return swap contracts as of April 30, 2016 were as follows:
Swap Counterparty | Reference Obligation | Description | Unrealized Appreciation/ (Depreciation) | |||||
Societe Generale Newedge UK Limited | Candriam IG Diversified Futures Index** | Total return swap with Societe Generale Newedge UK Limited (“SG Newedge UK”). The swap provides exposure to the total returns of the Candriam Alternative Return Systemat program, calculated on a daily basis with a reference to a managed account owned by SG Newedge UK, a company formed under the laws of England. (Notional Amount $19,853,086)*** | $ | 128,069 | ||||
Societe Generale Newedge UK Limited | Candriam Global Alpha Index | Total return swap with SG Newedge UK. The swap provides exposure to the returns of the exchange-traded derivatives and OTC foreign exchange forwards for the Candriam Global Alpha strategy, calculated on a daily basis with a reference to a managed account owned by SG Newedge UK, a company formed under the laws of England. (Notional Amount $6,195,888)**** | 19,038 | |||||
Societe Generale Newedge UK Limited | Candriam Global Opportunities Index | Total return swap with SG Newedge UK. The swap provides exposure to the returns of the exchange-traded derivatives and OTC foreign exchange forwards for the Candriam Global Opportunities strategy, calculated on a daily basis with a reference to a managed account owned by SG Newedge UK, a company formed under the laws of England. (Notional Amount $5,943,512)**** | (12,068 | ) | ||||
| $ | 135,039 | |||||||
The summaries below provide a breakdown of the derivative contracts comprising the index components of the above Candriam proprietary total return swaps as of April 30, 2016:
Candriam IG Diversified Futures Index
Category | % Breakdown | |||
Financials | 91.99 | % | ||
Metals | 5.86 | |||
Equity Index | 2.26 | |||
Agricultural | 1.32 | |||
Energy | 0.20 | |||
Foreign Currency | –1.63 | |||
Total | 100.00 | % | ||
Ticker | Description | Sector | Notional Amount (000)* | |||||
ADM6 | Australian Dollar CME Jun16 | Foreign Currency | 3,187 | |||||
BPM6 | British Pound CME Jun16 | Foreign Currency | (16,988 | ) | ||||
C N6 | Corn Jul16 | Agricultural | 5,269 | |||||
CDM6 | Canadian Dollar CME Jun16 | Foreign Currency | 4,386 | |||||
CFK6 | CAC Index May16 | Equity Index | (401 | ) | ||||
CLM6 | Crude Oil Jun16 | Energy | 230 | |||||
CON6 | Brent Crude Jul16 | Energy | 2,369 | |||||
CTN6 | Cotton Jul16 | Agricultural | 5,580 | |||||
DMM6 | Mini Dow Jun16 | Equity Index | 9,820 | |||||
ECM6 | EUR/USD CME Jun16 | Foreign Currency | 6,306 | |||||
EDU8 | Eurodollars Sep18 | Financials | 302,531 | |||||
ESM6 | E-mini S&P Jun16 | Equity Index | (721 | ) | ||||
FVM6 | 5 Yr T-Note Jun16 | Financials | 18,500 | |||||
GCM6 | Gold CMX Jun16 | Metals | 15,744 | |||||
GXM6 | DAX Index Jun16 | Equity Index | 1,155 | |||||
| The notes to the consolidated financial statements are an integral part of, and should be read in conjunction with, the consolidated financial statements. | 33 |
Consolidated Portfolio of Investments April 30, 2016 (continued)
Ticker | Description | Sector | Notional Amount (000)* | |||||
HGN6 | Copper Jul16 | Metals | 1,541 | |||||
HIK6 | Hang Seng Index May16 | Equity Index | 2,420 | |||||
IKM6 | Euro BTP Futures Jun16 | Financials | 3,001 | |||||
JBM6 | Japan Govt Bond Tiffe Jun16 | Financials | 18,509 | |||||
JYM6 | Japanese Yen CME Jun16 | Foreign Currency | 8,909 | |||||
KEM6 | Korean Bond Jun16 | Financials | 140,225 | |||||
L U8 | Short Sterling Sep18 | Financials | 192,473 | |||||
LAM6 | Aluminum LME Jun16 | Metals | 71,515 | |||||
LAM6 | Aluminum LME Jun16 | Metals | (59,715 | ) | ||||
LCM6 | Live Cattle Jun16 | Agricultural | (9,516 | ) | ||||
LXM6 | Zinc LME Jun16 | Metals | (9,336 | ) | ||||
LXM6 | Zinc LME Jun16 | Metals | 16,593 | |||||
NGM6 | Natural Gas Jun16 | Energy | (1,960 | ) | ||||
NIM6 | Nikkei Index Jun16 | Equity Index | (5,844 | ) | ||||
NQM6 | E-mini Nasdaq Jun16 | Equity Index | 2,686 | |||||
NVM6 | New Zealand Dollar CME Jun16 | Foreign Currency | 8,635 | |||||
OATM6 | Euro Oat Futures Jun16 | Financials | (895 | ) | ||||
PEM6 | Mexican Peso CME Jun16 | Foreign Currency | (7,144 | ) | ||||
RAM6 | South African Rand CME Jun16 | Foreign Currency | (4,182 | ) | ||||
RTAM6 | Mini Russell Jun16 | Equity Index | 2,368 | |||||
RXM6 | Euro Bund Jun16 | Financials | (8,712 | ) | ||||
RYM6 | EUR/JPY CME Jun16 | Foreign Currency | (15,080 | ) | ||||
S N6 | Soybean Jul16 | Agricultural | 9,216 | |||||
SBN6 | Sugar Jul16 | Agricultural | 6,288 | |||||
SIN6 | Silver Jul16 | Metals | 6,682 | |||||
TPM6 | Topix Index Jun16 | Equity Index | (3,491 | ) | ||||
TYM6 | US 10 Yr Notes Jun16 | Financials | 11,836 | |||||
USM6 | US Treasury Bond Jun16 | Financials | (1,796 | ) | ||||
UXK6 | CBOE VIX May16 | Equity Index | (1,553 | ) | ||||
VGM6 | Euro Stoxx50 Jun16 | Equity Index | (4,295 | ) | ||||
W N6 | Wheat Jul16 | Agricultural | (7,181 | ) | ||||
XBM6 | Gasoline Jun16 | Energy | 876 | |||||
XPM6 | SFE SPI 200 Jun16 | Equity Index | 597 | |||||
Z M6 | FTSE Index Jun16 | Equity Index | 13,887 | |||||
Candriam Global Alpha Index
Category | % Breakdown | |||
Foreign Currency | 59.61 | % | ||
Financials | 49.69 | |||
Equity Index | –9.30 | |||
Total | 100.00 | % | ||
| 34 | MainStay Absolute Return Multi-Strategy Fund | The notes to the consolidated financial statements are an integral part of, and should be read in conjunction with, the consolidated financial statements. |
Ticker | Description | Sector | Notional Amount (000)* | |||||
ADK6 | Australian Dollar CME May16 | Foreign Currency | 22 | |||||
ADM6 | Australian Dollar CME Jun16 | Foreign Currency | (10 | ) | ||||
ADM6 | Australian Dollar CME Jun16 | Foreign Currency | 11 | |||||
BPM6 | British Pound CME Jun16 | Foreign Currency | (1 | ) | ||||
BPU6 | British Pound CME Sep16 | Foreign Currency | 0 | ‡ | ||||
BPU6 | British Pound CME Sep16 | Foreign Currency | 1 | |||||
CXM6 | Euro Stoxx Banks Jun16 | Equity Index | (6 | ) | ||||
ECM6 | EUR/USD CME Jun16 | Foreign Currency | 44 | |||||
ESU6 | E-mini S&P Sep16 | Equity Index | (5 | ) | ||||
ESU6 | E-mini S&P Sep16 | Equity Index | 69 | |||||
FVSK6 | Euro Stoxx50 VSTOXX May16 | Equity Index | 94 | |||||
FVSM6 | Euro Stoxx50 VSTOXX Jun16 | Equity Index | (69 | ) | ||||
FWDBRLUSD | BRL vs. USD 06/15/2016 | Foreign Currency | 7 | |||||
FWDBRLUSD | BRL vs. USD 06/15/2016 | Foreign Currency | (7 | ) | ||||
FWDTRYUSD | TRY vs. USD 06/15/2016 | Foreign Currency | (11 | ) | ||||
FWDUSDTRY | USD vs. TRY 06/15/2016 | Foreign Currency | 5 | |||||
FWDUSDTRY | USD vs. TRY 06/15/2016 | Foreign Currency | 5 | |||||
IKM6 | Euro BTP Futures Jun16 | Financials | (5 | ) | ||||
JYM6 | Japanese Yen CME Jun16 | Foreign Currency | (45 | ) | ||||
JYM6 | Japanese Yen CME Jun16 | Foreign Currency | 15 | |||||
KGM6 | DJ STOXX 600 Oil & Gas Jun16 | Equity Index | 0 | ‡ | ||||
R5J6 | Euro Stoxx50 Jun16 | Equity Index | 1 | |||||
RXM6 | Euro Bund Jun16 | Financials | 28 | |||||
SEM6 | Euro Stoxx50 Jun16 | Equity Index | 38 | |||||
SEM6 | Euro Stoxx50 Jun16 | Equity Index | (23 | ) | ||||
SEM6 | Euro Stoxx50 Jun16 | Equity Index | (36 | ) | ||||
TYM6 | US 10 Yr Notes Jun16 | Financials | 9 | |||||
UXK6 | CBOE VIX May16 | Equity Index | 14 | |||||
UXN | CBOE VIX Jul16 | Equity Index | (14 | ) | ||||
VGM6 | Euro Stoxx50 Jun16 | Equity Index | (68 | ) | ||||
Candriam Global Opportunities Index
Category | % Breakdown | |||
Financials | 104.96 | % | ||
Equity Index | 20.50 | |||
Foreign Currency | –25.46 | |||
Total | 100.00 | % | ||
| The notes to the consolidated financial statements are an integral part of, and should be read in conjunction with, the consolidated financial statements. | 35 |
Consolidated Portfolio of Investments April 30, 2016 (continued)
Ticker | Description | Sector | Notional Amount (000)* | |||||
ADM6 | Australian Dollar CME Jun16 | Foreign Currency | (1,366 | ) | ||||
BPM6 | British Pound CME Jun16 | Foreign Currency | (1 | ) | ||||
ECM6 | EUR/USD CME Jun16 | Foreign Currency | (2,580 | ) | ||||
ESK6 | EMINI S&P May16 | Equity Index | 134 | |||||
ESM6 | Emini S&P 500 Jun16 | Equity Index | 3,603 | |||||
FWDBRLUSD | BRL vs. USD 04/25/2026 | Foreign Currency | 1,146 | |||||
FWDBRLUSD | BRL vs. USD 05/31/2016 | Foreign Currency | (1,149 | ) | ||||
FWDBRLUSD | BRL vs. USD 04/25/2026 | Foreign Currency | (1,146 | ) | ||||
FWDCLPUSD | CLP vs. USD 05/17/2016 | Foreign Currency | (2,568 | ) | ||||
FWDCLPUSD | CLP vs. USD 05/17/2016 | Foreign Currency | 2,568 | |||||
FWDCLPUSD | CLP vs. USD 04/24/2018 | Foreign Currency | 592 | |||||
FWDINRUSD | INR vs. USD 04/24/2018 | Foreign Currency | 964 | |||||
FWDPLNUSD | PLN vs. USD 04/25/2026 | Foreign Currency | (1,100 | ) | ||||
FWDRUBUSD | RUB vs. USD 06/14/2016 | Foreign Currency | (1,543 | ) | ||||
FWDRUBUSD | RUB vs. USD 06/14/2016 | Foreign Currency | 1,543 | |||||
FWDTRYUSD | TRY vs. USD 07/29/2016 | Foreign Currency | 938 | |||||
FWDUSDHKD | USD vs. HKD 01/19/2017 | Foreign Currency | (330 | ) | ||||
FWDUSDKRW | USD vs. KRW 12/27/2016 | Foreign Currency | (1,295 | ) | ||||
FWDUSDSGD | USD vs. SGD 05/18/2016 | Foreign Currency | (1,189 | ) | ||||
IKM6 | Euro BTP Futures Jun16 | Financials | 4,107 | |||||
KEM6 | Korean Bond Jun16 | Financials | 26,728 | |||||
R5J6 | Euro Stoxx50 Jun16 | Equity Index | 0 | ‡ | ||||
R5J6 | Euro Stoxx50 Jun16 | Equity Index | 0 | ‡ | ||||
RXM6 | Euro Bund Jun16 | Financials | 84 | |||||
RXM6 | Euro Bund Jun16 | Financials | (3,707 | ) | ||||
RXM6 | Euro Bund Jun16 | Financials | (96 | ) | ||||
SEK6 | Euro Stoxx50 Jun16 | Equity Index | (134 | ) | ||||
SEK6 | Euro Stoxx50 Jun16 | Equity Index | (26 | ) | ||||
SEK6 | Euro Stoxx50 Jun16 | Equity Index | 249 | |||||
SEK6 | Euro Stoxx50 Jun16 | Equity Index | 90 | |||||
TYM6 | US 10 Yr Notes Jun16 | Financials | (260 | ) | ||||
VGM6 | Euro Stoxx50 Jun16 | Equity Index | 1,329 | |||||
| 1. | As of April 30, 2016, cash in the amount of $1,120,071 was on deposit with brokers for total return equity swap contracts. |
| 2. | Plus represents that the Fund receives payments. Minus represents that the Fund makes payments. |
| * | Notional amounts reflected as a positive value indicate a long position held by the Fund or Index and a negative value indicates a short position. |
| ** | The total return swap is held in the MainStay Multi-Strategy Cayman Fund Ltd., which is a wholly-owned subsidiary of the MainStay Absolute Return Multi-Strategy Fund. |
| *** | The investment portfolio of the managed account is comprised at any given time of trading positions selected by Candriam France S.A.S. that include exchange traded futures in relation to any commodity, currency, interest rate, bond or equity index traded on certain exchanges. Under the terms of the swap, the advisor has the ability to periodically adjust the notional level of the swap. The swap was effective on June 24, 2015 and has an open ended term unless terminated by one of the parties. In addition, the terms of the swap provide for a payment to the SG Newedge UK based upon 0.4% per annum accrued on the full notional level of the swap, plus a floating rate (based on LIBOR and Fed Funds) accrued on 15% of the notional of the swap. |
| **** | The investment portfolio of the managed account is comprised at any given time of trading positions selected by Candriam France S.A.S. that include exchange traded derivatives and over the counter derivatives. Under the terms of the swap, the advisor has the ability to periodically adjust the notional level of the swap. The swap was effective on February 26, 2016 and has an open ended term unless terminated by one of the parties. In addition, the terms of the swap provide for a payment to the SG Newedge UK based upon 0.4% per annum accrued on the full notional level of the swap, plus a floating rate (based on LIBOR and Fed Funds) accrued on 15% of the notional of the swap. |
| ‡ | Amount represents less than $500. |
| 36 | MainStay Absolute Return Multi-Strategy Fund | The notes to the consolidated financial statements are an integral part of, and should be read in conjunction with, the consolidated financial statements. |
The following abbreviations are used in the preceding pages:
BRL—Brazilian Real
BTP—Buoni del Tesoro Poliennali
CAC—Cotation Assiste´e en Continu
CAD—Canadian Dollar
CBOE—Chicago Board Options Exchange
CHF—Swiss Franc
CME—Chicago Mercantile Exchange
CLP—Chilean Peso
DAX—Deutscher Aktienindex Index
ETF—Exchange-Traded Fund
EUR—Euro
FTSE—Financial Times Stock Exchange
GBP—British Pound Sterling
HKD—Hong Kong Dollar
INR—Indian Rupee
JPY—Japanese Yen
KRW—South Korean Won
LME—London Metal Exchange
PLN—Polish Zloty
RUB—Russian Ruble
SFE SPI—Sydney Futures Exchange Share Price Index
SGD—Singapore Dollar
SPDR—Standard & Poor’s Depositary Receipt
TRY—Turkish Lira
VIX—CBOE Volatility Index
The following is a summary of the fair valuations according to the inputs used as of April 30, 2016, for valuing the Fund’s assets and liabilities.
Asset Valuation Inputs
Description | Quoted (Level 1) | Significant (Level 2) | Significant (Level 3) | Total | ||||||||||||
| Investments in Securities (a) | ||||||||||||||||
| Long-Term Bonds | ||||||||||||||||
Corporate Bonds | $ | — | $ | 7,227,268 | $ | — | $ | 7,227,268 | ||||||||
Foreign Bonds | — | 9,672,698 | — | 9,672,698 | ||||||||||||
U.S. Government | — | 718,718 | — | 718,718 | ||||||||||||
|
|
|
|
|
|
|
| |||||||||
| Total Long-Term Bonds | — | 17,618,684 | — | 17,618,684 | ||||||||||||
|
|
|
|
|
|
|
| |||||||||
| Common Stocks | 26,764,994 | — | — | 26,764,994 | ||||||||||||
| Short-Term Investments | ||||||||||||||||
Repurchase Agreements | — | 43,101,713 | — | 43,101,713 | ||||||||||||
U.S. Government | — | 17,351,914 | — | 17,351,914 | ||||||||||||
|
|
|
|
|
|
|
| |||||||||
| Total Short-Term Investments | — | 60,453,627 | — | 60,453,627 | ||||||||||||
|
|
|
|
|
|
|
| |||||||||
| Total Investments in Securities | 26,764,994 | 78,072,311 | — | 104,837,305 | ||||||||||||
|
|
|
|
|
|
|
| |||||||||
| Other Financial Instruments | ||||||||||||||||
Candriam Proprietary Total Return Swap Contracts (b) | — | 147,107 | — | 147,107 | ||||||||||||
Credit Default Swap Contracts (b) | — | 120,569 | — | 120,569 | ||||||||||||
Foreign Currency Forward Contracts (b) | — | 7,720 | — | 7,720 | ||||||||||||
Futures Contracts Short (b) | 28,764 | — | — | 28,764 | ||||||||||||
Interest Rate Swap Contracts (b) | — | 161,520 | — | 161,520 | ||||||||||||
Total Return Basket Swap Contracts (b) | — | 6,912 | — | 6,912 | ||||||||||||
Total Return Equity Swap Contracts (b) | — | 662,322 | — | 662,322 | ||||||||||||
|
|
|
|
|
|
|
| |||||||||
| Total Other Financial Instruments | 28,764 | 1,106,150 | — | 1,134,914 | ||||||||||||
|
|
|
|
|
|
|
| |||||||||
| Total Investments in Securities and Other Financial Instruments | $ | 26,793,758 | $ | 79,178,461 | $ | — | $ | 105,972,219 | ||||||||
|
|
|
|
|
|
|
| |||||||||
| The notes to the consolidated financial statements are an integral part of, and should be read in conjunction with, the consolidated financial statements. | 37 |
Consolidated Portfolio of Investments April 30, 2016 (continued)
Liability Valuation Inputs
Description | Quoted (Level 1) | Significant (Level 2) | Significant (Level 3) | Total | ||||||||||||
| Investments in Securities Sold Short (a) | ||||||||||||||||
Common Stocks Sold Short (c) | $ | (15,901,288 | ) | $ | (42,411 | ) | $ | — | $ | (15,943,699 | ) | |||||
Exchange-Traded Funds Sold Short | (3,526,940 | ) | — | — | (3,526,940 | ) | ||||||||||
Warrants Sold Short | (4,302 | ) | — | — | (4,302 | ) | ||||||||||
|
|
|
|
|
|
|
| |||||||||
| Total Investments in Securities Sold Short | (19,432,530 | ) | (42,411 | ) | — | (19,474,941 | ) | |||||||||
|
|
|
|
|
|
|
| |||||||||
| Other Financial Instruments | ||||||||||||||||
Candriam Proprietary Total Return Swap Contracts (b) | — | (12,068 | ) | — | (12,068 | ) | ||||||||||
Credit Default Swap Contracts (b) | — | (68,932 | ) | — | (68,932 | ) | ||||||||||
Foreign Currency Forward Contracts (b) | — | (239,529 | ) | — | (239,529 | ) | ||||||||||
Interest Rate Swap Contracts (b) | — | (8,647 | ) | — | (8,647 | ) | ||||||||||
Total Return Basket Swap Contracts (b) | — | (2,682 | ) | — | (2,682 | ) | ||||||||||
Total Return Equity Swap Contracts (b) | — | (465,402 | ) | — | (465,402 | ) | ||||||||||
|
|
|
|
|
|
|
| |||||||||
| Total Other Financial Instruments | — | (797,260 | ) | — | (797,260 | ) | ||||||||||
|
|
|
|
|
|
|
| |||||||||
| Total Investments in Securities Sold Short and Other Financial Instruments | $ | (19,432,530 | ) | $ | (839,671 | ) | $ | — | $ | (20,272,201 | ) | |||||
|
|
|
|
|
|
|
| |||||||||
| (a) | For a complete listing of investments and their industries, see the Consolidated Portfolio of Investments. |
| (b) | The value listed for these securities reflects unrealized appreciation (depreciation) as shown on the Consolidated Portfolio of Investments. |
| (c) | The Level 2 securities valued at $(38,629) and $(3,782) are held in Commercial Services and Transportation, respectively, within the Common Stocks Sold Short section of the Consolidated Portfolio of Investments. |
The Fund recognizes transfers between the levels as of the beginning of the period.
For the year ended April 30, 2016, the Fund did not have any transfers between Level 1 and Level 2 fair value measurements. (See Note 2)
As of April 30, 2016, the Fund did not hold any investments with significant unobservable inputs (Level 3). (See Note 2)
| 38 | MainStay Absolute Return Multi-Strategy Fund | The notes to the consolidated financial statements are an integral part of, and should be read in conjunction with, the consolidated financial statements. |
Consolidated Statement of Assets and Liabilities as of April 30, 2016
| Assets | ||||
Investment in securities before investments sold short, at value (identified cost $60,092,674) | $ | 61,735,592 | ||
Repurchase agreements, at value (identified cost $43,101,713) | 43,101,713 | |||
Cash collateral on deposit at broker | 22,085,339 | |||
Cash | 2,085,291 | |||
Cash denominated in foreign currencies (identified cost $523,858) | 528,131 | |||
Receivables: | ||||
Investment securities sold | 908,997 | |||
Dividends and interest | 364,222 | |||
Fund shares sold | 97,047 | |||
Variation margin on futures contracts | 33,281 | |||
Manager (See Note 3) | 9,366 | |||
Other assets | 17,304 | |||
Unrealized appreciation on OTC swap contracts | 816,341 | |||
Unrealized appreciation on foreign currency forward contracts | 7,720 | |||
Variation margin on centrally cleared swaps | 39,475 | |||
|
| |||
Total assets | 131,829,819 | |||
|
| |||
| Liabilities | ||||
Investments sold short (proceeds $19,294,889) | 19,474,941 | |||
Payables: | ||||
Investment securities purchased | 1,381,706 | |||
Custodian | 195,924 | |||
Professional fees | 157,142 | |||
Broker fees and charges on short sales | 37,670 | |||
Fund shares redeemed | 16,260 | |||
Shareholder communication | 12,000 | |||
Transfer agent (See Note 3) | 8,300 | |||
Dividends on investments sold short | 7,960 | |||
Premiums received for OTC swap contracts | 7,809 | |||
NYLIFE Distributors (See Note 3) | 1,054 | |||
Trustees | 17 | |||
Unrealized depreciation on OTC swap contracts | 487,860 | |||
Accrued expenses | 4,051 | |||
Interest expense and fees payable | 158 | |||
Unrealized depreciation on foreign currency forward contracts | 239,529 | |||
|
| |||
Total liabilities | 22,032,381 | |||
|
| |||
Net assets | $ | 109,797,438 | ||
|
| |||
| Composition of Net Assets | ||||
Shares of beneficial interest outstanding (par value of $.001 per share) unlimited number of shares authorized | $ | 11,062 | ||
Additional paid-in capital | 112,049,799 | |||
|
| |||
| 112,060,861 | ||||
Net investment income (loss) | (840,339 | ) | ||
Accumulated net realized gain (loss) on investments, investments sold short, futures transactions, written options, swap transactions and foreign currency transactions | (3,236,047 | ) | ||
Net unrealized appreciation (depreciation) on investments, swap contracts and futures contracts | 2,212,381 | |||
Net unrealized appreciation (depreciation) on investments sold short | (180,052 | ) | ||
Net unrealized appreciation (depreciation) on translation of other assets and liabilities in foreign currencies and foreign currency forward contracts | (219,366 | ) | ||
|
| |||
Net assets | $ | 109,797,438 | ||
|
| |||
Class A | ||||
Net assets applicable to outstanding shares | $ | 3,638,243 | ||
|
| |||
Shares of beneficial interest outstanding | 366,796 | |||
|
| |||
Net asset value per share outstanding | $ | 9.92 | ||
Maximum sales charge (5.50% of offering price) | 0.58 | |||
|
| |||
Maximum offering price per share outstanding | $ | 10.50 | ||
|
| |||
Investor Class | ||||
Net assets applicable to outstanding shares | $ | 747,691 | ||
|
| |||
Shares of beneficial interest outstanding | 75,554 | |||
|
| |||
Net asset value per share outstanding | $ | 9.90 | ||
Maximum sales charge (5.50% of offering price) | 0.58 | |||
|
| |||
Maximum offering price per share outstanding | $ | 10.48 | ||
|
| |||
Class C | ||||
Net assets applicable to outstanding shares | $ | 299,488 | ||
|
| |||
Shares of beneficial interest outstanding | 30,481 | |||
|
| |||
Net asset value and offering price per share outstanding | $ | 9.83 | ||
|
| |||
Class I | ||||
Net assets applicable to outstanding shares | $ | 105,112,016 | ||
|
| |||
Shares of beneficial interest outstanding | 10,588,982 | |||
|
| |||
Net asset value and offering price per share outstanding | $ | 9.93 | ||
|
|
| The notes to the consolidated financial statements are an integral part of, and should be read in conjunction with, the consolidated financial statements. | 39 |
Consolidated Statement of Operations
for the period June 18, 2015 (inception date) through April 30, 2016
| Investment Income (Loss) | ||||
Income | ||||
Dividends (a) | $ | 713,215 | ||
Interest | 711,328 | |||
|
| |||
Total income | 1,424,543 | |||
|
| |||
Expenses | ||||
Manager (See Note 3) | 1,250,855 | |||
Broker fees and charges on short sales | 508,286 | |||
Custodian | 499,373 | |||
Dividends on investments sold short | 241,165 | |||
Professional fees | 197,791 | |||
Offering (See Note 2) | 182,899 | |||
Shareholder communication | 24,224 | |||
Transfer agent (See Note 3) | 22,344 | |||
Registration | 12,126 | |||
Distribution/Service—Class A (See Note 3) | 3,267 | |||
Distribution/Service—Investor Class (See Note 3) | 328 | |||
Distribution/Service—Class C (See Note 3) | 835 | |||
Trustees | 2,500 | |||
Interest expense | 1,079 | |||
Miscellaneous | 15,335 | |||
|
| |||
Total expenses before waiver/reimbursement | 2,962,407 | |||
Expense waiver/reimbursement from Manager (See Note 3) | (844,050 | ) | ||
|
| |||
Net expenses | 2,118,357 | |||
|
| |||
Net investment income (loss) | (693,814 | ) | ||
|
| |||
| Realized and Unrealized Gain (Loss) on Investments, Futures Contracts, Swap Contracts, Written Options and Foreign Currency Transactions | ||||
Net realized gain (loss) on: | ||||
Investment transactions | (8,314,908 | ) | ||
Investments sold short | 4,966,675 | |||
Futures transactions | (145,722 | ) | ||
Swap transactions | 1,848,931 | |||
Written option transactions | 15,357 | |||
Foreign currency transactions | 51,799 | |||
|
| |||
Net realized gain (loss) on investments, investments sold short, futures transactions, swap transactions, written option transactions and foreign currency transactions | (1,577,868 | ) | ||
|
| |||
Net change in unrealized appreciation (depreciation) on: | ||||
Investments | 1,642,918 | |||
Investments sold short | (180,052 | ) | ||
Futures contracts | 28,764 | |||
Swap contracts | 540,699 | |||
Translation of other assets and liabilities in foreign currencies and foreign currency forward contracts | (219,366 | ) | ||
|
| |||
Net change in unrealized appreciation (depreciation) on investments, investments sold short, futures contracts, swap contracts and foreign currency transactions | 1,812,963 | |||
|
| |||
Net realized and unrealized gain (loss) on investments, investments sold short, futures transactions, written options, swap transactions and foreign currency transactions | 235,095 | |||
|
| |||
Net increase (decrease) in net assets resulting from operations | $ | (458,719 | ) | |
|
| |||
| (a) | Dividends recorded net of foreign withholding taxes in the amount of $16,380. |
| 40 | MainStay Absolute Return Multi-Strategy Fund | The notes to the consolidated financial statements are an integral part of, and should be read in conjunction with, the consolidated financial statements. |
Consolidated Statement of Changes in Net Assets
for the period June 18, 2015 (inception date) through April 30, 2016
| 2016 | ||||
| Increase (Decrease) in Net Assets | ||||
Operations: | ||||
Net investment income (loss) | $ | (693,814 | ) | |
Net realized gain (loss) on investments, investments sold short, futures transactions, swap transactions, written option transactions and foreign currency transactions | (1,577,868 | ) | ||
Net change in unrealized appreciation (depreciation) on investments, investments sold short, futures contracts, swap contracts and foreign currency transactions | 1,812,963 | |||
|
| |||
Net increase (decrease) in net assets resulting from operations | (458,719 | ) | ||
|
| |||
Distributions to shareholders: | ||||
From net realized gain on investments: | ||||
Class A | (3,314 | ) | ||
Investor Class | (162 | ) | ||
Class C | (236 | ) | ||
Class I | (306,293 | ) | ||
|
| |||
Total distributions to shareholders | (310,005 | ) | ||
|
| |||
Capital share transactions: | ||||
Net proceeds from sale of shares | 176,915,339 | |||
Net asset value of shares issued to shareholders in reinvestment of distributions | 310,005 | |||
Cost of shares redeemed | (66,659,182 | ) | ||
|
| |||
Increase (decrease) in net assets derived from capital share transactions | 110,566,162 | |||
|
| |||
Net increase (decrease) in net assets | 109,797,438 | |||
| Net Assets | ||||
Beginning of period | — | |||
|
| |||
End of period | $ | 109,797,438 | ||
|
| |||
Net investment income (loss) at end of period | $ | (840,339 | ) | |
|
| |||
| The notes to the consolidated financial statements are an integral part of, and should be read in conjunction with, the consolidated financial statements. | 41 |
Consolidated Financial Highlights selected per share data and ratios
| Class A | June 18, 2015** through April 30, 2016 | |||||
Net asset value at beginning of period | $ | 10.00 | ||||
|
| |||||
Net investment income (loss) (a) | (0.08 | ) | ||||
Net realized and unrealized gain (loss) on investments | 0.05 | |||||
Net realized and unrealized gain (loss) on foreign currency transactions | (0.02 | ) | ||||
|
| |||||
Total from investment operations | (0.05 | ) | ||||
|
| |||||
| Less distributions: | ||||||
From net realized gain on investments | (0.03 | ) | ||||
|
| |||||
Net asset value at end of period | $ | 9.92 | ||||
|
| |||||
Total investment return (b)(c) | (0.49 | %) | ||||
| Ratios (to average net assets)/Supplemental Data: | ||||||
Net investment income (loss)†† | (0.97 | %) | ||||
Net expenses (excluding short sale expenses)†† | 1.80 | % | ||||
Expenses (including short sale expenses, before waiver/reimbursement)†† | 3.64 | % | ||||
Short sale expenses†† | 0.88 | % | ||||
Portfolio turnover rate (d) | 164 | % | ||||
Net assets at end of period (in 000’s) | $ | 3,638 | ||||
| ** | Inception date. |
| †† | Annualized. |
| (a) | Per share data based on average shares outstanding during the period. |
| (b) | Total investment return is calculated exclusive of sales charges and assumes the reinvestment of dividends and distributions. |
| (c) | Total investment return is not annualized. |
| (d) | Portfolio turnover rate is not annualized. |
| Investor Class | June 18, 2015** through April 30, 2016 | |||||
Net asset value at beginning of period | $ | 10.00 | ||||
|
| |||||
Net investment income (loss) (a) | (0.10 | ) | ||||
Net realized and unrealized gain (loss) on investments | 0.05 | |||||
Net realized and unrealized gain (loss) on foreign currency transactions | (0.02 | ) | ||||
|
| |||||
Total from investment operations | (0.07 | ) | ||||
|
| |||||
| Less distributions: | ||||||
From net realized gain on investments | (0.03 | ) | ||||
|
| |||||
Net asset value at end of period | $ | 9.90 | ||||
|
| |||||
Total investment return (b)(c) | (0.69 | %) | ||||
| Ratios (to average net assets)/Supplemental Data: | ||||||
Net investment income (loss)†† | (1.18 | %) | ||||
Net expenses (excluding short sale expenses)†† | 1.95 | % | ||||
Expenses (including short sale expenses, before waiver/reimbursement)†† | 3.82 | % | ||||
Short sale expenses†† | 0.92 | % | ||||
Portfolio turnover rate (d) | 164 | % | ||||
Net assets at end of period (in 000’s) | $ | 748 | ||||
| ** | Inception date. |
| †† | Annualized. |
| (a) | Per share data based on average shares outstanding during the period. |
| (b) | Total investment return is calculated exclusive of sales charges and assumes the reinvestment of dividends and distributions. |
| (c) | Total investment return is not annualized. |
| (d) | Portfolio turnover rate is not annualized. |
| 42 | MainStay Absolute Return Multi-Strategy Fund | The notes to the consolidated financial statements are an integral part of, and should be read in conjunction with, the consolidated financial statements. |
Consolidated Financial Highlights selected per share data and ratios
| Class C | June 18, 2015** through April 30, 2016 | |||||
Net asset value at beginning of period | $ | 10.00 | ||||
|
| |||||
Net investment income (loss) (a) | (0.17 | ) | ||||
Net realized and unrealized gain (loss) on investments | 0.05 | |||||
Net realized and unrealized gain (loss) on foreign currency transactions | (0.02 | ) | ||||
|
| |||||
Total from investment operations | (0.14 | ) | ||||
|
| |||||
| Less distributions: | ||||||
From net realized gain on investments | (0.03 | ) | ||||
|
| |||||
Net asset value at end of period | $ | 9.83 | ||||
|
| |||||
Total investment return (b)(c) | (1.39 | %) | ||||
| Ratios (to average net assets)/Supplemental Data: | ||||||
Net investment income (loss)†† | (1.95 | %) | ||||
Net expenses (excluding short sale expenses)†† | 2.70 | % | ||||
Expenses (including short sale expenses, before waiver/reimbursement)†† | 4.54 | % | ||||
Short sale expenses†† | 0.89 | % | ||||
Portfolio turnover rate (d) | 164 | % | ||||
Net assets at end of period (in 000’s) | $ | 299 | ||||
| ** | Inception date. |
| †† | Annualized. |
| (a) | Per share data based on average shares outstanding during the period. |
| (b) | Total investment return is calculated exclusive of sales charges and assumes the reinvestment of dividends and distributions. |
| (c) | Total investment return is not annualized. |
| (d) | Portfolio turnover rate is not annualized. |
| Class I | June 18, 2015** through April 30, 2016 | |||||
Net asset value at beginning of period | $ | 10.00 | ||||
|
| |||||
Net investment income (loss) (a) | (0.07 | ) | ||||
Net realized and unrealized gain (loss) on investments | 0.05 | |||||
Net realized and unrealized gain (loss) on foreign currency transactions | (0.02 | ) | ||||
|
| |||||
Total from investment operations | (0.04 | ) | ||||
|
| |||||
| Less distributions: | ||||||
From net realized gain on investments | (0.03 | ) | ||||
|
| |||||
Net asset value at end of period | $ | 9.93 | ||||
|
| |||||
Total investment return (b)(c) | (0.39 | %) | ||||
| Ratios (to average net assets)/Supplemental Data: | ||||||
Net investment income (loss)†† | (0.78 | %) | ||||
Net expenses (excluding short sale expenses)†† | 1.55 | % | ||||
Expenses (including short sale expenses, before waiver/reimbursement)†† | 3.36 | % | ||||
Short sale expenses†† | 0.85 | % | ||||
Portfolio turnover rate (d) | 164 | % | ||||
Net assets at end of period (in 000’s) | $ | 105,112 | ||||
| ** | Inception date. |
| †† | Annualized. |
| (a) | Per share data based on average shares outstanding during the period. |
| (b) | Total investment return is calculated exclusive of sales charges and assumes the reinvestment of dividends and distributions. Class I shares are not subject to sales charges. |
| (c) | Total investment return is not annualized. |
| (d) | Portfolio turnover rate is not annualized. |
| The notes to the consolidated financial statements are an integral part of, and should be read in conjunction with, the consolidated financial statements. | 43 |
Notes to Consolidated Financial Statements
Note 1–Organization and Business
MainStay Funds Trust (the “Trust”) was organized as a Delaware statutory trust on April 28, 2009, and is governed by a Declaration of Trust. The Trust is registered under the Investment Company Act of 1940, as amended (the “1940 Act”), as an open-end management investment company, and is comprised of thirty-eight funds (collectively referred to as the “Funds”). These consolidated financial statements and notes relate to the MainStay Absolute Return Multi-Strategy Fund (the “Fund”), a “diversified” fund, as that term is defined in the 1940 Act, as interpreted or modified by regulatory authorities having jurisdiction, from time to time.
The Fund currently offers four classes of shares: Investor Class, Class A, Class C and Class I shares. The inception date for all classes was June 18, 2015. Investor Class and Class A shares are offered at net asset value (“NAV”) per share plus an initial sales charge. No sales charge applies to investments of $1 million or more (and certain other qualified purchases) in Investor Class and Class A shares, but a contingent deferred sales charge (“CDSC”) is imposed on certain redemptions made within one year of the date of purchase. Class C shares are offered at NAV without an initial sales charge, although a 1.00% CDSC may be imposed on redemptions made within one year of the date of purchase of Class C shares. Class I shares are offered at NAV and are not subject to a sales charge. Depending upon eligibility, Investor Class shares may convert to Class A shares and Class A shares may convert to Investor Class shares. The four classes of shares have the same voting (except for issues that relate solely to one class), dividend, liquidation and other rights, and the same terms and conditions, except that Class C shares are subject to higher distribution and/or service fee rates than Investor Class and Class A shares under a distribution plan pursuant to Rule 12b-1 under the 1940 Act. Class I shares are not subject to a distribution and/or service fee.
The Fund’s investment objective is to seek long-term growth of capital.
Note 2–Significant Accounting Policies
The Fund is an investment company and accordingly follows the investment company accounting and reporting guidance of the Financial Accounting Standards Board (“FASB”) Accounting Standard Codification Topic 946 Financial Services—Investment Companies. The Fund prepares its consolidated financial statements in accordance with generally accepted accounting principles (“GAAP”) in the United States of America and follows the significant accounting policies described below.
(A) Securities Valuation. Investments are usually valued as of the close of regular trading on the New York Stock Exchange (the “Exchange”) (generally 4:00 p.m. Eastern time) on each day the Fund is open for business (“valuation date”).
The Board of Trustees (the “Board”) adopted procedures establishing methodologies for the valuation of the Fund’s securities and other assets and delegated the responsibility for valuation determinations under those procedures to the Valuation Committee of the Trust (the “Valuation Committee”). The Board authorized the Valuation Committee to appoint a Valuation Sub-Committee (the “Sub-Committee”) to deal in the first instance with establishing the prices of securities for which market quotations are not readily available or the prices of which are not otherwise readily determinable under these procedures. The Sub-
Committee meets (in person, via electronic mail or via teleconference) on an as-needed basis. Subsequently, the Valuation Committee meets to ensure that actions taken by the Sub-Committee were appropriate. The procedures recognize that, subject to the oversight of the Board and unless otherwise noted, the responsibility for the day-to-day valuation of portfolio assets (including fair value measurements for the Fund’s assets and liabilities) rests with New York Life Investment Management LLC (“New York Life Investments” or the “Manager”), aided to whatever extent necessary by the Subadvisors (as defined in Note 3(A)) to the Fund.
To assess the appropriateness of security valuations, the Manager, Subadvisors or the Fund’s third party service provider, who is subject to oversight by the Manager, regularly compares prior day prices, prices on comparable securities, and the sale prices to the prior and current day prices and challenges prices with changes exceeding certain tolerance levels with third party pricing services or broker sources. For those securities valued through either a standardized fair valuation methodology or a fair valuation measurement, the Sub-Committee deals in the first instance with such valuation and the Valuation Committee reviews and affirms, if appropriate, the reasonableness of the valuation based on such methodologies and measurements on a regular basis after considering all relevant information that is reasonably available. Any action taken by the Sub-Committee with respect to the valuation of a portfolio security is submitted by the Valuation Committee to the Board for its review and ratification, if appropriate, at its next regularly scheduled meeting.
“Fair value” is defined as the price the Fund would receive upon selling an asset or liability in an orderly transaction to an independent buyer in the principal or most advantageous market for the asset or liability. Fair value measurements are determined within a framework that establishes a three-tier hierarchy which maximizes the use of observable market data and minimizes the use of unobservable inputs to establish a classification of fair value measurements for disclosure purposes. “Inputs” refer broadly to the assumptions that market participants would use in pricing the asset or liability, including assumptions about risk, such as the risk inherent in a particular valuation technique used to measure fair value using a pricing model and/or the risk inherent in the inputs for the valuation technique. Inputs may be observable or unobservable. Observable inputs reflect the assumptions market participants would use in pricing the asset or liability based on market data obtained from sources independent of the Fund. Unobservable inputs reflect the Fund’s own assumptions about the assumptions market participants would use in pricing the asset or liability based on the information available. The inputs or methodology used for valuing assets or liabilities may not be an indication of the risks associated with investing in those assets or liabilities. The three-tier hierarchy of inputs is summarized below.
| • | Level 1—quoted prices in active markets for an identical asset or liability |
| • | Level 2—other significant observable inputs (including quoted prices for a similar asset or liability in active markets, interest rates and yield curves, prepayment speeds, credit risk, etc.) |
| • | Level 3—significant unobservable inputs (including the Fund’s own assumptions about the assumptions that market participants would use in measuring fair value of an asset or liability) |
| 44 | MainStay Absolute Return Multi-Strategy Fund |
The level of an asset or liability within the fair value hierarchy is based on the lowest level of an input, both individually and in the aggregate, that is significant to the fair value measurement. As of April 30, 2016, the aggregate value by input level of the Fund’s assets and liabilities is included at the end of the Fund’s Consolidated Portfolio of Investments.
The Fund may use third party vendor evaluations, whose prices may be derived from one or more of the following standard inputs, among others:
• Benchmark yields | • Reported trades | |
• Broker/dealer quotes | • Issuer spreads | |
• Two-sided markets | • Benchmark securities | |
• Bids/offers | • Reference data (corporate actions or material event notices) | |
• Industry and economic events | • Comparable bonds | |
• Equity and credit default swap curves | • Monthly payment information |
An asset or liability for which market values cannot be measured using the methodologies described above is valued by methods deemed reasonable in good faith by the Valuation Committee, following the procedures established by the Board, to represent fair value. Under these procedures, the Fund generally uses a market-based approach which may use related or comparable assets or liabilities, recent transactions, market multiples, book values, and other relevant information. The Fund may also use an income-based valuation approach in which the anticipated future cash flows of the asset or liability are discounted to calculate fair value. Discounts may also be applied due to the nature and/or duration of any restrictions on the disposition of the asset or liability. Fair value represents a good faith approximation of the value of a security. Fair value determinations involve the consideration of a number of subjective factors, an analysis of applicable facts and circumstances and the exercise of judgment. As a result, it is possible that the fair value for a security determined in good faith in accordance with the Fund’s valuation procedures may differ from valuations for the same security determined by other funds using their own valuation procedures. Although the Fund’s valuation procedures are designed to value a security at the price the Fund may reasonably expect to receive upon its sale in an orderly transaction, there can be no assurance that any fair value determination there under would, in fact, approximate the amount that the Fund would actually realize upon the sale of the security or the price at which the security would trade if a reliable market price were readily available. During the period ended April 30, 2016, there were no material changes to the fair value methodologies.
Equity and non-equity securities which may be valued in this manner include, but are not limited to: (i) a security for which trading has been halted or suspended; (ii) a debt security that has recently gone into default and for which there is not a current market quotation; (iii) a security of an issuer that has entered into a restructuring; (iv) a security that has been de-listed from a national exchange; (v) a security for which the market price is not readily available from a third party pricing source or, if so provided, does not, in the opinion of the Manager or Subadvisors reflect the security’s market value; (vi) a security subject to trading collars for which no or limited trading takes place; and (vii) a security whose principal market has been temporarily closed at a time when, under normal conditions, it would be open. Securities for which market quotations or observable inputs are not readily available are
generally categorized as Level 3 in the hierarchy. As of April 30, 2016, there were no securities held by the Fund that were fair valued in such a manner.
Certain securities held by the Fund may principally trade in foreign markets. Events may occur between the time the foreign markets close and the time at which the Fund’s NAV is calculated. These events may include, but are not limited to, situations relating to a single issuer in a market sector, significant fluctuations in U.S. or foreign markets, natural disasters, armed conflicts, governmental actions or other developments not tied directly to the securities markets. Should the Manager or Subadvisors conclude that such events may have affected the accuracy of the last price of such securities reported on the local foreign market, the Sub-Committee may, pursuant to procedures adopted by the Board, adjust the value of the local price to reflect the estimated impact on the price of such securities as a result of such events. In this instance, securities are generally categorized as Level 3 in the hierarchy. Additionally, certain foreign equity securities are also fair valued whenever the movement of a particular index exceeds certain thresholds. In such cases, the securities are fair valued by applying factors provided by a third party vendor in accordance with valuation procedures adopted by the Board and are generally categorized as Level 2 in the hierarchy.
Equity securities and shares of Exchange-Traded Funds (“ETFs”) are valued at the last quoted sales prices as of the close of regular trading on the relevant exchange on each valuation date. Securities that are not traded on the valuation date are valued at the mean of the last quoted bid and ask prices. Prices are normally taken from the principal market in which each security trades. Futures contracts are valued at the last posted settlement price on the market where such futures are primarily traded. Options contracts are valued at the last posted settlement price on the market where such options are primarily traded. Investments in mutual funds, including money market funds, are valued at their respective NAVs as of the close of the Exchange on the valuation date. These securities are generally categorized as Level 1 in the hierarchy.
Debt securities (other than convertible and municipal bonds) are valued at the evaluated bid prices (evaluated mean prices in the case of convertible and municipal bonds) supplied by a pricing agent or brokers selected by the Manager, in consultation with the Subadvisors. Those values reflect broker/dealer supplied prices and electronic data processing techniques, if the evaluated bid or mean prices are deemed by the Manager, in consultation with the Subadvisors, to be representative of market values, at the regular close of trading of the Exchange on each valuation date. Debt securities purchased on a delayed delivery basis are marked to market daily until settlement at the forward settlement date. Debt securities, including corporate bonds, U.S. government & federal agency bonds, municipal bonds, foreign bonds, convertible bonds, asset-backed securities and mortgage-backed securities are generally categorized as Level 2 in the hierarchy.
Temporary cash investments acquired in excess of 60 days to maturity at the time of purchase are valued using the latest bid prices or using valuations based on a matrix system (which considers such factors as security prices, yields, maturities, and ratings), both as furnished by independent pricing services. Other temporary cash investments which mature in 60 days or less at the time of purchase (“Short-Term Investments”) are valued using the amortized cost method of valuation, unless the use of such method would be inappropriate. The amortized
| 45 |
Notes to Consolidated Financial Statements (continued)
cost method involves valuing a security at its cost on the date of purchase and thereafter assuming a constant amortization to maturity of the difference between such cost and the value on maturity date. Amortized cost approximates the current fair value of a security. These securities are generally categorized as Level 2 in the hierarchy.
Foreign currency forward contracts are valued at their fair market values measured on the basis of the mean between the last current bid and ask prices based on dealer or exchange quotations and are generally categorized as Level 2 in the hierarchy.
Swaps are marked to market daily based upon quotations from pricing agents, brokers, or market makers. These securities are generally categorized as Level 2 in the hierarchy.
The information above is not intended to reflect an exhaustive list of the methodologies that may be used to value portfolio investments. The valuation procedures permit the use of a variety of valuation methodologies in connection with valuing portfolio investments. The methodology used for a specific type of investment may vary based on the market data available or other considerations. The methodologies summarized above may not represent the specific means by which portfolio investments are valued on any particular business day.
A Fund security or other asset may be determined to be illiquid under procedures approved by the Board. Illiquidity of a security might prevent the sale of such security at a time when the Manager or Subadvisors might wish to sell, and these securities could have the effect of decreasing the overall level of the Fund’s liquidity. Further, the lack of an established secondary market may make it more difficult to value illiquid securities, requiring the Fund to rely on judgments that may be somewhat subjective in measuring value, which could vary from the amount that the Fund could realize upon disposition. Difficulty in selling illiquid securities may result in a loss or may be costly to the Fund. Under the supervision of the Board, the Manager or Subadvisors measure the liquidity of the Fund’s investments; in doing so, the Manager or Subadvisors may consider various factors, including (i) the frequency of trades and quotations, (ii) the number of dealers and prospective purchasers, (iii) dealer undertakings to make a market, and (iv) the nature of the security and the market in which it trades (e.g., the time needed to dispose of the security, the method of soliciting offers and the mechanics of transfer). Illiquid securities generally will be valued by methods deemed reasonable in good faith in such a manner as the Board deems appropriate to reflect their fair value. The liquidity of the Fund’s investments, as shown in the Consolidated Portfolio of Investments, was measured as of April 30, 2016 and can change at any time in response to, among other relevant factors, market conditions or events or developments with respect to an individual issuer or instrument. As of April 30, 2016, securities deemed to be illiquid under procedures approved by the Board are shown in the Consolidated Portfolio of Investments.
(B) Income Taxes. The Fund’s policy is to comply with the requirements of the Internal Revenue Code of 1986, as amended (the “Internal Revenue Code”), applicable to regulated investment companies and to distribute all of the taxable income to the shareholders of the Fund within the allowable time limits. Therefore, no federal, state and local income tax provisions are required.
Management evaluates the Fund’s tax positions to determine if the tax positions taken meet the minimum recognition threshold in connection with accounting for uncertainties in income tax positions taken or expected to be taken for the purposes of measuring and recognizing tax liabilities in the consolidated financial statements. Recognition of tax benefits of an uncertain tax position is permitted only to the extent the position is “more likely than not” to be sustained assuming examination by taxing authorities. Management has analyzed the Fund’s tax positions taken on federal, state and local income tax returns for all open tax years (for up to three tax years), and has concluded that no provisions for federal, state and local income tax are required in the Fund’s consolidated financial statements. The Fund’s federal, state and local income and federal excise tax returns for tax years for which the applicable statutes of limitations have not expired are subject to examination by the Internal Revenue Service and state and local departments of revenue.
For U.S. tax purposes, the Cayman Subsidiary (defined in Note 2(V)) is treated as a controlled foreign corporation (“CFC”) of the Fund under the Code. As a U.S. shareholder of a CFC, the Fund is required to include its share of the Cayman Subsidiary’s earnings in its taxable income. Any net loss or deficit in earnings generated by the Cayman Subsidiary cannot be deducted by the Fund in the period incurred, nor can such loss or deficit in earnings be carried forward to offset the Fund’s taxable income and the Cayman Subsidiary’s earnings in future periods. As a Cayman Islands exempted limited company, the Cayman Subsidiary has received an undertaking from the Government of the Cayman Islands exempting it from all local income, profits and capital gains taxes. No such taxes are levied in the Cayman Islands at this time.
With respect to Fund investments in the Cayman Subsidiary, the Internal Revenue Service (“IRS”) has issued private letter rulings to regulated investment companies (but not the Fund) in which the IRS specifically concluded that income and gains earned by a regulated investment company from its investment in a wholly-owned foreign subsidiary that invests in commodity-linked instruments are qualifying gross income of a regulated investment company for purposes of compliance with Subchapter M of the Code. However, the Fund is not able to rely on private letter rulings issued to other taxpayers. Additionally, the IRS has suspended the issuance of such private letter rulings, pending review of its position on this matter. In connection with investments in the Cayman Subsidiary, the Fund has obtained an opinion of counsel that gross income derived by the Fund from its investment in the Cayman Subsidiary should constitute qualifying gross income of a regulated investment company under Subchapter M of the Code. However, no assurances can be provided that the IRS would not be able to successfully assert that the gross income derived by the Fund from its investment in the Cayman Subsidiary was not qualifying gross income of a regulated investment company under Subchapter M of the Internal Revenue Code, in which case the Fund could fail to qualify as a regulated investment company under Subchapter M of the Code if less than 90% of its gross income was not derived from such qualifying gross income. If the Fund failed to qualify as a regulated investment company, it would be subject to federal and state income tax on all of its taxable income at regular corporate tax rates. This would significantly adversely affect the returns to, and could cause substantial losses for, Fund shareholders.
| 46 | MainStay Absolute Return Multi-Strategy Fund |
(C) Foreign Taxes. The Fund may be subject to foreign taxes on income and other transaction-based taxes imposed by certain countries in which it invests. A portion of the taxes on gains on investments or currency purchases/repatriation may be recoverable. The Fund will accrue such taxes and recoveries as applicable, based upon its current interpretation of tax rules and regulations that exist in the markets in which it invests.
The Fund may be subject to taxation on realized capital gains, repatriation proceeds and other transaction-based taxes imposed by certain countries in which it invests. The Fund will accrue such taxes as applicable based upon its current interpretation of tax rules and regulations that exist in the market in which it invests. Capital gains taxes relating to positions still held are reflected as a liability on the Consolidated Statement of Assets and Liabilities, and are included with unrealized appreciation (depreciation). Taxes related to capital gains realized during the period ended April 30, 2016, if any, are reflected as part of net realized gain (loss) in the Consolidated Statement of Operations. Changes in tax liabilities related to capital gains taxes on unrealized investment gains, if any, are reflected as part of the change in net unrealized appreciation (depreciation) on investments in the Consolidated Statement of Operations. Transaction-based charges are generally assessed as a percentage of the transaction amount.
(D) Dividends and Distributions to Shareholders. Dividends and distributions are recorded on the ex-dividend date. The Fund intends to declare and pay dividends from net investment income, if any, at least monthly and distributions from net realized capital and currency gains, if any, at least annually. Unless the shareholder elects otherwise, all dividends and distributions are reinvested in the same class of shares of the Fund, at NAV. Dividends and distributions to shareholders are determined in accordance with federal income tax regulations and may differ from GAAP.
(E) Security Transactions and Investment Income. The Fund records security transactions on the trade date. Realized gains and losses on security transactions are determined using the identified cost method. Dividend income is recognized on the ex-dividend date; net of any foreign tax withheld at the source, and interest income is accrued as earned using the effective interest rate method and includes realized gains and losses from repayments of principal on mortgage-backed securities. Discounts and premiums on securities purchased, other than Short-Term Investments, for the Fund are accreted and amortized, respectively, on the effective interest rate method over the life of the respective securities or, in the case of a callable security, over the period to the first date of call. Discounts and premiums on Short-Term Investments are accreted and amortized, respectively, on the straight-line method. The straight-line method approximates the effective interest method for short-term investments. Income from payment-in-kind securities is recorded daily based on the effective interest method of accrual.
The Fund may invest in master limited partnerships (“MLPs”). To comply with Subchapter M of the Code, the Fund may invest no more than 25% of its total assets in MLPs. Distributions on a MLP are generally recorded based on the characterization reported on the Fund’s Form 1065, Schedule K-1, received from the MLP. The Fund records its pro rata share of the income and deductions, and capital gains and losses allocated from each MLP on its Consolidated Statement of Operations,
as well as adjusts the cost basis of each MLP accordingly, as reported on the Fund’s Consolidated Portfolio of Investments.
Distributions received from investments in energy related U.S. royalty trusts and Canadian royalty trusts and exploration and production companies (collectively, “Energy Trusts”) and MLPs generally are comprised of ordinary income, capital gains and return of capital from the Energy Trusts or MLPs. The Fund records its investment income on the ex-date of the distributions. For purposes of the consolidated financial statements, the Fund uses return of capital and income estimates to allocate the dividend income received. Such estimates are based on historical information available from each Energy Trust, MLP and other industry sources. These estimates may subsequently be revised based on information received from Energy Trusts or MLPs after their tax reporting periods are concluded, as the actual character of these distributions is not known until after the fiscal year end.
The Fund estimates the allocation of investment income and return of capital associated with distributions received from MLPs and recorded on the Consolidated Statement of Operations. For the period ended April 30, 2016, the Fund estimated approximately 100% of the distributions received from MLPs to be from return of capital.
Investment income and realized and unrealized gains and losses on investments of the Fund are allocated to separate classes of shares pro rata based upon their relative net assets on the date the income is earned or realized and unrealized gains and losses are incurred.
The Fund may place a debt security on non-accrual status and reduce related interest income by ceasing current accruals and writing off interest receivables when the collection of all or a portion of interest has become doubtful. A debt security is removed from non-accrual status when the issuer resumes interest payments or when collectability of interest is reasonably assured.
(F) Expenses. Expenses of the Trust are allocated to the individual Funds in proportion to the net assets of the respective Funds when the expenses are incurred, except where direct allocations of expenses can be made. Expenses (other than transfer agent expenses and fees incurred under the shareholder services plans and/or the distribution plans further discussed in Note 3(B)) are allocated to separate classes of shares pro rata based upon their relative net assets on the date the expenses are incurred. The expenses borne by the Fund, including those of related parties to the Fund, are shown in the Consolidated Statement of Operations.
(G) Use of Estimates. In preparing the consolidated financial statements in conformity with GAAP, management makes estimates and assumptions that affect the reported amounts and disclosures in the consolidated financial statements. Actual results could differ from those estimates.
(H) Repurchase Agreements. The Fund may enter into repurchase agreements to earn income. The Fund may enter into repurchase agreements only with financial institutions that are deemed by the Manager or Subadvisors to be creditworthy, pursuant to guidelines established by the Board. During the term of any repurchase agreement, the Manager or Subadvisors will continue to monitor the creditworthiness of the seller. Under the 1940 Act, repurchase agreements are considered to be collateralized loans by the Fund to the seller secured by the securities transferred to the Fund.
| 47 |
Notes to Consolidated Financial Statements (continued)
When the Fund enters into repurchase agreements, the Fund’s custodian takes possession of the collateral pledged for investments in the repurchase agreement. The underlying collateral is valued daily on a mark to market basis to determine if the value, including accrued interest, exceeds the repurchase price. In the event of the seller’s default on the obligation to repurchase, the Fund has the right to liquidate the collateral and apply the proceeds in satisfaction of the obligation. Under certain circumstances, such as in the event of default or bankruptcy by the counterparty to the agreement, realization and/or retention of the collateral may be subject to legal proceedings and possible realized loss to the Fund.
(I) Futures Contracts. A futures contract is an agreement to purchase or sell a specified quantity of an underlying instrument at a specified future date and price, or to make or receive a cash payment based on the value of a financial instrument (e.g., foreign currency, interest rate, security, or securities index). The Fund is subject to market price risk and/or interest rate risk in the normal course of investing in these transactions. Upon entering into a futures contract, the Fund is required to pledge to the broker or futures commission merchant an amount of cash and/or U.S. Government securities equal to a certain percentage of the collateral amount, known as the “initial margin.” During the period the futures contract is open, changes in the value of the contract are recognized as unrealized appreciation or depreciation by marking to market such contract on a daily basis to reflect the market value of the contract at the end of each day’s trading. The Fund agrees to receive from or pay to the broker or futures commission merchant an amount of cash equal to the daily fluctuation in the value of the contract. Such receipts or payments are known as “variation margin.” When the futures contract is closed, the Fund records a realized gain or loss equal to the difference between the proceeds from (or cost of) the closing transaction and the Fund’s basis in the contract.
The use of futures contracts involves, to varying degrees, elements of market risk in excess of the amount recognized in the Consolidated Statement of Assets and Liabilities. The contract or notional amounts and variation margin reflect the extent of the Fund’s involvement in open futures positions. There are several risks associated with the use of futures contracts as hedging techniques. There can be no assurance that a liquid market will exist at the time when the Fund seeks to close out a futures contract. If no liquid market exists, the Fund would remain obligated to meet margin requirements until the position is closed. Futures may involve a small initial investment relative to the risk assumed, which could result in losses greater than if they had not been used. Futures may be more volatile than direct investments in the instrument underlying the futures, and may not correlate to the underlying instrument, causing a given hedge not to achieve its objectives. The Fund’s activities in futures contracts have minimal counterparty risk as they are conducted through regulated exchanges that guarantee the futures against default by the counterparty. In the event of a bankruptcy or insolvency of a futures commission merchant that holds margin on behalf of the Fund, the Fund may not be entitled to the return of the entire margin owed to the Fund, potentially resulting in a loss. The Fund’s investment in futures contracts and other derivatives may increase the volatility of the Fund’s NAV and may result in a loss to the Fund.
(J) Swap Contracts. The Fund may enter into credit default, interest rate, equity, index and currency exchange rate contracts
(“swaps”). In a typical swap transaction, two parties agree to exchange the future returns (or differentials in rates of future returns) earned or realized at periodic intervals on a particular investment or instrument based on a notional principal amount. Generally, the Fund will enter into a swap on a net basis, which means that the two payment streams under the swap are netted, with the Fund receiving or paying (as the case may be) only the net amount of the two payment streams. Therefore, the Fund’s current obligation under a swap generally will be equal to the net amount to be paid or received under the swap, based on the relative value of notional positions attributable to each counterparty to the swap. The payments may be adjusted for transaction costs, interest payments, the amount of interest paid on the investment or instrument or other factors. Collateral, in the form of cash or securities, may be required to be held in segregated accounts with the custodian bank or broker in accordance with the terms of the swap. Swap agreements are privately negotiated in the over the counter market (“OTC swaps”) and may be executed in a multilateral or other trade facilities platform, such as a registered commodities exchange (“centrally cleared swaps”).
Certain standardized swaps, including certain credit default and interest rate swaps, are subject to mandatory clearing, and more types of standardized swaps are expected to be subject to mandatory clearing in the future. The counterparty risk for cleared derivatives is expected to be generally lower than for uncleared derivatives, but cleared contracts are not risk-free. In a cleared derivative transaction, the Fund typically enters into the transaction with a financial institution counterparty, and performance of the transaction is effectively guaranteed by a central clearinghouse, thereby reducing or eliminating the Fund’s exposure to the credit risk of its original counterparty. The Fund will be required to post specified levels of margin with the clearinghouse or at the instruction of the clearinghouse; the margin required by a clearinghouse may be greater than the margin the Fund would be required to post in an uncleared transaction. As of April 30, 2016, all swap positions outstanding are shown in the Consolidated Portfolio of Investments.
Swaps are marked to market daily based upon quotations from pricing agents, brokers, or market makers and the change in value, if any, is recorded as unrealized appreciation or depreciation. Any payments made or received upon entering into a swap would be amortized or accreted over the life of the swap and recorded as a realized gain or loss. Early termination of a swap is recorded as a realized gain or loss. Daily changes in valuation of centrally cleared swaps, if any, are recorded as a receivable or payable for the change in value as appropriate (“variation margin”) on the Consolidated Statement of Assets and Liabilities.
The Fund bears the risk of loss of the amount expected to be received under a swap in the event of the default or bankruptcy of the swap counterparty. The Fund may be able to eliminate its exposure under a swap either by assignment or other disposition, or by entering into an offsetting swap with the same party or a similar creditworthy party. Swaps are not actively traded on financial markets. Entering into swaps involves elements of credit, market, and documentation risk in excess of the amounts recognized on the Consolidated Statement of Assets and Liabilities. Such risks involve the possibilities that there will be no liquid market for these swaps, that the counterparty to the swaps may default on its obligation to perform or disagree as to the meaning of the contractual terms in the swaps and that there may be unfavorable changes
| 48 | MainStay Absolute Return Multi-Strategy Fund |
in interest rates, the price of the index or the security underlying these transactions.
Interest Rate Swaps: An interest rate swap is an agreement between two parties where one stream of future interest payments is exchanged for another based on a specified principal amount. Interest rate swaps often exchange a fixed payment for a floating payment that is linked to an interest rate (most often the London InterBank Offered Rate (“LIBOR”)). The Fund will typically use interest rate swaps to limit, or manage, its exposure to fluctuations in interest rates, or to obtain a marginally lower interest rate than it would have been able to get without the swap.
Credit Default Swaps: The Fund may enter into credit default swaps to simulate long and short bond positions or to take an active long or short position with respect to the likelihood of a default or credit event by the issuer of the underlying reference obligation. The types of reference obligations underlying the swaps that may be entered into by the Fund include debt obligations of a single issuer of corporate or sovereign debt, a basket of obligations of different issuers or a credit index. A credit index is an equally-weighted credit default swap index that is designed to track a representative segment of the credit default swap market (e.g., investment grade, high volatility, below investment grade or emerging markets) and provides an investor with exposure to specific “baskets” of issuers of certain debt instruments. Index credit default swaps have standardized terms including a fixed spread and standard maturity dates. The composition of the obligations within a particular index changes periodically. Credit default swaps involve one party, the protection buyer, making a stream of payments to another party, the protection seller, in exchange for the right to receive a contingent payment if there is a credit event related to the underlying reference obligation. In the event that the reference obligation matures prior to the termination date of the contract, a similar security will be substituted for the duration of the contract term. Credit events are defined under individual swap agreements and generally include bankruptcy, failure to pay, restructuring, repudiation/moratorium, obligation acceleration and obligation default. Selling protection effectively adds leverage to a portfolio up to the notional amount of the swap agreement. Potential liabilities under these contracts may be reduced by: the auction rates of the underlying reference obligations; upfront payments received at the inception of a swap; and net amounts received from credit default swaps purchased with the identical reference obligation.
Equity Swaps (Total Return Swaps): Total return swap contracts are agreements between counterparties to exchange cash flow, one based on a market-linked return of an individual asset or group of assets (such as an index), and the other on a fixed or floating rate. As a total return swap, an equity swap may be structured in different ways. For example, when the Fund enters into a “long” equity swap, the counterparty may agree to pay the Fund the amount, if any, by which the notional amount of the equity swap would have increased in value had it been invested in a particular referenced security or securities, plus the dividends that would have been received on those securities. In return, the Fund will generally agree to pay the counterparty interest on the notional amount of the equity swap plus the amount, if any, by which that notional amount would have decreased in value had it been invested in such referenced security or securities, plus, in certain instances, commissions or trading spreads on the notional amounts. Therefore, the Fund’s
return on the equity swap generally should equal the gain or loss on the notional amount, plus dividends on the referenced security or securities less the interest paid by the Fund on the notional amount. Alternatively, when the Fund enters into a “short” equity swap, the counterparty will generally agree to pay the Fund the amount, if any, by which the notional amount of the equity swap would have decreased in value had the Fund sold a particular referenced security or securities short, less the dividend expense that the Fund would have incurred on the referenced security or securities, as adjusted for interest payments or other economic factors. In this situation, the Fund will generally be obligated to pay the amount, if any, by which the notional amount of the swap would have increased in value had it been invested directly in the referenced security or securities.
Equity swaps generally do not involve the delivery of securities or other referenced assets. Accordingly, the risk of loss with respect to equity swaps is normally limited to the net amount of payments that the Fund is contractually obligated to make. If the other party to an equity swap defaults, the Fund’s risk of loss consists of the net amount of payments that the Fund is contractually entitled to receive, if any. The Fund will segregate cash or liquid assets, enter into offsetting transactions or use other measures permitted by applicable law to “cover” the Fund’s current obligations. The Fund and New York Life Investments, however, believe these transactions do not constitute senior securities under the 1940 Act and, accordingly, will not treat them as being subject to the Fund’s borrowing restrictions.
Equity swaps are derivatives and their value can be very volatile. The Fund may engage in total return swaps to gain exposure to emerging markets securities, along with offsetting long total return swap positions to maintain appropriate currency balances and risk exposures across all swap positions. To the extent that the Manager, or Subadvisors do not accurately analyze and predict future market trends, the values or assets or economic factors, the Fund may suffer a loss, which may be substantial.
(K) Foreign Currency Forward Contracts. The Fund may enter into foreign currency forward contracts, which are agreements to buy or sell foreign currencies on a specified future date at a specified rate. The Fund is subject to foreign currency exchange rate risk in the normal course of investing in these transactions. During the period the forward contract is open, changes in the value of the contract are recognized as unrealized appreciation or depreciation by marking to market such contract on a daily basis to reflect the market value of the contract at the end of each day’s trading. Cash movement occurs on settlement date. When the forward contract is closed, the Fund records a realized gain or loss equal to the difference between the proceeds from (or cost of) the closing transaction and the Fund’s basis in the contract. The Fund may purchase and sell foreign currency forward contracts for purposes of seeking to enhance portfolio returns and manage portfolio risk more efficiently. Foreign currency forward contracts may also be used to gain exposure to a particular currency or to hedge against the risk of loss due to changing currency exchange rates. Foreign currency forward contracts to purchase or sell a foreign currency may also be used in anticipation of future purchases or sales of securities denominated in foreign currency, even if the specific investments have not yet been selected.
| 49 |
Notes to Consolidated Financial Statements (continued)
The use of foreign currency forward contracts involves, to varying degrees, elements of risk in excess of the amount recognized in the Consolidated Statement of Assets and Liabilities, including counterparty risk, market risk, and illiquidity risk. Counterparty risk is heightened for these investments because foreign currency forward contracts are not exchange-traded and therefore no clearinghouse or exchange stands ready to meet the obligations under such contracts. Thus, the Fund faces the risk that its counterparties under such contracts may not perform their obligations. Market risk is the risk that the value of a foreign currency forward contract will depreciate due to unfavorable changes in exchange rates. Illiquidity risk arises because the secondary market for foreign currency forward contracts may have less liquidity relative to markets for other securities and financial instruments. Risks also arise from the possible movements in the foreign exchange rates underlying these instruments. While the Fund may enter into forward contracts to reduce currency exchange risks, changes in currency exchange rates may result in poorer overall performance for the Fund than if it had not engaged in such transactions. Exchange rate movements can be large, depending on the currency, and can last for extended periods of time, affecting the value of the Fund’s assets. Moreover, there may be an imperfect correlation between the Fund’s holdings of securities denominated in a particular currency and the forward contracts entered into by the Fund. Such imperfect correlation may prevent the Fund from achieving the intended hedge or expose the Fund to the risk of currency exchange loss. The unrealized appreciation (depreciation) on forward contracts also reflects the Fund’s exposure at the valuation date to credit loss in the event of a counterparty’s failure to perform its obligations.
(L) Foreign Currency Transactions. The Fund’s books and records are maintained in U.S. dollars. Prices of securities denominated in foreign currency amounts are translated into U.S. dollars at the mean between the buying and selling rates last quoted by any major U.S. bank at the following dates:
| (i) | market value of investment securities, other assets and liabilities—at the valuation date; and |
| (ii) | purchases and sales of investment securities, income and expenses—at the date of such transactions. |
The assets and liabilities that are denominated in foreign currency amounts are presented at the exchange rates and market values at the close of the period. The realized and unrealized changes in net assets arising from fluctuations in exchange rates and market prices of securities are not separately presented.
Net realized gain (loss) on foreign currency transactions represents net gains and losses on foreign currency forward contracts, net currency gains or losses realized as a result of differences between the amounts of securities sale proceeds or purchase cost, dividends, interest and withholding taxes as recorded on the Fund’s books, and the U.S. dollar equivalent amount actually received or paid. Net currency gains or losses from valuing such foreign currency denominated assets and liabilities, other than investments at valuation date exchange rates, are reflected in unrealized foreign exchange gains or losses.
(M) Rights and Warrants. Rights are certificates that permit the holder to purchase a certain number of shares, or a fractional share, of a new stock from the issuer at a specific price. Warrants are
instruments that entitle the holder to buy an equity security at a specific price for a specific period of time. These investments can provide a greater potential for profit or loss than an equivalent investment in the underlying security. Prices of these investments do not necessarily move in tandem with the prices of the underlying securities.
There is risk involved in the purchase of rights and warrants in that these investments are speculative investments. The Fund could also lose the entire value of its investment in warrants if such warrants are not exercised by the date of its expiration. The Fund is exposed to risk until the sale or exercise of each right or warrant is completed.
(N) Options. The Fund may write call and put options on securities and financial derivative instruments it owns or in which it may invest. Writing put options tends to increase the Fund’s exposure to the underlying instrument. Writing call options tends to decrease the Fund’s exposure to the underlying instrument. When the Fund writes a call or put, an amount equal to the premium received is recorded as a liability and subsequently marked to market to reflect the current value of the option written. These liabilities are reflected as written options outstanding on the Consolidated Statement of Assets and Liabilities. Premiums received from writing options which expire are treated as realized gains. Premiums received from writing options which are exercised or closed are added to the proceeds or offset against amounts paid on the underlying futures, swaps, security or currency transaction to determine the realized gain or loss. Certain options may be written with premiums to be determined on a future date. The Fund, as a writer of an option has no control over whether the underlying instrument may be sold (call) or purchased (put) and as a result bears the market risk of an unfavorable change in the price of the instrument underlying the written option. There is the risk the Fund may not be able to enter into a closing transaction because of an illiquid market.
The Fund may also purchase put and call options. Purchasing call options tends to increase the Fund’s exposure to the underlying instrument. Purchasing put options tends to decrease the Fund’s exposure to the underlying instrument. The Fund pays a premium which is included on the Fund’s Consolidated Statement of Assets and Liabilities as an investment and subsequently marked to market to reflect the current value of the option. Premiums paid for purchasing options which expire are treated as realized losses. Certain options may be purchased with premiums to be determined on a future date. The premiums for these options are based upon implied volatility parameters at specified terms. The risk associated with purchasing put and call options is limited to the premium paid. Premiums paid for purchasing options which are exercised or closed are added to the amounts paid or offset against the proceeds on the underlying investment transaction to determine the realized gain or loss when the underlying transaction is sold.
The Fund may purchase or write foreign currency options. Purchasing a foreign currency option gives the Fund the right, but not the obligation, to buy or sell a specified amount of the currency at a specified rate of exchange that may be exercised on or before the option’s expiration date. These options may be used as a short or long hedge against possible variations in foreign exchange rates or to gain exposure to foreign currencies.
| 50 | MainStay Absolute Return Multi-Strategy Fund |
During the period ended April 30, 2016, the Fund engaged in the following transactions in written options:
| Notional Amount | Premium | |||||||
Options Outstanding at June 18, 2015 | $ | — | $ | — | ||||
Options—Written | 2,001,000 | 21,509 | ||||||
Options—Bought back | (2,000,000 | ) | (20,808 | ) | ||||
Options—Exercised | (1,000 | ) | (701 | ) | ||||
Options Outstanding at April 30, 2016 | $ | — | $ | — | ||||
(O) Securities Sold Short. The Fund engages in sales of securities it does not own (“short sales”) as part of its investment strategy. When the Fund enters into a short sale, it must segregate or maintain with a broker the cash proceeds from the security sold short or other securities as collateral for its obligation to deliver the security upon conclusion of the sale. During the period a short position is open, depending on the nature and type of security, a short position is reflected as a liability and is marked to market in accordance with the valuation methodologies previously detailed (See Note 2(A)). Liabilities for securities sold short are closed out by purchasing the applicable securities for delivery to the counterparty broker. A gain, limited to the price at which the Fund sold the security short, or a loss, unlimited as to dollar amount, will be recognized upon termination of a short sale if the market price on the date the short position is closed out is less or greater, respectively, than the proceeds originally received. Any such gain or loss may be offset, completely or in part, by the change in the value of the hedged investments. Interest on short positions held is accrued daily, while dividends declared on short positions existing on the record date are recorded on the ex-dividend date as a dividend expense in the Consolidated Statement of Operations. Broker fees and other expenses related to securities sold short are disclosed in the Consolidated Statement of Operations. Short sales involve risk of loss in excess of the related amounts reflected in the Consolidated Statement of Assets and Liabilities.
(P) Offering Costs. Costs were incurred by the Fund in connection with the commencement of the Fund’s operations. These costs are being amortized on a straight line basis over twelve months.
(Q) Securities Lending. In order to realize additional income, the Fund may engage in securities lending, subject to the limitations set forth in the 1940 Act and relevant guidance by the staff of the Securities and Exchange Commission. In the event the Fund does engage in securities lending, the Fund will lend through its custodian, State Street Bank and Trust Company (“State Street”). State Street will manage the Fund’s cash collateral in accordance with the lending agreement between the Fund and State Street, and indemnify the Fund against counterparty risk. The loans will be collateralized by cash or securities at least equal at all times to the market value of the securities loaned. Collateral will consist of U.S. government securities, cash equivalents or irrevocable letters of credit. The Fund may bear the risk of delay in recovery of, or loss of rights in, the securities loaned should the borrower of the securities experience financial difficulty. The Fund may also record a realized gain or loss on securities deemed sold due to a borrower’s inability to return securities on loan. The Fund bears the risk of any loss on investment of the collateral. The Fund will receive compensation for lending its securities in the form of fees or it will retain a portion of interest on the investment of any cash received as collateral. The Fund will also
continue to receive interest and dividends on the securities loaned and any gain or loss in the market price of the securities loaned that may occur during the term of the loan will be for the account of the Fund. During the period ended April 30, 2016, the Fund did not have any portfolio securities on loan.
(R) Concentration of Risk. The Fund may invest in high-yield debt securities (sometimes called “junk bonds”), which are generally considered speculative because they present a greater risk of loss, including default, than higher quality debt securities. These securities pay investors a premium—a higher interest rate or yield than investment grade debt securities—because of the increased risk of loss. These securities can also be subject to greater price volatility.
The Fund may invest up to 25% of its total assets in securities of domestic and foreign publicly traded partnerships and/or other issuers (including U.S. and Canadian royalty trusts and Canadian energy companies) engaged in the transportation, storage, processing, refining, marketing, exploration, production or mining of crude oil, natural gas, minerals or other natural resources (“Energy Companies”). The Fund may be particularly vulnerable to adverse events affecting Energy Companies as a result of its focus in Energy Companies.
The Fund may invest as limited partners in the equity securities of MLPs. As limited partners of MLPs, holders of MLP equity securities are subject to certain risks inherent in the structure of MLPs, including (i) tax risks, (ii) the limited ability to elect or remove management or the general partner or managing member, (iii) limited voting rights, except with respect to extraordinary transactions, and (iv) conflicts of interest between the general partner or managing member and its affiliates, on the one hand, and the limited partners or members, on the other hand, including those arising from incentive distribution payments or corporate opportunities.
The Fund may invest in foreign securities, which carry certain risks that are in addition to the usual risks inherent in domestic instruments. These risks include those resulting from currency fluctuations, future adverse political or economic developments and possible imposition of currency exchange blockages or other foreign governmental laws or restrictions. These risks are likely to be greater in emerging markets than in developed markets. The ability of issuers of debt securities held by the Fund to meet their obligations may be affected by economic or political developments in a specific country, industry or region.
Cash comprises U.S. dollar and foreign currency deposits held at a bank(s) or custodian bank(s) which may exceed insured limits. The Fund may be subject to risk to the extent that the institutions may be unable to fulfill their obligations.
The Fund may enter into investment transactions which may represent off-balance sheet risk. Off-balance sheet risk exists when the maximum potential loss on a particular investment is greater than the value of such investment, as reflected in the Consolidated Statement of Assets and Liabilities. Off-balance sheet risk generally arises from the use of derivative financial instruments or short sales.
(S) Counterparty Credit Risk. In order to better define its contractual rights and to secure rights that will help the Fund mitigate its counterparty risk, the Fund may enter into an International Swaps and Derivatives Association, Inc. Master Agreement (“ISDA Master
Agreement”) or similar agreement with its counterparties. An ISDA
| 51 |
Notes to Consolidated Financial Statements (continued)
Master Agreement is a bilateral agreement between the Fund and a counterparty that governs certain OTC derivatives and typically contains collateral posting terms and netting provisions. Under an ISDA Master Agreement, the Fund may, under certain circumstances, offset with the counterparty certain derivative financial instruments’ payables and/or receivables with collateral held and/or posted and create one single net payment. The provisions of the ISDA Master Agreement typically permit a single net payment in the event of default including the bankruptcy or insolvency of the counterparty. Bankruptcy or insolvency laws of a particular jurisdiction may restrict or prohibit the right of offset in bankruptcy, insolvency or other events. In addition, certain ISDA Master Agreements may contain provisions for early termination of OTC derivative transactions in the event the net assets of the Fund decline below specific levels or if the Fund fails to meet the terms of its ISDA Master Agreements. The result would cause the Fund to accelerate payment of any net liability owed to the counterparty. For financial reporting purposes, the Fund does not offset derivative assets and derivative liabilities that are subject to netting arrangements, if any, in the Consolidated Statements of Assets and Liabilities.
(T) Indemnifications. Under the Trust’s organizational documents, its officers and trustees are indemnified against certain liabilities that may arise out of performance of their duties to the Trust. Additionally, in the normal course of business, the Fund enters into contracts with third-party service providers that contain a variety of representations and warranties and which may provide general indemnifications. The Fund’s maximum exposure under these arrangements is unknown, as this would involve future claims that may be made against the Fund that
have not yet occurred. Based on experience, management is of the view that the risk of loss in connection with these potential indemnification obligations is remote. However, there can be no assurance that material liabilities related to such obligations will not arise in the future, which could adversely impact the Fund.
(U) Quantitative Disclosure of Derivative Holdings. The following tables show additional disclosures related to the Fund’s derivative and hedging activities, including how such activities are accounted for and their effect on the Fund’s financial positions, performance and cash flows. These derivatives are not accounted for as hedging instruments.
The Fund utilizes a range of derivative instruments for a variety of different purposes. Total return swaps are one form of derivative that is used. In some cases, TRS contracts are entered into so as to affect long and short exposure to individual securities or indices within a particular strategy. In other cases, TRS are used to gain exposure to the strategy itself, which may also use derivatives. For example, a TRS contract is used to generate the return available from a customized index comprised of a diversified basket of exchange-traded futures. Other examples of derivative positions into which the Fund has entered include interest rate swaps, credit default swaps and option contracts. These instruments are frequently used to obtain a desired return at a lower cost to the Fund than is available when investing directly in the underlying instrument or to hedge against credit and interest rate risks. The Fund has also entered into foreign currency forward contracts to gain exposure to a particular currency or to hedge against the risk of loss due to changing currency exchange rates.
Fair value of derivative instruments as of April 30, 2016:
Asset Derivatives
Consolidated Statement of Assets and Liabilities Location | Equity Contracts Risk | Credit Contracts Risk | Foreign Exchange Contracts Risk | Interest Rate Contracts Risk | Total | |||||||||||||||||
Futures Contracts | Net Assets-Net unrealized appreciation (depreciation) on investments and futures contracts (a) | $ | — | $ | — | $ | — | $ | 28,764 | $ | 28,764 | |||||||||||
Swap Contracts | Unrealized appreciation on swap contracts (b) | 816,341 | 120,569 | — | 161,520 | 1,098,430 | ||||||||||||||||
Forward Contracts | Unrealized appreciation on foreign currency forward contracts | — | — | 7,720 | — | 7,720 | ||||||||||||||||
|
| |||||||||||||||||||||
Total Fair Value | $ | 816,341 | $ | 120,569 | $ | 7,720 | $ | 190,284 | $ | 1,134,914 | ||||||||||||
|
| |||||||||||||||||||||
Liability Derivatives
Consolidated Statement of Assets and Liabilities Location | Equity Contracts Risk | Credit Contracts Risk | Foreign Exchange Contracts Risk | Interest Rate Contracts Risk | Total | |||||||||||||||||
Forward Contracts | Unrealized depreciation on foreign currency forward contracts | $ | — | $ | — | $ | (239,529 | ) | $ | — | $ | (239,529 | ) | |||||||||
Swap Contracts | Premiums received for swap contracts | (508 | ) | (7,301 | ) | — | — | (7,809 | ) | |||||||||||||
Swap Contracts | Unrealized depreciation on swap contracts (b) | (480,152 | ) | (68,932 | ) | — | (8,647 | ) | (557,731 | ) | ||||||||||||
|
| |||||||||||||||||||||
Total Fair Value | $ | (480,660 | ) | $ | (76,233 | ) | $ | (239,529 | ) | $ | (8,647 | ) | $ | (805,069 | ) | |||||||
|
| |||||||||||||||||||||
| (a) | Includes cumulative appreciation (depreciation) of futures contracts as reported in the Consolidated Portfolio of Investments. Only current day’s variation margin is reported within the Consolidated Statement of Assets and Liabilities. |
| 52 | MainStay Absolute Return Multi-Strategy Fund |
| (b) | Includes cumulative appreciation (depreciation) of centrally cleared swap agreements as reported in the Consolidated Portfolio of Investments. Only current day’s variation margin of centrally cleared swaps is reported within the Consolidated Statement of Assets and Liabilities. |
The effect of derivative instruments on the Consolidated Statement of Operations for the period ended April 30, 2016:
Realized Gain (Loss)
Consolidated Statement of Operations Location | Equity Contracts Risk | Credit Contracts Risk | Foreign Exchange Contracts Risk | Interest Rate Contracts Risk | Total | |||||||||||||||||
Purchased Options | Net realized gain (loss) on investments transactions | $ | — | $ | — | $ | — | $ | (28,081 | ) | $ | (28,081 | ) | |||||||||
Written Option | Net realized gain (loss) on written option transactions | — | — | — | 15,357 | 15,357 | ||||||||||||||||
Futures Contracts | Net realized gain (loss) on futures transactions | — | — | — | (145,722 | ) | (145,722 | ) | ||||||||||||||
Forward Contracts | Net realized gain (loss) on foreign currency transactions | — | — | (37,253 | ) | — | (37,253 | ) | ||||||||||||||
Swap Contracts | Net realized gain (loss) on swap transactions | 1,635,385 | 219,659 | — | (6,113 | ) | 1,848,931 | |||||||||||||||
|
| |||||||||||||||||||||
Total Realized Gain (Loss) | $ | 1,635,385 | $ | 219,659 | $ | (37,253 | ) | $ | (164,559 | ) | $ | 1,653,232 | ||||||||||
|
|
|
|
|
|
|
|
|
| |||||||||||||
Change in Unrealized Appreciation (Depreciation)
Consolidated Statement of Location | Equity Contracts Risk | Credit Contracts Risk | Foreign Exchange Contracts Risk | Interest Rate Contracts Risk | Total | |||||||||||||||||
Futures Contracts | Net change in unrealized appreciation (depreciation) on futures contracts | $ | — | $ | — | $ | — | $ | 28,764 | $ | 28,764 | |||||||||||
Forward Contracts | Net change in unrealized appreciation (depreciation) on translation of other assets and liabilities in foreign currencies and foreign currency forward contracts | — | — | (231,809 | ) | — | (231,809 | ) | ||||||||||||||
Swap Contracts | Net change in unrealized appreciation (depreciation) on swap contracts | 336,189 | 51,637 | — | 152,873 | 540,699 | ||||||||||||||||
|
| |||||||||||||||||||||
Total Change in Unrealized Appreciation (Depreciation) | $ | 336,189 | $ | 51,637 | $ | (231,809 | ) | $ | 181,637 | $ | 337,654 | |||||||||||
|
| |||||||||||||||||||||
Average Notional Amount
| Equity Contracts Risk | Credit Contracts Risk | Foreign Exchange Contracts Risk | Interest Rate Contracts Risk | Total | ||||||||||||||||
Purchased Options (a) | $ | — | $ | — | $ | — | $ | 4,800,263 | $ | 4,800,263 | ||||||||||
Written Options (b) | $ | — | $ | — | $ | — | $ | (1,001,000 | ) | $ | (1,001,000 | ) | ||||||||
Futures Contracts Short (c) | $ | — | $ | — | $ | — | $ | (3,935,145 | ) | $ | (3,935,145 | ) | ||||||||
Forward Contracts Long (a) | $ | — | $ | — | $ | 583,555 | $ | — | $ | 583,555 | ||||||||||
Forward Contracts Short (c) | $ | — | $ | — | $ | (13,299,646 | ) | $ | — | $ | (13,299,646 | ) | ||||||||
Swap Contracts Long (c) | $ | 45,803,599 | $ | 19,044,001 | $ | — | $ | 14,004,545 | $ | 78,852,145 | ||||||||||
Swap Contracts Short (c) | $ | (6,400,574 | ) | $ | — | $ | — | $ | — | $ | (6,400,574 | ) | ||||||||
|
|
|
|
|
|
|
|
|
| |||||||||||
| (a) | Positions were open eight months during the reporting period. |
| (b) | Positions were open five months during the reporting period. |
| (c) | Positions were open eleven months during the reporting period. |
| 53 |
Notes to Consolidated Financial Statements (continued)
The following table presents the Fund’s derivative assets by counterparty net of amounts available for offset under a master netting agreement, or similar agreement, and net of the related collateral received by the Fund as of April 30, 2016.
Counterparty | Gross Assets in Statement of Assets and Liabilities | Derivative assets/(liabilities) available for Offset | Collateral Received | Net Amount of Derivative Assets* | ||||||||||||
Citibank N.A. | $ | 34,867 | $ | (12,621 | ) | $ | — | $ | 22,246 | |||||||
Credit Suisse International | 5,783 | (2,679 | ) | — | 3,104 | |||||||||||
Deutsche Bank | 482,089 | (379,476 | ) | — | 102,613 | |||||||||||
JPMorgan Chase Bank | 2 | — | — | 2 | ||||||||||||
Morgan Stanley Capital Services LLC | 104,680 | (12,858 | ) | — | 91,822 | |||||||||||
Societe Generale S.A. | 155,954 | (155,954 | ) | — | 168 | |||||||||||
UBS A.G. | 40,686 | (40,686 | ) | — | — | |||||||||||
|
| |||||||||||||||
| $ | 824,061 | $ | (604,274 | ) | $ | — | $ | 219,955 | ||||||||
|
| |||||||||||||||
The following table presents the Fund’s derivative liabilities by counterparty net of amounts available for offset under a master netting agreement, or similar agreement, and net of the related collateral pledged by the Fund as of April 30, 2016.
Counterparty | Gross Liabilities in Statement of Assets and Liabilities | Derivative assets/(liabilities) available for Offset | Collateral Pledged | Net Amount of Derivative Liabilities† | ||||||||||||
BNP Paribas S.A. | $ | 4,031 | $ | — | $ | — | $ | 4,031 | ||||||||
Citibank N.A. | 12,621 | (12,621 | ) | — | — | |||||||||||
Credit Suisse International | 2,679 | (2,679 | ) | — | — | |||||||||||
Deutsche Bank | 379,476 | (379,476 | ) | — | — | |||||||||||
Morgan Stanley Capital Services LLC | 12,858 | (12,858 | ) | — | — | |||||||||||
Societe Generale S.A. | 255,277 | (155,954 | ) | — | 99,323 | |||||||||||
UBS A.G. | 60,447 | (40,686 | ) | — | 19,761 | |||||||||||
|
| |||||||||||||||
| $ | 727,389 | $ | (604,274 | ) | $ | — | $ | 123,115 | ||||||||
|
| |||||||||||||||
| * | Represents the net amount receivable from the counterparty in the event of default. |
| † | Represents the net amount payable to the counterparty in the event of default. |
(V) Basis for Consolidation for the Wholly-Owned Subsidiary. MainStay Multi-Strategy Cayman Fund Ltd. (the “Cayman Subsidiary”) is organized as an exempted limited company under the laws of the Cayman Islands, and is a wholly-owned and controlled subsidiary of the Fund. The Fund and the Cayman Subsidiary are both advised by the Manager, and are subject to the same investment restrictions and guidelines as well as follows the same compliance policies and procedures. The Cayman Subsidiary serves as an investment vehicle for the Fund to enable the Fund to gain exposure to the commodity markets, primarily through investing up to 25% in the aggregate of the Fund’s assets in the equity securities of the Cayman Subsidiary. In pursuing its investment objective, the Cayman Subsidiary is expected to invest, directly or indirectly through the use of derivatives (including total return swaps), in securities, commodities, commodity- related instruments and other investments. Except where the context otherwise requires, the term “Fund” refers to the Fund together with the Cayman Subsidiary. As of April 30, 2016, net assets of the Cayman Subsidiary were $13,149,124 representing 12.0% of the Fund’s consolidated net assets.
Although the Cayman Subsidiary is otherwise subject to the same fundamental, non-fundamental and certain other investment restrictions as the Fund, the investment programs of the Fund and the Cayman Subsidiary are not necessarily identical. The Fund currently conducts its commodity investment activities only through the Cayman Subsidiary, but retains the ability to invest in additional Cayman Islands subsidiary entities in the future. The Fund is currently the sole shareholder of the
Cayman Subsidiary, and it is expected that the Fund will remain the sole shareholder and will continue to control the Cayman Subsidiary. As a wholly-owned subsidiary of the Fund, all assets, liabilities, income and expenses of the Cayman Subsidiary are consolidated in the financial statements and financial highlights of the Fund, and all significant intercompany balances, revenues and expenses have been eliminated in consolidation.
(W) Commodity Futures Trading Commission Regulation. The Fund and the Cayman Subsidiary operate subject to Commodity Futures Trading Commission (“CFTC”) regulation and the Manager and Candriam France S.A.S. (“Candriam” or “Subadvisor”) are registered with the CFTC as a commodity pool operator (“CPO”) and Commodity Trading Advisor (“CTA”), respectively, and each a member of the National Futures Association. The Manager and Candriam act as CPO and CTA, respectively, to the Fund and the Cayman Subsidiary. Accordingly, the Fund and the Manager will comply with certain CFTC rules regarding the disclosure, reporting and recordkeeping requirements that apply with respect to the Fund as a result of the Manager’s registration as a CPO. Generally, these rules allow for substituted compliance with CFTC disclosure and shareholder reporting requirements, based on the Fund’s compliance with comparable SEC requirements. This means that for most of the CFTC’s disclosure and shareholder reporting applicable to the Manager as the Fund’s CPO, the Manager’s compliance with SEC disclosure and shareholder reporting will generally be deemed to fulfill the Manager’s CFTC compliance
| 54 | MainStay Absolute Return Multi-Strategy Fund |
obligations so long as the Fund operates in compliance with the conditions of CFTC Regulation 4.12.
Candriam operates the Cayman Subsidiary in accordance with an operational exemption from certain CFTC disclosure, reporting and recordkeeping provisions.
As a result of CFTC regulation with respect to the Fund and the Cayman Subsidiary, the Fund and the Cayman Subsidiary may incur additional compliance and other expenses. The CFTC has neither reviewed nor approved the Fund, the Cayman Subsidiary, their investment strategies, or the Fund’s Prospectus or Statement of Additional Information.
Note 3–Fees and Related Party Transactions
(A) Manager and Subadvisors. New York Life Investments, a registered investment adviser and an indirect, wholly-owned subsidiary of New York Life Insurance Company (“New York Life”), serves as the Fund’s Manager, pursuant to an Amended and Restated Management Agreement (“Management Agreement”). The Manager provides offices, conducts clerical, recordkeeping and bookkeeping services, and keeps most of the financial and accounting records required to be maintained by the Fund. Except for the portion of salaries and expenses that are the responsibility of the Fund, the Manager pays the salaries and expenses of all personnel affiliated with the Fund and certain operational expenses of the Fund. The Fund reimburses New York Life Investments in an amount equal to a portion of the compensation of the Chief Compliance Officer of the Fund. Candriam, a registered investment adviser serves as a Subadvisor, pursuant to the terms of a Subadvisory Agreement (“Subadvisory Agreement”) between New York Life Investments and Candriam, and is responsible for the day-to-day portfolio management of a portion of the Fund and the Cayman Subsidiary. Cornerstone Capital Management Holdings LLC (“Cornerstone Holdings” or “Subadvisor”), a registered investment adviser and an indirect, wholly-owned subsidiary of New York Life, serves as a Subadvisor, pursuant to the terms of a Subadvisory Agreement between New York Life Investments and Cornerstone Holdings and is responsible for the day-to-day portfolio management of a portion of the Fund. Cushing® Asset Management, LP (“Cushing” or “Subadvisor”), a registered investment adviser, serves as a Subadvisor, pursuant to the terms of a Subadvisory Agreement between New York Life Investments and Cushing, and is responsible for the day-to-day portfolio management of a portion of the Fund. MacKay Shields LLC (“MacKay Shields” or “Subadvisor,” and together with Candriam, Cornerstone Holdings and Cushing, the “Subadvisors”), a registered investment adviser and an indirect, wholly-owned subsidiary of New York Life, serves as a Subadvisor, pursuant to the terms of a Subadvisory Agreement between New York Life Investments and MacKay Shields, and is responsible for the day-to-day portfolio management of a portion of the Fund. New York Life Investments pays for the services of the Subadvisors.
Under the Management Agreement, the Fund pays the Manager a monthly fee for services performed and facilities furnished at an annual rate of 1.25% of the Fund’s average daily net assets.
The Cayman Subsidiary has entered into a separate advisory agreement with New York Life Investments for the management of the Cayman Subsidiary’s portfolio pursuant to which the Cayman Subsidiary is obligated to pay New York Life Investments a management fee at the same
rate that the Fund pays New York Life Investments for services provided to the Fund. New York Life Investments is contractually obligated to waive the management fee it receives from the Fund in an amount equal to the management fee paid to New York Life Investments by the Cayman Subsidiary. This waiver arrangement may not be terminated by New York Life Investments as long as its advisory agreement with the Cayman Subsidiary is in place.
New York Life Investments has contractually agreed to waive fees and/or reimburse expenses so that Total Annual Fund Operating Expenses (excluding taxes, interest, litigation, extraordinary expenses, brokerage and other transaction expenses relating to the purchase or sale of portfolio investments, and acquired (underlying) fund fees and expenses) for Class A shares do not exceed 1.80% of its average daily net assets. New York Life Investments will apply an equivalent waiver or reimbursement, in an equal number of basis points, to the other share classes. This agreement will remain in effect until August 31, 2017, and shall renew automatically for one-year terms unless New York Life Investments provides written notice of termination prior to the start of the next term or upon approval by the Board of Trustees of the Fund.
During the period ended April 30, 2016, New York Life Investments earned fees from the Fund in the amount of $1,250,855 and waived its fees and/or reimbursed expenses in the amount of $844,050.
State Street provides sub-administration and sub-accounting services to the Fund pursuant to an agreement with New York Life Investments. These services include calculating the daily NAVs of the Fund, maintaining the general ledger and sub-ledger accounts for the calculation of the Fund’s NAVs, and assisting New York Life Investments in conducting various aspects of the Fund’s administrative operations. For providing these services to the Fund, State Street is compensated by New York Life Investments.
(B) Distribution and Service Fees. The Trust, on behalf of the Fund, has entered into a distribution agreement with NYLIFE Distributors LLC (the “Distributor”), an indirect, wholly-owned subsidiary of New York Life. The Fund has adopted distribution plans (the ‘‘Plans’’) in accordance with the provisions of Rule 12b-1 under the 1940 Act.
Pursuant to the Class A and Investor Class Plans, the Distributor receives a monthly distribution fee from the Class A and Investor Class shares at an annual rate of 0.25% of the average daily net assets of the Class A and Investor Class shares for distribution and/or service activities as designated by the Distributor. Pursuant to the Class C Plan, Class C shares pay the Distributor a monthly distribution fee at an annual rate of 0.75% of the average daily net assets of the Class C shares, along with a service fee at an annual rate of 0.25% of the average daily net assets of the Class C shares, for a total 12b-1 fee of 1.00%. Class I shares are not subject to a distribution and/or service fee.
The Plans provide that the distribution and service fees are payable to the Distributor regardless of the amounts actually expended by the Distributor for distribution of the Fund’s shares and service activities.
(C) Sales Charges. During the period ended April 30, 2016, the Fund was advised by the Distributor that the amount of initial sales charges retained on sales of Class A and Investor Class shares were $10,706 and $4,383, respectively.
| 55 |
Notes to Consolidated Financial Statements (continued)
(D) Transfer, Dividend Disbursing and Shareholder Servicing Agent. NYLIM Service Company LLC, an affiliate of New York Life Investments, is the Fund’s transfer, dividend disbursing and shareholder servicing agent pursuant to an agreement between NYLIM Service Company LLC and the Trust. NYLIM Service Company LLC has entered into an agreement with Boston Financial Data Services, Inc. (“BFDS”) pursuant to which BFDS performs certain transfer agent services on behalf of NYLIM Service Company LLC. State Street is the Cayman Subsidiary’s transfer agent pursuant to an agreement between State Street and the Cayman Subsidiary. During the period ended April 30, 2016, transfer agent expenses incurred by the Fund and Cayman Subsidiary were $4,955 and $17,389, respectively.
(E) Small Account Fee. Shareholders with small accounts adversely impact the cost of providing transfer agency services. In an effort to reduce total transfer agency expenses, the Fund has implemented a small account fee on certain types of accounts. Certain shareholders with an account balance of less than $1,000 are charged an annual per account fee of $20 (assessed semi-annually), the proceeds from which offset transfer agent fees as reflected in the Consolidated Statement of Operations.
Note 4–Federal Income Tax
As of April 30, 2016, the components of accumulated gain (loss) on a tax basis were as follows:
Ordinary | Accumulated Capital and Other Gain (Loss) | Other Temporary Differences | Unrealized Appreciation | Total Gain (Loss) | ||||||||||||
$1,722,977 | $ | (2,830,998 | ) | $ | (1,672,322 | ) | $ | 516,920 | $ | (2,263,423 | ) | |||||
The difference between book-basis and tax-basis unrealized appreciation (depreciation) is primarily due to wash sales adjustments, Passive Foreign Investment Company (PFIC) adjustments, partnership adjustments.
The following table discloses the current year reclassifications between undistributed net investment income (loss), accumulated net realized gain (loss) on investments, and additional paid-in capital arising from permanent differences; net assets as of April 30, 2016 were not affected, mark to market of swap contracts, futures, and foreign exchange forward contracts. The other temporary differences are primarily attributable to disallowed expenses and adjustments related to the Cayman Subsidiary.
Undistributed Net Investment Income (Loss) | Accumulated Net Realized Gain (Loss) on Investments | Additional Paid-In | ||||||
| $(146,525) | $ | (1,348,174 | ) | $ | 1,494,699 | |||
The reclassifications for the Fund are primarily due to foreign currency gain (loss), swaps, PFIC adjustments, partnership adjustments, distribution redesignations, and Cayman Subsidiary adjustments.
As of April 30, 2016, for federal income tax purposes, capital loss carryforwards of $2,830,998 were available as shown in the table below, to the extent provided by the regulations to offset future realized gains of the Fund through the years indicated.
Capital Loss | Short-Term Capital Loss Amounts (000’s) | Long-Term Capital Loss | ||||||
| Unlimited | 2,611 | 220 | ||||||
During the period ended April 30, 2016, the tax character of distributions paid as reflected in the Consolidated Statements of Changes in Net Assets was as follows:
| 2016 | ||||
Distributions paid from: | ||||
Ordinary Income | 310,005 | |||
Note 5–Custodian
State Street is the custodian of cash and securities held by the Fund. Custodial fees are charged to the Fund based on the Fund’s net assets and/or the market value of securities held by the Fund and the number of certain transactions incurred by the Fund.
Note 6–Line of Credit
The Fund and certain affiliated funds, maintain a line of credit with a syndicate of banks in order to secure a source of funds for temporary purposes to meet unanticipated or excessive redemption requests.
Effective August 4, 2015, under an amended and restated credit agreement (the “Credit Agreement”), the aggregate commitment amount is $600,000,000 with an additional uncommitted amount of $100,000,000. The commitment fee is an annual rate of 0.10% of the average commitment amount payable quarterly, regardless of usage, to Bank of New York Mellon, who serves as the agent to the syndicate. The commitment fee is allocated among the Fund and certain affiliated funds based upon their respective net assets and other factors. Interest on any revolving credit loan is charged based upon the Federal Funds Advances Rate or the one month LIBOR, whichever is higher. The Credit Agreement expires on August 2, 2016, although the Fund, certain affiliated funds and the syndicate of banks may renew the Credit Agreement for an additional year on the same or different terms. Prior to August 4, 2015, the aggregate commitment amount was $600,000,000 with an additional uncommitted amount of $100,000,000, and the commitment fee was at an annual rate of 0.08% of the average commitment amount. During the period ended April 30, 2016, there were no borrowings made or outstanding with respect to the Fund under the Credit Agreement.
Note 7–Purchases and Sales of Securities (in 000’s)
During the period ended April 30, 2016, purchases and sales of securities, other than short-term securities, were $104,855 and $77,668, respectively.
| 56 | MainStay Absolute Return Multi-Strategy Fund |
Note 8–Capital Share Transactions
Class A | Shares | Amount | ||||||
Period ended April 30, 2016 (a): | ||||||||
Shares sold | 639,554 | $ | 6,382,426 | |||||
Shares issued to shareholders in reinvestment of dividends and distributions | 337 | 3,314 | ||||||
Shares redeemed | (271,227 | ) | (2,698,654 | ) | ||||
|
|
|
| |||||
Net increase (decrease) in shares outstanding before conversion | 368,664 | 3,687,086 | ||||||
Shares converted into Class A (See Note 1) | 646 | 6,415 | ||||||
Shares converted from Class A (See Note 1) | (2,514 | ) | (24,913 | ) | ||||
|
|
|
| |||||
Net increase (decrease) | 366,796 | $ | 3,668,588 | |||||
|
|
|
| |||||
Investor Class | Shares | Amount | ||||||
Period ended April 30, 2016 (a): | ||||||||
Shares sold | 75,312 | $ | 748,098 | |||||
Shares issued to shareholders in reinvestment of dividends and distributions | 17 | 162 | ||||||
Shares redeemed | (1,647 | ) | (16,247 | ) | ||||
|
|
|
| |||||
Net increase (decrease) in shares outstanding before conversion | 73,682 | 732,013 | ||||||
Shares converted into Investor Class (See Note 1) | 2,519 | 24,913 | ||||||
Shares converted from Investor Class (See Note 1) | (647 | ) | (6,415 | ) | ||||
|
|
|
| |||||
Net increase (decrease) | 75,554 | $ | 750,511 | |||||
|
|
|
| |||||
Class C | Shares | Amount | ||||||
Period ended April 30, 2016 (a): | ||||||||
Shares sold | 38,909 | $ | 383,702 | |||||
Shares issued to shareholders in reinvestment of dividends and distributions | 24 | 236 | ||||||
Shares redeemed | (8,452 | ) | (83,365 | ) | ||||
|
|
|
| |||||
Net increase (decrease) | 30,481 | $ | 300,573 | |||||
|
|
|
| |||||
Class I | Shares | Amount | ||||||
Period ended April 30, 2016 (a): | ||||||||
Shares sold | 17,026,526 | $ | 169,401,113 | |||||
Shares issued to shareholders in reinvestment of dividends and distributions | 31,095 | 306,293 | ||||||
Shares redeemed | (6,468,639 | ) | (63,860,916 | ) | ||||
|
|
|
| |||||
Net increase (decrease) | 10,588,982 | $ | 105,846,490 | |||||
|
|
|
| |||||
| (a) | The inception date of the Fund was June 18, 2015. |
Note 9–Subsequent Events
In connection with the preparation of the consolidated financial statements of the Fund as of and for the period ended April 30, 2016, events and transactions subsequent to April 30, 2016, through the date the consolidated financial statements were issued have been evaluated by the Fund’s management for possible adjustment and/or disclosure. No subsequent events requiring financial statement adjustment or disclosure have been identified.
| 57 |
Report of Independent Registered Public Accounting Firm
The Board of Trustees and Shareholders of
MainStay Funds Trust:
We have audited the accompanying consolidated statement of assets and liabilities, including the consolidated portfolio of investments, of the MainStay Absolute Return Multi-Strategy Fund (the “Fund”), one of the funds constituting MainStay Funds Trust, as of April 30, 2016, and the related consolidated statement of operations, consolidated statement of changes in net assets, and the consolidated financial highlights for the period June 18, 2015 (inception date) through April 30, 2016. These financial statements and financial highlights are the responsibility of the Fund’s management. Our responsibility is to express an opinion on these financial statements and financial highlights based on our audit.
We conducted our audit in accordance with the standards of the Public Company Accounting Oversight Board (United States). Those standards require that we plan and perform the audit to obtain reasonable assurance about whether the financial statements and financial highlights are free of material misstatement. An audit includes examining, on a test basis, evidence supporting the amounts and disclosures in the financial statements. Our procedures included confirmation of securities owned as of April 30, 2016, by correspondence with the custodian, transfer agent, and brokers or by other appropriate auditing procedures where replies from brokers were not received. An audit also includes assessing the accounting principles used and significant estimates made by management, as well as evaluating the overall financial statement presentation. We believe that our audit provides a reasonable basis for our opinion.
In our opinion, the financial statements and financial highlights referred to above present fairly, in all material respects, the financial position of the Fund as of April 30, 2016, the results of its operations, the changes in its net assets, and the financial highlights for the period June 18, 2015 (inception date) through April 30, 2016, in conformity with U.S. generally accepted accounting principles.

Philadelphia, Pennsylvania
June 29, 2016
| 58 | MainStay Absolute Return Multi-Strategy Fund |
Federal Income Tax Information
(Unaudited)
The Fund is required under the Internal Revenue Code to advise shareholders in a written statement as to the federal tax status of dividends paid by the Fund during such fiscal years.
For the period ended April 30, 2016, the Fund designated approximately $208,421 under the Internal Revenue Code as qualified dividend income eligible for reduced tax rates.
The dividends paid by the Fund during the period ended April 30, 2016, should be multiplied by 38.1% to arrive at the amount eligible for the corporate dividends received deduction.
Proxy Voting Policies and Procedures and Proxy Voting Record
A description of the policies and procedures that New York Life Investments uses to vote proxies related to the Fund’s securities is available without charge, upon request, (i) by visiting the Fund’s website at mainstaylnvestments.com; and (ii) on the Securities and Exchange Commission’s (SEC) website at www.sec.gov.
The Fund is required to file with the SEC its proxy voting record for the 12-month period ending June 30 on Form N-PX. The Fund’s most recent Form N-PX or proxy voting record is available free of charge upon request by calling 800-MAINSTAY (624-6782); visiting the Fund’s website at mainstayinvestments.com; or on the SEC’s website at www.sec.gov.
Shareholder Reports and Quarterly Portfolio Disclosure
The Fund is required to file its complete schedule of portfolio holdings with the SEC for its first and third fiscal quarters on Form N-Q. The Fund’s Form N-Q is available without charge, on the SEC’s website at www.sec.gov or by calling MainStay Investments at 800-MAINSTAY (624-6782). You also can obtain and review copies of Form N-Q by visiting the SEC’s Public Reference Room in Washington, DC (information on the operation of the Public Reference Room may be obtained by calling 1-800-SEC-0330).
| 59 |
Board Consideration and Approval of Subadvisory Agreement (Unaudited)
At its December 8-10, 2015 meeting, the Board of Trustees (“Board”) of MainStay Funds Trust considered and approved on behalf of MainStay Absolute Return Multi-Strategy Fund (the “Fund”) an amended Subadvisory Agreement (“the Agreement”) between New York Life Investment Management LLC (“New York Life Investments”) and Candriam France S.A.S. (“Candriam France”) with respect to the Fund in order to permit Candriam France to manage two new additional “sleeves” of the Fund (“New Sleeves”).
In reaching its decision to approve the Agreement, the Board considered information furnished by New York Life Investments and Candriam France specifically in connection with the contract review process regarding the Agreement that took place in advance of the meeting, which included a response from Candriam France to a comprehensive list of questions encompassing a variety of topics prepared on behalf of the Board by independent legal counsel to the Board and its Trustees who are not “interested persons” (as such term is defined under the Investment Company Act of 1940, as amended) of the Fund. In evaluating the Agreement, the Board considered its experience with Candriam France as an existing Subadvisor to the Fund. The Board also considered other materials that were provided to the Board regarding the New Sleeves as well as discussions with representatives from New York Life Investments and Candriam France regarding the New Sleeves. Additionally, the Board considered materials provided since the Fund’s inception by Candriam France and New York Life Investments regarding the Fund and relevant information previously provided to the Board in connection with its review of the investment advisory agreements for other MainStay Funds.
The Board noted that the Agreement was substantially identical to the subadvisory agreement currently in place with Candriam France with respect to the Fund except for the addition of the fees that would be paid to Candriam France as compensation for its services with respect to the New Sleeves. The Board noted that the addition of the New Sleeves would not result in an increase in the overall management fee paid by the Fund. Because Candriam France is an affiliate of New York Life Investments, whose subadvisory fees are paid directly by New York Life Investments, the Board considered the cost and profitability information for New York Life Investments and Candriam France in the aggregate, as is its practice for affiliated Subadvisors.
While individual Trustees may have weighed certain factors or information differently, the Board’s decision to approve the Agreement was based on a consideration of the information provided to the Trustees throughout the year, as well as information furnished specifically in connection with the contract review process. On the basis of the information and factors and evaluated, the Board as a whole, including the independent trustees who are not parties to the Agreement or “interested persons” of any such party voting separately, unanimously voted to approve the Agreement.
| 60 | MainStay Absolute Return Multi-Strategy Fund |
Board of Trustees and Officers (Unaudited)
The Board of Trustees oversees the MainStay Group of Funds, (which is comprised of Funds that are series of the MainStay Funds, MainStay Funds Trust, MainStay VP Funds Trust, Private Advisors Alternative Strategies Master Fund1, Private Advisors Alternative Strategies Fund1, and MainStay DefinedTerm Municipal Opportunities Fund) (collectively the “Fund Complex”), the Manager and, when applicable, the Subadvisor(s), and other service providers to the Fund Complex. Each Trustee serves until his or her successor is elected and qualified or until his or her resignation, death or removal. Under the Retirement Policy, a Trustee must tender his or her resignation by the end of the calendar
year during which he or she reaches the age of 75. Officers serve a term of one year and are elected annually by the Board of Trustees. Information pertaining to the Trustees and officers is set forth below. The Statement of Additional Information includes additional information about the Trustees and is available, without charge, upon request by calling toll-free 800-598-2019. The business address of each Trustee and officer listed below is 51 Madison Avenue, New York, New York 10010. A majority of the Trustees are not “interested persons” (as defined by the 1940 Act) of the Funds (“Independent Trustees”).
Name and Date of Birth | Term of Office, Position(s) Held and Length of Service | Principal Occupation(s) During Past Five Years | Number of Portfolios in Fund Complex Overseen by Board Member | Other Directorships Held By Board Member | ||||||||
| Interested Board Member* | Christopher O. Blunt* 5/13/61 | Indefinite; MainStay Funds Trust: Trustee since January 2016 | Executive Vice President (since 2009), President, Investments Group (since 2015), Member of the Executive Management Committee (since 2007), Co-President, Insurance and Agency Group (2012 to 2015), President, Insurance Group (2012 to 2014), Executive Vice President, Retirement Income Security (2008 to 2012), New York Life Insurance Company.
| 84 | MainStay VP Funds Trust: Trustee since January 2016 (31 portfolios); The MainStay Funds: Trustee since January 2016 (12 Funds); MainStay DefinedTerm Municipal Opportunities Fund: Trustee since January 2016; Private Advisors Alternative Strategies Master Fund: Trustee since January 2016; and Private Advisors Alternative Strategies Fund: Trustee since January 2016 |
| 1 | On June 3, 2016, the Private Advisors Alternative Strategies Master Fund and the Private Advisors Alternative Strategies Fund filed an application for deregistration on Form N-8F with the SEC. |
| * | This Trustee is considered to be an “interested person” of the MainStay Group of Funds within the meaning of the 1940 Act because of his affiliation with New York Life Insurance Company, New York Life Investment Management LLC, Cornerstone Capital Management Holdings LLC, Cornerstone Capital Management LLC, MacKay Shields LLC, Institutional Capital LLC, NYL Investors LLC, NYLIFE Securities LLC and/or NYLIFE Distributors LLC, as described in detail above in the column entitled “Principal Occupation(s) During Past Five Years.” John Y. Kim also served as a trustee during the period. (Mr. Kim, an interested trustee, resigned from the Board, effective December 31, 2015). Effective on December 31, 2015, the Board appointed Christopher O. Blunt to become an interested trustee. |
| 61 |
Name and Date of Birth | Term of Office, Position(s) Held and Length of Service | Principal Occupation(s) During Past Five Years | Number of Portfolios in Fund Complex Overseen by Board Member | Other Directorships Held By Board Member | ||||||||
Non-Interested | David H. Chow 12/29/57 | Indefinite; MainStay Funds Trust: Trustee since January 2016; Advisory Board member (June 2015 to December 2015) | Member, Governing Council of the Independent Directors Council (since 2012); former President and Member of the Board, CFA Society of Stamford (since 2009); Member of the Board, Forward Management, LLC (2008 to 2015); Trustee, Berea College of Kentucky (since 2009); Founder and CEO, DanCourt Management, LLC (since 1999). | 84 | MainStay VP Funds Trust: Trustee since January 2016; Advisory Board Member (June 2015 to December 2015) (31 portfolios); The MainStay Funds: Trustee since January 2016; Advisory Board member since (June 2015 to December 2015) (12 Funds); MainStay DefinedTerm Municipal Opportunities Fund: Trustee since January 2016; Advisory Board Member (June 2015 to December 2015); Market Vectors ETF Trust: Independent Chairman of the Board of Trustees since 2008 and Trustee since 2006 (55 portfolios); Private Advisors Alternative Strategies Fund: Trustee since January 2016; Advisory Board Member (June 2015 to December 2015); and Private Advisors Alternative Strategies Master Fund: Trustee since January 2016 Advisory Board Member (June 2015 to December 2015); | |||||||
Susan B. Kerley 8/12/51 | Indefinite; MainStay Funds Trust: Trustee since 1990** | President, Strategic Management Advisors LLC (since 1990) | 84 | MainStay VP Funds Trust: Trustee since 2007*** (31 portfolios); The MainStay Funds: Trustee since 2007 (12 Funds); MainStay DefinedTerm Municipal Opportunities Fund: Trustee since 2011; Legg Mason Partners Funds: Trustee since 1991 (53 portfolios); Private Advisors Alternative Strategies Master Fund: Trustee since 2011; and Private Advisors Alternative Strategies Fund: Trustee since 2011; | ||||||||
Alan R. Latshaw 3/27/51 | Indefinite; MainStay Funds Trust: Trustee and Audit Committee Financial Expert since 2007** | Retired; Partner, Ernst & Young LLP (2002 to 2003); Partner, Arthur Andersen LLP (1989 to 2002); Consultant to the MainStay Funds Audit and Compliance Committee (2004 to 2006) | 84 | MainStay VP Funds Trust: Trustee and Audit Committee Financial Expert since 2007*** (31 portfolios); The MainStay Funds: Trustee and Audit Committee Financial Expert since 2006 (12 Funds); MainStay DefinedTerm Municipal Opportunities Fund: Trustee and Audit Committee Financial Expert since 2011; State Farm Associates Funds Trusts: Trustee since 2005 (4 portfolios); State Farm Mutual Fund Trust: Trustee since 2005 (15 portfolios); State Farm Variable Product Trust: Trustee since 2005 (9 portfolios); Private Advisors Alternative Strategies Master Fund: Trustee and Audit Committee Financial Expert since 2011; and Private Advisors Alternative Strategies Fund: Trustee and Audit Committee Financial Expert since 2011; | ||||||||
Peter Meenan 12/5/41 | Indefinite; MainStay Funds Trust: Chairman since 2013 and Trustee since 2002** | Retired; Independent Consultant (2004 to 2013); President and Chief Executive Officer, Babson—United, Inc. (financial services firm) (2000 to 2004); Independent Consultant (1999 to 2000); Head of Global Funds, Citicorp (1995 to 1999) | 84 | The MainStay Funds: Chairman since 2013 and Trustee since 2007 (12 Funds); MainStay VP Funds Trust: Chairman since 2013 and Trustee since 2007*** (31 portfolios); MainStay DefinedTerm Municipal Opportunities Fund: Chairman since 2013 and Trustee since 2011; Private Advisors Alternative Strategies Master Fund: Chairman since 2013 and Trustee since 2011; and Private Advisors Alternative Strategies Fund: Chairman since 2013 and Trustee since 2011; |
| 62 | MainStay Absolute Return Multi-Strategy Fund |
Name and Date of Birth | Term of Office, Position(s) Held and Length of Service | Principal Occupation(s) During Past Five Years | Number of Portfolios in Fund Complex Overseen by Board Member | Other Directorships Held By Board Member | ||||||||
Non-Interested | Richard H. Nolan, Jr. 11/16/46 | Indefinite; MainStay Funds Trust: Trustee since 2007** | Managing Director, ICC Capital Management (since 2004); President—Shields/Alliance, Alliance Capital Management (1994 to 2004) | 84 | MainStay VP Funds Trust: Trustee since 2006*** (31 portfolios); The MainStay Funds: Trustee since 2007 (12 Funds); MainStay DefinedTerm Municipal Opportunities Fund: Trustee since 2011; Private Advisors Alternative Strategies Master Fund: Trustee since 2011; and Private Advisors Alternative Strategies Fund: Trustee since 2011; | |||||||
Jacques P. Perold 5/12/58 | Indefinite; MainStay Funds Trust: Trustee since January 2016; Advisory Board member (June 2015 to December 2015) | Retired; Trustee, Boston University (since 2014); President, Fidelity Management & Research Company (2009 to 2014); Founder, President and Chief Executive Officer, Geode Capital Management, LLC (2001 to 2009). | 84 | MainStay VP Funds Trust: Trustee since January 2016; Advisory Board Member (June 2015 to December 2015) (31 portfolios); The MainStay Funds: Trustee since January 2016; Advisory Board member (June 2015 to December 2015) (12 Funds); MainStay DefinedTerm Municipal Opportunities Fund: Trustee since January 2016; Advisory Board Member since June 4, 2015; Private Advisors Alternative Strategies Fund: Trustee since January 2016; Advisory Board Member since (June 2015 to December 2015); and Private Advisors Alternative Strategies Master Fund: Trustee since January 2016; Advisory Board Member since (June 2015 to December 2015); | ||||||||
Richard S. Trutanic 2/13/52 | Indefinite; MainStay Funds Trust: Trustee since 2007** | Chairman and Chief Executive Officer, Somerset & Company (financial advisory firm) (since 2004); Managing Director, The Carlyle Group (private investment firm) (2002 to 2004); Senior Managing Director, Partner and Board Member, Groupe Arnault S.A. (private investment firm) (1999 to 2002) | 84 | MainStay VP Funds Trust: Trustee since 2007*** (31 portfolios); The MainStay Funds: Trustee since 1994 (12 Funds); MainStay DefinedTerm Municipal Opportunities Fund: Trustee since 2011; Private Advisors Alternative Strategies Master Fund: Trustee since 2011; and Private Advisors Alternative Strategies Fund: Trustee since 2011; | ||||||||
John A. Weisser 10/22/41 | Indefinite; MainStay Funds Trust: Trustee since 2007** | Retired; Managing Director of Salomon Brothers, Inc. (1971 to 1995) | 84 | MainStay VP Funds Trust: Trustee since 1997*** (31 portfolios); The MainStay Funds: Trustee since 2007 (12 Funds); MainStay DefinedTerm Municipal Opportunities Fund: Trustee since 2011; Direxion Insurance Trust: Trustee since 2007 (1 portfolio); Direxion Funds: Trustee since 2007 (18 portfolios); Direxion Shares ETF Trust: Trustee since 2008 (52 portfolios); Private Advisors Alternative Strategies Master Fund: Trustee since 2011; and Private Advisors Alternative Strategies Fund: Trustee since 2011; |
| ** | Includes prior service as a Director/Trustee of certain predecessor entities to MainStay Funds Trust. |
| *** | Includes prior service as a Director of MainStay VP Series Fund, Inc., the predecessor to MainStay VP Funds Trust. |
| **** | Roman L. Weil also served as a trustee during the period. Pursuant to the Board’s retirement policy, Mr. Weil, an independent trustee, retired on December 31, 2015. |
| 63 |
Name and Date of Birth | Position(s) Held and Length of Service | Principal Occupation(s) During Past Five Years | ||||||
| Officers (Who Are Not Trustees)* | Stephen P. Fisher 2/22/59 | President; MainStay Funds Trust (since 2009) | Chairman and Chief Executive Officer (since 2014), President and Chief Operating Officer (2008 to 2013), NYLIFE Distributors LLC; Senior Managing Director (since 2012) and Chairman of the Board (since 2008), NYLIM Service Company LLC; Senior Managing Director (since 2005) and Co-President (since January 2014), New York Life Investment Management LLC; President, MainStay DefinedTerm Municipal Opportunities Fund (since 2011); Private Advisors Alternative Strategies Master Fund and Private Advisors Alternative Strategies Fund; and The MainStay Funds and MainStay VP Funds Trust (since 2007)**. | |||||
Jack R. Benintende 5/12/64 | Treasurer and Principal Financial and Accounting Officer, MainStay Funds Trust (since 2009) | Managing Director, New York Life Investment Management LLC (since 2007); Treasurer and Principal Financial and Accounting Officer, MainStay DefinedTerm Municipal Opportunities Fund; Private Advisors Alternative Strategies Master Fund and Private Advisors Alternative Strategies Fund; (since 2011) and The MainStay Funds and MainStay VP Funds Trust (since 2007)**; and Assistant Treasurer, New York Life Investment Management Holdings LLC (2008 to 2012). | ||||||
Kevin M. Bopp 2/24/69 | Vice President and Chief Compliance Officer, MainStay Funds Trust (since 2014) | Vice President and Chief Compliance Officer, The MainStay Funds, MainStay VP Funds Trust; MainStay DefinedTerm Municipal Opportunities Fund; Private Advisors Alternative Strategies Fund and Private Advisors Alternative Strategies Master Fund (since 2014); Director and Associate General Counsel (2011 to 2014) and Vice President and Assistant General Counsel (2010 to 2011), New York Life Investment Management LLC; Assistant Secretary, The MainStay Funds, MainStay Funds Trust and MainStay VP Funds Trust (2010 to 2014)**, Private Advisors Alternative Strategies Fund, Private Advisors Alternative Strategies Master Fund and MainStay DefinedTerm Municipal Opportunities Fund (2011 to 2014); Associate, Dechert LLP (2006 to 2010). | ||||||
J. Kevin Gao 10/13/67 | Secretary and Chief Legal Officer, MainStay Funds Trust (since 2010) | Managing Director and Associate General Counsel, New York Life Investment Management LLC (since 2010); Secretary and Chief Legal Officer, MainStay DefinedTerm Municipal Opportunities Fund; Private Advisors Alternative Strategies Master Fund and Private Advisors Alternative Strategies Fund (since 2011) and The MainStay Funds and MainStay Funds VP Trust (since 2010)**. | ||||||
Scott T. Harrington 2/8/59 | Vice President—Administration, MainStay Funds Trust (since 2009) | Director, New York Life Investment Management LLC (including predecessor advisory organizations) (since 2000); Member of the Board of Directors, New York Life Trust Company (since 2009); Vice President—Administration, MainStay DefinedTerm Municipal Opportunities Fund; Private Advisors Alternative Strategies Master Fund and Private Advisors Alternative Strategies Fund (since 2011), The MainStay Funds and MainStay VP Funds Trust (since 2005)**. |
| * | The Officers listed above are considered to be “interested persons” of the MainStay Group of Funds within the meaning of the 1940 Act because of their affiliation with the MainStay Group of Funds, New York Life Insurance Company, New York Life Investment Management LLC, New York Life Insurance Company, New York Life Investment Management LLC, NYLIFE Securities LLC and/or NYLIFE Distributors LLC, as described in detail in the column captioned “Principal Occupation(s) During Past Five Years.” Officers are elected annually by the Board of Trustees to serve a one year term. |
| ** | Includes prior service as an Officer of MainStay VP Series Fund, Inc., the predecessor to MainStay VP Funds Trust. |
| 64 | MainStay Absolute Return Multi-Strategy Fund |
This page intentionally left blank
This page intentionally left blank
MainStay Funds
MainStay offers a wide range of Funds for virtually any investment need. The full array of MainStay open-end offerings is listed here, with information about the manager, subadvisors, legal counsel and independent registered public accounting firms.
Equity
U.S. Equity
MainStay Common Stock Fund
MainStay Cornerstone Growth Fund
MainStay Epoch U.S. All Cap Fund
MainStay Epoch U.S. Equity Yield Fund
MainStay Epoch U.S. Small Cap Fund
MainStay ICAP Equity Fund
MainStay ICAP Select Equity Fund
MainStay Large Cap Growth Fund
MainStay MAP Fund
MainStay S&P 500 Index Fund
MainStay U.S. Equity Opportunities Fund
International/Global Equity
MainStay Emerging Markets Opportunities Fund
MainStay Epoch Global Choice Fund
MainStay Epoch Global Equity Yield Fund
MainStay Epoch International Small Cap Fund
MainStay ICAP International Fund
MainStay International Equity Fund
MainStay International Opportunities Fund
Income
Taxable Bond
MainStay Floating Rate Fund
MainStay Global High Income Fund
MainStay Government Fund
MainStay High Yield Corporate Bond Fund
MainStay High Yield Opportunities Fund
MainStay Indexed Bond Fund
MainStay Short Duration High Yield Fund
MainStay Total Return Bond Fund
MainStay Unconstrained Bond Fund
Municipal/Tax Advantaged Bond
MainStay California Tax Free Opportunities Fund1
MainStay High Yield Municipal Bond Fund
MainStay New York Tax Free Opportunities Fund2
MainStay Tax Advantaged Short Term Bond Fund
MainStay Tax Free Bond Fund
Money Market
MainStay Money Market Fund
Mixed Asset
MainStay Balanced Fund
MainStay Convertible Fund
MainStay Income Builder Fund
Alternative
MainStay Absolute Return Multi-Strategy Fund
MainStay Cushing Energy Income Fund
MainStay Cushing MLP Premier Fund
MainStay Cushing Renaissance Advantage Fund
Asset Allocation/Target Date
MainStay Conservative Allocation Fund
MainStay Growth Allocation Fund
MainStay Moderate Allocation Fund
MainStay Moderate Growth Allocation Fund
MainStay Retirement 2010 Fund
MainStay Retirement 2020 Fund
MainStay Retirement 2030 Fund
MainStay Retirement 2040 Fund
MainStay Retirement 2050 Fund
MainStay Retirement 2060 Fund
Manager
New York Life Investment Management LLC
New York, New York
Subadvisors
Candriam France S.A.S.3
Paris, France
Cornerstone Capital Management Holdings LLC3
New York, New York
Cornerstone Capital Management LLC3
Bloomington, Minnesota
Cushing Asset Management, LP
Dallas, Texas
Epoch Investment Partners, Inc.
New York, New York
Institutional Capital LLC3
Chicago, Illinois
MacKay Shields LLC3
New York, New York
Markston International LLC
White Plains, New York
NYL Investors LLC3
New York, New York
Winslow Capital Management LLC
Minneapolis, Minnesota
Legal Counsel
Dechert LLP
Independent Registered Public Accounting Firms
KPMG LLP
1. This Fund is only registered for sale in AZ, CA, NV, OR, UT, and WA.
2. This Fund is only registered for sale in CT, DE, FL, MA, NJ, NY, and VT.
3. An affiliate of New York Life Investment Management LLC.
Not part of the Annual Report
For more information
800-MAINSTAY (624-6782)
mainstayinvestments.com
The MainStay Funds® are managed by New York Life Investment Management LLC and distributed through NYLIFE Distributors LLC, 30 Hudson Street, Jersey City, NJ 07302, a wholly owned subsidiary of New York Life Insurance Company. NYLIFE Distributors LLC is a Member FINRA/SIPC. MainStay Investments® is a registered service mark and name under which New York Life Investment Management LLC does business. MainStay Investments, an indirect subsidiary of New York Life Insurance Company, New York, NY 10010, provides investment advisory products and services.
This report may be distributed only when preceded or accompanied by a current Fund prospectus.
©2016 NYLIFE Distributors LLC. All rights reserved.
| Not FDIC/NCUA Insured | Not a Deposit | May Lose Value | No Bank Guarantee | Not Insured by Any Government Agency |
| 1694714 MS164-16 | MSARM11-06/16 (NYLIM) NL270 |
MainStay Tax Advantaged Short Term Bond Fund
Message from the President and Annual Report
April 30, 2016


This page intentionally left blank
Message from the President
The stock market experienced substantial volatility during the 12 months ended April 30, 2016. After holding relatively steady through early August 2015, many stock markets around the world dropped substantially after the People’s Bank of China devalued the Chinese yuan on August 11, 2015. Some took months to recover. U.S. stock prices sank again in the early weeks of 2016. Oil prices continued their long-standing descent through mid-January 2016, and slowing economic growth in China continued to be a major concern for equity investors. In February, U.S. stocks began a relatively steady recovery, and they closed the reporting period not far from where they began.
According to FTSE Russell data, U.S. stocks as a whole provided slightly negative returns for the reporting period. On the whole, large-capitalization stocks provided positive returns, outperforming mid- and small-cap stocks, which tended to provide negative returns. Among large-caps, growth stocks outperformed value stocks, while the reverse was true among mid- and small-cap stocks.
International and emerging-market stocks also tended to provide negative returns for the 12 months ended April 30, 2016. Slowing growth in China, weaker commodity prices and Brazil’s economic woes all took a toll on global stock performance.
Many sectors of the bond markets showed relatively strong performance during the 12-month reporting period. U.S. Treasury, agency, mortgage-backed and asset-backed securities—as well as corporate, municipal and emerging-market bonds—all provided positive performance. Longer-term bonds tended to provide higher total returns than shorter-term securities; and among investment-grade bonds, A-rated issues1 were particularly strong. On the other hand, high-yield bonds, convertible bonds and leveraged loans generally had negative returns for the reporting period.
While stock and bond markets may go up or down in ways that are hard to predict, staying the course requires a long-term
view. It may also require an ability to remain optimistic, even through periods of market volatility. During the reporting period, our managers sought to maintain a long-term perspective and generally did not make decisions based on short-term volatility. For some managers this may have proved beneficial. For example, although oil prices declined substantially in a period of supply-and-demand imbalance, they eventually recovered toward levels that were more familiar and reasonable. A similar pattern was seen in the stock market.
While our portfolio managers may closely consider daily market movements, they seek to make long-term decisions on the basis of the investment objectives of their respective Funds and the investment strategies outlined in each Fund’s prospectus. In this way, they seek to offer a consistent basis for their decisions, wherever the markets may move.
The annual report that follows provides more detailed information about the market changes, investment decisions and individual securities that affected MainStay Tax Advantaged Short Term Bond Fund during the 12 months ended April 30, 2016. We hope that you will read it carefully and use the information as part of your long-term investment planning and decision making.
At MainStay, we’re honored that you have chosen to invest with us, and we hope that our Funds will remain a valuable part of your investment portfolio for many years to come.
Sincerely,

Stephen P. Fisher
President
| 1. | An obligation rated ‘A’ by Standard & Poor’s (“S&P”) is deemed by S&P to be somewhat more susceptible to the adverse effects of changes in circumstances and economic conditions than obligations in higher-rated categories. In the opinion of S&P, however, the obligor’s capacity to meet its financial commitment on the obligation is still strong. When applied to Fund holdings, ratings are based solely on the creditworthiness of the bonds in the portfolio and are not meant to represent the security or safety of the Fund. |
The opinions expressed are as of the date of this report and are subject to change. There is no guarantee that any forecast made will come to pass. This material does not constitute investment advice and is not intended as an endorsement of any specific investment. Past performance is no guarantee of future results.
Not part of the Annual Report
Investors should refer to the Fund’s Summary Prospectus and/or Prospectus and consider the Fund’s investment objectives, strategies, risks, charges and expenses carefully before investing. The Summary Prospectus and/or Prospectus contain this and other information about the Fund. You may obtain copies of the Fund’s Summary Prospectus, Prospectus and Statement of Additional Information free of charge, upon request, by calling toll-free 800-MAINSTAY (624-6782), by writing to NYLIFE Distributors LLC, Attn: MainStay Marketing Department, 30 Hudson Street, Jersey City, NJ 07302 or by sending an e-mail to MainStayShareholderServices@nylim.com. These documents are also available via the MainStay Funds’ website at mainstayinvestments.com/documents. Please read the Summary Prospectus and/or Prospectus carefully before investing.
Investment and Performance Comparison1 (Unaudited)
Performance data quoted represents past performance. Past performance is no guarantee of future results. Because of market volatility, current performance may be lower or higher than the figures shown. Investment return and principal value will fluctuate, and as a result, when shares are redeemed, they may be worth more or less than their original cost. The graph below depicts the historical performance of Class I shares of the Fund. Performance will vary from class to class based on differences in class-specific expenses and sales charges. For performance information current to the most recent month-end, please call 800-MAINSTAY (624-6782) or visit mainstayinvestments.com.
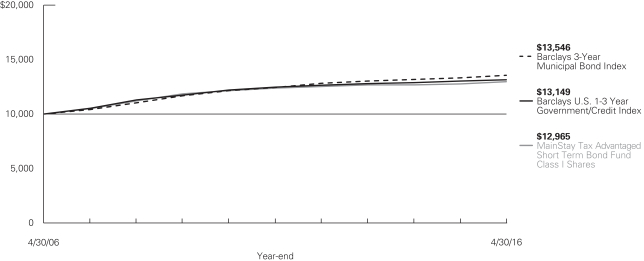
Average Annual Total Returns for the Year Ended April 30, 2016
| Class | Sales Charge | One Year | Five Years | Ten Years | Gross Expense Ratio2 | |||||||||||||||
| Class A Shares | Maximum 1% Initial Sales Charge3 | With sales charges Excluding sales charges |
| –1.64 1.41 | %
|
| 0.07 0.68 | %
|
| 2.05 2.36 | %
|
| 1.12 1.12 | %
| ||||||
| Investor Class Shares4 | Maximum 1% Initial Sales Charge3 | With sales charges Excluding sales charges |
| –1.97 1.06 |
|
| –0.30 0.31 |
|
| 1.77 2.08 |
|
| 1.48 1.48 |
| ||||||
| Class I Shares | No Sales Charge | 1.66 | 0.93 | 2.63 | 0.87 | |||||||||||||||
| 1. | The performance table and graph do not reflect the deduction of taxes that a shareholder would pay on distributions or Fund share redemptions. Total returns reflect maximum applicable sales charges as indicated in the table above, changes in share price, and reinvestment of dividend and capital gain distributions. The graph assumes the initial investment amount shown above and reflect the deduction of all sales charges that would have applied for the periods of investment. Performance figures may reflect certain fee waivers and/or expense limitations, without which total returns may have been lower. For more information on share classes and current fee waivers and/or expense limitations (if any), please refer to the notes to the financial statements. |
| 2. | The gross expense ratios presented reflect the Fund’s “Total Annual Fund Operating Expenses” from the most recent Prospectus and may differ from other expense ratios disclosed in this report. |
| 3. | The Maximum initial sales charge prior to June 1, 2015 was 3.00%. |
| 4. | Performance figures for Investor Class shares, first offered on February 28, 2008, include the historical performance of Class A shares through February 27, 2008, adjusted for differences in certain expenses and fees. Unadjusted, the performance shown for Investor Class shares would likely have been different. |
The footnotes on the next page are an integral part of the table and graph and should be carefully read in conjunction with them.
| 5 |
| Benchmark Performance | One Year | Five Years | Ten Years | |||||||||
Barclays 3-Year Municipal Bond Index5 | 1.84 | % | 1.75 | % | 3.08 | % | ||||||
Barclays U.S. 1-3 Year Government/Credit Index6 | 1.10 | 1.07 | 2.78 | |||||||||
Average Lipper Short U.S. Government Fund7 | 0.39 | 0.49 | 2.15 | |||||||||
| 5. | The Barclays 3-Year Municipal Bond Index is considered representative of the broad market for investment grade, tax-exempt bonds with a maturity range of 2-4 years. The Barclays 3-Year Municipal Bond Index is the Fund’s broad-based securities-market index for comparison purposes. Total returns assume reinvestment of all dividends and capital gains. An investment cannot be made directly into an index. |
| 6. | The Barclays U.S. 1-3 Year Government/Credit Index includes investment grade corporate debt issues as well as debt issues of U.S. government agencies and the U.S. Treasury, with maturities of one to three years. The Barclays U.S. 1-3 Year Government/Credit Index is the Fund’s secondary |
| benchmark. Total returns assume reinvestment of all dividends and capital gains. An investment cannot be made directly in an index. |
| 7. | The Average Lipper Short U.S. Government Fund is representative of funds that invest primarily in securities issued or guaranteed by the U.S. government, its agencies, or its instrumentalities, with dollar-weighted average maturities of less than three years. This benchmark is a product of Lipper Inc. Lipper Inc. is an independent monitor of fund performance. Results are based on average total returns of similar funds with all dividend and capital gain distributions reinvested. |
The footnotes on the preceding page are an integral part of the table and graph and should be carefully read in conjunction with them.
| 6 | MainStay Tax Advantaged Short Term Bond Fund |
Cost in Dollars of a $1,000 Investment in MainStay Tax Advantaged Short Term Bond Fund (Unaudited)
The example below is intended to describe the fees and expenses borne by shareholders during the six-month period from November 1, 2015, to April 30, 2016, and the impact of those costs on your investment.
Example
As a shareholder of the Fund, you incur two types of costs: (1) transaction costs, including exchange fees and sales charges (loads) on purchases (as applicable), and (2) ongoing costs, including management fees, distribution and/or service (12b-1) fees, and other Fund expenses (as applicable). This example is intended to help you understand your ongoing costs (in dollars) of investing in the Fund and to compare these costs with the ongoing costs of investing in other mutual funds. The example is based on an investment of $1,000 made at the beginning of the six-month period and held for the entire period from November 1, 2015, to April 30, 2016.
This example illustrates your Fund’s ongoing costs in two ways:
Actual Expenses
The second and third data columns in the table below provide information about actual account values and actual expenses. You may use the information in these columns, together with the amount you invested, to estimate the expenses that you paid during the six months ended April 30, 2016. Simply divide your account value by $1,000 (for example, an $8,600 account value divided by $1,000 = 8.6), then
multiply the result by the number under the heading entitled “Expenses Paid During Period” to estimate the expenses you paid on your account during this period.
Hypothetical Example for Comparison Purposes
The fourth and fifth data columns in the table below provide information about hypothetical account values and hypothetical expenses based on the Fund’s actual expense ratio and an assumed rate of return of 5% per year before expenses, which is not the Fund’s actual return. The hypothetical account values and expenses may not be used to estimate the actual ending account balances or expenses you paid for the six-month period shown. You may use this information to compare the ongoing costs of investing in the Fund with the ongoing costs of investing in other Funds. To do so, compare this 5% hypothetical example with the 5% hypothetical examples that appear in the shareholder reports of the other Funds.
Please note that the expenses shown in the table are meant to highlight your ongoing costs only and do not reflect any transactional costs, such as exchange fees or sales charges (loads). Therefore, the fourth and fifth data columns of the table are useful in comparing ongoing costs only and will not help you determine the relative total costs of owning different funds. In addition, if these transactional costs were included, your costs would have been higher.
| Share Class | Beginning Account Value 11/1/15 | Ending Account Value (Based on Actual Returns and Expenses) 4/30/16 | Expenses Paid During Period1 | Ending Account Value (Based on Hypothetical 5% Annualized Return and Actual Expenses) 4/30/16 | Expenses Paid During Period1 | |||||||||||||||
| Class A Shares | $ | 1,000.00 | $ | 1,007.30 | $ | 3.99 | $ | 1,020.90 | $ | 4.02 | ||||||||||
| Investor Class Shares | $ | 1,000.00 | $ | 1,005.80 | $ | 6.08 | $ | 1,018.80 | $ | 6.12 | ||||||||||
| Class I Shares | $ | 1,000.00 | $ | 1,008.60 | $ | 2.75 | $ | 1,022.10 | $ | 2.77 | ||||||||||
| 1. | Expenses are equal to the Fund’s annualized expense ratio of each class (0.80% for Class A, 1.22% for Investor Class and 0.55% for Class I) multiplied by the average account value over the period, divided by 366 and multiplied by 182 (to reflect the six-month period). The table above represents the actual expenses incurred during the six-month period. |
| 7 |
Portfolio Composition as of April 30, 2016 (Unaudited)
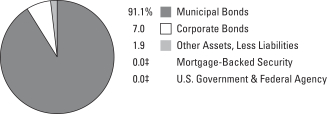
See Portfolio of Investments beginning on page 11 for specific holdings within these categories.
| ‡ | Less than one-tenth of a percent. |
Top Ten Issuers Held as of April 30, 2016 (Unaudited)
| 1. | Commonwealth of Puerto Rico, Public Improvement, Unlimited General Obligation, (zero coupon)–5.50%, due 7/1/16–7/1/19 |
| 2. | New Jersey Economic Development Authority, School Facilities Construction, Revenue Bonds, 1.096%–2.189%, due 6/15/16 |
| 3. | Indiana Finance Authority, Revenue Bonds, 0.31%–5.00%, due 3/1/19–2/1/37 |
| 4. | Louisville / Jefferson County Metropolitan Government, Norton Healthcare, Revenue Bonds Series B, 0.30%, due 10/1/39 |
| 5. | City of New York NY, Unlimited General Obligation Series H-3, Insured: AGM, 0.29%, due 8/1/23 |
| 6. | City of Minneapolis MN/St. Paul Housing & Redevelopment Authority, Allina Health Systems, Revenue Bonds Series B-1, 0.31%, due 11/15/35 |
| 7. | Beaver County PA, Unlimited General Obligation, 1.948%–2.18%, due 11/15/18–11/15/19 |
| 8. | JPMorgan Chase Putters / Drivers Trust, Unlimited General Obligation Series T0023, 0.75%, due 12/15/16 |
| 9. | Lehigh County Industrial Development Authority, PPL Electric Utilities Corp., Revenue Bonds Series B, 0.90%, due 2/15/27–9/1/29 |
| 10. | Municipal Improvement Corp. of Los Angeles, Revenue Bonds, 1.26%–2.846%, due 11/1/16–11/1/19 |
| 8 | MainStay Tax Advantaged Short Term Bond Fund |
Portfolio Management Discussion and Analysis (Unaudited)
Questions answered by portfolio managers Dan Roberts, PhD, Louis N. Cohen, CFA, Claude Athaide, PhD, CFA, John Loffredo, CFA, Robert DiMella, CFA, Michael Petty, David Dowden, Scott Sprauer and Frances Lewis of MacKay Shields LLC, the Fund’s Subadvisor.
How did MainStay Tax Advantaged Short Term Bond Fund perform relative to its benchmarks and peers during the 12 months ended April 30, 2016?
Excluding all sales charges, MainStay Tax Advantaged Short Term Bond Fund returned 1.41% for Class A shares and 1.06% for Investor Class shares for the 12 months ended April 30, 2016. Over the same period, Class I shares returned 1.66%. For the 12 months ended April 30, 2016, all share classes underperformed the 1.84% return of the Barclays 3-Year Municipal Bond Index,1 which is the Fund’s primary benchmark. Over the same period, the Fund’s Class A and Class I shares outperformed—and Investor Class shares underperformed—the 1.10% return of the Barclays U.S. 1–3 Year Government/Credit Index, which is the Fund’s secondary benchmark.1 Over the same period, all share classes outperformed the 0.39% return of the Average Lipper2 Short U.S. Government Fund. See page 5 for Fund returns with applicable sales charges.
What factors affected the Fund’s relative performance during the reporting period?
The Fund’s underweight exposure to several high-quality segments of the municipal market (bonds rated AA+ and AAA,3 as well as state general obligation bonds and prerefunded securities) detracted from relative performance. (Prerefunded securities are securities repurchased by the issuer prior to the first call date.) The Fund had exposure to taxable municipal bonds and other fixed-income securities that were not represented in the Barclays 3-Year Municipal Bond Index. These lower-rated, investment-grade, taxable securities saw their prices increase and yield spreads tighten, which had a positive impact on relative performance as investors looked for attractive opportunities in short-maturity bonds. Also contributing positively to the Fund’s performance during the reporting period was an overweight position in tax-exempt credits rated A and BBB,4 which saw increased demand for incremental yield as the Fund put new cash inflows to
work. Additionally, the Fund’s exposure to Puerto Rico insured bonds and California-issued credits were also positive relative performers. Unfortunately, these positive factors were unable to offset the Fund’s performance relative to the Index.
What was the Fund’s duration5 strategy during the reporting period?
Overall, our strategy was to keep the Fund’s duration close to that of its investable universe, which includes investment-grade municipal bonds, taxable fixed-income bonds, and insured and uninsured bonds of U.S. territories (Puerto Rico, Guam and the U.S. Virgin Islands). At times, depending on conditions in the fixed-income markets, seasonal technicals (supply and demand), and our outlook for what lies ahead, we may adjust the Fund’s duration modestly shorter or longer. During the reporting period, the Fund’s duration was shorter than that of the Barclays 3-Year Municipal Bond Index, as the rapid asset growth the Fund has experienced since its investment strategy changed in June 2015 often resulted in a higher percentage of cash than the Fund would normally hold. The Fund ended the reporting period with a duration of 1.58 years.
What specific factors, risks or market forces prompted significant decisions for the Fund during the reporting period?
We believed that the Federal Reserve’s stated desire to increase the federal funds target rate—along with the strong municipal industry cash flows and demand for bonds with attractive yields—would produce changes in the shape of the yield curve6 and alter credit spreads.7 We found attractive opportunities in the primary and secondary market in bonds with maturities inside four years with an emphasis on credits rated A and BBB, as spreads were elevated and dealer capital had been dramatically reduced. Additionally, the risk of a Puerto Rico debt restructuring continued to loom over the market as uninsured
| 1. | See footnote on page 6 for more information on this index. |
| 2. | See footnote on page 6 for more information on Lipper Inc. |
| 3. | An obligation rated ‘AAA’ has the highest rating assigned by Standard & Poor’s (“S&P”), and in the opinion of S&P, the obligor’s capacity to meet its financial commitment on the obligation is extremely strong. An obligation rated ‘AA’ by S&P is deemed by S&P to differ from the highest-rated obligations only to a small degree. In the opinion of S&P, the obligor’s capacity to meet its financial commitment on the obligation is very strong. Ratings from ‘AA’ to ‘CCC’ may be modified by the addition of a plus (+) or minus (–) sign to show relative standing within the major rating categories. When applied to Fund holdings, ratings are based solely on the creditworthiness of the bonds in the portfolio and are not meant to represent the security or safety of the Fund. |
| 4. | An obligation rated ‘A’ by S&P is deemed by S&P to be somewhat more susceptible to the adverse effects of changes in circumstances and economic conditions than obligations in higher-rated categories. In the opinion of S&P, however, the obligor’s capacity to meet its financial commitment on the obligation is still strong. An obligation rated ‘BBB’ by S&P is deemed by S&P to exhibit adequate protection parameters. In the opinion of S&P, however, adverse economic conditions or changing circumstances are more likely to lead to a weakened capacity of the obligor to meet its financial commitment on the obligation. When applied to Fund holdings, ratings are based solely on the creditworthiness of the bonds in the portfolio and are not meant to represent the security or safety of the Fund. |
| 5. | Duration is a measure of the price sensitivity of a fixed-income investment to changes in interest rates. Duration is expressed as a number of years and is considered a more accurate sensitivity gauge than average maturity. |
| 6. | The yield curve is a line that plots the yields of various securities of similar quality—typically U.S. Treasury issues—across a range of maturities. The U.S. Treasury yield curve serves as a benchmark for other debt and is used in economic forecasting. |
| 7. | The terms “spread” and “yield spread” may refer to the difference in yield between a security or type of security and comparable U.S. Treasury issues. The terms may also refer to the difference in yield between two specific securities or types of securities at a given time. The term “credit spread” typically refers to the difference in yield between corporate or municipal bonds (or a specific category of these bonds) and comparable U.S. Treasury issues. |
| 9 |
Puerto Rico bonds produced negative absolute returns for the reporting period. The Fund’s exposure to Puerto Rico debt was exclusively among bonds that were insured by a monoline insurer, and these bonds performed well during a relatively uncertain reporting period. The Fund also maintained an increased level of liquidity during the reporting period as a result of large cash inflows and our desire to take advantage of potential opportunities during expected bouts of market volatility.
Did the Fund make any significant purchases or sales during the reporting period?
The Fund continued its transition to a new investment strategy during the reporting period, so all purchases were significant. The sales of taxable securities during the reporting period consisted of U.S. Treasury bills and notes and low-yielding corporate bonds.
How did the Fund’s sector weightings change during the reporting period?
The prevalent sectors in the Fund—such as local general obligation, special tax, lease-backed and hospital bonds—reflected our desire to construct a reasonably well-diversified Fund,
include exposure to infrequent municipal issuers and maintain a bias toward individual security selection (as opposed to a top-down approach to portfolio construction). During the reporting period, the Fund increased its exposure to most municipal sectors, as the Fund continued its transition to a new investment strategy, while the Fund decreased its exposure to U.S. Treasury securities and select taxable corporate bonds.
How was the Fund positioned at the end of the reporting period?
As of April 30, 2016, the Fund continued to hold overweight positions relative to the Barclays 3-Year Municipal Bond Index in credits rated A and BBB, taxable fixed-income securities and insured Puerto Rico bonds. As of the same date, the Fund held underweight positions relative to the Index in securities rated AAA and AA+ and prerefunded bonds. At the end of the reporting period, we anticipated maintaining these underweight positions into the future because these securities have a higher correlation to inflation and interest rates than the rest of the market and because the Federal Reserve may seek to bring federal funds target range closer to historical norms in 2016.
The opinions expressed are those of the portfolio managers as of the date of this report and are subject to change. There is no guarantee that any forecasts will come to pass. This material does not constitute investment advice and is not intended as an endorsement of any specific investment.
| 10 | MainStay Tax Advantaged Short Term Bond Fund |
Portfolio of Investments April 30, 2016
| Principal Amount | Value | |||||||
Long-Term Bonds 98.1%† Corporate Bonds 7.0% | ||||||||
Agriculture 0.3% | ||||||||
Japan Tobacco, Inc. | $ | 1,070,000 | $ | 1,079,499 | ||||
|
| |||||||
Auto Manufacturers 0.1% | ||||||||
Daimler Finance North America LLC | 380,000 | 380,059 | ||||||
|
| |||||||
Banks 2.7% | ||||||||
Bank of America Corp. | ||||||||
2.00%, due 1/11/18 | 305,000 | 306,413 | ||||||
5.65%, due 5/1/18 | 1,000,000 | 1,073,886 | ||||||
BB&T Corp. | 915,000 | 919,322 | ||||||
Capital One N.A. | 1,000,000 | 992,190 | ||||||
Citigroup, Inc. | 1,975,000 | 2,011,348 | ||||||
Citizens Bank N.A. | ||||||||
2.30%, due 12/3/18 | 900,000 | 905,556 | ||||||
2.50%, due 3/14/19 | 310,000 | 313,503 | ||||||
Goldman Sachs Group, Inc. (The) | 1,080,000 | 1,106,119 | ||||||
Huntington National Bank (The) | 1,000,000 | 1,007,495 | ||||||
|
| |||||||
| 8,635,832 | ||||||||
|
| |||||||
Biotechnology 0.3% | ||||||||
Celgene Corp. | 900,000 | 913,103 | ||||||
|
| |||||||
Food 0.1% | ||||||||
J.M. Smucker Co. (The) | 205,000 | 206,306 | ||||||
|
| |||||||
Health Care—Products 0.3% | ||||||||
Stryker Corp. | 975,000 | 987,958 | ||||||
|
| |||||||
Insurance 0.3% | ||||||||
Voya Financial, Inc. | 1,000,000 | 1,017,094 | ||||||
|
| |||||||
Miscellaneous—Manufacturing 0.2% | ||||||||
3M Co. | 660,000 | 662,390 | ||||||
|
| |||||||
| Principal Amount | Value | |||||||
Oil & Gas 0.9% | ||||||||
Chevron Corp. | $ | 445,000 | $ | 488,190 | ||||
Phillips 66 | 285,000 | 290,324 | ||||||
Shell International Finance B.V. | 1,000,000 | 1,006,814 | ||||||
Total Capital International S.A. | 1,000,000 | 1,016,793 | ||||||
|
| |||||||
| 2,802,121 | ||||||||
|
| |||||||
Pharmaceuticals 0.9% | ||||||||
AbbVie, Inc. | 750,000 | 756,658 | ||||||
Express Scripts Holding Co. | 1,000,000 | 1,011,643 | ||||||
Medco Health Solutions Co. | 1,000,000 | 1,098,708 | ||||||
|
| |||||||
| 2,867,009 | ||||||||
|
| |||||||
Real Estate 0.3% | ||||||||
Prologis, L.P. | 1,000,000 | 1,024,811 | ||||||
|
| |||||||
Real Estate Investment Trusts 0.3% | ||||||||
Boston Properties, L.P. | 1,000,000 | 1,047,918 | ||||||
|
| |||||||
Telecommunications 0.3% | ||||||||
AT&T, Inc. | 1,000,000 | 1,110,810 | ||||||
|
| |||||||
Total Corporate Bonds | 22,734,910 | |||||||
|
| |||||||
| Mortgage-Backed Security 0.0%‡ | ||||||||
Commercial Mortgage Loans (Collateralized Mortgage Obligation) 0.0%‡ |
| |||||||
LB-UBS Commercial Mortgage Trust | 51,660 | 51,853 | ||||||
|
| |||||||
Total Mortgage-Backed Securities | 51,853 | |||||||
|
| |||||||
| Municipal Bonds 91.1% | ||||||||
Alabama 0.5% | ||||||||
Calhoun County Board of Education, Special Tax Insured: BAM | 200,000 | 210,078 | ||||||
| † | Percentages indicated are based on Fund net assets. |
| ¨ | Among the Fund’s 10 largest issuers held as of April 30, 2016. May be subject to change daily. |
| The notes to the financial statements are an integral part of, and should be read in conjunction with, the financial statements. | 11 |
Portfolio of Investments April 30, 2016 (continued)
| Principal Amount | Value | |||||||
| Municipal Bonds (continued) | ||||||||
Alabama (continued) | ||||||||
Industrial Development Board of the City of Mobile Alabama, Revenue Bonds | $ | 250,000 | $ | 252,407 | ||||
Jasper Water & Sewer Board Inc., Revenue Bonds | ||||||||
4.00%, due 6/1/18 | 705,000 | 746,595 | ||||||
4.00%, due 6/1/19 | 500,000 | 540,370 | ||||||
|
| |||||||
| 1,749,450 | ||||||||
|
| |||||||
Alaska 0.2% | ||||||||
Alaska Railroad Corp., Revenue Bonds | 500,000 | 542,280 | ||||||
|
| |||||||
Arizona 2.9% | ||||||||
Industrial Development Authority of the City of Phoenix (The), Revenue Bonds | 5,600,000 | 5,600,000 | ||||||
Pima County, Unified School District No. 16 Catalina Foothills, Unlimited General Obligation | ||||||||
3.00%, due 7/1/18 | 1,315,000 | 1,371,006 | ||||||
3.00%, due 7/1/19 | 1,165,000 | 1,231,650 | ||||||
Rio Nuevo Multipurpose Facilities, Revenue Bonds | 1,150,000 | 1,275,890 | ||||||
|
| |||||||
| 9,478,546 | ||||||||
|
| |||||||
Arkansas 0.1% | ||||||||
Arkansas Development Finance Authority, Baptist Health System Inc., Revenue Bonds | 375,000 | 393,874 | ||||||
|
| |||||||
California 10.3% | ||||||||
Auburn Urban Development Authority Successor Agency, Tax Allocation | 135,000 | 143,186 | ||||||
Insured: BAM | 140,000 | 152,422 | ||||||
Avalon Community Improvement Agency, Tax Allocation | ||||||||
Series A, Insured: AGM | 810,000 | 832,502 | ||||||
Series A, Insured: AGM | 300,000 | 319,788 | ||||||
| Principal Amount | Value | |||||||
California (continued) | ||||||||
California Health Facilities Financing Authority, NV Methodist Homes, Revenue Bonds | $ | 285,000 | $ | 298,851 | ||||
California Municipal Finance Authority, Revenue Bonds | ||||||||
2.00%, due 11/1/17 | 615,000 | 623,284 | ||||||
4.00%, due 11/1/18 | 740,000 | 790,261 | ||||||
California School Finance Authority, Aspire Public Schools, Revenue Bonds | ||||||||
Series A | 130,000 | 133,136 | ||||||
Series A | 130,000 | 144,322 | ||||||
California Statewide Communities Development Authority, Inland Regional Center Project, Revenue Bonds | ||||||||
2.00%, due 6/15/18 | 1,205,000 | 1,226,678 | ||||||
5.375%, due 12/1/37 | 50,000 | 53,763 | ||||||
Charter Oak Unified School District, Unlimited General Obligation | 435,000 | 466,063 | ||||||
City of Industry CA, Revenue Bonds | ||||||||
Series A, Insured: AGM | 150,000 | 150,945 | ||||||
Series A, Insured: AGM | 355,000 | 360,226 | ||||||
Series A, Insured: AGM | 985,000 | 1,006,010 | ||||||
City of Oakland CA Pension Obligation, Revenue Bonds | 1,000,000 | 929,950 | ||||||
City of San Francisco CA, Public Utilities Commission Water, Revenue Bonds | 315,000 | 330,489 | ||||||
Commerce Community Development Commission Successor Agency, Tax Allocation | 1,890,000 | 1,887,297 | ||||||
County of Orange CA, Revenue Bonds | 2,500,000 | 2,510,375 | ||||||
Del Mar Race Track Authority, Revenue Bonds | 1,230,000 | 1,305,768 | ||||||
Industry Public Facilities Authority, Tax Allocation | 4,000,000 | 4,168,120 | ||||||
| 12 | MainStay Tax Advantaged Short Term Bond Fund | The notes to the financial statements are an integral part of, and should be read in conjunction with, the financial statements. |
| Principal Amount | Value | |||||||
| Municipal Bonds (continued) | ||||||||
California (continued) | ||||||||
Industry Public Finance Authority, Tax Allocation | $ | 700,000 | $ | 744,499 | ||||
Moreno Valley Public Financing Authority, Revenue Bonds | ||||||||
Insured: AGM | 100,000 | 100,272 | ||||||
Insured: AGM | 105,000 | 106,548 | ||||||
¨Municipal Improvement Corp. of Los Angeles, Revenue Bonds | ||||||||
Series A | 500,000 | 500,980 | ||||||
Series A | 5,015,000 | 5,190,625 | ||||||
Ramona Unified School District Community Facilities District No. 92-1, Certificates of Participation | 1,245,000 | 1,317,198 | ||||||
Sacramento Public Financing Authority, Revenue Bonds | 750,000 | 761,512 | ||||||
Sacramento Redevelopment Agency Successor Agency, Tax Allocation | 965,000 | 1,006,678 | ||||||
San Bernardino City Unified School District, Election of 2012, Unlimited General Obligation | ||||||||
Series C, Insured: AGM | 250,000 | 260,302 | ||||||
Series C, Insured: AGM | 300,000 | 328,116 | ||||||
San Diego County CA, Limited Obligation, Sanford Burnham Prebys Medical Discovery Institute, Revenue Bonds | ||||||||
Series SE | 400,000 | 419,208 | ||||||
Series A | 400,000 | 440,172 | ||||||
San Diego Redevelopment Agency Successor Agency, Tax Allocation | ||||||||
Series B | 250,000 | 254,033 | ||||||
Series B | 250,000 | 255,750 | ||||||
Series B | 200,000 | 205,080 | ||||||
| Principal Amount | Value | |||||||
California (continued) | ||||||||
San Francisco City & County Redevelopment Agency, Mission Bay South Project, Tax Allocation | ||||||||
Series B | $ | 320,000 | $ | 335,642 | ||||
Series C | 765,000 | 802,393 | ||||||
Series B | 520,000 | 571,038 | ||||||
Series C | 700,000 | 768,705 | ||||||
Sierra Kings Health Care District, Unlimited General Obligation | ||||||||
4.00%, due 8/1/16 | 200,000 | 201,532 | ||||||
4.00%, due 8/1/17 | 220,000 | 227,216 | ||||||
4.00%, due 8/1/18 | 200,000 | 211,166 | ||||||
Stanton Redevelopment Agency, Stanton Consol Redevelopment, Tax Allocation | 260,000 | 259,771 | ||||||
Successor Agency to the Monrovia Redevelopment Agency, Central Redevelopment Project, Tax Allocation | 600,000 | 610,302 | ||||||
|
| |||||||
| 33,712,174 | ||||||||
|
| |||||||
Colorado 0.8% | ||||||||
City of Glendale CO, Revenue Bonds | ||||||||
Insured: AGM | 250,000 | 250,783 | ||||||
Insured: AGM | 250,000 | 252,517 | ||||||
Colorado Health Facilities Authority, Evangelical Lutheran, Revenue Bonds 3.00%, due 6/1/18 | 500,000 | 517,910 | ||||||
E-470 Public Highway Authority, Revenue Bonds | ||||||||
Series A | 230,000 | 232,454 | ||||||
Series A | 135,000 | 135,988 | ||||||
Series A | 1,000,000 | 1,128,420 | ||||||
|
| |||||||
| 2,518,072 | ||||||||
|
| |||||||
Connecticut 1.2% | ||||||||
City of Hartford CT, Unlimited General Obligation | ||||||||
Series A, Insured: AGM | 650,000 | 706,751 | ||||||
Series C, Insured: NATL-RE | 465,000 | 508,487 | ||||||
| The notes to the financial statements are an integral part of, and should be read in conjunction with, the financial statements. | 13 |
Portfolio of Investments April 30, 2016 (continued)
| Principal Amount | Value | |||||||
| Municipal Bonds (continued) | ||||||||
Connecticut (continued) | ||||||||
City of New Britain CT, Unlimited General Obligation | $ | 1,345,000 | $ | 1,415,720 | ||||
City of Waterbury CT, Taxable Pension, Unlimited General Obligation | 500,000 | 512,345 | ||||||
Connecticut State Health & Educational Facility Authority, Quinnipiac University, Revenue Bonds | 800,000 | 874,224 | ||||||
|
| |||||||
| 4,017,527 | ||||||||
|
| |||||||
Delaware 0.1% | ||||||||
Delaware State Health Facilities Authority, Beebe Medical Center, Revenue Bonds | ||||||||
Series A | 100,000 | 100,176 | ||||||
Series A | 300,000 | 313,920 | ||||||
|
| |||||||
| 414,096 | ||||||||
|
| |||||||
Florida 0.9% | ||||||||
City of Tallahassee FL, Tallahassee Memorial Healthcare, Inc., Revenue Bonds | ||||||||
Series A | 420,000 | 430,454 | ||||||
Series A | 435,000 | 462,392 | ||||||
Series A | 425,000 | 465,868 | ||||||
Escambia County School Board, Revenue Bonds | 300,000 | 321,903 | ||||||
Martin County Health Facilities Authority, Martin Memorial Medical Center, Revenue Bonds | 1,265,000 | 1,272,273 | ||||||
|
| |||||||
| 2,952,890 | ||||||||
|
| |||||||
Guam 0.2% | ||||||||
Territory of Guam, Revenue Bonds | ||||||||
Series D | 300,000 | 309,090 | ||||||
Series D | 275,000 | 294,561 | ||||||
|
| |||||||
| 603,651 | ||||||||
|
| |||||||
| Principal Amount | Value | |||||||
Hawaii 0.1% | ||||||||
State of Hawaii Department of Budget & Finance, Hawaii Pacific Health Obligation, Revenue Bonds | $ | 250,000 | $ | 272,083 | ||||
|
| |||||||
Illinois 11.2% | ||||||||
Chicago Board of Education, Unlimited General Obligation | ||||||||
Series B-1, Insured: NATL-RE | 1,470,000 | 1,340,067 | ||||||
Series A, Insured: NATL-RE | 1,775,000 | 1,903,013 | ||||||
Series A, Insured: NATL-RE | 400,000 | 432,236 | ||||||
Series A, Insured: AMBAC | 220,000 | 228,690 | ||||||
Chicago Public Building Commission, Chicago School Reform, Revenue Bonds | 115,000 | 121,544 | ||||||
City of Berwyn IL, Unlimited General Obligation | 1,675,000 | 1,780,491 | ||||||
City of Chicago IL, Unlimited General Obligation | ||||||||
Insured: AMBAC | 275,000 | 275,632 | ||||||
Insured: AMBAC | 170,000 | 172,596 | ||||||
Insured: AMBAC | 1,225,000 | 1,246,609 | ||||||
City of Freeport IL, Unlimited General Obligation | ||||||||
Series A, Insured: AGM | 100,000 | 100,661 | ||||||
Series A, Insured: AGM | 100,000 | 101,220 | ||||||
City of La Salle IL, Unlimited General Obligation | 135,000 | 136,812 | ||||||
City of Peoria IL, Unlimited General Obligation | 525,000 | 545,407 | ||||||
City of Rockford IL, Unlimited General Obligation | ||||||||
Series A, Insured: BAM | 225,000 | 227,990 | ||||||
Series A, Insured: BAM | 240,000 | 247,747 | ||||||
Series A, Insured: BAM | 145,000 | 151,863 | ||||||
| 14 | MainStay Tax Advantaged Short Term Bond Fund | The notes to the financial statements are an integral part of, and should be read in conjunction with, the financial statements. |
| Principal Amount | Value | |||||||
| Municipal Bonds (continued) | ||||||||
Illinois (continued) | ||||||||
Cook County School District No. 102 La Grange, Limited General Obligation | $ | 275,000 | $ | 284,944 | ||||
County of Cook IL, Unlimited General Obligation | 700,000 | 710,416 | ||||||
Governors State University, Capital Improvement Project, Certificates of Participation | 110,000 | 112,154 | ||||||
Illinois Sports Facilities Authority, Revenue Bonds | 495,000 | 520,502 | ||||||
Illinois State University, Revenue Bonds | ||||||||
Insured: AGM | 1,155,000 | 1,214,679 | ||||||
Insured: AGM | 1,000,000 | 1,101,510 | ||||||
¨ JPMorgan Chase Putters / Drivers Trust, Unlimited General Obligation | 6,000,000 | 6,000,000 | ||||||
Peoria County School District No. 68 Oak Grove, Unlimited General Obligation | 180,000 | 184,349 | ||||||
Randolph County Community Unit School District No. 140 Sparta, Unlimited General Obligation | ||||||||
Insured: AGM | 200,000 | 209,628 | ||||||
Insured: AGM | 405,000 | 435,087 | ||||||
Insured: AGM | 210,000 | 230,746 | ||||||
Regional Transportation Authority, Revenue Bonds | 1,000,000 | 1,101,850 | ||||||
Southern Illinois University, Housing & Auxiliary Facilities System, Revenue Bonds | ||||||||
Series B1 | 1,660,000 | 1,682,925 | ||||||
Series A, Insured: AGM | 1,165,000 | 1,207,557 | ||||||
| Principal Amount | Value | |||||||
Illinois (continued) | ||||||||
St. Clair County High School District No 201 Belleville, Unlimited General Obligation Insured: BAM | $ | 160,000 | $ | 167,850 | ||||
State of Illinois, Revenue Bonds | ||||||||
5.00%, due 6/15/18 | 545,000 | 591,903 | ||||||
5.00%, due 6/15/19 | 610,000 | 683,212 | ||||||
State of Illinois, Unlimited General Obligation | ||||||||
Insured: AGM | 750,000 | 769,680 | ||||||
Insured: AGM | 310,000 | 324,939 | ||||||
Insured: AGM | 2,500,000 | 2,573,575 | ||||||
Insured: NATL-RE | 750,000 | 813,157 | ||||||
United City of Yorkville IL, Special Service Area No. 2005-108 & 2005-109, Special Tax | 885,000 | 919,922 | ||||||
Village of Bellwood IL, Unlimited General Obligation | 1,000,000 | 1,041,870 | ||||||
Village of Rosemont IL, Unlimited General Obligation | 955,000 | 997,192 | ||||||
Volo Village Special Service Area 3 & 6, Symphony Meadows / Lancaster, Special Tax | ||||||||
Insured: AGM | 200,000 | 203,090 | ||||||
Insured: AGM | 200,000 | 205,862 | ||||||
Insured: AGM | 200,000 | 207,892 | ||||||
Western Illinois University, Revenue Bonds | ||||||||
Insured: BAM | 620,000 | 641,483 | ||||||
Insured: BAM | 600,000 | 641,178 | ||||||
Insured: BAM | 870,000 | 953,590 | ||||||
Insured: BAM | 460,000 | 514,294 | ||||||
Will & Kankakee Counties Community Unit School District No. 207-U Peotone, Unlimited General Obligation | 250,000 | 253,387 | ||||||
|
| |||||||
| 36,513,001 | ||||||||
|
| |||||||
| The notes to the financial statements are an integral part of, and should be read in conjunction with, the financial statements. | 15 |
Portfolio of Investments April 30, 2016 (continued)
| Principal Amount | Value | |||||||
| Municipal Bonds (continued) | ||||||||
Indiana 3.7% | ||||||||
City of Rockport IN, Revenue Bonds | $ | 2,000,000 | $ | 2,015,240 | ||||
Indiana Bond Bank, Revenue Bonds | ||||||||
Series A | 190,000 | 193,981 | ||||||
Series A | 1,000,000 | 1,095,110 | ||||||
¨ Indiana Finance Authority, Revenue Bonds | ||||||||
0.31%, due 2/1/37 (b) | 8,000,000 | 8,000,000 | ||||||
5.00%, due 3/1/19 | 750,000 | 788,287 | ||||||
|
| |||||||
| 12,092,618 | ||||||||
|
| |||||||
Iowa 2.0% | ||||||||
City of Coralville IA, Annual Appropriate Urban Renewal, Certificates of Participation Series B-1 | 320,000 | 323,187 | ||||||
City of Coralville IA, Corporate Purpose Bonds, Unlimited General Obligation | ||||||||
Series D1 | 510,000 | 510,699 | ||||||
Series D1 | 270,000 | 270,926 | ||||||
Series D2 | 70,000 | 70,702 | ||||||
Iowa Finance Authority, Health Facilities, Great River Medical Center Project, Revenue Bonds | 5,415,000 | 5,415,000 | ||||||
|
| |||||||
| 6,590,514 | ||||||||
|
| |||||||
Kentucky 2.8% | ||||||||
County of Harrison KY, Harrison Memorial Hospital, Revenue Notes | 1,000,000 | 1,000,030 | ||||||
¨Louisville / Jefferson County Metropolitan Government, Norton Healthcare, Revenue Bonds | 8,000,000 | 8,000,000 | ||||||
|
| |||||||
| 9,000,030 | ||||||||
|
| |||||||
Louisiana 2.0% | ||||||||
Bossier City LA, Public Improvement Sales & Tax, Revenue Bonds | ||||||||
2.00%, due 12/1/17 | 1,065,000 | 1,084,905 | ||||||
2.00%, due 12/1/18 | 500,000 | 511,750 | ||||||
2.00%, due 12/1/19 | 650,000 | 664,631 | ||||||
2.25%, due 12/1/20 | 500,000 | 515,515 | ||||||
| Principal Amount | Value | |||||||
Louisiana (continued) | ||||||||
City of New Orleans LA, Water System, Revenue Bonds | $ | 250,000 | $ | 262,220 | ||||
Lafayette Consolidated Government, Revenue Bonds | 550,000 | 583,671 | ||||||
Lafayette Public Trust Financing Authority, Ragin Cajun Facilities, Revenue Bonds | 705,000 | 768,669 | ||||||
Louisiana Local Government Environmental Facilities & Community Development Authority, University Student Housing, Revenue Bonds | ||||||||
Insured: AGM | 355,000 | 365,483 | ||||||
Insured: AGM | 865,000 | 905,127 | ||||||
Louisiana Public Facilities Authority, Nineteenth Judicial District, Revenue Bonds | 245,000 | 263,118 | ||||||
Shreveport LA, Airport System, Revenue Bonds | 500,000 | 515,610 | ||||||
|
| |||||||
| 6,440,699 | ||||||||
|
| |||||||
Maryland 0.3% | ||||||||
Maryland Health & Higher Educational Facilities Authority, Revenue Bonds | ||||||||
3.00%, due 1/1/18 | 705,000 | 728,258 | ||||||
5.00%, due 7/1/18 | 300,000 | 325,752 | ||||||
|
| |||||||
| 1,054,010 | ||||||||
|
| |||||||
Massachusetts 0.8% | ||||||||
Massachusetts Development Finance Agency, Revenue Bonds | 1,000,000 | 1,007,120 | ||||||
Massachusetts Development Finance Agency, UMass Memorial Health Care, Revenue Bonds | 1,000,000 | 1,086,740 | ||||||
Massachusetts Development Finance Agency, Western New England University, Revenue Bonds | ||||||||
2.00%, due 9/1/16 | 210,000 | 210,871 | ||||||
4.00%, due 9/1/17 | 200,000 | 207,884 | ||||||
5.00%, due 9/1/18 | 225,000 | 244,584 | ||||||
|
| |||||||
| 2,757,199 | ||||||||
|
| |||||||
| 16 | MainStay Tax Advantaged Short Term Bond Fund | The notes to the financial statements are an integral part of, and should be read in conjunction with, the financial statements. |
| Principal Amount | Value | |||||||
| Municipal Bonds (continued) | ||||||||
Michigan 4.6% | ||||||||
City of Detroit MI, Sewage Disposal System, Revenue Bonds | $ | 200,000 | $ | 201,374 | ||||
Harper Woods School District, Unlimited General Obligation | 500,000 | 559,600 | ||||||
Hartland Consolidated Schools, Unlimited General Obligation | 1,500,000 | 1,514,175 | ||||||
Lincoln Consolidated School District, Unlimited General Obligation | 1,180,000 | 1,310,886 | ||||||
Livonia Public Schools, School District, Unlimited General Obligation | 210,000 | 222,249 | ||||||
Michigan Finance Authority, College for Creative Studies, Revenue Bonds | ||||||||
3.00%, due 12/1/16 | 150,000 | 151,638 | ||||||
4.00%, due 12/1/17 | 200,000 | 208,070 | ||||||
5.00%, due 12/1/18 | 200,000 | 216,750 | ||||||
Michigan Finance Authority, Public School Academy, Revenue Bonds | 655,000 | 724,987 | ||||||
Orchard View Schools, Unlimited General Obligation | ||||||||
Series B | 1,000,000 | 1,006,530 | ||||||
Series B | 1,000,000 | 1,013,060 | ||||||
Series B | 1,410,000 | 1,440,752 | ||||||
Saline Area Schools | 2,300,000 | 2,331,878 | ||||||
Warren Consolidated Schools, Unlimited General Obligation | ||||||||
Series B, Insured: BAM | 1,260,000 | 1,297,649 | ||||||
Series B, Insured: BAM | 1,630,000 | 1,722,062 | ||||||
Series B, Insured: BAM | 1,080,000 | 1,195,398 | ||||||
|
| |||||||
| 15,117,058 | ||||||||
|
| |||||||
| Principal Amount | Value | |||||||
Minnesota 2.6% | ||||||||
¨City of Minneapolis MN/St. Paul Housing & Redevelopment Authority, Allina Health Systems, Revenue Bonds | $ | 7,175,000 | $ | 7,175,000 | ||||
St. Paul Housing & Redevelopment Authority, Healtheast Care System, Revenue Bonds | 1,350,000 | 1,474,794 | ||||||
|
| |||||||
| 8,649,794 | ||||||||
|
| |||||||
Mississippi 0.7% | ||||||||
Mississippi Development Bank, Canton Public School District, Revenue Bonds | ||||||||
Insured: AGM | 260,000 | 272,425 | ||||||
Insured: AGM | 935,000 | 1,003,723 | ||||||
Mississippi Hospital Equipment & Facilities Authority, Baptist Health System, Inc., Revenue Bonds | 1,000,000 | 1,046,660 | ||||||
|
| |||||||
| 2,322,808 | ||||||||
|
| |||||||
Missouri 0.7% | ||||||||
City of Belton MO, Certificates of Participation Insured: NATL-RE | 150,000 | 154,304 | ||||||
Saint Louis Municipal Finance Corp., Carnahan Courthouse, Revenue Bonds | ||||||||
Series A | 460,000 | 476,339 | ||||||
Series A | 1,425,000 | 1,538,259 | ||||||
|
| |||||||
| 2,168,902 | ||||||||
|
| |||||||
New Hampshire 0.4% | ||||||||
City of Nashua NH, Unlimited General Obligation | 450,000 | 455,004 | ||||||
Manchester Housing & Redevelopment Authority, Inc., Revenue Bonds | 100,000 | 95,820 | ||||||
New Hampshire Health & Education Facilities Authority, Kendel at Hanover, Revenue Bonds | ||||||||
2.00%, due 10/1/16 | 260,000 | 261,251 | ||||||
2.00%, due 10/1/17 | 200,000 | 202,688 | ||||||
3.00%, due 10/1/18 | 200,000 | 208,592 | ||||||
|
| |||||||
| 1,223,355 | ||||||||
|
| |||||||
| The notes to the financial statements are an integral part of, and should be read in conjunction with, the financial statements. | 17 |
Portfolio of Investments April 30, 2016 (continued)
| Principal Amount | Value | |||||||
| Municipal Bonds (continued) | ||||||||
New Jersey 8.5% | ||||||||
Borough of North Plainfield NJ, Unlimited General Obligation | $ | 330,000 | $ | 352,493 | ||||
Burlington County Bridge Commission, Revenue Notes | 4,625,000 | 4,661,352 | ||||||
Camden County Municipal Utilities Authority, Revenue Bonds | 1,000,000 | 1,051,080 | ||||||
Carteret Board of Education, Certificates of Participation | 315,000 | 339,208 | ||||||
Casino Reinvestment Development Authority, Revenue Bonds | 255,000 | 266,144 | ||||||
City of Bayonne NJ, Unlimited General Obligation | 1,000,000 | 1,084,350 | ||||||
Garden State Preservation Trust, Revenue Bonds | 100,000 | 102,184 | ||||||
Hammonton NJ, Unlimited General Obligation | ||||||||
Insured: AGM | 500,000 | 503,770 | ||||||
Insured: AGM | 750,000 | 786,772 | ||||||
¨New Jersey Economic Development Authority, School Facilities Construction, Revenue Bonds | ||||||||
Series QQ | 4,000,000 | 4,000,880 | ||||||
Series B | 6,000,000 | 6,008,880 | ||||||
New Jersey Health Care Facilities Financing Authority, Princeton Healthcare System, Revenue Bonds | ||||||||
4.00%, due 7/1/17 | 1,000,000 | 1,036,240 | ||||||
5.00%, due 7/1/18 | 640,000 | 694,502 | ||||||
New Jersey Health Care Facilities Financing Authority, Revenue Bonds | ||||||||
3.15%, due 7/1/18 | 1,000,000 | 1,021,410 | ||||||
Insured: AGM | 150,000 | 153,123 | ||||||
| Principal Amount | Value | |||||||
New Jersey (continued) | ||||||||
New Jersey State, Unlimited General Obligation | $ | 1,795,000 | $ | 1,951,739 | ||||
New Jersey Transportation Trust Fund Authority, Revenue Bonds | ||||||||
Series B-2, Insured: XLCA | 405,000 | 427,878 | ||||||
Series B, Insured: NATL-RE | 1,000,000 | 1,029,660 | ||||||
Series C, Insured: AGM | 420,000 | 448,069 | ||||||
Passaic Valley Water Commission, Revenue Bonds | 140,000 | 143,699 | ||||||
Phillipsburg School District, Unlimited General Obligation | 400,000 | 405,984 | ||||||
Township of Brick NJ, Unlimited General Obligation | 1,000,000 | 1,094,090 | ||||||
Upper Freehold Regional School District, Unlimited General Obligation | 235,000 | 238,349 | ||||||
|
| |||||||
| 27,801,856 | ||||||||
|
| |||||||
New York 5.8% | ||||||||
¨City of New York NY, Unlimited General Obligation | 8,000,000 | 8,000,000 | ||||||
City of Yonkers NY, Limited General Obligation Series D | 1,000,000 | 1,026,340 | ||||||
County of Rockland NY, Public Improvement, Limited General Obligation | ||||||||
Insured: AGM | 655,000 | 669,155 | ||||||
Series C, Insured: AGM | 1,435,000 | 1,505,100 | ||||||
New York City Transitional Finance Authority Future Tax Secured, Revenue Bonds | ||||||||
Series 2A | 1,200,000 | 1,200,000 | ||||||
Series A-3 | 1,000,000 | 1,000,000 | ||||||
| 18 | MainStay Tax Advantaged Short Term Bond Fund | The notes to the financial statements are an integral part of, and should be read in conjunction with, the financial statements. |
| Principal Amount | Value | |||||||
| Municipal Bonds (continued) | ||||||||
New York (continued) | ||||||||
Town of Oyster Bay NY, Limited General Obligation | $ | 4,235,000 | $ | 4,390,001 | ||||
Westchester County Local Development Corp., Westchester Medical Center, Revenue Bonds | 1,145,000 | 1,288,239 | ||||||
|
| |||||||
| 19,078,835 | ||||||||
|
| |||||||
North Carolina 0.2% | ||||||||
Raleigh Durham Airport Authority, Revenue Bonds | 750,000 | 810,668 | ||||||
|
| |||||||
North Dakota 1.4% | ||||||||
Burleigh County, Multi-County Sales Tax Revenue, Revenue Bonds | 1,490,000 | 1,581,218 | ||||||
City of Bowman ND Healthcare Facilities, Revenue Notes | 1,000,000 | 1,000,840 | ||||||
County of Burleigh ND, Multi-County Sales Tax, Revenue Bonds | 500,000 | 548,795 | ||||||
North Dakota Housing Finance Agency, Revenue Bonds | 1,425,000 | 1,429,717 | ||||||
|
| |||||||
| 4,560,570 | ||||||||
|
| |||||||
Ohio 1.8% | ||||||||
City of Cincinnati OH, Unlimited General Obligation | ||||||||
Series D | 300,000 | 301,341 | ||||||
Series D | 200,000 | 204,076 | ||||||
Cleveland Municipal School District, Unlimited General Obligation | 1,185,000 | 1,245,044 | ||||||
County of Cuyahoga OH, Sports Facilities Improvement, Revenue Bonds | ||||||||
3.00%, due 12/1/17 | 1,000,000 | 1,034,790 | ||||||
5.00%, due 12/1/18 | 1,000,000 | 1,101,920 | ||||||
Ohio Higher Educational Facility Commission, Hospital-Cleveland Clinic, Revenue Bonds | 2,000,000 | 2,000,000 | ||||||
|
| |||||||
| 5,887,171 | ||||||||
|
| |||||||
| Principal Amount | Value | |||||||
Oklahoma 2.5% | ||||||||
Cleveland County Educational Facilities Authority, Revenue Bonds | $ | 3,000,000 | $ | 3,342,060 | ||||
Oklahoma County Independent School District No. 52, Unlimited General Obligation | ||||||||
Series A | 2,210,000 | 2,234,531 | ||||||
Series A | 2,460,000 | 2,527,994 | ||||||
|
| |||||||
| 8,104,585 | ||||||||
|
| |||||||
Pennsylvania 8.2% | ||||||||
¨Beaver County PA, Unlimited General Obligation | ||||||||
Series B, Insured: BAM | 2,015,000 | 2,019,211 | ||||||
Series B, Insured: BAM | 4,215,000 | 4,232,408 | ||||||
Bermudian Springs School District, Limited General Obligation | 1,425,000 | 1,546,994 | ||||||
Capital Region Water, Revenue Bonds | 1,300,000 | 1,456,208 | ||||||
Centre County Hospital Authority, Mount Nittany Medical Center, Revenue Bonds | ||||||||
Series B | 100,000 | 108,238 | ||||||
Series A | 100,000 | 107,840 | ||||||
Series A | 240,000 | 264,679 | ||||||
City of Reading PA, Unlimited General Obligation | 1,000,000 | 1,012,040 | ||||||
Doylestown PA, Hospital Authority, Revenue Bonds | 245,000 | 261,271 | ||||||
General Authority of Southcentral Pennsylvania, Hanover Hospital, Inc., Revenue Bonds | ||||||||
4.00%, due 12/1/17 | 100,000 | 104,368 | ||||||
4.00%, due 12/1/18 | 185,000 | 196,958 | ||||||
¨Lehigh County Industrial Development Authority, PPL Electric Utilities Corp., Revenue Bonds | ||||||||
Series B | 3,000,000 | 2,997,540 | ||||||
Series A | 3,000,000 | 2,997,150 | ||||||
| The notes to the financial statements are an integral part of, and should be read in conjunction with, the financial statements. | 19 |
Portfolio of Investments April 30, 2016 (continued)
| Principal Amount | Value | |||||||
| Municipal Bonds (continued) | ||||||||
Pennsylvania (continued) | ||||||||
Mifflin County School District, Unlimited General Obligation | $ | 355,000 | $ | 387,142 | ||||
Pennsylvania Higher Educational Facilities Authority, Thomas Jefferson University, Revenue Bonds | 1,700,000 | 1,799,263 | ||||||
Philadelphia Authority for Industrial Development, Retirement System, Revenue Bonds | 360,000 | 346,331 | ||||||
Pocono Mountain School District, Limited General Obligation | 1,350,000 | 1,397,439 | ||||||
Reading School District, Unlimited General Obligation | 790,000 | 841,192 | ||||||
Riverside School District, Unlimited General Obligation | 1,155,000 | 1,189,627 | ||||||
State Public School Building Authority, Revenue Bonds | 1,140,000 | 1,241,209 | ||||||
Trinity Area School District, Unlimited General Obligation | 950,000 | 1,018,543 | ||||||
West Mifflin School District, Unlimited General Obligation | ||||||||
Insured: AGM | 410,000 | 425,871 | ||||||
Insured: AGM | 500,000 | 542,965 | ||||||
Western Wayne School District, Limited General Obligation | 290,000 | 305,950 | ||||||
|
| |||||||
| 26,800,437 | ||||||||
|
| |||||||
Puerto Rico 5.9% | ||||||||
Commonwealth of Puerto Rico, Public Improvement, CPI Linked Bonds, Unlimited General Obligation | 200,000 | 195,600 | ||||||
| Principal Amount | Value | |||||||
Puerto Rico (continued) | ||||||||
¨Commonwealth of Puerto Rico, Public Improvement, Unlimited General Obligation | ||||||||
Insured: NATL-RE | $ | 450,000 | $ | 426,465 | ||||
Insured: NATL-RE | 255,000 | 233,108 | ||||||
Series A, Insured: AGC | 1,205,000 | 1,210,820 | ||||||
Series A, Insured: AGC | 95,000 | 98,234 | ||||||
Series A, Insured: AGC | 525,000 | 528,434 | ||||||
Insured: AGM | 380,000 | 391,514 | ||||||
Insured: AGM | 190,000 | 198,447 | ||||||
Insured: AGM | 3,635,000 | 3,661,899 | ||||||
Series A, Insured: NATL-RE | 2,115,000 | 2,126,061 | ||||||
Insured: AGM | 495,000 | 511,419 | ||||||
Series A, Insured: NATL-RE | 930,000 | 963,108 | ||||||
Insured: AGM | 100,000 | 105,381 | ||||||
Series A, Insured: NATL-RE | 125,000 | 131,078 | ||||||
Puerto Rico Electric Power Authority, Revenue Bonds | ||||||||
Series UU, Insured: AGM | 430,000 | 432,163 | ||||||
Series SS, Insured: NATL-RE | 100,000 | 100,192 | ||||||
Series SS, Insured: NATL-RE | 1,525,000 | 1,545,450 | ||||||
Series KK, Insured: NATL-RE | 870,000 | 874,350 | ||||||
Puerto Rico Highways & Transportation Authority, Revenue Bonds | ||||||||
Series E, Insured: AGM | 175,000 | 175,975 | ||||||
Series E, Insured: AGM | 255,000 | 262,800 | ||||||
Series AA, Insured: NATL-RE | 715,000 | 734,062 | ||||||
Series Z, Insured: AGM | 1,000,000 | 1,058,580 | ||||||
Series Z, Insured: AGM | 855,000 | 860,848 | ||||||
| 20 | MainStay Tax Advantaged Short Term Bond Fund | The notes to the financial statements are an integral part of, and should be read in conjunction with, the financial statements. |
| Principal Amount | Value | |||||||
| Municipal Bonds (continued) | ||||||||
Puerto Rico (continued) | ||||||||
Puerto Rico Housing Finance Authority, Revenue Bonds | $ | 100,000 | $ | 107,537 | ||||
Puerto Rico Municipal Finance Agency, Revenue Bonds | ||||||||
Series C, Insured: AGM | 125,000 | 125,414 | ||||||
Series A, Insured: AGM | 195,000 | 195,634 | ||||||
Series B, Insured: AGC | 205,000 | 210,562 | ||||||
Series C, Insured: AGM | 450,000 | 463,059 | ||||||
Series C, Insured: AGM | 650,000 | 676,442 | ||||||
Puerto Rico Municipal Finance Agency, Unlimited General Obligation | ||||||||
Series A, Insured: AGM | 325,000 | 326,144 | ||||||
Series A, Insured: AGM | 250,000 | 253,895 | ||||||
Puerto Rico Public Buildings Authority, Revenue Bonds | 50,000 | 51,802 | ||||||
|
| |||||||
| 19,236,477 | ||||||||
|
| |||||||
Rhode Island 0.2% | ||||||||
Tobacco Settlement Financing Corp., Revenue Bonds | 500,000 | 517,575 | ||||||
|
| |||||||
South Carolina 1.5% | ||||||||
SCAGO Educational Facilities Corp. for Williamsburg School District, Revenue Bonds | ||||||||
Series A, Insured: BAM | 180,000 | 180,034 | ||||||
Series A, Insured: BAM | 345,000 | 346,156 | ||||||
Series A, Insured: BAM | 555,000 | 556,726 | ||||||
Series A, Insured: BAM | 425,000 | 426,373 | ||||||
Series A, Insured: BAM | 500,000 | 499,385 | ||||||
Series A, Insured: BAM | 100,000 | 99,849 | ||||||
| Principal Amount | Value | |||||||
South Carolina (continued) | ||||||||
South Carolina Jobs-Economic Development Authority, Revenue Bonds | ||||||||
Series A | $ | 1,125,000 | $ | 1,136,914 | ||||
Series A | 350,000 | 378,483 | ||||||
Sumter Two School Facilities, Inc., School District Project, Revenue Bonds | 1,065,000 | 1,200,244 | ||||||
|
| |||||||
| 4,824,164 | ||||||||
|
| |||||||
Tennessee 1.2% | ||||||||
Metropolitan Government Nashville & Davidson County Health & Educational Facilities Board, Lipscomb University Project, Revenue Bonds | ||||||||
Series A | 280,000 | 287,725 | ||||||
Series A | 250,000 | 266,753 | ||||||
Series A | 200,000 | 217,698 | ||||||
Metropolitan Government Nashville & Davidson County Health & Educational Facilities Board, Vanderbilt University Medical Center, Revenue Bonds | 2,000,000 | 2,000,000 | ||||||
Shelby County TN, Health Educational & Housing Facilities Board, Methodist Le Bonheur, Revenue Bonds | 1,200,000 | 1,200,000 | ||||||
|
| |||||||
| 3,972,176 | ||||||||
|
| |||||||
Texas 2.5% | ||||||||
Crane County Water District, Unlimited General Obligation | 500,000 | 507,700 | ||||||
Harris County Municipal Utility District No. 419, Unlimited General Obligation | ||||||||
Insured: AGM | 100,000 | 102,481 | ||||||
Insured: AGM | 150,000 | 156,218 | ||||||
Insured: AGM | 735,000 | 771,904 | ||||||
Insured: AGM | 500,000 | 528,925 | ||||||
| The notes to the financial statements are an integral part of, and should be read in conjunction with, the financial statements. | 21 |
Portfolio of Investments April 30, 2016 (continued)
| Principal Amount | Value | |||||||
| Municipal Bonds (continued) | ||||||||
Texas (continued) | ||||||||
Harris County-Houston Sports Authority, Revenue Bonds | $ | 4,040,000 | $ | 4,022,547 | ||||
Kerrville Health Facilities Development Corp., Peterson Regional Medical Center Project, Revenue Bonds | ||||||||
4.00%, due 8/15/17 | 780,000 | 808,166 | ||||||
4.00%, due 8/15/18 | 555,000 | 588,372 | ||||||
Tarrant County Cultural Education Facilities Finance Corp., Buckner Retirement Services, Revenue Bonds | 565,000 | 582,701 | ||||||
|
| |||||||
| 8,069,014 | ||||||||
|
| |||||||
U.S. Virgin Islands 1.5% | ||||||||
Virgin Islands Public Finance Authority, Matching Fund Lecture Note, Revenue Bonds | 1,000,000 | 1,081,940 | ||||||
Virgin Islands Public Finance Authority, Revenue Bonds | ||||||||
Series A | 1,635,000 | 1,717,698 | ||||||
Series A | 1,810,000 | 2,005,806 | ||||||
|
| |||||||
| 4,805,444 | ||||||||
|
| |||||||
Utah 0.3% | ||||||||
City of Saint George UT Electric, Revenue Bonds | 300,000 | 308,700 | ||||||
Utah Infrastructure Agency, Revenue Bonds | 630,000 | 627,549 | ||||||
|
| |||||||
| 936,249 | ||||||||
|
| |||||||
Vermont 0.2% | ||||||||
Vermont Educational & Health Building Financing Agency, Revenue Bonds | ||||||||
2.00%, due 10/1/16 | 195,000 | 195,913 | ||||||
3.00%, due 10/1/17 | 315,000 | 323,328 | ||||||
4.00%, due 10/1/18 | 125,000 | 133,190 | ||||||
4.00%, due 10/1/19 | 130,000 | 140,981 | ||||||
|
| |||||||
| 793,412 | ||||||||
|
| |||||||
| Principal Amount | Value | |||||||
Virginia 0.1% | ||||||||
Smyth County Industrial Development Authority, Mountain States Health Alliance, Revenue Bonds | $ | 225,000 | $ | 225,952 | ||||
|
| |||||||
Wisconsin 0.2% | ||||||||
State of Wisconsin, Revenue Bonds | 600,000 | 648,258 | ||||||
|
| |||||||
Total Municipal Bonds | 297,657,474 | |||||||
|
| |||||||
| U.S. Government & Federal Agency 0.0%‡ | ||||||||
Federal National Mortgage Association |
| |||||||
4.50%, due 11/1/18 | 26,435 | 27,222 | ||||||
|
| |||||||
Total U.S. Government & Federal Agency | 27,222 | |||||||
|
| |||||||
Total Long-Term Bonds | 320,471,459 | |||||||
|
| |||||||
Total Investments | 98.1 | % | 320,471,459 | |||||
Other Assets, Less Liabilities | 1.9 | 6,328,267 | ||||||
Net Assets | 100.0 | % | $ | 326,799,726 | ||||
| ‡ | Less than one-tenth of a percent. |
| (a) | May be sold to institutional investors only under Rule 144A or securities offered pursuant to Section 4(a)(2) of the Securities Act of 1933, as amended. |
| (b) | Floating rate—Rate shown was the rate in effect as of April 30, 2016. |
| (c) | Interest on these securities was subject to alternative minimum tax. |
| (d) | As of April 30, 2016, cost was $318,982,404 for federal income tax purposes and net unrealized appreciation was as follows: |
Gross unrealized appreciation | $ | 1,553,627 | ||
Gross unrealized depreciation | (64,572 | ) | ||
|
| |||
Net unrealized appreciation | $ | 1,489,055 | ||
|
|
The following abbreviations are used in the preceding pages:
AGC—Assured Guaranty Corp.
AGM—Assured Guaranty Municipal Corp.
AMBAC—Ambac Assurance Corp.
BAM—Build America Mutual Assurance Co.
MAC—Municipal Assurance Corp.
NATL-RE—National Public Finance Guarantee Corp.
| 22 | MainStay Tax Advantaged Short Term Bond Fund | The notes to the financial statements are an integral part of, and should be read in conjunction with, the financial statements. |
The following is a summary of the fair valuations according to the inputs used as of April 30, 2016, for valuing the Fund’s assets.
Asset Valuation Inputs
Description | Quoted (Level 1) | Significant (Level 2) | Significant (Level 3) | Total | ||||||||||||
| Investments in Securities (a) | ||||||||||||||||
| Long-Term Bonds | ||||||||||||||||
Corporate Bonds | $ | — | $ | 22,734,910 | $ | — | $ | 22,734,910 | ||||||||
Mortgage-Backed Securities | — | 51,853 | — | 51,853 | ||||||||||||
Municipal Bonds | — | 297,657,474 | — | 297,657,474 | ||||||||||||
U.S. Government & Federal Agency | — | 27,222 | — | 27,222 | ||||||||||||
|
|
|
|
|
|
|
| |||||||||
| Total Long-Term Bonds | — | 320,471,459 | — | 320,471,459 | ||||||||||||
|
|
|
|
|
|
|
| |||||||||
| Total Investments in Securities | $ | — | $ | 320,471,459 | $ | — | $ | 320,471,459 | ||||||||
|
|
|
|
|
|
|
| |||||||||
| (a) | For a complete listing of investments and their industries, see the Portfolio of Investments. |
The Fund recognizes transfers between the levels as of the beginning of the period.
For the year ended April 30, 2016, the Fund did not have any transfers between Level 1 and Level 2 fair value measurements. (See Note 2)
As of April 30, 2016, the Fund did not hold any investments with significant unobservable inputs (Level 3). (See Note 2)
| The notes to the financial statements are an integral part of, and should be read in conjunction with, the financial statements. | 23 |
Statement of Assets and Liabilities as of April 30, 2016
| Assets | ||||
Investment in securities, at value | $ | 320,471,459 | ||
Cash | 8,259,626 | |||
Receivables: | ||||
Fund shares sold | 9,572,228 | |||
Interest | 2,417,348 | |||
Other assets | 83,009 | |||
|
| |||
Total assets | 340,803,670 | |||
|
| |||
| Liabilities | ||||
Payables: | ||||
Investment securities purchased | 13,563,175 | |||
Fund shares redeemed | 199,520 | |||
Manager (See Note 3) | 78,785 | |||
Professional fees | 56,824 | |||
Transfer agent (See Note 3) | 29,292 | |||
NYLIFE Distributors (See Note 3) | 21,662 | |||
Shareholder communication | 14,962 | |||
Custodian | 4,052 | |||
Accrued expenses | 4,089 | |||
Dividend payable | 31,583 | |||
|
| |||
Total liabilities | 14,003,944 | |||
|
| |||
Net assets | $ | 326,799,726 | ||
|
| |||
| Composition of Net Assets | ||||
Shares of beneficial interest outstanding (par value of $.001 per share) unlimited number of shares authorized | $ | 34,004 | ||
Additional paid-in capital | 325,249,862 | |||
|
| |||
| 325,283,866 | ||||
Distributions in excess of net investment income | (8,218 | ) | ||
Accumulated net realized gain (loss) on investments | 35,023 | |||
Net unrealized appreciation (depreciation) on investments | 1,489,055 | |||
|
| |||
Net assets | $ | 326,799,726 | ||
|
| |||
Class A | ||||
Net assets applicable to outstanding shares | $ | 111,768,163 | ||
|
| |||
Shares of beneficial interest outstanding | 11,628,824 | |||
|
| |||
Net asset value per share outstanding | $ | 9.61 | ||
Maximum sales charge (1.00% of offering price)* | 0.10 | |||
|
| |||
Maximum offering price per share outstanding | $ | 9.71 | ||
|
| |||
Investor Class | ||||
Net assets applicable to outstanding shares | $ | 3,662,654 | ||
|
| |||
Shares of beneficial interest outstanding | 380,082 | |||
|
| |||
Net asset value per share outstanding | $ | 9.64 | ||
Maximum sales charge (1.00% of offering price)* | 0.10 | |||
|
| |||
Maximum offering price per share outstanding | $ | 9.74 | ||
|
| |||
Class I | ||||
Net assets applicable to outstanding shares | $ | 211,368,909 | ||
|
| |||
Shares of beneficial interest outstanding | 21,995,145 | |||
|
| |||
Net asset value and offering price per share outstanding | $ | 9.61 | ||
|
|
| * | Maximum sales charge prior to June 1, 2015 was 3.00%. |
| 24 | MainStay Tax Advantaged Short Term Bond Fund | The notes to the financial statements are an integral part of, and should be read in conjunction with, the financial statements. |
Statement of Operations for the year ended April 30, 2016
| Investment Income (Loss) | ||||
Income | ||||
Interest | $ | 1,868,433 | ||
|
| |||
Expenses | ||||
Manager (See Note 3) | 568,695 | |||
Distribution/Service—Class A (See Note 3) | 118,771 | |||
Distribution/Service—Investor Class (See Note 3) | 8,840 | |||
Transfer agent (See Note 3) | 101,592 | |||
Professional fees | 68,618 | |||
Registration | 66,507 | |||
Shareholder communication | 39,368 | |||
Custodian | 18,612 | |||
Trustees | 2,643 | |||
Miscellaneous | 9,991 | |||
|
| |||
Total expenses before waiver/reimbursement | 1,003,637 | |||
Expense waiver/reimbursement from Manager (See Note 3) | (166,760 | ) | ||
|
| |||
Net expenses | 836,877 | |||
|
| |||
Net investment income (loss) | 1,031,556 | |||
|
| |||
| Realized and Unrealized Gain (Loss) on Investments | ||||
Net realized gain (loss) on investments | 39,066 | |||
Net change in unrealized appreciation (depreciation) on investments | 1,272,276 | |||
|
| |||
Net realized and unrealized gain (loss) on investments | 1,311,342 | |||
|
| |||
Net increase (decrease) in net assets resulting from operations | $ | 2,342,898 | ||
|
| |||
| The notes to the financial statements are an integral part of, and should be read in conjunction with, the financial statements. | 25 |
Statements of Changes in Net Assets
for the year ended April 30, 2016, the period November 1, 2014 through April 30, 2015 and year ended October 31, 2014
| 2016 | 2015 (a) | 2014 | ||||||||||
| Increase (Decrease) in Net Assets | ||||||||||||
Operations: | ||||||||||||
Net investment income (loss) | $ | 1,031,556 | $ | 129,152 | $ | 421,035 | ||||||
Net realized gain (loss) on investments | 39,066 | (4,043 | ) | 74,360 | ||||||||
Net change in unrealized appreciation (depreciation) on investments | 1,272,276 | 44,743 | (284,018 | ) | ||||||||
|
| |||||||||||
Net increase (decrease) in net assets resulting from operations | 2,342,898 | 169,852 | 211,377 | |||||||||
|
| |||||||||||
Dividends and distributions to shareholders: | ||||||||||||
From net investment income: | ||||||||||||
Class A | (320,552 | ) | (30,329 | ) | (87,334 | ) | ||||||
Investor Class | (7,767 | ) | (236 | ) | (2,457 | ) | ||||||
Class I | (710,875 | ) | (97,172 | ) | (330,654 | ) | ||||||
|
| |||||||||||
| (1,039,194 | ) | (127,737 | ) | (420,445 | ) | |||||||
|
| |||||||||||
From net realized gain on investments: | ||||||||||||
Class A | — | (23,139 | ) | (49,098 | ) | |||||||
Investor Class | — | (4,418 | ) | (8,065 | ) | |||||||
Class I | — | (46,715 | ) | (120,264 | ) | |||||||
|
| |||||||||||
| — | (74,272 | ) | (177,427 | ) | ||||||||
|
| |||||||||||
Total dividends and distributions to shareholders | (1,039,194 | ) | (202,009 | ) | (597,872 | ) | ||||||
|
| |||||||||||
Capital share transactions: | ||||||||||||
Net proceeds from sale of shares | 373,404,129 | 14,409,884 | 38,396,223 | |||||||||
Net asset value of shares issued to shareholders in reinvestment of dividends and distributions | 832,013 | 166,250 | 531,022 | |||||||||
Cost of shares redeemed | (101,825,492 | ) | (28,897,831 | ) | (60,159,882 | ) | ||||||
|
| |||||||||||
Increase (decrease) in net assets derived from capital share transactions | 272,410,650 | (14,321,697 | ) | (21,232,637 | ) | |||||||
|
| |||||||||||
Net increase (decrease) in net assets | 273,714,354 | (14,353,854 | ) | (21,619,132 | ) | |||||||
| 2016 | 2015 (a) | 2014 | ||||||||||
| Net Assets | ||||||||||||
Beginning of period | $ | 53,085,372 | $ | 67,439,226 | $ | 89,058,358 | ||||||
|
| |||||||||||
End of period | $ | 326,799,726 | $ | 53,085,372 | $ | 67,439,226 | ||||||
|
| |||||||||||
Distributions in excess of net investment income at end of period | $ | (8,218 | ) | $ | (580 | ) | $ | (1,962 | ) | |||
|
| |||||||||||
| (a) | The Fund changed its fiscal year end from October 31 to April 30. |
| 26 | MainStay Tax Advantaged Short Term Bond Fund | The notes to the financial statements are an integral part of, and should be read in conjunction with, the financial statements. |
Financial Highlights selected per share data and ratios
| Year ended April 30, | November 1, 2014 through April 30, | Year ended October 31, | ||||||||||||||||||||||
| Class A | 2016 | 2015*** | 2014 | 2013 | 2012 | 2011 | ||||||||||||||||||
Net asset value at beginning of period | $ | 9.54 | $ | 9.54 | $ | 9.59 | $ | 9.68 | $ | 9.69 | $ | 9.78 | ||||||||||||
|
|
|
|
|
|
|
|
|
|
|
| |||||||||||||
Net investment income (loss) (a) | 0.07 | 0.01 | 0.04 | 0.05 | 0.09 | 0.11 | ||||||||||||||||||
Net realized and unrealized gain (loss) on investments | 0.06 | 0.01 | (0.03 | ) | (0.05 | ) | 0.02 | (0.06 | ) | |||||||||||||||
|
|
|
|
|
|
|
|
|
|
|
| |||||||||||||
Total from investment operations | 0.13 | 0.02 | 0.01 | — | 0.11 | 0.05 | ||||||||||||||||||
|
|
|
|
|
|
|
|
|
|
|
| |||||||||||||
| Less dividends and distributions: | ||||||||||||||||||||||||
From net investment income | (0.06 | ) | (0.01 | ) | (0.04 | ) | (0.05 | ) | (0.08 | ) | (0.12 | ) | ||||||||||||
From net realized gain on investments | — | (0.01 | ) | (0.02 | ) | (0.04 | ) | (0.04 | ) | (0.02 | ) | |||||||||||||
|
|
|
|
|
|
|
|
|
|
|
| |||||||||||||
Total dividends and distributions | (0.06 | ) | (0.02 | ) | (0.06 | ) | (0.09 | ) | (0.12 | ) | (0.14 | ) | ||||||||||||
|
|
|
|
|
|
|
|
|
|
|
| |||||||||||||
Net asset value at end of period | $ | 9.61 | $ | 9.54 | $ | 9.54 | $ | 9.59 | $ | 9.68 | $ | 9.69 | ||||||||||||
|
|
|
|
|
|
|
|
|
|
|
| |||||||||||||
Total investment return (b) | 1.41 | % | 0.27 | %(c) | 0.09 | % | 0.04 | % | 1.13 | % | 0.53 | % | ||||||||||||
| Ratios (to average net assets)/Supplemental Data: | ||||||||||||||||||||||||
Net investment income (loss) | 0.69 | % | 0.33 | %†† | 0.41 | % | 0.57 | % | 0.77 | % | 1.23 | % | ||||||||||||
Net expenses | 0.80 | % | 0.86 | %†† | 0.86 | % | 0.88 | % | 0.93 | % | 0.93 | % | ||||||||||||
Expenses (before waiver/reimbursement) | 0.94 | % | 1.24 | %†† | 1.07 | % | 1.13 | % | 1.10 | % | 1.15 | % | ||||||||||||
Portfolio turnover rate | 66 | % | 7 | % | 30 | % | 67 | % | 60 | % | 39 | % | ||||||||||||
Net assets at end of period (in 000’s) | $ | 111,768 | $ | 18,908 | $ | 20,086 | $ | 24,657 | $ | 31,422 | $ | 31,689 | ||||||||||||
| †† | Annualized. |
| *** | The Fund changed its fiscal year end from October 31 to April 30. |
| (a) | Per share data based on average shares outstanding during the period. |
| (b) | Total investment return is calculated exclusive of sales charges and assumes the reinvestment of dividends and distributions. |
| (c) | Total investment return is not annualized. |
| Year ended April 30, | November 1, 2014 through April 30, | Year ended October 31, | ||||||||||||||||||||||
| Investor Class | 2016 | 2015*** | 2014 | 2013 | 2012 | 2011 | ||||||||||||||||||
Net asset value at beginning of period | $ | 9.56 | $ | 9.57 | $ | 9.61 | $ | 9.71 | $ | 9.72 | $ | 9.81 | ||||||||||||
|
|
|
|
|
|
|
|
|
|
|
| |||||||||||||
Net investment income (loss) (a) | 0.03 | (0.00 | )‡ | 0.01 | 0.02 | 0.04 | 0.08 | |||||||||||||||||
Net realized and unrealized gain (loss) on investments | 0.07 | 0.00 | ‡ | (0.02 | ) | (0.06 | ) | 0.03 | (0.06 | ) | ||||||||||||||
|
|
|
|
|
|
|
|
|
|
|
| |||||||||||||
Total from investment operations | 0.10 | 0.00 | ‡ | (0.01 | ) | (0.04 | ) | 0.07 | 0.02 | |||||||||||||||
|
|
|
|
|
|
|
|
|
|
|
| |||||||||||||
| Less dividends and distributions: | ||||||||||||||||||||||||
From net investment income | (0.02 | ) | (0.00 | )‡ | (0.01 | ) | (0.02 | ) | (0.04 | ) | (0.09 | ) | ||||||||||||
From net realized gain on investments | — | (0.01 | ) | (0.02 | ) | (0.04 | ) | (0.04 | ) | (0.02 | ) | |||||||||||||
|
|
|
|
|
|
|
|
|
|
|
| |||||||||||||
Total dividends and distributions | (0.02 | ) | (0.01 | ) | (0.03 | ) | (0.06 | ) | (0.08 | ) | (0.11 | ) | ||||||||||||
|
|
|
|
|
|
|
|
|
|
|
| |||||||||||||
Net asset value at end of period | $ | 9.64 | $ | 9.56 | $ | 9.57 | $ | 9.61 | $ | 9.71 | $ | 9.72 | ||||||||||||
|
|
|
|
|
|
|
|
|
|
|
| |||||||||||||
Total investment return (b) | 1.06 | % | 0.02 | %(c) | (0.15 | %) | (0.41 | %) | 0.79 | % | 0.13 | % | ||||||||||||
| Ratios (to average net assets)/Supplemental Data: | ||||||||||||||||||||||||
Net investment income (loss) | 0.30 | % | (0.03 | %)†† | 0.02 | % | 0.22 | % | 0.44 | % | 0.83 | % | ||||||||||||
Net expenses | 1.20 | % | 1.22 | % †† | 1.24 | % | 1.23 | % | 1.27 | % | 1.33 | % | ||||||||||||
Expenses (before waiver/reimbursement) | 1.33 | % | 1.60 | % †† | 1.45 | % | 1.47 | % | 1.44 | % | 1.55 | % | ||||||||||||
Portfolio turnover rate | 66 | % | 7 | % | 30 | % | 67 | % | 60 | % | 39 | % | ||||||||||||
Net assets at end of period (in 000’s) | $ | 3,663 | $ | 3,552 | $ | 3,844 | $ | 3,965 | $ | 4,356 | $ | 4,128 | ||||||||||||
| †† | Annualized. |
| ‡ | Less than one cent per share. |
| *** | The Fund changed its fiscal year end from October 31 to April 30. |
| (a) | Per share data based on average shares outstanding during the period. |
| (b) | Total investment return is calculated exclusive of sales charges and assumes the reinvestment of dividends and distributions. |
| (c) | Total investment return is not annualized. |
| The notes to the financial statements are an integral part of, and should be read in conjunction with, the financial statements. | 27 |
Financial Highlights selected per share data and ratios
| Year ended April 30, | November 1, 2014 through April 30, | Year ended October 31, | ||||||||||||||||||||||
| Class I | 2016 | 2015*** | 2014 | 2013 | 2012 | 2011 | ||||||||||||||||||
Net asset value at beginning of period | $ | 9.54 | $ | 9.54 | $ | 9.58 | $ | 9.68 | $ | 9.69 | $ | 9.78 | ||||||||||||
|
|
|
|
|
|
|
|
|
|
|
| |||||||||||||
Net investment income (loss) (a) | 0.09 | 0.03 | 0.05 | 0.08 | 0.10 | 0.14 | ||||||||||||||||||
Net realized and unrealized gain (loss) on investments | 0.07 | 0.01 | (0.01 | ) | (0.06 | ) | 0.03 | (0.06 | ) | |||||||||||||||
|
|
|
|
|
|
|
|
|
|
|
| |||||||||||||
Total from investment operations | 0.16 | 0.04 | 0.04 | 0.02 | 0.13 | 0.08 | ||||||||||||||||||
|
|
|
|
|
|
|
|
|
|
|
| |||||||||||||
| Less dividends and distributions: | ||||||||||||||||||||||||
From net investment income | (0.09 | ) | (0.03 | ) | (0.06 | ) | (0.08 | ) | (0.10 | ) | (0.15 | ) | ||||||||||||
From net realized gain on investments | — | (0.01 | ) | (0.02 | ) | (0.04 | ) | (0.04 | ) | (0.02 | ) | |||||||||||||
|
|
|
|
|
|
|
|
|
|
|
| |||||||||||||
Total dividends and distributions | (0.09 | ) | (0.04 | ) | (0.08 | ) | (0.12 | ) | (0.14 | ) | (0.17 | ) | ||||||||||||
|
|
|
|
|
|
|
|
|
|
|
| |||||||||||||
Net asset value at end of period | $ | 9.61 | $ | 9.54 | $ | 9.54 | $ | 9.58 | $ | 9.68 | $ | 9.69 | ||||||||||||
|
|
|
|
|
|
|
|
|
|
|
| |||||||||||||
Total investment return (b) | 1.66 | % | 0.40 | %(c) | 0.45 | % | 0.19 | % | 1.39 | % | 0.78 | % | ||||||||||||
| Ratios (to average net assets)/Supplemental Data: | ||||||||||||||||||||||||
Net investment income (loss) | 0.93 | % | 0.56 | %†† | 0.66 | % | 0.79 | % | 1.03 | % | 1.48 | % | ||||||||||||
Net expenses | 0.55 | % | 0.61 | %†† | 0.61 | % | 0.63 | % | 0.68 | % | 0.68 | % | ||||||||||||
Expenses (before waiver/reimbursement) | 0.68 | % | 0.99 | %†† | 0.82 | % | 0.88 | % | 0.85 | % | 0.90 | % | ||||||||||||
Portfolio turnover rate | 66 | % | 7 | % | 30 | % | 67 | % | 60 | % | 39 | % | ||||||||||||
Net assets at end of period (in 000’s) | $ | 211,369 | $ | 30,626 | $ | 43,509 | $ | 60,437 | $ | 51,509 | $ | 48,193 | ||||||||||||
| †† | Annualized. |
| *** | The Fund changed its fiscal year end from October 31 to April 30. |
| (a) | Per share data based on average shares outstanding during the period. |
| (b) | Total investment return is calculated exclusive of sales charges and assumes the reinvestment of dividends and distributions. Class I shares are not subject to sales charges. |
| (c) | Total investment return is not annualized. |
| 28 | MainStay Tax Advantaged Short Term Bond Fund | The notes to the financial statements are an integral part of, and should be read in conjunction with, the financial statements. |
Note 1–Organization and Business
MainStay Funds Trust (the “Trust”) was organized as a Delaware statutory trust on April 28, 2009, and is governed by a Declaration of Trust. The Trust is registered under the Investment Company Act of 1940, as amended (the “1940 Act”), as an open-end management investment company, and is comprised of thirty-eight funds (collectively referred to as the “Funds”). These financial statements and notes relate to the MainStay Tax Advantaged Short Term Bond Fund (formerly known as MainStay Short Term Bond Fund (the “Fund”), a “diversified” fund, as that term is defined in the 1940 Act, as interpreted or modified by regulatory authorities having jurisdiction, from time to time.
At meetings held on March 24-26, 2015, the Board (as defined below) approved changes to the Fund’s name (from MainStay Short Term Bond Fund to MainStay Tax Advantaged Short Term Bond Fund), investment objective, primary benchmark, portfolio management team, principal investment strategies, management fee and certain other characteristics of the Fund effective June 1, 2015. For more information regarding these changes, please see the supplement to the Fund’s registration statement dated March 27, 2015. Effective April 30, 2015, the Fund changed its fiscal and tax year end from October 31 to April 30.
The Fund currently offers three classes of shares. Class I shares commenced operations on January 2, 1991. Class A shares commenced operations on January 2, 2004. Investor Class shares commenced operations on February 28, 2008. Class A and Investor Class shares are offered at net asset value (“NAV”) per share plus an initial sales charge. No sales charge applies to investments of $250,000 or more (and certain other qualified purchases) in Class A and Investor Class shares, but a contingent deferred sales charge (“CDSC”) is imposed on certain redemptions of such shares made within one year of the date of purchase. Class I shares are offered at NAV and are not subject to a sales charge. Depending upon eligibility, Class A shares may convert to Investor Class shares and Investor Class shares may convert to Class A shares. The three classes of shares have the same voting (except for issues that relate solely to one class), dividend, liquidation and other rights, and the same terms and conditions, except that Class A and Investor Class shares are subject to a distribution and/or service fee under a distribution plan pursuant to Rule 12b-1 of the 1940 Act. Class I shares are not subject to a distribution and/or service fee.
The Fund’s investment objective is to seek after tax total return.
Note 2–Significant Accounting Policies
The Fund is an investment company and accordingly follows the investment company accounting and reporting guidance of the Financial Accounting Standards Board (“FASB”) Accounting Standard Codification Topic 946 Financial Services—Investment Companies. The Fund prepares its financial statements in accordance with generally accepted accounting principles (“GAAP”) in the United States of America and follows the significant accounting policies described below.
(A) Securities Valuation. Investments are usually valued as of the close of regular trading on the New York Stock Exchange (the “Exchange”) (generally 4:00 p.m. Eastern time) on each day the Fund is open for business (“valuation date”).
The Board of Trustees (the “Board”) adopted procedures establishing methodologies for the valuation of the Fund’s securities and other assets and delegated the responsibility for valuation determinations under those procedures to the Valuation Committee of the Trust (the “Valuation Committee”). The Board authorized the Valuation Committee to appoint a Valuation Sub-Committee (the “Sub-Committee”) to deal in the first instance with establishing the prices of securities for which market quotations are not readily available or the prices of which are not otherwise readily determinable under these procedures. The Sub-Committee meets (in person, via electronic mail or via teleconference) on an as-needed basis. Subsequently, the Valuation Committee meets to ensure that actions taken by the Sub-Committee were appropriate. The procedures recognize that, subject to the oversight of the Board and unless otherwise noted, the responsibility for the day-to-day valuation of portfolio assets (including fair value measurements for the Fund’s assets and liabilities) rests with New York Life Investment Management LLC (“New York Life Investments” or the “Manager”), aided to whatever extent necessary by the Subadvisor (as defined in Note 3(A)) to the Fund.
To assess the appropriateness of security valuations, the Manager, Subadvisor or the Fund’s third party service provider, who is subject to oversight by the Manager, regularly compares prior day prices, prices on comparable securities, and the sale prices to the prior and current day prices and challenges prices with changes exceeding certain tolerance levels with third party pricing services or broker sources. For those securities valued through either a standardized fair valuation methodology or a fair valuation measurement, the Sub-Committee deals in the first instance with such valuation and the Valuation Committee reviews and affirms, if appropriate, the reasonableness of the valuation based on such methodologies and measurements on a regular basis after considering all relevant information that is reasonably available. Any action taken by the Sub-Committee with respect to the valuation of a portfolio security on other asset is submitted by the Valuation Committee to the Board for its review and ratification, if appropriate, at its next regularly scheduled meeting.
“Fair value” is defined as the price the Fund would receive upon selling an asset or liability in an orderly transaction to an independent buyer in the principal or most advantageous market for the asset or liability. Fair value measurements are determined within a framework that establishes a three-tier hierarchy which maximizes the use of observable market data and minimizes the use of unobservable inputs to establish a classification of fair value measurements for disclosure purposes. “Inputs” refer broadly to the assumptions that market participants would use in pricing the asset or liability, including assumptions about risk, such as the risk inherent in a particular valuation technique used to measure fair value using a pricing model and/or the risk inherent in the inputs for the valuation technique. Inputs may be observable or unobservable. Observable inputs reflect the assumptions market participants would use in pricing the asset or liability based on market data obtained from sources independent of the Fund. Unobservable inputs reflect the Fund’s own assumptions about the assumptions market participants would use in pricing the asset or liability based on the information available. The inputs or methodology used for valuing assets or liabilities may not be an indication of the risks associated with inves-
| 29 |
Notes to Financial Statements (continued)
ting in those assets or liabilities. The three-tier hierarchy of inputs is summarized below.
| • | Level 1—quoted prices in active markets for an identical asset or liability |
| • | Level 2—other significant observable inputs (including quoted prices for a similar asset or liability in active markets, interest rates and yield curves, prepayment speeds, credit risk, etc.) |
| • | Level 3—significant unobservable inputs (including the Fund’s own assumptions about the assumptions that market participants would use in measuring fair value of an asset or liability) |
The level of an asset or liability within the fair value hierarchy is based on the lowest level of an input, both individually and in the aggregate, that is significant to the fair value measurement. As of April 30, 2016, the aggregate value by input level of the Fund’s assets and liabilities is included at the end of the Fund’s Portfolio of Investments.
The Fund may use third party vendor evaluations, whose prices may be derived from one or more of the following standard inputs, among others:
• Benchmark yields | • Reported trades | |
• Broker/dealer quotes | • Issuer spreads | |
• Two-sided markets | • Benchmark securities | |
• Bids/offers | • Reference data (corporate actions or material event notices) | |
• Industry and economic events | • Comparable bonds | |
• Equity and credit default swap curves | • Monthly payment information |
An asset or liability for which market values cannot be measured using the methodologies described above is valued by methods deemed reasonable in good faith by the Valuation Committee, following the procedures established by the Board, to represent fair value. Under these procedures, the Fund generally uses a market-based approach which may use related or comparable assets or liabilities, recent transactions, market multiples, book values, and other relevant information. The Fund may also use an income-based valuation approach in which the anticipated future cash flows of the asset or liability are discounted to calculate fair value. Discounts may also be applied due to the nature and/or duration of any restrictions on the disposition of the asset or liability. Fair value represents a good faith approximation of the value of a security. Fair value determinations involve the consideration of a number of subjective factors, an analysis of applicable facts and circumstances and the exercise of judgment. As a result, it is possible that the fair value for a security determined in good faith in accordance with the Fund’s valuation procedures may differ from valuations for the same security determined by other funds using their own valuation procedures. Although the Fund’s valuation procedures are designed to value a security at the price the Fund may reasonably expect to receive upon its sale in an orderly transaction, there can be no assurance that any fair value determination thereunder would, in fact, approximate the amount that the Fund would actually realize upon the sale of the security or the price at which the security would trade if a reliable market price were readily available. During the year ended April 30, 2016, there were no material changes to the fair value methodologies.
Equity and non-equity securities which may be valued in this manner include, but are not limited to: (i) a security for which trading has been halted or suspended; (ii) a debt security that has recently gone into default and for which there is not a current market quotation; (iii) a security of an issuer that has entered into a restructuring; (iv) a security that has been de-listed from a national exchange; (v) a security for which the market price is not readily available from a third party pricing source or, if so provided, does not, in the opinion of the Manager or Subadvisor reflect the security’s market value; (vi) a security subject to trading collars for which no or limited trading takes place; and (vii) a security whose principal market has been temporarily closed at a time when, under normal conditions, it would be open. Securities for which market quotations or observable inputs are not readily available are generally categorized as Level 3 in the hierarchy. As of April 30, 2016, there were no securities held by the Fund that were fair valued in such a manner.
Debt securities (other than convertible and municipal bonds) are valued at the evaluated bid prices (evaluated mean prices in the case of convertible and municipal bonds) supplied by a pricing agent or brokers selected by the Manager, in consultation with the Subadvisor. Those values reflect broker/dealer supplied prices and electronic data processing techniques, if the evaluated bid or mean prices are deemed by the Manager, in consultation with the Subadvisor, to be representative of market values, at the regular close of trading of the Exchange on each valuation date. Debt securities purchased on a delayed delivery basis are marked to market daily until settlement at the forward settlement date. Debt securities, including corporate bonds, U.S. government & federal agency bonds, municipal bonds, foreign bonds, convertible bonds, asset-backed securities and mortgage-backed securities are generally categorized as Level 2 in the hierarchy.
Investments in mutual funds, including money market funds, are valued at their respective NAVs as of the close of the Exchange on the valuation date. These securities are generally categorized as Level 1 in the hierarchy.
Temporary cash investments acquired in excess of 60 days to maturity at the time of purchase are valued using the latest bid prices or using valuations based on a matrix system (which considers such factors as security prices, yields, maturities, and ratings), both as furnished by independent pricing services. Other temporary cash investments which mature in 60 days or less at the time of purchase (“Short-Term Investments”) are valued using the amortized cost method of valuation, unless the use of such method would be inappropriate. The amortized cost method involves valuing a security at its cost on the date of purchase and thereafter assuming a constant amortization to maturity of the difference between such cost and the value on maturity date. Amortized cost approximates the current fair value of a security. These securities are generally categorized as Level 2 in the hierarchy.
The information above is not intended to reflect an exhaustive list of the methodologies that may be used to value portfolio investments. The valuation procedures permit the use of a variety of valuation methodologies in connection with valuing portfolio investments. The methodology used for a specific type of investment may vary based on the market data available or other considerations. The methodologies summarized above may not represent the specific means by which portfolio investments are valued on any particular business day.
| 30 | MainStay Tax Advantaged Short Term Bond Fund |
(B) Income Taxes. The Fund’s policy is to comply with the requirements of the Internal Revenue Code of 1986, as amended (the “Internal Revenue Code”), applicable to regulated investment companies and to distribute all of the taxable income to the shareholders of the Fund within the allowable time limits. Therefore, no federal, state and local income tax provisions are required.
Management evaluates the Fund’s tax positions to determine if the tax positions taken meet the minimum recognition threshold in connection with accounting for uncertainties in income tax positions taken or expected to be taken for the purposes of measuring and recognizing tax liabilities in the financial statements. Recognition of tax benefits of an uncertain tax position is permitted only to the extent the position is “more likely than not” to be sustained assuming examination by taxing authorities. Management has analyzed the Fund’s tax positions taken on federal, state and local income tax returns for all open tax years (for up to three tax years), and has concluded that no provisions for federal, state and local income tax are required in the Fund’s financial statements. The Fund’s federal, state and local income and federal excise tax returns for tax years for which the applicable statutes of limitations have not expired are subject to examination by the Internal Revenue Service and state and local departments of revenue.
(C) Dividends and Distributions to Shareholders. Dividends and distributions are recorded on the ex-dividend date. During the fiscal year ended April 30, 2016, the Fund paid dividends from net investment income, if any, at least monthly and distributions from net realized capital and currency gains, if any, at least annually. Dividends and distributions to shareholders are determined in accordance with federal income tax regulations and may differ from GAAP. Effective May 1, 2016, the Fund intends to declare dividends from net investment income, if any, daily and intends to pay them at least monthly and declares and pays distributions from net realized capital gains, if any, at least annually. Unless the shareholder elects otherwise, all dividends and distributions are reinvested in the same class of shares of the Fund, at NAV.
(D) Security Transactions and Investment Income. The Fund records security transactions on the trade date. Realized gains and losses on security transactions are determined using the identified cost method. Interest income is accrued as earned using the effective interest rate method and includes realized gains and losses from repayments of principal on mortgage-backed securities. Discounts and premiums on securities purchased, other than Short-Term Investments, for the Fund are accreted and amortized, respectively, on the effective interest rate method over the life of the respective securities or, in the case of a callable security, over the period to the first date of call. Discounts and premiums on Short-Term Investments are accreted and amortized, respectively, on the straight-line method. The straight-line method approximates the effective interest method for short-term investments. Income from payment-in-kind securities is recorded daily based on the effective interest method of accrual.
Investment income and realized and unrealized gains and losses on investments of the Fund are allocated to separate classes of shares pro rata based upon their relative net assets on the date the income is earned or realized and unrealized gains and losses are incurred.
The Fund may place a debt security on non-accrual status and reduce related interest income by ceasing current accruals and writing off
interest receivables when the collection of all or a portion of interest has become doubtful. A debt security is removed from non-accrual status when the issuer resumes interest payments or when collectability of interest is reasonably assured.
(E) Expenses. Expenses of the Trust are allocated to the individual Funds in proportion to the net assets of the respective Funds when the expenses are incurred, except where direct allocations of expenses can be made. Expenses (other than transfer agent expenses and fees incurred under the shareholder services plans and/or the distribution plans further discussed in Note 3(B)) are allocated to separate classes of shares pro rata based upon their relative net assets on the date the expenses are incurred. The expenses borne by the Fund, including those of related parties to the Fund, are shown in the Statement of Operations.
(F) Use of Estimates. In preparing financial statements in conformity with GAAP, management makes estimates and assumptions that affect the reported amounts and disclosures in the financial statements. Actual results could differ from those estimates.
(G) Repurchase Agreements. The Fund may enter into repurchase agreements to earn income. The Fund may enter into repurchase agreements only with financial institutions that are deemed by the Manager or Subadvisor to be creditworthy, pursuant to guidelines established by the Board. During the term of any repurchase agreement, the Manager or Subadvisor will continue to monitor the creditworthiness of the seller. Under the 1940 Act, repurchase agreements are considered to be collateralized loans by the Fund to the seller secured by the securities transferred to the Fund.
When the Fund enters into repurchase agreements, the Fund’s custodian takes possession of the collateral pledged for investments in the repurchase agreement. The underlying collateral is valued daily on a mark to market basis to determine if the value, including accrued interest, exceeds the repurchase price. In the event of the seller’s default on the obligation to repurchase, the Fund has the right to liquidate the collateral and apply the proceeds in satisfaction of the obligation. Under certain circumstances, such as in the event of default or bankruptcy by the counterparty to the agreement, realization and/or retention of the collateral may be subject to legal proceedings and possible realized loss to the Fund.
(H) Dollar Rolls. The Fund may enter into dollar roll transactions in which it sells mortgage-backed securities (“MBS”) from its portfolio to a counterparty from whom it simultaneously agrees to buy a similar security on a delayed delivery basis. The Fund generally transfers MBS where the MBS are “to be announced,” therefore, the Fund accounts for these transactions as purchases and sales. The securities sold in connection with the dollar rolls are removed from the portfolio and a realized gain or loss is recognized. The securities the Fund has agreed to acquire are included at market value in the Portfolio of Investments and liabilities for such purchase commitments are included as payables for investments purchased. During the roll period, the Fund foregoes principal and interest paid on the securities. The Fund is compensated by the difference between the current sales price and the forward price for the future as well as by the earnings on the cash proceeds of the initial sale. Dollar rolls may be renewed without physical delivery of the securities subject to the contract. The Fund maintains liquid assets from
| 31 |
Notes to Financial Statements (continued)
its portfolio having a value not less than the repurchase price, including accrued interest. Dollar roll transactions involve certain risks, including the risk that the security returned to the Fund at the end of the roll period, while substantially similar, could be inferior to what was initially sold to the counterparty.
The Fund accounts for a dollar roll transaction as a purchase and sale whereby the difference in the sales price and purchase price of the security sold is recorded as a realized gain (loss).
(I) Securities Lending. In order to realize additional income, the Fund may engage in securities lending, subject to the limitations set forth in the 1940 Act and relevant guidance by the staff of the Securities and Exchange Commission. In the event the Fund does engage in securities lending, the Fund will lend through its custodian, State Street Bank and Trust Company (“State Street”). State Street will manage the Fund’s cash collateral in accordance with the lending agreement between the Fund and State Street, and indemnify the Fund against counterparty risk. The loans will be collateralized by cash or securities at least equal at all times to the market value of the securities loaned. Collateral will consist of U.S. government securities, cash equivalents or irrevocable letters of credit. The Fund may bear the risk of delay in recovery of, or loss of rights in, the securities loaned should the borrower of the securities experience financial difficulty. The Fund may also record a realized gain or loss on securities deemed sold due to a borrower’s inability to return securities on loan. The Fund bears the risk of any loss on investment of the collateral. The Fund will receive compensation for lending its securities in the form of fees or it will retain a portion of interest on the investment of any cash received as collateral. The Fund will also continue to receive interest and dividends on the securities loaned and any gain or loss in the market price of the securities loaned that may occur during the term of the loan will be for the account of the Fund. During the year ended April 30, 2016, the Fund did not have any portfolio securities on loan.
(J) Concentration of Risk. The Fund may invest a substantial amount of its assets in municipal bonds whose interest is paid solely from revenues of similar projects. If the Fund concentrates its investments in this manner, it assumes the legal and economic risks relating to such projects and this may have a significant impact on the Fund’s investment performance. In addition, the Fund may invest more heavily in bonds from certain cities, states, territories or regions than others, which may increase the Fund’s exposure to losses resulting from economic, political, or regulatory occurrences impacting these particular cities, states, territories or regions. Certain of the issuers in which the Fund may invest have recently experienced, or may experience, significant financial difficulties and repeated credit rating downgrades. For example, in recent years, Puerto Rico has experienced difficult financial and economic conditions, which may negatively affect the value of the Fund’s holdings in Puerto Rico municipal securities. The Fund’s vulnerability to potential losses associated with such developments may be reduced through investing in municipal securities that feature credit enhancements (such as bond insurance).
(K) Indemnifications. Under the Trust’s organizational documents, its officers and trustees are indemnified against certain liabilities that may arise out of performance of their duties to the Trust. Additionally, in the normal course of business, the Fund enters into contracts with third-party service providers that contain a variety of representations and
warranties and which may provide general indemnifications. The Fund’s
maximum exposure under these arrangements is unknown, as this would involve future claims that may be made against the Fund that have not yet occurred. Based on experience, management is of the view that the risk of loss in connection with these potential indemnification obligations is remote. However, there can be no assurance that material liabilities related to such obligations will not arise in the future, which could adversely impact the Fund.
Note 3–Fees and Related Party Transactions
(A) Manager and Subadvisor. New York Life Investments, a registered investment adviser and an indirect, wholly-owned subsidiary of New York Life Insurance Company (“New York Life”), serves as the Fund’s Manager, pursuant to an Amended and Restated Management Agreement (“Management Agreement”). The Manager provides offices, conducts clerical, recordkeeping and bookkeeping services, and keeps most of the financial and accounting records required to be maintained by the Fund. Except for the portion of salaries and expenses that are the responsibility of the Fund, the Manager pays the salaries and expenses of all personnel affiliated with the Fund and certain operational expenses of the Fund. The Fund reimburses New York Life Investments in an amount equal to a portion of the compensation of the Chief Compliance Officer of the Fund. MacKay Shields LLC (“MacKay Shields” or the “Subadvisor”), a registered investment adviser and an indirect, wholly-owned subsidiary of New York Life, serves as Subadvisor to the Fund and is responsible for the day-to-day portfolio management of the Fund. Pursuant to the terms of a Subadvisory Agreement (“Subadvisory Agreement”) between New York Life Investments and MacKay Shields, New York Life Investments pays for the services of the Subadvisor.
Under the Management Agreement, which came into effect on June 1, 2015, the Fund pays the Manager a monthly fee for services performed and facilities furnished at an annual rate of the Fund’s average daily net assets as follows: 0.45% on all assets. Prior to June 1, 2015, the Fund paid the Manager a monthly fee at an annual rate of the Fund’s average daily net assets as follows: 0.50% up to $500 million and 0.475% on assets above $500 million. During the year ended April 30, 2016, the effective management fee rate (exclusive of any applicable waivers/reimbursements) was 0.45%.
Effective June 1, 2015, New York Life Investments has contractually agreed to waive fees and/or reimburse expenses so that Total Annual Fund Operating Expenses for Class A shares do not exceed 0.80% of its average daily net assets. New York Life Investments will apply an equivalent waiver or reimbursement, in an equal number of basis points, to the other share classes of the Fund. This agreement will remain in effect until August 29, 2017, and shall renew automatically for one-year terms unless New York Life Investments provides written notice of termination prior to the start of the next term or upon approval by the Board. Prior to June 1, 2015, New York Life Investments contractually agreed to waive fees and/or reimburse expenses so that Total Annual Fund Operating Expenses for Class A shares would not exceed 0.86% of its average daily net assets. Prior to June 1, 2015, New York Life Investments contractually agreed to apply an equivalent waiver or reimbursement, in an equal number of basis points, to the other share classes of the Fund. Total Annual Fund Operating Expenses excludes taxes, interest, litigation, extraordinary expenses, brokerage and other transaction expenses relating to the purchase or sale of portfolio investments, and acquired (underlying) fund fees and expenses.
| 32 | MainStay Tax Advantaged Short Term Bond Fund |
During the year ended April 30, 2016, New York Life Investments earned fees from the Fund in the amount of $568,695 and waived its fees and/or reimbursed expenses in the amount of $166,760.
State Street provides sub-administration and sub-accounting services to the Fund pursuant to an agreement with New York Life Investments. These services include calculating the daily NAVs of the Fund, maintaining the general ledger and sub-ledger accounts for the calculation of the Fund’s NAVs, and assisting New York Life Investments in conducting various aspects of the Fund’s administrative operations. For providing these services to the Fund, State Street is compensated by New York Life Investments.
(B) Distribution and Service Fees. The Trust, on behalf of the Fund, has entered into a distribution agreement with NYLIFE Distributors LLC (the “Distributor”), an indirect, wholly-owned subsidiary of New York Life. The Fund has adopted distribution plans (the “Plans”) in accordance with the provisions of Rule 12b-1 under the 1940 Act.
Pursuant to the Class A and Investor Class Plans, the Distributor receives a monthly distribution fee from the Class A and Investor Class shares at an annual rate of 0.25% of the average daily net assets of the Class A and Investor Class shares for distribution and/or service activities as designated by the Distributor. Class I shares are not subject to a distribution and/or service fee.
The Plans provide that the distribution and service fees are payable to the Distributor regardless of the amounts actually expended by the Distributor for distribution of the Fund’s shares and service activities.
(C) Sales Charges. During the year ended April 30, 2016, the Fund was advised by the Distributor that the amount of initial sales charges retained on sales of Class A and Investor Class shares were $573 and $84, respectively. During the year ended April 30, 2016, the Fund was also advised that the Distributor retained CDSCs on redemptions of Class A shares of $18,053.
(D) Transfer, Dividend Disbursing and Shareholder Servicing Agent. NYLIM Service Company LLC, an affiliate of New York Life Investments, is the Fund’s transfer, dividend disbursing and shareholder servicing agent pursuant to an agreement between NYLIM Service Company LLC and the Trust. NYLIM Service Company LLC has entered into an agreement with Boston Financial Data Services, Inc. (“BFDS”) pursuant to which BFDS performs certain transfer agent services on behalf of NYLIM Service Company LLC. During the year ended April 30, 2016, transfer agent expenses incurred by the Fund were as follows:
Class A | $ | 33,009 | ||
Investor Class | 16,567 | |||
Class I | 52,016 |
(E) Small Account Fee. Shareholders with small accounts adversely impact the cost of providing transfer agency services. In an effort to reduce total transfer agency expenses, the Fund has implemented a small account fee on certain types of accounts. Certain shareholders with an account balance of less than $1,000 are charged an annual per account fee of $20 (assessed semi-annually), the proceeds from which offset transfer agent fees as reflected in the Statement of Operations.
Note 4–Federal Income Tax
As of April 30, 2016, the components of accumulated gain (loss) on a tax basis were as follows:
Ordinary | Accumulated Other Gain (Loss) | Other Temporary Differences | Unrealized Appreciation (Depreciation) | Total Gain (Loss) | ||||||||||||
$57,343 | $ | 1,045 | $ | (31,583 | ) | $ | 1,489,055 | $ | 1,515,860 | |||||||
Other temporary differences are primarily due to dividends payable.
The Fund utilized $4,043 of capital loss carryforwards during the year ended April 30, 2016.
During the year ended April 30, 2016, the six-month period ended April 30, 2015 and the fiscal year ended October 31, 2014, the tax character of distributions paid as reflected in the Statements of Changes in Net Assets was as follows:
| 2016 | 2015 | 2014 | ||||||||||
Distributions paid from: | ||||||||||||
Exempt Interest Dividends | $ | 828,717 | $ | — | $ | — | ||||||
Ordinary Income | 210,477 | 128,626 | 436,880 | |||||||||
Long-Term Capital Gain | — | 73,383 | 160,992 | |||||||||
Total | $ | 1,039,194 | $ | 202,009 | $ | 597,872 | ||||||
Note 5–Custodian
State Street is the custodian of cash and securities held by the Fund. Custodial fees are charged to the Fund based on the Fund’s net assets and/or the market value of securities held by the Fund and the number of certain transactions incurred by the Fund.
Note 6–Line of Credit
The Fund and certain other funds managed by New York Life Investments, maintain a line of credit with a syndicate of banks in order to secure a source of funds for temporary purposes to meet unanticipated or excessive redemption requests.
Effective August 4, 2015, under an amended and restated credit agreement (the “Credit Agreement”), the aggregate commitment amount is $600,000,000 with an additional uncommitted amount of $100,000,000. The commitment fee is an annual rate of 0.10% of the average commitment amount payable quarterly, regardless of usage, to Bank of New York Mellon, who serves as the agent to the syndicate. The commitment fee is allocated among the Fund and certain affiliated funds based upon their respective net assets and other factors. Interest on any revolving credit loan is charged based upon the Federal Funds Advances Rate or the one month London InterBank Offered Rate, whichever is higher. The Credit Agreement expires on August 2, 2016, although the Fund, certain affiliated funds and the syndicate of banks may renew the Credit Agreement for an additional year on the same or different terms. Prior to August 4, 2015, the aggregate commitment amount was $600,000,000 with an additional uncommitted amount of $100,000,000, and the commitment fee was at an annual rate of 0.08% of the average commitment amount. During the year ended April 30, 2016, there were no borrowings made or outstanding with respect to the Fund under the Credit Agreement.
| 33 |
Notes to Financial Statements (continued)
Note 7–Purchases and Sales of Securities (in 000’s)
During the year ended April 30, 2016, purchases and sales of U.S. government securities were $0 and $21,562, respectively. Purchases and sales of securities, other than U.S. government securities and short-term securities, were $302,520 and $50,361, respectively.
The Fund may purchase securities from or sell to other portfolios managed by the respective Subadvisor. These interportfolio transactions are primarily used for cash management purposes and are made pursuant to Rule 17a-7 of the 1940 Act. During the year ended April 30, 2016, such purchases were $3,173.
Note 8–Capital Share Transactions
Class A | Shares | Amount | ||||||
Year ended April 30, 2016: | ||||||||
Shares sold | 13,492,231 | $ | 129,166,122 | |||||
Shares issued to shareholders in reinvestment of dividends and distributions | 25,281 | 242,068 | ||||||
Shares redeemed | (3,865,724 | ) | (37,026,844 | ) | ||||
|
|
|
| |||||
Net increase (decrease) in shares outstanding before conversion | 9,651,788 | 92,381,346 | ||||||
Shares converted into Class A (See Note 1) | 3,138 | 30,129 | ||||||
Shares converted from Class A (See Note 1) | (8,126 | ) | (77,960 | ) | ||||
|
|
|
| |||||
Net increase (decrease) | 9,646,800 | $ | 92,333,515 | |||||
|
|
|
| |||||
Six-month period ended April 30, 2015: | ||||||||
Shares sold | 364,606 | $ | 3,474,988 | |||||
Shares issued to shareholders in reinvestment of dividends and distributions | 5,246 | 49,994 | ||||||
Shares redeemed | (493,037 | ) | (4,700,369 | ) | ||||
|
|
|
| |||||
Net increase (decrease) in shares outstanding before conversion | (123,185 | ) | (1,175,387 | ) | ||||
Shares converted into Class A (See Note 1) | 5,740 | 54,683 | ||||||
Shares converted from Class A (See Note 1) | (5,876 | ) | (55,997 | ) | ||||
|
|
|
| |||||
Net increase (decrease) | (123,321 | ) | $ | (1,176,701 | ) | |||
|
|
|
| |||||
Year ended October 31, 2014: | ||||||||
Shares sold | 583,104 | $ | 5,571,685 | |||||
Shares issued to shareholders in reinvestment of dividends and distributions | 13,234 | 126,430 | ||||||
Shares redeemed | (1,051,168 | ) | (10,044,830 | ) | ||||
|
|
|
| |||||
Net increase (decrease) in shares outstanding before conversion | (454,830 | ) | (4,346,715 | ) | ||||
Shares converted into Class A (See Note 1) | 4,207 | 40,173 | ||||||
Shares converted from Class A (See Note 1) | (16,440 | ) | (156,765 | ) | ||||
|
|
|
| |||||
Net increase (decrease) | (467,063 | ) | $ | (4,463,307 | ) | |||
|
|
|
| |||||
Investor Class | Shares | Amount | ||||||
Year ended April 30, 2016: | ||||||||
Shares sold | 74,672 | $ | 716,213 | |||||
Shares issued to shareholders in reinvestment of dividends and distributions | 808 | 7,735 | ||||||
Shares redeemed | (71,857 | ) | (688,689 | ) | ||||
|
|
|
| |||||
Net increase (decrease) in shares outstanding before conversion | 3,623 | 35,259 | ||||||
Shares converted into Investor Class (See Note 1) | 8,109 | 77,960 | ||||||
Shares converted from Investor Class (See Note 1) | (3,132 | ) | (30,129 | ) | ||||
|
|
|
| |||||
Net increase (decrease) | 8,600 | $ | 83,090 | |||||
|
|
|
| |||||
Six-month period ended April 30, 2015: | ||||||||
Shares sold | 45,517 | $ | 434,847 | |||||
Shares issued to shareholders in reinvestment of dividends and distributions | 486 | 4,640 | ||||||
Shares redeemed | (76,560 | ) | (731,537 | ) | ||||
|
|
|
| |||||
Net increase (decrease) in shares outstanding before conversion | (30,557 | ) | (292,050 | ) | ||||
Shares converted into Investor Class (See Note 1) | 5,864 | 55,997 | ||||||
Shares converted from Investor Class (See Note 1) | (5,728 | ) | (54,683 | ) | ||||
|
|
|
| |||||
Net increase (decrease) | (30,421 | ) | $ | (290,736 | ) | |||
|
|
|
| |||||
Year ended October 31, 2014: | ||||||||
Shares sold | 62,070 | $ | 594,852 | |||||
Shares issued to shareholders in reinvestment of dividends and distributions | 1,094 | 10,488 | ||||||
Shares redeemed | (85,847 | ) | (822,654 | ) | ||||
|
|
|
| |||||
Net increase in shares outstanding before conversion | (22,683 | ) | (217,314 | ) | ||||
Shares converted into Investor Class (See Note 1) | 16,388 | 156,765 | ||||||
Shares converted from Investor Class (See Note 1) | (4,194 | ) | (40,173 | ) | ||||
|
|
|
| |||||
Net increase (decrease) | (10,489 | ) | $ | (100,722 | ) | |||
|
|
|
| |||||
Class I | Shares | Amount | ||||||
Year ended April 30, 2016: | ||||||||
Shares sold | 25,417,293 | $ | 243,521,794 | |||||
Shares issued to shareholders in reinvestment of dividends and distributions | 60,750 | 582,210 | ||||||
Shares redeemed | (6,694,004 | ) | (64,109,959 | ) | ||||
|
|
|
| |||||
Net increase (decrease) | 18,784,039 | $ | 179,994,045 | |||||
|
| |||||||
Six-month period ended April 30, 2015: | ||||||||
Shares sold | 1,101,344 | $ | 10,500,049 | |||||
Shares issued to shareholders in reinvestment of dividends and distributions | 11,710 | 111,616 | ||||||
Shares redeemed | (2,462,695 | ) | (23,465,925 | ) | ||||
|
|
|
| |||||
Net increase (decrease) | (1,349,641 | ) | $ | (12,854,260 | ) | |||
|
| |||||||
Year ended October 31, 2014: | ||||||||
Shares sold | 3,375,337 | $ | 32,229,686 | |||||
Shares issued to shareholders in reinvestment of dividends and distributions | 41,254 | 394,104 | ||||||
Shares redeemed | (5,162,502 | ) | (49,292,398 | ) | ||||
|
|
|
| |||||
Net increase (decrease) | (1,745,911 | ) | $ | (16,668,608 | ) | |||
|
| |||||||
| 34 | MainStay Tax Advantaged Short Term Bond Fund |
Note 9–Subsequent Events
In connection with the preparation of the financial statements of the Fund as of and for the fiscal year ended April 30, 2016, events and transactions subsequent to April 30, 2016, through the date the financial statements were issued have been evaluated by the Fund’s management for possible adjustment and/or disclosure. No subsequent events requiring financial statement adjustment or disclosure have been identified.
| 35 |
Report of Independent Registered Public Accounting Firm
The Board of Trustees and Shareholders of
MainStay Funds Trust:
We have audited the accompanying statement of assets and liabilities, including the portfolio of investments, of the MainStay Tax Advantaged Short Term Bond Fund (formerly, MainStay Short Term Bond Fund) (the “Fund”), one of the funds constituting MainStay Funds Trust, as of April 30, 2016, and the related statement of operations for the year then ended, the statements of changes in net assets for each of the years or periods in the three-year period then ended, and the financial highlights for each of the years or periods in the six-year period then ended. These financial statements and financial highlights are the responsibility of the Fund’s management. Our responsibility is to express an opinion on these financial statements and financial highlights based on our audits.
We conducted our audits in accordance with the standards of the Public Company Accounting Oversight Board (United States). Those standards require that we plan and perform the audit to obtain reasonable assurance about whether the financial statements and financial highlights are free of material misstatement. An audit includes examining, on a test basis, evidence supporting the amounts and disclosures in the financial statements. Our procedures included confirmation of securities owned as of April 30, 2016, by correspondence with the custodian and brokers or by other appropriate auditing procedures where replies from brokers were not received. An audit also includes assessing the accounting principles used and significant estimates made by management, as well as evaluating the overall financial statement presentation. We believe that our audits provide a reasonable basis for our opinion.
In our opinion, the financial statements and financial highlights referred to above present fairly, in all material respects, the financial position of the Fund as of April 30, 2016, the results of its operations for the year then, the changes in its net assets for each of the years or periods in the three-year period then ended, and the financial highlights for each of the years or periods in the six-year period then ended, in conformity with U.S. generally accepted accounting principles.

Philadelphia, Pennsylvania
June 29, 2016
| 36 | MainStay Tax Advantaged Short Term Bond Fund |
Board Consideration and Approval of Management Agreement and
Subadvisory Agreement (Unaudited)
Section 15 of the Investment Company Act of 1940, as amended (the “1940 Act”), requires that each mutual fund’s board of trustees annually review and approve the fund’s investment advisory agreement(s). At its December 8-10, 2015 meeting, the Board of Trustees of the MainStay Group of Funds (“Board”) unanimously approved the Management Agreement with respect to the MainStay Tax Advantaged Short Term Bond Fund (“Fund”) and New York Life Investment Management LLC (“New York Life Investments”) and the Subadvisory Agreement between New York Life Investments and MacKay Shields LLC (“MacKay Shields”) with respect to the Fund.
In reaching its decision to approve the Agreements, the Board considered information furnished by New York Life Investments and MacKay Shields in connection with a contract review process that took place at various meetings of the Board and its Contracts Committee between September 2015 and December 2015, as well as other relevant information furnished to the Board throughout the year. Information requested by and furnished to the Board in connection with the contract review process included, among other items, reports on the Fund and “peer funds” prepared by Strategic Insight Mutual Fund Research and Consulting, LLC (“Strategic Insight”), an independent third-party service provider engaged by the Board to report objectively on the Fund’s investment performance, management fee and total expenses. The Board also considered information on the fees charged to any other investment advisory clients of New York Life Investments and MacKay Shields (including institutional separate accounts) that follow investment strategies similar to the Fund and the rationale for any differences in the Fund’s management and subadvisory fees and the fees charged to those other investment advisory clients. In addition, the Board requested and received information on the profitability of the Fund to New York Life Investments and its affiliates, including MacKay Shields as subadvisor to the Fund, and responses from New York Life Investments and MacKay Shields to a series of questions encompassing a variety of topics prepared on behalf of the Board by independent legal counsel to the Board and its Trustees who are not “interested persons” (as such term is defined under the 1940 Act) of the Fund (the “Independent Trustees”). Information provided to the Board at its meetings throughout the year included, among other items, detailed investment performance reports on the Fund prepared by the Investment Consulting Group at New York Life Investments. The structure and format for this regular reporting were developed in consultation with the Board. The Board also received from New York Life Investments throughout the year, among other items, periodic reports on legal and compliance matters, risk management, portfolio turnover, and sales and marketing activity. At various meetings, the Independent Trustees also met in executive session with their independent legal counsel, and met with senior management of New York Life Investments without other representatives of New York Life Investments present.
Throughout the year and specifically in connection with its June meeting each year, the Board also received an overview of the Fund’s distribution arrangements. In addition, the Board received information regarding the Fund’s asset levels, share purchase and redemption activity and the payment of Rule 12b-1 distribution and service fees by the Fund. New York Life Investments also provided the Board with information regarding the revenue sharing payments made to intermediaries that promote the sale, distribution, and/or servicing of Fund shares.
In considering the Agreements, the Trustees comprehensively reviewed and evaluated all of the information and factors they believed to be relevant and appropriate in light of legal advice furnished to them by independent legal counsel and through the exercise of their own business judgment. The broad factors considered by the Board are described in greater detail below and included, among other items: (i) the nature, scope and quality of the services provided to the Fund by New York Life Investments and MacKay Shields; (ii) the investment performance of the Fund, New York Life Investments and MacKay Shields; (iii) the costs of the services provided, and profits realized, by New York Life Investments and MacKay Shields from their relationship with the Fund; (iv) the extent to which economies of scale have been realized or may be realized if the Fund grows and the extent to which economies of scale have benefited or may benefit Fund shareholders; and (v) the reasonableness of the Fund’s management and subadvisory fees and overall total ordinary operating expenses, particularly as compared to any similar funds and accounts managed by New York Life Investments and MacKay Shields. The Board also considered the reasonableness of the Fund’s management fee and overall total ordinary operating expenses as compared to the peer funds identified by Strategic Insight.
While individual Trustees may have weighed certain factors or information differently, the Board’s decision to approve the Agreements was based on a consideration of the information provided to the Trustees throughout the year, as well as information furnished specifically in connection with the contract review process. The Board’s conclusions with respect to the Agreements may have been based, in part, on the Board’s consideration of the MainStay Group of Funds’ advisory agreements in prior years. In addition to considering the above-referenced factors, the Board observed that in the marketplace there are a range of investment options available to shareholders of the Fund and that the Fund’s shareholders, having had the opportunity to consider other investment options, have chosen to invest in the Fund. The factors that figured prominently in the Board’s decision to approve the Agreements are summarized in more detail below.
Nature, Scope and Quality of Services to Be Provided by New York Life Investments and MacKay Shields
The Board examined the nature, scope and quality of the services that New York Life Investments provides to the Fund. The Board evaluated New York Life Investments’ experience and capabilities in serving as manager of the Fund, noting that New York Life Investments manages other mutual funds, serves a variety of other investment advisory clients, including other pooled investment vehicles, and has experience with overseeing mutual fund service providers, including subadvisors. The Board considered the experience of senior personnel at New York Life Investments providing management and administrative services to the Fund as well as New York Life Investments’ reputation and financial condition. The Board also considered the full range of services that New York Life Investments supplies to the Fund under the terms of the Management Agreement, including: (i) fund accounting and on-going oversight services provided by New York Life Investments’ Fund Administration and Accounting Group; (ii) investment oversight and analytical services provided by New York Life Investments’ Investment Consulting Group; (iii) compliance services provided by the Fund’s Chief Compliance Officer as well as New York Life Investments’ Compliance
| 37 |
Board Consideration and Approval of Management Agreement and
Subadvisory Agreement (Unaudited) (continued)
Department, including oversight and implementation of the Fund’s compliance program; (iv) legal services provided by New York Life Investments’ Office of the General Counsel; and (v) risk management and portfolio trading oversight and analysis by compliance and investment personnel. Additional information about the non-advisory services provided by New York Life Investments is set forth in the Fund’s Management Agreement. The Board also considered New York Life Investments’ willingness to invest in personnel, infrastructure, technology, operational enhancements, cyber security, information security and shareholder privacy resources that benefit the Fund and noted that New York Life Investments is responsible for compensating the Fund’s officers. The Board also considered benefits to shareholders of being part of the MainStay Group of Funds, including the privilege of exchanging investments between the same class of shares without the imposition of a sales charge, as described more fully in the Fund’s prospectus.
The Board also examined the nature, scope and quality of the investment advisory services that MacKay Shields provides to the Fund. The Board evaluated MacKay Shields’ experience in serving as subadvisor to the Fund and managing other portfolios. It examined MacKay Shields’ track record and experience in providing investment advisory services, the experience of investment advisory, senior management and administrative personnel at MacKay Shields, and MacKay Shields’ overall legal and compliance environment. The Board further considered New York Life Investments’ policies, procedures and systems to reasonably assure compliance with applicable laws and regulations. In addition, the Board considered the policies and procedures in place with respect to matters that may involve conflicts of interest between the Fund’s investments and those of other accounts managed by MacKay Shields. The Board also reviewed MacKay Shields’ willingness to invest in personnel that benefit the Fund. In this regard, the Board considered the experience of the Fund’s portfolio managers, the number of accounts managed by the portfolio managers and the method for compensating portfolio managers.
Based on these considerations, the Board concluded, within the context of its overall determinations regarding the Agreements, that the Fund should continue to benefit from the nature, scope and quality of these services as a result of New York Life Investments’ and MacKay Shields’ experience, personnel, operations and resources.
Investment Performance
In evaluating the Fund’s investment performance, the Board considered investment performance results in light of the Fund’s investment objective, strategies and risks, as disclosed in the Fund’s prospectus. The Board particularly considered detailed investment reports on the Fund’s performance provided to the Board throughout the year by the Investment Consulting Group of New York Life Investments. These reports include, among other items, information on the Fund’s gross and net returns, the Fund’s investment performance relative to relevant investment categories and Fund benchmarks, the Fund’s risk-adjusted investment performance and the Fund’s investment performance as compared to peer funds, as appropriate, and in light of market conditions. The Board also considered information provided by Strategic Insight showing the investment performance of the Fund as compared to peer funds.
In considering the Fund’s investment performance, the Board focused principally on the Fund’s long-term performance track record. The Board also gave weight to its ongoing discussions with senior management at New York Life Investments concerning the Fund’s investment performance as well as discussions between the Fund’s portfolio managers and the Board’s Investment Committee that occur regularly, generally on an annual basis. In addition, the Board considered any specific actions that New York Life Investments or MacKay Shields had taken, or had agreed with the Board to take, to enhance Fund investment performance and the results of those actions. The Board considered the Fund’s underperformance relative to peers, but also acknowledged the recent changes to the Fund’s investment objective and investment strategies.
Based on these considerations, the Board concluded, within the context of its overall determinations regarding the Agreements, that the long-term investment performance of the Fund, along with ongoing efforts by New York Life Investments and MacKay Shields to enhance investment returns, supported a determination to approve the Agreements. The Fund discloses more information about investment performance in the Portfolio Management Discussion and Analysis, Investment and Performance Comparison and Financial Highlights sections of this Annual Report and in the Fund’s prospectus.
Costs of the Services Provided, and Profits Realized, by New York Life Investments and MacKay Shields
The Board considered the costs of the services provided by New York Life Investments and MacKay Shields under the Agreements and the profits realized by New York Life Investments and its affiliates, including MacKay Shields, due to their relationships with the Fund. Because MacKay Shields is an affiliate of New York Life Investments whose subadvisory fees are paid directly by New York Life Investments, the Board considered cost and profitability information for New York Life Investments and MacKay Shields in the aggregate.
In evaluating the costs of the services provided by New York Life Investments and MacKay Shields and profits realized by New York Life Investments and its affiliates, including MacKay Shields, the Board considered, among other factors, each party’s investments in personnel, systems, equipment and other resources necessary to manage the Fund, and that New York Life Investments is responsible for paying the subadvisory fees for the Fund. The Board acknowledged that New York Life Investments and MacKay Shields must be in a position to pay and retain experienced professional personnel to provide services to the Fund and that the ability to maintain a strong financial position is important in order for New York Life Investments and MacKay Shields to continue to provide high-quality services to the Fund. The Board also recognized that the Fund benefits from the allocation of certain fixed costs across the MainStay Group of Funds, among other benefits resulting from its relationship with New York Life Investments.
In addition, the Board acknowledged the difficulty in obtaining reliable comparative data about mutual fund managers’ profitability, since such information generally is not publicly available and may be impacted by numerous factors, including the structure of a fund manager’s organization, the types of funds it manages, the methodology used to allocate certain fixed costs to specific funds, and the manager’s capital
| 38 | MainStay Tax Advantaged Short Term Bond Fund |
structure and costs of capital. In connection with the annual fund profitability analysis that New York Life Investments presents to the Board, the Board in 2014 engaged Bobroff Consulting, Inc., an independent third-party consultant, to review the methods used to allocate costs to the MainStay Funds, and among individual Funds. As part of this engagement, the consultant analyzed: (i) the various New York Life Investments’ business units and affiliated Subadvisers that provide services to the MainStay Funds; (ii) how costs are allocated to the Fund and other funds managed by New York Life Investments, and to other lines of businesses; and (iii) how New York Life Investments’ cost allocation methods and profitability reports compare to industry practices. The Board noted that the independent consultant had concluded that New York Life Investments’ methods for allocating costs and procedures for estimating overall profitability of the funds in the MainStay Group of Funds, including the Fund, are reasonable, consistent with industry practice and likely to produce reasonable profitability estimates. While recognizing the difficulty in evaluating a manager’s profitability with respect to the Fund and noting that other profitability methodologies may also be reasonable, the Board concluded that the profitability methodology presented by New York Life Investments to the Board was reasonable in all material respects.
In considering the costs and profitability of the Fund, the Board also considered certain fall-out benefits that may be realized by New York Life Investments and its affiliates due to their relationships with the Fund.
The Board further considered that, in addition to fees earned by New York Life Investments for managing the Fund, New York Life Investments’ affiliates also earn revenues from serving the Fund in various other capacities, including as the Fund’s transfer agent and distributor. The Board observed that information about these other revenues, and their impact on the profitability of the Fund to New York Life Investments and its affiliates, was furnished to the Board as part of the 15(c) process. The Board noted that, although it assessed the overall profitability of the Fund to New York Life Investments and its affiliates as part of the contract review process, when considering the reasonableness of the fees to be paid to New York Life Investments and its affiliates under the Agreements, the Board considered the profitability of New York Life Investments’ relationship with the Fund on a pre-tax basis and without regard to distribution expenses.
After evaluating the information presented to the Board, the Board concluded, within the context of its overall determinations regarding the Agreements, that any profits realized by New York Life Investments and its affiliates, including MacKay Shields, due to their relationships with the Fund supported the Board’s decision to approve the Agreements.
Extent to Which Economies of Scale May Be Realized as the Fund Grows
The Board considered whether the Fund’s expense structure permits economies of scale to be shared with Fund investors. The Board also considered a report from New York Life Investments, prepared at the request of the Board, that addressed economies of scale in the mutual fund business generally, the changing economics of the mutual fund business and the various ways in which the benefits of economies of scale may be shared with the Fund and other funds in the MainStay
Group of Funds. While recognizing the difficulty of determining economies of scale with precision, the Board acknowledged that economies of scale may be shared with the Fund in a number of ways, including, for example, through the imposition of management fee breakpoints and by initially setting relatively low management fees. The Board reviewed information from New York Life Investments showing how the Fund’s management fee schedule compared to fee schedules of other funds and accounts managed by New York Life Investments. The Board also reviewed information from Strategic Insight showing how the Fund’s management fee schedule hypothetically would compare with fees paid for similar services by peer funds at varying asset levels. Additionally, the Board considered New York Life Investments’ assessment of the extent economies of scale existed for Funds that had experienced significant increases of assets during the year.
Based on this information, the Board concluded, within the context of its overall determinations regarding the Agreements, that the Fund’s expense structure appropriately reflects economies of scale for the benefit of Fund investors. The Board noted, however, that it would continue to evaluate the reasonableness of the Fund’s expense structure as the Fund grows over time.
Management and Subadvisory Fees and Total Ordinary Operating Expenses
The Board evaluated the reasonableness of the fees to be paid under the Agreements and the Fund’s expected total ordinary operating expenses. The Board primarily considered the reasonableness of the management fee paid by the Fund to New York Life Investments, because the fees paid to MacKay Shields are paid by New York Life Investments, not the Fund.
In assessing the reasonableness of the Fund’s fees and expenses, the Board primarily considered comparative data provided by Strategic Insight on the fees and expenses charged by similar mutual funds managed by other investment advisers. In addition, the Board considered information provided by New York Life Investments and MacKay Shields on fees charged to other investment advisory clients, including institutional separate accounts and other funds with similar investment objectives as the Fund. The Board particularly considered differences in the contractual management fee schedules of the retail MainStay Funds and similarly-managed MainStay VP Portfolios, taking into account New York Life Investments’ rationale for any differences in fee schedules. The Board also took into account explanations provided by New York Life Investments about the different scope of services provided to registered investment companies as compared with other investment advisory clients. Additionally, the Board considered the impact of any contractual breakpoints, voluntary waivers and expense limitation arrangements on the Fund’s net management fee and expenses. The Board also noted that New York Life Investments had reduced the Fund’s contractual management fee and made changes to its expense limitation arrangement in connection with the Fund’s repositioning effective June 1, 2015.
The Board noted that, outside of the Fund’s management fee and the fees charged under a share class’s Rule 12b-1 and/or shareholder services plans, a share class’s most significant “other expenses” are transfer agent fees. Transfer agent fees are charged to the Fund based
| 39 |
Board Consideration and Approval of Management Agreement and
Subadvisory Agreement (Unaudited) (continued)
on the number of shareholder accounts (a “per-account” fee) as compared with certain other fees (e.g., management fees), which are charged based on the Fund’s average net assets. The Board took into account information from New York Life Investments showing that the Fund’s transfer agent fee schedule is reasonable, including industry data demonstrating that the per-account fees that NYLIM Service Company LLC, the Fund’s transfer agent, charges the Fund are within the range of per-account fees charged by transfer agents to other mutual funds. In addition, the Board considered NYLIM Service Company LLC’s profitability in connection with the transfer agent services it provides to the Fund. The Board also noted information received from NYLIM Service Company LLC regarding the sub-transfer agency payments it made to intermediaries in connection with the services it provides to the Fund.
The Board considered that, because the Fund’s transfer agent fees are billed on a per-account basis, the impact of transfer agent fees on a share class’s expense ratio may be more significant in cases where the share class has a high number of accounts with limited assets (i.e., small accounts). The Board observed that transfer agent fees are a significant portion of total expenses of a number of funds in the MainStay Group of Funds. The impact of transfer agent fees on the expense ratios of these MainStay Funds tend to be greater than for other open-end retail funds, because the MainStay Group of Funds generally has a significant number of small accounts relative to competitor funds. The Board acknowledged the role that the MainStay Group of Funds historically has played in serving the investment needs of New York Life Insurance Company (“New York Life”) policyholders, who often maintain smaller account balances than other fund investors. The Board also recognized measures that it and New York Life Investments have taken in recent years to mitigate the effect of small accounts on the expense ratios of Fund share classes, including: (i) encouraging New York Life agents to consolidate multiple small accounts held by the same investor into one MainStay Asset Allocation Fund account; (ii) introducing Investor Class shares for certain MainStay Funds in early 2008 to consolidate smaller account investors; (iii) closing small accounts with balances below $250 in Investor Class shares or $750 in all other classes of shares; (iv) eliminating an exception with no minimum investment amount with respect to AutoInvest accounts with subsequent monthly purchases of $100; (v) since 2007, charging an annual $20.00 small account fee on certain accounts with balances below $1,000; and (vi) modifying the approach for billing transfer agent expenses to reduce the degree of subsidization by large accounts of smaller accounts. The Board also considered that NYLIM Service Company LLC had waived its cost of living adjustments in 2014, 2015 and 2016. In addition, the Board acknowledged New York Life Investments’ continued efforts to encourage intermediaries to consolidate small accounts in multiple Funds held by the same investor into a single Asset Allocation Fund account, if appropriate under the circumstances, in an effort to mitigate the effect of small accounts on the funds in the MainStay Group of Funds.
After considering all of the factors outlined above, the Board concluded that the Fund’s management and subadvisory fees and total ordinary operating expenses were within a range that is competitive and, within the context of the Board’s overall conclusions regarding the Agreements, support a conclusion that these fees and expenses are reasonable.
Conclusion
On the basis of the information and factors summarized above and the evaluation thereof, the Board as a whole, including the Independent Trustees who are not parties to the Agreements or “interested persons” of any such party voting separately, unanimously voted to approve the Agreements.
| 40 | MainStay Tax Advantaged Short Term Bond Fund |
Federal Income Tax Information
(Unaudited)
The Fund is required under the Internal Revenue Code to advise shareholders in a written statement as to the federal tax status of dividends paid by the Fund during such fiscal years.
For Federal individual income tax purposes, the Fund designated 79.7% of the ordinary income dividends paid during its fiscal year ended April 30, 2016 as attributable to interest income from Tax Exempt Municipal Bonds. Such dividends are currently exempt from Federal income taxes under Section 103(a) of the Internal Revenue Code.
In February 2017, shareholders will receive an IRS Form 1099-DIV or substitute Form 1099 which will show the federal tax status of the distributions received by shareholders in calendar year 2016. The amounts that will be reported on such 1099-DIV or substitute Form 1099 will be the amounts you are to use on your federal income tax return and will differ from the amounts which we must report for the Fund’s fiscal year ended April 30, 2016.
Proxy Voting Policies and Procedures and Proxy Voting Record
A description of the policies and procedures that New York Life Investments uses to vote proxies related to the Fund’s securities is available without charge, upon request, (i) by visiting the Fund’s website at mainstayinvestments.com; or (ii) on the SEC’s website at www.sec.gov.
The Fund is required to file with the SEC its proxy voting record for the 12-month period ending June 30 on Form N-PX. The Fund’s most recent Form N-PX or proxy voting record, once it is filed, will be available free of charge upon request (i) by calling 800-MAINSTAY (624-6782); (ii) by visiting the Fund’s website at mainstayinvestments.com; or (iii) on the SEC’s website at www.sec.gov.
Shareholder Reports and Quarterly Portfolio Disclosure
The Fund is required to file its complete schedule of portfolio holdings with the SEC for its first and third fiscal quarters on Form N-Q. The Fund’s Form N-Q will be available without charge on the SEC’s website at www.sec.gov or by calling MainStay Investments at 800-MAINSTAY (624-6782). You also can obtain and review copies of Form N-Q by visiting the SEC’s Public Reference Room in Washington, DC (information on the operation of the Public Reference Room may be obtained by calling 1-800-SEC-0330).
| 41 |
Board of Trustees and Officers (Unaudited)
The Board of Trustees oversees the MainStay Group of Funds, (which is comprised of Funds that are series of the MainStay Funds, MainStay Funds Trust, MainStay VP Funds Trust, Private Advisors Alternative Strategies Master Fund1, Private Advisors Alternative Strategies Fund1, and MainStay DefinedTerm Municipal Opportunities Fund) (collectively the “Fund Complex”), the Manager and, when applicable, the Subadvisor(s), and other service providers to the Fund Complex. Each Trustee serves until his or her successor is elected and qualified or until his or her resignation, death or removal. Under the Retirement Policy, a Trustee must tender his or her resignation by the end of the calendar
year during which he or she reaches the age of 75. Officers serve a term of one year and are elected annually by the Board of Trustees. Information pertaining to the Trustees and officers is set forth below. The Statement of Additional Information includes additional information about the Trustees and is available, without charge, upon request by calling toll-free 800-598-2019. The business address of each Trustee and officer listed below is 51 Madison Avenue, New York, New York 10010. A majority of the Trustees are not “interested persons” (as defined by the 1940 Act) of the Funds (“Independent Trustees”).
Name and Date of Birth | Term of Office, Position(s) Held and Length of Service | Principal Occupation(s) During Past Five Years | Number of Portfolios in Fund Complex Overseen by Board Member | Other Directorships Held By Board Member | ||||||||
| Interested Board Member* | Christopher O. Blunt* 5/13/61 | Indefinite; MainStay Funds Trust: Trustee since January 2016 | Executive Vice President (since 2009), President, Investments Group (since 2015), Member of the Executive Management Committee (since 2007), Co-President, Insurance and Agency Group (2012 to 2015), President, Insurance Group (2012 to 2014), Executive Vice President, Retirement Income Security (2008 to 2012), New York Life Insurance Company.
| 84 | MainStay VP Funds Trust: Trustee since January 2016 (31 portfolios); The MainStay Funds: Trustee since January 2016 (12 Funds); MainStay DefinedTerm Municipal Opportunities Fund: Trustee since January 2016; Private Advisors Alternative Strategies Master Fund: Trustee since January 2016; and Private Advisors Alternative Strategies Fund: Trustee since January 2016 |
| 1 | On June 3, 2016, the Private Advisors Alternative Strategies Master Fund and the Private Advisors Alternative Strategies Fund filed an application for deregistration on Form N-8F with the SEC. |
| * | This Trustee is considered to be an “interested person” of the MainStay Group of Funds within the meaning of the 1940 Act because of his affiliation with New York Life Insurance Company, New York Life Investment Management LLC, Cornerstone Capital Management Holdings LLC, Cornerstone Capital Management LLC, MacKay Shields LLC, Institutional Capital LLC, NYL Investors LLC, NYLIFE Securities LLC and/or NYLIFE Distributors LLC, as described in detail above in the column entitled “Principal Occupation(s) During Past Five Years.” John Y. Kim also served as a trustee during the period. (Mr. Kim, an interested trustee, resigned from the Board, effective December 31, 2015). Effective on December 31, 2015, the Board appointed Christopher O. Blunt to become an interested trustee. |
| 42 | MainStay Tax Advantaged Short Term Bond Fund |
Name and Date of Birth | Term of Office, Position(s) Held and Length of Service | Principal Occupation(s) During Past Five Years | Number of Portfolios in Fund Complex Overseen by Board Member | Other Directorships Held By Board Member | ||||||||
Non-Interested | David H. Chow 12/29/57 | Indefinite; MainStay Funds Trust: Trustee since January 2016; Advisory Board member (June 2015 to December 2015) | Member, Governing Council of the Independent Directors Council (since 2012); former President and Member of the Board, CFA Society of Stamford (since 2009); Member of the Board, Forward Management, LLC (2008 to 2015); Trustee, Berea College of Kentucky (since 2009); Founder and CEO, DanCourt Management, LLC (since 1999). | 84 | MainStay VP Funds Trust: Trustee since January 2016; Advisory Board Member (June 2015 to December 2015) (31 portfolios); The MainStay Funds: Trustee since January 2016; Advisory Board member since (June 2015 to December 2015) (12 Funds); MainStay DefinedTerm Municipal Opportunities Fund: Trustee since January 2016; Advisory Board Member (June 2015 to December 2015); Market Vectors ETF Trust: Independent Chairman of the Board of Trustees since 2008 and Trustee since 2006 (55 portfolios); Private Advisors Alternative Strategies Fund: Trustee since January 2016; Advisory Board Member (June 2015 to December 2015); and Private Advisors Alternative Strategies Master Fund: Trustee since January 2016 Advisory Board Member (June 2015 to December 2015); | |||||||
Susan B. Kerley 8/12/51 | Indefinite; MainStay Funds Trust: Trustee since 1990** | President, Strategic Management Advisors LLC (since 1990) | 84 | MainStay VP Funds Trust: Trustee since 2007*** (31 portfolios); The MainStay Funds: Trustee since 2007 (12 Funds); MainStay DefinedTerm Municipal Opportunities Fund: Trustee since 2011; Legg Mason Partners Funds: Trustee since 1991 (53 portfolios); Private Advisors Alternative Strategies Master Fund: Trustee since 2011; and Private Advisors Alternative Strategies Fund: Trustee since 2011; | ||||||||
Alan R. Latshaw 3/27/51 | Indefinite; MainStay Funds Trust: Trustee and Audit Committee Financial Expert since 2007** | Retired; Partner, Ernst & Young LLP (2002 to 2003); Partner, Arthur Andersen LLP (1989 to 2002); Consultant to the MainStay Funds Audit and Compliance Committee (2004 to 2006) | 84 | MainStay VP Funds Trust: Trustee and Audit Committee Financial Expert since 2007*** (31 portfolios); The MainStay Funds: Trustee and Audit Committee Financial Expert since 2006 (12 Funds); MainStay DefinedTerm Municipal Opportunities Fund: Trustee and Audit Committee Financial Expert since 2011; State Farm Associates Funds Trusts: Trustee since 2005 (4 portfolios); State Farm Mutual Fund Trust: Trustee since 2005 (15 portfolios); State Farm Variable Product Trust: Trustee since 2005 (9 portfolios); Private Advisors Alternative Strategies Master Fund: Trustee and Audit Committee Financial Expert since 2011; and Private Advisors Alternative Strategies Fund: Trustee and Audit Committee Financial Expert since 2011; | ||||||||
Peter Meenan 12/5/41 | Indefinite; MainStay Funds Trust: Chairman since 2013 and Trustee since 2002** | Retired; Independent Consultant (2004 to 2013); President and Chief Executive Officer, Babson—United, Inc. (financial services firm) (2000 to 2004); Independent Consultant (1999 to 2000); Head of Global Funds, Citicorp (1995 to 1999) | 84 | The MainStay Funds: Chairman since 2013 and Trustee since 2007 (12 Funds); MainStay VP Funds Trust: Chairman since 2013 and Trustee since 2007*** (31 portfolios); MainStay DefinedTerm Municipal Opportunities Fund: Chairman since 2013 and Trustee since 2011; Private Advisors Alternative Strategies Master Fund: Chairman since 2013 and Trustee since 2011; and Private Advisors Alternative Strategies Fund: Chairman since 2013 and Trustee since 2011; |
| 43 |
Name and Date of Birth | Term of Office, Position(s) Held and Length of Service | Principal Occupation(s) During Past Five Years | Number of Portfolios in Fund Complex Overseen by Board Member | Other Directorships Held By Board Member | ||||||||
Non-Interested | Richard H. Nolan, Jr. 11/16/46 | Indefinite; MainStay Funds Trust: Trustee since 2007** | Managing Director, ICC Capital Management (since 2004); President—Shields/Alliance, Alliance Capital Management (1994 to 2004) | 84 | MainStay VP Funds Trust: Trustee since 2006*** (31 portfolios); The MainStay Funds: Trustee since 2007 (12 Funds); MainStay DefinedTerm Municipal Opportunities Fund: Trustee since 2011; Private Advisors Alternative Strategies Master Fund: Trustee since 2011; and Private Advisors Alternative Strategies Fund: Trustee since 2011; | |||||||
Jacques P. Perold 5/12/58 | Indefinite; MainStay Funds Trust: Trustee since January 2016; Advisory Board member (June 2015 to December 2015) | Retired; Trustee, Boston University (since 2014); President, Fidelity Management & Research Company (2009 to 2014); Founder, President and Chief Executive Officer, Geode Capital Management, LLC (2001 to 2009). | 84 | MainStay VP Funds Trust: Trustee since January 2016; Advisory Board Member (June 2015 to December 2015) (31 portfolios); The MainStay Funds: Trustee since January 2016; Advisory Board member (June 2015 to December 2015) (12 Funds); MainStay DefinedTerm Municipal Opportunities Fund: Trustee since January 2016; Advisory Board Member since June 4, 2015; Private Advisors Alternative Strategies Fund: Trustee since January 2016; Advisory Board Member since (June 2015 to December 2015); and Private Advisors Alternative Strategies Master Fund: Trustee since January 2016; Advisory Board Member since (June 2015 to December 2015); | ||||||||
Richard S. Trutanic 2/13/52 | Indefinite; MainStay Funds Trust: Trustee since 2007** | Chairman and Chief Executive Officer, Somerset & Company (financial advisory firm) (since 2004); Managing Director, The Carlyle Group (private investment firm) (2002 to 2004); Senior Managing Director, Partner and Board Member, Groupe Arnault S.A. (private investment firm) (1999 to 2002) | 84 | MainStay VP Funds Trust: Trustee since 2007*** (31 portfolios); The MainStay Funds: Trustee since 1994 (12 Funds); MainStay DefinedTerm Municipal Opportunities Fund: Trustee since 2011; Private Advisors Alternative Strategies Master Fund: Trustee since 2011; and Private Advisors Alternative Strategies Fund: Trustee since 2011; | ||||||||
John A. Weisser 10/22/41 | Indefinite; MainStay Funds Trust: Trustee since 2007** | Retired; Managing Director of Salomon Brothers, Inc. (1971 to 1995) | 84 | MainStay VP Funds Trust: Trustee since 1997*** (31 portfolios); The MainStay Funds: Trustee since 2007 (12 Funds); MainStay DefinedTerm Municipal Opportunities Fund: Trustee since 2011; Direxion Insurance Trust: Trustee since 2007 (1 portfolio); Direxion Funds: Trustee since 2007 (18 portfolios); Direxion Shares ETF Trust: Trustee since 2008 (52 portfolios); Private Advisors Alternative Strategies Master Fund: Trustee since 2011; and Private Advisors Alternative Strategies Fund: Trustee since 2011; |
| ** | Includes prior service as a Director/Trustee of certain predecessor entities to MainStay Funds Trust. |
| *** | Includes prior service as a Director of MainStay VP Series Fund, Inc., the predecessor to MainStay VP Funds Trust. |
| **** | Roman L. Weil also served as a trustee during the period. Pursuant to the Board’s retirement policy, Mr. Weil, an independent trustee, retired on December 31, 2015. |
| 44 | MainStay Tax Advantaged Short Term Bond Fund |
Name and Date of Birth | Position(s) Held and Length of Service | Principal Occupation(s) During Past Five Years | ||||||
| Officers (Who Are Not Trustees)* | Stephen P. Fisher 2/22/59 | President; MainStay Funds Trust (since 2009) | Chairman and Chief Executive Officer (since 2014), President and Chief Operating Officer (2008 to 2013), NYLIFE Distributors LLC; Senior Managing Director (since 2012) and Chairman of the Board (since 2008), NYLIM Service Company LLC; Senior Managing Director (since 2005) and Co-President (since January 2014), New York Life Investment Management LLC; President, MainStay DefinedTerm Municipal Opportunities Fund (since 2011); Private Advisors Alternative Strategies Master Fund and Private Advisors Alternative Strategies Fund; and The MainStay Funds and MainStay VP Funds Trust (since 2007)**. | |||||
Jack R. Benintende 5/12/64 | Treasurer and Principal Financial and Accounting Officer, MainStay Funds Trust (since 2009) | Managing Director, New York Life Investment Management LLC (since 2007); Treasurer and Principal Financial and Accounting Officer, MainStay DefinedTerm Municipal Opportunities Fund; Private Advisors Alternative Strategies Master Fund and Private Advisors Alternative Strategies Fund; (since 2011) and The MainStay Funds and MainStay VP Funds Trust (since 2007)**; and Assistant Treasurer, New York Life Investment Management Holdings LLC (2008 to 2012). | ||||||
Kevin M. Bopp 2/24/69 | Vice President and Chief Compliance Officer, MainStay Funds Trust (since 2014) | Vice President and Chief Compliance Officer, The MainStay Funds, MainStay VP Funds Trust; MainStay DefinedTerm Municipal Opportunities Fund; Private Advisors Alternative Strategies Fund and Private Advisors Alternative Strategies Master Fund (since 2014); Director and Associate General Counsel (2011 to 2014) and Vice President and Assistant General Counsel (2010 to 2011), New York Life Investment Management LLC; Assistant Secretary, The MainStay Funds, MainStay Funds Trust and MainStay VP Funds Trust (2010 to 2014)**, Private Advisors Alternative Strategies Fund, Private Advisors Alternative Strategies Master Fund and MainStay DefinedTerm Municipal Opportunities Fund (2011 to 2014); Associate, Dechert LLP (2006 to 2010). | ||||||
J. Kevin Gao 10/13/67 | Secretary and Chief Legal Officer, MainStay Funds Trust (since 2010) | Managing Director and Associate General Counsel, New York Life Investment Management LLC (since 2010); Secretary and Chief Legal Officer, MainStay DefinedTerm Municipal Opportunities Fund; Private Advisors Alternative Strategies Master Fund and Private Advisors Alternative Strategies Fund (since 2011) and The MainStay Funds and MainStay Funds VP Trust (since 2010)**. | ||||||
Scott T. Harrington 2/8/59 | Vice President—Administration, MainStay Funds Trust (since 2009) | Director, New York Life Investment Management LLC (including predecessor advisory organizations) (since 2000); Member of the Board of Directors, New York Life Trust Company (since 2009); Vice President—Administration, MainStay DefinedTerm Municipal Opportunities Fund; Private Advisors Alternative Strategies Master Fund and Private Advisors Alternative Strategies Fund (since 2011), The MainStay Funds and MainStay VP Funds Trust (since 2005)**. |
| * | The Officers listed above are considered to be “interested persons” of the MainStay Group of Funds within the meaning of the 1940 Act because of their affiliation with the MainStay Group of Funds, New York Life Insurance Company, New York Life Investment Management LLC, New York Life Insurance Company, New York Life Investment Management LLC, NYLIFE Securities LLC and/or NYLIFE Distributors LLC, as described in detail in the column captioned “Principal Occupation(s) During Past Five Years.” Officers are elected annually by the Board of Trustees to serve a one year term. |
| ** | Includes prior service as an Officer of MainStay VP Series Fund, Inc., the predecessor to MainStay VP Funds Trust. |
| 45 |
This page intentionally left blank
MainStay Funds
MainStay offers a wide range of Funds for virtually any investment need. The full array of MainStay open-end offerings is listed here, with information about the manager, subadvisors, legal counsel and independent registered public accounting firms.
Equity
U.S. Equity
MainStay Common Stock Fund
MainStay Cornerstone Growth Fund
MainStay Epoch U.S. All Cap Fund
MainStay Epoch U.S. Equity Yield Fund
MainStay Epoch U.S. Small Cap Fund
MainStay ICAP Equity Fund
MainStay ICAP Select Equity Fund
MainStay Large Cap Growth Fund
MainStay MAP Fund
MainStay S&P 500 Index Fund
MainStay U.S. Equity Opportunities Fund
International/Global Equity
MainStay Emerging Markets Opportunities Fund
MainStay Epoch Global Choice Fund
MainStay Epoch Global Equity Yield Fund
MainStay Epoch International Small Cap Fund
MainStay ICAP International Fund
MainStay International Equity Fund
MainStay International Opportunities Fund
Income
Taxable Bond
MainStay Floating Rate Fund
MainStay Global High Income Fund
MainStay Government Fund
MainStay High Yield Corporate Bond Fund
MainStay High Yield Opportunities Fund
MainStay Indexed Bond Fund
MainStay Short Duration High Yield Fund
MainStay Total Return Bond Fund
MainStay Unconstrained Bond Fund
Municipal/Tax Advantaged Bond
MainStay California Tax Free Opportunities Fund1
MainStay High Yield Municipal Bond Fund
MainStay New York Tax Free Opportunities Fund2
MainStay Tax Advantaged Short Term Bond Fund
MainStay Tax Free Bond Fund
Money Market
MainStay Money Market Fund
Mixed Asset
MainStay Balanced Fund
MainStay Convertible Fund
MainStay Income Builder Fund
Alternative
MainStay Absolute Return Multi-Strategy Fund
MainStay Cushing Energy Income Fund
MainStay Cushing MLP Premier Fund
MainStay Cushing Renaissance Advantage Fund
Asset Allocation/Target Date
MainStay Conservative Allocation Fund
MainStay Growth Allocation Fund
MainStay Moderate Allocation Fund
MainStay Moderate Growth Allocation Fund
MainStay Retirement 2010 Fund
MainStay Retirement 2020 Fund
MainStay Retirement 2030 Fund
MainStay Retirement 2040 Fund
MainStay Retirement 2050 Fund
MainStay Retirement 2060 Fund
Manager
New York Life Investment Management LLC
New York, New York
Subadvisors
Candriam France S.A.S.3
Paris, France
Cornerstone Capital Management Holdings LLC3
New York, New York
Cornerstone Capital Management LLC3
Bloomington, Minnesota
Cushing Asset Management, LP
Dallas, Texas
Epoch Investment Partners, Inc.
New York, New York
Institutional Capital LLC3
Chicago, Illinois
MacKay Shields LLC3
New York, New York
Markston International LLC
White Plains, New York
NYL Investors LLC3
New York, New York
Winslow Capital Management LLC
Minneapolis, Minnesota
Legal Counsel
Dechert LLP
Independent Registered Public Accounting Firms
KPMG LLP
1. This Fund is only registered for sale in AZ, CA, NV, OR, UT, and WA.
2. This Fund is only registered for sale in CT, DE, FL, MA, NJ, NY, and VT.
3. An affiliate of New York Life Investment Management LLC.
Not part of the Annual Report
For more information
800-MAINSTAY (624-6782)
mainstayinvestments.com
MainStay Investments® is a registered service mark and name under which New York Life Investment Management LLC does business. MainStay Investments, an indirect subsidiary of New York Life Insurance Company, New York, NY 10010, provides investment advisory products and services. The MainStay Funds® are managed by New York Life Investment Management LLC and distributed through NYLIFE Distributors LLC, 30 Hudson Street, Jersey City, NJ 07302, a wholly owned subsidiary of New York Life Insurance Company. NYLIFE Distributors LLC is a Member FINRA/SIPC.
This report may be distributed only when preceded or accompanied by a current Fund prospectus.
©2016 NYLIFE Distributors LLC. All rights reserved.
| Not FDIC/NCUA Insured | Not a Deposit | May Lose Value | No Bank Guarantee | Not Insured by Any Government Agency |
| 1696572 MS164-16 | MSTAS11-06/16 (NYLIM) NL230 |
Item 2. Code of Ethics.
As of the end of the period covered by this report, the Registrant has adopted a code of ethics (the “Code”) that applies to the Registrant’s principal executive officer (“PEO”) and principal financial officer (“PFO”). A copy of the Code is filed herewith. The Registrant did not grant any waivers, including implicit waivers, from any provisions of the Code to the PEO or PFO during the period covered by this report.
Item 3. Audit Committee Financial Expert.
The Board of Trustees has determined that the Registrant has one audit committee financial expert serving on its Audit Committee. The Audit Committee financial expert is Alan R. Latshaw. Mr. Latshaw is “independent” as defined by Item 3 of Form N-CSR.
Item 4. Principal Accountant Fees and Services.
| (a) | Audit Fees |
The aggregate fees billed for the fiscal year ended April 30, 2016 for professional services rendered by KPMG LLP (“KPMG”) for the audit of the Registrant’s annual financial statements or services that are normally provided by KPMG in connection with statutory and regulatory filings or engagements for that fiscal year were $188,400.
The aggregate fees billed for the fiscal year ended April 30, 2015 for professional services rendered by KPMG LLP (“KPMG”) for the audit of the Registrant’s annual financial statements or services that are normally provided by KPMG in connection with statutory and regulatory filings or engagements for that fiscal year were $47,000.
| (b) | Audit-Related Fees |
The aggregate fees billed for assurance and related services by KPMG that are reasonably related to the performance of the audit of the Registrant’s financial statements and are not reported under paragraph (i) of this Item were $2,500 for the fiscal year ended April 30, 2016; and (ii) $0 for the fiscal year ended April 30, 2015. These audit-related services include review of financial highlights for Registrant’s registration statements and issuance of consents to use the auditor’s reports.
| (c) | Tax Fees |
The aggregate fees billed for professional services rendered by KPMG for tax compliance, tax advice, and tax planning were (i) $0 during the fiscal year ended April 30, 2016; and (ii) $0 during the fiscal year ended April 30, 2015. These services primarily included preparation of federal, state and local income tax returns and excise tax returns, as well as services relating to excise tax distribution requirements.
| (d) | All Other Fees |
The aggregate fees billed for products and services provided by KPMG, other than the services reported in paragraphs (a) through (c) of this Item were $0 during the fiscal year ended April 30, 2016; and $0 during the fiscal year ended April 30, 2015.
(e) Pre-Approval Policies and Procedures
| (1) | The Registrant’s Audit Committee has adopted pre-approval policies and procedures (the “Procedures”) to govern the Committee’s pre-approval of (i) all audit services and permissible non-audit services to be provided to the Registrant by its independent accountant, and (ii) all permissible non-audit services to be provided by such independent accountant to the Registrant’s investment adviser and to any entity controlling, controlled by or under common control with the investment adviser that provides ongoing services to the Registrant (collectively, the “Service Affiliates”) if the services directly relate to the Registrant’s operations and financial reporting. In accordance with the Procedures, the Audit Committee is responsible for the engagement of the independent accountant to certify the Registrant’s financial statements for each fiscal year. With respect to the pre-approval of non-audit services provided to the Registrant and its Service Affiliates, the Procedures provide that the Audit Committee may annually pre-approve a list of the types of services that may be provided to the Registrant or its Service Affiliates, or the Audit Committee may pre-approve such services on a project-by-project basis as they arise. Unless a type of service has received general pre-approval, it will require specific pre-approval by the Audit Committee if it is to be provided by the independent accountant. The Procedures also permit the Audit Committee to delegate authority to one or more of its members to pre-approve any proposed non-audit services that have not been previously pre-approved by the Audit Committee, subject to the ratification by the full Audit Committee no later than its next scheduled meeting. To date, the Audit Committee has not delegated such authority. |
| (2) | With respect to the services described in paragraphs (b) through (d) of this Item 4, no amount was approved by the Audit Committee pursuant to paragraph (c)(7)(i)(C) of Rule 2-01 of Regulation S-X. |
(f) There were no hours expended on KPMG’s engagement to audit the Registrant’s financial statements for the most recent fiscal year was attributable to work performed by persons other than KPMG’s full-time, permanent employees.
(g) All non-audit fees billed by KPMG for services rendered to the Registrant for the fiscal years ended April 30, 2016 and April 30, 2015 are disclosed in 4(b)-(d) above.
The aggregate non-audit fees billed by KPMG for services rendered to the Registrant’s investment adviser (not including any sub-adviser whose role is primarily portfolio management and is subcontracted with or overseen by another investment adviser), and any entity controlling, controlled by, or under common control with the adviser that provides ongoing services to the Registrant were approximately $0 for the fiscal year ended April 30, 2016; and $0 for the fiscal year ended April 30, 2015.
(h) The Registrant’s Audit Committee has determined that the non-audit services rendered by KPMG for the fiscal year ended April 30, 2016 to the Registrant’s investment adviser and any entity controlling, controlled by, or under common control with the Registrant’s investment adviser that provides ongoing services to the Registrant that were not required to be pre-approved by the Audit Committee because they did not relate directly to the operations and financial reporting of the registrant were compatible with maintaining the respective independence of KPMG during the relevant time period.
Item 5. Audit Committee of Listed Registrants
Not applicable.
| Item 6. | Schedule of Investments |
The Schedule of Investments is included as part of Item 1 of this report.
| Item 7. | Disclosure of Proxy Voting Policies and Procedures for Closed-End Management Investment Companies. |
Not applicable.
| Item 8. | Portfolio Managers of Closed-End Management Investment Companies. |
Not applicable.
| Item 9. | Purchases of Equity Securities by Closed-End Management Investment Company and Affiliated Purchasers. |
Not Applicable.
| Item 10. | Submission of Matters to a Vote of Security Holders. |
Since the Registrant’s last response to this Item, there have been no material changes to the procedures by which shareholders may recommend nominees to the Registrant’s Board of Trustees.
| Item 11. | Controls and Procedures. |
(a) Based on an evaluation of the Registrant’s Disclosure Controls and Procedures (as defined in Rule 30a-3(c) under the Investment Company Act of 1940) (the “Disclosure Controls”), as of a date within 90 days prior to the filing date (the “Filing Date”) of this Form N-CSR (the “Report”), the Registrant’s principal executive officer and principal financial officer have concluded that the Disclosure Controls are reasonably designed to ensure that information required to be disclosed by the Registrant in the Report is recorded, processed, summarized and reported by the Filing Date, including ensuring that information required to be disclosed in the Report is accumulated and communicated to the Registrant’s management, including the Registrant’s principal executive officer and principal financial officer, as appropriate to allow timely decisions regarding required disclosure.
(b) There were no changes in the Registrant’s internal control over financial reporting (as defined in Rule 30a-3(d)) under the Investment Company Act of 1940 that occurred during the second fiscal quarter of the period covered by this report that has materially affected, or is reasonably likely to materially affect, the Registrant’s internal control over financial reporting.
Item 12. Exhibits.
| (a)(1) | Code of Ethics | |
| (a)(2) | Certifications of principal executive officer and principal financial officer as required by Rule 30a-2 under the Investment Company Act of 1940. | |
| (b) | Certifications of principal executive officer and principal financial officer as required by Section 906 of the Sarbanes-Oxley Act of 2002. | |
SIGNATURES
Pursuant to the requirements of the Securities Exchange Act of 1934 and the Investment Company Act of 1940, the Registrant has duly caused this Report to be signed on its behalf by the undersigned, thereunto duly authorized.
MAINSTAY FUNDS TRUST
| By: | /s/ Stephen P. Fisher | |
Stephen P. Fisher President and Principal Executive Officer | ||
| Date: | July 8, 2016 | |
Pursuant to the requirements of the Securities Exchange Act of 1934 and the Investment Company Act of 1940, this Report has been signed below by the following persons on behalf of the Registrant and in the capacities and on the dates indicated.
| By: | /s/ Stephen P. Fisher | |
Stephen P. Fisher President and Principal Executive Officer | ||
| Date: | July 8, 2016 | |
| By: | /s/ Jack R. Benintende | |
Jack R. Benintende Treasurer and Principal Financial and Accounting Officer | ||
| Date: | July 8, 2016 | |
EXHIBIT INDEX
| (a)(1) | Code of Ethics | |
| (a)(2) | Certifications of principal executive officer and principal financial officer as required by Rule 30a-2 under the Investment Company Act of 1940. | |
| (b) | Certification of principal executive officer and principal financial officer as required by Section 906 of the Sarbanes-Oxley Act of 2002. | |