| OMB APPROVAL | ||||||
| OMB Number: 3235-0570 Expires: January 31, 2017 Estimated average burden hours per response. . ...20.6 |
UNITED STATES
SECURITIES AND EXCHANGE COMMISSION
Washington, D.C. 20549
Form N-CSR
CERTIFIED SHAREHOLDER REPORT OF REGISTERED MANAGEMENT
INVESTMENT COMPANIES
Investment Company Act File Number 811-22321
MAINSTAY FUNDS TRUST
(Exact name of Registrant as specified in charter)
51 Madison Avenue, New York, NY 10010
(Address of principal executive offices) (Zip code)
J. Kevin Gao, Esq.
169 Lackawanna Avenue
Parsippany, New Jersey 07054
(Name and address of agent for service)
Registrant’s telephone number, including area code: (212) 576-7000
Date of fiscal year end: November 30
(MainStay Cushing MLP Premier Fund, MainStay Cushing Renaissance Advantage Fund and MainStay Cushing Royalty Energy Income Fund only)
Date of reporting period: November 30, 2015
FORM N-CSR
The information presented in this Form N-CSR relates solely to the
MainStay Cushing MLP Premier Fund, MainStay Cushing Renaissance Advantage Fund and MainStay
Cushing Royalty Energy Income Fund, each a series of the Registrant.
Item 1. Reports to Stockholders.
MainStay Cushing® Funds
Message from the President, Cushing® Asset Management, LP,
Annual Report Commentary and Annual Report
November 30, 2015

MainStay Cushing® MLP Premier Fund
MainStay Cushing® Renaissance Advantage Fund
MainStay Cushing® Royalty Energy Income Fund

This page intentionally left blank
Message from the President
The 12-month period ended November 30, 2015, was marked by increased market volatility, particularly after the People’s Bank of China devalued the Chinese yuan on August 11, 2015. Following the devaluation, many stock markets around the world dropped substantially.
Energy stocks were particularly affected during the reporting period. Crude oil prices continued an extended decline, reaching several successive low points during the reporting period.
The Cushing Asset Management, LP, Annual Report Commentary that follows provides an overview of some of Cushing’s views on upstream, midstream and downstream energy companies and partnerships. This commentary seeks to help investors better understand the dynamics of the energy markets during the reporting period.
The following annual report provides more information on the specific market forces, securities and investment decisions that most affected your MainStay Cushing Fund(s) during the 12 months ended November 30, 2015.
We encourage you to carefully review this report and use it as you consider ways to pursue your personal financial goals and objectives.
Sincerely,

Stephen P. Fisher
President
The opinions expressed are as of the date of this report and are subject to change. There is no guarantee that any forecast made will come to pass. This material does not constitute investment advice and is not intended as an endorsement of any specific investment. Past performance is no guarantee of future results.
Not part of the Annual Report
Cushing Asset Management, LP, Annual Report Commentary
The one-year fiscal period ended November 30, 2015, proved to be challenging for energy-related equities. Weakness and volatility in crude oil prices appeared to be the main driver behind investor uncertainty during the year. Historically, global demand for crude oil has improved after previous downturns, and we believe that there were signs during the reporting period that the energy industry was taking steps to adapt during the corrective part of the cycle in anticipation of a future recovery. Crude oil prices appeared to be forming a bottom in early 2015, then rallied to over $60 per barrel in May and June, before finally declining to multi-year lows below $40 per barrel in the fourth quarter of 2015. We believe exploration and production (“E&P”) company management teams have reduced capital spending due to the precipitous drop in commodities much more quickly than in prior periods of falling prices. According to IHS Herold, E&P companies reduced their capital spending guidance for 2015 by 37% on average.1 The combination of spending cuts and steep production declines of shale reserves began impacting oil supplies towards the end of the period, as U.S. crude oil production declined month after month.2 In light of the 60% decline in the U.S. oil directed rig count since October 2014, the U.S. Energy Information Administration revised its most recent energy forecast and stated that it expects monthly U.S. production to generally decline through late 2016 before growth resumes.3
Midstream MLP Sector
For the period, the midstream energy space meaningfully underperformed the broader market and other energy-related indices. As measured by the Alerian MLP Index (AMZ), the performance of master limited partnerships (MLPs) declined 38.3%. To put that into greater perspective, prices of MLPs as of November 30, 2015 represented an astounding 44% decline since August of 2014, replicating the 44% peak-to-trough decline in 2008 from the global financial crisis.
We believe there were several negative catalysts currently working in unison. First, crude oil traded down to multi-year lows is an obvious headwind for the space (as of November 30, 2015, crude oil is priced at $42/bbl). Continued weakness in natural gas prices did not help matters either, as natural gas currently sits near $2/mmbtu. In addition to weak commodity prices, technical factors such as forced selling from closed-end funds due to leverage levels and even rumors of hedge funds targeting positions of leveraged closed-end funds (from the short side) exacerbated fundamental worries. Finally, credit and distribution reduction concerns all contributed to unprecedented weakness and volatility in the midstream MLP space.
Market weakness and price volatility impairs MLPs’ cost of capital, which in turn drives a negative feedback loop. Capital markets are of critical importance to MLPs, as they are typically
externally funded investment vehicles. In other words, the majority of cash flows earned from legacy assets are returned to unitholders in the form of distributions. Therefore, funding requirements for capital expenditures on growth projects are typically externally funded via the debt and equity capital markets. Even in a scenario where the underlying fundamentals of a business remain healthy, a “freezing” of the capital markets, or at least significantly higher debt and equity costs, can quickly lead to fundamental problems.
As of the end of the period, the midstream energy space as a whole was trading at deeply discounted valuations, regardless of the metric. Price to distributable cash flow (P/DCF) multiples, a common valuation tool for MLPs, and yield spreads were near levels experienced in late 2008, the darkest days of the great financial crisis. The vast majority of large cap MLPs were yielding 10-15%, levels we believe indicated the expectation for distribution cuts. The market appeared to be anticipating further distribution cuts, which is something we simply don’t see coming to fruition at this point. In fact, several management teams of MLPs reiterated the security of their current distribution rates, even in today’s market environment.
We believe the end of the 2015 calendar year will bring an end to several non-fundamental factors impacting the MLP market, such as tax harvesting and forced closed-end fund selling (i.e. year-end redemptions will likely be complete). Furthermore, January is historically an MLP distribution-paying month, and we believe short sellers in the space will be incrementally disposed to covering ahead of these expensive ex-dates (now significantly more expensive).
We believe a rally in prices for MLPs in 2016 and beyond will likely be largely dependent upon crude oil prices. While we believe crude oil prices will continue to face near-term headwinds (e.g. high inventory levels, relatively stable production volumes, etc.), we are incrementally more positive on prospects for a recovery in the second half of 2016. Crude oil production is a cyclical industry and we are monitoring for signs the balance between supply and demand is being restored. We are seeing encouraging signs on demand growth, and capital spending by E&P companies continues to be aggressively curtailed. Generally speaking, we believe sub-$40 per barrel oil prices are uneconomical across the globe. More importantly, we believe stabilization in crude oil prices will bring investor confidence back into the asset class. Referring back to the “negative feedback loop,” we mentioned above, many midstream MLPs continued to have little to no direct exposure to crude oil prices; however, negative energy sentiment damaged their ability to access reasonably priced capital, which is leading to the fundamental problems described above.
| 1. | “Outlook for Upstream Spending for U.S. E&Ps Continues to Drop.” IHS Herold. March 9, 2015. |
| 2. | “Natural Gas Gross Withdrawals and Production” Report. U.S. Energy Information Administration. October 30, 2015. |
| 3. | “Short-Term energy and Summer Fuels Outlook (STEO).” U.S. Energy Information Administration. October 2015. |
Not part of the Annual Report
In summary, we remain confident in our belief that the longer term outlook for the midstream MLP asset class is positive, but we acknowledge that volatility is likely to continue in the immediate near term. Almost all valuation metrics are significantly below long-term historical averages and sit at levels we find compelling.
Upstream Sector
Upstream MLPs and energy-related U.S. Royalty trusts, Canadian Royalty Trusts and Canadian E&P companies (collectively, “Energy Trusts”) as well as securities of other companies based in North America that are generally engaged in the same lines of business as those in which Energy Trusts and MLPs engage (“Other Energy Companies”) continued to suffer during the fiscal period due to the inherent sensitivity of these businesses to energy prices. Many were forced to reduce or suspend distributions in response to lower crude oil and natural gas liquids prices. As unit prices for Energy Trusts and Upstream MLPs fell, the total market capitalization of the subsector decreased significantly and business fundamentals for Energy Trusts and Upstream MLPs continued to deteriorate.
During the period, Energy Trusts and Upstream MLPs continued to underperform integrated energy companies and large capitalization E&P companies. The latter two sectors showed a high correlation to energy prices, and we believe companies in those sectors have relatively stronger fundamentals and growth prospects in this challenging energy price environment. These companies also generally have better leverage ratios as compared to Energy Trusts and Upstream MLPs in the current crude oil price environment and may offer better growth potential, as well as a potential price recovery in the event oil prices recover to higher levels if the global supply-demand balance improves in the coming quarters. Our deep “bottom-up” fundamental research seeks to assist us in identifying companies with strong fundamentals and attractive growth prospects in changing market conditions while seeking to manage portfolio risk.
It is difficult to predict where oil prices will be in the coming months. The swift and dramatic response by U.S. and Canadian energy producers to reduce capital expenditures by nearly 40% appeared to slow production growth in North America. Looking at the demand side of the issue, we have continued to see signs of demand growth globally as a result of lower overall energy prices. We believe both of these macro dynamics will continue to be supportive of higher crude oil prices in the long term.
In our view, management teams of Upstream MLPs and Energy Trusts and investors are beginning to appropriately recalibrate expectations related to lower commodity price assumptions. We also think energy investors will continue to remain cautious in this environment, as crude oil and energy equity prices remain volatile. We believe that the current environment continues to challenge the fundamentals of the Upstream MLP and Energy Trust business models, and we remain defensive on those sectors. By contrast, we see greater long-term opportunity in
integrated energy companies and large-capitalization E&P companies.
Although energy companies have been challenged by continued volatility within the energy sector and the fall in crude oil prices to say the least, we remain focused on the long-term fundamental attributes of the energy sector and the potential for attractive total returns based on current yield and growth potential. We remain confident that North American shale basins will be developed over time, albeit slower pace than previously projected.
We remain focused on the favorable long-term fundamental attributes of the broad upstream sector and the potential for attractive total returns based on current yield and expected distributions. We will continue to seek out stocks with attractive valuations and long-term growth opportunities, as well as those with near-term catalysts.
U.S. Energy Renaissance
During the reporting period, the U.S. Energy Renaissance continued to strengthen as the natural gas export theme and infrastructure build-out associated with the U.S. shale revolution moved forward. The beneficiaries of the Renaissance theme continued to be dynamic during the reporting period, shifting significantly with the dramatic decline in crude oil prices. Industries which may not have been as compelling in a high crude oil price environment became favorable at a West Texas Intermediate crude oil price of approximately $50-$60 per barrel.
The MainStay Cushing Renaissance Advantage Fund focuses on companies that we believe have multi-year growth embedded in their business models with appropriate capital structures, good free cash flow growth and higher return on invested capital relative to their peers. Our theses on such names were not a function of their quarterly performance but a function of their underlying business fundamentals. We are believers in the multi-year growth in the transportation sector, industrial companies benefiting from energy and industrial developments and materials companies benefiting from lower feedstock prices.
On the macro economic front, there was no dearth of macro headwinds globally during the period. Clearly, China took center stage with the emerging market stock market collapse and the negative data points coming out of the second largest economy of the world. The market was led to think that a hard landing in China was around the corner. As a result, some of the Renaissance strategy’s core themes, such as LNG (“Liquefied Natural Gas”) demand, were questioned by the market, as Asia is projected to be a significant contributor to LNG demand growth in the next decade. Additionally, with the decline in crude oil prices, the sustainability of contracted LNG prices and volumes was also questioned, which was perceived as a negative read through for marine shipping companies that seek to be an integral part of the LNG value chain.
Not part of the Annual Report
We are aware of the negative macroeconomic concerns of certain investors, but we—as fundamental investors—would like to focus on positive fundamental developments. Firstly, we note that the economy has been in a declining crude oil price environment for four straight quarters and we have yet to see a single LNG contract that has been negotiated downwards, either in price or volume commitments. We realize some investors might focus on the increasing probability of this event happening in the near future. However, we note that most of these LNG contracts do not start for another couple of years and, most importantly, most of these contracts are long term in nature, with the contract duration ranging anywhere between 5-20 years. So, if we were to reverse engineer the bear thesis, one logical conclusion would be that the economic growth in emerging markets and, most importantly, the demand for LNG will be subdued for roughly the next decade. In our view, this would be a very draconian conclusion.
Fundamentals for crude oil prices continued to improve during the period, although at a slower pace than previously anticipated. Production in Non-US, Non-OPEC regions continued to decline and we finally started to see early signs of production decline in North America as well. Oil rig counts in North America continued to decline. Demand, on the other hand, surprised to the upside globally during the period. With oil prices at a nearly 60% discount to the five-year average, the beneficiaries within the scope of the U.S. Energy Renaissance shifted to those who benefitted from a lower price environment. The reduced price of crude oil resulted in significantly lower gasoline prices, which had a positive impact on operating expenses for companies with fuel expense as a high input cost in their operations, such as trucking companies, auto and auto part manufacturers, retail gas companies and airlines. Additionally, a low crude oil price environment has historically been a positive driver for domestic gross domestic product, which historically has driven additional growth opportunities for a majority of the industries within the scope of the Renaissance universe.
Due to the dynamic theme and broad scope of the U.S. Energy Renaissance, the industries and companies which see the greatest benefit can vary in different macroeconomic environments. As an example within the transportation sector, when crude oil prices were above $100 per barrel, the demand for crude oil trucking was very high due to a lack of pipeline infrastructure in developing shales. However, the decline in crude oil prices led to a decline in gasoline prices, as well as decreased demand for crude oil trucking. Trucking companies which focus on hauling consumer goods versus crude oil experienced increased margins relative to recent historical levels, without decreased volumes associated with crude oil.
Throughout the reporting period, the continued discount of U.S. natural gas prices to global natural gas prices helped several industries maintain a competitive advantage. The incentive to take advantage of the price arbitrage through exporting natural gas as LNG was the driving force behind multiple companies filing for permits to build LNG export facilities along the coasts (primarily the Gulf Coast). On the same note, U.S. industries that have a high energy input cost, such as the manufacturing, industrials and chemicals industries, continued to realize a significant competitive advantage through a reduction in operating expense as U.S. natural gas prices remained at a significant discount to natural gas prices around the world. This advantage not only drove higher margins for companies operating domestically, but also drove jobs back to the U.S. that had largely moved overseas for the past 20 years. The competitive price advantage incentivized domestic companies to increase their production capacity, which led to a significant expansion in manufacturing and chemical plants. This expansion created heightened demand for industrial companies involved with design, construction and supply.
To summarize, we believe that the fundamentals for the U.S. Energy Renaissance thesis have improved since the beginning of the reporting period. The benefit has shifted from only portions of the economy benefiting from low natural gas prices to an even larger portion of the economy benefitting from both low natural gas prices and low crude oil prices. As a result, our investment universe has broadened and we believe the markets are beginning to realize the potential benefits. We also believe both the demand fundamentals for LNG and the price for LNG have more upside potential than is being reflected by the current equity price in the entire LNG value chain. In addition to the LNG theme, other industries that are benefitting from the energy Renaissance continued their upward trajectory. U.S. petrochemical margins were steady, aided by low NGL prices across the board, despite the fall in crude oil prices. The LNG export facilities being built in North America continued to be on track. The U.S. refining industry continued to benefit both due to higher product demand and healthy margins due to lower crude oil prices. The industrial sector experienced a slowdown, particularly in industries that are levered to energy sector capex. While the market remained skeptical of energy fundamentals during the period, Energy Renaissance theme companies continued to secure contracts worth billions that show the long-term competitiveness of U.S. sourced energy and LNG. Through active management, we believe the portfolio holdings can be adapted to capitalize on the opportunities created by the U.S. Energy Renaissance as it plays out over the next several years.
The information provided herein represents the opinion of the portfolio manager and in not intended to be a forecast of future events, a guarantee of future results, nor investment advice. The opinions expressed are as of the date of this report and are subject to change.
Not part of the Annual Report
Investors should refer to each Fund’s Summary Prospectus and/or Prospectus and consider each Fund’s investment objectives, strategies, risks, charges and expenses carefully before investing. The Summary Prospectus and/or Prospectus contain this and other information about each Fund. You may obtain copies of each Fund’s Summary Prospectus, Prospectus and Statement of Additional Information free of charge, upon request, by calling toll-free 800-MAINSTAY (624-6782), by writing to NYLIFE Distributors LLC, Attn: MainStay Marketing Department, 169 Lackawanna Avenue, Parsippany, New Jersey 07054 or by sending an e-mail to MainStayShareholderServices@nylim.com. These documents are also available via the MainStay Funds’ website at mainstayinvestments.com/documents. Please read each Summary Prospectus and/or Prospectus carefully before investing.
MainStay Cushing MLP Premier Fund
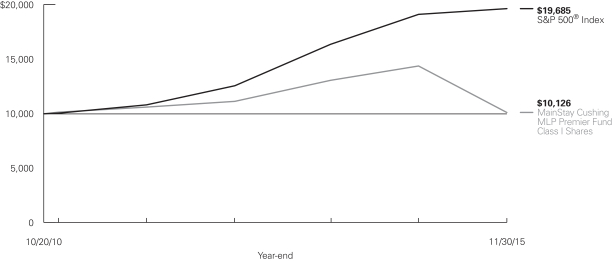
Investment and Performance Comparison1 (Unaudited)
Performance data quoted represents past performance. Past performance is no guarantee of future results. Because of market volatility, current performance may be lower or higher than the figures shown. Investment return and principal value will fluctuate, and as a result, when shares are redeemed, they may be worth more or less than their original cost. The graph below depicts the historical performance of Class I shares of the Fund. Performance will vary from class to class based on differences in class-specific expenses and sales charges. For performance information current to the most recent month-end, please call 800-MAINSTAY (624-6782) or visit mainstayinvestments.com.
Average Annual Total Returns for the Year Ended November 30, 2015
| Class | Sales Charge | One Year | Since Inception (10/20/10) | Gross Expense Ratio2 | ||||||||||||
| Class A Shares3 | Maximum 5.5% Initial Sales Charge | With sales charge Excluding sales charge |
| –33.77 –29.92 | %
|
| –1.16 –0.01 | %
|
| 6.98 6.98 | %
| |||||
| Investor Class Shares4 | Maximum 5.5% Initial Sales Charge | With sales charge Excluding sales charge |
| –33.77 –29.91 |
| | –1.16 –0.01 | | | 6.97 6.97 | | |||||
| Class C Shares3 | Maximum 1% CDSC if Redeemed Within One Year of Purchase | With sales charge Excluding sales charge |
| –31.08 –30.43 |
| | –0.77 –0.77 | | | 7.72 7.72 | | |||||
| Class I Shares3 | No Sales Charge | –29.71 | 0.24 | 6.73 | ||||||||||||
| 1. | The performance table and graph do not reflect the deduction of taxes that a shareholder would pay on distributions or Fund share redemptions. Total returns reflect maximum applicable sales charges as indicated in the table above, changes in share price, and reinvestment of dividend and capital gain distributions. The graph assumes the initial investment amount shown above and reflects the deduction of all sales charges that would have applied for the period of investment. Performance figures reflect certain fee waivers and/or expense limitations, without which total returns may have been lower. For more information on share classes and current fee waivers and/or expense limitations, please refer to the notes to the financial statements. |
| 2. | The gross expense ratios presented reflect the Fund’s “Total Annual Fund Operating Expenses” from the most recent Prospectus and may differ from other expense ratios disclosed in this report. |
| 3. | Performance figures for Class A shares, Class C shares and Class I shares reflect the historical performance of the then-existing Class A shares, Class C shares and Class I shares, respectively, of the Cushing® MLP Premier Fund (the predecessor to the Fund, which was subject to a different fee structure) for periods prior to July 11, 2014. The Cushing® MLP Premier Fund commenced operations on October 20, 2010. |
| 4. | Performance figures for Investor Class shares, first offered on July 11, 2014, include the historical performance of Class A shares through July 10, 2014, adjusted for differences in certain expenses and fees. Unadjusted, the performance shown for Investor Class shares would likely have been different. |
The footnotes on the next page are an integral part of the table and graph and should be carefully read in conjunction with them.
| 8 | MainStay Cushing MLP Premier Fund |
| Benchmark Performance | One Year | Since Inception | ||||||
S&P 500® Index5 | 2.75 | % | 14.16 | % | ||||
Average Lipper Energy MLP Fund6 | –32.52 | 2.31 | ||||||
| 5. | “S&P 500®” is a trademark of The McGraw-Hill Companies, Inc. The S&P 500® Index is widely regarded as the standard index for measuring large-cap U.S. stock market performance. The S&P 500® Index is the Fund’s primary benchmark. Results assume reinvestment of all dividends and capital gains. An investment cannot be made directly in an index. |
| 6. | The average Lipper Energy MLP Fund is representative of funds that invest primarily in Master Limited Partnerships (MLPs) engaged in the |
| transportation, storage and processing of minerals and natural resources. This benchmark is a product of Lipper Inc. Lipper Inc. is an independent monitor of fund performance. Results are based on average total returns of similar funds with all dividend and capital gain distributions reinvested. |
The footnotes on the preceding page are an integral part of the table and graph and should be carefully read in conjunction with them.
| 9 |
Cost in Dollars of a $1,000 Investment in MainStay Cushing MLP Premier Fund (Unaudited)
The example below is intended to describe the fees and expenses borne by shareholders during the six-month period from June 1, 2015, to November 30, 2015, and the impact of those costs on your investment.
Example
As a shareholder of the Fund, you incur two types of costs: (1) transaction costs, including exchange fees and sales charges (loads) on purchases (as applicable), and (2) ongoing costs, including management fees, distribution and/or service (12b-1) fees, and other Fund expenses (as applicable). This example is intended to help you understand your ongoing costs (in dollars) of investing in the Fund and to compare these costs with the ongoing costs of investing in other mutual funds. The example is based on an investment of $1,000 made at the beginning of the six-month period and held for the entire period from June 1, 2015, to November 30, 2015.
This example illustrates your Fund’s ongoing costs in two ways:
Actual Expenses
The second and third data columns in the table below provide information about actual account values and actual expenses. You may use the information in these columns, together with the amount you invested, to estimate the expenses that you paid during the six months ended November 30, 2015. Simply divide your account value by $1,000 (for example, an $8,600 account value divided by $1,000 = 8.6), then
multiply the result by the number under the heading entitled “Expenses Paid During Period” to estimate the expenses you paid on your account during this period.
Hypothetical Example for Comparison Purposes
The fourth and fifth data columns in the table below provide information about hypothetical account values and hypothetical expenses based on the Fund’s actual expense ratio and an assumed rate of return of 5% per year before expenses, which is not the Fund’s actual return. The hypothetical account values and expenses may not be used to estimate the actual ending account balances or expenses you paid for the six-month period shown. You may use this information to compare the ongoing costs of investing in the Fund with the ongoing costs of investing in other Funds. To do so, compare this 5% hypothetical example with the 5% hypothetical examples that appear in the shareholder reports of the other Funds.
Please note that the expenses shown in the table are meant to highlight your ongoing costs only and do not reflect any transactional costs, such as exchange fees or sales charges (loads). Therefore, the fourth and fifth data columns of the table are useful in comparing ongoing costs only and will not help you determine the relative total costs of owning different funds. In addition, if these transactional costs were included, your costs would have been higher.
| Share Class | Beginning Value | Ending Account Value (Based | Expenses During | Ending Account Value (Based on Hypothetical 5% Annualized Return and Actual Expenses) 11/30/15 | Expenses During | |||||||||||||||
| Class A Shares | $ | 1,000.00 | $ | 719.50 | $ | 6.42 | $ | 1,017.60 | $ | 7.54 | ||||||||||
| Investor Class Shares | $ | 1,000.00 | $ | 719.50 | $ | 6.47 | $ | 1,017.55 | $ | 7.59 | ||||||||||
| Class C Shares | $ | 1,000.00 | $ | 717.10 | $ | 9.64 | $ | 1,013.84 | $ | 11.31 | ||||||||||
| Class I Shares | $ | 1,000.00 | $ | 720.80 | $ | 5.35 | $ | 1,018.85 | $ | 6.28 | ||||||||||
| 1. | Expenses are equal to the Fund’s annualized expense ratio of each class (1.49% for Class A, 1.50% for Investor Class, 2.24% for Class C and 1.24% for Class I) multiplied by the average account value over the period, divided by 365 and multiplied by 183 for Class A, Investor Class, Class C, and Class I (to reflect the six-month period). Expenses for the six-month period ended excluded a net deferred tax benefit to the Fund that equaled 8.56% for Class A, 8.55% for Investor Class, 8.56% for Class C, and 8.56% for Class I. The table above represents the actual expenses incurred during the six-month period. |
| 10 | MainStay Cushing MLP Premier Fund |
Portfolio Composition as of November 30, 2015(1) (Unaudited)
(Expressed as a Percentage of Total Investments)
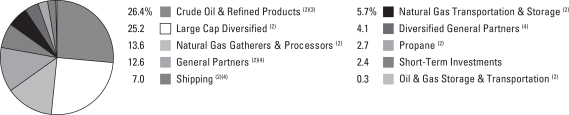
See Portfolio of Investments beginning on page 14 for specific holdings within these categories.
Top Ten Holdings as of November 30, 2015 (excluding short-term investments)
| 1. | Enterprise Products Partners, L.P. |
| 2. | Tesoro Logistics, L.P. |
| 3. | Energy Transfer Partners, L.P. |
| 4. | EQT Midstream Partners, L.P. |
| 5. | Energy Transfer Equity, L.P. |
| 6. | Genesis Energy, L.P. |
| 7. | Sunoco Logistics Partners, L.P. |
| 8. | Williams Partners, L.P. |
| 9. | Shell Midstream Partners, L.P. |
| 10. | Kinder Morgan, Inc. |
| (1) | Fund holdings and sector allocations are subject to change, and there is no assurance that the Fund will continue to hold any particular security. |
| (2) | Master Limited Partnerships and Related Companies |
| (3) | Preferred Stock |
| (4) | Common Stock |
| 11 |
Portfolio Management Discussion and Analysis (Unaudited)
Questions answered by portfolio managers Jerry V. Swank and Kevin P. Gallagher, CFA, of Cushing Asset Management, LP, the Fund’s Subadvisor.
How did MainStay Cushing MLP Premier Fund perform relative to its primary benchmark and peers during the 12 months ended November 30, 2015?
Excluding all sales charges, MainStay Cushing MLP Premier Fund returned –29.92% for Class A shares, –29.91% for Investor Class shares and –30.43% for Class C shares for the 12 months ended November 30, 2015. Over the same period, Class I shares returned –29.71%. For the 12 months ended November 30, 2015, all share classes underperformed the 2.75% return of the S&P 500® Index,1 which is the Fund’s broad-based securities-market index. Over the same period, all share classes outperformed the –32.52% return of the Average Lipper2 Energy MLP Fund. See page 8 for Fund returns with applicable sales charges.
Were there any changes to the Fund?
Effective December 7, 2015, Daniel L. Spears no longer serves as a portfolio manager of the Fund. Jerry V. Swank and Kevin P. Gallagher will continue to manage the Fund.
What factors affected the Fund’s performance relative to the S&P 500® Index during the reporting period?
The most significant factors that affected the Fund’s performance relative to the S&P 500® Index during the reporting period were primarily related to significant declines in commodity prices (crude oil, natural gas and natural gas liquids). These declines were driven by supply/demand imbalances, which weakened the operational and financial outlook for—and investor sentiment toward—the energy industry overall, including energy infrastructure master limited partnerships (“MLPs”). The S&P 500® Index includes stocks across many sectors, while the Fund’s exposure is limited to the energy sector. In this weakened energy environment, which led to significant selling pressure on energy equities and Fund holdings, many MLPs experienced slower or reduced volumes, slower capital spending on organic growth projects, higher leverage, diminished access to—and higher costs for—debt and equity capital, and slowing distribution growth. Other technical factors that likely pressured MLP equities and Fund holdings during the latter part of the reporting period included year-end tax-loss selling (i.e. tax harvesting), slowing retail fund flows into MLP-related investment products compared to the prior year, and MLP position liquidations by public closed-end funds to meet leverage covenants. In addition, unlike the S&P 500® Index, the Fund is subject to fees and expenses and is taxed as a regular corporation for federal income tax purposes, which may have a negative effect on the Fund’s performance relative to the Index.
Which subsectors were the strongest contributors to the Fund’s absolute performance and which subsectors were particularly weak?
The top subsector contributors to the Fund’s absolute performance during the reporting period were MLPs in the natural gas transportation & storage subsector, upstream MLPs and shipping MLP general partners. (Contributions take weightings and total returns into account.) The performance of each of these subsectors was negative for the reporting period, but the impact was moderated by the Fund’s relatively modest average weightings, which were less than 5% for each subsector. The Fund sold its two holdings in upstream MLPs early in the reporting period, so the Fund’s average exposure to this subsector was just 0.1% for the 12 months ended November 30, 2015.
The subsectors that detracted the most from the Fund’s absolute performance were MLPs in the large-cap diversified, natural gas gatherers & processors, and MLP general partners subsectors. All of these subsectors had negative absolute returns for the reporting period. Of these subsectors, the most substantial weighting was in the large-cap diversified subsector, partly because we believe that many of these partnerships are in the best position to weather the industry downturn from an operations and financial perspective. The natural gas gatherers & processors subsector was hurt by slowing or reduced system throughput and lower commodity prices. The MLP general partners subsector suffered from investor concerns about slowing distribution growth at the underlying MLPs.
During the reporting period, which individual holdings made the strongest contributions to the Fund’s absolute performance and which holdings detracted the most?
The top contributor to the Fund’s absolute performance during the reporting period was Shell Midstream Partners, L.P., a “drop-down” MLP with expected multiyear double-digit distribution growth in the crude oil & refined products subsector. This was followed by Spectra Energy Partners L.P., a natural gas transportation & storage MLP with stable and growing cash flows driven by a large project backlog, and Crestwood Equity Partners, L.P., a holding that was sold from the Fund in December 2014 (at the time, it was classified in the MLP general partners subsector). The contribution from each of these positions was approximately zero. Throughout the reporting period, we used periods of MLP market weakness (including periods of investor concern about funding growth projects) to add to the Shell Midstream Partners position.
The position that detracted the most from the Fund’s absolute performance during the reporting period was Targa Resources Corp., an MLP general partner with interests in a commodity-
| 1. | See footnote on page 9 for more information on the S&P 500® Index. |
| 2. | See footnote on page 9 for more information on Lipper Inc. |
| 12 | MainStay Cushing MLP Premier Fund |
sensitive natural gas gatherers & processors MLP. This was followed by Plains All American Pipeline, L.P., a large-cap diversified MLP, and Kinder Morgan Inc., a large diversified midstream company. Each of these detractors had negative absolute performance driven by the deteriorating commodity price environment. The Fund reduced the size of its position in Targa Resources during the reporting period because of slowing distribution growth at the underlying MLP and the levered impact on general partner cash flows. Following the second quarter earnings call for Plains All American Pipeline, L.P., the Fund reduced its position. We believed that the MLP’s business was performing worse than expected (in part because of competition) and that the near-term outlook was unlikely to improve. The Fund reduced its position in Kinder Morgan through the reporting period because of slowing growth expectations and the company’s relatively high leverage. (The Fund completely exited the position after the end of the reporting period following a sizeable cut in Kinder Morgan’s dividend.)
Did the Fund make any significant purchases or sales during the reporting period?
During the reporting period, the Fund’s largest purchase was Enterprise Products Partners, L.P., a large-cap diversified MLP. We added to the Fund’s position in Enterprise Products Partners because we believed that this MLP had a strong ability to weather the volatile environment. Enterprise Products Partners, L.P. had a large and diverse footprint of integrated assets, a relatively low cost of capital, a good backlog of contracted fee-based projects, healthy cash flow coverage and a strong bal-
ance sheet. We also added to the Fund’s position in Tesoro Logistics, L.P., a crude oil & refined products MLP, throughout the reporting period because of its relatively high distribution yield and projected double-digit multiyear distribution growth driven by drop-down transactions from its supportive sponsor/parent as well as an inventory of organic projects.
During the reporting period, we sold shares of The Williams Companies Inc., an MLP general partner, after it announced a merger agreement with Energy Transfer Equity, L.P. We used the sale to reduce the Fund’s combined exposure to the pro forma merged entity. We also sold units of Regency Energy Partners, L.P., formerly a natural gas gatherers & processors MLP, because of its merger agreement with Energy Transfer Partners L.P.
How did the Fund’s subsector weightings change during the reporting period?
During the reporting period, we increased the Fund’s exposure to the crude oil & refined products and large-cap diversified MLP subsectors. We decreased the Fund’s exposure to the general partners and natural gas gatherers & processors subsectors.
How was the Fund positioned at the end of the reporting period?
As of November 30, 2015, the Fund’s largest MLP subsector positions were in large cap diversified and in crude oil & refined products. Together, these positions accounted for more than 50% of the Fund’s net assets.
The opinions expressed are those of the portfolio managers as of the date of this report and are subject to change. There is no guarantee that any forecasts will come to pass. This material does not constitute investment advice and is not intended as an endorsement of any specific investment.
| 13 |
Portfolio of Investments November 30, 2015
| Shares | Value | |||||||
| Common Stocks 13.2%† | ||||||||
Diversified General Partners 4.1% |
| |||||||
United States 4.1% |
| |||||||
ONEOK, Inc. | 889,800 | $ | 26,231,304 | |||||
Williams Companies, Inc. | 759,700 | 27,774,632 | ||||||
|
| |||||||
| 54,005,936 | ||||||||
|
| |||||||
General Partners 5.8% |
| |||||||
United States 5.8% |
| |||||||
¨Kinder Morgan, Inc. | 2,088,432 | 49,224,342 | ||||||
Targa Resources Corporation | 708,100 | 27,828,330 | ||||||
|
| |||||||
| 77,052,672 | ||||||||
|
| |||||||
Shipping 3.3% | ||||||||
Bermuda 1.6% | ||||||||
Golar LNG Ltd. | 770,000 | 21,059,500 | ||||||
|
| |||||||
Republic of the Marshall Islands 1.7% |
| |||||||
Teekay Corporation | 830,000 | 23,107,200 | ||||||
|
| |||||||
| 44,166,700 | ||||||||
|
| |||||||
Total Common Stocks | 175,225,308 | |||||||
|
| |||||||
| MLPs and Related Companies 83.2% | ||||||||
Crude Oil & Refined Products 25.4% |
| |||||||
United States 25.4% |
| |||||||
Blueknight Energy Partners, L.P. (a) | 2,161,200 | 13,399,440 | ||||||
Enbridge Energy Partners, L.P. | 1,597,800 | 39,705,330 | ||||||
¨Genesis Energy, L.P. | 1,590,061 | 62,568,900 | ||||||
NuStar Energy, L.P. | 828,500 | 33,156,570 | ||||||
¨Shell Midstream Partners, L.P. | 1,497,987 | 52,234,807 | ||||||
¨Sunoco Logistics Partners, L.P. | 2,098,400 | 58,482,408 | ||||||
¨Tesoro Logistics, L.P. | 1,540,600 | 76,952,970 | ||||||
|
| |||||||
| 336,500,425 | ||||||||
|
| |||||||
General Partners 6.7% |
| |||||||
United States 6.7% |
| |||||||
¨Energy Transfer Equity, L.P. | 3,697,200 | 70,024,968 | ||||||
Plains GP Holdings, L.P. | 1,555,000 | 19,064,300 | ||||||
|
| |||||||
| 89,089,268 | ||||||||
|
| |||||||
Large Cap Diversified 25.2% |
| |||||||
United States 25.2% |
| |||||||
¨Energy Transfer Partners, L.P. | 2,005,312 | 76,622,972 | ||||||
¨Enterprise Products Partners, L.P. | 3,514,250 | 89,226,807 | ||||||
Magellan Midstream Partners, L.P. | 506,615 | 31,678,636 | ||||||
ONEOK Partners, L.P. | 1,121,600 | 33,905,968 | ||||||
Plains All American Pipeline, L.P. | 1,770,905 | 43,883,026 | ||||||
¨Williams Partners, L.P. | 2,111,603 | 57,900,154 | ||||||
|
| |||||||
| 333,217,563 | ||||||||
|
| |||||||
| Shares | Value | |||||||
Natural Gas Gatherers & Processors 13.5% |
| |||||||
United States 13.5% |
| |||||||
DCP Midstream Partners, L.P. | 541,000 | $ | 13,741,400 | |||||
Enable Midstream Partners, L.P. | 524,124 | 4,926,765 | ||||||
EnLink Midstream Partners, L.P. | 2,861,700 | 42,696,564 | ||||||
MarkWest Energy Partners, L.P. | 941,400 | 45,187,200 | ||||||
Targa Resources Partners, L.P. | 1,453,025 | 33,187,091 | ||||||
Western Gas Partners, L.P. | 828,600 | 39,789,372 | ||||||
|
| |||||||
| 179,528,392 | ||||||||
|
| |||||||
Natural Gas Transportation & Storage 5.7% |
| |||||||
United States 5.7% |
| |||||||
¨EQT Midstream Partners, L.P. | 1,110,000 | 75,091,500 | ||||||
|
| |||||||
Oil & Gas Storage & Transportation 0.3% |
| |||||||
United States 0.3% |
| |||||||
Spectra Energy Partners L.P. | 100,000 | 4,237,000 | ||||||
|
| |||||||
Propane 2.7% |
| |||||||
United States 2.7% |
| |||||||
NGL Energy Partners, L.P. | 2,018,652 | 35,427,343 | ||||||
|
| |||||||
Shipping 3.7% |
| |||||||
Republic of the Marshall Islands 3.7% |
| |||||||
Capital Product Partners, L.P. | 4,991,100 | 31,443,930 | ||||||
Golar LNG Partners, L.P. | 1,230,000 | 17,638,200 | ||||||
|
| |||||||
| 49,082,130 | ||||||||
|
| |||||||
Total MLPs and Related Companies | 1,102,173,621 | |||||||
|
| |||||||
| Preferred Stocks 1.0% | ||||||||
Crude Oil & Refined Products 1.0% |
| |||||||
United States 1.0% |
| |||||||
Blueknight Energy Partners, L.P. (a) | 1,902,541 | 13,013,381 | ||||||
|
| |||||||
Total Preferred Stocks | 13,013,381 | |||||||
|
| |||||||
| Short-Term Investments—Investment Companies 2.4% | ||||||||
United States 2.4% | ||||||||
Invesco Short-Term Treasury Portfolio Fund—Institutional Class, | 6,341,649 | 6,341,649 | ||||||
Fidelity Government Portfolio Fund—Institutional Class, | 6,341,648 | 6,341,648 | ||||||
Fidelity Money Market Portfolio— | 6,341,648 | 6,341,648 | ||||||
| † | Calculated as a percentage of net assets applicable to common shareholders. |
| ¨ | Among the Portfolio’s 10 largest holdings or issuers held, as of November 30, 2015, excluding short-term investments. May be subject to change daily. |
| 14 | MainStay Cushing MLP Premier Fund | The notes to the financial statements are an integral part of, and should be read in conjunction with, the financial statements. |
| Shares | Value | |||||||
| Short-Term Investments—Investment Companies (continued) | ||||||||
United States (continued) |
| |||||||
First American Prime Obligations Fund—Class Z, | 6,341,649 | $ | 6,341,649 | |||||
Invesco STIC Prime Portfolio, | 6,341,649 | 6,341,649 | ||||||
|
| |||||||
Total Short-Term Investments—Investment Companies | 31,708,243 | |||||||
|
| |||||||
Total Investments | 99.8 | % | 1,322,120,553 | |||||
Other Assets in Excess of Liabilities | 0.2 | 2,060,412 | ||||||
Net Assets | 100.0 | % | $ | 1,324,180,965 | ||||
| (a) | Illiquid security—As of November 30, 2015, the total market value of securities deemed illiquid under procedures approved by the Board of Trustees was $26,412,821, which represented 1.99% of the Fund’s net assets. |
| (b) | Rate reported is the current yield as of November 30, 2015. |
| (c) | As of November 30, 2015, cost was $1,436,380,112 for federal income tax purposes and net unrealized depreciation was as follows: |
Gross unrealized appreciation | $ | 492,113,759 | ||
Gross unrealized depreciation | (606,373,318 | ) | ||
|
| |||
Net unrealized depreciation | $ | (114,259,559 | ) | |
|
|
The following is a summary of the fair valuations according to the inputs used as of November 30, 2015, for valuing the Fund’s assets and liabilities.
Asset Valuation Inputs
Description | Quoted Prices in Active Markets for Assets (Level 1) | Significant Other Observable Inputs (Level 2) | Significant (Level 3) | Total | ||||||||||||
| Investments in Securities (a) | ||||||||||||||||
Common Stocks | $ | 175,225,308 | $ | — | $ | — | $ | 175,225,308 | ||||||||
MLPs and Related Companies | 1,102,173,621 | — | — | 1,102,173,621 | ||||||||||||
Preferred Stock | 13,013,381 | — | — | 13,013,381 | ||||||||||||
Short-Term Investments | 31,708,243 | — | — | 31,708,243 | ||||||||||||
|
|
|
|
|
|
|
| |||||||||
| Total Investments in Securities | $ | 1,322,120,553 | $ | — | $ | — | $ | 1,322,120,553 | ||||||||
|
|
|
|
|
|
|
| |||||||||
| (a) | For a complete listing of investments and their industries, see the Portfolio of Investments. |
The Fund recognizes transfers between the levels as of the beginning of the period.
For the year ended November 30, 2015, the Fund did not have any transfers between Level 1 and Level 2 fair value measurements (See Note 2).
As of November 30, 2015, the Fund did not hold any investments with significant unobservable inputs (Level 3) (See Note 2).
| The notes to the financial statements are an integral part of, and should be read in conjunction with, the financial statements. | 15 |
Statement of Assets and Liabilities as of November 30, 2015
| Assets | ||||
Investments, at value | $ | 1,322,120,553 | ||
Receivables: | ||||
Investments sold | 4,033,421 | |||
Fund shares sold | 11,824,984 | |||
Dividends and interest | 1,876 | |||
Prepaid expenses | 49,010 | |||
|
| |||
Total assets | 1,338,029,844 | |||
|
| |||
| Liabilities | ||||
Payables: | ||||
Fund shares redeemed | 7,031,768 | |||
Investments purchased | 4,255,465 | |||
Advisory fees (See Note 3) | 1,262,529 | |||
NYLIFE Distributors (See Note 3) | 553,988 | |||
Transfer agent (See Note 3) | 276,000 | |||
Shareholder communication | 70,438 | |||
Professional fees | 54,574 | |||
Custodian | 3,501 | |||
Trustees | 370 | |||
Accrued expenses | 81,365 | |||
Franchise taxes | 258,881 | |||
|
| |||
Total liabilities | 13,848,879 | |||
|
| |||
Net assets | $ | 1,324,180,965 | ||
|
| |||
| Composition of Net Assets | ||||
Shares of beneficial interest outstanding (par value of $.001 per share) unlimited number of shares authorized | $ | 92,889 | ||
Additional paid-in capital | 1,676,667,400 | |||
|
| |||
| 1,676,760,289 | ||||
Accumulated net investment loss, net of income taxes | (69,765,351 | ) | ||
Accumulated net realized gain (loss) on investments, net of income taxes | (56,218,817 | ) | ||
Net unrealized appreciation (depreciation) on investments, net of income taxes | (226,595,156 | ) | ||
|
| |||
Net assets | $ | 1,324,180,965 | ||
|
| |||
Class A | ||||
Net assets applicable to outstanding shares | $ | 317,903,246 | ||
|
| |||
Shares of beneficial interest outstanding | 21,967,819 | |||
|
| |||
Net asset value per share outstanding | $ | 14.47 | ||
Maximum sales charge (5.50% of offering price) | 0.80 | |||
|
| |||
Maximum offering price per share outstanding | $ | 15.27 | ||
|
| |||
Investor Class | ||||
Net assets applicable to outstanding shares | $ | 2,630,563 | ||
|
| |||
Shares of beneficial interest outstanding | 181,822 | |||
|
| |||
Net asset value per share outstanding | $ | 14.47 | ||
Maximum sales charge (5.50% of offering price) | 0.80 | |||
|
| |||
Maximum offering price per share outstanding | $ | 15.27 | ||
|
| |||
Class C | ||||
Net assets applicable to outstanding shares | $ | 553,891,725 | ||
|
| |||
Shares of beneficial interest outstanding | 40,115,163 | |||
|
| |||
Net asset value per share outstanding | $ | 13.81 | ||
|
| |||
Class I | ||||
Net assets applicable to outstanding shares | $ | 449,755,431 | ||
|
| |||
Shares of beneficial interest outstanding | 30,624,212 | |||
|
| |||
Net asset value per share outstanding | $ | 14.69 | ||
|
|
| 16 | MainStay Cushing MLP Premier Fund | The notes to the financial statements are an integral part of, and should be read in conjunction with, the financial statements. |
Statement of Operations for the year ended November 30, 2015
| Investment Income (Loss) | ||||
Income | ||||
Dividends and distributions | $ | 22,236,475 | ||
Interest | 38,034 | |||
|
| |||
Total income | 22,274,509 | |||
|
| |||
Expenses | ||||
Manager (See Note 3) | 19,828,997 | |||
Distribution/Service—Class A (See Note 3) | 1,159,611 | |||
Distribution/Service—Investor Class (See Note 3) | 5,882 | |||
Distribution/Service—Class C (See Note 3) | 7,710,821 | |||
Transfer agent (See Note 3) | 1,505,243 | |||
Registration | 368,105 | |||
Professional fees | 245,165 | |||
Franchise tax | 517,762 | |||
Shareholder communication | 376,616 | |||
Trustees | 23,300 | |||
Custodian | 21,740 | |||
Miscellaneous | 35,476 | |||
|
| |||
Net expenses | 31,798,718 | |||
|
| |||
Net investment loss, before income taxes | (9,524,209 | ) | ||
Deferred tax benefit | 7,343,122 | |||
|
| |||
Net investment income (loss) | (2,181,087 | ) | ||
|
| |||
| Realized and Unrealized Gain (Loss) on Investments | ||||
Net realized gain (loss) on: | ||||
Investments, before income taxes | (127,225,171 | ) | ||
Deferred tax benefit | 46,981,594 | |||
|
| |||
Net realized gain (loss) on investments | (80,243,577 | ) | ||
|
| |||
Net change in unrealized appreciation (depreciation) on: | ||||
Investments, before income taxes | (606,373,036 | ) | ||
Deferred tax benefit, net of valuation allowance | 100,482,703 | |||
|
| |||
Net change in unrealized appreciation (depreciation) | (505,890,333 | ) | ||
|
| |||
Net realized and unrealized gain (loss) on investments | (586,133,910 | ) | ||
|
| |||
Net increase (decrease) in net assets resulting from operations | $ | (588,314,997 | ) | |
|
| |||
| The notes to the financial statements are an integral part of, and should be read in conjunction with, the financial statements. | 17 |
Statements of Changes in Net Assets
| Year ended November 30, 2015 | Year ended November 30, 2014 | |||||||
| Increase (Decrease) in Net Assets | ||||||||
Operations: | ||||||||
Net investment income (loss) | $ | (2,181,087 | ) | $ | (10,515,805 | ) | ||
Net realized gain (loss) on investments | (80,243,577 | ) | 35,136,178 | |||||
Net change in unrealized appreciation (depreciation) on investments | (505,890,333 | ) | 100,775,299 | |||||
|
| |||||||
Net increase (decrease) in net assets resulting from operations | (588,314,997 | ) | 125,395,672 | |||||
|
| |||||||
Dividends and distributions to shareholders: | ||||||||
From net investment income: | ||||||||
Class A | — | (14,189,873 | ) | |||||
Investor Class | — | (6,008 | ) | |||||
Class C | — | (20,166,403 | ) | |||||
Class I | — | (10,131,458 | ) | |||||
|
| |||||||
| — | (44,493,742 | ) | ||||||
|
| |||||||
From return of capital: | ||||||||
Class A | (31,601,906 | ) | (18,145,019 | ) | ||||
Investor Class | (172,126 | ) | (7,683 | ) | ||||
Class C | (55,256,642 | ) | (25,787,389 | ) | ||||
Class I | (38,732,047 | ) | (12,955,400 | ) | ||||
|
| |||||||
| (125,762,721 | ) | (56,895,491 | ) | |||||
|
| |||||||
Total dividends and distributions to shareholders | (125,762,721 | ) | (101,389,233 | ) | ||||
|
| |||||||
Capital share transactions: | ||||||||
Net proceeds from sale of shares | 753,559,128 | 1,058,742,376 | ||||||
Net asset value of shares issued to shareholders in reinvestment of dividends and distributions | 116,970,153 | 86,845,034 | ||||||
Cost of shares redeemed | (803,926,743 | ) | (475,289,126 | ) | ||||
|
| |||||||
Increase (decrease) in net assets derived from capital share transactions | 66,602,538 | 670,298,284 | ||||||
|
| |||||||
Net increase (decrease) in net assets | (647,475,180 | ) | 694,304,723 | |||||
| Net Assets | ||||||||
Beginning of year | 1,971,656,145 | 1,277,351,422 | ||||||
|
| |||||||
End of year | $ | 1,324,180,965 | $ | 1,971,656,145 | ||||
|
| |||||||
Accumulated net investment loss, net of income taxes | $ | (69,765,351 | ) | $ | (67,584,264 | ) | ||
|
| |||||||
| 18 | MainStay Cushing MLP Premier Fund | The notes to the financial statements are an integral part of, and should be read in conjunction with, the financial statements. |
Financial Highlights selected per share data and ratios
| Year ended November 30, | ||||||||||||||||||||
| Class A | 2015 | 2014 | 2013*** | 2012*** | 2011*** | |||||||||||||||
Net asset value at beginning of year | $ | 22.15 | $ | 21.36 | $ | 19.48 | $ | 19.92 | $ | 20.28 | ||||||||||
|
|
|
|
|
|
|
|
|
| |||||||||||
Net investment income (loss) (a) | 0.03 | (0.09 | ) | (0.12 | ) | (0.13 | ) | (0.14 | ) | |||||||||||
Net realized and unrealized gain (loss) on investments | (6.37 | ) | 2.21 | 3.34 | 1.02 | 1.07 | ||||||||||||||
|
|
|
|
|
|
|
|
|
| |||||||||||
Total from investment operations | (6.34 | ) | 2.12 | 3.22 | 0.89 | 0.93 | ||||||||||||||
|
|
|
|
|
|
|
|
|
| |||||||||||
| Less dividends and distributions: | ||||||||||||||||||||
From net investment income | — | (0.59 | ) | — | — | — | ||||||||||||||
From return of capital | (1.34 | ) | (0.75 | ) | (1.34 | ) | (1.34 | ) | (1.30 | ) | ||||||||||
|
|
|
|
|
|
|
|
|
| |||||||||||
Total dividends and distributions | (1.34 | ) | (1.34 | ) | (1.34 | ) | (1.34 | ) | (1.30 | ) | ||||||||||
|
|
|
|
|
|
|
|
|
| |||||||||||
Redemption fees retained (a)(b) | — | 0.01 | 0.00 | ‡ | 0.01 | 0.01 | ||||||||||||||
|
|
|
|
|
|
|
|
|
| |||||||||||
Net asset value at end of year | $ | 14.47 | $ | 22.15 | $ | 21.36 | $ | 19.48 | $ | 19.92 | ||||||||||
|
|
|
|
|
|
|
|
|
| |||||||||||
Total investment return (c) | (29.92 | %) | 10.00 | % | 16.91 | % | 4.56 | % | 4.55 | % | ||||||||||
| Ratios (to average net assets)/Supplemental Data: | ||||||||||||||||||||
Net investment income (loss) (including net deferred income tax benefit (expense)) (d) | 8.32 | % (e) | (6.46 | %) | (9.12 | %) | (2.95 | %) | (1.95 | %) | ||||||||||
Net investment income (loss) (excluding net deferred income tax benefit (expense)) (d) | (0.24 | %)(e) | (0.97 | %) | (1.18 | %) | (1.23 | %) | (1.29 | %) | ||||||||||
Net expenses (including net deferred income tax (benefit) expense) (d)(f) | (7.07 | %)(e) | 7.08 | % | 9.59 | % | 3.37 | % | 2.32 | % | ||||||||||
Expenses (before waiver/recoupment, including net deferred income tax (benefit) | (7.07 | %)(e) | 7.03 | % | 9.57 | % | 3.43 | % | 3.29 | % | ||||||||||
Portfolio turnover rate | 32.35 | % | 20.70 | % | 27.29 | % | 43.32 | % | 72.32 | % | ||||||||||
Net assets at end of year (in 000’s) | $ | 317,903 | $ | 531,607 | $ | 487,318 | $ | 306,054 | $ | 81,865 | ||||||||||
| *** | These years were audited by a predecessor audit firm whose opinion was unqualified. |
| ‡ | Less than one cent per share. |
| (a) | Per share data based on average shares outstanding during the period. |
| (b) | Redemption fees were only applicable prior to reorganization. (See Note 1) |
| (c) | Total investment return is calculated exclusive of sales charges and assumes the reinvestment of dividends and distributions. |
| (d) | For the year ended November 30, 2015, the Fund accrued $154,807,419 in net deferred income tax benefit, of which $39,834,200 is attributable to Class A. For the year ended November 30, 2014, the Fund accrued $70,224,241 in net deferred income tax expense, of which $30,305,000 is attributable to Class A. For the year ended November 30, 2013, the Fund accrued $77,002,011 in net deferred income tax expense, of which $31,765,943 is attributable to Class A. For the year ended November 30, 2012, the Fund accrued $7,120,938 in net deferred income tax expense, of which $3,616,649 is attributable to Class A. For the year ended November 30, 2011, the Fund accrued $452,365 in net deferred tax expense, of which $212,282 is attributable to Class A. |
| (e) | Ratios including/excluding net deferred income tax benefit (expense) includes applicable franchise tax expense for the period. For the year ended November 30, 2015, the Fund accrued $517,762 in franchise tax expense, of which $128,449 is attributable to Class A. |
| (f) | The ratio of expenses excluding net deferred income tax expense to average net assets before waiver and recoupment was 1.49%, 1.54%, 1.63%, 1.71% and 2.62% for the fiscal years ended November 30, 2015, 2014, 2013, 2012 and 2011, respectively. The ratio of expenses excluding net deferred income tax expense to average net assets after waiver and recoupment was 1.49%, 1.59%, 1.65%, 1.65%, and 1.65% for the fiscal years ended November 30, 2015, 2014, 2013, 2012 and 2011, respectively. |
| The notes to the financial statements are an integral part of, and should be read in conjunction with, the financial statements. | 19 |
Financial Highlights selected per share data and ratios
| Investor Class | Year ended November 30, 2015 | July 12, 2014** through November 30, 2014 | ||||||
Net asset value at beginning of period | $ | 22.15 | $ | 24.02 | ||||
|
|
|
| |||||
Net investment income (loss) (a) | (0.00 | )‡ | (0.03 | ) | ||||
Net realized and unrealized gain (loss) on investments | (6.34 | ) | (1.17 | ) | ||||
|
|
|
| |||||
Total from investment operations | (6.34 | ) | (1.20 | ) | ||||
|
|
|
| |||||
| Less dividends and distributions: | ||||||||
From net investment income | — | (0.29 | ) | |||||
From return of capital | (1.34 | ) | (0.38 | ) | ||||
|
|
|
| |||||
Total dividends and distributions | (1.34 | ) | (0.67 | ) | ||||
|
|
|
| |||||
Net asset value at end of period | $ | 14.47 | $ | 22.15 | ||||
|
|
|
| |||||
Total investment return (b) | (29.91 | %)(d) | (5.12 | %)(c)(d) | ||||
| Ratios (to average net assets)/Supplemental Data: | ||||||||
Net investment income (loss) (including net deferred income tax benefit (expense)) (e) | 8.17 | % (f) | 2.79 | % †† | ||||
Net investment income (loss) (excluding net deferred income tax benefit (expense)) (e) | (0.38 | %)(f) | (0.52 | %)†† | ||||
Net expenses (including net deferred income tax (benefit) expense) (e)(g) | (7.05 | %)(f) | (1.80 | %)†† | ||||
Expenses (before waiver/recoupment, including net deferred income tax (benefit) expense) (e)(g) | (7.05 | %)(f) | (1.80 | %)†† | ||||
Portfolio turnover rate | 32.35 | % | 20.70 | % | ||||
Net assets at end of period (in 000’s) | $ | 2,631 | $ | 1,310 | ||||
| ** | Inception date. |
| ‡ | Less than one cent per share. |
| †† | Annualized. |
| (a) | Per share data based on average shares outstanding during the period. |
| (b) | Total investment return is calculated exclusive of sales charges and assumes the reinvestment of dividends and distributions. |
| (c) | Total investment return is not annualized. |
| (d) | Total investment return may reflect adjustments to conform to generally accepted accounting principles. |
| (e) | For the year ended November 30, 2015, the Fund accrued $154,807,419 in net deferred income tax benefit, of which $202,049 is attributable to Investor Class. For the period from July 12, 2014 to November 30, 2014, the Fund accrued $70,224,241 in net deferred income tax expense, of which $17,830 of deferred income tax benefit is attributable to Investor Class. |
| (f) | Ratios including/excluding net deferred income tax benefit (expense) includes applicable franchise tax expense for the period. For the year ended November 30, 2015, the Fund accrued $517,762 in franchise tax expense, of which $830 is attributable to Investor Class. |
| (g) | The ratio of expenses excluding net deferred income tax expense to average net assets before waiver and recoupment was 1.50% and 1.51%, for the year ended November 30, 2015 and the period from July 12, 2014 to November 30, 2014. The ratio of expenses excluding net deferred income tax expense to average net assets after waiver and recoupment was 1.50% and 1.51% for the year ended November 30, 2015 and the period from July 12 to November 30, 2014, respectively. |
| 20 | MainStay Cushing MLP Premier Fund | The notes to the financial statements are an integral part of, and should be read in conjunction with, the financial statements. |
Financial Highlights selected per share data and ratios
| Year ended November 30, | ||||||||||||||||||||
| Class C | 2015 | 2014 | 2013*** | 2012*** | 2011*** | |||||||||||||||
Net asset value at beginning of year | $ | 21.36 | $ | 20.79 | $ | 19.14 | $ | 19.73 | $ | 20.26 | ||||||||||
|
|
|
|
|
|
|
|
|
| |||||||||||
Net investment income (loss) (a) | (0.12 | ) | (0.25 | ) | (0.27 | ) | (0.27 | ) | (0.29 | ) | ||||||||||
Net realized and unrealized gain (loss) on investments | (6.09 | ) | 2.16 | 3.26 | 1.02 | 1.06 | ||||||||||||||
|
|
|
|
|
|
|
|
|
| |||||||||||
Total from investment operations | (6.21 | ) | 1.91 | 2.99 | 0.75 | 0.77 | ||||||||||||||
|
|
|
|
|
|
|
|
|
| |||||||||||
| Less dividends and distributions: | ||||||||||||||||||||
From net investment income | — | (0.59 | ) | — | — | — | ||||||||||||||
From return of capital | (1.34 | ) | (0.75 | ) | (1.34 | ) | (1.34 | ) | (1.30 | ) | ||||||||||
|
|
|
|
|
|
|
|
|
| |||||||||||
Total dividends and distributions | (1.34 | ) | (1.34 | ) | (1.34 | ) | (1.34 | ) | (1.30 | ) | ||||||||||
|
|
|
|
|
|
|
|
|
| |||||||||||
Redemption fees retained (a)(b) | — | 0.00 | ‡ | 0.00 | ‡ | 0.00 | ‡ | 0.00 | ‡ | |||||||||||
|
|
|
|
|
|
|
|
|
| |||||||||||
Net asset value at end of year | $ | 13.81 | $ | 21.36 | $ | 20.79 | $ | 19.14 | $ | 19.73 | ||||||||||
|
|
|
|
|
|
|
|
|
| |||||||||||
Total investment return (c) | (30.43 | %) | 9.19 | % | 16.05 | % | 3.82 | % | 3.69 | % | ||||||||||
| Ratios (to average net assets)/Supplemental Data: | ||||||||||||||||||||
Net investment income (loss) (including net deferred income tax benefit (expense)) (d) | 7.56 | % (e) | (5.80 | %) | (9.87 | %) | (3.70 | %) | (2.70 | %) | ||||||||||
Net investment income (loss) (excluding net deferred income tax benefit (expense)) (d) | (1.00 | %)(e) | (1.68 | %) | (1.93 | %) | (1.98 | %) | (2.04 | %) | ||||||||||
Net expenses (including net deferred income tax (benefit) expense) (d)(f) | (6.32 | %)(e) | 6.46 | % | 10.34 | % | 4.12 | % | 3.07 | % | ||||||||||
Expenses (before waiver/recoupment, including net deferred income tax (benefit) | (6.32 | %)(e) | 6.41 | % | 10.32 | % | 4.18 | % | 4.04 | % | ||||||||||
Portfolio turnover rate | 32.35 | % | 20.70 | % | 27.29 | % | 43.32 | % | 72.32 | % | ||||||||||
Net assets at end of year (in 000’s) | $ | 553,892 | $ | 859,193 | $ | 568,837 | $ | 252,473 | $ | 50,321 | ||||||||||
| ** | Inception date. |
| *** | These years were audited by a predecessor audit firm whose opinion was unqualified. |
| ‡ | Less than one cent per share. |
| (a) | Per share data based on average shares outstanding during the period. |
| (b) | Redemption fees were only applicable prior to reorganization. (See Note 1) |
| (c) | Total investment return is calculated exclusive of sales charges and assumes the reinvestment of dividends and distributions. |
| (d) | For the year ended November 30, 2015, the Fund accrued $154,807,419 in net deferred income tax benefit, of which $66,219,265 is attributable to Class C. For the year ended November 30, 2014, the Fund accrued $70,224,241 in net deferred income tax expense, of which $31,069,447 is attributable to Class C. For the year ended November 30, 2013, the Fund accrued $77,002,011 in net deferred income tax expense, of which $33,095,235 is attributable to Class C. For the year ended November 30, 2012, the Fund accrued $7,120,938 in net deferred income tax expense, of which $147,543 is attributable to Class C. For the year ended November 30, 2011, the Fund accrued $452,365 in net deferred income tax expense, of which $147,543 is attributable to Class C. |
| (e) | Ratios including/excluding net deferred income tax benefit (expense) includes applicable franchise tax expense for the period. For the year ended November 30, 2015, the Fund accrued $517,762 in franchise tax expense, of which $220,745 is attributable to Class C. |
| (f) | The ratio of expenses excluding net deferred income tax expense to average net assets before waiver and recoupment was 2.24% 2.29%, 2.38%, 2.46% and 3.37% for the fiscal years ended November 30, 2015, 2014, 2013, 2012 and 2011, respectively. The ratio of expenses excluding net deferred income tax expense to average net assets after waiver and recoupment was 2.24%, 2.34%, 2.40%, 2.40% and 2.40% for the fiscal years ended November 30, 2015, 2014, 2013, 2012 and 2011, respectively. |
| The notes to the financial statements are an integral part of, and should be read in conjunction with, the financial statements. | 21 |
Financial Highlights selected per share data and ratios
| Year ended November 30, | ||||||||||||||||||||
| Class I | 2015 | 2014 | 2013*** | 2012*** | 2011*** | |||||||||||||||
Net asset value at beginning of year | $ | 22.40 | $ | 21.54 | $ | 19.57 | $ | 19.96 | $ | 20.28 | ||||||||||
|
|
|
|
|
|
|
|
|
| |||||||||||
Net investment income (loss) (a) | 0.07 | (0.03 | ) | (0.07 | ) | (0.08 | ) | (0.09 | ) | |||||||||||
Net realized and unrealized gain (loss) on investments | (6.44 | ) | 2.22 | 3.36 | 1.02 | 1.07 | ||||||||||||||
|
|
|
|
|
|
|
|
|
| |||||||||||
Total from investment operations | (6.37 | ) | 2.19 | 3.29 | 0.94 | 0.98 | ||||||||||||||
|
|
|
|
|
|
|
|
|
| |||||||||||
| Less dividends and distributions: | ||||||||||||||||||||
From net investment income | — | (0.59 | ) | — | — | — | ||||||||||||||
From return of capital | (1.34 | ) | (0.75 | ) | (1.34 | ) | (1.34 | ) | (1.30 | ) | ||||||||||
|
|
|
|
|
|
|
|
|
| |||||||||||
Total dividends and distributions | (1.34 | ) | (1.34 | ) | (1.34 | ) | (1.34 | ) | (1.30 | ) | ||||||||||
|
|
|
|
|
|
|
|
|
| |||||||||||
Redemption fees retained (a)(b) | — | 0.01 | 0.02 | 0.01 | 0.00 | ‡ | ||||||||||||||
|
|
|
|
|
|
|
|
|
| |||||||||||
Net asset value at end of year | $ | 14.69 | $ | 22.40 | $ | 21.54 | $ | 19.57 | $ | 19.96 | ||||||||||
|
|
|
|
|
|
|
|
|
| |||||||||||
Total investment return (c) | (29.71 | %) | 10.25 | % | 17.37 | % | 4.81 | % | 4.75 | % | ||||||||||
| Ratios (to average net assets)/Supplemental Data: | ||||||||||||||||||||
Net investment income (loss) (including net deferred income tax benefit (expense)) (d) | 8.53 | % (e) | (2.90 | %) | (8.87 | %) | (2.70 | %) | (1.70 | %) | ||||||||||
Net investment income (loss) (excluding net deferred income tax benefit (expense)) (d) | (0.02 | %)(e) | (0.62 | %) | (0.93 | %) | (0.98 | %) | (1.04 | %) | ||||||||||
Net expenses (including net deferred income tax (benefit) expense) (d)(f) | (7.31 | %)(e) | 3.61 | % | 9.34 | % | 3.12 | % | 2.07 | % | ||||||||||
Expenses (before waiver/recoupment, including net deferred income tax (benefit) | (7.31 | %)(e) | 3.57 | % | 9.32 | % | 3.18 | % | 3.04 | % | ||||||||||
Portfolio turnover rate | 32.35 | % | 20.70 | % | 27.29 | % | 43.32 | % | 72.32 | % | ||||||||||
Net assets at end of year (in 000’s) | $ | 449,755 | $ | 579,546 | $ | 221,196 | $ | 92,104 | $ | 27,847 | ||||||||||
| *** | These years were audited by a predecessor audit firm whose opinion was unqualified. |
| ‡ | Less than one cent per share. |
| (a) | Per share data based on average shares outstanding during the period. |
| (b) | Redemption fees were only applicable prior to reorganization. (See Note 1) |
| (c) | Total investment return is calculated exclusive of sales charges and assumes the reinvestment of dividends and distributions. Class I shares are not subject to sales charges. |
| (d) | For the year ended November 30, 2015, the Fund accrued $154,807,419 in net deferred income tax benefit, of which $48,551,905 is attributable to Class I. For the year ended November 30, 2014, the Fund accrued $70,224,241 in net deferred income tax expense, of which $8,867,624 is attributable to Class I. For the year ended November 30, 2013, the Fund accrued $77,002,011 in net deferred income tax expense, of which $12,140,833 is attributable to Class I. For the year ended November 30, 2012, the Fund accrued $7,120,938 in net deferred income tax expense, of which $1,072,968 is attributable to Class I. For the year ended November 30, 2011, the Fund accrued $452,365 in net deferred income tax expense, of which $92,540 is attributable to Class I. |
| (e) | Ratios including/excluding net deferred income tax benefit (expense) includes applicable franchise tax expense for the period. For the year ended November 30, 2015, the Fund accrued $517,762 in franchise tax expense, of which $167,738 is attributable to Class I. |
| (f) | The ratio of expenses excluding net deferred income tax expense to average net assets before waiver and recoupment was 1.24%, 1.29%, 1.38%, 1.46% and 2.37% for the fiscal years ended November 30, 2015, 2014, 2013, 2012 and 2011, respectively. The ratio of expenses excluding net deferred income tax expense to average net assets after waiver and recoupment was 1.24%, 1.33%, 1.40%, 1.40% and 1.40% for the fiscal years ended November 30, 2015, 2014, 2013, 2012 and 2011, respectively. |
| 22 | MainStay Cushing MLP Premier Fund | The notes to the financial statements are an integral part of, and should be read in conjunction with, the financial statements. |
MainStay Cushing Renaissance Advantage Fund
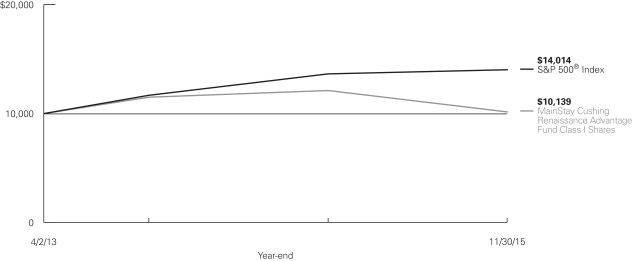
Investment and Performance Comparison1 (Unaudited)
Performance data quoted represents past performance. Past performance is no guarantee of future results. Because of market volatility, current performance may be lower or higher than the figures shown. Investment return and principal value will fluctuate, and as a result, when shares are redeemed, they may be worth more or less than their original cost. The graph below depicts the historical performance of Class I shares of the Fund. Performance will vary from class to class based on differences in class-specific expenses and sales charges. For performance information current to the most recent month-end, please call 800-MAINSTAY (624-6782) or visit mainstayinvestments.com.
Average Annual Total Returns for the Year Ended November 30, 2015
| Class | Sales Charge | One Year | Since | Gross | ||||||||||||
| Class A Shares3 | Maximum 5.5% Initial Sales Charge | With sales charge Excluding sales charge |
| –21.15 –16.57 | %
|
| –1.90 0.31 | %
|
| 1.76 1.76 | %
| |||||
| Investor Class Shares4 | Maximum 5.5% Initial Sales Charge | With sales charge Excluding sales charge | | –21.26 –16.68 | | | –1.92 0.29 | | | 1.88 1.88 | | |||||
| Class C Shares3 | Maximum 1% CDSC if Redeemed Within One Year of Purchase | With sales charge Excluding sales charge | | –18.09 –17.28 | | | –0.43 –0.43 | | | 2.63 2.63 | | |||||
| Class I Shares3 | No Sales Charge | –16.34 | 0.52 | 1.51 | ||||||||||||
| 1. | The performance table and graph do not reflect the deduction of taxes that a shareholder would pay on distributions or Fund share redemptions. Total returns reflect maximum applicable sales charges as indicated in the table above, changes in share price, and reinvestment of dividend and capital gain distributions. The graph assumes the initial investment amount shown above and reflects the deduction of all sales charges that would have applied for the period of investment. Performance figures reflect certain fee waivers and/or expense limitations, without which total returns may have been lower. For more information on share classes and current fee waivers and/or expense limitations, please refer to the notes to the financial statements. |
| 2. | The gross expense ratios presented reflect the Fund’s “Total Annual Fund Operating Expenses” from the most recent Prospectus and may differ from other expense ratios disclosed in this report. |
| 3. | Performance figures for Class A shares, Class C shares and Class I shares reflect the historical performance of the then-existing Class A shares, Class C shares and Class I shares, respectively, of the Cushing® Renaissance Advantage Fund (the predecessor to the Fund, which was subject to a different fee structure) for periods prior to July 11, 2014. The Cushing® Renaissance Advantage Fund commenced operations on April 2, 2013. |
| 4. | Performance figures for Investor Class shares, first offered on July 11, 2014, include the historical performance of Class A shares through July 10, 2014, adjusted for differences in certain expenses and fees. Unadjusted, the performance for Investor Class shares would likely have been different. |
The footnotes on the next page are an integral part of the table and graph and should be carefully read in conjunction with them.
| 23 |
| Benchmark Performance | One Year | Since Inception | ||||||
S&P 500® Index5 | 2.75 | % | 13.51 | % | ||||
Average Lipper Natural Resources Fund6 | –18.03 | –6.74 | ||||||
| 5. | “S&P 500®” is a trademark of The McGraw-Hill Companies, Inc. The S&P 500® Index is widely regarded as the standard index for measuring large-cap U.S. stock market performance. The S&P 500® Index is the Fund’s primary benchmark. Results assume reinvestment of all dividends and capital gains. An investment cannot be made directly in an index. |
| 6. | The average Lipper Natural Resources Fund is representative of funds that invest primarily in the equity securities of domestic companies engaged in |
| the exploration, development, production, or distribution of natural resources (including oil, natural gas, and base minerals) and/or alternative energy sources (including solar, wind, hydro, tidal, and geothermal). This benchmark is a product of Lipper Inc. Lipper Inc. is an independent monitor of fund performance. Results are based on average total returns of similar funds with all dividend and capital gain distributions reinvested. |
The footnotes on the preceding page are an integral part of the table and graph and should be carefully read in conjunction with them.
| 24 | MainStay Cushing Renaissance Advantage Fund |
Cost in Dollars of a $1,000 Investment in MainStay Cushing Renaissance Advantage Fund (Unaudited)
The example below is intended to describe the fees and expenses borne by shareholders during the six-month period from June 1, 2015, to November 30, 2015, and the impact of those costs on your investment.
Example
As a shareholder of the Fund, you incur two types of costs: (1) transaction costs, including exchange fees and sales charges (loads) on purchases (as applicable), and (2) ongoing costs, including management fees, distribution and/or service (12b-1) fees, and other Fund expenses (as applicable). This example is intended to help you understand your ongoing costs (in dollars) of investing in the Fund and to compare these costs with the ongoing costs of investing in other mutual funds. The example is based on an investment of $1,000 made at the beginning of the six-month period and held for the entire period from June 1, 2015, to November 30, 2015.
This example illustrates your Fund’s ongoing costs in two ways:
Actual Expenses
The second and third data columns in the table below provide information about actual account values and actual expenses. You may use the information in these columns, together with the amount you invested, to estimate the expenses that you paid during the six months ended November 30, 2015. Simply divide your account value by $1,000 (for example, an $8,600 account value divided by $1,000 = 8.6), then
multiply the result by the number under the heading entitled “Expenses Paid During Period” to estimate the expenses you paid on your account during this period.
Hypothetical Example for Comparison Purposes
The fourth and fifth data columns in the table below provide information about hypothetical account values and hypothetical expenses based on the Fund’s actual expense ratio and an assumed rate of return of 5% per year before expenses, which is not the Fund’s actual return. The hypothetical account values and expenses may not be used to estimate the actual ending account balances or expenses you paid for the six-month period shown. You may use this information to compare the ongoing costs of investing in the Fund with the ongoing costs of investing in other Funds. To do so, compare this 5% hypothetical example with the 5% hypothetical examples that appear in the shareholder reports of the other Funds.
Please note that the expenses shown in the table are meant to highlight your ongoing costs only and do not reflect any transactional costs, such as exchange fees or sales charges (loads). Therefore, the fourth and fifth data columns of the table are useful in comparing ongoing costs only and will not help you determine the relative total costs of owning different funds. In addition, if these transactional costs were included, your costs would have been higher.
| Share Class | Beginning Value | Ending Account Value (Based | Expenses During | Ending Account Value (Based on Hypothetical 5% Annualized Return and Actual Expenses) 11/30/15 | Expenses During | |||||||||||||||
| Class A Shares | $ | 1,000.00 | $ | 851.00 | $ | 7.84 | $ | 1,016.60 | $ | 8.54 | ||||||||||
| Investor Class Shares | $ | 1,000.00 | $ | 850.50 | $ | 8.49 | $ | 1,015.89 | $ | 9.25 | ||||||||||
| Class C Shares | $ | 1,000.00 | $ | 847.20 | $ | 11.85 | $ | 1,012.23 | $ | 12.91 | ||||||||||
| Class I Shares | $ | 1,000.00 | $ | 852.40 | $ | 6.64 | $ | 1,017.90 | $ | 7.23 | ||||||||||
| 1. | Expenses are equal to the Fund’s annualized expense ratio of each class (1.69% for Class A, 1.83% for Investor Class, 2.56% for Class C and 1.43% for Class I) multiplied by the average account value over the period, divided by 365 and multiplied by 183 for Class A, Investor Class, Class C, and Class I (to reflect the six-month period). The table above represents the actual expenses incurred during the six-month period. |
| 25 |
Portfolio Composition as of November 30, 2015(1) (Unaudited)
(Expressed as a Percentage of Total Investments)

See Portfolio of Investments beginning on page 29 for specific holdings within these categories.
Top Ten Holdings as of November 30, 2015 (excluding short-term investments)
| 1. | Westlake Chemical Corporation |
| 2. | Sempra Energy |
| 3. | Sealed Air Corporation |
| 4. | Phillips 66 |
| 5. | LyondellBasell Industries NV |
| 6. | Marathon Petroleum Corporation |
| 7. | Dominion Resources, Inc. |
| 8. | Ryder Systems, Inc. |
| 9. | The Dow Chemical Company |
| 10. | Wabtec Corporation |
| (1) | Fund holdings and sector allocations are subject to change, and there is no assurance that the Fund will continue to hold any particular security. |
| (2) | Master Limited Partnerships and Related Companies |
| (3) | Common Stocks |
| 26 | MainStay Cushing Renaissance Advantage Fund |
Portfolio Management Discussion and Analysis (Unaudited)
Questions answered by portfolio managers Jerry V. Swank, Matthew A. Lemme, CFA, and Saket Kumar of Cushing Asset Management, LP, the Fund’s Subadvisor.
How did MainStay Cushing Renaissance Advantage Fund perform relative to its primary benchmark and peers during the 12 months ended November 30, 2015?
Excluding all sales charges, MainStay Cushing Renaissance Advantage Fund returned –16.57% for Class A shares, –16.68% for Investor Class shares and –17.28% for Class C shares for the 12 months ended November 30, 2015. Over the same period, Class I shares returned –16.34%. For the 12 months ended November 30, 2015, all share classes underperformed the 2.75% return of the S&P 500® Index,1 which is the Fund’s broad-based securities-market index. Over the same period, all share classes outperformed the –18.03% return of the Average Lipper2 Natural Resources Fund. See page 23 for Fund returns with applicable sales charges.
What factors affected the Fund’s performance relative to the S&P 500® Index during the reporting period?
The Fund’s performance relative to the S&P 500® Index was affected by substantial weakness in crude oil prices during the reporting period. The sectors that drove the performance of the S&P 500® Index, such as information technology, are not included in the Fund’s investable universe.
Which subsectors were the strongest contributors to the Fund’s absolute performance and which subsectors were particularly weak?
During the reporting period, the subsectors that made most substantial contributions to the Fund’s absolute performance were refiners, materials and chemicals. (Contributions take weightings and total returns into account.) The most substantial detractors from the Fund’s absolute performance during the reporting period were the transportation, engineering & construction, and industrials subsectors.
During the reporting period, which individual holdings made the strongest contributions to the Fund’s absolute performance and which holdings detracted the most?
The strongest individual contributors to the Fund’s absolute performance during the reporting period were refining companies Phillips 66, Marathon Petroleum and Valero Energy. All three benefited from extremely strong refining margins caused by strong demand for gasoline and diesel plus historically high crude oil inventories.
The most substantial detractors from the Fund’s absolute performance were shipping companies Teekay Corp. and GasLog Ltd. and liquefied natural gas (“LNG”) producer Cheniere Energy. Each of these companies suffered from concerns that LNG production may no longer be profitable because of the
decline in crude oil prices. Cheniere is the only one of these companies that has direct, though limited, exposure to LNG sales prices. Each of these detractors also has master limited partnership (“MLP”) affiliates and underperformed because of the funding fears that hit the MLP market.
Did the Fund make any significant purchases or sales during the reporting period?
During the reporting period, we increased the Fund’s position in packaging manufacturer Sealed Air Corp. The additional purchases reflected our view that margins would increase because of declining commodity prices. We initiated a Fund position in coatings manufacturer Axalta Coating Systems, Ltd., because we believed that Axalta could benefit from lower oil and natural gas prices and could continue to gain market share.
During the reporting period, we sold the Fund’s position in equipment rental company United Rentals because decreased activity by energy producers created an oversupply of rental equipment, causing rental prices to decline. We also sold the Fund’s position in construction materials producer Eagle Materials. The company’s entry into the fracking sand business came at the same time that crude oil prices were crashing, which caused margins throughout the company to decline.
How did the Fund’s subsector weightings change during the reporting period?
During the reporting period, we increased the Fund’s exposure, as a percentage of net assets, to the transportation sector by over six percentage points, split between trucking and shipping names. Transportation names have traditionally benefited from lower fuel costs and have been profitable as long as goods are traded, regardless of the final sales price. We also increased the Fund’s ownership of companies in the chemicals sector. Many chemical companies purchase derivatives of oil and natural gas for raw materials and thus see margins expand when commodity prices decline.
During the reporting period, we reduced the Fund’s exposure to the industrials sector because we believed that the demand disruption from the energy markets created an oversupply of inventories. We also sold most of the Fund’s engineering & construction holdings. While we believed that many of the proposed projects would ultimately be built, volatility in oil prices caused delays on several projects.
How was the Fund positioned at the end of the reporting period?
As of November 30, 2015, we positioned the Fund in companies that we believed could benefit from lower crude oil and natural gas prices. On the same date, chemicals and trans-
| 1. | See footnote on page 24 for more information on the S&P 500® Index. |
| 2. | See footnote on page 24 for more information on Lipper Inc. |
| 27 |
portation stocks accounted for more than 43% of the Fund’s overall market exposure. We had intentionally built a higher cash balance at the end of the Fund’s previous fiscal year. During the reporting period, we invested the Fund’s assets opportunistically as the oil price decline caused massive share price declines in companies within the Fund’s investment universe.
The opinions expressed are those of the portfolio managers as of the date of this report and are subject to change. There is no guarantee that any forecasts will come to pass. This material does not constitute investment advice and is not intended as an endorsement of any specific investment.
| 28 | MainStay Cushing Renaissance Advantage Fund |
Portfolio of Investments November 30, 2015
| Shares | Value | |||||||
| Common Stocks 87.8%† | ||||||||
Chemicals 21.1% | ||||||||
Bermuda 2.3% | ||||||||
Axalta Coating Systems Ltd. (a) | 165,595 | $ | 4,805,567 | |||||
Canada 1.0% | ||||||||
Methanex Corporation | 55,714 | 2,185,103 | ||||||
Netherlands 4.4% | ||||||||
¨LyondellBasell Industries NV | 97,559 | 9,348,103 | ||||||
United States 13.4% | ||||||||
Air Products & Chemicals, Inc. | 16,477 | 2,255,537 | ||||||
PPG Industries, Inc. | 43,570 | 4,607,092 | ||||||
¨The Dow Chemical Company | 124,196 | 6,474,337 | ||||||
The Sherwin Williams Company | 15,706 | 4,335,955 | ||||||
¨Westlake Chemical Corporation | 173,640 | 10,427,082 | ||||||
|
| |||||||
| 44,438,776 | ||||||||
|
| |||||||
Construction & Engineering 0.9% |
| |||||||
United States 0.9% | ||||||||
Quanta Services, Inc. (a) | 87,976 | 1,939,871 | ||||||
|
| |||||||
Industrials 2.2% | ||||||||
United States 2.2% | ||||||||
General Electric Company | 107,600 | 3,221,544 | ||||||
Mobile Mini, Inc. | 39,242 | 1,391,129 | ||||||
|
| |||||||
| 4,612,673 | ||||||||
|
| |||||||
Machinery 5.9% | ||||||||
United States 5.9% | ||||||||
Allison Transmission, Inc. | 37,405 | 1,045,844 | ||||||
ITT Corporation | 96,829 | 3,845,080 | ||||||
Wabco Holdings, Inc. (a) | 10,000 | 1,074,800 | ||||||
¨Wabtec Corporation | 79,102 | 6,337,652 | ||||||
|
| |||||||
| 12,303,376 | ||||||||
|
| |||||||
Materials 7.5% | ||||||||
United States 7.5% | ||||||||
Martin Marietta Materials, Inc. | 14,996 | 2,360,370 | ||||||
¨Sealed Air Corporation | 215,229 | 9,762,788 | ||||||
Vulcan Materials Company | 35,184 | 3,612,341 | ||||||
|
| |||||||
| 15,735,499 | ||||||||
|
| |||||||
Oil & Gas Equipment & Services 2.7% |
| |||||||
Ireland 1.0% | ||||||||
Weatherford International Plc (a) | 198,739 | 2,148,368 | ||||||
United States 1.7% | ||||||||
Baker Hughes, Inc. | 66,325 | 3,586,193 | ||||||
|
| |||||||
| 5,734,561 | ||||||||
|
| |||||||
Oil & Gas Exploration & Production 5.0% |
| |||||||
United States 5.0% | ||||||||
Anadarko Petroleum Corporation | 51,323 | 3,074,248 | ||||||
Concho Resources, Inc. (a) | 41,343 | 4,524,578 | ||||||
| Shares | Value | |||||||
Oil & Gas Exploration & Production (continued) |
| |||||||
United States (continued) | ||||||||
EOG Resources, Inc. | 25,008 | $ | 2,086,417 | |||||
EQT Corporation | 14,595 | 835,126 | ||||||
|
| |||||||
| 10,520,369 | ||||||||
|
| |||||||
Oil & Gas Refining & Marketing 9.7% |
| |||||||
United States 9.7% | ||||||||
¨Marathon Petroleum Corporation | 149,913 | 8,756,418 | ||||||
¨Phillips 66 | 102,672 | 9,397,568 | ||||||
Tesoro Corporation | 18,538 | 2,135,022 | ||||||
|
| |||||||
| 20,289,008 | ||||||||
|
| |||||||
Oil & Gas Storage & Transportation 8.7% |
| |||||||
Bermuda 4.5% | ||||||||
GasLog Ltd. | 316,008 | 3,782,616 | ||||||
Golar LNG Ltd. | 210,080 | 5,745,688 | ||||||
Republic of the Marshall Islands 3.4% |
| |||||||
Gener8 Maritime, Inc. (a) | 111,733 | 1,082,693 | ||||||
Teekay Corporation | 217,634 | 6,058,930 | ||||||
United States 0.8% |
| |||||||
Kinder Morgan, Inc. | 72,543 | 1,709,839 | ||||||
|
| |||||||
| 18,379,766 | ||||||||
|
| |||||||
Trading Companies & Distributors 1.7% |
| |||||||
United States 1.7% | ||||||||
Fortress Transportation and Infrastructure Investors Ltd. | 143,545 | 1,650,767 | ||||||
Neff Corporation (a) | 219,774 | 1,826,322 | ||||||
|
| |||||||
| 3,477,089 | ||||||||
|
| |||||||
Transportation 13.6% |
| |||||||
Canada 1.8% | ||||||||
Canadian Pacific Railway Ltd. | 26,359 | 3,887,162 | ||||||
United States 11.8% |
| |||||||
CSX Corporation | 41,834 | 1,189,341 | ||||||
J.B. Hunt Transport Services, Inc. | 27,816 | 2,176,324 | ||||||
Kirby Corporation (a) | 39,877 | 2,576,054 | ||||||
Old Dominion Freight Line, Inc. (a) | 45,869 | 2,922,314 | ||||||
¨Ryder Systems, Inc. | 103,711 | 6,840,777 | ||||||
Swift Transportation Company (a) | 245,712 | 3,924,021 | ||||||
XPO Logistics, Inc. (a) | 167,231 | 5,100,545 | ||||||
|
| |||||||
| 28,616,538 | ||||||||
|
| |||||||
Utilities 8.8% |
| |||||||
United States 8.8% | ||||||||
¨Dominion Resources, Inc. | 123,026 | 8,288,262 | ||||||
¨Sempra Energy | 103,957 | 10,315,653 | ||||||
|
| |||||||
| 18,603,915 | ||||||||
|
| |||||||
Total Common Stocks | 184,651,441 | |||||||
|
| |||||||
| † | Calculated as a percentage of net assets applicable to common shareholders. |
| ¨ | Among the Portfolio’s 10 largest holdings or issuers held, as of November 30, 2015, excluding short-term investments. May be subject to change daily. |
| The notes to the financial statements are an integral part of, and should be read in conjunction with, the financial statements. | 29 |
Portfolio of Investments November 30, 2015 (continued)
| Shares | Value | |||||||
| MLPs and Related Companies 9.5% | ||||||||
Oil & Gas Storage & Transportation 9.5% |
| |||||||
Republic of the Marshall Islands 3.9% |
| |||||||
Capital Product Partners, L.P. | 546,239 | $ | 3,441,306 | |||||
GasLog Partners, L.P. | 232,098 | 4,182,406 | ||||||
Hoegh LNG Partners, L.P. | 36,877 | 586,344 | ||||||
United States 5.6% | ||||||||
Energy Transfer Equity, L.P. | 99,003 | 1,875,117 | ||||||
Energy Transfer Partners, L.P. | 48,767 | 1,863,387 | ||||||
Genesis Energy, L.P. | 63,711 | 2,507,028 | ||||||
Sunoco Logistics Partners, L.P. | 197,678 | 5,509,286 | ||||||
|
| |||||||
| 19,964,874 | ||||||||
|
| |||||||
Total MLPs and Related Companies | 19,964,874 | |||||||
|
| |||||||
| Short-Term Investments—Investment Companies 2.6% | ||||||||
United States 2.6% | ||||||||
Invesco Short-Term Treasury Portfolio Fund—Institutional Class, | 1,081,051 | 1,081,051 | ||||||
Fidelity Government Portfolio Fund—Institutional Class, | 1,081,050 | 1,081,050 | ||||||
Fidelity Money Market Portfolio— | 1,081,050 | 1,081,050 | ||||||
| Shares | Value | |||||||
United States (continued) | ||||||||
First American Prime Obligations Fund—Class Z, | 1,081,051 | $ | 1,081,051 | |||||
Invesco STIC Prime Portfolio, | 1,081,051 | 1,081,051 | ||||||
|
| |||||||
Total Short-Term Investments—Investment Companies | 5,405,253 | |||||||
|
| |||||||
Total Investments | 99.9 | % | 210,021,568 | |||||
Other Assets in Excess of Liabilities | 0.1 | 178,293 | ||||||
Net Assets | 100.0 | % | $ | 210,199,861 | ||||
| (a) | No distribution or dividend was made during the period ended November 30, 2015. As such, it is classified as a non-income producing security as of November 30, 2015. |
| (b) | Rate reported is the current yield as of November 30, 2015. |
| (c) | As of November 30, 2015, cost was $223,220,132 for federal income tax purposes and net unrealized depreciation was as follows: |
Gross unrealized appreciation | $ | 11,914,519 | ||
Gross unrealized depreciation | (25,113,083 | ) | ||
|
| |||
Net unrealized depreciation | $ | (13,198,564 | ) | |
|
|
The following is a summary of the fair valuations according to the inputs used as of November 30, 2015, for valuing the Fund’s assets and liabilities.
Asset Valuation Inputs
Description | Quoted Prices in Active Markets for Identical Assets (Level 1) | Significant Other Observable Inputs (Level 2) | Significant Unobservable Inputs (Level 3) | Total | ||||||||||||
| Investments in Securities (a) | ||||||||||||||||
Common Stocks | $ | 184,651,441 | $ | — | $ | — | $ | 184,651,441 | ||||||||
MLPs and Related Companies | 19,964,874 | — | — | 19,964,874 | ||||||||||||
Short-Term Investments | 5,405,253 | — | — | 5,405,253 | ||||||||||||
|
|
|
|
|
|
|
| |||||||||
| Total Investments in Securities | $ | 210,021,568 | $ | — | $ | — | $ | 210,021,568 | ||||||||
|
|
|
|
|
|
|
| |||||||||
| (a) | For a complete listing of investments and their industries, see the Portfolio of Investments. |
The Fund recognizes transfers between the levels as of the beginning of the period.
For the year ended November 30, 2015, the Fund did not have any transfers between Level 1 and Level 2 fair value measurements (See Note 2).
As of November 30, 2015, the Fund did not hold any investments with significant unobservable inputs (Level 3) (See Note 2).
| 30 | MainStay Cushing Renaissance Advantage Fund | The notes to the financial statements are an integral part of, and should be read in conjunction with, the financial statements. |
Statement of Assets and Liabilities as of November 30, 2015
| Assets | ||||
Investments, at value | $ | 210,021,568 | ||
Receivables: | ||||
Dividends and interest | 362,875 | |||
Fund shares sold | 688,614 | |||
Prepaid expenses | 30,949 | |||
|
| |||
Total assets | 211,104,006 | |||
|
| |||
| Liabilities | ||||
Payables: | ||||
Fund shares redeemed | 526,471 | |||
Manager fees (See Note 3) | 219,715 | |||
Transfer agent (See Note 3) | 40,030 | |||
NYLIFE Distributors (See Note 3) | 37,974 | |||
Shareholder communication | 16,241 | |||
Professional fees | 10,315 | |||
Custodian | 1,048 | |||
Trustees | 286 | |||
Accrued expenses | 52,065 | |||
|
| |||
Total liabilities | 904,145 | |||
|
| |||
Net assets | $ | 210,199,861 | ||
|
| |||
| Composition of Net Assets | ||||
Shares of beneficial interest outstanding (par value of $.001 per share) unlimited number of shares authorized | $ | 11,113 | ||
Additional paid-in capital | 290,105,469 | |||
|
| |||
| 290,116,582 | ||||
Distributions in excess of net investment income | (435 | ) | ||
Accumulated net realized gain (loss) on investments | (69,756,121 | ) | ||
Net unrealized appreciation (depreciation) on investments | (10,160,165 | ) | ||
|
| |||
Net assets | $ | 210,199,861 | ||
|
| |||
Class A | ||||
Net assets applicable to outstanding shares | $ | 42,135,121 | ||
|
| |||
Shares of beneficial interest outstanding | 2,227,927 | |||
|
| |||
Net asset value per share outstanding | $ | 18.91 | ||
Maximum sales charge (5.50% of offering price) | 1.04 | |||
|
| |||
Maximum offering price per share outstanding | $ | 19.95 | ||
|
| |||
Investor Class | ||||
Net assets applicable to outstanding shares | $ | 2,989,306 | ||
|
| |||
Shares of beneficial interest outstanding | 158,156 | |||
|
| |||
Net asset value per share outstanding | $ | 18.90 | ||
Maximum sales charge (5.50% of offering price) | 1.04 | |||
|
| |||
Maximum offering price per share outstanding | $ | 19.94 | ||
|
| |||
Class C | ||||
Net assets applicable to outstanding shares | $ | 35,398,329 | ||
|
| |||
Shares of beneficial interest outstanding | 1,910,611 | |||
|
| |||
Net asset value per share outstanding | $ | 18.53 | ||
|
| |||
Class I | ||||
Net assets applicable to outstanding shares | $ | 129,677,105 | ||
|
| |||
Shares of beneficial interest outstanding | 6,816,784 | |||
|
| |||
Net asset value per share outstanding | $ | 19.02 | ||
|
|
| The notes to the financial statements are an integral part of, and should be read in conjunction with, the financial statements. | 31 |
Statement of Operations for the year ended November 30, 2015
| Investment Income (Loss) | ||||
Income | ||||
Dividends and distributions | $ | 5,390,933 | ||
Interest | 4,758 | |||
|
| |||
Total income | 5,395,691 | |||
|
| |||
Expenses | ||||
Manager (See Note 3) | 3,768,959 | |||
Distribution/Service—Class A (See Note 3) | 128,273 | |||
Distribution/Service—Investor Class (See Note 3) | 6,215 | |||
Distribution/Service—Class C (See Note 3) | 423,274 | |||
Transfer agent (See Note 3) | 301,163 | |||
Registration | 266,053 | |||
Shareholder communication | 74,474 | |||
Professional fees | 42,963 | |||
Custodian | 8,548 | |||
Trustees | 5,254 | |||
Miscellaneous | 8,604 | |||
|
| |||
Total expenses | 5,033,780 | |||
Expense waiver/reimbursement from Manager (See Note 3) | (104,517 | ) | ||
|
| |||
Net expenses | 4,929,263 | |||
|
| |||
Net investment income (loss) | 466,428 | |||
|
| |||
| Realized and Unrealized Gain (Loss) on Investments | ||||
Net realized gain (loss) on investments (b) | (62,213,466 | ) | ||
Net change in unrealized appreciation (depreciation) | 12,008,633 | |||
|
| |||
Net realized and unrealized gain (loss) on investments | (50,204,833 | ) | ||
|
| |||
Net increase (decrease) in net assets resulting from operations | $ | (49,738,405 | ) | |
|
| |||
| (a) | Dividends and distributions recorded net of foreign withholding taxes in the amount of $8,265. |
| (b) | Includes realized net loss of $2,678,381 due to an in-kind redemption during the year ended November 30, 2015 (See Note 9). |
| 32 | MainStay Cushing Renaissance Advantage Fund | The notes to the financial statements are an integral part of, and should be read in conjunction with, the financial statements. |
Statements of Changes in Net Assets
| Year ended November 30, 2015 | Year ended November 30, 2014 | |||||||
| Increase (Decrease) in Net Assets | ||||||||
Operations: | ||||||||
Net investment income (loss) | $ | 466,428 | $ | 254,429 | ||||
Net realized gain (loss) on investments | (62,213,466 | ) | (10,615,161 | ) | ||||
Net change in unrealized appreciation (depreciation) on investments | 12,008,633 | (23,486,369 | ) | |||||
|
| |||||||
Net increase (decrease) in net assets resulting from operations | (49,738,405 | ) | (33,847,101 | ) | ||||
|
| |||||||
Dividends and distributions to shareholders: |
| |||||||
From net investment income: | ||||||||
Class A | (76,432 | ) | (30,993 | ) | ||||
Investor Class | (3,845 | ) | (456 | ) | ||||
Class C | (63,830 | ) | (24,795 | ) | ||||
Class I | (313,328 | ) | (144,092 | ) | ||||
|
| |||||||
| (457,435 | ) | (200,336 | ) | |||||
|
| |||||||
From return of capital: | ||||||||
Class A | (1,271,864 | ) | (474,870 | ) | ||||
Investor Class | (63,988 | ) | (6,995 | ) | ||||
Class C | (1,062,162 | ) | (379,894 | ) | ||||
Class I | (5,213,897 | ) | (2,207,751 | ) | ||||
|
| |||||||
| (7,611,911 | ) | (3,069,510 | ) | |||||
|
| |||||||
Total dividends and distributions to shareholders | (8,069,346 | ) | (3,269,846 | ) | ||||
|
| |||||||
Capital share transactions: | ||||||||
Net proceeds from sale of shares | 178,269,549 | 465,017,287 | ||||||
Net asset value of shares issued to shareholders in reinvestment of dividends and distributions | 7,363,670 | 2,784,065 | ||||||
Cost of shares redeemed (a) | (333,773,516 | ) | (40,445,800 | ) | ||||
|
| |||||||
Increase (decrease) in net assets derived from capital share transactions | (148,140,297 | ) | 427,355,552 | |||||
|
| |||||||
Net increase (decrease) in net assets | (205,948,048 | ) | 390,238,605 | |||||
| Net Assets | ||||||||
Beginning of year | 416,147,909 | 25,909,304 | ||||||
|
| |||||||
End of year | $ | 210,199,861 | $ | 416,147,909 | ||||
|
| |||||||
Distributions in excess of net investment income at end of year | $ | (435 | ) | $ | (5,718 | ) | ||
|
| |||||||
| (a) | Includes an in-kind redemption in the amount of $106,860,629 during the year ended November 30, 2015 (See Note 9). |
| The notes to the financial statements are an integral part of, and should be read in conjunction with, the financial statements. | 33 |
Financial Highlights selected per share data and ratios
| Year ended November 30, | April 2, 2013** through November 30, | |||||||||||
| Class A | 2015 | 2014 | 2013*** | |||||||||
Net asset value at beginning of period | $ | 23.29 | $ | 22.65 | $ | 20.00 | ||||||
|
|
|
|
|
| |||||||
Net investment income (loss) (a) | 0.03 | 0.01 | (0.12 | ) | ||||||||
Net realized and unrealized gain (loss) on investments | (3.85 | ) | 1.19 | 3.09 | ||||||||
|
|
|
|
|
| |||||||
Total from investment operations | (3.82 | ) | 1.20 | 2.97 | ||||||||
|
|
|
|
|
| |||||||
| Less dividends and distributions: | ||||||||||||
From net investment income | (0.03 | ) | (0.03 | ) | — | |||||||
From net realized gain on investment | — | — | (0.02 | ) | ||||||||
From return of capital | (0.53 | ) | (0.53 | ) | (0.30 | ) | ||||||
|
|
|
|
|
| |||||||
Total dividends and distributions | (0.56 | ) | (0.56 | ) | (0.32 | ) | ||||||
|
|
|
|
|
| |||||||
Redemption fees retained (a)(b) | — | 0.00 | ‡ | 0.00 | ‡ | |||||||
|
|
|
|
|
| |||||||
Net asset value at end of period | $ | 18.91 | $ | 23.29 | $ | 22.65 | ||||||
|
|
|
|
|
| |||||||
Total investment return (c) | (16.57 | %) | 5.14 | % | 14.92 | % (d) | ||||||
| Ratios (to average net assets)/Supplemental Data: | ||||||||||||
Net investment income (loss) | 0.15 | % | 0.03 | % | (0.83 | %)†† | ||||||
Net expenses | 1.69 | % | 1.80 | % | 2.00 | % †† | ||||||
Expenses (before waiver/reimbursement) | 1.73 | % | 1.81 | % | 5.65 | % †† | ||||||
Portfolio turnover rate | 149.12 | % | 115.22 | % | 23.44 | % | ||||||
Net assets at end of period (in 000’s) | $ | 42,135 | $ | 51,472 | $ | 6,867 | ||||||
| ** | Inception date. |
| *** | This period was audited by a predecessor audit firm whose opinion was unqualified. |
| †† | Annualized. |
| ‡ | Less than one cent per share. |
| (a) | Per share data based on average shares outstanding during the period. |
| (b) | Redemption fees were only applicable prior to reorganization. (See Note 1) |
| (c) | Total investment return is calculated exclusive of sales charges and assumes the reinvestment of dividends and distributions. |
| (d) | Total investment return is not annualized. |
| 34 | MainStay Cushing Renaissance Advantage Fund | The notes to the financial statements are an integral part of, and should be read in conjunction with, the financial statements. |
Financial Highlights selected per share data and ratios
| Investor Class | Year ended November 30, 2015 | July 12, 2014** through November 30, 2014 | ||||||
Net asset value at beginning of period | $ | 23.30 | $ | 26.80 | ||||
|
|
|
| |||||
Net investment income (loss) (a) | 0.00 | ‡ | 0.03 | |||||
Net realized and unrealized gain (loss) on investments | (3.84 | ) | (3.25 | ) | ||||
|
|
|
| |||||
Total from investment operations | (3.84 | ) | (3.22 | ) | ||||
|
|
|
| |||||
| Less dividends and distributions: | ||||||||
From net investment income | (0.03 | ) | (0.02 | ) | ||||
From return of capital | (0.53 | ) | (0.26 | ) | ||||
|
|
|
| |||||
Total dividends and distributions | (0.56 | ) | (0.28 | ) | ||||
|
|
|
| |||||
Net asset value at end of period | $ | 18.90 | $ | 23.30 | ||||
|
|
|
| |||||
Total investment return (b)(c) | (16.68 | %) | (12.10 | %)(d) | ||||
| Ratios (to average net assets)/Supplemental Data: | ||||||||
Net investment income (loss) | 0.01 | % | 0.31 | % †† | ||||
Net expenses | 1.83 | % | 1.70 | % †† | ||||
Expenses (before waiver/reimbursement) | 1.87 | % | 1.70 | % †† | ||||
Portfolio turnover rate | 149.12 | % | 115.22 | % | ||||
Net assets at end of period (in 000’s) | $ | 2,989 | $ | 1,651 | ||||
| ** | Inception date. |
| †† | Annualized. |
| ‡ | Less than one cent per share. |
| (a) | Per share data based on average shares outstanding during the period. |
| (b) | Total investment return is calculated exclusive of sales charges and assumes the reinvestment of dividends and distributions. |
| (c) | Total investment return may reflect adjustments to conform to generally accepted accounting principles. |
| (d) | Total investment return is not annualized. |
| The notes to the financial statements are an integral part of, and should be read in conjunction with, the financial statements. | 35 |
Financial Highlights selected per share data and ratios
| Year ended November 30, | April 2, 2013** through November 30, | |||||||||||
| Class C | 2015 | 2014 | 2013*** | |||||||||
Net asset value at beginning of period | $ | 23.02 | $ | 22.56 | $ | 20.00 | ||||||
|
|
|
|
|
| |||||||
Net investment income (loss) (a) | (0.15 | ) | (0.16 | ) | (0.23 | ) | ||||||
Net realized and unrealized gain (loss) on investments | (3.78 | ) | 1.18 | 3.11 | ||||||||
|
|
|
|
|
| |||||||
Total from investment operations | (3.93 | ) | 1.02 | 2.88 | ||||||||
|
|
|
|
|
| |||||||
| Less dividends and distributions: | ||||||||||||
From net investment income | (0.03 | ) | (0.03 | ) | — | |||||||
From net realized gain on investment | — | — | (0.02 | ) | ||||||||
From return of capital | (0.53 | ) | (0.53 | ) | (0.30 | ) | ||||||
|
|
|
|
|
| |||||||
Total dividends and distributions | (0.56 | ) | (0.56 | ) | (0.32 | ) | ||||||
|
|
|
|
|
| |||||||
Redemption fees retained (a)(b) | — | 0.00 | ‡ | — | ||||||||
|
|
|
|
|
| |||||||
Net asset value at end of period | $ | 18.53 | $ | 23.02 | $ | 22.56 | ||||||
|
|
|
|
|
| |||||||
Total investment return (c) | (17.28 | %) | 4.40 | % | 14.47 | % (d) | ||||||
| Ratios (to average net assets)/Supplemental Data: | ||||||||||||
Net investment income (loss) | (0.72 | %) | (0.65 | %) | (1.58 | %)†† | ||||||
Net expenses | 2.56 | % | 2.52 | % | 2.75 | % †† | ||||||
Expenses (before waiver/reimbursement) | 2.60 | % | 2.53 | % | 6.40 | % †† | ||||||
Portfolio turnover rate | 149.12 | % | 115.22 | % | 23.44 | % | ||||||
Net assets at end of period (in 000’s) | $ | 35,398 | $ | 47,022 | $ | 2,263 | ||||||
| ** | Inception date. |
| *** | This period was audited by a predecessor audit firm whose opinion was unqualified. |
| †† | Annualized. |
| ‡ | Less than one cent per share. |
| (a) | Per share data based on average shares outstanding during the period. |
| (b) | Redemption fees were only applicable prior to reorganization. (See Note 1) |
| (c) | Total investment return is calculated exclusive of sales charges and assumes the reinvestment of dividends and distributions. |
| (d) | Total investment return is not annualized. |
| 36 | MainStay Cushing Renaissance Advantage Fund | The notes to the financial statements are an integral part of, and should be read in conjunction with, the financial statements. |
Financial Highlights selected per share data and ratios
| Year ended November 30, | April 2, 2013** through November 30, | |||||||||||
| Class I | 2015 | 2014 | 2013*** | |||||||||
Net asset value at beginning of period | $ | 23.36 | $ | 22.66 | $ | 20.00 | ||||||
|
|
|
|
|
| |||||||
Net investment income (loss) (a) | 0.07 | 0.09 | (0.08 | ) | ||||||||
Net realized and unrealized gain (loss) on investments | (3.85 | ) | 1.17 | 3.06 | ||||||||
|
|
|
|
|
| |||||||
Total from investment operations | (3.78 | ) | 1.26 | 2.98 | ||||||||
|
|
|
|
|
| |||||||
| Less dividends and distributions: | ||||||||||||
From net investment income | (0.03 | ) | (0.03 | ) | — | |||||||
From net realized gain on investment | — | — | (0.02 | ) | ||||||||
From return of capital | (0.53 | ) | (0.53 | ) | (0.30 | ) | ||||||
|
|
|
|
|
| |||||||
Total dividends and distributions | (0.56 | ) | (0.56 | ) | (0.32 | ) | ||||||
|
|
|
|
|
| |||||||
Redemption fees retained (a)(b) | — | 0.00 | ‡ | 0.00 | ‡ | |||||||
|
|
|
|
|
| |||||||
Net asset value at end of period | $ | 19.02 | $ | 23.36 | $ | 22.66 | ||||||
|
|
|
|
|
| |||||||
Total investment return (c) | (16.34 | %) | 5.41 | % | 14.97 | % (d) | ||||||
| Ratios (to average net assets)/Supplemental Data: | ||||||||||||
Net investment income (loss) | 0.34 | % | 0.37 | % | (0.58 | %)†† | ||||||
Net expenses | 1.43 | % | 1.51 | % | 1.75 | % †† | ||||||
Expenses (before waiver/reimbursement) | 1.46 | % | 1.52 | % | 5.40 | % †† | ||||||
Portfolio turnover rate | 149.12 | % | 115.22 | % | 23.44 | % | ||||||
Net assets at end of period (in 000’s) | $ | 129,677 | $ | 316,002 | $ | 16,779 | ||||||
| ** | Inception date. |
| *** | This period was audited by a predecessor audit firm whose opinion was unqualified. |
| †† | Annualized. |
| ‡ | Less than one cent per share. |
| (a) | Per share data based on average shares outstanding during the period. |
| (b) | Redemption fees were only applicable prior to reorganization. (See Note 1) |
| (c) | Total investment return is calculated exclusive of sales charges and assumes the reinvestment of dividends and distributions. Class I shares are not subject to sales charges. |
| (d) | Total investment return is not annualized. |
| The notes to the financial statements are an integral part of, and should be read in conjunction with, the financial statements. | 37 |
MainStay Cushing Royalty Energy Income Fund
Investment and Performance Comparison1 (Unaudited)
Performance data quoted represents past performance. Past performance is no guarantee of future results. Because of market volatility, current performance may be lower or higher than the figures shown. Investment return and principal value will fluctuate, and as a result, when shares are redeemed, they may be worth more or less than their original cost. The graph below depicts the historical performance of Class I shares of the Fund. Performance will vary from class to class based on differences in class-specific expenses and sales charges. For performance information current to the most recent month-end, please call 800-MAINSTAY (624-6782) or visit mainstayinvestments.com.
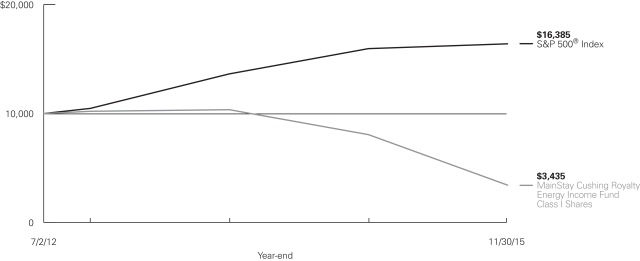
Average Annual Total Returns for the Year Ended November 30, 2015
| Class | Sales Charge | One Year | Since Inception (7/2/12) | Gross Expense Ratio2 | ||||||||||||
| Class A Shares3 | Maximum 5.5% Initial Sales Charge | With sales charge Excluding sales charge |
| –59.90 –57.56 | %
|
| –28.31 –27.06 | %
|
| 1.88 1.88 | %
| |||||
| Investor Class Shares4 | Maximum 5.5% Initial Sales Charge | With sales charge Excluding sales charge |
| –59.90 –57.56 |
|
| –28.31 –27.06 |
|
| 1.90 1.90 |
| |||||
| Class C Shares3 | Maximum 1% CDSC if Redeemed Within One Year of Purchase | With sales charge Excluding sales charge |
| –58.30 –57.93 |
|
| –27.61 –27.61 |
|
| 2.65 2.65 |
| |||||
| Class I Shares3 | No Sales Charge | –57.47 | –26.88 | 1.63 | ||||||||||||
| 1. | The performance table and graph do not reflect the deduction of taxes that a shareholder would pay on distributions or Fund share redemptions. Total returns reflect maximum applicable sales charges as indicated in the table above, changes in share price, and reinvestment of dividend and capital gain distributions. The graph assumes the initial investment amount shown above and reflects the deduction of all sales charges that would have applied for the period of investment. Performance figures reflect certain fee waivers and/or expense limitations, without which total returns may have been lower. For more information on share classes and current fee waivers and/or expense limitations, please refer to the notes to the financial statements. |
| 2. | The gross expense ratios presented reflect the Fund’s “Total Annual Fund Operating Expenses” from the most recent Prospectus and may differ from other expense ratios disclosed in this report. |
| 3. | Performance figures for Class A shares, Class C shares and Class I shares reflect the historical performance of the then-existing Class A shares, Class C shares and Class I shares, respectively, of the Cushing® Royalty Energy Income Fund (the predecessor to the Fund, which was subject to a different fee structure) for periods prior to July 11, 2014. The Cushing® Royalty Energy Income Fund commenced operations on July 2, 2012. |
| 4. | Performance figures for Investor Class shares, first offered on July 11, 2014, include the historical performance of Class A shares through July 10, 2014, adjusted to reflect differences in certain fees and expenses. Unadjusted, the performance for Investor Class shares would likely have been different. |
The footnotes on the next page are an integral part of the table and graph and should be carefully read in conjunction with them.
| 38 | MainStay Cushing Royalty Energy Income Fund |
| Benchmark Performance | One Year | Since Inception | ||||||
S&P 500® Index5 | 2.75 | % | 15.57 | % | ||||
Average Lipper Energy MLP Fund6 | –32.52 | % | –2.65 | |||||
| 5. | “S&P 500®” is a trademark of The McGraw-Hill Companies, Inc. The S&P 500® Index is widely regarded as the standard index for measuring large-cap U.S. stock market performance. The S&P 500® Index is the Fund’s primary benchmark. Results assume reinvestment of all dividends and capital gains. An investment cannot be made directly in an index. |
| 6. | The average Lipper Energy MLP Fund is representative of funds that invest primarily in Master Limited Partnerships (MLPs) engaged in the |
| transportation, storage and processing of minerals and natural resources. This benchmark is a product of Lipper Inc. Lipper Inc. is an independent monitor of fund performance. Results are based on average total returns of similar funds with all dividend and capital gain distributions reinvested. |
The footnotes on the preceding page are an integral part of the table and graph and should be carefully read in conjunction with them.
| 39 |
Cost in Dollars of a $1,000 Investment in MainStay Cushing Royalty Energy Income Fund (Unaudited)
The example below is intended to describe the fees and expenses borne by shareholders during the six-month period from June 1, 2015, to November 30, 2015, and the impact of those costs on your investment.
Example
As a shareholder of the Fund, you incur two types of costs: (1) transaction costs, including exchange fees and sales charges (loads) on purchases (as applicable), and (2) ongoing costs, including management fees, distribution and/or service (12b-1) fees, and other Fund expenses (as applicable). This example is intended to help you understand your ongoing costs (in dollars) of investing in the Fund and to compare these costs with the ongoing costs of investing in other mutual funds. The example is based on an investment of $1,000 made at the beginning of the six-month period and held for the entire period from June 1, 2015, to November 30, 2015.
This example illustrates your Fund’s ongoing costs in two ways:
Actual Expenses
The second and third data columns in the table below provide information about actual account values and actual expenses. You may use the information in these columns, together with the amount you invested, to estimate the expenses that you paid during the six months ended November 30, 2015. Simply divide your account value by $1,000 (for example, an $8,600 account value divided by $1,000 = 8.6), then
multiply the result by the number under the heading entitled “Expenses Paid During Period” to estimate the expenses you paid on your account during this period.
Hypothetical Example for Comparison Purposes
The fourth and fifth data columns in the table below provide information about hypothetical account values and hypothetical expenses based on the Fund’s actual expense ratio and an assumed rate of return of 5% per year before expenses, which is not the Fund’s actual return. The hypothetical account values and expenses may not be used to estimate the actual ending account balances or expenses you paid for the six-month period shown. You may use this information to compare the ongoing costs of investing in the Fund with the ongoing costs of investing in other Funds. To do so, compare this 5% hypothetical example with the 5% hypothetical examples that appear in the shareholder reports of the other Funds.
Please note that the expenses shown in the table are meant to highlight your ongoing costs only and do not reflect any transactional costs, such as exchange fees or sales charges (loads). Therefore, the fourth and fifth data columns of the table are useful in comparing ongoing costs only and will not help you determine the relative total costs of owning different funds. In addition, if these transactional costs were included, your costs would have been higher.
| Share Class | Beginning Account Value 6/1/15 | Ending Account Value (Based on Actual Expenses) | Expenses During | Ending Account Value (Based on Hypothetical 5% Annualized Return and Actual Expenses) 11/30/15 | Expenses During | |||||||||||||||
| Class A Shares | $ | 1,000.00 | $ | 590.90 | $ | 6.90 | $ | 1,016.39 | $ | 8.74 | ||||||||||
| Investor Class Shares | $ | 1,000.00 | $ | 590.90 | $ | 7.26 | $ | 1,015.94 | $ | 9.20 | ||||||||||
| Class C Shares | $ | 1,000.00 | $ | 588.50 | $ | 10.07 | $ | 1,012.38 | $ | 12.76 | ||||||||||
| Class I Shares | $ | 1,000.00 | $ | 591.20 | $ | 5.90 | $ | 1,017.65 | $ | 7.49 | ||||||||||
| 1. | Expenses are equal to the Fund’s annualized expense ratio of each class (1.73% for Class A, 1.82% for Investor Class, 2.53% for Class C and 1.48% for Class I) multiplied by the average account value over the period, divided by 365 and multiplied by 183 for Class A, Investor Class, Class C, and Class I (to reflect the six-month period). The table above represents the actual expenses incurred during the six-month period. |
| 40 | MainStay Cushing Royalty Energy Income Fund |
Portfolio Composition as of November 30, 2015(1) (Unaudited)
(Expressed as a Percentage of Total Investments)

See Portfolio of Investments beginning on page 44 for specific holdings within these categories.
Top Ten Holdings as of November 30, 2015 (excluding short-term investments)
| 1. | Vanguard Natural Resources, LLC |
| 2. | ONEOK Partners, L.P. |
| 3. | Legacy Reserves, L.P. |
| 4. | Energy Transfer Partners, L.P. |
| 5. | Chevron Corporation |
| 6. | Dorchester Minerals, L.P. |
| 7. | Memorial Production Partners, L.P. |
| 8. | Pioneer Natural Resource Co. |
| 9. | NuStar Energy, L.P. |
| 10. | Occidental Petroleum Corporation |
| (1) | Fund holdings and sector allocations are subject to change, and there is no assurance that the Fund will continue to hold any particular security. |
| (2) | Master Limited Partnerships and Related Companies |
| (3) | Common Stocks |
| (4) | Fixed Income |
| 41 |
Portfolio Management Discussion and Analysis (Unaudited)
Questions answered by portfolio managers Jerry V. Swank and Judd B. Cryer of Cushing Asset Management, LP, the Fund’s Subadvisor.
How did MainStay Cushing Royalty Energy Income Fund perform relative to its primary benchmark and peers during the 12 months ended November 30, 2015?
Excluding all sales charges, MainStay Cushing Royalty Energy Income Fund returned –57.56% for Class A shares and Investor Class shares and –57.93% for Class C shares for the 12 months ended November 30, 2015. Over the same period, Class I shares returned –57.47%. For the 12 months ended November 30, 2015, all share classes underperformed the 2.75% return of the S&P 500® Index,1 which is the Fund’s broad-based securities-market index. Over the same period, all share classes underperformed the –32.52% return of the Average Lipper2 Energy MLP Fund. See page 38 for Fund returns with applicable sales charges.
Were there any changes to the Fund?
Effective December 7, 2015, Daniel L. Spears no longer serves as a portfolio manager of the Fund. Jerry V. Swank and Judd B. Cryer will continue to manage the Fund.
What factors affected the Fund’s performance relative to the S&P 500® Index during the reporting period?
The most significant factors that affected the Fund’s performance relative to the S&P 500® Index during the reporting period were the continued decline in domestic and international crude oil prices, the continued decline in volatility, the decline of energy company fundamentals, and further reductions in distribution rates by U.S. royalty trusts and upstream master limited partnerships (“upstream MLPs”) held by the Fund. The S&P 500® Index includes stocks across many sectors, while the Fund’s exposure is limited to the energy sector. As a result, the continued weakness in crude oil prices led the Fund to substantially underperform the S&P 500® Index during the reporting period. In addition, unlike the S&P 500® Index, the Fund is subject to fees and expenses and is taxed as a regular corporation for federal income tax purposes, which may have a negative effect on the Fund’s performance relative to the Index.
Which subsectors were the strongest contributors to the Fund’s absolute performance and which subsectors were particularly weak?
The Fund invests primarily in three subsectors: upstream MLPs; U.S. royalty trusts and Canadian royalty trusts and exploration and production (“E&P”) companies (collectively, “Energy Trusts”); and other energy companies (“Other Energy Companies”). All three of these subsectors provided negative absolute performance for the Fund during the reporting period, primarily as a result of continuing declines in crude oil prices.
The top contributors to the Fund’s absolute performance during the reporting period were from the upstream MLPs and Other Energy Companies subsectors. (Contributions take weightings and total returns into account.) On average, these subsectors represented the second-highest and highest Fund weightings, respectively, during the reporting period.
The subsector with the weakest contribution to the Fund’s absolute performance during the reporting period was Energy Trusts. Canadian E&P companies had the third highest weighting, while U.S. royalty trusts had a negligible weighting.
During the reporting period, which individual holdings made the strongest contributions to the Fund’s absolute performance and which holdings detracted the most?
The strongest positive contribution to the Fund’s absolute performance came from Alon USA Partners, L.P., a crude oil refining midstream MLP. This was followed by Delek Logistics Partners, L.P., a crude oil and refined product logistics midstream MLP, and Pioneer Natural Resources Co., an independent E&P company. Among these strong contributors, only Pioneer Natural Resources had a negative total return for the reporting period.
The greatest detractor from the Fund’s absolute performance during the reporting period was EV Energy Partners, L.P., an upstream MLP. This was followed by upstream MLPs Legacy Reserves, L.P., and Vanguard Natural Resources, LLC. Each of these detractors had negative absolute performance driven by the fall in crude oil prices.
Did the Fund make any significant purchases or sales during the reporting period?
During the reporting period, many energy companies experienced significant share price declines and weakened fundamentals because of the decline in crude oil prices. Energy Trusts and upstream MLPs and unit prices were particularly hard hit as the cash flows of these businesses shrank and leverage increased. Because of the high degree of volatility and the decline in fundamentals for the subsector, we decreased the Fund’s overall exposure to Energy Trusts and upstream MLPs and replaced exposure to these subsectors through investments in integrated energy companies and certain large-capitalization oil and natural gas E&P companies. Large purchases included positions in integrated energy company Chevron and E&P companies Occidental Petroleum and EOG Resources. We purchased positions in these companies because of their size, their more conservative balance sheets comparable to peers and the nature of their exposure to crude oil prices.
| 1. | See footnote on page 39 for more information on the S&P 500® Index. |
| 2. | See footnote on page 39 for more information on Lipper Inc. |
| 42 | MainStay Cushing Royalty Energy Income Fund |
During the reporting period, we sold the Fund’s positions in three upstream MLPs: Linn Energy, LLC, BreitBurn Energy Partners, L.P., and Atlas Resource Partners, L.P. These positions were sold because of their high debt levels, distressed fundamentals (because of falling prices for crude oil and natural gas liquids), and unsustainable distribution levels.
How did the Fund’s subsector weightings change during the reporting period?
During the reporting period, we decreased the Fund’s exposure to the upstream MLP and Energy Trust subsectors. We increased the Fund’s exposure to Other Energy Companies,
which included integrated energy companies, oil and natural gas E&P companies, and midstream MLPs. The Fund’s exposure to Canadian E&P companies remained relatively unchanged during the reporting period.
How was the Fund positioned at the end of the reporting period?
As of November 30, 2015, the Fund’s largest subsector position was in Other Energy Companies at 68.4%, followed by upstream MLPs at 24.1% and Canadian E&P companies at 4.5%. There was minimal exposure to U.S. and Canadian royalty trusts.
The opinions expressed are those of the portfolio managers as of the date of this report and are subject to change. There is no guarantee that any forecasts will come to pass. This material does not constitute investment advice and is not intended as an endorsement of any specific investment.
| 43 |
Portfolio of Investments November 30, 2015
| Shares | Value | |||||||
| Common Stocks 38.8%† | ||||||||
Integrated Oil & Gas 16.2% | ||||||||
Canada 1.8% | ||||||||
Cenovus Energy Inc. | 125,000 | $ | 1,850,000 | |||||
Netherlands 2.6% | ||||||||
Royal Dutch Shell Plc | 53,000 | 2,637,280 | ||||||
United States 11.8% | ||||||||
¨Chevron Corporation | 46,900 | 4,282,908 | ||||||
Exxon Mobil Corporation | 44,900 | 3,666,534 | ||||||
¨Occidental Petroleum Corporation | 54,800 | 4,142,332 | ||||||
|
| |||||||
| 16,579,054 | ||||||||
|
| |||||||
Oil & Gas Exploration & Production 20.2% |
| |||||||
Canada 2.0% | ||||||||
Vermilion Energy Inc. | 70,500 | 2,111,120 | ||||||
United States 18.2% | ||||||||
Anadarko Petroleum Corporation | 54,400 | 3,258,560 | ||||||
ConocoPhillips Co. | 70,515 | 3,811,336 | ||||||
Devon Energy Corporation | 72,311 | 3,327,029 | ||||||
EOG Resource, Inc. | 48,656 | 4,059,370 | ||||||
¨Pioneer Natural Resource Co. | 29,138 | 4,217,725 | ||||||
|
| |||||||
| 20,785,140 | ||||||||
|
| |||||||
Upstream 2.4% | ||||||||
Canada 2.4% | ||||||||
ARC Resources Ltd. | 180,677 | 2,475,862 | ||||||
|
| |||||||
Total Common Stocks | 39,840,056 | |||||||
|
| |||||||
| MLPs and Related Companies 56.8% | ||||||||
Crude Oil & Refined Products 4.1% | ||||||||
United States 4.1% | ||||||||
¨NuStar Energy, L.P. | 105,000 | 4,202,100 | ||||||
|
| |||||||
Large Cap Diversified 12.3% | ||||||||
United States 12.3% | ||||||||
¨Energy Transfer Partners, L.P. | 113,172 | 4,324,302 | ||||||
¨ONEOK Partners, L.P. | 157,000 | 4,746,110 | ||||||
Williams Partners, L.P. | 132,000 | 3,619,440 | ||||||
|
| |||||||
| 12,689,852 | ||||||||
|
| |||||||
Natural Gas Gatherers & Processors 6.7% | ||||||||
United States 6.7% | ||||||||
Enable Midstream Partners, L.P. | 359,000 | 3,374,600 | ||||||
Targa Resources Partners, L.P. | 156,100 | 3,565,324 | ||||||
|
| |||||||
| 6,939,924 | ||||||||
|
| |||||||
Propane 1.2% | ||||||||
United States 1.2% | ||||||||
NGL Energy Partners, L.P. | 70,000 | 1,228,500 | ||||||
|
| |||||||
Shares | Value | |||||||
Shipping 8.4% | ||||||||
Republic of the Marshall Islands 8.4% | ||||||||
Capital Products Partners, L.P. | 535,295 | $ | 3,372,359 | |||||
Golar LNG Partner, L.P. | 201,500 | 2,889,510 | ||||||
Teekay Offshore Partners, L.P. | 175,000 | 2,325,750 | ||||||
|
| |||||||
| 8,587,619 | ||||||||
|
| |||||||
Upstream 24.1% | ||||||||
United States 24.1% | ||||||||
¨Dorchester Minerals, L.P. | 319,598 | 4,241,065 | ||||||
EV Energy Partners, L.P. | 1,030,279 | 3,595,674 | ||||||
¨Legacy Reserves, L.P. | 1,473,776 | 4,598,181 | ||||||
¨Memorial Production Partners, L.P. | 1,158,035 | 4,238,408 | ||||||
Mid-Con Energy Partners, L.P. | 460,244 | 1,072,368 | ||||||
¨Vanguard Natural Resources, LLC | 1,191,967 | 6,806,132 | ||||||
Viper Energy Partners, L.P. | 12,000 | 183,000 | ||||||
|
| |||||||
| 24,734,828 | ||||||||
|
| |||||||
Total MLPs and Related Companies | 58,382,823 | |||||||
|
| |||||||
| Principal | ||||||||
| Fixed Income 2.5% | ||||||||
Oil & Gas Exploration & Production 1.4% |
| |||||||
United States 1.4% | ||||||||
Sanchez Energy Corporation | $ | 2,000,000 | 1,385,000 | |||||
|
| |||||||
Upstream 1.1% | ||||||||
United State 1.1% | ||||||||
Legacy Reserves L.P. | 1,500,000 | 596,250 | ||||||
Memorial Production Partners, L.P. | 1,000,000 | 560,000 | ||||||
|
| |||||||
| 1,156,250 | ||||||||
|
| |||||||
Total Fixed Income | 2,541,250 | |||||||
|
| |||||||
| Shares | ||||||||
| Short-Term Investments—Investment Companies 1.6% | ||||||||
United States 1.6% | ||||||||
Invesco Short-Term Treasury Portfolio Fund— | 324,897 | 324,897 | ||||||
Fidelity Government Portfolio Fund— | 324,897 | 324,897 | ||||||
| † | Calculated as a percentage of net assets applicable to common shareholders. |
| ¨ | Among the Portfolio’s 10 largest holdings or issuers held, as of November 30, 2015, excluding short-term investments. May be subject to change daily. |
| 44 | MainStay Cushing Royalty Energy Income Fund | The notes to the financial statements are an integral part of, and should be read in conjunction with, the financial statements. |
| Shares | Value | |||||||
| Short-Term Investments—Investment Companies (continued) | ||||||||
United States (continued) | ||||||||
Fidelity Money Market Portfolio— | 324,897 | $ | 324,897 | |||||
First American Government Obligations Fund—Class Z, | 324,896 | 324,896 | ||||||
Invesco STIC Prime Portfolio, | 324,897 | 324,897 | ||||||
|
| |||||||
Total Short-Term Investments—Investment Companies | 1,624,484 | |||||||
|
| |||||||
Total Investments | 99.7 | % | 102,388,613 | |||||
Other Assets in Excess of Liabilities | 0.3 | 264,453 | ||||||
Net Assets | 100.0 | % | $ | 102,653,066 | ||||
| (a) | Rate reported is the current yield as of November 30, 2015. |
| (b) | As of November 30, 2015, cost was $217,463,481 for federal income tax purposes and net unrealized depreciation was as follows: |
Gross unrealized appreciation | $ | 1,713,434 | ||
Gross unrealized depreciation | (116,788,302 | ) | ||
|
| |||
Net unrealized depreciation | $ | (115,074,868 | ) | |
|
|
The following is a summary of the fair valuations according to the inputs used as of November 30, 2015, for valuing the Fund’s assets and liabilities.
Asset Valuation Inputs
Description | Quoted Prices in Active Markets for Identical Assets (Level 1) | Significant Other Observable Inputs (Level 2) | Significant (Level 3) | Total | ||||||||||||
| Investments in Securities (a) | ||||||||||||||||
Common Stocks | $ | 39,840,056 | $ | — | $ | — | $ | 39,840,056 | ||||||||
Fixed Income | 2,541,250 | — | — | 2,541,250 | ||||||||||||
MLPs and Related Companies | 58,382,823 | — | — | 58,382,823 | ||||||||||||
Short-Term Investments | 1,624,484 | — | — | 1,624,484 | ||||||||||||
|
|
|
|
|
|
|
| |||||||||
| Total Investments in Securities | $ | 102,388,613 | $ | — | $ | — | $ | 102,388,613 | ||||||||
|
|
|
|
|
|
|
| |||||||||
| (a) | For a complete listing of investments and their industries, see the Portfolio of Investments. |
The Fund recognizes transfers between the levels as of the beginning of the period.
For the year ended November 30, 2015, the Fund did not have any transfers between Level 1 and Level 2 fair value measurements (See Note 2).
As of November 30, 2015, the Fund did not hold any investments with significant unobservable inputs (Level 3) (see Note 2).
| The notes to the financial statements are an integral part of, and should be read in conjunction with, the financial statements. | 45 |
Statement of Assets and Liabilities as of November 30, 2015
| Assets | ||||
Investments, at value | $ | 102,388,613 | ||
Receivables: | ||||
Fund shares sold | 247,502 | |||
Dividends and interest | 475,064 | |||
Prepaid expenses | 88,422 | |||
|
| |||
Total assets | 103,199,601 | |||
|
| |||
| Liabilities | ||||
Payables: | ||||
Fund shares redeemed | 206,341 | |||
Advisory fees (See Note 3) | 96,035 | |||
NYLIFE Distributors (See Note 3) | 51,333 | |||
Transfer agent (See Note 3) | 47,672 | |||
Professional fees | 51,008 | |||
Custodian | 2,247 | |||
Trustees | 305 | |||
Franchise taxes | 54,708 | |||
Accrued expenses | 36,886 | |||
|
| |||
Total liabilities | 546,535 | |||
|
| |||
Net assets | $ | 102,653,066 | ||
|
| |||
| Composition of Net Assets | ||||
Shares of beneficial interest outstanding (par value of $.001 per share) unlimited number of shares authorized | $ | 20,820 | ||
Additional paid-in capital | 348,328,220 | |||
|
| |||
| 348,349,040 | ||||
Accumulated net investment loss, net of income taxes | (1,310,164 | ) | ||
Accumulated net realized gain (loss) on investments, net of income taxes | (133,574,767 | ) | ||
Net unrealized appreciation (depreciation) on investments, net of income taxes | (110,811,043 | ) | ||
|
| |||
Net assets | $ | 102,653,066 | ||
|
| |||
Class A | ||||
Net assets applicable to outstanding shares | $ | 48,884,825 | ||
|
| |||
Shares of beneficial interest outstanding | 9,864,742 | |||
|
| |||
Net asset value per share outstanding | $ | 4.96 | ||
Maximum sales charge (5.50% of offering price) | 0.27 | |||
|
| |||
Maximum offering price per share outstanding | $ | 5.23 | ||
|
| |||
Investor Class | ||||
Net assets applicable to outstanding shares | $ | 2,554,244 | ||
|
| |||
Shares of beneficial interest outstanding | 515,621 | |||
|
| |||
Net asset value per share outstanding | $ | 4.95 | ||
Maximum sales charge (5.50% of offering price) | 0.27 | |||
|
| |||
Maximum offering price per share outstanding | $ | 5.22 | ||
|
| |||
Class C | ||||
Net assets applicable to outstanding shares | $ | 25,052,542 | ||
|
| |||
Shares of beneficial interest outstanding | 5,214,570 | |||
|
| |||
Net asset value per share outstanding | $ | 4.80 | ||
|
| |||
Class I | ||||
Net assets applicable to outstanding shares | $ | 26,161,455 | ||
|
| |||
Shares of beneficial interest outstanding | 5,225,087 | |||
|
| |||
Net asset value per share outstanding | $ | 5.01 | ||
|
|
| 46 | MainStay Cushing Royalty Energy Income Fund | The notes to the financial statements are an integral part of, and should be read in conjunction with, the financial statements. |
Statement of Operations for the year ended November 30, 2015
| Investment Income (Loss) | ||||
Income | ||||
Dividends and distributions | ||||
(Net of return of capital of $13,779,238) (a) | $ | 2,925,361 | ||
Interest | 59,621 | |||
|
| |||
Total Income | 2,984,982 | |||
|
| |||
Expenses | ||||
Manager (See Note 3) | 2,632,455 | |||
Distribution/Service—Class A (See Note 3) | 225,279 | |||
Distribution/Service—Investor Class (See Note 3) | 5,689 | |||
Distribution/Service—Class C (See Note 3) | 437,104 | |||
Transfer agent (See Note 3) | 345,345 | |||
Registration | 241,391 | |||
Professional fees | 120,856 | |||
Franchise tax | 109,516 | |||
Shareholder communication | 32,509 | |||
Custodian | 16,340 | |||
Trustees | 3,310 | |||
Miscellaneous | 268 | |||
|
| |||
Total expenses before waiver/reimbursement | 4,170,062 | |||
Expense waiver/reimbursement from Manager (see Note 3) | (488,677 | ) | ||
|
| |||
Net expenses | 3,681,385 | |||
|
| |||
Net investment income (Loss) | (696,403 | ) | ||
|
| |||
| Realized and Unrealized Gain (Loss) on Investments | ||||
Net realized gain (loss) on: | ||||
Investments | (128,663,512 | ) | ||
Foreign currency transactions | (12,788 | ) | ||
|
| |||
Net realized gain (loss) on investments | (128,676,300 | ) | ||
|
| |||
Net change in unrealized appreciation (depreciation) on: | ||||
Investments | (39,322,700 | ) | ||
Foreign currency translations | 2,517 | |||
|
| |||
Net change in unrealized appreciation (depreciation) | (39,320,183 | ) | ||
|
| |||
Net realized and unrealized gain (loss) on investments | (167,996,483 | ) | ||
|
| |||
Net increase (decrease) in net assets resulting from operations | $ | (168,692,886 | ) | |
|
| |||
| (a) | Dividends and distributions recorded net of foreign withholding taxes in the amount of $159,734. |
| The notes to the financial statements are an integral part of, and should be read in conjunction with, the financial statements. | 47 |
Statements of Changes in Net Assets
| Year ended November 30, 2015 | Year ended November 30, 2014 | |||||||
| Increase (Decrease) in Net Assets | ||||||||
Operations: | ||||||||
Net investment income (loss) | $ | (696,403 | ) | $ | (631,369 | ) | ||
Net realized gain (loss) on investments | (128,676,300 | ) | (3,930,018 | ) | ||||
Net change in unrealized appreciation (depreciation) on investments | (39,320,183 | ) | (72,633,645 | ) | ||||
|
| |||||||
Net increase (decrease) in net assets resulting from operations | (168,692,886 | ) | (77,195,032 | ) | ||||
|
| |||||||
Dividends and distributions to shareholders: | ||||||||
From return of capital: | ||||||||
Class A | (8,767,937 | ) | (7,839,149 | ) | ||||
Investor Class | (258,515 | ) | (16,376 | ) | ||||
Class C | (4,440,784 | ) | (2,107,208 | ) | ||||
Class I | (5,828,475 | ) | (2,213,237 | ) | ||||
|
| |||||||
| (19,295,711 | ) | (12,175,970 | ) | |||||
|
| |||||||
Total dividends and distributions to shareholders | (19,295,711 | ) | (12,175,970 | ) | ||||
|
| |||||||
Capital share transactions: | ||||||||
Net proceeds from sale of shares | 203,781,690 | 334,154,320 | ||||||
Net asset value of shares issued to shareholders in reinvestment of dividends and distributions | 17,565,971 | 10,602,789 | ||||||
Cost of shares redeemed | (211,200,248 | ) | (35,503,765 | ) | ||||
|
| |||||||
Increase (decrease) in net assets derived from capital share transactions | 10,147,413 | 309,253,344 | ||||||
|
| |||||||
Net increase (decrease) in net assets | (177,841,184 | ) | 219,882,342 | |||||
| Net Assets | ||||||||
Beginning of year | 280,494,250 | 60,611,908 | ||||||
|
| |||||||
End of year | $ | 102,653,066 | $ | 280,494,250 | ||||
|
| |||||||
Accumulated net investment loss, net of income taxes | $ | (1,310,164 | ) | $ | (613,761 | ) | ||
|
| |||||||
| 48 | MainStay Cushing Royalty Energy Income Fund | The notes to the financial statements are an integral part of, and should be read in conjunction with, the financial statements. |
Financial Highlights selected per share data and ratios
| Year ended November 30, | July 2, | |||||||||||||||
| Class A | 2015 | 2014 | 2013*** | 2012*** | ||||||||||||
Net asset value at beginning of period | $ | 12.99 | $ | 18.23 | $ | 19.58 | $ | 20.00 | ||||||||
|
|
|
|
|
|
|
| |||||||||
Net investment income (loss) (a) | (0.02 | ) | (0.08 | ) | 0.03 | 0.07 | ||||||||||
Net realized and unrealized gain (loss) on investments | (7.21 | ) | (3.56 | ) | 0.22 | 0.31 | ||||||||||
|
|
|
|
|
|
|
| |||||||||
Total from investment operations | (7.23 | ) | (3.64 | ) | 0.25 | 0.38 | ||||||||||
|
|
|
|
|
|
|
| |||||||||
| Less dividends and distributions: | ||||||||||||||||
From return of capital | (0.80 | ) | (1.60 | ) | (1.60 | ) | (0.80 | ) | ||||||||
|
|
|
|
|
|
|
| |||||||||
Total dividends and distributions | (0.80 | ) | (1.60 | ) | (1.60 | ) | (0.80 | ) | ||||||||
|
|
|
|
|
|
|
| |||||||||
Redemption fees retained (a)(b) | — | 0.00 | ‡ | — | — | |||||||||||
|
|
|
|
|
|
|
| |||||||||
Net asset value at end of period | $ | 4.96 | $ | 12.99 | $ | 18.23 | $ | 19.58 | ||||||||
|
|
|
|
|
|
|
| |||||||||
Total investment return (c) | (57.56 | %) | (22.12 | %) | 1.23 | % | 1.81 | %(d) | ||||||||
| Ratios (to average net assets)/Supplemental Data: | ||||||||||||||||
Net investment income (loss) (including net deferred income tax benefit (expense)) (e) | (0.24 | %)(f) | 1.75 | % | (0.19 | %) | 0.55 | %†† | ||||||||
Net investment income (loss) (excluding net deferred income tax benefit (expense)) (e) | (0.19 | %)(f) | (0.53 | %) | 0.10 | % | 0.50 | %†† | ||||||||
Net expenses (including net deferred income tax (benefit) expense) (e)(g) | 1.79 | % (f) | 3.02 | % | 2.29 | % | 1.95 | %†† | ||||||||
Expenses (before waiver/reimbursement, including net deferred income tax (benefit) expense) (e)(g) | 2.04 | % (f) | 3.19 | % | 3.80 | % | 439.62 | %†† | ||||||||
Portfolio turnover rate | 94.70 | % | 26.81 | % | 61.96 | % | 17.31 | % | ||||||||
Net assets at end of period (in 000’s) | $ | 48,885 | $ | 136,037 | $ | 50,565 | $ | 297 | ||||||||
| ** | Inception date. |
| *** | These years were audited by a predecessor audit firm whose opinion was unqualified. |
| †† | Annualized. |
| ‡ | Less than one cent per share. |
| (a) | Per share data based on average shares outstanding during the period. |
| (b) | Redemption fees were only applicable prior to reorganization. (See Note 1) |
| (c) | Total investment return is calculated exclusive of sales charges and assumes the reinvestment of dividends and distributions. |
| (d) | Total investment return is not annualized. |
| (e) | For the year ended November 30, 2015, the Fund received a tax refund in the amount of $6,000, of which $2,773 is attributable to Class A. |
| For the year ended November 30, 2014, the Fund accrued $65,316 in net current and deferred income tax benefit, of which $(978,230) is attributable to Class A. |
| For the year ended November 30, 2013, the Fund accrued $71,348 in net current and deferred income tax expense, of which $58,510 is attributable to Class A. |
| For the period from July 2, 2012 to November 30, 2012, the Fund accrued $31 in net current and deferred income tax benefit, of which $13 is attributable to Class A. |
| (f) | Ratios including/excluding net deferred income tax benefit (expense) includes applicable franchise tax expense for the period. |
| For the year ended November 30, 2015, the Fund accrued $109,516 in franchise tax expense, of which $51,919 is attributable to Class A. |
| (g) | The ratio of expenses excluding net current and deferred income tax benefit to average net assets before waiver was 1.98%, 1.97%, 3.26% and 439.42% for the fiscal years ended November 30, 2015, 2014, 2013 and the period from July 2, 2012 to November 30, 2012, respectively. The ratio of expenses excluding deferred income tax benefit to average net assets after waiver was 1.73% 1.80%, 1.75% and 1.75% for the fiscal years ended November 30, 2015, 2014, 2013 and the period from July 2, 2012 to November 30, 2012, respectively. |
| The notes to the financial statements are an integral part of, and should be read in conjunction with, the financial statements. | 49 |
Financial Highlights selected per share data and ratios
| Investor Class | Year ended November 30, 2015 | July 12, 2014** through November 30, 2014 | ||||||
Net asset value at beginning of period | $ | 12.99 | $ | 19.15 | ||||
|
|
|
| |||||
Net investment income (loss) (a) | (0.04 | ) | (0.02 | ) | ||||
Net realized and unrealized gain (loss) on investments | (7.20 | ) | (5.34 | ) | ||||
|
|
|
| |||||
Total from investment operations | (7.24 | ) | (5.36 | ) | ||||
|
|
|
| |||||
| Less dividends and distributions: | ||||||||
From return of capital | (0.80 | ) | (0.80 | ) | ||||
|
|
|
| |||||
Total dividends and distributions | (0.80 | ) | (0.80 | ) | ||||
|
|
|
| |||||
Net asset value at end of period | $ | 4.95 | $ | 12.99 | ||||
|
|
|
| |||||
Total investment return (b)(c) | (57.56 | %) | (28.99 | %)(d) | ||||
| Ratios (to average net assets)/Supplemental Data: | ||||||||
Net investment income (loss) (including net deferred income tax benefit (expense)) (e) | (0.48 | %)(f) | 1.97 | % †† | ||||
Net investment income (loss) (excluding net deferred income tax benefit (expense)) (e) | (0.39 | %)(f) | (0.20 | %)†† | ||||
Net expenses (including net deferred income tax (benefit) expense) (e)(g) | 1.91 | % (f) | (0.55 | %)†† | ||||
Expenses (before waiver/reimbursement, including net deferred income tax (benefit) expense) (e)(g) | 2.24 | % (f) | (0.45 | %)†† | ||||
Portfolio turnover rate | 94.70 | % | 26.81 | % | ||||
Net assets at end of period (in 000’s) | $ | 2,554 | $ | 908 | ||||
| ** | Inception date. |
| †† | Annualized. |
| (a) | Per share data based on average shares outstanding during the period. |
| (b) | Total investment return is calculated exclusive of sales charges and assumes the reinvestment of dividends and distributions. |
| (c) | Total investment return may reflect adjustments to conform to generally accepted accounting principles. |
| (d) | Total investment return is not annualized. |
| (e) | For the year ended November 30, 2015, the Fund received a tax refund in the amount of $6,000, of which $70 is attributable to Investor Class For the year ended November 30, 2014, the Fund accrued $65,316 in net current and deferred income tax benefit, of which $8,533 is attributable to Investor Class. |
| (f) | Ratios including/excluding net deferred income tax benefit (expense) includes applicable franchise tax expense for the period. |
| For the year ended November 30, 2015, the Fund accrued $109,516 in franchise tax expense, of which $2,175 is attributable to Investor Class. |
| (g) | The ratio of expenses excluding net current and deferred income tax benefit to average net assets before waiver was 2.15% and 1.72% for the year ended November 30, 2015 and the period from July 12, 2014 to November 30, 2014, respectively. The ratio of expenses excluding deferred income tax benefit to average net assets after waiver was 1.82% and 1.62% for the year ended November 30, 2015 and the period from July 12, 2014 to November 30, 2014, respectively. |
| 50 | MainStay Cushing Royalty Energy Income Fund | The notes to the financial statements are an integral part of, and should be read in conjunction with, the financial statements. |
Financial Highlights selected per share data and ratios
| Year ended November 30, | July 2, 2012** through November 30, | |||||||||||||||
| Class C | 2015 | 2014 | 2013*** | 2012*** | ||||||||||||
Net asset value at beginning of period | $ | 12.74 | $ | 18.04 | $ | 19.53 | $ | 20.00 | ||||||||
|
|
|
|
|
|
|
| |||||||||
Net investment income (loss) (a) | (0.08 | ) | (0.20 | ) | (0.11 | ) | 0.01 | |||||||||
Net realized and unrealized gain (loss) on investments | (7.06 | ) | (3.50 | ) | 0.22 | 0.32 | ||||||||||
|
|
|
|
|
|
|
| |||||||||
Total from investment operations | (7.14 | ) | (3.70 | ) | 0.11 | 0.33 | ||||||||||
|
|
|
|
|
|
|
| |||||||||
| Less dividends and distributions: | ||||||||||||||||
From return of capital | (0.80 | ) | (1.60 | ) | (1.60 | ) | (0.80 | ) | ||||||||
|
|
|
|
|
|
|
| |||||||||
Total dividends and distributions | (0.80 | ) | (1.60 | ) | (1.60 | ) | (0.80 | ) | ||||||||
|
|
|
|
|
|
|
| |||||||||
Redemption fees retained (a)(b) | — | 0.00 | ‡ | — | — | |||||||||||
|
|
|
|
|
|
|
| |||||||||
Net asset value at end of period | $ | 4.80 | $ | 12.74 | $ | 18.04 | $ | 19.53 | ||||||||
|
|
|
|
|
|
|
| |||||||||
Total investment return (c) | (57.93 | %) | (22.71 | %) | 0.48 | % | 1.56 | % (d) | ||||||||
| Ratios (to average net assets)/Supplemental Data: | ||||||||||||||||
Net investment income (loss) (including net deferred income tax benefit (expense)) (e) | (1.04 | %)(f) | (0.93 | %) | (0.94 | %) | (0.20 | %)†† | ||||||||
Net investment income (loss) (excluding net deferred income tax benefit (expense)) (e) | (0.98 | %)(f) | (1.21 | %) | (0.65 | %) | (0.25 | %)†† | ||||||||
Net expenses (including net deferred income tax (benefit) expense) (e)(g) | 2.59 | % (f) | 2.23 | % | 3.04 | % | 2.70 | % †† | ||||||||
Expenses (before waiver/reimbursement, including net deferred income tax (benefit) expense) (e)(g) | 2.85 | % (f) | 2.38 | % | 4.55 | % | 440.37 | % †† | ||||||||
Portfolio turnover rate | 94.70 | % | 26.81 | % | 61.96 | % | 17.31 | % | ||||||||
Net assets at end of period (in 000’s) | $ | 25,053 | $ | 48,574 | $ | 8,379 | $ | 401 | ||||||||
| ** | Inception date. |
| *** | These years were audited by a predecessor audit firm whose opinion was unqualified. |
| †† | Annualized. |
| ‡ | Less than one cent per share. |
| (a) | Per share data based on average shares outstanding during the period. |
| (b) | Redemption fees were only applicable prior to reorganization. (See Note 1) |
| (c) | Total investment return is calculated exclusive of sales charges and assumes the reinvestment of dividends and distributions. |
| (d) | Total investment return is not annualized. |
| (e) | For the year ended November 30, 2015, the Fund received a tax refund in the amount of $6,000, of which $1,344 is attributable to Class C. |
| For the year ended November 30, 2014, the Fund accrued $65,316 in net current and deferred income tax benefit, of which $62,248 is attributable to Class C. |
| For the year ended November 30, 2013, the Fund accrued $71,348 in net current and deferred income tax expense, of which $10,203 is attributable to Class C. |
| For the period from July 2, 2012 to November 30, 2012, the Fund accrued $31 in net current and deferred income tax benefit, of which $10 is attributable to Class C. |
| (f) | Ratios including/excluding net deferred income tax benefit (expense) includes applicable franchise tax expense for the period. |
| For the year ended November 30, 2015, the Fund accrued $109,516 in franchise tax expense, of which $26,603 is attributable to Class C. |
| (g) | The ratio of expenses excluding net current and deferred income tax benefit to average net assets before waiver was 2.79%, 2.66%, 4.26% and 440.42% for the fiscal years ended November 30, 2015, 2014, 2013 and the period from July 2, 2012 to November 30, 2012, respectively. The ratio of expenses excluding deferred income tax benefit to average net assets after waiver was 2.53%, 2.51%, 2.75% and 2.75% for the fiscal years ended November 30, 2015, 2014, 2013 and the period from July 2, 2012 to November 30, 2012, respectively. |
| The notes to the financial statements are an integral part of, and should be read in conjunction with, the financial statements. | 51 |
Financial Highlights selected per share data and ratios
| Year ended November 30, | July 2, 2012** through November 30, | |||||||||||||||
| Class I | 2015 | 2014 | 2013*** | 2012*** | ||||||||||||
Net asset value at beginning of period | $ | 13.08 | $ | 18.30 | $ | 19.60 | $ | 20.00 | ||||||||
|
|
|
|
|
|
|
| |||||||||
Net investment income (loss) (a) | (0.00 | )‡ | (0.02 | ) | 0.08 | 0.10 | ||||||||||
Net realized and unrealized gain (loss) on investments | (7.27 | ) | (3.60 | ) | 0.22 | 0.30 | ||||||||||
|
|
|
|
|
|
|
| |||||||||
Total from investment operations | (7.27 | ) | (3.62 | ) | 0.30 | 0.40 | ||||||||||
|
|
|
|
|
|
|
| |||||||||
| Less dividends and distributions: | ||||||||||||||||
From return of capital | (0.80 | ) | (1.60 | ) | (1.60 | ) | (0.80 | ) | ||||||||
|
|
|
|
|
|
|
| |||||||||
Total dividends and distributions | (0.80 | ) | (1.60 | ) | (1.60 | ) | (0.80 | ) | ||||||||
|
|
|
|
|
|
|
| |||||||||
Redemption fees retained (a)(b) | — | — | — | — | ||||||||||||
|
|
|
|
|
|
|
| |||||||||
Net asset value at end of period | $ | 5.01 | $ | 13.08 | $ | 18.30 | $ | 19.60 | ||||||||
|
|
|
|
|
|
|
| |||||||||
Total investment return (c) | (57.47 | %) | (21.92 | %) | 1.49 | % | 1.91 | %(d) | ||||||||
| Ratios (to average net assets)/Supplemental Data: | ||||||||||||||||
Net investment income (loss) (including net deferred income tax benefit (expense)) (e) | (0.03 | %)(f) | 4.33 | % | 0.06 | % | 0.80 | %†† | ||||||||
Net investment income (loss) (excluding net deferred income tax benefit (expense)) (e) | 0.02 | % (f) | (0.01 | )% | 0.35 | % | 0.75 | %†† | ||||||||
Net expenses (including net deferred income tax (benefit) expense) (e)(g) | 1.54 | % (f) | (2.94 | )% | 2.04 | % | 1.70 | %†† | ||||||||
Expenses (before waiver/reimbursement, including net deferred income tax (benefit) expense) (e)(g) | 1.76 | % (f) | (2.83 | )% | 3.55 | % | 439.37 | %†† | ||||||||
Portfolio turnover rate | 94.70 | % | 26.81 | % | 61.96 | % | 17.31 | % | ||||||||
Net assets at end of period (in 000’s) | $ | 26,161 | $ | 94,975 | $ | 1,667 | $ | 77 | ||||||||
| ** | Inception date. |
| *** | These years were audited by a predecessor audit firm whose opinion was unqualified. |
| †† | Annualized. |
| ‡ | Less than one cent per share. |
| (a) | Per share data based on average shares outstanding during the period. |
| (b) | Redemption fees were only applicable prior to reorganization. (See Note 1) |
| (c) | Total investment return is calculated exclusive of sales charges and assumes the reinvestment of dividends and distributions. Class I shares are not subject to sales charges. |
| (d) | Total investment return is not annualized. |
| (e) | For the year ended November 30, 2015, the Fund received a tax refund in the amount of $6,000, of which $1,813 is attributable to Class I. |
| For the year ended November 30, 2014, the Fund accrued $65,316 in net current and deferred income tax benefit, of which $972,765 is attributable to Class I. |
| For the year ended November 30, 2013, the Fund accrued $71,348 in net current and deferred income tax expense, of which $2,635 is attributable to Class I. |
| For the period from July 2, 2012 to November 30, 2012, the Fund accrued $31 in net current and deferred income tax benefit, of which $8 is attributable to Class I. |
| (f) | Ratios including/excluding net deferred income tax benefit (expense) includes applicable franchise tax expense for the period. |
| For the year ended November 30, 2015, the Fund accrued $109,516 in franchise tax expense, of which $28,819 is attributable to Class I. |
| (g) | The ratio of expenses excluding net current and deferred income tax benefit to average net assets before waiver was 1.71%, 1.52%, 3.26% and 439.42% for the fiscal years ended November 30, 2015, 2014, 2013 and the period from July 2, 2012 to November 30, 2012, respectively. The ratio of expenses excluding deferred income tax benefit to average net assets after waiver was 1.48%, 1.41%, 1.75% and 1.75% for the fiscal years ended November 30, 2015, 2014, 2013 and the period from July 2, 2012 to November 30, 2012, respectively. |
| 52 | MainStay Cushing Royalty Energy Income Fund | The notes to the financial statements are an integral part of, and should be read in conjunction with, the financial statements. |
Note 1–Organization and Business
MainStay Funds Trust (the “Trust”) was organized as a Delaware statutory trust on April 28, 2009 and is governed by a Declaration of Trust. The Trust is registered under the Investment Company Act of 1940, as amended (the “1940 Act”), as an open-end management investment company, and is comprised of thirty-eight funds (collectively referred to as the “Funds” and each individually, referred to as a “Fund”). These financial statements and notes relate to the MainStay Cushing MLP Premier Fund, MainStay Cushing Renaissance Advantage Fund and MainStay Cushing Royalty Energy Income Fund (collectively referred to as the “MainStay Cushing Funds” and each individually referred to as a “MainStay Cushing Fund”). Each MainStay Cushing Fund is the successor to the corresponding series of The Cushing® Funds Trust (collectively referred to as the “Predecessor Funds” and each individually referred to as a “Predecessor Fund”), for which Cushing® Asset Management, LP, a Texas limited partnership and the Funds’ Subadvisor (as defined in Note 3(A)), served as investment adviser. The financial statements of the Funds reflect the historical results of the Predecessor Funds prior to their reorganization on July 11, 2014. Upon the completion of the reorganization, Class A, Class C and Class I shares of each MainStay Cushing Fund assumed the performance, financial and other information of the Predecessor Funds. All information and references to periods prior to July 11, 2014 refer to the Predecessor Funds.
The MainStay Cushing MLP Premier Fund offers four classes of shares. Class A, Class C and Class I shares commenced operations on October 20, 2010. Investor Class shares commenced operations on July 11, 2014. The investment objective is to seek current income and capital appreciation.
The MainStay Cushing Renaissance Advantage Fund offers four classes of shares. Class A, Class C and Class I shares commenced operations on April 2, 2013. Investor Class shares commenced operations on July 11, 2014. The investment objective is to seek total return.
The MainStay Cushing Royalty Energy Income Fund offers four classes of shares. Class A, Class C and Class I shares commenced operations on July 2, 2012. Investor Class shares commenced operations on July 11, 2014. The investment objective is to seek current income and capital appreciation.
Class A and Investor Class shares are offered at net asset value (“NAV”) per share plus an initial sales charge. No sales charge applies to investments of $1 million or more (and certain other qualified purchases) in Class A and Investor Class shares, but a contingent deferred sales charge (“CDSC”) is imposed on certain redemptions of such shares made within one year of the date of purchase. Class C shares are offered at NAV without an initial sales charge, although a 1.00% CDSC may be imposed on redemptions of such shares made within one year of the date of purchase of Class C shares. Class I shares are offered at NAV and are not subject to a sales charge. Depending upon eligibility, Class A shares may convert to Investor Class shares and Investor Class shares may convert to Class A shares. Each class of shares has the same voting (except for issues that relate solely to one class), dividend, liquidation and other rights, and the same terms and conditions, except that Class C shares are subject to higher distribution and/or service fee rates than Class A and Investor Class shares under a
distribution plan pursuant to Rule 12b-1 under the 1940 Act. Class I shares are not subject to a distribution and/or service fee.
Note 2–Significant Accounting Policies
The MainStay Cushing Funds are investment companies and accordingly follow the investment company accounting and reporting guidance of the Financial Accounting Standards Board (FASB) Accounting Standard Codification Topic 946 Financial Services – Investment Companies. The MainStay Cushing Funds prepare their financial statements in accordance with generally accepted accounting principles (“GAAP”) in the United States of America and follow the significant accounting policies described below.
(A) Securities Valuation. Investments are valued as of the close of regular trading on the New York Stock Exchange (“Exchange”) (generally 4:00 p.m. Eastern time) on each day the MainStay Cushing Funds are open for business (“valuation date”).
The Board of Trustees (the “Board”) of the MainStay Funds Trust adopted procedures establishing methodologies for the valuation of each MainStay Cushing Fund’s securities and delegated the responsibility for valuation determinations under those procedures to the Valuation Committee of the MainStay Cushing Funds (the “Valuation Committee”). The Board authorized the Valuation Committee to appoint a Valuation Sub-Committee (the “Sub-Committee”) to deal in the first instance with establishing the prices of securities for which market quotations are not readily available or the prices of which are not otherwise readily determinable under these procedures. The Sub-Committee meets (in person, via electronic mail or via teleconference) on an as-needed basis. Subsequently, the Valuation Committee meets to ensure that actions taken by the Sub-Committee were appropriate. The procedures recognize that, subject to the oversight of the Board and unless otherwise noted, the responsibility for day-to-day valuation of portfolio assets (including fair value measurements for the MainStay Cushing Funds’ assets and liabilities) rests with New York Life Investment Management LLC (“New York Life Investments” or the “Manager”), aided to whatever extent necessary by the Subadvisor (as defined in Note 3(A)) to each MainStay Cushing Fund.
To assess the appropriateness of security valuations, the Manager, Subadvisor, or the MainStay Cushing Funds’ third party service provider, who is subject to oversight by the Manager, regularly compares prior day prices, prices on comparable securities, and the sale prices to the prior and current day prices and challenges prices with changes exceeding certain tolerance levels with third party pricing services or broker sources. For those securities valued through either a standardized fair valuation methodology or a fair valuation measurement, the Sub-Committee deals in the first instance with such valuation and the Valuation Committee reviews and affirms the reasonableness of the valuation based on such methodologies and measurements on a regular basis after considering all relevant information that is reasonably available. Any action taken by the Sub-Committee with respect to the valuation of a portfolio security is submitted by the Valuation Committee to the Board for its review and ratification, if appropriate, at its next regularly scheduled meeting.
“Fair value” is defined as the price a MainStay Cushing Fund would receive upon selling an asset or liability in an orderly transaction to an
| 53 |
Notes to Financial Statements (continued)
independent buyer in the principal or most advantageous market for the asset or liability. Fair value measurements are determined within a framework that establishes a three-tier hierarchy which maximizes the use of observable market data and minimizes the use of unobservable inputs to establish a classification of fair value measurements for disclosure purposes. “Inputs” refer broadly to the assumptions that market participants would use in pricing the asset or liability, including assumptions about risk, such as the risk inherent in a particular valuation technique used to measure fair value using a pricing model and/or the risk inherent in the inputs for the valuation technique. Inputs may be observable or unobservable. Observable inputs reflect the assumptions market participants would use in pricing the asset or liability based on market data obtained from sources independent of the MainStay Cushing Funds. Unobservable inputs reflect each MainStay Cushing Fund’s own assumptions about the assumptions market participants would use in pricing the asset or liability based on the information available. The inputs or methodology used for valuing assets or liabilities may not be an indication of the risks associated with investing in those assets or liabilities. The three-tier hierarchy of inputs is summarized below.
| • | Level 1—quoted prices in active markets for an identical asset or liability |
| • | Level 2—other significant observable inputs (including quoted prices for a similar asset or liability in active markets, interest rates and yield curves, prepayment speeds, credit risk, etc.) |
| • | Level 3—significant unobservable inputs (including each MainStay Cushing Fund’s own assumptions about the assumptions that market participants would use in measuring fair value of an asset or liability) |
The level of an asset or liability within the fair value hierarchy is based on the lowest level of an input, both individually and in the aggregate, that is significant to the fair value measurement. As of November 30, 2015, the aggregate value by input level of each MainStay Cushing Fund’s assets and liabilities is included at the end of each MainStay Cushing Fund’s Portfolio of Investments.
The MainStay Cushing Funds may use third party vendor evaluations, whose prices may be derived from one or more of the following standard inputs among others:
• Benchmark Yields | • Reported Trades | |
• Broker/Dealer Quotes | • Issuer Spreads | |
• Two-sided markets | • Benchmark securities | |
• Bids/Offers | • Reference Data (corporate actions or material event notices) | |
• Industry and economic events | • Monthly payment information |
An asset or liability for which market values cannot be measured using the methodologies described above is valued by methods deemed reasonable in good faith by the Valuation Committee, following the procedures established by the Board, to represent fair value. Under these procedures, the MainStay Cushing Funds generally use a market-based approach which may use related or comparable assets or liabilities, recent transactions, market multiples, book values, and other relevant information. The MainStay Cushing Funds may also use an income-based valuation approach in which the anticipated future cash
flows of the asset or liability are discounted to calculate fair value. Discounts may also be applied due to the nature and/or duration of any restrictions on the disposition of the asset or liability. Due to the inherent valuation uncertainty of such assets or liabilities, fair values may differ significantly from values that would have been used had an active market existed. For the year ended November 30, 2015, there were no material changes to the fair value methodologies.
Equity and non-equity securities which may be valued in this manner include, but are not limited to: (i) a security for which trading has been halted or suspended; (ii) a debt security that has recently gone into default and for which there is not a current market quotation; (iii) a security of an issuer that has entered into a restructuring; (iv) a security that has been de-listed from a national exchange; (v) a security for which the market price is not readily available from a third party pricing source or, if so provided, does not, in the opinion of the Manager or Subadvisor reflect the security’s market value; (vi) a security subject to trading collars for which no or limited trading takes place; and (vii) a security whose principal market has been temporarily closed at a time when, under normal conditions, it would be open. Securities for which market quotations or observable inputs are not readily available are generally categorized as Level 3 in the hierarchy. As of November 30, 2015, the MainStay Cushing Funds did not hold any securities that were fair valued in such a manner.
Equity securities and securities of Exchange-Traded Funds are valued at the last quoted sales prices as of the close of regular trading on the relevant exchange on each valuation date. Securities that are not traded on the valuation date are valued at the mean of the last quoted bid and ask prices. Prices are normally taken from the principal market in which each security trades. Investments in mutual funds, including money market funds, are valued at their respective NAVs as of the close of the Exchange on the valuation date. These securities are generally categorized as Level 1 in the hierarchy.
Debt securities (other than convertible and municipal bonds) are valued at the evaluated bid prices (evaluated mean prices in the case of convertible and municipal bonds) supplied by a pricing agent or broker selected by the Manager, in consultation with the Subadvisor. Those values reflect broker/dealer supplied prices and electronic data processing techniques, if the evaluated bid or mean prices are deemed by the Manager, in consultation with the Subadvisor, to be representative of market values, at the regular close of trading of the Exchange on each valuation date. Debt securities purchased on a delayed delivery basis are marked to market daily until settlement at the forward settlement date. Debt securities, including corporate bonds, U.S. government & federal agency bonds, municipal bonds, foreign bonds, convertible bonds, asset-backed securities and mortgage-backed securities are generally categorized as Level 2 in the hierarchy.
Temporary cash investments acquired in excess of 60 days to maturity at the time of purchase are valued using the latest bid prices or using valuations based on a matrix system (which considers such factors as security prices, yields, maturities, and ratings), both as furnished by independent pricing services. Other temporary cash investments which mature in 60 days or less at the time of purchase (“Short-Term Investments”) are valued using the amortized cost method of valuation, unless the use of such method would be inappropriate. The amortized cost method involves valuing a security at its cost on the date of
| 54 | MainStay Cushing Funds |
purchase and thereafter assuming a constant amortization to maturity of the difference between such cost and the value on maturity date. Amortized cost approximates the current fair value of a security. These securities are generally categorized as Level 2 in the hierarchy.
Generally, a security is considered illiquid if it cannot be sold or disposed of in the ordinary course of business at approximately the price at which it is valued within seven days. Illiquidity of a security might prevent the sale of such security at a time when the Manager or Subadvisor might wish to sell, and these securities could have the effect of decreasing the overall level of a MainStay Cushing Fund’s liquidity. Further, the lack of an established secondary market may make it more difficult to value illiquid securities, requiring a MainStay Cushing Fund to rely on judgments that may be somewhat subjective in measuring value, which could vary from the amount that a MainStay Cushing Fund could realize upon disposition. Difficulty in selling illiquid securities may result in a loss or may be costly to a MainStay Cushing Fund. Under the supervision of the Board, the Manager or Subadvisor measures the liquidity of each MainStay Cushing Fund’s investments; in doing so, the Manager or Subadvisor may consider various factors, including (i) the frequency of trades and quotations, (ii) the number of dealers and prospective purchasers, (iii) dealer undertakings to make a market, and (iv) the nature of the security and the market in which it trades (e.g., the time needed to dispose of the security, the method of soliciting offers and the mechanics of transfer). Illiquid securities generally will be valued by methods deemed reasonable in good faith in such a manner as the Board deems appropriate to reflect their fair value. The liquidity of each MainStay Cushing Fund’s investments, as shown in its respective Portfolio of Investments, was measured as of November 30, 2015 and can change at any time in response to, among other relevant factors, market conditions or events or developments with respect to an individual issuer or instrument. As of November 30, 2015, securities deemed to be illiquid under procedures approved by the Board of Trustees are shown in the applicable MainStay Cushing Fund’s Portfolio of Investments.
(B) Income Taxes. The MainStay Cushing MLP Premier Fund and the MainStay Cushing Royalty Energy Income Fund, taxed as corporations, are obligated to pay federal and state income tax on their taxable income. Currently, the maximum marginal regular federal income tax rate for a corporation is 35%. The MainStay Cushing MLP Premier Fund and the MainStay Cushing Royalty Energy Income Fund may each be subject to a 20% federal alternative minimum tax on their respective federal alternative minimum taxable income to the extent that their respective alternative minimum tax exceeds their respective regular federal income tax.
The MainStay Cushing MLP Premier Fund invests its assets primarily in master limited partnerships (“MLPs”), which generally are treated as partnerships for federal income tax purposes. As a limited partner in MLPs, The MainStay Cushing MLP Premier Fund reports its allocable share of each MLP’s taxable income in computing its own taxable income.
The MainStay Cushing Royalty Energy Income Fund invests its assets in energy trusts and MLPs. U.S. royalty trusts are generally not subject to U.S. federal corporate income taxation at the trust or entity level. Instead, each unitholder of the U.S. royalty trust is required to take into account its share of all items of the U.S. royalty trust’s income,
gain, loss, deduction and expense. It is possible that the Fund’s share of taxable income from a U.S. royalty trust may exceed the cash actually distributed to it from the U.S. royalty trust in a given year. In such a case, the MainStay Cushing Royalty Energy Income Fund will have less after-tax cash available for distribution to shareholders. Canadian royalty trusts are taxed as regular Canadian corporations and are now subject to “double taxation” at both the corporate level and on the income distributed to investors. MLPs are generally treated as partnerships for federal income tax purposes. As a limited partner in MLPs, the MainStay Cushing Royalty Energy Income Fund reports its allocable share of each MLP’s taxable income in computing its own taxable income.
Management evaluates each MainStay Cushing Fund’s tax positions to determine if the tax positions taken meet the minimum recognition threshold in connection with accounting for uncertainties in income tax positions taken or expected to be taken for the purposes of measuring and recognizing tax liabilities in the financial statements. Recognition of tax benefits of an uncertain tax position is required only when the position is “more likely than not” to be sustained assuming examination by taxing authorities. Management has analyzed the MainStay Cushing Funds’ tax positions taken on federal, state and local income tax returns for all open tax years (for up to three tax years). Management has concluded that no provisions for federal, state and local income tax are required in the MainStay Cushing Renaissance Advantage Fund’s financial statements as it intends to qualify each year for special tax treatment afforded to a RIC. Management has concluded that provisions for federal, state and local income tax are required to be included in the financial statements for the MainStay Cushing MLP Premier Fund and the MainStay Cushing Royalty Energy Income Fund which are taxed as corporations and obligated to pay federal and state income tax on their taxable income. The MainStay Cushing Funds’ federal, state and local income and federal excise tax returns for tax years for which the applicable statutes of limitations have not expired are subject to examination by the Internal Revenue Service and state and local departments of revenue.
The MainStay Cushing MLP Premier Fund and the MainStay Cushing Royalty Energy Income Fund’s respective tax expense or benefit is included in the Statements of Operations based on the component of income or gains (losses) to which such expense or benefit relates. Deferred income taxes reflect the net tax effects of temporary differences between the carrying amounts of assets and liabilities for financial reporting purposes and the amounts used for income tax purposes. A valuation allowance is recognized if, based on the weight of available evidence, it is more likely than not that some portion or all of the deferred income tax asset will not be realized.
The MainStay Cushing Renaissance Advantage Fund’s policy is to comply with the requirements of the Internal Revenue Code of 1986, as amended (the “Internal Revenue Code”), applicable to regulated investment companies (“RIC”) and to distribute all of the taxable income to the shareholders of the Fund within the allowable time limits. Therefore, no federal, state, and local income tax provisions are required.
(C) Dividends and Distributions to Shareholders. Dividends and distributions are recorded on the ex-dividend date. The MainStay Cushing MLP Premier Fund and the MainStay Cushing Royalty Energy Income Fund intend to declare and pay distributions, if any, at least quarterly. On a book basis, all realized capital gains net of applicable
| 55 |
Notes to Financial Statements (continued)
taxes will be retained by the MainStay Cushing MLP Premier Fund and the MainStay Cushing Royalty Energy Income Fund. The MainStay Renaissance Advantage Fund intends to declare and pay distributions quarterly and distributions from net capital gains, if any, annually. Unless the shareholder elects otherwise, all dividends and distributions are reinvested in the same class of shares of the respective MainStay Cushing Fund, at NAV. Dividends and distributions to shareholders are determined in accordance with federal income tax regulations and may differ from GAAP.
(D) Security Transactions and Investment Income. The MainStay Cushing Funds record security transactions on the trade date. Realized gains and losses on security transactions are determined using the identified cost method. Dividend income is recognized on the ex-dividend date, net of any foreign tax withheld at the source, and interest income is accrued as earned using the effective interest rate method. Discounts and premiums on Short-Term Investments are accreted and amortized, respectively, on the straight-line method. The straight-line method approximates the effective interest method for short-term investments. Income from payment-in-kind securities is recorded daily based on the effective interest method of accrual. Distributions on an MLP are generally recorded based on the characterization reported on the MainStay Cushing Fund’s Form 1065, Schedule K-1, received from the MLP. The MainStay Cushing Funds record their pro rata share of the income and deductions, and capital gains and losses allocated from each MLP, as well as adjusting the cost basis of each MLP accordingly.
Distributions received from each of the MainStay Cushing Fund’s investments in energy related U.S. royalty trusts and Canadian royalty trusts and exploration and production companies (collectively, “Energy Trusts”) and MLPs generally are comprised of ordinary income, capital gains and return of capital from the Energy Trusts or MLPs. The MainStay Cushing Funds record investment income on the ex-date of the distributions. For financial statement purposes, the MainStay Cushing Funds use return of capital and income estimates to allocate the dividend income received. Such estimates are based on historical information available from each Energy Trust, MLP and other industry sources. These estimates may subsequently be revised based on information received from Energy Trusts or MLPs after their tax reporting periods are concluded, as the actual character of these distributions is not known until after the fiscal year end of the Funds.
Each MainStay Cushing Fund estimates the allocation of investment income and return of capital for the distributions received from MLPs within the Statements of Operations. For the year ended November 30, 2015, each MainStay Cushing Fund estimated approximately 100% of the distributions received from MLPs to be from return of capital. Investment income and realized and unrealized gains and losses on investments of the MainStay Cushing Funds are allocated to separate classes of shares pro rata based upon their relative net assets on the date the income is earned or realized and unrealized gains and losses are incurred.
(E) Expenses. Expenses of the Trust are allocated to the individual MainStay Cushing Funds in proportion to the net assets of the respective Funds when the expenses are incurred, except where direct allocations of expenses can be made. Expenses (other than transfer agent expenses and fees incurred under the shareholder services plans and/or the distribution plans further discussed in Note 3(B)) are allocated to separate classes of shares pro rata based upon their relative
net assets on the date the expenses are incurred. The expenses borne by the MainStay Cushing Funds, including those of related parties to the MainStay Cushing Funds, are shown in the Statement of Operations.
(F) Use of Estimates. In preparing financial statements in conformity with GAAP, management makes estimates and assumptions that affect the reported amounts and disclosures in the financial statements. Actual results could differ from those estimates.
(G) Concentration of Risk. The MainStay Cushing MLP Premier Fund, under normal market conditions, invests at least 80% of its assets (net assets plus any borrowings for investment purposes) in a portfolio of MLP investments. Under normal market conditions, the MainStay Cushing Royalty Energy Income Fund invests at least 80% of its assets (net assets plus any borrowings for investment purposes) in a portfolio of (i) energy-related U.S. royalty trusts and Canadian royalty trusts and exploration and production (“E&P”) companies, (ii) E&P MLPs and (iii) securities of other companies based in North America that are principally engaged in activities in the energy sector. Under normal market conditions, the MainStay Cushing Renaissance Advantage Fund invests at least 80% of its assets (net assets plus any borrowings for investment purposes) in a portfolio of (i) companies across the energy supply chain spectrum, including upstream, midstream and downstream energy companies, as well as oil and gas services companies, (ii) energy-intensive chemical, metal and industrial and manufacturing companies and engineering and construction companies that the Subadvisor expects to benefit from growing energy production and lower feedstock costs relative to global costs and, (iii) transportation and logistics companies providing solutions to the U.S. manufacturing industry. Therefore the MainStay Cushing Funds may be subject to more risks than if they were more broadly diversified over numerous industries and sectors of the economy. General changes in market sentiment towards companies in the sectors in which they invest may adversely affect the MainStay Cushing Funds, and the performance of such sectors may lag behind the broader market as a whole.
The MainStay Cushing MLP Premier Fund and the MainStay Cushing Royalty Energy Income Fund are also subject to MLP structure risk. Holders of MLP units are subject to certain risks inherent in the structure of MLPs, including (i) tax risks, (ii) the limited ability to elect or remove management or the general partner or managing member, (iii) limited voting rights, except with respect to extraordinary transactions, and (iv) conflicts of interest between the general partner or managing member and its affiliates, on the one hand, and the limited partners or members, on the other hand, including those arising from incentive distribution payments or corporate opportunities.
(H) Indemnifications. Under the Trust’s organizational documents, its officers and trustees are indemnified against certain liabilities that may arise out of performance of their duties to the Trust. Additionally, in the normal course of business, the MainStay Cushing Funds enter into contracts with third-party service providers that contain a variety of representations and warranties and which may provide general indemnifications. The MainStay Cushing Funds’ maximum exposure under these arrangements is unknown, as this would involve future claims that may be made against the MainStay Cushing Funds that have not yet occurred. Based on experience, management is of the view that the risk of loss in connection with these potential indemnification obligations is remote. However, there can be no assurance that material
| 56 | MainStay Cushing Funds |
liabilities related to such obligations will not arise in the future, which could adversely impact the MainStay Cushing Funds.
Note 3–Fees and Related Party Transactions
(A) Manager and Subadvisor. New York Life Investments, a registered investment adviser and an indirect, wholly-owned subsidiary of New York Life Insurance Company (“New York Life”), serves as the MainStay Cushing Funds’ Manager, pursuant to an Amended and Restated Management Agreement, (“Management Agreement”). The Manager provides offices, conducts clerical, recordkeeping and bookkeeping services, and keeps most of the financial and accounting records required to be maintained by the MainStay Cushing Funds. Except for the portion of salaries and expenses that are the responsibility of the MainStay Cushing Funds, the Manager pays the salaries and expenses of all personnel affiliated with the MainStay Cushing Funds and certain operational expenses of the MainStay Cushing Funds. The MainStay Cushing Funds reimburse New York Life Investments in an amount equal to a portion of the compensation of the Chief Compliance Officer of the MainStay Cushing Funds. Cushing® Asset Management, LP (“Cushing® Asset Management” or the “Subadvisor”), a registered investment adviser, serves as Subadvisor to the MainStay Cushing Funds and is responsible for the day-to-day portfolio management of the MainStay Cushing Funds. Pursuant to the terms of a Subadvisory Agreement (“Subadvisory Agreement”) between New York Life Investments and Cushing® Asset Management, New York Life Investments pays for the services of the Subadvisor.
Under the Management Agreement, the MainStay Cushing MLP Premier Fund pays the Manager a monthly fee for services performed and facilities furnished at an annual rate of 1.10% of the Fund’s average daily net assets.
Under the Management Agreement, the MainStay Cushing Renaissance Advantage Fund pays the Manager a monthly fee for services performed and facilities furnished at an annual rate of 1.25% of the Fund’s average daily net assets.
Under the Management Agreement, the MainStay Cushing Royalty Energy Income Fund pays the Manager a monthly fee for services performed and facilities furnished at an annual rate of 1.35% of the Fund’s average daily net assets.
In connection with the discussion below regarding expense limitation agreements, Total Annual Fund Operating Expenses excludes taxes, interest, litigation, extraordinary expenses, brokerage and other transaction expenses relating to the purchase or sale of portfolio investments, acquired (underlying) fund fees and expenses and deferred income tax expenses for the MainStay Cushing MLP Premier Fund and the MainStay Cushing Royalty Energy Income Fund.
MainStay Cushing MLP Premier Fund
New York Life Investments has contractually agreed to waive a portion of the MainStay Cushing MLP Premier Fund’s management fees and/or reimburse expenses so that Total Annual Fund Operating Expenses do not exceed the following percentages of average daily net assets: Class A, 1.60%; Class C, 2.35%; and Class I, 1.35%. Based on the waiver or reimbursement with respect to Class A shares, New York Life Investments will apply an equivalent waiver or reimbursement, in an
equal number of basis points, to Investor Class shares. This agreement will remain in effect until July 11, 2016 unless extended by New York Life Investments and approved by the Board.
MainStay Cushing Renaissance Advantage Fund
New York Life Investments has contractually agreed to waive a portion of the MainStay Cushing Renaissance Advantage Fund’s management fees and/or reimburse expenses so that Total Annual Fund Operating Expenses for Class A shares do not exceed 1.75% of its average daily net assets. New York Life Investments will apply an equivalent waiver or reimbursement, in an equal number of basis points, to the other share classes. This agreement will remain in effect until April 1, 2016 unless extended by New York Life Investments and approved by the Board.
New York Life Investments has contractually agreed to waive fees and/or reimburse expenses so that MainStay Cushing Renaissance Advantage Fund’s Total Annual Fund Operating Expenses of a class do not exceed the following percentages of average daily net assets: Class A, 1.90%; Class C, 2.65% and Class I, 1.65%. Based on the waiver or reimbursement with respect to Class A shares, New York Life Investments will apply an equivalent waiver or reimbursement, in an equal number of basis points, to Investor Class shares. This expense limitation agreement will remain in effect until July 11, 2016 unless extended by New York Life Investments and approved by the Board of Trustees of the Fund.
MainStay Cushing Royalty Energy Income Fund
New York Life Investments has contractually agreed to waive a portion of its management fee so that the management fee does not exceed 1.25% of the Fund’s average daily net assets. This agreement will remain in effect until April 1, 2016 unless extended by New York Life Investments and approved by the Board.
New York Life Investments has contractually agreed to waive a portion of the MainStay Cushing Royalty Energy Income Fund’s management fees and/or reimburse expenses so that Total Annual Fund Operating Expenses for Class A shares do not exceed 1.73% of its average daily net assets. New York Life Investments will apply an equivalent waiver or reimbursement, in an equal number of basis points, to the other share classes. This agreement will remain in effect until April 1, 2016 unless extended by New York Life Investments and approved by the Board.
New York Life Investments has contractually agreed to waive fees and/or reimburse expenses so that MainStay Cushing Royalty Energy Income Fund’s Total Annual Fund Operating Expenses of a class do not exceed the following percentages of average daily net assets: Class A, 1.90%, Class C, 2.65% and Class I, 1.65%. Based on the waiver or reimbursement with respect to Class A shares, New York Life Investments will apply an equivalent waiver or reimbursement, in an equal number of basis points, to Investor Class shares. This expense limitation agreement will remain in effect until July 11, 2016 unless extended by New York Life Investments and approved by the Board of Trustees of the Fund.
| 57 |
Notes to Financial Statements (continued)
For the year ended November 30, 2015, New York Life Investments earned fees from the MainStay Cushing Funds and waived its fees and/or reimbursed expenses as follows:
| Fees earned | Fees reimbursed | |||||||
MainStay Cushing MLP Premier Fund | $ | 19,828,997 | $ | — | ||||
MainStay Cushing Renaissance Advantage Fund | 3,768,959 | 104,517 | ||||||
MainStay Cushing Royalty Energy Income Fund | 2,632,455 | 488,677 | ||||||
U.S. Bancorp Fund Services, LLC (“U.S. Bancorp”) provides sub-administration and sub-accounting services to the MainStay Cushing Funds pursuant to an agreement with New York Life Investments. These services include calculating the daily NAVs of the MainStay Cushing Funds, maintaining the general ledger and sub-ledger accounts for the calculation of the MainStay Cushing Funds’ respective NAVs, and assisting New York Life Investments in conducting various aspects of the MainStay Cushing Funds’ administrative operations. For providing these services to the MainStay Cushing Funds, U.S. Bancorp is compensated by New York Life Investments.
(B) Distribution, Service and Shareholder Service Fees. The Trust, on behalf of the MainStay Cushing Funds, has entered into a distribution agreement with NYLIFE Distributors LLC (the “Distributor”), an indirect, wholly-owned subsidiary of New York Life. The MainStay Cushing Funds have adopted distribution plans (the “Plans”) in accordance with the provisions of Rule 12b-1 under the 1940 Act.
Pursuant to the Class A and Investor Class Plans, the Distributor receives a monthly distribution fee from the Class A and Investor Class shares, at an annual rate of 0.25% of the average daily net assets of the Class A and Investor Class shares for distribution and/or service activities as designated by the Distributor. Pursuant to the Class C Plan, Class C shares pay the Distributor a monthly distribution fee at an annual rate of 0.75% of the average daily net assets of the Class C shares, along with a service fee at an annual rate of 0.25% of the average daily net assets of the Class C shares, for a total 12b-1 fee of 1.00%. Class I shares are not subject to a distribution and/or service fee.
The Plans provide that the distribution and service fees are payable to the Distributor regardless of the amounts actually expended by the Distributor for distribution of the MainStay Cushing Funds’ shares and service activities.
(C) Sales Charges. The MainStay Cushing Funds were advised by the Distributor that the amount of initial sales charges retained on sales of Class A and Investor Class shares for the year ended November 30, 2015, were as follows:
MainStay Cushing MLP Premier Fund |
| |||
Class A | $ | 286,148 | ||
Investor Class | 6,931 | |||
MainStay Cushing Renaissance Advantage Fund |
| |||
Class A | $ | 116,049 | ||
Investor Class | 7,062 | |||
MainStay Cushing Royalty Energy Income Fund |
| |||
Class A | $ | 49,289 | ||
Investor Class | 9,846 | |||
The MainStay Cushing Funds were also advised that the Distributor retained CDSCs on redemptions of Class A, Investor Class and Class C shares, for the year ended November 30, 2015, were as follows:
MainStay Cushing MLP Premier Fund |
| |||
Class A | $ | 39,267 | ||
Investor Class | 49 | |||
Class C | 167,794 | |||
MainStay Cushing Renaissance Advantage Fund |
| |||
Class A | $ | 1,165 | ||
Investor Class | — | |||
Class C | 34,845 | |||
MainStay Cushing Royalty Energy Income Fund |
| |||
Class A | $ | 5,263 | ||
Investor Class | — | |||
Class C | 73,974 | |||
(D) Transfer, Dividend Disbursing and Shareholder Servicing Agent. NYLIM Service Company LLC, an affiliate of New York Life Investments, is the MainStay Cushing Funds’ transfer, dividend disbursing and shareholder servicing agent pursuant to an agreement between NYLIM Service Company LLC and the Trust. NYLIM Service Company LLC has entered into an agreement with Boston Financial Data Services, Inc. (“BFDS”) pursuant to which BFDS performs certain transfer agent services on behalf of NYLIM Service Company LLC. Transfer agent expenses incurred by the MainStay Cushing Funds’ share classes for the year ended November 30, 2015, were as follows:
MainStay Cushing MLP Premier Fund |
| |||
Class A | $ | 389,612 | ||
Investor Class | 2,041 | |||
Class C | 636,051 | |||
Class I | 477,539 | |||
MainStay Cushing Renaissance Advantage Fund |
| |||
Class A | $ | 44,346 | ||
Investor Class | 5,324 | |||
Class C | 84,210 | |||
Class I | 167,283 | |||
| 58 | MainStay Cushing Funds |
MainStay Cushing Royalty Energy Income Fund |
| |||
Class A | $ | 148,264 | ||
Investor Class | 6,147 | |||
Class C | 94,707 | |||
Class I | 96,227 | |||
(E) Small Account Fee. Shareholders with small accounts adversely impact the cost of providing transfer agency services. In an effort to reduce total transfer agency expenses, the MainStay Cushing Funds have implemented a small account fee on certain types of accounts. Certain shareholders with an account balance of less than $1,000 are charged an annual per account fee of $20 (assessed semi-annually), the proceeds from which offset transfer agent fees as reflected in the Statement of Operations.
Note 4–Federal Income Tax
MainStay Cushing MLP Premier Fund and MainStay Cushing Royalty Energy Income Fund
Deferred income taxes reflect the net tax effect of temporary differences between the carrying amount of assets and liabilities for financial reporting and tax purposes. Components of the MainStay Cushing MLP Premier Fund and MainStay Cushing Royalty Energy Income Fund deferred tax assets as of November 30, 2015 are as follows:
MainStay Cushing MLP Premier Fund | ||||
Deferred tax assets: | ||||
Net operating loss carryforward | $ | 37,894,528 | ||
Capital loss carryforward | 40,814,812 | |||
Net unrealized depreciation on investments in securities | 44,728,833 | |||
| Total deferred tax assets | 123,438,173 | |||
Less valuation allowance | 123,438,173 | |||
| Net deferred tax asset | $ | — | ||
MainStay Cushing Royalty Energy Income Fund | ||||
Deferred tax assets: | ||||
Net operating loss carryforward | $ | 1,478,674 | ||
Capital loss carryforward | 49,429,818 | |||
Net unrealized depreciation on investments in securities | 39,223,140 | |||
Foreign tax credit | 159,734 | |||
| Total deferred tax assets | 90,291,366 | |||
Less valuation allowance | 90,291,366 | |||
| Net deferred tax asset | $ | — | ||
The MainStay Cushing Funds periodically review the recoverability of their deferred tax assets, if any, based on the weight of available evidence. When assessing the recoverability of each MainStay Cushing Fund’s deferred tax assets, significant weight is given to the effects of potential future realized and unrealized gains on investments, and the period over which these deferred tax assets can be realized. Unexpected significant decreases in cash distributions from the MainStay Cushing Funds’ MLP investments or significant declines in the fair value of their investments may change the MainStay Cushing Funds’ assessment regarding the recoverability of their deferred tax assets and may result in a valuation allowance. Each MainStay Cushing Fund will continue to
assess the need to record a valuation allowance in the future. If a valuation allowance is required to reduce any deferred tax asset in the future, it could have a material impact on the MainStay Cushing Fund’s net asset value and results of operations in the period it is recovered.
Each MainStay Cushing Fund may rely, to some extent, on information provided by the MLPs, which may not necessarily be timely, to estimate taxable income allocable to MLP units held in its portfolio, and to estimate its associated deferred tax benefit (liability). Such estimates are made in good faith. From time to time, as new information becomes available, each MainStay Cushing Fund will modify its estimates or assumptions regarding its tax benefit (liability).
The net operating loss carryforward and capital loss carryforward are available to offset future taxable income. For corporations, capital losses can only be used to offset capital gains and cannot be used to offset ordinary income. The capital loss may be carried forward for five years and, accordingly, would begin to expire as of November 30, 2017. The net operating loss can be carried forward for 20 years and, accordingly, would begin to expire as of November 30, 2030. The MainStay Cushing MLP Premier Fund and MainStay Cushing Royalty Energy Income Fund have the following net operating loss and capital loss amounts:
MainStay Cushing MLP Premier Fund | ||||||
Fiscal Year Ended Net Operating Loss | Amount | Expiration | ||||
November 30, 2010 | $ | 3,330 | November 30, 2030 | |||
| November 30, 2011 | 541,249 | November 30, 2031 | ||||
| November 30, 2012 | 9,226,669 | November 30, 2032 | ||||
| November 30, 2013 | 22,865,115 | November 30, 2033 | ||||
| November 30, 2014 | 29,334,750 | November 30, 2034 | ||||
| November 30, 2015 | 37,521,744 | November 30, 2035 | ||||
|
| |||||
| Total | $ | 99,492,857 | ||||
|
| |||||
Fiscal Year Ended Capital Loss | Amount | Expiration | ||||
November 30, 2015 | $ | 110,525,655 | November 30, 2020 | |||
|
| |||||
MainStay Cushing Royalty Energy Income Fund | ||||||
Fiscal Year Ended Net Operating Loss | Amount | Expiration | ||||
November 30, 2012 | $ | 522 | November 30, 2032 | |||
| November 30, 2013 | 11,924 | November 30, 2033 | ||||
| November 30, 2014 | 1,934,847 | November 30, 2034 | ||||
| November 30, 2015 | 1,968,145 | November 30, 2035 | ||||
|
| |||||
| Total | $ | 3,915,438 | ||||
|
| |||||
Fiscal Year Ended Capital Loss | Amount | Expiration | ||||
November 30, 2012 | $ | 2,914 | November 30, 2017 | |||
| November 30, 2013 | 1,371,868 | November 30, 2018 | ||||
| November 30, 2014 | 3,090,784 | November 30, 2019 | ||||
| November 30, 2015 | 130,637,707 | November 30, 2020 | ||||
|
| |||||
| Total | $ | 135,103,273 | ||||
|
| |||||
| 59 |
Notes to Financial Statements (continued)
Total income tax benefit (current and deferred) differs from the amount computed by applying the federal statutory income tax rate of 35% to net investment income and realized and unrealized gains (losses) on investments before taxes for the year ended November 30, 2015, as follows:
| MainStay Cushing MLP Premier Fund | MainStay Cushing Royalty Energy Income Fund | |||||||
| Income tax provision (benefit) at the federal statutory rate of 35% | $ | (260,092,846 | ) | $ | (58,988,703 | ) | ||
State income tax (benefit), net of federal benefit | (14,326,715 | ) | (2,669,972 | ) | ||||
| Permanent differences, net | (3,826,031 | ) | (274,545 | ) | ||||
| Foreign taxes withheld | — | 159,734 | ||||||
Current tax refund | — | (6,000 | ) | |||||
Other | — | 3,764 | ||||||
Change in valuation allowance | 123,438,173 | 61,929,456 | ||||||
|
|
|
| |||||
| Total tax expense (benefit) | $ | (154,807,419 | ) | $ | 153,734 | |||
|
|
|
| |||||
MainStay Cushing Renaissance Advantage Fund
As of November 30, 2015, the components of accumulated gain (loss) on a tax basis were as follows:
| Ordinary Income | Accumulated Capital and Other Gain (Loss) | Other Temporary Differences | Unrealized Appreciation (Depreciation) | Total Gain (Loss) | ||||||||||||||||
MainStay Cushing Renaissance Advantage Fund | $ | — | $ | (66,717,722 | ) | $ | (435 | ) | $ | (13,198,564 | ) | $ | (79,916,721 | ) | ||||||
The difference between book basis and tax basis unrealized depreciation is primarily due to wash sale and partnership adjustments.
The following table discloses the current year reclassifications between undistributed net investment income (loss), accumulated net realized gain (loss) on investments, and additional paid-in capital arising from permanent differences; net assets as of November 30, 2015 were not affected.
| Undistributed Net Investment Income (Loss) | Accumulated Net Realized Gain (Loss) on Investments | Additional Paid-In Capital | ||||||||||
MainStay Cushing Renaissance Advantage Fund | $ | (3,710 | ) | $ | 3,029,527 | $ | (3,025,817 | ) | ||||
The reclassifications for the MainStay Cushing Renaissance Advantage Fund are primarily due to partnership adjustments and in-kind redemptions.
As of November 30, 2015, for federal income tax purposes, capital loss carryforwards of $66,717,722 were available as shown in the table below, to the extent provided by the regulations to offset future realized gains of the Fund through the years indicated.
| Capital Loss Available Through | Short-Term Capital Loss Amounts (000’s) | Long-Term Capital Loss Amounts (000’s) | ||||||
| Unlimited | $ | 63,856 | $ | 2,862 | ||||
The tax character of distributions paid during the years ended November 30, 2015 and 2014 shown in the Statements of Changes in Net Assets was as follows:
| 2015 | 2014 | |||||||||||||||||||||||
| Tax Based Distributions from Ordinary Income | Tax Based Distributions from Return of Capital | Total | Tax Based Distributions from Ordinary Income | Tax Based Distributions from Return of Capital | Total | |||||||||||||||||||
MainStay Cushing MLP Premier Fund | $ | — | $ | 125,762,721 | $ | 125,762,721 | $ | 44,493,742 | $ | 56,895,491 | $ | 101,389,233 | ||||||||||||
MainStay Cushing Renaissance Advantage Fund | 457,435 | 7,611,911 | 8,069,346 | 200,336 | 3,069,510 | 3,269,846 | ||||||||||||||||||
MainStay Cushing Royalty Energy Income Fund | — | 19,295,711 | 19,295,711 | — | 12,175,970 | 12,175,970 | ||||||||||||||||||
| 60 | MainStay Cushing Funds |
Note 5–Custodian
U.S. Bank, N.A. is the custodian of cash and securities held by the MainStay Cushing Funds. Custodial fees are charged to the MainStay Cushing Funds based on the MainStay Cushing Fund’s net assets and/or the market value of securities held by the MainStay Cushing Funds and the number of certain cash transactions incurred by the MainStay Cushing Funds.
Note 6–Line of Credit
The MainStay Cushing Funds and certain affiliated funds, maintain a line of credit with a syndicate of banks in order to secure a source of funds for temporary purposes to meet unanticipated or excessive redemption requests.
Effective August 4, 2015, under a second amended and restated credit agreement (the “Credit Agreement”), the aggregate commitment amount is $600,000,000 with an optional maximum aggregate amount of $700,000,000. The commitment fee is an annual rate of 0.10% of the average commitment amount payable quarterly, regardless of usage, to Bank of New York Mellon, who serves as the agent to the syndicate. The commitment fee is allocated among the MainStay Cushing Funds and certain affiliated funds based upon their respective net assets and other factors. Interest on any revolving credit loan is charged based upon the Federal Funds Advances rate or the one month London InterBank Offered Rate, whichever is higher. The Credit Agreement expires on August 2, 2016, although the Funds, certain affiliated funds and the syndicate of banks may renew the Credit Agreement for an additional year on the same or different terms. Prior to August 4, 2015, the aggregate commitment amount was $600,000,000 with an optional maximum of $700,000,000, and the commitment fee was at an annual rate of 0.08% of the average commitment amount. There were no borrowings made or outstanding with respect to any of the Funds under the Credit Agreement during the year ended November 30, 2015.
Note 7–Purchases and Sales of Securities (in 000’s)
During the year ended November 30, 2015, purchases and sales of securities, other than short-term securities, were as follows:
| Purchases | Sales | |||||||
MainStay Cushing MLP Premier Fund | $ | 638,087 | $ | 579,424 | ||||
MainStay Cushing Renaissance Advantage Fund | 442,335 | 542,885 | ||||||
MainStay Cushing Royalty Energy Income Fund | 205,239 | 164,672 | ||||||
Note 8–Capital Share Transactions
MainStay Cushing MLP Premier Fund
Class A | Shares | Amount | ||||||
Year ended November 30, 2015: | ||||||||
Shares sold | 8,852,245 | $ | 173,834,708 | |||||
Shares issued to shareholders in reinvestment of dividends and distributions | 1,386,793 | 26,302,684 | ||||||
Shares redeemed | (12,249,286 | ) | (235,291,686 | ) | ||||
|
| |||||||
Net increase (decrease) in shares before conversion | (2,010,248 | ) | (35,154,294 | ) | ||||
Shares converted into Class A (See Note 1) | 10,947 | 227,801 | ||||||
Shares converted from Class A (See Note 1) | (36,070 | ) | (614,337 | ) | ||||
|
| |||||||
Net increase (decrease) | (2,035,371 | ) | $ | (35,540,830 | ) | |||
|
|
|
| |||||
Year ended November 30, 2014: | ||||||||
Shares sold | 11,116,389 | $ | 252,609,875 | |||||
Shares issued to shareholders in reinvestment of dividends and distributions | 1,120,336 | 25,292,145 | ||||||
Shares redeemed | (10,919,530 | ) | (255,083,262 | ) | ||||
|
| |||||||
Net increase (decrease) in shares before conversion | 1,317,195 | 22,818,758 | ||||||
Shares converted into Class A (See Note 1) | 27,373 | 638,400 | ||||||
Shares converted from Class A (See Note 1) | (156,802 | ) | (3,679,320 | ) | ||||
|
| |||||||
Net increase (decrease) | 1,187,766 | $ | 19,777,838 | |||||
|
| |||||||
Investor Class (a) | Shares | Amount | ||||||
Year ended November 30, 2015: | ||||||||
Shares sold | 112,126 | $ | 2,257,859 | |||||
Shares issued to shareholders in reinvestment of dividends and distributions | 8,653 | 159,342 | ||||||
Shares redeemed | (23,241 | ) | (449,129 | ) | ||||
|
| |||||||
Net increase (decrease) in shares before conversion | 97,538 | 1,968,072 | ||||||
Shares converted into Investor Class (See Note 1) | 36,070 | 614,337 | ||||||
Shares converted from Investor Class (See Note 1) | (10,947 | ) | (227,801 | ) | ||||
|
| |||||||
Net increase (decrease) | 122,661 | $ | 2,354,608 | |||||
|
|
|
| |||||
Period ended November 30, 2014: | ||||||||
Shares sold | 61,067 | $ | 1,429,110 | |||||
Shares issued to shareholders in reinvestment of dividends and distributions | 567 | 13,027 | ||||||
Shares redeemed | (2,473 | ) | (59,411 | ) | ||||
|
| |||||||
Net increase (decrease) | 59,161 | $ | 1,382,726 | |||||
|
| |||||||
(a) Investor shares were first offered on July 11, 2014. |
| |||||||
| 61 |
Notes to Financial Statements (continued)
Class C | Shares | Amount | ||||||
Year ended November 30, 2015: | ||||||||
Shares sold | 9,207,415 | $ | 172,131,750 | |||||
Shares issued to shareholders in reinvestment of dividends and distributions | 2,879,975 | 52,076,346 | ||||||
Shares redeemed | (12,205,895 | ) | (217,409,245 | ) | ||||
|
| |||||||
Net increase (decrease) | (118,505 | ) | $ | 6,798,851 | ||||
|
| |||||||
Year ended November 30, 2014: | ||||||||
Shares sold | 15,598,796 | $ | 344,590,258 | |||||
Shares issued to shareholders in reinvestment of dividends and distributions | 1,838,916 | 40,315,113 | ||||||
Shares redeemed | (4,534,280 | ) | (100,418,307 | ) | ||||
|
| |||||||
Net increase (decrease) in shares before conversion | 12,903,432 | 284,487,064 | ||||||
Shares converted from Class C (See Note 1) | (31,804 | ) | (724,353 | ) | ||||
|
| |||||||
Net increase (decrease) | 12,871,628 | $ | 283,762,711 | |||||
|
| |||||||
Class I | Shares | Amount | ||||||
Year ended November 30, 2015: | ||||||||
Shares sold | 21,188,120 | $ | 405,334,811 | |||||
Shares issued to shareholders in reinvestment of dividends and distributions | 2,017,902 | 38,431,781 | ||||||
Shares redeemed | (18,454,724 | ) | (350,776,683 | ) | ||||
|
| |||||||
Net increase (decrease) | 4,751,298 | $ | 92,989,909 | |||||
|
| |||||||
Year ended November 30, 2014: | ||||||||
Shares sold | 19,696,781 | $ | 460,113,133 | |||||
Shares issued to shareholders in reinvestment of dividends and distributions | 924,636 | 21,224,749 | ||||||
Shares redeemed | (5,178,439 | ) | (119,728,146 | ) | ||||
|
| |||||||
Net increase (decrease) in shares before conversion | 15,442,978 | 361,609,736 | ||||||
Shares converted into Class I (See Note 1) | 185,796 | 4,403,673 | ||||||
Shares converted from Class I (See Note 1) | (27,103 | ) | (638,400 | ) | ||||
|
| |||||||
Net increase (decrease) | 15,601,671 | $ | 365,375,009 | |||||
|
| |||||||
MainStay Cushing Renaissance Advantage Fund
Class A | Shares | Amount | ||||||
Year ended November 30, 2015: | ||||||||
Shares sold | 1,183,043 | $ | 25,949,416 | |||||
Shares issued to shareholders in reinvestment of dividends and distributions | 56,416 | 1,176,048 | ||||||
Shares redeemed | (1,205,869 | ) | (25,461,423 | ) | ||||
|
| |||||||
Net increase (decrease) in shares before conversion | 33,590 | 1,664,041 | ||||||
Shares converted into Class A (See Note 1) | 10,014 | 226,475 | ||||||
Shares converted from Class A (See Note 1) | (25,675 | ) | (503,253 | ) | ||||
|
| |||||||
Net increase (decrease) | 17,929 | $ | 1,387,263 | |||||
|
|
|
| |||||
Year ended November 30, 2014: | ||||||||
Shares sold | 2,293,008 | $ | 58,961,228 | |||||
Shares issued to shareholders in reinvestment of dividends and distributions | 15,749 | 390,094 | ||||||
Shares redeemed | (397,479 | ) | (9,856,395 | ) | ||||
|
| |||||||
Net increase (decrease) in shares before conversion | 1,911,278 | 49,494,927 | ||||||
Shares converted from Class A (See Note 1) | (4,434 | ) | (112,227 | ) | ||||
|
| |||||||
Net increase (decrease) | 1,906,844 | $ | 49,382,700 | |||||
|
| |||||||
Investor Class (a) | Shares | Amount | ||||||
Year ended November 30, 2015: | ||||||||
Shares sold | 91,536 | $ | 1,967,027 | |||||
Shares issued to shareholders in reinvestment of dividends and distributions | 3,232 | 66,683 | ||||||
Shares redeemed | (23,127 | ) | (486,823 | ) | ||||
|
| |||||||
Net increase (decrease) in shares before conversion | 71,641 | 1,546,887 | ||||||
Shares converted into Investor Class (See Note 1) | 25,671 | 503,253 | ||||||
Shares converted from Investor Class (See Note 1) | (10,011 | ) | (226,475 | ) | ||||
|
| |||||||
Net increase (decrease) | 87,301 | $ | 1,823,665 | |||||
|
|
|
| |||||
Period ended November 30, 2014: | ||||||||
Shares sold | 79,488 | $ | 2,045,750 | |||||
Shares issued to shareholders in reinvestment of dividends and distributions | 302 | 7,352 | ||||||
Shares redeemed | (8,935 | ) | (240,309 | ) | ||||
|
| |||||||
Net increase (decrease) | 70,855 | $ | 1,812,793 | |||||
|
| |||||||
(a) Investor shares were first offered on July 11, 2014. |
| |||||||
| 62 | MainStay Cushing Funds |
Class C | Shares | Amount | ||||||
Year ended November 30, 2015: | ||||||||
Shares sold | 830,996 | $ | 17,450,401 | |||||
Shares issued to shareholders in reinvestment of dividends and distributions | 44,954 | 923,053 | ||||||
Shares redeemed | (1,007,570 | ) | (20,752,873 | ) | ||||
|
| |||||||
Net increase (decrease) | (131,620 | ) | $ | (2,379,419 | ) | |||
|
| |||||||
Year ended November 30, 2014: | ||||||||
Shares sold | 2,039,865 | $ | 52,208,128 | |||||
Shares issued to shareholders in reinvestment of dividends and distributions | 14,009 | 344,122 | ||||||
Shares redeemed | (111,955 | ) | (2,723,972 | ) | ||||
|
| |||||||
Net increase (decrease) | 1,941,919 | $ | 49,828,278 | |||||
|
| |||||||
Class I | Shares | Amount | ||||||
Year ended November 30, 2015: | ||||||||
Shares sold | 6,190,512 | $ | 132,902,705 | |||||
Shares issued to shareholders in reinvestment of dividends and distributions | 244,706 | 5,197,886 | ||||||
Shares redeemed (b) | (13,148,112 | ) | (287,072,397 | ) | ||||
|
| |||||||
Net increase (decrease) | (6,712,894 | ) | $ | (148,971,806 | ) | |||
|
| |||||||
Year ended November 30, 2014: | ||||||||
Shares sold | 13,837,341 | $ | 351,802,181 | |||||
Shares issued to shareholders in reinvestment of dividends and distributions | 82,836 | 2,042,497 | ||||||
Shares redeemed | (1,135,479 | ) | (27,625,124 | ) | ||||
|
| |||||||
Net increase (decrease) in shares before conversion | 12,784,698 | 326,219,554 | ||||||
Shares converted into Class I (See Note 1) | 4,427 | 112,227 | ||||||
|
| |||||||
Net increase (decrease) | 12,789,125 | $ | 326,331,781 | |||||
|
| |||||||
(b) Includes an in-kind redemption in the amount of $106,860,629 during the year ended November 30, 2015 (See Note 9). |
| |||||||
MainStay Cushing Royalty Energy Income Fund
Class A | Shares | Amount | ||||||
Year ended November 30, 2015: | ||||||||
Shares sold | 7,603,673 | $ | 72,399,720 | |||||
Shares issued to shareholders in reinvestment of dividends and distributions | 1,018,316 | 7,714,694 | ||||||
Shares redeemed | (9,111,676 | ) | (80,018,612 | ) | ||||
|
|
|
| |||||
Net increase (decrease) in shares before conversion | (489,687 | ) | 95,802 | |||||
Shares converted into Class A (See Note 1) | 23,156 | 200,767 | ||||||
Shares converted from Class A (See Note 1) | (137,914 | ) | (967,494 | ) | ||||
|
| |||||||
Net increase (decrease) | (604,445 | ) | $ | (670,925 | ) | |||
|
|
|
| |||||
Year ended November 30, 2014: | ||||||||
Shares sold | 8,836,339 | $ | 149,815,415 | |||||
Shares issued to shareholders in reinvestment of dividends and distributions | 411,696 | 7,080,446 | ||||||
Shares redeemed | (1,551,239 | ) | (26,198,303 | ) | ||||
|
| |||||||
Net increase (decrease) in shares before conversion | 7,696,796 | 130,697,558 | ||||||
Shares converted from Class A (See Note 1) | (893 | ) | (16,882 | ) | ||||
|
| |||||||
Net increase (decrease) | 7,695,903 | $ | 130,680,676 | |||||
|
| |||||||
Investor Class (a) | Shares | Amount | ||||||
Year ended November 30, 2015: | ||||||||
Shares sold | 348,203 | $ | 3,011,717 | |||||
Shares issued to shareholders in reinvestment of dividends and distributions | 34,560 | 240,717 | ||||||
Shares redeemed | (51,759 | ) | (383,302 | ) | ||||
|
| |||||||
Net increase (decrease) in shares before conversion | 331,004 | 2,869,132 | ||||||
Shares converted into Investor Class (See Note 1) | 137,914 | 967,494 | ||||||
Shares converted from Investor Class (See Note 1) | (23,211 | ) | (200,767 | ) | ||||
|
| |||||||
Net increase (decrease) | 445,707 | $ | 3,635,859 | |||||
|
|
|
| |||||
Period ended November 30, 2014: | ||||||||
Shares sold | 71,172 | $ | 1,181,406 | |||||
Shares issued to shareholders in reinvestment of dividends and distributions | 933 | 14,871 | ||||||
Shares redeemed | (2,191 | ) | (38,745 | ) | ||||
|
| |||||||
Net increase (decrease) | 69,914 | $ | 1,157,532 | |||||
|
| |||||||
(a) Investor shares were first offered on July 11, 2014. |
| |||||||
| 63 |
Notes to Financial Statements (continued)
Class C | Shares | Amount | ||||||
Year ended November 30, 2015: | ||||||||
Shares sold | 3,870,735 | $ | 36,589,735 | |||||
Shares issued to shareholders in reinvestment of dividends and distributions | 527,097 | 3,812,461 | ||||||
Shares redeemed | (2,997,312 | ) | (23,353,763 | ) | ||||
|
| |||||||
Net increase (decrease) | 1,400,520 | $ | 17,048,433 | |||||
|
| |||||||
Year ended November 30, 2014: | ||||||||
Shares sold | 3,560,370 | $ | 60,007,899 | |||||
Shares issued to shareholders in reinvestment of dividends and distributions | 86,793 | 1,437,135 | ||||||
Shares redeemed | (297,610 | ) | (4,940,033 | ) | ||||
|
| |||||||
Net increase (decrease) | 3,349,553 | $ | 56,505,001 | |||||
|
| |||||||
Class I | Shares | Amount | ||||||
Year ended November 30, 2015: | ||||||||
Shares sold | 9,620,946 | $ | 91,780,518 | |||||
Shares issued to shareholders in reinvestment of dividends and distributions | 736,692 | 5,798,099 | ||||||
Shares redeemed | (12,393,613 | ) | (107,444,571 | ) | ||||
|
| |||||||
Net increase (decrease) | (2,035,975 | ) | $ | (9,865,954 | ) | |||
|
| |||||||
Year ended November 30, 2014: | ||||||||
Shares sold | 7,305,537 | $ | 123,149,600 | |||||
Shares issued to shareholders in reinvestment of dividends and distributions | 128,133 | 2,070,337 | ||||||
Shares redeemed | (264,573 | ) | (4,326,684 | ) | ||||
|
| |||||||
Net increase (decrease) in shares before conversion | 7,169,097 | 120,893,253 | ||||||
Shares converted into Class I (See Note 1) | 888 | 16,882 | ||||||
|
| |||||||
Net increase (decrease) | 7,169,985 | $ | 120,910,135 | |||||
|
| |||||||
Note 9–In Kind Transfer of Securities
During the year ended November 30, 2015, the MainStay Cushing Renaissance Advantage Fund redeemed shares of beneficial interest in exchange for securities. The securities were transferred at their current value on the date of transaction.
| Transaction Date | Shares | Value | Gain (Loss) | |||||||||
4/30/2015 | 4,707,392 | $ | 106,860,629 | $ | (2,678,381 | ) | ||||||
Note 10–Recent Accounting Pronouncement
In June 2014, FASB issued ASU 2014-11, Transfers & Servicing (Topic 860): Repurchase-to-Maturity Transactions, Repurchase Financings, and Disclosures, which addresses the financial reporting of repurchase agreements and other similar transactions. The guidance classifies when repurchase agreements and securities lending transactions should be accounted for as secured borrowings, as well as requires expanded disclosure of these types of transactions. The guidance is effective for financial statements with fiscal years beginning after December 15, 2014, and for interim periods within those fiscal years. Management is evaluating the impact, if any, of this guidance on the Fund’s financial statement disclosures.
Note 11–Subsequent Events
In connection with the preparation of the financial statements of the MainStay Cushing Funds as of and for the year ended November 30, 2015, events and transactions subsequent to November 30, 2015, through the date the financial statements were issued have been evaluated by the MainStay Cushing Funds’ management for possible adjustment and/or disclosure. No subsequent events requiring financial statement adjustment or disclosure have been identified other than the notice of quarterly distributions declared by MainStay.
On January 22, 2016 the MainStay Cushing MLP Premier Fund declared a distribution payable of $0.335 per share, to Class A shareholders, Investors Class shareholders, Class C shareholders and Class I shareholders of record on January 21, 2016, and payable on January 22, 2015.
On January 22, 2016 the MainStay Cushing Renaissance Advantage Fund declared a distribution payable of $0.14 per share, to Class A shareholders, Investors Class shareholders, Class C shareholders and Class I shareholders of record on January 21, 2016, and payable on January 22, 2015.
On January 22, 2016 the MainStay Cushing Royalty Energy Income Fund declared a distribution of $0.20 per share, to Class A shareholders, Investors Class shareholders, Class C shareholders and Class I shareholders of record on January 21, 2016, and payable on January 22, 2015.
| 64 | MainStay Cushing Fund |
Federal Income Tax Information
(Unaudited)
The MainStay Cushing Renaissance Advantage Fund is required under the Internal Revenue Code to advise shareholders in a written statement as to the federal tax status of dividends paid by the Fund during such fiscal years.
For the fiscal year ended November 30, 2015, the MainStay Cushing Renaissance Fund designates approximately $457,435 under the Internal Revenue Code as qualified dividend income eligible for reduced tax rates.
The ordinary income dividends paid by the MainStay Cushing Renaissance Fund during the fiscal year ended November 30, 2015, should be multiplied by 100% to arrive at the amount eligible for the corporate dividends received deduction.
In February 2016, shareholders will receive an IRS Form 1099-DIV or substitute Form 1099 which will show the federal tax status of the distributions received by shareholders in calendar year 2015. The amounts that are reported on such Form 1099-DIV or substitute Form 1099 are the amounts you are to use on your federal income tax return and potentially differ from the amounts which we are reporting for the Funds’ fiscal year ended November 30, 2015.
Proxy Voting Policies and Procedures and Proxy Voting Record (Unaudited)
A description of the policies and procedures that New York Life Investments uses to vote proxies related to the Funds’ securities is available without charge, upon request, (i) by visiting the Funds’ website at mainstayinvestments.com; and (ii) on the Securities and Exchange Commission’s (“SEC”) website at www.sec.gov.
The Funds are required to file with the SEC its proxy voting record for the 12-month period ending June 30 on Form N-PX. The Funds’ most recent Form N-PX is available free of charge upon request by calling 800-MAINSTAY (624-6782); visiting the Fund’s website at mainstayinvestments.com; or on the SEC’s website at www.sec.gov.
Shareholder Reports and Quarterly Portfolio Disclosure (Unaudited)
Each Cushing Fund is required to file its complete schedule of portfolio holdings with the SEC for its first and third fiscal quarters on Form N-Q. Each Cushing Fund’s Form N-Q is available without charge, on the SEC’s website at www.sec.gov or by calling MainStay Investments at 800-MAINSTAY (624-6782). You also can obtain and review copies of Form N-Q by visiting the SEC’s Public Reference Room in Washington, DC (information on the operation of the Public Reference Room may be obtained by calling 1-800-SEC-0330).
| 65 |
Report of Independent Registered Public Accounting Firm
The Board of Trustees and Shareholders of
MainStay Funds Trust:
We have audited the accompanying statements of assets and liabilities, including the portfolios of investments, of the MainStay Cushing MLP Premier Fund, MainStay Cushing Renaissance Advantage Fund, and MainStay Cushing Royalty Energy Income Fund (each a “Fund” and collectively, the “Funds”), three of the funds constituting MainStay Funds Trust, as of November 30, 2015, and the related statements of operations, statements of changes in net assets, and the financial highlights for each of the years or periods in the two-year period then ended. These financial statements and financial highlights are the responsibility of the Funds’ management. Our responsibility is to express an opinion on these financial statements and financial highlights based on our audits. The financial highlights for each of the years presented through November 30, 2013, were audited by other auditors, whose report thereon dated January 29, 2014, expressed an unqualified opinion on those financial statements and financial highlights.
We conducted our audits in accordance with the standards of the Public Company Accounting Oversight Board (United States). Those standards require that we plan and perform the audit to obtain reasonable assurance about whether the financial statements and financial highlights are free of material misstatement. An audit includes examining, on a test basis, evidence supporting the amounts and disclosures in the financial statements. Our procedures included confirmation of securities owned as of November 30, 2015, by correspondence with the custodian and brokers or by other appropriate auditing procedures where replies from brokers were not received. An audit also includes assessing the accounting principles used and significant estimates made by management, as well as evaluating the overall financial statement presentation. We believe that our audits provide a reasonable basis for our opinion.
In our opinion, the financial statements and financial highlights referred to above present fairly, in all material respects, the financial position of the MainStay Cushing MLP Premier Fund, MainStay Cushing Renaissance Advantage Fund, and MainStay Cushing Royalty Energy Income Fund of MainStay Funds Trust as of November 30, 2015, the results of their operations, the changes in their net assets, and the financial highlights for each of the years or periods in the two-year period then ended in conformity with U.S. generally accepted accounting principles.

Philadelphia, Pennsylvania
January 26, 2016
| 66 | MainStay Cushing Fund |
Board of Trustees and Officers (Unaudited)
The Board of Trustees oversee the MainStay Group of Funds, (which is comprised of Funds that are series of the MainStay Funds, MainStay Funds Trust, MainStay VP Funds Trust, Private Advisors Alternative Strategies Master Fund, Private Advisors Alternative Strategies Fund, and MainStay DefinedTerm Municipal Opportunities Fund) (collectively the “Fund Complex”), the Manager and, when applicable, the Subadvisor(s), and other service providers to the Fund Complex. Each Trustee serves until his or her successor is elected and qualified or until his or her resignation, death or removal. Under the Retirement Policy, a
Trustee must tender his or her resignation by the end of the calendar year during which he or she reaches the age of 75. Officers serve a term of one year and are elected annually by the Board of Trustees. Information pertaining to the Trustees and officers is set forth below. The business address of each Trustee and officer listed below is 51 Madison Avenue, New York, New York 10010. A majority of the Trustees are not “interested persons” (as defined by the 1940 Act) of the Funds (“Independent Trustees”).
Name and Date of Birth | Term of Office, Position(s) Held and Length of Service | Principal Occupation(s) During Past Five Years | Number of Portfolios in Fund Complex Overseen by Board Member | Other Directorships Held By Board Member | ||||||||
Interested Board Member* | John Y. Kim* 9/24/60 | Indefinite; MainStay Funds Trust: Trustee since 2008.** | Vice Chairman (since January 2014) and Chief Investment Officer (since 2011), New York Life Insurance Company; President, Investments Group—New York Life Insurance Company (since 2012); Chairman of the Board of Managers and Chief Executive Officer, New York Life Investment Management Holdings LLC (since 2008); Chairman of the Board of Managers (since 2008) and Chief Executive Officer (2008 to 2013), New York Life Investment Management LLC; Member of the Board, MCF Capital Management LLC (since 2012), Private Advisors LLC (since 2010); MacKay Shields LLC and Madison Capital Funding LLC (since 2008); and Member of the Board of Managers, McMorgan and Company LLC and GoldPoint Partners (fka NYLCAP Manager LLC) (2008-2012) | 83 | The MainStay Funds: Trustee since 2008 (12 Funds); MainStay VP Funds Trust: Trustee since 2008 (29 portfolios)***; Private Advisors Alternative Strategies Master Fund: Trustee since 2011; Private Advisors Alternative Strategies Fund: Trustee since 2011; and MainStay DefinedTerm Municipal Opportunities Fund: Trustee since 2011. |
| * | This Trustee is considered to be an “interested person” of the MainStay Group of Funds within the meaning of the 1940 Act because of his affiliation with New York Life Insurance Company, New York Life Investment Management LLC, Cornerstone Capital Management Holdings LLC, Cornerstone Capital Management LLC, MacKay Shields LLC, Institutional Capital LLC, NYL Investors LLC, NYLIFE Securities LLC and/or NYLIFE Distributors LLC, as described in detail above in the column entitled “Principal Occupation(s) During Past Five Years.” Mr. Kim has resigned from the Board, effective December 31, 2015. Effective on that date, the Board has appointed Christopher O. Blunt to become an interested trustee. |
| ** | Includes prior service as a Director/Trustee of certain predecessor entities to MainStay Funds Trust. |
| *** | Includes prior service as a Director of MainStay VP Series Fund, Inc., the predecessor to MainStay VP Funds Trust. |
| 67 |
Name and Date of Birth | Term of Office, Position(s) Held and | Principal Occupation(s) During Past Five Years | Number of | Other Directorships Held By Board Member | ||||||||
Non-Interested | David H. Chow 12/29/57***** | Indefinite; MainStay Funds: Advisory Board member since June 4, 2015; MainStay Funds Trust: Advisory Board member since June 4, 2015 | Member, Governing Council of the Independent Directors Council (since 2012); former President and Member of the Board, CFA Society of Stamford (since 2009); Member of the Board, Forward Management, LLC (2008 to 2015); Trustee, Berea College of Kentucky (since 2009); Founder and CEO, DanCourt Management, LLC (since 1999). | 83 | MainStay VP Funds Trust: Advisory Board Member since June 4, 2015 (30 portfolios); Private Advisors Alternative Strategies Fund: Advisory Board Member since June 4, 2015; Private Advisors Alternative Strategies Master Fund: Advisory Board Member since June 4, 2015; MainStay DefinedTerm Municipal Opportunities Fund: Advisory Board Member since June 4, 2015; and Market Vectors ETF Trust: Independent Chairman of the Board of Trustees since 2008 and Trustee since 2006 (55 portfolios). | |||||||
Susan B. Kerley 8/12/51 | Indefinite; MainStay Funds Trust: Trustee since 1990.** | President, Strategic Management Advisors LLC (since 1990) | 83 | The MainStay Funds: Trustee since 2007 (12 Funds); MainStay VP Funds Trust: Trustee since 2007 (29 portfolios)***; Private Advisors Alternative Strategies Master Fund: Trustee since 2011; Private Advisors Alternative Strategies Fund: Trustee since 2011; MainStay DefinedTerm Municipal Opportunities Fund: Trustee since 2011; and Legg Mason Partners Funds: Trustee since 1991 (53 portfolios). | ||||||||
| Alan R. Latshaw 3/27/51 | Indefinite; MainStay Funds Trust: Trustee and Audit Committee Financial Expert since 2007.** | Retired; Partner, Ernst & Young LLP (2002 to 2003); Partner, Arthur Andersen LLP (1989 to 2002); Consultant to the MainStay Funds Audit and Compliance Committee (2004 to 2006) | 83 | The MainStay Funds: Trustee and Audit Committee Financial Expert since 2006 (12 Funds); MainStay VP Funds Trust: Trustee and Audit Committee Financial Expert since 2007 (29 portfolios)***; Private Advisors Alternative Strategies Master Fund: Trustee and Audit Committee Financial Expert since 2011; Private Advisors Alternative Strategies Fund: Trustee and Audit Committee Financial Expert since 2011; MainStay DefinedTerm Municipal Opportunities Fund: Trustee and Audit Committee Financial Expert since 2011; State Farm Associates Funds Trusts: Trustee since 2005 (4 portfolios); State Farm Mutual Fund Trust: Trustee since 2005 (15 portfolios); and State Farm Variable Product Trust: Trustee since 2005 (9 portfolios). |
| 68 | MainStay Cushing Fund |
Name and Date of Birth | Term of Office, Position(s) Held and | Principal Occupation(s) During Past Five Years | Number of | Other Directorships Held By Board Member | ||||||||
Non-Interested | Peter Meenan 12/5/41 | Indefinite; MainStay Funds Trust: Chairman since 2013 and Trustee since 2002.** | Retired; Independent Consultant (2004 to 2013); President and Chief Executive Officer, Babson—United, Inc. (financial services firm) (2000 to 2004); Independent Consultant (1999 to 2000); Head of Global Funds, Citicorp (1995 to 1999) | 83 | The MainStay Funds: Chairman since 2013 and Trustee since 2007 (12 Funds); MainStay VP Funds Trust: Chairman since 2013 and Trustee since 2007 (29 portfolios)***; Private Advisors Alternative Strategies Master Fund: Chairman since 2013 and Trustee since 2011; Private Advisors Alternative Strategies Fund: Chairman since 2013 and Trustee since 2011; and MainStay DefinedTerm Municipal Opportunities Fund: Chairman since 2013 and Trustee since 2011. | |||||||
Richard H. Nolan, Jr. 11/16/46 | Indefinite; MainStay Funds Trust: Trustee since 2007.** | Managing Director, ICC Capital Management (since 2004); President—Shields/ Alliance, Alliance Capital Management (1994 to 2004) | 83 | The MainStay Funds: Trustee since 2007 (12 Funds); MainStay VP Funds Trust: Trustee since 2006 (29 portfolios)***; Private Advisors Alternative Strategies Master Fund: Trustee since 2011; Private Advisors Alternative Strategies Fund: Trustee since 2011; and MainStay DefinedTerm Municipal Opportunities Fund: Trustee since 2011. | ||||||||
Jacques P. Perold 5/12/58***** | Indefinite; MainStay Funds: Advisory Board member since June 4, 2015; MainStay Funds Trust: Advisory Board member since June 4, 2015 | Retired; Trustee, Boston University (since 2014); President, Fidelity Management & Research Company (2009 to 2014); Founder, President and Chief Executive Officer, Geode Capital Management, LLC (2001 to 2009). | 83 | MainStay VP Funds Trust: Advisory Board Member since June 4, 2015 (30 portfolios); Private Advisors Alternative Strategies Fund: Advisory Board Member since June 4, 2015; Private Advisors Alternative Strategies Master Fund: Advisory Board Member since June 4, 2015; and MainStay DefinedTerm Municipal Opportunities Fund: Advisory Board Member since June 4, 2015. | ||||||||
Richard S. Trutanic 2/13/52 | Indefinite; MainStay Funds Trust: Trustee since 2007.** | Chairman and Chief Executive Officer, Somerset & Company (financial advisory firm) (since 2004); Managing Director, The Carlyle Group (private investment firm) (2002 to 2004); Senior Managing Director, Partner and Board Member, Groupe Arnault S.A. (private investment firm) (1999 to 2002) | 83 | The MainStay Funds: Trustee since 1994 (12 Funds); MainStay VP Funds Trust: Trustee since 2007 (29 portfolios)***; Private Advisors Alternative Strategies Master Fund: Trustee since 2011; Private Advisors Alternative Strategies Fund: Trustee since 2011; and MainStay DefinedTerm Municipal Opportunities Fund: Trustee since 2011. |
| 69 |
Name and Date of Birth | Term of Office, Position(s) Held and | Principal Occupation(s) During Past Five Years | Number of | Other Directorships Held By Board Member | ||||||||
Non-Interested | Roman L. Weil**** 5/22/40 | Indefinite; MainStay Funds Trust: Trustee and Audit Committee Financial Expert since 2007.** | President, Roman L. Weil Associates, Inc. (consulting firm) (since 1981); V. Duane Rath Professor Emeritus of Accounting, Chicago Booth School of Business, University of Chicago (since 2008); Visiting Professor, Johns Hopkins University (2013); Visiting Professor, University of California—San Diego (since 2012); Visiting Professor, Southern Methodist University (2011); Visiting Professor, NYU Stern School of Business, New York University (2011) | 83 | The MainStay Funds: Trustee and Audit Committee Financial Expert since 2007 (12 Funds); MainStay VP Funds Trust: Trustee and Audit Committee Financial Expert since 1994 (29 portfolios)***; Private Advisors Alternative Strategies Master Fund: Trustee and Audit Committee Financial Expert since 2011; Private Advisors Alternative Strategies Fund: Trustee and Audit Committee Financial Expert since 2011; and MainStay DefinedTerm Municipal Opportunities Fund: Trustee and Audit Committee Financial Expert since 2011. | |||||||
John A. Weisser 10/22/41 | Indefinite; MainStay Funds Trust: Trustee since 2007.** | Retired; Managing Director of Salomon Brothers, Inc. (1971 to 1995) | 83 | The MainStay Funds: Trustee since 2007 (12 Funds); MainStay VP Funds Trust: Trustee since 1997 (29 portfolios)***; Private Advisors Alternative Strategies Master Fund: Trustee since 2011; Private Advisors Alternative Strategies Fund: Trustee since 2011; MainStay DefinedTerm Municipal Opportunities Fund: Trustee since 2011; Direxion Insurance Trust: Trustee since 2007 (1 portfolio); Direxion Funds: Trustee since 2007 (18 portfolios); and Direxion Shares ETF Trust: Trustee since 2008 (52 portfolios). |
| ** | Includes prior service as a Director/Trustee of certain predecessor entities to MainStay Funds Trust. |
| *** | Includes prior service as a Director of MainStay VP Series Fund, Inc., the predecessor to MainStay VP Funds Trust. |
| **** | Pursuant to the Board’s retirement policy, Mr. Weil retired on December 31, 2015. |
| ***** | Effective January 1, 2016, Messrs. Chow and Perold will serve as Trustees. |
| 70 | MainStay Cushing Fund |
Name and Date of Birth | Position(s) Held and Length of Service | Principal Occupation(s) During Past Five Years | ||||||
Officers | Stephen P. Fisher 2/22/59 | President, MainStay Funds Trust (since 2009) | Chairman and Chief Executive Officer (since January 2014), President and Chief Operating Officer (2008 to 2013), NYLIFE Distributors LLC; Senior Managing Director (since 2012) and Chairman of the Board (since 2008), NYLIM Service Company LLC; Senior Managing Director (since 2005) and Co-President (since January 2014), New York Life Investment Management LLC; President, Private Advisors Alternative Strategies Master Fund, Private Advisors Alternative Strategies Fund and MainStay DefinedTerm Municipal Opportunities Fund (since 2011) and The MainStay Funds and MainStay VP Funds Trust (since 2007)** | |||||
Jack R. Benintende 5/12/64 | Treasurer and Principal Financial and Accounting Officer, MainStay Funds Trust (since 2009) | Managing Director, New York Life Investment Management LLC (since 2007); Treasurer and Principal Financial and Accounting Officer, Private Advisors Alternative Strategies Master Fund, Private Advisors Alternative Strategies Fund and MainStay DefinedTerm Municipal Opportunities Fund (since 2011) and The MainStay Funds and MainStay VP Funds Trust (since 2007)**; and Assistant Treasurer, New York Life Investment Management Holdings LLC (2008 to 2012)); | ||||||
Kevin M. Bopp 2/24/69 | Vice President and Chief Compliance Officer, MainStay Funds Trust (since October 2014) | Vice President and Chief Compliance Officer, The MainStay Funds, MainStay VP Funds Trust, Private Advisors Alternative Strategies Fund, Private Advisors Alternative Strategies Master Fund and MainStay DefinedTerm Municipal Opportunities Fund (October 2014 to present); Director and Associate General Counsel (2011 to December 2014) and Vice President and Assistant General Counsel (2010 to 2011), New York Life Investment Management LLC; Assistant Secretary, The MainStay Funds, MainStay Funds Trust and MainStay VP Funds Trust (2010 to 2014)**, Private Advisors Alternative Strategies Fund, Private Advisors Alternative Strategies Master Fund and MainStay DefinedTerm Municipal Opportunities Fund (2011 to 2014); Associate, Dechert LLP (2006 to 2010) | ||||||
J. Kevin Gao 10/13/67 | Secretary and Chief Legal Officer, MainStay Funds Trust (since 2010) | Managing Director and Associate General Counsel, New York Life Investment Management LLC (since 2010); Secretary and Chief Legal Officer, Private Advisors Alternative Strategies Master Fund, Private Advisors Alternative Strategies Fund and MainStay DefinedTerm Municipal Opportunities Fund (since 2011) and The MainStay Funds and MainStay VP Funds Trust (since 2010)**; Director and Counsel, Credit Suisse; Chief Legal Officer and Secretary, Credit Suisse Asset Management LLC and Credit Suisse Funds (2003 to 2010) | ||||||
Scott T. Harrington 2/8/59 | Vice President—Administration, MainStay Funds Trust (since 2009) | Director, New York Life Investment Management LLC (including predecessor advisory organizations) (since 2000); Member of the Board of Directors, New York Life Trust Company (since 2009); Vice President—Administration, Private Advisors Alternative Strategies Master Fund, Private Advisors Alternative Strategies Fund and MainStay DefinedTerm Municipal Opportunities Fund (since 2011) and The MainStay Funds and MainStay VP Funds Trust (since 2005)** |
| * | The Officers listed above are considered to be “interested persons” of the MainStay Group of Funds within the meaning of the 1940 Act because of their affiliation with the MainStay Group of Funds, New York Life Insurance Company, New York Life Investment Management LLC, New York Life Insurance Company, New York Life Investment Management LLC, NYLIFE Securities LLC and/or NYLIFE Distributors LLC, as described in detail in the column captioned “Principal Occupation(s) During Past Five Years.” Officers are elected annually by the Board of Trustees to serve a one year term. |
| ** | Includes prior service as an Officer of MainStay VP Series Fund, Inc., the predecessor to MainStay VP Funds Trust. |
| 71 |
This page intentionally left blank
This page intentionally left blank
This page intentionally left blank
MainStay Funds
MainStay offers a wide range of Funds for virtually any investment need. The full array of MainStay open-end offerings is listed here, with information about the manager, subadvisors, legal counsel and independent registered public accounting firms.
Equity
U.S. Equity
MainStay Common Stock Fund
MainStay Cornerstone Growth Fund
MainStay Epoch U.S. All Cap Fund
MainStay Epoch U.S. Equity Yield Fund
MainStay ICAP Equity Fund
MainStay ICAP Select Equity Fund
MainStay Large Cap Growth Fund
MainStay MAP Fund
MainStay S&P 500 Index Fund
MainStay U.S. Equity Opportunities Fund
MainStay U.S. Small Cap Fund
International/Global Equity
MainStay Emerging Markets Opportunities Fund
MainStay Epoch Global Choice Fund
MainStay Epoch Global Equity Yield Fund
MainStay Epoch International Small Cap Fund
MainStay ICAP International Fund
MainStay International Equity Fund
MainStay International Opportunities Fund
Income
Taxable Bond
MainStay Floating Rate Fund
MainStay Global High Income Fund
MainStay Government Fund
MainStay High Yield Corporate Bond Fund
MainStay High Yield Opportunities Fund
MainStay Indexed Bond Fund
MainStay Short Duration High Yield Fund
MainStay Total Return Bond Fund
MainStay Unconstrained Bond Fund
Municipal/Tax Advantaged Bond
MainStay California Tax Free Opportunities Fund1
MainStay High Yield Municipal Bond Fund
MainStay New York Tax Free Opportunities Fund2
MainStay Tax Advantaged Short Term Bond Fund
MainStay Tax Free Bond Fund
Money Market
MainStay Money Market Fund
Mixed Asset
MainStay Balanced Fund
MainStay Convertible Fund
MainStay Income Builder Fund
Alternative
MainStay Absolute Return Multi-Strategy Fund
MainStay Cushing MLP Premier Fund
MainStay Cushing Renaissance Advantage Fund
MainStay Cushing Royalty Energy Income Fund
MainStay Marketfield Fund
Asset Allocation/Target Date
MainStay Conservative Allocation Fund
MainStay Growth Allocation Fund
MainStay Moderate Allocation Fund
MainStay Moderate Growth Allocation Fund
MainStay Retirement 2010 Fund
MainStay Retirement 2020 Fund
MainStay Retirement 2030 Fund
MainStay Retirement 2040 Fund
MainStay Retirement 2050 Fund
Manager
New York Life Investment Management LLC
New York, New York
Subadvisors
Candriam France S.A.S.3
Paris, France
Cornerstone Capital Management Holdings LLC3
New York, New York
Cornerstone Capital Management LLC3
Bloomington, Minnesota
Cushing Asset Management, LP
Dallas, Texas
Epoch Investment Partners, Inc.
New York, New York
Institutional Capital LLC3
Chicago, Illinois
MacKay Shields LLC3
New York, New York
Marketfield Asset Management LLC
New York, New York
Markston International LLC
White Plains, New York
NYL Investors LLC3
New York, New York
Winslow Capital Management LLC
Minneapolis, Minnesota
Legal Counsel
Dechert LLP
Independent Registered Public Accounting Firms
KPMG LLP4
PricewaterhouseCoopers LLP5
1. This Fund is only registered for sale in AZ, CA, NV, OR, UT, and WA.
2. This Fund is only registered for sale in CT, DE, FL, MA, NJ, NY, and VT.
3. An affiliate of New York Life Investment Management LLC.
4. For all Funds listed above except MainStay Marketfield Fund.
5. For MainStay Marketfield Fund only.
Not part of the Annual Report
For more information
800-MAINSTAY (624-6782)
mainstayinvestments.com
MainStay Investments® is a registered service mark and name under which New York Life Investment Management LLC does business. MainStay Investments, an indirect subsidiary of New York Life Insurance Company, New York, NY 10010, provides investment advisory products and services. The MainStay Funds® are managed by New York Life Investment Management LLC and distributed through NYLIFE Distributors LLC, 169 Lackawanna Avenue, Parsippany, NJ 07054, a wholly owned subsidiary of New York Life Insurance Company. NYLIFE Distributors LLC is a Member FINRA/SIPC.
©2016 NYLIFE Distributors LLC. All rights reserved.
| Not FDIC/NCUA Insured | Not a Deposit | May Lose Value | No Bank Guarantee | Not Insured by Any Government Agency |
| 1676958 MS008-16 | MSCU11-01/16 (NYLIM) NL258 |
Item 2. Code of Ethics.
As of the end of the period covered by this report, the Registrant has adopted a code of ethics (the “Code”) that applies to the Registrant’s principal executive officer (“PEO”) and principal financial officer (“PFO”). A copy of the Code is filed herewith. The Registrant did not grant any waivers, including implicit waivers, from any provisions of the Code to the PEO or PFO during the period covered by this report.
| Item 3. | Audit Committee Financial Expert. |
The Board of Trustees has determined that the Registrant has two audit committee financial experts serving on its Audit Committee. The Audit Committee financial experts are Alan R. Latshaw and Roman L. Weil. Messrs. Latshaw and Weil are “independent” within the meaning of that term under the Investment Company Act of 1940.
| Item 4. | Principal Accountant Fees and Services. |
(a) Audit Fees
The aggregate fees billed for the fiscal year ended November 30, 2015 for professional services rendered by KPMG LLP (“KPMG”) for the audit of the Registrant’s annual financial statements or services that are normally provided by KPMG in connection with statutory and regulatory filings or engagements for that fiscal year were $221,500.
The aggregate fees billed for the fiscal year ended November 30, 2014 for professional services rendered by KPMG LLP (“KPMG”) for the audit of the Registrant’s annual financial statements or services that are normally provided by KPMG in connection with statutory and regulatory filings or engagements for that fiscal year were $215,000.
(b) Audit-Related Fees
The aggregate fees billed for assurance and related services by KPMG that are reasonably related to the performance of the audit of the Registrant’s financial statements and are not reported under paragraph (a) of this Item were: (i) $0 for the fiscal year ended November 30, 2015, and (ii) $0 for the fiscal year ended November 30, 2014. These audit-related services include review of financial highlights for Registrant’s registration statements and issuance of consents to use the auditor’s reports.
| (c) | Tax Fees |
The aggregate fees billed for professional services rendered by KPMG for tax compliance, tax advice, and tax planning were: (i) $0 for the fiscal year ended November 30, 2015; and (ii) $0 for the fiscal year ended November 30, 2014. These services primarily included preparation of federal, state and local income tax returns and excise tax returns, as well as services relating to excise tax distribution requirements.
| (d) | All Other Fees |
The aggregate fees billed for products and services provided by KPMG, other than the services reported in paragraphs (a) through (c) of this Item were: (i) $0 during the fiscal year ended November 30, 2015; and (ii) $0 during the fiscal year ended November 30, 2014.
| (e) | Pre-Approval Policies and Procedures |
| (1) | The Registrant’s Audit Committee has adopted pre-approval policies and procedures (the “Procedures”) to govern the Committee’s pre-approval of (i) all audit services and permissible non-audit services to be provided to the Registrant by its independent accountant, and (ii) all permissible non-audit services to be provided by such independent accountant to the Registrant’s investment adviser and to any entity controlling, controlled by or under common control with the investment adviser that provides ongoing services to the Registrant (collectively, the “Service Affiliates”) if the services directly relate to the Registrant’s operations and financial reporting. In accordance with the Procedures, the Audit Committee is responsible for the engagement of the independent accountant to certify the Registrant’s financial statements for each fiscal year. With respect to the pre-approval of non-audit services provided to the Registrant and its Service Affiliates, the Procedures provide that the Audit Committee may annually pre-approve a list of the types of services that may be provided to the Registrant or its Service Affiliates, or the Audit Committee may pre-approve such services on a project-by-project basis as they arise. Unless a type of service has received general pre-approval, it will require specific pre-approval by the Audit Committee if it is to be provided by the independent accountant. The Procedures also permit the Audit Committee to delegate authority to one or more of its members to pre-approve any proposed non-audit services that have not been previously pre-approved by the Audit Committee, subject to the ratification by the full Audit Committee no later than its next scheduled meeting. To date, the Audit Committee has not delegated such authority. |
| (2) | With respect to the services described in paragraphs (b) through (d) of this Item 4, no amount was approved by the Audit Committee pursuant to paragraph (c)(7)(i)(C) of Rule 2-01 of Regulation S-X. |
(f) There were no hours expended on KPMG’s engagement to audit the Registrant’s financial statements for the most recent fiscal year was attributable to work performed by persons other than KPMG’s full-time, permanent employees.
(g) All non-audit fees billed by KPMG for services rendered to the Registrant for the fiscal years ended November 30, 2015 and November 30, 2014 are disclosed in 4(b)-(d) above.
The aggregate non-audit fees billed by KPMG for services rendered to the Registrant’s investment adviser (not including any sub-adviser whose role is primarily portfolio management and is subcontracted with or overseen by another investment adviser), and any entity controlling, controlled by, or under common
control with the adviser that provides ongoing services to the Registrant were approximately: (i) $0 for the fiscal year ended November 30, 2015; and (ii) $0 for the fiscal year ended November 30, 2014.
(h) The Registrant’s Audit Committee has determined that the non-audit services rendered by KPMG for the fiscal year ended November 30, 2015 to the Registrant’s investment adviser and any entity controlling, controlled by, or under common control with the Registrant’s investment adviser that provides ongoing services to the Registrant that were not required to be pre-approved by the Audit Committee because they did not relate directly to the operations and financial reporting of the registrant were compatible with maintaining the respective independence of KPMG during the relevant time period.
| Item 5. | Audit Committee of Listed Registrants |
Not applicable.
| Item 6. | Schedule of Investments |
The Schedule of Investments is included as part of Item 1 of this report.
| Item 7. | Disclosure of Proxy Voting Policies and Procedures for Closed-End Management Investment Companies. |
Not applicable.
| Item 8. | Portfolio Managers of Closed-End Management Investment Companies. |
Not applicable.
| Item 9. | Purchases of Equity Securities by Closed-End Management Investment Company and Affiliated Purchasers. |
Not Applicable.
| Item 10. | Submission of Matters to a Vote of Security Holders. |
Since the Registrant’s last response to this Item, there have been no material changes to the procedures by which shareholders may recommend nominees to the Registrant’s Board of Trustees.
| Item 11. | Controls and Procedures. |
(a) Based on an evaluation of the Registrant’s Disclosure Controls and Procedures (as defined in Rule 30a-3(c) under the Investment Company Act of 1940) (the “Disclosure Controls”), as of a date within 90 days prior to the filing date (the “Filing Date”) of this Form N-CSR (the “Report”), the Registrant’s principal executive officer and principal financial officer have concluded that the Disclosure Controls are reasonably designed to ensure that information required to be disclosed by the Registrant in the Report is recorded, processed, summarized and reported by the Filing Date, including ensuring that information required to be disclosed in the Report is accumulated and communicated to the Registrant’s management, including the Registrant’s principal executive officer and principal financial officer, as appropriate to allow timely decisions regarding required disclosure.
(b) There were no changes in the Registrant’s internal control over financial reporting (as defined in Rule 30a-3(d)) under the Investment Company Act of 1940 that occurred during the second fiscal quarter
of the period covered by this report that has materially affected, or is reasonably likely to materially affect, the Registrant’s internal control over financial reporting.
Item 12. Exhibits.
| (a)(1) | Code of Ethics |
| (a)(2) | Certifications of principal executive officer and principal financial officer as required by Rule 30a-2 under the Investment Company Act of 1940. |
| (b) | Certifications of principal executive officer and principal financial officer as required by Section 906 of the Sarbanes-Oxley Act of 2002. |
SIGNATURES
Pursuant to the requirements of the Securities Exchange Act of 1934 and the Investment Company Act of 1940, the Registrant has duly caused this Report to be signed on its behalf by the undersigned, thereunto duly authorized.
MAINSTAY FUNDS TRUST
| By: | /s/ Stephen P. Fisher | |
Stephen P. Fisher President and Principal Executive Officer | ||
| Date: | February 5, 2016 | |
Pursuant to the requirements of the Securities Exchange Act of 1934 and the Investment Company Act of 1940, this Report has been signed below by the following persons on behalf of the Registrant and in the capacities and on the dates indicated.
| By: | /s/ Stephen P. Fisher | |
Stephen P. Fisher President and Principal Executive Officer | ||
| Date: | February 5, 2016 | |
| By: | /s/ Jack R. Benintende | |
Jack R. Benintende Treasurer and Principal Financial and Accounting Officer | ||
| Date: | February 5, 2016 | |
EXHIBIT INDEX
| (a)(1) | Code of Ethics |
| (a)(2) | Certifications of principal executive officer and principal financial officer as required by Rule 30a-2 under the Investment Company Act of 1940. |
| (b) | Certification of principal executive officer and principal financial officer as required by Section 906 of the Sarbanes-Oxley Act of 2002. |