UNITED STATES
SECURITIES AND EXCHANGE COMMISSION
Washington, D.C. 20549
Form N-CSR
CERTIFIED SHAREHOLDER REPORT OF REGISTERED MANAGEMENT
INVESTMENT COMPANIES
Investment Company Act File Number 811-22321
MAINSTAY FUNDS TRUST
(Exact name of Registrant as specified in charter)
51 Madison Avenue, New York, NY 10010
(Address of principal executive offices) (Zip code)
J. Kevin Gao, Esq.
169 Lackawanna Avenue
Parsippany, New Jersey 07054
(Name and address of agent for service)
Registrant’s telephone number, including area code: (212) 576-7000
Date of fiscal year end: April 30
Date of reporting period: April 30, 2015
FORM N-CSR
The information presented in this Form N-CSR relates solely to the
MainStay Tax Advantaged Short Term Bond Fund, a series of the Registrant.
Item 1. Reports to Stockholders.
MainStay Short Term Bond Fund
Message from the President and Annual Report
April 30, 2015


This page intentionally left blank
Message from the President
During the six months ended April 30, 2015, investors weathered a number of market events. In December 2014, U.S. stocks fell to their lowest levels during the six-month reporting period when the price of crude oil substantially declined.
Although energy prices began to rise again in 2015, many energy, utility and natural resources stocks suffered losses for the reporting period. On the other hand, lower energy prices helped airlines and trucking companies, and low gasoline prices boosted household purchasing power. The U.S. stock market as a whole recovered from its December lows and provided positive returns for the six months ended April 30, 2015.
Early in the new year, renewed speculation that Greece might exit the European monetary union took a toll on international markets. European bonds, which have faced a series of setbacks in recent years, remained weak; and as an asset class, international bonds declined during the reporting period.
Despite widespread anticipation of a Federal Reserve rate hike, the Federal Open Market Committee kept the federal funds target rate in its now-familiar near-zero range. Other central banks, including those in Europe, Japan and China also remained accommodative as they sought to stimulate economic growth.
In the United States, gross domestic product (GDP) growth slowed in the fourth quarter of 2014 and slowed further in the first quarter of 2015. While severe winter weather was partly to blame, other factors played a role. A strike by a dock workers’ union on the West Coast disrupted supply chains, and export companies headquartered in the United States faced reduced demand as the U.S. dollar strengthened relative to other major currencies.
The U.S. labor market showed modest improvement during much of the reporting period, and inflation remained low. The merger and acquisition market was active, and solid earnings reports helped stocks at all capitalization levels. According to Russell data, mid-cap stocks modestly outperformed large-cap and small-cap stocks overall, and growth-oriented stocks outperformed value-oriented stocks at all capitalization levels during the reporting period.
At MainStay, our portfolio managers seek to identify trends that are likely to influence the markets in which they invest. Even when the markets move in unexpected ways, however, our portfolio managers seek to pursue the investment objectives of their respective Funds using the investment strategies and processes outlined in each Fund’s prospectus.
The annual report that follows provides more detailed information about the markets, securities and specific investment decisions that influenced your MainStay Fund during the six months ended April 30, 2015. As you review this information, we hope that you’ll maintain a long-term perspective suited to your investment goals and objectives.
By regularly reviewing the investments you already own, you may be in a better position to expand your investment horizons by adding diversification, widening your risk profile or choosing additional Funds that fit with those you already own.
We thank you for choosing MainStay Funds. It has been a privilege to serve you, and we look forward to playing a continuing role as you pursue your financial goals.
Sincerely,

Stephen P. Fisher
President
The opinions expressed are as of the date of this report and are subject to change. There is no guarantee that any forecast made will come to pass. This material does not constitute investment advice and is not intended as an endorsement of any specific investment. Past performance is no guarantee of future results.
Not part of the Annual Report
| Annual Report | ||||
| Investment and Performance Comparison | 5 | |||
| Portfolio Management Discussion and Analysis | 9 | |||
| Portfolio of Investments | 11 | |||
| Financial Statements | 14 | |||
| Notes to Financial Statements | 19 | |||
| Report of Independent Registered Public Accounting Firm | 25 | |||
| Board Consideration and Approval of Management Agreement and Subadvisory Agreement | 26 | |||
| Federal Income Tax Information | 30 | |||
| Proxy Voting Policies and Procedures and Proxy Voting Record | 30 | |||
| Shareholder Reports and Quarterly Portfolio Disclosure | 30 | |||
| Board of Trustees and Officers | 31 | |||
Investors should refer to the Fund’s Summary Prospectus and/or Prospectus and consider the Fund’s investment objectives, strategies, risks, charges and expenses carefully before investing. The Summary Prospectus and/or Prospectus contain this and other information about the Fund. You may obtain copies of the Fund’s Summary Prospectus, Prospectus and Statement of Additional Information free of charge, upon request, by calling toll-free 800-MAINSTAY (624-6782), by writing to NYLIFE Distributors LLC, Attn: MainStay Marketing Department, 169 Lackawanna Avenue, Parsippany, New Jersey 07054 or by sending an e-mail to MainStayShareholderServices@nylim.com. These documents are also available via the MainStay Funds’ website at mainstayinvestments.com/documents. Please read the Summary Prospectus and/or Prospectus carefully before investing.
Investment and Performance Comparison1 (Unaudited)
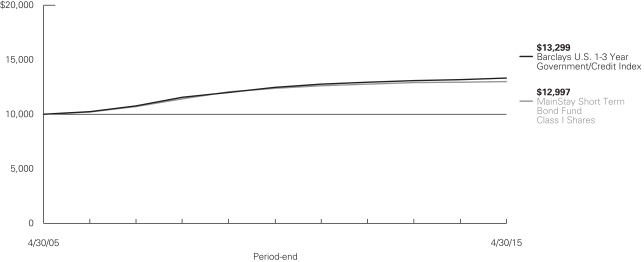
Performance data quoted represents past performance. Past performance is no guarantee of future results. Because of market volatility, current performance may be lower or higher than the figures shown. Investment return and principal value will fluctuate, and as a result, when shares are redeemed, they may be worth more or less than their original cost. The graph below depicts the historical performance of Class I shares of the Fund. Performance will vary from class to class based on differences in class-specific expenses and sales charges. For performance information current to the most recent month-end, please call 800-MAINSTAY (624-6782) or visit mainstayinvestments.com.
Average Annual Total Returns for the Period Ended April 30, 2015
| Class | Sales Charge | Six Months | One Year | Five Years | Ten Years | Gross Expense Ratio2 | ||||||||||||||||||
| Class A Shares | Maximum 3% Initial Sales Charge | With sales charges Excluding sales charges |
| –2.74 0.27 | %
|
| –2.76 0.25 | %
|
| 0.13 0.74 | %
|
| 2.06 2.37 | %
|
| 0.97 0.97 | %
| |||||||
| Investor Class Shares3 | Maximum 3% Initial Sales Charge | With sales charges Excluding sales charges |
| –2.98 0.02 |
|
| –3.06 –0.07 |
|
| –0.23 0.38 |
|
| 1.82 2.13 |
|
| 1.35 1.35 |
| |||||||
| Class I Shares | No Sales Charge | 0.40 | 0.61 | 0.99 | 2.66 | 0.72 | ||||||||||||||||||
| 1. | The performance table and graph do not reflect the deduction of taxes that a shareholder would pay on distributions or Fund share redemptions. Total returns reflect maximum applicable sales charges as indicated in the table above, changes in share price, and reinvestment of dividend and capital gain distributions. The graph assumes the initial investment amount shown above and reflect the deduction of all sales charges that would have applied for the periods of investment. Performance figures reflect certain fee waivers and/or expense limitations, without which total returns may have been lower. For more information on share classes and current fee waivers and/or expense limitations, please refer to the notes to the financial statements. |
| 2. | The gross expense ratios presented reflect the Fund’s “Total Annual Fund Operating Expenses” from the most recent Prospectus and may differ from other expense ratios disclosed in this report. |
| 3. | Performance figures for Investor Class shares, first offered on February 28, 2008, include the historical performance of Class A shares through February 27, 2008, adjusted for differences in certain expenses and fees. Unadjusted, the performance shown for Investor Class shares would likely have been different. |
The footnotes on the next page are an integral part of the table and graph and should be carefully read in conjunction with them.
| 5 |
| Benchmark Performance | Six Months | One Year | Five Years | Ten Years | ||||||||||||
Barclays U.S. 1-3 Year Government/Credit Index4 | 0.56 | % | 1.05 | % | 1.31 | % | 2.89 | % | ||||||||
Average Lipper Short U.S. Government Fund5 | 0.40 | 0.65 | 0.76 | 2.31 | ||||||||||||
| 4. | The Barclays U.S. 1-3 Year Government/Credit Index includes investment grade corporate debt issues as well as debt issues of U.S. government agencies and the U.S. Treasury, with maturities of one to three years. The Barclays U.S. 1-3 Year Government/Credit Index is the Fund’s broad-based securities-market index for comparison purposes. Total returns assume reinvestment of all dividends and capital gains. An investment cannot be made directly in an index. |
| 5. | The average Lipper short U.S. government fund is representative of funds that invest primarily in securities issued or guaranteed by the U.S. government, its agencies, or its instrumentalities, with dollar-weighted average maturities of less than three years. This benchmark is a product of Lipper Inc. Lipper Inc. is an independent monitor of fund performance. Results are based on average total returns of similar funds with all dividend and capital gain distributions reinvested. |
The footnotes on the preceding page are an integral part of the table and graph and should be carefully read in conjunction with them.
| 6 | MainStay Short Term Bond Fund |
Cost in Dollars of a $1,000 Investment in MainStay Short Term Bond Fund (Unaudited)
The example below is intended to describe the fees and expenses borne by shareholders during the six-month period from November 1, 2014, to April 30, 2015, and the impact of those costs on your investment.
Example
As a shareholder of the Fund, you incur two types of costs: (1) transaction costs, including exchange fees and sales charges (loads) on purchases (as applicable), and (2) ongoing costs, including management fees, distribution and/or service (12b-1) fees, and other Fund expenses (as applicable). This example is intended to help you understand your ongoing costs (in dollars) of investing in the Fund and to compare these costs with the ongoing costs of investing in other mutual funds. The example is based on an investment of $1,000 made at the beginning of the six-month period and held for the entire period from November 1, 2014, to April 30, 2015.
This example illustrates your Fund’s ongoing costs in two ways:
Actual Expenses
The second and third data columns in the table below provide information about actual account values and actual expenses. You may use the information in these columns, together with the amount you invested, to estimate the expenses that you paid during the six months ended April 30, 2015. Simply divide your account value by $1,000 (for example, an $8,600 account value divided by $1,000 = 8.6), then
multiply the result by the number under the heading entitled “Expenses Paid During Period” to estimate the expenses you paid on your account during this period.
Hypothetical Example for Comparison Purposes
The fourth and fifth data columns in the table below provide information about hypothetical account values and hypothetical expenses based on the Fund’s actual expense ratio and an assumed rate of return of 5% per year before expenses, which is not the Fund’s actual return. The hypothetical account values and expenses may not be used to estimate the actual ending account balances or expenses you paid for the six-month period shown. You may use this information to compare the ongoing costs of investing in the Fund with the ongoing costs of investing in other Funds. To do so, compare this 5% hypothetical example with the 5% hypothetical examples that appear in the shareholder reports of the other Funds.
Please note that the expenses shown in the table are meant to highlight your ongoing costs only and do not reflect any transactional costs, such as exchange fees or sales charges (loads). Therefore, the fourth and fifth data columns of the table are useful in comparing ongoing costs only and will not help you determine the relative total costs of owning different funds. In addition, if these transactional costs were included, your costs would have been higher.
| Share Class | Beginning Account Value 11/1/14 | Ending Account Value (Based on Actual Returns and Expenses) 4/30/15 | Expenses Paid During Period1 | Ending Account Value (Based on Hypothetical 5% Annualized Return and Actual Expenses) 4/30/15 | Expenses Paid During Period1 | |||||||||||||||
| Class A Shares | $ | 1,000.00 | $ | 1,002.70 | $ | 4.27 | $ | 1,020.50 | $ | 4.31 | ||||||||||
| Investor Class Shares | $ | 1,000.00 | $ | 1,000.20 | $ | 6.05 | $ | 1,018.70 | $ | 6.11 | ||||||||||
| Class I Shares | $ | 1,000.00 | $ | 1,004.00 | $ | 3.03 | $ | 1,021.80 | $ | 3.06 | ||||||||||
| 1. | Expenses are equal to the Fund’s annualized expense ratio of each class (0.86% for Class A, 1.22% for Investor Class and 0.61% for Class I) multiplied by the average account value over the period, divided by 365 and multiplied by 181 (to reflect the six-month period). The table above represents the actual expenses incurred during the six-month period. |
| 7 |
Portfolio Composition as of April 30, 2015 (Unaudited)

See Portfolio of Investments beginning on page 11 for specific holdings within these categories.
Top Ten Issuers Held as of April 30, 2015 (excluding short-term investment) (Unaudited) |
| 1. | United States Treasury Notes, 0.25%–1.00%, due 4/15/16–5/31/18 |
| 2. | Chevron Corp., 0.889%–4.95%, due 6/24/16–3/3/19 |
| 3. | Oracle Corp., 1.20%–5.75%, due 10/15/17–4/15/18 |
| 4. | JPMorgan Chase & Co., 3.45%, due 3/1/16 |
| 5. | Total Capital S.A., 3.125%, due 10/2/15 |
| 6. | Hutchison Whampoa International, Ltd., 4.625%, due 9/11/15 |
| 7. | Japan Tobacco, Inc., 2.10%, due 7/23/18 |
| 8. | Private Export Funding Corp., 1.375%, due 2/15/17 |
| 9. | Bank of America Corp., 2.00%–5.42%, due 3/15/17–1/11/18 |
| 10. | Goldman Sachs Group, Inc. (The), 3.625%, due 2/7/16 |
| 8 | MainStay Short Term Bond Fund |
Portfolio Management Discussion and Analysis (Unaudited)
Questions answered by portfolio managers Dan Roberts, PhD, Louis N. Cohen, CFA, and Claude Athaide, PhD, CFA, of MacKay Shields LLC, the Fund’s Subadvisor.
How did MainStay Short Term Bond Fund perform relative to its primary benchmark and peers during the six months ended April 30, 2015?
Excluding all sales charges, MainStay Short Term Bond Fund returned 0.27% for Class A shares and 0.02% for Investor Class shares for the six months ended April 30, 2015. Over the same period, Class I shares returned 0.40%. For the six months ended April 30, 2015, all share classes underperformed the 0.56% return of the Barclays U.S. 1–3 Year Government/Credit Index,1 which is the Fund’s broad-based securities-market index. Over the same period, Class I shares matched—and Class A and Investor Class shares underperformed—the 0.40% return of the Average Lipper2 Short U.S. Government Fund. See page 5 for returns with applicable sales charges.
What factors affected the Fund’s relative performance during the reporting period?
The Fund maintained an overweight position relative to the Barclays U.S. 1–3 Year Government/Credit Index in corporate debt and held a bias toward lower-quality investment-grade debt (bonds rated A to BBB).3 The Fund’s overweight position in lower-quality credit and its underweight position in interest-rate risk detracted from the Fund’s relative performance.
What was the Fund’s duration4 during the reporting period?
As of April 30, 2015, the Fund’s duration was 1.63 years, which was a slightly shorter duration than that of the Barclays U.S. 1–3 Year Government/Credit Index. This positioning did not have a significant impact on performance.
What specific factors, risks or market forces prompted significant decisions for the Fund during the reporting period?
We promoted credit risk as the principal driver of performance during the reporting period. We expected corporate bonds (investment-grade and high-yield) and commercial mortgage-backed securities to have superior returns to government-related debt for three reasons. First, the prospects of the credit-
related sectors were aligned with the decision of the Federal Reserve’s monetary policymaking committee to maintain the federal funds target rate in a near-zero range. Second, the current low interest-rate environment sparked healthy demand for higher-yielding products. Third, improving profitability signaled that corporations were doing more with less: less leverage, less short-term debt and smaller funding gaps. In turn, strengthening credit fundamentals also supported a narrowing of spreads5 alongside a favorable supply/demand balance for corporate debt. (Spreads to U.S. Treasury securities tend to reflect the compensation investors require to assume credit risk.) The positive momentum of the stock market also helped the performance of corporate bonds across the credit-quality spectrum.
During the reporting period, which market segments were the strongest positive contributors to the Fund’s absolute performance and which market segments were particularly weak?
The most substantial contributors to the Fund’s absolute performance were the banking sector and U.S. Treasury securities. In the corporate bond portion of the Fund, the most substantial contributors to absolute performance were HSBC Bank, computers & peripherals company Apple and software company Oracle. The Fund’s exposure to energy bonds contributed positively to absolute performance. We remained focused primarily on midstream companies, or distributors of oil and gas. These companies had responded to the fall in energy prices with resilience, given the nature of their longer-term contracts to transport commodities. During the reporting period, retailers and the food and beverage industries contributed the least to the Fund’s positive performance.
Did the Fund make any significant purchases or sales during the reporting period?
During the reporting period, the Fund purchased bonds of health care companies Actavis and Zimmer that were issued to finance acquisitions. Actavis bought Allergan and Zimmer bought Biomet. We thought that the bonds offered attractive spreads to U.S. Treasury securities and had the potential for spread tightening as the companies paid down their debt.
| 1. | See footnote on page 6 for more information on the Barclays U.S. 1–3 Year Government/Credit Index. |
| 2. | See footnote on page 6 for more information on Lipper Inc. |
| 3. | An obligation rated ‘A’ by Standard & Poor’s (“S&P”) is deemed by S&P to be somewhat more susceptible to the adverse effects of changes in circumstances and economic conditions than obligations in higher-rated categories. In the opinion of S&P, however, the obligor’s capacity to meet its financial commitment on the obligation is still strong. An obligation rated ‘BBB’ by S&P is deemed by S&P to exhibit adequate protection parameters. In the opinion of S&P, however, adverse economic conditions or changing circumstances are more likely to lead to a weakened capacity of the obligor to meet its financial commitment on the obligation. When applied to Fund holdings, ratings are based solely on the creditworthiness of the bonds in the portfolio and are not meant to represent the security or safety of the Fund. |
| 4. | Duration is a measure of the price sensitivity of a fixed-income investment to changes in interest rates. Duration is expressed as a number of years and is considered a more accurate sensitivity gauge than average maturity. |
| 5. | The terms “spread” and “yield spread” may refer to the difference in yield between a security or type of security and comparable U.S. Treasury issues. The terms may also refer to the difference in yield between two specific securities or types of securities at a given time. |
| 9 |
During the reporting period, the Fund sold its position in Costco because the bonds were within one year of maturity and did not offer an attractive yield relative to U.S. Treasury securities. The Fund held bonds of Pfizer and PepsiCo. that matured during the reporting period.
How did the Fund’s weightings change during the reporting period?
The overall risk composition of the Fund remained intact, consistent with our longer-term approach to investing. The Fund’s weightings did not change materially during the reporting period as the Fund remained overweight relative to the Barclays U.S.
1–3 Year Government/Credit Index in investment-grade corporate bonds and underweight in U.S. Treasury securities.
How was the Fund positioned at the end of the reporting period?
As of April 30, 2015, the Fund held an underweight position relative to the Barclays U.S. 1–3 Year Government/Credit Index in U.S. Treasury bonds. As of the same date, the Fund held overweight positions relative to the Index in corporate debt. As of April 30, 2015, the Fund also held a position in commercial mortgage-backed securities.
The opinions expressed are those of the portfolio managers as of the date of this report and are subject to change. There is no guarantee that any forecast made will come to pass. This material does not constitute investment advice and is not intended as an endorsement of any specific investment.
| 10 | MainStay Short Term Bond Fund |
Portfolio of Investments April 30, 2015
| Principal Amount | Value | |||||||
Long-Term Bonds 94.3%† Corporate Bonds 52.8% |
| |||||||
Agriculture 2.8% |
| |||||||
¨Japan Tobacco, Inc. | $ | 1,070,000 | $ | 1,085,562 | ||||
Reynolds American, Inc. | 420,000 | 420,012 | ||||||
|
| |||||||
| 1,505,574 | ||||||||
|
| |||||||
Auto Manufacturers 2.0% |
| |||||||
American Honda Finance Corp. | 650,000 | 659,761 | ||||||
Daimler Finance North America LLC | 380,000 | 380,934 | ||||||
|
| |||||||
| 1,040,695 | ||||||||
|
| |||||||
Banks 15.7% |
| |||||||
¨Bank of America Corp. | ||||||||
2.00%, due 1/11/18 | 305,000 | 306,997 | ||||||
5.42%, due 3/15/17 | 655,000 | 695,732 | ||||||
Barclays Bank PLC | 665,000 | 728,907 | ||||||
BB&T Corp. | 915,000 | 921,543 | ||||||
Citigroup, Inc. | 645,000 | 690,337 | ||||||
Discover Bank / Greenwood DE | 340,000 | 340,514 | ||||||
¨Goldman Sachs Group, Inc. (The) | 975,000 | 994,913 | ||||||
HSBC Bank PLC | 945,000 | 944,616 | ||||||
¨JPMorgan Chase & Co. | 1,235,000 | 1,262,161 | ||||||
Morgan Stanley | 895,000 | 902,063 | ||||||
Royal Bank of Scotland Group PLC | 565,000 | 568,288 | ||||||
|
| |||||||
| 8,356,071 | ||||||||
|
| |||||||
Computers & Peripherals 1.6% |
| |||||||
Apple, Inc. | 875,000 | 870,412 | ||||||
|
| |||||||
Electric 1.7% |
| |||||||
Dominion Gas Holdings LLC | 890,000 | 891,339 | ||||||
|
| |||||||
Finance—Commercial 1.5% |
| |||||||
Caterpillar Financial Services Corp. | 790,000 | 791,107 | ||||||
|
| |||||||
| Principal Amount | Value | |||||||
Finance—Consumer Loans 0.8% |
| |||||||
John Deere Capital Corp. | $ | 440,000 | $ | 441,984 | ||||
|
| |||||||
Finance—Other Services 1.9% |
| |||||||
¨Private Export Funding Corp. | 1,020,000 | 1,031,620 | ||||||
|
| |||||||
Food 1.5% |
| |||||||
JM Smucker Co. (The) | 205,000 | 205,776 | ||||||
Kellogg Co. | 305,000 | 305,012 | ||||||
Kraft Foods Group, Inc. | 290,000 | 290,249 | ||||||
|
| |||||||
| 801,037 | ||||||||
|
| |||||||
Health Care—Products 1.2% |
| |||||||
Baxter International, Inc. | 440,000 | 440,102 | ||||||
Zimmer Holdings, Inc. | 205,000 | 207,011 | ||||||
|
| |||||||
| 647,113 | ||||||||
|
| |||||||
Health Care—Services 1.0% |
| |||||||
UnitedHealth Group, Inc. | 535,000 | 536,032 | ||||||
|
| |||||||
Holding Company—Diversified 2.3% |
| |||||||
¨Hutchison Whampoa International, Ltd. | 1,195,000 | 1,211,332 | ||||||
|
| |||||||
Insurance 0.6% |
| |||||||
Berkshire Hathaway Finance Corp. | 305,000 | 306,286 | ||||||
|
| |||||||
Miscellaneous—Manufacturing 1.3% |
| |||||||
3M Co. | 660,000 | 667,807 | ||||||
|
| |||||||
Oil & Gas 9.3% |
| |||||||
BP Capital Markets PLC | 385,000 | 393,463 | ||||||
¨Chevron Corp. | ||||||||
0.889%, due 6/24/16 | 1,365,000 | 1,370,340 | ||||||
4.95%, due 3/3/19 | 445,000 | 498,496 | ||||||
ConocoPhillips Co. | 455,000 | 453,505 | ||||||
Phillips 66 | 285,000 | 294,670 | ||||||
| † | Percentages indicated are based on Fund net assets. |
| ¨ | Among the Fund’s 10 largest issuers held, as of April 30, 2015, excluding short-term investment. May be subject to change daily. |
| The notes to the financial statements are an integral part of, and should be read in conjunction with, the financial statements. | 11 |
Portfolio of Investments April 30, 2015 (continued)
| Principal Amount | Value | |||||||
| Corporate Bonds (continued) | ||||||||
Oil & Gas (continued) | ||||||||
Shell International Finance B.V. | $ | 665,000 | $ | 667,905 | ||||
¨Total Capital S.A. | 1,235,000 | 1,248,408 | ||||||
|
| |||||||
| 4,926,787 | ||||||||
|
| |||||||
Pharmaceuticals 2.6% |
| |||||||
Abbott Laboratories | 475,000 | 477,352 | ||||||
Actavis Funding SCS | 80,000 | 81,363 | ||||||
Eli Lilly & Co. | 335,000 | 338,708 | ||||||
Merck & Co., Inc. | 465,000 | 466,631 | ||||||
|
| |||||||
| 1,364,054 | ||||||||
|
| |||||||
Pipelines 0.5% | ||||||||
EnLink Midstream Partners, L.P. | 265,000 | 264,775 | ||||||
|
| |||||||
Software 3.0% |
| |||||||
¨Oracle Corp. | ||||||||
1.20%, due 10/15/17 | 730,000 | 731,614 | ||||||
5.75%, due 4/15/18 | 765,000 | 861,041 | ||||||
|
| |||||||
| 1,592,655 | ||||||||
|
| |||||||
Telecommunications 1.5% |
| |||||||
Verizon Communications, Inc. | 800,000 | 799,953 | ||||||
|
| |||||||
Total Corporate Bonds | 28,046,633 | |||||||
|
| |||||||
| Mortgage-Backed Securities 0.8% | ||||||||
Commercial Mortgage Loans |
| |||||||
Bear Stearns Commercial Mortgage Securities Trust | 306,821 | 310,583 | ||||||
LB-UBS Commercial Mortgage Trust | 94,656 | 96,192 | ||||||
|
| |||||||
Total Mortgage-Backed Securities | 406,775 | |||||||
|
| |||||||
| U.S. Government & Federal Agencies 40.7% | ||||||||
Federal Home Loan Mortgage Corp. |
| |||||||
1.50%, due 3/30/18 | 575,000 | 576,010 | ||||||
|
| |||||||
| Principal Amount | Value | |||||||
Federal National Mortgage Association |
| |||||||
2.00%, due 10/17/17 | $ | 680,000 | $ | 693,501 | ||||
4.50%, due 11/1/18 | 46,719 | 48,879 | ||||||
|
| |||||||
| 742,380 | ||||||||
|
| |||||||
¨United States Treasury Notes 38.2% | ||||||||
0.25%, due 4/15/16 | 6,430,000 | 6,430,501 | ||||||
0.50%, due 6/15/16 | 3,390,000 | 3,396,621 | ||||||
0.50%, due 7/31/17 | 2,000,000 | 1,991,562 | ||||||
0.625%, due 5/31/17 | 2,125,000 | 2,124,503 | ||||||
0.875%, due 2/28/17 | 2,700,000 | 2,716,033 | ||||||
1.00%, due 5/31/18 | 3,610,000 | 3,613,949 | ||||||
|
| |||||||
| 20,273,169 | ||||||||
|
| |||||||
Total U.S. Government & Federal Agencies | 21,591,559 | |||||||
|
| |||||||
Total Long-Term Bonds | 50,044,967 | |||||||
|
| |||||||
| Short-Term Investment 6.1% | ||||||||
Repurchase Agreement 6.1% | ||||||||
State Street Bank and Trust Co. | 3,248,703 | 3,248,703 | ||||||
|
| |||||||
Total Short-Term Investment | 3,248,703 | |||||||
|
| |||||||
Total Investments | 100.4 | % | 53,293,670 | |||||
Other Assets, Less Liabilities | (0.4 | ) | (208,298 | ) | ||||
Net Assets | 100.0 | % | $ | 53,085,372 | ||||
| (a) | May be sold to institutional investors only under Rule 144A or securities offered pursuant to Section 4(a)(2) of the Securities Act of 1933, as amended. |
| (b) | Floating rate—Rate shown was the rate in effect as of April 30, 2015. |
| (c) | As of April 30, 2015, cost was $53,076,891 for federal income tax purposes and net unrealized appreciation was as follows: |
Gross unrealized appreciation | $ | 265,749 | ||
Gross unrealized depreciation | (48,970 | ) | ||
|
| |||
Net unrealized appreciation | $ | 216,779 | ||
|
|
| 12 | MainStay Short Term Bond Fund | The notes to the financial statements are an integral part of, and should be read in conjunction with, the financial statements. |
The following is a summary of the fair valuations according to the inputs used as of April 30, 2015, for valuing the Fund’s assets.
Asset Valuation Inputs
Description | Quoted (Level 1) | Significant (Level 2) | Significant (Level 3) | Total | ||||||||||||
| Investments in Securities (a) | ||||||||||||||||
| Long-Term Bonds | ||||||||||||||||
Corporate Bonds | $ | — | $ | 28,046,633 | $ | — | $ | 28,046,633 | ||||||||
Mortgage-Backed Securities | — | 406,775 | — | 406,775 | ||||||||||||
U.S. Government & Federal Agencies | — | 21,591,559 | — | 21,591,559 | ||||||||||||
|
|
|
|
|
|
|
| |||||||||
| Total Long-Term Bonds | — | 50,044,967 | — | 50,044,967 | ||||||||||||
|
|
|
|
|
|
|
| |||||||||
| Short-Term Investment | ||||||||||||||||
Repurchase Agreement | — | 3,248,703 | — | 3,248,703 | ||||||||||||
|
|
|
|
|
|
|
| |||||||||
| Total Investments in Securities | $ | — | $ | 53,293,670 | $ | — | $ | 53,293,670 | ||||||||
|
|
|
|
|
|
|
| |||||||||
| (a) | For a complete listing of investments and their industries, see the Portfolio of Investments. |
The Fund recognizes transfers between the levels as of the beginning of the period.
For the year ended April 30, 2015, the Fund did not have any transfers between Level 1 and Level 2 fair value measurements. (See Note 2)
As of April 30, 2015, the Fund did not hold any investments with significant unobservable inputs (Level 3). (See Note 2)
| The notes to the financial statements are an integral part of, and should be read in conjunction with, the financial statements. | 13 |
Statement of Assets and Liabilities as of April 30, 2015
| Assets | ||||
Investment in securities, at value (identified cost $53,076,891) | $ | 53,293,670 | ||
Receivables: | ||||
Fund shares sold | 190,516 | |||
Interest | 184,229 | |||
Manager (See Note 3) | 16,260 | |||
Other assets | 30,308 | |||
|
| |||
Total assets | 53,714,983 | |||
|
| |||
| Liabilities | ||||
Payables: | ||||
Investment securities purchased | 527,110 | |||
Fund shares redeemed | 38,455 | |||
Professional fees | 30,221 | |||
Transfer agent (See Note 3) | 10,572 | |||
Shareholder communication | 9,786 | |||
NYLIFE Distributors (See Note 3) | 4,659 | |||
Custodian | 1,529 | |||
Trustees | 44 | |||
Accrued expenses | 2,758 | |||
Dividend payable | 4,477 | |||
|
| |||
Total liabilities | 629,611 | |||
|
| |||
Net assets | $ | 53,085,372 | ||
|
| |||
| Composition of Net Assets | ||||
Shares of beneficial interest outstanding (par value of $.001 per share) unlimited number of shares authorized | $ | 5,565 | ||
Additional paid-in capital | 52,867,651 | |||
|
| |||
| 52,873,216 | ||||
Distributions in excess of net investment income | (580 | ) | ||
Accumulated net realized gain (loss) on investments | (4,043 | ) | ||
Net unrealized appreciation (depreciation) on investments | 216,779 | |||
|
| |||
Net assets | $ | 53,085,372 | ||
|
| |||
Class A | ||||
Net assets applicable to outstanding shares | $ | 18,907,693 | ||
|
| |||
Shares of beneficial interest outstanding | 1,982,024 | |||
|
| |||
Net asset value per share outstanding | $ | 9.54 | ||
Maximum sales charge (3.00% of offering price) | 0.30 | |||
|
| |||
Maximum offering price per share outstanding | $ | 9.84 | ||
|
| |||
Investor Class | ||||
Net assets applicable to outstanding shares | $ | 3,551,920 | ||
|
| |||
Shares of beneficial interest outstanding | 371,482 | |||
|
| |||
Net asset value per share outstanding | $ | 9.56 | ||
Maximum sales charge (3.00% of offering price) | 0.30 | |||
|
| |||
Maximum offering price per share outstanding | $ | 9.86 | ||
|
| |||
Class I | ||||
Net assets applicable to outstanding shares | �� | $ | 30,625,759 | |
|
| |||
Shares of beneficial interest outstanding | 3,211,106 | |||
|
| |||
Net asset value and offering price per share outstanding | $ | 9.54 | ||
|
|
| 14 | MainStay Short Term Bond Fund | The notes to the financial statements are an integral part of, and should be read in conjunction with, the financial statements. |
Statement of Operations
for the period November 1, 2014 through April 30, 2015 and the year ended October 31, 2014
| 2015 (a) | 2014 | |||||||
| Investment Income (Loss) | ||||||||
Income | ||||||||
Interest | $ | 342,720 | $ | 965,061 | ||||
|
| |||||||
Expenses | ||||||||
Manager (See Note 3) | 165,143 | 456,981 | ||||||
Professional fees | 50,955 | 48,520 | ||||||
Distribution/Service—Class A (See Note 3) | 24,825 | 54,513 | ||||||
Distribution/Service—Investor Class (See Note 3) | 4,649 | 9,652 | ||||||
Transfer agent (See Note 3) | 32,154 | 60,884 | ||||||
Registration | 26,855 | 47,404 | ||||||
Shareholder communication | 10,706 | 6,595 | ||||||
Custodian | 3,008 | 6,595 | ||||||
Trustees | 491 | 1,302 | ||||||
Miscellaneous | 4,810 | 8,578 | ||||||
|
| |||||||
Total expenses before waiver/reimbursement | 323,596 | 701,024 | ||||||
Expense waiver/reimbursement from Manager (See Note 3) | (110,028 | ) | (156,998 | ) | ||||
|
| |||||||
Net expenses | 213,568 | 544,026 | ||||||
|
| |||||||
Net investment income (loss) | 129,152 | 421,035 | ||||||
|
| |||||||
| Realized and Unrealized Gain (Loss) on Investments | ||||||||
Net realized gain (loss) on investments | (4,043 | ) | 74,360 | |||||
Net change in unrealized appreciation (depreciation) on investments | 44,743 | (284,018 | ) | |||||
|
| |||||||
Net realized and unrealized gain (loss) on investments | 40,700 | (209,658 | ) | |||||
|
| |||||||
Net increase (decrease) in net assets resulting from operations | $ | 169,852 | $ | 211,377 | ||||
|
| |||||||
| (a) | The Fund changed its fiscal year end from October 31 to April 30. |
| The notes to the financial statements are an integral part of, and should be read in conjunction with, the financial statements. | 15 |
Statements of Changes in Net Assets
for the period November 1, 2014 through April 30, 2015 and years ended October 31, 2014 and October 31, 2013
| 2015 (a) | 2014 | 2013 | ||||||||||
| Increase (Decrease) in Net Assets | ||||||||||||
Operations: | ||||||||||||
Net investment income (loss) | $ | 129,152 | $ | 421,035 | $ | 648,677 | ||||||
Net realized gain (loss) on investments | (4,043 | ) | 74,360 | 182,626 | ||||||||
Net change in unrealized appreciation (depreciation) on investments | 44,743 | (284,018 | ) | (799,686 | ) | |||||||
|
| |||||||||||
Net increase (decrease) in net assets resulting from operations | 169,852 | 211,377 | 31,617 | |||||||||
|
| |||||||||||
Dividends and distributions to shareholders: |
| |||||||||||
From net investment income: | ||||||||||||
Class A | (30,329 | ) | (87,334 | ) | (156,208 | ) | ||||||
Investor Class | (236 | ) | (2,457 | ) | (9,148 | ) | ||||||
Class I | (97,172 | ) | (330,654 | ) | (483,929 | ) | ||||||
|
| |||||||||||
| (127,737 | ) | (420,445 | ) | (649,285 | ) | |||||||
|
| |||||||||||
From net realized gain on investments: |
| |||||||||||
Class A | (23,139 | ) | (49,098 | ) | (126,883 | ) | ||||||
Investor Class | (4,418 | ) | (8,065 | ) | (17,969 | ) | ||||||
Class I | (46,715 | ) | (120,264 | ) | (212,374 | ) | ||||||
|
| |||||||||||
| (74,272 | ) | (177,427 | ) | (357,226 | ) | |||||||
|
| |||||||||||
Total dividends and distributions to shareholders | (202,009 | ) | (597,872 | ) | (1,006,511 | ) | ||||||
|
| |||||||||||
Capital share transactions: | ||||||||||||
Net proceeds from sale of shares | 14,409,884 | 38,396,223 | 92,310,800 | |||||||||
Net asset value of shares issued to shareholders in reinvestment of dividends and distributions | 166,250 | 531,022 | 895,672 | |||||||||
Cost of shares redeemed | (28,897,831 | ) | (60,159,882 | ) | (90,460,140 | ) | ||||||
|
| |||||||||||
Increase (decrease) in net assets derived from capital share transactions | (14,321,697 | ) | (21,232,637 | ) | 2,746,332 | |||||||
|
| |||||||||||
Net increase (decrease) in net assets | (14,353,854 | ) | (21,619,132 | ) | 1,771,438 | |||||||
| Net Assets | ||||||||||||
Beginning of period | 67,439,226 | 89,058,358 | 87,286,920 | |||||||||
|
| |||||||||||
End of period | $ | 53,085,372 | $ | 67,439,226 | $ | 89,058,358 | ||||||
|
| |||||||||||
Distributions in excess of net investment income at end of period | $ | (580 | ) | $ | (1,962 | ) | $ | (2,552 | ) | |||
|
| |||||||||||
| (a) | The Fund changed its fiscal year end from October 31 to April 30. |
| 16 | MainStay Short Term Bond Fund | The notes to the financial statements are an integral part of, and should be read in conjunction with, the financial statements. |
Financial Highlights selected per share data and ratios
| November 1, 2014 through April 30, | Year ended October 31, | |||||||||||||||||||||||||||||||||||
| Class A | 2015*** | 2014 | 2013 | 2012 | 2011 | 2010 | ||||||||||||||||||||||||||||||
Net asset value at beginning of period | $ | 9.54 | $ | 9.59 | $ | 9.68 | $ | 9.69 | $ | 9.78 | $ | 9.79 | ||||||||||||||||||||||||
|
|
|
|
|
|
|
|
|
|
|
| |||||||||||||||||||||||||
Net investment income (loss) (a) | 0.01 | 0.04 | 0.05 | 0.09 | 0.11 | 0.11 | ||||||||||||||||||||||||||||||
Net realized and unrealized gain (loss) on investments | 0.01 | (0.03 | ) | (0.05 | ) | 0.02 | (0.06 | ) | 0.11 | |||||||||||||||||||||||||||
|
|
|
|
|
|
|
|
|
|
|
| |||||||||||||||||||||||||
Total from investment operations | 0.02 | 0.01 | — | 0.11 | 0.05 | 0.22 | ||||||||||||||||||||||||||||||
|
|
|
|
|
|
|
|
|
|
|
| |||||||||||||||||||||||||
| Less dividends and distributions: | ||||||||||||||||||||||||||||||||||||
From net investment income | (0.01 | ) | (0.04 | ) | (0.05 | ) | (0.08 | ) | (0.12 | ) | (0.11 | ) | ||||||||||||||||||||||||
From net realized gain on investments | (0.01 | ) | (0.02 | ) | (0.04 | ) | (0.04 | ) | (0.02 | ) | (0.12 | ) | ||||||||||||||||||||||||
|
|
|
|
|
|
|
|
|
|
|
| |||||||||||||||||||||||||
Total dividends and distributions | (0.02 | ) | (0.06 | ) | (0.09 | ) | (0.12 | ) | (0.14 | ) | (0.23 | ) | ||||||||||||||||||||||||
|
|
|
|
|
|
|
|
|
|
|
| |||||||||||||||||||||||||
Net asset value at end of period | $ | 9.54 | $ | 9.54 | $ | 9.59 | $ | 9.68 | $ | 9.69 | $ | 9.78 | ||||||||||||||||||||||||
|
|
|
|
|
|
|
|
|
|
|
| |||||||||||||||||||||||||
Total investment return (b) | 0.27 | %(c) | 0.09 | % | 0.04 | % | 1.13 | % | 0.53 | % | 2.19 | % | ||||||||||||||||||||||||
| Ratios (to average net assets)/Supplemental Data: | ||||||||||||||||||||||||||||||||||||
Net investment income (loss) | 0.33 | %†† | 0.41 | % | 0.57 | % | 0.77 | % | 1.23 | % | 1.03 | % | ||||||||||||||||||||||||
Net expenses | 0.86 | %†† | 0.86 | % | 0.88 | % | 0.93 | % | 0.93 | % | 0.93 | % | ||||||||||||||||||||||||
Expenses (before waiver/reimbursement) | 1.24 | %†† | 1.07 | % | 1.13 | % | 1.10 | % | 1.15 | % | 1.15 | % | ||||||||||||||||||||||||
Portfolio turnover rate | 7 | % | 30 | % | 67 | % | 60 | % | 39 | % | 68 | %(d) | ||||||||||||||||||||||||
Net assets at end of period (in 000’s) | $ | 18,908 | $ | 20,086 | $ | 24,657 | $ | 31,422 | $ | 31,689 | $ | 36,665 | ||||||||||||||||||||||||
| †† | Annualized. |
| *** | The Fund changed its fiscal year end from October 31 to April 30. |
| (a) | Per share data based on average shares outstanding during the period. |
| (b) | Total investment return is calculated exclusive of sales charges and assumes the reinvestment of dividends and distributions. |
| (c) | Total investment return is not annualized. |
| (d) | The portfolio turnover rate not including mortgage dollar rolls was 52% for the year ended October 31, 2010. |
| November 1, 2014 through April 30, | Year ended October 31, | |||||||||||||||||||||||||||||||||||
| Investor Class | 2015*** | 2014 | 2013 | 2012 | 2011 | 2010 | ||||||||||||||||||||||||||||||
Net asset value at beginning of period | $ | 9.57 | $ | 9.61 | $ | 9.71 | $ | 9.72 | $ | 9.81 | $ | 9.81 | ||||||||||||||||||||||||
|
|
|
|
|
|
|
|
|
|
|
| |||||||||||||||||||||||||
Net investment income (loss) (a) | (0.00 | )‡ | 0.01 | 0.02 | 0.04 | 0.08 | 0.05 | |||||||||||||||||||||||||||||
Net realized and unrealized gain (loss) on investments | 0.00 | ‡ | (0.02 | ) | (0.06 | ) | 0.03 | (0.06 | ) | 0.13 | ||||||||||||||||||||||||||
|
|
|
|
|
|
|
|
|
|
|
| |||||||||||||||||||||||||
Total from investment operations | 0.00 | ‡ | (0.01 | ) | (0.04 | ) | 0.07 | 0.02 | 0.18 | |||||||||||||||||||||||||||
|
|
|
|
|
|
|
|
|
|
|
| |||||||||||||||||||||||||
| Less dividends and distributions: | ||||||||||||||||||||||||||||||||||||
From net investment income | (0.00 | )‡ | (0.01 | ) | (0.02 | ) | (0.04 | ) | (0.09 | ) | (0.06 | ) | ||||||||||||||||||||||||
From net realized gain on investments | (0.01 | ) | (0.02 | ) | (0.04 | ) | (0.04 | ) | (0.02 | ) | (0.12 | ) | ||||||||||||||||||||||||
|
|
|
|
|
|
|
|
|
|
|
| |||||||||||||||||||||||||
Total dividends and distributions | (0.01 | ) | (0.03 | ) | (0.06 | ) | (0.08 | ) | (0.11 | ) | (0.18 | ) | ||||||||||||||||||||||||
|
|
|
|
|
|
|
|
|
|
|
| |||||||||||||||||||||||||
Net asset value at end of period | $ | 9.56 | $ | 9.57 | $ | 9.61 | $ | 9.71 | $ | 9.72 | $ | 9.81 | ||||||||||||||||||||||||
|
|
|
|
|
|
|
|
|
|
|
| |||||||||||||||||||||||||
Total investment return (b) | 0.02 | % (c) | (0.15 | %) | (0.41 | %) | 0.79 | % | 0.13 | % | 1.83 | % | ||||||||||||||||||||||||
| Ratios (to average net assets)/Supplemental Data: | ||||||||||||||||||||||||||||||||||||
Net investment income (loss) | (0.03 | %)†† | 0.02 | % | 0.22 | % | 0.44 | % | 0.83 | % | 0.63 | % | ||||||||||||||||||||||||
Net expenses | 1.22 | % †† | 1.24 | % | 1.23 | % | 1.27 | % | 1.33 | % | 1.38 | % | ||||||||||||||||||||||||
Expenses (before waiver/reimbursement) | 1.60 | % †† | 1.45 | % | 1.47 | % | 1.44 | % | 1.55 | % | 1.60 | % | ||||||||||||||||||||||||
Portfolio turnover rate | 7 | % | 30 | % | 67 | % | 60 | % | 39 | % | 68 | %(d) | ||||||||||||||||||||||||
Net assets at end of period (in 000’s) | $ | 3,552 | $ | 3,844 | $ | 3,965 | $ | 4,356 | $ | 4,128 | $ | 4,119 | ||||||||||||||||||||||||
| †† | Annualized. |
| ‡ | Less than one cent per share. |
| *** | The Fund changed its fiscal year end from October 31 to April 30. |
| (a) | Per share data based on average shares outstanding during the period. |
| (b) | Total investment return is calculated exclusive of sales charges and assumes the reinvestment of dividends and distributions. |
| (c) | Total investment return is not annualized. |
| (d) | The portfolio turnover rate not including mortgage dollar rolls was 52% for the year ended October 31, 2010. |
| The notes to the financial statements are an integral part of, and should be read in conjunction with, the financial statements. | 17 |
Financial Highlights selected per share data and ratios
| November 1, 2014 through April 30, | Year ended October 31, | |||||||||||||||||||||||||||||||||||
| Class I | 2015*** | 2014 | 2013 | 2012 | 2011 | 2010 | ||||||||||||||||||||||||||||||
Net asset value at beginning of period | $ | 9.54 | $ | 9.58 | $ | 9.68 | $ | 9.69 | $ | 9.78 | $ | 9.78 | ||||||||||||||||||||||||
|
|
|
|
|
|
|
|
|
|
|
| |||||||||||||||||||||||||
Net investment income (loss) (a) | 0.03 | 0.05 | 0.08 | 0.10 | 0.14 | 0.13 | ||||||||||||||||||||||||||||||
Net realized and unrealized gain (loss) on investments | 0.01 | (0.01 | ) | (0.06 | ) | 0.03 | (0.06 | ) | 0.12 | |||||||||||||||||||||||||||
|
|
|
|
|
|
|
|
|
|
|
| |||||||||||||||||||||||||
Total from investment operations | 0.04 | 0.04 | 0.02 | 0.13 | 0.08 | 0.25 | ||||||||||||||||||||||||||||||
|
|
|
|
|
|
|
|
|
|
|
| |||||||||||||||||||||||||
| Less dividends and distributions: | ||||||||||||||||||||||||||||||||||||
From net investment income | (0.03 | ) | (0.06 | ) | (0.08 | ) | (0.10 | ) | (0.15 | ) | (0.13 | ) | ||||||||||||||||||||||||
From net realized gain on investments | (0.01 | ) | (0.02 | ) | (0.04 | ) | (0.04 | ) | (0.02 | ) | (0.12 | ) | ||||||||||||||||||||||||
|
|
|
|
|
|
|
|
|
|
|
| |||||||||||||||||||||||||
Total dividends and distributions | (0.04 | ) | (0.08 | ) | (0.12 | ) | (0.14 | ) | (0.17 | ) | (0.25 | ) | ||||||||||||||||||||||||
|
|
|
|
|
|
|
|
|
|
|
| |||||||||||||||||||||||||
Net asset value at end of period | $ | 9.54 | $ | 9.54 | $ | 9.58 | $ | 9.68 | $ | 9.69 | $ | 9.78 | ||||||||||||||||||||||||
|
|
|
|
|
|
|
|
|
|
|
| |||||||||||||||||||||||||
Total investment return (b) | 0.40 | %(c) | 0.45 | % | 0.19 | % | 1.39 | % | 0.78 | % | 2.55 | % | ||||||||||||||||||||||||
| Ratios (to average net assets)/Supplemental Data: | ||||||||||||||||||||||||||||||||||||
Net investment income (loss) | 0.56 | %†† | 0.66 | % | 0.79 | % | 1.03 | % | 1.48 | % | 1.32 | % | ||||||||||||||||||||||||
Net expenses | 0.61 | %†† | 0.61 | % | 0.63 | % | 0.68 | % | 0.68 | % | 0.68 | % | ||||||||||||||||||||||||
Expenses (before waiver/reimbursement) | 0.99 | %†† | 0.82 | % | 0.88 | % | 0.85 | % | 0.90 | % | 0.90 | % | ||||||||||||||||||||||||
Portfolio turnover rate | 7 | % | 30 | % | 67 | % | 60 | % | 39 | % | 68 | %(d) | ||||||||||||||||||||||||
Net assets at end of period (in 000’s) | $ | 30,626 | $ | 43,509 | $ | 60,437 | $ | 51,509 | $ | 48,193 | $ | 76,456 | ||||||||||||||||||||||||
| †† | Annualized. |
| *** | The Fund changed its fiscal year end from October 31 to April 30. |
| (a) | Per share data based on average shares outstanding during the period. |
| (b) | Total investment return is calculated exclusive of sales charges and assumes the reinvestment of dividends and distributions. Class I shares are not subject to sales charges. |
| (c) | Total investment return is not annualized. |
| (d) | The portfolio turnover rate not including mortgage dollar rolls was 52% for the year ended October 31, 2010. |
| 18 | MainStay Short Term Bond Fund | The notes to the financial statements are an integral part of, and should be read in conjunction with, the financial statements. |
Note 1–Organization and Business
MainStay Funds Trust (the “Trust”) was organized as a Delaware statutory trust on April 28, 2009, and is governed by a Declaration of Trust. The Trust is registered under the Investment Company Act of 1940, as amended (the “1940 Act”), as an open-end management investment company, and is comprised of thirty-eight funds (collectively referred to as the “Funds”). These financial statements and notes relate to the MainStay Short Term Bond Fund (the “Fund”), a “diversified” fund, as that term is defined in the 1940 Act, as interpreted or modified by regulatory authorities having jurisdiction, from time to time. The Fund is the successor of the Mainstay Short Term Bond Fund, a series of Eclipse Funds Inc. (the “Predecessor Fund”). The reorganization of the Predecessor Fund with and into the Fund occurred on February 26, 2010. All information regarding and references to periods prior to February 26, 2010 relate to the Predecessor Fund.
The Fund currently offers three classes of shares. Class I shares commenced operations on January 2, 1991. Class A shares commenced operations on January 2, 2004. Investor Class shares commenced operations on February 28, 2008. Class A and Investor Class shares are offered at net asset value (“NAV”) per share plus an initial sales charge. No sales charge applies to investments of $1 million or more (and certain other qualified purchases) in Class A and Investor Class shares, but a contingent deferred sales charge (“CDSC”) is imposed on certain redemptions of such shares made within one year of the date of purchase. Class I shares are offered at NAV and are not subject to a sales charge. Depending upon eligibility, Class A shares may convert to Investor Class shares and Investor Class shares may convert to Class A shares. The three classes of shares have the same voting (except for issues that relate solely to one class), dividend, liquidation and other rights, and the same terms and conditions, except that Class A and Investor Class shares are subject to a distribution and/or service fee. Class I shares are not subject to a distribution and/or service fee.
The Fund’s investment objective is to seek total return.
Effective April 30, 2015, the Fund changed its fiscal and tax year end from October 31 to April 30.
At meetings held on March 24-26, 2015, the Board (as defined below) approved changes to the Fund’s name (from MainStay Short Term Bond Fund to MainStay Tax Advantaged Short Term Bond Fund), investment objective, primary benchmark, portfolio management team, principal investment strategies, management fee and certain other characteristics of the Fund effective June 1, 2015. For more information regarding these changes, please see the supplement to the Fund’s registration statement dated March 27, 2015.
Note 2–Significant Accounting Policies
The Fund is an investment company and accordingly follows the investment company accounting and reporting guidance of the Financial Accounting Standards Board (FASB) Accounting Standard Codification Topic 946 Financial Services—Investment Companies. The Fund prepares its financial statements in accordance with generally accepted accounting principles (“GAAP”) in the United States of America and follows the significant accounting policies described below.
(A) Securities Valuation. Investments are valued as of the close of regular trading on the New York Stock Exchange (“Exchange”) (generally
4:00 p.m. Eastern time) on each day the Fund is open for business (“valuation date”).
The Board of Trustees (the “Board”) adopted procedures establishing methodologies for the valuation of the Fund’s securities and delegated the responsibility for valuation determinations under those procedures to the Valuation Committee of the Fund (the “Valuation Committee”). The Board authorized the Valuation Committee to appoint a Valuation Sub-Committee (the “Sub-Committee”) to deal in the first instance with establishing the prices of securities for which market quotations are not readily available or the prices of which are not otherwise readily determinable under these procedures. The Sub-Committee meets (in person, via electronic mail or via teleconference) on an as-needed basis. Subsequently, the Valuation Committee meets to ensure that actions taken by the Sub-Committee were appropriate. The procedures recognize that, subject to the oversight of the Board and unless otherwise noted, the responsibility for day-to-day valuation of portfolio assets (including fair value measurements for the Fund’s assets and liabilities) rests with New York Life Investment Management LLC (“New York Life Investments” or the “Manager”), aided to whatever extent necessary by the Subadvisor (as defined in Note 3(A)) to the Fund.
To assess the appropriateness of security valuations, the Manager, Subadvisor or the Fund’s third party service provider, who is subject to oversight by the Manager, regularly compares prior day prices, prices on comparable securities, and the sale prices to the prior and current day prices and challenges prices with changes exceeding certain tolerance levels with third party pricing services or broker sources. For those securities valued through either a standardized fair valuation methodology or a fair valuation measurement, the Sub-Committee deals in the first instance with such valuation and the Valuation Committee reviews and affirms the reasonableness of the valuation based on such methodologies and measurements on a regular basis after considering all relevant information that is reasonably available. Any action taken by the Sub-Committee with respect to the valuation of a portfolio security is submitted by the Valuation Committee to the Board for its review and ratification, if appropriate, at its next regularly scheduled meeting.
“Fair value” is defined as the price the Fund would receive upon selling an asset or liability in an orderly transaction to an independent buyer in the principal or most advantageous market for the asset or liability. Fair value measurements are determined within a framework that establishes a three-tier hierarchy which maximizes the use of observable market data and minimizes the use of unobservable inputs to establish a classification of fair value measurements for disclosure purposes. “Inputs” refer broadly to the assumptions that market participants would use in pricing the asset or liability, including assumptions about risk, such as the risk inherent in a particular valuation technique used to measure fair value using a pricing model and/or the risk inherent in the inputs for the valuation technique. Inputs may be observable or unobservable. Observable inputs reflect the assumptions market participants would use in pricing the asset or liability based on market data obtained from sources independent of the Fund. Unobservable inputs reflect the Fund’s own assumptions about the assumptions market participants would use in pricing the asset or liability based on the information available. The inputs or methodology used for valuing assets or liabilities may not be an indication of the risks associated with investing in those assets or liabilities. The three-tier hierarchy of inputs is summarized below.
| • | Level 1—quoted prices in active markets for an identical asset or liability |
| 19 |
Notes to Financial Statements (continued)
| • | Level 2—other significant observable inputs (including quoted prices for a similar asset or liability in active markets, interest rates and yield curves, prepayment speeds, credit risk, etc.) |
| • | Level 3—significant unobservable inputs (including the Fund’s own assumptions about the assumptions that market participants would use in measuring fair value of an asset or liability) |
As of April 30, 2015, the aggregate value by input level of the Fund’s assets and liabilities is included at the end of the Fund’s Portfolio of Investments.
The Fund may use third party vendor evaluations, whose prices may be derived from one or more of the following standard inputs among others:
• Benchmark Yields | • Reported Trades | |
• Broker Dealer Quotes | • Issuer Spreads | |
• Two-sided markets | • Benchmark securities | |
• Bids/Offers | • Reference Data (corporate actions or material event notices) | |
• Industry and economic events | • Comparable bonds | |
• Equity and credit default swap curves | • Monthly payment information |
An asset or liability for which market values cannot be measured using the methodologies described above is valued by methods deemed reasonable in good faith by the Valuation Committee, following the procedures established by the Board, to represent fair value. Under these procedures, the Fund generally uses a market-based approach which may use related or comparable assets or liabilities, recent transactions, market multiples, book values, and other relevant information. The Fund may also use an income-based valuation approach in which the anticipated future cash flows of the asset or liability are discounted to calculate fair value. Discounts may also be applied due to the nature and/or duration of any restrictions on the disposition of the asset or liability. Due to the inherent uncertainty of such assets or liabilities, fair values may differ significantly from values that would have been used had an active market existed. During the period ended April 30, 2015, there have been no material changes to the fair value methodologies.
Equity and non-equity securities which may be valued in this manner include, but are not limited to: (i) a security for which trading has been halted or suspended; (ii) a debt security that has recently gone into default and for which there is not a current market quotation; (iii) a security of an issuer that has entered into a restructuring; (iv) a security that has been de-listed from a national exchange; (v) a security for which the market price is not readily available from a third party pricing source or, if so provided, does not, in the opinion of the Manager or Subadvisor reflect the security’s market value; (vi) a security subject to trading collars for which no or limited trading takes place; and (vii) a security whose principal market has been temporarily closed at a time when, under normal conditions, it would be open. Securities for which market quotations or observable inputs are not readily available are generally categorized as Level 3 in the hierarchy. As of April 30, 2015, the Fund did not hold any securities that were fair valued in such a manner.
Debt securities (other than convertible and municipal bonds) are valued at the evaluated bid prices (evaluated mean prices in the case of con-
vertible and municipal bonds) supplied by a pricing agent or broker selected by the Manager, in consultation with the Subadvisor. Those values reflect broker/dealer supplied prices and electronic data processing techniques, if the evaluated bid or mean prices are deemed by the Manager, in consultation with the Subadvisor, to be representative of market values, at the regular close of trading of the Exchange on each valuation date. Debt securities purchased on a delayed delivery basis are marked to market daily until settlement at the forward settlement date. Debt securities, including corporate bonds, U.S. government & federal agency bonds, municipal bonds, foreign bonds, convertible bonds, asset-backed securities and mortgage-backed securities, are generally categorized as Level 2 in the hierarchy.
Investments in mutual funds, including money market funds, are valued at their respective NAVs as of the close of the Exchange on the valuation date. These securities are generally categorized as Level 1 in the hierarchy.
Temporary cash investments acquired in excess of 60 days to maturity at the time of purchase are valued using the latest bid prices or using valuations based on a matrix system (which considers such factors as security prices, yields, maturities, and ratings), both as furnished by independent pricing services. Other temporary cash investments which mature in 60 days or less at the time of purchase (“Short-Term Investments”) are valued using the amortized cost method of valuation, unless the use of such method would be inappropriate. The amortized cost method involves valuing a security at its cost on the date of purchase and thereafter assuming a constant amortization to maturity of the difference between such cost and the value on maturity date. Amortized cost approximates the current fair value of a security. These securities are generally categorized as Level 2 in the hierarchy.
(B) Income Taxes. The Fund’s policy is to comply with the requirements of the Internal Revenue Code of 1986, as amended (the “Internal Revenue Code”), applicable to regulated investment companies and to distribute all of the taxable income to the shareholders of the Fund within the allowable time limits. Therefore, no federal, state and local income tax provisions are required.
Management evaluates the Fund’s tax positions to determine if the tax positions taken meet the minimum recognition threshold in connection with accounting for uncertainties in income tax positions taken or expected to be taken for the purposes of measuring and recognizing tax liabilities in the financial statements. Recognition of tax benefits of an uncertain tax position is required only when the position is “more likely than not” to be sustained assuming examination by taxing authorities. Management has analyzed the Fund’s tax positions taken on federal, state and local income tax returns for all open tax years (for up to three tax years), and has concluded that no provisions for federal, state and local income tax are required in the Fund’s financial statements. The Fund’s federal, state and local income and federal excise tax returns for tax years for which the applicable statutes of limitations have not expired are subject to examination by the Internal Revenue Service and state and local departments of revenue.
(C) Dividends and Distributions to Shareholders. Dividends and distributions are recorded on the ex-dividend date. The Fund intends to declare and pay dividends from net investment income, if any, at least monthly and distributions from net realized capital and currency gains, if any, at least annually. Unless the shareholder elects
| 20 | MainStay Short Term Bond Fund |
otherwise, all dividends and distributions are reinvested in the same class of shares of the Fund, at NAV. Dividends and distributions to shareholders are determined in accordance with federal income tax regulations and may differ from GAAP.
(D) Security Transactions and Investment Income. The Fund records security transactions on the trade date. Realized gains and losses on security transactions are determined using the identified cost method. Interest income is accrued as earned using the effective interest rate method and includes realized gains and losses from repayments of principal on mortgage-backed securities. Discounts and premiums on securities purchased, other than Short-Term Investments, for the Fund are accreted and amortized, respectively, on the effective interest rate method over the life of the respective securities or, in the case of a callable security, over the period to the first date of call. Discounts and premiums on Short-Term Investments are accreted and amortized, respectively, on the straight-line method. The straight-line method approximates the effective interest method for short-term investments. Income from payment-in-kind securities is recorded daily based on the effective interest method of accrual.
Investment income and realized and unrealized gains and losses on investments of the Fund are allocated to separate classes of shares pro rata based upon their relative net assets on the date the income is earned or realized and unrealized gains and losses are incurred.
The Fund may place a debt obligation on non-accrual status and reduce related interest income by ceasing current accruals and writing off interest receivables when the collection of all or a portion of interest has become doubtful based on consistently applied procedures. A debt obligation is removed from non-accrual status when the issuer resumes interest payments or when collectability of interest is reasonably assured.
(E) Expenses. Expenses of the Trust are allocated to the individual Funds in proportion to the net assets of the respective Funds when the expenses are incurred, except where direct allocations of expenses can be made. Expenses (other than transfer agent expenses and fees incurred under the shareholder services plans and/or the distribution plans further discussed in Note 3(B)) are allocated to separate classes of shares pro rata based upon their relative net assets on the date the expenses are incurred. The expenses borne by the Fund, including those of related parties to the Fund, are shown in the Statement of Operations.
(F) Use of Estimates. In preparing financial statements in conformity with GAAP, management makes estimates and assumptions that affect the reported amounts and disclosures in the financial statements. Actual results could differ from those estimates.
(G) Repurchase Agreements. The Fund may enter into repurchase agreements to earn income. The Fund may enter into repurchase agreements only with financial institutions that are deemed by the Manager or Subadvisor to be creditworthy, pursuant to guidelines established by the Board. During the term of any repurchase agreement, the Manager or Subadvisor will continue to monitor the creditworthiness of the seller. Under the 1940 Act, repurchase agreements are considered to be collateralized loans by the Fund to the seller secured by the securities transferred to the Fund.
When the Fund invests in repurchase agreements, the Fund’s custodian takes possession of the collateral pledged for investments in the
repurchase agreement. The underlying collateral is valued daily on a mark to market basis to determine if the value, including accrued interest, exceeds the repurchase price. In the event of the seller’s default on the obligation to repurchase, the Fund has the right to liquidate the collateral and apply the proceeds in satisfaction of the obligation. Under certain circumstances, such as in the event of default or bankruptcy by the counterparty to the agreement, realization and/or retention of the collateral may be subject to legal proceedings and possible realized loss to the Fund.
(H) Dollar Rolls. The Fund may enter into dollar roll transactions in which it sells mortgage-backed securities (“MBS”) from its portfolio to a counterparty from whom it simultaneously agrees to buy a similar security on a delayed delivery basis. The Fund generally transfers MBS where the MBS are “to be announced,” therefore, the Fund accounts for these transactions as purchases and sales. The securities sold in connection with the dollar rolls are removed from the portfolio and a realized gain or loss is recognized. The securities the Fund has agreed to acquire are included at market value in the Portfolio of Investments and liabilities for such purchase commitments are included as payables for investments purchased. During the roll period, the Fund foregoes principal and interest paid on the securities. The Fund is compensated by the difference between the current sales price and the forward price for the future as well as by the earnings on the cash proceeds of the initial sale. Dollar rolls may be renewed without physical delivery of the securities subject to the contract. The Fund maintains liquid assets from its portfolio having a value not less than the repurchase price, including accrued interest. Dollar roll transactions involve certain risks, including the risk that the security returned to the Fund at the end of the roll period, while substantially similar, could be inferior to what was initially sold to the counterparty.
(I) Securities Lending. In order to realize additional income, the Fund may engage in securities lending, subject to the limitations set forth in the 1940 Act and relevant guidance by the staff of the Securities and Exchange Commission. In the event the Fund does engage in securities lending, the Fund will lend through its custodian, State Street Bank and Trust Company (“State Street”). State Street will manage the Fund’s cash collateral in accordance with the lending agreement between the Fund and State Street, and indemnify the Fund against counterparty risk. The loans will be collateralized by cash or securities at least equal at all times to the market value of the securities loaned. Collateral will consist of U.S. government securities, cash equivalents or irrevocable letters of credit. The Fund may bear the risk of delay in recovery of, or loss of rights in, the securities loaned should the borrower of the securities experience financial difficulty. The Fund may also record a realized gain or loss on securities deemed sold due to a borrower’s inability to return securities on loan. The Fund bears the risk of any loss on investment of the collateral. The Fund will receive compensation for lending its securities in the form of fees or it will retain a portion of interest on the investment of any cash received as collateral. The Fund will also continue to receive interest and dividends on the securities loaned and any gain or loss in the market price of the securities loaned that may occur during the term of the loan will be for the account of the Fund. During the period ended April 30, 2015, the Fund did not have any portfolio securities on loan.
| 21 |
Notes to Financial Statements (continued)
(J) Concentration of Risk. The ability of issuers of debt securities held by the Fund to meet their obligations may be affected by economic or political developments in a specific country, industry or region.
(K) Indemnifications. Under the Trust’s organizational documents, its officers and trustees are indemnified against certain liabilities that may arise out of performance of their duties to the Trust. Additionally, in the normal course of business, the Fund enters into contracts with third-party service providers that contain a variety of representations and warranties and which may provide general indemnifications. The Fund’s maximum exposure under these arrangements is unknown, as this would involve future claims that may be made against the Fund that have not yet occurred. Based on experience, management is of the view that the risk of loss in connection with these potential indemnification obligations is remote. However, there can be no assurance that material liabilities related to such obligations will not arise in the future, which could adversely impact the Fund.
Note 3–Fees and Related Party Transactions
(A) Manager and Subadvisor. New York Life Investments, a registered investment adviser and an indirect, wholly-owned subsidiary of New York Life Insurance Company (“New York Life”), serves as the Fund’s Manager, pursuant to an Amended and Restated Management Agreement (“Management Agreement”). The Manager provides offices, conducts clerical, recordkeeping and bookkeeping services, and keeps most of the financial and accounting records required to be maintained by the Fund. Except for the portion of salaries and expenses that are the responsibility of the Fund, the Manager pays the salaries and expenses of all personnel affiliated with the Fund and certain operational expenses of the Fund. The Fund reimburses New York Life Investments in an amount equal to a portion of the compensation of the Chief Compliance Officer of the Fund. MacKay Shields LLC (“MacKay Shields” or the “Subadvisor”), a registered investment adviser and an indirect, wholly-owned subsidiary of New York Life, serves as Subadvisor to the Fund and is responsible for the day-to-day portfolio management of the Fund. Pursuant to the terms of the Subadvisory Agreement (“Subadvisory Agreement”) between New York Life Investments and MacKay Shields, New York Life Investments pays for the services of the Subadvisor.
Under the Management Agreement, the Fund pays the Manager a monthly fee for services performed and facilities furnished at an annual rate of the Fund’s average daily net assets as follows: 0.50% up to $500 million and 0.475% in excess of $500 million. New York Life Investments has contractually agreed to waive a portion of its management fee so that the management fee does not exceed 0.50% on assets up to $500 million; and 0.475% on assets in excess of $500 million. This agreement will remain in effect until February 28, 2016, and shall renew automatically for one-year terms unless New York Life Investments provides written notice of termination prior to the start of the next term or upon approval of the Board. During the period ended April 30, 2015, the effective management fee rate (exclusive of any applicable waivers/reimbursements) was 0.57%.
New York Life Investments has contractually agreed to waive fees and/or reimburse expenses so that Total Annual Fund Operating Expenses for Class A shares do not exceed 0.86% of its average daily net assets. New York Life Investments will apply an equivalent waiver or reimbursement, in an equal number of basis points, to the other share classes. This agreement will remain in effect until February 28, 2016
and shall renew automatically for one-year terms unless New York Life Investments provides written notice of termination prior to the start of the next term or upon approval of the Board. Total Annual Fund Operating Expenses excludes taxes, interest, litigation, extraordinary expenses, brokerage and other transaction expenses relating to the purchase or sale of portfolio investments, and acquired (underlying) fund fees and expenses.
During the period ended April 30, 2015, New York Life Investments earned fees from the Fund in the amount of $165,143 and waived its fees and/or reimbursed expenses in the amount of $110,028.
At meetings held on March 24-26, 2015, the Board approved changes to the Fund’s management fee, lowering the contractual management fee from 0.50% on assets up to $500 million and 0.475% on assets above $500 million to 0.45% on all assets effective June 1, 2015. Also effective June 1, 2015, New York Life Investments contractually agreed to waive fees and/or reimburse expenses so that Total Annual Fund Operating Expenses for Class A shares do not exceed 0.80% of its average daily net assets. New York Life Investments will apply an equivalent waiver or reimbursement, in an equal number of basis points, to the other share classes. This agreement will remain in effect until August 29, 2016 and shall renew automatically for one-year terms unless New York Life Investments provides written notice of termination prior to the start of the next term or upon approval of the Board.
State Street provides sub-administration and sub-accounting services to the Fund pursuant to an agreement with New York Life Investments. These services include calculating the daily NAVs of the Fund, maintaining the general ledger and sub-ledger accounts for the calculation of the Fund’s NAVs, and assisting New York Life Investments in conducting various aspects of the Fund’s administrative operations. For providing these services to the Fund, State Street is compensated by New York Life Investments.
(B) Distribution and Service Fees. The Trust, on behalf of the Fund, has entered into a distribution agreement with NYLIFE Distributors LLC (the “Distributor”), an indirect, wholly-owned subsidiary of New York Life. The Fund has adopted distribution plans (the “Plans”) in accordance with the provisions of Rule 12b-1 under the 1940 Act.
Pursuant to the Class A and Investor Class Plans, the Distributor receives a monthly distribution fee from the Class A and Investor Class shares at an annual rate of 0.25% of the average daily net assets of the Class A and Investor Class shares for distribution and/or service activities as designated by the Distributor. Class I shares are not subject to a distribution and/or service fee.
The Plans provide that the distribution and service fees are payable to the Distributor regardless of the amounts actually expended by the Distributor for distribution of the Fund’s shares and service activities.
(C) Sales Charges. During the period ended April 30, 2015, the Fund was advised by the Distributor that the amount of initial sales charges retained on sales of Class A and Investor Class shares were $1,827 and $694, respectively. During the period ended April 30, 2015, the Fund was also advised that the Distributor retained CDSCs on redemptions of Class A shares of $1,000.
| 22 | MainStay Short Term Bond Fund |
(D) Transfer, Dividend Disbursing and Shareholder Servicing Agent. NYLIM Service Company LLC, an affiliate of New York Life Investments, is the Fund’s transfer, dividend disbursing and shareholder servicing agent pursuant to an agreement between NYLIM Service Company LLC and the Trust. NYLIM Service Company LLC has entered into an agreement with Boston Financial Data Services, Inc. (“BFDS”) pursuant to which BFDS performs certain transfer agent services on behalf of NYLIM Service Company LLC. During the period ended April 30, 2015, transfer agent expenses incurred by the Fund were as follows:
Class A | $ | 8,722 | ||
Investor Class | 8,284 | |||
Class I | 15,148 |
(E) Small Account Fee. Shareholders with small accounts adversely impact the cost of providing transfer agency services. In an effort to reduce total transfer agency expenses, the Fund has implemented a small account fee on certain types of accounts. Certain shareholders with an account balance of less than $1,000 are charged an annual per account fee of $20 (assessed semi-annually), the proceeds from which offset transfer agent fees as reflected in the Statement of Operations.
Note 4–Federal Income Tax
As of April 30, 2015, the components of accumulated gain (loss) on a tax basis were as follows:
Ordinary Income | Accumulated Other Gain (Loss) | Other Temporary Differences | Unrealized Appreciation (Depreciation) | Total Gain (Loss) | ||||||||||||
$3,897 | $ | (4,043 | ) | $ | (4,477 | ) | $ | 216,779 | $ | 212,156 | ||||||
Other temporary differences are primarily due to dividends payable.
The following table discloses the current year reclassifications between undistributed net investment income (loss), accumulated net realized gain (loss) on investments, and additional paid-in capital arising from permanent differences; net assets as of April 30, 2015 were not affected.
Undistributed | Accumulated Net Realized Gain (Loss) on Investments | Additional Paid-In Capital | ||||||||
| $(33) | $ | 33 | $ | — | ||||||
The reclassifications for the Fund are primarily due to dividend redesignations.
As of April 30, 2015, for federal tax income purposes, capital loss carryforwards of $4,043 were available as shown in the table below, to the extent provided by regulations to offset future realized gains of the Fund through the years indicated. To the extent that these capital loss carryforwards are used to offset future capital gains, it is probable that the capital gains so offset will not be distributed to shareholders. No capital gain distributions shall be made until any capital loss carryforwards have been fully utilized or expired.
| Capital Loss Available Through | Short-Term Capital Loss Amounts (000’s) | Long-Term Capital Loss Amounts (000’s) | ||||||
| Unlimited | $ | 2 | $ | 2 | ||||
During the six-month period ended April 30, 2015 and the fiscal years ended October 31, 2014 and October 31, 2013 the tax character of distributions paid as reflected in the Statements of Changes in Net Assets was as follows:
| April 30, 2015 | October 31, 2014 | October 31, 2013 | ||||||||||
Distributions paid from: | ||||||||||||
Ordinary Income | $ | 128,626 | $ | 436,880 | $ | 656,485 | ||||||
Long-Term Capital Gain | 73,383 | 160,992 | 350,026 | |||||||||
Total | $ | 202,009 | $ | 597,872 | $ | 1,006,511 | ||||||
Note 5–Custodian
State Street is the custodian of cash and securities held by the Fund. Custodial fees are charged to the Fund based on the Fund’s net assets and/or the market value of securities held by the Fund and the number of certain cash transactions incurred by the Fund.
Note 6–Line of Credit
The Fund and certain affiliated funds, maintain a line of credit with a syndicate of banks in order to secure a source of funds for temporary purposes to meet unanticipated or excessive redemption requests.
Effective August 5, 2014, under a second amended and restated credit agreement (the “Credit Agreement”), the aggregate commitment amount is $600,000,000 with an optional maximum aggregate amount of $700,000,000. The commitment fee is an annual rate of 0.08% of the average commitment amount payable quarterly, regardless of usage, to Bank of New York Mellon, who serves as the agent to the syndicate. The commitment fee is allocated among the Fund and certain affiliated funds based upon their respective net assets and other factors. Interest on any revolving credit loan is charged based upon the Federal Funds Advances Rate or the one month London InterBank Offered Rate, whichever is higher. The Credit Agreement expires on August 4, 2015, although the Fund, certain affiliated funds and the syndicate of banks may renew the Credit Agreement for an additional year on the same or different terms. During the period ended April 30, 2015, there were no borrowings made or outstanding with respect to the Fund under the Credit Agreement.
Note 7–Purchases and Sales of Securities (in 000’s)
During the six-month period ended April 30, 2015, purchases and sales of U.S. government securities were $2,426 and $7,599, respectively. Purchases and sales of securities, other than U.S. government securities and short-term securities, were $1,429 and $9,658, respectively.
| 23 |
Notes to Financial Statements (continued)
Note 8–Capital Share Transactions
Class A | Shares | Amount | ||||||
Six-month period ended April 30, 2015: | ||||||||
Shares sold | 364,606 | $ | 3,474,988 | |||||
Shares issued to shareholders in reinvestment of dividends and distributions | 5,246 | 49,994 | ||||||
Shares redeemed | (493,037 | ) | (4,700,369 | ) | ||||
|
| |||||||
Net increase (decrease) in shares outstanding before conversion | (123,185 | ) | (1,175,387 | ) | ||||
Shares converted into Class A (See Note 1) | 5,740 | 54,683 | ||||||
Shares converted from Class A (See Note 1) | (5,876 | ) | (55,997 | ) | ||||
|
| |||||||
Net increase (decrease) | (123,321 | ) | $ | (1,176,701 | ) | |||
|
| |||||||
Year ended October 31, 2014: | ||||||||
Shares sold | 583,104 | $ | 5,571,685 | |||||
Shares issued to shareholders in reinvestment of dividends and distributions | 13,234 | 126,430 | ||||||
Shares redeemed | (1,051,168 | ) | (10,044,830 | ) | ||||
|
| |||||||
Net increase (decrease) in shares outstanding before conversion | (454,830 | ) | (4,346,715 | ) | ||||
Shares converted into Class A (See Note 1) | 4,207 | 40,173 | ||||||
Shares converted from Class A (See Note 1) | (16,440 | ) | (156,765 | ) | ||||
|
| |||||||
Net increase (decrease) | (467,063 | ) | $ | (4,463,307 | ) | |||
|
| |||||||
Year ended October 31, 2013: | ||||||||
Shares sold | 1,633,514 | $ | 15,675,928 | |||||
Shares issued to shareholders in reinvestment of dividends and distributions | 22,259 | 214,062 | ||||||
Shares redeemed | (2,325,264 | ) | (22,315,469 | ) | ||||
|
| |||||||
Net increase (decrease) in shares outstanding before conversion | (669,491 | ) | (6,425,479 | ) | ||||
Shares converted into Class A (See Note 1) | 18,475 | 176,945 | ||||||
Shares converted from Class A (See Note 1) | (21,653 | ) | (207,754 | ) | ||||
|
| |||||||
Net increase (decrease) | (672,669 | ) | $ | (6,456,288 | ) | |||
|
| |||||||
Investor Class | Shares | Amount | ||||||
Six-month period ended April 30, 2015: | ||||||||
Shares sold | 45,517 | $ | 434,847 | |||||
Shares issued to shareholders in reinvestment of dividends and distributions | 486 | 4,640 | ||||||
Shares redeemed | (76,560 | ) | (731,537 | ) | ||||
|
| |||||||
Net increase (decrease) in shares outstanding before conversion | (30,557 | ) | (292,050 | ) | ||||
Shares converted into Investor Class (See Note 1) | 5,864 | 55,997 | ||||||
Shares converted from Investor Class (See Note 1) | (5,728 | ) | (54,683 | ) | ||||
|
| |||||||
Net increase (decrease) | (30,421 | ) | $ | (290,736 | ) | |||
|
| |||||||
Year ended October 31, 2014: | ||||||||
Shares sold | 62,070 | $ | 594,852 | |||||
Shares issued to shareholders in reinvestment of dividends and distributions | 1,094 | 10,488 | ||||||
Shares redeemed | (85,847 | ) | (822,654 | ) | ||||
|
| |||||||
Net increase (decrease) in shares outstanding before conversion | (22,683 | ) | (217,314 | ) | ||||
Shares converted into Investor Class (See Note 1) | 16,388 | 156,765 | ||||||
Shares converted from Investor Class (See Note 1) | (4,194 | ) | (40,173 | ) | ||||
|
| |||||||
Net increase (decrease) | (10,489 | ) | $ | (100,722 | ) | |||
|
| |||||||
Year ended October 31, 2013: | ||||||||
Shares sold | 139,761 | $ | 1,347,695 | |||||
Shares issued to shareholders in reinvestment of dividends and distributions | 2,795 | 26,995 | ||||||
Shares redeemed | (181,834 | ) | (1,752,848 | ) | ||||
|
| |||||||
Net increase (decrease) in shares outstanding before conversion | (39,278 | ) | (378,158 | ) | ||||
Shares converted into Investor Class (See Note 1) | 21,586 | 207,754 | ||||||
Shares converted from Investor Class (See Note 1) | (18,418 | ) | (176,945 | ) | ||||
|
| |||||||
Net increase (decrease) | (36,110 | ) | $ | (347,349 | ) | |||
|
| |||||||
Class I | Shares | Amount | ||||||
Six-month period ended April 30, 2015: | ||||||||
Shares sold | 1,101,344 | $ | 10,500,049 | |||||
Shares issued to shareholders in reinvestment of dividends and distributions | 11,710 | 111,616 | ||||||
Shares redeemed | (2,462,695 | ) | (23,465,925 | ) | ||||
|
| |||||||
Net increase (decrease) | (1,349,641 | ) | $ | (12,854,260 | ) | |||
|
| |||||||
Year ended October 31, 2014: | ||||||||
Shares sold | 3,375,337 | $ | 32,229,686 | |||||
Shares issued to shareholders in reinvestment of dividends and distributions | 41,254 | 394,104 | ||||||
Shares redeemed | (5,162,502 | ) | (49,292,398 | ) | ||||
|
| |||||||
Net increase (decrease) | (1,745,911 | ) | $ | (16,668,608 | ) | |||
|
| |||||||
Year ended October 31, 2013: | ||||||||
Shares sold | 7,851,405 | $ | 75,287,177 | |||||
Shares issued to shareholders in reinvestment of dividends and distributions | 68,138 | 654,615 | ||||||
Shares redeemed | (6,933,387 | ) | (66,391,823 | ) | ||||
|
| |||||||
Net increase (decrease) | 986,156 | $ | 9,549,969 | |||||
|
| |||||||
Note 9–Subsequent Events
In connection with the preparation of the financial statements of the Fund as of and for the year ended April 30, 2015, events and transactions subsequent to April 30, 2015, through the date the financial statements were issued have been evaluated by the Fund’s management for possible adjustment and/or disclosure. No subsequent events requiring financial statement adjustment or disclosure have been identified.
| 24 | MainStay Short Term Bond Fund |
Report of Independent Registered Public Accounting Firm
The Board of Trustees and Shareholders of
MainStay Funds Trust:
We have audited the accompanying statement of assets and liabilities, including the portfolio of investments, of the MainStay Short Term Bond Fund (the “Fund”), one of the funds constituting MainStay Funds Trust, as of April 30, 2015, and the related statement of operations for the six-month period ended April 30, 2015 and the year ended October 31, 2014, the statements of changes in net assets for the six-month period ended April 30, 2015 and for each of the years in the two-year period ended October 31, 2014, and the financial highlights for the six-month period ended April 30, 2015 and each of the years in the five-year period ended October 31, 2014. These financial statements and financial highlights are the responsibility of the Fund’s management. Our responsibility is to express an opinion on these financial statements and financial highlights based on our audits.
We conducted our audits in accordance with the standards of the Public Company Accounting Oversight Board (United States). Those standards require that we plan and perform the audit to obtain reasonable assurance about whether the financial statements and financial highlights are free of material misstatement. An audit includes examining, on a test basis, evidence supporting the amounts and disclosures in the financial statements. Our procedures included confirmation of securities owned as of April 30, 2015, by correspondence with the custodian and brokers or by other appropriate auditing procedures where replies from brokers were not received. An audit also includes assessing the accounting principles used and significant estimates made by management, as well as evaluating the overall financial statement presentation. We believe that our audits provide a reasonable basis for our opinion.
In our opinion, the financial statements and financial highlights referred to above present fairly, in all material respects, the financial position of the MainStay Short Term Bond Fund of MainStay Funds Trust as of April 30, 2015, the results of its operations for the year, the six-month period ended April 30, 2015 and for each of the years in the two-year period ended October 31, 2014, and the financial highlights for the six-month period ended April 30, 2015 and each of the years in the five-year period ended October 31, 2014, in conformity with U.S. generally accepted accounting principles.

Philadelphia, Pennsylvania
June 22, 2015
| 25 |
Board Consideration and Approval of Management Agreement and
Subadvisory Agreement (Unaudited)
Section 15(c) of the Investment Company Act of 1940, as amended (the “1940 Act”) requires that each mutual fund’s board of trustees, including a majority of the independent trustees, annually review and approve the fund’s investment advisory agreements. At its December 8-10, 2014 meeting, the Board of Trustees of the MainStay Group of Funds (“Board”) unanimously approved the Management Agreement with respect to the MainStay Short Term Bond Fund (“Fund”) and New York Life Investment Management LLC (“New York Life Investments”) and the Subadvisory Agreement between New York Life Investments and MacKay Shields LLC (“MacKay Shields”) with respect to the Fund.
In reaching its decision to approve the Agreements, the Board considered information furnished by New York Life Investments and MacKay Shields in connection with a contract review process that took place at various meetings of the Board and its Contracts Committee between September 2014 and December 2014 as well as other relevant information furnished to the Board throughout the year. Information requested by and furnished to the Board in connection with the contract review process included, among other items, reports on the Fund and “peer funds” prepared by Strategic Insight Mutual Fund Research and Consulting, LLC (“Strategic Insight”), an independent third-party service provider engaged by the Board to report objectively on the Fund’s investment performance, management and subadvisory fees and total expenses. The Board also considered information on the fees charged to other investment advisory clients (including institutional separate accounts) that follow investment strategies similar to the Fund and the rationale for any differences in the Fund’s management and subadvisory fees and the fees charged to those other investment advisory clients. In addition, the Board requested and received information on the profitability of the Fund to New York Life Investments and its affiliates, including MacKay Shields as subadvisor to the Fund and responses from New York Life Investments and MacKay Shields to a series of questions encompassing a variety of topics prepared on behalf of the Board by independent legal counsel to the Board and its independent trustees (the “Independent Trustees”). Information provided to the Board at its meetings throughout the year included, among other items, detailed investment performance reports on the Fund prepared by the Portfolio Analytics and Risk Oversight Group at New York Life Investments. The structure and format for this regular reporting were developed in consultation with the Board. The Board also received from New York Life Investments throughout the year, among other items, periodic reports on legal and compliance matters, portfolio turnover, and sales and marketing activity.
In considering the Agreements, the members of the Board reviewed and evaluated all of the information and factors they believed to be relevant and appropriate in light of legal advice furnished to them by independent legal counsel and through the exercise of their own business judgment. The broad factors considered by the Board are discussed in greater detail below and included, among other items: (i) the nature, scope and quality of the services provided to the Fund by New York Life Investments and MacKay Shields; (ii) the investment performance of the Fund, New York Life Investments and MacKay Shields; (iii) the costs of the services provided, and profits realized, by New York Life Investments and MacKay Shields from their relationship with the Fund; (iv) the extent to which economies of scale may be realized as the Fund grows and the extent to which economies of scale may benefit
Fund investors; and (v) the reasonableness of the Fund’s management and subadvisory fees and overall total ordinary operating expenses, particularly as compared to similar funds and accounts managed by New York Life Investments and MacKay Shields and peer funds identified by Strategic Insight.
While individual members of the Board may have weighed certain factors differently, the Board’s decision to approve the Agreements was based on a consideration of all the information provided to the Board, including information provided to the Board throughout the year as well as information furnished specifically in connection with the contract review process. The Board’s conclusions with respect to the Agreements also were based, in part, on the Board’s consideration of the Agreements in prior years. In addition to considering the above-referenced factors, the Board observed that in the marketplace there are a range of investment options available to shareholders of the Fund and that the Fund’s shareholders, having had the opportunity to consider other investment options, have chosen to invest in the Fund. A more detailed discussion of the factors that figured prominently in the Board’s decisions to approve the Agreements is provided below.
Nature, Scope and Quality of Services to Be Provided by New York Life Investments and MacKay Shields
The Board examined the nature, scope and quality of the services that New York Life Investments provides to the Fund. The Board evaluated New York Life Investments’ experience in serving as manager of the Fund, noting that New York Life Investments manages other mutual funds, serves a variety of other investment advisory clients, including other pooled investment vehicles, and has experience with overseeing mutual fund service providers, including subadvisors. The Board considered the experience of senior personnel at New York Life Investments providing management and administrative services to the Fund as well as New York Life Investments’ reputation and financial condition. The Board also considered the full range of non-advisory services that New York Life Investments supplies to the Fund under the terms of the Management Agreement, including: (i) fund accounting and oversight services provided by New York Life Investments’ Fund Administration and Accounting Group; (ii) investment oversight and analytical services provided by New York Life Investments’ Portfolio Analytics and Risk Oversight Group; (iii) compliance services provided by the Fund’s Chief Compliance Officer as well as New York Life Investments’ Compliance Department, including oversight and implementation of the Fund’s compliance program; and (iv) legal services provided by New York Life Investments’ Office of the General Counsel. Additional information about the non-advisory services provided by New York Life Investments is set forth in the Fund’s Management Agreement. The Board also considered New York Life Investments’ willingness to invest in personnel and infrastructure that benefit the Fund and noted that New York Life Investments is responsible for compensating the Fund’s officers. The Board also considered benefits to shareholders of being part of the MainStay Group of Funds, including the privilege of exchanging investments between the same class of shares without the imposition of a sales charge, as described more fully in the Fund’s prospectus.
The Board also examined the nature, scope and quality of the advisory services that MacKay Shields provides to the Fund. The Board evaluated MacKay Shields’ experience in serving as subadvisor to the Fund and
| 26 | MainStay Short Term Bond Fund |
managing other portfolios. It examined MacKay Shields’ track records and experience in providing investment advisory services, the experience of investment advisory, senior management and administrative personnel at MacKay Shields, and MacKay Shields’ overall legal and compliance environment. The Board also reviewed MacKay Shields’ willingness to invest in personnel that benefit the Fund. In this regard, the Board considered the experience of the Fund’s portfolio managers, the number of accounts managed by the portfolio managers and the method for compensating portfolio managers.
Based on these considerations, the Board concluded, within the context of its overall determinations regarding the Agreements, that the Fund should continue to benefit from the nature, scope and quality of these services as a result of New York Life Investments’ and MacKay Shields’ experience, personnel, operations and resources.
Investment Performance
In evaluating the Fund’s investment performance, the Board considered investment performance results in light of the Fund’s investment objective, strategies and risks, as disclosed in the Fund’s prospectus. The Board particularly considered detailed investment reports on the Fund’s performance provided to the Board throughout the year by the Portfolio Analytics and Risk Oversight Group of New York Life Investments. These reports include, among other items, information on the Fund’s gross and net returns, the Fund’s investment performance relative to relevant investment categories and Fund benchmarks, the Fund’s risk-adjusted investment performance, and the Fund’s investment performance as compared to peer funds, as appropriate. The Board also considered information provided by Strategic Insight showing the investment performance of the Fund as compared to peer funds.
In considering the Fund’s investment performance, the Board focused principally on the Fund’s long-term performance track record. The Board also gave weight to its ongoing discussions with senior management at New York Life Investments concerning the Fund’s investment performance as well as discussions between the Fund’s portfolio managers and the Board’s Investment Committee that occur regularly, generally on an annual basis. In addition, the Board considered any specific actions that New York Life Investments or MacKay Shields had taken, or had agreed with the Board to take, to enhance Fund investment performance and the results of those actions. The Board noted the Fund had recently underperformed relative to peers and New York Life Investments’ explanations of the underperformance. The Board also noted discussions with New York Life Investments about efforts to improve the Fund’s investment performance.
Based on these considerations, the Board concluded, within the context of its overall determinations regarding the Agreements, that the long-term investment performance of the Fund, along with ongoing efforts by New York Life Investments and MacKay Shields to enhance investment returns, supported a determination to approve the Agreements. The Fund discloses more information about investment performance in the Portfolio Management Discussion and Analysis, Investment and Performance Comparison and Financial Highlights sections of this Semiannual Report and in the Fund’s prospectus.
Costs of the Services Provided, and Profits Realized, by New York Life Investments and MacKay Shields
The Board considered the costs of the services provided by New York Life Investments and MacKay Shields under the Agreements and the profits realized by New York Life Investments and its affiliates, including MacKay Shields, due to their relationships with the Fund. Because MacKay Shields is an affiliate of New York Life Investments whose subadvisory fees are paid directly by New York Life Investments, the Board considered cost and profitability information for New York Life Investments and MacKay Shields in the aggregate.
In evaluating the costs and profits of New York Life Investments and its affiliates, including MacKay Shields, the Board considered, among other factors, each party’s investments in personnel, systems, equipment and other resources necessary to manage the Fund, and that New York Life Investments is responsible for paying the subadvisory fees for the Fund. The Board acknowledged that New York Life Investments and MacKay Shields must be in a position to pay and retain experienced professional personnel to provide services to the Fund and that the ability to maintain a strong financial position is important in order for New York Life Investments and MacKay Shields to continue to provide high-quality services to the Fund. The Board also noted that the Fund benefits from the allocation of certain fixed costs across the MainStay Group of Funds.
In addition, the Board noted the difficulty in obtaining reliable comparative data about mutual fund managers’ profitability, since such information generally is not publicly available and may be impacted by numerous factors, including the structure of a fund manager’s organization, the types of funds it manages, the methodology used to allocate certain fixed costs to specific funds, and the manager’s capital structure and costs of capital. In connection with the annual fund profitability analysis that New York Life Investments presents to the Board, the Board in 2014 engaged Bobroff Consulting, Inc., an independent third-party consultant, to review the methods used to allocate costs to the MainStay Funds, and among individual Funds. As part of this engagement, the consultant analyzed: (i) the various New York Life Investments’ business units and affiliated Subadvisers that provide services to the MainStay Funds; (ii) how costs are allocated to the Fund and other funds managed by New York Life Investments, and to other lines of businesses; and (iii) how New York Life Investments’ cost allocation methods and profitability reports compare to industry practices. The Board noted that the independent consultant had concluded that New York Life Investments’ methods for allocating costs and procedures for estimating overall profitability of the funds in the MainStay Group of Funds, including the Fund, are reasonable, consistent with industry practice and likely to produce reasonable profitability estimates. While recognizing the difficulty in evaluating a manager’s profitability with respect to the Fund and noting that other profitability methodologies may also be reasonable, the Board concluded that the profitability methodology presented by New York Life Investments to the Board was reasonable in all material respects.
In considering the costs and profitability of the Fund, the Board also considered certain fall-out benefits that may be realized by New York Life Investments and its affiliates due to their relationships with the Fund.
| 27 |
Board Consideration and Approval of Management Agreement and
Subadvisory Agreement (Unaudited) (continued)
The Board further considered that, in addition to fees earned by New York Life Investments for managing the Fund, New York Life Investments’ affiliates also earn revenues from serving the Fund in various other capacities, including as the Fund’s transfer agent and distributor. The Board observed that information about these other revenues, and their impact on the profitability of the Fund to New York Life Investments and its affiliates, was furnished to the Board as part of the 15(c) process. The Board noted that, although it assessed the overall profitability of the Fund to New York Life Investments and its affiliates as part of the contract review process, when considering the reasonableness of the fees to be paid to New York Life Investments and its affiliates under the Agreements, the Board considered the profitability of New York Life Investments’ relationship with the Fund on a pre-tax basis and without regard to distribution expenses.
After evaluating the information presented to the Board, the Board concluded, within the context of its overall determinations regarding the Agreements, that any profits realized by New York Life Investments and its affiliates, including MacKay Shields, due to their relationships with the Fund supported the Board’s decision to approve the Agreements.
Extent to Which Economies of Scale May Be Realized as the Fund Grows
The Board considered whether the Fund’s expense structure permits economies of scale to be shared with Fund investors. The Board also considered a report from New York Life Investments, prepared at the request of the Board, that addressed economies of scale in the mutual fund business generally, the changing economics of the mutual fund business and the various ways in which the benefits of economies of scale may be shared with the Fund and other MainStay Funds. The Board reviewed information from New York Life Investments showing how the Fund’s management fee schedule compared to fee schedules of other funds and accounts managed by New York Life Investments. The Board also reviewed information from Strategic Insight showing how the Fund’s management fee schedule hypothetically would compare with fees paid for similar services by peer funds at varying asset levels. While recognizing the difficulty of determining economies of scale with precision, the Board acknowledged that economies of scale may be shared with the Fund in a number of ways, including, for example, through the imposition of management fee breakpoints and by initially setting relatively low management fees.
Based on this information, the Board concluded, within the context of its overall determinations regarding the Agreements, that the Fund’s expense structure appropriately reflects economies of scale for the benefit of Fund investors. The Board noted, however, that it would continue to evaluate the reasonableness of the Fund’s expense structure as the Fund grows over time.
Management and Subadvisory Fees and Total Ordinary Operating Expenses
The Board evaluated the reasonableness of the fees to be paid under the Agreements and the Fund’s expected total ordinary operating expenses. The Board primarily considered the reasonableness of the management fee paid by the Fund to New York Life Investments, since the fees paid to MacKay Shields are paid by New York Life Investments, not the Fund.
In assessing the reasonableness of the Fund’s fees and expenses, the Board primarily considered comparative data provided by Strategic Insight on the fees and expenses charged by similar mutual funds managed by other investment advisers. In addition, the Board considered information provided by New York Life Investments and MacKay Shields on fees charged to other investment advisory clients, including institutional separate accounts and other funds with similar investment objectives as the Fund. The Board particularly considered differences in the contractual management fee schedules of the retail MainStay Funds and similarly-managed MainStay VP Portfolios, taking into account New York Life Investments’ rationale for any differences in fee schedules. The Board also took into account explanations provided by New York Life Investments about the different scope of services provided to registered investment companies as compared with other investment advisory clients. Additionally, the Board considered the impact of any contractual breakpoints, voluntary waivers and expense limitation arrangements on the Fund’s net management fee and expenses. The Board noted that, following discussions with the Board, New York Life Investments proposed to eliminate the Fund’s management fee waiver and to lower the Fund’s contractual management fee schedule.
The Board noted that, outside of the Fund’s management fee and the fees charged under a share class’s Rule 12b-1 and/or shareholder services plans, a share class’s most significant “other expenses” are transfer agent fees. Transfer agent fees are charged to the Fund based on the number of shareholder accounts (a “per-account” fee) as compared with certain other fees (e.g., management fees), which are charged based on the Fund’s average net assets. The Board took into account information from New York Life Investments showing that the Fund’s transfer agent fee schedule is reasonable, including industry data showing that the per-account fees that NYLIM Service Company LLC, the Fund’s transfer agent, charges the Fund are within the range of per-account fees charged by transfer agents to other mutual funds. In addition, the Board considered NYLIM Service Company LLC’s profitability in connection with the transfer agent services it provides to the Fund.
The Board considered that, because the Fund’s transfer agent fees are billed on a per-account basis, the impact of transfer agent fees on a share class’s expense ratio may be more significant in cases where the share class has a high number of accounts with limited assets (i.e., small accounts). The Board observed that transfer agent fees are a significant portion of total expenses of many Funds in the MainStay Group of Funds. The impact of transfer agent fees on the expense ratios of these MainStay Funds tend to be greater than for other open-end retail funds, because the MainStay Group of Funds generally has a significant number of small accounts relative to competitor funds. The Board acknowledged the role that the MainStay Group of Funds historically has played in serving the investment needs of New York Life Insurance Company (“New York Life”) policyholders, who often maintain smaller account balances than other fund investors. The Board also acknowledged measures that it and New York Life Investments have taken in recent years to mitigate the effect of small accounts on the expense ratios of Fund share classes, including: (i) encouraging New York Life agents to consolidate multiple small accounts held by the same investor into one MainStay Asset Allocation Fund account; (ii) introducing Investor Class shares for certain MainStay Funds in early
| 28 | MainStay Short Term Bond Fund |
2008 to consolidate smaller account investors; (iii) closing small accounts with balances below $250 in Investor Class shares or $750 in all other classes of shares; (iv) eliminating an exception with no minimum investment amount with respect to AutoInvest accounts with subsequent monthly purchases of $100; (v) since 2007, charging an annual $20.00 small account fee on certain accounts with balances below $1,000; and (vi) modifying the approach for billing transfer agent expenses to reduce the degree of subsidization by large accounts of smaller accounts. In addition, the Board acknowledged New York Life Investments’ efforts to encourage intermediaries to consolidate small accounts in multiple Funds held by the same investor into a single Asset Allocation Fund account, if appropriate under the circumstances, in an effort to mitigate the effect of small accounts on the Funds in the MainStay Group of Funds.
After considering all of the factors outlined above, the Board concluded that the Fund’s management and subadvisory fees and total ordinary operating expenses were within a range that is competitive and, within the context of the Board’s overall conclusions regarding the Agreements, support a conclusion that these fees and expenses are reasonable.
Conclusion
On the basis of the information provided to it and its evaluation thereof, the Board, including the Independent Trustees, unanimously voted to approve the Agreements.
| 29 |
Federal Income Tax Information
(Unaudited)
The Fund is required by the Internal Revenue Code to advise shareholders in a written statement as to the federal tax status of dividends paid by the Fund during such fiscal period. Accordingly, the Fund paid $73,383 as a long term capital gain distribution.
In February 2016, shareholders will receive an IRS Form 1099-DIV or substitute Form 1099 which will show the federal tax status of the distributions received by shareholders in calendar year 2015. The amounts that will be reported on such 1099-DIV or substitute Form 1099 will be the amounts you are to use on your federal income tax return and will differ from the amounts which we must report for the Fund’s fiscal year ended April 30, 2015.
Proxy Voting Policies and Procedures and Proxy Voting Record
A description of the policies and procedures that New York Life Investments uses to vote proxies related to the Fund’s securities is available without charge, upon request, (i) by visiting the Fund’s website at mainstayinvestments.com; and (ii) on the Securities and Exchange Commission’s (SEC) website at www.sec.gov.
The Fund is required to file with the SEC its proxy voting record for the 12-month period ending June 30 on Form N-PX. The Fund’s most recent Form N-PX or proxy voting record is available free of charge upon request by calling 800-MAINSTAY (624-6782); visiting the Fund’s website at mainstayinvestments.com; or on the SEC’s website at www.sec.gov.
Shareholder Reports and Quarterly Portfolio Disclosure
The Fund is required to file its complete schedule of portfolio holdings with the SEC for its first and third fiscal quarters on Form N-Q. The Fund’s Form N-Q is available without charge, on the SEC’s website at www.sec.gov or by calling MainStay Investments at
800-MAINSTAY (624-6782). You also can obtain and review copies of Form N-Q by visiting the SEC’s Public Reference Room in Washington, DC (information on the operation of the Public Reference Room may be obtained by calling 1-800-SEC-0330).
| 30 | MainStay Short Term Bond Fund |
Board of Trustees and Officers (Unaudited)
The Board of Trustees oversees the MainStay Group of Funds, (which is comprised of Funds that are series of the MainStay Funds, MainStay Funds Trust, MainStay VP Funds Trust, Private Advisors Alternative Strategies Master Fund, Private Advisors Alternative Strategies Fund, and MainStay DefinedTerm Municipal Opportunities Fund) (collectively the “Fund Complex”), the Manager and, when applicable, the Subadvisor(s), and other service providers to the Fund Complex and elects the officers of the Funds who are responsible for the day-to-day operations of the Funds. Each Trustee serves until his or her successor
is elected and qualified or until his or her resignation, death or removal. Under the Retirement Policy, a Trustee must tender his or her resignation by the end of the calendar year during which he or she reaches the age of 75. Officers serve a term of one year and are elected annually by the Board of Trustees. Information pertaining to the Trustees and officers is set forth below. The business address of each Trustee and officer listed below is 51 Madison Avenue, New York, New York 10010. A majority of the Trustees are not “interested persons” (as defined by the 1940 Act) of the Funds (“Independent Trustees”).
Name and Date of Birth | Term of Office, Position(s) Held and Length of Service | Principal Occupation(s) During Past Five Years | Number of Portfolios in Fund Complex Board Member | Other Directorships Held by Board Member | ||||||||
John Y. Kim* 9/24/60 | Indefinite; MainStay Funds Trust: Trustee since 2008.** | Vice Chairman (since January 2014) and Chief Investment Officer (since 2011), New York Life Insurance Company; President, Investments Group—New York Life Insurance Company (since 2012); Chairman of the Board of Managers and Chief Executive Officer, New York Life Investment Management Holdings LLC (since 2008); Chairman of the Board of Managers (since 2008) and Chief Executive Officer (2008 to 2013), New York Life Investment Management LLC; Member of the Board, MCF Capital Management LLC (since 2012), Private Advisors LLC (since 2010); MacKay Shields LLC and Madison Capital Funding LLC (since 2008); and Member of the Board of Managers, McMorgan and Company LLC and GoldPoint Partners (fka NYLCAP Manager LLC) (2008-2012) | 84 | The MainStay Funds: MainStay VP Funds Trust: Trustee since 2008 (30 portfolios)***; Private Advisors Alternative Strategies Master Fund: Trustee since 2011; Private Advisors Alternative Strategies Fund: Trustee since 2011; and MainStay DefinedTerm Municipal Opportunities Fund: Trustee since 2011. |
| * | This Trustee is considered to be an “interested person” of the MainStay Group of Funds within the meaning of the 1940 Act because of his affiliation with New York Life Insurance Company, New York Life Investment Management LLC, Cornerstone Capital Management Holdings LLC, Cornerstone Capital Management LLC, MacKay Shields LLC, Institutional Capital LLC, NYL Investors LLC, NYLIFE Securities LLC and/or NYLIFE Distributors LLC, as described in detail above in the column entitled “Principal Occupation(s) During Past Five Years.” |
| ** | Includes prior service as a Director/Trustee of certain predecessor entities to MainStay Funds Trust. |
| *** | Includes prior service as a Director of MainStay VP Series Fund, Inc., the predecessor to MainStay VP Funds Trust. |
| 31 |
Name and Date of Birth | Term of Office, Position(s) Held and Length of Service | Principal Occupation(s) During Past Five Years | Number of Portfolios in Fund Complex Overseen by Board Member | Other Directorships Held by Board Member | ||||||||
Susan B. Kerley 8/12/51 | Indefinite; MainStay Funds Trust: Trustee since 1990.** | President, Strategic Management Advisors LLC (since 1990) | 84 | The MainStay Funds: Trustee since 2007 (12 Funds); MainStay VP Funds Trust: Trustee since 2007 (30 portfolios)***; Private Advisors Alternative Strategies Master Fund: Trustee since 2011; Private Advisors Alternative Strategies Fund: Trustee since 2011; MainStay DefinedTerm Municipal Opportunities Fund: Trustee since 2011; and Legg Mason Partners Funds: Trustee since 1991 (53 portfolios). | ||||||||
Alan R. Latshaw 3/27/51 | Indefinite; MainStay Funds Trust: Trustee and Audit Committee Financial Expert since 2007.** | Retired; Partner, Ernst & Young LLP (2002 to 2003); Partner, Arthur Andersen LLP (1989 to 2002); Consultant to the MainStay Funds Audit and Compliance Committee (2004 to 2006) | 84 | The MainStay Funds: Trustee and Audit Committee Financial Expert since 2006 (12 Funds); MainStay VP Funds Trust: Trustee and Audit Committee Financial Expert since 2007 (30 portfolios)***; Private Advisors Alternative Strategies Master Fund: Trustee and Audit Committee Financial Expert since 2011; Private Advisors Alternative Strategies Fund: Trustee and Audit Committee Financial Expert since 2011; MainStay DefinedTerm Municipal Opportunities Fund: Trustee and Audit Committee Financial Expert since 2011; State Farm Associates Funds Trusts: Trustee since 2005 (4 portfolios); State Farm Mutual Fund Trust: Trustee since 2005 (15 portfolios); and State Farm Variable Product Trust: Trustee since 2005 (9 portfolios). | ||||||||
Peter Meenan 12/5/41 | Indefinite; MainStay Funds Trust: Chairman since 2013 and Trustee since 2002.** | Retired; Independent Consultant (2004 to 2013); President and Chief Executive Officer, Babson—United, Inc. (financial services firm) (2000 to 2004); Independent Consultant (1999 to 2000); Head of Global Funds, Citicorp (1995 to 1999) | 84 | The MainStay Funds: Chairman since 2013 and Trustee since 2007 (12 Funds); MainStay VP Funds Trust: Chairman since 2013 and Trustee since 2007 (30 portfolios)***; Private Advisors Alternative Strategies Master Fund: Chairman since 2013 and Trustee since 2011; Private Advisors Alternative Strategies Fund: Chairman since 2013 and Trustee since 2011; and MainStay DefinedTerm Municipal Opportunities Fund: Chairman since 2013 and Trustee since 2011. | ||||||||
Richard H. Nolan, Jr. 11/16/46 | Indefinite; MainStay Funds Trust: Trustee since 2007.** | Managing Director, ICC Capital Management (since 2004); President—Shields/ Alliance, Alliance Capital Management (1994 to 2004) | 84 | The MainStay Funds: Trustee since 2007 (12 Funds); MainStay VP Funds Trust: Trustee since 2006 (30 portfolios)***; Private Advisors Alternative Strategies Master Fund: Trustee since 2011; Private Advisors Alternative Strategies Fund: Trustee since 2011; and MainStay DefinedTerm Municipal Opportunities Fund: Trustee since 2011. |
| 32 | MainStay Short Term Bond Fund |
Name and Date of Birth | Term of Office, Position(s) Held and Length of Service | Principal Occupation(s) During Past Five Years | Number of Portfolios in Fund Complex Board Member | Other Directorships Held by Board Member | ||||||||
Richard S. Trutanic 2/13/52 | Indefinite; MainStay Funds Trust: Trustee since 2007.** | Chairman and Chief Executive Officer, Somerset & Company (financial advisory firm) (since 2004); Managing Director, The Carlyle Group (private investment firm) (2002 to 2004); Senior Managing Director, Partner and Board Member, Groupe Arnault S.A. (private investment firm) (1999 to 2002) | 84 | The MainStay Funds: Trustee since 1994 (12 Funds); MainStay VP Funds Trust: Trustee since 2007 (30 portfolios)***; Private Advisors Alternative Strategies Master Fund: Trustee since 2011; Private Advisors Alternative Strategies Fund: Trustee since 2011; and MainStay DefinedTerm Municipal Opportunities Fund: Trustee since 2011. | ||||||||
Roman L. Weil 5/22/40 | Indefinite; MainStay Funds Trust: Trustee and Audit Committee Financial Expert since 2007.** | President, Roman L. Weil Associates, Inc. (consulting firm) (since 1981); V. Duane Rath Professor Emeritus of Accounting, Chicago Booth School of Business, University of Chicago (since 2008); Visiting Professor, Johns Hopkins University (2013); Visiting Professor, University of California—San Diego (since 2012); Visiting Professor, Southern Methodist University (2011); Visiting Professor, NYU Stern School of Business, New York University (2011) | 84 | The MainStay Funds: Trustee and Audit Committee Financial Expert since 2007 (12 Funds); MainStay VP Funds Trust: Trustee and Audit Committee Financial Expert since 1994 (30 portfolios)***; Private Advisors Alternative Strategies Master Fund: Trustee and Audit Committee Financial Expert since 2011; Private Advisors Alternative Strategies Fund: Trustee and Audit Committee Financial Expert since 2011; and MainStay DefinedTerm Municipal Opportunities Fund: Trustee and Audit Committee Financial Expert since 2011. | ||||||||
John A. Weisser 10/22/41 | Indefinite; MainStay Funds Trust: Trustee since 2007.** | Retired; Managing Director of Salomon Brothers, Inc. (1971 to 1995) | 84 | The MainStay Funds: Trustee since 2007 (12 Funds); MainStay VP Funds Trust: Trustee since 1997 (30 portfolios)***; Private Advisors Alternative Strategies Master Fund: Trustee since 2011; Private Advisors Alternative Strategies Fund: Trustee since 2011; MainStay DefinedTerm Municipal Opportunities Fund: Trustee since 2011; Direxion Insurance Trust: Trustee since 2007 (1 portfolio); Direxion Funds: Trustee since 2007 (18 portfolios); and Direxion Shares ETF Trust: Trustee since 2008 (52 portfolios). |
| ** | Includes prior service as a Director/Trustee of certain predecessor entities to MainStay Funds Trust. |
| *** | Includes prior service as a Director of MainStay VP Series Fund, Inc., the predecessor to MainStay VP Funds Trust. |
| 33 |
Name and Date of Birth | Position(s) Held and Length of Service | Principal Occupation(s) During Past Five Years | ||||||
Officers (Who Are Not Trustees)* | Stephen P. Fisher 2/22/59 | President, MainStay Funds Trust (since 2009) | Chairman and Chief Executive Officer (since 2014), President and Chief Operating Officer (2008 to 2013), NYLIFE Distributors LLC; Senior Managing Director (since 2012) and Chairman of the Board (since 2008), NYLIM Service Company LLC; Senior Managing Director (since 2005) and Co-President (since 2014), New York Life Investment Management LLC; President, Private Advisors Alternative Strategies Master Fund, Private Advisors Alternative Strategies Fund and MainStay DefinedTerm Municipal Opportunities Fund (since 2011) and The MainStay Funds and MainStay VP Funds Trust (since 2007)** | |||||
Jack R. Benintende 5/12/64 | Treasurer and Principal Financial and Accounting Officer, MainStay Funds Trust (since 2009) | Managing Director, New York Life Investment Management LLC (since 2007); Treasurer and Principal Financial and Accounting Officer, Private Advisors Alternative Strategies Master Fund, Private Advisors Alternative Strategies Fund and MainStay DefinedTerm Municipal Opportunities Fund (since 2011) and The MainStay Funds and MainStay VP Funds Trust (since 2007)**; and Assistant Treasurer, New York Life Investment Management Holdings LLC (2008 to 2012); | ||||||
Kevin M. Bopp 2/24/69 | Vice President and Chief Compliance Officer, MainStay Funds Trust (since 2014) | Vice President and Chief Compliance Officer, The MainStay Funds, MainStay VP Funds Trust, Private Advisors Alternative Strategies Fund, Private Advisors Alternative Strategies Master Fund and MainStay DefinedTerm Municipal Opportunities Fund (since 2014); Director and Associate General Counsel (2011 to 2014) and Vice President and Assistant General Counsel (2010 to 2011), New York Life Investment Management LLC; Assistant Secretary, The MainStay Funds, MainStay Funds Trust and MainStay VP Funds Trust (2010 to 2014)**, Private Advisors Alternative Strategies Fund, Private Advisors Alternative Strategies Master Fund and MainStay DefinedTerm Municipal Opportunities Fund (2011 to 2014); Associate, Dechert LLP (2006 to 2010) | ||||||
J. Kevin Gao 10/13/67 | Secretary and Chief Legal Officer, MainStay Funds Trust (since 2010) | Managing Director and Associate General Counsel, New York Life Investment Management LLC (since 2010); Secretary and Chief Legal Officer, Private Advisors Alternative Strategies Master Fund, Private Advisors Alternative Strategies Fund and MainStay DefinedTerm Municipal Opportunities Fund (since 2011) and The MainStay Funds and MainStay VP Funds Trust (since 2010)**; Director and Counsel, Credit Suisse; Chief Legal Officer and Secretary, Credit Suisse Asset Management LLC and Credit Suisse Funds (2003 to 2010) | ||||||
Scott T. Harrington 2/8/59 | Vice President—Administration, MainStay Funds Trust (since 2009) | Director, New York Life Investment Management LLC (including predecessor advisory organizations) (since 2000); Member of the Board of Directors, New York Life Trust Company (since 2009); Vice President—Administration, Private Advisors Alternative Strategies Master Fund, Private Advisors Alternative Strategies Fund and MainStay DefinedTerm Municipal Opportunities Fund (since 2011) and The MainStay Funds and MainStay VP Funds Trust (since 2005)** |
| * | The Officers listed above are considered to be “interested persons” of the MainStay Group of Funds within the meaning of the 1940 Act because of their affiliations with the MainStay Group of Funds, New York Life Insurance Company, New York Life Investment Management LLC, Cornerstone Capital Management Holdings LLC, Cornerstone Capital Management LLC, MacKay Shields LLC, Institutional Capital LLC, NYL Investors LLC, NYLIFE Securities LLC and/or NYLIFE Distributors LLC, as described in detail in the column captioned “Principal Occupation(s) During Past Five Years.” Officers are elected annually by the Board of Trustees to serve a one year term. |
| ** | Includes prior service as an Officer of MainStay VP Series Fund, Inc., the predecessor to MainStay VP Funds Trust. |
| 34 | MainStay Short Term Bond Fund |
MainStay Funds
MainStay offers a wide range of Funds for virtually any investment need. The full array of MainStay open-end offerings is listed here, with information about the manager, subadvisors, legal counsel and independent registered public accounting firms.
Equity
U.S. Equity
MainStay Common Stock Fund
MainStay Cornerstone Growth Fund
MainStay Epoch U.S. All Cap Fund
MainStay Epoch U.S. Equity Yield Fund
MainStay ICAP Equity Fund
MainStay ICAP Select Equity Fund
MainStay Large Cap Growth Fund
MainStay MAP Fund
MainStay S&P 500 Index Fund
MainStay U.S. Equity Opportunities Fund
MainStay U.S. Small Cap Fund
International/Global Equity
MainStay Emerging Markets Opportunities Fund
MainStay Epoch Global Choice Fund
MainStay Epoch Global Equity Yield Fund
MainStay Epoch International Small Cap Fund
MainStay ICAP Global Fund
MainStay ICAP International Fund
MainStay International Equity Fund
MainStay International Opportunities Fund
Income
Taxable Bond
MainStay Floating Rate Fund
MainStay Global High Income Fund
MainStay Government Fund
MainStay High Yield Corporate Bond Fund
MainStay High Yield Opportunities Fund
MainStay Indexed Bond Fund
MainStay Short Duration High Yield Fund
MainStay Total Return Bond Fund
MainStay Unconstrained Bond Fund
Municipal/Tax Advantaged Bond
MainStay California Tax Free Opportunities Fund1
MainStay High Yield Municipal Bond Fund
MainStay New York Tax Free Opportunities Fund2
MainStay Tax Advantaged Short Term Bond Fund (formerly known as MainStay Short Term Bond Fund)
MainStay Tax Free Bond Fund
Money Market
MainStay Money Market Fund
Mixed Asset
MainStay Balanced Fund
MainStay Convertible Fund
MainStay Income Builder Fund
Alternative
MainStay Absolute Return Multi-Strategy Fund
MainStay Cushing MLP Premier Fund
MainStay Cushing Renaissance Advantage Fund
MainStay Cushing Royalty Energy Income Fund
MainStay Marketfield Fund
Asset Allocation/Target Date
MainStay Conservative Allocation Fund
MainStay Growth Allocation Fund
MainStay Moderate Allocation Fund
MainStay Moderate Growth Allocation Fund
MainStay Retirement 2010 Fund
MainStay Retirement 2020 Fund
MainStay Retirement 2030 Fund
MainStay Retirement 2040 Fund
MainStay Retirement 2050 Fund
Manager
New York Life Investment Management LLC
New York, New York
Subadvisors
Candriam France S.A.S.3
Paris, France
Cornerstone Capital Management Holdings LLC3
New York, New York
Cornerstone Capital Management LLC3
Bloomington, Minnesota
Cushing Asset Management, LP
Dallas, Texas
Epoch Investment Partners, Inc.
New York, New York
Institutional Capital LLC3
Chicago, Illinois
MacKay Shields LLC3
New York, New York
Marketfield Asset Management LLC
New York, New York
Markston International LLC
White Plains, New York
NYL Investors LLC3
New York, New York
Winslow Capital Management LLC
Minneapolis, Minnesota
Legal Counsel
Dechert LLP
Independent Registered Public Accounting Firms
KPMG LLP4
PricewaterhouseCoopers LLP5
1. This Fund is only registered for sale in AZ, CA, NV, OR, UT, and WA.
2. This Fund is only registered for sale in CT, DE, FL, MA, NJ, NY, and VT.
3. An affiliate of New York Life Investment Management LLC.
4. For all Funds listed above except MainStay Marketfield Fund.
5. For MainStay Marketfield Fund only.
Not part of the Annual Report
For more information
800-MAINSTAY (624-6782)
mainstayinvestments.com
The MainStay Funds® are managed by New York Life Investment Management LLC and distributed through NYLIFE Distributors LLC, 169 Lackawanna Avenue, Parsippany, NJ 07054, a wholly owned subsidiary of New York Life Insurance Company. NYLIFE Distributors LLC is a Member FINRA/SIPC.
MainStay Investments® is a registered service mark and name under which New York Life Investment Management LLC does business. MainStay Investments, an indirect subsidiary of New York Life Insurance Company, New York, NY 10010, provides investment advisory products and services.
This report may be distributed only when preceded or accompanied by a current Fund prospectus.
©2015 NYLIFE Distributors LLC. All rights reserved.
| Not FDIC/NCUA Insured | Not a Deposit | May Lose Value | No Bank Guarantee | Not Insured by Any Government Agency |
| 1655049 MS139-15 | MSSB11-06/15 NL230 |
Item 2. Code of Ethics.
As of the end of the period covered by this report, the Registrant has adopted a code of ethics (the “Code”) that applies to the Registrant’s principal executive officer (“PEO”) and principal financial officer (“PFO”). A copy of the Code is filed herewith. The Registrant did not grant any waivers, including implicit waivers, from any provisions of the Code to the PEO or PFO during the period covered by this report.
| Item 3. | Audit Committee Financial Expert. |
The Board of Trustees has determined that the Registrant has two audit committee financial experts serving on its Audit Committee. The Audit Committee financial experts are Alan R. Latshaw and Roman L. Weil. Messrs. Latshaw and Weil are “independent” within the meaning of that term under the Investment Company Act of 1940.
| Item 4. | Principal Accountant Fees and Services. |
(a) Audit Fees
The aggregate fees billed for the fiscal year ended April 30, 2015 for professional services rendered by KPMG LLP (“KPMG”) for the audit of the Registrant’s annual financial statements or services that are normally provided by KPMG in connection with statutory and regulatory filings or engagements for that fiscal year were $47,000.
The aggregate fees billed for the fiscal year ended October 31, 2014 for professional services rendered by KPMG for the audit of the Registrant’s annual financial statements or services that are normally provided by KPMG in connection with statutory and regulatory filings or engagements for that fiscal year were $45,600.
(b) Audit-Related Fees
The aggregate fees billed for assurance and related services by KPMG that are reasonably related to the performance of the audit of the Registrant’s financial statements and are not reported under paragraph (a) of this Item were: (i) $0 for the fiscal year ended April 30, 2015, and (ii) $0 for the fiscal year ended October 31, 2014. These audit-related services include review of financial highlights for Registrant’s registration statements and issuance of consents to use the auditor’s reports.
(c) Tax Fees
The aggregate fees billed for professional services rendered by KPMG for tax compliance, tax advice, and tax planning were: (i) $3,600 during the fiscal year ended April 30, 2015, and (ii) $3,125 during the fiscal year ended October 31, 2014. These services primarily included preparation of federal, state and local income tax returns and excise tax returns, as well as services relating to excise tax distribution requirements.
(d) All Other Fees
The aggregate fees billed for products and services provided by KPMG, other than the services reported in paragraphs (a) through (c) of this Item were: (i) $0 during the fiscal year ended April 30, 2015, and (ii) $0 during the fiscal year ended October 31, 2014.
(e) Pre-Approval Policies and Procedures
| (1) | The Registrant’s Audit Committee has adopted pre-approval policies and procedures (the “Procedures”) to govern the Committee’s pre-approval of (i) all audit services and permissible non-audit services to be provided to the Registrant by its independent accountant, and (ii) all permissible non-audit services to be provided by such independent accountant to the Registrant’s investment adviser and to any entity controlling, controlled by or under common control with the investment adviser that provides ongoing services to the Registrant (collectively, the “Service Affiliates”) if the services directly relate to the Registrant’s operations and financial reporting. In accordance with the Procedures, the Audit Committee is responsible for the engagement of the independent accountant to certify the Registrant’s financial statements for each fiscal year. With respect to the pre-approval of non-audit services provided to the Registrant and its Service Affiliates, the Procedures provide that the Audit Committee may annually pre-approve a list of the types of services that may be provided to the Registrant or its Service Affiliates, or the Audit Committee may pre-approve such services on a project-by-project basis as they arise. Unless a type of service has received general pre-approval, it will require specific pre-approval by the Audit Committee if it is to be provided by the independent accountant. The Procedures also permit the Audit Committee to delegate authority to one or more of its members to pre-approve any proposed non-audit services that have not been previously pre-approved by the Audit Committee, subject to the ratification by the full Audit Committee no later than its next scheduled meeting. To date, the Audit Committee has not delegated such authority. |
| (2) | With respect to the services described in paragraphs (b) through (d) of this Item 4, no amount was approved by the Audit Committee pursuant to paragraph (c)(7)(i)(C) of Rule 2-01 of Regulation S-X. |
(f) There were no hours expended on KPMG’s engagement to audit the Registrant’s financial statements for the most recent fiscal year was attributable to work performed by persons other than KPMG’s full-time, permanent employees.
(g) All non-audit fees billed by KPMG for services rendered to the Registrant for the fiscal years ended April 30, 2015 and October 31, 2014 are disclosed in 4(b)-(d) above.
The aggregate non-audit fees billed by KPMG for services rendered to the Registrant’s investment adviser (not including any sub-adviser whose role is primarily portfolio management and is subcontracted with or overseen by another investment adviser), and any entity controlling, controlled by, or under common control with the adviser that provides ongoing services to the Registrant were approximately: (i) $0 for the fiscal year ended April 30, 2015, and (ii) $0 for the fiscal year ended October 31, 2014.
(h) The Registrant’s Audit Committee has determined that the non-audit services rendered by KPMG for the fiscal year ended April 30, 2015 to the Registrant’s investment adviser and any entity controlling, controlled by, or under common control with the Registrant’s investment adviser that provides ongoing services to the Registrant that were not required to be pre-approved by the Audit Committee because they did not relate directly to the operations and financial reporting of the registrant were compatible with maintaining the respective independence of KPMG during the relevant time period.
| Item 5. | Audit Committee of Listed Registrants |
Not applicable.
| Item 6. | Schedule of Investments |
The Schedule of Investments is included as part of Item 1 of this report.
| Item 7. | Disclosure of Proxy Voting Policies and Procedures for Closed-End Management Investment Companies. |
Not applicable.
| Item 8. | Portfolio Managers of Closed-End Management Investment Companies. |
Not applicable.
| Item 9. | Purchases of Equity Securities by Closed-End Management Investment Company and Affiliated Purchasers. |
Not Applicable.
| Item 10. | Submission of Matters to a Vote of Security Holders. |
Since the Registrant’s last response to this Item, there have been no material changes to the procedures by which shareholders may recommend nominees to the Registrant’s Board of Trustees.
Item 11. Controls and Procedures.
(a) Based on an evaluation of the Registrant’s Disclosure Controls and Procedures (as defined in Rule 30a-3(c) under the Investment Company Act of 1940) (the “Disclosure Controls”), as of a date within 90 days prior to the filing date (the “Filing Date”) of this Form N-CSR (the “Report”), the Registrant’s principal executive officer and principal financial officer have concluded that the Disclosure Controls are reasonably designed to ensure that information required to be disclosed by the Registrant in the Report is recorded, processed, summarized and reported by the Filing Date, including ensuring that information required to be disclosed in the Report is accumulated and communicated to the Registrant’s management, including the Registrant’s principal executive officer and principal financial officer, as appropriate to allow timely decisions regarding required disclosure.
(b) There were no changes in the Registrant’s internal control over financial reporting (as defined in Rule 30a-3(d)) under the Investment Company Act of 1940 that occurred during the second fiscal quarter of the period covered by this report that has materially affected, or is reasonably likely to materially affect, the Registrant’s internal control over financial reporting.
Item 12. Exhibits.
(a)(1) | Code of Ethics | |
(a)(2) | Certifications of principal executive officer and principal financial officer as required by Rule 30a-2 under the | |
| Investment Company Act of 1940. | ||
(b) | Certifications of principal executive officer and principal financial officer as required by Section 906 of the | |
| Sarbanes-Oxley Act of 2002. | ||
SIGNATURES
Pursuant to the requirements of the Securities Exchange Act of 1934 and the Investment Company Act of 1940, the Registrant has duly caused this Report to be signed on its behalf by the undersigned, thereunto duly authorized.
MAINSTAY FUNDS TRUST
| By: | /s/ Stephen P. Fisher | |
| Stephen P. Fisher |
President and Principal Executive Officer
Date: | July 10, 2015 | |
Pursuant to the requirements of the Securities Exchange Act of 1934 and the Investment Company Act of 1940, this Report has been signed below by the following persons on behalf of the Registrant and in the capacities and on the dates indicated.
| By: | /s/ Stephen P. Fisher | |
| Stephen P. Fisher |
President and Principal Executive Officer
Date: | July 10, 2015 | |
| By: | /s/ Jack R. Benintende | |
| Jack R. Benintende |
Treasurer and Principal Financial and Accounting Officer
Date: | July 10, 2015 | |
EXHIBIT INDEX
(a)(1) | Code of Ethics | |
(a)(2) | Certifications of principal executive officer and principal financial officer as required by Rule 30a-2 under the Investment Company Act of 1940. | |
(b) | Certification of principal executive officer and principal financial officer as required by Section 906 of the Sarbanes-Oxley Act of 2002. | |