UNITED STATES
SECURITIES AND EXCHANGE COMMISSION
Washington, D.C. 20549
Form N-CSR
CERTIFIED SHAREHOLDER REPORT OF REGISTERED MANAGEMENT
INVESTMENT COMPANIES
Investment Company Act File Number 811-22321
MAINSTAY FUNDS TRUST
(Exact name of Registrant as specified in charter)
51 Madison Avenue, New York, NY 10010
(Address of principal executive offices) (Zip code)
J. Kevin Gao, Esq.
169 Lackawanna Avenue
Parsippany, New Jersey 07054
(Name and address of agent for service)
Registrant’s telephone number, including area code: (212)576-7000
Date of fiscal year end: December 31
Date of reporting period: December 31, 2014
FORM N-CSR
The information presented in this Form N-CSR relates solely to the
MainStay Marketfield Fund, a series of the Registrant.
Item 1. Reports to Stockholders.
MainStay Marketfield Fund
Message from the President, Marketfield Asset Management LLC Year-End Commentary and Annual Report
December 31, 2014


This page intentionally left blank
Message from the President
While U.S. stocks advanced during 2014, energy prices tumbled and international stocks generally declined, making for a volatile year.
Additional information about the market events, economic trends and investment themes that shaped MainStay Marketfield Fund during the 12-months ended December 31, 2014, can be found in the annual report for MainStay Marketfield Fund and the Marketfield Asset Management LLC Year-End Commentary.
We encourage you to read the commentary and the report carefully and use them in your ongoing investment planning and review. As you review these materials, we hope that you’ll continue to maintain a long-term perspective, considering the role that MainStay Marketfield Fund plays in your overall investment portfolio.
We appreciate your choice of the MainStay Funds, and we look forward to continuing to serve your financial needs for many years to come.
Sincerely,

Stephen P. Fisher
President
The opinions expressed are as of the date of this report and are subject to change. There is no guarantee that any forecast made will come to pass. This material does not constitute investment advice and is not intended as an endorsement of any specific investment. Past performance is no guarantee of future results.
Not part of the Annual Report
Marketfield Asset Management LLC Year-End Commentary
A Message from Our Chairman
2014 was a difficult year for the Fund, with portfolio returns that were poor when viewed on either an absolute or relative basis. Although we were correct in identifying some of the more important issues in global economies, our implementation within the portfolio proved to be problematic. We anticipated a substantial migration of portfolio allocations back towards more cyclical portions of the equity market in response to a rapid improvement in the U.S. labor market. Instead equity market performance was tilted towards the sectors that typically shine in the midst of a deep recession, while sovereign yields reached levels often associated with deflationary recessions.
Based on past experience in managing the Fund, it is unusual for us to be correct about a macro thesis and wrong about the market’s response. In prior years our early identification of financial fragility (2008), the impact of the Federal Reserve’s emergency monetary stabilization efforts (2009), the absence of a U.S. double dip (2010), the likelihood of a Eurocrisis (2011), its ending (2012) and the potential for a strong bull market rally (2013) were all key factors in producing a strong long-term track record for the Fund. 2014 is a clear exception but we believe that it does not negate the value of our methods.
If we leave aside our own failings as investors over the past year, the general mismatch between economic and corporate data and market performance has led some to question whether macro investing itself is now a broken model. We appear to have come full circle from the position of investors at the end of the financial crisis six years ago when the ability of “bottom-up” fundamental analysis became widely derided. Our view has always been that both approaches are complementary and that, by and large, disciplined proponents of each approach should end up identifying similar risks and opportunities over time.
Macro investors will tend to get there first, but an investment opportunity that is shunned by the majority of global investors (and the fundamental camp is very much the majority) is unlikely to produce acceptable returns. The same is true on the downside; identifying a risk is one thing, identifying the timing that the risk will be recognized and acted upon by other investors can be much more difficult. Towards the ends of cycles, the slippage from timing tends to accelerate with the largest downward and upward movement in prices occurring on each side of a turning point.
As macro-driven investors navigating a portfolio through a period of poor performance, the decision as to whether to shift the focus of investment or hold a steady course comes from both our analysis and current market performance. By the end of the third quarter, it was clear that many of our positions were at odds with market forces, and we responded with a substantial reduction in exposure. Although this helped mitigate the effect of the collapse of markets in the early part of October, it also came at the price of reduced participation in the abrupt recovery rally.
However, this period of non-participation did allow us to regroup and refocus on where risk and opportunity reside. Clearly, for most global investors, the latter has been defined by the core defensive sectors of the S&P 500 Index, long-duration sovereign credit, and the U.S. dollar, all of which have seen substantial inflows in recent months. At the current time our own portfolio includes some U.S. large-cap equities, but mostly in areas that have historically been outside of the sphere of influence of the bond market. We have also been willing to seek opportunity abroad in markets that are viewed by many investors as either boring (Japan) or downright risky (China).
Our overall positioning is reasonably bullish, although we are not as exposed as we would be earlier in an investment cycle. Even as the U.S. domestic economy strengthens, there are growing headwinds for the corporate sector from both the U.S. dollar and potential wage pressures. The international markets we favor are also somewhat more volatile, meaning that smaller positioning can be expected to produce a similar return profile to core U.S. equity holdings. Although the last year has been difficult, our confidence in our investment process remains intact.
February 19, 2015
Michael Shaoul
Chairman, CEO
Portfolio Manager’s Report
One year ago, we put forth a case whereby pricing power was likely to begin appearing in portions of the real economy that were being over-stimulated by aggressive monetary loosening.
The analysis turned out to be incorrect and led to a year of poor performance for the Fund. Our decision to avoid owning the more stable, higher-yielding portions of the domestic equity market meant that we missed out on the main leadership themes during 2014. Performance was further undermined by our exposure to more cyclical and commodity-linked businesses, which generally suffered declines for most of the year.
We were surprised by the ineffective transmission of monetary policy beyond assets’ prices. Overall demand in the real economy remained subdued. The unrelenting flows toward vehicles that could provide some measure of income above the negligible returns on savings drove safe, non-economically geared assets to further heights, contrary to our expectations.
The flood of capital-seeking returns also boosted supplies of real assets and productive activities that held out the promise of stable, albeit low, cash returns. New commodity production continued to attract capital, even in the face of excess supply, causing prices to deflate across the commodity complex. Bulk shipping rates hovered around historic lows. The process appeared to reach a climactic stage with the collapse of oil prices and the subsequent distress in financial assets tied to energy prices.
Not part of the Annual Report
We have reached a stage at which concerns about global deflation provide a popular rationale for the purchase of fixed-income instruments that promise a negative return to the purchaser.
At present, ten countries in Europe have two-year rates that are below zero, despite the lack of fiscal discipline and concerns regarding Greece.
We understand that every purchaser of fixed-income instruments has some plausible justification, but in the aggregate, the phenomenon strikes us as a stage of excess normally associated with the late innings of investment manias.
At the heart of the question shaping the macroeconomic climate is the concept of deflation, which has become the principal source of anxiety among central bankers, economic commentators and political leaders. The unique aspect of this cycle is the universality of policies to inflate via policies designed to depreciate their currencies, a time honored mechanism by which monetary inflation can translate into a general rise in prices. As a consequence there is less scope for one country or region to provoke rising prices through isolated depreciation. Even with the U.S. dollar remaining strong, other major currency blocks have depreciated more or less in line with each other, limiting local inflationary effects.
Competitive pricing pressures in electronics and communication, over investment in commodity instruments by large financial institutions, bumper harvests and a technological revolution in the crude oil and gas industry are factors in reducing market prices, but none would seem to be appropriate targets for monetary policy. In some ways, the extraordinary efforts of central banks are contributing to the weakness in prices within the real economy. By allowing nearly unlimited financing at historically low cost, monetary policy is encouraging the commencement and continuation of projects that would be unattractive at normal interest rates.
In the meantime, diminished growth in public sector deficits, along with the rationalization of public labor costs from unsustainable, elevated levels all combine to give the appearance of widespread pressure on wages and prices and the threat of a real deflationary liquidation.
In light of the fact that certain price measures could be construed as warnings of a more serious monetary deflation, one might ask, “Why do we object to the persistence of easy money and aggressive central bank policy?” This is clearly the attitude that has been adopted by central bankers the world over.
Simply put, our concerns revolve around a phenomenon that has attended every period of easy money and credit in modern history. Monetary expansion prompts structural over-valuation of some critical portion of the system that ultimately reverts toward normal and, in doing so, wreaks havoc with the structure of finance and investment. Every expansive cycle has a different
focus of attention that enjoys the lion’s share of the inflated demand.
We have come a long way from the original justification for quantitative easing in 2008 for the U.S. and 2011 in Europe, when in both cases financial fragility threatened to destabilize entire economies. Current policy, by contrast, would seem to be driven by the “need to do something” to repair the unequal responses to prior stimulus.
Thus far the price increases fostered by stimulus have been concentrated in financial assets and investment media, enabling spectacular increases in wealth among those involved with either.
At present, the structural inflation of bond prices strikes us as the current iteration of growth stock valuations in 1999 and 2000. The willingness of investors to direct funds towards fixed-income instruments that offer negative yields with the risk of even greater losses against the hope that another investor will accept more deeply negative returns and thereby provide the current buyer with a capital gain strikes us as the terminal, manic phase of a long bull market.
It has been this writer’s experience that ending phases of bull markets are characterized by the willingness of buyers to forego any current return against the distant promise of capital gains.
Bonds have, from time immemorial, been valued on the basis of yield to maturity. Their transfiguration into capital gain instruments dependent upon persistent deflation in real economies strikes us as a prototypical expansion of risk.
Widespread exposure to high-grade bonds and equities that serve as bond proxies is, from our perspective, the main, systemic risk in the global investment landscape. Countervailing opportunities are equally substantial, should the focus on deflation prove to be misplaced. At the very least, we believe considerable relative value now resides within domestically focused portions of the U.S. equity market that lagged last year. Moreover, despite the overwhelming preference for U.S. equities at the current time, a number of key international markets, including China and Japan, would be considerable beneficiaries of a shift back towards a more balanced viewpoint of global growth and price trends.
Potential risks in long-duration fixed-income instruments will only be realized under economic conditions that are generally acknowledged as strong and getting stronger. Implicit in evolving views of strength will be a concern about the eventual appearance of price pressures.
Our argument and the performance of our portfolio rely on a shift in global attitude and portfolio allocation. We would be willing to admit that we would have argued something similar a year ago, although the manner in which we have expressed our opinion within the portfolio has changed considerably over this period. Although collapsing sovereign and high-grade yields
Not part of the Annual Report
have been taken as harbingers of serious deflation, their ultimate effects on real economic activity are likely, in our view, to be highly stimulative. We believe every large-scale investment excess ends with investors being forced to accept the inflated valuations on offer and participate in the new paradigm. It is exactly at these points of maximum pressure that there exists the greatest need and largest potential rewards for seeking opportunities far away from accepted trends.
February 19, 2015
Michael C. Aronstein
President, CIO & Portfolio Manager
The information provided herein represents the opinion of the Chairman and Portfolio Manager and is not intended to be a forecast of future events, a guarantee of future results, nor investment advice.
Not part of the Annual Report
Investors should refer to the Fund’s Summary Prospectus and/or Prospectus and consider the Fund’s investment objectives, strategies, risks, charges and expenses carefully before investing. The Summary Prospectus and/or Prospectus contain this and other information about the Fund. You may obtain copies of the Fund’s Summary Prospectus, Prospectus and Statement of Additional Information free of charge, upon request, by calling toll-free 800-MAINSTAY (624-6782), by writing to NYLIFE Distributors LLC, Attn: MainStay Marketing Department, 169 Lackawanna Avenue, Parsippany, New Jersey 07054 or by sending an e-mail to MainStayShareholderServices@nylim.com. These documents are also available via the MainStay Funds’ website at mainstayinvestments.com/documents. Please read the Summary Prospectus and/or Prospectus carefully before investing.
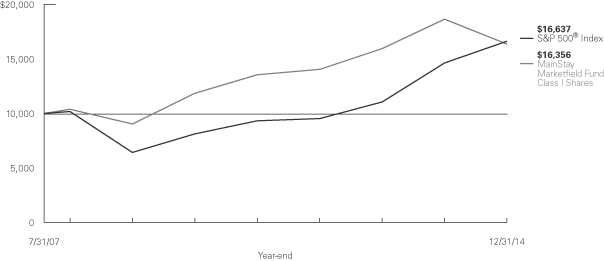
Investment and Performance Comparison1 (Unaudited)
Performance data quoted represents past performance. Past performance is no guarantee of future results. Because of market volatility, current performance may be lower or higher than the figures shown. Investment return and principal value will fluctuate, and as a result, when shares are redeemed, they may be worth more or less than their original cost. The graph below depicts the historical performance of Class I shares of the Fund. Performance will vary from class to class based on differences in class-specific expenses and sales charges. For performance information current to the most recent month-end, please call 800-MAINSTAY (624-6782) or visit mainstayinvestments.com.
Average Annual Total Returns for the Year Ended December 31, 2014
| Class | Sales Charge | One Year | Five Years | Since Inception (7/31/07) | Gross Expense Ratio2 | |||||||||||||||
| Class A Shares3 | Maximum 5.5% Initial Sales Charge | With sales charges Excluding sales charges |
| –17.32 –12.51 | %
|
| 5.20 6.40 | %
|
| 5.78 6.59 | %
|
| 2.93 2.93 | %
| ||||||
| Investor Class Shares3 | Maximum 5.5% Initial Sales Charge | With sales charges Excluding sales charges |
| –17.32 –12.51 |
| | 5.20 6.40 | |
| 5.78 6.59 |
|
| 2.95 2.95 |
| ||||||
| Class C Shares3 | Maximum 1% CDSC if Redeemed Within One Year of Purchase | With sales charges Excluding sales charges |
| –14.04 –13.17 |
| | 5.60 5.60 | |
| 5.80 5.80 |
|
| 3.68 3.68 |
| ||||||
| Class I Shares4 | No Sales Charge | –12.31 | 6.65 | 6.85 | 2.66 | |||||||||||||||
| Class R2 Shares3 | No Sales Charge | –12.64 | 6.27 | 6.47 | 3.05 | |||||||||||||||
| Class R6 Shares5 | No Sales Charge | –12.15 | 6.69 | 6.88 | 2.72 | |||||||||||||||
| Class P Shares6 | No Sales Charge | –12.26 | 6.65 | 6.85 | 2.66 | |||||||||||||||
| 1. | The performance table and graph do not reflect the deduction of taxes that a shareholder would pay on distributions or Fund-share redemptions. Total returns reflect maximum applicable sales charges as indicated in the table above, changes in share price, and reinvestment of dividends and capital gain distributions. The graph assumes the initial investment amount shown above and reflects the deduction of all sales charges that would have applied for the period of investment. Performance figures reflect certain fee waivers and/or expense limitations, without which total returns may have been lower. For more information on share classes and current fee waivers and/or expense limitations, please refer to the notes to the financial statements. |
| 2. | The gross expense ratios presented reflect the Fund’s “Total Annual Fund Operating Expenses” from the most recent Prospectus and may differ from other expense ratios disclosed in this report. |
| 3. | Performance figures for Class A, Investor Class, Class C, and Class R2 shares, first offered on October 5, 2012, include the historical performance of Class I shares through October 4, 2012 and are adjusted to reflect differences in fees and expenses. Performance data for the classes varies |
| based on differences in their fee and expense structures. Marketfield Fund commenced operations on July 31, 2007. Unadjusted, the performance for the newer classes would likely have been different. |
| 4. | Performance figures for Class I shares reflect the historical performance of the then-existing shares of Marketfield Fund (the predecessor to the Fund, which was subject to a different fee structure, and for which a predecessor entity to Marketfield Asset Management LLC served as investment advisor) for periods prior to October 5, 2012. Marketfield Fund commenced operations on July 31, 2007. |
| 5. | Performance figures for Class R6 shares, first offered on June 17, 2013, include the historical performance of Class I shares through June 16, 2013. Performance for Class R6 would likely have been different because of differences in certain expenses attributable to each share class. |
| 6. | Performance figures for Class P shares, first offered on May 31, 2013, include the historical performance of Class I shares through May 30, 2013. Performance for Class P shares would likely have been different because of differences in certain expenses attributable to each share class. |
The footnotes on the next page are an integral part of the table and graph and should be carefully read in conjunction with them.
| 8 | MainStay Marketfield Fund |
| Benchmark Performance | One Year | Five Years | Since Inception | |||||||||
S&P 500® Index7 | 13.69 | % | 15.45 | % | 7.10 | % | ||||||
Average Lipper Alternative Global Macro Fund8 | 0.87 | 4.83 | 3.29 | |||||||||
| 7. | S&P 500® Index is a trademark of The McGraw-Hill Companies, Inc. The S&P 500® Index is widely regarded as the standard index for measuring large-cap U.S. stock market performance. The S&P 500® Index is the Fund’s broad-based securities market index for comparison purposes. Results assume reinvestment of all dividends and capital gains. An investment cannot be made directly in an Index. |
| 8. | The Average Lipper Alternative Global Macro Fund is representative of funds that, by prospectus language, invest around the world using economic theory to justify the decision-making process. The strategy is typically based |
| on forecasts and analysis about interest rate trends, the general flow of funds, political changes, government policies, intergovernmental relations, and other broad systemic factors. These funds generally trade a wide range of markets and geographic regions, employing a broad range of trading ideas and instruments. This benchmark is a product of Lipper Inc. Lipper Inc. is an independent monitor of fund performance. Results are based on average total returns of similar funds with all dividend and capital gain distributions reinvested. |
The footnotes on the preceding page are an integral part of the table and graph and should be carefully read in conjunction with them.
| 9 |
Cost in Dollars of a $1,000 Investment in MainStay Marketfield Fund (Unaudited)
The example below is intended to describe the fees and expenses borne by shareholders during the six-month period from July 1, 2014, to December 31, 2014, and the impact of those costs on your investment.
Example
As a shareholder of the Fund, you incur two types of costs: (1) transaction costs, including exchange fees and sales charges (loads) on purchases (as applicable), and (2) ongoing costs, including management fees, distribution and/or service (12b-1) fees, and other Fund expenses (as applicable). This example is intended to help you understand your ongoing costs (in dollars) of investing in the Fund and to compare these costs with the ongoing costs of investing in other Funds. The example is based on an investment of $1,000 made at the beginning of the six-month period and held for the entire period from July 1, 2014, to December 31, 2014.
This example illustrates your Fund’s ongoing costs in two ways:
Actual Expenses
The second and third data columns in the table below provide information about actual account values and actual expenses. You may use the information in these columns, together with the amount you invested, to estimate the expenses that you paid during the six months ended December 31, 2014. Simply divide your account value by $1,000 (for example, an $8,600 account value divided by $1,000 = 8.6), then
multiply the result by the number under the heading entitled “Expenses Paid During Period” to estimate the expenses you paid on your account during this period.
Hypothetical Example for Comparison Purposes
The fourth and fifth data columns in the table below provide information about hypothetical account values and hypothetical expenses based on the Fund’s actual expense ratio and an assumed rate of return of 5% per year before expenses, which is not the Fund’s actual return. The hypothetical account values and expenses may not be used to estimate the actual ending account balances or expenses you paid for the six-month period shown. You may use this information to compare the ongoing costs of investing in the Fund with the ongoing costs of investing in other Funds. To do so, compare this 5% hypothetical example with the 5% hypothetical examples that appear in the shareholder reports of the other Funds.
Please note that the expenses shown in the table are meant to highlight your ongoing costs only and do not reflect any transactional costs, such as exchange fees or sales charges (loads). Therefore, the fourth and fifth data columns of the table are useful in comparing ongoing costs only and will not help you determine the relative total costs of owning different funds. In addition, if these transactional costs were included, your costs would have been higher.
| Share Class | Beginning Account Value 7/1/14 | Ending Account Value (Based on Actual Returns and Expenses) 12/31/14 | Expenses Paid During Period1 | Ending Account Value (Based on Hypothetical 5% Annualized Return and Actual Expenses) 12/31/14 | Expenses Paid During Period1 | |||||||||||||||
| Class A Shares | $ | 1,000.00 | $ | 907.90 | $ | 10.96 | $ | 1,013.70 | $ | 11.57 | ||||||||||
| Investor Class Shares | $ | 1,000.00 | $ | 907.90 | $ | 10.96 | $ | 1,013.70 | $ | 11.57 | ||||||||||
| Class C Shares | $ | 1,000.00 | $ | 903.90 | $ | 14.54 | $ | 1,009.90 | $ | 15.35 | ||||||||||
| Class I Shares | $ | 1,000.00 | $ | 908.80 | $ | 9.77 | $ | 1,015.00 | $ | 10.31 | ||||||||||
| Class R2 Shares | $ | 1,000.00 | $ | 907.10 | $ | 11.39 | $ | 1,013.30 | $ | 12.03 | ||||||||||
| Class R6 Shares | $ | 1,000.00 | $ | 909.40 | $ | 9.14 | $ | 1,015.60 | $ | 9.65 | ||||||||||
| Class P Shares | $ | 1,000.00 | $ | 908.80 | $ | 9.77 | $ | 1,015.00 | $ | 10.31 | ||||||||||
| 1. | Expenses are equal to the Fund’s annualized expense ratio of (2.28% for Class A, 2.28% for Investor Class, 3.03% for Class C, 2.03% for Class I, 2.37% for Class R2, 1.90% for Class R6 and 2.03% for Class P) multiplied by the average account value over the period, divided by 365 and multiplied by 184 (to reflect the six-month period). The table above represents the actual expenses incurred during the six-month period. |
| 10 | MainStay Marketfield Fund |
Country Composition as of December 31, 2014 (Unaudited)
| United States | 61.4 | % | ||
| Japan | 9.1 | |||
| Ireland | 7.6 | |||
| China | 3.1 | |||
| Spain | 2.2 | |||
| United Kingdom | 2.1 | |||
| Canada | 1.4 |
| Taiwan | 1.3 | % | ||
| Germany | 0.8 | |||
| Switzerland | 0.6 | |||
| Italy | 0.4 | |||
| Other Assets, Less Liabilities | 19.9 | |||
| Investments Sold Short | –9.9 | |||
|
| |||
| 100.0 | % | |||
|
|
Industry Composition as of December 31, 2014 (Unaudited)
| Banks | 13.9 | % | ||
| Household Durables | 8.4 | |||
| Aerospace & Defense | 5.1 | |||
| Real Estate Management & Development | 4.6 | |||
| Semiconductors & Semiconductor Equipment | 4.1 | |||
| Construction Materials | 3.3 | |||
| Machinery | 3.2 | |||
| Real Estate Investment Trusts | 3.1 | |||
| Internet & Catalog Retail | 2.2 | |||
| Specialty Retail | 2.1 | |||
| Technology Hardware, Storage & Peripherals | 1.9 | |||
| Electronic Equipment, Instruments & Components | 1.8 | |||
| Internet Software & Services | 1.7 | |||
| Chemicals | 1.6 | |||
| Diversified Financial Services | 1.5 | |||
| Insurance | 1.5 |
| Food & Staples Retailing | 1.4 | % | ||
| Purchased Options | 1.3 | |||
| Consumer Finance | 1.3 | |||
| Metals & Mining | 1.3 | |||
| Health Care Equipment & Supplies | 1.0 | |||
| Software | 0.9 | |||
| Oil, Gas & Consumable Fuels | 0.8 | |||
| Building Products | 0.6 | |||
| Hotels, Restaurants & Leisure | 0.4 | |||
| Trading Companies & Distributors | 0.4 | |||
| Beverages | 0.1 | |||
| Investments in Exchange-Traded Funds | 15.5 | |||
| Investment in Money Market Fund | 5.0 | |||
| Other Assets, Less Liabilities | 19.9 | |||
| Investments Sold Short | –9.9 | |||
|
| |||
| 100.0 | % | |||
|
|
See Portfolio of Investments beginning on page 14 for specific holdings within these categories.
Top Ten Holdings or Issuers as of December 31, 2014 (excluding short-term investment) (Unaudited)
| 1. | Bank of Ireland |
| 2. | Financial Select Sector SPDR Fund |
| 3. | iShares MSCI Japan Index Fund |
| 4. | iShares China Large-Cap ETF |
| 5. | Kennedy Wilson Europe Real Estate PLC |
| 6. | SPDR S&P Homebuilders |
| 7. | Lockheed Martin Corp. |
| 8. | Citigroup, Inc. |
| 9. | Facebook, Inc. Class A |
| 10. | Whirlpool Corp. |
Top Five Short Positions as of December 31, 2014 (Unaudited)
| 1. | iShares JP Morgan USD Emerging Markets Bond |
| 2. | Allianz SE |
| 3. | Boeing Co. (The) |
| 4. | Airbus Group N.V. |
| 5. | Nestle S.A. |
| 11 |
Portfolio Management Discussion and Analysis (Unaudited)
Questions answered by portfolio manager Michael C. Aronstein of Marketfield Asset Management LLC, the Fund’s Subadvisor.
How did MainStay Marketfield Fund perform relative to its primary benchmark and peers during the 12 months ended December 31, 2014?
Excluding all sales charges, MainStay Marketfield Fund returned –12.51% for Class A and Investor Class shares and –13.17% for Class C shares for the 12 months ended December 31, 2014. Over the same period, Class I shares returned –12.31%, Class R2 shares returned –12.64%, Class R6 shares returned –12.15% and Class P shares returned –12.26%. During the 12 months ended December 31, 2014, all share classes underperformed the 13.69% return of the S&P 500® Index,1 which is the Fund’s primary broad-based securities-market index. Over the same period, all share classes underperformed the 0.87% return of the average Lipper2 Alternative Global Macro Fund. See page 8 for Fund returns with applicable sales charges.
What factors affected the Fund’s performance relative to the S&P 500® Index during the reporting period?
MainStay Marketfield Fund is a long/short Fund whose correlation to the broad equity market may vary considerably over the course of an investment cycle. The Fund has a broad investment charter that allows it to use equity securities, fixed-income instruments, futures and options. Additionally, with respect to 50% of its net assets, the Fund may engage in short sales to profit from anticipated declines in security prices.
The Fund was not represented in—or it held short positions in—many of the sectors of the S&P 500® Index that performed well during the reporting period, such as transportation, real estate, health care and utilities. The Fund was long many of the sectors of the Index that performed poorly, such as materials and energy. In addition, the Fund’s equity exposure was too low in light of the performance of the S&P 500® Index.
During the reporting period, how was the Fund’s performance materially affected by investments in derivatives?
We took short positions in long-term developed-world bonds expecting yields to rise. We used bond futures and options to express these positions. When bond yields declined, however, these positions had a negative impact on the performance of the Fund.
Which investment themes were the strongest contributors to the Fund’s performance and which themes were particularly weak?
The Fund’s strongest-contributing themes were General Acceleration of Economic Activity, which contributed 0.3% to performance; Other (Legacy Holdings), which contributed 0.7%
to performance; and European Recovery, which contributed 0.1% to performance. (Contributions take weightings and total returns into account.) The Fund’s General Acceleration of Economic Activity theme sought long positions in U.S. housing, construction, industrial and financial stocks. The Other theme pursued legacy holdings with the rationale that various companies with good business models either remained from older themes or could have been purchased opportunistically. The Fund’s European Recovery theme sought long positions in real estate and financials in Europe. This reflected our view that depressed European real estate assets may recover.
The Fund’s weakest-contributing themes were Reflation, which contributed –2.7% to performance; Safe Haven, which contributed –1.9%; and Direct Hedges, which contributed –1.8%. The Fund’s reflation theme seeks long positions in material, energy and chemical stocks, with the rationale that pricing power is moving upstream in the value chain. The Fund’s Safe Haven theme—which reflected our view that assets considered to be “safe haven” assets by investors may have been overowned and overvalued, that interest rates may have had greater risk to the upside at then-current historic low yields, and that economic fears may have been subsiding—led the Fund to short safe-haven assets. The Direct Hedges theme sought short holdings in broad U.S. and European indices and various bonds and currencies.
During the reporting period, which individual holdings made the strongest contributions to the Fund’s absolute performance and which holdings detracted the most?
The stocks that made the strongest positive contributions to the Fund’s absolute performance were aluminum producer Alcoa, social media provider Facebook and home appliance manufacturer Whirlpool. During the reporting period, the holdings that detracted the most from the Fund’s absolute performance were mining company Teck Resources Limited, emerging markets exchange traded fund Vanguard FTSE Emerging Markets ETF, and gold mining exchange traded fund Market Vectors Gold Miners ETF. As of December 31, 2014, the Fund no longer held Teck Resources or Vanguard FTSE Emerging Markets ETF.
Did the Fund make any significant purchases or sales during the reporting period?
During the reporting period, the Fund decreased its allocation to our Reflation theme from 24% to 4% of net assets. We liquidated our short Normalization of European Yields theme, which formerly constituted 13% of net assets. During the reporting period, we increased long exposure to Japan from 6% to 12% of net assets, and we initiated our long Emerging Markets
| 1. | See footnote on page 9 for more information on the S&P 500® Index. |
| 2. | See footnote on page 9 for more information on Lipper Inc. |
| 12 | MainStay Marketfield Fund |
theme, which as of December 31, 2014, constituted 11% of the Fund. This theme was based on our belief that many emerging markets had deteriorating economic fundamentals.
How did the Fund’s sector weightings change during the reporting period?
In financials, the Fund moved from a 9.8% position at the beginning of the reporting period to 21% at the end, an increase of 11.2 percentage points. In information technology, the Fund moved from 1.6% at the beginning of the reporting period to 10.3% at the end, an increase of 8.7 percentage points. In consumer discretionary, the Fund moved from a 10.7% position at the beginning of the reporting period to a 13% position at the end, an increase of 2.3 percentage points.
In materials, the Fund moved from 14.2% at the beginning of the reporting period to 6.1% at the end, a decrease of 8.1 percentage points. The Fund’s allocation to industrials decreased from 15.2% of net assets at the beginning of the reporting period to 6.9% at the end, a decrease of 8.3 percentage points. In energy, the Fund decreased its 5.6% position at the beginning of the reporting period to 0.8% at the end, a
decrease of 4.8 percentage points.
How was the Fund positioned at the end of the reporting period?
As of December 31, 2014, the equity portion of the Fund was 83% long and 10% short. The net equity exposure was long 73%.3 As of the same date, the futures portion of the Fund was 4% long and 15% short. The net futures exposure was short 11%.
| 3. | See the Portfolio of Investments on page 14 for information on specific holdings. |
The opinions expressed are those of the portfolio manager as of the date of this report and are subject to change. There is no guarantee that any forecasts made will come to pass. This material does not constitute investment advice and is not intended as an endorsement of any specific investment.
| 13 |
Portfolio of Investments December 31, 2014
| Shares | Value | |||||||
| Common Stocks 65.5%† | ||||||||
Aerospace & Defense 5.1% | ||||||||
Honeywell International, Inc. | 772,152 | $ | 77,153,428 | |||||
¨Lockheed Martin Corp. | 835,122 | 160,819,444 | ||||||
Northrop Grumman Corp. (a) | 972,952 | 143,403,395 | ||||||
United Technologies Corp. | 657,247 | 75,583,405 | ||||||
|
| |||||||
| 456,959,672 | ||||||||
|
| |||||||
Banks 11.2% | ||||||||
Bank of America Corp. | 8,560,214 | 153,142,228 | ||||||
Bank of China, Ltd. Class H | 262,534,576 | 146,989,909 | ||||||
¨Bank of Ireland (b) | 522,679,599 | 194,638,401 | ||||||
¨Bank of Ireland, Sponsored | 1,433,108 | 21,811,904 | ||||||
¨Citigroup, Inc. (a) | 2,921,564 | 158,085,828 | ||||||
Sumitomo Mitsui Financial Group, Inc. | 2,690,922 | 97,229,748 | ||||||
U.S. Bancorp | 2,511,790 | 112,904,961 | ||||||
Wells Fargo & Co. (a) | 2,233,161 | 122,421,886 | ||||||
|
| |||||||
| 1,007,224,865 | ||||||||
|
| |||||||
Beverages 0.1% | ||||||||
Suntory Beverage & Food, Ltd. | 165,632 | 5,718,908 | ||||||
|
| |||||||
Building Products 0.6% | ||||||||
Geberit A.G. | 163,243 | 55,475,410 | ||||||
|
| |||||||
Chemicals 1.6% | ||||||||
Potash Corporation of Saskatchewan, Inc. | 1,350,760 | 47,708,843 | ||||||
Sherwin-Williams Co. (The) (a) | 359,619 | 94,594,182 | ||||||
|
| |||||||
| 142,303,025 | ||||||||
|
| |||||||
Construction Materials 3.3% | ||||||||
Buzzi Unicem S.p.A. | 2,772,488 | 34,879,160 | ||||||
CRH PLC | 2,060,506 | 48,941,052 | ||||||
Eagle Materials, Inc. (a) | 1,346,325 | 102,361,090 | ||||||
Taiheiyo Cement Corp. | 35,497,825 | 111,700,215 | ||||||
|
| |||||||
| 297,881,517 | ||||||||
|
| |||||||
Consumer Finance 1.3% | ||||||||
Discover Financial Services (a) | 1,791,864 | 117,349,173 | ||||||
|
| |||||||
Diversified Financial Services 1.5% |
| |||||||
CME Group, Inc. | 1,175,708 | 104,226,514 | ||||||
Intercontinental Exchange, Inc. | 134,500 | 29,494,505 | ||||||
|
| |||||||
| 133,721,019 | ||||||||
|
| |||||||
Electronic Equipment, Instruments & Components 1.8% |
| |||||||
Hitachi, Ltd. | 12,729,754 | 93,146,905 | ||||||
Trimble Navigation, Ltd. (b) | 2,591,092 | 68,767,582 | ||||||
|
| |||||||
| 161,914,487 | ||||||||
|
| |||||||
| Shares | Value | |||||||
Food & Staples Retailing 1.4% | ||||||||
Costco Wholesale Corp. (a) | 923,501 | $ | 130,906,267 | |||||
|
| |||||||
Health Care Equipment & Supplies 1.0% |
| |||||||
Intuitive Surgical, Inc. (b) | 163,980 | 86,735,581 | ||||||
|
| |||||||
Hotels, Restaurants & Leisure 0.4% | ||||||||
Dalata Hotel Group PLC (b) | 11,559,265 | 41,158,820 | ||||||
|
| |||||||
Household Durables 8.4% | ||||||||
D.R. Horton, Inc. (a) | 3,622,931 | 91,623,925 | ||||||
Lennar Corp. Class A (a) | 2,464,925 | 110,453,289 | ||||||
PulteGroup, Inc. | 4,910,567 | 105,380,768 | ||||||
Ryland Group, Inc. (The) (a) | 1,283,840 | 49,504,870 | ||||||
Sekisui House, Ltd. | 5,276,773 | 69,114,107 | ||||||
Sony Corp. | 3,485,022 | 70,950,944 | ||||||
Sony Corp., Sponsored ADR | 2,948,319 | 60,352,090 | ||||||
Toll Brothers, Inc. (b) | 1,438,177 | 49,286,326 | ||||||
¨Whirlpool Corp. | 793,743 | 153,779,769 | ||||||
|
| |||||||
| 760,446,088 | ||||||||
|
| |||||||
Insurance 1.5% | ||||||||
China Life Insurance Co., Ltd. Class H | 22,785,729 | 88,939,550 | ||||||
China Pacific Insurance Group Co., Ltd. Class H | 8,582,000 | 42,735,143 | ||||||
|
| |||||||
| 131,674,693 | ||||||||
|
| |||||||
Internet & Catalog Retail 2.2% | ||||||||
Amazon.com, Inc. (b) | 266,036 | 82,564,272 | ||||||
Priceline Group, Inc. (The) (b) | 98,803 | 112,656,169 | ||||||
|
| |||||||
| 195,220,441 | ||||||||
|
| |||||||
Internet Software & Services 1.7% | ||||||||
¨Facebook, Inc. Class A (a)(b) | 1,972,756 | 153,914,423 | ||||||
|
| |||||||
Machinery 3.2% | ||||||||
Cummins, Inc. (a) | 661,694 | 95,396,424 | ||||||
Deere & Co. (a) | 1,005,752 | 88,978,880 | ||||||
Fanuc Corp. | 626,629 | 103,417,992 | ||||||
|
| |||||||
| 287,793,296 | ||||||||
|
| |||||||
Metals & Mining 1.3% | ||||||||
Nippon Steel & Sumitomo Metal Corp. | 47,244,020 | 117,246,149 | ||||||
|
| |||||||
Oil, Gas & Consumable Fuels 0.8% | ||||||||
Hess Corp. | 973,839 | 71,888,795 | ||||||
|
| |||||||
Real Estate Investment Trusts 3.1% | ||||||||
Green REIT PLC (b) | 45,410,798 | 70,483,305 | ||||||
Hibernia REIT PLC (b) | 49,809,719 | 65,225,977 | ||||||
| † | Percentages indicated are based on Fund net assets. |
| ¨ | Among the Fund’s 10 largest holdings, as of December 31, 2014, excluding short-term investments. May be subject to change daily. |
| 14 | MainStay Marketfield Fund | The notes to the financial statements are an integral part of, and should be read in conjunction with, the financial statements. |
| Shares | Value | |||||||
| Common Stocks (continued) | ||||||||
Real Estate Investment Trusts (continued) |
| |||||||
Merlin Properties Socimi S.A. (b) | 11,831,585 | $ | 143,546,782 | |||||
|
| |||||||
| 279,256,064 | ||||||||
|
| |||||||
Real Estate Management & Development 4.6% |
| |||||||
Deutsche Wohnen A.G. | 2,480,070 | 58,927,048 | ||||||
¨Kennedy Wilson Europe Real Estate PLC | 11,669,575 | 191,701,608 | ||||||
Mitsubishi Estate Co., Ltd. | 4,180,774 | 88,483,378 | ||||||
St. Joe Co. (The) (a)(b) | 4,053,116 | 74,536,803 | ||||||
|
| |||||||
| 413,648,837 | ||||||||
|
| |||||||
Semiconductors & Semiconductor Equipment 4.1% |
| |||||||
First Solar, Inc. (b) | 1,689,655 | 75,350,165 | ||||||
Intel Corp. | 3,782,170 | 137,254,949 | ||||||
Taiwan Semiconductor Manufacturing Co., Ltd., Sponsored ADR (a) | 5,183,024 | 115,996,077 | ||||||
Texas Instruments, Inc. | 834,986 | 44,642,527 | ||||||
|
| |||||||
| 373,243,718 | ||||||||
|
| |||||||
Software 0.9% | ||||||||
FireEye, Inc. (b) | 836,608 | 26,420,080 | ||||||
Splunk, Inc. (a)(b) | 944,206 | 55,660,944 | ||||||
|
| |||||||
| 82,081,024 | ||||||||
|
| |||||||
Specialty Retail 2.1% | ||||||||
Home Depot, Inc. (The) (a) | 1,333,659 | 139,994,185 | ||||||
Inditex S.A. | 1,908,852 | 54,694,230 | ||||||
|
| |||||||
| 194,688,415 | ||||||||
|
| |||||||
Technology Hardware, Storage & Peripherals 1.9% |
| |||||||
Blackberry, Ltd. (b) | 7,410,611 | 81,368,509 | ||||||
EMC Corp. | 2,913,010 | 86,632,917 | ||||||
|
| |||||||
| 168,001,426 | ||||||||
|
| |||||||
Trading Companies & Distributors 0.4% |
| |||||||
Beacon Roofing Supply, Inc. (b) | 1,433,366 | 39,847,575 | ||||||
|
| |||||||
Total Common Stocks | 5,906,299,688 | |||||||
|
| |||||||
| Exchange-Traded Funds 15.5% (c) | ||||||||
¨Financial Select Sector SPDR | 12,984,149 | 321,098,005 | ||||||
¨iShares China Large-Cap ETF | 5,530,359 | 230,173,542 | ||||||
iShares Dow Jones U.S. Home Construction Index Fund (a) | 5,007,081 | 129,583,256 | ||||||
iShares MSCI Hong Kong ETF (a) | 7,005,269 | 143,888,225 | ||||||
¨iShares MSCI Japan Index Fund | 20,854,122 | 234,400,331 | ||||||
Market Vectors Agribusiness ETF | 1,392,781 | 73,162,786 | ||||||
Market Vectors Gold Miners ETF | 3,965,711 | 72,889,768 | ||||||
¨SPDR S&P Homebuilders (a) | 5,574,567 | 190,204,226 | ||||||
|
| |||||||
Total Exchange-Traded Funds | 1,395,400,139 | |||||||
|
| |||||||
| Shares | Value | |||||||
| Preferred Stock 2.7% | ||||||||
Banks 2.7% | ||||||||
¨Bank of Ireland Trust-Preferred Security 10.24% (d) | 190,011,000 | $ | 240,844,182 | |||||
|
| |||||||
Total Preferred Stock | 240,844,182 | |||||||
|
| |||||||
| Number of Contracts | ||||||||
| Purchased Options 1.3% | ||||||||
Purchased Call Options 0.8% | ||||||||
CBOE SPX Volatility Index | 75,000 | 15,525,000 | ||||||
| Notional Amount | ||||||||
CNH Put/USD Call, | 1,389,632,700 | 20,121,882 | ||||||
TRY Put/USD Call, | 750,000,000 | 38,119,500 | ||||||
|
| |||||||
Total Purchased Call Options | 73,766,382 | |||||||
|
| |||||||
Purchased Put Options 0.5% | ||||||||
EUR Put/USD Call, | 462,716,660 | 14,124,859 | ||||||
| Number of Contracts | ||||||||
Google, Inc. | 8,187 | 1,391,790 | ||||||
SPDR S&P 500 ETF Trust | 150,000 | 30,600,000 | ||||||
|
| |||||||
Total Purchased Put Options | 46,116,649 | |||||||
|
| |||||||
Total Purchased Options | 119,883,031 | |||||||
|
| |||||||
| The notes to the financial statements are an integral part of, and should be read in conjunction with, the financial statements. | 15 |
Portfolio of Investments December 31, 2014 (continued)
| Shares | Value | |||||||
| Short-Term Investment 5.0% | ||||||||
Money Market Fund 5.0% | ||||||||
State Street Institutional Treasury Money Market Fund | 450,000,000 | $ | 450,000,000 | |||||
|
| |||||||
Total Short-Term Investment | 450,000,000 | |||||||
|
| |||||||
Total Investments, Before Investments Sold Short | 90.0 | % | 8,112,427,040 | |||||
|
| |||||||
| Common Stocks Sold Short (6.3%) | ||||||||
Aerospace & Defense (2.3%) | ||||||||
Airbus Group N.V. | (1,858,082 | ) | (92,285,755 | ) | ||||
Boeing Co. (The) | (898,432 | ) | (116,778,191 | ) | ||||
|
| |||||||
| (209,063,946 | ) | |||||||
|
| |||||||
Food & Staples Retailing (0.4%) | ||||||||
Whole Foods Market, Inc. | (774,177 | ) | (39,034,004 | ) | ||||
|
| |||||||
Food Products (1.9%) | ||||||||
Danone | (1,254,511 | ) | (82,529,876 | ) | ||||
Nestle S.A. | (1,174,809 | ) | (86,115,311 | ) | ||||
|
| |||||||
| (168,645,187 | ) | |||||||
|
| |||||||
Insurance (1.7%) | ||||||||
Allianz SE | (891,828 | ) | (148,180,514 | ) | ||||
|
| |||||||
Total Common Stocks Sold Short | (564,923,651 | ) | ||||||
|
| |||||||
| Exchange-Traded Fund Sold Short (3.6%) (c) | ||||||||
iShares JP Morgan USD Emerging Markets Bond | (3,005,349 | ) | (329,716,839 | ) | ||||
|
| |||||||
Total Exchange-Traded Fund Sold Short | (329,716,839 | ) | ||||||
|
| |||||||
Total Investments Sold Short | (9.9 | )% | (894,640,490 | ) | ||||
|
| |||||||
Total Investments, Net of Investments Sold Short | 80.1 | 7,217,786,550 | ||||||
Other Assets, Less Liabilities | 19.9 | 1,790,802,983 | ||||||
Net Assets | 100.0 | % | $ | 9,008,589,533 | ||||
| Contracts Long | Unrealized Appreciation (Depreciation) (g) | |||||||
| Futures Contracts (0.6%) | ||||||||
H-Shares Index January 2015 (h) | 4,944 | $ | 7,141,520 | |||||
|
| |||||||
Total Futures Contracts Long (Notional Amount $382,181,117) | 7,141,520 | |||||||
|
| |||||||
| Contracts Short | ||||||||
CAC 40 Index 10 Euro January 2015 (h) | (9,321 | ) | (34,465,104 | ) | ||||
Standard & Poor’s 500 Index Mini March 2015 (h) | (8,245 | ) | (28,591,681 | ) | ||||
|
| |||||||
Total Futures Contracts Short | (63,056,785 | ) | ||||||
|
| |||||||
Total Futures Contracts | $ | (55,915,265 | ) | |||||
|
| |||||||
| (a) | Security, or a portion thereof, was maintained in a segregated account at the Fund’s custodian as collateral for securities Sold Short (See Note 2(J)). |
| (b) | Non-income producing security. |
| (c) | Exchange-Traded Fund—An investment vehicle that represents a basket of securities that is traded on an exchange. |
| (d) | May be sold to institutional investors only under Rule 144A or securities offered pursuant to Section 4(a)(2) of the Securities Act of 1933, as amended. |
| (e) | As of December 31, 2014, cash in the amount of $4,738,519 was on deposit with brokers for options transactions. |
| (f) | As of December 31, 2014, cash in the amount of $1,036,478,815 was on deposit with brokers for short sale transactions. |
| (g) | Represents the difference between the value of the contracts at the time they were opened and the value as of December 31, 2014. |
| (h) | As of December 31, 2014, cash in the amount of $236,818,070 was on deposit with brokers for futures transactions. |
| (i) | As of December 31, 2014, cost was $7,332,935,969 for federal income tax purposes and net unrealized appreciation was as follows: |
Gross unrealized appreciation | $ | 1,050,941,064 | ||
Gross unrealized depreciation | (271,449,993 | ) | ||
|
| |||
Net unrealized appreciation | $ | 779,491,071 | ||
|
|
| 16 | MainStay Marketfield Fund | The notes to the financial statements are an integral part of, and should be read in conjunction with, the financial statements. |
At December 31, 2014, the Fund held the following OTC credit default swap contract:
Reference Entity | Counterparty | Termination Date | Buy/Sell Protection1 | Notional Amount (000)2 | (Pay)/ Receive Fixed Rate3 | Upfront Premiums Received/ (Paid) | Value | Unrealized Appreciation/ (Depreciation)4 | ||||||||||||||||||||||||
Republic of South Africa | Citibank N.A. | 6/20/2019 | Buy | $ | 236,926 | (1.00 | )% | $ | (11,410,860 | ) | $ | 6,726,730 | $ | (4,684,130 | ) | |||||||||||||||||
| $ | 6,726,730 | $ | (4,684,130 | ) | ||||||||||||||||||||||||||||
| 1. | Buy—Fund pays premium and buys credit protection. If a credit event occurs, as defined under the terms of that particular swap agreement, the Fund will either (i) receive from the seller of protection an amount equal to the notional amount of the swap and deliver the referenced obligation or underlying securities comprising the referenced index or (ii) receive a net settlement amount in the form of cash or securities equal to the notional amount of the swap less the recovery value of the referenced obligation or underlying securities comprising the referenced index. |
| Sell—Fund receives premium and sells credit protection. If a credit event occurs, as defined under the terms of that particular swap agreement, the Fund will either (i) pay to the buyer of protection an amount equal to the notional amount of the swap and take delivery of the referenced obligation or underlying securities comprising the referenced index or (ii) pay a net settlement amount in the form of cash or securities equal to the notional amount of the swap less the recovery value of the referenced obligation or underlying securities comprising the referenced index. |
| 2. | The maximum potential amount the Fund could be required to pay as a seller of credit protection or receive as a buyer of credit protection if a credit event occurs as defined under the terms of that particular swap contract. |
| 3. | The annual fixed rate represents the interest received by the Fund (as a seller of protection) or paid by the Fund (as a buyer of protection) annually on the notional amount of the credit default swap contract. |
| 4. | Represents the difference between the value of the credit default swap contract at the time it was opened and the value at December 31, 2014. |
The following abbreviations are used in the preceding pages:
ADR—American Depositary Receipt
CAC—Cotation Assistee en Continu
CBOE—Chicago Board Options Exchange
CNH—Chinese Offshore Yuan
ETF—Exchange-Traded Fund
EUR—Euro
SPDR—Standard & Poor’s Depositary Receipt
TRY—Turkish Lira
USD—United States Dollar
| The notes to the financial statements are an integral part of, and should be read in conjunction with, the financial statements. | 17 |
Portfolio of Investments December 31, 2014 (continued)
The following is a summary of the fair valuations according to the inputs used as of December 31, 2014, for valuing the Fund’s assets and liabilities.
Asset Valuation Inputs
Description | Quoted (Level 1) | Significant (Level 2) | Significant (Level 3) | Total | ||||||||||||
| Investments in Securities (a) | ||||||||||||||||
| Common Stocks | ||||||||||||||||
Banks | $ | 568,366,807 | $ | 438,858,058 | $ | — | $ | 1,007,224,865 | ||||||||
Beverages | — | 5,718,908 | — | 5,718,908 | ||||||||||||
Building Products | — | 55,475,410 | — | 55,475,410 | ||||||||||||
Construction Materials | 102,361,090 | 195,520,427 | — | 297,881,517 | ||||||||||||
Electronic Equipment, Instruments & Components | 68,767,582 | 93,146,905 | — | 161,914,487 | ||||||||||||
Hotels, Restaurants & Leisure | — | 41,158,820 | — | 41,158,820 | ||||||||||||
Household Durables | 620,381,037 | 140,065,051 | — | 760,446,088 | ||||||||||||
Insurance | — | 131,674,693 | — | 131,674,693 | ||||||||||||
Machinery | 184,375,304 | 103,417,992 | — | 287,793,296 | ||||||||||||
Metals & Mining | — | 117,246,149 | — | 117,246,149 | ||||||||||||
Real Estate Investment Trusts | — | 279,256,064 | — | 279,256,064 | ||||||||||||
Real Estate Management & Development | 74,536,803 | 339,112,034 | — | 413,648,837 | ||||||||||||
Specialty Retail | 139,994,185 | 54,694,230 | — | 194,688,415 | ||||||||||||
All Other Industries | 2,152,172,139 | — | — | 2,152,172,139 | ||||||||||||
|
|
|
|
|
|
|
| |||||||||
| Total Common Stocks | 3,910,954,947 | 1,995,344,741 | — | 5,906,299,688 | ||||||||||||
|
|
|
|
|
|
|
| |||||||||
| Exchange-Traded Funds | 1,395,400,139 | — | — | 1,395,400,139 | ||||||||||||
| Preferred Stock | — | 240,844,182 | — | 240,844,182 | ||||||||||||
| Short-Term Investment | ||||||||||||||||
Money Market Fund | 450,000,000 | — | — | 450,000,000 | ||||||||||||
|
|
|
|
|
|
|
| |||||||||
| Total Investments in Securities | 5,756,355,086 | 2,236,188,923 | — | 7,992,544,009 | ||||||||||||
|
|
|
|
|
|
|
| |||||||||
| Other Financial Instruments | ||||||||||||||||
Futures Contracts Long (b) | 7,141,520 | — | — | 7,141,520 | ||||||||||||
Purchased Call Options | 73,766,382 | — | — | 73,766,382 | ||||||||||||
Purchased Put Options | 46,116,649 | — | — | 46,116,649 | ||||||||||||
|
|
|
|
|
|
|
| |||||||||
| Total Other Financial Instruments | 127,024,551 | — | — | 127,024,551 | ||||||||||||
|
|
|
|
|
|
|
| |||||||||
| Total Investments in Securities and Other Financial Instruments | $ | 5,883,379,637 | $ | 2,236,188,923 | $ | — | $ | 8,119,568,560 | ||||||||
|
|
|
|
|
|
|
| |||||||||
| 18 | MainStay Marketfield Fund | The notes to the financial statements are an integral part of, and should be read in conjunction with, the financial statements. |
Liability Valuation Inputs
Description | Quoted (Level 1) | Significant (Level 2) | Significant (Level 3) | Total | ||||||||||||
| Investments in Securities Sold Short (a) | ||||||||||||||||
| Common Stocks Sold Short | ||||||||||||||||
Aerospace & Defense | $ | (116,778,191 | ) | $ | (92,285,755 | ) | $ | — | $ | (209,063,946 | ) | |||||
Food Products | — | (168,645,187 | ) | — | (168,645,187 | ) | ||||||||||
Insurance | — | (148,180,514 | ) | — | (148,180,514 | ) | ||||||||||
All Other Industries | (39,034,004 | ) | — | — | (39,034,004 | ) | ||||||||||
|
|
|
|
|
|
|
| |||||||||
| Total Common Stocks Sold Short | (155,812,195 | ) | (409,111,456 | ) | — | (564,923,651 | ) | |||||||||
|
|
|
|
|
|
|
| |||||||||
| Exchange-Traded Fund Sold Short | (329,716,839 | ) | — | — | (329,716,839 | ) | ||||||||||
|
|
|
|
|
|
|
| |||||||||
| Total Investments in Securities Sold Short | (485,529,034 | ) | (409,111,456 | ) | — | (894,640,490 | ) | |||||||||
|
|
|
|
|
|
|
| |||||||||
| Other Financial Instruments | ||||||||||||||||
Futures Contracts Short (b) | (63,056,785 | ) | — | — | (63,056,785 | ) | ||||||||||
Credit Default Swap Contracts (b) | — | (4,684,130 | ) | — | (4,684,130 | ) | ||||||||||
|
|
|
|
|
|
|
| |||||||||
| Total Other Financial Instruments | (63,056,785 | ) | (4,684,130 | ) | — | (67,740,915 | ) | |||||||||
|
|
|
|
|
|
|
| |||||||||
| Total Investments in Securities Sold Short and Other Financial Instruments | $ | (548,585,819 | ) | $ | (413,795,586 | ) | $ | — | $ | (962,381,405 | ) | |||||
|
|
|
|
|
|
|
| |||||||||
| (a) | For a complete listing of investments and their industries, see the Portfolio of Investments. |
| (b) | The value listed for these securities reflects unrealized appreciation (depreciation) as shown on the Portfolio of Investments. |
The Fund recognizes transfers between the levels as of the beginning of the period.
As of December 31, 2014, certain foreign equity securities with a market value of $969,484,619 held by the Fund at December 31, 2013 transferred from Level 1 to Level 2 due to these securities being fair valued at year end by applying factors provided by a third party vendor in accordance with the Fund’s valuation policies and procedures. (See Note 2)
As of December 31, 2014, the Fund did not hold any investments with significant unobservable inputs (Level 3). (See Note 2)
| The notes to the financial statements are an integral part of, and should be read in conjunction with, the financial statements. | 19 |
Statement of Assets and Liabilities as of December 31, 2014
| Assets | ||||
Investment in securities, at value (identified cost $7,315,243,818) | $ | 8,112,427,040 | ||
Cash collateral on deposit at broker | 1,284,240,001 | |||
Cash | 671,279,859 | |||
Receivables: | ||||
Investment securities sold | 214,075,525 | |||
Dividends and interest | 32,633,391 | |||
Fund shares sold | 10,182,061 | |||
Premiums paid for swap contracts | 11,410,860 | |||
Other assets | 222,944 | |||
|
| |||
Total assets | 10,336,471,681 | |||
|
| |||
| Liabilities | ||||
Investments sold short (proceeds $922,505,796) | 894,640,490 | |||
Cash denominated in foreign currencies, due to brokers (identified cost $5,775,826) | 5,890,285 | |||
Cash denominated in foreign currencies, due to custodian (identified cost $1,206,604) | 1,206,102 | |||
Payables: | ||||
Investment securities purchased | 175,135,749 | |||
Fund shares redeemed | 172,525,547 | |||
Unrealized depreciation on futures contracts (a) | 55,915,265 | |||
Manager (See Note 3) | 12,378,016 | |||
Transfer agent (See Note 3) | 2,994,170 | |||
NYLIFE Distributors (See Note 3) | 1,134,777 | |||
Broker fees and charges on short sales | 720,726 | |||
Shareholder communication | 470,745 | |||
Professional fees | 114,804 | |||
Custodian | 59,758 | |||
Trustees | 9,845 | |||
Unrealized depreciation on swap contracts | 4,684,130 | |||
Accrued expenses | 1,739 | |||
|
| |||
Total liabilities | 1,327,882,148 | |||
|
| |||
Net assets | $ | 9,008,589,533 | ||
|
| |||
| Composition of Net Assets | ||||
Shares of beneficial interest outstanding (par value of $.001 per share) unlimited number of shares authorized | $ | 556,276 | ||
Additional paid-in capital | 9,054,536,482 | |||
|
| |||
| 9,055,092,758 | ||||
Net investment loss | (116,113 | ) | ||
Accumulated net realized gain (loss) on investments, investments sold short, futures transactions, written options, swap transactions and foreign currency transactions | (808,351,098 | ) | ||
Net unrealized appreciation (depreciation) on investments, futures contracts and swap contracts | 736,583,827 | |||
Net unrealized appreciation (depreciation) on investments sold short | 27,865,306 | |||
Net unrealized appreciation (depreciation) on translation of other assets and liabilities in foreign currencies | (2,485,147 | ) | ||
|
| |||
Net assets | $ | 9,008,589,533 | ||
|
| |||
Class A | ||||
Net assets applicable to outstanding shares | $ | 793,298,657 | ||
|
| |||
Shares of beneficial interest outstanding | 49,085,468 | |||
|
| |||
Net asset value per share outstanding | $ | 16.16 | ||
Maximum sales charge (5.50% of offering price) | 0.94 | |||
|
| |||
Maximum offering price per share outstanding | $ | 17.10 | ||
|
| |||
Investor Class | ||||
Net assets applicable to outstanding shares | $ | 14,975,241 | ||
|
| |||
Shares of beneficial interest outstanding | 926,668 | |||
|
| |||
Net asset value per share outstanding | $ | 16.16 | ||
Maximum sales charge (5.50% of offering price) | 0.94 | |||
|
| |||
Maximum offering price per share outstanding | $ | 17.10 | ||
|
| |||
Class C | ||||
Net assets applicable to outstanding shares | $ | 1,003,834,878 | ||
|
| |||
Shares of beneficial interest outstanding | 63,157,514 | |||
|
| |||
Net asset value and offering price per share outstanding | $ | 15.89 | ||
|
| |||
Class I | ||||
Net assets applicable to outstanding shares | $ | 7,062,935,130 | ||
|
| |||
Shares of beneficial interest outstanding | 434,878,076 | |||
|
| |||
Net asset value and offering price per share outstanding | $ | 16.24 | ||
|
| |||
Class R2 | ||||
Net assets applicable to outstanding shares | $ | 12,426,299 | ||
|
| |||
Shares of beneficial interest outstanding | 771,240 | |||
|
| |||
Net asset value and offering price per share outstanding | $ | 16.11 | ||
|
| |||
Class R6 | ||||
Net assets applicable to outstanding shares | $ | 6,364,598 | ||
|
| |||
Shares of beneficial interest outstanding | 391,199 | |||
|
| |||
Net asset value and offering price per share outstanding | $ | 16.27 | ||
|
| |||
Class P | ||||
Net assets applicable to outstanding shares | $ | 114,754,730 | ||
|
| |||
Shares of beneficial interest outstanding | 7,065,895 | |||
|
| |||
Net asset value and offering price per share outstanding | $ | 16.24 | ||
|
|
| (a) | Represents the difference between the value of the contracts at the time they were opened and the value as of December 31, 2014. Margin payments are not paid or received daily. |
| 20 | MainStay Marketfield Fund | The notes to the financial statements are an integral part of, and should be read in conjunction with, the financial statements. |
Statement of Operations for the year ended December 31, 2014
| Investment Income (Loss) | ||||
Income | ||||
Dividends (a) | $ | 243,237,606 | ||
Interest | 26,438,244 | |||
|
| |||
Total income | 269,675,850 | |||
|
| |||
Expenses | ||||
Manager (See Note 3) | 250,598,258 | |||
Dividends on investments sold short | 120,932,442 | |||
Broker fees and charges on short sales | 35,026,231 | |||
Distribution/Service—Class A (See Note 3) | 4,129,299 | |||
Distribution/Service—Investor Class | 38,835 | |||
Distribution/Service—Class C (See Note 3) | 16,206,336 | |||
Distribution/Service—Class R2 (See Note 3) | 49,924 | |||
Transfer agent (See Note 3) | 19,863,367 | |||
Registration | 2,001,971 | |||
Shareholder communication | 1,625,429 | |||
Professional fees | 889,423 | |||
Custodian | 822,854 | |||
Trustees | 327,377 | |||
Shareholder service—Class R2 (See Note 3) | 19,970 | |||
Miscellaneous | 421,054 | |||
|
| |||
Total expenses | 452,952,770 | |||
|
| |||
Net investment income (loss) | (183,276,920 | ) | ||
|
| |||
| Realized and Unrealized Gain (Loss) on Investments, Futures Contracts, Written Options, Swap Contracts and Foreign Currency Transactions | ||||
Net realized gain (loss) on: | ||||
Investment transactions | 415,232,764 | |||
Investments sold short | (669,011,410 | ) | ||
Futures transactions | (372,319,654 | ) | ||
Written option transactions | 61,064,190 | |||
Swap transactions | (30,438,154 | ) | ||
Foreign currency transactions | (2,104,930 | ) | ||
Net increase from payment by affiliates (Note 3) | 1,282,342 | |||
|
| |||
Net realized gain (loss) on investments, investments sold short, futures transactions, written option transactions, swap transactions and foreign currency transactions | (596,294,852 | ) | ||
|
| |||
Net change in unrealized appreciation (depreciation) on: | ||||
Investments | (1,777,494,244 | ) | ||
Investments sold short | 308,650,432 | |||
Futures contracts | (82,011,397 | ) | ||
Swap contracts | (4,072,756 | ) | ||
Translation of other assets and liabilities in foreign currencies | (2,574,486 | ) | ||
|
| |||
Net change in unrealized appreciation (depreciation) on investments, investments sold short, futures contracts, swap contracts and foreign currency transactions | (1,557,502,451 | ) | ||
|
| |||
Net realized and unrealized gain (loss) on investments, investments sold short, futures transactions, written options, swap transactions and foreign currency transactions | (2,153,797,303 | ) | ||
|
| |||
Net increase (decrease) in net assets resulting from operations | $ | (2,337,074,223 | ) | |
|
| |||
| (a) | Dividends recorded net of foreign withholding taxes in the amount of $11,674,553. |
| The notes to the financial statements are an integral part of, and should be read in conjunction with, the financial statements. | 21 |
Statements of Changes in Net Assets
for the years ended December 31, 2014 and December 31, 2013
| 2014 | 2013 | |||||||
| Increase (Decrease) in Net Assets | ||||||||
Operations: | ||||||||
Net investment income (loss) | $ | (183,276,920 | ) | $ | (160,390,429 | ) | ||
Net realized gain (loss) on investments, investments sold short, futures transactions, written option transactions, swap transactions and foreign currency transactions | (596,294,852 | ) | (155,701,363 | ) | ||||
Net change in unrealized appreciation (depreciation) on investments, investments sold short, futures contracts, swap contracts and foreign currency transactions | (1,557,502,451 | ) | 1,929,726,445 | |||||
|
| |||||||
Net increase (decrease) in net assets resulting from operations | (2,337,074,223 | ) | 1,613,634,653 | |||||
|
| |||||||
Dividends to shareholders: | ||||||||
From net investment income: | ||||||||
Class A | — | (185,252 | ) | |||||
Investor Class | — | (1,320 | ) | |||||
Class C | — | (172,240 | ) | |||||
Class I | — | (1,727,880 | ) | |||||
Class R2 | — | (1,849 | ) | |||||
Class R6 | — | (256 | ) | |||||
Class P | — | (20,583 | ) | |||||
|
| |||||||
Total dividends to shareholders | — | (2,109,380 | ) | |||||
|
| |||||||
Capital share transactions: | ||||||||
Net proceeds from sale of shares | 6,666,498,811 | 15,259,206,171 | ||||||
Net asset value of shares issued to shareholders in reinvestment of dividends | — | 1,639,832 | ||||||
Cost of shares redeemed | (14,717,080,134 | ) | (1,883,248,334 | ) | ||||
|
| |||||||
Increase (decrease) in net assets derived from capital share transactions | (8,050,581,323 | ) | 13,377,597,669 | |||||
|
| |||||||
Net increase (decrease) in net assets | (10,387,655,546 | ) | 14,989,122,942 | |||||
| Net Assets | ||||||||
Beginning of year | 19,396,245,079 | 4,407,122,137 | ||||||
|
| |||||||
End of year | $ | 9,008,589,533 | $ | 19,396,245,079 | ||||
|
| |||||||
Net investment loss at end of year | $ | (116,113 | ) | $ | (22,363,209 | ) | ||
|
| |||||||
| 22 | MainStay Marketfield Fund | The notes to the financial statements are an integral part of, and should be read in conjunction with, the financial statements. |
Financial Highlights selected per share data and ratios
| Year ended December 31, | October 5, 2012** through December 31, | |||||||||||
| Class A | 2014 | 2013 | 2012 | |||||||||
Net asset value at beginning of period | $ | 18.47 | $ | 15.84 | $ | 15.80 | † | |||||
|
|
|
|
|
| |||||||
Net investment income (loss) (a) | (0.20 | ) | (0.28 | ) | (0.04 | ) | ||||||
Net realized and unrealized gain (loss) on investments | (2.11 | ) | 2.91 | 0.15 | ||||||||
Net realized and unrealized gain (loss) on foreign currency transactions | (0.00 | )‡ | 0.00 | ‡ | — | |||||||
|
|
|
|
|
| |||||||
Total from investment operations | (2.31 | ) | 2.63 | 0.11 | ||||||||
|
|
|
|
|
| |||||||
| Less dividends and distributions: | ||||||||||||
From net investment income | — | (0.00 | )‡ | — | ||||||||
From net realized gain on investments | — | — | (0.07 | ) | ||||||||
|
|
|
|
|
| |||||||
Total dividends and distributions | — | (0.00 | )‡ | (0.07 | ) | |||||||
|
|
|
|
|
| |||||||
Net asset value at end of period | $ | 16.16 | $ | 18.47 | $ | 15.84 | ||||||
|
|
|
|
|
| |||||||
Total investment return | (12.51 | %) | 16.60 | % (b) | 0.72 | % (c)(d) | ||||||
| Ratios of expenses to average net assets (e): | ||||||||||||
Before waivers/reimbursements of expenses | 2.65 | % | 2.87 | % | 4.07 | % †† | ||||||
Excluding dividends and interest expense on short positions | 1.78 | % | 1.78 | % | 1.80 | % †† | ||||||
After waivers/reimbursements of expenses | 2.65 | % | 2.87 | % | 4.07 | % †† | ||||||
Excluding dividends and interest expense on short positions | 1.78 | % | 1.78 | % | 1.80 | % †† | ||||||
| Ratios of net investment loss to average net assets: | ||||||||||||
Before waivers/reimbursements of expenses (f) | (1.15 | %) | (1.59 | %) | (1.13 | %)†† | ||||||
After waivers/reimbursements of expenses (f) | (1.15 | %) | (1.59 | %) | (1.13 | %)†† | ||||||
Short sale expenses | 0.87 | % | 1.09 | % | 2.27 | % †† | ||||||
Portfolio turnover rate | 98 | % | 32 | % | 66 | % | ||||||
Net assets at end of period (in 000’s) | $ | 793,299 | $ | 1,718,301 | $ | 137,056 | ||||||
| ** | Inception date. |
| † | Based on the net asset value of Class I as of October 5, 2012. |
| †† | Annualized. |
| ‡ | Rounds to less than 0.5 cent per share. |
| (a) | Per share data based on average shares outstanding during the period. |
| (b) | Total investment return may reflect adjustments to conform to generally accepted accounting principles. |
| (c) | Total investment return is not annualized. |
| (d) | Total investment return is calculated exclusive of sales charges and assumes the reinvestment of dividends and distributions. |
| (e) | In addition to the fees and expenses which the Fund bears directly, the Fund indirectly bears a pro-rata share of the fees and expenses of the Exchange-Traded Funds in which it invests. Such indirect expenses are not included in the above expense ratios. |
| (f) | The net investment loss ratios include dividends and interest expense on short positions. |
| The notes to the financial statements are an integral part of, and should be read in conjunction with, the financial statements. | 23 |
Financial Highlights selected per share data and ratios
| Year ended December 31, | October 5, 2012** through December 31, | |||||||||||
| Investor Class | 2014 | 2013 | 2012 | |||||||||
Net asset value at beginning of period | $ | 18.47 | $ | 15.84 | $ | 15.80 | † | |||||
|
|
|
|
|
| |||||||
Net investment income (loss) (a) | (0.19 | ) | (0.28 | ) | (0.04 | ) | ||||||
Net realized and unrealized gain (loss) on investments | (2.12 | ) | 2.91 | 0.15 | ||||||||
Net realized and unrealized gain (loss) on foreign currency transactions | (0.00 | )‡ | 0.00 | ‡ | — | |||||||
|
|
|
|
|
| |||||||
Total from investment operations | (2.31 | ) | 2.63 | 0.11 | ||||||||
|
|
|
|
|
| |||||||
| Less dividends and distributions: | ||||||||||||
From net investment income | — | (0.00 | )‡ | — | ||||||||
From net realized gain on investments | — | — | (0.07 | ) | ||||||||
|
|
|
|
|
| |||||||
Total dividends and distributions | — | (0.00 | )‡ | (0.07 | ) | |||||||
|
|
|
|
|
| |||||||
Net asset value at end of period | $ | 16.16 | $ | 18.47 | $ | 15.84 | ||||||
|
|
|
|
|
| |||||||
Total investment return | (12.51 | %) | 16.60 | % (b) | 0.72 | % (c)(d) | ||||||
| Ratios of expenses to average net assets (e): | ||||||||||||
Before waivers/reimbursements of expenses | 2.61 | % | 2.89 | % | 4.03 | % †† | ||||||
Excluding dividends and interest expense on short positions | 1.78 | % | 1.79 | % | 1.74 | % †† | ||||||
After waivers/reimbursements of expenses | 2.61 | % | 2.89 | % | 4.03 | % †† | ||||||
Excluding dividends and interest expense on short positions | 1.78 | % | 1.79 | % | 1.74 | % †† | ||||||
| Ratios of net investment loss to average net assets: | ||||||||||||
Before waivers/reimbursements of expenses (f) | (1.10 | %) | (1.59 | %) | (1.06 | %)†† | ||||||
After waivers/reimbursements of expenses (f) | (1.10 | %) | (1.59 | %) | (1.06 | %)†† | ||||||
Short sale expenses | 0.83 | % | 1.10 | % | 2.29 | % †† | ||||||
Portfolio turnover rate | 98 | % | 32 | % | 66 | % | ||||||
Net assets at end of period (in 000’s) | $ | 14,975 | $ | 11,913 | $ | 619 | ||||||
| ** | Inception date. |
| † | Based on the net asset value of Class I as of October 5, 2012. |
| †† | Annualized. |
| ‡ | Rounds to less than 0.5 cent per share. |
| (a) | Per share data based on average shares outstanding during the period. |
| (b) | Total investment return may reflect adjustments to conform to generally accepted accounting principles. |
| (c) | Total investment return is not annualized. |
| (d) | Total investment return is calculated exclusive of sales charges and assumes the reinvestment of dividends and distributions. |
| (e) | In addition to the fees and expenses which the Fund bears directly, the Fund indirectly bears a pro-rata share of the fees and expenses of the Exchange-Traded Funds in which it invests. Such indirect expenses are not included in the above expense ratios. |
| (f) | The net investment loss ratios include dividends and interest expense on short positions. |
| 24 | MainStay Marketfield Fund | The notes to the financial statements are an integral part of, and should be read in conjunction with, the financial statements. |
Financial Highlights selected per share data and ratios
| Year ended December 31, | October 5, 2012** through December 31, | |||||||||||
| Class C | 2014 | 2013 | 2012 | |||||||||
Net asset value at beginning of period | $ | 18.30 | $ | 15.81 | $ | 15.80 | † | |||||
|
|
|
|
|
| |||||||
Net investment income (loss) (a) | (0.33 | ) | (0.41 | ) | (0.07 | ) | ||||||
Net realized and unrealized gain (loss) on investments | (2.08 | ) | 2.90 | 0.15 | ||||||||
Net realized and unrealized gain (loss) on foreign currency transactions | (0.00 | )‡ | 0.00 | ‡ | — | |||||||
|
|
|
|
|
| |||||||
Total from investment operations | (2.41 | ) | 2.49 | 0.08 | ||||||||
|
|
|
|
|
| |||||||
| Less dividends and distributions: | ||||||||||||
From net investment income | — | (0.00 | )‡ | — | ||||||||
From net realized gain on investments | — | — | (0.07 | ) | ||||||||
|
|
|
|
|
| |||||||
Total dividends and distributions | — | (0.00 | )‡ | (0.07 | ) | |||||||
|
|
|
|
|
| |||||||
Net asset value at end of period | $ | 15.89 | $ | 18.30 | $ | 15.81 | ||||||
|
|
|
|
|
| |||||||
Total investment return | (13.17 | %) | 15.75 | % (b) | 0.53 | % (c)(d) | ||||||
| Ratios of expenses to average net assets (e): | ||||||||||||
Before waivers/reimbursements of expenses | 3.38 | % | 3.62 | % | 4.82 | % †† | ||||||
Excluding dividends and interest expense on short positions | 2.53 | % | 2.53 | % | 2.50 | % †† | ||||||
After waivers/reimbursements of expenses | 3.38 | % | 3.62 | % | 4.82 | % †† | ||||||
Excluding dividends and interest expense on short positions | 2.53 | % | 2.53 | % | 2.50 | % †† | ||||||
| Ratio of net investment loss to average net assets: | ||||||||||||
Before waivers/reimbursements of expense (f) | (1.89 | %) | (2.35 | %) | (1.85 | %)†† | ||||||
After waivers/reimbursements of expense (f) | (1.89 | %) | (2.35 | %) | (1.85 | %)†† | ||||||
Short sale expenses | 0.85 | % | 1.09 | % | 2.32 | % †† | ||||||
Portfolio turnover rate | 98 | % | 32 | % | 66 | % | ||||||
Net assets at end of period (in 000’s) | $ | 1,003,835 | $ | 1,582,396 | $ | 124,430 | ||||||
| ** | Inception date. |
| † | Based on the net asset value of Class I as of October 5, 2012. |
| †† | Annualized. |
| ‡ | Rounds to less than 0.5 cent per share. |
| (a) | Per share data based on average shares outstanding during the period. |
| (b) | Total investment return may reflect adjustments to conform to generally accepted accounting principles. |
| (c) | Total investment return is not annualized. |
| (d) | Total investment return is calculated exclusive of sales charges and assumes the reinvestment of dividends and distributions. |
| (e) | In addition to the fees and expenses which the Fund bears directly, the Fund indirectly bears a pro-rata share of the fees and expenses of the Exchange-Traded Funds in which it invests. Such indirect expenses are not included in the above expense ratios. |
| (f) | The net investment loss ratios include dividends and interest expense on short positions. |
| The notes to the financial statements are an integral part of, and should be read in conjunction with, the financial statements. | 25 |
Financial Highlights selected per share data and ratios
| Year ended December 31, | ||||||||||||||||||||
| Class I | 2014 | 2013 | 2012 | 2011* | 2010* | |||||||||||||||
Net asset value at beginning of year | $ | 18.51 | $ | 15.84 | $ | 14.02 | $ | 13.52 | $ | 11.84 | ||||||||||
|
|
|
|
|
|
|
|
|
| |||||||||||
Net investment income (loss) | (0.16 | )(a) | (0.23 | )(a) | (0.06 | )(a) | (0.11 | ) | (0.04 | ) | ||||||||||
Net realized and unrealized gain (loss) on investments | (2.11 | ) | 2.90 | 1.96 | 0.61 | 1.75 | ||||||||||||||
Net realized and unrealized gain (loss) on foreign currency transactions | (0.00 | )‡ | 0.00 | ‡ | (0.01 | ) | — | (b) | — | (b) | ||||||||||
|
|
|
|
|
|
|
|
|
| |||||||||||
Total from investment operations | (2.27 | ) | 2.67 | 1.89 | 0.50 | 1.71 | ||||||||||||||
|
|
|
|
|
|
|
|
|
| |||||||||||
| Less dividends and distributions: | ||||||||||||||||||||
From net investment income | — | (0.00 | )‡ | — | — | (0.01 | ) | |||||||||||||
From net realized gain on investments | — | — | (0.07 | ) | — | (0.02 | ) | |||||||||||||
|
|
|
|
|
|
|
|
|
| |||||||||||
Total dividends and distributions | — | (0.00 | )‡ | (0.07 | ) | — | (0.03 | ) | ||||||||||||
|
|
|
|
|
|
|
|
|
| |||||||||||
Redemption fee | — | — | — | 0.00 | ‡ | 0.00 | ‡ | |||||||||||||
|
|
|
|
|
|
|
|
|
| |||||||||||
Net asset value at end of year | $ | 16.24 | $ | 18.51 | $ | 15.84 | $ | 14.02 | $ | 13.52 | ||||||||||
|
|
|
|
|
|
|
|
|
| |||||||||||
Total investment return (c) | (12.26 | %)(d) | 16.86 | %(d) | 13.50 | % | 3.70 | % | 14.32 | % | ||||||||||
| Ratios of expenses to average net assets (e): | ||||||||||||||||||||
Before waivers/reimbursements and recoupments of expenses | 2.39 | % | 2.60 | % | 2.86 | % | 2.42 | % | 2.35 | % | ||||||||||
Excluding dividends and interest expense on short positions | 1.53 | % | 1.52 | % | 1.53 | % | 1.55 | % | 1.64 | % | ||||||||||
After waivers/reimbursements and recoupments of expenses | 2.39 | % | 2.60 | % | 2.86 | % | 2.43 | % | 2.46 | % | ||||||||||
Excluding dividends and interest expense on short positions | 1.53 | % | 1.52 | % | 1.53 | % | 1.56 | % | 1.75 | % | ||||||||||
| Ratio of net investment loss to average net assets: | ||||||||||||||||||||
Before waivers/reimbursements and recoupments of expenses (f) | (0.90 | %) | (1.33 | %) | (1.28 | %) | (1.06 | %) | (0.25 | %) | ||||||||||
After waivers/reimbursements and recoupments of expenses (f) | (0.90 | %) | (1.33 | %) | (1.28 | %) | (1.07 | %) | (0.36 | %) | ||||||||||
Short sale expenses | 0.86 | % | 1.08 | % | 1.33 | % | 0.87 | % | 0.71 | % | ||||||||||
Portfolio turnover rate | 98 | % | 32 | % | 66 | % | 138 | % | 159 | % | ||||||||||
Net assets at end of year (in 000’s) | $ | 7,062,935 | $15,867,200 | $ | 4,144,927 | $ | 888,782 | $433,921 | ||||||||||||
| * | These periods were audited by a predecessor audit firm whose opinion was unqualified. |
| ‡ | Rounds to less than 0.5 cent per share. |
| (a) | Per share data based on average shares outstanding during the year. |
| (b) | This information was not separately reported and part of realized unrealized gain (loss). |
| (c) | Total investment return is calculated exclusive of sales charges and assumes the reinvestment of dividends and distributions. Class I shares are not subject to sales charges. |
| (d) | Total investment return may reflect adjustments to conform to generally accepted accounting principles. |
| (e) | In addition to the fees and expenses which the Fund bears directly, the Fund indirectly bears a pro-rata share of the fees and expenses of the Exchange-Traded Funds in which it invests. Such indirect expenses are not included in the above expense ratios. |
| (f) | The net investment loss ratios include dividends and interest expense on short positions. |
| 26 | MainStay Marketfield Fund | The notes to the financial statements are an integral part of, and should be read in conjunction with, the financial statements. |
Financial Highlights selected per share data and ratios
| Year ended December 31, | October 5, 2012** through December 31, | |||||||||||
| Class R2 | 2014 | 2013 | 2012 | |||||||||
Net asset value at beginning of period | $ | 18.44 | $ | 15.82 | $ | 15.80 | † | |||||
|
|
|
|
|
| |||||||
Net investment income (loss) (a) | (0.22 | ) | (0.32 | ) | (0.06 | ) | ||||||
Net realized and unrealized gain (loss) on investments | (2.11 | ) | 2.94 | 0.15 | ||||||||
Net realized and unrealized gain (loss) on foreign currency transactions | (0.00 | )‡ | 0.00 | ‡ | — | |||||||
|
|
|
|
|
| |||||||
Total from investment operations | (2.33 | ) | 2.62 | 0.09 | ||||||||
|
|
|
|
|
| |||||||
| Less dividends and distributions: | ||||||||||||
From net investment income | — | (0.00 | )‡ | — | ||||||||
From net realized gain on investments | — | — | (0.07 | ) | ||||||||
|
|
|
|
|
| |||||||
Total dividends and distributions | — | (0.00 | )‡ | (0.07 | ) | |||||||
|
|
|
|
|
| |||||||
Net asset value at end of period | $ | 16.11 | $ | 18.44 | $ | 15.82 | ||||||
|
|
|
|
|
| |||||||
Total investment return (b) | (12.64 | %) | 16.56 | %(c) | 0.59 | %(d) | ||||||
| Ratios of expenses to average net assets (e): | ||||||||||||
Before waivers/reimbursements of expenses | 2.76 | % | 2.99 | % | 3.83 | % †† | ||||||
Excluding dividends and interest expense on short positions | 1.88 | % | 1.89 | % | 1.89 | % †† | ||||||
After waivers/reimbursements of expenses | 2.76 | % | 2.99 | % | 3.83 | % †† | ||||||
Excluding dividends and interest expense on short positions | 1.88 | % | 1.89 | % | 1.89 | % †† | ||||||
| Ratio of net investment loss to average net assets: | ||||||||||||
Before waivers/reimbursements of expenses (f) | (1.24 | %) | (1.80 | %) | (1.56 | %)†† | ||||||
After waivers/reimbursements of expenses (f) | (1.24 | %) | (1.80 | %) | (1.56 | %)†† | ||||||
Short sale expenses | 0.88 | % | 1.10 | % | 1.94 | % †† | ||||||
Portfolio turnover rate | 98 | % | 32 | % | 66 | % | ||||||
Net assets at end of period (in 000’s) | $ | 12,426 | $ | 17,234 | $ | 90 | ||||||
| ** | Inception date. |
| † | Based on the net asset value of Class I as of October 5, 2012. |
| †† | Annualized. |
| ‡ | Rounds to less than 0.5 cent per share. |
| (a) | Per share data based on average shares outstanding during the period. |
| (b) | Total investment return is calculated exclusive of sales charges and assumes the reinvestment of dividends and distributions. Class R2 shares are not subject to sales charges. |
| (c) | Total investment return may reflect adjustments to conform to generally accepted accounting principles. |
| (d) | Total investment return is not annualized. |
| (e) | In addition to the fees and expenses which the Fund bears directly, the Fund indirectly bears a pro-rata share of the fees and expenses of the Exchange-Traded Funds in which it invests. Such indirect expenses are not included in the above expense ratios. |
| (f) | The net investment loss ratios include dividends and interest expense on short positions. |
| The notes to the financial statements are an integral part of, and should be read in conjunction with, the financial statements. | 27 |
Financial Highlights selected per share data and ratios
| Class R6 | Year ended December 31, 2014 | June 17, 2013** through December 31, 2013 | ||||||
Net asset value at beginning of period | $ | 18.53 | $ | 17.08 | † | |||
|
|
|
| |||||
Net investment income (loss) (a) | (0.13 | ) | (0.10 | ) | ||||
Net realized and unrealized gain (loss) on investments | (2.13 | ) | 1.55 | |||||
Net realized and unrealized gain (loss) on foreign currency transactions | (0.00 | )‡ | 0.00 | ‡ | ||||
|
|
|
| |||||
Total from investment operations | (2.26 | ) | 1.45 | |||||
|
|
|
| |||||
| Less dividends: | ||||||||
From net investment income | — | (0.00 | )‡ | |||||
|
|
|
| |||||
Net asset value at end of period | $ | 16.27 | $ | 18.53 | ||||
|
|
|
| |||||
Total investment return (b)(c) | (12.20 | %) | 8.49 | %(d) | ||||
| Ratios of expenses to average net assets (e): | ||||||||
Before waivers/reimbursements of expenses | 2.34 | % | 2.66 | % †† | ||||
Excluding dividends and interest expense on short positions | 1.42 | % | 1.44 | % †† | ||||
After waivers/reimbursements of expenses | 2.34 | % | 2.66 | % †† | ||||
Excluding dividends and interest expense on short positions | 1.42 | % | 1.44 | % †† | ||||
| Ratio of net investment loss to average net assets: | ||||||||
Before waivers/reimbursements of expenses (f) | (0.75 | %) | (1.04 | %)†† | ||||
After waivers/reimbursements of expenses (f) | (0.75 | %) | (1.04 | %)†† | ||||
Short sale expenses | 0.92 | % | 1.22 | % †† | ||||
Portfolio turnover rate | 98 | % | 32 | % | ||||
Net assets at end of period (in 000’s) | $ | 6,365 | $ | 1,957 | ||||
| ** | Inception date. |
| † | Based on the net asset value of Class I as of June 17, 2013. |
| †† | Annualized. |
| ‡ | Rounds to less than 0.5 cent per share. |
| (a) | Per share data based on average shares outstanding during the period. |
| (b) | Total investment return is calculated exclusive of sales charges and assumes the reinvestment of dividends and distributions. Class R6 shares are not subject to sales charges. |
| (c) | Total investment return may reflect adjustments to conform to generally accepted accounting principles. |
| (d) | Total investment return is not annualized. |
| (e) | In addition to the fees and expenses which the Fund bears directly, the Fund indirectly bears a pro-rata share of the fees and expenses of the Exchange-Traded Funds in which it invests. Such indirect expenses are not included in the above expense ratios. |
| (f) | The net investment loss ratios include dividends and interest expense on short positions. |
| 28 | MainStay Marketfield Fund | The notes to the financial statements are an integral part of, and should be read in conjunction with, the financial statements. |
Financial Highlights selected per share data and ratios
| Class P | Year ended December 31, 2014 | May 31, 2013** through December 31, 2013 | ||||||
Net asset value at beginning of period | $ | 18.51 | $ | 17.01 | † | |||
|
|
|
| |||||
Net investment income (loss) (a) | (0.16 | ) | (0.15 | ) | ||||
Net realized and unrealized gain (loss) on investments | (2.11 | ) | 1.65 | |||||
Net realized and unrealized gain (loss) on foreign currency transactions | (0.00 | )‡ | 0.00 | ‡ | ||||
|
|
|
| |||||
Total from investment operations | (2.27 | ) | 1.50 | |||||
|
|
|
| |||||
| Less dividends: | ||||||||
From net investment income | — | (0.00 | )‡ | |||||
|
|
|
| |||||
Net asset value at end of period | $ | 16.24 | $ | 18.51 | ||||
|
|
|
| |||||
Total investment return (b) | (12.26 | %) | 8.82 | % (c)(d) | ||||
| Ratios of expenses to average net assets (e): | ||||||||
Before waivers/reimbursements of expenses | 2.41 | % | 2.58 | % †† | ||||
Excluding dividends and interest expense on short positions | 1.54 | % | 1.54 | % †† | ||||
After waivers/reimbursements of expenses | 2.41 | % | 2.58 | % †† | ||||
Excluding dividends and interest expense on short positions | 1.54 | % | 1.54 | % †† | ||||
| Ratio of net investment loss to average net assets: | ||||||||
Before waivers/reimbursements of expenses (f) | (0.91 | %) | (1.46 | %)†† | ||||
After waivers/reimbursements of expenses (f) | (0.91 | %) | (1.46 | %)†† | ||||
Short sale expenses | 0.87 | % | 1.04 | % †† | ||||
Portfolio turnover rate | 98 | % | 32 | % | ||||
Net assets at end of period (in 000’s) | $ | 114,755 | $ | 197,245 | ||||
| ** | Inception date. |
| † | Based on the net asset value of Class I as of May 31, 2013. |
| †† | Annualized. |
| ‡ | Rounds to less than 0.5 cent per share. |
| (a) | Per share data based on average shares outstanding during the period. |
| (b) | Total investment return is calculated exclusive of sales charges and assumes the reinvestment of dividends and distributions. Class P shares are not subject to sales charges. |
| (c) | Total investment return may reflect adjustments to conform to generally accepted accounting principles. |
| (d) | Total investment return is not annualized. |
| (e) | In addition to the fees and expenses which the Fund bears directly, the Fund indirectly bears a pro-rata share of the fees and expenses of the Exchange Traded Funds in which it invests. Such indirect expenses are not included in the above expense ratios. |
| (f) | The net investment loss ratios include dividends and interest expense on short positions. |
| The notes to the financial statements are an integral part of, and should be read in conjunction with, the financial statements. | 29 |
Note 1–Organization and Business
MainStay Funds Trust (the “Trust”) was organized as a Delaware statutory trust on April 28, 2009, and is governed by a Declaration of Trust. The Trust is registered under the Investment Company Act of 1940, as amended (the “1940 Act”), as an open-end management investment company, and is comprised of thirty-eight funds (collectively referred to as the “Funds”). These financial statements and notes relate to the MainStay Marketfield Fund (the “Fund”), a “diversified” fund, as that term is defined in the 1940 Act, as interpreted or modified by regulatory authorities having jurisdiction, from time to time. The Fund is successor to Marketfield Fund (the “Predecessor Fund”), which was a series of a different registered investment company with different principal investment strategies and a different investment process, for which Marketfield Asset Management, LLC, a New York limited liability company and the predecessor entity to the Fund’s Subadvisor (as defined in Note 3(A)), served as investment adviser. The financial statements of the Fund reflect the historical results of the Predecessor Fund prior to its reorganization on October 5, 2012. Upon the completion of the reorganization, the Class I shares of the Fund assumed the performance, financial and other information of the Predecessor Fund. All information and references to periods prior to October 5, 2012 refer to the Predecessor Fund.
The Fund currently offers seven classes of shares. Class A, Investor Class, Class C and Class R2 shares commenced operations on October 5, 2012. Class I shares commenced operations on July 31, 2007. Class R6 shares commenced operations on June 17, 2013. Class P shares commenced operations on May 31, 2013. Class A and Investor Class shares are offered at net asset value (“NAV”) per share plus an initial sales charge. No sales charge applies to investments of $1 million or more (and certain other qualified purchases) in Class A and Investor Class shares, but a contingent deferred sales charge (“CDSC”) is imposed on certain redemptions of such shares made within one year of the date of purchase. Class C shares are offered at NAV without an initial sales charge, although a 1.00% CDSC may be imposed on redemptions made within one year of the date of purchase of Class C shares. Class I, Class R2, Class R6, and Class P shares are offered at NAV and are not subject to a sales charge. Depending upon eligibility, Class A shares may convert to Investor Class shares and Investor Class shares may convert to Class A shares. The seven classes of shares have the same voting (except for issues that relate solely to one class), dividend, liquidation and other rights, and the same terms and conditions, except that Class C shares are subject to higher distribution and/or service fee rates than Class A, Investor Class and Class R2 shares under a distribution plan pursuant to Rule 12b-1 under the 1940 Act. Class I, Class R6, and Class P shares are not subject to a distribution and/or service fee. Class R2 shares are subject to a shareholder service fee. This is in addition to any fees paid under a distribution plan, where applicable.
The Fund’s investment objective is to seek capital appreciation.
Note 2–Significant Accounting Policies
The Fund is an investment company and accordingly follows the investment company accounting and reporting guidance of the Financial Accounting Standards Board (FASB) Accounting Standard Codification Topic 946 Financial Services—Investment Companies. The Fund prepares its financial statements in accordance with generally accepted
accounting principles (“GAAP”) in the United States of America and follows the significant accounting policies described below.
(A) Securities Valuation. Investments are valued as of the close of regular trading on the New York Stock Exchange (“Exchange”) (generally 4:00 p.m. Eastern time) on each day the Fund is open for business (“valuation date”).
The Board of Trustees (the “Board”) adopted procedures establishing methodologies for the valuation of the Fund’s securities and delegated the responsibility for valuation determinations under those procedures to the Valuation Committee of the Fund (the “Valuation Committee”). The Board authorized the Valuation Committee to appoint a Valuation Sub-Committee (the “Sub-Committee”) to deal in the first instance with establishing the prices of securities for which market quotations are not readily available or the prices of which are not otherwise readily determinable under these procedures. The Sub-Committee meets (in person, via electronic mail or via teleconference) on an as-needed basis. Subsequently, the Valuation Committee meets to ensure that actions taken by the Sub-Committee were appropriate. The procedures recognize that, subject to the oversight of the Board and unless otherwise noted, the responsibility for day-to-day valuation of portfolio assets (including securities for which market prices are not readily available) rests with New York Life Investment Management LLC (“New York Life Investments” or the “Manager”), aided to whatever extent necessary by the Subadvisor (as defined in Note 3(A)) to the Fund.
To assess the appropriateness of security valuations, the Manager or the Fund’s third party service provider, who is subject to oversight by the Manager, regularly compares prior day prices, prices on comparable securities, and the sale prices to the prior and current day prices and challenges prices with changes exceeding certain tolerance levels with third party pricing services or broker sources. For those securities valued through either a standardized fair valuation methodology or a fair valuation measurement, the Sub-Committee deals in the first instance with such valuation and the Valuation Committee reviews and affirms the reasonableness of the valuation based on such methodologies and measurements on a regular basis after considering all relevant information that is reasonably available. Any action taken by the Sub-Committee with respect to the valuation of a portfolio security is submitted by the Valuation Committee to the full Board for its review and ratification, if appropriate, at its next regularly scheduled meeting.
“Fair value” is defined as the price the Fund would receive upon selling an asset or liability in an orderly transaction to an independent buyer in the principal or most advantageous market for the asset or liability. Fair value measurements are determined within a framework that establishes a three-tier hierarchy which maximizes the use of observable market data and minimizes the use of unobservable inputs to establish a classification of fair value measurements for disclosure purposes. “Inputs” refer broadly to the assumptions that market participants would use in pricing the asset or liability, including assumptions about risk, such as the risk inherent in a particular valuation technique used to measure fair value using a pricing model and/or the risk inherent in the inputs for the valuation technique. Inputs may be observable or unobservable. Observable inputs reflect the assumptions market participants would use in pricing the asset or liability based on market data obtained from sources independent of the Fund. Unobservable inputs reflect the Fund’s own assumptions about the assumptions market
| 30 | MainStay Marketfield Fund |
participants would use in pricing the asset or liability based on the information available. The inputs or methodology used for valuing assets or liabilities may not be an indication of the risks associated with investing in those assets or liabilities. The three-tier hierarchy of inputs is summarized below.
| • | Level 1—quoted prices in active markets for an identical asset or liability |
| • | Level 2—other significant observable inputs (including quoted prices for a similar asset or liability in active markets, interest rates and yield curves, prepayment speeds, credit risk, etc.) |
| • | Level 3—significant unobservable inputs (including the Fund’s own assumptions about the assumptions that market participants would use in measuring fair value of an asset or liability) |
The aggregate value by input level, as of December 31, 2014, for the Fund’s assets or liabilities is included at the end of the Fund’s Portfolio of Investments.
The Fund may use third party vendor evaluations, whose prices may be derived from one or more of the following standard inputs among others:
• Benchmark Yields | • Reported Trades | |
• Broker Dealer Quotes | • Issuer Spreads | |
• Two-sided markets | • Benchmark securities | |
• Bids/Offers | • Reference Data (corporate actions or material event notices) | |
• Industry and economic events | • Comparable bonds | |
• Monthly payment information | • Equity and credit default swap curves |
An asset or liability for which market values cannot be measured using the methodologies described above is valued by methods deemed reasonable in good faith by the Valuation Committee, following the procedures established by the Board, to represent fair value. Under these procedures, the Fund generally uses a market-based approach which may use related or comparable assets or liabilities, recent transactions, market multiples, book values, and other relevant information. The Fund may also use an income-based valuation approach in which the anticipated future cash flows of the asset or liability are discounted to calculate fair value. Discounts may also be applied due to the nature and/or duration of any restrictions on the disposition of the asset or liability. Due to the inherent valuation uncertainty of such assets or liabilities, fair values may differ significantly from values that would have been used had an active market existed. For the year ended December 31, 2014, there have been no material changes to the fair value methodologies.
Equity and non-equity securities which may be valued in this manner include, but are not limited to: (i) a security for which trading has been halted or suspended; (ii) a debt security that has recently gone into default and for which there is not a current market quotation; (iii) a security of an issuer that has entered into a restructuring; (iv) a security that has been de-listed from a national exchange; (v) a security for which the market price is not readily available from a third party pricing source or, if so provided, does not, in the opinion of the Manager or Subadvisor reflect the security’s market value; (vi) a security subject to
trading collars for which no or limited trading takes place; and (vii) a security whose principal market has been temporarily closed at a time when, under normal conditions, it would be open. Securities for which market quotations or observable inputs are not readily available are generally categorized as Level 3 in the hierarchy. As of December 31, 2014, there were no securities held by the Fund that were fair valued in such a manner.
Certain securities held by the Fund may principally trade in foreign markets. Events may occur between the time that foreign markets close and the time at which the Fund’s NAV is calculated. These events may include, but are not limited to, situations relating to a single issuer in a market sector, significant fluctuations in U.S. or foreign markets, natural disasters, armed conflicts, governmental actions or other developments not tied directly to the securities markets. Should the Manager or Subadvisor conclude that such events may have affected the accuracy of the last price of such securities reported on the local foreign market, the Sub-Committee may, pursuant to procedures adopted by the Board, adjust the value of the local price to reflect the estimated impact on the price of such securities as a result of such events. In this instance, securities are generally categorized as Level 3 in the hierarchy. Additionally, certain foreign equity securities are also fair valued whenever the movement of a particular index exceeds an established threshold. In such cases, the securities are fair valued by applying factors provided by a third party vendor in accordance with valuation procedures adopted by the Board and are generally categorized as Level 2 in the hierarchy. As of December 31, 2014, certain foreign equity securities were fair valued in such a manner.
Equity securities and Exchange-Traded Funds are valued at the last quoted sales prices as of the close of regular trading on the relevant exchange on each valuation date. Securities that are not traded on the valuation date are valued at the mean of the last quoted bid and ask prices. Prices are normally taken from the principal market in which each security trades. Options contracts are valued at the last posted settlement price on the market where such options are primarily traded. Investments in other mutual funds are valued at their respective NAVs as of the close of the Exchange on the valuation date. These securities are generally categorized as Level 1 in the hierarchy.
Investments in Money Market Mutual Funds are valued at their respective NAVs at the close of business each day. Money Market Mutual Funds seek to maintain an NAV of $1.00 per share, although there is no assurance that it will be able to do so on a continuous basis. These securities are generally categorized as Level 1 in the hierarchy.
Temporary cash investments acquired in excess of 60 days to maturity at the time of purchase are valued using the latest bid prices or using valuations based on a matrix system (which considers such factors as security prices, yields, maturities, and ratings), both as furnished by independent pricing services. Other temporary cash investments which mature in 60 days or less at the time of purchase (“Short-Term Investments”) are valued using the amortized cost method of valuation, unless the use of such method would be inappropriate. The amortized cost method involves valuing a security at its cost on the date of purchase and thereafter assuming a constant amortization to maturity of the difference between such cost and the value on maturity date. Amortized cost approximates the current fair value of a security. These securities are generally categorized as Level 2 in the hierarchy.
| 31 |
Notes to Financial Statements (continued)
Futures contracts are valued at the last posted settlement price on the market where such futures are primarily traded. Investments in other mutual funds are valued at their respective NAVs as of the close of the Exchange on the valuation date. These securities are generally categorized as Level 1 in the hierarchy.
Foreign currency forward contracts are valued at their fair market values measured on the basis of the mean between the last current bid and ask prices based on dealer or exchange quotations and are generally categorized as Level 2 in the hierarchy.
Credit default swaps are valued at prices supplied by a pricing agent or brokers selected by the Manager in consultation with the Subadvisor whose prices reflect broker/dealer supplied valuations and electronic data processing techniques. Swaps are marked-to-market daily and the change in value, if any, is recorded as unrealized appreciation or depreciation. These securities are generally categorized as Level 2 in the hierarchy.
Generally, a security is considered illiquid if it cannot be sold or disposed of in the ordinary course of business at approximately the price at which it is valued within seven days. Its illiquidity might prevent the sale of such security at a time when the Manager or Subadvisor might wish to sell, and these securities could have the effect of decreasing the overall level of the Fund’s liquidity. Further, the lack of an established secondary market may make it more difficult to value illiquid securities, requiring the Fund to rely on judgments that may be somewhat subjective in measuring value, which could vary from the amount that the Fund could realize upon disposition. Difficulty in selling illiquid securities may result in a loss or may be costly to the Fund. Under the supervision of the Board, the Manager or Subadvisor measure the liquidity of the Fund’s investments; in doing so, the Manager or Subadvisor may consider various factors, including (i) the frequency of trades and quotations, (ii) the number of dealers and prospective purchasers, (iii) dealer undertakings to make a market, and (iv) the nature of the security and the market in which it trades (e.g., the time needed to dispose of the security, the method of soliciting offers and the mechanics of transfer). Illiquid securities generally will be valued by methods deemed reasonable in good faith in such a manner as the Board deems appropriate to reflect their fair value. As of December 31, 2014, the Fund did not hold any illiquid securities.
(B) Income Taxes. The Fund’s policy is to comply with the requirements of the Internal Revenue Code of 1986, as amended (the “Code”), applicable to regulated investment companies and to distribute all of its taxable income to the shareholders of the Fund within the allowable time limits. Therefore, no federal, state and local income tax provisions are required.
Management evaluates the Fund’s tax positions to determine if the tax positions taken meet the minimum recognition threshold in connection with accounting for uncertainties in income tax positions taken or expected to be taken for the purposes of measuring and recognizing tax liabilities in the financial statements. Recognition of tax benefits of an uncertain tax position is required only when the position is “more likely than not” to be sustained assuming examination by taxing authorities. Management has analyzed the Fund’s tax positions taken on federal, state and local income tax returns for all open tax years (for up to three tax years), and has concluded that no provisions for federal, state and
local income tax are required in the Fund’s financial statements. The Fund’s federal, state and local income and federal excise tax returns for tax years for which the applicable statutes of limitations have not expired are subject to examination by the Internal Revenue Service and state and local departments of revenue.
(C) Foreign Taxes. The Fund may be subject to foreign taxes on income and other transaction-based taxes imposed by certain countries in which it invests. A portion of the taxes on gains on investments or currency purchases/repatriation may be recoverable. The Fund will accrue such taxes and recoveries as applicable, based upon its current interpretation of tax rules and regulations that exist in the markets in which it invests.
The Fund may be subject to taxation on realized capital gains, repatriation proceeds and other transaction-based taxes imposed by certain countries in which it invests. The Fund will accrue such taxes as applicable based upon its current interpretation of tax rules and regulations that exist in the market in which it invests. Capital gains taxes relating to positions still held are reflected as a liability on the Statement of Assets and Liabilities, as well as an adjustment to the Fund’s net unrealized appreciation (depreciation). Taxes related to capital gains realized during the year ended December 31, 2014, if any, are reflected as part of net realized gain (loss) in the Statement of Operations. Changes in tax liabilities related to capital gains taxes on unrealized investment gains, if any, are reflected as part of the change in net unrealized appreciation (depreciation) on investments in the Statement of Operations. Transaction-based charges are generally assessed as a percentage of the transaction amount.
(D) Dividends and Distributions to Shareholders. Dividends and distributions are recorded on the ex-dividend date. The Fund intends to declare and pay dividends from net investment income and distributions from net realized capital and currency gains, if any, at least annually. Unless the shareholder elects otherwise, all dividends and distributions are reinvested in the same class of shares of the Fund, at NAV. Dividends and distributions to shareholders are determined in accordance with federal income tax regulations and may differ from GAAP.
(E) Security Transactions and Investment Income. The Fund records security transactions on the trade date. Realized gains and losses on security transactions are determined using the identified cost method. Dividend income is recognized on the ex-dividend date, net of any foreign tax withheld at the source, and interest income is accrued as earned using the effective interest rate method. Discounts and premiums on Short-Term Investments are accreted and amortized, respectively, on the straight-line method. The straight-line method approximates the effective interest method for short-term investments. Income from payment-in-kind securities is recorded daily based on the effective interest method of accrual.
Investment income and realized and unrealized gains and losses on investments of the Fund are allocated to separate classes of shares pro rata based upon their relative net assets on the date the income is earned or realized and unrealized gains and losses are incurred.
(F) Expenses. Expenses of the Trust are allocated to the individual Funds in proportion to the net assets of the respective Funds when the expenses are incurred, except where direct allocations of expenses can
| 32 | MainStay Marketfield Fund |
be made. Expenses (other than transfer agent expenses and fees incurred under the shareholder services plans and/or the distribution plans further discussed in Note 3(B)) are allocated to separate classes of shares pro rata based upon their relative net assets on the date the expenses are incurred. The expenses borne by the Fund, including those of related parties to the Fund, are shown in the Statement of Operations.
(G) Use of Estimates. In preparing financial statements in conformity with GAAP, management makes estimates and assumptions that affect the reported amounts and disclosures in the financial statements. Actual results could differ from those estimates.
(H) Foreign Currency Transactions. The books and records of the Fund are kept in U.S. dollars. Prices of securities denominated in foreign currency amounts are translated into U.S. dollars at the mean between the buying and selling rates last quoted by any major U.S. bank at the following dates:
| (i) | market value of investment securities, other assets and liabilities—at the valuation date; and |
| (ii) | purchases and sales of investment securities, income and expenses—at the date of such transactions. |
The assets and liabilities that are denominated in foreign currency amounts are presented at the exchange rates and market values at the close of the period. The realized and unrealized changes in net assets arising from fluctuations in exchange rates and market prices of securities are not separately presented.
Net realized gain (loss) on foreign currency transactions represents net gains and losses on foreign currency forward contracts, net currency gains or losses realized as a result of differences between the amounts of securities sale proceeds or purchase cost, dividends, interest and withholding taxes as recorded on the Fund’s books, and the U.S. dollar equivalent amount actually received or paid. Net currency gains or losses from valuing such foreign currency denominated assets and liabilities, other than investments at valuation date exchange rates, are reflected in unrealized foreign exchange gains or losses.
(I) Swap Contracts. The Fund entered into credit default swap contracts (“swaps”) for the purpose of attempting to obtain a desired return at a lower cost to the Fund, rather than directly investing in an instrument yielding that desired return or to hedge against credit and interest rate risk. In a typical swap transaction, two parties agree to exchange the returns (or differentials in rates of returns) earned or realized on a particular investment or instruments. The gross returns to be exchanged or “swapped” between the parties are calculated with respect to a notional amount. The payments may be adjusted for transaction costs, interest payments, the amount of interest paid on the investment or instrument, or other factors. Collateral, in the form of cash or securities, may be required to be held in segregated accounts with the custodian bank or broker in accordance with the terms of the swap. Swaps agreements are privately negotiated in the over the counter market (“OTC swaps”) and may be executed in a multilateral or other trade facilities platform, such as a registered commodities exchange (“centrally cleared swaps”).
Credit default swaps, in particular, are contracts whereby one party makes periodic payments to a counterparty in exchange for the right to
receive a specified return in the event of a default by a third party on its obligation. Such periodic payments are accrued daily and recorded as a realized gain or loss. Credit default swaps may be used to provide a measure of protection against defaults of sovereign or corporate issuers.
Certain standardized swaps, including certain credit default and interest rate swaps, are subject to mandatory clearing, and more types of standardized swaps are expected to be subject to mandatory clearing in the future. The counterparty risk for cleared derivatives is expected to be generally lower than for uncleared derivatives, but cleared contracts are not risk-free. In a cleared derivative transaction, the Fund typically enters into the transaction with a financial institution counterparty, and performance of the transaction is effectively guaranteed by a central clearinghouse, thereby reducing or eliminating the Fund’s exposure to the credit risk of its original counterparty. The Fund will be required to post specified levels of margin with the clearinghouse or at the instruction of the clearinghouse; the margin required by a clearinghouse may be greater than the margin the Fund would be required to post in an uncleared transaction.
Swaps are marked-to-market daily based upon quotations from pricing agents, brokers, or market makers and the change in value, if any, is recorded as unrealized appreciation or depreciation. Any payments made or received upon entering a swap would be amortized or accreted over the life of the swap and recorded as a realized gain or loss. Early termination of a swap is recorded as a realized gain or loss. Daily changes in valuation of centrally cleared swaps, if any, are recorded as a receivable or payable for the change in value as appropriate (“variation margin”) on the Statements of Assets and Liabilities.
The Fund bears the risk of loss of the amount expected to be received under a swap in the event of the default or bankruptcy of the swap counterparty. The Fund may be able to eliminate its exposure under a swap either by assignment or other disposition, or by entering into an offsetting swap with the same party or a similar creditworthy party. Swaps are not actively traded on financial markets. Entering into swaps involves elements of credit, market, and documentation risk in excess of the amounts recognized on the Statement of Assets and Liabilities. Such risks involve the possibilities that there will be no liquid market for these swaps, that the counterparty to the swaps may default on its obligation to perform or disagree as to the meaning of the contractual terms in the swaps and that there may be unfavorable changes in interest rates, the price of the index or the security underlying these transactions.
(J) Securities Sold Short. The Fund engages in sales of securities it does not own (“short sales”) as part of its investment strategy. When the Fund enters into a short sale, it must segregate or maintain with a broker the cash proceeds from the security sold short or other securities as collateral for its obligation to deliver the security upon conclusion of the sale. During the period a short position is open, depending on the nature and type of security, short positions held are reflected as liabilities and are marked to market in accordance with the valuation methodologies previously detailed (See Note 2(A)). Liabilities for securities sold short are closed out by purchasing the applicable securities for delivery to the counterparty broker. A gain, limited to the price at which the Fund sold the security short, or a loss, unlimited as to dollar amount, will be recognized upon termination of a short sale if the market price on the date the short position is closed out is less or
| 33 |
Notes to Financial Statements (continued)
greater, respectively, than the proceeds originally received. Any such gain or loss may be offset, completely or in part, by the change in the value of the hedged investments. Interest on short positions held is accrued daily, while dividends declared on short positions existing on the record date are recorded on the ex-dividend date as a dividend expense in the Statement of Operations. Short sales involve risk of loss in excess of the related amounts reflected in the Statement of Assets and Liabilities.
At December 31, 2014 the Fund maintained collateral for short sales on deposit with Bank of America Merrill Lynch, Barclays Bank PLC, Citibank N.A., Credit Suisse International, and State Street Bank and Trust Company (“State Street”) (the “Brokers”). The Subadvisor (as defined in Note 3(A)) determined, based on information available at the time, that the creditworthiness of each of the Brokers is satisfactory. However, there is no guarantee that the Subadvisor’s determination is correct or will remain accurate. The amount of the Fund’s collateral for short sales on deposit with Brokers was $1,036,478,815, which was in excess of the Fund’s liability for securities sold short in the amount of $894,640,490. The Fund does not require the Brokers to maintain collateral in support of the receivable for proceeds on securities sold short.
(K) Options. The Fund may purchase and write call or put options on securities and indices and enter into related closing transactions. As a holder of a call option, the Fund has the right, but not the obligation, to purchase a security at the exercise price during the exercise period. As the writer of a call option, the Fund has the obligation to sell the security at the exercise price during the exercise period in the event the option is exercised. As a holder of a put option, the Fund has the right, but not the obligation, to sell a security at the exercise price during the exercise period. As the writer of a put option, the Fund has the obligation to buy the underlying security at the exercise price during the exercise period in the event the option is exercised.
The premium that the Fund pays when purchasing a call option or receives when writing a call option will reflect, among other things, the market price of the security, the relationship of the exercise price to the market price of the security, the relationship of the exercise price to the volatility of the security, the length of the option period and supply and demand factors. The premium is the market value of an option at the time of the trade.
When the Fund writes (sells) an option, an amount equal to the premium received by the Fund is included in the Statement of Assets and Liabilities as an equivalent liability. The amount of the liability is subsequently marked to-market to reflect the current value of the option written.
When the Fund purchases an option, the Fund pays a non-refundable premium to the seller (writer) of the option. The Fund includes the premium paid in the Statement of Assets and Liabilities as an equivalent asset. The amount of the asset is subsequently marked to market to reflect the current value of the option purchased. Premiums paid for purchasing options which expire are treated as realized losses. Certain options may be purchased with premiums to be determined on a future date. The premiums for these options are based upon implied volatility parameters at specified terms. The risk associated with purchasing put and call options is limited to the premium paid. Premiums paid for purchasing options which are exercised or closed are added to the
amounts paid or offset against the proceeds on the underlying investment transaction to determine the realized gain or loss when the underlying transaction is sold.
Certain options may expose the Fund to counterparty credit risk. The Fund will not enter into these transactions unless it owns either (1) an offsetting position in securities or other options or (2) cash and liquid assets with a value marked-to market daily, sufficient to cover potential obligations.
The Fund may purchase or write foreign currency options. Purchasing a foreign currency option gives the Fund the right, but not the obligation, to buy or sell a specified amount of the currency at a specified rate of exchange that may be exercised on or before the option’s expiration date. These options may be used as a short or long hedge against possible variations in foreign exchange rates or to gain exposure to foreign currencies.
During the year ended December 31, 2014, the Fund engaged in the following transactions in written options:
Number of Contracts | Premium | |||||||
Options Outstanding at December 31, 2013 | — | $ | — | |||||
Options—Written | 1,579,091 | 131,562,049 | ||||||
Options—Exercised | (94,780 | ) | (11,942,280 | ) | ||||
Options—Canceled in closing transactions | (1,134,311 | ) | (92,869,769 | ) | ||||
Options—Expired | (350,000 | ) | (26,750,000 | ) | ||||
Options Outstanding at | — | — | ||||||
(L) Futures Contracts. A futures contract is an agreement to purchase or sell a specified quantity of an underlying instrument at a specified future date and price, or to make or receive a cash payment based on the value of a financial instrument (e.g., foreign currency, interest rate, security, or securities index). The Fund is subject to market price risk and/or interest rate risk in the normal course of investing in these transactions. During the period the futures contract is open, changes in the value of the contract are recognized as unrealized appreciation or depreciation by marking-to-market such contract on a daily basis to reflect the market value of the contract at the end of each day’s trading. The Fund and broker do not exchange cash flows daily as a result of the daily change in unrealized appreciation or depreciation. When the futures contract is closed, the Fund records a realized gain or loss equal to the difference between the proceeds from (or cost of) the closing transaction and the Fund’s basis in the contract.
The use of futures contracts involves, to varying degrees, elements of market risk in excess of the amount recognized in the Statement of Assets and Liabilities. The contract or notional amounts and variation margin or unrealized appreciation/depreciation reflect the extent of the Fund’s involvement in open futures positions. Risks arise from the possible imperfect correlation in movements in the price of futures contracts, interest rates and the underlying hedged assets, and the possible inability of counterparties to meet the terms of their contracts. However, the Fund’s activities in futures contracts have minimal counterparty risk as they are conducted through regulated exchanges that guarantee the futures against default by the counterparty. In the event of a bankruptcy or insolvency of a futures commission merchant that holds margin and/or cash collateral on behalf of the Fund, the Fund
| 34 | MainStay Marketfield Fund |
may not be entitled to the return of all of the margin and/or cash collateral owed to the Fund, potentially resulting in a loss. The Fund may invest in futures contracts to protect against possible adverse changes in the market value of securities held, to gain long or short exposure to markets/indices, and to manage risks of its assets. The Fund’s investment in futures contracts and other derivatives may increase the volatility of the Fund’s NAV and may result in a loss to the Fund.
(M) Securities Lending. In order to realize additional income, the Fund may engage in securities lending, subject to the limitations set forth in the 1940 Act and relevant guidance by the staff of the Securities and Exchange Commission. In the event the Fund does engage in securities lending, the Fund will lend through its custodian, State Street Bank and Trust Company (“State Street”). State Street will manage the Fund’s cash collateral in accordance with the lending agreement between the Fund and State Street, and indemnify the Fund’s portfolio against counterparty risk. The loans will be collateralized by cash or securities at least equal at all times to the market value of the securities loaned. Collateral will consist of U.S. government securities, cash equivalents or irrevocable letters of credit. The Fund may bear the risk of delay in recovery of, or loss of rights in, the securities loaned should the borrower of the securities experience financial difficulty. The Fund may also record realized gain or loss on securities deemed sold due to a borrower’s inability to return securities on loan. The Fund will receive compensation for lending its securities in the form of fees or the retention of a portion of the interest on the investment of any cash received as collateral. The Fund also will continue to receive interest and dividends on the securities loaned and any gain or loss in the market price of the securities loaned that may occur during the term of the loan will be for the account of the Fund.
Although the Fund and New York Life Investments have temporarily suspended securities lending, the Fund and New York Life Investments reserve the right to reinstitute securities lending at any time without notice when deemed appropriate. The Fund did not have any portfolio securities on loan as of December 31, 2014.
(N) Counterparty Credit Risk. In order to better define its contractual rights and to secure rights that will help the Fund mitigate its counterparty risk, the Fund may enter into an International Swaps and Derivatives Association, Inc. Master Agreement (“ISDA Master Agreement”) or similar agreement with its counterparties. An ISDA Master Agreement is a bilateral agreement between the Fund and a counterparty that governs certain OTC derivatives and typically contains
collateral posting terms and netting provisions. Under an ISDA Master Agreement, the Fund may, under certain circumstances, offset with the counterparty certain derivative financial instrument’s payables and/or receivables with collateral held and/or posted and create one single net payment. The provisions of the ISDA Master Agreement typically permit a single net payment in the event of a default including the bankruptcy or insolvency of the counterparty. Bankruptcy or insolvency laws of a particular jurisdiction may restrict or prohibit the right of offset in bankruptcy, insolvency or other events. In addition, certain ISDA Master Agreements may contain provisions for early termination of OTC derivative transactions in the event the net assets of the Fund decline below specific levels or if the Fund fails to meet the terms of its ISDA Master Agreements. The result would cause the Fund to accelerate payment of any net liability owed to the counterparty.
For financial reporting purposes, the Fund does not offset derivative assets and derivative liabilities that are subject to netting arrangements, if any, in the Statements of Assets and Liabilities.
(O) Indemnifications. Under the Trust’s organizational documents, its officers and trustees are indemnified against certain liabilities that may arise out of performance of their duties to the Trust. Additionally, in the normal course of business, the Fund enters into contracts with third-party service providers that contain a variety of representations and warranties and which may provide general indemnifications. The Fund’s maximum exposure under these arrangements is unknown, as this would involve future claims that may be made against the Fund that have not yet occurred. Based on experience, management is of the view that the risk of loss in connection with these potential indemnification obligations is remote. However, there can be no assurance that material liabilities related to such obligations will not arise in the future, which could adversely impact the Fund.
(P) Quantitative Disclosure of Derivative Holdings. The following tables show additional disclosures about the Fund’s derivative and hedging activities, including how such activities are accounted for and their effect on the Fund’s financial positions, performance and cash flows. These derivatives are not accounted for as hedging instruments.
The Fund invested in options and futures contracts in order to gain exposure to that portion of the market and to hedge against anticipated changes in interest rates that might otherwise have an adverse effect upon the value of the Fund’s securities. The Fund invested in credit default swap contracts in order to provide a measure of protection against defaults of sovereign or corporate issuers.
Fair value of derivative instruments as of December 31, 2014:
Asset Derivatives
Statement of Assets and Liabilities Location | Credit Risk | Foreign Risk | Equity Risk | Interest Rate Contracts Risk | Total | |||||||||||||||||
Purchased Currency Options | Investments in securities, at value | $ | — | $ | 72,366,241 | $ | — | $ | — | $ | 72,366,241 | |||||||||||
Purchased Options | Investments in securities, at value | — | — | 47,516,790 | — | 47,516,790 | ||||||||||||||||
Futures Contracts | Net Assets-Net unrealized appreciation (depreciation) on investments and futures contracts | — | — | 7,141,520 | — | 7,141,520 | ||||||||||||||||
Swap Contract | Premiums paid for swap contract | 11,410,860 | — | — | — | 11,410,860 | ||||||||||||||||
|
|
|
|
|
|
|
|
|
| |||||||||||||
Total Fair Value | $ | 11,410,860 | $ | 72,366,241 | $ | 54,658,310 | $ | — | $ | 138,435,411 | ||||||||||||
|
|
|
|
|
|
|
|
|
| |||||||||||||
| 35 |
Notes to Financial Statements (continued)
Liability Derivatives
Statement of Assets and Liabilities Location | Credit Risk | Foreign Risk | Equity Risk | Interest Rate Contracts Risk | Total | |||||||||||||||||
Futures Contracts | Net Assets-Net unrealized appreciation (depreciation) on investments and futures contracts | $ | — | $ | — | $ | (63,056,785 | ) | $ | — | $ | (63,056,785 | ) | |||||||||
Swap Contract | Unrealized depreciation on swap contract | (4,684,130 | ) | — | — | — | (4,684,130 | ) | ||||||||||||||
|
|
|
|
|
|
|
|
|
| |||||||||||||
Total Fair Value | $ | (4,684,130 | ) | $ | — | $ | (63,056,785 | ) | $ | — | $ | (67,740,915 | ) | |||||||||
|
|
|
|
|
|
|
|
|
| |||||||||||||
The effect of derivative instruments on the Statement of Operations for the year ended December 31, 2014:
Realized Gain (Loss)
Statement of Operations Location | Credit Risk | Foreign Risk | Equity Contracts Risk | Interest Rate Contracts Risk | Total | |||||||||||||||||
Purchased Currency Options | Net realized gain (loss) on investment transactions | $ | — | $ | (13,153,460 | ) | $ | — | $ | — | $ | (13,153,460 | ) | |||||||||
Purchased Options | Net realized gain (loss) on investment transactions | — | — | (342,221,545 | ) | (57,641,132 | ) | (399,862,677 | ) | |||||||||||||
Written Options | Net realized gain (loss) on written option transactions | — | — | 61,064,190 | — | 61,064,190 | ||||||||||||||||
Futures Contracts | Net realized gain (loss) on futures transactions | — | — | (36,708,840 | ) | (335,610,814 | ) | (372,319,654 | ) | |||||||||||||
Forward Contracts | Net realized gain (loss) on foreign currency transactions | — | (35,445 | ) | — | — | (35,445 | ) | ||||||||||||||
Swap Contracts | Net realized gain (loss) on swap transactions | (30,438,154 | ) | — | — | — | (30,438,154 | ) | ||||||||||||||
|
|
|
|
|
|
|
|
|
| |||||||||||||
Total Realized Gain (Loss) | $ | (30,438,154 | ) | $ | (13,188,905 | ) | $ | (317,866,195 | ) | $ | (393,251,946 | ) | $ | (754,745,200 | ) | |||||||
|
|
|
|
|
|
|
|
|
| |||||||||||||
Change in Unrealized Appreciation (Depreciation)
Statement of Location | Credit Contracts Risk | Foreign Exchange Contracts Risk | Equity Contracts Risk | Interest Rate Contracts Risk | Total | |||||||||||||||||
Purchased Currency Options | Net change in unrealized appreciation (depreciation) on investments | $ | — | $ | 63,396,015 | $ | — | $ | — | $ | 63,396,015 | |||||||||||
Purchased Options | Net change in unrealized appreciation (depreciation) on investments | — | — | 2,253,127 | (1,662,520 | ) | 590,607 | |||||||||||||||
Futures Contracts | Net change in unrealized appreciation (depreciation) on futures contracts | — | — | (53,335,915 | ) | (28,675,482 | ) | (82,011,397 | ) | |||||||||||||
Swap Contracts | Net change in unrealized appreciation (depreciation) on swap contracts | (4,072,756 | ) | — | — | — | (4,072,756 | ) | ||||||||||||||
|
|
|
|
|
|
|
|
|
| |||||||||||||
Total Change in Unrealized Appreciation (Depreciation) | $ | (4,072,756 | ) | $ | 63,396,015 | $ | (51,082,788 | ) | $ | (30,338,002 | ) | $ | (22,097,531 | ) | ||||||||
|
|
|
|
|
|
|
|
|
| |||||||||||||
| 36 | MainStay Marketfield Fund |
Average Notional Amount
Credit Contracts Risk | Foreign Exchange Contracts Risk | Equity Contracts Risk | Interest Rate Contracts Risk | Total | ||||||||||||||||
Purchased Currency Options | $ | — | $ | 4,396,934,479 | $ | — | $ | — | $ | 4,396,934,479 | ||||||||||
Purchased Options | $ | — | $ | — | $ | 53,742,236 | $ | 30,000,000 | $ | 83,742,236 | ||||||||||
Swap Contracts | $ | 512,874,540 | $ | — | $ | — | $ | — | $ | 512,874,540 | ||||||||||
Written Options | $ | — | $ | — | $ | (14,552,757 | ) | $ | — | $ | (14,552,757 | ) | ||||||||
Futures Contracts Long | $ | — | $ | — | $ | 303,691,865 | $ | — | $ | 303,691,865 | ||||||||||
Futures Contracts Short | $ | — | $ | — | $ | (1,028,409,535 | ) | $ | (2,409,588,912 | ) | $ | (3,437,998,447 | ) | |||||||
|
|
|
| |||||||||||||||||
The following table presents the Fund’s derivative assets by counterparty net of amounts available for offset under a master netting agreement, or similar agreement, and net of the related collateral received by the Fund as of December 31, 2014.
Counterparty | Gross Assets in Statement of Assets and Liabilities | Derivative assets/ (liabilities) available for offset | Collateral Received | Net Amount of Derivative Assets | ||||||||||||
Barclays Bank PLC | $ | 46,125,000 | $ | — | $ | — | $ | 46,125,000 | ||||||||
Citibank N.A. | 79,092,971 | — | 17,997,922 | 61,095,049 | ||||||||||||
|
|
|
|
|
|
|
| |||||||||
| $ | 125,217,971 | $ | — | $ | 17,997,922 | $ | 107,220,049 | |||||||||
|
|
|
|
|
|
|
| |||||||||
Note 3–Fees and Related Party Transactions
(A) Manager and Subadvisor. New York Life Investments, a registered investment adviser and an indirect, wholly-owned subsidiary of New York Life Insurance Company (“New York Life”), serves as the Fund’s Manager, pursuant to an Amended and Restated Management Agreement (“Management Agreement”). The Manager provides offices, conducts clerical, recordkeeping and bookkeeping services, and keeps most of the financial and accounting records required to be maintained by the Fund. Except for the portion of salaries and expenses that are the responsibility of the Fund, the Manager pays the salaries and expenses of all personnel affiliated with the Fund and certain operational expenses of the Fund. The Fund reimburses New York Life Investments in an amount equal to a portion of the compensation of the Chief Compliance Officer of the Fund. Marketfield Asset Management, LLC (“MAM” or “Subadvisor”), serves as Subadvisor to the Fund and is responsible for the day-to-day portfolio management of the Fund. Pursuant to the terms of a Subadvisory Agreement (“Subadvisory Agreement”) between New York Life Investments and MAM, New York Life Investments pays for the services of the Subadvisor.
Under the Management Agreement, the Fund pays the Manager a monthly fee for services performed and facilities furnished at an annual rate of the Fund’s average daily net assets as follows: 1.40% up to $7.5 billion; 1.38% from $7.5 billion to $15 billion; and 1.36% in excess of $15 billion.
New York Life Investments has voluntarily agreed to waive a portion of its management fee so that it does not exceed 1.34% on average net assets in excess of $22.5 billion. This voluntary waiver may be discontinued at any time. The effective management fee rate (exclusive of any applicable waivers/reimbursements) was 1.39% for the year ended December 31, 2014.
On May 9, 2014, MAM voluntarily reimbursed the Fund $1,282,342 for a trading error which occurred during the reporting period. The effect of the loss incurred and the reimbursement by MAM of such amounts had no significant impact on the Fund’s total return.
New York Life Investments entered into a written expense limitation agreement under which it has agreed to reimburse expenses of Class I shares so that the total ordinary operating expenses for Class I shares do not exceed 1.56% of average daily net assets. This agreement will remain in effect until February 28, 2016 and shall renew automatically for one year terms unless New York Life Investments provides written notice of termination prior to the start of the next term or upon approval of the Board. Based on its review, the Board may agree to maintain, modify or terminate the agreement. Total ordinary operating expenses excludes taxes, interest, litigation, extraordinary expenses, brokerage and other transaction expenses relating to the purchase or sale of portfolio investments and the fees and expenses of any other funds in which the Fund invests.
For the year ended December 31, 2014, New York Life Investments earned fees from the Fund in the amount of $250,598,258.
State Street provides sub-administration and sub-accounting services to the Fund pursuant to an agreement with New York Life Investments. These services include calculating the daily NAVs of the Fund, maintaining the general ledger and sub-ledger accounts for the calculation of the Fund’s respective NAVs, and assisting New York Life Investments in conducting various aspects of the Fund’s administrative operations. For providing these services to the Fund, State Street is compensated by New York Life Investments.
(B) Distribution, Service and Shareholder Service Fees. The Trust, on behalf of the Fund, has entered into a distribution agreement
| 37 |
Notes to Financial Statements (continued)
with NYLIFE Distributors LLC (the ‘‘Distributor’’), an indirect, wholly-owned subsidiary of New York Life. The Fund has adopted distribution plans (the ‘‘Plans’’) in accordance with the provisions of Rule 12b-1 under the 1940 Act.
Pursuant to the Class A, Investor Class and Class R2 Plans, the Distributor receives a monthly distribution fee from the Class A, Investor Class and Class R2 shares at an annual rate of 0.25% of the average daily net assets of the Class A, Investor Class and Class R2 shares for distribution and/or service activities as designated by the Distributor. Pursuant to the Class C Plan, Class C shares pay the Distributor a monthly distribution fee at an annual rate of 0.75% of the average daily net assets of the Class C shares, along with a service fee at an annual rate of 0.25% of the average daily net assets of the Class C shares, for a total 12b-1 fee of 1.00%. Class I, Class R6 and Class P shares are not subject to a distribution and/or service fee.
The Plans provide that the distribution and service fees are payable to the Distributor regardless of the amounts actually expended by the Distributor for distribution of the Fund’s shares and service activities.
In accordance with the Shareholder Services Plan for the Class R2 shares, the Manager has agreed to provide, through its affiliates or independent third parties, various shareholder and administrative support services to shareholders of the Class R2 shares. For its services, the Manager is entitled to a Shareholder Service Fee accrued daily and paid monthly at an annual rate of 0.10% of the average daily net assets of the Class R2 shares. This is in addition to any fees paid under a distribution plan, where applicable.
Shareholder Service Fees incurred by the Fund for the year ended December 31, 2014, were as follows:
Class R2 | $ | 19,970 |
(C) Sales Charges. The Fund was advised by the Distributor that the amount of sales charges retained on sales of Class A and Investor Class shares were $599,301 and $40,923, respectively, for the year ended December 31, 2014. The Fund was also advised that the Distributor retained CDSCs on redemptions of Class A and Class C shares of $390,649 and $1,082,854, respectively, for the year ended December 31, 2014.
(D) Transfer, Dividend Disbursing and Shareholder Servicing Agent. NYLIM Service Company LLC, an affiliate of New York Life Investments, is the Fund’s transfer, dividend disbursing and shareholder servicing agent pursuant to an agreement between NYLIM Service Company LLC and the Trust. NYLIM Service Company LLC has entered into an agreement with Boston Financial Data Services, Inc. (“BFDS”) pursuant to which BFDS performs certain transfer agent services on behalf of NYLIM Service Company LLC. Transfer agent expenses incurred by the Fund for the year ended December 31, 2014, were as follows:
Class A | $ | 1,816,678 | ||
Investor Class | 17,335 | |||
Class C | 1,736,576 | |||
Class I | 16,029,394 | |||
Class R2 | 22,186 | |||
Class P | 241,198 |
Class R6 is not subject to transfer agent expenses.
Note 4–Federal Income Tax
As of December 31, 2014, the components of accumulated gain (loss) on a tax basis were as follows:
Ordinary | Accumulated Other Gain (Loss) | Other Temporary Differences | Unrealized Appreciation (Depreciation) | Total Gain (Loss) | ||||||||||||||
| $ | — | $ | (823,248,267 | ) | $ | (802,604 | ) | $ | 777,547,646 | $ | (46,503,225 | ) | ||||||
The difference between book-basis and tax-basis unrealized appreciation (depreciation) is primarily due to wash sale adjustments, Passive Foreign Investment Companies (PFICs), swaps and mark-to-market futures contracts. The other temporary difference is due to unsettled short sales not yet recognized for tax purposes.
The following table discloses the current year reclassifications between undistributed net investment income (loss), accumulated net realized gain (loss) on investments, and additional paid-in capital arising from permanent differences; net assets as of December 31, 2014 were not affected.
| Undistributed Net Investment Income (Loss) | Accumulated Net Realized Gain (Loss) on Investments | Additional Paid-In Capital | ||||||||
| $ | 205,524,016 | $ | 7,127,978 | $ | (212,651,994 | ) | ||||
The reclassifications for the Fund are primarily due to foreign currency gain (loss), net operating losses, swaps, PFICs and short sales.
As of December 31, 2014, for federal income tax purposes, capital loss carryforwards of $823,248,267 were available as shown in the table below, to the extent provided by the regulations to offset future realized gains of the Fund through the years indicated. To the extent that these capital loss carryforwards are used to offset future capital gains, it is probable that the capital gains so offset will not be distributed to shareholders. No capital gain distributions shall be made until any capital loss carryforwards have been fully utilized or expired.
Capital Loss Available Through | Short-Term Capital Loss Amount (000’s) | Long-Term Capital Loss Amount (000’s) | ||||||
| Unlimited | $ | 823,248 | $ | — | ||||
The tax character of distributions paid during the years ended December 31, 2014 and December 31, 2013, shown in the Statements of Changes in Net Assets was as follows:
| 2014 | 2013 | |||||||
Distributions paid from: | ||||||||
Ordinary Income | $ | — | $ | 2,109,380 | ||||
Note 5–Custodian
State Street is the custodian of cash and securities held by the Fund. Custodial fees are charged to the Fund based on the Fund’s net assets and/or the market value of securities held by the Fund and the number of certain cash transactions incurred by the Fund.
| 38 | MainStay Marketfield Fund |
Note 6–Line of Credit
The Fund and certain affiliated funds, maintain a line of credit with a syndicate of banks in order to secure a source of funds for temporary purposes to meet unanticipated or excessive redemption requests.
Effective August 5, 2014, under a second amended and restated credit agreement (the “Credit Agreement”), the aggregate commitment amount is $600,000,000 with an optional maximum amount of $700,000,000. The commitment fee is an annual rate of 0.08% of the average commitment amount payable quarterly, regardless of usage, to Bank of New York Mellon, who serves as the agent to the syndicate. The commitment fee is allocated among the Fund and certain affiliated funds based upon their respective net assets and other factors. Interest on any revolving credit loan is charged based upon the Federal Funds Advances rate or the one month London InterBank Offered Rate, whichever is higher. The Credit Agreement expires on August 4, 2015, although the Fund, certain affiliated funds and the syndicate of banks may renew the Credit Agreement for an additional year on the same or different terms. Prior to August 5, 2014, the aggregate commitment amount was $300,000,000 with an optional maximum amount of $400,000,000. There were no borrowings made or outstanding with respect to the Fund under the Credit Agreement during the year ended December 31, 2014.
Note 7–Purchases and Sales of Securities (in 000’s)
During the year ended December 31, 2014, purchases and sales of securities, other than short-term securities, were $14,476,248 and $21,542,724, respectively.
Note 8–Capital Share Transactions
Class A | Shares | Amount | ||||||
Year ended December 31, 2014: | ||||||||
Shares sold | 41,503,423 | $ | 748,601,178 | |||||
Shares redeemed | (85,455,410 | ) | (1,460,733,638 | ) | ||||
|
| |||||||
Net increase (decrease) | (43,951,987 | ) | $ | (712,132,460 | ) | |||
|
| |||||||
Year ended December 31, 2013: | ||||||||
Shares sold | 94,033,138 | $ | 1,634,199,101 | |||||
Shares issued to shareholders in reinvestment of dividends and distributions | 8,462 | 152,319 | ||||||
Shares redeemed | (9,733,884 | ) | (172,144,984 | ) | ||||
|
| |||||||
Net increase (decrease) in shares outstanding before conversion | 84,307,716 | 1,462,206,436 | ||||||
Shares converted into Class A (See Note 1) | 80,051 | 1,357,055 | ||||||
Shares converted from Class A (See Note 1) | (4,288 | ) | (71,523 | ) | ||||
|
|
|
| |||||
Net increase (decrease) | 84,383,479 | $ | 1,463,491,968 | |||||
|
|
|
| |||||
Investor Class | Shares | Amount | ||||||
Year ended December 31, 2014: |
| |||||||
Shares sold | 659,278 | $ | 11,755,708 | |||||
Shares redeemed | (377,558 | ) | (6,568,226 | ) | ||||
|
| |||||||
Net increase (decrease) | 281,720 | $ | 5,187,482 | |||||
|
| |||||||
Year ended December 31, 2013: | ||||||||
Shares sold | 805,375 | $ | 13,974,787 | |||||
Shares issued to shareholders in reinvestment of dividends and distributions | 73 | 1,310 | ||||||
Shares redeemed | (123,801 | ) | (2,230,380 | ) | ||||
|
| |||||||
Net increase (decrease) in shares outstanding before conversion | 681,647 | 11,745,717 | ||||||
Shares converted into Investor Class (See Note 1) | 4,288 | 71,523 | ||||||
Shares converted from Investor Class (See Note 1) | (80,051 | ) | (1,357,055 | ) | ||||
|
| |||||||
Net increase (decrease) | 605,884 | $ | 10,460,185 | |||||
|
| |||||||
Class C | Shares | Amount | ||||||
Year ended December 31, 2014: |
| |||||||
Shares sold | 28,355,091 | $ | 507,490,850 | |||||
Shares redeemed | (51,659,152 | ) | (859,565,846 | ) | ||||
|
| |||||||
Net increase (decrease) | (23,304,061 | ) | $ | (352,074,996 | ) | |||
|
| |||||||
Year ended December 31, 2013: | ||||||||
Shares sold | 81,255,464 | $ | 1,404,630,213 | |||||
Shares issued to shareholders in reinvestment of dividends and distributions | 6,964 | 124,245 | ||||||
Shares redeemed | (2,671,276 | ) | (46,850,664 | ) | ||||
|
| |||||||
Net increase (decrease) | 78,591,152 | $ | 1,357,903,794 | |||||
|
| |||||||
Class I | Shares | Amount | ||||||
Year ended December 31, 2014: |
| |||||||
Shares sold | 290,533,440 | $ | 5,228,916,255 | |||||
Shares redeemed | (712,674,328 | ) | (12,169,729,779 | ) | ||||
|
| |||||||
Net increase (decrease) | (422,140,888 | ) | $ | (6,940,813,524 | ) | |||
|
| |||||||
Year ended December 31, 2013: | ||||||||
Shares sold | 689,748,082 | $ | 11,991,805,245 | |||||
Shares issued to shareholders in reinvestment of dividends and distributions | 74,287 | 1,340,127 | ||||||
Shares redeemed | (94,500,234 | ) | (1,653,850,170 | ) | ||||
|
| |||||||
Net increase (decrease) | 595,322,135 | $ | 10,339,295,202 | |||||
|
| |||||||
| 39 |
Notes to Financial Statements (continued)
Class R2 | Shares | Amount | ||||||
Year ended December 31, 2014: |
| |||||||
Shares sold | 616,567 | $ | 11,147,874 | |||||
Shares redeemed | (779,874 | ) | (13,345,947 | ) | ||||
|
| |||||||
Net increase (decrease) | (163,307 | ) | $ | (2,198,073 | ) | |||
|
| |||||||
Year ended December 31, 2013: | ||||||||
Shares sold | 953,820 | $ | 16,807,376 | |||||
Shares issued to shareholders in reinvestment of dividends and distributions | 55 | 992 | ||||||
Shares redeemed | (25,023 | ) | (449,326 | ) | ||||
|
| |||||||
Net increase (decrease) | 928,852 | $ | 16,359,042 | |||||
|
| |||||||
Class R6 | Shares | Amount | ||||||
Year ended December 31, 2014: |
| |||||||
Shares sold | 554,485 | $ | 10,185,316 | |||||
Shares redeemed | (268,922 | ) | (4,711,557 | ) | ||||
|
| |||||||
Net increase (decrease) | 285,563 | $ | 5,473,759 | |||||
|
| |||||||
Period ended December 31, 2013 (a): | ||||||||
Shares sold | 121,398 | $ | 2,187,045 | |||||
Shares issued to shareholders in reinvestment of dividends | 14 | 256 | ||||||
Shares redeemed | (15,776 | ) | (285,728 | ) | ||||
|
| |||||||
Net increase (decrease) | 105,636 | $ | 1,901,573 | |||||
|
| |||||||
Class P | Shares | Amount | ||||||
Year ended December 31, 2014: | ||||||||
Shares sold | 8,267,532 | $ | 148,401,630 | |||||
Shares redeemed | (11,856,426 | ) | (202,425,141 | ) | ||||
|
| |||||||
Net increase (decrease) | (3,588,894 | ) | $ | (54,023,511 | ) | |||
|
| |||||||
Period ended December 31, 2013 (a): | ||||||||
Shares sold | 11,065,479 | $ | 195,602,404 | |||||
Shares issued to shareholders in reinvestment of dividends | 1,142 | 20,583 | ||||||
Shares redeemed | (411,832 | ) | (7,437,082 | ) | ||||
|
| |||||||
Net increase (decrease) | 10,654,789 | $ | 188,185,905 | |||||
|
| |||||||
| (a) | Class R6 shares were first offered on June 17, 2013 and Class P shares were first offered on May 31, 2013. |
Note 9–Litigation
On December 23, 2014, Cynthia Ann Redus-Tarchis and others filed a complaint against New York Life Investments in the United States District Court for the District of New Jersey. The complaint was brought derivatively on behalf of the Fund, the MainStay Large Cap Growth Fund, and the MainStay High Yield Corporate Bond Fund and alleges that New York Life Investments violated Section 36(b) of the 1940 Act by charging excessive investment management fees. The plaintiffs seek monetary damages and other relief from New York Life Investments. New York Life Investments believes the case has no merit, and intends to vigorously defend the matter.
Note 10–Subsequent Events
In connection with the preparation of the financial statements of the Fund as of and for the year ended December 31, 2014, events and transactions subsequent to December 31, 2014, through the date the financial statements were issued have been evaluated by the Fund’s management for possible adjustment and/or disclosure. No subsequent events requiring financial statement adjustment or disclosure have been identified.
| 40 | MainStay Marketfield Fund |
Report of Independent Registered Public Accounting Firm
To the Board of Trustees of MainStay Funds Trust and Shareholders of
MainStay Marketfield Fund:
In our opinion, the accompanying statement of assets and liabilities, including the schedule of investments, and the related statements of operations and of changes in net assets and the financial highlights present fairly, in all material respects, the financial position of MainStay Marketfield Fund (a fund of MainStay Funds Trust, and hereafter referred to as the “Fund”) at December 31, 2014, the results of its operations for the year then ended, the changes in its net assets for each of the two years in the period then ended and the financial highlights for each of the three years in the period then ended, in conformity with accounting principles generally accepted in the United States of America. These financial statements and financial highlights (hereafter referred to as “financial statements”) are the responsibility of the Fund’s management. Our responsibility is to express an opinion on these financial statements based on our audits. We conducted our audits of these financial statements in accordance with the standards of the Public Company Accounting Oversight Board (United States). Those standards require that we plan and perform the audit to obtain reasonable assurance about whether the financial statements are free of material misstatement. An audit includes examining, on a test basis, evidence supporting the amounts and disclosures in the financial statements, assessing the accounting principles used and significant estimates made by management, and evaluating the overall financial statement presentation. We believe that our audits, which included confirmation of securities at December 31, 2014 by correspondence with the custodian and brokers, and the application of alternative auditing procedures where such confirmations had not been received, provide a reasonable basis for our opinion. The financial highlights of the Fund for periods ended on or before December 31, 2011 included in the accompanying financial statements were audited by other auditors whose report dated February 29, 2012 expressed an unqualified opinion on the financial statements containing such financial highlights.
PricewaterhouseCoopers LLP
New York, New York
February 25, 2015
| 41 |
Board Consideration and Approval of Management Agreement and
Subadvisory Agreement (Unaudited)
Section 15(c) of the Investment Company Act of 1940, as amended (the “1940 Act”) requires that each mutual fund’s board of trustees, including a majority of the independent trustees, annually review and approve the fund’s investment advisory agreements. At its December 8-10, 2014 meeting, the Board of Trustees of the MainStay Group of Funds (the “Board”) unanimously approved the Management Agreement with respect to the MainStay Marketfield Fund (the “Fund”) and New York Life Investment Management LLC (“New York Life Investments”), and the Subadvisory Agreement between New York Life Investments and Marketfield Asset Management LLC (“MAM”) with respect to the Fund.
In reaching its decision to approve the Agreements, the Board considered information furnished by New York Life Investments and MAM in connection with a contract review process that took place at various meetings of the Board and its Contracts Committee between September 2014 and December 2014, as well as other relevant information furnished to the Board throughout the year by New York Life Investments and MAM. Information requested by and furnished to the Board in connection with the contract review process included, among other items, reports on the Fund and “peer funds” prepared by Strategic Insight Mutual Fund Research and Consulting, LLC (“Strategic Insight”), an independent third-party service provider engaged by the Board to report objectively on the Fund’s investment performance, management and subadvisory fees and ordinary operating expenses. The Board also considered information provided by New York Life Investments and MAM on the fees charged to other investment advisory clients (including institutional separate accounts) that follow investment strategies similar to the Fund, and the rationale for any differences in the Fund’s management and subadvisory fees and the fees charged to those other investment advisory clients. In addition, the Board requested and received information on the profitability of the Fund to New York Life Investments and its affiliates and MAM, and responses from New York Life Investments and MAM to a series of questions encompassing a variety of topics prepared on behalf of the Board by independent legal counsel to the Board and its independent trustees (the “Independent Trustees”). Information provided to the Board at its meetings throughout the year included, among other items, detailed investment performance reports on the Fund prepared by the Portfolio Analytics and Risk Oversight Group at New York Life Investments. The structure and format for this regular reporting were developed in consultation with the Board. The Board also received from New York Life Investments throughout the year, among other items, periodic reports on legal and compliance matters, portfolio turnover, and sales and marketing activity.
In considering the Agreements, the members of the Board reviewed and evaluated all of the information and factors they believed to be relevant and appropriate in light of legal advice furnished to them by independent legal counsel and through the exercise of their own business judgment. The broad factors considered by the Board are discussed in greater detail below, and included, among other items: (i) the nature, scope and quality of the services provided to the Fund by New York Life Investments and MAM; (ii) the investment performance of the Fund, New York Life Investments and MAM; (iii) the costs of the services provided, and profits realized, by New York Life Investments and MAM from their relationship with the Fund; (iv) the extent to which economies of scale may be realized as the Fund grows, and the extent to which economies of scale may benefit Fund investors; and (v) the reason-
ableness of the Fund’s management and subadvisory fees and overall total ordinary operating expenses, particularly as compared to similar funds and accounts managed by New York Life Investments and MAM and peer funds identified by Strategic Insight.
While individual members of the Board may have weighed certain factors differently, the Board’s decision to approve the Agreements was based on a consideration of all the information provided to the Board, including information provided to the Board throughout the year as well as information furnished specifically in connection with the contract review process. The Board’s conclusions with respect to the Agreements also were based, in part, on the Board’s consideration of the Agreements in prior years. In addition to considering the above-referenced factors, the Board observed that in the marketplace there are a range of investment options available to shareholders of the Fund, and that the Fund’s shareholders, having had the opportunity to consider other investment options, have chosen to invest in the Fund. A more detailed discussion of the factors that figured prominently in the Board’s decisions to approve the Agreements is provided below.
Nature, Scope and Quality of Services to Be Provided by New York Life Investments and MAM
The Board examined the nature, scope and quality of the services that New York Life Investments provides to the Fund. The Board evaluated New York Life Investments’ experience in serving as manager of the Fund, noting that New York Life Investments manages other mutual funds, serves a variety of other investment advisory clients, including other pooled investment vehicles, and has experience with overseeing mutual fund service providers, including subadvisors. The Board considered the experience of senior personnel at New York Life Investments providing management and administrative services to the Fund, as well as New York Life Investments’ reputation and financial condition. The Board also considered the full range of non-advisory services that New York Life Investments supplies to the Fund under the terms of the Management Agreement, including: (i) fund accounting and oversight services provided by New York Life Investments’ Fund Administration and Accounting Group; (ii) investment oversight and analytical services provided by New York Life Investments’ Portfolio Analytics and Risk Oversight Group; (iii) compliance services provided by the Fund’s Chief Compliance Officer as well as New York Life Investments’ Compliance Department, including oversight and implementation of the Fund’s compliance program; and (iv) legal services provided by New York Life Investments’ Office of the General Counsel. Additional information about the nonadvisory services provided by New York Life Investments is set forth in the Fund’s Management Agreement. The Board also considered New York Life Investments’ willingness to invest in personnel that benefit the Fund, and noted that New York Life Investments is responsible for compensating the Fund’s officers. The Board also considered benefits to shareholders of being part of the MainStay Group of Funds, including the privilege of exchanging investments between the same class of shares without the imposition of a sales charge, as described more fully in the Fund’s prospectus.
The Board also examined the nature, scope and quality of the advisory services that MAM provides to the Fund. The Board evaluated MAM’s experience in serving as subadvisor to the Fund and managing other portfolios. It examined MAM’s track record and experience in providing
| 42 | MainStay Marketfield Fund |
investment advisory services, the experience of investment advisory, senior management and administrative personnel at MAM, and MAM’s overall legal and compliance environment. The Board also reviewed MAM’s willingness to invest in personnel and infrastructure designed to benefit the Fund. In this regard, the Board considered the experience of the Fund’s portfolio managers, the number of accounts managed by the portfolio managers and the method for compensating portfolio managers.
Based on these considerations, the Board concluded, within the context of its overall determinations regarding the Agreements, that the Fund should continue to benefit from the nature, scope and quality of these services as a result of New York Life Investments’ and MAM’s experience, personnel, operations and resources.
Investment Performance
In evaluating the Fund’s investment performance, the Board considered investment performance results in light of the Fund’s investment objective, strategies and risks, as disclosed in the Fund’s prospectus. The Board particularly considered detailed investment reports on the Fund’s performance provided to the Board throughout the year by the Portfolio Analytics and Risk Oversight Group of New York Life Investments. These reports include, among other items, information on the Fund’s gross and net returns, the Fund’s investment performance relative to relevant investment categories and Fund benchmarks, the Fund’s risk-adjusted investment performance, and the Fund’s investment performance as compared to peer funds, as appropriate. The Board also considered information provided by Strategic Insight showing the investment performance of the Fund as compared to peer funds. In considering the Fund’s investment performance, the Board focused principally on the long-term performance track record of the Fund and its predecessor fund. The Board also gave weight to its ongoing discussions with senior management at New York Life Investments concerning the Fund’s investment performance, as well as discussions between the Fund’s portfolio managers and the Board’s Alternative and Closed-End Funds Oversight Committee and Investment Committee that occur regularly, not less than on an annual basis. In addition, the Board considered any specific actions that New York Life Investments or MAM had taken, or had agreed with the Board to take, to enhance Fund investment performance and to enhance MAM’s risk controls and the results of those actions. Based on these considerations, the Board concluded, within the context of its overall determinations regarding the Agreements, that the long-term investment performance of the Fund, along with ongoing efforts by New York Life Investments and MAM to enhance investment returns, supported a determination to approve the Agreements. The Fund discloses more information about investment performance in the Portfolio Management Discussion and Analysis, Investment and Performance Comparison and Financial Highlights sections of this Annual Report and in the Fund’s prospectus. The Board noted that the Fund had recently underperformed relative to its peers, and that the Fund’s recent underperformance would be the subject of continuing Board monitoring and discussion with New York Life Investments and MAM. The Board noted that it would continue to monitor the investment performance of the Fund in the coming year.
Costs of the Services Provided, and Profits Realized, by New York Life Investments and MAM
The Board considered the costs of the services provided by New York Life Investments and MAM under the Agreements, and the profits realized by New York Life Investments and its affiliates and MAM due to their relationships with the Fund. Because MAM’s subadvisory fees are negotiated at arm’s-length by New York Life Investments and are paid directly by New York Life Investments, not the Fund, the Board principally considered cost and profitability information for New York Life Investments and its affiliates with respect to the Funds.
In evaluating the costs and profits of New York Life Investments and its affiliates and MAM, the Board considered, among other factors, each party’s investments in personnel, systems, equipment and other resources necessary to manage the Fund, and that New York Life Investments is responsible for paying the subadvisory fees for the Fund. The Board acknowledged that New York Life Investments and MAM must be in a position to pay and retain experienced professional personnel to provide services to the Fund, and that the ability to maintain a strong financial position is important in order for New York Life Investments and MAM to continue to provide high-quality services to the Fund. The Board also noted that the Fund benefits from the allocation of certain fixed costs across the MainStay Group of Funds.
In addition, the Board noted the difficulty in obtaining reliable comparative data about mutual fund managers’ profitability, since such information generally is not publicly available and may be impacted by numerous factors, including the structure of a fund manager’s organization, the types of funds it manages, the methodology used to allocate certain fixed costs to specific funds, and the manager’s capital structure and costs of capital. In connection with the annual fund profitability analysis that New York Life Investments presents to the Board, the Board in 2014 engaged Bobroff Consulting, Inc., an independent third-party consultant, to review the methods used to allocate costs to the Funds, and among individual Funds. As part of this engagement, the consultant analyzed: (i) the various New York Life Investments’ business units and affiliated Subadvisers that provide services to the Funds; (ii) how costs are allocated to the Fund and other funds managed by New York Life Investments and to other lines of business; and (iii) how New York Life Investments’ cost allocation methods and profitability reports compare to industry practices. The Board noted that the independent consultant had concluded that New York Life Investments’ methods for allocating costs and procedures for estimating overall profitability of the funds in the MainStay Group of Funds, are reasonable, consistent with industry practice and likely to produce reasonable profitability estimates. While recognizing the difficulty in evaluating a manager’s profitability with respect to the Fund, and noting that other profitability methodologies may also be reasonable, the Board concluded that the profitability methodology presented by New York Life Investments to the Board, which was developed by New York Life Investments in consultation with an independent consultant, was reasonable in all material respects.
In considering the costs and profitability of the Fund, the Board also considered certain fall-out benefits that may be realized by New York Life Investments, MAM and their affiliates due to their relationships with the Fund. The Board recognized, for example, the benefits to MAM from legally permitted “soft-dollar” arrangements by which brokers provide
| 43 |
Board Consideration and Approval of Management Agreement and
Subadvisory Agreement (Unaudited) (continued)
research and other services to MAM in exchange for commissions paid by the Fund with respect to trades on the Fund’s portfolio securities. In this regard, the Board also requested and received information from New York Life Investments and MAM concerning other business relationships between MAM and its affiliates and New York Life Investments and its affiliates.
The Board further considered that, in addition to fees earned by New York Life Investments for managing the Fund, New York Life Investments’ affiliates also earn revenues from serving the Fund in various other capacities, including as the Fund’s transfer agent and distributor. The Board observed that information about these other revenues, and their impact on the profitability of the Fund to New York Life Investments and its affiliates, was furnished to the Board as part of the 15(c) process. The Board noted that, although it assessed the overall profitability of the Fund to New York Life Investments and its affiliates as part of the contract review process, when considering the reasonableness of the fees to be paid to New York Life Investments and its affiliates under the Agreements, the Board considered the profitability of New York Life Investments’ relationship with the Fund on a pre-tax basis, and without regard to distribution expenses.
After evaluating the information presented to the Board, the Board concluded, within the context of its overall determinations regarding the Agreements, that any profits realized by New York Life Investments and its affiliates due to their relationships with the Fund supported the Board’s decision to approve the Agreements. With respect to MAM, the Board concluded that any profits realized by MAM due to its relationship with the Fund are the result of arm’s-length negotiations between New York Life Investments and MAM, and are based on fees paid to MAM by New York Life Investments, not the Fund.
Extent to Which Economies of Scale May Be Realized as the Fund Grows
The Board considered whether the Fund’s expense structure permits economies of scale to be shared with Fund investors. The Board also considered a report from New York Life Investments, prepared at the request of the Board, that addressed economies of scale in the mutual fund business generally, the changing economics of the mutual fund business and the various ways in which the benefits of economies of scale may be shared with the MainStay Group of Funds. The Board took note of the overall significant asset growth experienced by the Fund and its predecessor fund in recent years, despite substantial outflows experienced by the Fund more recently. The Board also noted the costs borne by New York Life Investments and MAM in connection with managing the Fund.
The Board also reviewed information from New York Life Investments showing how the Fund’s management fee schedule compared to fee schedules of other funds and accounts managed by New York Life Investments. In addition, the Board reviewed information from Strategic Insight showing how the Fund’s management fee schedule hypothetically would compare with fees paid for similar services by peer funds at varying asset levels. While recognizing the difficulty of determining economies of scale with precision, the Board acknowledged that economies of scale may be shared with the Fund in a number of ways, including, for example, through the imposition of management fee
breakpoints and by initially setting relatively lower management fees. The Board considered that, following negotiations with the Board over the course of the annual contract review process, New York Life Investments agreed to implement a new voluntary management fee waiver to become effective on February 28, 2015.
Based on this information, the Board concluded, within the context of its overall determinations regarding the Agreements, that the Fund’s expense structure appropriately reflects economies of scale for the benefit of Fund investors. The Board noted, however, that it would continue to evaluate the reasonableness of the Fund’s expense structure as the Fund grows over time.
Management and Subadvisory Fees and Total Ordinary Operating Expenses
The Board evaluated the reasonableness of the fees to be paid under the Agreements in relation to the scope of services to be provided and the Fund’s expected total ordinary operating expenses. The Board primarily considered the reasonableness of the management fee paid by the Fund to New York Life Investments, since the fees paid to MAM are paid by New York Life Investments, not the Fund.
In assessing the reasonableness of the Fund’s fees and expenses, the Board primarily considered comparative data provided by New York Life Investments on the fees and expenses charged by similar mutual funds managed by other investment advisers. In addition, the Board considered information provided by New York Life Investments and MAM on fees charged to other investment advisory clients, including institutional separate accounts and other funds with similar investment objectives as the Fund. The Board particularly considered differences in the contractual management fee schedules of the retail MainStay Funds and similarly managed MainStay VP Portfolios, taking into account New York Life Investments’ rationale for any differences in fee schedules. The Board also took into account explanations provided by New York Life Investments about the different scope of services provided to registered investment companies as compared with other investment advisory clients. Additionally, the Board considered the impact of any contractual breakpoints, voluntary waivers and expense limitation arrangements on the Fund’s net management fee and expenses.
The Board noted that, outside of the Fund’s management fee and the fees charged under a share class’s Rule 12b-1 and/or shareholder services plans, a share class’s most significant “other expenses” are transfer agent fees. Transfer agent fees are charged to the Fund based on the number of shareholder accounts (a “per-account” fee) as compared with certain other fees (e.g., management fees), which are charged based on the Fund’s average net assets. The Board took into account information from New York Life Investments showing that the Fund’s transfer agent fee schedule is reasonable, including industry data showing that the per-account fees that NYLIM Service Company LLC, the Fund’s transfer agent, charges the Fund are within the range of per-account fees charged by transfer agents to other mutual funds. In addition, the Board considered NYLIM Service Company LLC’s profitability in connection with the transfer agent services it provides to the Fund.
The Board considered that, because the Fund’s transfer agent fees are billed on a per-account basis, the impact of transfer agent fees on a
| 44 | MainStay Marketfield Fund |
share class’s expense ratio may be more significant in cases where the share class has a high number of accounts with limited assets (i.e., small accounts). The Board observed that transfer agent fees are a significant portion of total expenses of many Funds in the MainStay Group of Funds. The impact of transfer agent fees on the expense ratios of these MainStay Funds tend to be greater than for other open-end retail funds, because the MainStay Group of Funds generally has a significant number of small accounts relative to competitor funds. The Board acknowledged the role that the MainStay Group of Funds historically has played in serving the investment needs of New York Life Insurance Company (“New York Life”) policyholders, who often maintain smaller account balances than other fund investors. The Board also acknowledged measures that it and New York Life Investments have taken in recent years to mitigate the effect of small accounts on the expense ratios of Fund share classes, including: (i) encouraging New York Life agents to consolidate multiple small accounts held by the same investor into one MainStay Asset Allocation Fund account; (ii) increasing investment minimums from $500 to $1,000 in 2003; (iii) introducing Investor Class shares for certain MainStay Funds in early 2008 to consolidate smaller account investors; (iv) closing small accounts with balances below $250 in Investor Class shares or $750 in all other classes of shares; (v) eliminating an exception with no minimum investment amount with respect to AutoInvest accounts with subsequent monthly purchases of $100; (vi) since 2007, charging an annual $20.00 small account fee on certain accounts with balances below $1,000; and (vii) modifying the approach for billing transfer agent expenses to reduce the degree of subsidization by large accounts of smaller accounts. In addition, the Board acknowledged New York Life Investments’ efforts to encourage intermediaries to consolidate small accounts in multiple Funds held by the same investor into a single Asset Allocation Fund account, if appropriate under the circumstances, in an effort to mitigate the effect of small accounts on the Funds in the MainStay Group of Funds.
After considering all of the factors outlined above, the Board concluded that the Fund’s management and subadvisory fees and total ordinary operating expenses were within a range that is competitive and, within the context of the Board’s overall conclusions regarding the Agreements, support a conclusion that these fees and expenses are reasonable.
Conclusion
On the basis of the information provided to it and its evaluation thereof, the Board, including the Independent Trustees, unanimously voted to approve the Agreements.
| 45 |
Federal Income Tax Information (Unaudited)
In February 2015, shareholders received an IRS Form 1099-DIV or substitute Form 1099 which showed the federal tax status of the distributions received by shareholders in calendar year 2014. The amounts that were reported on such 1099-DIV or substitute Form 1099 were the amounts you are to use on your federal income tax return and potentially differed from the amounts which we reported for the Fund’s fiscal year ended December 31, 2014.
Proxy Voting Policies and Procedures and Proxy Voting Record
A description of the policies and procedures that New York Life Investments uses to vote proxies related to the Fund’s securities is available without charge, upon request, (i) by visiting the Fund’s website at mainstayinvestments.com; and (ii) on the Securities and Exchange Commission’s (“SEC”) website at www.sec.gov.
The Fund is required to file with the SEC its proxy voting record for the 12-month period ending June 30 on Form N-PX. The Fund’s most recent Form N-PX or proxy voting record is available free of charge upon request by calling 800-MAINSTAY (624-6782); visiting the Fund’s website at mainstayinvestments.com; or on the SEC’s website at www.sec.gov.
Shareholder Reports and Quarterly Portfolio Disclosure
The Fund is required to file its complete schedule of portfolio holdings with the SEC for its first and third fiscal quarters on Form N-Q. The Fund’s Form N-Q is available without charge, on the SEC’s website at www.sec.gov or by calling MainStay Investments at 800-MAINSTAY (624-6782). You also can obtain and review copies of Form N-Q by visiting the SEC’s Public Reference Room in Washington, DC (information on the operation of the Public Reference Room may be obtained by calling 1-800-SEC-0330).
| 46 | MainStay Marketfield Fund |
Board of Trustees and Officers
The Board of Trustees oversee the MainStay Group of Funds, (which is comprised of Funds that are series of the MainStay Funds, MainStay Funds Trust, MainStay VP Funds Trust, Private Advisors Alternative Strategies Master Fund, Private Advisors Alternative Strategies Fund, and MainStay DefinedTerm Municipal Opportunities Fund) (collectively the “Fund Complex”), the Manager and, when applicable, the Subadvisor(s), and other service providers to the Fund Complex and elects the officers of the Funds who are responsible for the day-to-day operations of the Funds. Each Trustee serves until his or her successor
is elected and qualified or until his or her resignation, death or removal. Under the Retirement Policy, a Trustee must tender his or her resignation by the end of the calendar year during which he or she reaches the age of 75. Officers serve a term of one year and are elected annually by the Board of Trustees. Information pertaining to the Trustees and officers is set forth below. The business address of each Trustee and officer listed below is 51 Madison Avenue, New York, New York 10010. A majority of the Trustees are not “interested persons” (as defined by the 1940 Act) of the Funds (“Independent Trustees”).
Name and Date of Birth | Term of Office, Position(s) Held and Length of Service | Principal Occupation(s) During Past Five Years | Number of Portfolios in Fund Complex Overseen by Board Member | Other Directorships Held by Board Member | ||||||||
| Interested Board Member | John Y. Kim* 9/24/60 | Indefinite; MainStay Funds Trust: Trustee since 2008.** | Vice Chairman (since January 2014) and Chief Investment Officer (since 2011), New York Life Insurance Company; President, Investments Group—New York Life Insurance Company (since 2012); Chairman of the Board of Managers and Chief Executive Officer, New York Life Investment Management Holdings LLC (since 2008); Chairman of the Board of Managers (since 2008) and Chief Executive Officer (2008 to 2013), New York Life Investment Management LLC; Member of the Board, MCF Capital Management LLC (since 2012), Private Advisors LLC (since 2010); MacKay Shields LLC and Madison Capital Funding LLC (since 2008); and Member of the Board of Managers, McMorgan and Company LLC and GoldPoint Partners (fka NYLCAP Manager LLC) (2008-2012) | 82 | The MainStay Funds: MainStay VP Funds Trust: Private Advisors Alternative Strategies Master Fund: Trustee since 2011; Private Advisors Alternative Strategies Fund: Trustee since 2011; and MainStay DefinedTerm Municipal Opportunities Fund: Trustee since 2011. |
| * | This Trustee is considered to be an “interested person” of the MainStay Group of Funds within the meaning of the 1940 Act because of his affiliation with New York Life Insurance Company, New York Life Investment Management LLC, Cornerstone Capital Management Holdings LLC, Cornerstone Capital Management LLC, MacKay Shields LLC, Institutional Capital LLC, NYL Investors LLC, NYLIFE Securities LLC and/or NYLIFE Distributors LLC, as described in detail above in the column entitled “Principal Occupation(s) During Past Five Years.” |
| ** | Includes prior service as a Director/Trustee of certain predecessor entities to MainStay Funds Trust. |
| *** | Includes prior service as a Director of MainStay VP Series Fund, Inc., the predecessor to MainStay VP Funds Trust. |
| 47 |
Name and Date of Birth | Term of Office, Position(s) Held and Length of Service | Principal Occupation(s) During Past Five Years | Number Of Portfolios In Fund Complex Overseen By Board Member | Other Directorships Held By Board Member | ||||||||
Non-Interested Board Members | Susan B. Kerley 8/12/51 | Indefinite; MainStay Funds Trust: Trustee since 1990.** | President, Strategic Management Advisors LLC (since 1990) | 82 | The MainStay Funds: Trustee since 2007 (12 Funds); MainStay VP Funds Trust: Trustee since 2007 (29 portfolios)***; Private Advisors Alternative Strategies Master Fund: Trustee since 2011; Private Advisors Alternative Strategies Fund: Trustee since 2011; MainStay DefinedTerm Municipal Opportunities Fund: Trustee since 2011; and Legg Mason Partners Funds: Trustee since 1991 (53 portfolios). | |||||||
Alan R. Latshaw 3/27/51 | Indefinite; MainStay Funds Trust: Trustee and Audit Committee Financial Expert since 2007.** | Retired; Partner, Ernst & Young LLP (2002 to 2003); Partner, Arthur Andersen LLP (1989 to 2002); Consultant to the MainStay Funds Audit and Compliance Committee (2004 to 2006) | 82 | The MainStay Funds: Trustee and Audit Committee Financial Expert since 2006 (12 Funds); MainStay VP Funds Trust: Trustee and Audit Committee Financial Expert since 2007 (29 portfolios)***; Private Advisors Alternative Strategies Master Fund: Trustee and Audit Committee Financial Expert since 2011; Private Advisors Alternative Strategies Fund: Trustee and Audit Committee Financial Expert since 2011; MainStay DefinedTerm Municipal Opportunities Fund: Trustee and Audit Committee Financial Expert since 2011; State Farm Associates Funds Trusts: Trustee since 2005 (4 portfolios); State Farm Mutual Fund Trust: Trustee since 2005 (15 portfolios); and State Farm Variable Product Trust: Trustee since 2005 (9 portfolios). | ||||||||
Peter Meenan 12/5/41 | Indefinite; MainStay Funds Trust: Chairman since 2013 and Trustee since 2002.** | Retired; Independent Consultant (2004 to 2013); President and Chief Executive Officer, Babson—United, Inc. (financial services firm) (2000 to 2004); Independent Consultant (1999 to 2000); Head of Global Funds, Citicorp (1995 to 1999) | 82 | The MainStay Funds: Chairman since 2013 and Trustee since 2007 (12 Funds); MainStay VP Funds Trust: Chairman since 2013 and Trustee since 2007 (29 portfolios)***; Private Advisors Alternative Strategies Master Fund: Chairman since 2013 and Trustee since 2011; Private Advisors Alternative Strategies Fund: Chairman since 2013 and Trustee since 2011; and MainStay DefinedTerm Municipal Opportunities Fund: Chairman since 2013 and Trustee since 2011. | ||||||||
Richard H. Nolan, Jr. 11/16/46 | Indefinite; MainStay Funds Trust: Trustee since 2007.** | Managing Director, ICC Capital Management (since 2004); President—Shields/ Alliance, Alliance Capital Management (1994 to 2004) | 82 | The MainStay Funds: Trustee since 2007 (12 Funds); MainStay VP Funds Trust: Trustee since 2006 (29 portfolios)***; Private Advisors Alternative Strategies Master Fund: Trustee since 2011; Private Advisors Alternative Strategies Fund: Trustee since 2011; and MainStay DefinedTerm Municipal Opportunities Fund: Trustee since 2011. |
| 48 | MainStay Marketfield Fund |
Name and Date of Birth | Term of Office, Position(s) Held and Length of Service | Principal Occupation(s) During Past Five Years | Number Of Portfolios In Fund Complex Overseen By Board Member | Other Directorships Held By Board Member | ||||||||
Non-Interested Board Members | Richard S. Trutanic 2/13/52 | Indefinite; MainStay Funds Trust: Trustee since 2007.** | Chairman and Chief Executive Officer, Somerset & Company (financial advisory firm) (since 2004); Managing Director, The Carlyle Group (private investment firm) (2002 to 2004); Senior Managing Director, Partner and Board Member, Groupe Arnault S.A. (private investment firm) (1999 to 2002) | 82 | The MainStay Funds: Trustee since 1994 (12 Funds); MainStay VP Funds Trust: Trustee since 2007 (29 portfolios)***; Private Advisors Alternative Strategies Master Fund: Trustee since 2011; Private Advisors Alternative Strategies Fund: Trustee since 2011; and MainStay DefinedTerm Municipal Opportunities Fund: Trustee since 2011. | |||||||
Roman L. Weil 5/22/40 | Indefinite; MainStay Funds Trust: Trustee and Audit Committee Financial Expert since 2007.** | President, Roman L. Weil Associates, Inc. (consulting firm) (since 1981); V. Duane Rath Professor Emeritus of Accounting, Chicago Booth School of Business, University of Chicago (since 2008); Visiting Professor, Johns Hopkins University (2013); Visiting Professor, University of California—San Diego (since 2012); Visiting Professor, Southern Methodist University (2011); Visiting Professor, NYU Stern School of Business, New York University (2011) | 82 | The MainStay Funds: Trustee and Audit Committee Financial Expert since 2007 (12 Funds); MainStay VP Funds Trust: Trustee and Audit Committee Financial Expert since 1994 (29 portfolios)***; Private Advisors Alternative Strategies Master Fund: Trustee and Audit Committee Financial Expert since 2011; Private Advisors Alternative Strategies Fund: Trustee and Audit Committee Financial Expert since 2011; and MainStay DefinedTerm Municipal Opportunities Fund: Trustee and Audit Committee Financial Expert since 2011. | ||||||||
John A. Weisser 10/22/41 | Indefinite; MainStay Funds Trust: Trustee since 2007.** | Retired; Managing Director of Salomon Brothers, Inc. (1971 to 1995) | 82 | The MainStay Funds: Trustee since 2007 (12 Funds); MainStay VP Funds Trust: Trustee since 1997 (29 portfolios)***; Private Advisors Alternative Strategies Master Fund: Trustee since 2011; Private Advisors Alternative Strategies Fund: Trustee since 2011; MainStay DefinedTerm Municipal Opportunities Fund: Trustee since 2011; Direxion Insurance Trust: Trustee since 2007 (1 portfolio); Direxion Funds: Trustee since 2007 (18 portfolios); and Direxion Shares ETF Trust: Trustee since 2008 (52 portfolios). |
| ** | Includes prior service as a Director/Trustee of certain predecessor entities to MainStay Funds Trust. |
| *** | Includes prior service as a Director of MainStay VP Series Fund, Inc., the predecessor to MainStay VP Funds Trust. |
| 49 |
Name and Date of Birth | Position(s) Held and Length of Service | Principal Occupation(s) During Past Five Years | ||||||
Officers (Who Are Not Trustees)* | Stephen P. Fisher 2/22/59 | President, MainStay Funds Trust (since 2009) | Chairman and Chief Executive Officer (since 2014), President and Chief Operating Officer (2008 to 2013), NYLIFE Distributors LLC; Senior Managing Director (since 2012) and Chairman of the Board (since 2008), NYLIM Service Company LLC; Senior Managing Director (since 2005) and Co-President (since 2014), New York Life Investment Management LLC; President, Private Advisors Alternative Strategies Master Fund, Private Advisors Alternative Strategies Fund and MainStay DefinedTerm Municipal Opportunities Fund (since 2011) and The MainStay Funds and MainStay VP Funds Trust (since 2007)** | |||||
Jack R. Benintende 5/12/64 | Treasurer and Principal Financial and Accounting Officer, MainStay Funds Trust (since 2009) | Managing Director, New York Life Investment Management LLC (since 2007); Treasurer and Principal Financial and Accounting Officer, Private Advisors Alternative Strategies Master Fund, Private Advisors Alternative Strategies Fund and MainStay DefinedTerm Municipal Opportunities Fund (since 2011) and The MainStay Funds and MainStay VP Funds Trust (since 2007)**; and Assistant Treasurer, New York Life Investment Management Holdings LLC (2008 to 2012)); | ||||||
Kevin M. Bopp 2/24/69 | Vice President and Chief Compliance Officer, MainStay Funds Trust (since October 2014) | Vice President and Chief Compliance Officer, The MainStay Funds, MainStay VP Funds Trust, Private Advisors Alternative Strategies Fund, Private Advisors Alternative Strategies Master Fund and MainStay DefinedTerm Municipal Opportunities Fund (since 2014); Director and Associate General Counsel (2011 to 2014) and Vice President and Assistant General Counsel (2010 to 2011), New York Life Investment Management LLC; Assistant Secretary, The MainStay Funds, MainStay Funds Trust and MainStay VP Funds Trust (2010 to 2014)**, Private Advisors Alternative Strategies Fund, Private Advisors Alternative Strategies Master Fund and MainStay DefinedTerm Municipal Opportunities Fund (2011 to 2014); Associate, Dechert LLP (2006 to 2010) | ||||||
J. Kevin Gao 10/13/67 | Secretary and Chief Legal Officer, MainStay Funds Trust (since 2010) | Managing Director and Associate General Counsel, New York Life Investment Management LLC (since 2010); Secretary and Chief Legal Officer, Private Advisors Alternative Strategies Master Fund, Private Advisors Alternative Strategies Fund and MainStay DefinedTerm Municipal Opportunities Fund (since 2011) and The MainStay Funds and MainStay VP Funds Trust (since 2010)**; Director and Counsel, Credit Suisse; Chief Legal Officer and Secretary, Credit Suisse Asset Management LLC and Credit Suisse Funds (2003 to 2010) | ||||||
Scott T. Harrington 2/8/59 | Vice President—Administration, MainStay Funds Trust (since 2009) | Director, New York Life Investment Management LLC (including predecessor advisory organizations) (since 2000); Member of the Board of Directors, New York Life Trust Company (since 2009); Vice President—Administration, Private Advisors Alternative Strategies Master Fund, Private Advisors Alternative Strategies Fund and MainStay DefinedTerm Municipal Opportunities Fund (since 2011) and The MainStay Funds and MainStay VP Funds Trust (since 2005)** |
| * | The Officers listed above are considered to be “interested persons” of the MainStay Group of Funds within the meaning of the 1940 Act because of their affiliation with the MainStay Group of Funds, New York Life Insurance Company, New York Life Investment Management LLC, New York Life Insurance Company, New York Life Investment Management LLC, NYLIFE Securities LLC and/or NYLIFE Distributors LLC, as described in detail in the column captioned “Principal Occupation(s) During Past Five Years.” Officers are elected annually by the Board of Trustees to serve a one year term. |
| ** | Includes prior service as an Officer of MainStay VP Series Fund, Inc., the predecessor to MainStay VP Funds Trust. |
| 50 | MainStay Marketfield Fund |
MainStay Funds
MainStay offers a wide range of Funds for virtually any investment need. The full array of MainStay open-end offerings is listed here, with information about the manager, subadvisors, legal counsel and independent registered public accounting firms.
Equity
U.S. Equity Funds
MainStay Common Stock Fund
MainStay Cornerstone Growth Fund
MainStay Epoch U.S. All Cap Fund
MainStay Epoch U.S. Equity Yield Fund
MainStay ICAP Equity Fund
MainStay ICAP Select Equity Fund
MainStay Large Cap Growth Fund
MainStay MAP Fund
MainStay S&P 500 Index Fund
MainStay U.S. Equity Opportunities Fund
MainStay U.S. Small Cap Fund
International/Global Equity Funds
MainStay Emerging Markets Opportunities Fund
MainStay Epoch Global Choice Fund
MainStay Epoch Global Equity Yield Fund
MainStay Epoch International Small Cap Fund
MainStay ICAP Global Fund
MainStay ICAP International Fund
MainStay International Equity Fund
MainStay International Opportunities Fund
Income
Taxable Bond Funds
MainStay Floating Rate Fund
MainStay Global High Income Fund
MainStay Government Fund
MainStay High Yield Corporate Bond Fund
MainStay High Yield Opportunities Fund
MainStay Indexed Bond Fund
MainStay Short Duration High Yield Fund
MainStay Short Term Bond Fund
MainStay Total Return Bond Fund
MainStay Unconstrained Bond Fund
Municipal Bond Funds
MainStay California Tax Free Opportunities Fund1
MainStay High Yield Municipal Bond Fund
MainStay New York Tax Free Opportunities Fund2
MainStay Tax Free Bond Fund
Money Market Fund
MainStay Money Market Fund
Mixed Asset
MainStay Balanced Fund
MainStay Convertible Fund
MainStay Income Builder Fund
Asset Allocation/Target Date
MainStay Conservative Allocation Fund
MainStay Growth Allocation Fund
MainStay Moderate Allocation Fund
MainStay Moderate Growth Allocation Fund
MainStay Retirement 2010 Fund
MainStay Retirement 2020 Fund
MainStay Retirement 2030 Fund
MainStay Retirement 2040 Fund
MainStay Retirement 2050 Fund
Alternative
MainStay Cushing MLP Premier Fund
MainStay Cushing Renaissance Advantage Fund
MainStay Cushing Royalty Energy Income Fund
MainStay Marketfield Fund
Manager
New York Life Investment Management LLC
New York, New York
Subadvisors
Cornerstone Capital Management Holdings LLC3
New York, New York
Cornerstone Capital Management LLC3
Bloomington, Minnesota
Cushing Asset Management, LP
Dallas, Texas
Epoch Investment Partners, Inc.
New York, New York
Institutional Capital LLC3
Chicago, Illinois
MacKay Shields LLC3
New York, New York
Marketfield Asset Management LLC
New York, New York
Markston International LLC
White Plains, New York
NYL Investors LLC3
New York, New York
Winslow Capital Management LLC
Minneapolis, Minnesota
Legal Counsel
Dechert LLP
Independent Registered Public Accounting Firms
KPMG LLP4
PricewaterhouseCoopers LLP5
1. This Fund is only registered for sale in AZ, CA, NV, OR, UT, and WA.
2. This Fund is only registered for sale in CT, DE, FL, MA, NJ, NY, and VT.
3. An affiliate of New York Life Investment Management LLC.
4. For all Funds listed above except MainStay Marketfield Fund.
5. For MainStay Marketfield Fund only.
Not part of the Annual Report
For more information
800-MAINSTAY (624-6782)
mainstayinvestments.com
MainStay Investments® is a registered service mark and name under which New York Life Investment Management LLC does business. MainStay Investments, an indirect subsidiary of New York Life Insurance Company, New York, NY 10010, provides investment advisory products and services. The MainStay Funds® are managed by New York Life Investment Management LLC and distributed through NYLIFE Distributors LLC, 169 Lackawanna Avenue, Parsippany, NJ 07054, a wholly owned subsidiary of New York Life Insurance Company. NYLIFE Distributors is a Member FINRA/SIPC.
©2015 by NYLIFE Distributors LLC. All rights reserved.
| Not FDIC/NCUA Insured | Not a Deposit | May Lose Value | No Bank Guarantee | Not Insured by Any Government Agency |
| 1637809 MS022-15 | MSMK11-02/15 (NYLIM) NL062 |
Item 2. Code of Ethics.
As of the end of the period covered by this report, the Registrant has adopted a code of ethics (the “Code”) that applies to the Registrant’s principal executive officer (“PEO”) and principal financial officer (“PFO”). A copy of the Code is filed herewith. The Registrant did not grant any waivers, including implicit waivers, from any provisions of the Code to the PEO or PFO during the period covered by this report.
| Item 3. | Audit Committee Financial Expert. |
The Board of Trustees has determined that the Registrant has two audit committee financial experts serving on its Audit Committee. The Audit Committee financial experts are Alan R. Latshaw and Roman L. Weil. Messrs. Latshaw and Weil are “independent” within the meaning of that term under the Investment Company Act of 1940.
| Item 4. | Principal Accountant Fees and Services. |
(a) Audit Fees
The aggregate fees billed for the fiscal year ended December 31, 2014 for professional services rendered by PricewaterhouseCoopers LLP (“PwC”) for the audit of the Registrant’s annual financial statements or services that are normally provided by PwC in connection with statutory and regulatory filings or engagements for that fiscal year were $118,000.
The aggregate fees billed for the fiscal year ended December 31, 2013 for professional services rendered by PwC for the audit of the Registrant’s annual financial statements or services that are normally provided by PwC in connection with statutory and regulatory filings or engagements for that fiscal year were $82,500.
(b) Audit-Related Fees
The aggregate fees billed for assurance and related services by PwC that are reasonably related to the performance of the audit of the Registrant’s financial statements and are not reported under paragraph (a) of this Item were: (i) $0 for the fiscal year ended December 31, 2014, and (ii) $0 for the fiscal year ended December 31, 2013. These audit-related services include review of financial highlights for Registrant’s registration statements and issuance of consents to use the auditor’s reports.
(c) Tax Fees
The aggregate fees billed for professional services rendered by PwC for tax compliance, tax advice, and tax planning were: (i) $0 during the fiscal year ended December 31, 2014, and (ii) $20,000 during the fiscal year ended December 31, 2013. These services primarily included preparation of federal, state and local income tax returns and excise tax returns, as well as services relating to excise tax distribution requirements.
(d) All Other Fees
The aggregate fees billed for products and services provided by PwC, other than the services reported in paragraphs (a) through (c) of this Item were: (i) $0 during the fiscal year ended December 31, 2014, and (ii) $0 during the fiscal year ended December 31, 2013.
(e) Pre-Approval Policies and Procedures
| (1) | The Registrant’s Audit Committee has adopted pre-approval policies and procedures (the “Procedures”) to govern the Committee’s pre-approval of (i) all audit services and permissible non-audit services to be provided to the Registrant by its independent accountant, and (ii) all permissible non-audit services to be provided by such independent accountant to the Registrant’s investment adviser and to any entity controlling, controlled by or under common control with the investment adviser that provides ongoing services to the Registrant (collectively, the “Service Affiliates”) if the services directly relate to the Registrant’s operations and financial reporting. In accordance with the Procedures, the Audit Committee is responsible for the engagement of the independent accountant to certify the Registrant’s financial statements for each fiscal year. With respect to the pre-approval of non-audit services provided to the Registrant and its Service Affiliates, the Procedures provide that the Audit Committee may annually pre-approve a list of the types of services that may be provided to the Registrant or its Service Affiliates, or the Audit Committee may pre-approve such services on a project-by-project basis as they arise. Unless a type of service has received general pre-approval, it will require specific pre-approval by the Audit Committee if it is to be provided by the independent accountant. The Procedures also permit the Audit Committee to delegate authority to one or more of its members to pre-approve any proposed non-audit services that have not been previously pre-approved by the Audit Committee, subject to the ratification by the full Audit Committee no later than its next scheduled meeting. To date, the Audit Committee has not delegated such authority. |
| (2) | With respect to the services described in paragraphs (b) through (d) of this Item 4, no amount was approved by the Audit Committee pursuant to paragraph (c)(7)(i)(C) of Rule 2-01 of Regulation S-X. |
(f) There were no hours expended on PwC’s engagement to audit the Registrant’s financial statements for the most recent fiscal year was attributable to work performed by persons other than PwC’s full-time, permanent employees.
(g) All non-audit fees billed by PwC for services rendered to the Registrant for the fiscal years ended December 31, 2014 and December 31, 2013 are disclosed in 4(b)-(d) above.
The aggregate non-audit fees billed by PwC for services rendered to the Registrant’s investment adviser (not including any sub-adviser whose role is primarily portfolio management and is subcontracted with or overseen by another investment adviser), and any entity controlling, controlled by, or under common control with the adviser that provides ongoing services to the Registrant were approximately: (i) $3,400,000 for the fiscal year ended December 31, 2014, and (ii) $2,700,000 for the fiscal year ended December 31, 2013.
(h) The Registrant’s Audit Committee has determined that the non-audit services rendered by PwC for the fiscal year ended December 31, 2014 to the Registrant’s investment adviser and any entity controlling, controlled by, or under common control with the Registrant’s investment adviser that provides ongoing services to the Registrant that were not required to be pre-approved by the Audit Committee because they did not relate directly to the operations and financial reporting of the registrant were compatible with maintaining the respective independence of PwC during the relevant time period.
| Item 5. | Audit Committee of Listed Registrants |
Not applicable.
| Item 6. | Schedule of Investments |
The Schedule of Investments is included as part of Item 1 of this report.
| Item 7. | Disclosure of Proxy Voting Policies and Procedures for Closed-End Management Investment Companies. |
Not applicable.
| Item 8. | Portfolio Managers of Closed-End Management Investment Companies. |
Not applicable.
| Item 9. | Purchases of Equity Securities by Closed-End Management Investment Company and Affiliated Purchasers. |
Not Applicable.
| Item 10. | Submission of Matters to a Vote of Security Holders. |
Since the Registrant’s last response to this Item, there have been no material changes to the procedures by which shareholders may recommend nominees to the Registrant’s Board of Trustees.
Item 11. Controls and Procedures.
(a) Based on an evaluation of the Registrant’s Disclosure Controls and Procedures (as defined in Rule 30a-3(c) under the Investment Company Act of 1940) (the “Disclosure Controls”), as of a date within 90 days prior to the filing date (the “Filing Date”) of this Form N-CSR (the “Report”), the Registrant’s principal executive officer and principal financial officer have concluded that the Disclosure Controls are reasonably designed to ensure that information required to be disclosed by the Registrant in the Report is recorded, processed, summarized and reported by the Filing Date, including ensuring that information required to be disclosed in the Report is accumulated and communicated to the Registrant’s management, including the Registrant’s principal executive officer and principal financial officer, as appropriate to allow timely decisions regarding required disclosure.
(b) There were no changes in the Registrant’s internal control over financial reporting (as defined in Rule 30a-3(d)) under the Investment Company Act of 1940 that occurred during the second fiscal quarter of the period covered by this report that has materially affected, or is reasonably likely to materially affect, the Registrant’s internal control over financial reporting.
Item 12. Exhibits.
(a)(1) Code of Ethics
(a)(2) Certifications of principal executive officer and principal financial officer as required by Rule 30a-2 under the Investment Company Act of 1940.
(b) Certifications of principal executive officer and principal financial officer as required by Section 906 of the Sarbanes-Oxley Act of 2002.
SIGNATURES
Pursuant to the requirements of the Securities Exchange Act of 1934 and the Investment Company Act of 1940, the Registrant has duly caused this Report to be signed on its behalf by the undersigned, thereunto duly authorized.
MAINSTAY FUNDS TRUST
| By: | /s/ Stephen P. Fisher | |
Stephen P. Fisher President and Principal Executive Officer | ||
Date: | March 6, 2015 | |
Pursuant to the requirements of the Securities Exchange Act of 1934 and the Investment Company Act of 1940, this Report has been signed below by the following persons on behalf of the Registrant and in the capacities and on the dates indicated.
| By: | /s/ Stephen P. Fisher | |
Stephen P. Fisher President and Principal Executive Officer | ||
| Date: | March 6, 2015 | |
| By: | /s/ Jack R. Benintende | |
Jack R. Benintende Treasurer and Principal Financial and Accounting Officer | ||
| Date: | March 6, 2015 | |
EXHIBIT INDEX
(a)(1) | Code of Ethics | |
(a)(2) | Certifications of principal executive officer and principal financial officer as required by Rule 30a-2 under the Investment Company Act of 1940. | |
(b) | Certification of principal executive officer and principal financial officer as required by Section 906 of the Sarbanes-Oxley Act of 2002. | |