| OMB APPROVAL | ||||
| OMB Number: 3235-0570 | ||||
| Expires: January 31, 2017 | ||||
| Estimated average burden hours | ||||
| per response. . . ..20.6 |
UNITED STATES
SECURITIES AND EXCHANGE COMMISSION
Washington, D.C. 20549
Form N-CSR
CERTIFIED SHAREHOLDER REPORT OF REGISTERED MANAGEMENT
INVESTMENT COMPANIES
Investment Company Act File Number 811-22321
MAINSTAY FUNDS TRUST
(Exact name of Registrant as specified in charter)
51 Madison Avenue, New York, NY 10010
(Address of principal executive offices) (Zip code)
J. Kevin Gao, Esq.
169 Lackawanna Avenue
Parsippany, New Jersey 07054
(Name and address of agent for service)
Registrant’s telephone number, including area code: (212) 576-7000
Date of fiscal year end: November 30
(MainStay Cushing MLP Premier Fund, MainStay Cushing Renaissance Advantage Fund and MainStay Cushing Royalty Energy Income Fund only)
Date of reporting period: November 30, 2014
FORM N-CSR
The information presented in this Form N-CSR relates solely to the
MainStay Cushing MLP Premier Fund, MainStay Cushing Renaissance Advantage Fund and MainStay
Cushing Royalty Energy Income Fund, each a series of the Registrant.
Item 1. Reports to Stockholders.
MainStay Cushing® Funds
Message from the President, Cushing® Asset Management, LP Commentary and Annual Report
November 30, 2014

MainStay Cushing® MLP Premier Fund
MainStay Cushing® Renaissance Advantage Fund
MainStay Cushing® Royalty Energy Income Fund

This page intentionally left blank
Message from the President
Whether you are new to the MainStay family or have invested with us for many years, we are pleased to have you as a shareholder of the MainStay Cushing Funds.
All MainStay Cushing Funds continue to provide the portfolio management capability and market insight of Cushing Asset Management, LP. Their consistent use of time-tested investment principles and risk-management techniques can be comforting in light of the volatility that the energy markets have experienced in recent months.
The Cushing Asset Management, LP, Fiscal Year-End Commentary that follows contains detailed information about up-stream, midstream and downstream energy companies. It looks at the U.S. Energy Renaissance and explains how various energy providers have dealt with recent market volatility. Most importantly, it shows why an optimistic outlook may be warranted.
The annual report for the MainStay Cushing Funds for the 12 months ended November 30, 2014, also follows. The report contains more detailed information about the market forces,
investment decisions and specific holdings that affected your MainStay Cushing Fund investment(s) during the reporting period.
We encourage you to read this information carefully and use it as you evaluate the progress of your investment portfolio. We welcome Cushing Asset Management, LP, to the MainStay family, and we thank you for choosing MainStay Funds.
Sincerely,

Stephen P. Fisher
President
The opinions expressed are as of the date of this report and are subject to change. There is no guarantee that any forecast made will come to pass. This material does not constitute investment advice and is not intended as an endorsement of any specific investment. Past performance is no guarantee of future results.
Not part of the Annual Report
Cushing Asset Management, LP Fiscal Year-End Commentary
Midstream MLPs
For the bulk of the 12-month reporting period ending November 30, 2014, fundamentals were quite favorable for the midstream master limited partnership (“MLP”) space. Key themes driving positive fundamentals included: 1) good earnings results, particularly for natural gas pipeline companies with capacity available to take advantage of extreme winter weather in late 2013 and early 2014; 2) continuing supply takeaway announcements, such as new long-haul Bakken crude pipelines, a significant ethane export terminal project and numerous sizable natural gas pipeline project proposals related to the Marcellus/Utica takeaway; 3) merger and acquisition activity and strategic restructurings spurred by the pursuit of growth, including several “drop-down” transactions and proposals for MLP consolidation; 4) numerous initial public offerings and the ongoing “MLP-ification” trend (assets moving into MLP structures), including an important announcement by an energy “major” to form an MLP; and 5) positive fund flows into MLP-focused investment products. Continuing the trend of the past few years, the rapid and dramatically shifting dynamics related to midstream infrastructure has created both challenges and opportunities for individual MLPs.
The vast majority of energy infrastructure needed to support continued shale development is being built and developed by MLPs. In addition to the significant capex backlogs of existing MLPs, we believe the numerous announcements and filings for new MLPs in the past year alone highlight the positive attributes of the MLP structure (assets moving into the MLP structure is a trend we have historically referred to as the “MLP-ification” of the energy space). Noteworthy examples of “MLP-ification” this year included IPOs from large sponsors such as Royal Dutch Shell PLC (NYSE: RDS), Antero Resources Corp. (AM), Dominion Resources, Inc. (NYSE: D), CONSOL Energy Inc. (NYSE: CNX), Noble Energy, Inc. (NYSE: NBL), Transocean Ltd. (NYSE: RIG), Westlake Chemical Corp. (NYSE: WLKP), CenterPoint Energy, Inc. (NYSEL CNP) and OGE Energy Corp. (NYSE: OGE). We believe the MLP structure remains a preferred vehicle to house midstream assets as well as a means to unlock value, via the general partner and associated incentive distribution rights (“IDRs”), at the parent/sponsor level.
IPO activity was robust, with 16 MLP public offerings launched and priced in the six months ending November 2014, as compared to a total of six IPOs for the prior six-month period ending May 2014. In addition, there were 14 planned MLP IPOs on file with the SEC with plans for potential launch in the future.
Asset flows into MLP-focused pooled products and general demand for equity capital from MLPs were supportive of the IPOs launched during the period. According to U.S. Capital Advisors, total assets for U.S. MLP-focused open-end mutual funds, closed-end funds, exchange traded products and exchange traded notes increased by $23 billion during the
period from December 2013 to November 2014, representing a 42% year-over-year increase and resulting in a total asset size for MLP products of approximately $78 billion.1 We continue to closely monitor these inflows as we believe this has been a significant contributor to MLP performance.
Merger and acquisition activity was also elevated, including MLP consolidation, as larger MLPs focused on M&A to further diversify and integrate their assets into new business areas as well as gain access to new production regions. There were numerous acquisition/merger announcements this year, including Williams Companies, Inc. (NYSE: WMB)/Williams Partners, L.P. (NYSE:WPZ) acquiring Access Midstream Partners, L.P. (NYSE:ACMP), NGL Energy Partners, LP (NYSE: NGL) acquiring Transmontaigne Partners, L.P. (NYSE: TLP), Kinder Morgan, Inc. (NYSE: KMI) acquiring Kinder Morgan Energy Partners, LP (NYSE: KMP)/Kinder Morgan Management, LLC (NYSE: KMR)/El Paso Pipeline Partners, LP (NYSE: EPB) and Targa Resources Corp. (NYSE:TRGP)/Targa Resources Partners, LP (NYSE:NGLS) acquiring Atlas Energy, LP (NYSE:ATLS)/Atlas Pipeline Partners, LP (NYSE:APL).
However, the positive fundamental landscape and investor sentiment changed significantly with the precipitous decline in crude and natural gas liquids (“NGL”) prices beginning in the summer of 2014, and prices were further aggravated by the OPEC (Organization of the Petroleum Exporting Countries) decision in November 2014 to maintain its targeted crude production ceiling. Crude prices fell sharply towards the end of the fiscal year in large part, we believe, due to robust production, global growth concerns, geopolitical issues and dollar strength.
This dramatic price decline sent shockwaves through the energy industry. For example, many exploration and production (“E&P”) companies materially lowered their 2015 cap-ex budgets (i.e. reducing planned drilling and expected production growth) and indicated an intent to focus spending on higher return areas within their respective footprint. According to Bentek’s internal rate of return (“IRR”) estimates, most of the major oil plays in the U.S. yield IRRs between 20% and 30% at a wellhead price as low as $60/bbl.2
It is important to note that this is an ongoing development affecting plays and companies/partnerships in different ways and to different degrees (for example, depending on the type of business, the location of the asset, the customer, the type of contract, etc.). For the time being, many midstream MLP management teams have stated they have yet to see volumetric impacts for their systems or anticipate significant reductions in their backlog of organic growth projects. However, MLP investors have apparently re-priced MLP equities based not only on direct commodity price impacts (for those contracts with commodity price sensitivity) but on anticipated throughput and/or project backlog reductions as well. Subsectors that have performed worse on a relative basis over the past few months
| 1. | “USCA MLP Weekly” US Capital Advisors., 12/8/14. |
| 2. | “Production Junction, What’s That Price Function?” Bentek Energy LLC., 11/4/14. |
Not part of the Annual Report
are generally more commodity price sensitive and include natural gas gatherers & processors, shipping, coal, upstream MLPs, variable distribution MLPs and general partners. We expect continued volatility in MLP trading until we get additional clarity into E&P cap-ex plans and commodity prices stabilize.
Despite the increased volatility in unit prices, there are numerous examples of MLPs whose earnings and growth attributes have been thus far largely unaffected by the current commodity price environment. For example, select “dropdown” MLPs have predominately fee-based cash flow and multi-year growth opportunities supported by visible (sometimes guaranteed) acquisitions from their parent sponsor. These partnerships typically have minimum volume commitments (“MVCs”) which, along with visible dropdown acquisitions, generally allow the partnership to maintain earnings growth through any commodity price weakness. As an example and despite the current crude market weakness, management of the recently formed Shell Midstream Partners, LP (NYSE: SHLX) is guiding towards approximately 20% annual distribution growth for at least the next 10 years. Additionally, MPLX, LP (the MLP formed by Marathon Petroleum Corp.) recently updated their guidance to mid-20% annual distribution growth for at least the next five years. Although lower yielding, we continue to believe these dropdown MLPs offer investors a very attractive risk-adjusted combination of yield and growth.
In the midst of the current market turmoil, we continue to monitor relevant credit spreads, which have historically been an early warning signal for trouble ahead in the MLP space. While these spreads have widened, they remain below longer-term averages and below recent peaks experienced during 2011 and 2008-2009.
We believe interest rates have taken a back seat to the focus on crude oil and related NGL dynamics. Nonetheless, while there have been bouts of heightened market anxiety surrounding monetary policy and the timing/trajectory of interest rate “lift-off,” interest rates continue to remain low and currently provide a favorable backdrop for midstream MLPs. We believe the market generally expects the Federal Reserve to begin increasing the Fed Funds rate as early as June 2015, and we shall see if we get a “rate tantrum” as we approach that point in time.
While we remain confident in the long-term need for infrastructure and positive return potential for MLPs, the rapid decline in crude oil prices has created significant near-term headwinds and uncertainty for the space. This is an ongoing and rapidly changing development and the industry is currently assessing and working through the implications of a lower crude price environment. A prolonged period of low crude oil prices is likely to reduce drilling activity, which would result in a lower production growth trajectory. Although this could result in fewer future organic growth opportunities for MLPs, we do not believe this will have an impact on current projects under development, most all of which are supported by long term commitments.
Nonetheless, we have stress tested our models to better understand the cash flow impact for midstream companies from the recent oil price fluctuations.
We believe the midstream energy sector continues to provide a compelling long term risk-adjusted total return potential through a combination of current yield with growth. In the near term, we expect continued equity volatility until commodity prices stabilize and we gain a better understanding of expected E&P spending plans. Importantly, we do not invest in the asset class as a whole; we continue to seek attractive investment opportunities based upon our fundamental and bottom-up research process.
Upstream MLPs & Royalty Trusts
While there were multiple macro-economic factors that impacted equity markets during the fiscal period, particularly in October of 2014, including the International Monetary Fund’s cut to its global growth forecasts, the spread of the Ebola outbreak to Europe and the U.S., concerns of a recession in Germany, and further decreases in China’s growth outlook, the U.S. equity market continued to perform reasonably well. Furthermore, U.S. economic data continued to be on the positive side, but global growth concerns and a strengthening U.S. dollar were factors that the Federal Reserve cited for its decision not to increase short-term interest rates for the time being. The most significant event that impacted upstream master limited partnerships (“upstream MLPs”) and U.S. and Canadian royalty trusts and energy companies (“energy trusts”) during the period was the decline in crude oil prices resulting primarily from OPEC’s November 2014 announcement that it would maintain current production quotas in the face of a widely projected oversupplied global crude oil market in the first half of 2015. Adding to the weakness in crude oil prices were Saudi Arabia’s comments that it would defend its market share to existing customers and would not decrease production in order to support crude oil prices.
The upstream MLP and energy trust subsectors have each continued to grow, mature and evolve. Deal flow and acquisition activity by upstream MLPs continued to be robust until the recent dramatic fall in crude oil prices. Clearly, it will take time for buyers and sellers of oil and natural gas assets to adjust to this new crude oil price environment and the subsequent changes in their cost of capital, liquidity and the conditions of their balance sheets. We anticipate deal flow and acquisitions by upstream MLPs will continue, but it will likely take time to recover to the pace we witnessed over the last several quarters. Furthermore, if current lower crude oil prices persist for a prolonged period of time, some upstream MLPs may need to reduce distribution levels to a sustainable level commensurate with a lower commodity price environment. On the other hand, in this lower crude oil price environment we believe many E&P companies may be forced to sell attractive and/or mature oil and natural gas assets in order to fill funding gaps for their drilling development programs or de-lever their balance sheets.
Not part of the Annual Report
We remain focused on the favorable long-term fundamental attributes of upstream MLPs and energy trusts and the potential for attractive total returns based on current yield and expected distributions. We will continue to seek out stocks with attractive valuations and long-term growth opportunities, as well as those with near-term catalysts.
U.S. Energy Renaissance
For a majority of 2014, the U.S. Energy Renaissance continued to strengthen as the natural gas export theme and infrastructure build-out associated with the U.S. shale revolution moved forward. The beneficiaries of the Renaissance theme continued to be dynamic, shifting significantly during the last half of the year with the dramatic decline in crude oil prices. Industries which may not have been as compelling in a high crude oil price environment became favorable as the price of West Texas Intermediate (“WTI”) crude oil dropped from approximately $108 per barrel in late June to approximately $66 per barrel at the end of November.
Throughout the first half of the year, the discount of U.S. natural gas prices to global natural gas prices created a competitive advantage in several industries. The incentive to take advantage of the price arbitrage through exporting natural gas as liquefied natural gas (“LNG”) was a large driving force behind multiple companies filing for permits to build LNG export facilities along the coasts (primarily the Gulf Coast). Projects sponsored by ConocoPhillips (NYSE: COP), Energy Transfer Partners, L.P. (NYSE: ETP) and Sempra Energy (NYSE: SRE) received approval to begin construction in 2014, joining the project by Cheniere Energy, Inc. (NYSE: LNG) already under construction. On the same note, U.S. industries that have a high energy input cost, such as the manufacturing, industrials and chemicals industries, were able to realize a significant competitive advantage through a reduction in operating expense as U.S. natural gas prices remained at a significant discount to natural gas prices around the world. This advantage not only drove higher margins for companies currently operating domestically, but also drove jobs back to the U.S. that had largely moved overseas for the past 20 years. The competitive price advantage incentivized domestic companies to increase their production capacity, which led to a significant expansion in manufacturing
and chemical plants. This expansion created heightened demand for industrial companies involved with design, construction and supply. In addition to the impact from the natural gas price dynamic, the increased production of crude oil and natural gas drove infrastructure build-out and a need for alternative means of transporting crude oil, which benefitted multiple industries. Production across the U.S. was growing at a faster pace than the midstream sector was able to accommodate, which provided an opportunity for companies within the rail, trucking and barge sectors to transport a portion of the additional volumes. This benefit transcended into ancillary industries including rail car manufacturers, rail car component manufacturers and inland barge manufacturers as the demand for their products and services increased.
As oil prices steadily declined during the latter half of the year, the beneficiaries within the scope of the U.S. Energy Renaissance shifted to those who benefitted from a lower price environment. The reduced price of crude oil ultimately resulted in significantly lower gasoline prices, which had a positive impact on operating expense for companies with fuel expense as a high input cost in their operations, similar to the dynamic mentioned previously with natural gas. Beneficiaries of low oil prices within the Renaissance universe include trucking companies, auto and auto part manufacturers, retail gas companies and airlines. Although the decrease in crude oil prices created a new dynamic within the Renaissance theme, the drop in natural gas prices only served as further support to the theme. The industries which gained a competitive price advantage versus global pricing were able to further reduce their operating costs with respect to natural gas and natural gas liquids (“NGLs”). Additionally, a low crude oil price environment has historically been a positive driver for domestic gross domestic product, which ultimately drives additional growth opportunities for a majority of the industries within the scope of the Renaissance universe. Due to the dynamic theme and broad scope of the U.S. Energy Renaissance, the industries and companies which see the greatest benefit can vary in different macroeconomic environments. Through active management, we believe portfolio holdings can be adapted to capitalize on the opportunities created by the U.S. Energy Renaissance as it plays out over the next several years.
The information provided herein represents the opinion of the Portfolio Manager and is not intended to be a forecast of future events, a guarantee of future results, nor investment advice.
Not part of the Annual Report
Investors should refer to each Fund’s Summary Prospectus and/or Prospectus and consider each Fund’s investment objectives, strategies, risks, charges and expenses carefully before investing. The Summary Prospectus and/or Prospectus contain this and other information about each Fund. You may obtain copies of each Fund’s Summary Prospectus, Prospectus and Statement of Additional Information free of charge, upon request, by calling toll-free 800-MAINSTAY (624-6782), by writing to NYLIFE Distributors LLC, Attn: MainStay Marketing Department, 169 Lackawanna Avenue, Parsippany, New Jersey 07054 or by sending an e-mail to MainStayShareholderServices@nylim.com. These documents are also available via the MainStay Funds’ website at mainstayinvestments.com/documents. Please read each Summary Prospectus and/or Prospectus carefully before investing.
MainStay Cushing MLP Premier Fund
Investment and Performance Comparison1 (Unaudited)
Performance data quoted represents past performance. Past performance is no guarantee of future results. Because of market volatility, current performance may be lower or higher than the figures shown. Investment return and principal value will fluctuate, and as a result, when shares are redeemed, they may be worth more or less than their original cost. The graph below depicts the historical performance of Class I shares of the Fund. Performance will vary from class to class based on differences in class-specific expenses and sales charges. For performance information current to the most recent month-end, please call 800-MAINSTAY (624-6782) or visit mainstayinvestments.com.

Average Annual Total Returns for the Year Ended November 30, 2014
| Class | Sales Charge | One Year | Since Inception (10/20/10) | Gross Expense Ratio2 | ||||||||||||
| Class A Shares4 | Maximum 5.5% Initial Sales Charge | With sales charge Excluding sales charge |
| 3.67 10.00 | %
|
| 7.45 9.01 | %
|
| 9.42 9.42 | %
| |||||
| Investor Class Shares3 | Maximum 5.5% Initial Sales Charge | With sales charge Excluding sales charge |
| 3.67 10.00 |
|
| 7.45 9.01 |
|
| 9.42 9.42 |
| |||||
| Class C Shares4 | Maximum 1% CDSC if Redeemed Within One Year of Purchase | With sales charge Excluding sales charge | | 8.19 9.19 | | | 8.18 8.18 | |
| 10.17 10.17 |
| |||||
| Class I Shares4 | No Sales Charge | 10.25 | 9.28 | 9.17 | ||||||||||||
| 1. | The performance table and graph do not reflect the deduction of taxes that a shareholder would pay on distributions or Fund share redemptions. Total returns reflect maximum applicable sales charges as indicated in the table above, changes in share price, and reinvestment of dividend and capital gain distributions. The graph assumes the initial investment amount shown above and reflects the deduction of all sales charges that would have applied for the period of investment. Performance figures reflect certain fee waivers and/or expense limitations, without which total returns may have been lower. For more information on share classes and current fee waivers and/or expense limitations, please refer to the notes to the financial statements. |
| 2. | The gross expense ratios presented reflect the Fund’s “Total Annual Fund Operating Expenses” from the most recent Prospectus and may differ from other expense ratios disclosed in this report. |
| 3. | Performance figures for Investor Class shares, first offered on July 11, 2014, include the historical performance of Class A shares through July 10, 2014, adjusted for differences in certain expenses and fees. Unadjusted, the performance shown for Investor Class shares would likely have been different. |
| 4. | Performance figures for Class A shares, Class C shares and Class I shares reflect the historical performance of the then-existing Class A shares, Class C shares and Class I shares, respectively, of the Cushing® MLP Premier Fund (the predecessor to the Fund, which was subject to a different fee structure) for periods prior to July 11, 2014. The Cushing® MLP Premier Fund commenced operations on October 20, 2010. |
The footnotes on the next page are an integral part of the table and graph and should be carefully read in conjunction with them.
| 8 | MainStay Cushing MLP Premier Fund |
Benchmark Performance | One Year | Since Inception | ||||||
S&P 500® Index5 | 16.86 | % | 17.13 | % | ||||
Average Lipper Energy MLP Fund6 | 11.65 | 11.36 | ||||||
| 5. | “S&P 500®” is a trademark of The McGraw-Hill Companies, Inc. The S&P 500® Index is widely regarded as the standard index for measuring large-cap U.S. stock market performance. The S&P 500® Index is the Fund’s primary benchmark. Results assume reinvestment of all dividends and capital gains. An investment cannot be made directly in an index. |
| 6. | The average Lipper Energy MLP Fund is representative of funds that invest primarily in Master Limited Partnerships (MLPs) engaged in the |
| transportation, storage and processing of minerals and natural resources. This benchmark is a product of Lipper Inc. Lipper Inc. is an independent monitor of fund performance. Results are based on total returns with all dividend and capital gain distributions reinvested. |
The footnotes on the preceding page are an integral part of the table and graph and should be carefully read in conjunction with them.
| 9 |
Cost in Dollars of a $1,000 Investment in MainStay Cushing MLP Premier Fund (Unaudited)
The example below is intended to describe the fees and expenses borne by shareholders during the six-month period from June 1, 2014, to November 30, 2014, and the impact of those costs on your investment.
Example
As a shareholder of the Fund, you incur two types of costs: (1) transaction costs, including exchange fees and sales charges (loads) on purchases (as applicable), and (2) ongoing costs, including management fees, distribution and/or service (12b-1) fees, and other Fund expenses (as applicable). This example is intended to help you understand your ongoing costs (in dollars) of investing in the Fund and to compare these costs with the ongoing costs of investing in other mutual funds. The example is based on an investment of $1,000 made at the beginning of the six-month period and held for the entire period from June 1, 2014, to November 30, 2014.
This example illustrates your Fund’s ongoing costs in two ways:
Actual Expenses
The second and third data columns in the table below provide information about actual account values and actual expenses. You may use the information in these columns, together with the amount you invested, to estimate the expenses that you paid during the six months ended November 30, 2014. Simply divide your account value by $1,000 (for example, an $8,600 account value divided by $1,000 = 8.6), then
multiply the result by the number under the heading entitled “Expenses Paid During Period” to estimate the expenses you paid on your account during this period.
Hypothetical Example for Comparison Purposes
The fourth and fifth data columns in the table below provide information about hypothetical account values and hypothetical expenses based on the Fund’s actual expense ratio and an assumed rate of return of 5% per year before expenses, which is not the Fund’s actual return. The hypothetical account values and expenses may not be used to estimate the actual ending account balances or expenses you paid for the six-month period shown. You may use this information to compare the ongoing costs of investing in the Fund with the ongoing costs of investing in other Funds. To do so, compare this 5% hypothetical example with the 5% hypothetical examples that appear in the shareholder reports of the other Funds.
Please note that the expenses shown in the table are meant to highlight your ongoing costs only and do not reflect any transactional costs, such as exchange fees or sales charges (loads). Therefore, the fourth and fifth data columns of the table are useful in comparing ongoing costs only and will not help you determine the relative total costs of owning different funds. In addition, if these transactional costs were included, your costs would have been higher.
| Share Class | Beginning Value | Ending Account Value (Based | Expenses During | Ending Account Value (Based on Hypothetical 5% Annualized Return and Actual Expenses) 11/30/2014 | Expenses During | |||||||||||||||
| Class A Shares4 | $ | 1,000.00 | $ | 991.30 | $ | 35.34 | $ | 989.57 | $ | 35.31 | ||||||||||
| Investor Class Shares1,3 | $ | 1,000.00 | $ | 948.80 | $ | 20.93 | $ | 997.98 | $ | 21.45 | ||||||||||
| Class C Shares4 | $ | 1,000.00 | $ | 987.80 | $ | 32.19 | $ | 992.68 | $ | 32.27 | ||||||||||
| Class I Shares4 | $ | 1,000.00 | $ | 992.70 | $ | 18.03 | $ | 1,006.97 | $ | 18.16 | ||||||||||
| 1. | Investor Class shares were first offered as of the close of business on July 11, 2014. |
| 2. | Expenses are equal to the Fund’s annualized expense ratio of each class (7.08% for Class A, 5.52% for Investor Class, 6.46% for Class C and 3.61% for Class I) multiplied by the average account value over the period, divided by 365 and multiplied by 183 for Class A, Class C, and Class I and 142 days for Investor Class (to reflect the six-month period). The table above represents the actual expenses incurred during the six-month period. |
| 3. | Expenses paid during the period reflect ongoing costs for the period from inception through November 30, 2014. Had these shares been offered for the full six-month period ended November 30, 2014, and had the Fund provided a hypothetical 5% annualized return, expenses paid during the period would have been $27.64 for Investor Class shares and the ending account value would have been $997.39 for Investor Class shares. |
| 4. | For the period from June 1, 2014 through July 11, 2014, expenses were from Predecessor Fund. |
| 10 | MainStay Cushing MLP Premier Fund |
Portfolio Composition as of November 30, 2014(1) (Unaudited)
(Expressed as a Percentage of Total Investments)

See Portfolio of Investments beginning on page 14 for specific holdings within these categories.
Top Ten Holdings as of November 30, 2014 (excluding short-term investment) (Unaudited)
| 1. | Kinder Morgan, Inc. |
| 2. | Energy Transfer Equity, L.P. |
| 3. | Williams Companies, Inc. |
| 4. | Energy Transfer Partners, L.P. |
| 5. | Targa Resources Corp. |
| 6. | Enbridge Energy Partners, L.P. |
| 7. | Regency Energy Partners, L.P. |
| 8. | Equitable Midstream Partners, L.P. |
| 9. | Atlas Pipeline Partners, L.P. |
| 10. | Access Midstream Partners, L.P. |
| (1) | Fund holdings and sector allocations are subject to change, and there is no assurance that the Fund will continue to hold any particular security. |
| (2) | Master Limited Partnerships and Related Companies |
| (3) | Preferred Stock |
| (4) | Common Stock |
| 11 |
Portfolio Management Discussion and Analysis (Unaudited)
Questions answered by portfolio managers Jerry V. Swank, Daniel L. Spears and Kevin P. Gallagher, CFA, of Cushing Asset Management, LP, the Fund’s Subadvisor.
How did MainStay Cushing MLP Premier Fund perform relative to its primary benchmark and peers for the 12 months ended November 30, 2014?
Excluding all sales charges, MainStay Cushing MLP Premier Fund returned 10.00% for Class A shares and Investor Class shares and 9.19% for Class C shares for the 12 months ended November 30, 2014. Over the same period, Class I shares returned 10.25%. For the 12 months ended November 30, 2014, all share classes underperformed the 16.86% return of the S&P 500® Index,1 which is the Fund’s primary broad-based securities-market index. Over the same period, all share classes underperformed the 11.65% return of the average Lipper2 Energy MLP Fund. See page 8 for Fund returns with applicable sales charges.
What factors affected the Fund’s performance relative to the S&P 500® Index during the reporting period?
The Fund is subject to fees and expenses and is taxed as a regular corporation, or “C” corporation, for federal income tax purposes. The S&P 500® Index, on the other hand, does not incur taxes, fees or expenses. During the reporting period, these were the primary factors that led the Fund to underperform the S&P 500® Index.
Which subsectors were the strongest contributors to the Fund’s absolute performance and which subsectors were particularly weak?
The top contributors to the Fund’s absolute performance dur- ing the reporting period were general partnerships, large cap diversified, and natural gas gatherers & processors. (Contribu- tions take weightings and total returns into account.) On average, these subsectors represented the highest Fund weightings during the reporting period, and each provided positive performance. The general partnerships subsector provided the strongest positive contribution given the actual and estimated distribution growth for its constituents relative to other MLPs. The subsectors with the weakest absolute performance were upstream MLPs, natural gas transportation & storage, and shipping. Although each of these sectors had negative performance, each also had a relatively modest weighting, which lessened the impact on the Fund. The upstream MLPs and shipping subsectors were particularly affected by the deteriorating commodity-price environment during the reporting period.
During the reporting period, which individual holdings made the strongest contributions to the Fund’s absolute performance and which holdings detracted the most?
The top contributors to the Fund’s absolute performance during the reporting period were Energy Transfer Equity L.P., a general
partnership; Kinder Morgan Management LLC, a large cap diversified MLP; and The Williams Companies, Inc., a general partnership. Both Energy Transfer Equity and The Williams Companies are general partners with projected double-digit multiyear distribution/dividend growth percentages at the end of the reporting period, driven by acquisitions and a healthy backlog of organic projects across a diverse asset base. Kin- der Morgan Management’s performance benefited from the announced consolidation acquisition by its parent company, Kinder Morgan, Inc. Major detractors from the Fund’s absolute performance during the reporting period included BreitBurn Energy Partners, L.P., an upstream MLP; Linn Energy, LLC, an upstream MLP; and Navios Maritime Partners L.P., a drybulk shipping MLP. Each of these detractors had negative absolute performance driven by the deteriorating commodity-price environment. As of December 9, 2014, which was shortly after the reporting period, the Fund had a reduced position in BreitBurn Energy Partners and no longer held Linn Energy, LLC.
Did the Fund make any significant purchases or sales during the reporting period?
During the reporting period, the Fund’s largest purchases were EQT Midstream Partners, L.P., a natural gas transportation & storage MLP, and Kinder Morgan, Inc., a general partnership with large, diversified underlying businesses. (On November 26, 2014, Kinder Morgan, Inc., completed the acquisition of its affiliate MLPs.) The Fund purchased EQT Midstream Partners because of its attractive visible distribution growth. This growth was driven by the parent’s inventory of assets available for “drop down” acquisitions and a strong position in the natural gas infrastructure build-out related to the growth of the Marcellus shale. The Fund purchased Kinder Morgan, Inc., because of an estimated underpricing of growth fueled by a sizable backlog of organic projects across several geographic areas and businesses along the energy midstream value chain. During the reporting period, the Fund’s largest sales were Williams Partners, L.P., a large cap diversified MLP, and Targa Resources Partners, L.P., a natural gas gatherer & processor. Both MLPs are involved with pending transactions to merge with other MLPs held by the Fund, and both sales were made to reduce combined exposure to the pro forma merged entities.
On December 1, 2014, which was immediately after the reporting period, the deteriorating commodity-price environment led the Fund to reduce positions in general partnerships, natural gas gatherers & processors, and upstream MLPs. These post-reporting-period sales represented just under 10% of the Fund’s exposure at that time.
| 1. | See footnote on page 9 for more information on the S&P 500® Index. |
| 2. | See footnote on page 9 for more information on Lipper Inc. |
| 12 | MainStay Cushing MLP Premier Fund |
How did the Fund’s subsector weightings change during the reporting period?
During the reporting period, the Fund increased exposure to the shipping, natural gas gatherers & processors, and general partnerships subsectors. The Fund decreased exposure to the crude oil & refined products, large cap diversified, and propane subsectors.
How was the Fund positioned at the end of the reporting period?
As of November 30, 2014, the Fund’s largest subsector position was natural gas gatherers & processors, followed by general
partnerships and large-cap diversified. As previously noted, the extraordinarily weak commodity-price environment led the Fund to reduce its positions in general partnerships, natural gas gatherers & processors, and upstream MLPs on December 1, 2014. These sales represented just under 10% of the Fund’s exposure at that time.
The opinions expressed are those of the portfolio managers as of the date of this report and are subject to change. There is no guarantee that any forecast made will come to pass. This material does not constitute investment advice and is not intended as an endorsement of any specific investment.
| 13 |
Portfolio of Investments November 30, 2014
| Shares | Value | |||||||
| Common Stock 24.0%† | ||||||||
General Partnership 12.3% | ||||||||
United States 12.3% |
| |||||||
¨Kinder Morgan, Inc. | 3,560,435 | $ | 147,223,976 | |||||
¨Targa Resources Corp. | 840,100 | 95,889,014 | ||||||
|
| |||||||
| 243,112,990 | ||||||||
|
| |||||||
Shipping 1.9% | ||||||||
Bermuda 1.9% | ||||||||
Golar LNG Ltd. | 895,000 | 37,160,400 | ||||||
|
| |||||||
Large Cap Diversified 9.8% |
| |||||||
United States 9.8% | ||||||||
ONEOK, Inc. | 1,424,800 | 77,167,168 | ||||||
¨Williams Companies, Inc. | 2,229,700 | 115,386,975 | ||||||
|
| |||||||
| 192,554,143 | ||||||||
|
| |||||||
Total Common Stock | 472,827,533 | |||||||
|
| |||||||
| Master Limited Partnerships and Related Companies 79.4% | ||||||||
Crude Oil & Refined Products 15.6% |
| |||||||
United States 15.6% |
| |||||||
Blueknight Energy Partners, L.P. | 2,161,200 | 15,517,416 | ||||||
¨Enbridge Energy Partners, L.P. | 2,382,800 | 89,355,000 | ||||||
Genesis Energy, L.P. | 860,000 | 37,865,800 | ||||||
NuStar Energy, L.P. | 1,108,500 | 62,076,000 | ||||||
Sunoco Logistics Partners, L.P. | 933,400 | 44,933,876 | ||||||
Tesoro Logistics, L.P. | 1,020,600 | 58,449,762 | ||||||
|
| |||||||
| 308,197,854 | ||||||||
|
| |||||||
General Partnerships 8.1% | ||||||||
United States 8.1% | ||||||||
Crestwood Equity Partners, L.P. | 316,124 | 2,845,116 | ||||||
¨Energy Transfer Equity, L.P. | 1,948,600 | 115,727,354 | ||||||
Plains GP Holdings L.P. | 1,555,000 | 40,398,900 | ||||||
|
| |||||||
| 158,971,370 | ||||||||
|
| |||||||
Large Cap Diversified 15.4% | ||||||||
United States 15.4% | ||||||||
¨Energy Transfer Partners, L.P. | 1,515,312 | 98,752,883 | ||||||
Enterprise Products Partners, L.P. | 1,694,250 | 63,263,295 | ||||||
Magellan Midstream Partners, L.P. | 771,615 | 63,959,167 | ||||||
ONEOK Partners, L.P. | 441,600 | 19,465,728 | ||||||
Plains All American Pipeline, L.P. | 1,125,905 | 57,927,812 | ||||||
|
| |||||||
| 303,368,885 | ||||||||
|
| |||||||
| Shares | Value | |||||||
Natural Gas Gatherers & Processors 27.2% |
| |||||||
United States 27.2% | ||||||||
¨Access Midstream Partners, L.P. | 1,240,300 | $ | 77,742,004 | |||||
¨Atlas Pipeline Partners, L.P. | 2,472,100 | 81,183,764 | ||||||
DCP Midstream Partners, L.P. | 1,226,000 | 58,737,660 | ||||||
Enable Midstream Partners, L.P. | 1,317,000 | 26,498,040 | ||||||
EnLink Midstream Partners, L.P. | 2,701,700 | 75,350,413 | ||||||
MarkWest Energy Partners, L.P. | 1,066,400 | 75,778,384 | ||||||
¨Regency Energy Partners, L.P. | 3,003,230 | 85,562,023 | ||||||
Western Gas Partners, L.P. | 772,600 | 54,800,518 | ||||||
|
| |||||||
| 535,652,806 | ||||||||
|
| |||||||
Natural Gas Transportation & Storage 4.1% |
| |||||||
United States 4.1% | ||||||||
¨EQT Midstream Partners, L.P. | 975,000 | 81,549,000 | ||||||
|
| |||||||
Propane 3.4% |
| |||||||
United States 3.4% |
| |||||||
NGL Energy Partners, L.P. | 1,918,652 | 66,960,955 | ||||||
|
| |||||||
Shipping 2.6% |
| |||||||
Republic of the Marshall Islands 2.6% |
| |||||||
Capital Product Partners, L.P. | 3,310,576 | 25,888,704 | ||||||
Navios Maritime Partners, L.P. | 1,916,000 | 24,831,360 | ||||||
|
| |||||||
| 50,720,064 | ||||||||
|
| |||||||
Upstream 3.0% | ||||||||
United States 3.0% | ||||||||
BreitBurn Energy Partners, L.P. | 2,662,500 | 35,171,625 | ||||||
Linn Energy, LLC | 1,362,800 | 24,871,100 | ||||||
|
| |||||||
| 60,042,725 | ||||||||
|
| |||||||
Total Master Limited Partnerships and Related Companies | 1,565,463,659 | |||||||
|
| |||||||
| Preferred Stock 0.8% | ||||||||
Crude Oil & Refined Products 0.8% |
| |||||||
United States 0.8% |
| |||||||
Blueknight Energy Partners, L.P. (a) | 1,902,541 | 16,742,361 | ||||||
|
| |||||||
Total Preferred Stock | 16,742,361 | |||||||
|
| |||||||
| † | Calculated as a percentage of net assets applicable to common shareholders. |
| ¨ | Among the Portfolio’s 10 largest holdings or issuers held, as of November 30, 2014, excluding short-term investments. May be subject to change daily. |
| 14 | MainStay Cushing MLP Premier Fund | The notes to the financial statements are an integral part of, and should be read in conjunction with, the financial statements. |
| Shares | Value | |||||||
| Short-Term Investments—Investment Companies 3.3% | ||||||||
United States 3.3% | ||||||||
AIM Short-Term Treasury Portfolio Fund—Institutional Class, 0.01% (b) | 13,039,583 | $ | 13,039,583 | |||||
Fidelity Government Portfolio Fund—Institutional Class, 0.01% (b) | 13,039,583 | 13,039,583 | ||||||
Fidelity Money Market Portfolio—Institutional Class, 0.05% (b) | 13,039,582 | 13,039,582 | ||||||
First American Government Obligations Fund—Class Z, 0.01% (b) | 13,039,582 | 13,039,582 | ||||||
Invesco STIC Prime Portfolio, 0.04% (b) | 13,039,583 | 13,039,583 | ||||||
|
| |||||||
Total Short-Term Investments | 65,197,913 | |||||||
|
| |||||||
Total Investments | 107.5 | % | 2,120,231,466 | |||||
Liabilities in Excess of Other Assets | (7.5 | ) | (148,575,321 | ) | ||||
Net Assets | 100.0 | % | $ | 1,971,656,145 | ||||
| (a) | Illiquid security – As of November 30, 2014, the total market value of this security was $16,742,361, which represented 0.08% of the Fund’s net assets. |
| (b) | Rate reported is the current yield as of November 30, 2014. |
| (c) | As of November 30, 2014, cost was $1,630,374,525 for federal income tax purposes and net unrealized appreciation was as follows: |
Gross unrealized appreciation | $ | 489,857,223 | ||
Gross unrealized depreciation | (282 | ) | ||
|
| |||
Net unrealized appreciation | $ | 489,856,941 | ||
|
|
The following is a summary of the fair valuations according to the inputs used as of November 30, 2014, for valuing the Fund’s assets and liabilities.
Asset Valuation Inputs
Description | Quoted Prices in Active Markets for Identical Assets (Level 1) | Significant Other Observable Inputs (Level 2) | Significant Unobservable Inputs (Level 3) | Total | ||||||||||||
| Investments in Securities (a) | ||||||||||||||||
Common Stock | $ | 472,827,533 | $ | — | $ | — | $ | 472,827,533 | ||||||||
Master Limited Partnerships and Related Companies | 1,565,463,659 | — | — | 1,565,463,659 | ||||||||||||
Preferred Stock | 16,742,361 | — | — | 16,742,361 | ||||||||||||
Short-Term Investments | 65,197,913 | — | — | 65,197,913 | ||||||||||||
|
|
|
|
|
|
|
| |||||||||
| Total Investments in Securities | $ | 2,120,231,466 | $ | — | $ | — | $ | 2,120,231,466 | ||||||||
|
|
|
|
|
|
|
| |||||||||
| (a) | For a complete listing of investments and their industries, see the Portfolio of Investments. |
The Fund recognizes transfers between the levels as of the beginning of the period.
For the year ended November 30, 2014, the Fund did not have any transfers between Level 1 and Level 2 fair value measurements.
As of November 30, 2014, the Fund did not hold any investments with significant unobservable inputs (Level 3).
| The notes to the financial statements are an integral part of, and should be read in conjunction with, the financial statements. | 15 |
Statement of Assets and Liabilities as of November 30, 2014
| Assets | ||||
Investments, at value | $ | 2,120,231,466 | ||
Receivables: | ||||
Fund shares sold | 11,146,043 | |||
Dividends and interest | 1,323 | |||
Prepaid expenses | 145,480 | |||
|
| |||
Total assets | 2,131,524,312 | |||
|
| |||
| Liabilities | ||||
Payables: | ||||
Fund shares redeemed | 1,938,436 | |||
Advisory fees (See Note 3) | 1,809,290 | |||
NYLIFE Distributors (See Note 3) | 829,766 | |||
Transfer agent (See Note 3) | 367,000 | |||
Shareholder communication | 63,241 | |||
Professional fees | 31,903 | |||
Trustees | 15,428 | |||
Custodian | 3,875 | |||
Accrued expenses | 1,809 | |||
Deferred tax liability | 154,807,419 | |||
|
| |||
Total liabilities | 159,868,167 | |||
|
| |||
Net assets | $ | 1,971,656,145 | ||
|
| |||
| Composition of Net Assets | ||||
Shares of beneficial interest outstanding (par value of $.001 per share) unlimited number of shares authorized | $ | 90,169 | ||
Additional paid-in capital | 1,735,830,303 | |||
|
| |||
| 1,735,920,472 | ||||
Accumulated net investment loss, net of income taxes | (67,584,264 | ) | ||
Accumulated net realized gain (loss) on investments, net of income taxes | 24,024,760 | |||
Net unrealized appreciation (depreciation) on investments, net of income taxes | 279,295,177 | |||
|
| |||
Net assets | $ | 1,971,656,145 | ||
|
| |||
Class A | ||||
Net assets applicable to outstanding shares | $ | 531,606,641 | ||
|
| |||
Shares of beneficial interest outstanding | 24,003,190 | |||
|
| |||
Net asset value per share outstanding | $ | 22.15 | ||
Maximum sales change (5.50% of offering price) | 1.22 | |||
|
| |||
Maximum offering price per share outstanding | $ | 23.37 | ||
|
| |||
Investor Class | ||||
Net assets applicable to outstanding shares | $ | 1,310,220 | ||
|
| |||
Shares of beneficial interest outstanding | 59,161 | |||
|
| |||
Net asset value per share outstanding | $ | 22.15 | ||
Maximum sales change (5.50% of offering price) | 1.22 | |||
|
| |||
Maximum offering price per share outstanding | $ | 23.37 | ||
|
| |||
Class C | ||||
Net assets applicable to outstanding shares | $ | 859,193,117 | ||
|
| |||
Shares of beneficial interest outstanding | 40,233,668 | |||
|
| |||
Net asset value per share outstanding | $ | 21.36 | ||
|
| |||
Class I | ||||
Net assets applicable to outstanding shares | $ | 579,546,167 | ||
|
| |||
Shares of beneficial interest outstanding | 25,872,914 | |||
|
| |||
Net asset value per share outstanding | $ | 22.40 | ||
|
|
| 16 | MainStay Cushing MLP Premier Fund | The notes to the financial statements are an integral part of, and should be read in conjunction with, the financial statements. |
Statement of Operations for the year ended November 30, 2014
| Investment Income (Loss) | ||||
Income | ||||
Dividends and distributions | $ | 11,095,063 | ||
Interest | 12,463 | |||
|
| |||
Total income | 11,107,526 | |||
|
| |||
Expenses | ||||
Manager (See Note 3) | 18,640,080 | |||
Distribution/Service—Class A (See Note 3) | 1,381,048 | |||
Distribution/Service—Investor Class (See Note 3) | 524 | |||
Distribution/Service—Class C (See Note 3) | 7,533,655 | |||
Transfer agent (See Note 3) | 1,106,083 | |||
Administration and accounting (See Note 3) | 899,842 | |||
Professional fees | 280,873 | |||
Insurance | 262,248 | |||
Registration | 254,008 | |||
Shareholder communication | 205,527 | |||
Trustees | 132,027 | |||
Custodian | 52,547 | |||
Franchise tax | 29,305 | |||
Miscellaneous | 8,168 | |||
|
| |||
Total expenses before recovery of previous waivers | 30,785,935 | |||
Recoupment of previous waivers from Manager (See Note 3) | 801,594 | |||
|
| |||
Net expenses | 31,587,529 | |||
|
| |||
Net Investment Loss, before Income Taxes | (20,480,003 | ) | ||
Deferred tax benefit | 9,964,198 | |||
|
| |||
Net Investment Income (Loss) | (10,515,805 | ) | ||
|
| |||
| Realized and Unrealized Gain (Loss) on Investments | ||||
Net realized gain (loss) on: | ||||
Investments, before income taxes | 55,866,449 | |||
Deferred tax expense | (20,730,271 | ) | ||
|
| |||
Net realized gain (loss) on investments | 35,136,178 | |||
|
| |||
Net change in unrealized appreciation (depreciation) on: | ||||
Investments, before income taxes | 160,233,467 | |||
Deferred tax expense | (59,458,168 | ) | ||
|
| |||
Net change in unrealized appreciation (depreciation) | 100,775,299 | |||
|
| �� | ||
Net realized and unrealized gain (loss) on investments | 135,911,477 | |||
|
| |||
Net increase (decrease) in net assets resulting from operations | $ | 125,395,672 | ||
|
| |||
| The notes to the financial statements are an integral part of, and should be read in conjunction with, the financial statements. | 17 |
Statements of Changes in Net Assets
| Year ended November 30, 2014 | Year ended November 30, 2013* | |||||||
| Increase (Decrease) in Net Assets | ||||||||
Operations: | ||||||||
Net investment income (loss) | $ | (10,515,805 | ) | $ | (8,226,281 | ) | ||
Net realized gain (loss) on investments | 35,136,178 | 6,064,272 | ||||||
Net change in unrealized appreciation (depreciation) on investments | 100,775,299 | 143,419,606 | ||||||
|
| |||||||
Net increase (decrease) in net assets resulting from operations | 125,395,672 | 141,257,597 | ||||||
|
| |||||||
Dividends and distributions to shareholders: | ||||||||
From net investment income: | ||||||||
Class A | (14,189,873 | ) | — | |||||
Investor Class | (6,008 | ) | — | |||||
Class C | (20,166,403 | ) | — | |||||
Class I | (10,131,458 | ) | — | |||||
|
| |||||||
| (44,493,742 | ) | — | ||||||
|
| |||||||
From return of capital: | ||||||||
Class A | (18,145,019 | ) | (26,084,046 | ) | ||||
Investor Class | (7,683 | ) | — | |||||
Class C | (25,787,389 | ) | (27,804,978 | ) | ||||
Class I | (12,955,400 | ) | (9,945,506 | ) | ||||
|
| |||||||
| (56,895,491 | ) | (63,834,530 | ) | |||||
|
| |||||||
Total dividends and distributions to shareholders | (101,389,233 | ) | (63,834,530 | ) | ||||
|
| |||||||
Capital share transactions: | ||||||||
Net proceeds from sale of shares | 1,058,742,376 | 727,380,349 | ||||||
Net asset value of shares issued to shareholders in reinvestment of dividends and distributions | 86,845,034 | 42,036,389 | ||||||
Cost of shares redeemed | (475,289,126 | ) | (220,119,043 | ) | ||||
|
| |||||||
Increase (decrease) in net assets derived from capital share transactions | 670,298,284 | 549,297,695 | ||||||
|
| |||||||
Net increase (decrease) in net assets | 694,304,723 | 626,720,762 | ||||||
| Net Assets | ||||||||
Beginning of year | 1,277,351,422 | 650,630,660 | ||||||
|
| |||||||
End of year | $ | 1,971,656,145 | $ | 1,277,351,422 | ||||
|
| |||||||
Undistributed (distributions in excess of) net investment income at end of year | $ | (67,584,264 | ) | $ | (12,574,717 | ) | ||
|
| |||||||
| * | This year was audited by a predecessor audit firm whose opinion was unqualified. |
| 18 | MainStay Cushing MLP Premier Fund | The notes to the financial statements are an integral part of, and should be read in conjunction with, the financial statements. |
Financial Highlights selected per share data and ratios
| Year ended November 30, | October 20, 2010** through November 30, | |||||||||||||||||||
| Class A | 2014 | 2013*** | 2012*** | 2011*** | 2010*** | |||||||||||||||
Net asset value at beginning of period | $ | 21.36 | $ | 19.48 | $ | 19.92 | $ | 20.28 | $ | 20.00 | ||||||||||
|
|
|
|
|
|
|
|
|
| |||||||||||
Net investment income (loss) (a) | (0.09 | ) | (0.12 | ) | (0.13 | ) | (0.14 | ) | (0.02 | ) | ||||||||||
Net realized and unrealized gain (loss) on investments | 2.21 | 3.34 | 1.02 | 1.07 | 0.30 | |||||||||||||||
|
|
|
|
|
|
|
|
|
| |||||||||||
Total from investment operations | 2.12 | 3.22 | 0.89 | 0.93 | 0.28 | |||||||||||||||
|
|
|
|
|
|
|
|
|
| |||||||||||
| Less dividends and distributions: | ||||||||||||||||||||
From net investment income | (0.59 | ) | — | — | — | — | ||||||||||||||
From return of capital | (0.75 | ) | (1.34 | ) | (1.34 | ) | (1.30 | ) | — | |||||||||||
|
|
|
|
|
|
|
|
|
| |||||||||||
Total dividends and distributions | (1.34 | ) | (1.34 | ) | (1.34 | ) | (1.30 | ) | — | |||||||||||
|
|
|
|
|
|
|
|
|
| |||||||||||
Redemption fees retained (a)(b) | 0.01 | 0.00 | ‡ | 0.01 | 0.01 | — | ||||||||||||||
|
|
|
|
|
|
|
|
|
| |||||||||||
Net asset value at end of period | $ | 22.15 | $ | 21.36 | $ | 19.48 | $ | 19.92 | $ | 20.28 | ||||||||||
|
|
|
|
|
|
|
|
|
| |||||||||||
Total investment return (c) | 10.00 | % | 16.91 | % | 4.56 | % | 4.55 | % | 1.40 | % (d) | ||||||||||
| Ratios (to average net assets)/Supplemental Data: | ||||||||||||||||||||
Net investment income (loss) (including net deferred income tax benefit (expense)) (e) | (6.46 | %) | (9.12 | %) | (2.95 | %) | (1.95 | %) | (5.32 | %)†† | ||||||||||
Net investment income (loss) (excluding net deferred income tax benefit (expense)) (e) | (0.97 | %) | (1.18 | %) | (1.23 | %) | (1.29 | %) | (1.45 | %)†† | ||||||||||
Net expenses (including net deferred income tax (benefit) expense) (e)(f) | 7.08 | % | 9.59 | % | 3.37 | % | 2.32 | % | 5.52 | % †† | ||||||||||
Expenses (before waiver/recoupment, including net deferred income tax (benefit) expense) (e)(f) | 7.03 | % | 9.57 | % | 3.43 | % | 3.29 | % | 44.22 | % †† | ||||||||||
Portfolio turnover rate | 20.70 | % | 27.29 | % | 43.32 | % | 72.32 | % | 0.74 | % | ||||||||||
Net assets at end of period (in 000’s) | $ | 531,607 | $ | 487,318 | $ | 306,054 | $ | 81,865,313 | $ | 696,702 | ||||||||||
| ** | Inception date |
| *** | These years were audited by a predecessor audit firm whose opinion was unqualified. |
| †† | Annualized. |
| ‡ | Less than one cent per share. |
| (a) | Per share data based on average shares outstanding during the period. |
| (b) | Redemption fees were only applicable prior to reorganization. |
| (c) | Total investment return is calculated exclusive of sales charges and assumes the reinvestment of dividends and distributions. |
| (d) | Total investment return is not annualized. |
| (e) | For the year ended November 30, 2014, the Fund accrued $70,224,241 in net deferred income tax expense, of which $30,305,000 is attributable to Class A. For the year ended November 30, 2013, the Fund accrued $77,002,011 in net deferred income tax expense, of which $31,765,943 is attributable to Class A. For the year ended November 30, 2012, the Fund accrued $7,120,938 in net deferred income tax expense, of which $3,616,649 is attributable to Class A. For the year ended November 30, 2011, the Fund accrued $452,365 in net deferred income tax expense, of which $212,282 is attributable to Class A. For the period from October 20, 2010 to November 30, 2010, the Fund accrued $7,864 in net deferred income tax expense, of which $2,596 is attributable to Class A. |
| (f) | The ratio of expenses excluding net deferred income tax expense to average net assets before waiver and recoupment was 1.54%, 1.63%, 1.71%, 2.62% and 40.35% for the fiscal years ended November 30, 2014, 2013, 2012, 2011, and the period from October 20, 2012 to November 30, 2010, respectively. The ratio of expenses excluding net deferred income tax expense to average net assets after waiver and recoupment was 1.59%, 1.65%, 1.65%, 1.65% and 1.65% for the fiscal years ended November 30, 2014, 2013, 2012, 2011, and the period from October 20, 2012 to November 30, 2010, respectively. |
| The notes to the financial statements are an integral part of, and should be read in conjunction with, the financial statements. | 19 |
Financial Highlights selected per share data and ratios
| Investor Class | July 12, 2014** through November 30, 2014 | |||
Net asset value at beginning of period | $ | 24.02 | ||
|
| |||
Net investment income (loss) (a) | (0.03 | ) | ||
Net realized and unrealized gain (loss) on investments | (1.17 | ) | ||
|
| |||
Total from investment operations | (1.20 | ) | ||
|
| |||
| Less dividends and distributions: | ||||
From net investment income | (0.29 | ) | ||
From return of capital | (0.38 | ) | ||
|
| |||
Total dividends and distributions | (0.67 | ) | ||
|
| |||
Net asset value at end of period | $ | 22.15 | ||
|
| |||
Total investment return (b)(c) | (5.12 | %)(d) | ||
| Ratios (to average net assets)/Supplemental Data: | ||||
Net investment income (loss) (including net deferred income tax benefit (expense)) (e) | 2.79 | †† | ||
Net investment income (loss) (excluding net deferred income tax benefit (expense)) (e) | (0.52 | )†† | ||
Net expenses (including net deferred income tax (benefit) expense) (e)(f) | (1.80 | )†† | ||
Expenses (before waiver/reimbursement, including net deferred income tax (benefit) expense) (e)(f) | (1.80 | )†† | ||
Portfolio turnover rate | 20.70 | % | ||
Net assets at end of period (in 000’s) | $ | 1,310 | ||
| ** | Inception date |
| †† | Annualized. |
| (a) | Per share data based on average shares outstanding during the period. |
| (b) | Total investment return is calculated exclusive of sales charges and assumes the reinvestment of dividends and distributions. |
| (c) | Total investment return is not annualized. |
| (d) | Total investment return may reflect adjustments to conform to generally accepted accounting principles. |
| (e) | For the year ended November 30, 2014, the Fund accrued $70,224,241 in net deferred income tax expense, of which $17,830 of deferred income tax benefit is attributable to Investor Class. |
| (f) | The ratio of expenses excluding net deferred income tax expense to average net assets before waiver was 1.51%, for the period from July 12, 2014 to November 30, 2014. The ratio of expenses excluding net deferred income tax expense to average net assets after waiver and recoupment was 1.51% for the period from July 12 to November 30, 2010, respectively. |
| 20 | MainStay Cushing MLP Premier Fund | The notes to the financial statements are an integral part of, and should be read in conjunction with, the financial statements. |
Financial Highlights selected per share data and ratios
| Year ended November 30, | October 20, 2010** through November 30, | |||||||||||||||||||
| Class C | 2014 | 2013*** | 2012*** | 2011*** | 2010*** | |||||||||||||||
Net asset value at beginning of period | $ | 20.79 | $ | 19.14 | $ | 19.73 | $ | 20.26 | $ | 20.00 | ||||||||||
|
|
|
|
|
|
|
|
|
| |||||||||||
Net investment income (loss) (a) | (0.25 | ) | (0.27 | ) | (0.27 | ) | (0.29 | ) | (0.04 | ) | ||||||||||
Net realized and unrealized gain (loss) on investments | 2.16 | 3.26 | 1.02 | 1.06 | 0.30 | |||||||||||||||
|
|
|
|
|
|
|
|
|
| |||||||||||
Total from investment operations | 1.91 | 2.99 | 0.75 | 0.77 | 0.26 | |||||||||||||||
|
|
|
|
|
|
|
|
|
| |||||||||||
| Less dividends and distributions: | ||||||||||||||||||||
From net investment income | �� | (0.59 | ) | — | — | — | — | |||||||||||||
From return of capital | (0.75 | ) | (1.34 | ) | (1.34 | ) | (1.30 | ) | — | |||||||||||
|
|
|
|
|
|
|
|
|
| |||||||||||
Total dividends and distributions | (1.34 | ) | (1.34 | ) | (1.34 | ) | (1.30 | ) | — | |||||||||||
|
|
|
|
|
|
|
|
|
| |||||||||||
Redemption fees retained (a)(b) | 0.00 | ‡ | 0.00 | ‡ | 0.00 | ‡ | 0.00 | ‡ | — | |||||||||||
|
|
|
|
|
|
|
|
|
| |||||||||||
Net asset value at end of period | $ | 21.36 | $ | 20.79 | $ | 19.14 | $ | 19.73 | $ | 20.26 | ||||||||||
|
|
|
|
|
|
|
|
|
| |||||||||||
Total investment return (c) | 9.19 | % | 16.05 | % | 3.82 | % | 3.69 | % | 1.30 | % (d) | ||||||||||
| Ratios (to average net assets)/Supplemental Data: | ||||||||||||||||||||
Net investment income (loss) (including net deferred income tax benefit (expense)) (e) | (5.80 | %) | (9.87 | %) | (3.70 | %) | (2.70 | %) | (6.07 | %)†† | ||||||||||
Net investment income (loss) (excluding net deferred income tax benefit (expense)) (e) | (1.68 | %) | (1.93 | %) | (1.98 | %) | (2.04 | %) | (2.20 | %)†† | ||||||||||
Net expenses (including net deferred income tax (benefit) expense) (e)(f) | 6.46 | % | 10.34 | % | 4.12 | % | 3.07 | % | 6.27 | % †† | ||||||||||
Expenses (before waiver/recoupment, including net deferred income tax (benefit) expense) (e)(f) | 6.41 | % | 10.32 | % | 4.18 | % | 4.04 | % | 44.97 | % †† | ||||||||||
Portfolio turnover rate | 20.70 | % | 27.29 | % | 43.32 | % | 72.32 | % | 0.74 | % | ||||||||||
Net assets at end of period (in 000’s) | $ | 859,193 | $ | 568,837 | $ | 252,473 | $ | 50,321 | $ | 598 | ||||||||||
| ** | Inception date |
| *** | These years were audited by a predecessor audit firm whose opinion was unqualified. |
| †† | Annualized. |
| ‡ | Less than one cent per share. |
| (a) | Per share data based on average shares outstanding during the period. |
| (b) | Redemption fees were only applicable prior to reorganization. |
| (c) | Total investment return is calculated exclusive of sales charges and assumes the reinvestment of dividends and distributions. |
| (d) | Total investment return is not annualized. |
| (e) | For the year ended November 30, 2014, the Fund accrued $70,224,241 in net deferred income tax expense, of which $31,069,447 is attributable to Class C. For the year ended November 30, 2013, the Fund accrued $77,002,011 in net deferred income tax expense, of which $33,095,235 is attributable to Class C. For the year ended November 30, 2012, the Fund accrued $7,120,938 in net deferred income tax expense, of which $147,543 is attributable to Class C. For the year ended November 30, 2011, the Fund accrued $452,365 in net deferred income tax expense, of which $147,543 is attributable to Class C. For the period from October 20, 2010 to November 30, 2010, the Fund accrued $7,864 in net deferred income tax expense, of which $1,536 is attributable to Class C. |
| (f) | The ratio of expenses excluding net deferred income tax expense to average net assets before waiver and recoupment was 2.29%, 2.38%, 2.46%, 3.37% and 41.10% for the fiscal years ended November 30, 2014, 2013, 2012, 2011, and the period from October 20, 2012 to November 30, 2010, respectively. The ratio of expenses excluding net deferred income tax expense to average net assets after waiver and recoupment was 2.34%, 2.40%, 2.40%, 2.40% and 2.40% for the fiscal years ended November 30, 2014, 2013, 2012, 2011, and the period from October 20, 2012 to November 30, 2010, respectively. |
| The notes to the financial statements are an integral part of, and should be read in conjunction with, the financial statements. | 21 |
Financial Highlights selected per share data and ratios
| Year ended November 30, | October 20, 2010** through November 30, | |||||||||||||||||||
| Class I | 2014 | 2013*** | 2012*** | 2011*** | 2010*** | |||||||||||||||
Net asset value at beginning of period | $ | 21.54 | $ | 19.57 | $ | 19.96 | $ | 20.28 | $ | 20.00 | ||||||||||
|
|
|
|
|
|
|
|
|
| |||||||||||
Net investment income (loss) (a) | (0.03 | ) | (0.07 | ) | (0.08 | ) | (0.09 | ) | (0.02 | ) | ||||||||||
Net realized and unrealized gain (loss) on investments | 2.22 | 3.36 | 1.02 | 1.07 | 0.30 | |||||||||||||||
|
|
|
|
|
|
|
|
|
| |||||||||||
Total from investment operations | 2.19 | 3.29 | 0.94 | 0.98 | 0.28 | |||||||||||||||
|
|
|
|
|
|
|
|
|
| |||||||||||
| Less dividends and distributions: | ||||||||||||||||||||
From net investment income | (0.59 | ) | — | — | — | — | ||||||||||||||
From return of capital | (0.75 | ) | (1.34 | ) | (1.34 | ) | (1.30 | ) | — | |||||||||||
|
|
|
|
|
|
|
|
|
| |||||||||||
Total dividends and distributions | (1.34 | ) | (1.34 | ) | (1.34 | ) | (1.30 | ) | — | |||||||||||
|
|
|
|
|
|
|
|
|
| |||||||||||
Redemption fees retained (a)(b) | 0.01 | 0.02 | 0.01 | 0.00 | ‡ | — | ||||||||||||||
|
|
|
|
|
|
|
|
|
| |||||||||||
Net asset value at end of period | $ | 22.40 | $ | 21.54 | $ | 19.57 | $ | 19.96 | $ | 20.28 | ||||||||||
|
|
|
|
|
|
|
|
|
| |||||||||||
Total investment return (c) | 10.25 | % | 17.37 | % | 4.81 | % | 4.75 | % | 1.40 | % (d) | ||||||||||
| Ratios (to average net assets)/Supplemental Data: | ||||||||||||||||||||
Net investment income (loss) (including net deferred income tax benefit (expense)) (e) | (2.90 | %) | (8.87 | %) | (2.70 | %) | (1.70 | %) | (5.07 | %)†† | ||||||||||
Net investment income (loss) (excluding net deferred income tax benefit (expense)) (e) | (0.62 | %) | (0.93 | %) | (0.98 | %) | (1.04 | %) | (1.20 | %)†† | ||||||||||
Net expenses (including net deferred income tax (benefit) expense) (e)(f) | 3.61 | % | 9.34 | % | 3.12 | % | 2.07 | % | 5.27 | % †† | ||||||||||
Expenses (before waiver/recoupment, including net deferred income tax (benefit) expense) (e)(f) | 3.57 | % | 9.32 | % | 3.18 | % | 3.04 | % | 43.97 | % †† | ||||||||||
Portfolio turnover rate | 20.70 | % | 27.29 | % | 43.32 | % | 72.32 | % | 0.74 | % | ||||||||||
Net assets at end of period (in 000’s) | $ | 579,546 | $ | 221,196 | $ | 92,104 | $ | 27,847 | $ | 1,533 | ||||||||||
| ** | Inception date |
| *** | These years were audited by a predecessor audit firm whose opinion was unqualified. |
| †† | Annualized. |
| ‡ | Less than one cent per share. |
| (a) | Per share data based on average shares outstanding during the period. |
| (b) | Redemption fees were only applicable prior to reorganization. |
| (c) | Total investment return is calculated exclusive of sales charges and assumes the reinvestment of dividends and distributions. Class I shares are not subject to sales charges. |
| (d) | Total investment return is not annualized. |
| (e) | For the year ended November 30, 2014, the Fund accrued $70,224,241 in net deferred income tax expense, of which $8,867,624 is attributable to Class I. For the year ended November 30, 2013, the Fund accrued $77,002,011 in net deferred income tax expense, of which $12,140,833 is attributable to Class I. For the year ended November 30, 2012, the Fund accrued $7,120,938 in net deferred income tax expense, of which $1,072,968 is attributable to Class I. For the year ended November 30, 2011, the Fund accrued $452,365 in net deferred income tax expense, of which $92,540 is attributable to Class I. For the period from October 20, 2010 to November 30, 2010, the Fund accrued $7,864 in net deferred income tax expense, of which $3,732 is attributable to Class I. |
| (f) | The ratio of expenses excluding net deferred income tax expense to average net assets before waiver and recoupment was 1.29%, 1.38%, 1.46%, 2.37% and 40.10% for the fiscal years ended November 30, 2014, 2013, 2012, 2011, and the period from October 20, 2012 to November 30, 2010, respectively. The ratio of expenses excluding net deferred income tax expense to average net assets after waiver and recoupment was 1.33%, 1.40%, 1.40%, 1.40% and 1.40% for the fiscal years ended November 30, 2014, 2013, 2012, 2011, and the period from October 20, 2010 to November 30, 2010, respectively. |
| 22 | MainStay Cushing MLP Premier Fund | The notes to the financial statements are an integral part of, and should be read in conjunction with, the financial statements. |
MainStay Cushing Renaissance Advantage Fund
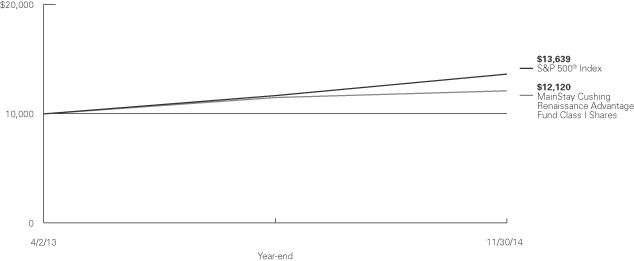
Investment and Performance Comparison1 (Unaudited)
Performance data quoted represents past performance. Past performance is no guarantee of future results. Because of market volatility, current performance may be lower or higher than the figures shown. Investment return and principal value will fluctuate, and as a result, when shares are redeemed, they may be worth more or less than their original cost. The graph below depicts the historical performance of Class I shares of the Fund. Performance will vary from class to class based on differences in class-specific expenses and sales charges. For performance information current to the most recent month-end, please call 800-MAINSTAY (624-6782) or visit mainstayinvestments.com.
Average Annual Total Returns for the Year Ended November 30, 2014
| Class | Sales Charge | One Year | Since Inception (4/2/13) | Gross Expense Ratio2 | ||||||||||||
Class A Shares4 | Maximum 5.5% Initial Sales Charge | With sales charge | | -0.90 | % | | 8.13 | % | 3.90 | % | ||||||
| Excluding sales charge | 5.14 | 12.05 | 3.90 | |||||||||||||
Investor Class Shares3 | Maximum 5.5% Initial Sales Charge | With sales charge | | -0.82 | | | 8.19 | | 4.02 | |||||||
| Excluding sales charge | 5.23 | 12.11 | 4.02 | |||||||||||||
Class C Shares4 | Maximum 1% CDSC | With sales charge | | 3.40 | | | 11.31 | | 4.77 | |||||||
| if Redeemed Within One Year of Purchase | Excluding sales charge | 4.40 | 11.31 | 4.77 | ||||||||||||
| Class I Shares4 | No Sales Charge | 5.41 | 12.25 | 3.65 | ||||||||||||
| 1. | The performance table and graph do not reflect the deduction of taxes that a shareholder would pay on distributions or Fund share redemptions. Total returns reflect maximum applicable sales charges as indicated in the table above, changes in share price, and reinvestment of dividend and capital gain distributions. The graph assumes the initial investment amount shown above and reflects the deduction of all sales charges that would have applied for the period of investment. Performance figures reflect certain fee waivers and/or expense limitations, without which total returns may have been lower. For more information on share classes and current fee waivers and/or expense limitations, please refer to the notes to the financial statements. |
| 2. | The gross expense ratios presented reflect the Fund’s “Total Annual Fund Operating Expenses” from the most recent Prospectus and may differ from other expense ratios disclosed in this report. |
| 3. | Performance figures for Investor Class shares, first offered on July 11, 2014, include the historical performance of Class A shares through July 10, 2014, adjusted for differences in certain expenses and fees. Unadjusted, the performance for Investor Class shares would likely have been different. |
| 4. | Performance figures for Class A shares, Class C shares and Class I shares reflect the historical performance of the then-existing Class A shares, Class C shares and Class I shares, respectively, of the Cushing® Renaissance Advantage Fund (the predecessor to the Fund, which was subject to a different fee structure) for periods prior to July 11, 2014. The Cushing® Renaissance Advantage Fund commenced operations on April 2, 2013. |
The footnotes on the next page are an integral part of the table and graph and should be carefully read in conjunction with them.
| 23 |
| Benchmark Performance | One Year | Since Inception | ||||||
S&P 500® Index5 | 16.86 | % | 20.51 | % | ||||
Average Lipper Natural Resources Fund6 | -11.29 | 0.99 | ||||||
| 5. | “S&P 500®” is a trademark of The McGraw-Hill Companies, Inc. The S&P 500® Index is widely regarded as the standard index for measuring large-cap U.S. stock market performance. The S&P 500® Index is the Fund’s primary benchmark. Results assume reinvestment of all dividends and capital gains. An investment cannot be made directly in an index. |
| 6. | The average Lipper Natural Resources Fund is representative of funds that invest primarily in the equity securities of domestic companies engaged in |
| the exploration, development, production, or distribution of natural resources (including oil, natural gas, and base minerals) and/or alternative energy sources (including solar, wind, hydro, tidal, and geothermal). This benchmark is a product of Lipper Inc. Lipper Inc. is an independent monitor of fund performance. Results are based on total returns with all dividend and capital gain distributions reinvested. |
The footnotes on the preceding page are an integral part of the table and graph and should be carefully read in conjunction with them.
| 24 | MainStay Cushing Renaissance Advantage Fund |
Cost in Dollars of a $1,000 Investment in MainStay Cushing Renaissance Advantage Fund (Unaudited)
The example below is intended to describe the fees and expenses borne by shareholders during the six-month period from June 1, 2014, to November 30, 2014, and the impact of those costs on your investment.
Example
As a shareholder of the Fund, you incur two types of costs: (1) transaction costs, including exchange fees and sales charges (loads) on purchases (as applicable), and (2) ongoing costs, including management fees, distribution and/or service (12b-1) fees, and other Fund expenses (as applicable). This example is intended to help you understand your ongoing costs (in dollars) of investing in the Fund and to compare these costs with the ongoing costs of investing in other mutual funds. The example is based on an investment of $1,000 made at the beginning of the six-month period and held for the entire period from June 1, 2014, to November 30, 2014.
This example illustrates your Fund’s ongoing costs in two ways:
Actual Expenses
The second and third data columns in the table below provide information about actual account values and actual expenses. You may use the information in these columns, together with the amount you invested, to estimate the expenses that you paid during the six months ended November 30, 2014. Simply divide your account value by $1,000 (for example, an $8,600 account value divided by $1,000 = 8.6), then
multiply the result by the number under the heading entitled “Expenses Paid During Period” to estimate the expenses you paid on your account during this period.
Hypothetical Example for Comparison Purposes
The fourth and fifth data columns in the table below provide information about hypothetical account values and hypothetical expenses based on the Fund’s actual expense ratio and an assumed rate of return of 5% per year before expenses, which is not the Fund’s actual return. The hypothetical account values and expenses may not be used to estimate the actual ending account balances or expenses you paid for the six-month period shown. You may use this information to compare the ongoing costs of investing in the Fund with the ongoing costs of investing in other Funds. To do so, compare this 5% hypothetical example with the 5% hypothetical examples that appear in the shareholder reports of the other Funds.
Please note that the expenses shown in the table are meant to highlight your ongoing costs only and do not reflect any transactional costs, such as exchange fees or sales charges (loads). Therefore, the fourth and fifth data columns of the table are useful in comparing ongoing costs only and will not help you determine the relative total costs of owning different funds. In addition, if these transactional costs were included, your costs would have been higher.
| Share Class | Beginning Value | Ending Account Value (Based | Expenses During | Ending Account Value (Based on Hypothetical 5% Annualized Return and Actual Expenses) 11/30/2014 | Expenses During | |||||||||||||||
| Class A Shares4 | $ | 1,000.00 | $ | 906.60 | $ | 8.60 | $ | 1,016.04 | $ | 9.10 | ||||||||||
| Investor Class Shares1,3 | $ | 1,000.00 | $ | 879.00 | $ | 6.21 | $ | 1,012.84 | $ | 6.66 | ||||||||||
| Class C Shares4 | $ | 1,000.00 | $ | 903.20 | $ | 12.02 | $ | 1,012.43 | $ | 12.71 | ||||||||||
| Class I Shares4 | $ | 1,000.00 | $ | 907.90 | $ | 7.22 | $ | 1,017.50 | $ | 7.64 | ||||||||||
| 1. | Investor Class shares were first offered as of the close of business on July 11, 2014. |
| 2. | Expenses are equal to the Fund’s annualized expense ratio of each class (1.80% for Class A, 1.70% for Investor Class, 2.52% for Class C and 1.51% for Class I) multiplied by the average account value over the period, divided by 365 and multiplied by 183 for Class A, Class C, and Class I and 142 days for Investor Class (to reflect the six-month period). The table above represents the actual expenses incurred during the six-month period. |
| 3. | Expenses paid during the period reflect ongoing costs for the period from inception through November 30, 2014. Had these shares been offered for the full six-month period ended November 30, 2014, and had the Fund provided a hypothetical 5% annualized return, expenses paid during the period would have been $8.59 for Investor Class shares and the ending account value would have been $1,016.55 for Investor Class shares. |
| 4. | For the period from June 1, 2014 through July 11, 2014, expenses were from Predecessor Fund. |
| 25 |
Portfolio Composition as of November 30, 2014(1) (Unaudited)
(Expressed as a Percentage of Total Investments)

See Portfolio of Investments beginning on page 29 for specific holdings within these categories.
Top Ten Holdings as of November 30, 2014 (excluding short-term investment) (Unaudited)
| 1. | Kirby Corporation |
| 2. | Sempra Energy |
| 3. | Marathon Petroleum Corporation |
| 4. | Quanta Services, Inc. |
| 5. | Phillips 66 |
| 6. | Union Pacific Corp. |
| 7. | Wabtec Corporation |
| 8. | United Rentals, Inc. |
| 9. | Dominion Resources, Inc. |
| 10. | Westlake Chemical Corporation |
| (1) | Fund holdings and sector allocations are subject to change, and there is no assurance that the Fund will continue to hold any particular security. |
| (2) | Master Limited Partnerships and Related Companies |
| (3) | Common Stock |
| 26 | MainStay Cushing Renaissance Advantage Fund |
Portfolio Management Discussion and Analysis (Unaudited)
Questions answered by portfolio managers Jerry V. Swank, Matthew A. Lemme, CFA, and Saket Kumar of Cushing Asset Management, LP, the Fund’s Subadvisor.
How did MainStay Cushing Renaissance Advantage Fund perform relative to its primary benchmark and peers during the 12 months ended November 30, 2014?
Excluding all sales charges, MainStay Cushing Renaissance Advantage Fund returned 5.14% for Class A shares, 5.23% for Investor Class shares and 4.40% for Class C shares. Over the same period, Class I shares returned 5.41%. For the 12 months ended November 30, 2014, all share classes underperformed the 16.86% return of the S&P 500® Index,1 which is the Fund’s primary broad-based securities-market index. Over the same period, all share classes outperformed the –11.29% return of the average Lipper2 Natural Resources Fund. See page 23 for Fund returns with applicable sales charges.
What factors affected the Fund’s performance relative to the S&P 500® Index during the reporting period?
The key reason the Fund underperformed the S&P 500® Index during the reporting period stems from differences in the makeup of the Fund and its broad-based Index. The Fund’s investments include companies with direct or indirect energy exposure (either through oil and gas prices or activity levels tied to the industry). The S&P 500® Index, as a broad stock-market index, predominantly consists of sectors beyond the focus of the Fund, including health care, information technology, financials and consumer discretionary. Furthermore, many industries outside the Fund’s investment universe, like apparel, restaurants and durable goods, often benefit from declining energy prices. While the Fund is well diversified within its investment universe and holds stocks that provide hedges for its energy price exposure, these measures were not enough to offset the impact of the sharp and sudden decline in energy prices.
Which sectors were the strongest contributors to the Fund’s absolute performance and which sectors were particularly weak?
During the reporting period, the Fund’s strongest sector contributions to absolute performance came from industrials, midstream and utilities. (Contributions take weightings and total returns into account.) Over the same period, the Fund’s weakest sector contributions came from oil services, basic materials, and exploration & production.
During the reporting period, which individual holdings made the strongest contributions to the Fund’s absolute performance and which holdings detracted the most?
The top contributors to the Fund’s absolute performance included equipment rental company United Rentals, Inc., railcar manufacturer Trinity Industries, Inc., and natural gas export company Cheniere Energy, Inc. United Rentals performed well
because of leverage to secular trends in industrial and commercial construction. The company remained a large holding for the Fund at the end of the reporting period. Trinity Industries performed well into the summer of 2014 as its backlog grew and tighter regulations for crude-by-rail transportation suggested continued strength. We sold the stock in the summer, as the valuation looked more difficult to justify and the company faced a potentially material negative legal outcome. Cheniere performed well as its first natural gas export facility got closer to completion (ahead of schedule and under budget). The company also made progress on a second export facility, and the stock retained its unique stature as the only pure-play natural gas export stock. We owned a small position in the company at the end of the reporting period.
Oil service companies Basic Energy Services, Inc., and Nabors Industries, Ltd., as well as crude-oil and refined-products shipping company Teekay Corporation, were the Fund’s most significant detractors from absolute performance. Basic Energy Services and Nabors Industries fell with the price of oil in October on concerns that lower oil prices might result in reduced drilling activity. We did not own either of these stocks at the end of the reporting period. Teekay’s stock price fell on concerns that lower oil prices could lead to reduced seaborne movement of barrels. At the end of the reporting period, however, the Fund continued to own a position in Teekay.
Did the Fund make any significant purchases or sales during the reporting period?
The Fund initiated a position in Sempra Energy, a utility and natural gas infrastructure operator, and dramatically increased a position in Wabtec, a manufacturer of components for railcars and locomotives. Both stocks were top-ten holdings at the end of the reporting period. We believed that Sempra Energy had multiple valuation catalysts that were not adequately reflected in its stock price. These catalysts included potential natural gas export opportunities on the U.S. Gulf Coast, new pipelines in the United States and at the company’s Mexican subsidiary, and the announcement of a yield vehicle into which the company can place assets with long-term contracts. With regard to Wabtec, we believe that rail car construction is a secular growth theme. The Fund’s position in Wabtec was a derivative play on this theme.
The Fund sold a position in Trinity Industries, a manufacturer of railcars and barges, in late summer because we believed that the stock’s valuation was becoming “full” and the company faced a material, binary legal outcome in the near future. In fact, the company lost the case; and shortly thereafter, the stock fell more than 20%.
| 1. | See footnote on page 24 for more information on the S&P 500® Index. |
| 2. | See footnote on page 24 for more information on Lipper Inc. |
| 27 |
The Fund also sold a position in Tesoro Corp., a refiner of petroleum into products such as gasoline and diesel fuel. Tesoro was a top-ten holding for much of 2014, but we believed that the company had achieved most of its identified catalysts and was very close to our estimate of its intrinsic value.
How did the Fund’s sector weightings change during the reporting period?
We dramatically reduced the Fund’s weightings in exploration & production and oilfield service companies throughout October and November, both before and in response to plummeting oil prices.
We increased the Fund’s exposure to specialty chemicals throughout the year, particularly in response to falling oil prices. We also increased the Fund’s exposure to utilities and power companies, especially those with exposure to natural gas infrastructure and export.
How was the Fund positioned at the end of the reporting period?
As of November 30, 2014, we maintained about 40% of the Fund in transportation and industrials stocks, a similar weighting to what we held throughout the year. As of the same date, in sectors where we take on more energy price risk, we were positioned more defensively because we believed that oil could languish at low price levels, with deleterious effects on many of the Fund’s holdings. As of November 30, 2014, the Fund therefore had very little exploration & production or oilfield services exposure. By November 30, 2014, we had also added to the specialty chemicals, utilities and refining sectors because we believed that these sectors could benefit from declining energy prices.
The opinions expressed are those of the portfolio managers as of the date of this report and are subject to change. There is no guarantee that any forecast made will come to pass. This material does not constitute investment advice and is not intended as an endorsement of any specific investment.
| 28 | MainStay Cushing Renaissance Advantage Fund |
Portfolio of Investments November 30, 2014
| Shares | Value | |||||||
| Common Stock 82.1%† | ||||||||
Chemicals 12.8% | ||||||||
Canada 1.7% | ||||||||
Methanex Corp. | 135,000 | $ | 6,974,100 | |||||
Netherlands 1.9% | ||||||||
LyondellBasell Industries NV | 100,392 | 7,916,913 | ||||||
United States 9.2% | ||||||||
Albemarle Corporation | 100,000 | 5,904,000 | ||||||
The Dow Chemical Company | 150,000 | 7,300,500 | ||||||
Eastman Chemical Company | 115,166 | 9,549,565 | ||||||
Polyone Corp. | 150,000 | 5,595,000 | ||||||
¨Westlake Chemical Corporation | 160,000 | 10,176,000 | ||||||
|
| |||||||
| 53,416,078 | ||||||||
|
| |||||||
Commercial Service Supplies & Distributors 5.1% |
| |||||||
United States 5.1% | ||||||||
H&E Equipment Services, Inc. | 120,000 | 4,200,000 | ||||||
Mobile Mini, Inc. | 57,500 | 2,385,675 | ||||||
MRC Global Inc. (a) | 200,000 | 4,042,000 | ||||||
¨United Rentals, Inc. (a) | 91,662 | 10,386,221 | ||||||
|
| |||||||
| 21,013,896 | ||||||||
|
| |||||||
Construction & Engineering 4.3% | ||||||||
United States 4.3% | ||||||||
Fluor Corporation | 34,526 | 2,140,267 | ||||||
Primoris Services Corporation | 180,154 | 4,711,027 | ||||||
¨Quanta Services, Inc. (a) | 366,604 | 11,181,422 | ||||||
|
| |||||||
| 18,032,716 | ||||||||
|
| |||||||
Energy Equipment & Services 2.8% | ||||||||
Ireland 0.4% | ||||||||
Weatherford International plc (a) | 112,000 | 1,467,200 | ||||||
United States 2.4% | ||||||||
Baker Hughes Inc. | 24,000 | 1,368,000 | ||||||
Forum Energy Technologies, Inc. (a) | 93,308 | 2,240,325 | ||||||
Halliburton Company | 20,000 | 844,000 | ||||||
Independence Contract Drilling, Inc. (a) | 118,085 | 814,786 | ||||||
Matrix Service Co. (a) | 225,000 | 4,752,000 | ||||||
|
| |||||||
| 11,486,311 | ||||||||
|
| |||||||
Machinery 10.7% | ||||||||
United States 10.7% | ||||||||
Allison Transmission Inc. | 145,000 | 4,769,050 | ||||||
Cummins Inc. | 34,200 | 4,980,204 | ||||||
Flowserve Corporation | 130,500 | 7,682,535 | ||||||
Greenbrier Companies, Inc. | 150,000 | 8,322,000 | ||||||
ITT Corporation | 90,000 | 3,726,000 | ||||||
The Lincoln Electric Company | 40,000 | 2,881,600 | ||||||
Wabash National Corporation (a) | 126,209 | 1,361,795 | ||||||
¨Wabtec Corporation | 121,500 | 10,751,535 | ||||||
|
| |||||||
| 44,474,719 | ||||||||
|
| |||||||
| Shares | Value | |||||||
Materials 2.4% | ||||||||
United States 2.4% | ||||||||
Commercial Metal Co. | 50,000 | $ | 817,000 | |||||
Eagle Materials, Inc. | 111,000 | 9,145,290 | ||||||
|
| |||||||
| 9,962,290 | ||||||||
|
| |||||||
Oil & Gas Exploration & Production 2.5% |
| |||||||
United States 2.5% | ||||||||
Devon Energy Corporation | 70,000 | 4,127,900 | ||||||
Rice Energy, Inc. (a) | 250,000 | 6,225,000 | ||||||
|
| |||||||
| 10,352,900 | ||||||||
|
| |||||||
Oil & Gas Refining & Marketing 10.5% |
| |||||||
United States 10.5% | ||||||||
Delek US Holdings, Inc. | 250,000 | 7,475,000 | ||||||
HollyFrontier Corporation | 110,400 | 4,506,528 | ||||||
¨Marathon Petroleum Corporation | 125,700 | 11,324,313 | ||||||
¨Phillips 66 | 150,000 | 10,953,000 | ||||||
Western Refining Inc. | 230,000 | 9,455,300 | ||||||
|
| |||||||
| 43,714,141 | ||||||||
|
| |||||||
Oil & Gas Storage & Transportation 7.3% |
| |||||||
Bermuda 2.9% | ||||||||
GasLog Ltd. | 333,962 | 5,891,090 | ||||||
Golar LNG Ltd. | 146,378 | 6,077,615 | ||||||
Republic of the Marshall Islands 3.9% |
| |||||||
Ardmore Shipping Corporation | 51,011 | 520,822 | ||||||
Dorian LPG Ltd. (a) | 209,654 | 2,849,198 | ||||||
Navigator Holdings Ltd. (a) | 180,000 | 3,855,600 | ||||||
Teekay Corporation | 184,000 | 9,148,480 | ||||||
United States 0.5% |
| |||||||
Williams Companies, Inc. | 40,000 | 2,070,000 | ||||||
|
| |||||||
| 30,412,805 | ||||||||
|
| |||||||
Utilities 10.7% | ||||||||
United States 10.7% | ||||||||
Calpine Corporation (a) | 240,000 | 5,510,400 | ||||||
Centerpoint Energy, Inc. | 300,000 | 7,182,000 | ||||||
¨Dominion Resources, Inc. | 140,400 | 10,186,020 | ||||||
NRG Energy, Inc. | 200,000 | 6,252,000 | ||||||
NRG Yield, Inc. | 80,000 | 3,791,200 | ||||||
¨Sempra Energy | 105,000 | 11,731,650 | ||||||
|
| |||||||
| 44,653,270 | ||||||||
|
| |||||||
Transportation 13.0% | ||||||||
Canada 1.2% | ||||||||
Canadian Pacific Railway Ltd. | 25,000 | 4,829,000 | ||||||
United States 11.8% |
| |||||||
¨Kirby Corporation (a) | 139,250 | 13,387,495 | ||||||
Quality Distribution Inc. (a) | 331,700 | 4,003,619 | ||||||
Ryder Systems, Inc. | 50,000 | 4,776,000 | ||||||
Swift Transportation Company (a) | 285,000 | 8,284,950 | ||||||
| † | Calculated as a percentage of net assets applicable to common shareholders. |
| ¨ | Among the Portfolio’s 10 largest holdings or issuers held, as of November 30, 2014, excluding short-term investments. May be subject to change daily. |
| The notes to the financial statements are an integral part of, and should be read in conjunction with, the financial statements. | 29 |
Portfolio of Investments November 30, 2014 (continued)
| Shares | Value | |||||||
| Common Stock (continued) | ||||||||
Transportation (continued) | ||||||||
United States (continued) |
| |||||||
¨Union Pacific Corp. | 93,500 | $ | 10,917,995 | |||||
XPO Logistics, Inc. (a) | 200,000 | 7,736,000 | ||||||
|
| |||||||
| 53,935,059 | ||||||||
|
| |||||||
Total Common Stock | 341,454,185 | |||||||
|
| |||||||
| Master Limited Partnerships and Related Companies 3.5% | ||||||||
Chemicals 0.2% | ||||||||
United States 0.2% | ||||||||
OCI Partners, L.P. | 47,400 | 805,800 | ||||||
|
| |||||||
Oil & Gas Storage & Transportation 3.3% |
| |||||||
Republic of the Marshall Islands 1.7% |
| |||||||
Capital Product Partners, L.P. | 112,500 | 879,750 | ||||||
GasLog Partners, L.P. | 176,384 | 4,506,611 | ||||||
Hoegh LNG Partners, L.P. | 51,339 | 944,638 | ||||||
Teekay LNG Partners, L.P. | 21,000 | 756,420 | ||||||
United States 1.6% | ||||||||
Cheniere Energy Partners, L.P. | 12,000 | 348,960 | ||||||
Cone Midstream Partners, L.P. (a) | 106,933 | 2,936,380 | ||||||
Dominion Midstream Partners, L.P. (a) | 36,242 | 1,125,314 | ||||||
Energy Transfer Equity, L.P. | 41,000 | 2,434,990 | ||||||
|
| |||||||
| 13,933,063 | ||||||||
|
| |||||||
Total Master Limited Partnerships and Related Companies | 14,738,863 | |||||||
|
| |||||||
| Shares | Value | |||||||
| Short-Term Investments—Investment Companies 8.5% | ||||||||
United States 8.5% | ||||||||
AIM Short-Term Treasury Portfolio Fund—Institutional Class, 0.01% (b) | 7,093,931 | $ | 7,093,931 | |||||
Fidelity Government Portfolio Fund—Institutional Class, 0.01% (b) | 7,093,931 | 7,093,931 | ||||||
Fidelity Money Market Portfolio—Institutional Class, 0.05% (b) | 7,093,931 | 7,093,931 | ||||||
First American Government Obligations Fund—Class Z, 0.01% (b) | 7,093,932 | 7,093,932 | ||||||
Invesco STIC Prime Portfolio, 0.04% (b) | 7,093,931 | 7,093,931 | ||||||
|
| |||||||
Total Short-Term Investments | 35,469,656 | |||||||
|
| |||||||
Total Investments | 94.1 | % | 391,662,704 | |||||
Other Assets, Less Liabilities | 5.9 | 24,485,205 | ||||||
Net Assets | 100.0 | % | $ | 416,147,909 | ||||
| (a) | No distribution or dividend was made during the period ended November 30, 2014. As such, it is classified as a non-income producing security as of November 30, 2014. |
| (b) | Rate reported is the current yield as of November 30, 2014. |
| (c) | As of November 30, 2014, cost was $415,602,052 for federal income tax purposes and net unrealized appreciation was as follows: |
Gross unrealized appreciation | $ | 13,965,929 | ||
Gross unrealized depreciation | (37,905,277 | ) | ||
|
| |||
Net unrealized depreciation | $ | (23,939,348 | ) | |
|
|
The following is a summary of the fair valuations according to the inputs used as of November 30, 2014, for valuing the Fund’s assets and liabilities.
Asset Valuation Inputs
Description | Quoted Prices in Active Markets for Identical Assets (Level 1) | Significant (Level 2) | Significant Unobservable Inputs (Level 3) | Total | ||||||||||||
| Investments in Securities (a) | ||||||||||||||||
Common Stock | $ | 341,454,185 | $ | — | $ | — | $ | 341,454,185 | ||||||||
Master Limited Partnerships and Related Companies | 14,738,863 | — | — | 14,738,863 | ||||||||||||
Short-Term Investments | 35,469,656 | — | — | 35,469,656 | ||||||||||||
|
|
|
|
|
|
|
| |||||||||
| Total Investments in Securities | $ | 391,662,704 | $ | — | $ | — | $ | 391,662,704 | ||||||||
|
|
|
|
|
|
|
| |||||||||
| (a) | For a complete listing of investments and their industries, see the Portfolio of Investments. |
The Fund recognizes transfers between the levels as of the beginning of the period.
For the period ended November 30, 2014, the Fund did not have any transfers between Level 1 and Level 2 fair value measurements.
As of November 30, 2014, the Fund did not hold any investments with significant unobservable inputs (Level 3).
| 30 | MainStay Cushing Renaissance Advantage Fund | The notes to the financial statements are an integral part of, and should be read in conjunction with, the financial statements. |
Statement of Assets and Liabilities as of November 30, 2014
| Assets | ||||
Investments, at value | $ | 391,662,704 | ||
Receivables: | ||||
Investments sold | 40,277,266 | |||
Fund shares sold | 2,487,881 | |||
Dividends and interest | 1,091,889 | |||
Prepaid expenses | 115,859 | |||
|
| |||
Total assets | 435,635,599 | |||
|
| |||
| Liabilities | ||||
Payables: | ||||
Investments purchased | 18,573,649 | |||
Manager fees (See Note 3) | 415,939 | |||
Fund shares redeemed | 381,684 | |||
NYLIFE Distributors (See Note 3) | 49,382 | |||
Transfer agent (See Note 3) | 43,496 | |||
Professional fees | 14,085 | |||
Shareholder communication | 5,060 | |||
Trustees | 1,631 | |||
Custodian | 1,506 | |||
Accrued expenses | 1,258 | |||
|
| |||
Total liabilities | 19,487,690 | |||
|
| |||
Net assets | $ | 416,147,909 | ||
|
| |||
| Composition of Net Assets | ||||
Shares of beneficial interest outstanding (par value of $.001 per share) unlimited number of shares authorized | $ | 17,853 | ||
Additional paid-in capital | 448,876,754 | |||
|
| |||
| 448,894,607 | ||||
Accumulated net investment loss | (5,718 | ) | ||
Accumulated net realized gain (loss) on investments | (10,572,182 | ) | ||
Net unrealized appreciation (depreciation) on investments | (22,168,798 | ) | ||
|
| |||
Net assets | $ | 416,147,909 | ||
|
| |||
Class A | ||||
Net assets applicable to outstanding shares | $ | 51,472,396 | ||
|
| |||
Shares of beneficial interest outstanding | 2,209,998 | |||
|
| |||
Net asset value per share outstanding | $ | 23.29 | ||
Maximum sales change (5.50% of offering price) | 1.28 | |||
|
| |||
Maximum offering price per share outstanding | $ | 24.57 | ||
|
| |||
Investor Class | ||||
Net assets applicable to outstanding shares | $ | 1,651,133 | ||
|
| |||
Shares of beneficial interest outstanding | 70,855 | |||
|
| |||
Net asset value per share outstanding | $ | 23.30 | ||
Maximum sales change (5.50% of offering price) | 1.28 | |||
|
| |||
Maximum offering price per share outstanding | $ | 24.58 | ||
|
| |||
Class C | ||||
Net assets applicable to outstanding shares | $ | 47,021,950 | ||
|
| |||
Shares of beneficial interest outstanding | 2,042,231 | |||
|
| |||
Net asset value per share outstanding | $ | 23.02 | ||
|
| |||
Class I | ||||
Net assets applicable to outstanding shares | $ | 316,002,430 | ||
|
| |||
Shares of beneficial interest outstanding | 13,529,678 | |||
|
| |||
Net asset value per share outstanding | $ | 23.36 | ||
|
|
| The notes to the financial statements are an integral part of, and should be read in conjunction with, the financial statements. | 31 |
Statement of Operations for the year ended November 30, 2014
| Investment Income (Loss) | ||||
Income | ||||
Dividends and distributions | $ | 2,539,414 | ||
Interest | 2,439 | |||
|
| |||
Total income | 2,541,853 | |||
|
| |||
Expenses | ||||
Manager (See Note 3) | 1,697,063 | |||
Distribution/Service—Class A (See Note 3) | 53,927 | |||
Distribution/Service—Investor Class (See Note 3) | 792 | |||
Distribution/Service—Class C (See Note 3) | 171,947 | |||
Transfer agent (See Note 3) | 141,245 | |||
Registration | 78,088 | |||
Administration and accounting (See Note 3) | 66,944 | |||
Professional fees | 47,517 | |||
Shareholder communication | 13,404 | |||
Miscellaneous | 9,662 | |||
Trustees | 8,500 | |||
Custodian | 5,398 | |||
Insurance | 3,076 | |||
|
| |||
Total expenses before recovery of previous waivers | 2,297,563 | |||
Expense waiver/reimbursement from Manager (See Note 3) | (10,139 | ) | ||
|
| |||
Net expenses | 2,287,424 | |||
|
| |||
Net investment income (loss) | 254,429 | |||
|
| |||
| Realized and Unrealized Gain (Loss) on Investments | ||||
Net realized gain (loss) on investments | (10,615,161 | ) | ||
Net change in unrealized appreciation (depreciation) | (23,486,369 | ) | ||
|
| |||
Net realized and unrealized gain (loss) on investments | (34,101,530 | ) | ||
|
| |||
Net increase (decrease) in net assets resulting from operations | $ | (33,847,101 | ) | |
|
| |||
| (a) | Dividends and distributions recorded net of foreign withholding taxes in the amount of $14,436. |
| 32 | MainStay Cushing Renaissance Advantage Fund | The notes to the financial statements are an integral part of, and should be read in conjunction with, the financial statements. |
Statements of Changes in Net Assets
| Year ended November 30, 2014 | Period from April 2, 2013* through November 30, 2013** | |||||||
| Increase (Decrease) in Net Assets | ||||||||
Operations: | ||||||||
Net investment income (loss) | $ | 254,429 | $ | (33,911 | ) | |||
Net realized gain (loss) on investments | (10,615,161 | ) | 31,180 | |||||
Net change in unrealized appreciation (depreciation) on investments | (23,486,369 | ) | 1,317,571 | |||||
|
| |||||||
Net increase (decrease) in net assets resulting from operations | (33,847,101 | ) | 1,314,840 | |||||
|
| |||||||
Dividends and distributions to shareholders: |
| |||||||
From net investment income: | ||||||||
Class A | (30,993 | ) | — | |||||
Investor Class | (456 | ) | — | |||||
Class C | (24,795 | ) | — | |||||
Class I | (144,092 | ) | — | |||||
|
| |||||||
| (200,336 | ) | — | ||||||
|
| |||||||
From realized gain: | ||||||||
Class A | — | (3,493 | ) | |||||
Investor Class | — | — | ||||||
Class C | — | (1,030 | ) | |||||
Class I | — | (4,859 | ) | |||||
|
| |||||||
| — | (9,382 | ) | ||||||
|
| |||||||
From return of capital: | ||||||||
Class A | (474,870 | ) | (43,287 | ) | ||||
Investor Class | (6,995 | ) | — | |||||
Class C | (379,894 | ) | (12,770 | ) | ||||
Class I | (2,207,751 | ) | (60,223 | ) | ||||
|
| |||||||
| (3,069,510 | ) | (116,280 | ) | |||||
|
| |||||||
Total dividends and distributions to shareholders | (3,269,846 | ) | (125,662 | ) | ||||
|
| |||||||
Capital share transactions: | ||||||||
Net proceeds from sale of shares | 465,017,287 | 24,879,137 | ||||||
Net asset value of shares issued to shareholders in reinvestment of dividends and distributions | 2,784,065 | 34,701 | ||||||
Cost of shares redeemed | (40,445,800 | ) | (193,712 | ) | ||||
|
| |||||||
Increase (decrease) in net assets derived from capital share transactions | 427,355,552 | 24,720,126 | ||||||
|
| |||||||
Net increase (decrease) in net assets | 390,238,605 | 25,909,304 | ||||||
| Net Assets | ||||||||
Beginning of period | 25,909,304 | — | ||||||
|
| |||||||
End of period | $ | 416,147,909 | $ | 25,909,304 | ||||
|
| |||||||
Undistributed (distributions in excess of) net investment income at end of period | $ | (5,718 | ) | $ | (19,400 | ) | ||
|
| |||||||
| * | Inception date. |
| ** | This period was audited by a predecessor audit firm whose opinion was unqualified. |
| The notes to the financial statements are an integral part of, and should be read in conjunction with, the financial statements. | 33 |
Financial Highlights selected per share data and ratios
| Class A | Year ended November 30, 2014 | April 2, 2013** through November 30, 2013*** | ||||||
Net asset value at beginning of period | $ | 22.65 | $ | 20.00 | ||||
|
|
|
| |||||
Net investment income (loss) (a) | 0.01 | (0.12 | ) | |||||
Net realized and unrealized gain (loss) on investments | 1.19 | 3.09 | ||||||
|
|
|
| |||||
Total from investment operations | 1.20 | 2.97 | ||||||
|
|
|
| |||||
| Less dividends and distributions: | ||||||||
From net investment income | (0.03 | ) | — | |||||
From net realized gain on investment | — | (0.02 | ) | |||||
From return of capital | (0.53 | ) | (0.30 | ) | ||||
|
|
|
| |||||
Total dividends and distributions | (0.56 | ) | (0.32 | ) | ||||
|
|
|
| |||||
Redemption fees retained (a)(b) | 0.00 | ‡ | 0.00 | ‡ | ||||
|
|
|
| |||||
Net asset value at end of period | $ | 23.29 | $ | 22.65 | ||||
|
|
|
| |||||
Total investment return (c) | 5.14 | % | 14.92 | % (d) | ||||
| Ratios (to average net assets)/Supplemental Data: | ||||||||
Net investment income (loss) | 0.03 | % | (0.83 | %)†† | ||||
Net expenses | 1.80 | % | 2.00 | % †† | ||||
Expenses (before waiver/reimbursement) | 1.81 | % | 5.65 | % †† | ||||
Portfolio turnover rate | 115.22 | % | 23.44 | % | ||||
Net assets at end of period (in 000’s) | $ | 51,472 | $ | 6,867 | ||||
| ** | Inception date |
| *** | This period was audited by a predecessor audit firm whose opinion was unqualified. |
| †† | Annualized. |
| ‡ | Less than one cent per share. |
| (a) | Per share data based on average shares outstanding during the period. |
| (b) | Redemption fees were only applicable prior to reorganization. |
| (c) | Total investment return is calculated exclusive of sales charges and assumes the reinvestment of dividends and distributions. |
| (d) | Total investment return is not annualized. |
| 34 | MainStay Cushing Renaissance Advantage Fund | The notes to the financial statements are an integral part of, and should be read in conjunction with, the financial statements. |
Financial Highlights selected per share data and ratios
| Investor Class | July 12, 2014** through | |||
Net asset value at beginning of period | $ | 26.80 | ||
|
| |||
Net investment income (loss) (a) | 0.03 | |||
Net realized and unrealized gain (loss) on investments | (3.25 | ) | ||
|
| |||
Total from investment operations | (3.22 | ) | ||
|
| |||
| Less dividends and distributions: | ||||
From net investment income | (0.02 | ) | ||
From return of capital | (0.26 | ) | ||
|
| |||
Total dividends and distributions | (0.28 | ) | ||
|
| |||
Net asset value at end of period | $ | 23.30 | ||
|
| |||
Total investment return (b)(c) | (12.10 | %)(d) | ||
| Ratios (to average net assets)/Supplemental Data: | ||||
Net investment income (loss) | 0.31 | % †† | ||
Net expenses | 1.70 | % †† | ||
Expenses (before waiver/reimbursement) | 1.70 | % †† | ||
Portfolio turnover rate | 115.22 | % | ||
Net assets at end of period (in 000’s) | $ | 1,651 | ||
| ** | Inception date |
| †† | Annualized. |
| (a) | Per share data based on average shares outstanding during the period. |
| (b) | Total investment return is calculated exclusive of sales charges and assumes the reinvestment of dividends and distributions. |
| (c) | Total investment return may reflect adjustments to conform to generally accepted accounting principles. |
| (d) | Total investment return is not annualized. |
| The notes to the financial statements are an integral part of, and should be read in conjunction with, the financial statements. | 35 |
Financial Highlights selected per share data and ratios
| Class C | Year ended November 30, 2014 | April 2, 2013** through November 30, 2013*** | ||||||
Net asset value at beginning of period | $ | 22.56 | $ | 20.00 | ||||
|
|
|
| |||||
Net investment income (loss) (a) | (0.16 | ) | (0.23 | ) | ||||
Net realized and unrealized gain (loss) on investments | 1.18 | 3.11 | ||||||
|
|
|
| |||||
Total from investment operations | 1.02 | 2.88 | ||||||
|
|
|
| |||||
| Less dividends and distributions: | ||||||||
From net investment income | (0.03 | ) | — | |||||
From net realized gain on investment | — | (0.02 | ) | |||||
From return of capital | (0.53 | ) | (0.30 | ) | ||||
|
|
|
| |||||
Total dividends and distributions | (0.56 | ) | (0.32 | ) | ||||
|
|
|
| |||||
Redemption fees retained (a)(b) | 0.00 | ‡ | — | |||||
|
|
|
| |||||
Net asset value at end of period | $ | 23.02 | $ | 22.56 | ||||
|
|
|
| |||||
Total investment return (c) | 4.40 | % | 14.47 | % (d) | ||||
| Ratios (to average net assets)/Supplemental Data: | ||||||||
Net investment income (loss) | (0.65 | %) | (1.58 | %)†† | ||||
Net expenses | 2.52 | % | 2.75 | % †† | ||||
Expenses (before waiver/reimbursement) | 2.53 | % | 6.40 | % †† | ||||
Portfolio turnover rate | 115.22 | % | 23.44 | % | ||||
Net assets at end of period (in 000’s) | $ | 47,022 | $ | 2,263 | ||||
| ** | Inception date |
| *** | This period was audited by a predecessor audit firm whose opinion was unqualified. |
| †† | Annualized. |
| ‡ | Less than one cent per share. |
| (a) | Per share data based on average shares outstanding during the period. |
| (b) | Redemption fees were only applicable prior to reorganization. |
| (c) | Total investment return is calculated exclusive of sales charges and assumes the reinvestment of dividends and distributions. |
| (d) | Total investment return is not annualized. |
| 36 | MainStay Cushing Renaissance Advantage Fund | The notes to the financial statements are an integral part of, and should be read in conjunction with, the financial statements. |
Financial Highlights selected per share data and ratios
| Class I | Year ended November 30, 2014 | April 2, 2013** through November 30, 2013*** | ||||||
Net asset value at beginning of period | $ | 22.66 | $ | 20.00 | ||||
|
|
|
| |||||
Net investment income (loss) (a) | 0.09 | (0.08 | ) | |||||
Net realized and unrealized gain (loss) on investments | 1.17 | 3.06 | ||||||
|
|
|
| |||||
Total from investment operations | 1.26 | 2.98 | ||||||
|
|
|
| |||||
| Less dividends and distributions: | ||||||||
From net investment income | (0.03 | ) | — | |||||
From net realized gain on investment | — | (0.02 | ) | |||||
From return of capital | (0.53 | ) | (0.30 | ) | ||||
|
|
|
| |||||
Total dividends and distributions | (0.56 | ) | (0.32 | ) | ||||
|
|
|
| |||||
Redemption fees retained (a)(b) | 0.00 | ‡ | 0.00 | ‡ | ||||
|
|
|
| |||||
Net asset value at end of period | $ | 23.36 | $ | 22.66 | ||||
|
|
|
| |||||
Total investment return (c) | 5.41 | % | 14.97 | % (d) | ||||
| Ratios (to average net assets)/Supplemental Data: | ||||||||
Net investment income (loss) | 0.37 | % | (0.58 | %)†† | ||||
Net expenses | 1.51 | % | 1.75 | % †† | ||||
Expenses (before waiver/reimbursement) | 1.52 | % | 5.40 | % †† | ||||
Portfolio turnover rate | 115.22 | % | 23.44 | % | ||||
Net assets at end of period (in 000’s) | $ | 316,002 | $ | 16,779 | ||||
| ** | Inception date |
| *** | This period was audited by a predecessor audit firm whose opinion was unqualified. |
| †† | Annualized. |
| ‡ | Less than one cent per share. |
| (a) | Per share data based on average shares outstanding during the period. |
| (b) | Redemption fees were only applicable prior to reorganization. |
| (c) | Total investment return is calculated exclusive of sales charges and assumes the reinvestment of dividends and distributions. Class I shares are not subject to sales charges. |
| (d) | Total investment return is not annualized. |
| The notes to the financial statements are an integral part of, and should be read in conjunction with, the financial statements. | 37 |
MainStay Cushing Royalty Energy Income Fund
Investment and Performance Comparison1 (Unaudited)
Performance data quoted represents past performance. Past performance is no guarantee of future results. Because of market volatility, current performance may be lower or higher than the figures shown. Investment return and principal value will fluctuate, and as a result, when shares are redeemed, they may be worth more or less than their original cost. The graph below depicts the historical performance of Class I shares of the Fund. Performance will vary from class to class based on differences in class-specific expenses and sales charges. For performance information current to the most recent month-end, please call 800-MAINSTAY (624-6782) or visit mainstayinvestments.com.
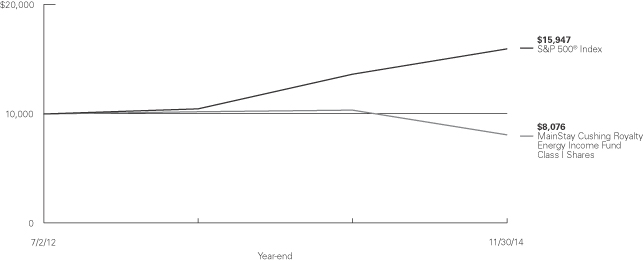
Average Annual Total Returns for the Year Ended November 30, 2014
| Class | Sales Charge | One Year | Since Inception (7/2/12) | Gross Expense Ratio2 | ||||||||||||
| Class A Shares4 | Maximum 5.5% Initial Sales Charge | With sales charge Excluding sales charge |
| -26.60 -22.12 | %
|
| -10.92 -8.71 | %
|
| 2.69 2.69 | %
| |||||
| Investor Class Shares3 | Maximum 5.5% Initial Sales Charge | With sales charge Excluding sales charge |
| -26.60 -22.12 |
|
| -10.92 -8.71 |
|
| 2.74 2.74 |
| |||||
| Class C Shares4 | Maximum 1% CDSC if Redeemed Within One Year of Purchase | With sales charge Excluding sales charge |
| -23.41 -22.71 |
|
| -9.36 -9.36 |
|
| 3.49 3.49 |
| |||||
| Class I Shares4 | No Sales Charge | -21.92 | -8.47 | 2.44 | ||||||||||||
| 1. | The performance table and graph do not reflect the deduction of taxes that a shareholder would pay on distributions or Fund share redemptions. Total returns reflect maximum applicable sales charges as indicated in the table above, changes in share price, and reinvestment of dividend and capital gain distributions. The graph assumes the initial investment amount shown above and reflects the deduction of all sales charges that would have applied for the period of investment. Performance figures reflect certain fee waivers and/or expense limitations, without which total returns may have been lower. For more information on share classes and current fee waivers and/or expense limitations, please refer to the notes to the financial statements. |
| 2. | The gross expense ratios presented reflect the Fund’s “Total Annual Fund Operating Expenses” from the most recent Prospectus and may differ from other expense ratios disclosed in this report. |
| 3. | Performance figures for Investor Class shares, first offered on July 11, 2014, include the historical performance of Class A shares through July 10, 2014, adjusted to reflect differences in certain fees and expenses. Unadjusted, the performance for Investor Class shares would likely have been different. |
| 4. | Performance figures for Class A shares, Class C shares and Class I shares reflect the historical performance of the then-existing Class A shares, Class C shares and Class I shares, respectively, of the Cushing® Royalty Energy Income Fund (the predecessor to the Fund, which was subject to a different fee structure) for periods prior to July 11, 2014. The Cushing® Royalty Energy Income Fund commenced operations on July 2, 2012. |
The footnotes on the next page are an integral part of the table and graph and should be carefully read in conjunction with them.
| 38 | MainStay Cushing Royalty Energy Income Fund |
Benchmark Performance | One Year | Since Inception | ||||||
S&P 500® Index5 | 16.86 | % | 21.35 | % | ||||
Average Lipper Energy MLP Fund6 | 11.65 | 13.36 | ||||||
| 5. | “S&P 500®” is a trademark of The McGraw-Hill Companies, Inc. The S&P 500® Index is widely regarded as the standard index for measuring large-cap U.S. stock market performance. The S&P 500® Index is the Fund’s primary benchmark. Results assume reinvestment of all dividends and capital gains. An investment cannot be made directly in an index. |
| 6. | The average Lipper Energy MLP Fund is representative of funds that invest primarily in Master Limited Partnerships (MLPs) engaged in the |
| transportation, storage and processing of minerals and natural resources. This benchmark is a product of Lipper Inc. Lipper Inc. is an independent monitor of fund performance. Results are based on total returns with all dividend and capital gain distributions reinvested. |
The footnotes on the preceding page are an integral part of the table and graph and should be carefully read in conjunction with them.
| 39 |
Cost in Dollars of a $1,000 Investment in MainStay Cushing Royalty Energy Income Fund (Unaudited)
The example below is intended to describe the fees and expenses borne by shareholders during the six-month period from June 1, 2014, to November 30, 2014, and the impact of those costs on your investment.
Example
As a shareholder of the Fund, you incur two types of costs: (1) transaction costs, including exchange fees and sales charges (loads) on purchases (as applicable), and (2) ongoing costs, including management fees, distribution and/or service (12b-1) fees, and other Fund expenses (as applicable). This example is intended to help you understand your ongoing costs (in dollars) of investing in the Fund and to compare these costs with the ongoing costs of investing in other mutual funds. The example is based on an investment of $1,000 made at the beginning of the six-month period and held for the entire period from June 1, 2014, to November 30, 2014.
This example illustrates your Fund’s ongoing costs in two ways:
Actual Expenses
The second and third data columns in the table below provide information about actual account values and actual expenses. You may use the information in these columns, together with the amount you invested, to estimate the expenses that you paid during the six months ended November 30, 2014. Simply divide your account value by $1,000 (for example, an $8,600 account value divided by $1,000 = 8.6), then
multiply the result by the number under the heading entitled “Expenses Paid During Period” to estimate the expenses you paid on your account during this period.
Hypothetical Example for Comparison Purposes
The fourth and fifth data columns in the table below provide information about hypothetical account values and hypothetical expenses based on the Fund’s actual expense ratio and an assumed rate of return of 5% per year before expenses, which is not the Fund’s actual return. The hypothetical account values and expenses may not be used to estimate the actual ending account balances or expenses you paid for the six-month period shown. You may use this information to compare the ongoing costs of investing in the Fund with the ongoing costs of investing in other Funds. To do so, compare this 5% hypothetical example with the 5% hypothetical examples that appear in the shareholder reports of the other Funds.
Please note that the expenses shown in the table are meant to highlight your ongoing costs only and do not reflect any transactional costs, such as exchange fees or sales charges (loads). Therefore, the fourth and fifth data columns of the table are useful in comparing ongoing costs only and will not help you determine the relative total costs of owning different funds. In addition, if these transactional costs were included, your costs would have been higher.
| Share Class | Beginning Value | Ending Account Value (Based on Actual Returns and Expenses) 11/30/2014 | Expenses Paid (Received) During | Ending Account on Hypothetical 5% Annualized Return and Actual Expenses) 11/30/2014 | Expenses Paid During | |||||||||||||||
| Class A Shares4 | $ | 1,000.00 | $ | 724.50 | $ | 7.78 | $ | 1,016.04 | $ | 9.10 | ||||||||||
| Investor Class Shares1,3 | $ | 1,000.00 | $ | 710.10 | $ | 4.69 | $ | 1,013.97 | $ | 5.52 | ||||||||||
| Class C Shares4 | $ | 1,000.00 | $ | 721.90 | $ | 10.83 | $ | 1,012.48 | $ | 12.66 | ||||||||||
| Class I Shares4 | $ | 1,000.00 | $ | 725.40 | $ | 6.10 | $ | 1,018.00 | $ | 7.13 | ||||||||||
| 1. | Investor Class shares were first offered as of the close of business on July 11, 2014. |
| 2. | Expenses are equal to the Fund’s annualized expense ratio of each class (1.80% for Class A, 1.41% for Investor Class, 2.51% for Class C and 1.41% for Class I) multiplied by the average account value over the period, divided by 365 and multiplied by 183 for Class A, Class C, and Class I and 142 days for Investor Class (to reflect the six-month period). The table above represents the actual expenses incurred during the six-month period. |
| 3. | Expenses paid during the period reflect ongoing costs for the period from inception through November 30, 2014. Had these shares been offered for the full six-month period ended November 30, 2014, and had the Fund provided a hypothetical 5% annualized return, expenses paid during the period would have been $7.13 for Investor Class shares and the ending account value would have been $1,018.00 for Investor Class shares. |
| 4. | For the period from June 1, 2014 through July 11, 2014, expenses were from Predecessor Fund. |
| 40 | MainStay Cushing Royalty Energy Income Fund |
Portfolio Composition as of November 30, 2014(1) (Unaudited)
(Expressed as a Percentage of Total Investments)

See Portfolio of Investments beginning on page 43 for specific holdings within these categories.
Top Ten Holdings as of November 30, 2014 (excluding short-term investments) (Unaudited)
| 1. | EV Energy Partners, L.P. |
| 2. | BreitBurn Energy Partners, L.P. |
| 3. | Vanguard Natural Resources, LLC |
| 4. | Legacy Reserves, L.P. |
| 5. | Linn Energy, LLC |
| 6. | Memorial Production Partners, L.P. |
| 7. | Atlas Resource Partners, L.P. |
| 8. | Crescent Point Energy Corporation |
| 9. | Mid-Con Energy Partners, L.P. |
| 10. | Dorchester Minerals, L.P. |
| (1) | Fund holdings and sector allocations are subject to change, and there is no assurance that the Fund will continue to hold any particular security. |
| (2) | Master Limited Partnerships and Related Companies |
| (3) | Royalty Trusts |
| (4) | Common Stock |
| 41 |
Portfolio Management Discussion and Analysis (Unaudited)
Questions answered by portfolio managers Jerry V. Swank, Daniel L. Spears, and Judd B. Cryer of Cushing Asset Management, LP, the Fund’s Subadvisor.
How did MainStay Cushing Royalty Energy Income Fund perform relative to its primary benchmark and peers during the 12 months ended November 30, 2014?
Excluding all sales charges, MainStay Cushing Royalty Energy Income Fund returned –22.12% for Class A shares and Investor Class shares and –22.71% for Class C shares. Over the same period, Class I shares returned –21.92%. For the 12 months ended November 30, 2014, all share classes underperformed the 16.86% return of the S&P 500® Index,1 which is the Fund’s primary broad-based securities-market index. Over the same period, all share classes underperformed the 11.65% return of the average Lipper2 Energy MLP Fund. See page 38 for Fund returns with applicable sales charges.
What factors affected the Fund’s performance relative to the S&P 500® Index during the reporting period?
During the reporting period the single most significant factor that affected the Fund’s performance relative to the S&P 500® Index was a substantial decline in domestic and international crude oil prices. The S&P 500® Index includes stocks across many sectors, while the Fund’s exposure is limited to the energy sector. It is therefore not surprising that declining crude oil prices led the Fund to underperform of the S&P 500® Index during the reporting period.
Which subsectors were the strongest contributors to the Fund’s absolute performance and which subsectors were particularly weak?
The Fund invests primarily in four subsectors: upstream MLPs, U.S. royalty trusts, Canadian exploration and production companies and other energy companies. The top contributors to the Fund’s performance during the reporting period were the upstream MLPs and Canadian exploration and production companies. (Contributions take weightings and total returns into account.) On average, these subsectors represented the highest Fund weightings during the reporting period; and they both provided negative absolute performance.
The subsectors with the weakest contributions to the Fund’s absolute performance during the reporting period were U.S. royalty trusts and other energy companies. Both of these subsectors had relatively modest weightings, and they both provided negative absolute performance during the reporting period.
Performance in all of the Fund’s main subsectors was particularly hard hit by the deteriorating commodity-price environment.
During the reporting period, which individual holdings made the strongest contributions to the Fund’s absolute performance and which holdings detracted the most?
The strongest positive contribution to the Fund’s absolute performance came from fracking sand producer Emerge Energy
Services L.P., followed by oil and natural gas producer RSP Permian Inc. and refined petroleum wholesaler and distributor Sprague Resources, L.P. The greatest detractor from the Fund’s absolute performance during the reporting period was upstream MLP Linn Energy, LLC, followed by upstream MLP Memorial Production Partners, L.P., and upstream MLP Legacy Reserves, L.P. Each of these detractors had negative absolute performance driven by the deteriorating commodity-price environment.
Did the Fund make any significant purchases or sales during the reporting period?
During the reporting period, large purchases included positions in Legacy Reserves, L.P., an upstream MLP and Bonterra Energy Corp., a Canadian energy company. The Fund purchased a position in Legacy Reserves, L.P., because of its attractive potential for distribution growth. This growth was driven by the potential for assets available for “drop down” acquisitions from its strategic partner, WPX Energy Inc. (which owns incentive distribution rights for Legacy Reserves, L.P.) and a strong position in the prolific Permian Basin. The Fund purchased its position in Bonterra Energy Corporation because of improving drilling results in the Cardium oil pool, the company’s strong financial position and the potential for distribution increases.
During the reporting period, large sales included Linn Energy, LLC, an upstream MLP, and Petrologistics L.P., an MLP that owned and operated a propane dehydrogenation facility. Linn Energy, LLC, was involved in a transaction to merge with another company that was held by the Fund (Berry Petroleum Company), and Petrologistics L.P. was involved in a buyout by a private company. We sold some of the Fund’s Linn Energy, LLC, position to reduce the Fund’s combined exposure to the pro forma merged entities. We sold Petrologistics L.P. to reallocate capital to other investments following the buyout, which took the company private.
How did the Fund’s subsector weightings change during the reporting period?
During the reporting period, the Fund decreased exposure to the U.S. royalty trusts subsector. Exposure to the upstream MLP, Canadian exploration and production companies, and other energy companies subsectors remained relatively unchanged.
How was the Fund positioned at the end of the reporting period?
As of November 30, 2014, the Fund’s largest subsector position was in upstream MLPs, followed by Canadian exploration and production companies and other energy companies, with the majority of exposure focused in the upstream MLP subsector.
| 1. | See footnote on page 39 for more information on the S&P 500® Index. |
| 2. | See footnote on page 39 for more information on Lipper Inc. |
The opinions expressed are those of the portfolio managers as of the date of this report and are subject to change. There is no guarantee that any forecast made will come to pass. This material does not constitute investment advice and is not intended as an endorsement of any specific investment.
| 42 | MainStay Cushing Royalty Energy Income Fund |
Portfolio of Investments November 30, 2014
| Shares | Value | |||||||
| Common Stock 12.2%† | ||||||||
Upstream 12.2% | ||||||||
Canada 12.2% | ||||||||
Arc Resources Ltd. | 245,577 | $ | 5,807,085 | |||||
Bonterra Energy Corporation | 155,560 | 5,890,466 | ||||||
¨Crescent Point Energy Corporation | 436,065 | 11,318,242 | ||||||
Enerplus Corporation | 460,767 | 6,013,009 | ||||||
Freehold Royalties Ltd. | 235,404 | 4,008,147 | ||||||
Painted Pony Petroleum Ltd. (a) | 128,000 | 1,063,402 | ||||||
|
| |||||||
Total Common Stock | 34,100,351 | |||||||
|
| |||||||
| Master Limited Partnerships and Related Companies 72.4% | ||||||||
Coal 1.5% | ||||||||
United States 1.5% | ||||||||
Natural Resource Partners, L.P. | 348,000 | 4,155,120 | ||||||
|
| |||||||
Crude Oil & Refined Products 0.4% |
| |||||||
United States 0.4% | ||||||||
Delek Logistics Partners, L.P. | 35,034 | 1,295,908 | ||||||
|
| |||||||
Other 2.6% | ||||||||
Republic of the Marshall Islands 2.6% |
| |||||||
Seadrill Partners, LLC | 220,169 | 3,725,259 | ||||||
Transocean Partners, LLC | 224,300 | 3,517,024 | ||||||
|
| |||||||
| 7,242,283 | ||||||||
|
| |||||||
Shipping 2.8% | ||||||||
Republic of the Marshall Islands 2.8% |
| |||||||
Capital Products Partners, L.P. | 445,295 | 3,482,207 | ||||||
Golar LNG Partners, L.P. | 131,500 | 4,326,350 | ||||||
|
| |||||||
| 7,808,557 | ||||||||
|
| |||||||
Upstream 62.6% | ||||||||
United States 62.6% | ||||||||
¨Atlas Resource Partners, L.P. | 1,078,996 | 16,411,529 | ||||||
¨BreitBurn Energy Partners, L.P. | 1,856,640 | 24,526,216 | ||||||
¨Dorchester Minerals, L.P. | 330,990 | 8,549,472 | ||||||
¨EV Energy Partners, L.P. | 898,909 | 25,466,092 | ||||||
¨Legacy Reserves, L.P. | 1,075,978 | 19,184,688 | ||||||
¨Linn Energy, LLC | 1,022,344 | 18,657,778 | ||||||
LinnCo, LLC | 260,506 | 4,274,903 | ||||||
LRR Energy, L.P. | 553,228 | 6,306,799 | ||||||
¨Memorial Production Partners, L.P. | 1,337,960 | 18,410,330 | ||||||
¨Mid-Con Energy Partners, L.P. | 863,285 | 10,134,966 | ||||||
¨Vanguard Natural Resources, LLC | 1,020,010 | 23,684,632 | ||||||
|
| |||||||
| 175,607,405 | ||||||||
|
| |||||||
| Shares | Value | |||||||
Variable Distribution 2.5% | ||||||||
United States 2.5% | ||||||||
Alon USA Partners, L.P. | 255,000 | $ | 4,347,750 | |||||
CVR Refining L.P. | 120,000 | 2,674,800 | ||||||
|
| |||||||
| 7,022,550 | ||||||||
|
| |||||||
Total Master Limited Partnerships and Related Companies | 203,131,823 | |||||||
|
| |||||||
| Royalty Trusts 1.7% | ||||||||
Upstream 1.7% | ||||||||
United States 1.7% | ||||||||
Enduro Royalty Trust | 180,200 | 1,272,212 | ||||||
Permian Basin Royalty Trust | 204,400 | 2,238,180 | ||||||
Sabine Royalty Trust | 26,673 | 1,286,972 | ||||||
|
| |||||||
Total Royalty Trusts | 4,797,364 | |||||||
|
| |||||||
| Short-Term Investments—Investment Companies 14.5% | ||||||||
United States 14.5% | ||||||||
AIM Short-Term Treasury Portfolio Fund—Institutional Class, 0.01% (b) | 8,134,554 | 8,134,554 | ||||||
Fidelity Government Portfolio Fund—Institutional Class, 0.01% (b) | 8,134,554 | 8,134,554 | ||||||
Fidelity Money Market Portfolio—Institutional Class, 0.05% (b) | 8,134,553 | 8,134,553 | ||||||
First American Government Obligations Fund—Class Z, 0.01% (b) | 8,134,553 | 8,134,553 | ||||||
Invesco STIC Prime Portfolio, 0.04% (b) | 8,134,553 | 8,134,553 | ||||||
|
| |||||||
Total Short-Term Investments | 40,672,767 | |||||||
|
| |||||||
Total Investments | 100.8 | % | 282,702,305 | |||||
Liabilities in Excess of Other Assets | (0.8 | ) | (2,208,055 | ) | ||||
Net Assets | 100.0 | % | $ | 280,494,250 | ||||
| (a) | No distribution or dividend was made during the period ended November 30, 2014. As such, it is classified as a non-income producing security as of November 30, 2014. |
| (b) | Rate reported is the current yield as of November 30, 2014. |
| (c) | As of November 30, 2014, cost was $353,907,021 for federal income tax purposes and net unrealized appreciation was as follows: |
Gross unrealized appreciation | $ | 1,713,680 | ||
Gross unrealized depreciation | (72,918,396 | ) | ||
|
| |||
Net unrealized depreciation | $ | (71,204,716 | ) | |
|
|
| † | Calculated as a percentage of net assets applicable to common shareholders. |
| ¨ | Among the Portfolio’s 10 largest holdings or issuers held, as of November 30, 2014, excluding short-term investments. May be subject to change daily. |
| The notes to the financial statements are an integral part of, and should be read in conjunction with, the financial statements. | 43 |
Portfolio of Investments November 30, 2014 (continued)
The following is a summary of the fair valuations according to the inputs used as of November 30, 2014, for valuing the Fund’s assets and liabilities.
Asset Valuation Inputs
Description | Quoted Prices in Active Markets for Identical Assets (Level 1) | Significant Other Observable Inputs (Level 2) | Significant Unobservable Inputs (Level 3) | Total | ||||||||||||
| Investments in Securities (a) | ||||||||||||||||
Common Stock | $ | 34,100,351 | $ | — | $ | — | $ | 34,100,351 | ||||||||
Master Limited Partnerships and Related Companies | 203,131,823 | — | — | 203,131,823 | ||||||||||||
Royalty Trusts | 4,797,364 | — | — | 4,797,364 | ||||||||||||
Short-Term Investments | 40,672,767 | — | — | 40,672,767 | ||||||||||||
|
|
|
|
|
|
|
| |||||||||
| Total Investments in Securities | $ | 282,702,305 | $ | — | $ | — | $ | 282,702,305 | ||||||||
|
|
|
|
|
|
|
| |||||||||
| (a) | For a complete listing of investments and their industries, see the Portfolio of Investments. |
The Fund recognizes transfers between the levels as of the beginning of the period.
For the year ended November 30, 2014, the Fund did not have any transfers between Level 1 and Level 2 fair value measurements.
As of November 30, 2014, the Fund did not hold any investments with significant unobservable inputs (Level 3).
| 44 | MainStay Cushing Royalty Energy Income Fund | The notes to the financial statements are an integral part of, and should be read in conjunction with, the financial statements. |
Statement of Assets and Liabilities as of November 30, 2014
| Assets | ||||
Investments, at value (identified cost $353,619,733) | $ | 282,702,305 | ||
Receivables: | ||||
Fund shares sold | 5,846,295 | |||
Dividends and interest | 412,654 | |||
Prepaid expenses | 122,273 | |||
|
| |||
Total assets | 289,083,527 | |||
|
| |||
| Liabilities | ||||
Payables: | ||||
Due to custodian | 770,058 | |||
Investments purchased | 6,829,006 | |||
Fund shares redeemed | 568,151 | |||
Advisory fees (See Note 3) | 291,047 | |||
NYLIFE Distributors (See Note 3) | 87,225 | |||
Transfer agent (See Note 3) | 24,731 | |||
Shareholder communication | 4,590 | |||
Professional fees | 10,554 | |||
Trustees | 1,379 | |||
Custodian | 1,253 | |||
Accrued expenses | 1,283 | |||
|
| |||
Total liabilities | 8,589,277 | |||
|
| |||
Net assets | $ | 280,494,250 | ||
|
| |||
| Composition of Net Assets | ||||
Shares of beneficial interest outstanding (par value of $.001 per share) unlimited number of shares authorized | $ | 21,614 | ||
Additional paid-in capital | 357,475,724 | |||
|
| |||
| 357,497,338 | ||||
Accumulated net investment loss, net of income taxes | (613,761 | ) | ||
Accumulated net realized gain (loss) on investments, net of income taxes | (4,898,467 | ) | ||
Net unrealized appreciation (depreciation) on investments, net of income taxes | (71,490,860 | ) | ||
|
| |||
Net assets | $ | 280,494,250 | ||
|
| |||
Class A | ||||
Net assets applicable to outstanding shares | $ | 136,036,554 | ||
|
| |||
Shares of beneficial interest outstanding | 10,469,187 | |||
|
| |||
Net asset value per share outstanding | $ | 12.99 | ||
Maximum sales change (5.50% of offering price) | 0.71 | |||
|
| |||
Maximum offering price per share outstanding | $ | 13.70 | ||
|
| |||
Investor Class | ||||
Net assets applicable to outstanding shares | $ | 908,047 | ||
|
| |||
Shares of beneficial interest outstanding | 69,914 | |||
|
| |||
Net asset value per share outstanding | $ | 12.99 | ||
Maximum sales change (5.50% of offering price) | 0.71 | |||
|
| |||
Maximum offering price per share outstanding | $ | 13.70 | ||
|
| |||
Class C | ||||
Net assets applicable to outstanding shares | $ | 48,574,457 | ||
|
| |||
Shares of beneficial interest outstanding | 3,814,050 | |||
|
| |||
Net asset value per share outstanding | $ | 12.74 | ||
|
| |||
Class I | ||||
Net assets applicable to outstanding shares | $ | 94,975,192 | ||
|
| |||
Shares of beneficial interest outstanding | 7,261,062 | |||
|
| |||
Net asset value per share outstanding | $ | 13.08 | ||
|
|
| The notes to the financial statements are an integral part of, and should be read in conjunction with, the financial statements. | 45 |
Statement of Operations for the year ended November 30, 2014
| Investment Income (Loss) | ||||
Income | ||||
Dividends and distributions | $ | 1,625,345 | ||
Interest | 2,169 | |||
|
| |||
Total income | 1,627,514 | |||
|
| |||
Expenses | ||||
Manager (See Note 3) | 1,687,605 | |||
Distribution/Service—Class A (See Note 3) | 200,638 | |||
Distribution/Service—Investor Class (See Note 3) | 381 | |||
Distribution/Service—Class C (See Note 3) | 222,240 | |||
Administration and accounting (See Note 3) | 120,890 | |||
Transfer agent (See Note 3) | 118,886 | |||
Professional fees | 77,172 | |||
Registration | 57,151 | |||
Insurance | 8,669 | |||
Trustees | 8,100 | |||
Custodian | 8,029 | |||
Shareholder communication | 4,333 | |||
Miscellaneous | 900 | |||
|
| |||
Total expenses before recovery of previous waivers | 2,514,994 | |||
Expense waiver/reimbursement from Manager (see Note 3) | (190,795 | ) | ||
|
| |||
Net expenses | 2,324,199 | |||
|
| |||
Net Investment Loss, before Income Taxes | (696,685 | ) | ||
Deferred tax benefit | 65,316 | |||
|
| |||
Net Investment Income (Loss) | (631,369 | ) | ||
|
| |||
| Realized and Unrealized Gain (Loss) on Investments | ||||
Net realized gain (loss) on: | ||||
Investments | (3,924,802 | ) | ||
Foreign currency transactions | (5,216 | ) | ||
|
| |||
Net realized gain (loss) on investments | (3,930,018 | ) | ||
|
| |||
Net change in unrealized appreciation (depreciation) on: | ||||
Investments | (72,630,798 | ) | ||
Foreign currency translations | (2,847 | ) | ||
|
| |||
Net change in unrealized appreciation (depreciation) | (72,633,645 | ) | ||
|
| |||
Net realized and unrealized gain (loss) on investments | (76,563,663 | ) | ||
|
| |||
Net increase (decrease) in net assets resulting from operations | $ | (77,195,032 | ) | |
|
| |||
| (a) | Dividends and distributions recorded net of foreign withholding taxes in the amount of $163,496. |
| 46 | MainStay Cushing Royalty Energy Income Fund | The notes to the financial statements are an integral part of, and should be read in conjunction with, the financial statements. |
Statements of Changes in Net Assets
| Year ended November 30, 2014 | Year ended November 30, 2013* | |||||||
| Increase (Decrease) in Net Assets | ||||||||
Operations: | ||||||||
Net investment income (loss) | $ | (631,369 | ) | $ | 17,106 | |||
Net realized gain (loss) on investments | (3,930,018 | ) | (966,679 | ) | ||||
Net change in unrealized appreciation | ||||||||
(depreciation) on investments | (72,633,645 | ) | 1,141,568 | |||||
|
| |||||||
Net increase (decrease) in net assets resulting from operations | (77,195,032 | ) | 191,995 | |||||
|
| |||||||
Dividends and distributions to shareholders: | ||||||||
From return of capital: | ||||||||
Class A | (7,839,149 | ) | (1,645,676 | ) | ||||
Investor Class | (16,376 | ) | — | |||||
Class C | (2,107,208 | ) | (293,815 | ) | ||||
Class I | (2,213,237 | ) | (83,251 | ) | ||||
|
| |||||||
| (12,175,970 | ) | (2,022,742 | ) | |||||
|
| |||||||
Total dividends and distributions to shareholders | (12,175,970 | ) | (2,022,742 | ) | ||||
|
| |||||||
Capital share transactions: | ||||||||
Net proceeds from sale of shares | 334,154,320 | 64,250,671 | ||||||
Net asset value of shares issued to shareholders in reinvestment of dividends and distributions | 10,602,789 | 1,563,074 | ||||||
Cost of shares redeemed | (35,503,765 | ) | (4,146,870 | ) | ||||
|
| |||||||
Increase (decrease) in net assets derived from capital share transactions | 309,253,344 | 61,666,875 | ||||||
|
| |||||||
Net increase (decrease) in net assets | 219,882,342 | 59,836,128 | ||||||
| Net Assets | ||||||||
Beginning of year | 60,611,908 | 775,780 | ||||||
|
| |||||||
End of year | $ | 280,494,250 | $ | 60,611,908 | ||||
|
| |||||||
Undistributed (distributions in excess of) net investment income at end of year | $ | (613,761 | ) | $ | 17,608 | |||
|
| |||||||
| * | This year was audited by a predecessor audit firm whose opinion was unqualified. |
| The notes to the financial statements are an integral part of, and should be read in conjunction with, the financial statements. | 47 |
Financial Highlights selected per share data and ratios
| Year ended November 30, | July 2, 2012** through | |||||||||||
| Class A | 2014 | 2013*** | 2012*** | |||||||||
Net asset value at beginning of period | $ | 18.23 | $ | 19.58 | $ | 20.00 | ||||||
|
|
|
|
|
| |||||||
Net investment income (loss) (a) | (0.08 | ) | 0.03 | 0.07 | ||||||||
Net realized and unrealized gain (loss) on investments | (3.56 | ) | 0.22 | 0.31 | ||||||||
|
|
|
|
|
| |||||||
Total from investment operations | (3.64 | ) | 0.25 | 0.38 | ||||||||
|
|
|
|
|
| |||||||
| Less dividends and distributions: | ||||||||||||
From return of capital | (1.60 | ) | (1.60 | ) | (0.80 | ) | ||||||
|
|
|
|
|
| |||||||
Total dividends and distributions | (1.60 | ) | (1.60 | ) | (0.80 | ) | ||||||
|
|
|
|
|
| |||||||
Redemption fees retained (a)(b) | 0.00 | ‡ | — | — | ||||||||
|
|
|
|
|
| |||||||
Net asset value at end of period | $ | 12.99 | $ | 18.23 | $ | 19.58 | ||||||
|
|
|
|
|
| |||||||
Total investment return (c) | (22.12 | %) | 1.23 | % | 1.81 | %(d) | ||||||
| Ratios (to average net assets)/Supplemental Data: | ||||||||||||
Net investment income (loss) (including net deferred income tax benefit (expense)) (e) | 1.75 | % | (0.19 | )% | 0.55 | %†† | ||||||
Net investment income (loss) (excluding net deferred income tax benefit (expense)) (e) | (0.53 | %) | 0.10 | % | 0.50 | %†† | ||||||
Net expenses (including net deferred income tax (benefit) expense) (e)(f) | 3.02 | % | 2.29 | % | 1.95 | %†† | ||||||
Expenses (before waiver/reimbursement, including net deferred income tax (benefit) expense) (e)(f) | 3.19 | % | 3.80 | % | 439.62 | %†† | ||||||
Portfolio turnover rate | 26.81 | % | 61.96 | % | 17.31 | % | ||||||
Net assets at end of period (in 000’s) | $ | 136,037 | $ | 50,565 | $ | 297 | ||||||
| ** | Inception date |
| *** | These years were audited by a predecessor audit firm whose opinion was unqualified. |
| †† | Annualized. |
| ‡ | Less than one cent per share. |
| (a) | Per share data based on average shares outstanding during the period. |
| (b) | Redemption fees were only applicable prior to reorganization. |
| (c) | Total investment return is calculated exclusive of sales charges and assumes the reinvestment of dividends and distributions. |
| (d) | Total investment return is not annualized. |
| (e) | For the year ended November 30, 2014, the Fund accrued $65,316 in net current and deferred income tax benefit, of which $(978,230) is attributable to Class A. For the year ended November 30, 2013, the Fund accrued $71,348 in net current and deferred income tax expense, of which $58,510 is attributable to Class A. For the period from July 2, 2012 to November 30, 2012, the Fund accrued $31 in net current and deferred income tax benefit, of which $13 is attributable to Class A. |
| (f) | The ratio of expenses excluding net current and deferred income tax benefit to average net assets before waiver was 1.97%, 3.26% and 439.42% for the fiscal years ended November 30, 2014, 2013 and the period from July 2, 2012 to November 30, 2012, respectively. The ratio of expenses excluding deferred income tax benefit to average net assets after waiver was 1.80%, 1.75% and 1.75% for the fiscal years ended November 30, 2014, 2013 and the period from July 2, 2012 to November 30, 2012, respectively. |
| 48 | MainStay Cushing Royalty Energy Income Fund | The notes to the financial statements are an integral part of, and should be read in conjunction with, the financial statements. |
Financial Highlights selected per share data and ratios
| Investor Class | July 12, 2014** through | |||
Net asset value at beginning of period | $ | 19.15 | ||
|
| |||
Net investment income (loss) (a) | (0.02 | ) | ||
Net realized and unrealized gain (loss) on investments | (5.34 | ) | ||
|
| |||
Total from investment operations | (5.36 | ) | ||
|
| |||
| Less dividends and distributions: | ||||
From return of capital | (0.80 | ) | ||
|
| |||
Total dividends and distributions | (0.80 | ) | ||
|
| |||
Net asset value at end of period | $ | 12.99 | ||
|
| |||
Total investment return (b)(c) | (28.99 | %)(d) | ||
| Ratios (to average net assets)/Supplemental Data: | ||||
Net investment income (loss) (including net deferred income tax benefit (expense)) (e) | 1.97 | % †† | ||
Net investment income (loss) (excluding net deferred income tax benefit (expense)) (e) | (0.20 | %)†† | ||
Net expenses (including net deferred income tax (benefit) expense) (e)(f) | (0.55 | %)†† | ||
Expenses (before waiver/reimbursement, including net deferred income tax (benefit) expense) (e)(f) | (0.45 | %)†† | ||
Portfolio turnover rate | 26.81 | % | ||
Net assets at end of period (in 000’s) | $ | 908 | ||
| ** | Inception date |
| †† | Annualized. |
| (a) | Per share data based on average shares outstanding during the period. |
| (b) | Total investment return is calculated exclusive of sales charges and assumes the reinvestment of dividends and distributions. |
| (c) | Total investment return may reflect adjustments to conform to generally accepted accounting principles. |
| (d) | Total investment return is not annualized. |
| (e) | For the year ended November 30, 2014, the Fund accrued $65,316 in net current and deferred income tax benefit, of which $8,533 is attributable to Investor Class. |
| (f) | The ratio of expenses excluding net current and deferred income tax benefit to average net assets before waiver was 1.72% for the period from July 12, 2014 to November 30, 2014. The ratio of expenses excluding deferred income tax benefit to average net assets after waiver was 1.62% for the period from July 12, 2014 to November 30, 2014. |
| The notes to the financial statements are an integral part of, and should be read in conjunction with, the financial statements. | 49 |
Financial Highlights selected per share data and ratios
| Year ended November 30, | July 2, 2012** through | |||||||||||
| Class C | 2014 | 2013*** | 2012*** | |||||||||
Net asset value at beginning of period | $ | 18.04 | $ | 19.53 | $ | 20.00 | ||||||
|
|
|
|
|
| |||||||
Net investment income (loss) (a) | (0.20 | ) | (0.11 | ) | 0.01 | |||||||
Net realized and unrealized gain (loss) on investments | (3.50 | ) | 0.22 | 0.32 | ||||||||
|
|
|
|
|
| |||||||
Total from investment operations | (3.70 | ) | 0.11 | 0.33 | ||||||||
|
|
|
|
|
| |||||||
| Less dividends and distributions: | ||||||||||||
From return of capital | (1.60 | ) | (1.60 | ) | (0.80 | ) | ||||||
|
|
|
|
|
| |||||||
Total dividends and distributions | (1.60 | ) | (1.60 | ) | (0.80 | ) | ||||||
|
|
|
|
|
| |||||||
Redemption fees retained (a)(b) | 0.00 | ‡ | — | — | ||||||||
|
|
|
|
|
| |||||||
Net asset value at end of period | $ | 12.74 | $ | 18.04 | $ | 19.53 | ||||||
|
|
|
|
|
| |||||||
Total investment return (c) | (22.71 | %) | 0.48 | % | 1.56 | % (d) | ||||||
| Ratios (to average net assets)/Supplemental Data: | ||||||||||||
Net investment income (loss) (including net deferred income tax benefit (expense)) (e) | (0.93 | %) | (0.94 | %) | (0.20 | %)†† | ||||||
Net investment income (loss) (excluding net deferred income tax benefit (expense)) (e) | (1.21 | %) | (0.65 | %) | (0.25 | %)†† | ||||||
Net expenses (including net deferred income tax (benefit) expense) (e)(f) | 2.23 | % | 3.04 | % | 2.70 | %†† | ||||||
Expenses (before waiver/reimbursement, including net deferred income tax (benefit) expense) (e)(f) | 2.38 | % | 4.55 | % | 440.37 | %†† | ||||||
Portfolio turnover rate | 26.81 | % | 61.96 | % | 17.31 | % | ||||||
Net assets at end of period (in 000’s) | $ | 48,574 | $ | 8,379 | $ | 401 | ||||||
| ** | Inception date |
| *** | These years were audited by a predecessor audit firm whose opinion was unqualified. |
| †† | Annualized. |
| ‡ | Less than one cent per share. |
| (a) | Per share data based on average shares outstanding during the period. |
| (b) | Redemption fees were only applicable prior to reorganization. |
| (c) | Total investment return is calculated exclusive of sales charges and assumes the reinvestment of dividends and distributions. |
| (d) | Total investment return is not annualized. |
| (e) | For the year ended November 30, 2014, the Fund accrued $65,316 in net current and deferred income tax benefit, of which $62,248 is attributable to Class C. For the year ended November 30, 2013, the Fund accrued $71,348 in net current and deferred income tax expense, of which $10,203 is attributable to Class C. For the period from July 2, 2012 to November 30, 2012, the Fund accrued $31 in net current and deferred income tax benefit, of which $10 is attributable to Class C. |
| (f) | The ratio of expenses excluding net current and deferred income tax benefit to average net assets before waiver was 2.66%, 4.26% and 440.42% for the fiscal years ended November 30, 2014, 2013 and the period from July 2, 2012 to November 30, 2012, respectively. The ratio of expenses excluding deferred income tax benefit to average net assets after waiver was 2.51%, 2.75% and 2.75% for the fiscal years ended November 30, 2014, 2013 and the period from July 2, 2012 to November 30, 2012, respectively. |
| 50 | MainStay Cushing Royalty Energy Income Fund | The notes to the financial statements are an integral part of, and should be read in conjunction with, the financial statements. |
Financial Highlights selected per share data and ratios
| Year ended November 30, | July 2, 2012** through | |||||||||||
| Class I | 2014 | 2013*** | 2012*** | |||||||||
Net asset value at beginning of period | $ | 18.30 | $ | 19.60 | $ | 20.00 | ||||||
|
|
|
|
|
| |||||||
Net investment income (loss) (a) | (0.02 | ) | 0.08 | 0.10 | ||||||||
Net realized and unrealized gain (loss) on investments | (3.60 | ) | 0.22 | 0.30 | ||||||||
|
|
|
|
|
| |||||||
Total from investment operations | (3.62 | ) | 0.30 | 0.40 | ||||||||
|
|
|
|
|
| |||||||
| Less dividends and distributions: | ||||||||||||
From return of capital | (1.60 | ) | (1.60 | ) | (0.80 | ) | ||||||
|
|
|
|
|
| |||||||
Total dividends and distributions | (1.60 | ) | (1.60 | ) | (0.80 | ) | ||||||
|
|
|
|
|
| |||||||
Redemption fees retained (a)(b) | — | — | — | |||||||||
|
|
|
|
|
| |||||||
Net asset value at end of period | $ | 13.08 | $ | 18.30 | $ | 19.60 | ||||||
|
|
|
|
|
| |||||||
Total investment return (c) | (21.92 | %) | 1.49 | % | 1.91 | %(d) | ||||||
| Ratios (to average net assets)/Supplemental Data: | ||||||||||||
Net investment income (loss) (including net deferred income tax benefit (expense)) (e) | 4.33 | % | 0.06 | % | 0.80 | %†† | ||||||
Net investment income (loss) (excluding net deferred income tax benefit (expense)) (e) | (0.01 | %) | 0.35 | % | 0.75 | %†† | ||||||
Net expenses (including net deferred income tax (benefit) expense) (e)(f) | (2.94 | %) | 2.04 | % | 1.70 | %†† | ||||||
Expenses (before waiver/reimbursement, including net deferred income tax (benefit) expense) (e)(f) | (2.83 | %) | 3.55 | % | 439.37 | %†† | ||||||
Portfolio turnover rate | 26.81 | % | 61.96 | % | 17.31 | % | ||||||
Net assets at end of period (in 000’s) | $ | 94,975 | $ | 1,667 | $ | 77 | ||||||
| ** | Inception date |
| *** | These years were audited by a predecessor audit firm whose opinion was unqualified. |
| †† | Annualized. |
| ‡ | Less than one cent per share. |
| (a) | Per share data based on average shares outstanding during the period. |
| (b) | Redemption fees were only applicable prior to reorganization. |
| (c) | Total investment return is calculated exclusive of sales charges and assumes the reinvestment of dividends and distributions. Class I shares are not subject to sales charges. |
| (d) | Total investment return is not annualized. |
| (e) | For the year ended November 30, 2014, the Fund accrued $65,316 in net current and deferred income tax benefit, of which $972,765 is attributable to Class I. For the year ended November 30, 2013, the Fund accrued $71,348 in net current and deferred income tax expense, of which $2,635 is attributable to Class I. For the period from July 2, 2012 to November 30, 2012, the Fund accrued $31 in net current and deferred income tax benefit, of which $8 is attributable to Class I. |
| (f) | The ratio of expenses excluding net current and deferred income tax benefit to average net assets before waiver was 1.52%, 3.26% and 439.42% for the fiscal years ended November 30, 2014, 2013 and the period from July 2, 2012 to November 30, 2012, respectively. The ratio of expenses excluding deferred income tax benefit to average net assets after waiver was 1.41%, 1.75% and 1.75% for the fiscal years ended November 30, 2014, 2013 and the period from July 2, 2012 to November 30, 2012, respectively. |
| The notes to the financial statements are an integral part of, and should be read in conjunction with, the financial statements. | 51 |
Note 1–Organization and Business
MainStay Funds Trust (the “Trust”) was organized as a Delaware statutory trust on April 28, 2009 and is governed by a Declaration of Trust. The Trust is registered under the Investment Company Act of 1940, as amended (the “1940 Act”), as an open-end management investment company, and is comprised of thirty-eight funds (collectively referred to as the “Funds” and each individually, referred to as a “Fund”). These financial statements and notes relate to the MainStay Cushing MLP Premier Fund, MainStay Cushing Renaissance Advantage Fund and MainStay Cushing Royalty Energy Income Fund (collectively referred to as the “Cushing Funds” and each individually referred to as a “Cushing Fund”). Each Cushing Fund is the successor corresponding series of The Cushing® Funds Trust (collectively referred to as the “Predecessor Funds” and each individually referred to as a “Predecessor Fund”), for which Cushing® Asset Management, LP, a Texas limited partnership and the Funds’ Subadvisor (as defined in Note 3(A)), served as investment adviser. The financial statements of the Funds reflect the historical results of the Predecessor Funds prior to their reorganization on July 11, 2014. Upon the completion of the reorganization, Class A, Class C and Class I shares of each Cushing Fund assumed the performance, financial and other information of the Predecessor Funds. All information and references to periods prior to July 11, 2014 refer to the Predecessor Funds.
The MainStay Cushing MLP Premier Fund offers four classes of shares. Class A, Class C and Class I shares commenced operations on October 20, 2010. Investor Class shares commenced operations on July 12, 2014. The investment objective is to seek current income and capital appreciation.
The MainStay Cushing Renaissance Advantage Fund offers four classes of shares. Class A, Class C and Class I shares commenced operations on April 2, 2013. Investor Class shares commenced operations on July 12, 2014. The investment objective is to seek total return.
The MainStay Cushing Royalty Energy Income Fund offers four classes of shares. Class A, Class C and Class I shares commenced operations on July 2, 2012. Investor Class shares commenced operations on July 12, 2014. The investment objective is to seek current income and capital appreciation.
Class A and Investor Class shares are offered at net asset value (“NAV”) per share plus an initial sales charge. No sales charge applies to investments of $1 million or more (and certain other qualified purchases) in Class A and Investor Class shares, but a contingent deferred sales charge (“CDSC”) is imposed on certain redemptions made within one year of the date of purchase. Class C shares are offered at NAV without an initial sales charge, although a 1.00% CDSC may be imposed on redemptions of such shares made within one year of the date of purchase of Class C shares. Class I shares are offered at NAV and are not subject to a sales charge. Depending upon eligibility, Class A shares may convert to Investor Class shares and Investor Class shares may convert to Class A shares. Each class of shares has the same voting (except for issues that relate solely to one class), dividend, liquidation and other rights, and the same terms and conditions, except that Class C shares are subject to higher distribution and/or service fee rates, than Class A and Investor Class shares under a distribution plan
pursuant to Rule 12b-1 under the 1940 Act. Class I shares are not subject to a distribution and/or service fee.
Note 2–Significant Accounting Policies
The MainStay Cushing Renaissance Advantage Fund is an investment company and accordingly follows the investment company accounting and reporting guidance of the Financial Accounting Standards Board (FASB) Accounting Standard Codification Topic 946 Financial Services—Investment Companies.
The Cushing Funds prepare their financial statements in accordance with generally accepted accounting principles (“GAAP”) in the United States of America and follow the significant accounting policies described below.
(A) Securities Valuation. Investments are valued as of the close of regular trading on the New York Stock Exchange (“Exchange”) (generally 4:00 p.m. Eastern time) on each day the Cushing Funds are open for business (“valuation date”).
The Board of Trustees (the “Board”) adopted procedures establishing methodologies for the valuation of each Cushing Fund’s securities and delegated the responsibility for valuation determinations under those procedures to the Valuation Committee of the Cushing Funds (the “Valuation Committee”). The Board authorized the Valuation Committee to appoint a Valuation Sub-Committee (the “Sub-Committee”) to deal in the first instance with establishing the prices of securities for which market quotations are not readily available or the prices of which are not otherwise readily determinable under these procedures. The Sub-Committee meets (in person, via electronic mail or via teleconference) on an as-needed basis. Subsequently, the Valuation Committee meets to ensure that actions taken by the Sub-Committee were appropriate. The procedures recognize that, subject to the oversight of the Board and unless otherwise noted, the responsibility for day-to-day valuation of portfolio assets (including securities for which market prices are not readily available) rests with New York Life Investment Management LLC (“New York Life Investments” or the “Manager”), aided to whatever extent necessary by the Subadvisor (as defined in Note 3(A)) to each Cushing Fund.
To assess the appropriateness of security valuations, the Manager or the Cushing Funds’ third party service provider, who is subject to oversight by the Manager, regularly compares prior day prices, prices on comparable securities, and the sale prices to the prior and current day prices and challenges prices with changes exceeding certain tolerance levels with third party pricing services or broker sources. For those securities valued through either a standardized fair valuation methodology or a fair valuation measurement, the Sub-Committee deals in the first instance with such valuation and the Valuation Committee reviews and affirms the reasonableness of the valuation based on such methodologies and measurements on a regular basis after considering all relevant information that is reasonably available. Any action taken by the Sub-Committee with respect to the valuation of a portfolio security is submitted by the Valuation Committee to the full Board for its review and ratification, if appropriate, at its next regularly scheduled meeting immediately after such action.
| 52 | MainStay Cushing Funds |
“Fair value” is defined as the price a Cushing Fund would receive upon selling an asset or liability in an orderly transaction to an independent buyer in the principal or most advantageous market for the asset or liability. Fair value measurements are determined within a framework that establishes a three-tier hierarchy which maximizes the use of observable market data and minimizes the use of unobservable inputs to establish a classification of fair value measurements for disclosure purposes. “Inputs” refers broadly to the assumptions that market participants would use in pricing the asset or liability, including assumptions about risk, such as the risk inherent in a particular valuation technique used to measure fair value using a pricing model and/or the risk inherent in the inputs for the valuation technique. Inputs may be observable or unobservable. Observable inputs reflect the assumptions market participants would use in pricing the asset or liability based on market data obtained from sources independent of the Cushing Funds. Unobservable inputs reflect each Cushing Fund’s own assumptions about the assumptions market participants would use in pricing the asset or liability based on the information available. The inputs or methodology used for valuing assets or liabilities may not be an indication of the risks associated with investing in those assets or liabilities. The three-tier hierarchy of inputs is summarized below.
| • | Level 1—quoted prices in active markets for an identical asset or liability |
| • | Level 2—other significant observable inputs (including quoted prices for a similar asset or liability in active markets, interest rates and yield curves, prepayment speeds, credit risk, etc.) |
| • | Level 3—significant unobservable inputs (including each Cushing Fund’s own assumptions about the assumptions that market participants would use in measuring fair value of an asset or liability) |
The aggregate value by input level, as of November 30, 2014, for each Cushing Fund’s assets or liabilities is included at the end of each Cushing Fund’s Portfolio of Investments.
The Cushing Funds may use third party vendor evaluations, whose prices may be derived from one or more of the following standard inputs among others:
• Benchmark Yields | • Reported Trades | |
• Broker Dealer Quotes | • Issuer Spreads | |
• Two-sided markets | • Benchmark securities | |
• Bids/Offers | • Reference Data (corporate actions or material event notices) | |
• Industry and economic events | • Monthly payment information |
An asset or liability for which market values cannot be measured using the methodologies described above is valued by methods deemed reasonable in good faith by the Valuation Committee, following the procedures established by the Board, to represent fair value. Under these procedures, the Cushing Funds generally use a market-based approach which may use related or comparable assets or liabilities, recent transactions, market multiples, book values, and other relevant information. The Cushing Funds may also use an income-based valuation approach in which the anticipated future cash flows of the asset or liability are discounted to calculate fair value. Discounts may also be applied due to the nature and/or duration of any restrictions on the
disposition of the asset or liability. Due to the inherent valuation uncertainty of such assets or liabilities, fair values may differ significantly from values that would have been used had an active market existed. For the year ended November 30, 2014, there have been no material changes to the fair value methodologies.
Equity and non-equity securities which may be valued in this manner include, but are not limited to: (i) a security for which trading has been halted or suspended; (ii) a debt security that has recently gone into default and for which there is not a current market quotation; (iii) a security of an issuer that has entered into a restructuring; (iv) a security that has been de-listed from a national exchange; (v) a security for which the market price is not readily available from a third party pricing source or, if so provided, does not, in the opinion of the Manager or Subadvisor reflect the security’s market value; (vi) a security subject to trading collars for which no or limited trading takes place; and (vii) a security whose principal market has been temporarily closed at a time when, under normal conditions, it would be open. Securities for which market quotations or observable inputs are not readily available are generally categorized as Level 3 in the hierarchy. As of November 30, 2014, the Cushing Funds did not hold any securities that were fair valued in such a manner.
Equity securities and Exchange-Traded Funds are valued at the last quoted sales prices as of the close of regular trading on the relevant exchange on each valuation date. Securities that are not traded on the valuation date are valued at the mean of the last quoted bid and ask prices. Prices are normally taken from the principal market in which each security trades. These securities are generally categorized as Level 1 in the hierarchy.
Temporary cash investments acquired in excess of 60 days to maturity at the time of purchase are valued using the latest bid prices or using valuations based on a matrix system (which considers such factors as security prices, yields, maturities, and ratings), both as furnished by independent pricing services. Other temporary cash investments which mature in 60 days or less at the time of purchase (“Short-Term Investments”) are valued using the amortized cost method of valuation, unless the use of such a method would be inappropriate. The amortized cost method involves valuing a security at its cost on the date of purchase and thereafter assuming a constant amortization to maturity of the difference between such cost and the value on maturity date. Amortized cost approximates the current fair value of a security. These securities are generally categorized as Level 2 in the hierarchy.
Generally, a security is considered illiquid if it cannot be sold or disposed of in the ordinary course of business at approximately the price at which it is valued within seven days. Its illiquidity might prevent the sale of such security at a time when the Manager or Subadvisor(s) might wish to sell, and these securities could have the effect of decreasing the overall level of a Fund’s liquidity. Further, the lack of an established secondary market may make it more difficult to value illiquid securities, requiring a Fund to rely on judgments that may be somewhat subjective in measuring value, which could vary from the amount that a Fund could realize upon disposition. Difficulty in selling illiquid securities may result in a loss or may be costly to a Fund. Under the supervision of the Board, the Manager or Subadvisor(s) measure the liquidity of a Fund’s investments; in doing so, the Manager or Subadvisor(s) may consider various factors, including (i) the frequency of trades and quotations, (ii) the
| 53 |
Notes to Financial Statements (continued)
number of dealers and prospective purchasers, (iii) dealer undertakings to make a market, and (iv) the nature of the security and the market in which it trades (e.g., the time needed to dispose of the security, the method of soliciting offers and the mechanics of transfer). Illiquid securities generally will be valued in good faith in such a manner as the Board deems appropriate to reflect their fair value.
(B) Income Taxes. The MainStay Cushing MLP Premier Fund and the MainStay Cushing Royalty Energy Income Fund, taxed as corporations, are obligated to pay federal and state income tax on their taxable income. Currently, the maximum marginal regular federal income tax rate for a corporation is 35%. The MainStay Cushing MLP Premier Fund and the MainStay Cushing Royalty Energy Income Fund may each be subject to a 20% federal alternative minimum tax on their respective federal alternative minimum taxable income to the extent that their respective alternative minimum tax exceeds their respective regular federal income tax.
The MainStay Cushing MLP Premier Fund invests its assets primarily in master limited partnerships (“MLPs”), which generally are treated as partnerships for federal income tax purposes. As a limited partner in MLPs, The MainStay Cushing MLP Premier Fund reports its allocable share of each MLP’s taxable income in computing its own taxable income.
The MainStay Cushing Royalty Energy Income Fund invests its assets primarily in energy trusts and MLPs. U.S. royalty trusts are generally not subject to U.S. federal corporate income taxation at the trust or entity level. Instead, each unitholder of the U.S. royalty trust is required to take into account its share of all items of the U.S. royalty trust’s income, gain, loss, deduction and expense. It is possible that the Fund’s share of taxable income from a U.S. royalty trust may exceed the cash actually distributed to it from the U.S. royalty trust in a given year. In such a case, the MainStay Cushing Royalty Energy Income Fund will have less after-tax cash available for distribution to shareholders. Canadian royalty trusts are taxed as regular Canadian corporations and are now subject to “double taxation” at both the corporate level and on the income distributed to investors. MLPs are generally treated as partnerships for federal income tax purposes. As a limited partner in MLPs, the MainStay Cushing Royalty Energy Income Fund reports its allocable share of each MLP’s taxable income in computing its own taxable income.
The MainStay Cushing MLP Premier Fund and the MainStay Cushing Royalty Energy Income Fund’s respective tax expense or benefit is included in the Statements of Operations based on the component of income or gains (losses) to which such expense or benefit relates. Deferred income taxes reflect the net tax effects of temporary differences between the carrying amounts of assets and liabilities for financial reporting purposes and the amounts used for income tax purposes. A valuation allowance is recognized if, based on the weight of available evidence, it is more likely than not that some portion or all of the deferred income tax asset will not be realized.
The MainStay Cushing Renaissance Advantage Fund’s policy is to comply with the requirements of the Internal Revenue Code of 1986, as amended (the “Internal Revenue Code”), applicable to regulated investment companies and to distribute all of the taxable income to shareholders of the Fund within the allowable time limits. Therefore, no federal, state, and local income tax provisions are required.
Management evaluates each Cushing Fund’s tax positions to determine if the tax positions taken meet the minimum recognition threshold in connection with accounting for uncertainties in income tax positions taken or expected to be taken for the purposes of measuring and recognizing tax liabilities in the financial statements. Recognition of tax benefits of an uncertain tax position is required only when the position is “more likely than not” to be sustained assuming examination by taxing authorities. Management has analyzed the Cushing Funds’ tax positions taken on federal, state and local income tax returns for all open tax years (for up to three tax years). Management has concluded that no provisions for federal, state and local income tax are required in the MainStay Cushing Renaissance Advantage Fund’s financial statements as it intends to qualify each year for special tax treatment afforded to a RIC. Management has concluded that a provisions for federal, state and local income tax are required to be included in the financial statements for the MainStay Cushing MLP Premier Fund and the MainStay Cushing Royalty Energy Income Fund which are taxed as corporations and obligated to pay federal and state income tax on their taxable income. The Cushing Funds’ federal, state and local income and federal excise tax returns for tax years for which the applicable statutes of limitations have not expired are subject to examination by the Internal Revenue Service and state and local departments of revenue.
(D) Dividends and Distributions to Shareholders. Dividends and distributions are recorded on the ex-dividend date. The MainStay Cushing MLP Premier Fund and the MainStay Cushing Royalty Energy Income Fund intend to declare and pay distributions, if any, at least quarterly. On a book basis, all realized capital gains net of applicable taxes, will be retained by the MainStay Cushing MLP Premier Fund and the MainStay Cushing Royalty Energy Income Fund. The MainStay Renaissance Advantage Fund intends to declare and pay distributions quarterly and distributions from net capital gains, if any, annually. Unless the shareholder elects otherwise, all dividends and distributions are reinvested in the same class of shares of the respective Cushing Fund, at NAV. Dividends and distributions to shareholders are determined in accordance with federal income tax regulations and may differ from GAAP.
(E) Security Transactions and Investment Income. The Cushing Funds record security transactions on the trade date. Realized gains and losses on security transactions are determined using the identified cost method. Dividend income is recognized on the ex-dividend date, net of any foreign tax withheld at the source, and interest income is accrued as earned using the effective interest rate method. Discounts and premiums on Short-Term Investments are accreted and amortized, respectively, on the straight-line method. The straight-line method approximates the effective interest method for short-term investments. Income from payment-in-kind securities is recorded daily based on the effective interest method of accrual. Distributions on a MLP are generally recorded based on the characterization reported on the Cushing Fund’s Form 1065, Schedule K-1, received from the MLP. The Cushing Funds record their pro rata share of the income and deductions, and capital gains and losses allocated from each MLP, as well as adjusting the cost basis of each MLP accordingly.
Distributions received from each of the Fund’s investments in energy-related U.S. royalty trusts and Canadian royalty trusts and exploration and production companies (collectively, “Energy Trusts”) and MLPs
| 54 | MainStay Cushing Funds |
generally are comprised of ordinary income, capital gains and return of capital from the Energy Trusts or MLPs. The Cushing Funds record investment income on the ex-date of the distributions. For financial statement purposes, the Funds use return of capital and income estimates to allocate the dividend income received. Such estimates are based on historical information available from each Energy Trust, MLP and other industry sources. These estimates may subsequently be revised based on information received from Energy Trusts or MLPs after their tax reporting periods are concluded, as the actual character of these distributions is not known until after the fiscal year end of the Funds.
Each Fund estimates the allocation of investment income and return of capital for the distributions received from MLPs within the Statements of Operations. For the period ended November 30, 2014, Premier, Renaissance Advantage, and Royalty Energy estimated approximately 100% of the distributions received from MLPs to be from return of capital.
Investment income and realized and unrealized gains and losses on investments of the Cushing Funds are allocated to separate classes of shares pro rata based upon their relative net assets on the date the income is earned or realized and unrealized gains and losses are incurred.
(F) Expenses. Expenses of the Trust are allocated to the individual Funds in proportion to the net assets of the respective Funds when the expenses are incurred, except where direct allocations of expenses can be made. Expenses (other than transfer agent expenses and fees incurred under the shareholder services plans and the distribution plans further discussed in Note 3(B)) are allocated to separate classes of shares pro rata based upon their relative net assets on the date the expenses are incurred. The expenses borne by the Cushing Funds, including those of related parties to the Cushing Funds, are shown in the Statement of Operations.
(G) Use of Estimates. In preparing financial statements in conformity with GAAP, management makes estimates and assumptions that affect the reported amounts and disclosures in the financial statements. Actual results could differ from those estimates.
(H) Repurchase Agreements. The Cushing Funds may enter into repurchase agreements to earn income. The Cushing Funds may enter into repurchase agreements only with financial institutions that are deemed by the Manager or Subadvisor to be creditworthy, pursuant to guidelines established by the Board. During the term of any repurchase agreement, the Manager or Subadvisor will continue to monitor the creditworthiness of the seller. Under the 1940 Act, repurchase agreements are considered to be collateralized loans by a Cushing Fund to the seller secured by the securities transferred to the respective Cushing Fund.
When the Cushing Funds invest in repurchase agreements, the Cushing Funds’ custodian takes possession of the collateral pledged for investments in the repurchase agreement. The underlying collateral is valued daily on a mark-to-market basis to determine if the value, including accrued interest, exceeds the repurchase price. In the event of the seller’s default on the obligation to repurchase, the Cushing Funds have the right to liquidate the collateral and apply the proceeds in satisfaction of the obligation. Under certain circumstances, such as in the event of default or bankruptcy by the counterparty to the agreement, realization
and/or retention of the collateral may be subject to legal proceedings and possible realized loss to the respective Cushing Fund.
(L) Concentration of Risk. The MainStay Cushing MLP Premier Fund’s investment objective is to seek current income and capital appreciation. The MainStay Cushing MLP Premier Fund seeks to achieve its investment objective by investing, under normal market conditions, at least 80% of its assets (net assets plus any borrowings for investment purposes) in a portfolio of MLP investments.
The MainStay Cushing Renaissance Advantage Fund’s investment objective is to seek total return. The MainStay Cushing Renaissance Advantage Fund will seek to achieve its investment objective by investing, under normal market conditions, at least 80% of its assets (net assets plus any borrowings for investment purposes) in a portfolio of (i) companies across the energy supply chain spectrum, including upstream, midstream and downstream energy companies, as well as oil and gas services companies, (ii) energy-intensive chemical, metal and industrial and manufacturing companies and engineering and construction companies that the Subadvisor expects to benefit from growing energy production and lower feedstock costs relative to global costs, and (iii) transportation and logistics companies providing solutions to the U.S. manufacturing industry.
The MainStay Cushing Royalty Energy Income Fund’s investment objective is to seek current income and capital appreciation. The MainStay Cushing Royalty Energy Income Fund will seek to achieve its investment objective by investing, under normal market conditions, at least 80% of its assets (net assets plus any borrowings for investment purposes) in a portfolio of (i) Energy Trusts, (ii) exploration and production MLPs and (iii) securities of other companies based in North America that are generally engaged in the energy sector.
(M) Indemnifications. Under the Trust’s organizational documents, its officers and trustees are indemnified against certain liabilities that may arise out of performance of their duties to the Trust. Additionally, in the normal course of business, the Cushing Funds enter into contracts with third-party service providers that contain a variety of representations and warranties and which may provide general indemnifications. The Cushing Funds’ maximum exposure under these arrangements is unknown, as this would involve future claims that may be made against the Cushing Funds that have not yet occurred. Based on experience, management is of the view that the risk of loss in connection with these potential indemnification obligations is remote. However, there can be no assurance that material liabilities related to such obligations will not arise in the future, which could adversely impact the Cushing Funds.
Note 3–Fees and Related Party Transactions
(A) Manager and Subadvisor. Effective after the close of business on July 11, 2014, New York Life Investments, a registered investment adviser and an indirect, wholly-owned subsidiary of New York Life Insurance Company (“New York Life”), began serving as the Cushing Funds’ Manager, pursuant to an Amended and Restated Management Agreement, (“Management Agreement”). The Manager provides offices, conducts clerical, recordkeeping and bookkeeping services, and keeps most of the financial and accounting records required to be maintained by the Cushing Funds. Except for the portion of salaries and expenses that are the responsibility of the Cushing Funds, the Manager pays the
| 55 |
Notes to Financial Statements (continued)
salaries and expenses of all personnel affiliated with the Cushing Funds and certain operational expenses of the Cushing Funds. The Cushing Funds reimburse New York Life Investments in an amount equal to a portion of the compensation of the Chief Compliance Officer of the Cushing Funds. Cushing® Asset Management, LP (“Cushing® Asset Management” or the “Subadvisor”), a registered investment adviser, serves as Subadvisor to the Cushing Funds and is responsible for the day-to-day portfolio management of the Cushing Funds. Pursuant to the terms of a Subadvisory Agreement (“Subadvisory Agreement”) between New York Life Investments and Cushing® Asset Management, New York Life Investments pays for the services of the Subadvisor.
Under the Management Agreement, the MainStay Cushing MLP Premier Fund pays the Manager a monthly fee for services performed and facilities furnished at an annual rate of 1.10% of the Fund’s average daily net assets.
Under the Management Agreement, the MainStay Cushing Renaissance Advantage Fund pays the Manager a monthly fee for services performed and facilities furnished at an annual rate of 1.25% of the Fund’s average daily net assets.
Under the Management Agreement, the MainStay Cushing Royalty Energy Income Fund pays the Manager a monthly fee for services performed and facilities furnished at an annual rate of 1.35% of the Fund’s average daily net assets.
Prior to the close of business on July 11, 2014, the annual fee rates paid monthly to Cushing® Asset Management were the same as the current annual fees.
In connection with the discussion below regarding expense limitation agreements, Total Annual Fund Operating Expenses excludes taxes, interest, litigation, extraordinary expenses, brokerage and other transaction expenses relating to the purchase or sale of portfolio investments and acquired (underlying) fund fees and expenses.
MainStay Cushing MLP Premier Fund
Effective after the close of business on July 11, 2014, New York Life Investments has contractually agreed to waive a portion of the MainStay Cushing MLP Premier Fund’s management fees and/or reimburse expenses so that Total Annual Fund Operating Expenses (excluding taxes, deferred income tax expenses, interest, litigation, extraordinary expenses, brokerage and other transaction expenses relating to the purchase or sale of portfolio investments, and acquired (underlying) fund fees and expenses) do not exceed the following percentages of average daily net assets: Class A, 1.60%; Class C, 2.35%; and Class I, 1.35%. Based on the waiver or reimbursement with respect to Class A shares, New York Life Investments will apply an equivalent waiver or reimbursement, in an equal number of basis points, to Investor Class shares. This agreement will remain in effect until July 11, 2016 unless extended by New York Life Investments and approved by the Board.
MainStay Cushing Renaissance Advantage Fund
Effective after the close of business on July 11, 2014, New York Life Investments has contractually agreed to waive a portion of the MainStay Cushing Renaissance Advantage Fund’s management fees and/or
reimburse expenses so that Total Annual Fund Operating Expenses for Class A shares do not exceed 1.75% of its average daily net assets. New York Life Investments will apply an equivalent waiver or reimbursement, in an equal number of basis points, to the other share classes. This agreement will remain in effect until April 1, 2016 unless extended by New York Life Investments and approved by the Board.
Effective after the close of business on July 11, 2014, New York Life Investments has contractually agreed to waive fees and/or reimburse expenses so that MainStay Cushing Renaissance Advantage Fund’s Total Annual Fund Operating Expenses (excluding taxes, interest, litigation, extraordinary expenses, brokerage and other transaction expenses relating to the purchase or sale of portfolio investments, and acquired (underlying) fund fees and expenses) of a class do not exceed the following percentages of average daily net assets: Class A, 1.90%; Class C, 2.65% and Class I, 1.65%. Based on the waiver or reimbursement with respect to Class A shares, New York Life Investments will apply an equivalent waiver or reimbursement, in an equal number of basis points, to Investor Class shares. This expense limitation agreement will remain in effect until July 11, 2016 unless extended by New York Life Investments and approved by the Board of Trustees of the Fund.
MainStay Cushing Royalty Energy Income Fund
Effective after the close of business on July 11, 2014, New York Life Investments has contractually agreed to waive a portion of its management fee so that the management fee does not exceed 1.25% of the Fund’s average daily net assets. This agreement will remain in effect until April 1, 2016 unless extended by New York Life Investments and approved by the Board.
Effective after the close of business on July 11, 2014, New York Life Investments has contractually agreed to waive a portion of the MainStay Cushing Royalty Energy Income Fund’s management fees and/or reimburse expenses so that Total Annual Fund Operating Expenses for Class A shares do not exceed 1.73% of its average daily net assets. New York Life Investments will apply an equivalent waiver or reimbursement, in an equal number of basis points, to the other share classes. This agreement will remain in effect until April 1, 2016 unless extended by New York Life Investments and approved by the Board.
Effective after the close of business on July 11, 2014, New York Life Investments has contractually agreed to waive fees and/or reimburse expenses so that MainStay Cushing Royalty Energy Income Fund’s Total Annual Fund Operating Expenses (excluding taxes, deferred income tax expenses, interest, litigation, extraordinary expenses, brokerage and other transaction expenses relating to the purchase or sale of portfolio investments, and acquired (underlying) fund fees and expenses) of a class do not exceed the following percentages of average daily net assets: Class A, 1.90%, Class C, 2.65% and Class I, 1.65%. Based on the waiver or reimbursement with respect to Class A shares, New York Life Investments will apply an equivalent waiver or reimbursement, in an equal number of basis points, to Investor Class shares. This expense limitation agreement will remain in effect until July 11, 2016 unless extended by New York Life Investments and approved by the Board of Trustees of the Fund.
| 56 | MainStay Cushing Funds |
For the period July 12, 2014 through November 30, 2014, New York Life Investments earned fees from the Cushing Funds and waived its fees and/or reimbursed expenses as follows:
| Fees Earned | Fees Reimbursed | |||||||
MainStay Cushing MLP Premier Fund | $ | 8,331,638 | $ | — | ||||
MainStay Cushing Renaissance Advantage Fund | 1,295,475 | — | ||||||
MainStay Cushing Royalty Energy Income Fund | 1,030,258 | 76,315 | ||||||
Prior to July 12, 2014, the Cushing Funds’ investment adviser, Cushing Asset Management, LP, had waived a portion of its management fee and reimbursed the Fund’s expenses, such that fund operating expenses did not exceed 1.40% for each of MainStay Cushing MLP Premier Fund’s Class A, C and I shares, 1.75% for each of MainStay Cushing Renaissance Advantage Fund’s Class A, C and I shares, and 1.75% for each of MainStay Cushing Royalty Energy Income Fund’s Class A, C and I shares. Amounts waived were subject to recoupment in future years on a rolling three year basis (within the three years after the fees had been waived) if such recoupment was achievable with the expense limits.
For the period December 1, 2013 through July 11, 2014, the Predecessor entity to the Cushing Funds earned fees from the Cushing Funds and waived its fees and/or reimbursed expenses as follows:
| Fees Earned | Fees Reimbursed/ (Recouped) | |||||||
MainStay Cushing MLP Premier Fund | $ | 10,308,442 | $ | (801,594 | ) | |||
MainStay Cushing Renaissance Advantage Fund | 401,588 | 10,139 | ||||||
MainStay Cushing Royalty Energy Income Fund | 657,347 | 114,480 | ||||||
U.S. Bancorp Fund Services, LLC (“U.S. Bancorp”), 615 East Michigan Street, 3rd Floor, Milwaukee, WI 53202, provides sub-administration and sub-accounting services to the Cushing Funds pursuant to an agreement with New York Life Investments. These services include calculating the daily NAVs of the Cushing Funds, maintaining the general ledger and sub-ledger accounts for the calculation of the Cushing Funds’ respective NAVs, and assisting New York Life Investments in conducting various aspects of the Cushing Funds’ administrative operations. For providing these services to the Cushing Funds, U.S. Bancorp is compensated by New York Life Investments.
(B) Distribution, Service and Shareholder Service Fees. The Trust, on behalf of the Cushing Funds, has entered into a distribution agreement with NYLIFE Distributors LLC (the ‘‘Distributor’’), an indirect, wholly-owned subsidiary of New York Life. The Cushing Funds have adopted distribution plans (the ‘‘Plans’’) in accordance with the provisions of Rule 12b-1 under the 1940 Act.
Pursuant to the Class A and Investor Class Plans, the Distributor receives a monthly distribution fee from the Class A and Investor Class shares, at an annual rate of 0.25% of the average daily net assets of the Class A
and Investor Class shares for distribution and/or service activities as designated by the Distributor. Pursuant to the Class C Plan, Class C shares pay the Distributor a monthly distribution fee at an annual rate of 0.75% of the average daily net assets of the Class C shares, along with a service fee at an annual rate of 0.25% of the average daily net assets of the Class C shares, for a total 12b-1 fee of 1.00%. Class I shares are not subject to a distribution and/or service fee.
Prior to the close of business on July 11, 2014, Quasar Distributors, LLC (“Quasar”) served as the distributor to the Predecessor Funds. As the distributor, Quasar, received a monthly distribution fee from Class A shares at an annual rate of 0.25% of the average daily net assets.
The Plans provide that the distribution and service fees are payable to the Distributor regardless of the amounts actually expended by the Distributor for distribution of the Cushing Funds’ shares and service activities.
(C) Sales Charges. The Cushing Funds were advised by the Distributor that the amount of sales charges retained on sales of Class A and Investor Class shares for the year ended November 30, 2014, were as follows:
MainStay Cushing MLP Premier Fund |
| |||
Investor Class | $ | 4,383 | ||
Class A | 244,318 | |||
MainStay Cushing Renaissance Advantage Fund |
| |||
Investor Class | $ | 5,969 | ||
Class A | 181,294 | |||
MainStay Cushing Royalty Energy Income Fund |
| |||
Investor Class | $ | 3,517 | ||
Class A | 95,698 | |||
The Cushing Funds were also advised that the Distributor retained CDSCs on redemptions of Class A, Investor Class and Class C shares, for the year ended November 30, 2014, were as follows:
MainStay Cushing MLP Premier Fund |
| |||
Class A | $ | 1,523 | ||
Class C | 94,006 | |||
MainStay Cushing Renaissance Advantage Fund |
| |||
Class A | $ | 5,319 | ||
Class C | 5,564 | |||
MainStay Cushing Royalty Energy Income Fund |
| |||
Class A | $ | 392 | ||
Class C | 10,072 | |||
(D) Transfer, Dividend Disbursing and Shareholder Servicing Agent. NYLIM Service Company LLC, an affiliate of New York Life Investments, is the Cushing Funds’ transfer, dividend disbursing and shareholder servicing agent pursuant to an agreement between NYLIM Service Company LLC and the Trust. NYLIM Service
| 57 |
Notes to Financial Statements (continued)
Company LLC has entered into an agreement with Boston Financial Data Services, Inc. (“BFDS”) pursuant to which BFDS performs certain transfer agent services on behalf of NYLIM Service Company LLC. Prior to the close of business on July 11, 2014, these services were provided by U.S. Bancorp. Transfer agent expenses incurred by the Cushing Funds for the year ended November 30, 2014, were as follows (inclusive of amounts paid to U.S. Bancorp):
MainStay Cushing MLP Premier Fund |
| |||
Investor Class | $ | 208 | ||
Class A | 345,538 | |||
Class C | 489,619 | |||
Class I | 270,718 | |||
MainStay Cushing Renaissance Advantage Fund |
| |||
Investor Class | $ | 507 | ||
Class A | 21,514 | |||
Class C | 23,587 | |||
Class I | 95,637 | |||
MainStay Cushing Royalty Energy Income Fund |
| |||
Investor Class | $ | 190 | ||
Class A | 75,345 | |||
Class C | 25,811 | |||
Class I | 17,540 | |||
(E) Small Account Fee. Shareholders with small accounts adversely impact the cost of providing transfer agency services. In an effort to reduce total transfer agency expenses, the Cushing Funds have implemented a small account fee on certain types of accounts. Certain shareholders with an account balance of less than $1,000 are charged an annual per account fee of $20 (assessed semi-annually), the proceeds from which offset transfer agent fees as reflected in the Statement of Operations.
(F) Capital. As of November 30, 2014, New York Life and its affiliates beneficially held shares of the Cushing Funds with values and percentages of net assets as follows:
MainStay Cushing MLP Premier Fund | $ | 23,719 | 0.0 | %‡ | ||||
MainStay Cushing Renaissance Advantage Fund | 21,974 | 0.0 | ‡ | |||||
MainStay Cushing Royalty Energy Income Fund | 17,753 | 0.0 | ‡ |
| ‡ | Less than one-tenth of a percent. |
Note 4–Federal Income Tax
MainStay Cushing MLP Premier Fund and MainStay Cushing Royalty Energy Income Fund
Deferred income taxes reflect the net tax effect of temporary differences between the carrying amount of assets and liabilities for financial reporting and tax purposes. Components of the MainStay Cushing Premier Fund and MainStay Cushing Royalty Energy Income Fund
deferred tax assets and liabilities as of November 30, 2014 are as follows:
MainStay Cushing MLP Premier Fund | ||||
Deferred tax assets: | ||||
Net operating loss carryforward | $ | 24,807,314 | ||
Capital loss carryforward utilized | (339,293 | ) | ||
| Total deferred tax assets | 24,468,021 | |||
Less deferred tax liabilities: | ||||
Net unrealized depreciation on investments in securities | 179,275,440 | |||
| Net deferred tax liability | $ | 154,807,419 | ||
MainStay Cushing Royalty Energy Income Fund | ||||
Deferred tax assets: | ||||
Net operating loss carryforward | $ | 507,757 | ||
Capital loss carryforward | 1,597,209 | |||
Net unrealized depreciation on investments in securities | 26,093,448 | |||
Foreign tax credit | 163,496 | |||
| Total deferred tax assets | 28,361,910 | |||
Less valuation allowance | 28,361,910 | |||
| Net deferred tax asset | $ | — | ||
The MainStay Cushing Premier Fund has recorded a deferred tax liability at November 30, 2014. The Funds periodically reviews the recoverability of its deferred tax assets, if any, based on the weight of available evidence. When assessing the recoverability of each Fund’s deferred tax assets, significant weight is given to the effects of potential future realized and unrealized gains on investments, and the period over which these deferred tax assets can be realized. Unexpected significant decreases in cash distributions from the Funds’ MLP investments or significant declines in the fair value of its investments may change the Funds’ assessment regarding the recoverability of their deferred tax assets and may result in a valuation allowance. Each Fund will continue to assess the need to record a valuation allowance in the future. If a valuation allowance is required to reduce any deferred tax asset in the future, it could have a material impact on the Fund’s net asset value and results of operations in the period it is recovered.
Each Fund may rely, to some extent, on information provided by the MLPs, which may not necessarily be timely, to estimate taxable income allocable to MLP units held in its portfolio, and to estimate its associated deferred tax benefit/(liability). Such estimates are made in good faith. From time to time, as new information becomes available, each Fund will modify its estimates or assumptions regarding its tax benefit/(liability).
The net operating loss carryforward and capital loss carryforward are available to offset future taxable income. For corporations, capital losses
can only be used to offset capital gains and cannot be used to offset ordinary income. The capital loss may be carried forward for five years and, accordingly, would begin to expire as of November 30, 2017. The net operating loss can be carried forward for 20 years and, accordingly, would begin to expire as of November 30, 2030. The MainStay Cushing
| 58 | MainStay Cushing Funds |
MLP Premier Fund and MainStay Cushing Royalty Energy Income Fund have the following net operating loss and capital loss amounts:
MainStay Cushing MLP Premier Fund | ||||||
Fiscal Year Ended Net Operating Loss | Amount | Expiration | ||||
November 30, 2010 | $ | 3,330 | November 30, 2030 | |||
| November 30, 2011 | 541,249 | November 30, 2031 | ||||
| November 30, 2012 | 9,226,669 | November 30, 2032 | ||||
| November 30, 2013 | 22,865,115 | November 30, 2033 | ||||
| November 30, 2014 | 30,225,243 | November 30, 2034 | ||||
|
| |||||
| Total | $ | 62,861,606 | ||||
|
| |||||
MainStay Cushing Royalty Energy Income Fund | ||||||
Fiscal Year Ended Net Operating Loss | Amount | Expiration | ||||
November 30, 2012 | $ | 522 | November 30, 2032 | |||
| November 30, 2013 | 11,924 | November 30, 2033 | ||||
| November 30, 2014 | 1,372,387 | November 30, 2034 | ||||
|
| |||||
| Total | $ | 1,384,833 | ||||
|
| |||||
Fiscal Year Ended Capital Loss | Amount | Expiration | ||||
November 30, 2012 | $ | 2,914 | November 30, 2017 | |||
| November 30, 2013 | 1,371,868 | November 30, 2018 | ||||
| November 30, 2014 | 2,958,969 | November 30, 2019 | ||||
|
| |||||
| Total | $ | 4,333,751 | ||||
|
| |||||
Total income tax benefit (current and deferred) differs from the amount computed by applying the federal statutory income tax rate of 35% to net investment income and realized and unrealized gains (losses) on investments before taxes for the year ended November 30, 2014, as follows:
| MainStay Cushing MLP Premier Fund | MainStay Cushing Royalty Energy Income Fund | |||||||
| Income tax provision (benefit) at the federal statutory rate of 35% | $ | 72,410,409 | $ | (27,110,574 | ) | |||
State income tax (benefit), net of federal benefit | 5,930,359 | (1,279,549 | ) | |||||
| Permanent differences, net | (2,364,117 | ) | — | |||||
| Foreign taxes withheld | — | 163,496 | ||||||
| Provision to return | (1,713,059 | ) | (35,452 | ) | ||||
Tax expense (benefit) due to change in effective state rates | (4,039,351 | ) | (1,651 | ) | ||||
Change in valuation allowance | — | 28,361,910 | ||||||
|
|
|
| |||||
| Total tax expense (benefit) | $ | 70,224,241 | $ | 98,180 | ||||
|
|
|
| |||||
MainStay Cushing Renaissance Advantage Fund
The difference between book basis and tax basis unrealized depreciation is primarily due to capital loss carryforwards.
The following table discloses the current year reclassifications between undistributed net investment income (loss), accumulated net realized gain (loss) on investments, and additional paid-in capital arising from permanent differences; net assets as of November 30, 2014 were not affected.
| Undistributed Net Investment Income (Loss) | Accumulated Net Realized Gain (Loss) on Investments | Additional Paid-In Capital | ||||||||||
MainStay Cushing Renaissance Advantage Fund | $ | (40,411 | ) | $ | 28,839 | $ | 11,572 | |||||
The reclassifications for the MainStay Cushing Renaissance Advantage Fund are primarily due to partnership adjustments.
Under the Regulated Investment Company Modernization Act of 2010, the Cushing Funds are permitted to carry forward capital losses incurred in taxable years beginning after December 22, 2010, for an unlimited period. However, any losses incurred during those future years will be required to be utilized prior to the losses incurred in pre-enactment tax years. As a result of this ordering rule, pre-enactment capital loss carryforwards may be more likely to expire unused. Additionally, post-enactment capital losses that are carried forward will retain their character as either short-term or long-term capital losses rather than being considered all short-term as under previous law.
As of November 30, 2014, for federal income tax purposes, capital loss carryforwards of $8,806,880 were available as shown in the table below, to the extent provided by the regulations to offset future realized gains of the Fund through the years indicated.
| Capital Loss Available Through | Short-Term Capital Loss Amounts (000’s) | Long-Term Capital Loss Amounts (000’s) | ||||||
| Unlimited | $ | 8,807 | $ | — | ||||
As of November 30, 2014, the components of accumulated gain (loss) on a tax basis were as follows:
| Ordinary Income | Accumulated Capital and Other Gain (Loss) | Other Temporary Differences | Unrealized Appreciation (Depreciation) | Total Gain (Loss) | ||||||||||||||||
MainStay Cushing Renaissance Advantage Fund | $ | — | $ | — | $ | (8,807,350 | ) | $ | (23,939,348 | ) | $ | (32,746,698 | ) | |||||||
| 59 |
Notes to Financial Statements (continued)
The tax character of distributions paid during the years ended November 30, 2014 and 2013 shown in the Statements of Changes in Net Assets was as follows:
| 2014 | 2013 | |||||||||||||||||||||||
| Tax Based Distributions from Ordinary Income | Tax Based Capital | Total | Tax Based Distributions from Return of Capital | Tax Based Distributions from Long-Term Capital Gains | Total | |||||||||||||||||||
MainStay Cushing MLP Premier Fund | $ | 44,493,742 | $ | 56,895,491 | $ | 101,389,233 | $ | 13,676,381 | $ | — | $ | 13,676,381 | ||||||||||||
MainStay Cushing Renaissance Advantage Fund | 200,336 | 3,069,510 | 3,269,846 | 20,556,674 | — | 20,556,674 | ||||||||||||||||||
MainStay Cushing Royalty Energy Income Fund | — | 12,175,970 | 12,175,970 | 60,393,363 | — | 60,393,363 | ||||||||||||||||||
Note 5–Custodian
U.S. Bank, N.A., 1555 N. River Center Drive, Suite 302, Milwaukee, WI 53212 is the custodian of cash and securities held by the Cushing Funds. Custodial fees are charged to the Cushing Funds based on the Cushing Fund’s net assets and/or the market value of securities held by the Cushing Funds and the number of certain cash transactions incurred by the Cushing Funds.
Note 6–Line of Credit
The Cushing Funds and certain affiliated funds, maintain a line of credit with a syndicate of banks in order to secure a source of funds for temporary purposes to meet unanticipated or excessive redemption requests.
Effective August 5, 2014, under a second amended and restated credit agreement (the “Credit Agreement”), the aggregate commitment amount is $600,000,000 with an optional maximum amount of $700,000,000. The commitment fee is an annual rate of 0.08% of the average commitment amount payable quarterly, regardless of usage, to Bank of New York Mellon, who serves as the agent to the syndicate. The commitment fee is allocated among the Cushing Funds and certain affiliated funds based upon their respective net assets and other factors. Interest on any revolving credit loan is charged based upon the Federal Funds Advances rate or the one month London InterBank Offered Rate, whichever is higher. The Credit Agreement expires on August 4, 2015, although the Fund, certain affiliated funds and the syndicate of banks may renew the Credit Agreement for an additional year on the same or different terms.
Note 7–Purchases and Sales of Securities (in 000’s)
For the year ended November 30, 2014, purchases and sales of securities, other than short-term securities, were as follows:
| Purchases | Sales | |||||||
MainStay Cushing MLP Premier Fund | $ | 972,151 | $ | 374,673 | ||||
MainStay Cushing Renaissance Advantage Fund | 522,769 | 151,303 | ||||||
MainStay Cushing Royalty Energy Income Fund | 304,673 | 33,539 | ||||||
Note 8–Capital Share Transactions
MainStay Cushing MLP Premier Fund
Investor Class (a) | Shares | Amount | ||||||
Period ended November 30, 2014: | ||||||||
Shares sold | 61,067 | $ | 1,429,110 | |||||
Shares issued to shareholders in reinvestment of dividends and distributions | 567 | 13,027 | ||||||
Shares redeemed | (2,473 | ) | (59,411 | ) | ||||
|
| |||||||
Net increase (decrease) | 59,161 | $ | 1,382,726 | |||||
|
| |||||||
Class A | Shares | Amount | ||||||
Year ended November 30, 2014: | ||||||||
Shares sold | 11,116,389 | $ | 252,609,875 | |||||
Shares issued to shareholders in reinvestment of dividends and distributions | 1,120,336 | 25,292,145 | ||||||
Shares redeemed | (10,919,530 | ) | (255,083,262 | ) | ||||
|
| |||||||
Net increase (decrease) in shares before conversion | 1,317,195 | 22,818,758 | ||||||
Shares converted into Class A (See Note 1) | 27,373 | 638,400 | ||||||
Shares converted from Class A (See Note 1) | (156,802 | ) | (3,679,320 | ) | ||||
|
| |||||||
Net increase (decrease) | 1,187,766 | $ | 19,777,838 | |||||
|
| |||||||
Year ended November 30, 2013: | ||||||||
Shares sold | 11,952,231 | $ | 246,225,433 | |||||
Shares issued to shareholders in reinvestment of dividends and distributions | 860,037 | 17,705,745 | ||||||
Shares redeemed | (5,704,382 | ) | (116,617,817 | ) | ||||
|
| |||||||
Net increase (decrease) | 7,107,886 | $ | 147,313,361 | |||||
|
| |||||||
| 60 | MainStay Cushing Funds |
Class C | Shares | Amount | ||||||
Year ended November 30, 2014: | ||||||||
Shares sold | 15,598,796 | $ | 344,590,258 | |||||
Shares issued to shareholders in reinvestment of dividends and distributions | 1,838,916 | 40,315,113 | ||||||
Shares redeemed | (4,534,280 | ) | (100,418,307 | ) | ||||
|
| |||||||
Net increase (decrease) in shares before conversion | 19,903,432 | 284,487,064 | ||||||
Shares converted from Class C (See Note 1) | (31,804 | ) | (724,353 | ) | ||||
|
| |||||||
Net increase (decrease) | 12,871,628 | $ | 283,762,711 | |||||
|
| |||||||
Year ended November 30, 2013: | ||||||||
Shares sold | 15,150,103 | $ | 305,638,465 | |||||
Shares issued to shareholders in reinvestment of dividends and distributions | 879,092 | 17,709,279 | ||||||
Shares redeemed | (1,861,074 | ) | (37,493,626 | ) | ||||
|
| |||||||
Net increase (decrease) | 14,168,121 | $ | 285,854,118 | |||||
|
| |||||||
Class I | Shares | Amount | ||||||
Year ended November 30, 2014: | ||||||||
Shares sold | 19,696,781 | $ | 460,113,133 | |||||
Shares issued to shareholders in reinvestment of dividends and distributions | 924,636 | 21,224,749 | ||||||
Shares redeemed | (5,178,439 | ) | (119,728,146 | ) | ||||
|
| |||||||
Net increase (decrease) in shares before conversion | 15,442,978 | 361,609,736 | ||||||
Shares converted into Class I (See Note 1) | 185,796 | 4,403,673 | ||||||
Shares converted from Class I (See Note 1) | (27,103 | ) | (638,400 | ) | ||||
|
| |||||||
Net increase (decrease) | 15,601,671 | $ | 365,375,009 | |||||
|
| |||||||
Year ended November 30, 2013: | ||||||||
Shares sold | 8,438,876 | $ | 175,516,451 | |||||
Shares issued to shareholders in reinvestment of dividends and distributions | 319,125 | 6,621,365 | ||||||
Shares redeemed | (3,192,290 | ) | (66,007,600 | ) | ||||
|
| |||||||
Net increase (decrease) | 5,565,711 | $ | 116,130,216 | |||||
|
| |||||||
(a) Investor shares were first offered on July 12, 2014. |
| |||||||
MainStay Cushing Renaissance Advantage Fund
Investor Class (a) | Shares | Amount | ||||||
Period ended November 30, 2014: | ||||||||
Shares sold | 79,488 | $ | 2,045,750 | |||||
Shares issued to shareholders in reinvestment of dividends and distributions | 302 | 7,352 | ||||||
Shares redeemed | (8,935 | ) | (240,309 | ) | ||||
|
| |||||||
Net increase (decrease) | 70,855 | $ | 1,812,793 | |||||
|
| |||||||
Class A | Shares | Amount | ||||||
Year ended November 30, 2014: | ||||||||
Shares sold | 2,293,008 | $ | 58,961,228 | |||||
Shares issued to shareholders in reinvestment of dividends and distributions | 15,749 | 390,094 | ||||||
Shares redeemed | (397,479 | ) | (9,856,395 | ) | ||||
|
| |||||||
Net increase (decrease) in shares before conversion | 1,911,278 | 49,494,927 | ||||||
Shares converted from Class A (See Note 1) | (4,434 | ) | (112,227 | ) | ||||
|
| |||||||
Net increase (decrease) | 1,906,844 | $ | 49,382,700 | |||||
|
| |||||||
Period ended November 30, 2013 (b): | ||||||||
Shares sold | 304,043 | $ | 6,480,526 | |||||
Shares issued to shareholders in reinvestment of dividends and distributions | 370 | 8,256 | ||||||
Shares redeemed | (1,259 | ) | (27,308 | ) | ||||
|
| |||||||
Net increase (decrease) | 303,154 | $ | 6,461,474 | |||||
|
| |||||||
Class C | Shares | Amount | ||||||
Year ended November 30, 2014: | ||||||||
Shares sold | 2,039,865 | $ | 52,208,128 | |||||
Shares issued to shareholders in reinvestment of dividends and distributions | 14,009 | 344,122 | ||||||
Shares redeemed | (111,955 | ) | (2,723,972 | ) | ||||
|
| |||||||
Net increase (decrease) | 1,941,919 | $ | 49,828,278 | |||||
|
| |||||||
Period ended November 30, 2013 (b): | ||||||||
Shares sold | 102,391 | $ | 2,193,696 | |||||
Shares issued to shareholders in reinvestment of dividends and distributions | 532 | 11,886 | ||||||
Shares redeemed | (2,611 | ) | (58,997 | ) | ||||
|
| |||||||
Net increase (decrease) | 100,312 | $ | 2,146,585 | |||||
|
| |||||||
Class I | Shares | Amount | ||||||
Year ended November 30, 2014: | ||||||||
Shares sold | 13,837,341 | $ | 351,802,181 | |||||
Shares issued to shareholders in reinvestment of dividends and distributions | 82,836 | 2,042,497 | ||||||
Shares redeemed | (1,135,479 | ) | (27,625,124 | ) | ||||
|
| |||||||
Net increase (decrease) in shares before conversion | 12,784,698 | 326,219,554 | ||||||
Shares converted into Class I (See Note 1) | 4,427 | 112,227 | ||||||
|
| |||||||
Net increase (decrease) | 12,789,125 | $ | 326,331,781 | |||||
|
| |||||||
Period ended November 30, 2013 (b): | ||||||||
Shares sold | 744,767 | $ | 16,204,915 | |||||
Shares issued to shareholders in reinvestment of dividends and distributions | 652 | 14,559 | ||||||
Shares redeemed | (4,866 | ) | (107,407 | ) | ||||
|
| |||||||
Net increase (decrease) | 740,553 | $ | 16,112,067 | |||||
|
| |||||||
(a) Investor shares were first offered on July 12, 2014. |
| |||||||
(b) Class A shares, Class C shares and Class I shares were first offered on April 2, 2013. |
| |||||||
| 61 |
Notes to Financial Statements (continued)
MainStay Cushing Royalty Energy Income Fund
Investor Class (a) | Shares | Amount | ||||||
Period ended November 30, 2014: | ||||||||
Shares sold | 71,172 | $ | 1,181,406 | |||||
Shares issued to shareholders in reinvestment of dividends and distributions | 933 | 14,871 | ||||||
Shares redeemed | (2,191 | ) | (38,745 | ) | ||||
|
| |||||||
Net increase (decrease) | 69,914 | $ | 1,157,532 | |||||
|
| |||||||
Class A | Shares | Amount | ||||||
Year ended November 30, 2014: | ||||||||
Shares sold | 8,836,339 | $ | 149,815,415 | |||||
Shares issued to shareholders in reinvestment of dividends and distributions | 411,696 | 7,080,446 | ||||||
Shares redeemed | (1,551,239 | ) | (26,198,303 | ) | ||||
|
| |||||||
Net increase (decrease) in shares before conversion | 7,696,796 | 130,697,558 | ||||||
Shares converted from Class A (See Note 1) | (893 | ) | (16,882 | ) | ||||
|
| |||||||
Net increase (decrease) | 7,695,903 | $ | 130,680,676 | |||||
|
| |||||||
Year ended November 30, 2013: | ||||||||
Shares sold | 2,858,554 | $ | 53,563,024 | |||||
Shares issued to shareholders in reinvestment of dividends and distributions | 74,461 | 1,382,405 | ||||||
Shares redeemed | (174,894 | ) | (3,238,482 | ) | ||||
|
| |||||||
Net increase (decrease) | 2,758,121 | $ | 51,706,947 | |||||
|
| |||||||
Class C | Shares | Amount | ||||||
Year ended November 30, 2014: | ||||||||
Shares sold | 3,560,370 | $ | 60,007,899 | |||||
Shares issued to shareholders in reinvestment of dividends and distributions | 86,793 | 1,437,135 | ||||||
Shares redeemed | (297,610 | ) | (4,940,033 | ) | ||||
|
| |||||||
Net increase (decrease) | 3,349,553 | $ | 56,505,001 | |||||
|
| |||||||
Year ended November 30, 2013: | ||||||||
Shares sold | 456,759 | $ | 8,531,695 | |||||
Shares issued to shareholders in reinvestment of dividends and distributions | 6,044 | 111,264 | ||||||
Shares redeemed | (18,867 | ) | (344,089 | ) | ||||
|
| |||||||
Net increase (decrease) | 443,936 | $ | 8,298,870 | |||||
|
| |||||||
Class I | Shares | Amount | ||||||
Year ended November 30, 2014: | ||||||||
Shares sold | 7,305,537 | $ | 123,149,600 | |||||
Shares issued to shareholders in reinvestment of dividends and distributions | 128,133 | 2,070,337 | ||||||
Shares redeemed | (264,573 | ) | (4,326,684 | ) | ||||
|
| |||||||
Net increase (decrease) in shares before conversion | 7,169,097 | 120,893,253 | ||||||
Shares converted into Class I (See Note 1) | 888 | 16,882 | ||||||
|
| |||||||
Net increase (decrease) | 7,169,985 | $ | 120,910,135 | |||||
|
| |||||||
Year ended November 30, 2013: | ||||||||
Shares sold | 113,127 | $ | 2,155,952 | |||||
Shares issued to shareholders in reinvestment of dividends and distributions | 3,703 | 69,405 | ||||||
Shares redeemed | (29,703 | ) | (564,299 | ) | ||||
|
| |||||||
Net increase (decrease) | 87,127 | $ | 1,661,058 | |||||
|
| |||||||
(a) Investor shares were first offered on July 12, 2014. |
| |||||||
Note 9–Change in Independent Registered Public Accounting Firm (Unaudited)
On April 3, 2014, KPMG LLP (“KPMG”) was selected as the Funds’ independent registered public accounting firm. The Funds’ selection of KPMG as its independent registered public accounting firm was recommended by the Funds’ audit committee and was approved by the Funds’ Board of Trustees.
Ernst & Young LLP (“E&Y”) was the independent registered public accounting firm for the Predecessor Funds. The reports of the financial statements audited by E&Y for the Predecessor Funds each year in the four-year period ended November 30, 2013 did not contain an adverse opinion or disclaimer of opinion, and were not qualified or modified as to uncertainty, audit scope or accounting principles. There were no disagreements between the Predecessor Funds and E&Y on any matters of accounting principles or practices, financial statement disclosure, or auditing scope or procedures, which disagreements, if not resolved to the satisfaction of E&Y would have caused it to make reference to the subject matter of the disagreements in connection with its reports on the financial statements of such years.
Note 10–Subsequent Events
In connection with the preparation of the financial statements of the Cushing Funds as of and for the year ended November 30, 2014, events and transactions subsequent to November 30, 2014, through the date the financial statements were issued have been evaluated by the Cushing Funds’ management for possible adjustment and/or disclosure. No subsequent events requiring financial statement adjustment or disclosure have been identified.
On January 23, 2015 the MainStay Cushing MLP Premier Fund declared a distribution payable of $0.335 per share, to Class A share shareholders, Investors Class shares shareholders, Class C shares shareholders and Class I share shareholders of record January 22, 2015, and payable on January 26, 2015.
| 62 | MainStay Cushing Funds |
On January 23, 2015 the MainStay Cushing Renaissance Advantage Fund declared a distribution payable of $0.20 per share, to Class A share shareholders, Investors Class shares shareholders, Class C shares shareholders and Class I share shareholders of record January 22, 2015, and payable on January 26, 2015.
On January 23, 2015 the MainStay Cushing Royalty Energy Income Fund declared a distribution of $0.20 per share, to Class A share shareholders, Investors Class shares shareholders, Class C shares shareholders and Class I share shareholders of record January 22, 2015, and payable on January 26, 2015.
| 63 |
Board Consideration and Approval of Management Agreement and
Subadvisory Agreement (Unaudited)
Section 15(c) of the Investment Company Act of 1940, as amended (the “1940 Act”) requires that each mutual fund’s board of trustees, including a majority of the independent trustees, annually review and approve the fund’s investment advisory agreements. At its April 1-3, 2014 meeting, the Board of Trustees of the MainStay Group of Funds (the “Board”) unanimously approved the Management Agreement with respect to the MainStay Cushing MLP Premier Fund, MainStay Cushing Renaissance Advantage Fund and MainStay Cushing Royalty Energy Income Fund (the “Funds”) and New York Life Investment Management LLC (“New York Life Investments”), and the Subadvisory Agreement between New York Life Investments and Cushing Asset Management, LP (“Cushing”) with respect to the Funds.
In reaching its decision to approve the Agreements, the Board considered information furnished by New York Life Investments and Cushing specifically in connection with a contract review process that took place in advance of its April 2014 meeting, which included responses from New York Life Investments and Cushing to a comprehensive list of questions encompassing a variety of topics prepared on behalf of the Board by independent legal counsel to the Board and its independent trustees (the “Independent Trustees”). The Board in particular considered materials provided in connection with its special March 10, 2014 meeting regarding the Funds. The Board also considered information provided by New York Life Investments and Cushing on the fees charged to other investment advisory clients (including institutional separate accounts) that follow investment strategies similar to those proposed for the Funds, and the rationale for any differences in the Funds’ proposed management and subadvisory fees and the fees charged to those other investment advisory clients. The Board also considered relevant information previously provided to the Board in connection with its review of the investment advisory agreements for other MainStay Funds.
In considering the Agreements, the members of the Board reviewed and evaluated all of the information and factors they believed to be relevant and appropriate in light of legal advice furnished to them by independent legal counsel and through the exercise of their own business judgment. The broad factors considered by the Board are discussed in greater detail below, and included, among other items: (i) the nature, scope, and quality of the services to be provided to the Funds by New York Life Investments and Cushing in relation to the advisory fee to be charged to the Funds; (ii) the qualifications of the proposed portfolio managers for the Funds and the historical investment performance of products previously managed by such portfolio managers with similar investment strategies to the Funds, including the predecessor Cushing Funds; (iii) the anticipated costs of the services to be provided, and profits expected to be realized, by New York Life Investments and its affiliates and Cushing from their relationships with the Funds; (iv) the extent to which economies of scale may be realized as the Funds grow, and the extent to which economies of scale may benefit the Funds’ investors; and (v) the reasonableness of the Funds’ proposed management and subadvisory fees and overall total ordinary operating expenses, particularly as compared to similar funds and accounts managed by New York Life Investments and Cushing.
While individual members of the Board may have weighed certain factors differently, the Board’s decision to approve the Agreements was based on a consideration of all the information provided to the Board, including information provided to the Board specifically in connection with the
contract review process. In addition to considering the above-referenced factors, the Board observed that in the marketplace there are a range of investment options available to shareholders of the Funds, and that the Funds’ shareholders, having had the opportunity to consider other investment options, will have chosen to invest in the Funds. A more detailed discussion of the factors that figured prominently in the Board’s decisions to approve the Agreements is provided below.
Nature, Scope and Quality of Services to Be Provided by New York Life Investments and Cushing
The Board examined the nature, scope and quality of the services that New York Life Investments proposed to provide to the Funds. The Board evaluated New York Life Investments’ experience in serving as manager of other mutual funds, noting that New York Life Investments manages other mutual funds, serves a variety of other investment advisory clients, including other pooled investment vehicles, and has experience with overseeing mutual fund service providers, including subadvisors. The Board considered the experience of senior personnel at New York Life Investments proposed to provide management and administrative services to the Funds, as well as New York Life Investments’ reputation and financial condition. The Board also considered the full range of non-advisory services that New York Life Investments will supply to the Funds under the terms of the Management Agreement, including: (i) fund accounting and oversight services provided by New York Life Investments’ Fund Administration and Accounting Group; (ii) investment oversight and analytical services provided by New York Life Investments’ Portfolio Analytics and Risk Oversight Group; (iii) compliance services provided by the Funds’ Chief Compliance Officer as well as New York Life Investments’ compliance department, including oversight and implementation of the Funds’ compliance program; and (iv) legal services provided by New York Life Investments’ Office of the General Counsel. Additional information about the non-advisory services provided by New York Life Investments will be set forth in the Funds’ Management Agreement. The Board also considered New York Life Investments’ willingness to invest in personnel and infrastructure that benefit the Funds, and noted that New York Life Investments is responsible for compensating the Funds’ officers. The Board also considered benefits to shareholders of being part of the MainStay Group of Funds, including the privilege of exchanging investments between the same class of shares without the imposition of a sales charge, as described more fully in the Funds’ prospectus.
The Board also examined the nature, scope and quality of the advisory services that Cushing proposed to provide to the Funds. The Board evaluated Cushing’s experience in managing other portfolios, including those with similar investment strategies to the Funds, such as the predecessor Cushing Funds. It examined Cushing’s track record and experience in providing investment advisory services, the experience of investment advisory, senior management and administrative personnel at Cushing, and Cushing’s overall legal and compliance environment. The Board also reviewed Cushing’s willingness to invest in personnel and infrastructure designed to benefit the Funds. In this regard, the Board considered the experience of the Funds’ proposed portfolio managers, including with respect to other products with similar investment strategies to the Funds, such as the predecessor Cushing Funds, the number of accounts managed by the portfolio managers and the method for compensating portfolio managers.
| 64 | MainStay Cushing Funds |
Based on these considerations, the Board concluded, within the context of its overall determinations regarding the Agreements, that the Funds likely would benefit from the nature, scope and quality of these services as a result of New York Life Investments’ and Cushing’s experience, personnel, operations and resources.
Investment Performance
In connection with the Board’s consideration of the Agreements, the Board noted that the Funds had no investment performance track record since the Funds had not yet been offered to investors. The Board discussed with management and the Funds’ proposed portfolio management team the Funds’ investment process, strategies and risks. Additionally, the Board considered the historical performance of other investment portfolios with similar investment strategies that are or have been managed by the proposed portfolio managers for the Funds, including the predecessor Cushing Funds. Based on these considerations, the Board concluded that the Funds were likely to be managed responsibly and capably by Cushing. The Funds disclose more information about investment performance in the Portfolio Management Discussion and Analysis, Investment and Performance Comparison and Financial Highlights sections of this Annual Report and in the Funds’ prospectus.
Costs of the Services Provided, and Profits Realized, by New York Life Investments and Cushing
The Board considered the anticipated costs of the services to be provided by New York Life Investments and Cushing under the Agreements, and the profits expected to be realized by New York Life Investments and its affiliates and Cushing due to their relationships with the Funds. Because Cushing’s subadvisory fees are negotiated at arm’s-length by New York Life Investments and are to be paid by New York Life Investments, not the Funds, the Board principally considered the profits to be realized by New York Life Investments and its affiliates with respect to the Funds.
In evaluating the anticipated costs and profits of New York Life Investments and its affiliates and Cushing due to their relationships with the Funds, the Board considered, among other factors, each party’s investments in personnel, systems, equipment and other resources necessary to manage the Funds, and that New York Life Investments will be responsible for paying the subadvisory fees for the Funds. The Board acknowledged that New York Life Investments and Cushing must be in a position to pay and retain experienced professional personnel to provide services to the Funds, and that the ability to maintain a strong financial position is important in order for New York Life Investments and Cushing to continue to provide high-quality services to the Funds. The Board also noted that the Funds will benefit from the allocation of certain fixed costs across the MainStay Group of Funds.
In addition, the Board noted the difficulty in obtaining reliable comparative data about mutual fund managers’ profitability, since such information generally is not publicly available and may be impacted by numerous factors, including the structure of a fund manager’s organization, the types of funds it manages, the methodology used to allocate certain fixed costs to specific funds, and the manager’s capital structure and costs of capital. The Board also discussed the results of an independent consultant’s review of New York Life Investments’ profitability methodology. The Board noted that the consultant had
reviewed: (i) the reasonableness of the methods and procedures used to compile New York Life Investments’ profitability analysis; and (ii) the appropriateness of the presentation approach used in the analysis. In conducting the review, the consultant employed a line of inquiry which analyzed: (i) the New York Life Investments units that provide services; (ii) how costs are allocated to the funds advised by New York Life Investments and other lines of businesses (including whether the procedures were reasonable); and (iii) using key metrics for different types of services, how the funds’ costs compare with (a) costs assigned to other units and (b) general industry practice. The Board noted that the independent consultant had concluded that New York Life Investments’ methods and procedures for estimating overall profitability of the funds in the MainStay Group of Funds, is reasonable, consistent with industry practice and likely to produce reasonable profitability estimates. While recognizing the difficulty in evaluating a manager’s profitability with respect to the Funds, and noting that other profitability methodologies may also be reasonable, the Board concluded that the profitability methodology presented by New York Life Investments to the Board was reasonable in all material respects.
In considering the anticipated costs and profitability of the Funds, the Board also considered certain fall-out benefits that may be realized by New York Life Investments, its affiliates, and Cushing, due to their relationships with the Funds. The Board also requested and received information from New York Life Investments and Cushing concerning other business relationships between Cushing and its affiliates and New York Life Investments and its affiliates.
The Board further considered that, in addition to fees earned by New York Life Investments for managing the Funds, New York Life Investments’ affiliates would also earn revenues from serving the Funds in various other capacities, including as the Funds’ transfer agent and distributor. The Board observed that information about these other revenues, and their impact on the profitability of the Funds to New York Life Investments and its affiliates, was furnished to the Board as part of the 15(c) process. The Board noted that, although it assessed the overall profitability of the Funds to New York Life Investments and its affiliates as part of the contract review process, when considering the reasonableness of the fees to be paid to New York Life Investments and its affiliates under the Agreements, the Board considered the profitability of New York Life Investments’ relationship with the Funds on a pre-tax basis, and without regard to distribution expenses.
After evaluating the information presented to the Board, the Board concluded, within the context of its overall determinations regarding the Agreements, that any profits expected to be realized by New York Life Investments and its affiliates due to their relationships with the Funds supported the Board’s decision to approve the Agreements. With respect to Cushing, the Board concluded that any profits to be realized by Cushing due to its relationship with the Funds will be the result of arm’s-length negotiations between New York Life Investments and Cushing, and will be based on fees paid to Cushing by New York Life Investments, not the Funds.
Extent to Which Economies of Scale May Be Realized as the Funds Grow
The Board considered whether the Funds’ proposed expense structures permit economies of scale to be shared with Fund investors. The Board
| 65 |
Board Consideration and Approval of Management Agreement and
Subadvisory Agreement (Unaudited) (continued)
also considered a report from New York Life Investments, prepared at the request of the Board, that addressed economies of scale in the mutual fund business generally, the changing economics of the mutual fund business and the various ways in which the benefits of economies of scale may be shared with the MainStay Group of Funds. The Board reviewed information from New York Life Investments showing how the Funds’ management fee schedules compared to fee schedules of other funds and accounts managed by New York Life Investments and how it hypothetically would compare with fees paid for similar services by peer funds at varying asset levels. While recognizing the difficulty of determining future economies of scale with precision, the Board acknowledged that economies of scale may be shared with the Funds in a number of ways, including, for example, through the imposition of management fee breakpoints and by initially setting relatively lower management fees.
Based on this information, the Board concluded, within the context of its overall determinations regarding the Agreements, that the Funds’ expense structures appropriately reflect economies of scale for the benefit of Fund investors. The Board noted, however, that it would continue to evaluate the reasonableness of the Funds’ expense structures as the Funds grow over time.
Management and Subadvisory Fees and Total Ordinary Operating Expenses
The Board evaluated the reasonableness of the fees to be paid under the Agreements in relation to the scope of services to be provided and the Funds’ expected total ordinary operating expenses. The Board primarily considered the reasonableness of the management fees to be paid by the Funds to New York Life Investments, since the fees to be paid to Cushing will be paid by New York Life Investments, not the Funds.
In assessing the reasonableness of the Funds’ fees and expenses, the Board primarily considered comparative data provided by New York Life Investments on the fees and expenses charged by similar mutual funds managed by other investment advisers. In addition, the Board considered information provided by New York Life Investments and Cushing on fees charged to other investment advisory clients, including institutional separate accounts and other funds with similar investment objectives as the Funds, including the predecessor Cushing Funds. In this regard, the Board took into account the explanation provided by New York Life Investments about the different scope of services provided to mutual funds as compared with other investment advisory clients. The Board also took into account the impact of any expense limitation arrangements on the Funds’ net management fee and expenses.
The Board noted that, outside of the Funds’ management fees and the fees charged under a share class’s Rule 12b-1 and/or shareholder services plans, a share class’s most significant “other expenses” are transfer agent fees. Transfer agent fees will be charged to the Funds based on the number of shareholder accounts (a “per-account” fee) as compared with certain other fees (e.g., management fees), which will be charged based on the Funds’ average net assets. The Board took into account information from New York Life Investments showing that the Funds’ transfer agent fee schedule is reasonable, including industry data showing that the per-account fees that NYLIM Service Company LLC, the Funds’ transfer agent, will charge the Funds are within the
range of per-account fees charged by transfer agents to other mutual funds. In addition, the Board considered NYLIM Service Company LLC’s profitability in connection with the transfer agent services it will provide to the Funds.
The Board considered that, because the Funds’ transfer agent fees will be billed on a per-account basis, the impact of transfer agent fees on a share class’s expense ratio may be more significant in cases where the share class has a high number of accounts with limited assets (i.e., small accounts). The Board observed that transfer agent fees are a significant portion of total expenses of many Funds in the MainStay Group of Funds. The impact of transfer agent fees on the expense ratios of these MainStay Funds tend to be greater than for other open-end retail funds, because the MainStay Group of Funds generally has a significant number of small accounts relative to competitor funds. The Board acknowledged the role that the MainStay Group of Funds historically has played in serving the investment needs of New York Life Insurance Company (“New York Life”) policyholders, who often maintain smaller account balances than other fund investors. The Board also acknowledged measures that it and New York Life Investments have taken in recent years to mitigate the effect of small accounts on the expense ratios of Fund share classes, including: (i) encouraging New York Life agents to consolidate multiple small accounts held by the same investor into one MainStay Asset Allocation Fund account; (ii) increasing investment minimums from $500 to $1,000 in 2003; (iii) introducing Investor Class shares for certain MainStay Funds in early 2008 to consolidate smaller account investors; (iv) closing small accounts with balances below $250 in Investor Class shares or $750 in all other classes of shares; (v) eliminating an exception with no minimum investment amount with respect to AutoInvest accounts with subsequent monthly purchases of $100; (vi) since 2007, charging an annual $20.00 small account fee on certain accounts with balances below $1,000; and (vii) modifying the approach for billing transfer agent expenses to reduce the degree of subsidization by large accounts of smaller accounts. In addition, the Board acknowledged New York Life Investments’ efforts to encourage intermediaries to consolidate small accounts in multiple Funds held by the same investor into a single Asset Allocation Fund account, if appropriate under the circumstances, in an effort to mitigate the effect of small accounts on the Funds in the MainStay Group of Funds.
After considering all of the factors outlined above, the Board concluded that the Funds’ management and subadvisory fees and anticipated total ordinary operating expenses were within a range that is competitive and, within the context of the Board’s overall conclusions regarding the Agreements, support a conclusion that these fees and expenses are reasonable.
Conclusion
On the basis of the information provided to it and its evaluation thereof, the Board, including the Independent Trustees, unanimously voted to approve the Agreements.
| 66 | MainStay Cushing Funds |
Federal Income Tax Information
(Unaudited)
The MainStay Cushing Renaissance Advantage Fund is required under the Internal Revenue Code to advise shareholders in a written statement as to the federal tax status of dividends paid by the Fund during such fiscal years.
For the fiscal year ended November 30, 2014, the MainStay Cushing Renaissance Fund designates approximately $200,336 under the Internal Revenue Code as qualified dividend income eligible for reduced tax rates.
The ordinary income dividends paid by the MainStay Cushing Renaissance Fund during the fiscal year ended November 30, 2014, should be multiplied by 100% to arrive at the amount eligible for the corporate dividends received deduction.
In February 2015, shareholders will receive an IRS Form 1099-DIV or substitute Form 1099 which will show the federal tax status of the distributions received by shareholders in calendar year 2014. The amounts that are reported on such Form 1099-DIV or substitute Form 1099 are the amounts you are to use on your federal income tax return and potentially differ from the amounts which we are reporting for the Funds’ fiscal year ended November 30, 2014.
Proxy Voting Policies and Procedures and Proxy Voting Record (Unaudited)
A description of the policies and procedures that New York Life Investments uses to vote proxies related to the Funds’ securities is available without charge, upon request, (i) by visiting the Funds’ website at mainstayinvestments.com; and (ii) on the Securities and Exchange Commission’s (“SEC”) website at www.sec.gov.
The Funds are required to file with the SEC its proxy voting record for the 12-month period ending June 30 on Form N-PX. The Funds’ most recent Form N-PX is available free of charge upon request by calling 800-MAINSTAY (624-6782); visiting the Fund’s website at mainstayinvestments.com; or on the SEC’s website at www.sec.gov.
Shareholder Reports and Quarterly Portfolio Disclosure (Unaudited)
Each Cushing Fund is required to file its complete schedule of portfolio holdings with the SEC for its first and third fiscal quarters on Form N-Q. Each Cushing Fund’s Form N-Q is available without charge, on the SEC’s website at www.sec.gov or by calling MainStay Investments at 800-MAINSTAY (624-6782). You also can obtain and review copies of Form N-Q by visiting the SEC’s Public Reference Room in Washington, DC (information on the operation of the Public Reference Room may be obtained by calling 1-800-SEC-0330).
| 67 |
Report of Independent Registered Public Accounting Firm
The Board of Trustees and Shareholders of
MainStay Funds Trust:
We have audited the accompanying statements of assets and liabilities, including the portfolios of investments, of the MainStay Cushing MLP Premier Fund, MainStay Cushing Renaissance Advantage Fund, and MainStay Cushing Royalty Energy Income Fund (each a “Fund” and collectively, the “Funds”), three of the funds constituting MainStay Funds Trust, as of November 30, 2014, and the related statements of operations, statements of changes in net assets, and the financial highlights for the year or period then ended. These financial statements and financial highlights are the responsibility of the Funds’ management. Our responsibility is to express an opinion on these financial statements and financial highlights based on our audits. The statements of changes in net assets and the financial highlights for each of the years or periods presented through November 30, 2013, were audited by other auditors, whose report thereon dated January 29, 2014, expressed an unqualified opinion on those financial statements and financial highlights.
We conducted our audits in accordance with the standards of the Public Company Accounting Oversight Board (United States). Those standards require that we plan and perform the audit to obtain reasonable assurance about whether the financial statements and financial highlights are free of material misstatement. An audit includes examining, on a test basis, evidence supporting the amounts and disclosures in the financial statements. Our procedures included confirmation of securities owned as of November 30, 2014, by correspondence with the custodian and brokers or by other appropriate auditing procedures where replies from brokers were not received. An audit also includes assessing the accounting principles used and significant estimates made by management, as well as evaluating the overall financial statement presentation. We believe that our audits provide a reasonable basis for our opinion.
In our opinion, the financial statements and financial highlights referred to above present fairly, in all material respects, the financial position of the MainStay Cushing MLP Premier Fund, MainStay Cushing Renaissance Advantage Fund, and MainStay Cushing Royalty Energy Income Fund of MainStay Funds Trust as of November 30, 2014, the results of their operations, the changes in their net assets, and the financial highlights for the year or period then ended in conformity with U.S. generally accepted accounting principles.

Philadelphia, Pennsylvania
January 28, 2015
| 68 | MainStay Cushing Funds |
Board of Trustees and Officers (Unaudited)
The Board of Trustees oversee the MainStay Group of Funds, (which is comprised of Funds that are series of the MainStay Funds, MainStay Funds Trust, MainStay VP Funds Trust, Private Advisors Alternative Strategies Master Fund, Private Advisors Alternative Strategies Fund, and MainStay DefinedTerm Municipal Opportunities Fund) (collectively the “Fund Complex”), the Manager and, when applicable, the Subadvisor(s), and other service providers to the Fund Complex. Each Trustee serves until his or her successor is elected and qualified or until his or her resignation, death or removal. Under the Retirement Policy, a
Trustee must tender his or her resignation by the end of the calendar year during which he or she reaches the age of 75. Officers serve a term of one year and are elected annually by the Board of Trustees. Information pertaining to the Trustees and officers is set forth below. The business address of each Trustee and officer listed below is 51 Madison Avenue, New York, New York 10010. A majority of the Trustees are not “interested persons” (as defined by the 1940 Act) of the Funds (“Independent Trustees”).
Name and Date of Birth | Term of Office, Position(s) Held and Length of Service | Principal Occupation(s) During Past Five Years | Number of Portfolios in Fund Complex Overseen by Board Member | Other Directorships Held By Board Member | ||||||||
Interested Board Member* | John Y. Kim* 9/24/60 | Indefinite; MainStay Funds Trust: Trustee since 2008.** | Vice Chairman (since January 2014) and Chief Investment Officer (since 2011), New York Life Insurance Company; President, Investments Group—New York Life Insurance Company (since 2012); Chairman of the Board of Managers and Chief Executive Officer, New York Life Investment Management Holdings LLC (since 2008); Chairman of the Board of Managers (since 2008) and Chief Executive Officer (2008 to 2013), New York Life Investment Management LLC; Member of the Board, MCF Capital Management LLC (since 2012), Private Advisors LLC (since 2010); MacKay Shields LLC and Madison Capital Funding LLC (since 2008); and Member of the Board of Managers, McMorgan and Company LLC and GoldPoint Partners (fka NYLCAP Manager LLC) (2008-2012) | 82 | The MainStay Funds: Trustee since 2008 (12 Funds); MainStay VP Funds Trust: Trustee since 2008 (29 portfolios)***; Private Advisors Alternative Strategies Master Fund: Trustee since 2011; Private Advisors Alternative Strategies Fund: Trustee since 2011; and MainStay DefinedTerm Municipal Opportunities Fund: Trustee since 2011. |
| * | This Trustee is considered to be an “interested person” of the MainStay Group of Funds within the meaning of the 1940 Act because of his affiliation with New York Life Insurance Company, New York Life Investment Management LLC, Cornerstone Capital Management Holdings LLC, Cornerstone Capital Management LLC, MacKay Shields LLC, Institutional Capital LLC, NYL Investors LLC, NYLIFE Securities LLC and/or NYLIFE Distributors LLC, as described in detail above in the column entitled “Principal Occupation(s) During Past Five Years.” |
| ** | Includes prior service as a Director/Trustee of certain predecessor entities to MainStay Funds Trust. |
| *** | Includes prior service as a Director of MainStay VP Series Fund, Inc., the predecessor to MainStay VP Funds Trust. |
| 69 |
Name and Date of Birth | Term of Office, Position(s) Held and | Principal Occupation(s) During Past Five Years | Number of | Other Directorships Held By Board Member | ||||||||
Non-Interested Board Members | Susan B. Kerley 8/12/51 | Indefinite; MainStay Funds Trust: Trustee since 1990.** | President, Strategic Management Advisors LLC (since 1990) | 82 | The MainStay Funds: Trustee since 2007 (12 Funds); MainStay VP Funds Trust: Trustee since 2007 (29 portfolios)***; Private Advisors Alternative Strategies Master Fund: Trustee since 2011; Private Advisors Alternative Strategies Fund: Trustee since 2011; MainStay DefinedTerm Municipal Opportunities Fund: Trustee since 2011; and Legg Mason Partners Funds: Trustee since 1991 (53 portfolios). | |||||||
Alan R. Latshaw 3/27/51 | Indefinite; MainStay Funds Trust: Trustee and Audit Committee Financial Expert since 2007.** | Retired; Partner, Ernst & Young LLP (2002 to 2003); Partner, Arthur Andersen LLP (1989 to 2002); Consultant to the MainStay Funds Audit and Compliance Committee (2004 to 2006) | 82 | The MainStay Funds: Trustee and Audit Committee Financial Expert since 2006 (12 Funds); MainStay VP Funds Trust: Trustee and Audit Committee Financial Expert since 2007 (29 portfolios)***; Private Advisors Alternative Strategies Master Fund: Trustee and Audit Committee Financial Expert since 2011; Private Advisors Alternative Strategies Fund: Trustee and Audit Committee Financial Expert since 2011; MainStay DefinedTerm Municipal Opportunities Fund: Trustee and Audit Committee Financial Expert since 2011; State Farm Associates Funds Trusts: Trustee since 2005 (4 portfolios); State Farm Mutual Fund Trust: Trustee since 2005 (15 portfolios); and State Farm Variable Product Trust: Trustee since 2005 (9 portfolios). | ||||||||
Peter Meenan 12/5/41 | Indefinite; MainStay Funds Trust: Chairman since 2013 and Trustee since 2002.** | Retired; Independent Consultant (2004 to 2013); President and Chief Executive Officer, Babson—United, Inc. (financial services firm) (2000 to 2004); Independent Consultant (1999 to 2000); Head of Global Funds, Citicorp (1995 to 1999) | 82 | The MainStay Funds: Chairman since 2013 and Trustee since 2007 (12 Funds); MainStay VP Funds Trust: Chairman since 2013 and Trustee since 2007 (29 portfolios)***; Private Advisors Alternative Strategies Master Fund: Chairman since 2013 and Trustee since 2011; Private Advisors Alternative Strategies Fund: Chairman since 2013 and Trustee since 2011; and MainStay DefinedTerm Municipal Opportunities Fund: Chairman since 2013 and Trustee since 2011. | ||||||||
Richard H. Nolan, Jr. 11/16/46 | Indefinite; MainStay Funds Trust: Trustee since 2007.** | Managing Director, ICC Capital Management (since 2004); President—Shields/ Alliance, Alliance Capital Management (1994 to 2004) | 82 | The MainStay Funds: Trustee since 2007 (12 Funds); MainStay VP Funds Trust: Trustee since 2006 (29 portfolios)***; Private Advisors Alternative Strategies Master Fund: Trustee since 2011; Private Advisors Alternative Strategies Fund: Trustee since 2011; and MainStay DefinedTerm Municipal Opportunities Fund: Trustee since 2011. |
| 70 | MainStay Cushing Funds |
Name and Date of Birth | Term of Office, Position(s) Held and | Principal Occupation(s) During Past Five Years | Number of Portfolios in Fund Complex Overseen by Board Member | Other Directorships Held By Board Member | ||||||||
Non-Interested Board Members | Richard S. Trutanic 2/13/52 | Indefinite; MainStay Funds Trust: Trustee since 2007.** | Chairman and Chief Executive Officer, Somerset & Company (financial advisory firm) (since 2004); Managing Director, The Carlyle Group (private investment firm) (2002 to 2004); Senior Managing Director, Partner and Board Member, Groupe Arnault S.A. (private investment firm) (1999 to 2002) | 82 | The MainStay Funds: Trustee since 1994 (12 Funds); MainStay VP Funds Trust: Trustee since 2007 (29 portfolios)***; Private Advisors Alternative Strategies Master Fund: Trustee since 2011; Private Advisors Alternative Strategies Fund: Trustee since 2011; and MainStay DefinedTerm Municipal Opportunities Fund: Trustee since 2011. | |||||||
Roman L. Weil 5/22/40 | Indefinite; MainStay Funds Trust: Trustee and Audit Committee Financial Expert since 2007.** | President, Roman L. Weil Associates, Inc. (consulting firm) (since 1981); V. Duane Rath Professor Emeritus of Accounting, Chicago Booth School of Business, University of Chicago (since 2008); Visiting Professor, Johns Hopkins University (2013); Visiting Professor, University of California—San Diego (since 2012); Visiting Professor, Southern Methodist University (2011); Visiting Professor, NYU Stern School of Business, New York University (2011) | 82 | The MainStay Funds: Trustee and Audit Committee Financial Expert since 2007 (12 Funds); MainStay VP Funds Trust: Trustee and Audit Committee Financial Expert since 1994 (29 portfolios)***; Private Advisors Alternative Strategies Master Fund: Trustee and Audit Committee Financial Expert since 2011; Private Advisors Alternative Strategies Fund: Trustee and Audit Committee Financial Expert since 2011; and MainStay DefinedTerm Municipal Opportunities Fund: Trustee and Audit Committee Financial Expert since 2011. | ||||||||
John A. Weisser 10/22/41 | Indefinite; MainStay Funds Trust: Trustee since 2007.** | Retired; Managing Director of Salomon Brothers, Inc. (1971 to 1995) | 82 | The MainStay Funds: Trustee since 2007 (12 Funds); MainStay VP Funds Trust: Trustee since 1997 (29 portfolios)***; Private Advisors Alternative Strategies Master Fund: Trustee since 2011; Private Advisors Alternative Strategies Fund: Trustee since 2011; MainStay DefinedTerm Municipal Opportunities Fund: Trustee since 2011; Direxion Insurance Trust: Trustee since 2007 (1 portfolio); Direxion Funds: Trustee since 2007 (18 portfolios); and Direxion Shares ETF Trust: Trustee since 2008 (52 portfolios). |
| ** | Includes prior service as a Director/Trustee of certain predecessor entities to MainStay Funds Trust. |
| *** | Includes prior service as a Director of MainStay VP Series Fund, Inc., the predecessor to MainStay VP Funds Trust. |
| 71 |
Name and Date of Birth | Position(s) Held and Length of Service | Principal Occupation(s) During Past Five Years | ||||||
Officers (Who Are Not Trustees)* | Stephen P. Fisher 2/22/59 | President, MainStay Funds Trust (since 2009) | Chairman and Chief Executive Officer (since January 2014), President and Chief Operating Officer (2008 to 2013), NYLIFE Distributors LLC; Senior Managing Director (since 2012) and Chairman of the Board (since 2008), NYLIM Service Company LLC; Senior Managing Director (since 2005) and Co-President (since January 2014), New York Life Investment Management LLC; President, Private Advisors Alternative Strategies Master Fund, Private Advisors Alternative Strategies Fund and MainStay DefinedTerm Municipal Opportunities Fund (since 2011) and The MainStay Funds and MainStay VP Funds Trust (since 2007)** | |||||
Jack R. Benintende 5/12/64 | Treasurer and Principal Financial and Accounting Officer, MainStay Funds Trust (since 2009) | Managing Director, New York Life Investment Management LLC (since 2007); Treasurer and Principal Financial and Accounting Officer, Private Advisors Alternative Strategies Master Fund, Private Advisors Alternative Strategies Fund and MainStay DefinedTerm Municipal Opportunities Fund (since 2011) and The MainStay Funds and MainStay VP Funds Trust (since 2007)**; and Assistant Treasurer, New York Life Investment Management Holdings LLC (2008 to 2012)); | ||||||
Kevin M. Bopp 2/24/69 | Vice President and Chief Compliance Officer, MainStay Funds Trust (since October 2014) | Vice President and Chief Compliance Officer, The MainStay Funds, MainStay VP Funds Trust, Private Advisors Alternative Strategies Fund, Private Advisors Alternative Strategies Master Fund and MainStay DefinedTerm Municipal Opportunities Fund (October 2014 to present); Director and Associate General Counsel (2011 to December 2014) and Vice President and Assistant General Counsel (2010 to 2011), New York Life Investment Management LLC; Assistant Secretary, The MainStay Funds, MainStay Funds Trust and MainStay VP Funds Trust (2010 to 2014)**, Private Advisors Alternative Strategies Fund, Private Advisors Alternative Strategies Master Fund and MainStay DefinedTerm Municipal Opportunities Fund (2011 to 2014); Associate, Dechert LLP (2006 to 2010) | ||||||
J. Kevin Gao 10/13/67 | Secretary and Chief Legal Officer, MainStay Funds Trust (since 2010) | Managing Director and Associate General Counsel, New York Life Investment Management LLC (since 2010); Secretary and Chief Legal Officer, Private Advisors Alternative Strategies Master Fund, Private Advisors Alternative Strategies Fund and MainStay DefinedTerm Municipal Opportunities Fund (since 2011) and The MainStay Funds and MainStay VP Funds Trust (since 2010)**; Director and Counsel, Credit Suisse; Chief Legal Officer and Secretary, Credit Suisse Asset Management LLC and Credit Suisse Funds (2003 to 2010) | ||||||
Scott T. Harrington 2/8/59 | Vice President—Administration, MainStay Funds Trust (since 2009) | Director, New York Life Investment Management LLC (including predecessor advisory organizations) (since 2000); Member of the Board of Directors, New York Life Trust Company (since 2009); Vice President—Administration, Private Advisors Alternative Strategies Master Fund, Private Advisors Alternative Strategies Fund and MainStay DefinedTerm Municipal Opportunities Fund (since 2011) and The MainStay Funds and MainStay VP Funds Trust (since 2005)** |
| * | The Officers listed above are considered to be “interested persons” of the MainStay Group of Funds within the meaning of the 1940 Act because of their affiliation with the MainStay Group of Funds, New York Life Insurance Company, New York Life Investment Management LLC, New York Life Insurance Company, New York Life Investment Management LLC, NYLIFE Securities LLC and/or NYLIFE Distributors LLC, as described in detail in the column captioned “Principal Occupation(s) During Past Five Years.” Officers are elected annually by the Board of Trustees to serve a one year term. |
| ** | Includes prior service as an Officer of MainStay VP Series Fund, Inc., the predecessor to MainStay VP Funds Trust. |
| 72 | MainStay Cushing Funds |
This page intentionally left blank
This page intentionally left blank
MainStay Funds
MainStay offers a wide range of Funds for virtually any investment need. The full array of MainStay open-end offerings is listed here, with information about the manager, subadvisors, legal counsel and independent registered public accounting firms.
Equity
U.S. Equity Funds
MainStay Common Stock Fund
MainStay Cornerstone Growth Fund
MainStay Epoch U.S. All Cap Fund
MainStay Epoch U.S. Equity Yield Fund
MainStay ICAP Equity Fund
MainStay ICAP Select Equity Fund
MainStay Large Cap Growth Fund
MainStay MAP Fund
MainStay S&P 500 Index Fund
MainStay U.S. Equity Opportunities Fund
MainStay U.S. Small Cap Fund
International/Global Equity Funds
MainStay Emerging Markets Opportunities Fund
MainStay Epoch Global Choice Fund
MainStay Epoch Global Equity Yield Fund
MainStay Epoch International Small Cap Fund
MainStay ICAP Global Fund
MainStay ICAP International Fund
MainStay International Equity Fund
MainStay International Opportunities Fund
Income
Taxable Bond Funds
MainStay Floating Rate Fund
MainStay Global High Income Fund
MainStay Government Fund
MainStay High Yield Corporate Bond Fund
MainStay High Yield Opportunities Fund
MainStay Indexed Bond Fund
MainStay Short Duration High Yield Fund
MainStay Short Term Bond Fund
MainStay Total Return Bond Fund
MainStay Unconstrained Bond Fund
Municipal Bond Funds
MainStay California Tax Free Opportunities Fund1
MainStay High Yield Municipal Bond Fund
MainStay New York Tax Free Opportunities Fund2
MainStay Tax Free Bond Fund
Money Market Fund
MainStay Money Market Fund
Mixed Asset
MainStay Balanced Fund
MainStay Convertible Fund
MainStay Income Builder Fund
Asset Allocation/Target Date
MainStay Conservative Allocation Fund
MainStay Growth Allocation Fund
MainStay Moderate Allocation Fund
MainStay Moderate Growth Allocation Fund
MainStay Retirement 2010 Fund
MainStay Retirement 2020 Fund
MainStay Retirement 2030 Fund
MainStay Retirement 2040 Fund
MainStay Retirement 2050 Fund
Alternative
MainStay Cushing MLP Premier Fund
MainStay Cushing Renaissance Advantage Fund
MainStay Cushing Royalty Energy Income Fund
MainStay Marketfield Fund
Manager
New York Life Investment Management LLC
New York, New York
Subadvisors
Cornerstone Capital Management Holdings LLC3
New York, New York
Cornerstone Capital Management LLC3
Bloomington, Minnesota
Cushing Asset Management, LP
Dallas, Texas
Epoch Investment Partners, Inc.
New York, New York
Institutional Capital LLC3
Chicago, Illinois
MacKay Shields LLC3
New York, New York
Marketfield Asset Management LLC
New York, New York
Markston International LLC
White Plains, New York
NYL Investors LLC3
New York, New York
Winslow Capital Management LLC
Minneapolis, Minnesota
Legal Counsel
Dechert LLP
Independent Registered Public Accounting Firms
KPMG LLP4
PricewaterhouseCoopers LLP5
1. This Fund is only registered for sale in AZ, CA, NV, OR, UT, and WA.
2. This Fund is only registered for sale in CT, DE, FL, MA, NJ, NY, and VT.
3. An affiliate of New York Life Investment Management LLC.
4. For all Funds listed above except MainStay Marketfield Fund.
5. For MainStay Marketfield Fund only.
Not part of the Annual Report
For more information
800-MAINSTAY (624-6782)
mainstayinvestments.com
MainStay Investments® is a registered service mark and name under which New York Life Investment Management LLC does business. MainStay Investments, an indirect subsidiary of New York Life Insurance Company, New York, NY 10010, provides investment advisory products and services. The MainStay Funds® are managed by New York Life Investment Management LLC and distributed through NYLIFE Distributors LLC, 169 Lackawanna Avenue, Parsippany, NJ 07054, a wholly owned subsidiary of New York Life Insurance Company. NYLIFE Distributors LLC is a Member FINRA/SIPC.
©2015 NYLIFE Distributors LLC. All rights reserved.
| Not FDIC/NCUA Insured | Not a Deposit | May Lose Value | No Bank Guarantee | Not Insured by Any Government Agency |
| 1634138 MS386-14 | MSCU11-01/15 (NYLIM) NL258 |
Item 2. Code of Ethics.
As of the end of the period covered by this report, the Registrant has adopted a code of ethics (the “Code”) that applies to the Registrant’s principal executive officer (“PEO”) and principal financial officer (“PFO”). A copy of the Code is filed herewith. The Registrant did not grant any waivers, including implicit waivers, from any provisions of the Code to the PEO or PFO during the period covered by this report.
| Item 3. | Audit Committee Financial Expert. |
The Board of Trustees has determined that the Registrant has two audit committee financial experts serving on its Audit Committee. The Audit Committee financial experts are Alan R. Latshaw and Roman L. Weil. Messrs. Latshaw and Weil are “independent” within the meaning of that term under the Investment Company Act of 1940.
| Item 4. | Principal Accountant Fees and Services. |
MainStay Cushing MLP Premier Fund, MainStay Cushing Renaissance Advantage Fund and MainStay Cushing Royalty Energy Income Fund each commenced operations on July 11, 2014. Therefore, there is no information to report for the fiscal year ended November 30, 2013.
(a) Audit Fees
The aggregate fees billed for the fiscal year ended November 30, 2014 for professional services rendered by KPMG LLP (“KPMG”) for the audit of the Registrant’s annual financial statements or services that are normally provided by KPMG in connection with statutory and regulatory filings or engagements for that fiscal year were $1,613,600.
(b) Audit-Related Fees
The aggregate fees billed for assurance and related services by KPMG that are reasonably related to the performance of the audit of the Registrant’s financial statements and are not reported under paragraph (a) of this Item were $0 for the fiscal year ended November 30, 2014. These audit-related services include review of financial highlights for Registrant’s registration statements and issuance of consents to use the auditor’s reports.
(c) Tax Fees
The aggregate fees billed for professional services rendered by KPMG for tax compliance, tax advice, and tax planning were $0 for the fiscal year ended November 30, 2014. These services primarily included preparation of federal, state and local income tax returns and excise tax returns, as well as services relating to excise tax distribution requirements.
The aggregate fees billed for professional services rendered by Ernst & Young LLP for tax compliance, tax advice, and tax planning were $12,000 during the fiscal year ended November 30, 2014. These services primarily included preparation of federal, state and local income tax returns and excise tax returns, as well as services relating to excise tax distribution requirements.
(d) All Other Fees
The aggregate fees billed for products and services provided by KPMG, other than the services reported in paragraphs (a) through (c) of this Item were $0 during the fiscal year ended November 30, 2014.
The aggregate fees billed for products and services provided by Ernst & Young LLP, other than the services reported in paragraphs (a) through (c) of this Item were $0 during the fiscal year ended November 30, 2014
(e) Pre-Approval Policies and Procedures
| (1) | The Registrant’s Audit Committee has adopted pre-approval policies and procedures (the “Procedures”) to govern the Committee’s pre-approval of (i) all audit services and permissible non-audit services to be provided to the Registrant by its independent accountant, and (ii) all permissible non-audit services to be provided by such independent accountant to the Registrant’s investment adviser and to any entity controlling, controlled by or under common control with the investment adviser that provides ongoing services to the Registrant (collectively, the “Service Affiliates”) if the services directly relate to the Registrant’s operations and financial reporting. In accordance with the Procedures, the Audit Committee is responsible for the engagement of the independent accountant to certify the Registrant’s financial statements for each fiscal year. With respect to the pre-approval of non-audit services provided to the Registrant and its Service Affiliates, the Procedures provide that the Audit Committee may annually pre-approve a list of the types of services that may be provided to the Registrant or its Service Affiliates, or the Audit Committee may pre-approve such services on a project-by-project basis as they arise. Unless a type of service has received general pre-approval, it will require specific pre-approval by the Audit Committee if it is to be provided by the independent accountant. The Procedures also permit the Audit Committee to delegate authority to one or more of its members to pre-approve any proposed non-audit services that have not been previously pre-approved by the Audit Committee, subject to the ratification by the full Audit Committee no later than its next scheduled meeting. To date, the Audit Committee has not delegated such authority. |
| (2) | With respect to the services described in paragraphs (b) through (d) of this Item 4, no amount was approved by the Audit Committee pursuant to paragraph (c)(7)(i)(C) of Rule 2-01 of Regulation S-X. |
(f) There were no hours expended on KPMG’s engagement to audit the Registrant’s financial statements for the most recent fiscal year was attributable to work performed by persons other than KPMG’s full-time, permanent employees.
(g) All non-audit fees billed by KPMG for services rendered to the Registrant for the fiscal year ended November 30, 2014 are disclosed in 4(b)-(d) above.
The aggregate non-audit fees billed by KPMG for services rendered to the Registrant’s investment adviser (not including any sub-adviser whose role is primarily portfolio management and is subcontracted with or overseen by another investment adviser), and any entity controlling, controlled by, or under common control with the adviser that provides ongoing services to the Registrant were approximately $0 for the fiscal year ended November 30, 2014.
(h) The Registrant’s Audit Committee has determined that the non-audit services rendered by KPMG for the fiscal year ended November 30, 2014 to the Registrant’s investment adviser and any entity controlling, controlled by, or under common control with the Registrant’s investment adviser that provides ongoing services to the Registrant that were not required to be pre-approved by the Audit Committee because they did not relate directly to the operations and financial reporting of the registrant were compatible with maintaining the respective independence of KPMG during the relevant time period.
| Item 5. | Audit Committee of Listed Registrants |
Not applicable.
| Item 6. | Schedule of Investments |
The Schedule of Investments is included as part of Item 1 of this report.
| Item 7. | Disclosure of Proxy Voting Policies and Procedures for Closed-End Management Investment Companies. |
Not applicable.
| Item 8. | Portfolio Managers of Closed-End Management Investment Companies. |
Not applicable.
| Item 9. | Purchases of Equity Securities by Closed-End Management Investment Company and Affiliated Purchasers. |
Not Applicable.
| Item 10. | Submission of Matters to a Vote of Security Holders. |
Since the Registrant’s last response to this Item, there have been no material changes to the procedures by which shareholders may recommend nominees to the Registrant’s Board of Trustees.
| Item 11. | Controls and Procedures. |
(a) Based on an evaluation of the Registrant’s Disclosure Controls and Procedures (as defined in Rule 30a-3(c) under the Investment Company Act of 1940) (the “Disclosure Controls”), as of a date within 90 days prior to the filing date (the “Filing Date”) of this Form N-CSR (the “Report”), the Registrant’s principal executive officer and principal financial officer have concluded that the Disclosure Controls are reasonably designed to ensure that information required to be disclosed by the Registrant in
the Report is recorded, processed, summarized and reported by the Filing Date, including ensuring that information required to be disclosed in the Report is accumulated and communicated to the Registrant’s management, including the Registrant’s principal executive officer and principal financial officer, as appropriate to allow timely decisions regarding required disclosure.
(b) There were no changes in the Registrant’s internal control over financial reporting (as defined in Rule 30a-3(d)) under the Investment Company Act of 1940 that occurred during the second fiscal quarter of the period covered by this report that has materially affected, or is reasonably likely to materially affect, the Registrant’s internal control over financial reporting.
Item 12. Exhibits.
(a)(1) | Code of Ethics | |
(a)(2) | Certifications of principal executive officer and principal financial officer as required by Rule 30a-2 under the Investment Company Act of 1940. | |
(b) | Certifications of principal executive officer and principal financial officer as required by Section 906 of the Sarbanes-Oxley Act of 2002. | |
SIGNATURES
Pursuant to the requirements of the Securities Exchange Act of 1934 and the Investment Company Act of 1940, the Registrant has duly caused this Report to be signed on its behalf by the undersigned, thereunto duly authorized.
MAINSTAY FUNDS TRUST
| By: | /s/ Stephen P. Fisher | |
Stephen P. Fisher President and Principal Executive Officer | ||
Date: | February 6, 2015 | |
Pursuant to the requirements of the Securities Exchange Act of 1934 and the Investment Company Act of 1940, this Report has been signed below by the following persons on behalf of the Registrant and in the capacities and on the dates indicated.
| By: | /s/ Stephen P. Fisher | |
Stephen P. Fisher President and Principal Executive Officer | ||
| Date: | February 6, 2015 | |
| By: | /s/ Jack R. Benintende | |
Jack R. Benintende Treasurer and Principal Financial and Accounting Officer | ||
| Date: | February 6, 2015 | |
EXHIBIT INDEX
(a)(1) | Code of Ethics | |
(a)(2) | Certifications of principal executive officer and principal financial officer as required by Rule 30a-2 under the Investment Company Act of 1940. | |
(b) | Certification of principal executive officer and principal financial officer as required by Section 906 of the Sarbanes-Oxley Act of 2002. | |