UNITED STATES
SECURITIES AND EXCHANGE COMMISSION
Washington, D.C. 20549
Form N-CSR
CERTIFIED SHAREHOLDER REPORT OF REGISTERED
MANAGEMENT INVESTMENT COMPANIES
Investment Company Act File Number 811-22321
MAINSTAY FUNDS TRUST
(Exact name of Registrant as specified in charter)
51 Madison Avenue, New York, NY 10010
(Address of principal executive offices) (Zip code)
J. Kevin Gao, Esq.
169 Lackawanna Avenue
Parsippany, New Jersey 07054
(Name and address of agent for service)
Registrant’s telephone number, including area code: (212)576-7000
Date of fiscal year end: December 31
Date of reporting period: December 31, 2013
FORM N-CSR
The information presented in this Form N-CSR relates solely to the
MainStay Marketfield Fund, a series of the Registrant.
| Item 1. | Reports to Stockholders. |
MainStay Marketfield Fund
Message from the President, Marketfield Asset Management LLC Year-End Commentary and Annual Report
December 31, 2013


This page intentionally left blank
Message from the President
We are pleased to present the annual report for MainStay Marketfield Fund and the Marketfield Asset Management LLC Year-End Commentary. The commentary was prepared by Michael Aronstein, President and Chief Investment Officer of Marketfield Asset Management LLC and the portfolio manager of MainStay Marketfield Fund.
Together, the commentary and the annual report contain specific information about the market events, macroeconomic trends and investment decisions that shaped MainStay Marketfield Fund during the reporting period.
We encourage you to read the following material carefully and to make thoughtful use of the information it contains.
We thank you for selecting MainStay Marketfield Fund, and we look forward to serving your investment needs for many years to come.
Sincerely,

Stephen P. Fisher
President
The opinions expressed are as of the date of this report and are subject to change. There is no guarantee that any forecast made will come to pass. This material does not constitute investment advice and is not intended as an endorsement of any specific investment. Past performance is no guarantee of future results.
Not part of the Annual Report
Marketfield Asset Management LLC Year-End Commentary
During the last quarter, our monthly commentaries have begun to explore the question of inflation as a significant macroeconomic factor over the course of the next year. Our interest in this possibility is an outgrowth of a strong feeling that the Federal Reserve Board (FRB) is maintaining a radically expansive policy long past the point of propriety.
To the extent that we are correct in doubting the need for additional monetary stimulus, the consequences will be manifest in an environment that shows evidence of over-stimulation in the forms of excess activity and accelerating nominal prices.
On the other hand, if the popular view that rates deflation as the main macroeconomic risk is correct, then the FRB is entirely justified in its current policy path and we are wrong.
At the earliest stages of change in macroeconomic conditions, empirical evidence of the new, emergent regime is scant. The process of discernment is entirely theoretical. It is a function of human reason and the logical, scientific structures that derive from rational consideration.
Economic science and its related forecasting protocols, which we employ as a basis of our investment process, are logical, not empirical in form. Just as there is no need to measure thousands of triangles in order to prove the Pythagorean Theorem, we do not need studies to demonstrate that raising legal minimum wages above market rates reduces total employment or that subsidies provoke surpluses.
A reliance on theoretical processes to forecast economic change makes certain that we will spend a great deal of time defending views that most commentators find far-fetched or nonsensical.
From a practical, portfolio management standpoint, it is imperative that these theoretical musings about large-scale trend changes not be implemented before conditions are actually beginning to change. The risks of portfolio adjustments that are years too early outweigh any potential benefits of utilizing macroeconomic inputs in the asset allocation process. That said, it is important to act when markets are still incorporating the longer-term, macroeconomic factors that one believes to be on the way out. The difference in timing between insight and error comes out in the form of performance.
In the current cycle, plenty of intelligent commentators and managers made the point in 2009-2011 that the relentless monetary expansion undertaken by the FRB was bound to result in inflation. To the extent that they reacted by allocating funds to typical inflation sensitive assets e.g., mining stocks, precious metals, commodity indices, emerging market mineral exporters and inflation-indexed bonds, performance has been disastrous.
Now that these views have been fully discredited and customers have pulled a great deal of capital away from those who held and acted on them, conditions are ripe for change.
The early conflation of FRB policy and the consequent likelihood of inflation were not conceptually incorrect but incorrectly timed. We have said for decades that implementation of macroeconomic views that are several years in advance of market recognition is not a matter of too early but simply another way of being wrong.
Popular media presents an endless stream of heroic commentators who “called,” ex post, every great market dislocation since the 1929 crash. What is never mentioned is that these calls were generally three or four years before the actual event and thus useless in application. By the time such a long-touted event unfolds (if ever), the narrative behind the opinion has been so fully discredited by poor investment performance that clients have moved their assets elsewhere and the manager has become emotionally impaired.
The process of discrediting worries about inflation has been gathering momentum for the past three years. It appears to us to have reached full force with central bankers now uniformly anxious about their ability to create nominal price increases. This is somewhat the obverse of the sentiment that prevailed in 2008-2010, when we had countless discussions with advisors, analysts and business leaders who were concerned that the Fed could not muster enough firepower to prevent a tidal surge of default across fixed income markets and the entire banking system.
Now that nearly every measure of credit distress in the domestic financial system is at record lows, arguments for monetary impotence continue in different form. The fact that five years of balance sheet expansion by the Federal Reserve has not resulted in consumer price acceleration is taken as an indication that they are powerless to affect such an outcome. Prices of non-financial, “main street” goods and services did not respond quickly to the surge in dollar liquidity because the transmission mechanism within the economy was broken.
Households, governments and the banking systems that financed their credit adventures have been in the throes of secular balance sheet restructurings since the panic of 2008. Parallel restructurings and rationalizations in the elements of the real economy i.e., property markets and construction activity have likewise been in process.
The monetary pipeline was blocked by a full blown depression in U.S. home construction and the deflationary policies of the European Central Bank, which presided, ineptly, over the largest economic bloc in the world and did not change policy until the end of 2011. The Bank of Japan was similarly recalcitrant.
The combination of inappropriately tight monetary policy in two of the major developed world central banks, serious rationalization of government finances in the European periphery, U.S. states and municipalities and the draconian restructuring of the majority of the multinational banking system prevented the expansion of central bank liquidity from provoking more than spectacular asset inflation.
Not part of the Annual Report
The main defects in the transmission mechanism through the real economy are now largely healed. The question is how the inflationary process can migrate from assets’ prices to prices of consumers’ goods and services.
In order to address the question, one must begin with the morphology of asset inflations and central banks’ roles in provoking them.
We come at the issue from a perspective that considers inflationary processes to be monetary in origin. Our working definition of inflation is an inappropriately large (in relation to real economic activity) increase in money and credit.
Once such an increase has, as in the present case, come to pass, the discussion is entirely about consequences. The main focus of this letter is on the symptoms deriving from the inflation of money and credit that has already come to pass. We assume the impropriety of current FRB policy and will not further argue that point. Time and markets will tell if that basic assumption is correct.
Inflations are pernicious aspects of economies mainly because their effects are so uneven, or, in more popular parlance, unequal.
There would be little to object to in a circumstance where prices, wages and asset values were suddenly revised higher by 20%. Assuming this process was applied to bank balances and credit instruments, the resulting distortions would be manageable.
Unfortunately, the actual effects of monetary inflation are manifest throughout the global economy in highly uneven fashion. The process produces clear groups of winners and losers. The characteristics of the members in those categories vary from cycle to cycle. Beneficiaries range widely from owners of raw land (Japan 1980s, U.S. 2001-2007), to oil producers (1970s) and owners of residential property in financial centers (2010-present). Each of these episodes has countless subcategories comprising beneficiaries.
The main burdens in each case fall upon those who are not involved in the parts of the economy that are enjoying the boost from inflationary policy but are still in need of goods and services, the real cost of which continues to rise. There is a real transfer of wealth from the second group to the first. If it persists long enough, the disparity becomes extreme.
We can recall the height of the oil boom and the depth of the bond bear market in the early 1980s, when a two bedroom apartment in Manhattan cost less than a two bedroom starter home in Houston. Petroleum geologists, not fixed income managers, expected helicopter transport to work sites.
The effects of monetary inflations within the real economy arise in accordance with the different pathways of credit expansion at work in each cycle. At the outset of every inflationary cycle, there is always a collateral form that enjoys good fundamental
supply/demand characteristics available to transmit the monetary impulse. It is never the asset type that the central bank is attempting to repair.
Expansive monetary policy always follows periods of distress, when policymakers see something that needs to be rescued. The distressed assets are normally those that were the focus of enthusiasm in the prior cycle.
As monetary conditions are eased in response to the distress in a dying mania as took place in housing and housing finance in 2008-2009, that sector is never the beneficiary of the increased availability of credit. Bankers and investors will not willingly return to the collateral types that have just caused them the most extreme pain.
With the credit spigots open, there is always some unimpaired sector that can serve as collateral with no apparent risks. In the current cycle, emerging market economies gathered a disproportionate share of the global credit excess that began after the Panic of 2008. They were not involved in the U.S. and European property mania, had been growing steadily since 2002 and were, as a result, regarded as pristine borrowers.
The remarkable cycle of issuance in emerging market credit since 2009 strikes us as the primary locus of the inflation engendered by Federal Reserve policy.
It is difficult for observers to put the process in context because it is, like every important macroeconomic cycle, unique and without direct precedent. The inflationary mechanism utilized by the Fed in the present circumstance relies less upon the traditional avenue of expanding bank credit and more on the direct stimulation of fixed income markets.
By supporting bond prices at above market levels, the Fed is, in essence, maintaining a massive subsidy for issuers. There is little difference in form between QE 3 and the various agricultural price support programs undertaken by governments around the world. Their end result is always the same—a surplus of the item that is being held at above market prices.
All artificially elevated prices eventually provoke surplus production. The bond markets since the beginnings of QE have been no exception. Because the Fed has confined its purchases largely to high quality government and mortgage bonds, the field has been cleared for other issuers of lesser quality to jump into the void.
And jump they have.
We will not recapitulate the statistics regarding global fixed income issuance during the past three years. Suffice it to say that despite the Fed’s absorption of more than three trillion dollars of bonds from the open markets, the corpus of outstanding issues has still managed to grow.
In response to price declines in cotton and distress in the farm sector, the Chinese government introduced cotton price supports in 2011 and 2012. These were above world market levels.
Not part of the Annual Report
Today China is warehousing enough surplus cotton to supply more than half of the world’s annual needs. Unless wearing four pairs of underwear at once becomes the new fashion, the Chinese have a major problem.
The Federal Reserve has painted itself into a similar corner. Fixed income issuance since the onset of QE 2 has comprised a variety of overvalued and lesser quality instruments of little practical use. The old Wall Street admonition about learning the difference between eating sardines and trading sardines (which are never meant to be opened or consumed, merely passed back and forth among traders) is particularly apt as pertains to contemporary fixed income markets.
A ten-year bond with a 1.5% coupon is about as useful as teats on a bullfrog. It is a trading sardine with no practical, fundamental output value to the investor. It does not hold up next to cash as a safe haven. The only hope in owning it is to make a trading gain, which, on the heels of a 31-year bull market, is a dangerous business.
More egregious overvaluations were evident in the offerings from emerging market sovereign and corporate issuers. Their dollar bonds had the dual features of extraordinarily low rates and questionable credit fundamentals. Like Chinese cotton, Thai rice or U.S. sugar, price supports (by the FRB) have created a bond glut.
The inflationary aspect of the bond glut is the extraordinary flow of cash to issuers. For the past three years, it seemed as though anyone able to spell ‘bond’ was considered qualified to issue them.
The distortions in prices enabled by unprecedented and nearly unlimited access to credit markets have been profound. The most straightforward has been the corporate balance sheet arbitrage whereby companies have issued overpriced bonds and used the proceeds to buy back their own stock. This has been an obvious method of taking advantage of the implicit price supports offered by the Federal Reserve.
The capital structure arbitrage employed by developed market companies has been a meaningful factor in propelling equity prices and provoking resentment among those not enjoying the benefits.
The liquidity flood emanating from the fixed income markets has had the most striking effects within the developing world. The hyperinflationary spirals of property in Western financial centers, bad art and luxury goods are celebrated in ever-grander gatherings and heavier magazines.
The question at hand is whether this liquidity flood will now make its presence known in more prosaic aspects of the global economy.
An easy first look can be had directly within emerging market economies. Broad and accelerating inflation has become the norm. In China, Brazil, Russia, Indonesia and India, among
others, wages and prices are increasing at between 10 and 20% per annum. A portion of the increases in goods’ costs is attributable to the weakening currencies and the withdrawal of subsidies that have held prices of fuels, power and certain staples at artificially suppressed levels. The costs to central governments of maintaining payments to producers and importers to hold prices below market levels have exacerbated current account shortfalls and further weakened currencies and local bond markets. As these are withdrawn, costs of living increase rapidly for the lower and middle classes, and demands for legislated wage increases intensify. The process is self-reinforcing.
To the extent that these governments have sufficient reserves and are inclined to support their currencies in the face of current account shortfalls, that activity has the effect of tightening local capital markets’ liquidity (withdrawing local currency by purchasing it for dollars) and placing more stress on internal debtors.
The inflation, credit distress and capital outflows are consequences of the liquidity booms that proceeded in the aftermath of 2008. That process was and continues to be supported by the flood of dollar liquidity induced by the Federal Reserve.
The inflationary response to inflationary policy appears first in the developing world because they did not have the deflationary sinkholes opening in their economies between 2007 and 2010 that prevented anything other than asset inflation in the U.S. and Western Europe.
In order to consider the possible domestic influences of the inflation underway in emerging markets, we will go back four decades to look at a potential line of transmission.
During the explosive growth of the American consumer economy during the decades following the Second World War, a key input factor was an apparently limitless supply of cheap energy from domestic discoveries and from newly acquired allies in the Middle East.
In many regards, the repressed price of hydrocarbons was a crucial factor (along with our returning military personnel and the destruction of the rest of the world’s industrial capacity) in allowing the U.S. to vastly outperform every other economy on Earth. The development of a far-flung, suburban consumer infrastructure was enabled by the very low cost of automobile travel.
A generation after the end of World War II, the presence of inexpensive fuel was taken as a given throughout our economy.
The first oil shock in the early 1970s set the stage for a long, disruptive cycle of inflation and recession. It culminated with record high interest rates and a near collapse of the dollar. The oil supply shock, while real, was simply the proximate trigger for the generalized acceleration of inflation. The enabling fundamental was the Federal Reserve’s effort to head off a countervailing deflation in the non-energy related portions of the
Not part of the Annual Report
economy by inflating the money supply sufficiently to accommodate rising energy prices without that increase coming out of some other price.
Recall that in a stable monetary environment, a rise in the price of item A will be counterbalanced by falls in other prices. This is what the FRB of the early 1970s wished to prevent. In its stead, it provoked a much more serious and destabilizing trend, where rising prices and falling real incomes spread across all corners of the economy.
At present, there is a somewhat analogous system of external dependence and fears of deflationary chimera at work in the U.S. economy, although they do not involve OPEC and oil scarcity.
For more than two decades, we have come to rely on the extraordinarily inexpensive manufactured goods produced in the developing world. China is a particularly clear example of this. The trend of relocating global manufacturing capacity outside the developed world accelerated in the aftermath of the 1997-1998 Asian currency crisis. Their abrupt, involuntary devaluations further lowered costs and prices from the perspective of Western manufacturers and consumers.
The long migration of manufacturing capacity to Asia was abetted by the very loose monetary policy maintained by the Federal Reserve between 2001 and 2005. The process was then turbocharged by the radically accommodative policy measures arising in the aftermath of 2008 and continuing to this day.
The initial macroeconomic effects of the mass movement of capacity to low cost regions were deflationary for Western economies. These effects were particularly glaring in regions of the U.S. that had been devoted to traditional industrial processes. Wages, standards of living and overall measures of prosperity were relentlessly depressed.
The bankruptcies of two of the three remaining U.S. automobile manufacturers and the city in which they were headquartered probably marked the nadir. Readers should keep in mind that in 1926, some of the most expensive commercial property on the planet was on Dearborn Avenue in Detroit. Things change.
The processes by which labor unions and their legislative allies raised the costs of labor well beyond the growth of productivity created the basic incentive structure for companies (and consumers) to look overseas for greater value. The inevitable readjustment of wage levels from their artificially elevated heights two generations ago has been taken up by the mainstream economics community and much of the financial press as proof that there are fundamental flaws in labor markets that need administrative remedy.
The fact is that wage rates in the U.S. have finally adjusted back to levels at which they are well supported by productivity, and without political interference, should begin a cycle of real growth.
A similar cycle of wage deflation has been evident in parts of Europe since the onset of their crisis, and in much of the periphery, private labor costs are approaching levels where they are competitive on an international scale.
The extraordinary largess of the Federal Reserve has not, with some limited exceptions, raised U.S. wages, commodity prices or costs of retail goods, and in light of these facts the consensus view of the economy now holds deflation as a much more worrisome probability. Nearly every mainstream forecaster dismisses the possibility of a serious inflationary trend out of hand.
Price shocks that would undermine the accepted picture of economic risks in the U.S. and Europe have already progressed well beyond the embryonic stages in the parts of the emerging world that we have come to rely on for an endless supply of inexpensive manufactured goods.
Wage rates in China and most of developing Asia are continuing to grow at double-digit rates. Inadequate power and transportation infrastructure further undermines any cost advantages that have characterized the region since the mid 1990s.
Asia is the present day OPEC of manufactured products. We in the West have provided access to our robust consumer demand and manufacturing expertise in exchange for a generation of remarkably inexpensive consumer and intermediate goods. A sustained rise in prices from this corner will catch the investment community and central banks completely unprepared.
Most observers are discounting the risks inherent in inflationary processes now underway because their focus is on commodity prices and developed market wage rates. Both have been very subdued. In addition, anyone who has sounded the alarm regarding inflation since 2009 has been made to look quite foolish by markets and economic data flows. Most in that camp appear to have surrendered, a normal sign of trend change.
Commodity prices are still being depressed by the withdrawal of institutional investment capital that was sold the fiction of a “commodity super-cycle” right as it was ending some five years ago. The influx of passive capital to the strategy of owning large stocks of commodity inventory helped to create the final peak in prices. Large increases in productive capacity were the normal industry response to the price spikes. Both are being unwound and keeping most index contained commodities relatively docile.
Wages in the developed economies are in the midst of a long correction from unsustainably elevated levels. The process is complete in the vast majority of the private sector, particularly in manufacturing. The correction of unsustainably elevated public sector employment cost is underway, having progressed much farther in Greece and Detroit than in New York City. This is part of a long process of global cost rationalization that has made its way through the private sector and is just taking hold among governments.
Not part of the Annual Report
Price rises at the emerging economy end of the global supply chain would seem a natural prompt to capital and capacity migration back to the developed world. To some extent this is already underway. An important surprise will develop when it becomes clear that there is a great deal less spare capacity in developed economies than statistics would indicate.
Pressures on corporate managers to conserve equity capital (the apparent, real costs of which are high and difficult to determine) are substantial. There is a large cadre of analysts and “activists” leaning on managers to close, sell, reduce and rationalize capacity. Marginal facilities that are counted by statisticians as unused capacity may, in actuality, have no real productive value.
We suspect that the same is true in the labor force, where the skills mismatch between the unemployed and those needing workers capable of participating in modern manufacturing processes is insurmountable.
It is becoming quite clear that the popular imperative among central bankers in the developed world is to make monetary inflation manifest in prices and wages. The choruses of academia and politics are supporting them in this endeavor. A form of militant altruism has arisen as the new intellectual fashion among the very rich and powerful. Davos 2014 has become the Woodstock of guilt.
Present efforts to speed the migration of price increases from assets to goods and wages are not just superfluous but harmful. The tragic harm consists in the fact that the burdens of policy error will fall most heavily on those at the bottom of the economic ladder.
If there is just one thing about the relationship between economics and society that readers of this letter take away, it should be this; economic inefficiency kills prospects of the poor. Always and everywhere and in spite of good intentions (which are indeed pavement on the road to Hell).
In every cycle comprising unusual macroeconomic features, there are clear beneficiaries and victims. This one will be no different.
Companies with capacity that is difficult to replicate or substitute for will be at great advantage, assuming that they are able to compete for the labor required to satisfy additional demand.
Businesses that depend upon price advantages from emerging market inputs will begin to see cost pressures. Some will be able to pass these through, but few will have the ability to continue to take costs from their domestic labor force. Real wages at all points in the domestic economy look set to begin a long advance.
Commodities prices should be widely dispersed, with local supply/demand conditions playing a much larger role than institutional capital flows. Real costs of production in certain parts of the world will rise dramatically as the phenomenon of absurdly low wage rates in developing markets begins to abate.
In past cycles, equity valuations have not responded well to unanticipated increases in reported inflation. The negative response often takes time. At present, it is clear in the case of Emerging Market equities, where we have just entered year three of the bear market. Investors seem to be noticing, but there is still a stubborn adherence to the idea that the future of global economic progress will be led by the developing world. We continue to believe otherwise.
As 2013 drew to a close, our portfolio was continuing to move toward those companies that would fare better in a world where prices in the real economy started to catch up with prices of investment media. Our short portfolio remains concentrated in emerging market assets, where the benefits of the radical largess of Western central banks have been most profound and fundamentally unsupported.
As many of you are aware, the fund has experienced remarkable asset growth during the past year. We are acutely aware that this is not a good portent for ensuing performance. Our style and methods of execution remain deliberate and long-term, as they have been from day one. They are now matters of necessity as well as inclination, but the day-to-day processes within the firm have not changed. Results will continue to depend upon our ability to gain some differentiable insight into the complex macroeconomic processes that drive changes in capital assets’ pricing and output.
As always, we are extraordinarily grateful for your support and welcome your questions.
January 27, 2014
Michael C. Aronstein
President, CIO & Portfolio Manager
The information provided herein represents the opinion of the Portfolio Manager and is not intended to be a forecast of future events, a guarantee of future results, nor investment advice.
Not part of the Annual Report
Investors should refer to the Fund’s Summary Prospectus and/or Prospectus and consider the Fund’s investment objectives, strategies, risks, charges and expenses carefully before investing. The Summary Prospectus and/or Prospectus contain this and other information about the Fund. You may obtain copies of the Fund’s Summary Prospectus, Prospectus and Statement of Additional Information free of charge, upon request, by calling toll-free 800-MAINSTAY (624-6782), by writing to NYLIFE Distributors LLC, Attn: MainStay Marketing Department, 169 Lackawanna Avenue, Parsippany, New Jersey 07054 or by sending an e-mail to MainStayShareholderServices@nylim.com. These documents are also available via the MainStay Funds’ website at mainstayinvestments.com/documents. Please read the Summary Prospectus and/or Prospectus carefully before investing.
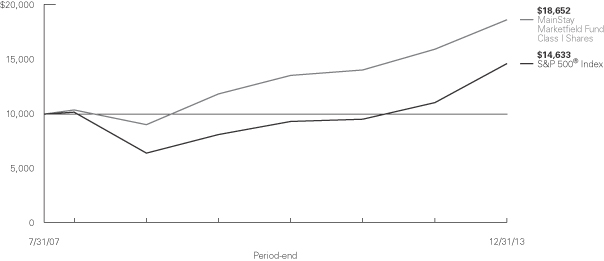
Investment and Performance Comparison1 (Unaudited)
Performance data quoted represents past performance. Past performance is no guarantee of future results. Because of market volatility, current performance may be lower or higher than the figures shown. Investment return and principal value will fluctuate, and as a result, when shares are redeemed, they may be worth more or less than their original cost. The graph below depicts the historical performance of Class I shares of the Fund. Performance will vary from class to class based on differences in class-specific expenses and sales charges. For performance information current to the most recent month-end, please call 800-MAINSTAY (624-6782) or visit mainstayinvestments.com.
Average Annual Total Returns for the Period Ended December 31, 2013
| Class | Sales Charge | One Year | Five Years | Since Inception (7/31/07) | Gross Expense Ratio2 | |||||||||||||||
| Class A Shares3 | Maximum 5.5% Initial Sales Charge | With sales charges Excluding sales charges |
| 10.20 16.62 | %
|
| 14.00 15.30 | %
|
| 8.96 9.92 | %
|
| 4.15 4.15 | %
| ||||||
| Investor Class Shares3 | Maximum 5.5% Initial Sales Charge | With sales charges Excluding sales charges |
| 10.20 16.62 |
|
| 14.00 15.30 |
|
| 8.96 9.92 |
|
| 4.11 4.11 |
| ||||||
| Class C Shares3 | Maximum 1% CDSC if Redeemed Within One Year of Purchase | With sales charges Excluding sales charges | | 14.76 15.76 | | | 14.44 14.44 | | | 9.10 9.10 | |
| 4.90 4.90 |
| ||||||
| Class I Shares4 | No Sales Charge | 16.93 | 15.58 | 10.19 | 2.94 | |||||||||||||||
| Class R2 Shares3 | No Sales Charge | 16.58 | 15.18 | 9.80 | 3.91 | |||||||||||||||
| Class R6 Shares5 | No Sales Charge | 16.93 | 15.58 | 10.19 | 2.84 | |||||||||||||||
| Class P Shares6 | No Sales Charge | 16.87 | 15.57 | 10.18 | 2.94 | |||||||||||||||
| 1. | The performance table and graph do not reflect the deduction of taxes that a shareholder would pay on distributions or Fund-share redemptions. Total returns reflect maximum applicable sales charges as indicated in the table above, changes in share price, and reinvestment of dividends and capital gain distributions. The graph assumes the initial investment amount shown above and reflects the deduction of all sales charges that would have applied for the period of investment. Performance figures reflect certain fee waivers and/or expense limitations, without which total returns may have been lower. For more information on share classes and current fee waivers and/or expense limitations, please refer to the notes to the financial statements. |
| 2. | The gross expense ratios presented reflect the Fund’s “Total Annual Fund Operating Expenses” from the most recent Prospectus and may differ from other expense ratios disclosed in this report. |
| 3. | Performance figures for Class A, Investor Class, Class C, and Class R2 shares, first offered on October 5, 2012 include the historical performance of Class I shares through October 4, 2012 and are adjusted to reflect |
| differences in fees and expenses. Performance data for the classes varies based on differences in their fee and expense structures. Marketfield Fund commenced operations on July 31, 2007. Unadjusted, the performance for the newer classes would likely have been different. |
| 4. | Performance figures for Class I shares reflect the historical performance of the then-existing shares of Marketfield Fund (the predecessor to the Fund, which was subject to a different fee structure, and for which a predecessor entity to Marketfield Asset Management LLC served as investment advisor) for periods prior to October 5, 2012. Marketfield Fund commenced operations on July 31, 2007. |
| 5. | Performance figures for Class R6 shares, first offered on June 17, 2013, include the historical performance of Class I shares through June 16, 2013. Performance for Class R6 would likely have been different because of differences in certain expenses attributable to each share class. |
| 6. | Performance figures for Class P shares, first offered on May 31, 2013, include the historical performance of Class I shares through May 30, 2013. |
The footnotes on the next page are an integral part of the table and graph and should be carefully read in conjunction with them.
| 10 | MainStay Marketfield Fund |
| Benchmark Performance | One Year | Five Years | Since Inception | |||||||||
S&P 500® Index7 | 32.39 | % | 17.94 | % | 6.11 | % | ||||||
Average Lipper Alternative Long/Short Equity Fund8 | 15.63 | 8.71 | 2.80 | |||||||||
| Performance for Class P shares would likely have been different because of differences in certain expenses attributable to each share class. |
| 7. | S&P 500® Index is a trademark of The McGraw-Hill Companies, Inc. The S&P 500® Index is widely regarded as the standard index for measuring large-cap U.S. stock market performance. The S&P 500® Index is the Fund’s broad-based securities market index for comparison purposes. Results assume reinvestment of all dividends and capital gains. An investment cannot be made directly in an Index. |
| 8. | The average Lipper alternative long/short equity fund is representative of funds that employ portfolio strategies combining long holdings of equities with short sales of equity, equity options, or equity index options. The funds may be either net long or net short, depending on the portfolio manager’s view of the market. This benchmark is a product of Lipper Inc. Lipper Inc. is an independent monitor of fund performance. Results are based on average total returns of similar funds with all dividend and capital gain distributions reinvested. |
The footnotes on the preceding page are an integral part of the table and graph and should be carefully read in conjunction with them.
| mainstayinvestments.com | 11 |
Cost in Dollars of a $1,000 Investment in MainStay Marketfield Fund (Unaudited)
The example below is intended to describe the fees and expenses borne by shareholders during the period from July 1, 2013, to December 31, 2013, and the impact of those costs on your investment.
Example
As a shareholder of the Fund, you incur two types of costs: (1) transaction costs, including exchange fees and sales charges (loads) on purchases (as applicable), and (2) ongoing costs, including management fees, distribution and/or service (12b-1) fees, and other Fund expenses (as applicable). This example is intended to help you understand your ongoing costs (in dollars) of investing in the Fund and to compare these costs with the ongoing costs of investing in other Funds. The example is based on an investment of $1,000 made at the beginning of the six-month period and held for the entire period from July 1, 2013, to December 31, 2013. Shares are only sold in connection with variable life and annuity contracts and the example does not reflect any contract level or transactional fees or expenses. If these costs had been included, your costs would have been higher.
This example illustrates your Fund’s ongoing costs in two ways:
Actual Expenses
The second and third data columns in the table below provide information about actual account values and actual expenses. You may use the information in these columns, together with the amount you invested, to estimate the expenses that you paid during the six months
ended December 31, 2013. Simply divide your account value by $1,000 (for example, an $8,600 account value divided by $1,000 = 8.6), then multiply the result by the number under the heading entitled “Expenses Paid During Period” to estimate the expenses you paid on your account during this period.
Hypothetical Example for Comparison Purposes
The fourth and fifth data columns in the table below provide information about hypothetical account values and hypothetical expenses based on the Fund’s actual expense ratio and an assumed rate of return of 5% per year before expenses, which is not the Fund’s actual return. The hypothetical account values and expenses may not be used to estimate the actual ending account balances or expenses you paid for the six-month period shown. You may use this information to compare the ongoing costs of investing in the Fund with the ongoing costs of investing in other Funds. To do so, compare this 5% hypothetical example with the 5% hypothetical examples that appear in the shareholder reports of the other Funds.
Please note that the expenses shown in the table are meant to highlight your ongoing costs only and do not reflect any transactional costs, such as exchange fees or sales charges (loads). Therefore, the fourth and fifth data columns of the table are useful in comparing ongoing costs only and will not help you determine the relative total costs of owning different funds. In addition, if these transactional costs were included, your costs would have been higher.
| Share Class | Beginning Account Value 7/1/13 | Ending Account Value (Based on Actual Returns and Expenses) 12/31/13 | Expenses Paid During Period1 | Ending Account Value (Based on Hypothetical 5% Annualized Return and Actual Expenses) 12/31/13 | Expenses Paid During Period1 | |||||||||||||||
| Investor Class Shares | $ | 1,000.00 | $ | 1,085.30 | $ | 14.93 | $ | 1,010.90 | $ | 14.39 | ||||||||||
| Class A Shares | $ | 1,000.00 | $ | 1,086.00 | $ | 14.88 | $ | 1,010.90 | $ | 14.34 | ||||||||||
| Class C Shares | $ | 1,000.00 | $ | 1,081.70 | $ | 18.84 | $ | 1,007.10 | $ | 18.16 | ||||||||||
| Class I Shares | $ | 1,000.00 | $ | 1,087.60 | $ | 13.58 | $ | 1,012.20 | $ | 13.09 | ||||||||||
| Class R2 Shares | $ | 1,000.00 | $ | 1,085.50 | $ | 15.40 | $ | 1,010.40 | $ | 14.85 | ||||||||||
| Class R6 Shares | $ | 1,000.00 | $ | 1,087.60 | $ | 14.00 | $ | 1,011.80 | $ | 13.49 | ||||||||||
| Class P Shares | $ | 1,000.00 | $ | 1,087.00 | $ | 13.52 | $ | 1,012.20 | $ | 13.03 | ||||||||||
| 1. | Expenses are equal to the Fund’s annualized expense ratio of each class (2.84% for Investor Class, 2.83% for Class A, 3.59% for Class C, 2.58% for Class I, 2.93% for Class R2, 2.66% for Class R6 and 2.57% for Class P) multiplied by the average account value over the period, divided by 365 and multiplied by 184 (to reflect the six-month period). The table above represents the actual expenses incurred during the six-month period. |
| 12 | MainStay Marketfield Fund |
Country Composition as of December 31, 2013 (Unaudited)
| United States | 61.4 | % | ||
| Germany | 6.3 | |||
| Ireland | 4.9 | |||
| Japan | 4.6 | |||
| Italy | 4.1 | |||
| Spain | 3.1 | |||
| United Kingdom | 3.0 | |||
| Switzerland | 2.3 | |||
| Canada | 2.0 |
| Denmark | 1.0 | % | ||
| France | 1.0 | |||
| Mexico | 0.8 | |||
| Sweden | 0.2 | |||
| Other Assets, Less Liabilities | 34.7 | |||
| Investments Sold Short | –29.4 | |||
|
| |||
| 100.0 | % | |||
|
|
Industry Composition as of December 31, 2013 (Unaudited)
| Commercial Banks | 12.9 | % | ||
| Exchange-Traded Funds | 7.3 | |||
| Household Durables | 5.9 | |||
| Construction Materials | 5.1 | |||
| Metals & Mining | 4.8 | |||
| Chemicals | 4.3 | |||
| Machinery | 4.2 | |||
| Oil, Gas & Consumable Fuels | 3.4 | |||
| Automobiles | 2.8 | |||
| Electrical Equipment | 2.3 | |||
| Energy Equipment & Services | 2.2 | |||
| Industrial Conglomerates | 2.0 | |||
| Specialty Retail | 2.0 | |||
| Trading Companies & Distributors | 1.7 | |||
| Auto Components | 1.6 | |||
| Internet Software & Services | 1.4 | |||
| Food & Staples Retailing | 1.2 | |||
| Real Estate Management & Development | 1.2 | |||
| Aerospace & Defense | 1.0 | |||
| Building Products | 1.0 |
| Capital Markets | 1.0 | % | ||
| Consumer Finance | 1.0 | |||
| IT Services | 1.0 | |||
| Insurance | 1.0 | |||
| Road & Rail | 1.0 | |||
| Semiconductors & Semiconductor Equipment | 1.0 | |||
| Diversified Financial Services | 0.9 | |||
| Internet & Catalog Retail | 0.9 | |||
| Software | 0.9 | |||
| Transportation Infrastructure | 0.9 | |||
| Construction & Engineering | 0.8 | |||
| Purchased Options | 0.7 | |||
| Real Estate Investment Trusts | 0.6 | |||
| Commercial Services & Supplies | 0.5 | |||
| Investment in Money Market Fund | 14.2 | |||
| Other Assets, Less Liabilities | 34.7 | |||
| Investments Sold Short | –29.4 | |||
|
| |||
| 100.0 | % | |||
|
|
See Portfolio of Investments beginning on page 16 for specific holdings within these categories.
Top Ten Holdings or Issuers as of December 31, 2013 (excluding short-term investment) (Unaudited)
| 1. | Bank of Ireland |
| 2. | SPDR S&P Regional Banking |
| 3. | Sumitomo Mitsui Financial Group, Inc. |
| 4. | iShares MSCI Mexico Investable Market Index Fund |
| 5. | Facebook, Inc. Class A |
| 6. | ABB, Ltd. |
| 7. | Continental A.G. |
| 8. | Alcoa, Inc. |
| 9. | iShares Dow Jones US Home Construction Index Fund |
| 10. | BASF S.E. Corp. |
Top Five Short Positions as of December 31, 2013 (Unaudited)
| 1. | Vanguard FTSE Emerging Markets |
| 2. | Utilities Select Sector SPDR Fund |
| 3. | Allianz SE |
| 4. | iShares JP Morgan USD Emerging Markets Bond |
| 5. | JPMorgan Chase & Co. |
| mainstayinvestments.com | 13 |
Portfolio Management Discussion and Analysis (Unaudited)
Questions answered by portfolio manager Michael C. Aronstein of Marketfield Asset Management LLC, the Fund’s Subadvisor.
How did MainStay Marketfield Fund perform relative to its benchmark and peers during the 12 months ended December 31, 2013?
Excluding all sales charges, MainStay Marketfield Fund returned 16.62% for Class A and Investor Class shares and 15.76% for Class C shares for the 12 months ended December 31, 2013. Over the same period, Class I shares returned 16.93%, Class R2 shares returned 16.58%, Class R6 shares returned 16.93% and Class P shares returned 16.87%. During the 12 months ended December 31, 2013, all share classes underperformed the 32.39% return of the S&P 500® Index,1 which is the Fund’s broad-based securities-market index. Over the same period, all share classes outperformed the 15.63% return of the average Lipper2 alternative long/short equity fund. See page 10 for Fund returns with applicable sales charges.
What factors affected the Fund’s relative performance during the reporting period?
The Fund takes a top-down investment approach in which the portfolio manager identifies macroeconomic trends and themes, and then determines the most appropriate investment instruments or strategies to express those themes in the Fund.
Relative to the S&P 500® Index, the Fund’s net long position during the reporting period turned out to be not long enough. However, the Fund outperformed most of the relevant alternative indices. The Fund’s long Europe theme and its long Capital Spending Cycle theme were primary positive drivers of performance. The short Safe Haven Assets theme and the short Emerging Markets theme were the primary themes that pulled performance down.
During the reporting period, how was the Fund’s performance materially affected by investments in derivatives?
During the reporting period, we used short positions in various bond futures to express the Fund’s domestic and global interest-rate views. These positions had a negligible impact on performance. We also used puts in emerging-market securities as a way of creating short positions in these markets. We also used a number of long sovereign credit default swap3 positions in the Fund. These derivatives had an overall negative effect on the Fund’s performance.
During the reporting period, which investment themes were the strongest contributors to the Fund’s performance and which themes were particularly weak?
Several of our long themes provided positive contributions to the Fund’s performance. (Contributions take weightings and total returns into account.) Our Europe theme contributed 8.1% to performance. This theme suggests that Europe is broadening its economic recovery that was triggered by the European Central Bank’s 2011 monetary stimulus. Our Capital Spending theme contributed 7.5% to performance. This theme reflects our belief that the combination of the beginning of a broad capital spending cycle and the significant improvement in the global competiveness of U.S. manufacturing will benefit the U.S. industrial base. Our U.S. Housing Recovery theme added 4.8% to performance. This theme suggests that the U.S. housing market continues to recover supported by credit cycle strengthening and favorable inventory levels.
Other themes detracted from the Fund’s performance. Our short Safe Haven Assets theme detracted from performance by 3.4%. This theme’s rationale is that those assets that investors have considered to be “safe haven” assets are over-owned and overvalued, that interest rates have greater risk to the upside at current historic low yields, and that economic fears are subsiding. Our End of the PC Era theme detracted from performance by 1.7%. This theme reflects our view that the marketplace has become saturated with legacy computers and software and that the new technology era is likely to benefit consumer-driven web-based solutions and service providers. Our short Margin Pressures in Non-cyclical Businesses theme detracted from performance by 0.4%. This theme suggests that the Federal Reserve’s continued loose policy, combined with a recovery in the developed world economies, will give rise to pressures on wages and input costs.
During the reporting period, which individual stocks made the strongest contributions to the Fund’s absolute performance and which stocks detracted the most?
During 2013, the three strongest individual positive contributors to the Fund’s absolute performance were long holdings in commercial banking company Bank of Ireland, Internet software & services company Facebook, and Germany-based auto components company Continental AG.
Over the same period, the weakest contributions to the Fund’s absolute performance came from short holdings in China-based Internet software & services company Qihoo 360 Technology
| 1. | See footnote on page 11 for more information on the S&P 500® Index. |
| 2. | See footnote on page 11 for more information on Lipper Inc. |
| 3. | Credit default swaps are contracts where one party makes periodic payments to another party in exchange for the right to receive from that other party a payment equal to the par or other agreed-upon value of a particular debt obligation in the event of a default by the issuer of that debt obligation. |
| 14 | MainStay Marketfield Fund |
Co., Ltd., Germany-based insurance company Allianz SE, and U.K.-based financial services company Aberdeen Asset Management PLC.
Did the Fund make any significant purchases or sales during the reporting period?
During the reporting period, we initiated long exposure to Japan of 6%, which includes individual equities as well as Tokyo Price Index futures. We increased our long investment in the Bank of Ireland by purchasing Bank of Ireland Trust—Preferred Security 10.24%.
During the reporting period, we decreased our short emerging-market bond holding from 5% to 2%, and we covered our equity short holdings in India and Brazil.
How did the Fund’s sector weightings change during the reporting period?
Industrials ended 2012 at 32% of net assets compared to 15.2% at the end of 2013—a decrease of 16.8 percentage
points. Consumer discretionary ended 2012 at 16.5% of net assets compared to 10.7% at the end of 2013—a decrease of 5.8 percentage points. Materials ended 2012 at 7% of net assets compared to 14.2% at the end of 2013—an increase of 7.2 percentage points. Energy ended 2012 at 2% compared to 5.6% at the end of 2013—an increase of 3.6 percentage points. Financials ended 2012 at 2.6% compared to 9.8% at the end of 2013—an increase of 7.2 percentage points.
How was the Fund positioned at the end of the reporting period?
As of December 31, 2013, the equity portion of the Fund was 80% long and 30% short. The net equity exposure was long 50%.4 As of the same date, the futures portion of the Fund was 2% long and 14% short. The net futures exposure was short 12%.
| 4. | See Portfolio of Investments beginning on page 16 for information on specific holdings. |
The opinions expressed are those of the portfolio manager as of the date of this report and are subject to change. There is no guarantee that any forecasts made will come to pass. This material does not constitute investment advice and is not intended as an endorsement of any specific investment.
| mainstayinvestments.com | 15 |
Portfolio of Investments December 31, 2013
| Shares | Value | |||||||
| Common Stocks 70.9%† | ||||||||
Aerospace & Defense 1.0% |
| |||||||
Precision Castparts Corp. (a) | 702,059 | $ | 189,064,489 | |||||
|
| |||||||
Auto Components 1.6% | ||||||||
¨Continental A.G. | 1,134,505 | 248,781,608 | ||||||
ElringKlinger A.G. | 1,658,747 | 67,476,883 | ||||||
|
| |||||||
| 316,258,491 | ||||||||
|
| |||||||
Automobiles 2.8% |
| |||||||
Daimler A.G. | 2,329,310 | 201,558,666 | ||||||
Fiat Industrial S.p.A. (b) | 22,831,250 | 186,726,126 | ||||||
Ford Motor Co. | 9,974,810 | 153,911,318 | ||||||
|
| |||||||
| 542,196,110 | ||||||||
|
| |||||||
Building Products 1.0% |
| |||||||
Geberit A.G. | 614,769 | 186,418,939 | ||||||
|
| |||||||
Capital Markets 1.0% |
| |||||||
Daiwa Securities Group, Inc. | 19,027,959 | 189,719,466 | ||||||
|
| |||||||
Chemicals 3.9% |
| |||||||
Air Liquide S.A. | 1,318,450 | 186,457,698 | ||||||
¨BASF S.E. Corp. | 2,246,711 | 239,506,008 | ||||||
Potash Corporation of Saskatchewan, Inc. | 5,854,319 | 192,958,354 | ||||||
Sherwin-Williams Co. (The) (a) | 752,886 | 138,154,581 | ||||||
|
| |||||||
| 757,076,641 | ||||||||
|
| |||||||
Commercial Banks 11.7% |
| |||||||
Banco Bilbao Vizcaya Argentaria S.A. | 18,026,644 | 221,903,625 | ||||||
¨Bank of Ireland (b) | 1,024,050,774 | 355,014,073 | ||||||
¨Bank of Ireland, Sponsored ADR (b) | 3,389,402 | 48,841,283 | ||||||
Barclays PLC | 42,077,723 | 189,490,957 | ||||||
BB&T Corp. (a) | 5,103,628 | 190,467,397 | ||||||
CIT Group, Inc. (a) | 3,683,443 | 192,017,884 | ||||||
Fifth Third Bancorp (a) | 8,969,833 | 188,635,588 | ||||||
Grupo Financiero Banorte S.A.B. de C.V. Class O | 22,823,374 | 159,666,601 | ||||||
Lloyds Banking Group PLC (b) | 158,095,702 | 206,506,707 | ||||||
¨Sumitomo Mitsui Financial Group, Inc. | 5,571,889 | 286,768,952 | ||||||
UniCredit S.p.A. | 30,205,205 | 223,556,655 | ||||||
|
| |||||||
| 2,262,869,722 | ||||||||
|
| |||||||
Commercial Services & Supplies 0.5% |
| |||||||
Bilfinger S.E. | 893,532 | 100,219,237 | ||||||
|
| |||||||
Construction & Engineering 0.8% |
| |||||||
KBR, Inc. | 4,656,743 | 148,503,534 | ||||||
|
| |||||||
| Shares | Value | |||||||
Construction Materials 5.1% |
| |||||||
Buzzi Unicem S.p.A. | 10,458,073 | $ | 188,615,726 | |||||
CRH PLC | 7,840,070 | 197,727,484 | ||||||
Eagle Materials, Inc. (a) | 2,607,095 | 201,867,366 | ||||||
HeidelbergCement A.G. | 2,266,520 | 171,960,465 | ||||||
Taiheiyo Cement Corp. | 58,233,757 | 223,401,745 | ||||||
|
| |||||||
| 983,572,786 | ||||||||
|
| |||||||
Consumer Finance 1.0% |
| |||||||
Discover Financial Services | 3,485,591 | 195,018,816 | ||||||
|
| |||||||
Diversified Financial Services 0.9% |
| |||||||
CME Group, Inc. | 2,248,889 | 176,447,831 | ||||||
|
| |||||||
Electrical Equipment 2.3% |
| |||||||
¨ABB, Ltd. (b) | 9,618,365 | 253,168,780 | ||||||
Emerson Electric Co. | 2,709,197 | 190,131,445 | ||||||
|
| |||||||
| 443,300,225 | ||||||||
|
| |||||||
Energy Equipment & Services 2.2% |
| |||||||
Baker Hughes, Inc. | 3,459,321 | 191,162,078 | ||||||
Schlumberger, Ltd. (a) | 2,642,160 | 238,085,038 | ||||||
|
| |||||||
| 429,247,116 | ||||||||
|
| |||||||
Food & Staples Retailing 1.2% |
| |||||||
Costco Wholesale Corp. (a) | 1,893,207 | 225,310,565 | ||||||
|
| |||||||
Household Durables 5.9% |
| |||||||
D.R. Horton, Inc. (a) | 8,957,153 | 199,923,655 | ||||||
Mohawk Industries, Inc. (a)(b) | 1,317,929 | 196,239,628 | ||||||
PulteGroup, Inc. (a) | 9,994,004 | 203,577,862 | ||||||
Ryland Group, Inc. (The) (a) | 3,298,025 | 143,167,265 | ||||||
Sekisui House, Ltd. | 14,453,974 | 201,759,964 | ||||||
Toll Brothers, Inc. (a)(b) | 5,261,767 | 194,685,379 | ||||||
|
| |||||||
| 1,139,353,753 | ||||||||
|
| |||||||
Industrial Conglomerates 2.0% |
| |||||||
3M Co. (a) | 1,377,046 | 193,130,701 | ||||||
General Electric Co. (a) | 6,888,229 | 193,077,059 | ||||||
|
| |||||||
| 386,207,760 | ||||||||
|
| |||||||
Insurance 1.0% |
| |||||||
Assicurazioni Generali S.p.A. | 8,221,728 | 193,411,705 | ||||||
|
| |||||||
Internet & Catalog Retail 0.9% |
| |||||||
Amazon.com, Inc. (a)(b) | 462,682 | 184,512,955 | ||||||
|
| |||||||
Internet Software & Services 1.4% |
| |||||||
¨Facebook, Inc. Class A (a)(b) | 4,993,300 | 272,933,778 | ||||||
|
| |||||||
| † | Percentages indicated are based on Fund net assets. |
| ¨ | Among the Fund’s 10 largest holdings, as of December 31, 2013, excluding short-term investment. May be subject to change daily. |
| 16 | MainStay Marketfield Fund | The notes to the financial statements are an integral part of, and should be read in conjunction with, the financial statements. |
| Shares | Value | |||||||
| Common Stocks (continued) | ||||||||
IT Services 1.0% |
| |||||||
Amadeus IT Holding S.A. Class A | 4,572,000 | $ | 195,641,041 | |||||
|
| |||||||
Machinery 4.2% |
| |||||||
Cummins, Inc. (a) | 1,356,303 | 191,198,034 | ||||||
Deere & Co. (a) | 2,087,025 | 190,607,993 | ||||||
Ingersoll-Rand PLC (a) | 3,060,997 | 188,557,415 | ||||||
Joy Global, Inc. | 3,396,266 | 198,647,598 | ||||||
Scania AB Class B | 2,356,873 | 46,134,520 | ||||||
|
| |||||||
| 815,145,560 | ||||||||
|
| |||||||
Metals & Mining 4.8% |
| |||||||
¨Alcoa, Inc. (a) | 22,570,589 | 239,925,361 | ||||||
Freeport-McMoRan Copper & Gold, Inc. | 5,926,689 | 223,673,243 | ||||||
Steel Dynamics, Inc. (a) | 10,139,391 | 198,123,700 | ||||||
Teck Resources, Ltd. Class B (a) | 7,552,603 | 196,443,204 | ||||||
Walter Energy, Inc. | 4,932,820 | 82,032,797 | ||||||
|
| |||||||
| 940,198,305 | ||||||||
|
| |||||||
Oil, Gas & Consumable Fuels 3.4% |
| |||||||
Alpha Natural Resources, Inc. (a)(b) | 10,933,019 | 78,061,756 | ||||||
Apache Corp. (a) | 2,281,988 | 196,114,049 | ||||||
Chesapeake Energy Corp. (a) | 7,545,887 | 204,795,373 | ||||||
Devon Energy Corp. | 3,049,045 | 188,644,414 | ||||||
|
| |||||||
| 667,615,592 | ||||||||
|
| |||||||
Real Estate Investment Trusts 0.6% |
| |||||||
Green REIT PLC (b) | 28,477,636 | 56,492,752 | ||||||
Hibernia REIT PLC (b) | 34,883,746 | 56,147,771 | ||||||
|
| |||||||
| 112,640,523 | ||||||||
|
| |||||||
Real Estate Management & Development 1.2% |
| |||||||
Deutsche Wohnen A.G. | 5,741,449 | 110,855,557 | ||||||
St. Joe Co. (The) (b) | 6,130,622 | 117,646,636 | ||||||
|
| |||||||
| 228,502,193 | ||||||||
|
| |||||||
Road & Rail 1.0% |
| |||||||
DSV A/S | 5,695,640 | 186,747,461 | ||||||
|
| |||||||
Semiconductors & Semiconductor Equipment 1.0% |
| |||||||
Intel Corp. | 7,448,529 | 193,363,813 | ||||||
|
| |||||||
Software 0.9% |
| |||||||
Splunk, Inc. (b) | 2,667,543 | 183,180,178 | ||||||
|
| |||||||
Specialty Retail 2.0% |
| |||||||
Home Depot, Inc. (The) (a) | 2,341,800 | 192,823,812 | ||||||
Tractor Supply Co. | 2,476,634 | 192,137,266 | ||||||
|
| |||||||
| 384,961,078 | ||||||||
|
| |||||||
Trading Companies & Distributors 1.7% |
| |||||||
Beacon Roofing Supply, Inc. (a)(b) | 3,554,595 | 143,179,087 | ||||||
Wolseley PLC | 3,361,718 | 190,664,154 | ||||||
|
| |||||||
| 333,843,241 | ||||||||
|
| |||||||
| Shares | Value | |||||||
Transportation Infrastructure 0.9% |
| |||||||
Abertis Infraestructuras S.A. | 8,215,980 | $ | 182,538,904 | |||||
|
| |||||||
Total Common Stocks | 13,746,021,808 | |||||||
|
| |||||||
| Exchange-Traded Funds 7.3% (d) | ||||||||
¨iShares Dow Jones US Home Construction Index Fund (a) | 9,656,478 | 239,866,913 | ||||||
iShares MSCI Italy Index Fund | 13,068,013 | 203,730,323 | ||||||
iShares MSCI Japan Index Fund | 15,224,466 | 184,672,773 | ||||||
¨iShares MSCI Mexico Investable Market Index Fund (a) | 4,200,747 | 285,650,796 | ||||||
SPDR S&P Homebuilders (a) | 5,808,244 | 193,414,525 | ||||||
¨SPDR S&P Regional Banking (a) | 7,516,275 | 305,235,928 | ||||||
|
| |||||||
Total Exchange-Traded Funds | 1,412,571,258 | |||||||
|
| |||||||
| Preferred Stocks 1.6% | ||||||||
Chemicals 0.4% |
| |||||||
Fuchs Petrolub SE 1.81% | 840,221 | 82,114,532 | ||||||
|
| |||||||
Commercial Banks 1.2% | ||||||||
¨Bank of Ireland Trust—Preferred Security 10.24% (c) | 168,400,000 | 243,946,166 | ||||||
|
| |||||||
Total Preferred Stocks | 326,060,698 | |||||||
|
| |||||||
| Notional Amount | ||||||||
| Purchased Options 0.7% | ||||||||
Purchased Call Options 0.4% |
| |||||||
CNY/USD | ||||||||
Strike Price $6.321 | 1,401,000,000 | 888,234 | ||||||
Strike Price $6.722 | 1,401,000,000 | 1,340,757 | ||||||
| Number of Contracts | ||||||||
iShares Russell 2000 Index ETF | ||||||||
Strike Price $111.00 | 70,016 | 34,097,792 | ||||||
Strike Price $112.00 | 94,710 | 36,368,640 | ||||||
Vanguard FTSE Emerging Markets Strike Price $43.00 | 200,000 | 2,000,000 | ||||||
|
| |||||||
Total Purchased Call Options | 74,695,423 | |||||||
|
| |||||||
| The notes to the financial statements are an integral part of, and should be read in conjunction with, the financial statements. | mainstayinvestments.com | 17 |
Portfolio of Investments December 31, 2013 (continued)
| Notional Amount | Values | |||||||
| Purchased Options (continued) | ||||||||
Purchased Put Options 0.3% |
| |||||||
EUR/USD | 1,041,631,468 | $ | 19,780,742 | |||||
| Number of Contracts | ||||||||
30 Year United States Treasury Bond Futures | 28,918 | 40,665,938 | ||||||
iShares China Large Cap ETF | 94,470 | 2,078,340 | ||||||
iShares MSCI Emerging Markets | 236,441 | 8,511,876 | ||||||
|
| |||||||
Total Purchased Put Options | 71,036,896 | |||||||
|
| |||||||
Total Purchased Options (Cost $197,618,612) | 145,732,319 | |||||||
|
| |||||||
| Shares | ||||||||
| Short-Term Investment 14.2% | ||||||||
Money Market Fund 14.2% |
| |||||||
State Street Institutional Treasury Money Market Fund | 2,750,000,000 | 2,750,000,000 | ||||||
|
| |||||||
Total Short-Term Investment | 2,750,000,000 | |||||||
|
| |||||||
Total Investments, Before Investments Sold Short | 94.7 | % | 18,380,386,083 | |||||
|
| |||||||
| Common Stocks Sold Short (16.8%) | ||||||||
Beverages (1.2%) |
| |||||||
Coca-Cola Co. (The) | (5,602,494 | ) | (231,439,027 | ) | ||||
|
| |||||||
Capital Markets (3.3%) |
| |||||||
Aberdeen Asset Management PLC | (25,060,854 | ) | (207,497,595 | ) | ||||
Franklin Resources, Inc. | (3,122,898 | ) | (180,284,901 | ) | ||||
Invesco, Ltd. | (4,795,574 | ) | (174,558,894 | ) | ||||
Legg Mason, Inc. | (1,743,408 | ) | (75,803,380 | ) | ||||
|
| |||||||
| (638,144,770 | ) | |||||||
|
| |||||||
Diversified Financial Services (1.6%) |
| |||||||
JPMorgan Chase & Co. | (5,376,264 | ) | (314,403,919 | ) | ||||
|
| |||||||
| Shares | Values | |||||||
Food Products (3.3%) |
| |||||||
Danone | (3,222,286 | ) | $ | (231,929,162 | ) | |||
Kellogg Co. | (3,511,494 | ) | (214,446,938 | ) | ||||
Nestle S.A. | (2,613,789 | ) | (191,335,039 | ) | ||||
|
| |||||||
| (637,711,139 | ) | |||||||
|
| |||||||
Hotels, Restaurants & Leisure (1.2%) |
| |||||||
McDonald’s Corp. | (2,326,023 | ) | (225,694,012 | ) | ||||
|
| |||||||
Insurance (2.4%) |
| |||||||
Allianz SE | (2,623,510 | ) | (470,454,144 | ) | ||||
|
| |||||||
IT Services (1.0%) |
| |||||||
International Business Machines Corp. | (989,517 | ) | (185,603,703 | ) | ||||
|
| |||||||
Multiline Retail (1.0%) |
| |||||||
Target Corp. | (3,234,810 | ) | (204,666,429 | ) | ||||
|
| |||||||
Software (1.8%) |
| |||||||
Microsoft Corp. | (3,280,207 | ) | (122,778,148 | ) | ||||
Oracle Corp. | (2,250,814 | ) | (86,116,144 | ) | ||||
SAP A.G., Sponsored ADR | (1,699,966 | ) | (148,135,037 | ) | ||||
|
| |||||||
| (357,029,329 | ) | |||||||
|
| |||||||
Total Common Stocks Sold Short | (3,265,146,472 | ) | ||||||
|
| |||||||
| Exchange-Traded Funds Sold Short (12.6%) (d) | ||||||||
iShares iBoxx Investment Grade Corporate Bond | (754,366 | ) | (86,156,141 | ) | ||||
iShares JP Morgan USD Emerging Markets Bond | (3,872,623 | ) | (418,862,904 | ) | ||||
Market Vectors Emerging Markets Local Currency Bond | (759,501 | ) | (17,886,249 | ) | ||||
Utilities Select Sector SPDR Fund | (14,175,100 | ) | (538,228,547 | ) | ||||
Vanguard FTSE Emerging Markets | (33,602,717 | ) | (1,382,415,777 | ) | ||||
|
| |||||||
Total Exchange-Traded Funds Sold Short | (2,443,549,618 | ) | ||||||
|
| |||||||
Total Investments Sold Short | (29.4 | )% | (5,708,696,090 | ) | ||||
|
| |||||||
Total Investments, Net of Investments Sold Short | 65.3 | 12,671,689,993 | ||||||
Other Assets, Less Liabilities | 34.7 | 6,724,555,086 | ||||||
Net Assets | 100.0 | % | $ | 19,396,245,079 | ||||
| 18 | MainStay Marketfield Fund | The notes to the financial statements are an integral part of, and should be read in conjunction with, the financial statements. |
| Contracts Long | Unrealized Appreciation (Depreciation) (g) | |||||||
| Futures Contracts 0.1% | ||||||||
Futures Contracts Long | ||||||||
Topix Index March 2014 (f) | 2,933 | $ | 13,975,741 | |||||
|
| |||||||
Total Futures Contracts Long | 13,975,741 | |||||||
|
| |||||||
Futures Contracts Short | ||||||||
CAC 40 Index 10 Euro | (6,335 | ) | (16,555,091 | ) | ||||
Euro-Bund | (5,504 | ) | 16,278,946 | |||||
Euro-OAT | (5,864 | ) | 6,894,104 | |||||
United States Treasury Bond | (1,998 | ) | 5,502,432 | |||||
|
| |||||||
Total Futures Contracts Short | 12,120,391 | |||||||
|
| |||||||
Total Futures Contracts | $ | 26,096,132 | ||||||
| (a) | Security, or a portion thereof, is maintained in a segregated account at the Fund’s custodian as collateral for securities Sold Short (See Note 2(J)). |
| (b) | Non-income producing security. |
| (c) | May be sold to institutional investors only under Rule 144A or securities offered pursuant to Section 4(a)(2) of the Securities Act of 1933, as amended. |
| (d) | Exchange-Traded Fund—An investment vehicle that represents a basket of securities that is traded on an exchange. |
| (e) | As of December 31, 2013, cash in the amount of $6,284,632,232 is on deposit with broker for short sale transactions. |
| (f) | As of December 31, 2013, cash in the amount of $48,953,770 is on deposit with broker for futures transactions. |
| (g) | Represents the difference between the value of the contracts at the time they were opened and the value as of December 31, 2013. |
| (h) | As of December 31, 2013, cost is $15,842,520,296 for federal income tax purposes and net unrealized appreciation is as follows: |
Gross unrealized appreciation | $ | 2,670,043,946 | ||
Gross unrealized depreciation | (132,178,159 | ) | ||
|
| |||
Net unrealized appreciation | $ | 2,537,865,787 | ||
|
|
The following abbreviations are used in the above portfolio:
ADR—American Depositary Receipt
CNY—Chinese Yuan
EUR—Euro
ETF—Exchange-Traded Fund
SPDR—Standard & Poor’s Depositary Receipt
USD—United States Dollar
At December 31, 2013, the Fund held the following OTC credit default swap contracts:
Reference Entity | Counterparty | Termination Date | Buy/Sell Protection1 | Notional Amount (000)2 | (Pay)/ Receive Fixed Rate3 | Upfront Premiums Received/ (Paid) | Value | Unrealized Appreciation/ Depreciation4 | ||||||||||||||||||||||||
Federal Republic of Brazil | Citigroup | 3/20/2019 | Buy | $ | 945,424 | 1.00 | % | $ | (42,299,679 | ) | $ | 42,030,051 | $ | (269,628 | ) | |||||||||||||||||
Republic of South Africa | Citigroup | 3/20/2019 | Buy | $ | 236,356 | 1.00 | % | $ | (12,070,782 | ) | $ | 11,729,036 | $ | (341,746 | ) | |||||||||||||||||
| $ | 53,759,087 | $ | (611,374 | ) | ||||||||||||||||||||||||||||
| 1. | Buy—Fund pays premium and buys credit protection. If a credit event occurs, as defined under the terms of that particular swap agreement, the Fund will either (i) receive from the seller of protection an amount equal to the notional amount of the swap and deliver the referenced obligation or underlying securities comprising the referenced index or (ii) receive a net settlement amount in the form of cash or securities equal to the notional amount of the swap less the recovery value of the referenced obligation or underlying securities comprising the referenced index. |
| Sell—Fund receives premium and sells credit protection. If a credit event occurs, as defined under the terms of that particular swap agreement, the Fund will either (i) pay to the buyer of protection an amount equal to the notional amount of the swap and take delivery of the referenced obligation or underlying securities comprising the referenced index or (ii) pay a net settlement amount in the form of cash or securities equal to the notional amount of the swap less the recovery value of the referenced obligation or underlying securities comprising the referenced index. |
| 2. | The maximum potential amount the Fund could be required to pay as a seller of credit protection or receive as a buyer of credit protection if a credit event occurs as defined under the terms of that particular swap contract. |
| 3. | The annual fixed rate represents the interest received by the Fund (as a seller of protection) or paid by the Fund (as a buyer of protection) annually on the notional amount of the credit default swap contract. |
| 4. | Represents the difference between the value of the credit default swap contracts at the time they were opened and the value at December 31, 2013. |
| The notes to the financial statements are an integral part of, and should be read in conjunction with, the financial statements. | mainstayinvestments.com | 19 |
Portfolio of Investments December 31, 2013 (continued)
The following is a summary of the fair valuations according to the inputs used as of December 31, 2013, for valuing the Fund’s assets and liabilities.
Asset Valuation Inputs
Description | Quoted Prices in Active Markets for Identical Assets (Level 1) | Significant Other Observable Inputs (Level 2) | Significant Unobservable Inputs (Level 3) | Total | ||||||||||||
| Investments in Securities (a) | ||||||||||||||||
| Common Stocks | $ | 13,746,021,808 | $ | — | $ | — | $ | 13,746,021,808 | ||||||||
| Exchange-Traded Funds | 1,412,571,258 | — | — | 1,412,571,258 | ||||||||||||
| Preferred Stocks | 82,114,532 | 243,946,166 | — | 326,060,698 | ||||||||||||
| Short-Term Investment | ||||||||||||||||
Money Market Fund | 2,750,000,000 | — | — | 2,750,000,000 | ||||||||||||
|
|
|
|
|
|
|
| |||||||||
| Total Investments in Securities | 17,990,707,598 | 243,946,166 | — | 18,234,653,764 | ||||||||||||
|
|
|
|
|
|
|
| |||||||||
| Other Financial Instruments | ||||||||||||||||
Futures Contracts Long (b) | 13,975,741 | — | — | 13,975,741 | ||||||||||||
Futures Contracts Short (b) | 28,675,482 | — | — | 28,675,482 | ||||||||||||
Purchased Call Options | 74,695,423 | — | — | 74,695,423 | ||||||||||||
Purchased Put Options | 71,036,896 | — | — | 71,036,896 | ||||||||||||
|
|
|
|
|
|
|
| |||||||||
| Total Other Financial Instruments | 188,383,542 | — | — | 188,383,542 | ||||||||||||
|
|
|
|
|
|
|
| |||||||||
| Total Investments in Securities and Other Financial Instruments | $ | 18,179,091,140 | $ | 243,946,166 | $ | — | $ | 18,423,037,306 | ||||||||
|
|
|
|
|
|
|
| |||||||||
Liability Valuation Inputs
Description | Quoted Prices in Active Markets for Identical (Level 1) | Significant Other Observable Inputs (Level 2) | Significant Unobservable Inputs (Level 3) | Total | ||||||||||||
| Investments in Securities Sold Short (a) | ||||||||||||||||
| Common Stocks Sold Short | $ | (3,265,146,472 | ) | $ | — | $ | — | $ | (3,265,146,472 | ) | ||||||
| Exchange-Traded Funds Sold Short | (2,443,549,618 | ) | — | — | (2,443,549,618 | ) | ||||||||||
|
|
|
|
|
|
|
| |||||||||
| Total Investments in Securities Sold Short | (5,708,696,090 | ) | — | — | (5,708,696,090 | ) | ||||||||||
|
|
|
|
|
|
|
| |||||||||
| Other Financial Instruments | ||||||||||||||||
Futures Contracts Short (b) | (16,555,091 | ) | — | — | (16,555,091 | ) | ||||||||||
Credit Default Swap Contracts (b) | — | (611,374 | ) | — | (611,374 | ) | ||||||||||
|
|
|
|
|
|
|
| |||||||||
| Total Other Financial Instruments | (16,555,091 | ) | (611,374 | ) | — | (17,166,465 | ) | |||||||||
|
|
|
|
|
|
|
| |||||||||
| Total Investments in Securities Sold Short and Other Financial Instruments | $ | (5,725,251,181 | ) | $ | (611,374 | ) | $ | — | $ | (5,725,862,555 | ) | |||||
|
|
|
|
|
|
|
| |||||||||
| (a) | For a complete listing of investments and their industries, see the Portfolio of Investments. |
| (b) | The value listed for these securities reflects unrealized appreciation (depreciation) as shown on the Portfolio of Investments. |
The Fund recognizes transfers between the levels as of the beginning of the period.
As of December 31, 2013, certain foreign securities with a market value of $909,364,735 were transferred from Level 2 to Level 1 as the prices of these securities were based on unadjusted quoted prices compared with the prior year prices which were adjusted for events after the market close. The December 31, 2012 prices were adjusted by applying factors provided by a third party vendor in accordance with the Fund’s policies and procedures. Fair values as of December 31,2013 for these securities were based on quoted prices in active markets for identical investments. (See Note 2)
As of December 31, 2013, the Portfolio did not hold any investments with significant unobservable inputs (Level 3). (See Note 2)
| 20 | MainStay Marketfield Fund | The notes to the financial statements are an integral part of, and should be read in conjunction with, the financial statements. |
Statement of Assets and Liabilities as of December 31, 2013
| Assets | ||||
Investment in securities, at value | $ | 18,380,386,083 | ||
Cash collateral on deposit at broker | 6,333,586,002 | |||
Cash | 815,870,192 | |||
Cash denominated in foreign currencies | 60,424,498 | |||
Receivables: | ||||
Fund shares sold | 203,583,162 | |||
Investment securities sold | 59,671,408 | |||
Dividends and interest | 38,793,648 | |||
Premiums paid for swap contracts | 54,370,461 | |||
Other assets | 863,219 | |||
|
| |||
Total assets | 25,947,548,673 | |||
|
| |||
| Liabilities | ||||
Investments sold short (proceeds $5,427,910,964) | 5,708,696,090 | |||
Payables: | ||||
Investment securities purchased | 787,442,545 | |||
Manager (See Note 3) | 21,955,906 | |||
Fund shares redeemed | 18,272,168 | |||
Dividends on investments sold short | 7,925,792 | |||
Transfer agent (See Note 3) | 2,440,566 | |||
NYLIFE Distributors (See Note 3) | 1,628,391 | |||
Variation margin on futures contracts | 860,872 | |||
Shareholder communication | 196,824 | |||
Custodian | 118,632 | |||
Broker fees and charges on short sales | 103,558 | |||
Professional fees | 93,856 | |||
Trustees | 18,493 | |||
Unrealized depreciation on swap contracts | 611,374 | |||
Accrued expenses | 938,527 | |||
|
| |||
Total liabilities | 6,551,303,594 | |||
|
| |||
Net assets | $ | 19,396,245,079 | ||
|
| |||
| Composition of Net Assets | ||||
Shares of beneficial interest outstanding (par value of $.001 per share) unlimited number of shares authorized | $ | 1,048,858 | ||
Additional paid-in capital | 17,317,277,217 | |||
|
| |||
| 17,318,326,075 | ||||
Net investment loss | (22,363,209 | ) | ||
Accumulated net realized gain (loss) on investments, investments sold short, futures transactions, written options, swap transactions and foreign currency transactions | (219,184,224 | ) | ||
Net unrealized appreciation (depreciation) on investments, futures contracts, written options and swap contracts | 2,600,162,224 | |||
Net unrealized appreciation (depreciation) on investments sold short | (280,785,126 | ) | ||
Net unrealized appreciation (depreciation) on translation of other assets and liabilities in foreign currencies | 89,339 | |||
|
| |||
Net assets | $ | 19,396,245,079 | ||
|
| |||
Investor Class | ||||
Net assets applicable to outstanding shares | $ | 11,912,717 | ||
|
| |||
Shares of beneficial interest outstanding | 644,948 | |||
|
| |||
Net asset value per share outstanding | $ | 18.47 | ||
Maximum sales charge (5.50% of offering price) | 1.07 | |||
|
| |||
Maximum offering price per share outstanding | $ | 19.54 | ||
|
| |||
Class A | ||||
Net assets applicable to outstanding shares | $ | 1,718,300,955 | ||
|
| |||
Shares of beneficial interest outstanding | 93,037,455 | |||
|
| |||
Net asset value per share outstanding | $ | 18.47 | ||
Maximum sales charge (5.50% of offering price) | 1.07 | |||
|
| |||
Maximum offering price per share outstanding | $ | 19.54 | ||
|
| |||
Class C | ||||
Net assets applicable to outstanding shares | $ | 1,582,395,750 | ||
|
| |||
Shares of beneficial interest outstanding | 86,461,575 | |||
|
| |||
Net asset value and offering price per share outstanding | $ | 18.30 | ||
|
| |||
Class I | ||||
Net assets applicable to outstanding shares | $ | 15,867,199,669 | ||
|
| |||
Shares of beneficial interest outstanding | 857,018,964 | |||
|
| |||
Net asset value and offering price per share outstanding | $ | 18.51 | ||
|
| |||
Class R2 | ||||
Net assets applicable to outstanding shares | $ | 17,233,788 | ||
|
| |||
Shares of beneficial interest outstanding | 934,547 | |||
|
| |||
Net asset value and offering price per share outstanding | $ | 18.44 | ||
|
| |||
Class R6 | ||||
Net assets applicable to outstanding shares | $ | 1,956,925 | ||
|
| |||
Shares of beneficial interest outstanding | 105,636 | |||
|
| |||
Net asset value and offering price per share outstanding | $ | 18.53 | ||
|
| |||
Class P | ||||
Net assets applicable to outstanding shares | $ | 197,245,275 | ||
|
| |||
Shares of beneficial interest outstanding | 10,654,789 | |||
|
| |||
Net asset value and offering price per share outstanding | $ | 18.51 | ||
|
|
| The notes to the financial statements are an integral part of, and should be read in conjunction with, the financial statements. | mainstayinvestments.com | 21 |
Statement of Operations for the year ended December 31, 2013
| Investment Income (Loss) | ||||
Income | ||||
Dividends (a) | $ | 142,768,377 | ||
Interest | 1,349,624 | |||
|
| |||
Total income | 144,118,001 | |||
|
| |||
Expenses | ||||
Manager (See Note 3) | 158,325,336 | |||
Dividends on investments sold short | 90,445,958 | |||
Broker fees and charges on short sales | 31,295,788 | |||
Transfer agent (See Note 3) | 10,563,638 | |||
Distribution/Service—Investor Class (See Note 3) | 15,055 | |||
Distribution/Service—Class A (See Note 3) | 2,135,437 | |||
Distribution/Service—Class C (See Note 3) | 7,754,420 | |||
Distribution/Service—Class R2 (See Note 3) | 14,594 | |||
Registration | 1,805,469 | |||
Shareholder communication | 725,395 | |||
Professional fees | 537,044 | |||
Custodian | 484,304 | |||
Trustees | 205,265 | |||
Shareholder service—Class R2 (See Note 3) | 5,838 | |||
Miscellaneous | 194,889 | |||
|
| |||
Total expenses | 304,508,430 | |||
|
| |||
Net investment income (loss) | (160,390,429 | ) | ||
|
| |||
| Realized and Unrealized Gain (Loss) on Investments, Futures Contracts, Written Options, Swap Contracts and Foreign Currency Transactions | ||||
Net realized gain (loss) on: | ||||
Security transactions | 57,006,772 | |||
Investments sold short | (175,104,607 | ) | ||
Futures transactions | (31,605,212 | ) | ||
Written option transactions | 6,449,973 | |||
Swap transactions | (13,072,498 | ) | ||
Foreign currency transactions | 624,209 | |||
|
| |||
Net realized gain (loss) on investments, investments sold short, futures transactions, written options transactions, swap transactions and foreign currency transactions | (155,701,363 | ) | ||
|
| |||
Net change in unrealized appreciation (depreciation) on: | ||||
Investments | 2,136,014,728 | |||
Investments sold short | (230,908,207 | ) | ||
Futures contracts | 26,096,132 | |||
Written option contracts | (948,324 | ) | ||
Swap contracts | (611,374 | ) | ||
Translation of other assets and liabilities in foreign currencies | 83,490 | |||
|
| |||
Net change in unrealized appreciation (depreciation) on investments, investments sold short, futures contracts, written options, swap contracts and foreign currency transactions | 1,929,726,445 | |||
|
| |||
Net realized and unrealized gain (loss) on investments, investments sold short, futures transactions, written options, swap transactions and foreign currency transactions | 1,774,025,082 | |||
|
| |||
Net increase (decrease) in net assets resulting from operations | $ | 1,613,634,653 | ||
|
| |||
| (a) | Dividends recorded net of foreign withholding taxes in the amount of $5,974,508. |
| 22 | MainStay Marketfield Fund | The notes to the financial statements are an integral part of, and should be read in conjunction with, the financial statements. |
Statements of Changes in Net Assets
for the years ended December 31, 2013 and December 31, 2012
| 2013 | 2012 | |||||||
| Increase (Decrease) in Net Assets | ||||||||
Operations: | ||||||||
Net investment income (loss) | $ | (160,390,429 | ) | $ | (27,714,619 | ) | ||
Net realized gain (loss) on investments, investments sold short, futures transactions, written option transactions, swap transactions and foreign currency transactions | (155,701,363 | ) | (23,685,780 | ) | ||||
Net change in unrealized appreciation (depreciation) on investments, investments sold short, futures contracts, written options, swap contracts and foreign currency transactions | 1,929,726,445 | 301,411,597 | ||||||
|
| |||||||
Net increase (decrease) in net assets resulting from operations | 1,613,634,653 | 250,011,198 | ||||||
|
| |||||||
Dividends and distributions to shareholders: | ||||||||
From net investment income: | ||||||||
Investor Class | (1,320 | ) | — | |||||
Class A | (185,252 | ) | — | |||||
Class C | (172,240 | ) | — | |||||
Class I | (1,727,880 | ) | — | |||||
Class R2 | (1,849 | ) | — | |||||
Class R6 | (256 | ) | — | |||||
Class P | (20,583 | ) | — | |||||
|
| |||||||
| (2,109,380 | ) | — | ||||||
|
| |||||||
From net realized gain on investment: | ||||||||
Investor Class | — | (1,882 | ) | |||||
Class A | — | (407,905 | ) | |||||
Class C | — | (366,143 | ) | |||||
Class I | — | (16,701,031 | ) | |||||
Class R2 | — | (114 | ) | |||||
|
| |||||||
| — | (17,477,075 | ) | ||||||
|
| |||||||
Total dividends and distributions to shareholders | (2,109,380 | ) | (17,477,075 | ) | ||||
|
| |||||||
Capital share transactions: | ||||||||
Net proceeds from sale of shares | 15,259,206,171 | 3,627,403,963 | ||||||
Net asset value of shares issued to shareholders in reinvestment of dividends and distributions | 1,639,832 | 13,221,785 | ||||||
Cost of shares redeemed | (1,883,248,334 | ) | (354,820,101 | )(a) | ||||
|
| |||||||
Increase (decrease) in net assets derived from capital share transactions | 13,377,597,669 | 3,285,805,647 | ||||||
|
| |||||||
Net increase (decrease) in net assets | 14,989,122,942 | 3,518,339,770 | ||||||
| 2013 | 2012 | |||||||
| Net Assets | ||||||||
Beginning of year | $ | 4,407,122,137 | $ | 888,782,367 | ||||
|
| |||||||
End of year | $ | 19,396,245,079 | $ | 4,407,122,137 | ||||
|
| |||||||
Net investment income (loss) at end of year | $ | (22,363,209 | ) | $ | 1,479 | |||
|
| |||||||
| (a) | Cost of shares redeemed net of redemption fees of $140,260 for the year ended December 31, 2012. |
| The notes to the financial statements are an integral part of, and should be read in conjunction with, the financial statements. | mainstayinvestments.com | 23 |
Financial Highlights selected per share data and ratios
| Investor Class | Year ended December 31, 2013 | October 5, | ||||||
Net asset value at beginning of period | $ | 15.84 | $ | 15.80 | † | |||
|
|
|
| |||||
Net investment income (loss) (a) | (0.28 | ) | (0.04 | ) | ||||
Net realized and unrealized gain (loss) on investments | 2.91 | 0.15 | ||||||
Net realized and unrealized gain (loss) on foreign currency transactions | 0.00 | ‡ | — | |||||
|
|
|
| |||||
Total from investment operations | 2.63 | 0.11 | ||||||
|
|
|
| |||||
| Less dividends and distributions: | ||||||||
From net investment income | (0.00 | )‡ | — | |||||
From net realized gain on investments | — | (0.07 | ) | |||||
|
|
|
| |||||
Total dividends and distributions | (0.00 | )‡ | (0.07 | ) | ||||
|
|
|
| |||||
Net asset value at end of period | $ | 18.47 | $ | 15.84 | ||||
|
|
|
| |||||
Total investment return | 16.60 | % (b) | 0.72 | % (c)(d) | ||||
| Ratios of expenses to average net assets (e): | ||||||||
Before waivers/reimbursements of expenses | 2.89 | % | 4.03 | % †† | ||||
Excluding dividends and interest expense on short positions | 1.79 | % | 1.74 | % †† | ||||
After waivers/reimbursements of expenses | 2.89 | % | 4.03 | % †† | ||||
Excluding dividends and interest expense on short positions | 1.79 | % | 1.74 | % †† | ||||
| Ratio of net investment loss to average net assets: | ||||||||
Before waivers/reimbursements of expenses (f) | (1.59 | %) | (1.06 | %)†† | ||||
After waivers/reimbursements of expenses (f) | (1.59 | %) | (1.06 | %)†† | ||||
Short sale expenses | 1.10 | % | 2.29 | % †† | ||||
Portfolio turnover rate | 32 | % | 66 | % | ||||
Net assets at end of period (in 000’s) | $ | 11,913 | $ | 619 | ||||
| ** | Inception date. |
| † | Based on the net asset value of Class I as of October 5, 2012. |
| †† | Annualized. |
| ‡ | Rounds to less than 0.5 cent per share. |
| (a) | Per share data based on average shares outstanding during the period. |
| (b) | Total investment return may reflect adjustments to conform to generally accepted accounting principles. |
| (c) | Total investment return is not annualized. |
| (d) | Total investment return is calculated exclusive of sales charges and assumes the reinvestment of dividends and distributions. |
| (e) | In addition to the fees and expenses which the Fund bears directly, the Fund indirectly bears a pro-rata share of the fees and expenses of the Exchange Traded Funds in which it invests. Such indirect expenses are not included in the above expense ratios. |
| (f) | The net investment loss ratios include dividends and interest expense on short positions. |
| 24 | MainStay Marketfield Fund | The notes to the financial statements are an integral part of, and should be read in conjunction with, the financial statements. |
Financial Highlights selected per share data and ratios
| Class A | Year ended December 31, 2013 | October 5, 2012** through December 31, 2012 | ||||||
Net asset value at beginning of period | $ | 15.84 | $ | 15.80 | † | |||
|
|
|
| |||||
Net investment income (loss) (a) | (0.28 | ) | (0.04 | ) | ||||
Net realized and unrealized gain (loss) on investments | 2.91 | 0.15 | ||||||
Net realized and unrealized gain (loss) on foreign currency transactions | 0.00 | ‡ | — | |||||
|
|
|
| |||||
Total from investment operations | 2.63 | 0.11 | ||||||
|
|
|
| |||||
| Less dividends and distributions: | ||||||||
From net investment income | (0.00 | )‡ | — | |||||
From net realized gain on investments | — | (0.07 | ) | |||||
|
|
|
| |||||
Total dividends and distributions | (0.00 | )‡ | (0.07 | ) | ||||
|
|
|
| |||||
Net asset value at end of period | $ | 18.47 | $ | 15.84 | ||||
|
|
|
| |||||
Total investment return | 16.60 | % (b) | 0.72 | % (c)(d) | ||||
| Ratios of expenses to average net assets (e): | ||||||||
Before waivers/reimbursements of expenses | 2.87 | % | 4.07 | % †† | ||||
Excluding dividends and interest expense on short positions | 1.78 | % | 1.80 | % †† | ||||
After waivers/reimbursements of expenses | 2.87 | % | 4.07 | % †† | ||||
Excluding dividends and interest expense on short positions | 1.78 | % | 1.80 | % †† | ||||
| Ratio of net investment loss to average net assets: | ||||||||
Before waivers/reimbursements of expenses (f) | (1.59 | %) | (1.13 | %)†† | ||||
After waivers/reimbursements of expenses (f) | (1.59 | %) | (1.13 | %)†† | ||||
Short sale expenses | 1.09 | % | 2.27 | % †† | ||||
Portfolio turnover rate | 32 | % | 66 | % | ||||
Net assets at end of period (in 000’s) | $ | 1,718,301 | $ | 137,056 | ||||
| ** | Inception date. |
| † | Based on the net asset value of Class I as of October 5, 2012. |
| †† | Annualized. |
| ‡ | Rounds to less than 0.5 cent per share. |
| (a) | Per share data based on average shares outstanding during the period. |
| (b) | Total investment returns may reflect adjustments to conform to generally accepted accounting principles. |
| (c) | Total investment return is not annualized. |
| (d) | Total investment return is calculated exclusive of sales charges and assumes the reinvestment of dividends and distributions. |
| (e) | In addition to the fees and expenses which the Fund bears directly, the Fund indirectly bears a pro-rata share of the fees and expenses of the Exchange Traded Funds in which it invests. Such indirect expenses are not included in the above expense ratios. |
| (f) | The net investment loss ratios include dividends and interest expense on short positions. |
| The notes to the financial statements are an integral part of, and should be read in conjunction with, the financial statements. | mainstayinvestments.com | 25 |
Financial Highlights selected per share data and ratios
| Class C | Year ended December 31, 2013 | October 5, | ||||||
Net asset value at beginning of period | $ | 15.81 | $ | 15.80 | † | |||
|
|
|
| |||||
Net investment income (loss) (a) | (0.41 | ) | (0.07 | ) | ||||
Net realized and unrealized gain (loss) on investments | 2.90 | 0.15 | ||||||
Net realized and unrealized gain (loss) on foreign currency transactions | 0.00 | ‡ | — | |||||
|
|
|
| |||||
Total from investment operations | 2.49 | 0.08 | ||||||
|
|
|
| |||||
| Less dividends and distributions: | ||||||||
From net investment income | (0.00 | )‡ | — | |||||
From net realized gain on investments | — | (0.07 | ) | |||||
|
|
|
| |||||
Total dividends and distributions | (0.00 | )‡ | (0.07 | ) | ||||
|
|
|
| |||||
Net asset value at end of period | $ | 18.30 | $ | 15.81 | ||||
|
|
|
| |||||
Total investment return | 15.75 | % (b) | 0.53 | % (c)(d) | ||||
| Ratios of expenses to average net assets (e): | ||||||||
Before waivers/reimbursements of expenses | 3.62 | % | 4.82 | % †† | ||||
Excluding dividends and interest expense on short positions | 2.53 | % | 2.50 | % †† | ||||
After waivers/reimbursements of expenses | 3.62 | % | 4.82 | % †† | ||||
Excluding dividends and interest expense on short positions | 2.53 | % | 2.50 | % †† | ||||
| Ratio of net investment loss to average net assets: | ||||||||
Before waivers/reimbursements of expenses (f) | (2.35 | %) | (1.85 | %)†† | ||||
After waivers/reimbursements of expenses (f) | (2.35 | %) | (1.85 | %)†† | ||||
Short sale expenses | 1.09 | % | 2.32 | % †† | ||||
Portfolio turnover rate | 32 | % | 66 | % | ||||
Net assets at end of period (in 000’s) | $ | 1,582,396 | $ | 124,430 | ||||
| ** | Inception date. |
| † | Based on the net asset value of Class I as of October 5, 2012. |
| †† | Annualized. |
| ‡ | Rounds to less than 0.5 cent per share. |
| (a) | Per share data based on average shares outstanding during the period. |
| (b) | Total investment return may reflect adjustments to conform to generally accepted accounting principles. |
| (c) | Total investment return is not annualized. |
| (d) | Total investment return is calculated exclusive of sales charges and assumes the reinvestment of dividends and distributions. |
| (e) | In addition to the fees and expenses which the Fund bears directly, the Fund indirectly bears a pro-rata share of the fees and expenses of the Exchange Traded Funds in which it invests. Such indirect expenses are not included in the above expense ratios. |
| (f) | The net investment loss ratios include dividends and interest expense on short positions. |
| 26 | MainStay Marketfield Fund | The notes to the financial statements are an integral part of, and should be read in conjunction with, the financial statements. |
Financial Highlights selected per share data and ratios
| Year ended December 31, | Period ended June 1, 2009 to | Year ended May 31, | ||||||||||||||||||||||
| Class I | 2013 | 2012 | 2011* | 2010* | 2009* | 2009* | ||||||||||||||||||
Net asset value at beginning of period | $ | 15.84 | $ | 14.02 | $ | 13.52 | $ | 11.84 | $ | 10.18 | $ | 10.76 | ||||||||||||
|
|
|
|
|
|
|
|
|
|
|
| |||||||||||||
Net investment income (loss) | (0.23 | )(a) | (0.06 | )(a) | (0.11 | ) | (0.04 | ) | (0.06 | ) | (0.03 | ) | ||||||||||||
Net realized and unrealized gain (loss) on investments | 2.90 | 1.96 | 0.61 | 1.75 | 1.72 | (0.55 | ) | |||||||||||||||||
Net realized and unrealized gain (loss) on foreign currency transactions | 0.00 | ‡ | (0.01 | ) | — | (b) | — | (b) | — | (b) | — | (b) | ||||||||||||
|
|
|
|
|
|
|
|
|
|
|
| |||||||||||||
Total from investment operations | 2.67 | 1.89 | 0.50 | 1.71 | 1.66 | (0.58 | ) | |||||||||||||||||
|
|
|
|
|
|
|
|
|
|
|
| |||||||||||||
| Less dividends and distributions: | ||||||||||||||||||||||||
From net investment income | (0.00 | )‡ | — | — | (0.01 | ) | — | — | ||||||||||||||||
From net realized gain on investments | — | (0.07 | ) | — | (0.02 | ) | — | (0.00 | )‡ | |||||||||||||||
|
|
|
|
|
|
|
|
|
|
|
| |||||||||||||
Total dividends and distributions | (0.00 | )‡ | (0.07 | ) | — | (0.03 | ) | — | (0.00 | )‡ | ||||||||||||||
|
|
|
|
|
|
|
|
|
|
|
| |||||||||||||
Redemption fee | — | — | 0.00 | ‡ | 0.00 | ‡ | 0.00 | ‡ | 0.00 | ‡ | ||||||||||||||
|
|
|
|
|
|
|
|
|
|
|
| |||||||||||||
Net asset value at end of period | $ | 18.51 | $ | 15.84 | $ | 14.02 | $ | 13.52 | $ | 11.84 | $ | 10.18 | ||||||||||||
|
|
|
|
|
|
|
|
|
|
|
| |||||||||||||
Total investment return (c) | 16.86 | % (d) | 13.50 | % | 3.70 | % | 14.32 | % | 16.40 | % (e) | (5.36 | %)(e) | ||||||||||||
| Ratios of expenses to average net assets (f): | ||||||||||||||||||||||||
Before waivers/reimbursements and recoupments or expenses | 2.60 | % | 2.86 | % | 2.42 | % | 2.35 | % | 2.58 | % †† | 2.67 | % | ||||||||||||
Excluding dividends and interest expense on short positions | 1.52 | % | 1.53 | % | 1.55 | % | 1.64 | % | 1.75 | % †† | 2.24 | % | ||||||||||||
After waivers/reimbursements and recoupments of expenses | 2.60 | % | 2.86 | % | 2.43 | % | 2.46 | % | 2.43 | % (g)†† | 2.24 | % | ||||||||||||
Excluding dividends and interest expense on short position | 1.52 | % | 1.53 | % | 1.56 | % | 1.75 | % | 1.90 | % (g)†† | 1.81 | % | ||||||||||||
| Ratio of net investment loss to average net assets: | ||||||||||||||||||||||||
Before waivers/reimbursements and recoupments of expense (h) | (1.33 | %) | (1.28 | %) | (1.06 | %) | (0.25 | %) | (1.48 | %)(i)†† | (0.92 | %) | ||||||||||||
After waivers/reimbursements and recoupments of expense (h) | (1.33 | %) | (1.28 | %) | (1.07 | %) | (0.36 | %) | (1.33 | %)(g)†† | (0.49 | %) | ||||||||||||
Short sale expenses | 1.08 | % | 1.33 | % | 0.87 | % | 0.71 | % | 0.83 | % †† | 0.43 | % | ||||||||||||
Portfolio turnover rate | 32 | % | 66 | % | 138 | % | 159 | % | 78 | % | 227 | % | ||||||||||||
Net assets at end of period (in 000’s) | $ | 15,867,200 | $ | 4,144,927 | $ | 888,782 | $ | 433,921 | $ | 98,503 | $ | 43,044 | ||||||||||||
| * | These periods were audited by a predecessor audit firm whose opinion was unqualified. |
| †† | Annualized. |
| ‡ | Rounds to less than 0.5 cent per share. |
| (a) | Per share data based on average shares outstanding during the period. |
| (b) | This information was not separately reported and part of realized unrealized gain (loss). |
| (c) | Total investment return is calculated exclusive of sales charges and assumes the reinvestment of dividends and distributions. Class I shares are not subject to sales charges. |
| (d) | Total investment returns may reflect adjustments to conform to generally accepted accounting principles. |
| (e) | Not annualized for periods less than a full year. The total return shown for the year ended May 31, 2009, and the period ended December 31, 2009, reflect the total return while the Fund was taxed as a C corporation. (See Note 2(b)) |
| (f) | In addition to the fees and expenses which the Fund bears directly, the Fund indirectly bears a pro-rata share of the fees and expenses of the Exchange Traded Funds in which it invests. Such indirect expenses are not included in the above expense ratios. |
| (g) | Includes tax expense. |
| (h) | The net investment loss ratios include dividends and interest expense on short positions. |
| (i) | The net investment loss ratios include tax expense. |
| The notes to the financial statements are an integral part of, and should be read in conjunction with, the financial statements. | mainstayinvestments.com | 27 |
Financial Highlights selected per share data and ratios
Class R2 | Year ended December 31, 2013 | October 5, 2012** through December 31, 2012 | ||||||
Net asset value at beginning of period | $ | 15.82 | $ | 15.80 | † | |||
|
|
|
| |||||
Net investment income (loss) (a) | (0.32 | ) | (0.06 | ) | ||||
Net realized and unrealized gain (loss) on investments | 2.94 | 0.15 | ||||||
Net realized and unrealized gain (loss) on foreign currency transactions | 0.00 | ‡ | — | |||||
|
|
|
| |||||
Total from investment operations | 2.62 | 0.09 | ||||||
|
|
|
| |||||
| Less dividends and distributions: | ||||||||
From net investment income | (0.00 | )‡ | — | |||||
From net realized gain on investments | — | (0.07 | ) | |||||
|
|
|
| |||||
Total dividends and distributions | (0.00 | )‡ | (0.07 | ) | ||||
|
|
|
| |||||
Net asset value at end of period | $ | 18.44 | $ | 15.82 | ||||
|
|
|
| |||||
Total investment return | 16.56 | % (b) | 0.59 | % (c)(d) | ||||
| Ratios of expenses to average net assets (e): | ||||||||
Before waivers/reimbursements of expenses | 2.99 | % | 3.83 | % †† | ||||
Excluding dividends and interest expense on short positions | 1.89 | % | 1.89 | % †† | ||||
After waivers/reimbursements of expenses | 2.99 | % | 3.83 | % †† | ||||
Excluding dividends and interest expense on short positions | 1.89 | % | 1.89 | % †† | ||||
| Ratio of net investment loss to average net assets: | ||||||||
Before waivers/reimbursements of expenses (f) | (1.80 | %) | (1.56 | %)†† | ||||
After waivers/reimbursements of expenses (f) | (1.80 | %) | (1.56 | %)†† | ||||
Short sale expenses | 1.10 | % | 1.94 | % †† | ||||
Portfolio turnover rate | 32 | % | 66 | % | ||||
Net assets at end of period (in 000’s) | $ | 17,234 | $ | 90 | ||||
| ** | Inception date. |
| † | Based on the net asset value of Class I as of October 5, 2012. |
| †† | Annualized. |
| ‡ | Rounds to less than 0.5 cent per share. |
| (a) | Per share data based on average shares outstanding during the period. |
| (b) | Total investment returns may reflect adjustments to conform to generally accepted accounting principles. |
| (c) | Total investment return is not annualized. |
| (d) | Total investment return is calculated exclusive of sales charges and assumes the reinvestment of dividends and distributions. Class R2 shares are not subject to sales charges. |
| (e) | In addition to the fees and expenses which the Fund bears directly, the Fund indirectly bears a pro-rata share of the fees and expenses of the Exchange Traded Funds in which it invests. Such indirect expenses are not included in the above expense ratios. |
| (f) | The net investment loss ratios include dividends and interest expense on short positions. |
| 28 | MainStay Marketfield Fund | The notes to the financial statements are an integral part of, and should be read in conjunction with, the financial statements. |
Financial Highlights selected per share data and ratios
Class R6 | June 17, 2013** through December 31, 2013 | |||
Net asset value at beginning of period | $ | 17.08 | † | |
|
| |||
Net investment income (loss) (a) | (0.10 | ) | ||
Net realized and unrealized gain (loss) on investments | 1.55 | |||
Net realized and unrealized gain (loss) on foreign currency transactions | 0.00 | ‡ | ||
|
| |||
Total from investment operations | 1.45 | |||
|
| |||
| Less dividends: | ||||
From net investment income | (0.00 | )‡ | ||
|
| |||
Net asset value at end of period | $ | 18.53 | ||
|
| |||
Total investment return | 8.49 | % (b)(c)(d) | ||
| Ratios of expenses to average net assets (e): | ||||
Before waivers/reimbursements of expenses | 2.66 | % †† | ||
Excluding dividends and interest expense on short positions | 1.44 | % †† | ||
After waivers/reimbursements of expenses | 2.66 | % †† | ||
Excluding dividends and interest expense on short positions | 1.44 | % †† | ||
| Ratio of net investment loss to average net assets: | ||||
Before waivers/reimbursements of expenses (f) | (1.04 | %)†† | ||
After waivers/reimbursements of expenses (f) | (1.04 | %)†† | ||
Short sale expenses | 1.22 | % †† | ||
Portfolio turnover rate | 32 | % | ||
Net assets at end of period (in 000’s) | $ | 1,957 | ||
| ** | Inception date. |
| † | Based on the net asset value of Class I as of June 17, 2013. |
| †† | Annualized. |
| ‡ | Rounds to less than 0.5 cent per share. |
| (a) | Per share data based on average shares outstanding during the period. |
| (b) | Total investment return may reflect adjustments to conform to generally accepted accounting principles. |
| (c) | Total investment return is not annualized. |
| (d) | Total investment return is calculated exclusive of sales charges and assumes the reinvestment of dividends and distributions. Class R6 shares are not subject to sales charges. |
| (e) | In addition to the fees and expenses which the Fund bears directly, the Fund indirectly bears a pro-rata share of the fees and expenses of the Exchange Traded Funds in which it invests. Such indirect expenses are not included in the above expense ratios. |
| (f) | The net investment loss ratios include dividends and interest expense on short positions. |
| The notes to the financial statements are an integral part of, and should be read in conjunction with, the financial statements. | mainstayinvestments.com | 29 |
Financial Highlights selected per share data and ratios
Class P | May 31, 2013** through December 31, 2013 | |||
Net asset value at beginning of period | $ | 17.01 | † | |
|
| |||
Net investment income (loss) (a) | (0.15 | ) | ||
Net realized and unrealized gain (loss) on investments | 1.65 | |||
Net realized and unrealized gain (loss) on foreign currency transactions | 0.00 | ‡ | ||
|
| |||
Total from investment operations | 1.50 | |||
|
| |||
| Less dividends: | ||||
From net investment income | (0.00 | )‡ | ||
|
| |||
Net asset value at end of period | $ | 18.51 | ||
|
| |||
Total investment return | 8.82 | % (b)(c)(d) | ||
| Ratios of expenses to average net assets (e): | ||||
Before waivers/reimbursements of expenses | 2.58 | % †† | ||
Excluding dividends and interest expense on short positions | 1.54 | % †† | ||
After waivers/reimbursements of expenses | 2.58 | % †† | ||
Excluding dividends and interest expense on short positions | 1.54 | % †† | ||
| Ratio of net investment loss to average net assets: | ||||
Before waivers/reimbursements of expenses (f) | (1.46 | %)†† | ||
After waivers/reimbursements of expenses (f) | (1.46 | %)†† | ||
Short sale expenses | 1.04 | % | ||
Portfolio turnover rate | 32 | % | ||
Net assets at end of period (in 000’s) | $ | 197,245 | ||
| ** | Inception date. |
| † | Based on the net asset value of Class I as of May 31, 2013. |
| †† | Annualized. |
| ‡ | Rounds to less than 0.5 cent per share. |
| (a) | Per share data based on average shares outstanding during the period. |
| (b) | Total investment returns may reflect adjustments to conform to generally accepted accounting principles. |
| (c) | Total investment return is not annualized. |
| (d) | Total investment return is calculated exclusive of sales charges and assumes the reinvestment of dividends and distributions. Class P shares are not subject to sales charges. |
| (e) | In addition to the fees and expenses which the Fund bears directly, the Fund indirectly bears a pro-rata share of the fees and expenses of the Exchange Traded Funds in which it invests. Such indirect expenses are not included in the above expense ratios. |
| (f) | The net investment loss ratios include dividends and interest expense on short positions. |
| 30 | MainStay Marketfield Fund | The notes to the financial statements are an integral part of, and should be read in conjunction with, the financial statements. |
Note 1–Organization and Business
MainStay Funds Trust (the “Trust”) was organized as a Delaware statutory trust on April 28, 2009, and is governed by a Declaration of Trust. The Trust is registered under the Investment Company Act of 1940, as amended (the “1940 Act”), as an open-end management investment company, and is comprised of thirty-five funds (collectively referred to as the “Funds”). These financial statements and notes relate only to the MainStay Marketfield Fund (the “Fund”), a diversified fund. The Fund is successor to Marketfield Fund (the “Predecessor Fund”), which was a series of a different registered investment company for which Marketfield Asset Management, LLC, a New York limited liability company and the predecessor entity to the Fund’s Subadvisor (as defined in Note 3(A)), served as investment adviser. The financial statements of the Fund reflect the historical results of the Predecessor Fund prior to its reorganization on October 5, 2012. Upon the completion of the reorganization, the Class I shares of the Fund assumed the performance, financial and other information of the Predecessor Fund. All information and references to periods prior to October 5, 2012 refer to the Predecessor Fund.
The Fund currently offers seven classes of shares. Investor Class, Class A, Class C and Class R2 shares commenced operations on October 5, 2012. Class I shares commenced operations on July 31, 2007. Class R6 shares commenced operations on June 17, 2013. Class P shares commenced operations on May 31, 2013. Investor Class and Class A shares are offered at net asset value (“NAV”) per share plus an initial sales charge. No sales charge applies to investments of $1 million or more (and certain other qualified purchases) in Investor Class and Class A shares, but a contingent deferred sales charge (“CDSC”) is imposed on certain redemptions made within one year of the date of purchase. Class C shares are offered at NAV without an initial sales charge, although a 1.00% CDSC may be imposed on redemptions made within one year of the date of purchase of Class C shares. Class I, Class R2, Class R6, and Class P shares are offered at NAV and are not subject to a sales charge. Depending upon eligibility, Investor Class shares may convert to Class A shares and Class A shares may convert to Investor Class shares. The seven classes of shares have the same voting (except for issues that relate solely to one class), dividend, liquidation and other rights, and the same terms and conditions, except that Class C shares are subject to higher distribution and/or service fee rates than Investor Class, Class A and Class R2 shares under a distribution plan pursuant to Rule 12b-1 under the 1940 Act. Class I, Class R6, and Class P shares are not subject to a distribution and/or service fee. Class R2 shares are subject to a shareholder service fee. This is in addition to any fees paid under a distribution plan, where applicable.
The Fund’s investment objective is to seek capital appreciation.
Note 2–Significant Accounting Policies
The Fund prepares its financial statements in accordance with generally accepted accounting principles (“GAAP”) in the United States of America and follows the significant accounting policies described below.
(A) Securities Valuation. Investments are valued as of the close of regular trading on the New York Stock Exchange (“Exchange”) (generally 4:00 p.m. Eastern time) on each day the Fund is open for business (“valuation date”).
The Board of Trustees (the “Board”) adopted procedures for the valuation of the Fund’s securities and delegated the responsibility for valuation measurements under those procedures to the Valuation Committee of the Fund (the “Valuation Committee”). The Board authorized the Valuation Committee to appoint a Valuation Sub-Committee (the “Sub-Committee”) to deal in the first instance with questions that arise or cannot be resolved under these procedures. The Sub-Committee meets (in person, via electronic mail or via teleconference) on an as-needed basis. The Valuation Committee meets at a later time, as necessary, to ensure that actions taken by the Sub-Committee were appropriate. The procedures recognize that, subject to the oversight of the Board and unless otherwise noted, the responsibility for day-to-day valuation of portfolio assets (including securities for which market prices are not readily available) rests with New York Life Investment Management LLC (“New York Life Investments” or the “Manager”), aided to whatever extent necessary by the Subadvisor (as defined in Note 3(A)) to the Fund.
To assess the appropriateness of security valuations, the Manager or the Fund’s third party service provider, who is subject to oversight by the Manager, regularly compares prior day prices, prices on comparable securities, and the sale prices to the prior and current day prices and challenges prices exceeding certain tolerance levels with third party pricing services or broker sources. For those securities valued through either a standardized fair valuation methodology or a fair valuation measurement, the Valuation Committee reviews and affirms the reasonableness of the valuation based on such methodologies and measurements on a regular basis after considering all relevant information that is reasonably available.
Each security owned by the Fund that is listed on a securities exchange is valued at its last sale price on that exchange on the date as of which assets are valued. When the security is listed on more than one exchange, the Fund will use the price of the exchange that the Fund generally considers to be the principal exchange on which the stock is traded.
Fund securities listed on the NASDAQ Stock Market, Inc. (“NASDAQ”) will be valued at the NASDAQ Official Closing Price (“NOCP”), which may not necessarily represent the last sale price. If the NOCP is not available, such securities shall be valued at the last sale price on the day of valuation. If there has been no sale on such exchange or on NASDAQ on such day, the security is valued at the mean between the bid and asked prices on such day.
“Fair value” is defined as the price that the Fund would receive upon selling an investment in an orderly transaction to an independent buyer in the principal or most advantageous market for the investment. Fair value measurements are estimated within a framework that has established a three-tier hierarchy which maximizes the use of observable market data and minimizes the use of unobservable inputs to establish a classification of fair value measurements for disclosure purposes. “Inputs” refers broadly to the assumptions that market participants would use in pricing the asset or liability, including assumptions about risk, such as the risk inherent in a particular valuation technique used to measure fair value using a pricing model and/or the risk inherent in the inputs for the valuation technique. Inputs may be observable or unobservable. Observable inputs reflect the assumptions market participants would use in pricing the asset or liability based on market data
| mainstayinvestments.com | 31 |
Notes to Financial Statements (continued)
obtained from sources independent of the Fund. Unobservable inputs reflect the Fund’s own assumptions about the assumptions market participants would use in pricing the asset or liability developed based on the information available. The inputs or methodology used for valuing securities may not be an indication of the risks associated with investing in those securities. The three-tier hierarchy of inputs is summarized in the three broad Levels listed below.
| • | Level 1—quoted prices in active markets for identical investments |
| • | Level 2—other significant observable inputs (including quoted prices for similar investments in active markets, interest rates and yield curves, prepayment speeds, credit risks, etc.) |
| • | Level 3—significant unobservable inputs (including the Fund’s own assumptions about the assumptions that market participants would use in measuring the fair value of investments) |
The aggregate value by input level, as of December 31, 2013, for the Fund’s investments is included at the end of the Fund’s Portfolio of Investments.
The valuation techniques used by the Fund to measure fair value maximize the use of observable inputs and minimize the use of unobservable inputs. The Fund may use third party vendor evaluations, whose prices may be derived from one or more of the following standard inputs:
• Benchmark Yields | • Reported Trades | |
• Broker Dealer Quotes | • Issuer Spreads | |
• Two-sided markets | • Benchmark securities | |
• Bids / Offers | • Reference Data (corporate actions or material event notices) | |
• Industry and economic events | • Comparable bonds | |
• Equity and credit default swap curves | • Monthly payment information |
Securities for which market values cannot be measured using the methodologies described above are valued by methods deemed reasonable and in good faith by the Fund’s Valuation Committee, following the procedures established by the Board, to represent fair value. Under these procedures, the Fund primarily uses a market-based approach which may use related or comparable assets or liabilities, recent transactions, market multiples, book values, and other relevant information. The Fund may also use an income-based valuation approach in which the anticipated future cash flows of the investment are discounted to calculate fair value. Discounts may also be applied due to the nature or duration of any restrictions on the disposition of the investments. Due to the inherent uncertainty of valuations of such investments, fair values may differ significantly from values that would have been used had an active market existed. For the year ended December 31, 2013 there have been no changes to the fair value methodologies.
Equity and non-equity securities which may be valued in this manner include, but are not limited to: (i) a security for which trading has been halted or suspended; (ii) a debt security that has recently gone into default and for which there is not a current market quotation; (iii) a security of an issuer that has entered into a restructuring; (iv) a security that has been de-listed from a national exchange; (v) a security for which the market price is not readily available from a third party pricing source or, if so provided, does not, in the opinion of the Manager or
Subadvisor reflect the security’s market value; and (vi) a security whose principal market has been temporarily closed at a time when, under normal conditions, it would be open. Securities for which market quotations or observable inputs are not readily available are generally categorized as Level 3 in the hierarchy. As of December 31, 2013, there were no securities held by the Fund that were fair valued in such a manner.
Certain events may occur between the time that foreign markets close, on which securities held by the Fund principally trade, and the time at which the Fund’s NAV is calculated. These events may include, but are not limited to, situations relating to a single issuer in a market sector, significant fluctuations in U.S. or foreign markets, natural disasters, armed conflicts, governmental actions or other developments not tied directly to the securities markets. Should the Manager or Subadvisor conclude that such events may have affected the accuracy of the last price of such securities reported on the local foreign market, the Sub-Committee may, pursuant to procedures adopted by the Board, adjust the value of the local price to reflect the estimated impact on the price of such securities as a result of such events. In this instance, securities are generally categorized as Level 3 in the hierarchy. Additionally, certain foreign equity securities are also fair valued whenever the movement of a particular index exceeds an established threshold. In such cases, the securities are fair valued by applying factors provided by a third party vendor in accordance with the Fund’s policies and procedures and are generally categorized as Level 2 in the hierarchy. As of December 31, 2013, no foreign equity securities held by the Fund were fair valued in such a manner.
Equity securities and Exchange-Traded Funds are valued at the last quoted sales prices as of the close of regular trading on the Exchange on each valuation date. Securities that are not traded on the valuation date are valued at the mean of the last quoted bid and ask prices. Prices are normally taken from the principal market in which each security trades. Options contracts are valued at the last posted settlement price on the market where such options are principally traded. Investments in other mutual funds are valued at their respective NAVs as of the close of the Exchange on the valuation date. These securities are generally categorized as Level 1 in the hierarchy.
Temporary cash investments acquired in excess of 60 days to maturity are valued using the latest bid prices or using valuations based on a matrix system (which considers such factors as security prices, yields, maturities, and ratings), both as furnished by independent pricing services. Other temporary cash investments which mature in 60 days or less at the time of purchase (“Short-Term Investments”) are valued at amortized cost. The amortized cost method involves valuing a security at its cost on the date of purchase and thereafter assuming a constant amortization to maturity of the difference between such cost and the value on maturity date. Amortized cost approximates the current fair value of a security. Securities valued at amortized cost are not valued using a quoted price in an active market. These securities are generally categorized as Level 2 in the hierarchy.
Generally, a security is considered illiquid if it cannot be sold or disposed of in the ordinary course of business at approximately the price at which it is valued within seven days. Its illiquidity might prevent the sale of such security at a time when the Fund’s Manager or Subadvisor might wish to sell, and these securities could have the effect of
| 32 | MainStay Marketfield Fund |
decreasing the overall level of a Fund’s liquidity. Further, the lack of an established secondary market may make it more difficult to value illiquid securities, requiring the Fund to rely on judgments that may be somewhat subjective in measuring value, which could vary from the amount that the Fund could realize upon disposition. Difficulty in selling illiquid securities may result in a loss or may be costly to the Fund. Under the supervision of the Board, the Manager or Subadvisor measures the liquidity of the Fund’s investments; in doing so, the Manager or Subadvisor may consider various factors, including (i) the frequency of trades and quotations, (ii) the number of dealers and prospective purchasers, (iii) dealer undertakings to make a market, and (iv) the nature of the security and the market in which it trades (e.g., the time needed to dispose of the security, the method of soliciting offers and the mechanics of transfer). Illiquid securities generally will be valued in good faith in such a manner as the Board deems appropriate to reflect their fair value.
(B) Income Taxes. The Fund’s policy is to comply with the requirements of the Internal Revenue Code of 1986, as amended (the “Code”), applicable to regulated investment companies (“RIC”) and to distribute all of the taxable income to the shareholders of the Fund within the allowable time limits. Therefore, no federal, state and local income tax provisions are required.
Due to significant non-qualifying income earned by the Fund on its investments in futures on commodities and other financial instruments for the period from June 1, 2008 to December 31, 2009, the Predecessor Fund failed to qualify as a “RIC” and was therefore treated as a C corporation for that period. The results of operations of the Predecessor Fund for this period may have been different than they would have been had the Predecessor Fund complied with the requirements of Subchapter M of the code. In order to re-qualify as a RIC, the Predecessor Fund distributed, prior to the end of its first new RIC taxable year, all of its earnings and profits accumulated in those non-RIC taxable years. During 2010, the Predecessor Fund complied with the requirements of subchapter M of the Code necessary to qualify as a RIC in 2010, including distributing earnings and profits accumulated as of December 31, 2009. As such, the Predecessor Fund met the requirements to once again qualify as a RIC beginning with its December 31, 2010 tax year, and so qualified for each fiscal year thereafter for the Fund.
Management evaluates the Fund’s tax positions to determine if the tax positions taken meet the minimum recognition threshold in connection with accounting for uncertainties in income tax positions taken or expected to be taken for the purposes of measuring and recognizing tax liabilities in the financial statements. Recognition of tax benefits of an uncertain tax position is required only when the position is “more likely than not” to be sustained assuming examination by taxing authorities. Management has analyzed the Fund’s tax positions taken on federal, state and local income tax returns for all open tax years (for up to three tax years), and has concluded that no provisions for federal, state and local income tax are required in the Fund’s financial statements. The Fund’s federal, state and local income and federal excise tax returns for tax years for which the applicable statutes of limitations have not expired are subject to examination by the Internal Revenue Service and state and local departments of revenue.
(C) Foreign Taxes. Investment income received by the Fund from foreign sources may be subject to foreign income taxes. These foreign income taxes are generally withheld at the source, a portion of which may be recoverable. The Fund will accrue such taxes and recoveries as applicable, based upon its current interpretation of tax rules and regulations that exist in the markets in which it invests.
The Fund may be subject to taxation on realized capital gains, repatriation proceeds and other transaction-based taxes imposed by certain countries in which it invests. The Fund will accrue such taxes as applicable based upon its current interpretation of tax rules and regulations that exist in the market in which it invests. Capital gains taxes relating to positions still held are reflected as a liability on the Statement of Assets and Liabilities, as well as an adjustment to the Fund’s net unrealized appreciation (depreciation). Taxes related to capital gains realized during the year ended December 31, 2013, if any, are reflected as part of net realized gain (loss) in the Statement of Operations. Changes in tax liabilities related to capital gains taxes on unrealized investment gains, if any, are reflected as part of the change in net unrealized appreciation (depreciation) on investments in the Statement of Operations. Transaction-based charges are generally assessed as a percentage of the transaction amount.
(D) Dividends and Distributions to Shareholders. Dividends and distributions are recorded on the ex-dividend date. The Fund intends to declare and pay dividends of net investment income and distributions of net realized capital and currency gains, if any, at least annually. Unless the shareholder elects otherwise, all dividends and distributions are reinvested in the same class of shares of the Fund, at NAV. Dividends and distributions to shareholders are determined in accordance with federal income tax regulations and may differ from GAAP.
(E) Security Transactions and Investment Income. The Fund records security transactions on the trade date. Realized gains and losses on security transactions are determined using the identified cost method. Dividend income is recognized on the ex-dividend date and interest income is accrued as earned using the effective interest rate method. Discounts and premiums on Short-Term Investments are accreted and amortized, respectively, on the straight-line method.
Investment income and realized and unrealized gains and losses on investments of the Fund are allocated to the separate classes of shares pro rata based upon their relative net assets on the date the income is earned or realized and unrealized gains and losses are incurred.
(F) Expenses. Expenses of the Trust are allocated to the individual Funds in proportion to the net assets of the respective Funds when the expenses are incurred, except where direct allocations of expenses can be made. Expenses (other than transfer agent expenses and fees incurred under the shareholder services plans and the distribution plans further discussed in Note 3(B)) are allocated to separate classes of shares pro rata based upon their relative net assets on the date the expenses are incurred. The expenses borne by the Fund, including those of related parties to the Fund, are shown in the Statement of Operations.
(G) Use of Estimates. In preparing financial statements in conformity with GAAP, management makes estimates and assumptions that
| mainstayinvestments.com | 33 |
Notes to Financial Statements (continued)
affect the reported amounts and disclosures in the financial statements. Actual results could differ from those estimates.
(H) Foreign Currency Transactions. The books and records of the Fund are kept in U.S. dollars. Prices of securities denominated in foreign currency amounts are translated into U.S. dollars at the mean between the buying and selling rates last quoted by any major U.S. bank at the following dates:
| (i) | market value of investment securities, other assets and liabilities—at the valuation date, and |
| (ii) | purchases and sales of investment securities, income and expenses—at the date of such transactions. |
The assets and liabilities that are denominated in foreign currency amounts are presented at the exchange rates and market values at the close of the period. The realized and unrealized changes in net assets arising from fluctuations in exchange rates and market prices of securities are not separately presented.
Net realized gain (loss) on foreign currency transactions represents net gains and losses on foreign currency forward contracts, net currency gains or losses realized as a result of differences between the amounts of securities sale proceeds or purchase cost, dividends, interest and withholding taxes as recorded on the Fund’s books, and the U.S. dollar equivalent amount actually received or paid. Net currency gains or losses from valuing such foreign currency denominated assets and liabilities, other than investments at valuation date exchange rates, are reflected in unrealized foreign exchange gains or losses.
(I) Swap Contracts. The Fund may enter into credit default, interest rate, index and currency exchange rate swap contracts (“swaps”) for the purpose of attempting to obtain a desired return at a lower cost to the Fund, rather than directly investing in an instrument yielding that desired return or to hedge against credit and interest rate risk. In a typical swap transaction, two parties agree to exchange the returns (or differentials in rates of returns) earned or realized on a particular investment or instruments. The gross returns to be exchanged or “swapped” between the parties are calculated with respect to a notional amount. The payments may be adjusted for transaction costs, interest payments, the amount of interest paid on the investment or instrument or other factors. Collateral, in the form of cash or securities, may be required to be held in segregated accounts with the custodian bank or broker in accordance with the swap. Swaps agreements are privately negotiated in the over the counter market (“OTC swaps”) and may be executed in a multilateral or other trade facilities platform, such as a registered commodities exchange (“centrally cleared swaps”).
Credit default swaps, in particular, are contracts whereby one party makes periodic payments to a counterparty in exchange for the right to receive a specified return in the event of a default by a third party on its obligation. Such periodic payments are accrued daily and recorded as a realized gain or loss. Credit default swaps may be used to provide a measure of protection against defaults of sovereign or corporate issuers.
Certain clearinghouses currently offer clearing for limited types of derivatives transactions, principally credit derivatives. In a cleared derivative transaction, a Fund typically enters into the transaction with a financial institution counterparty, and performance of the transaction is
effectively guaranteed by a central clearinghouse, thereby reducing or eliminating the Fund’s exposure to the credit risk of its original counterparty. The Fund will be required to post specified levels of margin with the clearinghouse or at the instruction of the clearinghouse; the margin required by a clearinghouse may be greater than the margin the Fund would be required to post in an uncleared transaction. Only a limited number of transactions are currently eligible for clearing.
Swaps are marked-to-market daily based upon quotations from pricing agents, brokers, or market makers and the change in value, if any, is recorded as unrealized appreciation or depreciation. Any payments made or received upon entering a swap would be amortized or accreted over the life of the swap and recorded as a realized gain or loss. Early termination of a swap is recorded as a realized gain or loss. Daily changes in valuation of centrally cleared swaps, if any, are recorded as a receivable or payable for the change in value as appropriate (“variation margin”) on the Statements of Assets and Liabilities.
The Fund bears the risk of loss of the amount expected to be received under a swap in the event of the default or bankruptcy of the swap counterparty. The Fund may be able to eliminate its exposure under a swap either by assignment or other disposition, or by entering into an offsetting swap with the same party or a similar creditworthy party. Swaps are not actively traded on financial markets. Entering into swaps involves elements of credit, market, and documentation risk in excess of the amounts recognized on the Statement of Assets and Liabilities. Such risks involve the possibilities that there will be no liquid market for these swaps, that the counterparty to the swaps may default on its obligation to perform or disagree as to the meaning of the contractual terms in the swaps and that there may be unfavorable changes in interest rates, the price of the index or the security underlying these transactions.
(J) Securities Sold Short. The Fund engages in sales of securities it does not own (“short sales”) as part of its investment strategy. When the Fund enters into a short sale, it must segregate the cash proceeds from the security sold short or other securities as collateral for its obligation to deliver the security upon conclusion of the sale. During the period a short position is open, depending on the nature and type of security, short positions held are reflected as liabilities and are marked to market in accordance with the valuation methodologies previously detailed (See Note 2(A)). Liabilities for securities sold short are closed out by purchasing the applicable securities for delivery to the counterparty broker. A gain, limited to the price at which the Fund sold the security short, or a loss, unlimited as to dollar amount, will be recognized upon termination of a short sale if the market price on the date the short position is closed out is less or greater, respectively, than the proceeds originally received. Dividends declared on short positions existing on the record date are recorded on the ex-dividend date. Interest on short positions held is accrued daily while dividends declared on short positions existing on the record date are recorded on the ex-dividend date. Both the interest and dividends paid on short sales are recorded as expenses on the Statement of Operations. Short sales involve risk of loss in excess of the related amounts reflected on the Statement of Assets and Liabilities.
At December 31, 2013 the Fund’s deposit for short sales at broker was with Barclays Capital Inc. and Citigroup Global Markets Inc. (the “Brokers”). The Subadvisor (as defined in Note 3(A)) determined, based on information available at the time, that the creditworthiness of the
| 34 | MainStay Marketfield Fund |
Brokers is satisfactory. However, there is no guarantee that the Subadvisor’s determination is correct or will remain accurate. The Fund’s deposit for short sales at broker was $6,284,632,232 and in excess of the Fund’s liability for securities sold short of $5,708,696,090. The Fund does not require the Brokers to maintain collateral in support of the receivable for proceeds on securities sold short.
(K) Options. The Fund may purchase and write call or put options on securities and indices and enter into related closing transactions. As a holder of a call option, the Fund has the right, but not the obligation, to purchase a security at the exercise price during the exercise period. As the writer of a call option, the Fund has the obligation to sell the security at the exercise price during the exercise period in the event the option is exercised. As a holder of a put option, the Fund has the right, but not the obligation, to sell a security at the exercise price during the exercise period. As the writer of a put option, the Fund has the obligation to buy the underlying security at the exercise price during the exercise period in the event the option is exercised.
The premium that the Fund pays when purchasing a call option or receives when writing a call option will reflect, among other things, the market price of the security, the relationship of the exercise price to the market price of the security, the relationship of the exercise price to the volatility of the security, the length of the option period and supply and demand factors. The premium is the market value of an option at the time of the trade.
When the Fund writes (sells) an option, an amount equal to the premium received by the Fund is included in the Statement of Assets and Liabilities as an equivalent liability. The amount of the liability is subsequently marked to-market to reflect the current value of the option written.
When the Fund purchases an option, the Fund pays a non-refundable premium to the seller (writer) of the option. The Fund includes the premium paid in the Statement of Assets and Liabilities as an equivalent asset. The amount of the asset is subsequently marked to market to reflect the current value of the option purchased. Premiums paid for purchasing options which expire are treated as realized losses. Certain options may be purchased with premiums to be determined on a future date. The premiums for these options are based upon implied volatility parameters at specified terms. The risk associated with purchasing put and call options is limited to the premium paid. Premiums paid for purchasing options which are exercised or closed are added to the amounts paid or offset against the proceeds on the underlying investment transaction to determine the realized gain or loss when the underlying transaction is sold.
Certain options may expose the Fund to counterparty credit risk. The Fund will not enter into these transactions unless it owns either 1) an offsetting position in securities or other options or 2) cash and liquid assets with a value marked-to market daily, sufficient to cover potential obligations.
During the year ended December 31, 2013, the Fund had the following transactions in written options:
Number of Contracts | Premium | |||||||
Options Outstanding at December 31, 2012 | (34,778 | ) | $ | (10,206,790 | ) | |||
Options—Written | (283,704 | ) | (58,310,708 | ) | ||||
Options—Canceled in closing transactions | 240,631 | 54,137,889 | ||||||
Options—Exercised | 13,870 | 2,140,695 | ||||||
Options—Expired | 63,981 | 12,238,914 | ||||||
Options Outstanding at December 31, 2013 | — | — | ||||||
(L) Futures Contracts. A futures contract is an agreement to purchase or sell a specified quantity of an underlying instrument at a specified future date and price, or to make or receive a cash payment based on the value of a financial instrument (e.g., foreign currency, interest rate, security, or securities index). The Fund is subject to equity price risk and/or interest rate risk in the normal course of investing in these transactions. During the period the futures contract is open, changes in the value of the contract are recognized as unrealized appreciation or depreciation by marking-to-market such contract on a daily basis to reflect the market value of the contract at the end of each day’s trading. The Fund agrees to receive from or pay to the broker an amount of cash equal to the daily fluctuation in the value of the contract. Such receipts or payments are known as ‘‘variation margin.’’ When the futures contract is closed, the Fund records a realized gain or loss equal to the difference between the proceeds from (or cost of) the closing transaction and the Fund’s basis in the contract.
The use of futures contracts involves, to varying degrees, elements of market risk in excess of the amount recognized in the Statement of Assets and Liabilities. The contract or notional amounts and variation margin reflect the extent of the Fund’s involvement in open futures positions. Risks arise from the possible imperfect correlation in movements in the price of futures contracts, interest rates and the underlying hedged assets, and the possible inability of counterparties to meet the terms of their contracts. However, the Fund’s activities in futures contracts have minimal counterparty risk as they are conducted through regulated exchanges that guarantee the futures against default by the counterparty. In the event of a bankruptcy or insolvency of a futures commission merchant that holds margin on behalf of the Fund, the Fund may not be entitled to the return of all of the margin owed to the Fund, potentially resulting in a loss. The Fund may invest in futures contracts to protect against possible adverse changes in the market value of securities held and to manage risks of its assets. The Fund’s investment in futures contracts and other derivatives may increase the volatility of the Fund’s NAV and may result in a loss to the Fund.
(M) Securities Lending. In order to realize additional income, the Fund may engage in securities lending, subject to the limitations set forth in the 1940 Act and relevant guidance by the staff of the Securities and Exchange Commission. In the event the Fund does engage in securities lending, the Fund will lend through its custodian, State Street Bank and Trust Company (“State Street”). State Street will manage the Fund’s cash collateral in accordance with the lending agreement between the Fund and State Street, and indemnify the Fund’s portfolio against
| mainstayinvestments.com | 35 |
Notes to Financial Statements (continued)
counterparty risk. The loans will be collateralized by cash or securities at least equal at all times to the market value of the securities loaned. Collateral will consist of U.S. government securities, cash equivalents or irrevocable letters of credit. The Fund may bear the risk of delay in recovery of, or loss of rights in, the securities loaned should the borrower of the securities experience financial difficulty. The Fund may also record realized gain or loss on securities deemed sold due to a borrower’s inability to return securities on loan. The Fund will receive compensation for lending its securities in the form of fees or the retention of a portion of the interest on the investment of any cash received as collateral. The Fund also will continue to receive interest and dividends on the securities loaned and any gain or loss in the market price of the securities loaned that may occur during the term of the loan will be for the account of the Fund.
Although the Fund and New York Life Investments have temporarily suspended securities lending, the Fund and New York Life Investments reserve the right to reinstitute lending when deemed appropriate. The Fund did not have any portfolio securities on loan as of December 31, 2013.
(N) Redemption Fee. Prior to October 5, 2012, the Predecessor Fund imposed a 1.00% redemption fee on redemptions (including exchanges) of Predecessor Fund shares made within 60 days of their date of purchase. These fees were deducted from the redemption proceeds otherwise payable to the shareholder. The Predecessor Fund retained the fee charged as an increase in paid-in capital and such fees
became part of the Fund’s daily NAV calculation. The redemption fees are included in the Statement of Changes in Net Assets’ shares redeemed amount and retained by the Predecessor Fund. The Predecessor Fund retained redemption fees of $140,260 for the year ended December 31, 2012. Upon adoption of the Predecessor Fund by the Fund the redemption fee was terminated.
(O) Indemnifications. Under the Trust’s organizational documents, its officers and trustees are indemnified against certain liabilities that may arise out of performance of their duties to the Trust. Additionally, in the normal course of business, the Fund enters into contracts with third-party service providers that contain a variety of representations and warranties and which may provide general indemnifications. The Fund’s maximum exposure under these arrangements is unknown, as this would involve future claims that may be made against the Fund that have not yet occurred. Based on experience, management is of the view that the risk of loss in connection with these potential indemnification obligations is remote. However, there can be no assurance that material liabilities related to such obligations will not arise in the future, which could adversely impact the Fund.
(P) Quantitative Disclosure of Derivative Holdings. The following tables show additional disclosures about the Fund’s derivative and hedging activities, including how such activities are accounted for and their effect on the Fund’s financial positions, performance and cash flows. These derivatives are not accounted for as hedging instruments.
Fair value of derivatives instruments as of December 31, 2013:
Asset Derivatives
Statement of Assets and Liabilities Location | Credit Contracts Risk | Foreign Exchange Contracts Risk | Equity Contracts Risk | Interest Rate Contracts Risk | Total | |||||||||||||||||
Purchased Currency Options | Investments in securities, at value | $ | — | $ | 22,009,733 | $ | — | $ | — | $ | 22,009,733 | |||||||||||
Purchased Options | Investments in securities, at value | — | — | 83,056,648 | 40,665,938 | 123,722,586 | ||||||||||||||||
Futures Contracts | Net Assets—Net unrealized appreciation (depreciation) on investments and futures contracts (a) | — | — | 13,975,741 | 28,675,482 | 42,651,223 | ||||||||||||||||
Swap Contracts | Premiums paid for swap contracts | 54,370,461 | — | — | — | 54,370,461 | ||||||||||||||||
|
|
|
|
|
|
|
|
|
| |||||||||||||
Total Fair Value | $ | 54,370,461 | $ | 22,009,733 | $ | 97,032,389 | $ | 69,341,420 | $ | 242,754,003 | ||||||||||||
|
|
|
|
|
|
|
|
|
| |||||||||||||
Liability Derivatives
Statement of Assets and Liabilities Location | Credit Contracts Risk | Foreign Exchange Contracts Risk | Equity Contracts Risk | Interest Rate Contracts Risk | Total | |||||||||||||||||
Futures Contracts | Net Assets—Net unrealized appreciation (depreciation) on investments and futures contracts (a) | $ | — | $ | — | $ | 16,555,091 | $ | — | $ | 16,555,091 | |||||||||||
Swap Contracts | Unrealized depreciation on swap contracts | 611,374 | — | — | — | 611,374 | ||||||||||||||||
|
|
|
|
|
|
|
| |||||||||||||||
Total Fair Value | $ | 611,374 | $ | — | $ | 16,555,091 | $ | — | $ | 17,166,465 | ||||||||||||
|
|
|
|
|
|
|
| |||||||||||||||
| (a) | Includes cumulative appreciation (depreciation) of futures contracts as reported in the Portfolio of Investments. Only current day’s variation margin is reported within the Statement of Assets and Liabilities. |
| 36 | MainStay Marketfield Fund |
The effect of derivative instruments on the Statement of Operations for the year ended December 31, 2013:
Realized Gain (Loss)
Statement of Operations Location | Credit Contracts Risk | Foreign Exchange Contracts Risk | Equity Contracts Risk | Interest Rate Contracts Risk | Total | |||||||||||||||||
Written Options | Net realized gain (loss) on written option transactions | $ | — | $ | — | $ | 156,891 | $ | 6,293,082 | $ | 6,449,973 | |||||||||||
Purchased Options | Net realized gain (loss) on securities transactions | — | — | (105,685,475 | ) | (65,983,541 | ) | (171,669,016 | ) | |||||||||||||
Futures Contracts | Net realized gain (loss) on futures transactions | — | — | (29,401,012 | ) | (2,204,200 | ) | (31,605,212 | ) | |||||||||||||
Forward Contracts | Net realized gain (loss) on foreign currency transactions | — | (388,047 | ) | — | — | (388,047 | ) | ||||||||||||||
Swap Contracts | Net realized gain (loss) on swap transactions | (13,072,498 | ) | — | — | — | (13,072,498 | ) | ||||||||||||||
|
|
|
|
|
|
|
|
|
| |||||||||||||
Total Realized Gain (Loss) | $ | (13,072,498 | ) | $ | (388,047 | ) | $ | (134,929,596 | ) | $ | (61,894,659 | ) | $ | (210,284,800 | ) | |||||||
|
|
|
|
|
|
|
|
|
| |||||||||||||
Change in Unrealized Appreciation (Depreciation)
Statement of Operations Location | Credit Contracts Risk | Foreign Exchange Contracts Risk | Equity Contracts Risk | Interest Rate Contracts Risk | Total | |||||||||||||||||
Purchased Currency Options | Net change in unrealized appreciation (depreciation) on investments | $ | — | $ | (47,288,236 | ) | $ | — | $ | — | $ | (47,288,236 | ) | |||||||||
Purchased Options | Net change in unrealized appreciation (depreciation) on investments | — | — | (7,518,852 | ) | (2,383,101 | ) | (9,901,953 | ) | |||||||||||||
Written Options | Net change in unrealized appreciation (depreciation) on written option contracts | — | — | 4,132,375 | (5,080,699 | ) | (948,324 | ) | ||||||||||||||
Futures Contracts | Net change in unrealized appreciation (depreciation) on futures contracts | — | — | 25,159,569 | 936,563 | 26,096,132 | ||||||||||||||||
Swap Contracts | Net change in unrealized appreciation (depreciation) on swap contracts | (611,374 | ) | — | — | — | (611,374 | ) | ||||||||||||||
|
|
|
|
|
|
|
|
|
| |||||||||||||
Total Change in Unrealized Appreciation (Depreciation) | $ | (611,374 | ) | $ | (47,288,236 | ) | $ | 21,773,092 | $ | (6,527,237 | ) | $ | (32,653,755 | ) | ||||||||
|
|
|
|
|
|
|
|
|
| |||||||||||||
Number of Contracts, Notional Amounts or Shares/Units
| Credit Contracts Risk | Foreign Exchange Contracts Risk | Equity Contracts Risk | Interest Rate Contracts Risk | Total | ||||||||||||||||
Purchased Currency Options (Average notional amount) | $ | — | $ | 3,248,413,486 | $ | — | $ | — | $ | 3,248,413,486 | ||||||||||
Purchased Options (Average notional amount) | $ | — | $ | — | $ | 515,738 | $ | 126,773 | $ | 642,511 | ||||||||||
Swap Contracts (Average notional amount) | $ | 1,063,485 | $ | — | $ | — | $ | — | $ | 1,063,485 | ||||||||||
Written Options (Average notional amount) | $ | — | $ | — | $ | (49,539 | ) | $ | (40,000 | ) | $ | (89,539 | ) | |||||||
Futures Contracts Long (Average number of contracts) | — | — | 3,832 | — | 3,832 | |||||||||||||||
Futures Contracts Short (Average number of contracts) | — | — | (6,335 | ) | (10,473 | ) | (16,808 | ) | ||||||||||||
|
|
|
|
|
|
|
|
|
| |||||||||||
The following table presents the Fund’s derivative assets by counterparty net of amounts available for offset under a master netting agreement, or similar agreement, and net of the related collateral received by the Fund as of December 31, 2013.
Counterparty | Gross Assets in Statement of Assets and Liabilities | Derivative assets/(liabilities) available for offset | Collateral Received | Net Amount of Derivative Assets* | ||||||||||||
Barclays Bank PLC | $ | 2,078,340 | $ | — | $ | — | $ | 2,078,340 | ||||||||
Citibank N.A. | 64,675,671 | — | — | 64,675,671 | ||||||||||||
|
|
|
| |||||||||||||
| $ | 66,754,011 | $ | — | $ | — | $ | 66,754,011 | |||||||||
|
|
|
| |||||||||||||
| * | Represents the net amount receivable from the counterparty in the event of default. |
| mainstayinvestments.com | 37 |
Notes to Financial Statements (continued)
Note 3–Fees and Related Party Transactions
(A) Manager and Subadvisor. Effective after the close of business on October 5, 2012, New York Life Investments, a registered investment adviser and an indirect, wholly-owned subsidiary of New York Life Insurance Company (“New York Life”), serves as the Fund’s Manager, pursuant to an Amended and Restated Management Agreement (“Management Agreement”). The Manager provides offices, conducts clerical, recordkeeping and bookkeeping services, and keeps most of the financial and accounting records required to be maintained by the Fund. Except for the portion of salaries and expenses that are the responsibility of the Fund, the Manager pays the salaries and expenses of all personnel affiliated with the Fund and certain operational expenses of the Fund. The Fund reimburses New York Life Investments in an amount equal to a portion of the salary of the Chief Compliance Officer (“CCO”) of the Fund. Marketfield Asset Management, LLC (“MAM” or “Subadvisor”), serves as Subadvisor to the Fund and is responsible for the day-to-day portfolio management of the Fund. Pursuant to the terms of a Subadvisory Agreement (“Subadvisory Agreement”) between New York Life Investments and MAM, New York Life Investments pays for the services of the Subadvisor.
The Fund pays the Manager a monthly fee for services performed and facilities furnished at an annual rate of 1.40% of the Fund’s average daily net assets. Prior to the close of business on October 5, 2012, the monthly fee rates paid to MAM were the same as the current monthly fees.
Effective after the close of business on October 5, 2012, New York Life Investments entered into a written expense limitation agreement under which it has agreed to reimburse expenses of Class I shares so that the total ordinary operating expenses for Class I shares do not exceed 1.56% of average daily net assets. This agreement will be in effect for a two-year period unless extended by New York Life Investments and approved by the Board in connection with its review of the Fund’s investment advisory agreement. Based on its review, the Board may agree to maintain, modify or terminate the agreement. Total ordinary operating expenses excludes taxes, interest, litigation, extraordinary expenses, brokerage and other transaction expenses relating to the purchase or sale of portfolio investments and the fees and expenses of any other funds in which the Fund invests.
Prior to the close of business on October 5, 2012, MAM had a written expense limitation agreement under which it had agreed to waive a portion of the Predecessor Fund’s management fee and/or reimburse expenses of the Predecessor Fund to ensure that Total Annual Fund operating expenses (exclusive of taxes, leverage, interest, brokerage commissions, expenses incurred in connection with any merger or reorganization, dividends on short positions, acquired fund fees and expenses and extraordinary or non-recurring expenses, such as litigation) did not exceed 1.75% of the Predecessor Fund’s average annual net assets. MAM was permitted to be reimbursed by the Predecessor Fund for management fee reductions and/or expense payments made in the prior three fiscal years, so long as the reimbursement did not cause the Predecessor Fund’s Total Annual Fund Operating Expenses to exceed the 1.75% expense limitation cap.
For the year ended December 31, 2013, New York Life Investments earned fees from the Fund in the amount of $158,325,336.
For the period October 5, 2012 through December 31, 2012, New York Life Investments earned fees from the Fund in the amount of $11,888,241.
For the period from January 1, 2012 through October 5, 2012, MAM earned fees from the Fund in the amount of $18,408,611.
State Street, 1 Lincoln Street, Boston, Massachusetts 02111, provides sub-administration and sub-accounting services to the Fund pursuant to an agreement with New York Life Investments. These services include calculating the daily NAVs of the Fund, maintaining the general ledger and sub-ledger accounts for the calculation of the Fund’s respective NAVs, and assisting New York Life Investments in conducting various aspects of the Fund’s administrative operations. For providing these services to the Fund, State Street is compensated by New York Life Investments.
Prior to the close of business on October 5, 2012, these services were provided by U.S. Bancorp Fund Services, LLC and U.S. Bank N.A. The services provided by U.S. Bank, N.A., were a direct expense of the Fund and are included in the Statement of Operations as Administration and Accounting which totaled $848,640 for the period January 1, 2012 through October 5, 2012.
(B) Distribution, Service and Shareholder Service Fees. The Trust, on behalf of the Fund, has entered into a distribution agreement with NYLIFE Distributors LLC (the ‘‘Distributor’’), an indirect, wholly-owned subsidiary of New York Life. The Fund has adopted distribution plans (the ‘‘Plans’’) in accordance with the provisions of Rule 12b-1 under the 1940 Act.
Pursuant to the Investor Class, Class A, and Class R2 Plans, the Distributor receives a monthly distribution fee from the Investor Class, Class A, Class C and Class R2 shares at an annual rate of 0.25% of the average daily net assets of the Investor Class, Class A, Class C and Class R2 shares for distribution and/or service activities as designated by the Distributor. Pursuant to the Class C Plan, Class C shares pay the Distributor a monthly distribution fee at an annual rate of 0.75% of the average daily net assets of the Class C shares, along with a service fee at an annual rate of 0.25% of the average daily net assets of the Class C shares, for a total 12b-1 fee of 1.00%. Class I, Class R6 and Class P shares are not subject to a distribution and/or service fee.
The Plans provide that the distribution and service fees are payable to the Distributor regardless of the amounts actually expended by the Distributor for distribution of the Fund’s shares and service activities.
In accordance with the Shareholder Services Plan for the Class R2 shares, the Manager has agreed to provide, through its affiliates or independent third parties, various shareholder and administrative support services to shareholders of the Class R2 shares. For its services, the Manager is entitled to a Shareholder Service Fee accrued daily and paid monthly at an annual rate of 0.10% of the average daily net assets of the Class R2 shares. This is in addition to any fees paid under a distribution plan, where applicable.
(C) Sales Charges. The Fund was advised by the Distributor that the amount of sales charges retained on sales of Investor Class and Class A shares were $48,025 and $1,769,008, respectively, for the year ended December 31, 2013. The Fund was also advised that the Distributor retained CDSCs on redemptions of Class A and Class C
| 38 | MainStay Marketfield Fund |
shares of $7,099 and $259,693, respectively, for the year ended December 31, 2013.
Shareholder Service Fees incurred by the Fund for the year ended December 31, 2013 were as follows:
Class R2 | $ | 5,838 |
(D) Transfer, Dividend Disbursing and Shareholder Servicing Agent. NYLIM Service Company LLC, an affiliate of New York Life Investments, is the Fund’s transfer, dividend disbursing and shareholder servicing agent pursuant to an agreement between NYLIM Service Company LLC and the Trust. NYLIM Service Company LLC has entered into an agreement with Boston Financial Data Services, Inc. (“BFDS”) pursuant to which BFDS performs certain transfer agent services on behalf of NYLIM Service Company LLC. Transfer agent expenses incurred by the Fund for the year ended December 31, 2013, were as follows:
Investor Class | $ | 6,056 | ||
Class A | 810,006 | |||
Class C | 778,395 | |||
Class I | 8,896,446 | |||
Class R2 | 5,866 | |||
Class P | 66,869 |
Prior to the close of business on October 5, 2012, these services were provided by U.S. Bancorp Fund Services, LLC.
(E) Capital. As of December 31, 2013, New York Life and its affiliates beneficially held shares of the Fund with values and percentages of net assets as follows:
Class R2 | $ | 29,390 | 0.2 | % | ||||
Class R6 | 27,111 | 1.4 | ||||||
Class P | 29,484 | 0.0 | ‡ |
| ‡ | Less than one-tenth of a percent. |
Note 4–Federal Income Tax
As of December 31, 2013, the components of accumulated gain (loss) on a tax basis were as follows:
Ordinary | Accumulated Capital and Other Gain (Loss) | Other Temporary Differences | Unrealized Appreciation (Depreciation) | Total Accumulated Gain (Loss) | ||||||||||||
$— | $ | (175,009,126 | ) | $ | — | $ | 2,252,928,130 | $ | 2,077,919,004 | |||||||
The difference between book-basis and tax-basis unrealized appreciation (depreciation) is primarily due to wash sale adjustments, return of capital distributions received, Passive Foreign Investment Companies (PFICs), futures, options and swaps.
The following table discloses the current year reclassifications between undistributed net investment income (loss), accumulated net realized gain (loss) on investments, and additional paid-in capital arising from
permanent differences; net assets as of December 31, 2013 were not affected.
Undistributed | Accumulated Net Realized Gain (Loss) on Investments | Additional Paid-In Capital | ||||||
$140,135,121 | $ | (10,106,638 | ) | $ | (130,028,483 | ) | ||
The reclassifications for the Fund are primarily due to return of capital distributions received, Real Estate Investment Trusts (REITs), foreign currency gain (loss), nondeductible expenses, net operating losses, swaps, PFICs and short sales.
As of December 31, 2013, for federal income tax purposes, capital loss carryforwards of $175,009,126 were available as shown in the table below, to the extent provided by the regulations to offset future realized gains of the Fund through the years indicated. To the extent that these capital loss carryforwards are used to offset future capital gains, it is probable that the capital gains so offset will not be distributed to shareholders. No capital gain distributions shall be made until any capital loss carryforwards have been fully utilized or expired.
Capital Loss | Short-Term Capital Loss Amount (000’s) | Long-Term Capital Loss Amount (000’s) | ||||||
Unlimited | $ | 175,009 | $ | — | ||||
The tax character of distributions paid during the year ended December 31, 2013 and year ended December 31, 2012, shown in the Statements of Changes in Net Assets was as follows:
| 2013 | 2012 | |||||||
Distributions paid from: | ||||||||
Ordinary Income | $ | 2,109,380 | $ | — | ||||
Long-Term Capital Gain | — | 17,477,075 | ||||||
| Total | $2,109,380 | $17,477,075 | ||||||
Note 5–Custodian
State Street is the custodian of the cash and the securities of the Fund. Custodial fees are charged to the Fund based on the Fund’s net assets and/or the market value of securities in the Fund and the number of certain cash transactions incurred by the Fund.
Prior to the close of business on October 5, 2012, these services were provided by U.S. Bank, N.A.
Note 6–Line of Credit
The Fund and certain affiliated funds maintain a line of credit with a syndicate of banks in order to secure a source of funds for temporary purposes to meet unanticipated or excessive redemption requests.
Effective August 28, 2013, under a second amended and restated credit agreement (the “Credit Agreement”), the aggregate commitment amount is $300,000,000 with an optional maximum amount of $400,000,000. The commitment fee is an annual rate of 0.08% of the average commitment amount payable quarterly, regardless of usage, to Bank of New York Mellon and State Street, who serve as the agents to the syndicate. The commitment fee is allocated among the Fund and certain affiliated funds based upon net assets and other factors. Interest on any revolving credit loan is charged based upon the Federal Funds Advances rate or the one month London InterBank Offered Rate, whichever is higher. The
| mainstayinvestments.com | 39 |
Notes to Financial Statements (continued)
Credit Agreement expires on August 27, 2014, although the Fund, certain affiliated funds and the syndicate of banks may renew the Credit Agreement for an additional year on the same or different terms. Prior to August 28, 2013, the aggregate commitment amount was $200,000,000 with an optional maximum amount of $250,000,000. There were no borrowings made or outstanding with respect to the Fund under the Credit Agreement during the year ended December 31, 2013.
Note 7–Purchases and Sales of Securities (in 000’s)
During the year ended December 31, 2013, purchases and sales of securities, other than short-term securities, were $12,092,427 and $2,792,857, respectively.
Note 8–Capital Share Transactions
Investor Class | Shares | Amount | ||||||
Year ended December 31, 2013: | ||||||||
Shares sold | 805,375 | $ | 13,974,787 | |||||
Shares issued to shareholders in reinvestment of dividends and distibutions | 73 | 1,310 | ||||||
Shares redeemed | (123,801 | ) | (2,230,380 | ) | ||||
|
| |||||||
Net increase (decrease) in shares outstanding before conversion | 681,647 | 11,745,717 | ||||||
Shares converted into Investor Class (See Note 1) | 4,288 | 71,523 | ||||||
Shares converted from Investor Class (See Note 1) | (80,051 | ) | (1,357,055 | ) | ||||
|
| |||||||
Net increase (decrease) | 605,884 | $ | 10,460,185 | |||||
|
| |||||||
Year ended December 31, 2012 (a): | ||||||||
Shares sold | 42,880 | $ | 669,105 | |||||
Shares issued to shareholders in reinvestment of dividends and distributions | 121 | 1,882 | ||||||
Shares redeemed | (3,937 | ) | (61,620 | ) | ||||
|
| |||||||
Net increase (decrease) | 39,064 | $ | 609,367 | |||||
|
| |||||||
Class A | Shares | Amount | ||||||
Year ended December 31, 2013: | ||||||||
Shares sold | 94,033,138 | $ | 1,634,199,101 | |||||
Shares issued to shareholders in reinvestment of dividends and distributions | 8,462 | 152,319 | ||||||
Shares redeemed | (9,733,884 | ) | (172,144,984 | ) | ||||
|
| |||||||
Net increase (decrease) in shares outstanding before conversion | 84,307,716 | 1,462,206,436 | ||||||
Shares converted into Class A (See Note 1) | 80,051 | 1,357,055 | ||||||
Shares converted from Class A (See Note 1) | (4,288 | ) | (71,523 | ) | ||||
|
| |||||||
Net increase (decrease) | 84,383,479 | $ | 1,463,491,968 | |||||
|
| |||||||
Year ended December 31, 2012 (a): | ||||||||
Shares sold | 8,787,539 | $ | 137,164,370 | |||||
Shares issued to shareholders in reinvestment of dividends and distributions | 17,759 | 275,442 | ||||||
Shares redeemed | (151,322 | ) | (2,358,740 | ) | ||||
|
| |||||||
Net increase (decrease) | 8,653,976 | $ | 135,081,072 | |||||
|
| |||||||
Class C | Shares | Amount | ||||||
Year ended December 31, 2013: | ||||||||
Shares sold | 81,255,464 | $ | 1,404,630,213 | |||||
Shares issued to shareholders in reinvestment of dividends and distributions | 6,964 | 124,245 | ||||||
Shares redeemed | (2,671,276 | ) | (46,850,664 | ) | ||||
|
| |||||||
Net increase (decrease) | 78,591,152 | $ | 1,357,903,794 | |||||
|
| |||||||
Year ended December 31, 2012 (a): | ||||||||
Shares sold | 7,929,550 | $ | 123,516,328 | |||||
Shares issued to shareholders in reinvestment of dividends and distributions | 15,737 | 243,922 | ||||||
Shares redeemed | (74,864 | ) | (1,170,444 | ) | ||||
|
| |||||||
Net increase (decrease) | 7,870,423 | $ | 122,589,806 | |||||
|
| |||||||
Class I | Shares | Amount | ||||||
Year ended December 31, 2013: | ||||||||
Shares sold | 689,748,082 | $ | 11,991,805,245 | |||||
Shares issued to shareholders in reinvestment of dividends and distributions | 74,287 | 1,340,127 | ||||||
Shares redeemed | (94,500,234 | ) | (1,653,850,170 | ) | ||||
|
| |||||||
Net increase (decrease) | 595,322,135 | $ | 10,339,295,202 | |||||
|
| |||||||
Year ended December 31, 2012: | ||||||||
Shares sold | 220,353,583 | $ | 3,365,964,623 | |||||
Shares issued to shareholders in reinvestment of dividends and distributions | 818,854 | 12,700,425 | ||||||
Shares redeemed | (22,868,512 | ) | (351,229,292 | ) | ||||
|
| |||||||
Net increase (decrease) | 198,303,925 | $ | 3,027,435,756 | |||||
|
| |||||||
Class R2 | Shares | Amount | ||||||
Year ended December 31, 2013: | ||||||||
Shares sold | 953,820 | $ | 16,807,376 | |||||
Shares issued to shareholders in reinvestment of dividends and distributions | 55 | 992 | ||||||
Shares redeemed | (25,023 | ) | (449,326 | ) | ||||
|
| |||||||
Net increase (decrease) | 928,852 | $ | 16,359,042 | |||||
|
| |||||||
Year ended December 31, 2012 (a): | ||||||||
Shares sold | 5,688 | $ | 89,537 | |||||
Shares issued to shareholders in reinvestment of dividends and distributions | 7 | 114 | ||||||
Shares redeemed | — | (b) | (5 | ) | ||||
|
| |||||||
Net increase (decrease) | 5,695 | $ | 89,646 | |||||
|
| |||||||
| 40 | MainStay Marketfield Fund |
Class R6 | Shares | Amount | ||||||
Period ended December 31, 2013 (c): | ||||||||
Shares sold | 121,398 | $ | 2,187,045 | |||||
Shares issued to shareholders in reinvestment of dividends and distributions | 14 | 256 | ||||||
Shares redeemed | (15,776 | ) | (285,728 | ) | ||||
|
| |||||||
Net increase (decrease) | 105,636 | $ | 1,901,573 | |||||
|
| |||||||
Class P | Shares | Amount | ||||||
Period ended December 31, 2013 (c): | ||||||||
Shares sold | 11,065,479 | $ | 195,602,404 | |||||
Shares issued to shareholders in reinvestment of dividends and distributions | 1,142 | 20,583 | ||||||
Shares redeemed | (411,832 | ) | (7,437,082 | ) | ||||
|
| |||||||
Net increase (decrease) | 10,654,789 | $ | 188,185,905 | |||||
|
| |||||||
| (a) | Class A shares, Class C shares, Investor Class shares and Class R2 shares were first offered on October 5, 2012. |
| (b) | Less than one share. |
| (c) | Class R6 shares were first offered on June 17, 2013 and Class P shares were first offered on May 31, 2013. |
Note 9–Acquisition of Marketfield Fund
On October 5, 2012, MainStay Marketfield Fund acquired all of the net assets of Marketfield Fund, an open-end investment company, pursuant to a plan of reorganization approved by Marketfield Fund shareholders on September 24, 2012. The acquisition was accomplished by a tax-free exchange of 191,379,249 shares of MainStay Marketfield Fund,
valued at $3,023,808,744, for 191,379,249 Class I shares of Marketfield Fund outstanding on October 5, 2012. The investment portfolio of Marketfield Fund, with a fair value of $1,934,359,404 and identified cost of $1,655,741,379 at October 5, 2012 was the principal asset acquired by MainStay Marketfield Fund. Immediately prior to the merger, MainStay Marketfield Fund did not have any assets or liabilities. On October 5, 2012, the MainStay Marketfield Fund also launched Classes A, C, R2 and Investor.
Assuming the acquisition had been completed on January 1, 2012, the beginning of the annual reporting period of MainStay Marketfield Fund, there would have been no difference in the results of operations since the acquiring fund was established to receive all assets and liabilities of the predecessor, Marketfield Fund, and the MainStay Marketfield Fund did not have any operations or investment activities prior to the acquisition.
Note 10–Subsequent Events
In connection with the preparation of the financial statements of the Fund as of and for the year ended December 31, 2013, events and transactions subsequent to December 31, 2013, through the date the financial statements were issued have been evaluated by the Fund’s management for possible adjustment and/or disclosure. No subsequent events requiring financial statement adjustment or disclosure have been identified.
| mainstayinvestments.com | 41 |
Report of Independent Registered Public Accounting Firm
To the Board of MainStay Funds Trust and Shareholders of
MainStay Marketfield Fund:
In our opinion, the accompanying statement of assets and liabilities, including the schedule of investments, and the related statements of operations and of changes in net assets and the financial highlights present fairly, in all material respects, the financial position of MainStay Marketfield Fund (a fund of MainStay Funds Trust, and hereafter referred to as the “Fund”) at December 31, 2013, the results of its operations for the year then ended, and the changes in its net assets and the financial highlights for each of the years ended December 31, 2013 and December 31, 2012, in conformity with accounting principles generally accepted in the United States of America. These financial statements and financial highlights (hereafter referred to as “financial statements”) are the responsibility of the Fund’s management. Our responsibility is to express an opinion on these financial statements based on our audits. We conducted our audits of these financial statements in accordance with the standards of the Public Company Accounting Oversight Board (United States). Those standards require that we plan and perform the audit to obtain reasonable assurance about whether the financial statements are free of material misstatement. An audit includes examining, on a test basis, evidence supporting the amounts and disclosures in the financial statements, assessing the accounting principles used and significant estimates made by management, and evaluating the overall financial statement presentation. We believe that our audits, which included confirmation of securities at December 31, 2013 by correspondence with the custodian and brokers, and the application of alternative auditing procedures where confirmation of securities purchased had not been received, provide a reasonable basis for our opinion. The financial highlights of the Fund for periods ended on or before December 31, 2011 included in the accompanying financial statements were audited by other auditors whose report dated February 29, 2012 expressed an unqualified opinion on the financial statements containing such financial highlights.
PricewaterhouseCoopers LLP
New York, New York
February 27, 2014
| 42 | MainStay Marketfield Fund |
Board Consideration and Approval of Management Agreement and
Subadvisory Agreement (Unaudited)
Section 15(c) of the Investment Company Act of 1940, as amended (the “1940 Act”) requires that each mutual fund’s board of trustees, including a majority of the independent trustees, annually review and approve the fund’s investment advisory agreements. At its December 10-11, 2013 meeting, the Board of Trustees of the MainStay Group of Funds (“Board”) unanimously approved the Management Agreement with respect to the MainStay Marketfield Fund (“Fund”) and New York Life Investment Management LLC (“New York Life Investments”), and the Subadvisory Agreement between New York Life Investments and Marketfield Asset Management LLC (“MAM”) with respect to the Fund.
In reaching its decision to approve the Agreements, the Board considered information furnished by New York Life Investments and MAM in connection with a contract review process that took place at various meetings of the Board and its Contracts Committee between September 2013 and December 2013, as well as other relevant information furnished to the Board throughout the year by New York Life Investments and MAM. Information requested by and furnished to the Board in connection with the contract review process included, among other items, reports on the Fund prepared by Strategic Insight Mutual Fund Research and Consulting, LLC (“Strategic Insight”), an independent third-party service provider engaged by the Board to report objectively on the Fund’s investment performance, management and subadvisory fees and ordinary operating expenses. The Board also considered information provided by New York Life Investments and MAM on the fees charged to other investment advisory clients that follow investment strategies similar to the Fund, and the rationale for any differences in the Fund’s management and subadvisory fees and the fees charged to those other investment advisory clients. In addition, the Board requested and received information on the profitability of the Fund to New York Life Investments and its affiliates and MAM, and responses from New York Life Investments and MAM to a series of questions encompassing a variety of topics prepared on behalf of the Board by independent legal counsel to the Board and its independent trustees (the “Independent Trustees”). Information provided to the Board at its meetings throughout the year included, among other items, detailed investment performance reports on the Fund prepared by the Investment Consulting Group at New York Life Investments. The structure and format for this regular reporting were developed in consultation with the Board. The Board also received from New York Life Investments throughout the year, among other items, periodic reports on legal and compliance matters, portfolio turnover, and sales and marketing activity.
In determining to approve the Agreements, the members of the Board reviewed and evaluated all of the information and factors they believed to be relevant and appropriate in light of legal advice furnished to them by independent legal counsel and through the exercise of their own business judgment. The broad factors considered by the Board are discussed in greater detail below, and included, among other items: (i) the nature, scope and quality of the services provided to the Fund by New York Life Investments and MAM; (ii) the investment performance of the Fund, New York Life Investments and MAM; (iii) the costs of the services provided, and profits realized, by New York Life Investments and MAM from their relationship with the Fund; (iv) the extent to which economies of scale may be realized as the Fund grows, and the extent to which economies of scale may benefit Fund investors; and (v) the
reasonableness of the Fund’s management and subadvisory fees and overall total ordinary operating expenses, particularly as compared to similar funds and accounts managed by New York Life Investments and MAM and third-party “peer funds” identified by Strategic Insight.
While individual members of the Board may have weighed certain factors differently, the Board’s decision to approve the Agreements was based on a consideration of all the information provided to the Board, including information provided to the Board throughout the year and specifically in connection with the contract review process. The Board’s conclusions with respect to the Agreements also were based, in part, on the Board’s consideration of the Agreements in prior years. In addition to considering the above-referenced factors, the Board observed that in the marketplace there are a range of investment options available to shareholders of the Fund, and that the Fund’s shareholders, having had the opportunity to consider other investment options, have chosen to invest in the Fund. A more detailed discussion of the factors that figured prominently in the Board’s decisions to approve the Agreements is provided below.
Nature, Scope and Quality of Services to Be Provided by New York Life Investments and MAM
The Board examined the nature, scope and quality of the services that New York Life Investments provides to the Fund. The Board evaluated New York Life Investments’ experience in serving as manager of the Fund, noting that New York Life Investments manages other mutual funds, serves a variety of other investment advisory clients, including other pooled investment vehicles, and has experience with overseeing mutual fund service providers, including subadvisors. The Board considered the experience of senior personnel at New York Life Investments providing management and administrative services to the Fund, as well as New York Life Investments’ reputation and financial condition. The Board also considered the full range of non-advisory services that New York Life Investments supplies to the Fund under the terms of the Management Agreement, including: (i) fund accounting services and oversight provided by New York Life Investments’ Fund Accounting and Administration Group; (ii) investment oversight and analytical services provided by New York Life Investments’ Investment Consulting Group; (iii) compliance services provided by the Fund’s Chief Compliance Officer as well as New York Life Investments’ compliance department, including oversight and implementation of the Fund’s compliance program; and (iv) legal services provided by New York Life Investments’ Office of the General Counsel. Additional information about the non-advisory services provided by New York Life Investments is set forth in the Fund’s Management Agreement. The Board also considered New York Life Investments’ willingness to invest in personnel that benefit the Fund, and noted that New York Life Investments is responsible for compensating the Fund’s officers. The Board also considered benefits to shareholders of being part of the MainStay Group of Funds, including the privilege of exchanging investments between the same class of shares without the imposition of a sales charge, as described more fully in the Fund’s prospectus.
The Board also examined the nature, scope and quality of the advisory services that MAM provides to the Fund. The Board evaluated MAM’s experience in serving as subadvisor to the Fund and managing other portfolios. It examined MAM’s track record and experience in providing
| mainstayinvestments.com | 43 |
Board Consideration and Approval of Management Agreement and
Subsidiary Agreement (Unaudited) (continued)
investment advisory services, the experience of investment advisory, senior management and administrative personnel at MAM, and MAM’s overall legal and compliance environment. The Board also reviewed MAM’s willingness to invest in personnel and infrastructure that benefit the Fund. In this regard, the Board considered the experience of the Fund’s portfolio managers, the number of accounts managed by the portfolio managers and the method for compensating portfolio managers.
Based on these considerations, the Board concluded, within the context of its overall determinations regarding the Agreements, that the Fund should continue to benefit from the nature, scope and quality of these services as a result of New York Life Investments’ and MAM’s experience, personnel, operations and resources.
Investment Performance
In evaluating the Fund’s investment performance, the Board considered investment performance results in light of the Fund’s investment objective, strategies and risks, as disclosed in the Fund’s prospectus. The Board particularly considered detailed investment reports on the Fund’s performance provided to the Board throughout the year by the Investment Consulting Group of New York Life Investments. These reports include, among other items, information on the Fund’s gross and net returns, the Fund’s investment performance relative to relevant investment categories and Fund benchmarks, the Fund’s risk-adjusted investment performance, and the Fund’s investment performance as compared to similar competitor funds, as appropriate. The Board also considered information provided by Strategic Insight showing the investment performance of the Fund as compared to peer funds.
In considering the Fund’s investment performance, the Board focused principally on the long-term performance track record of the Fund and its predecessor fund. The Board also gave weight to its ongoing discussions with senior management at New York Life Investments concerning the Fund’s investment performance, as well as discussions between the Fund’s portfolio managers and the Board that occur typically on an annual basis. In addition, the Board considered any specific actions that New York Life Investments or MAM had taken, or had agreed with the Board to take, to enhance Fund investment performance, and the results of those actions.
Based on these considerations, the Board concluded, within the context of its overall determinations regarding the Agreements, that the long-term investment performance of the Fund, along with ongoing efforts by New York Life Investments and MAM to enhance investment returns, supported a determination to approve the Agreements. The Fund discloses more information about investment performance in the Portfolio Management Discussion and Analysis, Investment and Performance Comparison and Financial Highlights sections of this Semiannual Report and in the Fund’s prospectus.
Costs of the Services Provided, and Profits Realized, by New York Life Investments and MAM
The Board considered the costs of the services provided by New York Life Investments and MAM under the Agreements, and the profits realized by New York Life Investments and its affiliates and MAM due to their relationships with the Fund. Because MAM’s subadvisory fees are negotiated at arm’s-length by New York Life Investments and are paid
by New York Life Investments, not the Fund, the Board principally considered the profits realized by New York Life Investments and its affiliates with respect to the Fund.
In evaluating the costs and profits of New York Life Investments and its affiliates and MAM, the Board considered, among other factors, each party’s investments in personnel, systems, equipment and other resources necessary to manage the Fund, and that New York Life Investments is responsible for paying the subadvisory fees for the Fund. The Board acknowledged that New York Life Investments and MAM must be in a position to pay and retain experienced professional personnel to provide services to the Fund, and that the ability to maintain a strong financial position is important in order for New York Life Investments and MAM to continue to provide high-quality services to the Fund. The Board also noted that the Fund benefits from the allocation of certain fixed costs across the MainStay Group of Funds.
In addition, the Board noted the difficulty in obtaining reliable comparative data about mutual fund managers’ profitability, since such information generally is not publicly available and may be impacted by numerous factors, including the structure of a fund manager’s organization, the types of funds it manages, the methodology used to allocate certain fixed costs to specific funds, and the manager’s capital structure and costs of capital. While recognizing the difficulty in evaluating a manager’s profitability with respect to the Fund, and noting that other profitability methodologies may also be reasonable, the Board concluded that the profitability methodology presented by New York Life Investments to the Board, which was developed by New York Life Investments in consultation with an independent consultant, was reasonable in all material respects.
In considering the costs and profitability of the Fund, the Board also considered certain fall-out benefits that may be realized by New York Life Investments and its affiliates due to their relationships with the Fund. The Board recognized, for example, the benefits to MAM from legally permitted “soft-dollar” arrangements by which brokers provide research and other services to MAM in exchange for commissions paid by the Fund with respect to trades on the Fund’s portfolio securities. The Board also requested and received information from New York Life Investments and MAM concerning other business relationships between MAM and its affiliates and New York Life Investments and its affiliates.
The Board further considered that, in addition to fees earned by New York Life Investments for managing the Fund, New York Life Investments’ affiliates also earn revenues from serving the Fund in various other capacities, including as the Fund’s transfer agent and distributor. The Board observed that information about these other revenues, and their impact on the profitability of the Fund to New York Life Investments and its affiliates, was furnished to the Board as part of the 15(c) process. The Board noted that, although it assessed the overall profitability of the Fund to New York Life Investments and its affiliates as part of the contract review process, when considering the reasonableness of the fees to be paid to New York Life Investments and its affiliates under the Agreements, the Board considered the profitability of New York Life Investments’ relationship with the Fund on a pre-tax basis, and without regard to distribution expenses.
After evaluating the information presented to the Board, the Board concluded, within the context of its overall determinations regarding the
| 44 | MainStay Marketfield Fund |
Agreements, that any profits realized by New York Life Investments and its affiliates due to their relationships with the Fund supported the Board’s decision to approve the Agreements. With respect to MAM, the Board concluded that any profits realized by MAM due to its relationship with the Fund are the result of arm’s-length negotiations between New York Life Investments and MAM, and are based on fees paid to MAM by New York Life Investments, not the Fund.
Extent to Which Economies of Scale May Be Realized as the Fund Grows
The Board considered whether the Fund’s expense structure permitted economies of scale to be shared with Fund investors. The Board also considered a report from New York Life Investments, prepared at the request of the Board, that addressed economies of scale in the mutual fund business generally, the changing economics of the mutual fund business and the various ways in which the benefits of economies of scale may be shared with the MainStay Funds. The Board took note of the significant asset growth experienced by the Fund and its predecessor fund in recent years, as well as costs borne by New York Life Investments and MAM in connection with managing the Fund. The Board also reviewed information from New York Life Investments showing how the Fund’s management fee schedule compared to fee schedules of other funds and accounts managed by New York Life Investments. In addition, the Board reviewed information from Strategic Insight showing how the Fund’s management fee schedule hypothetically would compare with fees paid for similar services by peer funds at varying asset levels. While recognizing the difficulty of determining economies of scale with precision, the Board acknowledged that economies of scale may be shared with the Fund in a number of ways, including, for example, through the imposition of management fee breakpoints and by initially setting relatively low management fees. The Board considered that, following negotiations with the Board over the course of the annual contract review process, New York Life Investments agreed to implement new contractual breakpoints to reduce the Fund’s management fee as well as a new voluntary management fee waiver. These changes will become effective on February 28, 2014.
Based on this information, the Board concluded, within the context of its overall determinations regarding the Agreements, that the Fund’s expense structure appropriately reflects economies of scale for the benefit of Fund investors. The Board noted, however, that it would continue to evaluate the reasonableness of the Fund’s expense structure as the Fund grows over time.
Management and Subadvisory Fees and Total Ordinary Operating Expenses
The Board evaluated the reasonableness of the fees to be paid under the Agreements and the Fund’s expected total ordinary operating expenses. The Board primarily considered the reasonableness of the management fee paid by the Fund to New York Life Investments, since the fees paid to MAM are paid by New York Life Investments, not the Fund.
In assessing the reasonableness of the Fund’s fees and expenses, the Board primarily considered comparative data provided by Strategic Insight on the fees and expenses charged by similar mutual funds
managed by other investment advisers. In addition, the Board considered information provided by New York Life Investments and MAM on fees charged to other investment advisory clients, including other funds with similar investment objectives as the Fund. The Board took into account explanations provided by New York Life Investments about the different scope of services provided to mutual funds as compared with other investment advisory clients. Additionally, the Board considered the impact of any contractual breakpoints, voluntary waivers and expense limitation arrangements on the Fund’s net management fee and expenses.
The Board noted that, outside of the Fund’s management fee and the fees charged under a share class’s Rule 12b-1 and/or shareholder services plans, a share class’s most significant “other expenses” are transfer agent fees. Transfer agent fees are charged to the Fund based on the number of shareholder accounts (a “per-account” fee) as compared with certain other fees (e.g., management fees), which are charged based on the Fund’s average net assets. The Board took into account information from New York Life Investments showing that the Fund’s transfer agent fee schedule is reasonable, including industry data showing that the per-account fees that NYLIM Service Company LLC, the Fund’s transfer agent, charges the Fund are within the range of per-account fees charged by transfer agents to other mutual funds. In addition, the Board considered NYLIM Service Company LLC’s profitability in connection with the transfer agent services it provides to the Fund.
The Board acknowledged that, because the Fund’s transfer agent fees are billed on a per-account basis, the impact of transfer agent fees on a share class’s expense ratio may be more significant in cases where the share class has a high number of accounts with limited assets (i.e., small accounts). The Board observed that transfer agent fees are a significant portion of total expenses of many Funds in the MainStay Group of Funds. The impact of transfer agent fees on the expense ratios of these MainStay Funds tend to be greater than for other open-end retail funds, because the MainStay Group of Funds generally has a significant number of small accounts relative to competitor funds. The Board acknowledged the role that the MainStay Group of Funds historically has played in serving the investment needs of New York Life Insurance Company (“New York Life”) policyholders, who often maintain smaller account balances than other fund investors. The Board discussed measures that it and New York Life Investments have taken in recent years to mitigate the effect of small accounts on the expense ratios of Fund share classes, including: (i) encouraging New York Life agents to consolidate multiple small accounts held by the same investor into one MainStay Asset Allocation Fund account; (ii) increasing investment minimums from $500 to $1,000 in 2003; (iii) introducing Investor Class shares for certain MainStay Funds in early 2008 to consolidate smaller account investors; (iv) closing small accounts with balances below $250 in Investor Class shares or $750 in all other classes of shares; (v) no longer allowing an exception with no minimum investment amount with respect to AutoInvest accounts with subsequent monthly purchases of $100; (vi) since 2007, charging an annual $20.00 small account fee on certain accounts with balances below $1,000; and (vii) modifying the approach for billing transfer agent expenses to reduce the degree of subsidization by large accounts of smaller accounts. In addition, the Board acknowledged New York Life Investments’ efforts to
| mainstayinvestments.com | 45 |
Board Consideration and Approval of Management Agreement and
Subsidiary Agreement (Unaudited) (continued)
encourage intermediaries to consolidate small accounts in multiple Funds held by the same investor into a single Asset Allocation Fund account, if appropriate under the circumstances, in an effort to mitigate the effect of small accounts on the Funds in the MainStay Group of Funds.
After considering all of the factors outlined above, the Board concluded that the Fund’s management and subadvisory fees and total ordinary operating expenses were within a range that is competitive and, within the context of the Board’s overall conclusions regarding the Agreements, support a conclusion that these fees and expenses are reasonable.
Conclusion
On the basis of the information provided to it and its evaluation thereof, the Board, including the Independent Trustees, unanimously voted to approve the Agreements.
| 46 | MainStay Marketfield Fund |
Federal Income Tax Information (Unaudited)
The Fund is required under the Internal Revenue Code to advise shareholders in a written statement as to the federal tax status of dividends paid by the Fund during such fiscal years.
For the fiscal year ended December 31, 2013, the Fund designated approximately $2,109,380 under the Internal Revenue Code as qualified dividend income eligible for reduced tax rates.
The dividends paid by the Fund during the fiscal year ended December 31, 2013, should be multiplied by 100% to arrive at the amount eligible for the corporate dividends received deduction.
In February 2014, shareholders received an IRS Form 1099-DIV or substitute Form 1099 which showed the federal tax status of the distributions received by shareholders in calendar year 2013. The amounts that were reported on such 1099-DIV or substitute Form 1099 were the amounts you are to use on your federal income tax return and potentially differed from the amounts which we reported for the Fund’s fiscal year ended December 31, 2013.
Proxy Voting Policies and Procedures and Proxy Voting Record
A description of the policies and procedures that New York Life Investments uses to vote proxies related to the Fund’s securities is available without charge, upon request, (i) by visiting the Fund’s website at mainstayinvestments.com; and (ii) on the Securities and Exchange Commission’s (“SEC”) website at www.sec.gov.
The Fund is required to file with the SEC its proxy voting record for the 12-month period ending June 30 on Form N-PX. The Fund’s most recent Form N-PX is available free of charge upon request by calling 800-MAINSTAY (624-6782); visiting the Fund’s website at mainstayinvestments.com; or on the SEC’s website at www.sec.gov.
Shareholder Reports and Quarterly Portfolio Disclosure
The Fund is required to file its complete schedule of portfolio holdings with the SEC for its first and third fiscal quarters on Form N-Q. The Fund’s Form N-Q is available without charge, on the SEC’s website at www.sec.gov or by calling MainStay Investments at 800-MAINSTAY (624-6782). You also can obtain and review copies of Form N-Q by visiting the SEC’s Public Reference Room in Washington, DC (information on the operation of the Public Reference Room may be obtained by calling 1-800-SEC-0330).
| mainstayinvestments.com | 47 |
Board Members and Officers (Unaudited)
The Board Members oversee the MainStay Group of Funds (which is comprised of Funds that are series of The MainStay Funds, MainStay Funds Trust and MainStay VP Funds Trust, and Private Advisors Alternative Strategies Master Fund, Private Advisors Alternative Strategies Fund, and MainStay DefinedTerm Municipal Opportunities Fund) (collectively, the “Fund Complex���), the Manager and, when applicable, the Subadvisor(s) and other service providers to the Fund Complex. Each Board Member of MainStay Funds Trust serves until his or her successor is elected and qualified or until his or her resignation, death or removal. The Retirement Policy provides that a Board Member shall
tender his or her resignation by the end of the calendar year during which he or she reaches the age of 75.
Officers serve a term of one year and are elected annually by the Board Members. The business address of each Board Member and officer listed below is 51 Madison Avenue, New York, New York 10010.
The Statement of Additional Information applicable to the Fund includes additional information about the Board Members and is available without charge, upon request, by calling 800-MAINSTAY (624-6782) or by going online to mainstayinvestments.com.
Name and Date of Birth | Term of Office, Position(s) Held and Length of Service | Principal Occupation(s) During Past Five Years | Number of Portfolios in Fund Complex Overseen by Board Member | Other Directorships Held by Board Member | ||||||||
Interested Board Members | John Y. Kim* 9/24/60 | Indefinite; MainStay Funds Trust: Trustee since 2008.*** | Vice Chairman (since January 2014),Chief Investment Officer (since 2011), New York Life Insurance Company ; President, Investments Group—New York Life Insurance Company (since 2012); Chairman of the Board of Managers and Chief Executive Officer, New York Life Investment Management Holdings LLC (since 2008); Chairman of the Board of Managers (since 2008)and Chief Executive Officer (2008 to 2013), New York Life Investment Management LLC, Member of the Board, MCF Capital Management (since 2012), Private Advisors, L.L.C. (since 2012); MacKay Shields LLC and Madison Capital Funding LLC (since 2008); and Member of the Board of Managers, McMorgan and Company LLC and GoldPoint Partners (fka NYLCAP Manager LLC) (2008-2012) | 79 | MainStay Funds: Trustee since 2008 (12 Funds); MainStay VP Funds Trust: Trustee since 2008 (29 portfolios)**; Private Advisors Alternative Strategies Master Fund: Trustee since 2011; Private Advisors Alternative Strategies Fund: Trustee since 2011; and MainStay DefinedTerm Municipal Opportunities Fund: Trustee since 2011. |
| 48 | MainStay Marketfield Fund |
Name and Date of Birth | Term of Office, Position(s) Held and Length of Service | Principal Occupation(s) During Past Five Years | Number of Portfolios in Fund Complex Overseen by Board Member | Other Directorships Held by Board Member | ||||||||
Non-Interested Board Members | Susan B. Kerley 8/12/51 | Indefinite; MainStay Funds Trust: Trustee since 1990.*** | President, Strategic Management Advisors LLC (since 1990) | 79 | MainStay Funds: Trustee since 2007 (12 Funds); MainStay VP Funds Trust: Trustee since 2007 (29 portfolios)**; Private Advisors Alternative Strategies Master Fund: Trustee since 2011; Private Advisors Alternative Strategies Fund: Trustee since 2011; MainStay DefinedTerm Municipal Opportunities Fund: Trustee since 2011; and Legg Mason Partners Funds: Trustee since 1991 (53 portfolios). | |||||||
Alan R. Latshaw 3/27/51 | Indefinite; MainStay Funds Trust: Trustee and Audit Committee Financial Expert since 2007.*** | Retired; Partner, Ernst & Young LLP (2002 to 2003); Partner, Arthur Andersen LLP (1989 to 2002); Consultant to the MainStay Funds Audit and Compliance Committee (2004 to 2006) | 79 | MainStay Funds: Trustee and Audit Committee Financial Expert since 2006 (12 Funds); MainStay VP Funds Trust: Trustee and Audit Committee Financial Expert since 2007 (29 portfolios)**; Private Advisors Alternative Strategies Master Fund: Trustee and Audit Committee Financial Expert since 2011; Private Advisors Alternative Strategies Fund: Trustee and Audit Committee Financial Expert since 2011; MainStay DefinedTerm Municipal Opportunities Fund: Trustee and Audit Committee Financial Expert since 2011; State Farm Associates Funds Trusts: Trustee since 2005 (4 portfolios); State Farm Mutual Fund Trust: Trustee since 2005 (15 portfolios); and State Farm Variable Product Trust: Trustee since 2005 (9 portfolios). | ||||||||
Peter Meenan 12/5/41 | Indefinite; MainStay Funds Trust: Chairman since 2013 and Trustee since 2002. *** | Retired; Independent Consultant (2004 to 2013); President and Chief Executive Officer, Babson–United, Inc. (financial services firm) (2000 to 2004); Independent Consultant (1999 to 2000); Head of Global Funds, Citicorp (1995 to 1999) | 79 | MainStay Funds: Chairman since 2013 and Trustee since 2007 (12 Funds); MainStay VP Funds Trust: Chairman since 2013 and Trustee since 2007 (29 portfolios)**; Private Advisors Alternative Strategies Master Fund: Chairman since 2013 and Trustee since 2011; Private Advisors Alternative Strategies Fund: Chairman since 2013 and Trustee since 2011; and MainStay DefinedTerm Municipal Opportunities Fund: Chairman since 2013 and Trustee since 2011. | ||||||||
Richard H. Nolan, Jr. 11/16/46 | Indefinite; MainStay Funds Trust: Trustee since 2007. *** | Managing Director, ICC Capital Management; President – Shields/ Alliance, Alliance Capital Management (1994 to 2004) | 79 | MainStay Funds: Trustee since 2007 (12 Funds); MainStay VP Funds Trust: Trustee since 2006 (29 portfolios)**; Private Advisors Alternative Strategies Master Fund: Trustee since 2011; Private Advisors Alternative Strategies Fund: Trustee since 2011; and MainStay DefinedTerm Municipal Opportunities Fund: Trustee since 2011. |
| mainstayinvestments.com | 49 |
Name and Date of Birth | Term of Office, Position(s) Held and Length of Service | Principal Occupation(s) During Past Five Years | Number of Portfolios in Fund Complex Overseen by Board Member | Other Directorships Held by Board Member | ||||||||
Non-Interested Board Members | Richard S. Trutanic 2/13/52 | Indefinite; MainStay Funds Trust: Trustee since 2007. *** | Chairman and Chief Executive Officer, Somerset & Company (financial advisory firm) (since 2004); Managing Director, The Carlyle Group (private investment firm) (2002 to 2004); Senior Managing Director, Partner and Board Member, Groupe Arnault S.A. (private investment firm) (1999 to 2002) | 79 | MainStay Funds: Trustee since 1994 (12 Funds); MainStay VP Funds Trust: Trustee since 2007 (29 portfolios)**; Private Advisors Alternative Strategies Master Fund: Trustee since 2011; Private Advisors Alternative Strategies Fund: Trustee since 2011; and MainStay DefinedTerm Municipal Opportunities Fund: Trustee since 2011. | |||||||
Roman L. Weil 5/22/40 | Indefinite; MainStay Funds Trust: Trustee and Audit Committee Financial Expert since 2007.*** | Visiting Professor, University of California—San Diego (since 2012); President, Roman L. Weil Associates, Inc. (consulting firm) (since 1981); Visiting Professor, Johns Hopkins University (2013); Visiting Professor, Southern Methodist University (2011); Visiting Professor, NYU Stern School of Business, New York University (2011); V. Duane Rath Professor Emeritus of Accounting, Chicago Booth School Business, University of Chicago (Since-2008) | 79 | MainStay Funds: Trustee and Audit Committee Financial Expert since 2007 (12 Funds); MainStay VP Funds Trust: Trustee and Audit Committee Financial Expert since 1994 (29 portfolios)**; Private Advisors Alternative Strategies Master Fund: Trustee and Audit Committee Financial Expert since 2011; Private Advisors Alternative Strategies Fund: Trustee and Audit Committee Financial Expert since 2011; and MainStay DefinedTerm Municipal Opportunities Fund: Trustee and Audit Committee Financial Expert since 2011. | ||||||||
John A. Weisser 10/22/41 | Indefinite; MainStay Funds Trust: Trustee since 2007.*** | Retired; Managing Director of Salomon Brothers, Inc. (1971 to 1995) | 79 | MainStay Funds: Trustee since 2007 (12 Funds); MainStay VP Funds Trust: Trustee since 1997 (29 portfolios)**; Private Advisors Alternative Strategies Master Fund: Trustee since 2011; Private Advisors Alternative Strategies Fund: Trustee since 2011; MainStay DefinedTerm Municipal Opportunities Fund: Trustee since 2011; Direxion Insurance Trust: Trustee since 2007 (1 portfolio); Direxion Funds: Trustee since 2007 (18 portfolios); and Direxion Shares ETF Trust: Trustee since 2008 (52 portfolios). |
| * | This Board Member is considered to be an “interested person” of the MainStay Group of Funds within the meaning of the 1940 Act because of his affiliation with New York Life Insurance Company, New York Life Investment Management LLC, Cornerstone Capital Management Holdings LLC, Cornerstone Capital Management LLC, MacKay Shields LLC, Institutional Capital LLC, NYLIFE Securities LLC and/or NYLIFE Distributors LLC, as described in detail above in the column entitled “Principal Occupation(s) During the Past Five Years.” |
| ** | Includes prior service as a Director of MainStay VP Series Fund, Inc., the predecessor to MainStay VP Funds Trust. |
| *** | Includes prior service as a Director/Trustee of certain predecessor entities to MainStay Funds Trust. |
| 50 | MainStay Marketfield Fund |
The following individuals have been appointed by the Board Members to serve as Officers of the MainStay Group of Funds.*
Name and Date Of Birth | Position(s) Held and Length Of Service | Principal Occupation(s) During Past Five Years | ||||||
Fund Officers | Stephen P. Fisher 2/22/59 | President, MainStay Funds Trust (since 2009) | Chairman and Chief Executive Officer (since January 2014), President and Chief Operating Officer (2008 to 2013), NYLIFE Distributors LLC, Senior Managing Director (since 2012) and Chairman of the Board (since 2008), NYLIM Service Company LLC; Senior Managing Director (since 2005) and Co-President (since 2014), New York Life Investment Management LLC; President, MainStay Funds (since 2007), Private Advisors Alternative Strategies Master Fund, Private Advisors Alternative Strategies Fund and MainStay DefinedTerm Municipal Opportunities Fund (since 2011) and MainStay VP Funds Trust (since 2007)** | |||||
Jack R. Benintende 5/12/64 | Treasurer and Principal Financial and Accounting Officer, MainStay Funds Trust (since 2009) | Managing Director, New York Life Investment Management LLC (since 2007); Treasurer and Principal Financial and Accounting Officer, MainStay Funds (since 2007), Private Advisors Alternative Strategies Master Fund, Private Advisors Alternative Strategies Fund and MainStay DefinedTerm Municipal Opportunities Fund (since 2011) and MainStay VP Funds Trust (since 2007)** and Assistant Treasurer, New York Life Investment Management Holdings LLC (since 2008) | ||||||
Jeffrey A. Engelsman 9/28/67 | Vice President and Chief Compliance Officer MainStay Funds Trust (since 2009) | Managing Director, Compliance, New York Life Investment Management LLC (since 2009); Vice President and Chief Compliance Officer, MainStay Funds (since 2009), Private Advisors Alternative Strategies Master Fund, Private Advisors Alternative Strategies Fund and MainStay DefinedTerm Municipal Opportunities Fund (since 2011) and MainStay VP Funds Trust (since 2009)** | ||||||
J. Kevin Gao 10/13/67 | Secretary and Chief Legal Officer, MainStay Funds Trust (since 2010) | Managing Director and Associate General Counsel, New York Life Investment Management LLC (since 2010); Secretary and Chief Legal Officer, MainStay Funds (since 2010), Private Advisors Alternative Strategies Master Fund, Private Advisors Alternative Strategies Fund and MainStay DefinedTerm Municipal Opportunities Fund (since 2011) and MainStay VP Funds Trust (since 2010)**; Director and Counsel, Credit Suisse; Chief Legal Officer and Secretary, Credit Suisse Asset Management LLC and Credit Suisse Funds (2003 to 2010) | ||||||
Scott T. Harrington 2/8/59 | Vice President— Administration, MainStay Funds Trust (since 2009) | Director, New York Life Investment Management LLC (including predecessor advisory organizations) (since 2000); Member of the Board of Directors, New York Life Trust Company (since 2009); Vice President—Administration, MainStay Funds (since 2005), Private Advisors Alternative Strategies Master Fund, Private Advisors Alternative Strategies Fund and MainStay DefinedTerm Municipal Opportunities Fund (since 2011) and MainStay VP Funds Trust (since 2005)** |
| * | The Officers listed above are considered to be “interested persons” of the MainStay Group of Funds within the meaning of the 1940 Act because of their affiliation with the MainStay Group of Funds, New York Life Insurance Company, New York Life Investment Management LLC, New York Life Insurance Company, New York Life Investment Management LLC, NYLIFE Securities LLC and/or NYLIFE Distributors LLC, as described in detail in the column captioned “Principal Occupation(s) During Past Five Years.” Officers are elected annually by the Board to serve a one year term. |
| ** | Includes prior service as an Officer of MainStay VP Series Fund, Inc., the predecessor to MainStay VP Funds Trust. |
| mainstayinvestments.com | 51 |
This page intentionally left blank
This page intentionally left blank
This page intentionally left blank
MainStay Funds
MainStay offers a wide range of Funds for virtually any investment need. The full array of MainStay open-end offerings is listed here, with information about the manager, subadvisors, legal counsel and independent registered public accounting firms.
Equity
U.S. Equity Funds
MainStay Common Stock Fund
MainStay Cornerstone Growth Fund
MainStay Epoch U.S. All Cap Fund
MainStay Epoch U.S. Equity Yield Fund
MainStay ICAP Equity Fund
MainStay ICAP Select Equity Fund
MainStay Large Cap Growth Fund
MainStay MAP Fund
MainStay S&P 500 Index Fund
MainStay U.S. Equity Opportunities Fund
MainStay U.S. Small Cap Fund
International/Global Equity Funds
MainStay Emerging Markets Opportunities Fund
MainStay Epoch Global Choice Fund
MainStay Epoch Global Equity Yield Fund
MainStay Epoch International Small Cap Fund
MainStay ICAP Global Fund
MainStay ICAP International Fund
MainStay International Equity Fund
MainStay International Opportunities Fund
Income
Taxable Bond Funds
MainStay Floating Rate Fund
MainStay Global High Income Fund
MainStay Government Fund
MainStay High Yield Corporate Bond Fund
MainStay High Yield Opportunities Fund
MainStay Indexed Bond Fund
MainStay Short Duration High Yield Fund
MainStay Short Term Bond Fund
MainStay Total Return Bond Fund
MainStay Unconstrained Bond Fund
Municipal Bond Funds
MainStay California Tax Free Opportunities Fund1
MainStay High Yield Municipal Bond Fund
MainStay New York Tax Free Opportunities Fund2
MainStay Tax Free Bond Fund
Money Market Fund
MainStay Money Market Fund
Mixed Asset
MainStay Balanced Fund
MainStay Convertible Fund
MainStay Income Builder Fund
MainStay Marketfield Fund
Asset Allocation/Target Date
MainStay Conservative Allocation Fund
MainStay Growth Allocation Fund
MainStay Moderate Allocation Fund
MainStay Moderate Growth Allocation Fund
MainStay Retirement 2010 Fund
MainStay Retirement 2020 Fund
MainStay Retirement 2030 Fund
MainStay Retirement 2040 Fund
MainStay Retirement 2050 Fund
Manager
New York Life Investment Management LLC
New York, New York
Subadvisors
Cornerstone Capital Management Holdings LLC3
New York, New York
Cornerstone Capital Management LLC3
Bloomington, Minnesota
Epoch Investment Partners, Inc.
New York, New York
Institutional Capital LLC3
Chicago, Illinois
MacKay Shields LLC3
New York, New York
Marketfield Asset Management LLC
New York, New York
Markston International LLC
White Plains, New York
Winslow Capital Management, LLC
Minneapolis, Minnesota
Legal Counsel
Dechert LLP
Independent Registered Public Accounting Firms
KPMG LLP
PricewaterhouseCoopers LLP4
1. This Fund is only registered for sale in AZ, CA, NV, OR, UT, and WA.
2. This Fund is only registered for sale in CT, DE, FL, MA, NJ, NY, and VT.
3. An affiliate of New York Life Investment Management LLC.
4. For MainStay Marketfield Fund only.
Not part of the Annual Report
For more information
800-MAINSTAY (624-6782)
mainstayinvestments.com
The MainStay Funds® are managed by New York Life Investment Management LLC and distributed through NYLIFE Distributors LLC, 169 Lackawanna Avenue, Parsippany, NJ 07054, a wholly owned subsidiary of New York Life Insurance Company. NYLIFE Distributors is a Member FINRA/SIPC.
MainStay Investments® is a registered service mark and name under which New York Life Investment Management LLC does business. MainStay Investments, an indirect subsidiary of New York Life Insurance Company, New York, NY 10010, provides investment advisory products and services.
This report may be distributed only when preceded or accompanied by a current Fund prospectus.
© 2014 by NYLIFE Distributors LLC. All rights reserved.
| Not FDIC/NCUA Insured | Not a Deposit | May Lose Value | No Bank Guarantee | Not Insured by Any Government Agency |
| NYLIM-32692 MS009-14 | MSMK11-02/14 NL040 |
| Item 2. | Code of Ethics. |
As of the end of the period covered by this report, the Registrant has adopted a code of ethics (the “Code”) that applies to the Registrant’s principal executive officer (“PEO”) and principal financial officer (“PFO”). A copy of the Code is filed herewith. The Registrant did not grant any waivers, including implicit waivers, from any provisions of the Code to the PEO or PFO during the period covered by this report.
| Item 3. | Audit Committee Financial Expert. |
The Board of Trustees has determined that the Registrant has two audit committee financial experts serving on its Audit Committee. The Audit Committee financial experts are Alan R. Latshaw and Roman L. Weil. Messrs. Latshaw and Weil are “independent” within the meaning of that term under the Investment Company Act of 1940.
| Item 4. | Principal Accountant Fees and Services. |
(a) Audit Fees
The aggregate fees billed for the fiscal year ended December 31, 2013 for professional services rendered by PricewaterhouseCoopers LLP (“PwC”) for the audit of the Registrant’s annual financial statements or services that are normally provided by PwC in connection with statutory and regulatory filings or engagements for that fiscal year were $82,500.
The aggregate fees billed for the fiscal year ended December 31, 2012 for professional services rendered by PwC for the audit of the Registrant’s annual financial statements or services that are normally provided by PwC in connection with statutory and regulatory filings or engagements for that fiscal year were $82,500.
(b) Audit-Related Fees
The aggregate fees billed for assurance and related services by PwC that are reasonably related to the performance of the audit of the Registrant’s financial statements and are not reported under paragraph (a) of this Item were: (i) $0 for the fiscal year ended December 31, 2013, and (ii) $0 for the fiscal year ended December 31, 2012. These audit-related services include review of financial highlights for Registrant’s registration statements and issuance of consents to use the auditor’s reports.
(c) Tax Fees
The aggregate fees billed for professional services rendered by PwC for tax compliance, tax advice, and tax planning were: (i) $20,000 during the fiscal year ended December 31, 2013, and (ii) $10,000 during the fiscal year ended December 31, 2012. These services primarily included preparation of federal, state and local income tax returns and excise tax returns, as well as services relating to excise tax distribution requirements.
The aggregate fees billed for professional services rendered by Deloitte & Touche LLP (“Deloitte”) for tax compliance, tax advice, and tax planning were $54,880 during the fiscal year ended December 31, 2012. These services primarily included preparation of federal, state and local income tax returns and excise tax returns, as well as services relating to excise tax distribution requirements.
(d) All Other Fees
The aggregate fees billed for products and services provided by PwC, other than the services reported in paragraphs (a) through (c) of this Item were: (i) $0 during the fiscal year ended December 31, 2013, and (ii) $11,000 during the fiscal year ended December 31, 2012.
The aggregate fees billed for products and services provided by Deloitte, other than the services reported in paragraphs (a) through (c) of this Item were $10,500 during the fiscal year ended December 31, 2012.
(e) Pre-Approval Policies and Procedures
| (1) | The Registrant’s Audit Committee has adopted pre-approval policies and procedures (the “Procedures”) to govern the Committee’s pre-approval of (i) all audit services and permissible non-audit services to be provided to the Registrant by its independent accountant, and (ii) all permissible non-audit services to be provided by such independent accountant to the Registrant’s investment adviser and to any entity controlling, controlled by or under common control with the investment adviser that provides ongoing services to the Registrant (collectively, the “Service Affiliates”) if the services directly relate to the Registrant’s operations and financial reporting. In accordance with the Procedures, the Audit Committee is responsible for the engagement of the independent accountant to certify the Registrant’s financial statements for each fiscal year. With respect to the pre-approval of non-audit services provided to the Registrant and its Service Affiliates, the Procedures provide that the Audit Committee may annually pre-approve a list of the types of services that may be provided to the Registrant or its Service Affiliates, or the Audit Committee may pre-approve such services on a project-by-project basis as they arise. Unless a type of service has received general pre-approval, it will require specific pre-approval by the Audit Committee if it is to be provided by the independent accountant. The Procedures also permit the Audit Committee to delegate authority to one or more of its members to pre-approve any proposed non-audit services that have not been previously pre-approved by the Audit Committee, subject to the ratification by the full Audit Committee no later than its next scheduled meeting. To date, the Audit Committee has not delegated such authority. |
| (2) | With respect to the services described in paragraphs (b) through (d) of this Item 4, no amount was approved by the Audit Committee pursuant to paragraph (c)(7)(i)(C) of Rule 2-01 of Regulation S-X. |
(f) There were no hours expended on PwC’s engagement to audit the Registrant’s financial statements for the most recent fiscal year was attributable to work performed by persons other than PwC’s full-time, permanent employees.
(g) All non-audit fees billed by PwC for services rendered to the Registrant for the fiscal years ended December 31, 2013 and December 31, 2012 are disclosed in 4(b)-(d) above.
The aggregate non-audit fees billed by PwC for services rendered to the Registrant’s investment adviser (not including any sub-adviser whose role is primarily portfolio management and is subcontracted with or overseen by another investment adviser), and any entity controlling, controlled by, or under common control with the adviser that provides ongoing services to the Registrant were approximately: (i) $2,700,000 for the fiscal year ended December 31, 2013, and (ii) $2,608,827 for the fiscal year ended December 31, 2012.
(h) The Registrant’s Audit Committee has determined that the non-audit services rendered by PwC for the fiscal year ended December 31, 2013 to the Registrant’s investment adviser and any entity controlling, controlled by, or under common control with the Registrant’s investment adviser that provides ongoing services to the Registrant that were not required to be pre-approved by the Audit Committee because they did not relate directly to the operations and financial reporting of the registrant were compatible with maintaining the respective independence of PwC during the relevant time period.
| Item 5. | Audit Committee of Listed Registrants |
Not applicable.
| Item 6. | Schedule of Investments |
The Schedule of Investments is included as part of Item 1 of this report.
| Item 7. | Disclosure of Proxy Voting Policies and Procedures for Closed-End Management Investment Companies. |
Not applicable.
| Item 8. | Portfolio Managers of Closed-End Management Investment Companies. |
Not applicable.
| Item 9. | Purchases of Equity Securities by Closed-End Management Investment Company and Affiliated Purchasers. |
Not Applicable.
| Item 10. | Submission of Matters to a Vote of Security Holders. |
Since the Registrant’s last response to this Item, there have been no material changes to the procedures by which shareholders may recommend nominees to the Registrant’s Board of Trustees.
| Item 11. | Controls and Procedures. |
(a) Based on an evaluation of the Registrant’s Disclosure Controls and Procedures (as defined in Rule 30a-3(c) under the Investment Company Act of 1940) (the “Disclosure Controls”), as of a date within 90 days prior to the filing date (the “Filing Date”) of this Form N-CSR (the “Report”), the Registrant’s principal executive officer and principal financial officer have concluded that the Disclosure Controls are reasonably designed to ensure that information required to be disclosed by the Registrant in the Report is recorded, processed, summarized and reported by the Filing Date, including ensuring that information required to be disclosed in the Report is accumulated and communicated to the Registrant’s management, including the Registrant’s principal executive officer and principal financial officer, as appropriate to allow timely decisions regarding required disclosure.
(b) There were no changes in the Registrant’s internal control over financial reporting (as defined in Rule 30a-3(d)) under the Investment Company Act of 1940 that occurred during the second fiscal quarter of the period covered by this report that has materially affected, or is reasonably likely to materially affect, the Registrant’s internal control over financial reporting.
| Item 12. | Exhibits. |
| (a)(1) | Code of Ethics | |
| (a)(2) | Certifications of principal executive officer and principal financial officer as required by Rule 30a-2 under the Investment Company Act of 1940. | |
| (b) | Certifications of principal executive officer and principal financial officer as required by Section 906 of the Sarbanes-Oxley Act of 2002. | |
SIGNATURES
Pursuant to the requirements of the Securities Exchange Act of 1934 and the Investment Company Act of 1940, the Registrant has duly caused this Report to be signed on its behalf by the undersigned, thereunto duly authorized.
MAINSTAY FUNDS TRUST
| By: | /s/ Stephen P. Fisher | |
Stephen P. Fisher President and Principal Executive Officer | ||
| Date: | March 10, 2014 | |
Pursuant to the requirements of the Securities Exchange Act of 1934 and the Investment Company Act of 1940, this Report has been signed below by the following persons on behalf of the Registrant and in the capacities and on the dates indicated.
| By: | /s/ Stephen P. Fisher | |
Stephen P. Fisher President and Principal Executive Officer | ||
| Date: | March 10, 2014 | |
| By: | /s/ Jack R. Benintende | |
Jack R. Benintende Treasurer and Principal Financial and Accounting Officer | ||
| Date: | March 10, 2014 | |
EXHIBIT INDEX
| (a)(1) | Code of Ethics | |
| (a)(2) | Certifications of principal executive officer and principal financial officer as required by Rule 30a-2 under the Investment Company Act of 1940. | |
| (b) | Certification of principal executive officer and principal financial officer as required by Section 906 of the Sarbanes-Oxley Act of 2002. | |