UNITED STATES
SECURITIES AND EXCHANGE COMMISSION
Washington, D.C. 20549
Form N-CSR
CERTIFIED SHAREHOLDER REPORT OF REGISTERED
MANAGEMENT INVESTMENT COMPANIES
Investment Company Act File Number 811-22321
MAINSTAY FUNDS TRUST
(Exact name of Registrant as specified in charter)
51 Madison Avenue, New York, NY 10010
(Address of principal executive offices) (Zip code)
J. Kevin Gao, Esq.
169 Lackawanna Avenue
Parsippany, New Jersey 07054
(Name and address of agent for service)
Registrant’s telephone number, including area code: (212) 576-7000
Date of fiscal year end: June 30 (MainStay Cornerstone Growth Fund)
Date of reporting period: June 30, 2013
FORM N-CSR
The information presented in this Form N-CSR relates solely to the
MainStay Cornerstone Growth Fund, a series of the Registrant.
| Item 1. | Reports to Stockholders. |
MainStay Cornerstone Growth Fund
Message from the President and Annual Report
June 30, 2013


This page intentionally left blank
Message from the President
The stock market advanced during the 12 months ended June 30, 2013. But the climb was less than steady. In the United States, stocks progressed until shortly before the November election, then gave up much of their earlier gains. After that, domestic stocks rose relatively steadily, dipping occasionally for major events, including the fiscal cliff, the Boston marathon bombing, and suggestions that the Federal Reserve might taper its direct purchases of securities on the open market.
International stocks were also strong, but many emerging markets suffered from concerns about slower growth in China and falling prices for metals and other commodities.
The Federal Open Market Committee (“FOMC”) maintained the federal funds target rate in a near-zero target range, as it had done since December 2008. During the 12-month period, the FOMC reaffirmed that it would “continue purchasing additional agency mortgage-backed securities at a pace of $40 billion per month and longer-term Treasury securities at a pace of $45 billion per month.” Nevertheless, the FOMC noted that it was “prepared to increase or reduce the pace of its purchases to maintain appropriate policy accommodation as the outlook for the labor market or inflation changes.”
During the reporting period, the FOMC also shifted from providing dates when it anticipated that the federal funds target might change to specifying the economic conditions under which an adjustment might be warranted.
Generally speaking, bonds did not fare as well as stocks during the reporting period. Interest rates rose when Federal Reserve Chairman Ben Bernanke outlined a plan for tapering the Federal Reserve’s quantitative easing and other accommodative strategies. The consequent drop in bond prices led U.S. government securities into negative territory. Many investors, however, lengthened maturities and lowered their risk threshold in hopes of earning extra yield. As a result, high-yield bonds, leveraged
loans, and convertible securities on the whole tended to provide positive single-digit returns.
With wide variations in the performance of various asset classes, some investors might be tempted to chase higher returns by shifting back and forth between stocks and bonds. Since no one can predict where the market will move next, however, we encourage investors to select an appropriate mix of investments for their risk tolerance and time horizon and to stick with that mix, making only minor adjustments over time.
At MainStay Funds, our portfolio managers use a similar approach. Careful security selection and thoughtful sell disciplines help them pursue the investment objectives of their respective Funds. Using the principal investment strategies outlined in the Prospectus, they focus primarily on providing long-term investment potential for our shareholders.
Has this approach proved successful? In its most recent rankings, Barron’s listed MainStay Funds as the #1 fund family over the past 10 years. We were also the only mutual fund family that has appeared in Barron’s top six for the past five consecutive years.
The pages that follow provide additional insight into the specific market events, investment decisions and securities that shaped MainStay Cornerstone Growth Fund during the 12 months ended June 30, 2013. We encourage you to read the accompanying annual report carefully and to evaluate your results with your long-term financial goals in mind.
Sincerely,

Stephen P. Fisher
President
The opinions expressed are as of the date of this report and are subject to change. There is no guarantee that any forecast made will come to pass. This material does not constitute investment advice and is not intended as an endorsement of any specific investment.
To qualify for the Lipper/Barron’s Fund Survey, a fund family must have at least three funds in Lipper’s general U.S.-stock category, one in world equity (which combines global and international funds), one mixed-equity fund (which holds stocks and bonds), two taxable-bond funds, and one tax-exempt fund. Fund loads and 12b-1 fees aren’t included in the calculation of returns because the aim is to measure the manager’s skill. Each fund’s return is measured against all funds in its Lipper category, resulting in a percentile ranking which is then weighted by asset size relative to the fund family’s other assets in its general classifications. Finally, the score is multiplied by the general classification weightings as determined by the entire Lipper universe of funds.
Source: Barron’s, 2/9/13. Overall, MainStay Funds ranked number 56 for the one-year period, 20 for the five-year period and one for the 10-year period ended December 31, 2012, out of 62, 53 and 46 fund families, respectively. MainStay ranked number three for the 10-year period in 2009, 2010 and 2011 from among 48, 46 and 45 fund families, respectively. MainStay ranked number six from among 48 fund families for the 10-year period in 2008.
According to Lipper Inc., the percentile ranks for MainStay Cornerstone Growth Fund Class A shares are 97, 32, 53 and 52 for the one-, three-, five-year and since-inception periods and are from among 724, 612, 552 and 486 large-cap growth funds, respectively. The Fund’s total-return percentile rank for the specified time period is relative to all funds that have the same Lipper category. The highest (or most favorable) percentile rank is 1 and the lowest (or least favorable) percentile rank is 100. The top-performing fund in a category will always receive a rank of 1. Percentile ranks within categories are most useful in those categories that have a large number of funds. Lipper Inc. is an independent monitor of fund performance. Past performance is no guarantee of future results, which will vary. For the most recent MainStay Funds performance, please visit our website at mainstayinvestments.com. All mutual funds are subject to market risk and will fluctuate in value.
Not part of the Annual Report
Investors should refer to the Fund’s Summary Prospectus and/or Prospectus and consider the Fund’s investment objectives, strategies, risks, charges and expenses carefully before investing. The Summary Prospectus and/or Prospectus contain this and other information about the Fund. You may obtain copies of the Fund’s Summary Prospectus, Prospectus and Statement of Additional Information free of charge, upon request, by calling toll-free 800-MAINSTAY (624-6782), by writing to NYLIFE Distributors LLC, Attn: MainStay Marketing Department, 169 Lackawanna Avenue, Parsippany, New Jersey 07054 or by sending an e-mail to MainStayShareholderServices@nylim.com. These documents are also available via the MainStay Funds’ website at mainstayinvestments.com/documents. Please read the Summary Prospectus and/or Prospectus carefully before investing.
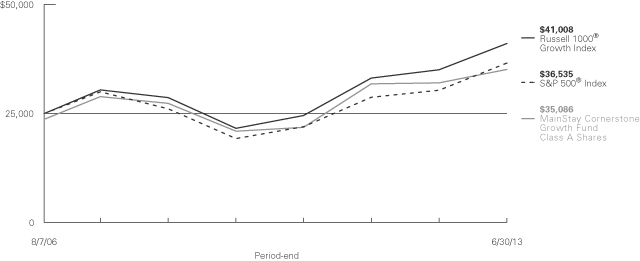
Investment and Performance Comparison1 (Unaudited)
Performance data quoted represents past performance. Past performance is no guarantee of future results. Because of market volatility, current performance may be lower or higher than the figures shown. Investment return and principal value will fluctuate, and as a result, when shares are redeemed, they may be worth more or less than their original cost. The graph below depicts the historical performance of Class A shares of the Fund. Performance will vary from class to class based on differences in class-specific expenses and sales charges. For performance information current to the most recent month-end, please call 800-MAINSTAY (624-6782) or visit mainstayinvestments.com.
Average Annual Total Returns for the Period Ended June 30, 2013
| Class | Sales Charge | One Year | Five Year | Since Inception (8/7/06) | Gross Expense Ratio2 | |||||||||||||||
| Investor Class Shares3 | Maximum 5.5% Initial Sales Charge | With sales charges Excluding sales charges |
| 3.33 9.34 | %
|
| 3.88 5.06 | %
|
| 4.99 5.86 | %
|
| 1.58 1.58 | %
| ||||||
| Class A Shares4 | Maximum 5.5% Initial Sales Charge | With sales charges Excluding sales charges |
| 3.61 9.64 |
|
| 3.94 5.12 |
|
| 5.03 5.90 |
|
| 1.32 1.32 |
| ||||||
| Class B Shares3 | Maximum 5% CDSC if Redeemed Within First Six Years of Purchase | With sales charges Excluding sales charges |
| 3.51 8.51 |
|
| 3.93 4.28 |
|
| 5.06 5.06 |
|
| 2.33 2.33 |
| ||||||
| Class C Shares3 | Maximum 1% CDSC if Redeemed Within One Year of Purchase | With sales charges Excluding sales charges |
| 7.51 8.51 |
|
| 4.28 4.28 |
|
| 5.06 5.06 |
|
| 2.33 2.33 |
| ||||||
| Class | Sales Charge | One Year | Since Inception (11/2/09) | Gross Expense Ratio2 | ||||||||||||||||
| Class I Shares4 | No Sales Charge | 9.91 | % | 11.98 | % | 1.07 | % | |||||||||||||
| Class | Sales Charge | One Year | Five Year | Since Inception (8/7/06) | Gross Expense Ratio2 | |||||||||||||||
| Class R2 Shares3 | No Sales Charge | 9.50 | % | 5.01 | % | 5.79 | % | 1.42 | % | |||||||||||
| 1. | The performance table and graph do not reflect the deduction of taxes that a shareholder would pay on distributions or Fund-share redemptions. Total returns reflect maximum applicable sales charges as indicated in the table above, changes in share price, and reinvestment of dividend and capital gain distributions. The graph assumes the initial investment amount being shown above and reflects the deduction of all sales charges that would have applied for the period of investment. Performance figures reflect certain fee waivers and/or expense limitations, without which total returns may have been lower. For more information on share classes and current fee waivers and/or expense limitations, please refer to the notes to the financial statements. |
| 2. | The gross expense ratios presented reflect the Fund’s “Total Annual Fund Operating Expenses” from the most recent Prospectus and may differ from other expense ratios disclosed in this report. |
| 3. | Performance figures for Investor Class shares, Class B shares, Class C shares and Class R2 shares, first offered as of the close of business on January 18, 2013 include the historical performance of Class A shares through January 18, 2013. Performance figures for Investor Class shares, Class B shares, Class C shares and Class R2 shares have been adjusted for differences in fees and expenses. Unadjusted, the performance for the newer classes would likely have been different. |
| 4. | Performance figures for Class A and Class I shares reflect the historical performance of Class A and Class I shares of the Keystone Large Cap Growth Fund (the predecessor to the Fund, which was subject to a different fee structure), for periods prior to January 11, 2013. Performance data for the classes varies based on differences in their fee and expense structures and the length of time these shares have been offered. Keystone Large Cap Growth Fund commenced operations, and Class A shares were first offered, on August 7, 2006. Class I shares were first offered on November 2, 2009. |
The footnotes on the next page are an integral part of the table and graph and should be carefully read in conjunction with them.
| mainstayinvestments.com | 5 |
| Benchmark Performance | One Year | Five Year | Since Inception | |||||||||
Russell 1000® Growth Index5 | 17.07 | % | 7.47 | % | 7.44 | % | ||||||
S&P 500® Index6 | 20.60 | 7.01 | 5.65 | |||||||||
Average Lipper Large-Cap Growth Fund7 | 15.85 | 5.29 | 5.95 | |||||||||
| 5. | The Russell 1000® Growth Index measures the performance of the large-cap growth segment of the U.S. equity universe. It includes those Russell 1000® Index companies with higher price-to-book ratios and higher forecasted growth values. The Russell 1000® Growth Index is the Fund’s broad-based securities market index for comparison purposes. Total returns assume reinvestment of all dividends and capital gains. An investment cannot be made directly in an index. |
| 6. | The S&P 500® Index is a trademark of the McGraw-Hill Companies, Inc. The S&P 500® Index is widely regarded as the standard index for measuring large-cap U.S. stock market performance. The S&P 500® Index is the Fund’s secondary benchmark. Total returns assume reinvestment of all |
| dividends and capital gains. An investment cannot be made directly in an index. |
| 7. | The average Lipper large-cap growth fund is representative of funds that, by portfolio practice, invest at least 75% of their equity assets in companies with market capitalizations (on a three-year weighted basis) above Lipper’s U.S. Diversified Equity large-cap floor. Large-cap growth funds typically have an above-average price-to-earnings ratio, price-to-book ratio, and three-year sales-per-share growth value, compared to the S&P 500® Index. This benchmark is a product of Lipper Inc. Lipper Inc. is an independent monitor of fund performance. Results are based on average total returns of similar funds with all dividends and capital gain distributions reinvested. |
The footnotes on the preceding page are an integral part of the table and graph and should be carefully read in conjunction with them.
| 6 | MainStay Cornerstone Growth Fund |
Cost in Dollars of a $1,000 Investment in MainStay Cornerstone Growth Fund (Unaudited)
The example below is intended to describe the fees and expenses borne by shareholders during the period from January 1, 2013, to June 30, 2013, and the impact of those costs on your investment.
Example
As a shareholder of the Fund, you incur two types of costs: (1) transaction costs, including exchange fees and sales charges (loads) on purchases (as applicable), and (2) ongoing costs, including management fees, distribution and/or service (12b-1) fees, and other Fund expenses (as applicable). This example is intended to help you understand your ongoing costs (in dollars) of investing in the Fund and to compare these costs with the ongoing costs of investing in other Funds. The example is based on an investment of $1,000 made at the beginning of the six-month period and held for the entire period from January 1, 2013, to June 30, 2013.
This example illustrates your Fund’s ongoing costs in two ways:
Actual Expenses
The second and third data columns in the table below provide information about actual account values and actual expenses. You may use the information in these columns, together with the amount you invested, to estimate the expenses that you paid during the six months ended June 30, 2013. Simply divide your account value by $1,000 (for example, an $8,600 account value divided by $1,000 = 8.6), then
multiply the result by the number under the heading entitled “Expenses Paid During Period” to estimate the expenses you paid on your account during this period.
Hypothetical Example for Comparison Purposes
The fourth and fifth data columns in the table below provide information about hypothetical account values and hypothetical expenses based on the Fund’s actual expense ratio and an assumed rate of return of 5% per year before expenses, which is not the Fund’s actual return. The hypothetical account values and expenses may not be used to estimate the actual ending account balances or expenses you paid for the six-month period shown. You may use this information to compare the ongoing costs of investing in the Fund with the ongoing costs of investing in other Funds. To do so, compare this 5% hypothetical example with the 5% hypothetical examples that appear in the shareholder reports of the other Funds.
Please note that the expenses shown in the table are meant to highlight your ongoing costs only and do not reflect any transactional costs, such as exchange fees or sales charges (loads). Therefore, the fourth and fifth data columns of the table are useful in comparing ongoing costs only and will not help you determine the relative total costs of owning different funds. In addition, if these transactional costs were included, your costs would have been higher.
| Share Class | Beginning Account Value 1/1/131 | Ending Account Value (Based on Actual Returns and Expenses) 6/30/13 | Expenses During | Ending Account Value (Based on Hypothetical 5% Annualized Return and Actual Expenses) 6/30/13 | Expenses Paid During Period2 | |||||||||||||||
| Investor Class Shares3 | $ | 1,000.00 | $ | 1,015.10 | $ | 7.96 | $ | 1,014.40 | $ | 7.96 | ||||||||||
| Class A Shares | $ | 1,000.00 | $ | 1,051.30 | $ | 5.95 | $ | 1,019.00 | $ | 5.86 | ||||||||||
| Class B Shares3 | $ | 1,000.00 | $ | 1,011.60 | $ | 11.32 | $ | 1,011.10 | $ | 11.32 | ||||||||||
| Class C Shares3 | $ | 1,000.00 | $ | 1,011.60 | $ | 11.32 | $ | 1,011.10 | $ | 11.32 | ||||||||||
| Class I Shares | $ | 1,000.00 | $ | 1,052.60 | $ | 4.73 | $ | 1,020.20 | $ | 4.66 | ||||||||||
| Class R2 Shares3 | $ | 1,000.00 | $ | 1,017.10 | $ | 5.86 | $ | 1,016.50 | $ | 5.85 | ||||||||||
| 1. | Investor Class, Class B, Class C, and Class R2 shares were first offered as of the close of business on January 18, 2013. |
| 2. | Expenses are equal to the Fund’s annualized expense ratio of each class (1.77% for Investor Class, 1.17% for Class A, 2.52% for Class B, 2.52% for Class C, 0.93% for Class I and 1.30% for Class R2) multiplied by the average account value over the period, divided by 365 and multiplied by 181 for Class A and Class I and 163 days for Investor Class, Class B, Class C and Class R2 (to reflect the six-month period). The table above represents the actual expenses incurred during the six-month period. |
| 3. | Expenses paid during the period reflect ongoing costs for the period from inception through June 30, 2013. Had these shares been offered for the full six-month period ended June 30, 2013, and had the Fund provided a hypothetical 5% annualized return, expenses paid during the period would have been $8.85 for Investor Class, $12.57 for Class B and Class C, and $6.51 for Class R2 and the ending account value would have been $1,016.00 for Investor Class, $1,012.30 for Class B and Class C, and $1,018.30 for Class R2. |
| mainstayinvestments.com | 7 |
Industry Composition as of June 30, 2013 (Unaudited)
| Internet Software & Services | 11.0 | % | ||
| IT Services | 7.0 | |||
| Textiles, Apparel & Luxury Goods | 6.1 | |||
| Health Care Equipment & Supplies | 5.3 | |||
| Communications Equipment | 5.2 | |||
| Chemicals | 5.0 | |||
| Health Care Providers & Services | 4.7 | |||
| Software | 4.4 | |||
| Oil, Gas & Consumable Fuels | 3.8 | |||
| Beverages | 3.7 | |||
| Media | 3.7 | |||
| Computers & Peripherals | 3.6 | |||
| Specialty Retail | 3.3 | |||
| Biotechnology | 2.9 | |||
| Tobacco | 2.9 | |||
| Energy Equipment & Services | 2.7 | |||
| Construction & Engineering | 2.2 |
| Semiconductors & Semiconductor Equipment | 2.1 | % | ||
| Real Estate Investment Trusts | 2.0 | |||
| Trading Companies & Distributors | 2.0 | |||
| Internet & Catalog Retail | 1.9 | |||
| Metals & Mining | 1.9 | |||
| Auto Components | 1.7 | |||
| Machinery | 1.6 | |||
| Pharmaceuticals | 1.3 | |||
| Consumer Finance | 1.1 | |||
| Food Products | 1.1 | |||
| Diversified Financial Services | 1.0 | |||
| Aerospace & Defense | 0.9 | |||
| Capital Markets | 0.9 | |||
| Electrical Equipment | 0.9 | |||
| Multiline Retail | 0.8 | |||
| Short-Term Investment | 3.0 | |||
| Other Assets, Less Liabilities | –1.7 | |||
|
| |||
| 100.0 | % | |||
|
|
See Portfolio of Investments beginning on page 11 for specific holdings within these categories.
Top Ten Holdings as of June 30, 2013 (excluding short-term investment) (Unaudited)
| 1. | Google, Inc. Class A |
| 2. | QUALCOMM, Inc. |
| 3. | Western Union Co. (The) |
| 4. | Visa, Inc. Class A |
| 5. | Cobalt International Energy, Inc. |
| 6. | Sherwin-Williams Co. (The) |
| 7. | Diageo PLC, Sponsored ADR |
| 8. | Philip Morris International, Inc. |
| 9. | Hologic, Inc. |
| 10. | Walt Disney Co. (The) |
| 8 | MainStay Cornerstone Growth Fund |
Portfolio Management Discussion and Analysis (Unaudited)
Questions answered by portfolio manager Thomas G. Kamp, CFA, of Cornerstone Capital Management LLC, the Fund’s Subadvisor.
How did MainStay Cornerstone Growth Fund perform relative to its benchmark and peers during the 12 months ended June 30, 2013?
Excluding all sales charges, MainStay Cornerstone Growth Fund returned 9.34% for Investor Class shares, 9.64% for Class A shares and 8.51% for Class B and Class C shares for the 12 months ended June 30, 2013. Over the same period, Class I shares returned 9.91% and Class R2 shares returned 9.50%. During the 12 months ended June 30, 2013, all share classes underperformed the 17.07% return of the Russell 1000® Growth Index,1 which is the Fund’s broad-based securities-market index. Over the same period, all share classes underperformed the 15.85% return of the average Lipper2 large-cap growth fund. See page 5 for Fund returns with applicable sales charges.
What factors affected the Fund’s relative performance during the reporting period?
We entered the reporting period with caution. In our opinion, the U.S. government was following an unsustainable path that would likely lead to equity market volatility, especially in light of economic and political challenges elsewhere in the world. We have been and continue to be pessimistic about the prospects for meaningful spending cuts. As a result, we anticipated a series of cliffs, deadlines and Band-Aid solutions that would do little to solve our nation’s structural problems.
We underestimated the willingness of investors to ignore these structural problems by bidding valuations higher, in many cases on reduced earnings expectations. The lesson we must take away is “Don’t fight the Federal Reserve”—especially when central banks around the world seem to be aggressively monetizing their debt, injecting hundreds of billions of dollars of liquidity into the financial system.
Our cautionary stance resulted in the Fund’s underperformance of the Russell 1000® Growth Index in a robustly rising stock market. We sought safety in stocks we thought offered protection because of low valuations and high cash-flow generation. We sold or steered clear of many growth stocks because we viewed their valuations as high, but then saw their valuations rise.
During the reporting period, which sectors were the strongest positive contributors to the Fund’s relative performance and which sectors were particularly weak?
During the reporting period, information technology made the strongest positive sector contribution relative to the Russell 1000® Growth Index, primarily because of stock selection. (Contributions take weightings and total returns into account.) Financials also contributed modestly to relative returns, primarily as a result of stock selection.
The Fund’s weakest-contributing sector relative to the Russell 1000® Growth Index was consumer discretionary, primarily as a result of stock selection. In the health care sector, stock selection detracted from relative performance. The industrials sector was the third-weakest contributor, with stock selection and an underweight position hurting relative performance.
During the reporting period, which individual stocks made the strongest contributions to the Fund’s absolute performance and which stocks detracted the most?
Search engine company Google was the strongest positive contributor to the Fund’s absolute performance. The stock rallied on prospects for accelerated growth from mobile and new product opportunities.
Retail electronic payments company Visa was the next-strongest contributor to absolute performance. Visa continued to deliver high revenue growth with strong operating margin expansion and shareholder-friendly capital deployment. These fundamentals combined to generate high rates of earnings-per-share growth.
Global diversified technology and industrial company Johnson Controls was also a strong contributor to absolute performance during the reporting period. We trimmed the Fund’s position in the stock during the period as it approached what we viewed as its fair value. Nevertheless, we continue to see longer-term value in the stock, assuming execution in Europe and divestitures of underperforming segments.
Computers & peripherals company Apple was the weakest contributor to the Fund’s absolute performance, and the stock was no longer held in the Fund at the end of the reporting period. The weak contribution resulted from concerns about saturation of the high-end smart phone market, delays in striking a distribution deal with China Mobile, and iPhone inventory buildup in the distribution channel.
Online education company Apollo Group was the second-weakest contributor to the Fund’s absolute performance and was no longer held in the Fund at the end of the reporting period. We eliminated our position in Apollo Group because of a growing realization that the online education industry is facing increasing competition from traditional not-for-profit schools and because the company intends to invest in international operations.
Cardiovascular device company Edwards Lifesciences was another weak contributor during the reporting period. The company missed sales and earnings estimates and lowered 2013 guidance primarily because the outlook weakened for U.S. transcatheter heart valves, a key product and market. Nevertheless, we see potential in the company, and the Fund continued to hold the stock at the end of the reporting period.
| 1. | See footnote on page 6 for more information on the Russell 1000® Growth Index. |
| 2. | See footnote on page 6 for more information on Lipper Inc. |
| mainstayinvestments.com | 9 |
Did the Fund make any significant purchases or sales during the reporting period?
We eliminated our position in Apple because of concerns about saturation in the high-end smart phone market, delays in striking a distribution deal with China Mobile, and iPhone inventory buildup in the distribution channel.
We eliminated the Fund’s position in Chinese Internet search provider Baidu because of concerns that the incremental investments required to expand its mobile business and cloud services would lead to negative estimate revisions.
We also eliminated the Fund’s holdings in health benefit company WellPoint as the valuation recovered toward our price target. We anticipated that membership among small businesses would be volatile as the health care exchanges begin.
Finally, we eliminated our position in Apollo Group because of a growing realization that the online education industry is facing increasing competition from traditional not-for-profit schools and because the company intends to invest in international operations.
We added a position in Edwards Lifesciences during the reporting period. We anticipated accelerated procedure volume after a heavy period of training. Another new addition was biopharmaceutical company Gilead Sciences. We liked the promise of Sofusbuvir, a treatment for hepatitis C. We believed that the new drug might lead to high earnings growth and rising estimates for much of this decade. The Fund also added a position in industrial equipment company United Rentals. We were attracted to the stock because the company is focused on the United States market and has no exposure to China. The stock gave the Fund upside to nonresidential construction acceleration in addition to increases in industrial and energy capital expenditures. We also added professional social networking company LinkedIn. The company is a leading provider of human
resource recruiting services that is disintermediating traditional recruitment at a lower cost. The Internet company is leveraging its growing user base to drive advertising and revenue from subscriptions.
How did the Fund’s sector weightings change during the reporting period?
In the financials sector, the Fund moved from a significantly underweight position relative to the Russell 1000® Growth Index to a slightly overweight position during the reporting period. The Fund started the reporting period with a modestly underweight position in health care but moved to a meaningfully overweight position at the end of June. Another increase in sector weightings came in the materials sector, adding to an already meaningfully overweight position.
In the industrials sector, the Fund moved from an underweight position relative to the Russell 1000® Growth Index to a dramatically underweight position. The Fund cut its dramatically overweight position in the energy sector to a meaningfully overweight position. In the consumer discretionary sector, the Fund moved from a significantly overweight position to a modestly overweight position.
How was the Fund positioned at the end of June 2013?
As of June 30, 2013, the Fund held a significantly overweight position relative to the Russell 1000® Growth Index in information technology and significantly overweight positions in materials and energy. As of the same date, the Fund held significantly underweight positions in industrials and consumer staples and a significantly underweight position in telecommunication services. The telecommunication services underweight resulted from not owning any stocks in the sector because these stocks did not meet the Fund’s investment criteria.
The opinions expressed are those of the portfolio manager as of the date of this report and are subject to change. There is no guarantee that any forecasts made will come to pass. This material does not constitute investment advice and is not intended as an endorsement of any specific investment.
| 10 | MainStay Cornerstone Growth Fund |
Portfolio of Investments June 30, 2013
| Shares | Value | |||||||
| Common Stocks 98.7%† | ||||||||
Aerospace & Defense 0.9% | ||||||||
Textron, Inc. | 334,911 | $ | 8,724,432 | |||||
|
| |||||||
Auto Components 1.7% | ||||||||
Johnson Controls, Inc. | 496,463 | 17,768,411 | ||||||
|
| |||||||
Beverages 3.7% | ||||||||
Coca-Cola Co. (The) | 198,587 | 7,965,324 | ||||||
¨Diageo PLC, Sponsored ADR | 256,741 | 29,512,378 | ||||||
|
| |||||||
| 37,477,702 | ||||||||
|
| |||||||
Biotechnology 2.9% | ||||||||
Celgene Corp. (a) | 78,584 | 9,187,255 | ||||||
Gilead Sciences, Inc. (a) | 397,407 | 20,351,213 | ||||||
|
| |||||||
| 29,538,468 | ||||||||
|
| |||||||
Capital Markets 0.9% | ||||||||
Morgan Stanley | 368,533 | 9,003,261 | ||||||
|
| |||||||
Chemicals 5.0% | ||||||||
Mosaic Co. (The) | 378,582 | 20,371,497 | ||||||
¨Sherwin-Williams Co. (The) | 171,383 | 30,266,238 | ||||||
|
| |||||||
| 50,637,735 | ||||||||
|
| |||||||
Communications Equipment 5.2% | ||||||||
¨QUALCOMM, Inc. | 869,520 | 53,110,282 | ||||||
|
| |||||||
Computers & Peripherals 3.6% | ||||||||
NetApp, Inc. (a) | 627,680 | 23,713,751 | ||||||
Stratasys, Ltd. (a) | 153,622 | 12,864,306 | ||||||
|
| |||||||
| 36,578,057 | ||||||||
|
| |||||||
Construction & Engineering 2.2% | ||||||||
Fluor Corp. | 370,091 | 21,950,097 | ||||||
|
| |||||||
Consumer Finance 1.1% | ||||||||
Capital One Financial Corp. | 179,477 | 11,272,950 | ||||||
|
| |||||||
Diversified Financial Services 1.0% | ||||||||
CME Group, Inc. | 137,036 | 10,411,995 | ||||||
|
| |||||||
Electrical Equipment 0.9% | ||||||||
Rockwell Automation, Inc. | 112,890 | 9,385,675 | ||||||
|
| |||||||
Energy Equipment & Services 2.7% | ||||||||
Schlumberger, Ltd. | 382,322 | 27,397,194 | ||||||
|
| |||||||
Food Products 1.1% | ||||||||
Mondelez International, Inc. Class A | 392,535 | 11,199,024 | ||||||
|
| |||||||
| Shares | Value | |||||||
Health Care Equipment & Supplies 5.3% |
| |||||||
Edwards Lifesciences Corp. (a) | 392,173 | $ | 26,354,026 | |||||
¨Hologic, Inc. (a) | 1,440,941 | 27,810,161 | ||||||
|
| |||||||
| 54,164,187 | ||||||||
|
| |||||||
Health Care Providers & Services 4.7% | ||||||||
Catamaran Corp. (a) | 304,382 | 14,829,491 | ||||||
Express Scripts Holding Co. (a) | 366,223 | 22,592,297 | ||||||
WellPoint, Inc. | 123,089 | 10,073,604 | ||||||
|
| |||||||
| 47,495,392 | ||||||||
|
| |||||||
Internet & Catalog Retail 1.9% | ||||||||
Amazon.com, Inc. (a) | 50,578 | 14,045,005 | ||||||
Shutterfly, Inc. (a) | 99,923 | 5,574,704 | ||||||
|
| |||||||
| 19,619,709 | ||||||||
|
| |||||||
Internet Software & Services 11.0% | ||||||||
eBay, Inc. (a) | 309,917 | 16,028,907 | ||||||
¨Google, Inc. Class A (a) | 74,136 | 65,267,110 | ||||||
LinkedIn Corp. Class A (a) | 89,400 | 15,940,020 | ||||||
Zillow, Inc. Class A (a) | 253,185 | 14,254,316 | ||||||
|
| |||||||
| 111,490,353 | ||||||||
|
| |||||||
IT Services 7.0% | ||||||||
¨Visa, Inc. Class A | 177,485 | 32,435,384 | ||||||
¨ Western Union Co. (The) | 2,247,550 | 38,455,580 | ||||||
|
| |||||||
| 70,890,964 | ||||||||
|
| |||||||
Machinery 1.6% | ||||||||
Joy Global, Inc. | 344,378 | 16,712,664 | ||||||
|
| |||||||
Media 3.7% | ||||||||
Comcast Corp. Class A | 245,543 | 10,283,341 | ||||||
¨ Walt Disney Co. (The) | 434,982 | 27,469,113 | ||||||
|
| |||||||
| 37,752,454 | ||||||||
|
| |||||||
Metals & Mining 1.9% | ||||||||
Freeport-McMoRan Copper & Gold, Inc. | 691,041 | 19,079,642 | ||||||
|
| |||||||
Multiline Retail 0.8% | ||||||||
Dollar General Corp. (a) | 154,828 | 7,807,976 | ||||||
|
| |||||||
Oil, Gas & Consumable Fuels 3.8% | ||||||||
Anadarko Petroleum Corp. | 69,944 | 6,010,288 | ||||||
¨Cobalt International Energy, Inc. (a) | 1,210,712 | 32,168,618 | ||||||
|
| |||||||
| 38,178,906 | ||||||||
|
| |||||||
Pharmaceuticals 1.3% | ||||||||
Teva Pharmaceutical Industries, Ltd., Sponsored ADR | 335,740 | 13,161,008 | ||||||
|
| |||||||
Real Estate Investment Trusts 2.0% | ||||||||
Camden Property Trust | 289,880 | 20,042,303 | ||||||
|
| |||||||
| † | Percentages indicated are based on Fund net assets. |
| ¨ | Among the Portfolio’s 10 largest holdings, as of June 30, 2013, excluding short-term investment. May be subject to change daily. |
| The notes to the financial statements are an integral part of, and should be read in conjunction with, the financial statements. | mainstayinvestments.com | 11 |
Portfolio of Investments June 30, 2013 (continued)
| Shares | Value | |||||||
| Common Stocks (continued) | ||||||||
Semiconductors & Semiconductor Equipment 2.1% |
| |||||||
Altera Corp. | 645,233 | $ | 21,286,237 | |||||
|
| |||||||
Software 4.4% | ||||||||
Citrix Systems, Inc. (a) | 363,792 | 21,947,571 | ||||||
Salesforce.com, Inc. (a) | 603,070 | 23,025,213 | ||||||
|
| |||||||
| 44,972,784 | ||||||||
|
| |||||||
Specialty Retail 3.3% | ||||||||
Dick’s Sporting Goods, Inc. | 405,456 | 20,297,127 | ||||||
TJX Cos., Inc. | 275,324 | 13,782,720 | ||||||
|
| |||||||
| 34,079,847 | ||||||||
|
| |||||||
Textiles, Apparel & Luxury Goods 6.1% |
| |||||||
Burberry Group PLC, Sponsored ADR | 313,860 | 12,931,032 | ||||||
Michael Kors Holdings, Ltd. (a) | 155,914 | 9,669,786 | ||||||
NIKE, Inc. Class B | 283,102 | 18,027,935 | ||||||
Ralph Lauren Corp. | 123,139 | 21,394,170 | ||||||
|
| |||||||
| 62,022,923 | ||||||||
|
| |||||||
Tobacco 2.9% | ||||||||
¨ Philip Morris International, Inc. | 337,582 | 29,241,353 | ||||||
|
| |||||||
Trading Companies & Distributors 2.0% |
| |||||||
United Rentals, Inc. (a) | 401,168 | 20,022,295 | ||||||
|
| |||||||
Total Common Stocks | 1,002,476,280 | |||||||
|
| |||||||
| Principal Amount | Value | |||||||
| Short-Term Investment 3.0% | ||||||||
Repurchase Agreement 3.0% | ||||||||
State Street Bank and Trust Co. | $ | 30,280,090 | $ | 30,280,090 | ||||
|
| |||||||
Total Short-Term Investment | 30,280,090 | |||||||
|
| |||||||
Total Investments | 101.7 | % | 1,032,756,370 | |||||
Other Assets, Less Liabilities | (1.7 | ) | (17,456,740 | ) | ||||
Net Assets | 100.0 | % | $ | 1,015,299,630 | ||||
| (a) | Non-income producing security. |
| (b) | As of June 30, 2013, cost is $983,602,514 for federal income tax purposes and net unrealized appreciation is as follows: |
Gross unrealized appreciation | $ | 82,462,870 | ||
Gross unrealized depreciation | (33,309,014 | ) | ||
|
| |||
Net unrealized appreciation | $ | 49,153,856 | ||
|
|
| The | following abbreviation is used in the above portfolio: |
| ADR | —American Depositary Receipt |
The following is a summary of the fair valuations according to the inputs used as of June 30, 2013, for valuing the Fund’s assets.
Asset Valuation Inputs
Description | Quoted Prices in Active Markets for Assets (Level 1) | Significant (Level 2) | Significant (Level 3) | Total | ||||||||||||
| Investments in Securities (a) | ||||||||||||||||
| Common Stocks | $ | 1,002,476,280 | $ | — | $ | — | $ | 1,002,476,280 | ||||||||
| Short-Term Investment | ||||||||||||||||
Repurchase Agreement | — | 30,280,090 | — | 30,280,090 | ||||||||||||
|
|
|
|
|
|
|
| |||||||||
Total Investments in Securities | $ | 1,002,476,280 | $ | 30,280,090 | $ | — | $ | 1,032,756,370 | ||||||||
|
|
|
|
|
|
|
| |||||||||
| (a) | For a complete listing of investments and their industries, see the Portfolio of Investments. |
The Fund recognizes transfers between levels as of the beginning of the period.
For the year ended June 30, 2013, the Fund did not have any transfers between Level 1 and Level 2 fair value measurements. (See Note 2)
As of June 30, 2013, the Fund did not hold any investments with significant unobservable inputs (Level 3). (See Note 2)
| 12 | MainStay Cornerstone Growth Fund | The notes to the financial statements are an integral part of, and should be read in conjunction with, the financial statements. |
Statement of Assets and Liabilities as of June 30, 2013
| Assets | ||||
Investment in securities, at value | $ | 1,032,756,370 | ||
Receivables: | ||||
Investment securities sold | 1,898,682 | |||
Dividends and interest | 1,707,990 | |||
Fund shares sold | 1,328,995 | |||
Other assets | 174,050 | |||
|
| |||
Total assets | 1,037,866,087 | |||
|
| |||
| Liabilities | ||||
Payables: | ||||
Investment securities purchased | 19,230,141 | |||
Fund shares redeemed | 1,441,355 | |||
Transfer agent (See Note 3) | 1,113,337 | |||
Manager (See Note 3) | 514,258 | |||
NYLIFE Distributors (See Note 3) | 155,494 | |||
Professional fees | 65,789 | |||
Shareholder communication | 28,692 | |||
Custodian | 3,600 | |||
Trustees | 1,208 | |||
Accrued expenses | 12,583 | |||
|
| |||
Total liabilities | 22,566,457 | |||
|
| |||
Net assets | $ | 1,015,299,630 | ||
|
| |||
| Net Assets Consist of | ||||
Shares of beneficial interest outstanding (par value of $.001 per share) unlimited number of shares authorized | $ | 34,049 | ||
Additional paid-in capital | 921,706,488 | |||
|
| |||
| 921,740,537 | ||||
Undistributed net investment income | 806,187 | |||
Accumulated net realized gain (loss) on investments | 42,988,319 | |||
Net unrealized appreciation (depreciation) on investments | 49,764,587 | |||
|
| |||
Net assets | $ | 1,015,299,630 | ||
|
| |||
Investor Class | ||||
Net assets applicable to outstanding shares | $ | 233,119,650 | ||
|
| |||
Shares of beneficial interest outstanding | 7,864,455 | |||
|
| |||
Net asset value per share outstanding | $ | 29.64 | ||
Maximum sales charge (5.50% of offering price) | 1.73 | |||
|
| |||
Maximum offering price per share outstanding | $ | 31.37 | ||
|
| |||
Class A | ||||
Net assets applicable to outstanding shares | $ | 272,378,007 | ||
|
| |||
Shares of beneficial interest outstanding | 9,164,132 | |||
|
| |||
Net asset value per share outstanding | $ | 29.72 | ||
Maximum sales charge (5.50% of offering price) | 1.73 | |||
|
| |||
Maximum offering price per share outstanding | $ | 31.45 | ||
|
| |||
Class B | ||||
Net assets applicable to outstanding shares | $ | 55,523,655 | ||
|
| |||
Shares of beneficial interest outstanding | 1,879,517 | |||
|
| |||
Net asset value per share outstanding | $ | 29.54 | ||
|
| |||
Class C | ||||
Net assets applicable to outstanding shares | $ | 3,850,711 | ||
|
| |||
Shares of beneficial interest outstanding | 130,352 | |||
|
| |||
Net asset value and offering price per share outstanding | $ | 29.54 | ||
|
| |||
Class I | ||||
Net assets applicable to outstanding shares | $ | 450,402,173 | ||
|
| |||
Shares of beneficial interest outstanding | 15,010,053 | |||
|
| |||
Net asset value and offering price per share outstanding | $ | 30.01 | ||
|
| |||
Class R2 | ||||
Net assets applicable to outstanding shares | $ | 25,434 | ||
|
| |||
Shares of beneficial interest outstanding | 856 | |||
|
| |||
Net asset value and offering price per share outstanding (a) | $ | 29.70 | ||
|
|
| (a) | The difference in the NAV recalculation and NAV stated is caused by rounding differences. |
| The notes to the financial statements are an integral part of, and should be read in conjunction with, the financial statements. | mainstayinvestments.com | 13 |
Statement of Operations for the year ended June 30, 2013
| Investment Income (Loss) | ||||
Income | ||||
Dividends (a) | $ | 9,561,599 | ||
Interest | 467 | |||
|
| |||
Total income | 9,562,066 | |||
|
| |||
Expenses | ||||
Manager (See Note 3) | 4,297,560 | |||
Transfer agent (See Note 3) | 1,875,244 | |||
Distribution/Service—Investor Class (See Note 3) | 265,096 | |||
Distribution/Service—Class A (See Note 3) | 341,615 | |||
Distribution and service—Class B (See Note 3) | 272,746 | |||
Distribution/Service—Class C (See Note 3) | 18,399 | |||
Distribution/Service—Class R2 (See Note 3) | 28 | |||
Administration and accounting (See Note 3) | 218,416 | |||
Shareholder communication | 133,460 | |||
Professional fees | 114,708 | |||
Registration | 85,284 | |||
Trustees | 58,411 | |||
Custodian | 31,775 | |||
Miscellaneous | 57,179 | |||
|
| |||
Total expenses before waiver/reimbursement | 7,769,921 | |||
Expense waiver/reimbursement from Manager (See Note 3) | (119,144 | ) | ||
|
| |||
Net expenses | 7,650,777 | |||
|
| |||
Net investment income (loss) | 1,911,289 | |||
|
| |||
| Realized and Unrealized Gain (Loss) on Investments | ||||
Net realized gain (loss) on investments | 58,502,775 | |||
Net change in unrealized appreciation (depreciation) on investments | (17,153,257 | ) | ||
|
| |||
Net realized and unrealized gain (loss) on investments | 41,349,518 | |||
|
| |||
Net increase (decrease) in net assets resulting from operations | $ | 43,260,807 | ||
|
| |||
| (a) | Dividends recorded net of foreign withholding taxes in the amount of $49,916. |
| 14 | MainStay Cornerstone Growth Fund | The notes to the financial statements are an integral part of, and should be read in conjunction with, the financial statements. |
Statements of Changes in Net Assets
for the years ended June 30, 2013 and June 30, 2012
| 2013 | 2012* | |||||||
| Increase (Decrease) in Net Assets | ||||||||
Operations: | ||||||||
Net investment income (loss) | $ | 1,911,289 | $ | (225,794 | ) | |||
Net realized gain (loss) on investments | 58,502,775 | 21,596,363 | ||||||
Net change in unrealized appreciation (depreciation) on investments | (17,153,257 | ) | (19,331,846 | ) | ||||
|
| |||||||
Net increase (decrease) in net assets resulting from operations | 43,260,807 | 2,038,723 | ||||||
|
| |||||||
Dividends and distributions | ||||||||
From net investment income: | ||||||||
Class A | (72,827 | ) | — | |||||
Class I | (976,716 | ) | — | |||||
|
| |||||||
| (1,049,543 | ) | — | ||||||
|
| |||||||
From net realized gain on investments: | ||||||||
Class A | (2,913,456 | ) | (7,283,246 | ) | ||||
Class I | (23,470,802 | ) | (6,166,482 | ) | ||||
|
| |||||||
| (26,384,258 | ) | (13,449,728 | ) | |||||
|
| |||||||
Total dividends and distributions to shareholders | (27,433,801 | ) | (13,449,728 | ) | ||||
|
| |||||||
Capital share transactions: | ||||||||
Net proceeds from sale of shares | 224,733,585 | 236,561,174 | ||||||
Net asset value of shares issued in connection with the acquisition of MainStay Growth Equity Fund (See Note 9) | 539,595,303 | — | ||||||
Net asset value of shares issued to shareholders in reinvestment of dividends and distributions | 25,434,466 | 12,537,211 | ||||||
Cost of shares redeemed | (115,106,399 | ) | (211,414,962 | ) | ||||
|
| |||||||
Increase (decrease) in net assets derived from capital share transactions | 674,656,955 | 37,683,423 | ||||||
|
| |||||||
Net increase (decrease) in net assets | 690,483,961 | 26,272,418 | ||||||
| Net Assets | ||||||||
Beginning of year | 324,815,669 | 298,543,251 | ||||||
|
| |||||||
End of year | $ | 1,015,299,630 | $ | 324,815,669 | ||||
|
| |||||||
Undistributed net investment income at end of year | $ | 806,187 | $ | — | ||||
|
| |||||||
| * | This year was audited by a predecessor audit firm whose opinion was unqualified. |
| The notes to the financial statements are an integral part of, and should be read in conjunction with, the financial statements. | mainstayinvestments.com | 15 |
Financial Highlights selected per share data and ratios
| Investor Class | ||||
| January 18, 2013** through June 30, | ||||
| 2013 | ||||
Net asset value at beginning of period | $ | 29.20 | † | |
|
| |||
Net investment income (loss) | (0.03 | )(a) | ||
Net realized and unrealized gain (loss) on investments | 0.47 | |||
|
| |||
Total from investment operations | 0.44 | |||
|
| |||
Net asset value at end of period | $ | 29.64 | ||
|
| |||
Total investment return | 1.51 | % (b)(c) | ||
Ratio of expenses to average net assets: | ||||
Before expense waivers and reimbursements | 1.77 | % †† | ||
After expense waivers and reimbursements | 1.77 | % †† | ||
Ratio of net investment income (loss) to average net assets: | ||||
Before expense waivers and reimbursements | (0.25 | %)†† | ||
After expense waivers and reimbursements | (0.25 | %)†† | ||
Portfolio turnover rate | 98 | % | ||
Net assets at end of period (in 000’s) | $ | 233,120 | ||
| ** | Inception date. |
| † | Based on the net asset value of Class A as of January 18, 2013. |
| †† | Annualized. |
| (a) | Per share data based on average shares outstanding during the period. |
| (b) | Total investment return is not annualized. |
| (c) | Total investment return may reflect adjustments to conform to generally accepted accounting principles. |
| Class A | ||||||||||||||||||||
Year ended June 30, | ||||||||||||||||||||
| 2013 | 2012*** | 2011*** | 2010*** | 2009*** | ||||||||||||||||
Net asset value at beginning of year | $ | 29.41 | $ | 30.71 | $ | 21.10 | $ | 20.24 | $ | 26.43 | ||||||||||
|
|
|
|
|
|
|
|
|
| |||||||||||
Net investment income (loss) (a) | 0.10 | (0.07 | ) | (0.18 | ) | (0.12 | ) | (0.06 | ) | |||||||||||
Net realized and unrealized gain (loss) on investments | 2.57 | 0.16 | 9.79 | 0.98 | (6.13 | ) | ||||||||||||||
|
|
|
|
|
|
|
|
|
| |||||||||||
Total from investment operations | 2.67 | 0.09 | 9.61 | 0.86 | (6.19 | ) | ||||||||||||||
|
|
|
|
|
|
|
|
|
| |||||||||||
Less dividends and distributions: | ||||||||||||||||||||
From net investment income | (0.06 | ) | — | — | — | — | ||||||||||||||
From net realized gain on investments | (2.30 | ) | (1.39 | ) | — | — | — | |||||||||||||
|
|
|
|
|
|
|
|
|
| |||||||||||
Total dividends and distributions | (2.36 | ) | (1.39 | ) | — | — | — | |||||||||||||
|
|
|
|
|
|
|
|
|
| |||||||||||
Net asset value at end of year | $ | 29.72 | $ | 29.41 | $ | 30.71 | $ | 21.10 | $ | 20.24 | ||||||||||
|
|
|
|
|
|
|
|
|
| |||||||||||
Total investment return | 9.64 | % | 0.72 | % | 45.55 | % | 4.25 | % | (23.42 | %) | ||||||||||
Ratio of expenses to average net assets: | ||||||||||||||||||||
Before expense waivers and reimbursements | 1.21 | % | 1.34 | % | 1.33 | % | 1.39 | % | 1.54 | % | ||||||||||
After expense waivers and reimbursements | 1.19 | % | 1.34 | % | 1.40 | % | 1.48 | % | 1.50 | % | ||||||||||
Ratio of net investment income (loss) to average net assets: | ||||||||||||||||||||
Before expense waivers and reimbursements | 0.32 | % | (0.24 | %) | (0.58 | %) | (0.42 | %) | (0.37 | %) | ||||||||||
After expense waivers and reimbursements | 0.34 | % | (0.24 | %) | (0.65 | %) | (0.51 | %) | (0.33 | %) | ||||||||||
Portfolio turnover rate | 98 | % | 114 | % | 120 | % | 132 | % | 192 | % | ||||||||||
Net assets at end of year (in 000’s) | $ | 272,378 | $ | 35,680 | $ | 155,583 | $ | 171,330 | $ | 106,119 | ||||||||||
| *** | These years were audited by a predecessor audit firm whose opinion was unqualified. |
| (a) | Per share data based on average shares outstanding during the year. |
| 16 | MainStay Cornerstone Growth Fund | The notes to the financial statements are an integral part of, and should be read in conjunction with, the financial statements. |
Financial Highlights selected per share data and ratios
| Class B | Class C | |||||||
| January 18, 2013** through June 30, | January 18, 2013** through June 30, | |||||||
2013 | 2013 | |||||||
Net asset value at beginning of period | $ | 29.20 | † | $ | 29.20 | † | ||
|
|
|
| |||||
Net investment income (loss) | (0.13 | )(a) | (0.13 | )(a) | ||||
Net realized and unrealized gain (loss) on investments | 0.47 | 0.47 | ||||||
|
|
|
| |||||
Total from investment operations | 0.34 | 0.34 | ||||||
|
|
|
| |||||
Net asset value at end of period | $ | 29.54 | $ | 29.54 | ||||
|
|
|
| |||||
Total investment return | 1.16 | % (b)(c) | 1.16 | % (b)(c) | ||||
Ratios of expenses to average net assets: | ||||||||
Before expense waivers and reimbursements | 2.52 | % †† | 2.52 | % †† | ||||
After expense waivers and reimbursements | 2.52 | % †† | 2.52 | % †† | ||||
Ratios of net investment income (loss) to average net assets: | ||||||||
Before expense waivers and reimbursements | (0.99 | %)†† | (1.00 | %)†† | ||||
After expense waivers and reimbursements | (0.99 | %)†† | (1.00 | %)†† | ||||
Portfolio turnover rate | 98 | % | 98 | % | ||||
Net assets at end of period (in 000’s) | $ | 55,524 | $ | 3,851 | ||||
| ** | Inception date. |
| † | Based on the net asset value of Class A as of January 18, 2013. |
| †† | Annualized. |
| (a) | Per share data based on average shares outstanding during the period. |
| (b) | Total investment return is not annualized. |
| (c) | Total investment return may reflect adjustments to conform to generally accepted accounting principles. |
| Class I | ||||||||||||||||
Year ended June 30, | November 2, 2009** through June 30, | |||||||||||||||
| 2013 | 2012*** | 2011*** | 2010*** | |||||||||||||
Net asset value at beginning of period | $ | 29.63 | $ | 30.84 | $ | 21.14 | $ | 22.64 | ||||||||
|
|
|
|
|
|
|
| |||||||||
Net investment income (loss) (a) | 0.17 | 0.00 | ‡ | (0.11 | ) | (0.04 | ) | |||||||||
Net realized and unrealized gain (loss) on investments | 2.61 | 0.18 | 9.81 | (1.46 | ) | |||||||||||
|
|
|
|
|
|
|
| |||||||||
Total from investment operations | 2.78 | 0.18 | 9.70 | (1.50 | ) | |||||||||||
|
|
|
|
|
|
|
| |||||||||
Less dividends and distributions: | ||||||||||||||||
From net investment income | (0.10 | ) | — | — | — | |||||||||||
From net realized gain on investments | (2.30 | ) | (1.39 | ) | — | — | ||||||||||
|
|
|
|
|
|
|
| |||||||||
Total dividends and distributions | (2.40 | ) | (1.39 | ) | — | — | ||||||||||
|
|
|
|
|
|
|
| |||||||||
Net asset value at end of period | $ | 30.01 | $ | 29.63 | $ | 30.84 | $ | 21.14 | ||||||||
|
|
|
|
|
|
|
| |||||||||
Total investment return | 9.91 | % | 1.02 | % | 45.88 | % | (6.63 | %)(b) | ||||||||
Ratio of expenses to average net assets: | ||||||||||||||||
Before expense waivers and reimbursements | 1.00 | % | 1.10 | % | 1.10 | % | 1.12 | % †† | ||||||||
After expense waivers and reimbursements | 0.97 | % | 1.10 | % | 1.14 | % | 1.20 | % †† | ||||||||
Ratio of net investment income (loss) to average net assets: | ||||||||||||||||
Before expense waivers and reimbursements | 0.55 | % | 0.01 | % | (0.34 | %) | (0.18 | %)†† | ||||||||
After expense waivers and reimbursements | 0.58 | % | 0.01 | % | (0.38 | %) | (0.26 | %)†† | ||||||||
Portfolio turnover rate | 98 | % | 114 | % | 120 | % | 132 | % | ||||||||
Net assets at end of period (in 000’s) | $ | 450,402 | $ | 289,136 | $ | 142,960 | $ | 7,518 | ||||||||
| ** | Inception date. |
| *** | These years were audited by a predecessor audit firm whose opinion was unqualified. |
| †† | Annualized. |
| ‡ | Less than one cent per share. |
| (a) | Per share data based on average shares outstanding during the period. |
| (b) | Total investment return is not annualized. |
| The notes to the financial statements are an integral part of, and should be read in conjunction with, the financial statements. | mainstayinvestments.com | 17 |
Financial Highlights selected per share data and ratios
| Class R2 | ||||
| January 18, 2013** through June 30, | ||||
| 2013 | ||||
Net asset value at beginning of period | $ | 29.20 | † | |
|
| |||
Net investment income (loss) | 0.03 | (a) | ||
Net realized and unrealized gain (loss) on investments | 0.47 | |||
|
| |||
Total from investment operations | 0.50 | |||
|
| |||
Net asset value at end of period | $ | 29.70 | ||
|
| |||
Total investment return | 1.71 | %(b)(c) | ||
Ratio of expenses to average net assets: | ||||
Before expense waivers and reimbursements | 1.30 | %†† | ||
After expense waivers and reimbursements | 1.30 | %†† | ||
Ratio of net investment income (loss) to average net assets: | ||||
Before expense waivers and reimbursements | 0.23 | %†† | ||
After expense waivers and reimbursements | 0.23 | %†† | ||
Portfolio turnover rate | 98 | % | ||
Net assets at end of period (in 000’s) | $ | 25 | ||
| ** | Inception date. |
| † | Based on the net asset value of Class A as of January 18, 2013. |
| †† | Annualized. |
| (a) | Per share data based on average shares outstanding during the period. |
| (b) | Total investment return is not annualized. |
| (c) | Total investment return may reflect adjustments to conform to generally accepted accounting principles. |
| 18 | MainStay Cornerstone Growth Fund | The notes to the financial statements are an integral part of, and should be read in conjunction with, the financial statements. |
Note 1–Organization and Business
MainStay Funds Trust (the “Trust”) was organized as a Delaware statutory trust on April 28, 2009, and is governed by a Declaration of Trust. The Trust is registered under the Investment Company Act of 1940, as amended (the “1940 Act”), as an open-end management investment company, and is comprised of thirty-four funds (collectively referred to as the “Funds”). These financial statements and notes relate only to the MainStay Cornerstone Growth Fund (the “Fund”), a diversified fund. The Fund is successor to Keystone Large Cap Growth Fund (the “Predecessor Fund”), which was a series of a different registered investment company for which Cornerstone Capital Management LLC, a Minnesota limited liability company and the predecessor entity to the Fund’s Subadvisor (as defined in Note 3(A)), served as investment adviser. The financial statements of the Fund reflect the historical results of corresponding shares of the Predecessor Fund prior to its reorganization on January 11, 2013. Upon the completion of the reorganization, the Class A and Class I shares of the Fund assumed the performance, financial and other information of the Predecessor Fund. All information and references to periods prior to January 11, 2013 refer to the Predecessor Fund.
The Fund currently offers six classes of shares. Investor Class, Class B, Class C and Class R2 were first offered as of the close of business on January 18, 2013. Class B shares were closed to new investors as of January 18, 2013, however, existing Class B shareholders continue to be able to add to their existing account. Class A shares commenced operations on August 7, 2006. Class I shares commenced operations on November 2, 2009. Investor Class and Class A shares are offered at net asset value (“NAV”) per share plus an initial sales charge. No sales charge applies to investments of $1 million or more (and certain other qualified purchases) in Investor Class and Class A shares, but a contingent deferred sales charge (“CDSC”) is imposed on certain redemptions made within one year of the date of purchase. Class B and Class C shares are offered at NAV without an initial sales charge, although a declining CDSC may be imposed on redemptions made within six years of the date of purchase of Class B shares and a 1.00% CDSC may be imposed on redemptions made within one year of the date of purchase of Class C shares. Class I and Class R2 shares are offered at NAV and are not subject to a sales charge. Depending upon eligibility, Class B shares convert to either Investor Class or Class A shares at the end of the calendar quarter eight years after the date they were purchased. Additionally, depending upon eligibility, Investor Class shares may convert to Class A shares and Class A shares may convert to Investor Class shares. The six classes of shares have the same voting (except for issues that relate solely to one class), dividend, liquidation and other rights, and the same terms and conditions, except that Class B and Class C shares are subject to higher distribution and/or service fee rates than Investor Class, Class A and Class R2 shares under a distribution plan pursuant to Rule 12b-1 under the 1940 Act. Class I shares are not subject to a distribution and/or service fee. Class R2 shares are subject to a shareholder service fee. This is in addition to any fees paid under a distribution plan, where applicable.
The Fund’s investment objective is to seek long-term growth of capital.
Note 2–Significant Accounting Policies
The Fund prepares its financial statements in accordance with generally accepted accounting principles (“GAAP”) in the United States of America and follows the significant accounting policies described below.
(A) Securities Valuation. Investments are valued as of the close of regular trading on the New York Stock Exchange (“Exchange”) (generally 4:00 p.m. Eastern time) on each day the Fund is open for business (“valuation date”).
The Board of Trustees (the “Board”) has adopted procedures for the valuation of the Fund’s securities and has delegated the responsibility for valuation determination under those procedures to the Valuation Committee of the Fund (the “Valuation Committee”). The Board has authorized the Valuation Committee to appoint a Valuation Sub-Committee (the “Sub-Committee”) to deal in the first instance with questions that arise or cannot be resolved under these procedures. The Sub-Committee meets (in person, via electronic mail or via teleconference) on an as-needed basis. The Valuation Committee meets at a later time, as necessary, to ensure that actions taken by the Sub-Committee were appropriate. The procedures recognize that, subject to the oversight of the Board and unless otherwise noted, the responsibility for day-to-day valuation of portfolio assets (including securities for which market prices are not readily available) rests with New York Life Investment Management LLC (“New York Life Investments” or the “Manager”), aided to whatever extent necessary by the Subadvisor (as defined in Note 3(A)) of the Fund.
To assess the appropriateness of security valuations, the Manager or the Fund’s third party service provider who is subject to oversight by the Manager regularly compares prior day prices, prices on comparable securities and the sale prices to the prior and current day prices and challenges prices exceeding certain tolerance levels with third party pricing services or broker sources. For those securities valued by recommendation, whether through a standardized fair valuation methodology or a fair valuation determination, the Valuation Committee reviews and affirms the reasonableness of the valuation based on such methodologies and determinations on a regular basis after considering all relevant information that is reasonably available.
“Fair value” is defined as the price that the Fund would receive upon selling an investment in an orderly transaction to an independent buyer in the principal or most advantageous market of the investment. Fair value measurements are determined within a framework that has established a three-tier hierarchy which maximizes the use of observable market data and minimizes the use of unobservable inputs to establish classification of fair value measurements for disclosure purposes. “Inputs” refers broadly to the assumptions that market participants would use in pricing the asset or liability, including assumptions about risk, such as the risk inherent in a particular valuation technique used to measure fair value using a pricing model and/or the risk inherent in the inputs for the valuation technique. Inputs may be observable or unobservable. Observable inputs reflect the assumptions market participants would use in pricing the asset or liability based on market data obtained from sources independent of the Fund. Unobservable inputs reflect the Fund’s own assumptions about the assumptions market participants would use in pricing the asset or liability developed based on the information available in the circumstances. The inputs or
| mainstayinvestments.com | 19 |
Notes to Financial Statements (continued)
methodology used for valuing securities may not be an indication of the risks associated with investing in those securities. The three-tier hierarchy of inputs is summarized in the three broad Levels listed below.
| • | Level 1—quoted prices in active markets for identical investments |
| • | Level 2—other significant observable inputs (including quoted prices for similar investments in active markets, interest rates and yield curves, prepayment speeds, credit risks, etc.) |
| • | Level 3—significant unobservable inputs (including the Fund’s own assumptions about the assumptions that market participants would use in determining the fair value of investments) |
The aggregate value by input level, as of June 30, 2013, for the Fund’s investments is included at the end of the Fund’s Portfolio of Investments.
The valuation techniques used by the Fund to measure fair value maximize the use of observable inputs and minimize the use of unobservable inputs. The Fund may utilize third party vendor evaluations, whose prices may be derived from one or more of the following standard inputs:
• Broker Dealer Quotes | • Reported Trades | |
• Two-sided markets | • Issuer Spreads | |
• Bids/Offers | • Benchmark securities | |
• Industry and economic events | • Reference Data (corporate actions or material event notices) | |
• Equity and credit default swap curves | • Monthly payment information |
Securities for which market values cannot be determined using the methodologies described above are valued by methods deemed in good faith by the Fund’s Valuation Committee, following the procedures established by the Board, to represent fair value. Under these procedures, the Fund primarily employs a market-based approach which may use related or comparable assets or liabilities, recent transactions, market multiples, book values, and other relevant information. The Fund may also use an income-based valuation approach in which the anticipated future cash flows of the investment are discounted to calculate fair value. Discounts may also be applied due to the nature or duration of any restrictions on the disposition of the investments. Due to the inherent uncertainty of valuations of such investments, the fair values may differ significantly from the values that would have been used had an active market existed. After the completion of the reorganization the Fund assumed the current fair value methodologies described in this note.
Equity and non-equity securities which may be valued in this manner include, but are not limited to: (i) a security for which the trading has been halted or suspended; (ii) a debt security that has recently gone into default and for which there is not a current market quotation; (iii) a security of an issuer that has entered into a restructuring; (iv) a security that has been de-listed from a national exchange; (v) a security for which the market price is not available from a third party pricing source or, if so provided, does not, in the opinion of the Fund’s Manager or Subadvisor reflect the security’s market value; and (vi) a security whose principal market has been temporarily closed at a time when, under normal conditions, it would be open. Securities for which market quotations or observable inputs are not readily available are generally categorized as Level 3 in the hierarchy. As of June 30, 2013, the Fund did not hold any securities that were fair valued in such a manner.
Certain events may occur between the time that foreign markets close, on which securities held by the Fund principally trade, and the time at which the Fund’s NAV is calculated. These events may include, but are not limited to, situations relating to a single issuer in a market sector, significant fluctuations in U.S. or foreign markets, natural disasters, armed conflicts, governmental actions or other developments not tied directly to the securities markets. Should the Manager or Subadvisor conclude that such events may have affected the accuracy of the last price of such securities reported on the local foreign market, the Manager or Subadvisor may, pursuant to procedures adopted by the Board, adjust the value of the local price to reflect the estimated impact on the price of such securities as a result of such events. In this instance, securities are generally categorized as Level 3 in the hierarchy. Additionally, foreign equity securities are also fair valued whenever the movement of a particular index exceeds certain thresholds. In such cases, the securities are fair valued by applying factors provided by a third party vendor in accordance with the Fund’s policies and procedures and are generally categorized as Level 2 in the hierarchy. As of June 30, 2013, the Fund did not hold any foreign equity securities.
Equity securities and Exchange Traded Funds are valued at the latest quoted sales prices as of the close of regular trading on the Exchange on each valuation date. Securities that are not traded on the valuation date are valued at the mean of the latest quoted bid and ask prices. Prices normally are taken from the principal market in which each security trades. Investments in other mutual funds are valued at their respective NAVs as of the close of the Exchange on the valuation date. These securities are generally categorized as Level 1 in the hierarchy.
Temporary cash investments acquired over 60 days to maturity are valued using the latest bid prices or using valuations based on a matrix system (which considers such factors as security prices, yields, maturities, and ratings), both as furnished by independent pricing services. Other temporary cash investments which mature in 60 days or less (“Short-Term Investments”) are valued at amortized cost. The amortized cost method involves valuing a security at its cost on the date of purchase and thereafter assuming a constant amortization to maturity of the difference between such cost and the value on maturity date. Amortized cost approximates the current fair value of a security. Securities valued at amortized cost are not valued using a quoted price in an active market. These securities are generally categorized as Level 2 in the hierarchy.
(B) Income Taxes. The Fund’s policy is to comply with the requirements of the Internal Revenue Code of 1986, as amended (the “Internal Revenue Code”), applicable to regulated investment companies and to distribute all of the taxable income to the shareholders of the Fund within the allowable time limits. Therefore, no federal, state and local income tax provision is required.
Management evaluates its tax positions to determine if the tax positions taken meet the minimum recognition threshold in connection with accounting for uncertainties in income tax positions taken or expected to be taken for the purposes of measuring and recognizing tax liabilities in the financial statements. Recognition of tax benefits of an uncertain tax position is required only when the position is “more likely than not” to be sustained assuming examination by taxing authorities. Management has analyzed the Fund’s tax positions taken on federal, state and local income tax returns for all open tax years (for up to three tax years), and has concluded that no provision for federal, state and local income tax is
| 20 | MainStay Cornerstone Growth Fund |
required in the Fund’s financial statements. The Fund’s federal, state and local income and federal excise tax returns for tax years for which the applicable statutes of limitations have not expired are subject to examination by the Internal Revenue Service and state and local departments of revenue.
(C) Dividends and Distributions to Shareholders. Dividends and distributions are recorded on the ex-dividend date. The Fund intends to declare and pay dividends of net investment income and distributions of net realized capital and currency gains, if any, annually. Unless the shareholder elects otherwise, all dividends and distributions are reinvested in the same class of shares of the Fund, at NAV. Dividends and distributions to shareholders are determined in accordance with federal income tax regulations and may differ from GAAP.
(D) Security Transactions and Investment Income. The Fund records security transactions on the trade date. Realized gains and losses on security transactions are determined using the identified cost method. Dividend income is recognized on the ex-dividend date and interest income is accrued as earned using the effective interest rate method. Discounts and premiums on Short-Term Investments are accreted and amortized, respectively, on the straight-line method.
Investment income and realized and unrealized gains and losses on investments of the Fund are allocated to separate classes of shares pro rata based upon their relative net assets on the date the income is earned or realized and unrealized gains and losses are incurred.
(E) Expenses. Expenses of the Trust are allocated to the individual Funds in proportion to the net assets of the respective Funds when the expenses are incurred, except where direct allocations of expenses can be made. Expenses (other than transfer agent expenses and fees incurred under the shareholder services plans and the distribution plans further discussed in Note 3(B)) are allocated to separate classes of shares pro rata based upon their relative net assets on the date the expenses are incurred. The expenses borne by the Fund, including those of related parties to the Fund, are shown in the Statement of Operations.
(F) Use of Estimates. In preparing financial statements in conformity with GAAP, management makes estimates and assumptions that affect the reported amounts and disclosures in the financial statements. Actual results could differ from those estimates.
(G) Repurchase Agreements. The Fund may enter into repurchase agreements to earn income. The Fund may enter into repurchase agreements only with financial institutions that are deemed by the Manager or Subadvisor to be creditworthy, pursuant to guidelines established by the Fund’s Board. During the term of any repurchase agreement, the Manager or Subadvisor will continue to monitor the creditworthiness of the seller. Under the 1940 Act, repurchase agreements are considered to be collateralized loans by a Fund to the seller secured by the securities transferred to the Fund.
When the Fund invests in repurchase agreements, the Fund’s custodian takes possession of the collateral pledged for investments in the repurchase agreement. The underlying collateral is valued daily on a mark-to-market basis to determine that the value, including accrued interest, exceeds the repurchase price. In the event of the seller’s default on the obligation to repurchase, the Fund has the right to liquidate the collateral and apply the proceeds in satisfaction of the obliga-
tion. Under certain circumstances, such as in the event of default or bankruptcy by the counterparty to the agreement, realization and/or retention of the collateral may be subject to legal proceedings and possible realized loss to the Fund.
(H) Securities Lending. In order to realize additional income, the Fund may engage in securities lending, subject to the limitations set forth in the 1940 Act and relevant guidance by the staff of the Securities and Exchange Commission. In the event the Fund does engage in securities lending, the Fund will lend through its custodian, State Street Bank and Trust Company (“State Street”). State Street will manage the Fund’s cash collateral in accordance with the lending agreement between the Fund and State Street, and indemnify the Fund’s portfolio against counterparty risk. The loans will be collateralized by cash or securities at least equal at all times to the market value of the securities loaned. Collateral will consist of U.S. Government securities, cash equivalents or irrevocable letters of credit. The Fund may bear the risk of delay in recovery of, or loss of rights in, the securities loaned should the borrower of the securities experience financial difficulty. The Fund may also record realized gain or loss on securities deemed sold due to a borrower’s inability to return securities on loan. The Fund will receive compensation for lending its securities in the form of fees or the retention of a portion of the interest on the investment of any cash received as collateral. The Fund also will continue to receive interest and dividends on the securities loaned and any gain or loss in the market price of the securities loaned that may occur during the term of the loan will be for the account of the Fund.
Although the Fund and New York Life Investments have temporarily suspended securities lending, the Fund and New York Life Investments reserve the right to reinstitute lending when deemed appropriate. The Fund did not have any portfolio securities on loan as of June 30, 2013.
(I) Indemnifications. Under the Trust’s organizational documents, its officers and trustees are indemnified against certain liabilities that may arise out of performance of their duties to the Trust. Additionally, in the normal course of business, the Fund enters into contracts with third-party service providers that contain a variety of representations and warranties and which may provide general indemnifications. The Fund’s maximum exposure under these arrangements is unknown, as this would involve future claims that may be made against the Fund that have not yet occurred. Based on experience, management is of the view that the risk of loss in connection with these potential indemnification obligations is remote. However, there can be no assurance that material liabilities related to such obligations will not arise in the future, which could adversely impact the Fund.
Note 3–Fees and Related Party Transactions
(A) Manager and Subadvisor. Effective after the close of business on January 11, 2013, New York Life Investments, a registered investment adviser and an indirect, wholly-owned subsidiary of New York Life Insurance Company (“New York Life”), began serving as the Fund’s Manager, pursuant to an Amended and Restated Management Agreement (“Management Agreement”). The Manager provides offices, conducts clerical, recordkeeping and bookkeeping services, and keeps most of the financial and accounting records required to be maintained by the Fund. Except for the portion of salaries and expenses that are the responsibility of the Fund, the Manager pays the salaries and expenses of all
| mainstayinvestments.com | 21 |
Notes to Financial Statements (continued)
personnel affiliated with the Fund and certain operational expenses of the Fund. The Fund reimburses New York Life Investments in an amount equal to a portion of the salary of the Chief Compliance Officer (“CCO”) of the Fund. Cornerstone Capital Management LLC, an affiliate of New York Life Investments (“CCM” or “Subadvisor”), serves as Subadvisor to the Fund and is responsible for the day-to-day portfolio management of the Fund. Pursuant to the terms of a Subadvisory Agreement (“Subadvisory Agreement”) between New York Life Investments and CCM, New York Life Investments pays for the services of the Subadvisor.
The Fund pays the Manager a monthly fee for services performed and facilities furnished at an annual rate of the Fund’s average daily net assets as follows: 0.70% up to $500 million; 0.675% from $500 million to $1 billion; and 0.65% in excess of $1 billion. The effective management fee rate was 0.69% for the year ended June 30, 2013. Prior to the close of business on January 11, 2013, the monthly fee rates paid to CCM were 0.70% on the average daily net assets.
Effective after the close of business on January 11, 2013, New York Life Investments entered into a written expense limitation agreement under which it has agreed to reimburse expenses of Class A and Class I shares so that the total ordinary operating expenses for Class A and Class I shares do not exceed 1.34% and 1.09%, respectively, of average daily net assets. This agreement will be in effect for a two-year period unless extended by New York Life Investments and approved by the Board. Total Annual Fund operating expenses excludes taxes, interest, litigation, extraordinary expenses, brokerage and other transaction expenses relating to the purchase or sale of portfolio investments and the fees and expenses of any other funds in which the Fund invests.
Prior to the close of business on January 11, 2013, the Predecessor entity to CCM had a written expense limitation agreement under which it had agreed to waive a portion of the Predecessor Fund’s management fee and/or reimburse expenses of the Predecessor Fund to ensure that Total Annual Fund operating expenses for Class A and Class I (exclusive of taxes, leverage, interest, brokerage commissions, expenses incurred in connection with any merger or reorganization, dividends on short positions, acquired fund fees and expenses and extraordinary or non-recurring expenses, such as litigation) did not exceed 1.45% and 1.20%, respectively, of the Predecessor Fund’s average annual net assets. The Predecessor entity to CCM was permitted to be reimbursed by the Predecessor Fund for management fee reductions and/or expense payments made in the prior three fiscal years, so long as the reimbursement did not cause the Predecessor Fund’s Total Annual Fund Operating Expenses to exceed the expense limitation.
Effective January 22, 2013, New York Life Investments has agreed to voluntarily waive fees and/or reimburse expenses so that the Fund’s Total Annual Fund Operating Expenses (excluding taxes, interest, litigation, extraordinary expenses, brokerage and other transaction expenses relating to the purchase or sale of portfolio investments, and acquired (underlying) fund fees and expenses) applicable to Class A and Class I shares do not exceed the following percentages of average daily net assets: Class A, 1.17%; and Class I, 0.92%. These voluntary waivers will remain in effect until February 28, 2014, unless terminated earlier by New York Life Investments or the Board of Trustees.
For the period January 11, 2013 through June 30, 2013, New York Life Investments earned fees from the Fund in the amount of $3,017,484 and waived its fees and/or reimbursed expenses in the amount of $98,675.
For the period from July 1, 2012 through January 11, 2013, the Predecessor entity to CCM earned fees from the Fund in the amount of $1,280,076 and waived its fees and/or reimbursed expenses in the amount of $20,469.
State Street, 1 Lincoln Street, Boston, Massachusetts 02111, provides sub-administration and sub-accounting services to the Fund pursuant to an agreement with New York Life Investments. These services include calculating the daily NAVs of the Fund, maintaining the general ledger and sub-ledger accounts for the calculation of the Fund’s respective NAVs, and assisting New York Life Investments in conducting various aspects of the Fund’s administrative operations. For providing these services to the Fund, State Street is compensated by New York Life Investments.
Prior to the close of business on January 11, 2013, these services were provided by U.S. Bancorp Fund Services, LLC and U.S. Bank N.A. The services provided by U.S. Bank, N.A., were a direct expense of the Fund and are included in the Statement of Operations as Administration and Accounting which totaled $218,416 for the period July 1, 2012 through January 11, 2013.
(B) Distribution, Service and Shareholder Service Fees. The Trust, on behalf of the Fund, has entered into a distribution agreement with NYLIFE Distributors LLC (the ‘‘Distributor’’), an indirect, wholly-owned subsidiary of New York Life. The Fund has adopted distribution plans (the ‘‘Plans’’) in accordance with the provisions of Rule 12b-1 under the 1940 Act.
Pursuant to the Investor Class, Class A and Class R2 Plans, the Distributor receives a monthly distribution fee from the Investor Class, Class A and Class R2 shares at an annual rate of 0.25% of the average daily net assets of the Investor Class, Class A and Class R2 shares for distribution and/or service activities as designated by the Distributor. Pursuant to the Class B and Class C Plans, Class B and Class C shares pay the Distributor a monthly distribution fee at an annual rate of 0.75% of the average daily net assets of the Class B and Class C shares, along with a service fee at an annual rate of 0.25% of the average daily net assets of the Class B and Class C shares, for a total 12b-1 fee of 1.00%. Class I shares are not subject to a distribution and/or service fee.
Prior to the close of business on January 11, 2013, Quasar Distributors, LLC (“Quasar”) served as the distributor to the Predecessor Fund. As the distributor, Quasar, received a monthly distribution fee from Class A shares at an annual rate of 0.25% of the average daily net assets.
The Plans provide that the distribution and service fees are payable to the Distributor regardless of the amounts actually expended by the Distributor for distribution of the Fund’s shares and service activities.
In accordance with the Shareholder Services Plan for the Class R2 shares, the Manager has agreed to provide, through its affiliates or independent third parties, various shareholder and administrative support services to shareholders of the Class R2 shares. For its services, the Manager is entitled to a Shareholder Service Fee accrued daily and paid monthly at an annual rate of 0.10% of the average daily net assets of the Class R2 shares. This is in addition to any fees paid under a distribution plan, where applicable.
(C) Sales Charges. The Fund was advised by the Distributor that the amount of sales charges retained on sales of Investor Class and Class A shares were $15,372 and $8,150, respectively, for the period ended June 30, 2013. The Fund was also advised that the Distributor
| 22 | MainStay Cornerstone Growth Fund |
retained CDSCs on redemptions of Investor Class, Class A, Class B and Class C shares of $47, $77, $38,127 and $446, respectively, for the period ended June 30, 2013. Prior to the close of business on January 11, 2013, the Predecessor Fund only had Class A and Class I shares, which were not subject to sales charges.
(D) Transfer, Dividend Disbursing and Shareholder Servicing Agent. NYLIM Service Company LLC, an affiliate of New York Life Investments, is the Fund’s transfer, dividend disbursing and shareholder servicing agent pursuant to an agreement between NYLIM Service Company LLC and the Trust. NYLIM Service Company LLC has entered into an agreement with Boston Financial Data Services, Inc. (“BFDS”) pursuant to which BFDS performs certain transfer agent services on behalf of NYLIM Service Company LLC. Prior to the close of business on January 11, 2013, these services were provided by U.S. Bancorp Fund Services, LLC. Transfer agent expenses incurred by the Fund for the period ended June 30, 2013, were as follows (inclusive of amounts paid to U.S. Bancorp Fund Services, LLC):
Investor Class | $ | 815,331 | ||
Class A | 274,516 | |||
Class B | 209,135 | |||
Class C | 14,124 | |||
Class I | 562,115 | |||
Class R2 | 23 |
(E) Capital. As of June 30, 2013, New York Life and its affiliates beneficially held shares of the Fund with values and percentages of net assets as follows:
Class R2 | $ | 25,431 | 99.9 | % |
Note 4–Federal Income Tax
As of June 30, 2013, the components of accumulated gain (loss) on a tax basis were as follows:
| Ordinary Income | Undistributed Realized Capital Gain | Capital Loss Carry Forward | Unrealized Appreciation (Depreciation) | Total Gain (Loss) | ||||||||||||
$19,867,747 | $ | 27,814,454 | $ | (3,276,964 | ) | $ | 49,153,856 | $ | 93,559,093 | |||||||
The difference between book basis and tax basis unrealized appreciation (depreciation) is primarily due to wash sales.
The following table discloses the current year reclassifications between undistributed net investment income (loss), accumulated net realized gain (loss) on investments, and additional paid-in capital arising from permanent differences; net assets as of June 30, 2013 were not affected.
Undistributed Net Investment Income (Loss) | Accumulated Net Realized Gain (Loss) on Investments | Additional Paid-In Capital | ||||||
$(55,559) | $ | (4,017,781 | ) | $ | 4,073,340 | |||
The reclassifications for the Fund are primarily due to capital gain distributions from Real Estate Investment Trusts and merger adjustments.
Under the Regulated Investment Company Modernization Act of 2010, the Fund is permitted to carry forward capital losses incurred in taxable years beginning after December 22, 2010, for an unlimited period. However, any losses incurred during those future years will be required to be utilized prior to the losses incurred in pre-enactment tax years. As a result of this ordering rule, pre-enactment capital loss carryforwards may be more likely to expire unused. Additionally, post-enactment capital losses that are carried forward will retain their character as either short-term or long-term capital losses rather than being considered all short-term as under previous law.
The Fund utilized $626,196 of capital loss carryforwards during the period ended June 30, 2013.
Additionally, $1,402,218 of capital loss carry forward expired unused. The Fund has capital losses of $3,276,964 that will expire on 10/31/2015, and are subject to limitation.
The tax character of distributions paid during the years ended June 30, 2013 and June 30, 2012 shown in the Statements of Changes in Net Assets was as follows:
| 2013 | 2012 | |||||||
Distributions paid from: | ||||||||
Ordinary Income | $ | 11,480,024 | $ | 2,354,099 | ||||
Long-term Capital Gain | 15,953,777 | 11,095,629 | ||||||
Total | $ | 27,433,801 | $ | 13,449,728 | ||||
Note 5–Custodian
State Street is the custodian of the cash and the securities of the Fund. Custodial fees are charged to the Fund based on the market value of securities in the Fund and the number of certain cash transactions incurred by the Fund. For the period January 11, 2013 through June 30, 2013, State Street earned fees from the Fund in the amount of $13,055.
For the period July 1, 2012 through January 11, 2013, U.S. Bank, N.A. earned fees from the Fund in the amount of $18,720.
Note 6–Line of Credit
The Fund and certain affiliated funds maintain a line of credit with a syndicate of banks in order to secure a source of funds for temporary purposes to meet unanticipated or excessive redemption requests.
Effective August 29, 2012, under a second amended and restated credit agreement (the “Credit Agreement”), the aggregate commitment amount is $200,000,000 with an optional maximum amount of $250,000,000. The commitment fee is an annual rate of 0.08% of the average commitment amount payable quarterly, regardless of usage, to Bank of New York Mellon, which serves as the agent to the syndicate. The commitment fee is allocated among the Fund and certain affiliated funds based upon net assets and other factors. Interest on any revolving credit loan is charged based upon the Federal Funds Advances rate or the one month London InterBank Offered Rate, whichever is higher. The Credit Agreement expires on August 28, 2013, although the Fund, certain affiliated funds and the syndicate of banks may renew the Credit Agreement for an additional year on the same or different terms. There were no borrowings made or outstanding with respect to the Fund on the Credit Agreement during the period ended June 30, 2013.
| mainstayinvestments.com | 23 |
Notes to Financial Statements (continued)
Note 7–Purchases and Sales of Securities (in 000’s)
During the year ended June 30, 2013, purchases and sales of securities, other than short-term securities, were $722,438 and $604,399, respectively.
Note 8–Capital Share Transactions
Investor Class (a) | Shares | Amount | ||||||
Period ended June 30, 2013: | ||||||||
Shares sold | 84,732 | $ | 2,504,594 | |||||
Shares issued in connection with the acquisition of MainStay Growth Equity Fund | 8,156,933 | 238,156,340 | ||||||
Shares redeemed | (422,724 | ) | (12,518,021 | ) | ||||
|
| |||||||
Net increase (decrease) in shares outstanding before conversion | 7,818,941 | 228,142,913 | ||||||
Shares converted into Investor Class (See Note 1) | 188,961 | 5,594,968 | ||||||
Shares converted from Investor Class (See Note 1) | (143,447 | ) | (4,223,920 | ) | ||||
|
| |||||||
Net increase (decrease) | 7,864,455 | $ | 229,513,961 | |||||
|
| |||||||
Class A | Shares | Amount | ||||||
Year ended June 30, 2013: | ||||||||
Shares sold | 746,721 | $ | 22,228,053 | |||||
Shares issued in connection with the acquisition of MainStay Growth Equity Fund | 7,950,596 | 232,131,950 | ||||||
Shares issued to shareholders in reinvestment of dividends and distributions | 36,306 | 1,004,237 | ||||||
Shares redeemed | (965,939 | ) | (28,944,947 | ) | ||||
|
| |||||||
Net increase (decrease) in shares outstanding before conversion | 7,767,684 | 226,419,293 | ||||||
Shares converted into Class A (See Note 1) | 202,643 | 6,011,509 | ||||||
Shares converted from Class A (See Note 1) | (19,452 | ) | (577,911 | ) | ||||
|
| |||||||
Net increase (decrease) | 7,950,875 | $ | 231,852,891 | |||||
|
| |||||||
Year ended June 30, 2012: | ||||||||
Shares sold | 1,457,364 | $ | 41,680,725 | |||||
Shares issued to shareholders in reinvestment of dividends | 242,119 | 6,496,042 | ||||||
Shares redeemed | (5,552,218 | ) | (167,504,131 | ) | ||||
|
| |||||||
Net increase (decrease) | (3,852,735 | ) | $ | (119,327,364 | ) | |||
|
| |||||||
Class B (a) | Shares | Amount | ||||||
Period ended June 30, 2013: | ||||||||
Shares sold | 75,939 | $ | 2,246,409 | |||||
Shares issued in connection with the acquisition of MainStay Growth Equity Fund | 2,184,189 | 63,771,319 | ||||||
Shares redeemed | (151,181 | ) | (4,470,647 | ) | ||||
|
| |||||||
Net increase (decrease) in shares outstanding before conversion | 2,108,947 | 61,547,081 | ||||||
Shares converted from Class B (See Note 1) | (229,430 | ) | (6,804,646 | ) | ||||
|
| |||||||
Net increase (decrease) | 1,879,517 | $ | 54,742,435 | |||||
|
| |||||||
Class C (a) | Shares | Amount | ||||||
Period ended June 30, 2013: | ||||||||
Shares sold | 18,487 | $ | 546,418 | |||||
Shares issued in connection with the acquisition of MainStay Growth Equity Fund | 140,349 | 4,097,732 | ||||||
Shares redeemed | (28,484 | ) | (843,781 | ) | ||||
|
| |||||||
Net increase (decrease) | 130,352 | $ | 3,800,369 | |||||
|
| |||||||
Class I | Shares | Amount | ||||||
Year ended June 30, 2013: | ||||||||
Shares sold | 6,592,004 | $ | 197,183,111 | |||||
Shares issued in connection with the acquisition of MainStay Growth Equity Fund | 48,840 | 1,437,962 | ||||||
Shares issued to shareholders in reinvestment of dividends and distributions | 875,949 | 24,430,229 | ||||||
Shares redeemed | (2,263,660 | ) | (68,329,003 | ) | ||||
|
| |||||||
Net increase (decrease) | 5,253,133 | $ | 154,722,299 | |||||
|
| |||||||
Year ended June 30, 2012: | ||||||||
Shares sold | 6,403,637 | $ | 194,880,449 | |||||
Shares issued to shareholders in reinvestment of distributions | 223,913 | 6,041,169 | ||||||
Shares redeemed | (1,505,766 | ) | (43,910,831 | ) | ||||
|
| |||||||
Net increase (decrease) | 5,121,784 | $ | 157,010,787 | |||||
|
| |||||||
Class R2 (a) | Shares | Amount | ||||||
Period ended June 30, 2013: | ||||||||
Shares sold | 856 | $ | 25,000 | |||||
|
| |||||||
Net increase (decrease) | 856 | $ | 25,000 | |||||
|
| |||||||
(a) Class B shares, Class C shares, Investor Class shares and Class R2 shares were first offered on January 18, 2013. |
| |||||||
Note 9–Fund Acquisitions
Keystone Large Cap Growth Fund
On January 11, 2013, MainStay Cornerstone Growth Fund acquired all of the net assets of Keystone Large Cap Growth Fund, an open-end investment company, pursuant to a plan of reorganization approved by Keystone Large Cap Growth Fund shareholders on December 18, 2012. The acquisition was accomplished by a tax-free exchange of 12,423,785 shares of MainStay Cornerstone Growth Fund, valued at $39,966,272 for 1,366,582 Class A shares and $326,082,048 for 11,057,203 Class I shares of Keystone Large Cap Growth Fund outstanding on January 11, 2013. The investment portfolio of Keystone Large Cap Growth Fund, with a fair value of $365,640,832 and identified cost of $330,906,053 at January 11, 2013 was the principal asset acquired by MainStay Cornerstone Growth Fund. Immediately prior to the merger, MainStay Cornerstone Growth Fund did not have any assets or liabilities. On January 18, 2013, the MainStay Cornerstone Growth Fund also launched Classes A, B, C, R2 and Investor. Assuming the acquisition had been completed on July 1, 2012, the beginning of the annual reporting period of MainStay Cornerstone Growth Fund, there would have been no difference in the results of operations since the acquiring fund was established to receive all assets and liabilities of the predecessor, Keystone Large Cap Growth Fund, and the MainStay Cornerstone Growth Fund did not have any operations or investment activities prior to the acquisition.
| 24 | MainStay Cornerstone Growth Fund |
MainStay Growth Equity Fund
At a meeting held on September 24-25, 2012, the Board of Trustees approved a plan of reorganization whereby the Fund would acquire the assets, including the investments, and assume the liabilities on MainStay Growth Equity Fund, a series of MainStay Funds Trust. Shareholders of MainStay Growth Equity Fund approved this reorganization on January 7, 2013, which was then completed on January 18, 2013. The aggregate net assets of the acquiring Fund, MainStay Cornerstone Growth Fund, immediately before the acquisition were $367,512,018 and the combined net assets after the acquisition were $907,107,321.
The acquisition was accomplished by a tax-free exchange of the following:
| Shares | Value | |||||||
MainStay Growth Equity Fund | ||||||||
Investor Class | 20,529,705 | $ | 238,156,340 | |||||
Class A | 19,906,164 | 232,131,950 | ||||||
Class B | 5,796,666 | 63,771,319 | ||||||
Class C | 372,398 | 4,097,732 | ||||||
Class I | 122,131 | 1,437,962 | ||||||
In exchange for the MainStay Growth Equity Fund shares and net assets, the Fund issued 8,156,933, 7,950,596, 2,184,189, 140,349, and 48,840 of Investor Class, Class A, Class B, Class C, and Class I shares, respectively.
MainStay Growth Equity Fund’s net assets after adjustments for any permanent book-to-tax differences at the acquisition date were as follows, which include the following amounts of capital stock, unrealized appreciation (depreciation), accumulated net realized gain (loss) and undistributed net investment income:
| Total Net Assets | Capital Stock | Unrealized Appreciation (Depreciation) | Capital Loss Carry Forward | Undistributed Net Realized Capital Gain | ||||||||||||||||
MainStay Growth Equity Fund | $ | 539,595,303 | $ | 479,358,627 | $ | 46,457,288 | $ | (5,305,378 | ) | $ | 19,084,766 | |||||||||
Assuming the acquisition of MainStay Growth Equity Fund had been completed on July 1, 2012, the beginning of the annual reporting period of the Fund, the Fund’s pro forma results of operations for the period ended June 30, 2013, are as follows:
Net investment income (loss) | $ | 3,520,881 | ||
Net gain on investments | $ | 78,546,274 | ||
Net increase in net assets resulting from operations | $ | 82,067,155 |
Because the combined investment portfolios have been managed as a single integrated portfolio since the acquisition was completed, it is not practicable to separate the amounts of revenue and earnings of the MainStay Growth Equity Fund that have been included in the Fund’s Statement of Operations since January 18, 2013.
For financial reporting purposes, assets received and shares issued by the Fund were recorded at fair value; however, the cost basis of the investments received from MainStay Growth Equity Fund, in the amount of $482,929,858, was carried forward to align ongoing reporting of the Fund’s realized and unrealized gains and losses with amounts distributable to shareholders for tax purposes.
Note 10–Change in Independent Registered Public Accounting Firm (Unaudited)
On September 24, 2012, KPMG LLP (KPMG) was selected as the Fund’s independent registered public accounting firm. The Fund’s selection of KPMG as its independent registered public accounting firm was recommended by the Fund’s audit committee and was approved by the Fund’s Board of Trustees.
Ernst & Young LLP (E&Y) was the independent registered public accounting firm for the Predecessor Fund. The reports of the financial statements audited by E&Y for the Predecessor Fund for each of the years in the four-year period ended June 30, 2012 did not contain an adverse opinion or disclaimer of opinion, and were not qualified or modified as to uncertainty, audit scope or accounting principles. There were no disagreements between the Predecessor Fund and E&Y on any
matters of accounting principles or practices, financial statement disclosure, or auditing scope or procedures, which disagreements, if not resolved to the satisfaction of E&Y would have caused it to make reference to the subject matter of the disagreements in connection with its reports on the financial statements of such years.
Note 11–Subsequent Events
In connection with the preparation of the financial statements of the Fund as of and for the year ended June 30, 2013, events and transactions subsequent to June 30, 2013, through the date the financial statements were issued have been evaluated by the Fund’s management for possible adjustment and/or disclosure. No subsequent events requiring financial statement adjustment or disclosure have been identified except as described below:
Effective July 1, 2013, the MainStay Cornerstone Growth Fund changed its fiscal and tax year end from June 30 to October 31.
On August 28, 2013, the Board of Trustees declared long-term capital gain distributions of $0.56 per share and $0.94 per share which totals $1.50 per share to shareholders of record on August 29, 2013. The ex-dividend and payable date is August 30, 2013.
| mainstayinvestments.com | 25 |
Report of Independent Registered Public Accounting Firm
The Board of Trustees and Shareholders of
MainStay Funds Trust:
We have audited the accompanying statement of assets and liabilities, including the portfolio of investments, of the MainStay Cornerstone Growth Fund (the “Fund”), one of the funds constituting MainStay Funds Trust, as of June 30, 2013, and the related statements of operations, changes in net assets and the financial highlights for the year then ended. These financial statements and financial highlights are the responsibility of the Fund’s management. Our responsibility is to express an opinion on these financial statements and financial highlights based on our audit. The statement of changes in net assets and the financial highlights for each of the years or periods presented through June 30, 2012 were audited by other auditors, whose report thereon dated August 27, 2012, expressed an unqualified opinion on those statements.
We conducted our audit in accordance with the standards of the Public Company Accounting Oversight Board (United States). Those standards require that we plan and perform the audit to obtain reasonable assurance about whether the financial statements and financial highlights are free of material misstatement. An audit includes examining, on a test basis, evidence supporting the amounts and disclosures in the financial statements. Our procedures included confirmation of securities owned as of June 30, 2013, by correspondence with the custodian and brokers or by other appropriate auditing procedures where replies from brokers were not received. An audit also includes assessing the accounting principles used and significant estimates made by management, as well as evaluating the overall financial statement presentation. We believe that our audit provides a reasonable basis for our opinion.
In our opinion, the financial statements and financial highlights referred to above present fairly, in all material respects, the financial position of the Fund as of June 30, 2013, and the results of its operations, the changes in its net assets and the financial highlights for the year then ended in conformity with U.S. generally accepted accounting principles.

Philadelphia, Pennsylvania
August 28, 2013
| 26 | MainStay Cornerstone Growth Fund |
Board Consideration and Approval of Management Agreement and
Subadvisory Agreement (Unaudited)
Section 15(c) of the Investment Company Act of 1940, as amended (the “1940 Act”) requires that each mutual fund’s board of trustees, including a majority of the independent trustees, review and approve the fund’s investment advisory agreements. At its September 24-25, 2012 meeting, the Board of Trustees of the MainStay Group of Funds (“Board”) unanimously approved the Management Agreement with respect to the MainStay Cornerstone Growth Fund (“Fund”) and New York Life Investment Management LLC (“New York Life Investments”), and the Subadvisory Agreement between New York Life Investments and Cornerstone Capital Management LLC (“CCM”) with respect to the Fund.
In reaching its decision to approve the Agreements, the Board considered information furnished by New York Life Investments and CCM specifically in connection with the contract review process that took place in advance of its September 2012 meeting, which included responses from New York Life Investments and CCM to a comprehensive list of questions encompassing a variety of topics prepared on behalf of the Board by independent legal counsel to the Board and its independent trustees (the “Independent Trustees”). The Board also considered information provided by New York Life Investments and CCM on the fees charged to other investment advisory clients (including institutional separate accounts) that follow investment strategies similar to those proposed for the Fund and the rationale for any differences in the Fund’s proposed management and subadvisory fees and the fees charged to those other investment advisory clients. The Board also considered relevant information previously provided to the Board in connection with its review of the investment advisory agreements for other MainStay Funds.
In determining to approve the Agreements, the members of the Board reviewed and evaluated all of the information and factors they believed to be relevant and appropriate in light of legal advice furnished to them by independent legal counsel and through the exercise of their own business judgment. The broad factors considered by the Board are discussed in greater detail below, and included, among other items: (i) the nature, scope, and quality of the services to be provided to the Fund by New York Life Investments and CCM in relation to the advisory fee to be charged the Fund; (ii) the qualifications of the proposed portfolio managers for the Fund and the historical investment performance of products previously managed by such portfolio managers with similar investment strategies to the Fund, including the Keystone Large Cap Growth Fund (the “Keystone Fund”); (iii) the anticipated costs of the services to be provided, and profits expected to be realized, by New York Life Investments and CCM from their relationships with the Fund; (iv) the extent to which economies of scale may be realized as the Fund grows, and the extent to which economies of scale may benefit Fund investors; and (v) the reasonableness of the Fund’s proposed management and subadvisory fees and overall total ordinary operating expenses, particularly as compared to similar funds and accounts managed by New York Life Investments and CCM.
While individual members of the Board may have weighed certain factors differently, the Board’s decisions to approve the Agreements were based on a consideration of all the information provided to the Board, including information provided to the Board specifically in connection with the contract review processes. In addition to considering the above-referenced factors, the Board observed that in the marketplace
there are a range of investment options available to shareholders of the Fund, and that the Fund’s shareholders, having had the opportunity to consider other investment options, will have chosen to invest in the Fund. A more detailed discussion of the factors that figured prominently in the Board’s decisions to approve the Agreements is provided below.
Nature, Scope and Quality of Services to Be Provided by New York Life Investments and CCM
The Board examined the nature, scope and quality of the services that New York Life Investments proposed to provide to the Fund. The Board evaluated New York Life Investments’ experience in serving as manager of other mutual funds, noting that New York Life Investments manages other mutual funds, serves a variety of other investment advisory clients, including other pooled investment vehicles, and has experience with overseeing mutual fund service providers, including subadvisers. The Board considered the experience of senior personnel at New York Life Investments proposed to provide management and administrative services to the Fund, as well as New York Life Investments’ reputation and financial condition. The Board also considered the full range of non-advisory services that New York Life Investments will supply to the Fund under the terms of the Management Agreement, including: (i) fund accounting services provided by New York Life Investments’ Fund Accounting and Administration Group; (ii) investment oversight and analytical services provided by New York Life Investments’ Investment Consulting Group; (iii) compliance services provided by New York Life Investments’ compliance department, including oversight and implementation of the Fund’s compliance program; and (iv) legal services provided by New York Life Investments’ Office of the General Counsel. Additional information about the non-advisory services provided by New York Life Investments is to be set forth in the Management Agreement. The Board also considered New York Life Investments’ willingness to invest in personnel that benefit the Fund and noted that New York Life Investments is responsible for compensating the Fund’s officers. The Board also considered benefits to shareholders of being part of the MainStay Group of Funds, including the privilege of exchanging investments between the same class of shares without the imposition of a sales charge, as described more fully in the Fund’s prospectus.
The Board also examined the nature, scope and quality of the advisory services that CCM proposed to provide to the Fund. The Board evaluated CCM’s experience in managing other portfolios, including those with similar investment strategies to the Fund. It examined CCM’s track record and experience in providing investment advisory services, the experience of investment advisory, senior management and administrative personnel at CCM, and CCM’s overall legal and compliance environment. The Board also reviewed CCM’s willingness to invest in personnel designed to benefit the Fund. In this regard, the Board considered the experience of the Fund’s proposed portfolio managers, including with respect to other products with similar investment strategies to the Fund, the number of accounts managed by the portfolio managers and the method for compensating portfolio managers.
Based on these considerations, the Board concluded, within the context of its overall determinations regarding the Agreements, that the Fund likely would benefit from the nature, extent and quality of these services as a result of New York Life Investments’ and CCM’s experience, personnel, operations and resources.
| mainstayinvestments.com | 27 |
Board Consideration and Approval of Management Agreement and
Subadvisory Agreement (Unaudited) (continued)
Investment Performance
In connection with the Board’s consideration of the Agreements, the Board noted that the Fund had no investment performance track record since the Fund had not yet been offered to investors. The Board discussed with management and the Fund’s proposed portfolio management team the Fund’s investment process, strategies and risks. Additionally, the Board considered the historical performance of other investment portfolios with similar investment strategies that are or have been managed by the proposed portfolio managers for the Fund, including the Keystone Fund. Based on these considerations, the Board concluded that the Fund was likely to be managed responsibly and capably by CCM.
Costs of the Services to Be Provided, and Profits to Be Realized, by New York Life Investments and CCM
The Board considered the anticipated costs of the services to be provided by New York Life Investments and CCM under the Agreements and the profits expected to be realized by New York Life Investments and its affiliates, including CCM, due to their relationships with the Fund. Because, upon commencement of operations of the Fund, CCM will be an affiliate of New York Life Investments whose subadvisory fees will be paid directly by New York Life Investments, the Board considered cost and profitability information for New York Life Investments and not separately for CCM.
In evaluating the anticipated costs and profits of New York Life Investments and its affiliates, including CCM, due to their relationships with the Fund, the Board considered, among other factors, each party’s investments in personnel, systems, equipment and other resources necessary to manage the Fund, and that New York Life Investments will be responsible for paying the subadvisory fees for the Fund. The Board acknowledged that New York Life Investments and CCM must be in a position to pay and retain experienced professional personnel to provide services to the Fund, and that the ability to maintain a strong financial position is important in order for New York Life Investments and CCM to continue to provide high-quality services to the Fund. The Board also noted that the Fund should benefit from the allocation of certain fixed costs across the MainStay Group of Funds.
In addition, the Board noted the difficulty in obtaining reliable comparative data about mutual fund managers’ profitability, since such information generally is not publicly available and may be impacted by numerous factors, including the structure of a fund manager’s organization, the types of funds it manages, the methodology used to allocate certain fixed costs to specific funds, and the manager’s capital structure and costs of capital. While recognizing the difficulty in evaluating a manager’s profitability with respect to the Fund, and noting that other profitability methodologies may also be reasonable, the Board concluded that the profitability methodology presented by New York Life Investments to the Board with respect to the Fund, which was developed by New York Life Investments in consultation with an independent consultant, was reasonable in all material respects.
In considering the anticipated costs and profitability of the Fund, the Board also considered certain fall-out benefits that may be realized by New York Life Investments and its affiliates due to their relationships with the Fund. The Board recognized, for example, the benefits to CCM
from legally permitted “soft-dollar” arrangements by which brokers provide research and other services to CCM in exchange for commissions paid by the Fund with respect to trades on the Funds’ portfolio securities.
The Board further considered that, in addition to fees earned by New York Life Investments for managing the Fund, New York Life Investments’ affiliates would also earn revenues from serving the Fund in various other capacities, including as the Fund’s transfer agent and distributor. The Board observed that information about these other revenues and their impact on the profitability of the Fund to New York Life Investments, was furnished to the Board as part of the 15(c) process. The Board noted that, although it assessed the overall profitability of the Fund to New York Life Investments and its affiliates as part of the contract review process, when considering the reasonableness of the fees to be paid to New York Life Investments and its affiliates under the Agreements, the Board considered the profitability of New York Life Investments’ relationship with the Fund on a pre-tax basis, and without regard to distribution expenses.
After evaluating the information presented to the Board, the Board concluded, within the context of its overall determinations regarding the Agreements, that any profits expected to be realized by New York Life Investments and its affiliates, including CCM, due to their relationships with the Fund supported the Board’s decision to approve the Agreements.
Extent to Which Economies of Scale May Be Realized as the Fund Grows
The Board also considered whether the Fund’s proposed expense structure permitted economies of scale to be shared with Fund investors. The Board reviewed information from New York Life Investments showing how the Fund’s management fee schedule compared to fee schedules of other funds and accounts managed by New York Life Investments and how it hypothetically would compare with fees paid for similar services by peer funds at varying asset levels. While recognizing the difficulty of determining future economies of scale with precision, the Board acknowledged that economies of scale may be shared with the Fund in a number of ways, including, for example, through the imposition of management fee breakpoints and by initially setting relatively lower management fees.
Based on this information, the Board concluded, within the context of its overall determinations regarding the Agreements, that the Fund’s expense structure appropriately reflects economies of scale for the benefit of Fund investors. The Board noted, however, that it would continue to evaluate the reasonableness of the Fund’s expense structure as the Fund grows over time.
Management and Subadvisory Fees and Total Ordinary Operating Expenses
The Board evaluated the reasonableness of the fees to be paid under the Agreements in relation to the scope of services to be provided and the Fund’s expected total ordinary operating expenses. The Board primarily considered the reasonableness of the management fee to be paid by the Fund to New York Life Investments, since the fees to be paid to CCM will be paid by New York Life Investments, not the Fund.
| 28 | MainStay Cornerstone Growth Fund |
In assessing the reasonableness of the Fund’s fees and expenses, the Board primarily considered comparative data provided by New York Life Investments on the fees and expenses charged by similar mutual funds managed by other investment advisers. In addition, the Board considered information provided by New York Life Investments and CCM on fees charged to other investment advisory clients, including institutional separate accounts and other funds with similar investment objectives as the Fund, including the Keystone Fund. In this regard, the Board took into account the explanation provided by New York Life Investments about the different scope of services provided to mutual funds as compared with other investment advisory clients. The Board also took into account the impact of any expense limitation arrangements on the Fund’s net management fee and expenses.
The Board noted that, outside of the Fund’s management fee and the fees charged under a share class’s Rule 12b-1 and/or shareholder services plans, a share class’s most significant “other expenses” are transfer agent fees. Transfer agent fees will be charged to the Fund based on the number of shareholder accounts (a “per-account” fee) as compared with certain other fees (e.g., management fees), which will be charged based on the Fund’s average net assets. The Board took into account information from New York Life Investments showing that the Fund’s transfer agent fee schedule is reasonable, including industry data showing that the per-account fees that NYLIM Service Company LLC, the Fund’s transfer agent, will charge the Fund are within the range of per-account fees charged by transfer agents to other mutual funds. In addition, the Board considered NYLIM Service Company LLC’s profitability in connection with the transfer agent services it will provide to the Fund.
The Board acknowledged that, because the Fund’s transfer agent fees will be billed on a per-account basis, the impact of transfer agent fees on a share class’s expense ratio may be more significant in cases where the share class has a high number of accounts with limited assets (i.e., small accounts). The Board observed that transfer agent fees are a significant portion of non-advisory expenses of many Funds in the MainStay Group of Funds. The impact of transfer agent fees on the expense ratios of these MainStay Funds tend to be greater than for other open-end retail funds, because the MainStay Group of Funds generally has a significant number of small accounts relative to competitor funds. The Board acknowledged the role that the MainStay Group of Funds historically has played in serving the investment needs of New York Life policyholders, who often maintain smaller account balances than other fund investors. The Board discussed measures that it and New York Life Investments have taken in recent years to mitigate the effect of small accounts on the expense ratios of Fund share classes, including: (i) encouraging New York Life agents to consolidate multiple small accounts held by the same investor into one MainStay Asset Allocation Fund account; (ii) increasing investment minimums from $500 to $1,000 in 2003; (iii) introducing Investor Class shares for certain MainStay Funds in early 2008 to consolidate smaller account investors; (iv) closing small accounts with balances below $250 in Investor Class shares or $750 in all other classes of shares; (v) no longer allowing an exception with no minimum investment amount with respect to AutoInvest accounts with subsequent monthly purchases of $100; (vi) since 2007, charging an annual $20.00 small account fee on certain accounts with balances below $1,000; and (vii) modifying the
approach for billing transfer agent expenses to reduce the degree of subsidization by large accounts of smaller accounts. In addition, the Board acknowledged New York Life Investments’ efforts to encourage intermediaries to consolidate small accounts in multiple Funds held by the same investor into a single Asset Allocation Fund account, if appropriate under the circumstances, in an effort to mitigate the effect of small accounts on the Funds in the MainStay Group of Funds.
Based on these considerations, the Board concluded that the Fund’s management and subadvisory fees and anticipated total ordinary operating expenses were within a range that is competitive and, within the context of the Board’s overall conclusions regarding the Agreements, support a conclusion that these fees and expenses are reasonable.
Conclusion
On the basis of the information provided to it and its evaluation thereof, the Board, including the Independent Trustees, unanimously voted to approve the Agreements.
| mainstayinvestments.com | 29 |
Special Meeting of Shareholders (Unaudited)
At a Special Meeting of Shareholders (“Special Meeting”) of MainStay Growth Equity Fund (“Growth Equity Fund”), a series of MainStay Funds Trust, was held on January 7, 2013 at 12:00 pm Eastern time at the offices of New York Life Investment Management LLC, 169 Lackawanna Avenue, Parsippany, New Jersey 07054, for the following purposes:
| 1) | To approve an Agreement and Plan of Reorganization providing for the acquisition of the assets and liabilities of the Growth Equity Fund by MainStay Cornerstone Growth Fund (“Acquiring Fund”), a series of MainStay Funds Trust, in exchange for shares of the Acquiring Fund, followed by the complete liquidation of the Growth Equity Fund; and |
| 2) | To transact such other business as may properly come before the Special Meeting or any adjournment or postponement thereof. |
As of January 7, 2013, Proposal 1 passed.
The results of the meeting were:
Votes For | Votes Against | Abstentions | Total | |||||||||
19,885,738.868 | 769,987.913 | 1,861,534.199 | 22,517,260.980 | |||||||||
Federal Income Tax Information
(Unaudited)
The Fund is required under the Internal Revenue Code to advise shareholders in a written statement as to the federal tax status of dividends paid by the Fund during such fiscal years. Accordingly, the Fund paid $15,953,777 as long term capital gain distributions.
For the fiscal year ended June 30, 2013, the Fund designates approximately $8,837,372 under the Internal Revenue Code as qualified dividend income eligible for reduced tax rates.
The ordinary income dividends paid by the Fund during the fiscal year ended June 30, 2013, should be multiplied by 35.85% to arrive at the amount eligible for the corporate dividends received deduction.
In February 2014, shareholders will receive an IRS Form 1099-DIV or substitute Form 1099 which will show the federal tax status of the distributions received by shareholders in calendar year 2013. The amounts that are reported on such Form 1099-DIV or substitute Form 1099 are the amounts you are to use on your federal income tax return and potentially differ from the amounts which we are reporting for the Fund’s fiscal year ended June 30, 2013.
Proxy Voting Policies and Procedures and Proxy Voting Record (Unaudited)
A description of the policies and procedures that New York Life Investments uses to vote proxies related to the Fund’s securities is available without charge, upon request, (i) by visiting the Fund’s website at mainstayinvestments.com; and (ii) on the Securities and Exchange Commission’s (“SEC”) website at www.sec.gov.
The Fund is required to file with the SEC its proxy voting record for the 12-month period ending June 30 on Form N-PX. The Fund’s most recent Form N-PX is available free of charge upon request by calling 800-MAINSTAY (624-6782); visiting the Fund’s website at mainstayinvestments.com; or on the SEC’s website at www.sec.gov.
Shareholder Reports and Quarterly Portfolio Disclosure (Unaudited)
The Fund is required to file its complete schedule of portfolio holdings with the SEC for its first and third fiscal quarters on Form N-Q. The Fund’s Form N-Q is available without charge, on the SEC’s website at www.sec.gov or by calling MainStay Investments at 800-MAINSTAY (624-6782). You also can obtain and review copies of Form N-Q by visiting the SEC’s Public Reference Room in Washington, DC (information on the operation of the Public Reference Room may be obtained by calling 1-800-SEC-0330).
| 30 | MainStay Cornerstone Growth Fund |
Board Members and Officers (Unaudited)
The Board Members oversee the MainStay Group of Funds (which are comprised of Funds that are series of The MainStay Funds, MainStay Funds Trust, MainStay VP Funds Trust, Private Advisors Alternative Strategies Master Fund, Private Advisors Alternative Strategies Fund, and MainStay DefinedTerm Municipal Opportunities Fund ) (collectively, the “Fund Complex”), the Manager, the Subadvisor, and other service providers to the Fund Complex and elects the officers of the Fund who are responsible for the day-to-day operations of the Fund. Each Board Member serves until his or her successor is elected and qualified or until his or her resignation, death or removal. Under the Retirement
Policy, a Board Member must tender his or her resignation by the end of the calendar year during which he or she reaches the age of 75.
Officers serve a term of one year and are elected annually by the Board Members. The business address of each Board Member and officer listed below is 51 Madison Avenue, New York, New York 10010.
The Statement of Additional Information applicable to the Fund includes additional information about the Board Members and is available without charge, upon request, by calling 800-MAINSTAY (624-6782) or by going online to mainstayinvestments.com.
Name and Date of Birth | Term of Office, Position(s) Held and Length of Service | Principal Occupation(s) During Past Five Years | Number of Fund Complex | Other Directorships Held by Board Member | ||||||||
John Y. Kim* 9/24/60 | Indefinite; MainStay Funds Trust: Trustee since 2009. | Chief Investment Officer, New York Life Insurance Company (since 2011); President, Investments Group—New York Life Insurance Company (since 2012); Chairman of the Board of Managers and Chief Executive Officer, New York Life Investment Management LLC and New York Life Investment Management Holdings LLC (since 2008); Member of the Board, MacKay Shields LLC, Institutional Capital LLC, Madison Capital Funding LLC, Cornerstone Capital Management Holdings LLC (fka Madison Square Investors LLC) (since 2008); Member of the Board of Managers, McMorgan and Company LLC and GoldPoint Partners (fka NYLCAP Manager LLC) (2008-2012); Member of the Board of Private Advisors, L.L.C. (since 2010); Member of the Board of MCF Capital management LLC (since 2012); and President, Prudential Retirement, a business unit of Prudential Financial, Inc. (2002 to 2007) | 78 | MainStay Funds: Trustee since 2008 (12 funds); MainStay VP Funds Trust: Trustee since 2008 (29 portfolios)**; Private Advisors Alternative Strategies Master Fund: Trustee since 2011; Private Advisors Alternative Strategies Fund: Trustee since 2011; and MainStay DefinedTerm Municipal Opportunities Fund: Trustee since 2011. |
| * | This Board Member is considered to be an “interested person” of the MainStay Group of Funds within the meaning of the 1940 Act because of his affiliation with New York Life Insurance Company, New York Life Investment Management LLC, NYLIFE Securities LLC and/or NYLIFE Distributors LLC, as described in detail above in the column entitled “Principal Occupation(s) During the Past Five Years.” |
| ** | Includes prior service as a Director of MainStay VP Series Fund, Inc., the predecessor to MainStay VP Funds Trust. |
| mainstayinvestments.com | 31 |
Name and Date of Birth | Term of Office, Position(s) Held and Length of Service | Principal Occupation(s) During Past Five Years | Number of Funds in Fund Complex Overseen by | Other Directorships Held by Board Member | ||||||||
Susan B. Kerley 8/12/51 | Indefinite; MainStay Funds Trust: Trustee since 2009. | President, Strategic Management Advisors LLC (since 1990) | 78 | MainStay Funds: Trustee since 2007 (12 funds); MainStay VP Funds Trust: Trustee since 2007 (29 portfolios)**; Private Advisors Alternative Strategies Master Fund: Trustee since 2011; Private Advisors Alternative Strategies Fund: Trustee since 2011; MainStay DefinedTerm Municipal Opportunities Fund: Trustee since 2011; and Legg Mason Partners Funds: Trustee since 1991 (50 portfolios). | ||||||||
Alan R. Latshaw 3/27/51 | Indefinite; MainStay Funds Trust: Trustee and Audit Committee Financial Expert since 2009. | Retired. Partner, Ernst & Young LLP (2002 to 2003); Partner, Arthur Andersen LLP (1989 to 2002); Consultant to the MainStay Funds Audit and Compliance Committee (2004 to 2006) | 78 | MainStay Funds: Trustee and Audit Committee Financial Expert since 2006 (12 funds); MainStay VP Funds Trust: Trustee since 2007 (29 portfolios)**; Private Advisors Alternative Strategies Master Fund: Trustee and Audit Committee Financial Expert since 2011; Private Advisors Alternative Strategies Fund: Trustee and Audit Committee Financial Expert since 2011; MainStay DefinedTerm Municipal Opportunities Fund: Trustee and Audit Committee Financial Expert since 2011; State Farm Associates Funds Trusts: Trustee since 2005 (4 portfolios); State Farm Mutual Fund Trust: Trustee since 2005 (15 portfolios); and State Farm Variable Product Trust: Trustee since 2005 (9 portfolios). | ||||||||
Peter Meenan 12/5/41 | Indefinite; MainStay Funds Trust: Chairman since 2013 and Trustee since 2009. | Retired. Independent Consultant (2004 to 2013); President and Chief Executive Officer, Babson—United, Inc. (financial services firm) (2000 to 2004); Independent Consultant (1999 to 2000); Head of Global Funds, Citicorp (1995 to 1999) | 78 | MainStay Funds: Chairman since 2013 and Trustee since 2007 (12 funds); MainStay VP Funds Trust: Chairman since 2013 and Trustee since 2006 (29 portfolios)**; Private Advisors Alternative Strategies Master Fund: Chairman since 2013 and Trustee since 2011; Private Advisors Alternative Strategies Fund: Chairman since 2013 and Trustee since 2011; and MainStay DefinedTerm Municipal Opportunities Fund: Chairman since 2013 and Trustee since 2011. | ||||||||
Richard H. Nolan, Jr. 11/16/46 | Indefinite; MainStay Funds Trust: Trustee since 2009. | Managing Director, ICC Capital Management; President – Shields/ Alliance, Alliance Capital Management (1994 to 2004) | 78 | MainStay Funds: Trustee since 2007 (12 funds); MainStay VP Funds Trust: Trustee since 2006 (29 portfolios)**; Private Advisors Alternative Strategies Master Fund: Trustee since 2011; Private Advisors Alternative Strategies Fund: Trustee since 2011; and MainStay DefinedTerm Municipal Opportunities Fund: Trustee since 2011. |
| 32 | MainStay Cornerstone Growth Fund |
Name and Date of Birth | Term of Office, Position(s) Held and Length of Service | Principal Occupation(s) During Past Five Years | Number of Funds in Fund Complex Overseen by | Other Directorships Held by Board Member | ||||||||
Richard S. Trutanic 2/13/52 | Indefinite; MainStay Funds Trust: Trustee since 2009. | Chairman and Chief Executive Officer, Somerset & Company (financial advisory firm) (since 2004); Managing Director, The Carlyle Group (private investment firm) (2002 to 2004); Senior Managing Director, Partner and Board Member, Groupe Arnault S.A. (private investment firm) (1999 to 2002) | 78 | MainStay Funds: Trustee since 1994 (12 funds); MainStay VP Funds Trust: Trustee since 2007 (29 portfolios)**; Private Advisors Alternative Strategies Master Fund: Trustee since 2011; Private Advisors Alternative Strategies Fund: Trustee since 2011; and MainStay DefinedTerm Municipal Opportunities Fund: Trustee since 2011. | ||||||||
Roman L. Weil 5/22/40 | Indefinite; MainStay Funds Trust: Trustee and Audit Committee Financial Expert since 2009. | Visiting Professor, University of California—San Diego (since 2012); President, Roman L. Weil Associates, Inc. (consulting firm) (since 1981); Visiting Professor, Southern Methodist University (2011); Visiting Professor, NYU Stern School of Business, New York University (2011); V. Duane Roth Professor Emeritus of Accounting, Chicago Booth School Business, University of Chicago (1965-2008) | 78 | MainStay Funds: Trustee and Audit Committee Financial Expert since 2007 (12 funds); MainStay VP Funds Trust: Trustee and Audit Committee Financial Expert since 1994 (29 portfolios)**; Private Advisors Alternative Strategies Master Fund: Trustee and Audit Committee Financial Expert since 2011; Private Advisors Alternative Strategies Fund: Trustee and Audit Committee Financial Expert since 2011; and MainStay DefinedTerm Municipal Opportunities Fund: Trustee and Audit Committee Financial Expert since 2011. | ||||||||
John A. Weisser 10/22/41 | Indefinite; MainStay Funds Trust: Trustee since 2009. | Retired. Managing Director of Salomon Brothers, Inc. (1971 to 1995) | 78 | MainStay Funds: Trustee since 2007 (12 funds); MainStay VP Funds Trust: Trustee since 1997 (29 portfolios)**; Private Advisors Alternative Strategies Master Fund: Trustee since 2011; Private Advisors Alternative Strategies Fund: Trustee since 2011; MainStay DefinedTerm Municipal Opportunities Fund: Trustee since 2011; Direxion Insurance Trust: Trustee since 2007 (1 portfolio); Direxion Funds: Trustee since 2007 (27 portfolios); and Direxion Shares ETF Trust: Trustee since 2008 (50 portfolios). |
| ** | Includes prior service as a Director of MainStay VP Series Fund, Inc., the predecessor to MainStay VP Funds Trust. |
| mainstayinvestments.com | 33 |
Name and Date of Birth | Position(s) Held and Length of Service | Principal Occupation(s) During Past Five Years | ||||||
Officers (Who Are Not Board Members)* | Stephen P. Fisher 2/22/59 | President, MainStay Funds Trust (since 2009) | Manager, President and Chief Operating Officer, NYLIFE Distributors LLC (since 2008); Chairman of the Board, NYLIM Service Company LLC (since 2008); Senior Managing Director and Chief Marketing Officer, New York Life Investment Management LLC (since 2005); President, Private Advisors Alternative Strategies Master Fund, Private Advisors Alternative Strategies Fund and MainStay DefinedTerm Municipal Opportunities Fund (since 2011), President, MainStay Funds and MainStay VP Funds Trust** (since 2007) | |||||
Jack R. Benintende 5/12/64 | Treasurer and Principal Financial and Accounting Officer, MainStay Funds Trust (since 2009) | Assistant Treasurer, New York Life Investment Management Holdings LLC (since 2008); Managing Director, New York Life Investment Management LLC (since 2007); Private Advisors Alternative Strategies Master Fund, Private Advisors Alternative Strategies Fund and MainStay DefinedTerm Municipal Opportunities Fund (since 2011); Treasurer and Principal Financial and Accounting Officer, MainStay Funds and MainStay VP Funds Trust** (since 2007) | ||||||
Jeffrey A. Engelsman 9/28/67 | Vice President and Chief Compliance Officer, MainStay Funds Trust (since 2009) | Managing Director, Compliance (since 2009), Director and Associate General Counsel, New York Life Investment Management LLC (2005 to 2008); Assistant Secretary, NYLIFE Distributors LLC (2006 to 2008); Vice President and Chief Compliance Officer Private Advisors Alternative Strategies Master Fund, Private Advisors Alternative Strategies Fund and MainStay DefinedTerm Municipal Opportunities Fund (since 2011), MainStay Funds and MainStay VP Funds Trust (since 2009); Assistant Secretary, MainStay Funds (2006 to 2008); Assistant Secretary, MainStay VP Series Fund, Inc. (2005 to 2008)** | ||||||
J. Kevin Gao 10/13/67 | Secretary and Chief Legal Officer, MainStay Funds Trust (since 2010) | Managing Director and Associate General Counsel, New York Life Investment Management LLC (since 2010); Secretary and Chief Legal Officer, MainStay Funds and MainStay VP Funds Trust** (since 2010), Private Advisors Alternative Strategies Master Fund, Private Advisors Alternative Strategies Fund and MainStay DefinedTerm Municipal Opportunities Fund (since 2011); Director and Counsel, Credit Suisse; Chief Legal Officer and Secretary, Credit Suisse Asset Management LLC and Credit Suisse Funds (2003-2010) | ||||||
Scott T. Harrington 2/8/59 | Vice President—Administration, MainStay Funds Trust (since 2009) | Director, New York Life Investment Management LLC (including predecessor advisory organizations) (since 2000); Executive Vice President, New York Life Trust Company and New York Life Trust Company, FSB (since 2006); Vice President—Administration, MainStay Funds and MainStay VP Funds Trust** (since 2005), Private Advisors Alternative Strategies Master Fund, Private Advisors Alternative Strategies Fund and MainStay DefinedTerm Municipal Opportunities Fund (since 2011) |
| * | The Officers listed above are considered to be “interested persons” of the MainStay Group of Funds within the meaning of the 1940 Act because of their affiliation with the MainStay Group of Funds, New York Life Insurance Company, New York Life Investment Management LLC, New York Life Insurance Company, New York Life Investment Management LLC, NYLIFE Securities LLC and/or NYLIFE Distributors LLC, as described in detail in the column captioned “Principal Occupation(s) During Past Five Years.” Officers are elected annually by the Board to serve a one year term. |
| ** | Includes prior service as an Officer of MainStay VP Series Fund, Inc., the predecessor to MainStay VP Funds Trust. |
| 34 | MainStay Cornerstone Growth Fund |
MainStay Funds
MainStay offers a wide range of Funds for virtually any investment need. The full array of MainStay open-end offerings is listed here, with information about the manager, subadvisors, legal counsel and independent registered public accounting firms.
Equity
U.S. Equity Funds
MainStay Common Stock Fund
MainStay Cornerstone Growth Fund
MainStay Epoch U.S. All Cap Fund
MainStay Epoch U.S. Equity Yield Fund
MainStay ICAP Equity Fund
MainStay ICAP Select Equity Fund
MainStay Large Cap Growth Fund1
MainStay MAP Fund
MainStay S&P 500 Index Fund
MainStay U.S. Equity Opportunities Fund
MainStay U.S. Small Cap Fund
International/Global Equity Funds
MainStay Epoch Global Choice Fund
MainStay Epoch Global Equity Yield Fund
MainStay Epoch International Small Cap Fund
MainStay ICAP Global Fund
MainStay ICAP International Fund
MainStay International Equity Fund
MainStay International Opportunities Fund
Income
Taxable Bond Funds
MainStay Floating Rate Fund
MainStay Global High Income Fund
MainStay Government Fund
MainStay High Yield Corporate Bond Fund
MainStay High Yield Opportunities Fund
MainStay Indexed Bond Fund
MainStay Intermediate Term Bond Fund
MainStay Short Duration High Yield Fund
MainStay Short Term Bond Fund
MainStay Unconstrained Bond Fund
Municipal Bond Funds
MainStay California Tax Free Opportunities Fund2
MainStay High Yield Municipal Bond Fund
MainStay New York Tax Free Opportunities Fund3
MainStay Tax Free Bond Fund
Money Market Fund
MainStay Money Market Fund
Mixed Asset
MainStay Balanced Fund
MainStay Convertible Fund
MainStay Income Builder Fund
MainStay Marketfield Fund
Asset Allocation/Target Date
MainStay Conservative Allocation Fund
MainStay Growth Allocation Fund
MainStay Moderate Allocation Fund
MainStay Moderate Growth Allocation Fund
MainStay Retirement 2010 Fund
MainStay Retirement 2020 Fund
MainStay Retirement 2030 Fund
MainStay Retirement 2040 Fund
MainStay Retirement 2050 Fund
Manager
New York Life Investment Management LLC
New York, New York
Subadvisors
Cornerstone Capital Management Holdings LLC4
New York, New York
Cornerstone Capital Management LLC4
Bloomington, Minnesota
Epoch Investment Partners, Inc.
New York, New York
Institutional Capital LLC4
Chicago, Illinois
MacKay Shields LLC4
New York, New York
Marketfield Asset Management LLC
New York, New York
Markston International LLC
White Plains, New York
Winslow Capital Management, LLC
Minneapolis, Minnesota
Legal Counsel
Dechert LLP
Independent Registered Public Accounting Firms
KPMG LLP
PricewaterhouseCoopers LLP5
1. Effective January 13, 2012, the Fund was closed to new investors with certain exceptions.
2. This Fund is only registered for sale in AZ, CA, NV, OR, UT, and WA.
3. This Fund is only registered for sale in CT, DE, FL, MA, NJ, NY, and VT.
4. An affiliate of New York Life Investment Management LLC.
5. For MainStay Marketfield Fund only.
Not part of the Annual Report
For more information
800-MAINSTAY (624-6782)
mainstayinvestments.com
The MainStay Funds® are managed by New York Life Investment Management LLC and distributed through NYLIFE Distributors LLC, 169 Lackawanna Avenue, Parsippany, NJ 07054, a wholly owned subsidiary of New York Life Insurance Company. NYLIFE Distributors LLC is a Member FINRA/SIPC.
MainStay Investments® is a registered service mark and name under which New York Life Investment Management LLC does business. MainStay Investments, an indirect subsidiary of New York Life Insurance Company, New York, NY 10010, provides investment advisory products and services.
This report may be distributed only when preceded or accompanied by a current Fund prospectus.
©2013 NYLIFE Distributors LLC. All rights reserved.
| Not FDIC/NCUA Insured | Not a Deposit | May Lose Value | No Bank Guarantee | Not Insured by Any Government Agency |
| NYLIM-30684 MS212-13 | MSCG11-08/13 NL045 |
| Item 2. | Code of Ethics. |
As of the end of the period covered by this report, the Registrant has adopted a code of ethics (the “Code”) that applies to the Registrant’s principal executive officer (“PEO”) and principal financial officer (“PFO”). A copy of the Code is filed herewith. The Registrant did not grant any waivers, including implicit waivers, from any provisions of the Code to the PEO or PFO during the period covered by this report.
| Item 3. | Audit Committee Financial Expert. |
The Board of Trustees has determined that the Registrant has two audit committee financial experts serving on its Audit Committee. The Audit Committee financial experts are Alan R. Latshaw and Roman L. Weil. Messrs. Latshaw and Weil are “independent” within the meaning of that term under the Investment Company Act of 1940.
| Item 4. | Principal Accountant Fees and Services. |
MainStay Cornerstone Growth Fund commenced operations on January 11, 2013.
| (a) | Audit Fees |
The aggregate fees billed for the fiscal year ended June 30, 2013 for professional services rendered by KPMG LLP (“KPMG”) for the audit of the Registrant’s annual financial statements or services that are normally provided by KPMG in connection with statutory and regulatory filings or engagements for that fiscal year were $37,000.
| (b) | Audit-Related Fees |
The aggregate fees billed for assurance and related services by KPMG that are reasonably related to the performance of the audit of the Registrant’s financial statements and are not reported under paragraph (a) of this Item were $12,500 for the fiscal year ended June 30, 2013. These audit-related services include issuance of consents to use the auditor’s reports.
| (c) | Tax Fees |
The aggregate fees billed for professional services rendered by KPMG for tax compliance, tax advice, and tax planning were $0 during the fiscal year ended June 30, 2013.
| (d) | All Other Fees |
The aggregate fees billed for products and services provided by KPMG, other than the services reported in paragraphs (a) through (c) of this Item were $0 during the fiscal year ended June 30, 2013.
| (e) | Pre-Approval Policies and Procedures |
| (1) | The Registrant’s Audit Committee has adopted pre-approval policies and procedures (the “Procedures”) to govern the Committee’s pre-approval of (i) all audit services and permissible non-audit services to be provided to the Registrant by its independent accountant, and (ii) all permissible non-audit services to be provided by such independent accountant to the Registrant’s investment adviser and to any entity controlling, controlled by or under common control with the investment adviser that provides ongoing services to the Registrant (collectively, the “Service |
| Affiliates”) if the services directly relate to the Registrant’s operations and financial reporting. In accordance with the Procedures, the Audit Committee is responsible for the engagement of the independent accountant to certify the Registrant’s financial statements for each fiscal year. With respect to the pre-approval of non-audit services provided to the Registrant and its Service Affiliates, the Procedures provide that the Audit Committee may annually pre-approve a list of the types of services that may be provided to the Registrant or its Service Affiliates, or the Audit Committee may pre-approve such services on a project-by-project basis as they arise. Unless a type of service has received general pre-approval, it will require specific pre-approval by the Audit Committee if it is to be provided by the independent accountant. The Procedures also permit the Audit Committee to delegate authority to one or more of its members to pre-approve any proposed non-audit services that have not been previously pre-approved by the Audit Committee, subject to the ratification by the full Audit Committee no later than its next scheduled meeting. To date, the Audit Committee has not delegated such authority. |
| (2) | With respect to the services described in paragraphs (b) through (d) of this Item 4, no amount was approved by the Audit Committee pursuant to paragraph (c)(7)(i)(C) of Rule 2-01 of Regulation S-X. |
(f) There were no hours expended on KPMG’s engagement to audit the Registrant’s financial statements for the most recent fiscal year was attributable to work performed by persons other than KPMG’s full-time, permanent employees.
(g) All non-audit fees billed by KPMG for services rendered to the Registrant for the fiscal year ended June 30, 2013 are disclosed in 4(b)-(d) above.
The aggregate non-audit fees billed by KPMG for services rendered to the Registrant’s investment adviser (not including any sub-adviser whose role is primarily portfolio management and is subcontracted with or overseen by another investment adviser), and any entity controlling, controlled by, or under common control with the adviser that provides ongoing services to the Registrant were approximately $81,308 for the fiscal year ended June 30, 2013.
(h) The Registrant’s Audit Committee has determined that the non-audit services rendered by KPMG for the fiscal year ended June 30, 2013 to the Registrant’s investment adviser and any entity controlling, controlled by, or under common control with the Registrant’s investment adviser that provides ongoing services to the Registrant that were not required to be pre-approved by the Audit Committee because they did not relate directly to the operations and financial reporting of the registrant were compatible with maintaining the respective independence of KPMG during the relevant time period.
| Item 5. | Audit Committee of Listed Registrants |
Not applicable.
| Item 6. | Schedule of Investments |
The Schedule of Investments is included as part of Item 1 of this report.
| Item 7. | Disclosure of Proxy Voting Policies and Procedures for Closed-End Management Investment Companies. |
Not applicable.
| Item 8. | Portfolio Managers of Closed-End Management Investment Companies. |
Not applicable.
| Item 9. | Purchases of Equity Securities by Closed-End Management Investment Company and Affiliated Purchasers. |
Not Applicable.
| Item 10. | Submission of Matters to a Vote of Security Holders. |
Since the Registrant’s last response to this Item, there have been no material changes to the procedures by which shareholders may recommend nominees to the Registrant’s Board of Trustees.
| Item 11. | Controls and Procedures. |
| (a) | Based on an evaluation of the Registrant’s Disclosure Controls and Procedures (as defined in Rule 30a-3(c) under the Investment Company Act of 1940) (the “Disclosure Controls”), as of a date within 90 days prior to the filing date (the “Filing Date”) of this Form N-CSR (the “Report”), the Registrant’s principal executive officer and principal financial officer have concluded that the Disclosure Controls are reasonably designed to ensure that information required to be disclosed by the Registrant in the Report is recorded, processed, summarized and reported by the Filing Date, including ensuring that information required to be disclosed in the Report is accumulated and communicated to the Registrant’s management, including the Registrant’s principal executive officer and principal financial officer, as appropriate to allow timely decisions regarding required disclosure. |
| (b) | There were no changes in the Registrant’s internal control over financial reporting (as defined in Rule 30a-3(d)) under the Investment Company Act of 1940 that occurred during the second fiscal quarter of the period covered by this report that has materially affected, or is reasonably likely to materially affect, the Registrant’s internal control over financial reporting. |
| Item 12. | Exhibits. |
| (a) | Certifications of principal executive officer and principal financial officer as required by Rule 30a-2 under the Investment Company Act of 1940. |
| (b) | Certifications of principal executive officer and principal financial officer as required by Section 906 of the Sarbanes-Oxley Act of 2002. |
SIGNATURES
Pursuant to the requirements of the Securities Exchange Act of 1934 and the Investment Company Act of 1940, the Registrant has duly caused this Report to be signed on its behalf by the undersigned, thereunto duly authorized.
MAINSTAY FUNDS TRUST
| By: | /s/ Stephen P. Fisher | |
| Stephen P. Fisher | ||
| President and Principal Executive Officer |
Date: September 6, 2013
Pursuant to the requirements of the Securities Exchange Act of 1934 and the Investment Company Act of 1940, this Report has been signed below by the following persons on behalf of the Registrant and in the capacities and on the dates indicated.
| By: | /s/ Stephen P. Fisher | |
| Stephen P. Fisher | ||
| President and Principal Executive Officer |
Date: September 6, 2013
| By: | /s/ Jack R. Benintende | |
| Jack R. Benintende | ||
| Treasurer and Principal Financial and Accounting Officer |
Date: September 6, 2013
EXHIBIT INDEX
| (a)(1) | Code of Ethics |
| (a)(2) | Certifications of principal executive officer and principal financial officer as required by Rule 30a-2 under the Investment Company Act of 1940. |
| (c) | Certification of principal executive officer and principal financial officer as required by Section 906 of the Sarbanes-Oxley Act of 2002. |