UNITED STATES
SECURITIES AND EXCHANGE COMMISSION
Washington, D.C. 20549
FormN-CSR
CERTIFIED SHAREHOLDER REPORT OF REGISTERED MANAGEMENT
INVESTMENT COMPANIES
Investment Company Act File Number811-22321
MAINSTAY FUNDS TRUST
(Exact name of Registrant as specified in charter)
51 Madison Avenue, New York, NY 10010
(Address of principal executive offices) (Zip code)
J. Kevin Gao, Esq.
30 Hudson Street
Jersey City, New Jersey 070302
(Name and address of agent for service)
Registrant’s telephone number, including area code: (212)576-7000
Date of fiscal year end: April 30
(MainStay MacKay Short Term Municipal Fund)
Date of reporting period: April 30, 2019
FORMN-CSR
Item 1. Reports to Stockholders.
MainStay MacKay Short Term Municipal Fund
(Formerly known as MainStay MacKay Tax Advantaged Short Term Bond Fund)
Message from the President and Annual Report
April 30, 2019

Beginning on January 1, 2021, paper copies of each MainStay Fund’s annual and semiannual shareholder reports will no longer be sent by mail, unless you specifically request paper copies of the reports from MainStay Funds or from your financial intermediary. Instead, the reports will be made available on the MainStay Funds’ website. You will be notified by mail and provided with a website address to access the report each time a new report is posted to the website.
If you already elected to receive shareholder reports electronically, you will not be affected by this change and you need not take any action. At any time, you may elect to receive reports and other communications from MainStay Funds electronically by calling toll-free 800-624-6782, by sending an e-mail to MainStayShareholderServices@nylim.com, or by contacting your financial intermediary.
You may elect to receive all future shareholder reports in paper form free of charge. If you hold shares of a MainStay Fund directly, you can inform MainStay Funds that you wish to receive paper copies of reports by calling toll-free 800-624-6782 or by sending an e-mail to MainStayShareholderServices@nylim.com. If you hold shares of a MainStay Fund through a financial intermediary, please contact the financial intermediary to make this election. Your election to receive reports in paper form will apply to all MainStay Funds in which you are invested and may apply to all funds held with your financial intermediary.
| Not FDIC/NCUA Insured | Not a Deposit | May Lose Value | No Bank Guarantee | Not Insured by Any Government Agency | ||||

This page intentionally left blank
Message from the President
Despite volatile market conditions, stocks and bonds in the United States and around the world generally gained ground during the12-month period ended April 30, 2019.
The reporting period began on a positive note with strong U.S. economic expansion and moderate levels of growth in much of the developed world, accompanied by historically low interest rates and restrained inflation. However, high equity valuations, particularly in the information technology sector, drove equity and fixed-income markets lower in October 2018. The prospect of rising interest rates, as the U.S. Federal Reserve Board (Fed) gradually hiked its benchmark, further added to this decline. Markets plunged further in early December 2018 in response to concerns that the Fed was raising rates too aggressively and that trade conflicts between the U.S. and China could prove more difficult to resolve than previously expected.
Market sentiment turned positive in the last week of December 2018 after the Fed indicated that additional rate hikes were put on hold, positioning financial markets to bounce back quickly in 2019. Investors overlooked ongoing concerns regarding mounting trade tensions between the U.S. and China and an increasingly unclear global economic picture, focusing instead on continued U.S. economic growth, low unemployment, restrained inflation and better than expected corporate earnings. By April 30, 2019, most U.S.-based equity and fixed-income sectors climbed back into positive territory, with some areas of the domestic market recording impressive gains. International markets showed signs of recovery as well, though generally less robust than in the United States.
Among U.S. equities,large-cap stocks tended to outperform their smaller-caps counterparts, while growth stocks generally outperformed value-oriented issues. Among industry sectors, information technology led the market’s advance, followed by consumer discretionary, communications services, industrials and materials. Of the market’s 11 sectors, only energy ended the reporting period in mildly negative territory, largely due to declining oil and gas prices. Health care also significantly underperformed the broader market largely due to uncertainties regarding potential regulatory changes.
Not surprisingly, traditionally less volatile U.S. fixed-income instruments traded in a narrower range than equities. For the most part, corporate bonds suffered relatively mild declines in late 2018 and recovered along with their equity counterparts through the end of the reporting period. Most other bond sectors produced comparatively steady positive performance throughout the reporting period, with lower-credit quality, higher-yielding, longer-duration securities generally leading the group’s advance. On average, municipal bonds performed in the middle of the pack while continuing to providetax-advantaged returns for eligible investors.
Amid volatile conditions for most financial markets, we’re pleased that MainStay MacKay Short Term Municipal Fund met its objective of providing shareholders with current income exempt from regular federal income tax. We remain sharply focused on providing you, as a MainStay shareholder, with the experienced and disciplined fund management that we believe underpins an effective, long-term investment strategy. Whatever tomorrow’s investment environment brings, you can rely on our portfolio managers to pursue the objectives of their individual Funds as outlined in the prospectus with the energy and dedication you have come to expect.
While volatility will always remain characteristic of financial markets, your financial professional remains an excellent resource to help you review your investment strategy and make any necessary updates or revisions. We encourage you to discuss with them any questions you may have regarding the report that follows, and to seek their advice in meeting your evolving financial goals. We also invite you to visit our website at nylinvestments.com/funds for more information on investing and the MainStay Funds.
Sincerely,

Kirk C. Lehneis
President
The opinions expressed are as of the date of this report and are subject to change. There is no guarantee that any forecast made will come to pass. This material does not constitute investment advice and is not intended as an endorsement of any specific investment. Past performance is no guarantee of future results.
Not part of the Annual Report
Investors should refer to the Fund’s Summary Prospectus and/or Prospectus and consider the Fund’s investment objectives, strategies, risks, charges and expenses carefully before investing. The Summary Prospectus and/or Prospectus contain this and other information about the Fund. You may obtain copies of the Fund’s Summary Prospectus, Prospectus and Statement of Additional Information free of charge, upon request, by calling toll-free 800-624-6782, by writing to NYLIFE Distributors LLC, Attn: MainStay Marketing Department, 30 Hudson Street, Jersey City, NJ 07302 or by sending ane-mail to MainStayShareholderServices@nylim.com. These documents are also available via the MainStay Funds’ website at nylinvestments.com/funds. Please read the Summary Prospectus and/or Prospectus carefully before investing.
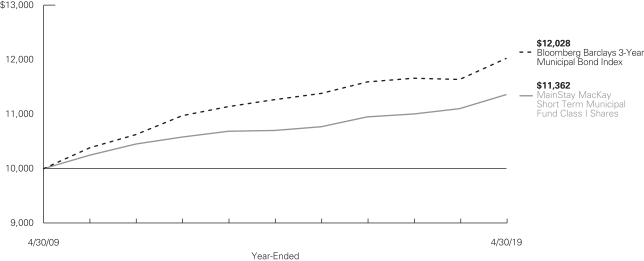
Investment and Performance Comparison1(Unaudited)
Performance data quoted represents past performance. Past performance is no guarantee of future results. Because of market volatility and other factors, current performance may be lower or higher than the figures shown. Investment return and principal value will fluctuate, and as a result, when shares are redeemed, they may be worth more or less than their original cost. The graph below depicts the historical performance of Class I shares of the Fund. Performance will vary from class to class based on differences in class-specific expenses and sales charges. For performance information current to the most recent month-end, please call 800-624-6782 or visit nylinvestments.com/funds.
Average Annual Total Returns for the Year-Ended April 30, 20192
| Class | Sales Charge | Inception Date | One Year | Five Years | Ten Years | Gross Expense Ratio3 | ||||||||||||||||||
| Class A Shares | Maximum 1% Initial Sales Charge4 | With sales charges Excluding sales charges | | 1/2/2004 | | | 0.91 1.93 | %
| | 0.29 0.90 | %
| | 0.71 1.02 | %
| | 0.74 0.74 | %
| |||||||
| Investor Class Shares | Maximum 1% Initial Sales Charge4 | With sales charges Excluding sales charges | | 2/28/2008 | | | 0.54 1.56 |
| | –0.11 0.50 |
| | 0.32 0.62 |
| | 1.26 1.26 |
| |||||||
| Class I Shares | No Sales Charge | 1/2/1991 | 2.34 | 1.20 | 1.28 | 0.49 | ||||||||||||||||||
| 1. | The performance table and graph do not reflect the deduction of taxes that a shareholder would pay on distributions or Fund share redemptions. Total returns reflect maximum applicable sales charges as indicated in the table above, if any, changes in share price, and reinvestment of dividend and capital gain distributions. The graph assumes the initial investment amount shown above and reflects the deduction of all sales charges that would have applied for the period of investment. Performance figures may reflect certain fee waivers and/or expense limitations, without which total returns may have been lower. For more information on share classes and current fee waivers and/or expense limitations (if any), please refer to the Notes to Financial Statements. |
| 2. | Effective June 1, 2015, the Fund changed, among other things, its investment objective and principal investment strategies. Effective May 22, 2018, the Fund made further changes to, among other things, its principal investment strategies. Effective February 28, 2019, the Fund further changed its investment objective. The performance information shown in this report reflects the Fund’s prior investment objectives and principal investment strategies, as applicable. |
| 3. | The gross expense ratios presented reflect the Fund’s “Total Annual Fund Operating Expenses” from the most recent Prospectus, as supplemented, and may differ from other expense ratios disclosed in this report. |
| 4. | The maximum initial sales charge prior to June 1, 2015 was 3.00%. |
The footnotes on the next page are an integral part of the table and graph and should be carefully read in conjunction with them.
| 5 |
| Benchmark Performance | One Year | Five Years | Ten Years | |||||||||
Bloomberg Barclays 3-Year Municipal Bond Index5 | 3.31 | % | 1.30 | % | 1.86 | % | ||||||
Morningstar Muni National Short Category Average6 | 2.71 | 1.08 | 1.66 | |||||||||
| 5. | The Bloomberg Barclays 3-Year Municipal Bond Index is the Fund’s primary broad-based securities-market index for comparison purposes. The Bloomberg Barclays 3-Year Municipal Bond Index is considered representative of the broad-based market for investment grade, tax-exempt bonds with a maturity range of 2-4 years. Results assume reinvestment of all dividends and capital gains. An investment cannot be made directly into an index. |
| 6. | The Morningstar Muni National Short Category Average is representative of funds that invest in bonds issued by state and local governments to fund |
| public projects. The income from these bonds is generally free from federal taxes and/or from state taxes in the issuing state. To lower risk, some of these portfolios spread their assets across many states and sectors. Other portfolios buy bonds from only one state in order to get the state-tax benefit. These portfolios have durations of less than 4.5 years. Results are based on average total returns of similar funds with all dividends and capital gain distributions reinvested. |
The footnotes on the preceding page are an integral part of the table and graph and should be carefully read in conjunction with them.
| 6 | MainStay MacKay Short Term Municipal Fund |
Cost in Dollars of a $1,000 Investment in Mainstay MacKay Short Term Municipal Fund (Unaudited)
The example below is intended to describe the fees and expenses borne by shareholders during the six-month period from November 1, 2018, to April 30, 2019, and the impact of those costs on your investment.
Example
As a shareholder of the Fund you incur two types of costs: (1) transaction costs, including exchange fees and sales charges (loads) on purchases (as applicable), and (2) ongoing costs, including management fees, distribution and/or service (12b-1) fees, and other Fund expenses (as applicable). This example is intended to help you understand your ongoing costs (in dollars) of investing in the Fund and to compare these costs with the ongoing costs of investing in other mutual funds. The example is based on an investment of $1,000 made at the beginning of the six-month period and held for the entire period from November 1, 2018, to April 30, 2019.
This example illustrates your Fund’s ongoing costs in two ways:
Actual Expenses
The second and third data columns in the table below provide information about actual account values and actual expenses. You may use the information in these columns, together with the amount you invested, to estimate the expenses that you paid during the six months ended April 30, 2019. Simply divide your account value by $1,000 (for example, an $8,600 account value divided by $1,000 = 8.6), then
multiply the result by the number under the heading entitled “Expenses Paid During Period” to estimate the expenses you paid on your account during this period.
Hypothetical Example for Comparison Purposes
The fourth and fifth data columns in the table below provide information about hypothetical account values and hypothetical expenses based on the Fund’s actual expense ratio and an assumed rate of return of 5% per year before expenses, which is not the Fund’s actual return. The hypothetical account values and expenses may not be used to estimate the actual ending account balances or expenses you paid for thesix-month period shown. You may use this information to compare the ongoing costs of investing in the Fund with the ongoing costs of investing in other mutual funds. To do so, compare this 5% hypothetical example with the 5% hypothetical examples that appear in the shareholder reports of the other mutual funds.
Please note that the expenses shown in the table are meant to highlight your ongoing costs only and do not reflect any transactional costs, such as exchange fees or sales charges (loads). Therefore, the fourth and fifth data columns of the table are useful in comparing ongoing costs only and will not help you determine the relative total costs of owning different funds. In addition, if these transactional costs were included, your costs would have been higher.
| Share Class | Beginning Account Value 11/1/18 | Ending Account Value (Based on Actual Returns and Expenses) 4/30/19 | Expenses Paid During Period1 | Ending Account Value (Based on Hypothetical 5% Annualized Return and Actual Expenses) 4/30/19 | Expenses Paid During Period1 | Net Expense Ratio During Period2 | ||||||||||||||||
| Class A Shares | $ | 1,000.00 | $ | 1,012.30 | $ | 3.49 | $ | 1,021.32 | $ | 3.51 | 0.70% | |||||||||||
| Investor Class Shares | $ | 1,000.00 | $ | 1,009.90 | $ | 5.83 | $ | 1,018.99 | $ | 5.86 | 1.17% | |||||||||||
| Class I Shares | $ | 1,000.00 | $ | 1,013.80 | $ | 2.00 | $ | 1,022.81 | $ | 2.01 | 0.40% | |||||||||||
| 1. | Expenses are equal to the Fund’s annualized expense ratio of each class multiplied by the average account value over the period, divided by 365 and multiplied by 181 (to reflect the six-month period). The table above represents the actual expenses incurred during the six-month period. |
| 2. | Expenses are equal to the Fund’s annualized expense ratio to reflect the six-month period. |
| 7 |
Portfolio Composition as of April 30, 2019(Unaudited)
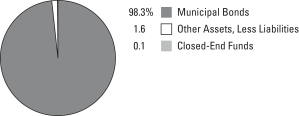
See Portfolio of Investments beginning on page 10 for specific holdings within these categories. The Fund’s holdings are subject to change.
Top Ten Issuers Held as of April 30, 2019(Unaudited)
| 1. | Territory of Guam, Revenue Bonds, 5.00%, due 11/15/19–12/1/21 |
| 2. | State of Illinois, Unlimited General Obligation, 5.00%, due 11/1/19–6/1/21 |
| 3. | State of Ohio, Capital Facilities Lease-Appropriation, Revenue Bonds, 2.20%, due 10/1/36 |
| 4. | Main Street Natural Gas, Inc., Revenue Bonds, 2.426%–5.00%, due 5/15/20–4/1/48 |
| 5. | New Jersey Economic Development Authority, School Facilities Construction, Revenue Bonds, 5.25%–5.50%, due 12/15/19–9/1/23 |
| 6. | New Jersey Transportation Trust Fund Authority, Transportation System, Revenue Bonds, 5.25%–5.50%, due 12/15/20–12/15/23 |
| 7. | State of North Carolina, Capital Improvement, Revenue Bonds, 5.00%, due 5/1/19 |
| 8. | Indiana Health & Educational Facilities Financing Authority, Ascension Senior Health Credit Group, Revenue Bonds, 1.375%–1.75%, due 10/1/27–11/15/31 |
| 9. | County of Anne Arundel MD, Unlimited General Obligation, 5.00%, due 10/1/19 |
| 10. | New Jersey Economic Development Authority, Revenue Bonds, 5.00%, due 11/1/19–6/15/21 |
| 8 | MainStay MacKay Short Term Municipal Fund |
Portfolio Management Discussion and Analysis(Unaudited)
Questions answered by portfolio managers John Loffredo, CFA, Robert DiMella, CFA, Michael Petty, David Dowden, Scott Sprauer, Frances Lewis and John Lawlor of MacKay Shields LLC, the Fund’s Subadvisor.
How did MainStay MacKay Short Term Municipal Fund perform relative to its benchmark and peer group during the 12 months ended April 30, 2019?
For the 12 months ended April 30, 2019, Class I shares of MainStay MacKay Short Term Municipal Fund returned 2.34%, underperforming the 3.31% return of the Fund’s primary benchmark, the Bloomberg Barclays3-Year Municipal Bond Index. Over the same period, Class I shares also underperformed the 2.71% return of the Morningstar Muni National Short Category Average.1
What factors affected the Fund’s relative performance during the reporting period?
During the reporting period, the Fund’s underweight exposure to bonds from New York detracted from relative performance, as did the Fund’s Treasury hedge. However, overweight exposure to securities from Guam and underweight exposure to securities from Virginia contributed positively to performance relative to the Bloomberg Barclays3-Year Municipal Bond Index. (Contributions take weightings and total returns into account.)
Were there any changes to the Fund during the reporting period?
Effective February 28, 2019, the Fund’s investment objective was modified to seek current income exempt from regular federal income tax. Also on February 28, 2019, John Lawlor was added as a portfolio manager of the Fund. John Loffredo, Robert DiMella, Michael Petty, David Dowden, Scott Sprauer and Francis Lewis continue to manage the Fund. For more information about these changes refer to the supplements dated December 14, 2018, and February 28, 2019.
What was the Fund’s duration2 strategy during the reporting period?
The Fund targeted a shorter duration posture than its benchmark, the Bloomberg Barclays3-Year Municipal Bond Index. At the end of the reporting period, the Fund’s modified duration to
worst3 was 1.23 years while the benchmark’s modified duration to worst was 2.46 years.
During the reporting period, which sectors were the strongest positive contributors to the Fund’s relative performance and which sectors were particularly weak?
The strongest contributors to the Fund’s performance relative to the Bloomberg Barclays3-Year Municipal Bond Index were beneficial security selection in the hospital, industrial development revenue/pollution control revenue (IDR/PCR) and resource recovery sectors. The Fund’s overweight exposure to the prerefunded/escrowed to maturity (ETM), state general obligation, and transportation sectors detracted from relative performance.
What were some of the Fund’s largest purchases and sales during the reporting period?
The Fund remained focused on diversification and liquidity, so no individual transaction was considered significant.
How did the Fund’s sector weightings change during the reporting period?
During the reporting period, the Fund decreased its exposure to the hospital, education and water/sewer sectors while increasing its exposure to the leasing, special tax and electric sectors. The Fund decreased its exposure to bonds from New York and Minnesota while increasing its exposure to bonds from North Carolina, Illinois and Georgia during the same period.
How was the Fund positioned at the end of the reporting period?
At the end of the reporting period, the Fund held overweight positions relative to the Bloomberg Barclays3-Year Municipal Bond Index in the hospital and leasing sectors and to bonds from New Jersey and Illinois. At the same point in time, the Fund held underweight exposure to the prerefunded/ETM and state general obligation sectors and to bonds from New York and California.
| 1. | See page 5 for other share class returns, which may be higher or lower than Class I share returns. See page 6 for more information on benchmark and peer group returns. |
| 2. | Duration is a measure of the price sensitivity of a fixed-income investment to changes in interest rates. Duration is expressed as a number of years and is considered a more accurate sensitivity gauge than average maturity. |
| 3. | Modified duration is inversely related to the approximate percentage change in price for a given change in yield. Duration to worst is the duration of a bond computed using the bond’s nearest call date or maturity, whichever comes first. This measure ignores future cash flow fluctuations due to embedded optionality. |
The opinions expressed are those of the portfolio managers as of the date of this report and are subject to change. There is no guarantee that any forecasts will come to pass. This material does not constitute investment advice and is not intended as an endorsement of any specific investment.
| 9 |
Portfolio of InvestmentsApril 30, 2019
| Principal Amount | Value | |||||||
Long-Term Bonds 98.4%† Municipal Bonds 98.3% |
| |||||||
Arizona 0.2% | ||||||||
Industrial Development Authority of the City of Phoenix, Downtown Phoenix Student LLC, Revenue Bonds | $ | 50,000 | $ | 55,002 | ||||
City of Tucson AZ, Certificates of Participation Insured: AGM | 350,000 | 359,111 | ||||||
Glendale Union School District No. 205, School Improvement Project, Unlimited General Obligation | 540,000 | 560,822 | ||||||
|
| |||||||
| 974,935 | ||||||||
|
| |||||||
California 11.0% |
| |||||||
Alta Loma School District, Capital Appreciation, Unlimited General Obligation | 1,750,000 | 1,682,975 | ||||||
Anaheim Public Financing Authority, Public Improvements Project, Revenue Bonds | 300,000 | 287,157 | ||||||
Auburn Urban Development Authority Successor Agency, Auburn Redevelopment Project, Tax Allocation | 140,000 | 140,267 | ||||||
Cabrillo Unified School District, Capital Appreciation, Unlimited General Obligation | 400,000 | 391,372 | ||||||
California Educational Facilities Authority, Loyola Marymount University, Revenue Bonds | 3,000,000 | 2,820,450 | ||||||
California Health Facilities Financing Authority, Los Angeles Biomedical Research Institute, Revenue Bonds | ||||||||
3.00%, due 9/1/20 | 215,000 | 218,294 | ||||||
4.00%, due 9/1/21 | 275,000 | 288,057 | ||||||
4.00%, due 9/1/22 | 300,000 | 319,581 | ||||||
4.00%, due 9/1/23 | 310,000 | 335,432 | ||||||
California Municipal Finance Authority, California Lutheran University, Revenue Bonds | ||||||||
5.00%, due 10/1/20 | 325,000 | 339,729 | ||||||
5.00%, due 10/1/21 | 250,000 | 268,583 | ||||||
| Principal Amount | Value | |||||||
California (continued) | ||||||||
California Municipal Finance Authority, Community Medical Centers, Revenue Bonds | $ | 1,100,000 | $ | 1,158,344 | ||||
California Municipal Finance Authority, LAX Integrated Express Solutions Project, Revenue Bonds | 1,300,000 | 1,461,603 | ||||||
California Municipal Finance Authority, Paradise Valley Estates Project, Revenue Bonds | 500,000 | 500,925 | ||||||
California Municipal Finance Authority, West Village Student Housing Project, Revenue Bonds | 1,000,000 | 1,111,940 | ||||||
California School Finance Authority, Aspire Public Schools, Revenue Bonds | 130,000 | 130,958 | ||||||
California School Finance Authority, Classical Academies Project, Revenue Bonds | 5,050,000 | 5,944,506 | ||||||
California State Educational Facilities Authority, Art Center College of Design, Revenue Bonds | ||||||||
Series A | 125,000 | 127,408 | ||||||
Series A | 290,000 | 312,771 | ||||||
Series A | 200,000 | 220,938 | ||||||
Series A | 215,000 | 242,903 | ||||||
California State Health Facilities Financing Authority, Dignity Health, Revenue Bonds | 2,700,000 | 2,700,000 | ||||||
California Statewide Communities Development Authority, Methodist Hospital of Southern California Project, Revenue Bonds | ||||||||
5.00%, due 1/1/20 | 365,000 | 372,468 | ||||||
5.00%, due 1/1/21 | 300,000 | 315,024 | ||||||
5.00%, due 1/1/22 | 500,000 | 539,130 | ||||||
| 10 | MainStay MacKay Short Term Municipal Fund | The notes to the financial statements are an integral part of, and should be read in conjunction with, the financial statements. |
| Principal Amount | Value | |||||||
| Municipal Bonds (continued) |
| |||||||
California (continued) | ||||||||
City of Oakland CA, Revenue Bonds | $ | 1,000,000 | $ | 979,700 | ||||
Inglewood Unified School District, Unlimited General Obligation | ||||||||
Series B, Insured: BAM | 500,000 | 502,800 | ||||||
Series B, Insured: BAM | 1,000,000 | 1,027,370 | ||||||
Los Angeles Department of Airports, Revenue Bonds (a) | ||||||||
Series C | 1,000,000 | 1,001,220 | ||||||
Series A | 1,065,000 | 1,135,695 | ||||||
Los Angeles Unified School District, Unlimited General Obligation | 3,000,000 | 3,017,640 | ||||||
Monrovia Redevelopment Agency Successor Agency, Central Redevelopment Project, Tax Allocation | 600,000 | 600,000 | ||||||
Oxnard County Water Revenue, Revenue Bonds | ||||||||
Insured: BAM | 500,000 | 501,345 | ||||||
Insured: BAM | 925,000 | 957,981 | ||||||
Insured: BAM | 280,000 | 299,079 | ||||||
Sacramento City Financing Authority, Capital Appreciation, Tax Allocation | 4,170,000 | 3,969,548 | ||||||
Sacramento County Sanitation District Financing Authority, Revenue Bonds | 2,000,000 | 1,995,020 | ||||||
San Diego Redevelopment Agency Successor Agency, Tax Allocation | 250,000 | 249,745 | ||||||
San Francisco City & County International Airports Communities, Revenue Bonds | 2,965,000 | 3,060,740 | ||||||
| Principal Amount | Value | |||||||
California (continued) | ||||||||
San Ysidro School District, Unlimited General Obligation | $ | 1,320,000 | $ | 1,446,284 | ||||
Santa Fe Springs Community Development Commission, Consolidated Redevelopment Project, Tax Allocation | 500,000 | 487,525 | ||||||
Southern California Public Power Authority, Apex Power Project No. 1, Revenue Bonds | 1,300,000 | 1,394,601 | ||||||
Stockton Public Financing Authority, Water Revenue, Revenue Bonds | ||||||||
Series A, Insured: BAM | 750,000 | 760,177 | ||||||
Series A, Insured: BAM | 400,000 | 419,624 | ||||||
Series A, Insured: BAM | 500,000 | 538,770 | ||||||
Ukiah Unified School District, Capital Appreciation, Unlimited General Obligation Insured: NATL-RE | 875,000 | 839,615 | ||||||
Vallejo City Unified School District, Unlimited General Obligation | 2,500,000 | 2,573,375 | ||||||
|
| |||||||
| 49,988,669 | ||||||||
|
| |||||||
Colorado 0.7% |
| |||||||
Colorado Health Facilities Authority, Catholic Health Initiatives, Revenue Bonds | 1,360,000 | 1,429,442 | ||||||
Denver City & County Airport Revenue | 550,000 | 576,944 | ||||||
E-470 Public Highway Authority, Revenue Bonds | 1,000,000 | 1,009,860 | ||||||
|
| |||||||
| 3,016,246 | ||||||||
|
| |||||||
Connecticut 1.6% |
| |||||||
City of Bridgeport CT, Unlimited General Obligation | 1,000,000 | 1,038,910 | ||||||
| The notes to the financial statements are an integral part of, and should be read in conjunction with, the financial statements. | 11 |
Portfolio of InvestmentsApril 30, 2019 (continued)
| Principal Amount | Value | |||||||
| Municipal Bonds (continued) |
| |||||||
Connecticut (continued) |
| |||||||
City of Hartford CT, Unlimited General Obligation | ||||||||
Series C, Insured: AGM | $ | 200,000 | $ | 213,688 | ||||
Series A, Insured: AGM | 1,000,000 | 1,088,310 | ||||||
Connecticut State Health & Educational Facility Authority, Quinnipiac University, Revenue Bonds | 800,000 | 803,016 | ||||||
State of Connecticut, Unlimited General Obligation | ||||||||
Series C | 2,210,000 | 2,348,280 | ||||||
Series C | 1,500,000 | 1,678,605 | ||||||
|
| |||||||
| 7,170,809 | ||||||||
|
| |||||||
Florida 3.0% |
| |||||||
City of Lakeland FL, Lakeland Regional Health Systems, Revenue Bonds | 265,000 | 269,616 | ||||||
County of Broward Port Facilities, Revenue Bonds | 2,420,000 | 2,517,720 | ||||||
County of Miami-Dade Seaport Department, Revenue Bonds | 2,140,000 | 2,166,536 | ||||||
Escambia County, Gulf Power Co. Project, Revenue Bonds | 500,000 | 500,000 | ||||||
Florida Department of Environmental Protection, Revenue Bonds | 1,000,000 | 1,038,680 | ||||||
Mid-Bay Bridge Authority, Revenue Bonds | 1,000,000 | 1,071,630 | ||||||
Orange County, Tourist Development Tax, Revenue Bonds | 5,000,000 | 5,070,800 | ||||||
State of Florida Lottery, Revenue Bonds | 1,100,000 | 1,106,061 | ||||||
|
| |||||||
| 13,741,043 | ||||||||
|
| |||||||
| Principal Amount | Value | |||||||
Georgia 5.1% |
| |||||||
Burke County Development Authority, Georgia Power Co., Vogtle Project, Revenue Bonds | $ | 4,500,000 | $ | 4,500,000 | ||||
Heard County Development Authority, Georgia Power Co., Plant Wansley, Revenue Bonds | 4,500,000 | 4,500,000 | ||||||
Main Street Natural Gas, Inc., Revenue Bonds | ||||||||
Series B | 5,000,000 | 4,960,450 | ||||||
Series A | 1,000,000 | 1,028,920 | ||||||
Series A | 500,000 | 526,560 | ||||||
Series A | 550,000 | 591,921 | ||||||
Series A | 1,000,000 | 1,098,500 | ||||||
Municipal Electric Authority of Georgia, Revenue Bonds | ||||||||
Series 18A | 230,000 | 234,552 | ||||||
Series HH | 1,460,000 | 1,488,893 | ||||||
Series B | 2,250,000 | 2,293,785 | ||||||
State of Georgia, Unlimited General Obligation | 1,925,000 | 1,935,780 | ||||||
|
| |||||||
| 23,159,361 | ||||||||
|
| |||||||
Guam 3.4% |
| |||||||
Guam Government Waterworks Authority, Water & Wastewater Systems Revenue, Revenue Bonds | 400,000 | 411,976 | ||||||
Port Authority of Guam, Revenue Bonds | ||||||||
Series C | 500,000 | 501,590 | ||||||
Series C | 500,000 | 504,650 | ||||||
Series B | 250,000 | 251,058 | ||||||
Series B | 400,000 | 429,676 | ||||||
Territory of Guam, Business Privilege Tax, Revenue Bonds | 660,000 | 671,827 | ||||||
Territory of Guam, Revenue Bonds | ||||||||
Series D | 1,000,000 | 1,015,320 | ||||||
| 12 | MainStay MacKay Short Term Municipal Fund | The notes to the financial statements are an integral part of, and should be read in conjunction with, the financial statements. |
| Principal Amount | Value | |||||||
| Municipal Bonds (continued) |
| |||||||
Guam (continued) |
| |||||||
Territory of Guam, Revenue Bonds (continued) |
| |||||||
Series D | $ | 2,740,000 | $ | 2,852,148 | ||||
Series A | 3,230,000 | 3,365,886 | ||||||
Series A | 5,295,000 | 5,632,133 | ||||||
|
| |||||||
| 15,636,264 | ||||||||
|
| |||||||
Hawaii 0.2% |
| |||||||
State of Hawaii, Unlimited General Obligation | 1,000,000 | 1,014,080 | ||||||
|
| |||||||
Illinois 10.7% |
| |||||||
Chicago Board of Education, Chicago School Board, Unlimited General Obligation | 400,000 | 405,804 | ||||||
Chicago Board of Education, Unlimited General Obligation | ||||||||
Series A, Insured: NATL-RE | 1,775,000 | 1,798,217 | ||||||
Series A, Insured: AGM | 1,600,000 | 1,769,216 | ||||||
Chicago Midway International Airport, Revenue Bonds | 1,425,000 | 1,454,825 | ||||||
Chicago Park District, Limited General Obligation | ||||||||
Series C | 955,000 | 964,197 | ||||||
Series C | 450,000 | 458,010 | ||||||
Series E | 750,000 | 782,250 | ||||||
Series E | 800,000 | 853,256 | ||||||
Chicago Transit Authority, Revenue Bonds | 5,000,000 | 5,378,200 | ||||||
City of Chicago IL, Waterworks Second Lien, Revenue Bonds | 245,000 | 248,729 | ||||||
Cook County Community High School District No. 212 Leyden, Revenue Bonds | 1,140,000 | 1,134,243 | ||||||
| Principal Amount | Value | |||||||
Illinois (continued) | ||||||||
Cook County Community Unit School District No. 401 Elmwood Park, Limited General Obligation | $ | 1,340,000 | $ | 1,406,290 | ||||
Cook County School District, No. 81 Schiller Park, Limited General Obligation | 570,000 | 577,535 | ||||||
County of Cook IL, Unlimited General Obligation | 1,665,000 | 1,733,165 | ||||||
Illinois Educational Facilities Authority, University of Chicago, Revenue Bonds | 2,250,000 | 2,251,462 | ||||||
Illinois Finance Authority, Edward Elmhurst Obligated Group, Revenue Bonds | 300,000 | 313,290 | ||||||
Illinois Finance Authority, Rosalind Franklin University of Medicine & Science, Revenue Bonds | 250,000 | 249,873 | ||||||
Illinois Sports Facilities Authority, Revenue Bonds | 925,000 | 921,541 | ||||||
Illinois State University, Auxiliary Facilities System, Revenue Bonds | ||||||||
Series A, Insured: AGM | 505,000 | 529,503 | ||||||
Series B, Insured: AGM | 250,000 | 262,130 | ||||||
Series A, Insured: AGM | 425,000 | 455,400 | ||||||
Series B, Insured: AGM | 645,000 | 691,137 | ||||||
La Salle County School District No. 141, Unlimited General Obligation | ||||||||
Insured: MAC | 560,000 | 578,133 | ||||||
Insured: MAC | 585,000 | 610,091 | ||||||
Insured: MAC | 370,000 | 390,742 | ||||||
| The notes to the financial statements are an integral part of, and should be read in conjunction with, the financial statements. | 13 |
Portfolio of InvestmentsApril 30, 2019 (continued)
| Principal Amount | Value | |||||||
| Municipal Bonds (continued) |
| |||||||
Illinois (continued) | ||||||||
Madison Macoupin Etc Counties Illinois Community College District No. 536, Lewis & Clark Community College, Unlimited General Obligation | ||||||||
4.50%, due 5/1/20 | $ | 305,000 | $ | 312,857 | ||||
5.00%, due 11/1/22 | 420,000 | 450,912 | ||||||
Madison Macoupin Etc Counties Illinois Community College District No. 536, Unlimited General Obligation | ||||||||
Series A | 150,000 | 155,276 | ||||||
Series A | 70,000 | 74,024 | ||||||
Peoria County School District No. 68 Oak Grove, Unlimited General Obligation | 180,000 | 180,279 | ||||||
Public Building Commission of Chicago, Chicago Transit Authority, Revenue Bonds Insured: AMBAC | 1,000,000 | 1,120,190 | ||||||
Railsplitter Tobacco Settlement Authority, Revenue Bonds | 3,765,000 | 3,897,076 | ||||||
Randolph County Community Unit School District No. 140 Sparta, Unlimited General Obligation | 210,000 | 212,715 | ||||||
Regional Transportation Authority, Revenue Bonds | 1,560,000 | 1,563,884 | ||||||
Round Lake IL, Lakewood Grove Special Service Area No. 3 & 4, Special Tax Insured: BAM | 499,000 | 499,699 | ||||||
Sales Tax Securitization Corp., Revenue Bonds | 1,250,000 | 1,337,687 | ||||||
State of Illinois, Junior Obligation, Revenue Bonds | 610,000 | 612,111 | ||||||
State of Illinois, Sales Tax, Revenue Bonds | ||||||||
5.00%, due 6/15/22 | 655,000 | 706,175 | ||||||
Series C | 95,000 | 102,422 | ||||||
| Principal Amount | Value | |||||||
Illinois (continued) | ||||||||
State of Illinois, Unlimited General Obligation | ||||||||
Series B | $ | 5,000,000 | $ | 5,073,350 | ||||
5.00%, due 6/1/21 | 4,000,000 | 4,199,400 | ||||||
Upper Illinois River Valley Development Authority, Morris Hospital, Revenue Bonds | 575,000 | 599,282 | ||||||
Village of Cary IL, Special Service Area No. 2, Special Tax | 149,000 | 148,347 | ||||||
Village of Crestwood IL, Alternate Revenue Source, Unlimited General Obligation | 500,000 | 500,150 | ||||||
Western Illinois University, Revenue Bonds Insured: BAM | 460,000 | 471,118 | ||||||
|
| |||||||
| 48,434,193 | ||||||||
|
| |||||||
Indiana 4.4% |
| |||||||
City of Indianapolis IN, Economic Development, Revenue Bonds | 5,900,000 | 5,900,000 | ||||||
City of Whiting IN, Environmental Facilities, BP Products North America, Revenue Bonds | 5,000,000 | 5,002,250 | ||||||
Hammond Multi-School Building Corp., Revenue Bonds | ||||||||
4.00%, due 1/15/20 | 470,000 | 477,111 | ||||||
4.00%, due 7/15/21 | 330,000 | 345,055 | ||||||
5.00%, due 1/15/22 | 555,000 | 599,045 | ||||||
5.00%, due 7/15/22 | 1,040,000 | 1,137,177 | ||||||
Indiana Health & Educational Facilities Financing Authority, Ascension Senior Health Credit Group, Revenue Bonds (c) | ||||||||
Series A-9 | 4,985,000 | 4,960,723 | ||||||
Series 2006 B-3 | 1,400,000 | 1,401,778 | ||||||
|
| |||||||
| 19,823,139 | ||||||||
|
| |||||||
Iowa 0.3% |
| |||||||
City of Coralville IA, Certificates of Participation | ||||||||
Series E | 465,000 | 464,861 | ||||||
Series E | 500,000 | 498,410 | ||||||
| 14 | MainStay MacKay Short Term Municipal Fund | The notes to the financial statements are an integral part of, and should be read in conjunction with, the financial statements. |
| Principal Amount | Value | |||||||
| Municipal Bonds (continued) |
| |||||||
Iowa (continued) | ||||||||
City of Coralville IA, Corporate Purpose Bonds, Unlimited General Obligation | $ | 270,000 | $ | 270,000 | ||||
Xenia Rural Water District, Capital Loan Notes, Revenue Bonds | 375,000 | 376,391 | ||||||
|
| |||||||
| 1,609,662 | ||||||||
|
| |||||||
Kansas 0.3% |
| |||||||
Johnson County Unified School District No. 233 Olathe, Unlimited General Obligation | 1,250,000 | 1,305,363 | ||||||
|
| |||||||
Kentucky 1.1% |
| |||||||
Kentucky Bond Development Corp., Lexington Center Corp. Project, Revenue Bonds | 550,000 | 604,852 | ||||||
Kentucky Bond Development Corp., Revenue Bonds | ||||||||
5.00%, due 9/1/19 | 390,000 | 394,161 | ||||||
5.00%, due 9/1/21 | 325,000 | 347,958 | ||||||
Louisville & Jefferson County Metropolitan Government, Louisville Gas & Electric Co., Revenue Bonds | 3,000,000 | 3,001,110 | ||||||
Louisville / Jefferson County Metropolitan Government, Norton Healthcare, Revenue Bonds | 790,000 | 823,654 | ||||||
|
| |||||||
| 5,171,735 | ||||||||
|
| |||||||
Louisiana 1.9% |
| |||||||
E Baton Rouge Parish, Road & Street Improvement, Revenue Bonds Insured: AGC | 2,000,000 | 2,017,720 | ||||||
Evangeline Parish Road & Drain Sales Tax District No. 1, Revenue Bonds Insured: AGM | 500,000 | 524,895 | ||||||
Louisiana Local Government Environmental Facilities & Community Development Authority, University Student Housing, Revenue Bonds | 555,000 | 555,699 | ||||||
| Principal Amount | Value | |||||||
Louisiana (continued) |
| |||||||
Louisiana Public Facilities Authority, Willis-Knighton Medical Center, Revenue Bonds | $ | 5,400,000 | $ | 5,400,000 | ||||
|
| |||||||
| 8,498,314 | ||||||||
|
| |||||||
Maine 0.2% |
| |||||||
State of Maine, Unlimited General Obligation | 810,000 | 812,236 | ||||||
|
| |||||||
Maryland 2.4% |
| |||||||
County of Anne Arundel MD, Unlimited General Obligation | 6,165,000 | 6,254,393 | ||||||
Maryland Health & Higher Educational Facilities Authority, Broadmead Issue, Revenue Bonds | 1,750,000 | 1,791,335 | ||||||
Prince George’s County, Regional Medical Center, Certificates of Participation | 1,040,000 | 1,089,525 | ||||||
Washington Suburban Sanitary Commission, General Unlimited Obligation | 1,955,000 | 1,960,376 | ||||||
|
| |||||||
| 11,095,629 | ||||||||
|
| |||||||
Massachusetts 0.8% |
| |||||||
Massachusetts Development Finance Agency, UMass Boston Student Housing Project, Revenue Bonds | 985,000 | 997,342 | ||||||
Massachusetts Housing Finance Agency, Revenue Bonds | 2,535,000 | 2,535,887 | ||||||
|
| |||||||
| 3,533,229 | ||||||||
|
| |||||||
Michigan 2.4% |
| |||||||
City of Detroit MI Sewage Disposal System, Second Lien, Revenue Bonds | 1,500,000 | 1,661,910 | ||||||
City of Detroit MI Sewage Disposal System, Senior Lien, Revenue Bonds | 1,000,000 | 1,005,620 | ||||||
Harper Woods School District, Unlimited General Obligation | 500,000 | 500,000 | ||||||
| The notes to the financial statements are an integral part of, and should be read in conjunction with, the financial statements. | 15 |
Portfolio of InvestmentsApril 30, 2019 (continued)
| Principal Amount | Value | |||||||
| Municipal Bonds (continued) |
| |||||||
Michigan (continued) | ||||||||
Lincoln Consolidated School District, Unlimited General Obligation | $ | 1,180,000 | $ | 1,180,000 | ||||
Michigan Finance Authority, Trinity Health Credit Group, Revenue Bonds | ||||||||
Series MI-1 | 200,000 | 210,344 | ||||||
Series MI-1 | 200,000 | 216,494 | ||||||
Series MI-1 | 200,000 | 222,478 | ||||||
Michigan Finance Authority, Wayne County Criminal Justice Center Project, Revenue Bonds | 500,000 | 555,130 | ||||||
Michigan Strategic Fund, Detroit Edison Project, Revenue Bonds | 2,000,000 | 1,949,340 | ||||||
Royal Oak Hospital Finance Authority, Beaumont Health Credit Group, Revenue Bonds | 1,500,000 | 1,516,350 | ||||||
State of Michigan, School Loan, Revenue Bonds | 715,000 | 732,839 | ||||||
Warren Consolidated Schools, Unlimited General Obligation | 1,080,000 | 1,080,000 | ||||||
|
| |||||||
| 10,830,505 | ||||||||
|
| |||||||
Minnesota 1.7% |
| |||||||
Kanabec County MN, FirstLight Health System, Revenue Bonds | 2,750,000 | 2,750,357 | ||||||
State of Minnesota, Unlimited General Obligation | 4,940,000 | 4,981,249 | ||||||
|
| |||||||
| 7,731,606 | ||||||||
|
| |||||||
Mississippi 1.2% |
| |||||||
City of Jackson MS Water & Sewer System, Revenue Bonds | 625,000 | 639,162 | ||||||
| Principal Amount | Value | |||||||
Mississippi (continued) |
| |||||||
Mississippi Development Bank, Jackson Public School District, Revenue Bonds Insured: BAM | $ | 450,000 | $ | 483,008 | ||||
Mississippi Development Bank, Jackson Water & Sewer System Project, Revenue Bonds | 1,000,000 | 1,045,950 | ||||||
Mississippi Gaming Tax, Revenue Bonds | ||||||||
Series A | 500,000 | 507,495 | ||||||
Series A | 750,000 | 785,362 | ||||||
Series A | 700,000 | 754,600 | ||||||
Series A | 1,000,000 | 1,106,070 | ||||||
|
| |||||||
| 5,321,647 | ||||||||
|
| |||||||
Missouri 1.0% |
| |||||||
Kansas City Industrial Development Authority, Downtown Redevelopment District, Revenue Bonds | 4,420,000 | 4,739,566 | ||||||
|
| |||||||
Montana 0.2% |
| |||||||
Montana Facilities Finance Authority, Kalispell Regional Medical Center, Revenue Bonds | 915,000 | 935,011 | ||||||
|
| |||||||
Nebraska 1.2% |
| |||||||
Central Plains Energy, Project No. 4, Revenue Bonds | 5,000,000 | 5,554,100 | ||||||
|
| |||||||
Nevada 0.7% |
| |||||||
County of Washoe N.V., Sierra Pacific Power Co. Project, Revenue Bonds | 3,000,000 | 2,998,140 | ||||||
|
| |||||||
New Hampshire 0.7% |
| |||||||
New Hampshire Business Finance Authority, United Illuminating Co., Revenue Bonds | 3,000,000 | 3,077,190 | ||||||
|
| |||||||
| 16 | MainStay MacKay Short Term Municipal Fund | The notes to the financial statements are an integral part of, and should be read in conjunction with, the financial statements. |
| Principal Amount | Value | |||||||
| Municipal Bonds (continued) |
| |||||||
New Jersey 11.2% |
| |||||||
Atlantic County Improvement Authority, Stockton University Atlantic City, Revenue Bonds | $ | 3,745,000 | $ | 3,918,468 | ||||
Borough of North Plainfield NJ, Unlimited General Obligation | 330,000 | 335,000 | ||||||
City of Atlantic City NJ, Tax Appeal, Unlimited General Obligation | ||||||||
Series B, Insured: AGM | 200,000 | 204,846 | ||||||
Series A, Insured: BAM | 600,000 | 630,624 | ||||||
City of Bayonne NJ, Unlimited General Obligation | 1,000,000 | 1,004,690 | ||||||
Essex County Improvement Authority, Revenue Bonds Insured: County Guaranteed | 500,000 | 507,290 | ||||||
Garden State Preservation Trust, Revenue Bonds | ||||||||
Series C, Insured: AGM | 3,175,000 | 3,228,149 | ||||||
Series C, Insured: AGM | 1,535,000 | 1,612,886 | ||||||
Greater Egg Harbor Regional High School District, Unlimited General Obligation Insured: AGM | 1,000,000 | 1,017,290 | ||||||
New Jersey Economic Development Authority, North Star Academy Charter School of Newark, Inc., Revenue Bonds | 200,000 | 210,468 | ||||||
New Jersey Economic Development Authority, Revenue Bonds | ||||||||
Series B | 5,000,000 | 5,077,850 | ||||||
Series DDD | 960,000 | 1,016,890 | ||||||
New Jersey Economic Development Authority, School Facilities Construction, Revenue Bonds | ||||||||
Series K; Insured: AMBAC | 300,000 | 315,306 | ||||||
Series K; Insured: AMBAC | 5,000,000 | 5,112,100 | ||||||
| Principal Amount | Value | |||||||
New Jersey (continued) | ||||||||
New Jersey Economic Development Authority, School Facilities Construction, Revenue Bonds (continued) | ||||||||
Series N-1, Insured: NATL-RE | $ | 1,500,000 | $ | 1,696,605 | ||||
New Jersey State Economic Development Authority, Revenue Bonds | 2,525,000 | 2,962,961 | ||||||
New Jersey Transportation Trust Fund Authority, Federal Highway Reimbursement, Revenue Bonds | 1,000,000 | 1,129,430 | ||||||
New Jersey Transportation Trust Fund Authority, Transportation System, Revenue Bonds | ||||||||
Series B, Insured: AMBAC | 275,000 | 312,029 | ||||||
Series B, Insured: NATL-RE | 5,000,000 | 5,274,900 | ||||||
Series B, Insured: AGC | 1,000,000 | 1,057,620 | ||||||
New Jersey Turnpike Authority, Revenue Bonds | 6,000,000 | 6,010,740 | ||||||
Passaic Valley Sewerage Commissioners, Sewer System, Revenue Bonds | 2,190,000 | 2,478,313 | ||||||
State of New Jersey, Unlimited General Obligation | 225,000 | 226,780 | ||||||
Tobacco Settlement Financing Corp., Revenue Bonds | ||||||||
Series A | 500,000 | 501,340 | ||||||
Series A | 2,500,000 | 2,579,475 | ||||||
Series A | 500,000 | 529,465 | ||||||
Series A | 1,250,000 | 1,356,400 | ||||||
Series A | 250,000 | 277,233 | ||||||
Trenton Parking Authority, Revenue Bonds | 170,000 | 169,342 | ||||||
|
| |||||||
| 50,754,490 | ||||||||
|
| |||||||
| The notes to the financial statements are an integral part of, and should be read in conjunction with, the financial statements. | 17 |
Portfolio of InvestmentsApril 30, 2019 (continued)
| Principal Amount | Value | |||||||
| Municipal Bonds (continued) |
| |||||||
New Mexico 0.2% |
| |||||||
Rio Rancho Water & Wastewater Systems, Revenue Bonds | $ | 800,000 | $ | 827,832 | ||||
|
| |||||||
New York 5.9% |
| |||||||
City of Long Beach, Limited General Obligation | ||||||||
Insured: BAM | 600,000 | 632,142 | ||||||
Insured: BAM | 615,000 | 667,023 | ||||||
Dutchess County Resource Recovery Agency, Revenue Bonds | 1,055,000 | 1,075,034 | ||||||
Hempstead Town Local Development Corp., Molloy College Project, Revenue Bonds | ||||||||
5.00%, due 7/1/20 | 1,235,000 | 1,279,213 | ||||||
5.00%, due 7/1/21 | 435,000 | 462,827 | ||||||
Metropolitan Transportation Authority, Revenue Bonds | 3,500,000 | 3,615,465 | ||||||
New York State Dormitory Authority, Interagency Council Pooled Loan Program, Revenue Bonds | ||||||||
SubseriesA-1 | 275,000 | 282,189 | ||||||
SubseriesA-1 | 255,000 | 266,988 | ||||||
SubseriesA-1 | 400,000 | 424,860 | ||||||
SubseriesA-1 | 430,000 | 463,527 | ||||||
New York State Housing Finance Agency, 350 West 34th Street, Revenue Bonds | 2,100,000 | 2,100,000 | ||||||
New York Transportation Development Corp., LaGuardia Airport Terminals C&D Redevelopment Project, Revenue Bonds | 5,000,000 | 5,369,700 | ||||||
Niagara Frontier Transportation Authority, Buffalo Niagara International Airport, Revenue Bonds (a) | ||||||||
Series A | 1,600,000 | 1,645,296 | ||||||
Series A | 1,850,000 | 1,955,468 | ||||||
| Principal Amount | Value | |||||||
New York (continued) |
| |||||||
Port Authority of New York & New Jersey, Revenue Bonds (a) | ||||||||
5.00%, due 9/15/19 | $ | 4,750,000 | $ | 4,807,902 | ||||
5.00%, due 10/15/21 | 375,000 | 404,156 | ||||||
Westchester County Local Development Corp., Westchester Medical Center, Revenue Bonds | 1,145,000 | 1,161,912 | ||||||
|
| |||||||
| 26,613,702 | ||||||||
|
| |||||||
North Carolina 3.0% |
| |||||||
Charlotte Airport Revenue, Charlotte Douglas International Airport, Revenue Bonds | 550,000 | 575,256 | ||||||
Guilford County, Unlimited General Obligation | 1,830,000 | 1,881,862 | ||||||
State of North Carolina, Capital Improvement, Revenue Bonds | 6,500,000 | 6,500,000 | ||||||
State of North Carolina, Unlimited General Obligation | 2,500,000 | 2,506,950 | ||||||
Wake County, Hammond Road Detention Center, Revenue Bonds | 2,275,000 | 2,281,347 | ||||||
|
| |||||||
| 13,745,415 | ||||||||
|
| |||||||
Ohio 3.9% |
| |||||||
Akron Bath Copley Joint Township Hospital District, Township Hospital District , Revenue Bonds | 1,000,000 | 1,096,270 | ||||||
City of Cleveland OH, Airport System, Revenue Bonds | 500,000 | 524,330 | ||||||
City of Dayton OH Airport, Revenue Bonds | 995,000 | 1,038,661 | ||||||
City of Toledo OH, Limited General Obligation Insured: AGM | 1,540,000 | 1,560,082 | ||||||
Cleveland Department of Public Utilities Division of Public Power, Revenue Bonds | 3,000,000 | 3,144,330 | ||||||
| 18 | MainStay MacKay Short Term Municipal Fund | The notes to the financial statements are an integral part of, and should be read in conjunction with, the financial statements. |
| Principal Amount | Value | |||||||
| Municipal Bonds (continued) |
| |||||||
Ohio (continued) |
| |||||||
Lucas County Ohio Hospital Revenue, ProMedica Healthcare Obligated Group, Revenue Bonds | $ | 500,000 | $ | 507,550 | ||||
Ohio Higher Educational Facility Commission, Otterbein University Project, Revenue Bonds | 915,000 | 925,339 | ||||||
State of Ohio, Capital Facilities Lease-Appropriation, Revenue Bonds | 8,800,000 | 8,800,000 | ||||||
|
| |||||||
| 17,596,562 | ||||||||
|
| |||||||
Oklahoma 0.2% |
| |||||||
Weatherford Industrial Trust Educational Facilities, Weatherford Public Schools Project, Revenue Bonds | 1,000,000 | 1,056,970 | ||||||
|
| |||||||
Pennsylvania 3.2% |
| |||||||
Capital Region Water, Revenue Bonds | 1,300,000 | 1,308,736 | ||||||
Centre County Hospital Authority, Mount Nittany Medical Center, Revenue Bonds | 240,000 | 242,841 | ||||||
City of Reading PA, Unlimited General Obligation | 620,000 | 625,952 | ||||||
Commonwealth of Pennsylvania, Certificates of Participation | ||||||||
Series A | 300,000 | 310,188 | ||||||
Series A | 350,000 | 371,546 | ||||||
Series A | 300,000 | 326,166 | ||||||
Dauphin County General Authority, Pinnacle Health System Project, Revenue Bonds | 500,000 | 516,545 | ||||||
Hazleton Area School District, Limited General Obligation | ||||||||
Series B, Insured: BAM | 375,000 | 375,334 | ||||||
| Principal Amount | Value | |||||||
Pennsylvania (continued) | ||||||||
Hazleton Area School District, Limited General Obligation (continued) | ||||||||
Series A, Insured: BAM | $ | 600,000 | $ | 610,374 | ||||
Lancaster Higher Education Authority, Harrisburg Area Community, Revenue Bonds | 685,000 | 694,042 | ||||||
Lycoming County Authority, Pennsylvania College of Technology, Revenue Bonds | 755,000 | 761,644 | ||||||
Pennsylvania Turnpike Commission, Oil Franchise Tax, Revenue Bonds | 1,000,000 | 1,019,610 | ||||||
Philadelphia Gas Works Co., 1998 General Ordinance, Revenue Bonds | 2,030,000 | 2,057,466 | ||||||
Philadelphia Gas Works Co., Revenue Bonds | 800,000 | 806,456 | ||||||
Philadelphia School District, Unlimited General Obligation | 700,000 | 751,394 | ||||||
Philadelphia Water & Wastewater Revenue, Revenue Bonds | ||||||||
Series A | 1,500,000 | 1,520,670 | ||||||
Series A | 2,000,000 | 2,093,220 | ||||||
|
| |||||||
| �� | 14,392,184 | |||||||
|
| |||||||
Puerto Rico 2.6% |
| |||||||
Commonwealth of Puerto Rico, CPI- Linked Bonds-Public Improvement, Unlimited General Obligation | 655,000 | 654,384 | ||||||
Commonwealth of Puerto Rico, Public Improvement, Unlimited General Obligation | ||||||||
Insured: AGM | 900,000 | 921,915 | ||||||
Series A, Insured: NATL-RE | 3,545,000 | 3,558,187 | ||||||
Insured: AGM | 525,000 | 527,121 | ||||||
Series A, Insured: NATL-RE | 420,000 | 430,395 | ||||||
| The notes to the financial statements are an integral part of, and should be read in conjunction with, the financial statements. | 19 |
Portfolio of InvestmentsApril 30, 2019 (continued)
| Principal Amount | Value | |||||||
| Municipal Bonds (continued) |
| |||||||
Puerto Rico (continued) | ||||||||
Puerto Rico Electric Power Authority, Revenue Bonds | ||||||||
Series MM, Insured: NATL-RE | $ | 230,000 | $ | 230,669 | ||||
Series UU, Insured: NATL-RE | 290,000 | 290,844 | ||||||
Series MM, Insured: NATL-RE | 275,000 | 280,253 | ||||||
Series N, Insured: NATL-RE | 620,000 | 622,058 | ||||||
Series L, Insured: NATL-RE | 60,000 | 60,223 | ||||||
Puerto Rico Highway & Transportation Authority, Revenue Bonds | ||||||||
Series AA, Insured: NATL-RE | 1,100,000 | 1,104,092 | ||||||
Series AA, Insured: NATL-RE | 1,020,000 | 1,045,245 | ||||||
Puerto Rico Municipal Finance Agency, Revenue Bonds | ||||||||
Series A, Insured: AGM | 240,000 | 240,816 | ||||||
Series A, Insured: AGM | 250,000 | 250,950 | ||||||
Series C, Insured: AGM | 965,000 | 970,308 | ||||||
Puerto Rico Public Buildings Authority, Government Facilities, Revenue Bonds | 800,000 | 802,656 | ||||||
|
| |||||||
| 11,990,116 | ||||||||
|
| |||||||
Rhode Island 0.6% |
| |||||||
Rhode Island Commerce Corp., Grant Anticipation Rhode Island Department, Revenue Bonds | 1,000,000 | 1,036,990 | ||||||
Rhode Island Health & Educational Building Corp., Hospital Financing-Lifespan Obligated Group, Revenue Bonds | 1,500,000 | 1,544,790 | ||||||
|
| |||||||
| 2,581,780 | ||||||||
|
| |||||||
South Carolina 0.6% |
| |||||||
South Carolina Ports Authority, Revenue Bonds | 1,490,000 | 1,497,763 | ||||||
| Principal Amount | Value | |||||||
South Carolina (continued) |
| |||||||
Sumter Two School Facilities, Inc., Sumter School District Project, Revenue Bonds Insured: BAM | $ | 1,065,000 | $ | 1,083,147 | ||||
|
| |||||||
| 2,580,910 | ||||||||
|
| |||||||
Tennessee 0.3% |
| |||||||
Memphis-Shelby County Airport Authority, Revenue Bonds | 1,290,000 | 1,370,535 | ||||||
Metropolitan Government Nashville & Davidson County Health & Educational Facilities Board, Lipscomb University Project, Revenue Bonds | 200,000 | 201,712 | ||||||
|
| |||||||
| 1,572,247 | ||||||||
|
| |||||||
Texas 5.9% |
| |||||||
City of Dallas TX, Waterworks & Sewer Systems, Revenue Bonds | 3,500,000 | 3,501,785 | ||||||
City of Houston TX, Airport System, Revenue Bonds | 500,000 | 532,640 | ||||||
City of Houston TX, Utility System, Revenue Bonds | 450,000 | 452,970 | ||||||
Dallas-Fort Worth International Airport, Revenue Bonds | 1,000,000 | 1,048,100 | ||||||
Fort Bend Municipal Utility District, No. 169 Contract, Revenue Bonds | ||||||||
Series A, Insured: AGM | 925,000 | 974,201 | ||||||
Series A, Insured: AGM | 465,000 | 483,730 | ||||||
Harris County Municipal Utility District No. 419, Unlimited General Obligation Insured: AGM | 735,000 | 738,116 | ||||||
Harris County-Houston Sports Authority, Revenue Bonds | 1,500,000 | 1,525,410 | ||||||
| 20 | MainStay MacKay Short Term Municipal Fund | The notes to the financial statements are an integral part of, and should be read in conjunction with, the financial statements. |
| Principal Amount | Value | |||||||
| Municipal Bonds (continued) |
| |||||||
Texas (continued) |
| |||||||
Houston Hotel Occupancy Tax Hotel Occupancy & Special, Revenue Bonds | $ | 2,900,000 | $ | 2,882,658 | ||||
Little Elm Independent School District, Capital Appreciation, Unlimited General Obligation Insured: PSF | 500,000 | 471,880 | ||||||
Montgomery County Municipal Utility District No. 46, Unlimited General Obligation | 1,455,000 | 1,455,757 | ||||||
North Central Texas Community College District, Revenue Bonds | 380,000 | 389,382 | ||||||
State of Texas, Revenue Notes | 6,000,000 | 6,043,560 | ||||||
Texas Municipal Gas Acquisition & Supply Corp. III, Revenue Bonds | 650,000 | 661,563 | ||||||
Texas State Public Finance Authority, Financing System Texas Southern University, Revenue Bonds | ||||||||
Insured: BAM | 1,000,000 | 1,000,000 | ||||||
Insured: BAM | 1,500,000 | 1,528,275 | ||||||
Viridian Municipal Management District, Road Improvement, Unlimited General Obligation | ||||||||
Insured: AGM | 505,000 | 522,549 | ||||||
Insured: AGM | 300,000 | 315,492 | ||||||
Insured: AGM | 550,000 | 587,862 | ||||||
Insured: AGM | 300,000 | 324,642 | ||||||
Viridian Municipal Management District, Utility Improvement, Unlimited General Obligation | ||||||||
Insured: AGM | 260,000 | 269,035 | ||||||
Insured: AGM | 225,000 | 236,619 | ||||||
Insured: AGM | 395,000 | 422,192 | ||||||
Insured: AGM | 305,000 | 330,053 | ||||||
|
| |||||||
| 26,698,471 | ||||||||
|
| |||||||
| Principal Amount | Value | |||||||
U.S. Virgin Islands 0.4% |
| |||||||
Virgin Islands Public Finance Authority, Revenue Bonds | $ | 1,810,000 | $ | 1,782,850 | ||||
|
| |||||||
Utah 0.2% |
| |||||||
Salt Lake City Airport Revenue | 725,000 | 772,966 | ||||||
|
| |||||||
Vermont 0.0%‡ |
| |||||||
Vermont Educational & Health Building Financing Agency, Saint Michael’s College-Green Bond, Revenue Bonds | 130,000 | 131,031 | ||||||
|
| |||||||
Virginia 2.0% |
| |||||||
Virginia Commonwealth Transportation Board, Revenue Bonds | 6,075,000 | 6,082,411 | ||||||
Virginia Public School Authority, Special Obligation, Revenue Bonds | 2,990,000 | 3,113,846 | ||||||
|
| |||||||
| 9,196,257 | ||||||||
|
| |||||||
Washington 0.3% |
| |||||||
Douglas County Public Utility Distrist No. 1, Wells Hydroelectric, Revenue Bonds | 1,170,000 | 1,219,608 | ||||||
|
| |||||||
Wisconsin 1.4% |
| |||||||
Burlington Area School District, Unlimited General Obligation | 1,000,000 | 1,000,150 | ||||||
Public Finance Authority, Affinity Living Group, Revenue Bonds | 2,000,000 | 2,003,340 | ||||||
Wisconsin State Health & Educational Facilities Authority, Advocate Aurora Health Credit Group, Revenue Bonds | 3,500,000 | 3,486,805 | ||||||
|
| |||||||
| 6,490,295 | ||||||||
|
| |||||||
Total Municipal Bonds | 446,176,358 | |||||||
|
| |||||||
| The notes to the financial statements are an integral part of, and should be read in conjunction with, the financial statements. | 21 |
Portfolio of InvestmentsApril 30, 2019 (continued)
| Shares | Value | |||||||
| Closed-End Funds 0.1% |
| |||||||
Florida 0.1% |
| |||||||
BlackRock Florida Municipal 2020 Term Trust, 1.95% (e) | 34,857 | $ | 497,061 | |||||
|
| |||||||
Total Closed-End Funds | 497,061 | |||||||
|
| |||||||
TotalLong-Term Bonds | 446,673,419 | |||||||
|
| |||||||
Total Investments | 98.4 | % | 446,673,419 | |||||
Other Assets, Less Liabilities | 1.6 | 7,299,800 | ||||||
Net Assets | 100.0 | % | $ | 453,973,219 | ||||
| † | Percentages indicated are based on Fund net assets. |
| ‡ | Less than one-tenth of a percent. |
| (a) | Interest on these securities was subject to alternative minimum tax. |
| (b) | May be sold to institutional investors only under Rule 144A or securities offered pursuant to Section 4(a)(2) of the Securities Act of 1933, as amended. |
| (c) | Coupon rate may change based on changes of the underlying collateral or prepayments of principal. The coupon rate shown represents the rate at period end. |
| (d) | Variable-rate demand notes (VRDNs)—Provide the right to sell the security at face value on either that day or within the rate-reset period. VRDNs will normally trade as if the maturity is the earlier put date, even though stated maturity is longer. The interest rate is reset on the put date at a stipulated daily, weekly, monthly, quarterly, or other specified time interval to reflect current market conditions. These securities do not indicate a reference rate and spread in their description. The maturity date shown is the final maturity. |
| (e) | Current yield as of April 30, 2019. |
The following abbreviations are used in the preceding pages:
AGC—Assured Guaranty Corp.
AGM—Assured Guaranty Municipal Corp.
AMBAC—Ambac Assurance Corp.
BAM—Build America Mutual Assurance Co.
MAC—Municipal Assurance Corp.
NATL-RE—National Public Finance Guarantee Corp.
PSF—Permanent School Fund
Q-SBLF—Qualified School Bond Loan Fund
The following is a summary of the fair valuations according to the inputs used as of April 30, 2019, for valuing the Fund’s assets:
Description | Quoted Prices in Active Markets for Identical Assets (Level 1) | Significant Other Observable Inputs (Level 2) | Significant Unobservable Inputs (Level 3) | Total | ||||||||||||
Asset Valuation Inputs | ||||||||||||||||
| Investments in Securities (a) | ||||||||||||||||
| Long-Term Bonds | ||||||||||||||||
Municipal Bonds | $ | — | $ | 446,176,358 | $ | — | $ | 446,176,358 | ||||||||
Closed-End Funds | 497,061 | — | — | 497,061 | ||||||||||||
|
|
|
|
|
|
|
| |||||||||
| Total Investments in Securities | $ | 497,061 | $ | 446,176,358 | $ | — | $ | 446,673,419 | ||||||||
|
|
|
|
|
|
|
| |||||||||
| (a) | For a complete listing of investments and their industries, see the Portfolio of Investments. |
| 22 | MainStay MacKay Short Term Municipal Fund | The notes to the financial statements are an integral part of, and should be read in conjunction with, the financial statements. |
Statement of Assets and Liabilitiesas of April 30, 2019
| Assets | ||||
Investment in securities, at value | $ | 446,673,419 | ||
Cash | 1,351,102 | |||
Receivables: | ||||
Dividends and interest | 5,487,294 | |||
Fund shares sold | 1,706,807 | |||
Other assets | 56,491 | |||
|
| |||
Total assets | 455,275,113 | |||
|
| |||
| Liabilities | ||||
Payables: | ||||
Fund shares redeemed | 956,753 | |||
Manager (See Note 3) | 110,067 | |||
Transfer agent (See Note 3) | 27,072 | |||
NYLIFE Distributors (See Note 3) | 23,731 | |||
Shareholder communication | 19,540 | |||
Custodian | 10,108 | |||
Professional fees | 6,248 | |||
Trustees | 200 | |||
Accrued expenses | 3,274 | |||
Dividend payable | 144,901 | |||
|
| |||
Total liabilities | 1,301,894 | |||
|
| |||
Net assets | $ | 453,973,219 | ||
|
| |||
| Composition of Net Assets | ||||
Shares of beneficial interest outstanding (par value of $.001 per share) unlimited number of shares authorized | $ | 47,379 | ||
Additional paid-in capital | 453,291,308 | |||
|
| |||
| 453,338,687 | ||||
Total distributable earnings (loss)(1) | 634,532 | |||
|
| |||
Net assets | $ | 453,973,219 | ||
|
| |||
Class A | ||||
Net assets applicable to outstanding shares | $ | 113,023,188 | ||
|
| |||
Shares of beneficial interest outstanding | 11,794,192 | |||
|
| |||
Net asset value per share outstanding | $ | 9.58 | ||
Maximum sales charge (1.00% of offering price) | 0.10 | |||
|
| |||
Maximum offering price per share outstanding | $ | 9.68 | ||
|
| |||
Investor Class | ||||
Net assets applicable to outstanding shares | $ | 3,833,657 | ||
|
| |||
Shares of beneficial interest outstanding | 398,957 | |||
|
| |||
Net asset value per share outstanding | $ | 9.61 | ||
Maximum sales charge (1.00% of offering price) | 0.10 | |||
|
| |||
Maximum offering price per share outstanding | $ | 9.71 | ||
|
| |||
Class I | ||||
Net assets applicable to outstanding shares | $ | 337,116,374 | ||
|
| |||
Shares of beneficial interest outstanding | 35,186,042 | |||
|
| |||
Net asset value and offering price per share outstanding | $ | 9.58 | ||
|
|
| (1) | See Note 10. |
| The notes to the financial statements are an integral part of, and should be read in conjunction with, the financial statements. | 23 |
Statement of Operationsfor the year ended April 30, 2019
| Investment Income (Loss) | ||||
Income | ||||
Interest | $ | 7,461,410 | ||
Dividends | 3,207 | |||
|
| |||
Total income | 7,464,617 | |||
|
| |||
Expenses | ||||
Manager (See Note 3) | 1,319,543 | |||
Distribution/Service—Class A (See Note 3) | 254,152 | |||
Distribution/Service—Investor Class (See Note 3) | 8,528 | |||
Transfer agent (See Note 3) | 143,503 | |||
Registration | 91,284 | |||
Professional fees | 79,128 | |||
Shareholder communication | 28,955 | |||
Custodian | 23,452 | |||
Trustees | 9,023 | |||
Miscellaneous | 18,992 | |||
|
| |||
Total expenses before waiver/reimbursement | 1,976,560 | |||
Expense waiver/reimbursement from Manager (See Note 3) | (139,397 | ) | ||
|
| |||
Net expenses | 1,837,163 | |||
|
| |||
Net investment income (loss) | 5,627,454 | |||
|
| |||
| Realized and Unrealized Gain (Loss) on Investments and Futures Contracts |
| |||
Net realized gain (loss) on: | ||||
Investment transactions | (231,522 | ) | ||
Futures transactions | (22,623 | ) | ||
|
| |||
Net realized gain (loss) on investments and futures transactions | (254,145 | ) | ||
|
| |||
Net change in unrealized appreciation (depreciation) on investments | 2,888,874 | |||
|
| |||
Net realized and unrealized gain (loss) on investments and futures transactions | 2,634,729 | |||
|
| |||
Net increase (decrease) in net assets resulting from operations | $ | 8,262,183 | ||
|
| |||
| 24 | MainStay MacKay Short Term Municipal Fund | The notes to the financial statements are an integral part of, and should be read in conjunction with, the financial statements. |
Statements of Changes in Net Assets
for the years ended April 30, 2019 and April 30, 2018
| 2019 | 2018 | |||||||
| Increase (Decrease) in Net Assets |
| |||||||
Operations: | ||||||||
Net investment income (loss) | $ | 5,627,454 | $ | 3,518,928 | ||||
Net realized gain (loss) on investments and futures contracts | (254,145 | ) | (261,068 | ) | ||||
Net change in unrealized appreciation (depreciation) on investments and futures contracts | 2,888,874 | (1,241,965 | ) | |||||
|
| |||||||
Net increase (decrease) in net assets resulting from operations | 8,262,183 | 2,015,895 | ||||||
|
| |||||||
Distributions to shareholders(1): | ||||||||
Class A | (1,304,594 | ) | ||||||
Investor Class | (27,705 | ) | ||||||
Class I | (4,296,551 | ) | ||||||
|
| |||||||
| (5,628,850 | ) | |||||||
|
| |||||||
Dividends to shareholders from net investment income: | ||||||||
Class A | (1,323,485 | ) | ||||||
Investor Class | (18,646 | ) | ||||||
Class I | (2,176,761 | ) | ||||||
|
| |||||||
Total dividends and distributions to shareholders | (5,628,850 | ) | (3,518,892 | ) | ||||
|
| |||||||
Capital share transactions: | ||||||||
Net proceeds from sale of shares | 438,680,545 | 199,137,746 | ||||||
Net asset value of shares issued to shareholders in reinvestment of dividends | 4,248,851 | 2,701,265 | ||||||
Cost of shares redeemed | (251,882,183 | ) | (255,509,908 | ) | ||||
|
| |||||||
Increase (decrease) in net assets derived from capital share transactions | 191,047,213 | (53,670,897 | ) | |||||
|
| |||||||
Net increase (decrease) in net assets | 193,680,546 | (55,173,894 | ) | |||||
| Net Assets | ||||||||
Beginning of year | 260,292,673 | 315,466,567 | ||||||
|
| |||||||
End of year(2) | $ | 453,973,219 | $ | 260,292,673 | ||||
|
| |||||||
| (1) | For the year ended April 30, 2019, the requirement to disclose dividends and distributions paid to shareholders from net investments income and/or net realized gain on investments was modified and are now presented together as distributions to shareholders. (See Note 10) |
| (2) | End of year net assets includes undistributed (overdistributed) net investment income of $(8,709) in 2018. The requirement to disclose the corresponding amount as of April 30, 2019 was eliminated. See Note 4 for tax basis of distributable earnings. (See Note 10) |
| The notes to the financial statements are an integral part of, and should be read in conjunction with, the financial statements. | 25 |
Financial Highlightsselected per share data and ratios
| Year ended April 30, | November 1, 2014 through April 30, | Year ended October 31, | ||||||||||||||||||||||
| Class A | 2019 | 2018 | 2017 | 2016 | 2015* | 2014 | ||||||||||||||||||
Net asset value at beginning of period | $ | 9.51 | $ | 9.56 | $ | 9.61 | $ | 9.54 | $ | 9.54 | $ | 9.59 | ||||||||||||
|
|
|
|
|
|
|
|
|
|
|
| |||||||||||||
Net investment income (loss) (a) | 0.12 | 0.10 | 0.08 | 0.07 | 0.01 | 0.04 | ||||||||||||||||||
Net realized and unrealized gain (loss) on investments | 0.07 | (0.05 | ) | (0.05 | ) | 0.06 | 0.01 | (0.03 | ) | |||||||||||||||
|
|
|
|
|
|
|
|
|
|
|
| |||||||||||||
Total from investment operations | 0.19 | 0.05 | 0.03 | 0.13 | 0.02 | 0.01 | ||||||||||||||||||
|
|
|
|
|
|
|
|
|
|
|
| |||||||||||||
| Less dividends and distributions: | ||||||||||||||||||||||||
From net investment income | (0.12 | ) | (0.10 | ) | (0.08 | ) | (0.06 | ) | (0.01 | ) | (0.04 | ) | ||||||||||||
From net realized gain on investments | — | — | (0.00 | )‡ | — | (0.01 | ) | (0.02 | ) | |||||||||||||||
|
|
|
|
|
|
|
|
|
|
|
| |||||||||||||
Total dividends and distributions | (0.12 | ) | (0.10 | ) | (0.08 | ) | (0.06 | ) | (0.02 | ) | (0.06 | ) | ||||||||||||
|
|
|
|
|
|
|
|
|
|
|
| |||||||||||||
Net asset value at end of period | $ | 9.58 | $ | 9.51 | $ | 9.56 | $ | 9.61 | $ | 9.54 | $ | 9.54 | ||||||||||||
|
|
|
|
|
|
|
|
|
|
|
| |||||||||||||
Total investment return (b) | 2.04 | %(c) | 0.54 | % | 0.27 | % | 1.41 | % | 0.27 | % | 0.09 | % | ||||||||||||
| Ratios (to average net assets)/Supplemental Data: | ||||||||||||||||||||||||
Net investment income (loss) | 1.28 | % | 1.06 | % | 0.79 | % | 0.69 | % | 0.33 | %†† | 0.41 | % | ||||||||||||
Net expenses | 0.71 | % | 0.80 | % | 0.80 | % | 0.80 | % | 0.86 | %†† | 0.86 | % | ||||||||||||
Expenses (before waiver/reimbursement) | 0.71 | % | 0.84 | % | 0.84 | % | 0.94 | % | 1.24 | %†† | 1.07 | % | ||||||||||||
Portfolio turnover rate | 96 | % | 69 | % | 85 | % | 66 | % | 7 | % | 30 | % | ||||||||||||
Net assets at end of period (in 000’s) | $ | 113,023 | $ | 98,982 | $ | 147,029 | $ | 111,768 | $ | 18,908 | $ | 20,086 | ||||||||||||
| †† | Annualized. |
| ‡ | Less than one cent per share. |
| * | The Fund changed its fiscal year end from October 31 to April 30. |
| (a) | Per share data based on average shares outstanding during the period. |
| (b) | Total investment return is calculated exclusive of sales charges and assumes the reinvestment of dividends and distributions. For periods of less than one year, total return is not annualized. |
| (c) | Total investment return may reflect adjustments to conform to generally accepted accounting principles. |
| Year ended April 30, | November 1, 2014 through April 30, | Year ended October 31, | ||||||||||||||||||||||
| Investor Class | 2019 | 2018 | 2017 | 2016 | 2015* | 2014 | ||||||||||||||||||
Net asset value at beginning of period | $ | 9.54 | $ | 9.59 | $ | 9.64 | $ | 9.56 | $ | 9.57 | $ | 9.61 | ||||||||||||
|
|
|
|
|
|
|
|
|
|
|
| |||||||||||||
Net investment income (loss) (a) | 0.08 | 0.06 | 0.04 | 0.03 | (0.00 | )‡ | 0.01 | |||||||||||||||||
Net realized and unrealized gain (loss) on investments | 0.07 | (0.05 | ) | (0.05 | ) | 0.07 | 0.00 | ‡ | (0.02 | ) | ||||||||||||||
|
|
|
|
|
|
|
|
|
|
|
| |||||||||||||
Total from investment operations | 0.15 | 0.01 | (0.01 | ) | 0.10 | 0.00 | ‡ | (0.01 | ) | |||||||||||||||
|
|
|
|
|
|
|
|
|
|
|
| |||||||||||||
| Less dividends and distributions: | ||||||||||||||||||||||||
From net investment income | (0.08 | ) | (0.06 | ) | (0.04 | ) | (0.02 | ) | (0.00 | )‡ | (0.01 | ) | ||||||||||||
From net realized gain on investments | — | — | (0.00 | )‡ | — | (0.01 | ) | (0.02 | ) | |||||||||||||||
|
|
|
|
|
|
|
|
|
|
|
| |||||||||||||
Total dividends and distributions | (0.08 | ) | (0.06 | ) | (0.04 | ) | (0.02 | ) | (0.01 | ) | (0.03 | ) | ||||||||||||
|
|
|
|
|
|
|
|
|
|
|
| |||||||||||||
Net asset value at end of period | $ | 9.61 | $ | 9.54 | $ | 9.59 | $ | 9.64 | $ | 9.56 | $ | 9.57 | ||||||||||||
|
|
|
|
|
|
|
|
|
|
|
| |||||||||||||
Total investment return (b) | 1.56 | % | 0.08 | % | (0.09 | %) | 1.06 | % | 0.02 | % | (0.15 | %) | ||||||||||||
| Ratios (to average net assets)/Supplemental Data: | ||||||||||||||||||||||||
Net investment income (loss) | 0.81 | % | 0.60 | % | 0.42 | % | 0.30 | % | (0.03 | %)†† | 0.02 | % | ||||||||||||
Net expenses | 1.18 | % | 1.26 | % | 1.17 | % | 1.20 | % | 1.22 | % †† | 1.24 | % | ||||||||||||
Expenses (before waiver/reimbursement) | 1.30 | % | 1.36 | % | 1.22 | % | 1.33 | % | 1.60 | % †† | 1.45 | % | ||||||||||||
Portfolio turnover rate | 96 | % | 69 | % | 85 | % | 66 | % | 7 | % | 30 | % | ||||||||||||
Net assets at end of period (in 000’s) | $ | 3,834 | $ | 3,366 | $ | 3,639 | $ | 3,663 | $ | 3,552 | $ | 3,844 | ||||||||||||
| †† | Annualized. |
| ‡ | Less than one cent per share. |
| * | The Fund changed its fiscal year end from October 31 to April 30. |
| (a) | Per share data based on average shares outstanding during the period. |
| (b) | Total investment return is calculated exclusive of sales charges and assumes the reinvestment of dividends and distributions. For periods of less than one year, total return is not annualized. |
| 26 | MainStay MacKay Short Term Municipal Fund | The notes to the financial statements are an integral part of, and should be read in conjunction with, the financial statements. |
Financial Highlightsselected per share data and ratios
| Year ended April 30, | November 1, 2014 through April 30, | Year ended October 31, | ||||||||||||||||||||||
| Class I | 2019 | 2018 | 2017 | 2016 | 2015* | 2014 | ||||||||||||||||||
Net asset value at beginning of period | $ | 9.51 | $ | 9.56 | $ | 9.61 | $ | 9.54 | $ | 9.54 | $ | 9.58 | ||||||||||||
|
|
|
|
|
|
|
|
|
|
|
| |||||||||||||
Net investment income (loss) (a) | 0.15 | 0.13 | 0.10 | 0.09 | 0.03 | 0.05 | ||||||||||||||||||
Net realized and unrealized gain (loss) on investments | 0.07 | (0.05 | ) | (0.05 | ) | 0.07 | 0.01 | (0.01 | ) | |||||||||||||||
|
|
|
|
|
|
|
|
|
|
|
| |||||||||||||
Total from investment operations | 0.22 | 0.08 | 0.05 | 0.16 | 0.04 | 0.04 | ||||||||||||||||||
|
|
|
|
|
|
|
|
|
|
|
| |||||||||||||
| Less dividends and distributions: | ||||||||||||||||||||||||
From net investment income | (0.15 | ) | (0.13 | ) | (0.10 | ) | (0.09 | ) | (0.03 | ) | (0.06 | ) | ||||||||||||
From net realized gain on investments | — | — | (0.00 | )‡ | — | (0.01 | ) | (0.02 | ) | |||||||||||||||
|
|
|
|
|
|
|
|
|
|
|
| |||||||||||||
Total dividends and distributions | (0.15 | ) | (0.13 | ) | (0.10 | ) | (0.09 | ) | (0.04 | ) | (0.08 | ) | ||||||||||||
|
|
|
|
|
|
|
|
|
|
|
| |||||||||||||
Net asset value at end of period | $ | 9.58 | $ | 9.51 | $ | 9.56 | $ | 9.61 | $ | 9.54 | $ | 9.54 | ||||||||||||
|
|
|
|
|
|
|
|
|
|
|
| |||||||||||||
Total investment return (b) | 2.34 | % | 0.84 | % | 0.54 | % | 1.66 | % | 0.40 | % | 0.45 | % | ||||||||||||
| Ratios (to average net assets)/Supplemental Data: | ||||||||||||||||||||||||
Net investment income (loss) | 1.61 | % | 1.36 | % | 1.04 | % | 0.93 | % | 0.56 | %†† | 0.66 | % | ||||||||||||
Net expenses | 0.40 | % | 0.50 | % | 0.54 | % | 0.55 | % | 0.61 | %†† | 0.61 | % | ||||||||||||
Expenses (before waiver/reimbursement) | 0.45 | % | 0.59 | % | 0.59 | % | 0.68 | % | 0.99 | %†† | 0.82 | % | ||||||||||||
Portfolio turnover rate | 96 | % | 69 | % | 85 | % | 66 | % | 7 | % | 30 | % | ||||||||||||
Net assets at end of period (in 000’s) | $ | 337,116 | $ | 157,945 | $ | 164,798 | $ | 211,369 | $ | 30,626 | $ | 43,509 | ||||||||||||
| †† | Annualized. |
| ‡ | Less than one cent per share. |
| * | The Fund changed its fiscal year end from October 31 to April 30. |
| (a) | Per share data based on average shares outstanding during the period. |
| (b) | Total investment return is calculated exclusive of sales charges and assumes the reinvestment of dividends and distributions. Class I shares are not subject to sales charges. For periods of less than one year, total return is not annualized. |
| The notes to the financial statements are an integral part of, and should be read in conjunction with, the financial statements. | 27 |
Note 1–Organization and Business
MainStay Funds Trust (the “Trust”) was organized as a Delaware statutory trust on April 28, 2009, and is governed by a Declaration of Trust. The Trust is registered under the Investment Company Act of 1940, as amended (the “1940 Act”), as an open-end management investment company, and is comprised of thirty-five funds (collectively referred to as the “Funds”). These financial statements and notes relate to the Mainstay MacKay Short Term Municipal Fund (formerly known as MainStay MacKay Tax Advantaged Short Term Bond Fund) (the “Fund”), a “diversified” fund, as that term is defined in the 1940 Act, as interpreted or modified by regulatory authorities having jurisdiction, from time to time.
The Fund currently has four classes of shares registered for sale. Class I shares commenced operations on January 2, 1991. Class A shares commenced operations on January 2, 2004. Investor Class shares commenced operations on February 28, 2008. Class R6 shares were registered for sale effective as of February 28, 2017. As of April 30, 2019, Class R6 shares were not yet offered for sale.
Class A and Investor Class shares are offered at net asset value (“NAV”) per share plus an initial sales charge. No initial sales charge applies to investments of $250,000 or more (and certain other qualified purchases) in Class A and Investor Class shares. Effective August 1, 2017, a contingent deferred sales charge (“CDSC”) of 0.50% may be imposed on certain redemptions of Class A and Investor Class shares made within 12 months of the date of purchase on shares that were purchased without an initial sales charge. For purchases of Class A and Investor Class shares made from January 1, 2017, through July 31, 2017, a CDSC of 1.00% may be imposed on certain redemptions of such shares made within 24 months of the date of purchase on shares that were purchased without an initial sales charge. Class I shares are offered at NAV without a sales charge. Class R6 shares are currently expected to be offered at NAV without a sales charge. As disclosed in the Fund’s prospectus, Class A shares may convert automatically to Investor Class shares and Investor Class shares may convert automatically to Class A shares. Under certain circumstances and as may be permitted by the Trust’s multiple class plan pursuant to Rule 18f-3 under the 1940 Act, specified share classes of the Fund may be converted to one or more other share classes of the Fund as disclosed in the capital share transactions within these Notes. The classes of shares have the same voting (except for issues that relate solely to one class), dividend, liquidation and other rights, and the same terms and conditions, except that under distribution plans pursuant to Rule 12b-1 under the 1940 Act, Class A and Investor Class shares are subject to a distribution and/or service fee. Class I and Class R6 shares are not subject to a distribution and/or service fee.
The Fund’s investment objective is to seek current income exempt from regular federal income tax.
Note 2–Significant Accounting Policies
The Fund is an investment company and accordingly follows the investment company accounting and reporting guidance of the Financial Accounting Standards Board (“FASB”) Accounting Standard CodificationTopic 946 Financial Services—Investment Companies. The Fund prepares its financial statements in accordance with generally accepted
accounting principles (“GAAP”) in the United States of America and follows the significant accounting policies described below.
(A) Securities Valuation. Investments are usually valued as of the close of regular trading on the New York Stock Exchange (the “Exchange”) (usually 4:00 p.m. Eastern time) on each day the Fund is open for business (“valuation date”).
The Board of Trustees of the Trust (the “Board”) adopted procedures establishing methodologies for the valuation of the Fund’s securities and other assets and delegated the responsibility for valuation determinations under those procedures to the Valuation Committee of the Trust (the “Valuation Committee”). The Board authorized the Valuation Committee to appoint a Valuation Subcommittee (the “Subcommittee”) to deal in the first instance with establishing the prices of securities for which market quotations are not readily available or the prices of which are not otherwise readily determinable under these procedures. The Subcommittee meets (in person, via electronic mail or via teleconference) on an as-needed basis. Subsequently, the Valuation Committee meets to ensure that actions taken by the Subcommittee were appropriate. The procedures state that, subject to the oversight of the Board and unless otherwise noted, the responsibility for theday-to-day valuation of portfolio assets (including fair value measurements for the Fund’s assets and liabilities) rests with New York Life Investment Management LLC (“New York Life Investments” or the “Manager”), aided to whatever extent necessary by the Subadvisor (as defined in Note 3(A)).
To assess the appropriateness of security valuations, the Manager, the Subadvisor or the Fund’s third-party service provider, who is subject to oversight by the Manager, regularly compares prior day prices, prices on comparable securities and the sale prices to the prior and current day prices and challenges prices with changes exceeding certain tolerance levels with third-party pricing services or broker sources. For those securities valued through either a standardized fair valuation methodology or a fair valuation measurement, the Subcommittee deals in the first instance with such valuation and the Valuation Committee reviews and affirms, if appropriate, the reasonableness of the valuation based on such methodologies and measurements on a regular basis after considering information that is reasonably available and deemed relevant by the Valuation Committee. Any action taken by the Subcommittee with respect to the valuation of a portfolio security or other asset is submitted for review and ratification (if appropriate) to the Valuation Committee and the Board at the next regularly scheduled meeting.
“Fair value” is defined as the price the Fund would reasonably expect to receive upon selling an asset or liability in an orderly transaction to an independent buyer in the principal or most advantageous market for the asset or liability. Fair value measurements are determined within a framework that establishes a three-tier hierarchy which maximizes the use of observable market data and minimizes the use of unobservable inputs to establish a classification of fair value measurements for disclosure purposes. “Inputs” refer broadly to the assumptions that market participants would use in pricing the asset or liability, including assumptions about risk, such as the risk inherent in a particular valuation technique used to measure fair value using a pricing model and/or the risk inherent in the inputs for the valuation technique. Inputs may be observable or unobservable. Observable inputs reflect the assumptions market participants would use in pricing the asset or liability based on
| 28 | MainStay MacKay Short Term Municipal Fund |
market data obtained from sources independent of the Fund. Unobservable inputs reflect the Fund’s own assumptions about the assumptions market participants would use in pricing the asset or liability based on the information available. The inputs or methodology used for valuing assets or liabilities may not be an indication of the risks associated with investing in those assets or liabilities. The three-tier hierarchy of inputs is summarized below.
| • | Level 1—quoted prices in active markets for an identical asset or liability |
| • | Level 2—other significant observable inputs (including quoted prices for a similar asset or liability in active markets, interest rates and yield curves, prepayment speeds, credit risk, etc.) |
| • | Level 3—significant unobservable inputs (including the Fund’s own assumptions about the assumptions that market participants would use in measuring fair value of an asset or liability) |
The level of an asset or liability within the fair value hierarchy is based on the lowest level of an input, both individually and in the aggregate, that is significant to the fair value measurement. As of April 30, 2019, the aggregate value by input level of the Fund’s assets and liabilities is included at the end of the Fund’s Portfolio of Investments.
The Fund may use third-party vendor evaluations, whose prices may be derived from one or more of the following standard inputs, among others:
• Benchmark yields | • Reported trades | |
• Broker/dealer quotes | • Issuer spreads | |
• Two-sided markets | • Benchmark securities | |
• Bids/offers | • Reference data (corporate actions or material event notices) | |
• Industry and economic events | • Comparable bonds | |
• Monthly payment information |
An asset or liability for which market values cannot be measured using the methodologies described above is valued by methods deemed reasonable in good faith by the Valuation Committee, following the procedures established by the Board, to represent fair value. Under these procedures, the Fund generally uses a market-based approach which may use related or comparable assets or liabilities, recent transactions, market multiples, book values and other relevant information. The Fund may also use an income-based valuation approach in which the anticipated future cash flows of the asset or liability are discounted to calculate fair value. Discounts may also be applied due to the nature and/or duration of any restrictions on the disposition of the asset or liability. Fair value represents a good faith approximation of the value of a security. Fair value determinations involve the consideration of a number of subjective factors, an analysis of applicable facts and circumstances and the exercise of judgment. As a result, it is possible that the fair value for a security determined in good faith in accordance with the Fund’s valuation procedures may differ from valuations for the same security determined by other funds using their own valuation procedures. Although the Fund’s valuation procedures are designed to value a security at the price the Fund may reasonably expect to receive upon the security’s sale in an orderly transaction, there can be no assurance that any fair value determination thereunder would, in fact,
approximate the amount that the Fund would actually realize upon the sale of the security or the price at which the security would trade if a reliable market price were readily available. During the year ended April 30, 2019, there were no material changes to the fair value methodologies.
Securities which may be valued in this manner include, but are not limited to: (i) a security for which trading has been halted or suspended; (ii) a debt security that has recently gone into default and for which there is not a current market quotation; (iii) a security of an issuer that has entered into a restructuring; (iv) a security that has been delisted from a national exchange; (v) a security for which the market price is not readily available from a third-party pricing source or, if so provided, does not, in the opinion of the Manager or the Subadvisor, reflect the security’s market value; (vi) a security subject to trading collars for which no or limited trading takes place; and (vii) a security whose principal market has been temporarily closed at a time when, under normal conditions, it would be open. Securities valued in this manner are generally categorized as Level 3 in the hierarchy. As of April 30, 2019, there were no securities held by the Fund that were fair valued in such a manner.
Debt securities are valued at the evaluated mean prices supplied by a pricing agent or broker selected by the Manager, in consultation with the Subadvisor. The evaluations are market-based measurements processed through a pricing application and represents the pricing agent’s good faith determination as to what a holder may receive in an orderly transaction under market conditions. The rules based logic utilizes valuation techniques that reflect participants’ assumptions and vary by asset class and per methodology, maximizing the use of relevant observable data including quoted prices for similar assets, benchmark yield curves and market corroborated inputs. The evaluated bid or mean prices are deemed by the Manager, in consultation with the Subadvisor, to be representative of market values, at the regular close of trading of the Exchange on each valuation date. Debt securities purchased on a delayed delivery basis are marked to market daily until settlement at the forward settlement date. Municipal debt securities are generally categorized as Level 2 in the hierarchy.
Investments in mutual funds, including money market funds, are valued at their respective NAVs as of the close of the Exchange on the valuation date. These securities are generally categorized as Level 1 in the hierarchy.
In calculating NAV, each closed end fund is valued at market value, which will generally be determined using the last reported official closing or last trading price on the exchange or market on which the security is primarily traded at the time of valuation. Price information on closed end funds are taken from the exchange where the security is primarily traded. In addition, because closed-end funds and ETFs trade on a secondary market, their shares may trade at a premium or discount to the actual net asset value of their portfolio securities and their shares may have greater volatility because of the potential lack of liquidity.
Temporary cash investments acquired in excess of 60 days to maturity at the time of purchase are valued using the latest bid prices or using valuations based on a matrix system (which considers such factors as security prices, yields, maturities and ratings), both as furnished by
| 29 |
Notes to Financial Statements(continued)
independent pricing services. Other temporary cash investments which mature in 60 days or less at the time of purchase (“Short-Term Investments”) are valued using the amortized cost method of valuation, unless the use of such method would be inappropriate. The amortized cost method involves valuing a security at its cost on the date of purchase and thereafter assuming a constant amortization to maturity of the difference between such cost and the value on maturity date. Amortized cost approximates the current fair value of a security. Securities valued using the amortized cost method are not valued using quoted prices in an active market and are generally categorized as Level 2 in the hierarchy.
The information above is not intended to reflect an exhaustive list of the methodologies that may be used to value portfolio investments. The valuation procedures permit the use of a variety of valuation methodologies in connection with valuing portfolio investments. The methodology used for a specific type of investment may vary based on the market data available or other considerations. The methodologies summarized above may not represent the specific means by which portfolio investments are valued on any particular business day.
(B) Income Taxes. The Fund’s policy is to comply with the requirements of the Internal Revenue Code of 1986, as amended (the “Internal Revenue Code”), applicable to regulated investment companies and to distribute all of its taxable income to the shareholders of the Fund within the allowable time limits. Therefore, no federal, state and local income tax provisions are required.
Management evaluates the Fund’s tax positions to determine if the tax positions taken meet the minimum recognition threshold in connection with accounting for uncertainties in income tax positions taken or expected to be taken for the purposes of measuring and recognizing tax liabilities in the financial statements. Recognition of tax benefits of an uncertain tax position is permitted only to the extent the position is “more likely than not” to be sustained assuming examination by taxing authorities. Management has analyzed the Fund’s tax positions taken on federal, state and local income tax returns for all open tax years (for up to three tax years) and has concluded that no provisions for federal, state and local income tax are required in the Fund’s financial statements. The Fund’s federal, state and local income tax and federal excise tax returns for tax years for which the applicable statutes of limitations have not expired are subject to examination by the Internal Revenue Service and state and local departments of revenue.
(C) Dividends and Distributions to Shareholders. Dividends and distributions are recorded on the ex-dividend date. The Fund intends to declare dividends from net investment income, if any, daily and intends to pay them at least monthly and distributions from net realized capital and currency gains, if any, at least annually. Unless the shareholder elects otherwise, all dividends and distributions are reinvested in the same class of shares of the Fund, at NAV. Dividends and distributions to shareholders are determined in accordance with federal income tax regulations and may differ from determinations using GAAP.
(D) Security Transactions and Investment Income. The Fund records security transactions on the trade date. Realized gains and losses on security transactions are determined using the identified cost method. Interest income is accrued as earned using the effective
interest rate method and includes any realized gains and losses from repayments of principal on mortgage-backed securities. Discounts and premiums on securities purchased, other than Short Term Investments, for the Fund are accreted and amortized, respectively, on the effective interest rate method over the life of the respective securities.
Investment income and realized and unrealized gains and losses on investments of the Fund are allocated pro rata to the separate classes of shares based upon their relative net assets on the date the income is earned or realized and unrealized gains and losses are incurred.
The Fund may place a debt security on non-accrual status and reduce related interest income by ceasing current accruals and writing off all or a portion of any interest receivables when the collection of all or a portion of such interest has become doubtful. A debt security is removed from non-accrual status when the issuer resumes interest payments or when collectability of interest is reasonably assured.
(E) Expenses. Expenses of the Trust are allocated to the individual Funds in proportion to the net assets of the respective Funds when the expenses are incurred, except where direct allocations of expenses can be made. Expenses (other than transfer agent expenses and fees incurred under the shareholder services plans and/or the distribution plans further discussed in Note 3(B)) are allocated to separate classes of shares pro rata based upon their relative net assets on the date the expenses are incurred. The expenses borne by the Fund, including those of related parties to the Fund, are shown in the Statement of Operations.
Additionally, the Fund may invest in mutual funds, which are subject to management fees and other fees that may increase the costs of investing in mutual funds versus the costs of owning the underlying securities directly. These indirect expenses of mutual funds are not included in the amounts shown as expenses in the Fund’s Statement of Operations or in the expense ratios included in the financial highlights.
(F) Use of Estimates. In preparing financial statements in conformity with GAAP, management makes estimates and assumptions that affect the reported amounts and disclosures in the financial statements. Actual results could differ from those estimates.
(G) Futures Contracts. A futures contract is an agreement to purchase or sell a specified quantity of an underlying instrument at a specified future date and price, or to make or receive a cash payment based on the value of a financial instrument (e.g., foreign currency, interest rate, security or securities index). The Fund is subject to risks such as market price risk and/or interest rate risk in the normal course of investing in these transactions. Upon entering into a futures contract, the Fund is required to pledge to the broker or futures commission merchant an amount of cash and/or U.S. government securities equal to a certain percentage of the collateral amount, known as the “initial margin.” During the period the futures contract is open, changes in the value of the contract are recognized as unrealized appreciation or depreciation by marking to market such contract on a daily basis to reflect the market value of the contract at the end of each day’s trading. The Fund agrees to receive from or pay to the broker or futures commission merchant an amount of cash equal to the daily fluctuation in the value of the contract. Such receipts or payments are known as “variation margin.” When the futures contract is closed, the Fund
| 30 | MainStay MacKay Short Term Municipal Fund |
records a realized gain or loss equal to the difference between the proceeds from (or cost of) the closing transaction and the Fund’s basis in the contract.
The use of futures contracts involves, to varying degrees, elements of market risk in excess of the amount recognized in the Statement of Assets and Liabilities. The contract or notional amounts and variation margin reflect the extent of the Fund’s involvement in open futures positions. There are several risks associated with the use of futures contracts as hedging techniques. There can be no assurance that a liquid market will exist at the time when the Fund seeks to close out a futures contract. If no liquid market exists, the Fund would remain obligated to meet margin requirements until the position is closed. Futures may involve a small initial investment relative to the risk assumed, which could result in losses greater than if they had not been used. Futures may be more volatile than direct investments in the instrument underlying the futures and may not correlate to the underlying instrument, causing a given hedge not to achieve its objectives. The Fund’s activities in futures contracts have minimal counterparty risk as they are conducted through regulated exchanges that guarantee the futures against default by the counterparty. In the event of a bankruptcy or insolvency of a futures commission merchant that holds margin on behalf of the Fund, the Fund may not be entitled to the return of the entire margin owed to the Fund, potentially resulting in a loss. The Fund’s investment in futures contracts and other derivatives may increase the volatility of the Fund’s NAVs and may result in a loss to the Fund. As of April 30, 2019, the Fund did not hold any futures contracts.
(H) Debt Securities Risk. The ability of issuers of debt securities held by the Fund to meet their obligations may be affected by, among other things, economic or political developments in a specific country, industry or region.
(I) Municipal Bond Risk. The Fund may invest a substantial amount of its assets in municipal bonds whose interest is paid solely from revenues of similar projects. If the Fund concentrates its investments in this manner, it assumes the legal and economic risks relating to such projects that may have a significant impact on the Fund’s investment performance. In addition, the Fund may invest more heavily in bonds from certain cities, states or regions than others, which may increase the Fund’s exposure to losses resulting from economic, political, or regulatory occurrences impacting these particular cities, states or regions.
Certain of the issuers in which the Fund may invest have recently experienced, or may experience, significant financial difficulties and repeated credit rating downgrades. On May 3, 2017, the Commonwealth of Puerto Rico began proceedings to seek bankruptcy-type protections from approximately $74 billion in debt and approximately $48 billion in unfunded pension obligations. Puerto Rico’s debt restructuring of $122 billion is significantly larger than the previous largest U.S. public bankruptcy, which covered approximately $18 billion of debt for the city of Detroit. Puerto Rico has reached agreements with certain bondholders to restructure outstanding debt issued by certain of Puerto Rico’s instrumentalities and is negotiating the restructuring of its debt with certain other bondholders. Any agreement to restructure such outstanding debt must be approved by the judge overseeing the debt restructuring. Puerto Rico’s debt restructuring process and other economic factors or developments could occur rapidly and may
significantly affect the value of municipal securities of Puerto Rico. The Fund’s vulnerability to potential losses associated with such developments may be reduced through investing in municipal securities that feature credit enhancements (such as bond insurance). The bond insurance provider pays both principal and interest when due to the bond holder. The magnitude of Puerto Rico’s debt restructuring or other adverse economic developments could pose significant strains on the ability of municipal securities insurers to meet all future claims. As of April 30, 2019, 100.0% of the Puerto Rico municipal securities held by the Fund were insured.
(J) Indemnifications. Under the Trust’s organizational documents, its officers and trustees are indemnified against certain liabilities that may arise out of performance of their duties to the Trust. Additionally, in the normal course of business, the Fund enters into contracts with third-party service providers that contain a variety of representations and warranties and which may provide general indemnifications. The Fund’s maximum exposure under these arrangements is unknown, as this would involve future claims that may be made against the Fund that have not yet occurred. Based on experience, management is of the view that the risk of loss in connection with these potential indemnification obligations is remote. However, there can be no assurance that material liabilities related to such obligations will not arise in the future, which could adversely impact the Fund.
(K) Quantitative Disclosure of Derivative Holdings. The following tables show additional disclosures related to the Fund’s derivative and hedging activities, including how such activities are accounted for and their effect on the Fund’s financial positions, performance and cash flows. These derivatives are not accounted for as hedging instruments.
The effect of derivative instruments on the Statement of Operations for the year ended April 30, 2019:
Realized Gain (Loss)
| Statement of Operations Location | Interest Rate Contracts Risk | Total | ||||||||
Futures Contracts | Net realized gain (loss) on futures transactions | $ | (22,623 | ) | $ | (22,623 | ) | |||
|
| |||||||||
Total Realized Gain (Loss) | $ | (22,623 | ) | $ | (22,623 | ) | ||||
|
| |||||||||
Average Notional Amount
| Interest Rate Contracts Risk | Total | |||||||
Futures Contracts Short (a) | $ | (13,699,572 | ) | $ | (13,699,572 | ) | ||
|
| |||||||
| (a) | Positions were open less than one month during the reporting period. |
Note 3–Fees and Related Party Transactions
(A) Manager and Subadvisor. New York Life Investments, a registered investment adviser and an indirect,wholly-owned subsidiary of
| 31 |
Notes to Financial Statements(continued)
New York Life Insurance Company (“New York Life”), serves as the Fund’s Manager, pursuant to an Amended and Restated Management Agreement (“Management Agreement”). The Manager provides offices, conducts clerical, recordkeeping and bookkeeping services and keeps most of the financial and accounting records required to be maintained by the Fund. Except for the portion of salaries and expenses that are the responsibility of the Fund, the Manager pays the salaries and expenses of all personnel affiliated with the Fund and certain operational expenses of the Fund. The Fund reimburses New York Life Investments in an amount equal to a portion of the compensation of the Chief Compliance Officer attributable to the Fund. MacKay Shields LLC (“MacKay Shields” or the “Subadvisor”), a registered investment adviser and an indirect,wholly-owned subsidiary of New York Life, serves as Subadvisor to the Fund and is responsible for theday-to-day portfolio management of the Fund. Pursuant to the terms of an Amended and Restated Subadvisory Agreement (“Subadvisory Agreement”) between New York Life Investments and MacKay Shields, New York Life Investments pays for the services of the Subadvisor.
Under the Management Agreement, the Fund pays the Manager a monthly fee for the services performed and the facilities furnished at an annual rate of the Fund’s average daily net assets as follows: 0.35% on all assets. Prior to May 22, 2018, the Fund paid the Manager a monthly fee for the services performed and the facilities furnished at 0.45% on all assets. During the year ended April 30, 2019, the effective management fee rate was 0.35%, (exclusive of any applicable waivers/reimbursements).
Effective to May 22, 2018, New York Life Investments has contractually agreed to waive fees and/or reimburse expenses so that Total Annual Fund Operating Expenses (excluding taxes, interest, litigation, extraordinary expenses, brokerage and other transaction expenses relating to the purchase or sale of portfolio investments and acquired (underlying) fund fees and expenses) do not exceed: Class A, 0.70% and Class I, 0.40% of its average daily net assets. New York Life Investments will apply an equivalent waiver or reimbursement, in an equal number of basis points of the Class A shares waiver/reimbursement, to Investor Class shares. New York Life Investments will waive fees and/or reimburse expenses so that Class R6 fees and expenses do not exceed those of Class I. This agreement will remain in effect until August 31, 2019, and shall renew automatically for one-year terms unless New York Life Investments provides written notice of termination prior to the start of the next term or upon approval of the Board.
Prior to May 22, 2018, New York Life Investments had contractually agreed to waive fees and/or reimburse expenses so that Total Annual Fund Operating Expenses did not exceed the following percentages of average daily net assets: Class A, 0.80% and Class I, 0.50% of its average daily net assets. New York Life Investments would have applied an equivalent waiver or reimbursement based on Class A, in an equal number of basis points to Investor Class.
During the year ended April 30, 2019, New York Life Investments earned fees from the Fund in the amount of $1,319,543 and waived its fees and/or reimbursed expenses including the voluntary waiver/reimbursement of certain class-specific expenses, in the amount of $139,397.
State Street providessub-administration andsub-accounting services to the Fund pursuant to an agreement with New York Life Investments. These services include calculating the daily NAVs of the Fund, maintaining the general ledger andsub-ledger accounts for the calculation of the Fund’s NAVs and assisting New York Life Investments in conducting various aspects of the Fund’s administrative operations. For providing these services to the Fund, State Street is compensated by New York Life Investments.
Pursuant to an agreement between the Trust and New York Life Investments, New York Life Investments is responsible for providing or procuring certain regulatory reporting services for the Fund. The Fund will reimburse New York Life Investments for the actual costs incurred by New York Life Investments in connection with providing or procuring these services for the Fund.
(B) Distribution and Service Fees. The Trust, on behalf of the Fund, has entered into a distribution agreement with NYLIFE Distributors LLC (the “Distributor”), an indirect,wholly-owned subsidiary of New York Life. The Fund has adopted distribution plans (the “Plans”) in accordance with the provisions of Rule 12b-1 under the 1940 Act.
Pursuant to the Class A and Investor Class Plans, the Distributor receives a monthly distribution fee from the Class A and Investor Class shares at an annual rate of 0.25% of the average daily net assets of the Class A and Investor Class shares for distribution and/or service activities as designated by the Distributor. Class I shares are not subject to a distribution and/or service fee.
The Plans provide that the distribution and service fees are payable to the Distributor regardless of the amounts actually expended by the Distributor for distribution of the Fund’s shares and service activities.
(C) Sales Charges. During the year ended April 30, 2019, the Fund was advised by the Distributor that the amount of initial sales charges retained on sales of Class A and Investor Class shares were $10,340 and $919, respectively.
During the year ended April 30, 2019, the Fund was also advised that the Distributor retained CDSCs on redemptions of Class A and Investor Class shares of $26,813 and $21, respectively.
(D) Transfer, Dividend Disbursing and Shareholder Servicing Agent. NYLIM Service Company LLC, an affiliate of New York Life Investments, is the Fund’s transfer, dividend disbursing and shareholder servicing agent pursuant to an agreement between NYLIM Service Company LLC and the Trust. NYLIM Service Company LLC has entered into an agreement with DST Asset Manager Solutions, Inc. (“DST”), pursuant to which DST performs certain transfer agent services on behalf of NYLIM Service Company LLC. During the year ended April 30, 2019, transfer agent expenses incurred by the Fund were as follows:
Class A | $ | 33,748 | ||
Investor Class | 21,361 | |||
Class I | 88,394 |
(E) Small Account Fee. Shareholders with small accounts adversely impact the cost of providing transfer agency services. In an effort to reduce total transfer agency expenses, the Fund has implemented a small account fee on certain types of accounts. Certain
| 32 | MainStay MacKay Short Term Municipal Fund |
shareholders with an account balance of less than $1,000 are charged an annual per account fee of $20 (assessed semi-annually), the proceeds from which offset transfer agent fees as reflected in the Statement of Operations.
(F) Capital. As of April 30, 2019, New York Life and its affiliates beneficially held shares of the Fund with the values and percentages of net assets as follows:
Class A | $ | 15,857,120 | 14.0 | % |
Note 4–Federal Income Tax
As of April 30, 2019, the cost and unrealized appreciation (depreciation) of the Fund’s investment portfolio, including applicable derivative contracts and other financial instruments, as determined on a federal income tax basis, were as follows:
| Federal Tax Cost | Gross Unrealized Appreciation | Gross Unrealized (Depreciation) | Net Unrealized Appreciation/ (Depreciation) | |||||||||||||
Investments in Securities | $ | 445,392,202 | $ | 1,603,608 | $ | (322,391 | ) | $ | 1,281,217 | |||||||
As of April 30, 2019, the components of accumulated gain (loss) on a tax basis were as follows:
| Ordinary Income | Undistrib uted Tax Exempt Income | Accumu lated Capital and Other Gain (Loss) | Other Temporary Differences | Unrealized Appreciation (Depreciation) | Total Accumu lated Gain (Loss) | |||||
| $— | $134,796 | $(636,580) | $(144,901) | $1,281,217 | $634,532 | |||||
The other temporary differences are primarily due to dividends payable.
As of April 30, 2019, for federal income tax purposes, capital loss carryforwards of $636,580 were available as shown in the table below, to the extent provided by the regulations to offset future realized gains of the Fund. To the extent that these capital loss carryforwards are used to offset future capital gains, it is probable that the capital gains so offset will not be distributed to shareholders. No capital gain distributions shall be made until any capital loss carryforwards have been fully utilized.
| Capital Loss Available Through | Short-Term Capital Loss Amounts (000’s) | Long-Term Capital Loss Amounts (000’s) | ||
| Unlimited | $212 | $425 | ||
During the years ended April 30, 2019 and April 30, 2018, the tax character of distributions paid as reflected in the Statements of Changes in Net Assets were as follows:
| 2019 | 2018 | |||||||
Distributions paid from: | ||||||||
Ordinary Income | $ | 104,095 | $ | 650,578 | ||||
Exempt Interest Dividends | 5,524,755 | 2,868,314 | ||||||
Total | $ | 5,628,850 | $ | 3,518,892 | ||||
Note 5–Custodian
State Street is the custodian of cash and securities held by the Fund. Custodial fees are charged to the Fund based on the Fund’s net assets and/or the market value of securities held by the Fund and the number of certain transactions incurred by the Fund.
Note 6–Line of Credit
The Fund and certain other funds managed by New York Life Investments maintain a line of credit with a syndicate of banks in order to secure a source of funds for temporary purposes to meet unanticipated or excessive redemption requests.
Effective July 31, 2018, under the credit agreement (the “Credit Agreement”), the aggregate commitment amount is $600,000,000 with an additional uncommitted amount of $100,000,000. The commitment fee is an annual rate of 0.15% of the average commitment amount payable quarterly, regardless of usage, to State Street, who serves as the agent to the syndicate. The commitment fee is allocated among the Fund and certain other funds managed by New York Life Investments based upon their respective net assets and other factors. Interest on any revolving credit loan is charged based upon the Federal Funds Rate or the one-month London Interbank Offered Rate (“LIBOR”), whichever is higher. The Credit Agreement expires on July 30, 2019, although the Fund, certain other funds managed by New York Life Investments and the syndicate of banks may renew the Credit Agreement for an additional year on the same or different terms. Prior to July 31, 2018, the aggregate commitment amount and the commitment fee were the same as those under the current Credit Agreement. During the year ended April 30, 2019, there were no borrowings made or outstanding with respect to the Fund under the Credit Agreement.
Note 7–Interfund Lending Program
Pursuant to an exemptive order issued by the SEC, the Fund, along with certain other funds managed by New York Life Investments, may participate in an interfund lending program. The interfund lending program provides an alternative credit facility that permits the Fund and certain other funds managed by New York Life Investments to lend or borrow money for temporary purposes directly to or from one another subject to the conditions of the exemptive order. During the year ended April 30, 2019, there were no interfund loans made or outstanding with respect to the Fund.
Note 8–Purchases and Sales of Securities (in 000’s)
During the year ended April 30, 2019, purchases and sales of U.S. government securities were $0 and $2, respectively. Purchases and sales of securities, other than U.S. government securities andshort-term securities, were $423,334 and $322,692, respectively.
The Fund may purchase securities from or sell securities to other portfolios managed by the Subadvisor. These interportfolio transactions are primarily used for cash management purposes and are made pursuant to Rule 17a-7 under the 1940 Act. During the year ended April 30, 2019, such purchases were $5,942.
| 33 |
Notes to Financial Statements(continued)
Note 9–Capital Share Transactions
Class A | Shares | Amount | ||||||
Year ended April 30, 2019: | ||||||||
Shares sold | 10,465,323 | $ | 99,977,399 | |||||
Shares issued to shareholders in reinvestment of dividends and distributions | 121,312 | 1,159,600 | ||||||
Shares redeemed | (9,248,191 | ) | (88,360,287 | ) | ||||
|
| |||||||
Net increase (decrease) in shares outstanding before conversion | 1,338,444 | 12,776,712 | ||||||
Shares converted into Class A (See Note 1) | 101,825 | 972,961 | ||||||
Shares converted from Class A (See Note 1) | (48,787 | ) | (466,343 | ) | ||||
|
| |||||||
Net increase (decrease) | 1,391,482 | $ | 13,283,330 | |||||
|
| |||||||
| Year ended April 30, 2018: | ||||||||
Shares sold | 8,984,696 | $ | 85,804,850 | |||||
Shares issued to shareholders in reinvestment of dividends and distributions | 120,693 | 1,152,427 | ||||||
Shares redeemed | (14,220,228 | ) | (135,757,525 | ) | ||||
|
| |||||||
Net increase (decrease) in shares outstanding before conversion | (5,114,839 | ) | (48,800,248 | ) | ||||
Shares converted into Class A (See Note 1) | 168,731 | 1,615,538 | ||||||
Shares converted from Class A (See Note 1) | (23,019 | ) | (219,630 | ) | ||||
|
| |||||||
Net increase (decrease) | (4,969,127 | ) | $ | (47,404,340 | ) | |||
|
| |||||||
Investor Class | Shares | Amount | ||||||
Year ended April 30, 2019: | ||||||||
Shares sold | 347,701 | $ | 3,332,424 | |||||
Shares issued to shareholders in reinvestment of dividends and distributions | 2,786 | 26,710 | ||||||
Shares redeemed | (242,011 | ) | (2,318,453 | ) | ||||
|
| |||||||
Net increase (decrease) in shares outstanding before conversion | 108,476 | 1,040,681 | ||||||
Shares converted into Investor Class (See Note 1) | 39,246 | 376,174 | ||||||
Shares converted from Investor Class (See Note 1) | (101,566 | ) | (972,961 | ) | ||||
|
| |||||||
Net increase (decrease) | 46,156 | $ | 443,894 | |||||
|
| |||||||
| Year ended April 30, 2018: | ||||||||
Shares sold | 295,685 | $ | 2,827,195 | |||||
Shares issued to shareholders in reinvestment of dividends and distributions | 1,842 | 17,635 | ||||||
Shares redeemed | (178,863 | ) | (1,710,869 | ) | ||||
|
| |||||||
Net increase (decrease) in shares outstanding before conversion | 118,664 | 1,133,961 | ||||||
Shares converted into Investor Class (See Note 1) | 22,971 | 219,630 | ||||||
Shares converted from Investor Class (See Note 1) | (168,362 | ) | (1,615,538 | ) | ||||
|
| |||||||
Net increase (decrease) | (26,727 | ) | $ | (261,947 | ) | |||
|
| |||||||
Class I | Shares | Amount | ||||||
Year ended April 30, 2019: | ||||||||
Shares sold | 35,124,870 | $ | 335,370,722 | |||||
Shares issued to shareholders in reinvestment of dividends and distributions | 320,376 | 3,062,541 | ||||||
Shares redeemed | (16,872,592 | ) | (161,203,443 | ) | ||||
|
| |||||||
Net increase (decrease) in shares outstanding before conversion | 18,572,654 | 177,229,820 | ||||||
Shares converted into Class I (See Note 1) | 9,432 | 90,169 | ||||||
|
| |||||||
Net increase (decrease) | 18,582,086 | $ | 177,319,989 | |||||
|
| |||||||
| Year ended April 30, 2018: | ||||||||
Shares sold | 11,577,783 | $ | 110,505,701 | |||||
Shares issued to shareholders in reinvestment of dividends and distributions | 160,452 | 1,531,203 | ||||||
Shares redeemed | (12,369,327 | ) | (118,041,514 | ) | ||||
|
| |||||||
Net increase (decrease) | (631,092 | ) | $ | (6,004,610 | ) | |||
|
| |||||||
Note 10–Recent Accounting Pronouncement
In March 2017, the Financial Accounting Standards Board issued an Accounting Standards Update, ASU2017-08, which amends the amortization period for certain callable debt securities that are held at a premium. The amendment requires the premium to be amortized to the earliest call date. This amendment does not require an accounting change for securities held at a discount. This guidance is effective for fiscal years beginning after December 15, 2018. Management is currently evaluating the potential impact of this guidance to the financial statements.
Effective October 31, 2018, the Fund has adopted disclosure requirements conforming to SEC Rule 6-04.17 of Regulation S-X that simplifies the reporting of information by registered investment companies in financial statements. The amendments require presentation of the total, rather than the components, of distributable earnings in the Statement of Assets and Liabilities and also require presentation of the total, rather than the components, of distributions to shareholders, except for tax return of capital distributions, if any, in the Statements of Changes in Net Assets. The amendments also removed the requirement for parenthetical disclosure of undistributed net investment income in the Statements of Changes in Net Assets. These Regulation S-X amendments are reflected in the Fund’s financial statements for the year ended April 30, 2019.
To improve the effectiveness of fair value disclosure requirements, the Financial Accounting Standards Board recently issued Accounting Standard Update (ASU)2018-13, Fair Value Measurement Disclosure Framework—Changes to the Disclosure Requirements for Fair Value Measurement (ASU2018-13), which adds, removes, and modifies certain aspects relating to fair value disclosure. ASU2018-13 is effective for interim and annual reporting periods beginning after December 15, 2019; early adoptions of the entire ASU 2019-13, or portions thereof, is permitted. Management has evaluated the implications of certain other provisions of the ASU and has determined to early adopt aspects related to the removal and modifications of certain fair value measurement disclosures under the ASU effective immediately. At this time, management is evaluating the implications of
| 34 | MainStay MacKay Short Term Municipal Fund |
certain other provisions of the ASU related to new disclosure requirements and any impact in the financial statement disclosures has not yet been determined.
Note 11–Subsequent Events
In connection with the preparation of the financial statements of the Fund as of and for the year ended April 30, 2019, events and trans-
actions subsequent to April 30, 2019, through the date the financial statements were issued have been evaluated by the Fund’s management for possible adjustment and/or disclosure. No subsequent events requiring financial statement adjustment or disclosure have been identified.
| 35 |
Report of Independent Registered Public Accounting Firm
To the Shareholders and Board of Trustees
MainStay Funds Trust:
Opinion on the Financial Statements
We have audited the accompanying statement of assets and liabilities of MainStay MacKay Short Term Municipal Fund (formerly, MainStay MacKay Tax Advantaged Short Term Bond Fund) (the Fund), a series of MainStay Funds Trust, including the portfolio of investments, as of April 30, 2019, the related statement of operations for the year then ended, the statements of changes in net assets for each of the years in the two-year period then ended, and the related notes (collectively, the financial statements) and the financial highlights for each of the years in the four-year period then ended, the six-month period ended April 30, 2015, and the year ended October 31, 2014. In our opinion, the financial statements and financial highlights present fairly, in all material respects, the financial position of the Fund as of April 30, 2019, the results of its operations for the year then ended, the changes in its net assets for each of the years in the two-year period then ended, and the financial highlights for each of the years in the four-year period then ended, the six-month period ended April 30, 2015, and the year ended October 31, 2014, in conformity with U.S. generally accepted accounting principles.
Basis for Opinion
These financial statements and financial highlights are the responsibility of the Fund’s management. Our responsibility is to express an opinion on these financial statements and financial highlights based on our audits. We are a public accounting firm registered with the Public Company Accounting Oversight Board (United States) (PCAOB) and are required to be independent with respect to the Fund in accordance with the U.S. federal securities laws and the applicable rules and regulations of the Securities and Exchange Commission and the PCAOB.
We conducted our audits in accordance with the standards of the PCAOB. Those standards require that we plan and perform the audit to obtain reasonable assurance about whether the financial statements and financial highlights are free of material misstatement, whether due to error or fraud. Our audits included performing procedures to assess the risks of material misstatement of the financial statements and financial highlights, whether due to error or fraud, and performing procedures that respond to those risks. Such procedures included examining, on a test basis, evidence regarding the amounts and disclosures in the financial statements and financial highlights. Such procedures also included confirmation of securities owned as of April 30, 2019, by correspondence with the custodian. Our audits also included evaluating the accounting principles used and significant estimates made by management, as well as evaluating the overall presentation of the financial statements and financial highlights. We believe that our audits provide a reasonable basis for our opinion.

We have served as the auditor of one or more New York Life Investment Management investment companies since 2003.
Philadelphia, Pennsylvania
June 18, 2019
| 36 | MainStay MacKay Short Term Municipal Fund |
Board Consideration and Approval of Management Agreement and
Subadvisory Agreement (Unaudited)
The continuation of the Management Agreement with respect to the MainStay MacKay Short Term Municipal Fund (“Fund”) and New York Life Investment Management LLC (“New York Life Investments”) and the Subadvisory Agreement between New York Life Investments and MacKay Shields LLC (“MacKay”) with respect to the Fund (together, “Advisory Agreements”), following an initial term of up to two years, is subject to annual review and approval by the Board of Trustees of MainStay Funds Trust (the “Board” of the “Trust”) in accordance with Section 15 of the Investment Company Act of 1940, as amended (“1940 Act”). At its December10-12, 2018in-person meeting, the Board, including the Trustees who are not “interested persons” (as such term is defined in the 1940 Act) of the Trust (“Independent Trustees”) voting separately, unanimously approved for aone-year period the continuation of the Advisory Agreements.
In reaching the decision to approve the Advisory Agreements, the Board considered information furnished by New York Life Investments and MacKay in connection with an annual contract review process undertaken by the Board that took place at various meetings of the Board and its Contracts Committee between October 2018 and December 2018, as well as other information furnished to the Board throughout the year as deemed relevant by the Trustees. Information requested by and furnished to the Board for consideration in connection with the contract review process included, among other items, reports on the Fund and “peer funds” prepared by Strategic Insight Mutual Fund Research and Consulting, LLC (“Strategic Insight”), an independent third-party service provider engaged by the Board to report objectively on the Fund’s investment performance, management fee and total expenses. The Board also considered information on the fees charged to other investment advisory clients of New York Life Investments and/or MacKay (including institutional separate accounts) that follow investment strategies similar to the Fund, if any, and, when applicable, the rationale for any differences in the Fund’s management and subadvisory fees and the fees charged to those other investment advisory clients. In addition, the Board considered information furnished by New York Life Investments and MacKay in response to requests prepared on behalf of, and in consultation with, the Board by independent legal counsel to the Independent Trustees, which encompassed a variety of topics, including those summarized below. The Board took into account information provided in advance of and during its meetings throughout the year, including, among other items, information regarding the legal standards and fiduciary obligations applicable to its consideration of the Advisory Agreements and investment performance reports on the Fund prepared by the Investment Consulting Group of New York Life Investments as well as presentations from New York Life Investments and MacKay personnel, such as portfolio managers. The Board also took into account other information received from New York Life Investments throughout the year, including, among other items, periodic reports on legal and compliance matters, risk management, portfolio turnover and brokerage commissions, sales and marketing activity, andnon-advisory services provided to the Fund by New York Life Investments. The overall annual contract review process, including the structure and format for materials provided to the Board, was developed in consultation with the Board. At various meetings, the Independent Trustees also met in executive session with their independent legal counsel, and met with senior management of New York Life Investments without other representatives of New York Life Investments present.
In addition to information provided to the Board throughout the year, the Board received information provided specifically in response to requests prepared on behalf of, and in consultation with, the Board by independent legal counsel regarding the Fund’s distribution arrangements in connection with its June 2018 meeting. In addition, the Board received information regarding the Fund’s asset levels, share purchase and redemption activity and the payment of Rule12b-1 distribution and service fees by applicable share classes of the Fund. In connection with this June meeting, New York Life Investments also provided the Board with information regarding the revenue sharing payments made by New York Life Investments from its own resources to intermediaries that promote the sale or distribution of Fund shares or that provide servicing to Fund shareholders.
In considering the continuation of the Advisory Agreements, the Trustees reviewed and evaluated all of the information and factors they believed to be relevant and appropriate in light of legal advice furnished to them by independent legal counsel and through the exercise of their own business judgment. The broad factors considered by the Board are described in greater detail below and included, among other factors: (i) the nature, extent and quality of the services provided to the Fund by New York Life Investments and MacKay; (ii) the qualifications of the portfolio managers of the Fund and the historical investment performance of the Fund, New York Life Investments and MacKay; (iii) the costs of the services provided, and profits realized, by New York Life Investments and MacKay from their relationships with the Fund; (iv) the extent to which economies of scale have been realized or may be realized if the Fund grows and the extent to which economies of scale have benefited or may benefit Fund shareholders; and (v) the reasonableness of the Fund’s management and subadvisory fees and overall total ordinary operating expenses, particularly as compared to any similar funds and accounts managed by New York Life Investments and/or MacKay. Although the Board recognized that the comparisons between the Fund’s fees and expenses and those of other funds are imprecise given different terms of agreements, variations in fund strategies and other factors, the Board considered the reasonableness of the Fund’s management fee and overall total ordinary operating expenses as compared to the peer funds identified by Strategic Insight. Throughout their considerations, the Trustees acknowledged the overall commitment of New York Life Investments and its affiliates to serve the MainStay Group of Funds, as well as their capacity, experience, resources, financial stability and reputations.
Although individual Trustees may have weighed certain factors or information differently, the Board’s decision to approve the continuation of the Advisory Agreements was based on a consideration of the information provided to the Trustees throughout the year, as well as information furnished specifically in connection with the contract review process. The Trustees noted that, throughout the year, the Trustees are also afforded an opportunity to ask questions of and request additional information or materials from New York Life Investments and MacKay. The Board’s conclusions with respect to the Advisory Agreements may have also been based, in part, on the Board’s knowledge of New York Life Investments and MacKay resulting from, among other things, the Board’s consideration of the Advisory Agreements in prior years, the advisory agreements for other funds in the MainStay Group of Funds in prior years, the Board’s regular review throughout the year of the performance and operations of other funds in the MainStay Group of Funds
| 37 |
Board Consideration and Approval of Management Agreement and
Subadvisory Agreement(Unaudited) (continued)
and the Board’s business judgment and industry experience. In addition to considering the above-referenced factors, the Board observed that in the marketplace there are a range of investment options available to shareholders of the Fund and that the Fund’s shareholders, having had the opportunity to consider other investment options, have chosen to invest in the Fund. The factors that figured prominently in the Board’s decision to approve the continuation of the Advisory Agreements during its December10-12, 2018in-person meeting are summarized in more detail below.
Nature, Extent and Quality of Services Provided by New York Life Investments and MacKay
The Board examined the nature, extent and quality of the services that New York Life Investments provides to the Fund. The Board evaluated New York Life Investments’ experience and capabilities in serving as manager of the Fund and managing Fund operations in amanager-of-managers structure, noting that New York Life Investments manages other mutual funds, serves a variety of other investment advisory clients, including other pooled investment vehicles, and has experience with overseeing mutual fund service providers, including subadvisors. The Board considered the experience of senior personnel at New York Life Investments providing management and administrative and othernon-advisory services to the Fund as well as New York Life Investments’ reputation and financial condition. The Board observed that New York Life Investments devotes significant resources and time to providing advisory andnon-advisory services to the Fund, including New York Life Investments’ supervision and due diligence reviews of MacKay and ongoing analysis of, and interactions with, MacKay with respect to, among other things, Fund investment performance and risk as well as MacKay’s investment capabilities and subadvisory services with respect to the Fund.
The Board also considered the full range of services that New York Life Investments provides to the Fund under the terms of the Management Agreement, including: (i) fund accounting and ongoing supervisory services provided by New York Life Investments’ Fund Administration and Accounting Group; (ii) investment supervisory and analytical services provided by New York Life Investments’ Investment Consulting Group; (iii) compliance services provided by the Trust’s Chief Compliance Officer as well as New York Life Investments’ Compliance Department, including supervision and implementation of the Fund’s compliance program; (iv) legal services provided by New York Life Investments’ Office of the General Counsel; and (v) risk management and portfolio trading monitoring and analysis by compliance and investment personnel. The Board noted that certainnon-advisory services provided by New York Life Investments are set forth in the Management Agreement. In addition, the Board considered New York Life Investments’ willingness to invest in personnel, infrastructure, technology, operational enhancements, cyber security, information security, shareholder privacy resources and business continuity planning that are designed to benefit the Fund, and noted that New York Life Investments is responsible for compensating the Trust’s officers, except for a portion of the salary of the Trust’s Chief Compliance Officer. The Board recognized that New York Life Investments has provided an increasingly broad array ofnon-advisory services to the MainStay Group of Funds as a result of regulatory and other developments, including in connection with the designation of New York Life Investments as the
administrator of the MainStay Group of Funds’ liquidity risk management program adopted under the 1940 Act. The Board considered benefits to shareholders of being part of the MainStay Group of Funds, including the privilege of exchanging investments between the same class of shares without the imposition of a sales charge, as described more fully in the Fund’s prospectus.
The Board also examined the nature, extent and quality of the investment advisory services that MacKay provides to the Fund. The Board evaluated MacKay’s experience in serving as subadvisor to the Fund and managing other portfolios and MacKay’s track record and experience in providing investment advisory services, the experience of investment advisory, senior management and administrative personnel at MacKay, and MacKay’s overall legal and compliance environment, resources and history. In addition to information provided in connection with its quarterly meetings with the Trust’s Chief Compliance Officer, the Board considered that New York Life Investments and MacKay believe the compliance policies, procedures and systems are reasonably designed to prevent violation of the federal securities laws, and acknowledged their continued commitment to further developing and strengthening compliance programs relating to the Fund. In addition, the Board considered the policies and procedures in place with respect to matters that may involve conflicts of interest between the Fund’s investments and those of other accounts managed by MacKay. The Board reviewed MacKay’s ability to attract and retain qualified investment professionals and willingness to invest in personnel to service and support the Fund. In this regard, the Board considered the experience of the Fund’s portfolio managers, the number of accounts managed by the portfolio managers and the method for compensating the portfolio managers.
Based on these considerations, the Board concluded, within the context of its overall determinations regarding the Advisory Agreements, that the Fund would likely continue to benefit from the nature, extent and quality of these services as a result of New York Life Investments’ and MacKay’s experience, personnel, operations and resources.
Investment Performance
In evaluating the Fund’s investment performance, the Board considered investment performance results over various periods in light of the Fund’s investment objective, strategies and risks, as disclosed in the Fund’s prospectus. The Board particularly considered investment reports on and analysis of the Fund’s performance provided to the Board throughout the year by the Investment Consulting Group of New York Life Investments. These reports include, among other items, information on the Fund’s gross and net returns, the Fund’s investment performance compared to relevant investment categories and the Fund’s benchmark, the Fund’s risk-adjusted investment performance and the Fund’s investment performance as compared to peer funds, as appropriate, as well as portfolio attribution information and commentary on the effect of current and recent market conditions. The Board also considered information provided by Strategic Insight showing the investment performance of the Fund as compared to peer funds.
In considering the Fund’s investment performance, the Board generally placed greater emphasis on the Fund’s long-term performance track record. The Board also gave weight to its ongoing discussions with senior management at New York Life Investments concerning the
| 38 | MainStay MacKay Short Term Municipal Fund |
Fund’s investment performance as well as discussions between the Fund’s portfolio managers and the Board’s Investment Committee that occur regularly, generally on an annual basis. In addition, the Board considered any specific actions that New York Life Investments or MacKay had taken, or had agreed with the Board to take, to seek to enhance Fund investment performance and the results of those actions.
Based on these considerations, the Board concluded, within the context of its overall determinations regarding the Advisory Agreements, that the long-term investment performance of the Fund, along with ongoing efforts by New York Life Investments and MacKay to seek to enhance investment returns, supported a determination to approve the continuation of the Advisory Agreements. The Fund discloses more information about investment performance in the Portfolio Management Discussion and Analysis, Investment and Performance Comparison and Financial Highlights sections of this Annual Report and in the Fund’s prospectus.
Costs of the Services Provided, and Profits Realized, by New York Life Investments and MacKay
The Board considered the costs of the services provided by New York Life Investments and MacKay under the Advisory Agreements and the profits realized by New York Life Investments and its affiliates, including MacKay, due to their relationships with the Fund. Because MacKay is an affiliate of New York Life Investments whose subadvisory fees are paid directly by New York Life Investments, not the Fund, the Board considered cost and profitability information for New York Life Investments and MacKay in the aggregate.
In addition, the Board acknowledged the difficulty in obtaining reliable comparative data about mutual fund managers’ profitability, because such information generally is not publicly available and may be impacted by numerous factors, including the structure of a fund manager’s organization, the types of funds it manages, the methodology used to allocate certain fixed costs to specific funds, and the manager’s capital structure and costs of capital.
In evaluating the costs of the services provided by New York Life Investments and MacKay and profits realized by New York Life Investments and its affiliates, including MacKay, the Board considered, among other factors, each party’s continuing investments in personnel, systems, equipment and other resources and infrastructure to support and further enhance the management of the Fund, and that New York Life Investments is responsible for paying the subadvisory fees for the Fund. The Board considered the financial resources of New York Life Investments and MacKay and acknowledged that New York Life Investments and MacKay must be in a position to attract and retain experienced professional personnel and to maintain a strong financial position for New York Life Investments and MacKay to continue to provide high-quality services to the Fund. The Board also recognized that the Fund benefits from the allocation of certain fixed costs across the MainStay Group of Funds, among other expected benefits resulting from its relationship with New York Life Investments.
In connection with the annual fund profitability analysis that New York Life Investments presents to the Board, the Board considers information provided by New York Life Investments regarding its methodology for calculating profitability and allocating costs. In 2014, the Board engaged
Bobroff Consulting, Inc., an independent third-party consultant, to review the methods used to allocate costs to the funds in the MainStay Group of Funds and among individual funds in the MainStay Group of Funds. As part of this engagement, the consultant analyzed: (i) the various New York Life Investments business units and affiliated subadvisors that provide services to the funds in the MainStay Group of Funds; (ii) how costs are allocated to the funds in the MainStay Group of Funds and to other lines of businesses; and (iii) how New York Life Investments’ cost allocation methods and profitability reports compare to industry practices. The Board noted that the independent consultant had concluded that New York Life Investments’ methods for allocating costs and procedures for estimating overall profitability of the funds in the MainStay Group of Funds are reasonable, consistent with industry practice and likely to produce reasonable profitability estimates. Although the Board recognized the difficulty in evaluating a manager’s profitability with respect to the Fund and noting that other profitability methodologies may also be reasonable, the Board concluded that the profitability methodology presented by New York Life Investments to the Board was reasonable in all material respects.
In considering the costs and profitability of the Fund, the Board also considered certainfall-out benefits that may be realized by New York Life Investments and its affiliates due to their relationships with the Fund, including reputational and other indirect benefits. In addition, the Board reviewed information regarding a money market fund advised by New York Life Investments and an affiliated subadvisor that serves as an investment option for the Fund, including the rationale for and costs associated with investments in this money market fund by the Fund, if any, and considered information from New York Life Investments that the nature and type of specific investment advisory services provided to this money market fund are distinct from or in addition to the investment advisory services provided to the Fund. The Board observed that, in addition to fees earned by New York Life Investments for managing the Fund, New York Life Investments’ affiliates also earn revenues from serving the Fund in various other capacities, including as the Fund’s transfer agent and distributor. The Board considered information about these other revenues, and their impact on the profitability of the Fund to New York Life Investments and its affiliates, which was furnished to the Board as part of the annual contract review process. The Board noted that, although it assessed the overall profitability of the Fund to New York Life Investments and its affiliates as part of the contract review process, when considering the reasonableness of the fees to be paid to New York Life Investments and its affiliates under the Advisory Agreements, the Board considered the profitability of New York Life Investments’ relationship with the Fund on apre-tax basis and without regard to distribution expenses incurred by New York Life Investments from its own resources.
After evaluating the information deemed relevant by the Trustees, the Board concluded, within the context of its overall determinations regarding the Advisory Agreements, that any profits realized by New York Life Investments and its affiliates, including MacKay, due to their relationships with the Fund were not excessive.
| 39 |
Board Consideration and Approval of Management Agreement and
Subadvisory Agreement(Unaudited) (continued)
Management and Subadvisory Fees and Total Ordinary Operating Expenses
The Board evaluated the reasonableness of the fees paid under the Advisory Agreements and the Fund’s total ordinary operating expenses. The Board primarily considered the reasonableness of the management fee paid by the Fund to New York Life Investments, because the subadvisory fees paid to MacKay are paid by New York Life Investments, not the Fund. The Board also considered the reasonableness of the subadvisory fees to be paid by New York Life Investments and the amount of the management fee retained by New York Life Investments.
In assessing the reasonableness of the Fund’s fees and expenses, the Board primarily considered comparative data provided by Strategic Insight on the fees and expenses charged by similar mutual funds managed by other investment advisers. In addition, the Board considered information provided by New York Life Investments and MacKay on fees charged to other investment advisory clients, including institutional separate accounts and other funds that follow investment strategies similar to those of the Fund, if any. The Board considered the similarities and differences in the contractual management fee schedules of the Fund and these similarly-managed funds, taking into account New York Life Investments’ rationale for any differences in fee schedules. The Board took into account explanations provided by New York Life Investments about the more extensive scope of services provided to registered investment companies, such as the Fund, as compared with other investment advisory clients. Additionally, the Board considered the impact of any contractual breakpoints, voluntary waivers and expense limitation arrangements on the Fund’s net management fee and expenses. The Board also considered that in proposing fees for the Fund, New York Life Investments considers the competitive marketplace for financial products. The Board considered its discussions with representatives from New York Life Investments regarding the total net expenses for the Fund. The Board noted that New York Life Investments had proposed, and the Board had approved, a reduction in the Fund’s management fee and expense limitation, effective May 22, 2018.
The Board noted that, outside of the Fund’s management fee and the fees charged under a share class’s Rule12b-1 and/or shareholder services plans, a share class’s most significant “other expenses” are transfer agent fees. Transfer agent fees are charged to the Fund based on the number of shareholder accounts (a“per-account” fee) as compared with certain other fees (e.g., management fees) that are charged based on the Fund’s average net assets. The Board took into account information from New York Life Investments regarding the reasonableness of the Fund’s transfer agent fee schedule, including industry data demonstrating that theper-account fees that NYLIM Service Company LLC, an affiliate of New York Life Investments and the Fund’s transfer agent, charges the Fund are within the range ofper-account fees charged by transfer agents to other mutual funds. In addition, the Board considered NYLIM Service Company LLC’s profitability in connection with the transfer agent services it provides to the Fund. The Board also took into account information received from NYLIM Service Company LLC regarding thesub-transfer agency payments it made to intermediaries in connection with the provision ofsub-transfer agency services to the Fund.
The Board considered that, because the Fund’s transfer agent fees are billed on aper-account basis, the impact of transfer agent fees on a
share class’s expense ratio may be more significant in cases where the share class has a high number of accounts with limited assets (i.e., small accounts). The Board considered the extent to which transfer agent fees comprised total expenses of the Fund. The Board acknowledged the role that the MainStay Group of Funds historically has played in serving the investment needs of New York Life Insurance Company (“New York Life”) customers, who often maintain smaller account balances than other shareholders of funds, and the impact of small accounts on the expense ratios of Fund share classes. The Board also recognized measures that it and New York Life Investments have taken to mitigate the effect of small accounts on the expense ratios of Fund share classes. The Board noted that, for purposes of allocating transfer agency fees and expenses, each retail fund in the MainStay Group of Funds combines the shareholder accounts of its Class A, I, R1, R2, and Class R3 shares (as applicable) into one group and the shareholder accounts of its Investor Class and Class B and C shares (as applicable) into another group. The Board also noted that theper-account fees attributable to each group of share classes is then allocated among the constituent share classes based on relative net assets and that a MainStay Fund’s Class R6 shares, if any, are not combined with any other share class for this purpose. The Board considered New York Life Investments’ rationale with respect to these groupings and received a report from an independent consultant engaged to conduct comparative analysis of these groupings. The Board also considered that NYLIM Service Company LLC had waived its contractual cost of living adjustments during the past five years.
After considering all of the factors outlined above, the Board concluded that the Fund’s management fees and total ordinary operating expenses were within a range that is competitive and, within the context of the Board’s overall conclusions regarding the Advisory Agreements, support a conclusion that these fees and expenses are reasonable.
Extent to Which Economies of Scale May Be Realized as the Fund Grows
The Board considered whether the Fund’s expense structure permits economies of scale to be shared with Fund shareholders. The Board also considered a report from New York Life Investments, previously prepared at the request of the Board, that addressed economies of scale in the mutual fund business generally, the changing economics of the mutual fund business and the various ways in which the benefits of economies of scale may be shared with the Fund and other funds in the MainStay Group of Funds. Although the Board recognized the difficulty of determining future economies of scale with precision, the Board acknowledged that economies of scale may be shared with the Fund in a number of ways, including, for example, through the imposition of management fee breakpoints, initially setting management fee rates at scale or making additional investments to enhance shareholder services. The Board reviewed information from New York Life Investments showing how the Fund’s management fee schedule compared to fee schedules of other funds and accounts managed by New York Life Investments. The Board also reviewed information from Strategic Insight showing how the Fund’s management fee schedule hypothetically would compare with fees paid for similar services by peer funds at varying asset levels.
| 40 | MainStay MacKay Short Term Municipal Fund |
Based on this information, the Board concluded, within the context of its overall determinations regarding the Advisory Agreements, that the Fund’s expense structure appropriately reflects economies of scale for the benefit of Fund shareholders at current asset levels. The Board noted, however, that it would continue to evaluate the reasonableness of the Fund’s expense structure over time.
Conclusion
On the basis of the information and factors summarized above and the evaluation thereof, the Board as a whole, including the Independent Trustees voting separately, unanimously voted to approve the continuation of the Advisory Agreements.
| 41 |
Federal Income Tax Information
(Unaudited)
The Fund is required under the Internal Revenue Code to advise shareholders in a written statement as to the federal tax status of dividends paid by the Fund during such fiscal years.
For Federal individual income tax purposes, the Fund designated 98.2% of the ordinary income dividends paid during its fiscal year ended April 30, 2019 as attributable to interest income from Tax Exempt Municipal Bonds. Such dividends are currently exempt from Federal income taxes under Section 103(a) of the Internal Revenue Code.
In February 2019, shareholders will receive an IRS Form1099-DIV or substitute Form 1099, which will show the federal tax status of the distributions received by shareholders in calendar year 2018. The amounts that will be reported on such1099-DIV or substitute Form 1099 will be the amounts you are to use on your federal income tax return and will differ from the amounts which we must report for the Fund’s fiscal year end April 30, 2019.
Proxy Voting Policies and Procedures and Proxy Voting Record
A description of the policies and procedures that New York Life Investments uses to vote proxies related to the Fund’s securities is available without charge, upon request, by visiting the MainStay Funds’ website atnylinvestments.com/fundsor on the SEC’s website atwww.sec.gov.
The Fund is required to file with the SEC its proxy voting records for the12-month period ending June 30 on Form N-PX. The most recent Form N-PX or proxy voting record is available free of charge upon request by calling800-624-6782; visiting the MainStay Funds’ website atnylinvestments.com/funds; or on the SEC’s website atwww.sec.gov.
Shareholder Reports and Quarterly Portfolio Disclosure
The Fund is required to file its complete schedule of portfolio holdings with the SEC 60 days after each fiscal quarter on Form N-PORT. The Fund’s Form N-PORT is available without charge, on the SEC’s website atwww.sec.govor by calling New York Life Investments at800-624-6782.
| 42 | MainStay MacKay Short Term Municipal Fund |
Board of Trustees and Officers (Unaudited)
The Trustees and officers of the Funds are listed below. The Board oversees the MainStay Group of Funds (which consists of MainStay Funds and MainStay Funds Trust), MainStay VP Funds Trust, MainStay MacKay DefinedTerm Municipal Opportunities Fund, the Manager and the Subadvisors, and elects the officers of the Funds who are responsible for theday-to-day operations of the Funds. Information pertaining to the Trustees and officers is set forth below. Each Trustee serves until his or her successor is elected and qualified or until his or her resignation, death or removal. Under the Board’s retirement policy, unless an exception is made, a Trustee must tender his or her
resignation by the end of the calendar year during which he or she reaches the age of 75. Mr. Meenan reached the age of 75 during the calendar year 2016, and his term was extended for one additional year through the end of calendar year 2017. Mr. Meenan retired at the end of calendar year 2017. Officers are elected annually by the Board. The business address of each Trustee and officer listed below is 51 Madison Avenue, New York, New York 10010. A majority of the Trustees are not “interested persons” (as defined by the 1940 Act and rules adopted by the SEC thereunder) of the Fund (“Independent Trustees”).
| Name and Date of Birth | Term of Office, Position(s) Held and Length of Service | Principal Occupation(s) During Past Five Years | Number of Portfolios in Fund Complex Overseen by Trustee | Other Directorships Held by Trustee | ||||||||
Interested Trustee | Yie-Hsin Hung* 8/12/62 | MainStay Funds: Trustee since 2017; MainStay Funds Trust:Trustee since 2017. | Senior Vice President of New York Life since joining in 2010, Member of the Executive Management Committee since 2017, Chief Executive Officer, New York Life Investment Management Holdings LLC & New York Life Investment Management LLC since 2015. Senior Managing Director andCo-President of New York Life Investment Management LLC from January 2014 to May 2015. Previously held positions of increasing responsibility, including head of NYLIM International, Alternative Growth Businesses, and Institutional investments since joining New York Life in 2010. | 80 | MainStay VP Funds Trust: Trustee since 2017 (32 portfolios); and MainStay MacKay DefinedTerm Municipal Opportunities Fund: Trustee since 2017. |
| * | This Trustee is considered to be an “interested person” of the MainStay Group of Funds, MainStay VP Funds Trust and MainStay MacKay DefinedTerm Municipal Opportunities Fund, within the meaning of the 1940 Act because of her affiliation with New York Life Insurance Company, New York Life Investment Management LLC, Candriam Belgium S.A., Candriam France S.A.S., IndexIQ Advisors LLC, MacKay Shields LLC, NYL Investors LLC, NYLIFE Securities LLC and/or NYLIFE Distributors LLC, as described in detail above in the column entitled “Principal Occupation(s) During Past Five Years.” |
| 43 |
| Name and Date of Birth | Term of Office, Position(s) Held and Length of Service | Principal Occupation(s) During Past Five Years | Number of Portfolios in Fund Complex Overseen by Trustee | Other Directorships Held by Trustee | ||||||||
Independent Trustees | David H. Chow 12/29/57 | MainStay Funds: Trustee since 2016, Advisory Board Member (June 2015 to December 2015); MainStay Funds Trust:Trustee since 2016, Advisory Board Member (June 2015 to December 2015). | Founder and CEO, DanCourt Management, LLC (since 1999) | 80 | MainStay VP Funds Trust: Trustee since 2016, Advisory Board Member (June 2015 to December 2015) (32 portfolios); MainStay MacKay DefinedTerm Municipal Opportunities Fund: Trustee since 2016, Advisory Board Member (June 2015 to December 2015); Market Vectors Group of Exchange-Traded Funds: Independent Chairman of the Board of Trustees since 2008 and Trustee since 2006 (56 portfolios); and Berea College of Kentucky: Trustee since 2009. | |||||||
Susan B. Kerley 8/12/51 | MainStay Funds: Chairman since 2017 and Trustee since 2007; MainStay Funds Trust:Chairman since 2017 and Trustee since 1990.** | President, Strategic Management Advisors LLC (since 1990) | 80 | MainStay VP Funds Trust: Chairman since January 2017 and Trustee since 2007 (32 portfolios)***; MainStay MacKay DefinedTerm Municipal Opportunities Fund: Chairman since 2017 and Trustee since 2011; and Legg Mason Partners Funds: Trustee since 1991 (45 portfolios). | ||||||||
Alan R. Latshaw 3/27/51 | MainStay Funds: Trustee and Audit Committee Financial Expert since 2006; MainStay Funds Trust: Trustee and Audit Committee Financial Expert since 2007.** | Retired; Partner, Ernst & Young LLP (2002 to 2003); Partner, Arthur Andersen LLP (1989 to 2002); Consultant to the MainStay Funds Audit and Compliance Committee (2004 to 2006) | 80 | MainStay VP Funds Trust: Trustee and Audit Committee Financial Expert since 2007 (32 portfolios)***; MainStay MacKay DefinedTerm Municipal Opportunities Fund: Trustee and Audit Committee Financial Expert since 2011; State Farm Associates Funds Trusts: Trustee since 2005 (4 portfolios); and State Farm Variable Product Trust: Trustee since 2005 (9 portfolios). | ||||||||
Richard H. Nolan, Jr. 11/16/46 | MainStay Funds: Trustee since 2007; MainStay Funds Trust:Trustee since 2007.** | Managing Director, ICC Capital Management (since 2004); President—Shields/Alliance, Alliance Capital Management (1994 to 2004) | 80 | MainStay VP Funds Trust: Trustee since 2006 (32 portfolios)***; and MainStay MacKay DefinedTerm Municipal Opportunities Fund: Trustee since 2011. | ||||||||
Jacques P. Perold 5/12/58 | MainStay Funds: Trustee since 2016, Advisory Board Member (June 2015 to December 2015); MainStay Funds Trust:Trustee since 2016, Advisory Board Member (June 2015 to December 2015). | Retired; President, Fidelity Management & Research Company (2009 to 2014); Founder, President and Chief Executive Officer, Geode Capital Management, LCC (2001 to 2009) | 80 | MainStay VP Funds Trust: Trustee since 2016, Advisory Board Member (June 2015 to December 2015) (32 portfolios); MainStay MacKay DefinedTerm Municipal Opportunities Fund: Trustee since 2016, Advisory Board Member (June 2015 to December 2015); Allstate Corporation: Director since 2015;MSCI, Inc.: Director since 2017 and Boston University: Trustee since 2014. |
| 44 | MainStay MacKay Short Term Municipal Fund |
| Name and Date of Birth | Term of Office, Position(s) Held and Length of Service | Principal Occupation(s) During Past Five Years | Number of Portfolios in Fund Complex Overseen by Trustee | Other Directorships Held by Trustee | ||||||||
Independent Trustees | Richard S. Trutanic 2/13/52 | MainStay Funds: Trustee since 1994; MainStay Funds Trust: Trustee since 2007.** | Chairman and Chief Executive Officer, Somerset & Company (financial advisory firm) (since 2004); Managing Director, The Carlyle Group (private investment firm) (2002 to 2004); Senior Managing Director, Partner and Board Member, Groupe Arnault S.A. (private investment firm) (1999 to 2002) | 80 | MainStay VP Funds Trust: Trustee since 2007 (32 portfolios)***; and MainStay MacKay DefinedTerm Municipal Opportunities Fund: Trustee since 2011. |
| ** | Includes prior service as a Director/Trustee of certain predecessor entities to MainStay Funds Trust. |
| *** | Includes prior service as a Director of MainStay VP Series Fund, Inc., the predecessor to MainStay VP Funds Trust. |
| 45 |
| Name and Date of Birth | Position(s) Held and Length of Service | Principal Occupation(s) During Past Five Years | ||||||
Officers | Kirk C. Lehneis 6/29/74 | President, MainStay Funds, MainStay Funds Trust (since 2017) | Chief Operating Officer and Senior Managing Director (since 2016), New York Life Investment Management LLC; Chairman of the Board (since 2017), NYLIFE Distributors LLC; Chairman of the Board, NYLIM Service Company LLC (since 2017); Trustee, President and Principal Executive Officer of IndexIQ Trust, IndexIQ ETF Trust and IndexIQ Active ETF Trust (since January 2018); President, MainStay MacKay DefinedTerm Municipal Opportunities Fund and MainStay VP Funds Trust (since 2017)**; Senior Managing Director, Global Product Development (From 2015—2016); Managing Director, Product Development (From 2010—2015), New York Life Investment Management LLC | |||||
Jack R. Benintende 5/12/64 | Treasurer and Principal Financial and Accounting Officer, MainStay Funds (since 2007), MainStay Funds Trust (since 2009) | Managing Director, New York Life Investment Management LLC (since 2007); Treasurer and Principal Financial and Accounting Officer, MainStay MacKay DefinedTerm Municipal Opportunities Fund (since 2011) and MainStay VP Funds Trust (since 2007)**; and Assistant Treasurer, New York Life Investment Management Holdings LLC (2008 to 2012) | ||||||
Kevin M. Bopp 2/24/69 | Vice President and Chief Compliance Officer, MainStay Funds and MainStay Funds Trust (since 2014) | Chief Compliance Officer, New York Life Investment Management LLC, IndexIQ Trust, IndexIQ ETF Trust and IndexIQ Active ETF Trust (since 2016), Director and Associate General Counsel (2011 to 2014) and Vice President and Assistant General Counsel (2010 to 2011), New York Life Investment Management LLC; Vice President and Chief Compliance Officer, MainStay VP Funds Trust, MainStay MacKay DefinedTerm Municipal Opportunities Fund (since 2014); Assistant Secretary, MainStay Funds, MainStay Funds Trust and MainStay VP Funds Trust (2010 to 2014)**, MainStay MacKay DefinedTerm Municipal Opportunities Fund (2011 to 2014) | ||||||
J. Kevin Gao 10/13/67 | Secretary and Chief Legal Officer, MainStay Funds and MainStay Funds Trust (since 2010) | Managing Director and Associate General Counsel, New York Life Investment Management LLC (since 2010); Secretary and Chief Legal Officer, MainStay MacKay DefinedTerm Municipal Opportunities Fund (since 2011) and MainStay VP Funds Trust (since 2010)** | ||||||
Scott T. Harrington 2/8/59 | Vice President—Administration, MainStay Funds (since 2005), MainStay Funds Trust (since 2009) | Managing Director, New York Life Investment Management LLC (including predecessor advisory organizations) (since 2000); Member of the Board of Directors, New York Life Trust Company (since 2009); Vice President—Administration, MainStay MacKay DefinedTerm Municipal Opportunities Fund (since 2011) and MainStay VP Funds Trust (since 2005)** |
| * | The officers listed above are considered to be “interested persons” of the MainStay Group of Funds, MainStay VP Funds Trust and MainStay MacKay Defined Term Municipal Opportunities Fund within the meaning of the 1940 Act because of their affiliation with the MainStay Group of Funds, New York Life Insurance Company and/or its affiliates, including New York Life Investment Management LLC, NYLIM Service Company LLC, NYLIFE Securities LLC and/or NYLIFE Distributors LLC, as described in detail in the column captioned “Principal Occupation(s) During Past Five Years.” Officers are elected annually by the Board. |
| ** | Includes prior service as an Officer of MainStay VP Series Fund, Inc., the predecessor to MainStay VP Funds Trust. |
| 46 | MainStay MacKay Short Term Municipal Fund |
MainStay Funds
Equity
U.S. Equity
MainStay Epoch U.S. All Cap Fund
MainStay Epoch U.S. Equity Yield Fund
MainStay Large Cap Growth Fund
MainStay MacKay Common Stock Fund
MainStay MacKay Growth Fund
MainStay MacKay S&P 500 Index Fund
MainStay MacKay Small Cap Core Fund1
MainStay MacKay U.S. Equity Opportunities Fund
MainStay MAP Equity Fund
International Equity
MainStay Epoch International Choice Fund
MainStay MacKay International Equity Fund
MainStay MacKay International Opportunities Fund
Emerging Markets Equity
MainStay Candriam Emerging Markets Equity Fund
MainStay MacKay Emerging Markets Equity Fund
Global Equity
MainStay Epoch Capital Growth Fund
MainStay Epoch Global Equity Yield Fund
Fixed Income
Taxable Income
MainStay Floating Rate Fund
MainStay Indexed Bond Fund
MainStay MacKay Emerging Markets Debt Fund2
MainStay MacKay High Yield Corporate Bond Fund
MainStay MacKay Infrastructure Bond Fund3
MainStay MacKay Short Duration High Yield Fund
MainStay MacKay Total Return Bond Fund
MainStay MacKay Unconstrained Bond Fund
Tax-Exempt Income
MainStay MacKay California Tax Free Opportunities Fund4
MainStay MacKay High Yield Municipal Bond Fund
MainStay MacKay New York Tax Free Opportunities Fund5
MainStay MacKay Short Term Municipal Fund6
MainStay MacKay Tax Free Bond Fund
Money Market
MainStay Money Market Fund
Mixed Asset
MainStay Balanced Fund
MainStay Income Builder Fund
MainStay MacKay Convertible Fund
Speciality
MainStay Cushing Energy Income Fund
MainStay Cushing MLP Premier Fund
MainStay Cushing Renaissance Advantage Fund
Asset Allocation/Target Date7
MainStay Conservative Allocation Fund
MainStay Growth Allocation Fund
MainStay Moderate Allocation Fund
MainStay Moderate Growth Allocation Fund
MainStay Retirement 2010 Fund
MainStay Retirement 2020 Fund
MainStay Retirement 2030 Fund
MainStay Retirement 2040 Fund
MainStay Retirement 2050 Fund
MainStay Retirement 2060 Fund
Manager
New York Life Investment Management LLC
New York, New York
Subadvisors
Candriam Belgium S.A.8
Brussels, Belgium
Candriam Luxembourg S.C.A.8
Strassen, Luxembourg
Cushing Asset Management, LP
Dallas, Texas
Epoch Investment Partners, Inc.
New York, New York
MacKay Shields LLC8
New York, New York
Markston International LLC
White Plains, New York
NYL Investors LLC8
New York, New York
Winslow Capital Management, LLC
Minneapolis, Minnesota
Legal Counsel
Dechert LLP
Washington, District of Columbia
Independent Registered Public Accounting Firm
KPMG LLP
Philadelphia, Pennsylvania
| 1. | Formerly known as MainStay Epoch U.S. Small Cap Fund. |
| 2. | Effective June 21, 2019, MainStay MacKay Emerging Markets Debt Fund was renamed MainStay Candriam Emerging Markets Debt Fund. |
| 3. | Formerly known as MainStay MacKay Government Fund. |
| 4. | Class A and Class I shares of this Fund are registered for sale in AZ, CA, MI, NV, OR, TX, UT and WA. Class I shares are registered for sale in CO, FL, GA, HI, ID, MA, MD, NH, NJ and NY. |
| 5. | This Fund is registered for sale in CA, CT, DE, FL, MA, NJ, NY and VT. |
| 6. | Formerly known as MainStay MacKay Tax Advantaged Short Term Bond Fund. |
| 7. | Effective June 14, 2019, each MainStay Retirement Fund merged into a respective acquiring MainStay Asset Allocation Fund. |
| 8. | An affiliate of New York Life Investment Management LLC. |
Not part of the Annual Report
For more information
800-624-6782
nylinvestments.com/funds
New York Life Investments is a service mark and name under which New York Life Investment Management LLC does business. New York Life Investments, an indirect subsidiary of New York Life Insurance Company, New York, NY 10010, provides investment advisory products and services. The MainStay Funds® are managed by New York Life Investment Management LLC and distributed by NYLIFE Distributors LLC, 30 Hudson Street, Jersey City, NJ 07302, a wholly owned subsidiary of New York Life Insurance Company. NYLIFE Distributors LLC is a Member FINRA/SIPC.
This report may be distributed only when preceded or accompanied by a current Fund prospectus.
©2019 NYLIFE Distributors LLC. All rights reserved.
| 1737605 MS065-19 | MSTAS11-06/19 (NYLIM) NL230 |
Item 2. Code of Ethics.
As of the end of the period covered by this report, the Registrant has adopted a code of ethics (the “Code”) that applies to the Registrant’s principal executive officer (“PEO”) and principal financial officer (“PFO”). A copy of the Code is filed herewith. The Registrant did not grant any waivers, including implicit waivers, from any provisions of the Code to the PEO or PFO during the period covered by this report.
| Item 3. | Audit Committee Financial Expert. |
The Board of Trustees has determined that the Registrant has three audit committee financial experts serving on its Audit Committee. The Audit Committee financial experts are Alan R. Latshaw, David H. Chow and Susan B. Kerley. Mr. Latshaw, Mr. Chow and Ms. Kerley are “independent” as defined by Item 3 of FormN-CSR.
| Item 4. | Principal Accountant Fees and Services. |
(a) Audit Fees
The aggregate fees billed for the fiscal year ended April 30, 2019 for professional services rendered by KPMG LLP (“KPMG”) for the audit of the Registrant’s annual financial statements or services that are normally provided by KPMG in connection with statutory and regulatory filings or engagements for that fiscal year were $63,700.
The aggregate fees billed for the fiscal year ended April 30, 2018 for professional services rendered by KPMG LLP (“KPMG”) for the audit of the Registrant’s annual financial statements or services that are normally provided by KPMG in connection with statutory and regulatory filings or engagements for that fiscal year were $52,300.
(b) Audit-Related Fees
The aggregate fees billed for assurance and related services by KPMG that are reasonably related to the performance of the audit of the Registrant’s financial statements and are not reported under paragraph (a) of this Item were $0 for the fiscal year ended April 30, 2019; and (ii) $0 for the fiscal year ended April 30, 2018. These audit-related services include review of financial highlights for Registrant’s registration statements and issuance of consents to use the auditor’s reports.
(c) Tax Fees
The aggregate fees billed for professional services rendered by KPMG for tax compliance, tax advice, and tax planning were $0 during the fiscal year ended April 30, 2019; and (ii) $0 during the fiscal year ended April 30, 2018. These services primarily included preparation of federal, state and local income tax returns and excise tax returns, as well as services relating to excise tax distribution requirements.
(d) All Other Fees
The aggregate fees billed for products and services provided by KPMG, other than the services reported in paragraphs (a) through (c) of this Item were $0 during the fiscal year ended April 30, 2019; and $0 during the fiscal year ended April 30, 2018.
(e) Pre-Approval Policies and Procedures
| (1) | The Registrant’s Audit Committee has adoptedpre-approval policies and procedures (the “Procedures”) to govern the Committee’spre-approval of (i) all audit services and permissiblenon-audit services to be provided to the Registrant by its independent accountant, and (ii) all permissiblenon-audit services to be provided by such independent accountant to the Registrant’s investment adviser and to any entity controlling, controlled by or under common control with the investment adviser that provides ongoing services to the Registrant (collectively, the “Service Affiliates”) if the services directly relate to the Registrant’s operations and financial reporting. In accordance with the Procedures, the Audit Committee is responsible for the engagement of the independent accountant to certify the Registrant’s financial statements for each fiscal year. With respect to thepre-approval ofnon-audit services provided to the Registrant and its Service Affiliates, the Procedures provide that the Audit Committee may annuallypre-approve a list of the types of services that may be provided to the Registrant or its Service Affiliates, or the Audit Committee maypre-approve such services on aproject-by-project basis as they arise. Unless a type of service has received generalpre-approval, it will require specificpre-approval by the Audit Committee if it is to be provided by the independent accountant. The Procedures also permit the Audit Committee to delegate authority to one or more of its members topre-approve any proposednon-audit services that have not been previouslypre-approved by the Audit Committee, subject to the ratification by the full Audit Committee no later than its next scheduled meeting. To date, the Audit Committee has not delegated such authority. |
| (2) | With respect to the services described in paragraphs (b) through (d) of this Item 4, no amount was approved by the Audit Committee pursuant to paragraph (c)(7)(i)(C) of Rule2-01 of RegulationS-X. |
(f) There were no hours expended on KPMG’s engagement to audit the Registrant’s financial statements for the most recent fiscal year was attributable to work performed by persons other than KPMG’s full-time, permanent employees.
(g) Allnon-audit fees billed by KPMG for services rendered to the Registrant for the fiscal years ended April 30, 2019 and April 30, 2018 are disclosed in 4(b)-(d) above.
The aggregatenon-audit fees billed by KPMG for services rendered to the Registrant’s investment adviser (not including anysub-adviser whose role is primarily portfolio management and is subcontracted with or overseen by another investment adviser), and any entity controlling, controlled by, or under common control with the adviser that provides ongoing services to the Registrant were approximately $0 for the fiscal year ended April 30, 2019; and $0 for the fiscal year ended April 30, 2018.
(h) The Registrant’s Audit Committee has determined that thenon-audit services rendered by KPMG for the fiscal year ended April 30, 2019 to the Registrant’s investment adviser and any entity controlling, controlled by, or under common control with the Registrant’s investment adviser that provides ongoing services to the Registrant that were not required to bepre-approved by the Audit Committee because they did not relate directly to the operations and financial reporting of the registrant were compatible with maintaining the respective independence of KPMG during the relevant time period.
| Item 5. | Audit Committee of Listed Registrants |
Not applicable.
| Item 6. | Schedule of Investments |
The Schedule of Investments is included as part of Item 1 of this report.
| Item 7. | Disclosure of Proxy Voting Policies and Procedures forClosed-End Management Investment Companies. |
Not applicable.
| Item 8. | Portfolio Managers ofClosed-End Management Investment Companies. |
Not applicable.
| Item 9. | Purchases of Equity Securities byClosed-End Management Investment Company and Affiliated Purchasers. |
Not Applicable.
| Item 10. | Submission of Matters to a Vote of Security Holders. |
Since the Registrant’s last response to this Item, there have been no material changes to the procedures by which shareholders may recommend nominees to the Registrant’s Board of Trustees.
Item 11. Controls and Procedures.
(a) Based on an evaluation of the Registrant’s Disclosure Controls and Procedures (as defined in Rule30a-3(c) under the Investment Company Act of 1940) (the “Disclosure Controls”), as of a date within 90 days prior to the filing date (the “Filing Date”) of this FormN-CSR (the “Report”), the Registrant’s principal executive officer and principal financial officer have concluded that the Disclosure Controls are reasonably designed to ensure that information required to be disclosed by the Registrant in the Report is recorded, processed, summarized and reported by the Filing Date, including ensuring that information required to be disclosed in the Report is accumulated and communicated to the Registrant’s management, including the Registrant’s principal executive officer and principal financial officer, as appropriate to allow timely decisions regarding required disclosure.
(b) There were no changes in the Registrant’s internal control over financial reporting (as defined in Rule30a-3(d)) under the Investment Company Act of 1940 that occurred during the second fiscal quarter of the period covered by this report that has materially affected, or is reasonably likely to materially affect, the Registrant’s internal control over financial reporting.
Item 12. Exhibits.
| (a)(1) | Code of Ethics | |
| (a)(2) | Certifications of principal executive officer and principal financial officer as required by Rule30a-2 under the Investment Company Act of 1940. | |
| (b) | Certifications of principal executive officer and principal financial officer as required by Section 906 of the Sarbanes-Oxley Act of 2002. | |
SIGNATURES
Pursuant to the requirements of the Securities Exchange Act of 1934 and the Investment Company Act of 1940, the Registrant has duly caused this Report to be signed on its behalf by the undersigned, thereunto duly authorized.
MAINSTAY FUNDS TRUST
| By: | /s/ Kirk C. Lehneis | |
Kirk C. Lehneis | ||
President and Principal Executive Officer | ||
Date: | July 2, 2019 | |
Pursuant to the requirements of the Securities Exchange Act of 1934 and the Investment Company Act of 1940, this Report has been signed below by the following persons on behalf of the Registrant and in the capacities and on the dates indicated.
| By: | /s/ Kirk C. Lehneis | |
Kirk C. Lehneis | ||
President and Principal Executive Officer | ||
Date: | July 2, 2019 | |
| By: | /s/ Jack R. Benintende | |
Jack R. Benintende | ||
Treasurer and Principal Financial and Accounting Officer | ||
Date: | July 2, 2019 | |
EXHIBIT INDEX
| (a)(1) | Code of Ethics | |
| (a)(2) | Certifications of principal executive officer and principal financial officer as required by Rule30a-2 under the Investment Company Act of 1940. | |
| (b) | Certification of principal executive officer and principal financial officer as required by Section 906 of the Sarbanes-Oxley Act of 2002. | |