UNITED STATES
SECURITIES AND EXCHANGE COMMISSION
Washington, D.C. 20549
FormN-CSR
CERTIFIED SHAREHOLDER REPORT OF REGISTERED MANAGEMENT
INVESTMENT COMPANIES
Investment Company Act File Number811-22321
MAINSTAY FUNDS TRUST
(Exact name of Registrant as specified in charter)
51 Madison Avenue, New York, NY 10010
(Address of principal executive offices) (Zip code)
J. Kevin Gao, Esq.
30 Hudson Street
Jersey City, New Jersey 07302
(Name and address of agent for service)
Registrant’s telephone number, including area code: (212)576-7000
Date of fiscal year end: November 30
(MainStay Cushing MLP Premier Fund, MainStay Cushing Renaissance Advantage Fund and MainStay Cushing Energy Income Fund only)
Date of reporting period: November 30, 2019
FORMN-CSR
The information presented in this FormN-CSR relates solely to the
MainStay Cushing MLP Premier Fund, MainStay Cushing Renaissance Advantage Fund and MainStay
Cushing Energy Income Fund, each a series of the Registrant.
| Item 1. | Reports to Stockholders. |
MainStay Cushing® Funds
Message from the President and Annual Report
November 30, 2019

MainStay Cushing® Energy Income Fund
MainStay Cushing® MLP Premier Fund
MainStay Cushing® Renaissance Advantage Fund
Beginning on January 1, 2021, paper copies of MainStay Fund annual and semiannual shareholder reports will no longer be sent by mail, unless you specifically request paper copies of the reports from MainStay Funds or from your financial intermediary. Instead, the reports will be made available on the MainStay Funds’ website. You will be notified by mail and provided with a website address to access the report each time a new report is posted to the website.
If you already elected to receive shareholder reports electronically, you will not be affected by this change and you need not take any action. At any time, you may elect to receive reports and other communications from MainStay Funds electronically by calling toll-free 800-624-6782, by sending an e-mail to MainStayShareholderServices@nylim.com, or by contacting your financial intermediary.
You may elect to receive all future shareholder reports in paper form free of charge. If you hold shares of a MainStay Fund directly, you can inform MainStay Funds that you wish to receive paper copies of reports by calling toll-free 800-624-6782 or by sending an e-mail to MainStayShareholderServices@nylim.com. If you hold shares of a MainStay Fund through a financial intermediary, please contact the financial intermediary to make this election. Your election to receive reports in paper form will apply to all MainStay Funds in which you are invested and may apply to all funds held with your financial intermediary.
| Not FDIC/NCUA Insured | Not a Deposit | May Lose Value | No Bank Guarantee | Not Insured by Any Government Agency | ||||

This page intentionally left blank
Message from the President
Amid high levels of volatility, most U.S. and international stocks and bonds gained ground during the 12 months ended November 30, 2019.
U.S. equities led most of the developed world’s markets higher, bolstered by continued economic gains as the United States marked its 10th consecutive year of expansion, making this the longest period of sustained growth in the nation’s history. However, the reporting period was not without challenges. Equities and equity-sensitive bonds fell sharply in December 2018 due to recessionary fears, a U.S. government shutdown and the potential impact of trade disputes between the United States and other nations, particularly China. Markets recovered quickly in early 2019 as trade tensions eased, the government reopened and the U.S. Federal Reserve Board (“Fed”) adopted a more patient tone regarding the future direction of interest rates.
A wide spectrum of equity and fixed-income sectors gained ground through April 2019. Mixed macroeconomic signals and the inability of China and the United States to reach a trade agreement caused the market’s recovery to falter during the spring and summer of 2019. However, accommodative monetary policies from several central banks, including a series of interest rate cuts by the Fed, reassured investors and enabled markets to resume their advance. Increasingly risk-on investor sentiment was further supported by strong levels of consumer confidence backed by rising wages and declining unemployment levels. Major U.S. equity indices repeatedly set new records during the ensuing months, with large-cap stocks outperforming their smaller-cap counterparts. Cyclical and value-oriented equities, which had underperformed earlier in 2019, largely caught up with growth-oriented issues between September and late November 2019, finishing with generally similar gains.
Bond prices, which generally respond inversely to interest rates, rose as the Fed reversed most of the rate hike it had implemented in the prior year, lowering the benchmark federal funds rate three times during the reporting period, from 2.25%
to 1.50%. Prices soared as yields dropped for long-term investment-grade corporate and Treasury bonds, while shorter-term and higher-yielding instruments delivered more modest price increases.
For the 12-month reporting period, the information technology sector led the large-cap S&P 500® Index, with communications and real estate stocks also delivering above-average performance. The utilities, industrials, financials, consumer discretionary and consumer staples sectors lagged slightly behind the S&P 500® Index while still delivering double-digit gains. The materials and health care sectors underperformed the S&P 500® Index by a larger margin but still produced positive returns. Only the energy sector suffered absolute declines. Although the price for a barrel of benchmark West Texas crude oil climbed modestly from $52.95 at the beginning of the reporting period to $55.17 on November 30, 2019, energy stocks remained under pressure from increased U.S. production, the industry’s high debt levels and concerns about future global energy demand at a time of sluggish economic growth in most of the developed and developing world. Stocks of energy equipment and services providers, particularly drilling companies, suffered the steepest losses, hurt by spending cutbacks from oil producers.
The annual report that follows contains additional information on the market events, investment decisions and specific securities that shaped your Fund’s performance during the 12 months ended November 30, 2019. We encourage you to read it carefully.
Sincerely,

Kirk C. Lehneis
President
The opinions expressed are as of the date of this report and are subject to change. There is no guarantee that any forecast made will come to pass. This material does not constitute investment advice and is not intended as an endorsement of any specific investment. Past performance is no guarantee of future results.
Not part of the Annual Report
Investors should refer to each Fund’s Summary Prospectus and/or Prospectus and consider each Fund’s investment objectives, strategies, risks, charges and expenses carefully before investing. The Summary Prospectus and/or Prospectus contain this and other information about each Fund. You may obtain copies of each Fund’s Summary Prospectus, Prospectus and Statement of Additional Information free of charge, upon request, by calling toll-free800-624-6782, by writing to NYLIFE Distributors LLC, Attn: MainStay Marketing Department, 30 Hudson Street, Jersey City, New Jersey 07302 or by sending ane-mail to MainStayShareholderServices@nylim.com. These documents are also available via the MainStay Funds’ website at nylinvestments.com/funds. Please read each Summary Prospectus and/or Prospectus carefully before investing.
MainStay Cushing Energy Income Fund
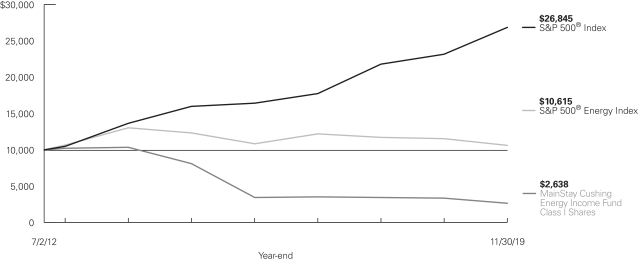
Investment and Performance Comparison1(Unaudited)
Performance data quoted represents past performance. Past performance is no guarantee of future results. Because of market volatility and other factors, current performance may be lower or higher than the figures shown. Investment return and principal value will fluctuate, and as a result, when shares are redeemed, they may be worth more or less than their original cost. The graph below depicts the historical performance of Class I shares of the Fund. Performance will vary from class to class based on differences in class-specific expenses and sales charges. For performance information current to the most recent month-end, please call800-624-6782 or visit nylinvestments.com/funds.
Average Annual Total Returns for the Year Ended November 30, 2019
| Class | Sales Charge | Inception Date | One Year | Five Years | Since Inception | Gross Expense | ||||||||||||||||||
| Class A Shares3 | Maximum 5.5% Initial Sales Charge | With sales charge Excluding sales charge | 7/2/2012 | | –25.30 –20.96 | %
| | –21.16 –20.26 | %
| | –17.30 –16.66 | %
| | 1.69 1.69 | %
| |||||||||
| Investor Class Shares | Maximum 5.5% Initial Sales Charge | With sales charge Excluding sales charge | 7/11/2014 | | –25.25 –20.90 |
| | –21.25 –20.35 |
| | –24.80 –24.01 |
| | 1.84 1.84 |
| |||||||||
| Class C Shares3 | Maximum 1% CDSC if Redeemed Within One Year of Purchase | With sales charge Excluding sales charge | | 7/2/2012 | | | –22.51 –21.76 |
| | –20.97 –20.97 |
| | –17.36 –17.36 |
| | 2.59 2.59 |
| |||||||
| Class I Shares3 | No Sales Charge | 7/2/2012 | –20.72 | –20.05 | –16.45 | 1.44 | ||||||||||||||||||
| 1. | The performance table and graph do not reflect the deduction of taxes that a shareholder would pay on distributions or Fund share redemptions. Total returns reflect maximum applicable sales charges as indicated in the table above, if any, changes in share price, and reinvestment of dividend and capital gain distributions. The graph assumes the initial investment amount shown above and reflects the deduction of all sales charges that would have applied for the period of investment. Performance figures may reflect certain fee waivers and/or expense limitations, without which total returns may have been lower. For more information on share classes and current fee waivers and/or expense limitations (if any), please refer to the Notes to Financial Statements. |
| 2. | The gross expense ratios presented reflect the Fund’s “Total Annual Fund Operating Expenses” from the most recent Prospectus and may differ from other expense ratios disclosed in this report. |
| 3. | Performance figures for Class A shares, Class C shares and Class I shares reflect the historical performance of the then-existing Class A shares, Class C shares and Class I shares, respectively, of the Cushing® Energy Income Fund (the predecessor to the Fund, which was subject to a different fee structure) for periods prior to July 12, 2014. The Cushing® Energy Income Fund commenced operations on July 2, 2012. |
The footnotes on the next page are an integral part of the table and graph and should be carefully read in conjunction with them.
| 5 |
| Benchmark Performance | One Year | Five Years | Since Inception | |||||||||
S&P 500® Index4 | 16.11 | % | 10.98 | % | 14.25 | % | ||||||
S&P 500® Energy Index5 | –7.90 | –2.90 | 0.81 | |||||||||
Morningstar Equity Energy Category Average6 | –17.27 | –9.64 | –4.64 | |||||||||
| 4. | The S&P 500® Index is the Fund’s primary benchmark. “S&P 500®” is a trademark of The McGraw-Hill Companies, Inc. The S&P 500® Index is widely regarded as the standard index for measuring large-cap U.S. stock market performance. Results assume reinvestment of all dividends and capital gains. An investment cannot be made directly in an index. |
| 5. | The S&P 500® Energy Index is the Fund’s secondary benchmark. The S&P 500® Energy Index comprises those companies included in the S&P 500® Index that are classified as members of the GICS® Energy Sector. |
| 6. | The Morningstar Equity Energy Category Average is representative of funds that invest primarily in equity securities of U.S. or non-U.S. companies who conduct business primarily in energy-related industries. This includes and is not limited to companies in alternative energy, coal, exploration, oil and gas services, pipelines, natural gas services, and refineries. Results are based on average total returns of similar funds with all dividends and capital gain distributions reinvested. |
The footnotes on the preceding page are an integral part of the table and graph and should be carefully read in conjunction with them.
| 6 | MainStay Cushing Energy Income Fund |
Cost in Dollars of a $1,000 Investment in MainStay Cushing Energy Income Fund (Unaudited)
The example below is intended to describe the fees and expenses borne by shareholders during thesix-month period from June 1, 2019, to November 30, 2019, and the impact of those costs on your investment.
Example
As a shareholder of the Fund, you incur two types of costs: (1) transaction costs, including exchange fees and sales charges (loads) on purchases (as applicable), and (2) ongoing costs, including management fees, distribution and/or service(12b-1) fees, and other Fund expenses (as applicable). This example is intended to help you understand your ongoing costs (in dollars) of investing in the Fund and to compare these costs with the ongoing costs of investing in other mutual funds. The example is based on an investment of $1,000 made at the beginning of thesix-month period and held for the entire period from June 1, 2019, to November 30, 2019.
This example illustrates your Fund’s ongoing costs in two ways:
Actual Expenses
The second and third data columns in the table below provide information about actual account values and actual expenses. You may use the information in these columns, together with the amount you invested, to estimate the expenses that you paid during the six months ended November 30, 2019. Simply divide your account value by $1,000 (for example, an $8,600 account value divided by $1,000 = 8.6), then
multiply the result by the number under the heading entitled “Expenses Paid During Period” to estimate the expenses you paid on your account during this period.
Hypothetical Example for Comparison Purposes
The fourth and fifth data columns in the table below provide information about hypothetical account values and hypothetical expenses based on the Fund’s actual expense ratio and an assumed rate of return of 5% per year before expenses, which is not the Fund’s actual return. The hypothetical account values and expenses may not be used to estimate the actual ending account balances or expenses you paid forthe six-month period shown. You may use this information to compare the ongoing costs of investing in the Fund with the ongoing costs of investing in other mutual funds. To do so, compare this 5% hypothetical example with the 5% hypothetical examples that appear in the shareholder reports of the other Funds.
Please note that the expenses shown in the table are meant to highlight your ongoing costs only and do not reflect any transactional costs, such as exchange fees or sales charges (loads). Therefore, the fourth and fifth data columns of the table are useful in comparing ongoing costs only and will not help you determine the relative total costs of owning different funds. In addition, if these transactional costs were included, your costs would have been higher.
| Share Class | Beginning Value | Ending Account Value (Based | Expenses During | Ending Account Value (Based on Hypothetical 5% Annualized Return and Actual Expenses) 11/30/19 | Expenses During | Net Expense Ratio During Period2 | ||||||||||||||||
| Class A Shares | $ | 1,000.00 | $ | 895.00 | $ | 6.89 | $ | 1,017.80 | $ | 7.33 | 1.45% | |||||||||||
| Investor Class Shares | $ | 1,000.00 | $ | 893.90 | $ | 7.22 | $ | 1,017.45 | $ | 7.69 | 1.52% | |||||||||||
| Class C Shares | $ | 1,000.00 | $ | 889.20 | $ | 10.75 | $ | 1,013.69 | $ | 11.46 | 2.27% | |||||||||||
| Class I Shares | $ | 1,000.00 | $ | 895.00 | $ | 5.70 | $ | 1,019.05 | $ | 6.07 | 1.20% | |||||||||||
| 1. | Expenses are equal to the Fund’s annualized expense ratio of each class multiplied by the average account value over the period, divided by 365 and multiplied by 183 (to reflect thesix-month period). The table above represents the actual expenses incurred during thesix-month period. |
| 2. | Expenses are equal to the Fund’s annualized expense ratio to reflect thesix-month period. |
| 7 |
Portfolio Composition as of November 30, 2019(1)(Unaudited)

See Portfolio of Investments beginning on page 10 for specific holdings within these categories.
Top Ten Holdings as of November 30, 2019(excluding short-term investments) (Unaudited)
| 1. | Total S.A. |
| 2. | BP PLC |
| 3. | Chevron Corporation |
| 4. | ONEOK, Inc. |
| 5. | Targa Resources Corporation |
| 6. | EOG Resources, Inc. |
| 7. | Viper Energy Partners, L.P. |
| 8. | DCP Midstream Partners, L.P. |
| 9. | Kimbell Royalty Partners, L.P. |
| 10. | Cabot Oil & Gas Corporation |
| (1) | Fund holdings and sector allocations are subject to change, and there is no assurance that the Fund will continue to hold any particular security. |
| (2) | MLP Investments and Related Companies |
| (3) | Common Stocks |
| (4) | Fixed Income |
| (5) | Rights |
| 8 | MainStay Cushing Energy Income Fund |
Portfolio Management Discussion and Analysis(Unaudited)
Questions answered by portfolio managers Jerry V. Swank, Matthew A. Lemme, CFA,1 and Nick English of Cushing Asset Management, LP, the Fund’s Subadvisor.
How did MainStay Cushing Energy Income Fund perform relative to its benchmarks and peer group during the 12 months ended November 30, 2019?
For the 12 months ended November 30, 2019, Class I shares of MainStay Cushing Energy Income Fund returned –20.72%, underperforming the 16.11% return of the Fund’s primary benchmark, the S&P 500® Index. Over the same period, Class I shares underperformed the –7.90% return of the S&P 500® Energy Index, which is the Fund’s secondary benchmark, and the –17.27% return of the Morningstar Equity Energy Category Average.2
Were there any changes to the Fund?
At a meeting held on December 10-11, 2019, the Board approved an Agreement and Plan of Reorganization (“Plan of Reorganization”) with respect to MainStay Cushing Energy Income Fund, which provides for the reorganization of the Fund with and into MainStay CBRE Global Infrastructure Fund. This Plan of Reorganization is subject to approval by shareholders at a special meeting expected to be held on or about April 27, 2020. (See Note 11—Subsequent Events.)
What factors affected the Fund’s relative performance during the reporting period?
The Fund’s investment program is focused exclusively on investments in companies involved in the energy sector, while its primary benchmark, the S&P 500® Index, tracks the performance of stocks in a wide variety of sectors. During the reporting period, negative investor sentiment towards the energy sector was primarily responsible for the Fund’s underperformance relative to the Index. Investor concerns were prompted by lower growth guidance from energy companies as issuers increasingly focused on operating within cash flows.
During the reporting period, which subsectors were the strongest positive contributors to the Fund’s relative performance and which subsectors were particularly weak?
The subsector providing the strongest positive contribution to the Fund’s relative performance during the reporting period was integrated oil. (Contributions take weightings and total returns into account.) The weakest contributing subsector was exploration & production (“E&P”). The Fund’s allocation to energy bonds also detracted from relative performance.
During the reporting period, which individual stocks made the strongest positive contributions to the Fund’s absolute performance and which stocks detracted the most?
The holdings making the strongest contributions to the Fund’s absolute performance during the reporting period included oil & gas storage & transportation company ONEOK, Inc.; integrated oil & gas company Royal Dutch Shell PLC; and integrated oil & gas company Chevron Corporation. Investors favored all three companies due to their defensive and diversified asset bases. In addition, Royal Dutch Shell and Chevron benefited from their exposure to the refining and marketing of crude oil. In being outbid by Occidental Petroleum Corporation for the acquisition of Anadarko Petroleum, we believe Chevron further solidified its position as a company run by a conservative and defensive management team.
The most significant detractors from absolute performance during the reporting period included a Legacy Reserves, L.P., bond and equity positions in DCP Midstream Partners, L.P., and EOG Resources, Inc. Legacy Reserves filed for bankruptcy in June 2019 due to its high leverage ratio and exposure to declining crude oil prices. DCP Midstream Partners underperformed due to the drop in natural gas and natural gas liquids pricing, as well as a pullback in spending from upstream E&P companies resulting in lower industry production growth forecasts. EOG Resources suffered due to the company’s aggressive production growth target at a time when the industry focus was shifting from growth to free cash flow generation.
What were some of the Fund’s largest purchases and sales during the reporting period?
During the reporting period, the Fund’s largest purchases included shares of integrated oil & gas companies Chevron and Equinor ASA, both of which were added to the Fund because of their defensive natures and exposure to international crude oil pricing. The Fund’s largest sales during the reporting period included oil & gas storage & transportation company Energy Transfer, L.P., which announced a richly valued deal to acquire competitor SemGroup; and integrated oil & gas company Royal Dutch Shell, which appeared financially vulnerable given the company’s relatively high leverage and dividend yield.
How did the Fund’s subsector weightings change during the reporting period?
At the end of the reporting period, the Fund was overweight inlarge-cap E&P companies, midstream firms, and integrated oil companies. In contrast, the Fund held underweight exposure to Canadian E&P names, as well as transportation and upstream companies.
| 1. | Effective January 21, 2020, Matthew A. Lemme no longer serves as a portfolio manager of the Fund. |
| 2. | See page 5 for other share class returns, which may be higher or lower than Class I share returns. See page 6 for more information on benchmark and peer group returns. |
The opinions expressed are those of the portfolio managers as of the date of this report and are subject to change. There is no guarantee that any forecasts will come to pass. This material does not constitute investment advice and is not intended as an endorsement of any specific investment.
| 9 |
Portfolio of InvestmentsNovember 30, 2019
| Shares | Value | |||||||
| Common Stocks 71.6%† |
| |||||||
Exploration & Production 51.3% |
| |||||||
Canada 5.4% |
| |||||||
Suncor Energy, Inc. | 27,733 | $ | 870,816 | |||||
Vermillion Energy, Inc. | 26,937 | 388,432 | ||||||
France 7.5% | ||||||||
Total S.A. | 33,358 | 1,752,629 | ||||||
Norway 3.2% | ||||||||
Equinor ASA | 40,000 | 741,200 | ||||||
Sweden 2.0% | ||||||||
Lundin Petroleum AB | 15,000 | 462,389 | ||||||
United Kingdom 7.2% | ||||||||
BP PLC | 45,213 | 1,691,871 | ||||||
United States 26.0% | ||||||||
Cabot Oil & Gas Corporation | 57,122 | 910,525 | ||||||
Chevron Corporation | 14,000 | 1,639,820 | ||||||
EOG Resources, Inc. | 15,356 | 1,088,740 | ||||||
Noble Energy, Inc. | 37,455 | 777,566 | ||||||
Parsley Energy, Inc. | 53,649 | 803,662 | ||||||
Pioneer Natural Resource Company | 6,835 | 873,786 | ||||||
|
| |||||||
| 12,001,436 | ||||||||
|
| |||||||
Large Cap Diversified C Corps 5.2% |
| |||||||
United States 5.2% |
| |||||||
ONEOK, Inc. | 17,000 | 1,207,850 | ||||||
|
| |||||||
Natural Gas Gatherers & Processors 5.1% |
| |||||||
United States 5.1% |
| |||||||
Targa Resources Corporation | 32,582 | 1,190,220 | ||||||
|
| |||||||
Oil & Gas Exploration & Production 6.2% |
| |||||||
United States 6.2% |
| |||||||
ConocoPhillips Company | 12,000 | 719,280 | ||||||
Diamondback Energy, Inc. | 9,429 | 729,239 | ||||||
|
| |||||||
| 1,448,519 | ||||||||
|
| |||||||
Oil & Gas Refining & Marketing 3.8% | ||||||||
United States 3.8% | ||||||||
WPX Energy, Inc. (a) | 91,000 | 895,440 | ||||||
|
| |||||||
Total Common Stocks | 16,743,465 | |||||||
|
| |||||||
| MLP Investments and Related Companies 17.9% |
| |||||||
Marine 2.7% |
| |||||||
Republic of the Marshall Islands 2.7% |
| |||||||
GasLog Partners, L.P. | 43,698 | 635,806 | ||||||
|
| |||||||
Natural Gas Gatherers & Processors 4.1% |
| |||||||
United States 4.1% |
| |||||||
DCP Midstream Partners, L.P. | 45,000 | 949,950 | ||||||
|
| |||||||
| Shares | Value | |||||||
Natural Gas Transportation & Storage 2.5% |
| |||||||
United States 2.5% |
| |||||||
EQM Midstream Partners, L.P. | 25,151 | $ | 582,748 | |||||
|
| |||||||
Upstream MLPs 8.6% |
| |||||||
United States 8.6% |
| |||||||
Kimbell Royalty Partners, L.P. | 65,900 | 948,960 | ||||||
Mid-Con Energy Partners, L.P. (a)(b)(c) | 348,837 | 82,744 | ||||||
Viper Energy Partners, L.P. | 41,169 | 976,529 | ||||||
|
| |||||||
| 2,008,233 | ||||||||
|
| |||||||
Total MLP Investments and Related Companies | 4,176,737 | |||||||
|
| |||||||
| Principal Amount | ||||||||
| Fixed Income 4.5% |
| |||||||
Exploration & Production 4.0% |
| |||||||
United States 4.0% |
| |||||||
HighPoint Resources | 500,000 | 457,656 | ||||||
QEP Resources, Inc. | 500,000 | 454,988 | ||||||
|
| |||||||
| 912,644 | ||||||||
|
| |||||||
Oil & Gas Exploration & Production 0.3% |
| |||||||
United States 0.3% |
| |||||||
Sanchez Energy Corporation | 2,000,000 | 80,000 | ||||||
|
| |||||||
Upstream MLPs 0.2% |
| |||||||
United States 0.2% |
| |||||||
Legacy Reserves, L.P. (b)(d) | 1,500,000 | 52,500 | ||||||
|
| |||||||
Total Fixed Income | 1,045,144 | |||||||
|
| |||||||
| Number of Rights | ||||||||
| Rights 1.0% |
| |||||||
Upstream MLPs 1.0% |
| |||||||
United States 1.0% |
| |||||||
Legacy Reserves, L.P. (b)(c)(d) | 22,253 | 222,530 | ||||||
|
| |||||||
Total Rights | 222,530 | |||||||
|
| |||||||
| 10 | MainStay Cushing Energy Income Fund | The notes to the financial statements are an integral part of, and should be read in conjunction with, the financial statements. |
| Shares | Value | |||||||
| Short-Term Investments—Investment Companies 4.2% |
| |||||||
United States 4.2% |
| |||||||
First American Government Obligations Fund—Class X, 1.56% (e) | 486,216 | $ | 486,216 | |||||
First American Treasury Obligations Fund—Class X, 1.59% (e) | 486,217 | 486,217 | ||||||
|
| |||||||
Total Short-Term Investments—Investment Companies |
| 972,433 | ||||||
|
| |||||||
Total Investments | 99.2 | % | 23,160,309 | |||||
Other Assets, Less Liabilities | 0.8 | 192,487 | ||||||
Net Assets | 100.0 | % | $ | 23,352,796 | ||||
| † | Calculated as a percentage of net assets applicable to common shareholders. |
| (a) | Non-income producing security. |
| (b) | Illiquid Investment—As of November 30, 2019, the total market value of these illiquid investments was $357,774, which represented 1.5% of the Fund’s net assets. (Unaudited) |
| (c) | Fair Value Security—represents fair value measured in good faith under procedures approved by the Board of Trustees. As of November 30, 2019, the total market value of these securities was $305,274, which represented. 1.3% of the Fund’s net assets. |
| (d) | Issue in default. |
| (e) | Current yield as of November 30, 2019. |
The following is a summary of the fair valuations according to the inputs used as of November 30, 2019, for valuing the Fund’s assets.
Description | Quoted Prices in Active Markets for Identical Assets (Level 1) | Significant Other Observable Inputs (Level 2) | Significant Unobservable Inputs (Level 3) | Total | ||||||||||||
Asset Valuation Inputs | ||||||||||||||||
| Investments in Securities (a) | ||||||||||||||||
Common Stocks | $ | 16,743,465 | $ | — | $ | — | $ | 16,743,465 | ||||||||
MLP Investments and Related Companies | 4,176,737 | — | — | 4,176,737 | ||||||||||||
Fixed Income | — | 1,045,144 | — | 1,045,144 | ||||||||||||
Rights | — | 222,530 | — | 222,530 | ||||||||||||
Short-Term Investments—Investment Companies | 972,433 | — | — | 972,433 | ||||||||||||
|
|
|
|
|
|
|
| |||||||||
| Total Investments in Securities | $ | 21,892,635 | $ | 1,267,674 | $ | — | $ | 23,160,309 | ||||||||
|
|
|
|
|
|
|
| |||||||||
| (a) | For a complete listing of investments and their industries, see the Portfolio of Investments. |
| The notes to the financial statements are an integral part of, and should be read in conjunction with, the financial statements. | 11 |
Statement of Assets and Liabilitiesas of November 30, 2019
| Assets | ||||
Investments, at value | $ | 23,160,309 | ||
Receivables: | ||||
Fund shares sold | 258,459 | |||
Dividends and interest | 74,654 | |||
Prepaid expenses | 53,234 | |||
|
| |||
Total assets | 23,546,656 | |||
|
| |||
| Liabilities | ||||
Payables: | ||||
Investments purchased | 115,222 | |||
Manager fees (See Note 3) | 21,178 | |||
Transfer agent (See Note 3) | 18,666 | |||
Professional fees | 15,272 | |||
Shareholder communication | 7,723 | |||
NYLIFE Distributors (See Note 3) | 7,562 | |||
Fund shares redeemed | 6,599 | |||
Dividends payable | 699 | |||
Trustees | 368 | |||
Custodian | 302 | |||
Accrued expenses | 269 | |||
|
| |||
Total liabilities | 193,860 | |||
|
| |||
Net assets | $ | 23,352,796 | ||
|
| |||
| Composition of Net Assets | ||||
Shares of beneficial interest outstanding (par value of $.001 per share) unlimited number of shares authorized | $ | 7,926 | ||
Additionalpaid-in capital | 263,823,316 | |||
|
| |||
| 263,831,242 | ||||
Total distributable earnings (loss) | (240,478,446 | ) | ||
|
| |||
Net assets | $ | 23,352,796 | ||
|
| |||
Class A | ||||
Net assets applicable to outstanding shares | $ | 12,765,174 | ||
|
| |||
Shares of beneficial interest outstanding | 4,295,982 | |||
|
| |||
Net asset value per share outstanding | $ | 2.97 | ||
Maximum sales charge (5.50% of offering price) | 0.17 | |||
|
| |||
Maximum offering price per share outstanding | $ | 3.14 | ||
|
| |||
Investor Class | ||||
Net assets applicable to outstanding shares | $ | 1,573,086 | ||
|
| |||
Shares of beneficial interest outstanding | 531,484 | |||
|
| |||
Net asset value per share outstanding | $ | 2.96 | ||
Maximum sales charge (5.50% of offering price) | 0.17 | |||
|
| |||
Maximum offering price per share outstanding | $ | 3.13 | ||
|
| |||
Class C | ||||
Net assets applicable to outstanding shares | $ | 5,356,669 | ||
|
| |||
Shares of beneficial interest outstanding | 1,883,882 | |||
|
| |||
Net asset value per share outstanding | $ | 2.84 | ||
|
| |||
Class I | ||||
Net assets applicable to outstanding shares | $ | 3,657,867 | ||
|
| |||
Shares of beneficial interest outstanding | 1,214,999 | |||
|
| |||
Net asset value per share outstanding | $ | 3.01 | ||
|
|
| 12 | MainStay Cushing Energy Income Fund | The notes to the financial statements are an integral part of, and should be read in conjunction with, the financial statements. |
Statement of Operationsfor the year ended November 30, 2019
| Investment Income (Loss) | ||||
Income | ||||
Dividends and distributions | $ | 355,245 | ||
Interest | 264,023 | |||
|
| |||
Total Income | 619,268 | |||
|
| |||
Expenses | ||||
Manager (See Note 3) | 283,631 | |||
Distribution/Service—Class A (See Note 3) | 42,055 | |||
Distribution/Service—Investor Class (See Note 3) | 4,552 | |||
Distribution/Service—Class C (See Note 3) | 70,449 | |||
Transfer agent (See Note 3) | 84,339 | |||
Registration | 69,015 | |||
Professional fees | 50,171 | |||
Shareholder communication | 20,852 | |||
Custodian | 2,100 | |||
Trustees | 884 | |||
Miscellaneous | 11,340 | |||
|
| |||
Total expenses before waiver/reimbursement | 639,388 | |||
Expense waiver/reimbursement from Manager (see Note 3) | (151,953 | ) | ||
|
| |||
Net expenses | 487,435 | |||
|
| |||
Net investment income (loss) | 131,833 | |||
|
| |||
| Realized and Unrealized Gain (Loss) on Investments |
| |||
Net realized gain (loss) on: | ||||
Investments | (1,121,994 | ) | ||
Foreign currency transactions | (176 | ) | ||
|
| |||
Net realized gain (loss) on investments and foreign currency transactions | (1,122,170 | ) | ||
|
| |||
Net change in unrealized appreciation (depreciation) on investments | (5,637,168 | ) | ||
|
| |||
Net realized and unrealized gain (loss) on investments | (6,759,338 | ) | ||
|
| |||
Net increase (decrease) in net assets resulting from operations | $ | (6,627,505 | ) | |
|
| |||
| (a) | Dividends and distributions recorded net of foreign withholding taxes in the amount of $43,332. |
| The notes to the financial statements are an integral part of, and should be read in conjunction with, the financial statements. | 13 |
Statements of Changes in Net Assets
| Year ended November 30, 2019 | Year ended November 30, 2018 | |||||||
| Increase (Decrease) in Net Assets |
| |||||||
Operations: | ||||||||
Net investment income (loss) | $ | 131,833 | $ | 845,723 | ||||
Net realized gain (loss) on investments and foreign currency transactions | (1,122,170 | ) | 978,408 | |||||
Net change in unrealized appreciation (depreciation) on investments | (5,637,168 | ) | (1,972,411 | ) | ||||
|
| |||||||
Net increase (decrease) in net assets resulting from operations | (6,627,505 | ) | (148,280 | ) | ||||
|
| |||||||
Distributions to shareholders: | ||||||||
Class A | — | (526,118 | ) | |||||
Investor Class | — | (49,926 | ) | |||||
Class C | — | (193,054 | ) | |||||
Class I | — | (137,018 | ) | |||||
|
| |||||||
| — | (906,116 | ) | ||||||
|
| |||||||
Distributions to shareholders from return of capital: | ||||||||
Class A | (850,811 | ) | (768,622 | ) | ||||
Investor Class | (90,650 | ) | (72,939 | ) | ||||
Class C | (305,303 | ) | (282,039 | ) | ||||
Class I | (218,797 | ) | (200,172 | ) | ||||
|
| |||||||
| (1,465,561 | ) | (1,323,772 | ) | |||||
|
| |||||||
Total distributions to shareholders | (1,465,561 | ) | (2,229,888 | ) | ||||
|
| |||||||
Capital share transactions: | ||||||||
Net proceeds from sale of shares | 8,633,941 | 4,291,030 | ||||||
Net asset value of shares issued to shareholders in reinvestment of dividends and distributions | 1,429,714 | 2,168,873 | ||||||
Cost of shares redeemed | (16,257,609 | ) | (23,360,410 | ) | ||||
|
| |||||||
Increase (decrease) in net assets derived from capital share transactions | (6,193,954 | ) | (16,900,507 | ) | ||||
|
| |||||||
Net increase (decrease) in net assets | (14,287,020 | ) | (19,278,675 | ) | ||||
| Net Assets | ||||||||
Beginning of year | 37,639,816 | 56,918,491 | ||||||
|
| |||||||
End of year | $ | 23,352,796 | $ | 37,639,816 | ||||
|
| |||||||
| 14 | MainStay Cushing Energy Income Fund | The notes to the financial statements are an integral part of, and should be read in conjunction with, the financial statements. |
Financial Highlightsselected per share data and ratios
| Year ended November 30, | ||||||||||||||||||||
| Class A | 2019 | 2018 | 2017 | 2016 | 2015 | |||||||||||||||
Net asset value at beginning of year | $ | 3.94 | $ | 4.28 | $ | 4.61 | $ | 4.96 | $ | 12.99 | ||||||||||
|
|
|
|
|
|
|
|
|
| |||||||||||
Net investment income (loss) (a) | 0.02 | 0.09 | 0.07 | 0.06 | (0.02 | ) | ||||||||||||||
Net realized and unrealized gain (loss) on investments | (0.81 | ) | (0.21 | ) | (0.20 | ) | (0.06 | ) | (7.21 | ) | ||||||||||
|
|
|
|
|
|
|
|
|
| |||||||||||
Total from investment operations | (0.79 | ) | (0.12 | ) | (0.13 | ) | 0.00 | (7.23 | ) | |||||||||||
|
|
|
|
|
|
|
|
|
| |||||||||||
| Less distributions: | ||||||||||||||||||||
From net investment income | — | (0.09 | ) | — | (0.02 | ) | — | |||||||||||||
From return of capital | (0.18 | ) | (0.13 | ) | (0.20 | ) | (0.33 | ) | (0.80 | ) | ||||||||||
|
|
|
|
|
|
|
|
|
| |||||||||||
Total dividends and distributions | (0.18 | ) | (0.22 | ) | (0.20 | ) | (0.35 | ) | (0.80 | ) | ||||||||||
|
|
|
|
|
|
|
|
|
| |||||||||||
Net asset value at end of year | $ | 2.97 | $ | 3.94 | $ | 4.28 | $ | 4.61 | $ | 4.96 | ||||||||||
|
|
|
|
|
|
|
|
|
| |||||||||||
Total investment return (b) | (20.96 | %) | (3.48 | %)(c) | (2.77 | %) | 2.17 | % | (57.56 | %) | ||||||||||
| Ratios (to average net assets)/Supplemental Data: |
| |||||||||||||||||||
Net investment income (loss) (including net deferred income tax benefit (expense)) | 0.64 | % | 1.98 | % | 1.57 | % (d) | 1.39 | %(d)(e) | (0.24 | %)(d)(e) | ||||||||||
Net investment income (loss) (excluding net deferred income tax benefit (expense)) | 0.64 | % | 1.98 | % | 1.56 | % (d) | 1.33 | %(d)(e) | (0.19 | %)(d)(e) | ||||||||||
Net expenses (including net deferred income tax (benefit) expense) (f)(g) | 1.45 | % | 1.45 | % | 1.44 | % (d) | 1.47 | %(d)(e) | 1.79 | % (d)(e) | ||||||||||
Expenses (before waiver/reimbursement, including net deferred income tax (benefit) expense) (f)(g) | 1.96 | % | 1.69 | % | 1.65 | % (d) | 1.85 | %(d)(e) | 2.04 | % (d)(e) | ||||||||||
Portfolio turnover rate | 34 | % | 32 | % | 51 | % | 64 | % | 95 | % | ||||||||||
Net assets at end of year (in 000’s) | $ | 12,765 | $ | 21,450 | $ | 30,582 | $ | 42,712 | $ | 48,885 | ||||||||||
| (a) | Per share data based on average shares outstanding during the period. |
| (b) | Total investment return is calculated exclusive of sales charges and assumes the reinvestment of dividends and distributions. For periods of less than one year, total return is not annualized. |
| (c) | Total investment return may reflect adjustments to conform to generally accepted accounting principles. |
| (d) | Ratios including/excluding net deferred income tax benefit (expense) includes applicable franchise tax expense for the period. |
For the year ended November 30, 2017, the Fund received a franchise tax refund in the amount of $10,487, of which $5,634 is attributable to Class A. |
For the year ended November 30, 2016, the Fund accrued $55,919 in franchise tax benefit, of which $29,562 is attributable to Class A. |
For the year ended November 30, 2015, the Fund accrued $(109,516) in franchise tax expense, of which $(51,919) is attributable to Class A. |
| (e) | For the year ended November 30, 2016, the Fund accrued $13,006 in net current tax expense, of which $6,919 is attributable to Class A. |
For the year ended November 30, 2015, the Fund received a tax refund in the amount of $6,000, of which $2,773 is attributable to Class A. |
| (f) | The ratio of expenses excluding net current and deferred income tax benefit to average net assets before waiver was 1.96%, 1.69%, 1.66%, 1.91% and 1.98% for the fiscal years ended November 30, 2019, 2018, 2017, 2016 and 2015, respectively. The ratio of expenses excluding deferred income tax benefit to average net assets after waiver was 1.45%, 1.45%, 1.45%, 1.53% and 1.73% for the fiscal years ended November 30, 2019, 2018, 2017, 2016 and 2015, respectively. |
| (g) | In addition to the fees and expenses which the Fund bears directly, it also indirectly bears a pro-rata share of the fees and expenses of the underlying funds in which it invests. Such indirect expenses are not included in the above expense ratios. |
| The notes to the financial statements are an integral part of, and should be read in conjunction with, the financial statements. | 15 |
Financial Highlightsselected per share data and ratios
| Year ended November 30, | ||||||||||||||||||||
| Investor Class | 2019 | 2018 | 2017 | 2016 | 2015 | |||||||||||||||
Net asset value at beginning of year | $ | 3.93 | $ | 4.26 | $ | 4.60 | $ | 4.95 | $ | 12.99 | ||||||||||
|
|
|
|
|
|
|
|
|
| |||||||||||
Net investment income (loss) (a) | 0.01 | 0.08 | 0.06 | 0.05 | (0.04 | ) | ||||||||||||||
Net realized and unrealized gain (loss) on investments | (0.81 | ) | (0.20 | ) | (0.20 | ) | (0.05 | ) | (7.20 | ) | ||||||||||
|
|
|
|
|
|
|
|
|
| |||||||||||
Total from investment operations | (0.80 | ) | (0.12 | ) | (0.14 | ) | 0.00 | (7.24 | ) | |||||||||||
|
|
|
|
|
|
|
|
|
| |||||||||||
| Less distributions: | ||||||||||||||||||||
From net investment income | — | (0.09 | ) | — | (0.02 | ) | — | |||||||||||||
From return of capital | (0.17 | ) | (0.12 | ) | (0.20 | ) | (0.33 | ) | (0.80 | ) | ||||||||||
|
|
|
|
|
|
|
|
|
| |||||||||||
Total dividends and distributions | (0.17 | ) | (0.21 | ) | (0.20 | ) | (0.35 | ) | (0.80 | ) | ||||||||||
|
|
|
|
|
|
|
|
|
| |||||||||||
Net asset value at end of year | $ | 2.96 | $ | 3.93 | $ | 4.26 | $ | 4.60 | $ | 4.95 | ||||||||||
|
|
|
|
|
|
|
|
|
| |||||||||||
Total investment return (b) | (20.90 | %) | (3.38 | %) | (3.09 | %)(c) | 1.97 | %(c) | (57.56 | %)(c) | ||||||||||
| Ratios (to average net assets)/Supplemental Data: |
| |||||||||||||||||||
Net investment income (loss) (including net deferred income tax benefit (expense)) | 0.40 | % | 1.78 | % | 1.47 | % (d) | 1.25 | %(d)(e) | (0.48 | %)(d)(e) | ||||||||||
Net investment income (loss) (excluding net deferred income tax benefit (expense)) | 0.40 | % | 1.78 | % | 1.46 | % (d) | 1.19 | %(d)(e) | (0.39 | %)(d)(e) | ||||||||||
Net expenses (including net deferred income tax (benefit) expense) (f)(g) | 1.58 | % | 1.60 | % | 1.56 | % (d) | 1.58 | %(d)(e) | 1.91 | % (d)(e) | ||||||||||
Expenses (before waiver/reimbursement, including net deferred income tax (benefit) expense) (f)(g) | 2.09 | % | 1.84 | % | 1.78 | % (d) | 1.93 | %(d)(e) | 2.24 | % (d)(e) | ||||||||||
Portfolio turnover rate | 34 | % | 32 | % | 51 | % | 64 | % | 95 | % | ||||||||||
Net assets at end of year (in 000’s) | $ | 1,573 | $ | 2,058 | $ | 2,788 | $ | 3,513 | $ | 2,554 | ||||||||||
| (a) | Per share data based on average shares outstanding during the period. |
| (b) | Total investment return is calculated exclusive of sales charges and assumes the reinvestment of dividends and distributions. For periods of less than one year, total return is not annualized. |
| (c) | Total investment return may reflect adjustments to conform to generally accepted accounting principles. |
| (d) | Ratios including/excluding net deferred income tax benefit (expense) includes applicable franchise tax expense for the period. |
For the year ended November 30, 2017, the Fund received a franchise tax refund in the amount of $10,487, of which $514 is attributable to Investor Class. |
For the year ended November 30, 2016, the Fund accrued $55,919 in franchise tax benefit, of which $2,115 is attributable to Investor Class. |
For the year ended November 30, 2015, the Fund accrued $(109,516) in franchise tax expense, of which $(2,175) is attributable to Investor Class. |
| (e) | For the year ended November 30, 2016, the Fund accrued $13,006 in net current tax expense, of which $490 is attributable to Investor Class. |
For the year ended November 30, 2015, the Fund received a tax refund in the amount of $6,000, of which $70 is attributable to Investor Class. |
| (f) | The ratio of expenses excluding net current and deferred income tax benefit to average net assets before waiver was 2.09%, 1.84%, 1.79%, 1.99% and 2.15% for the fiscal years ended November 30, 2019, 2018, 2017, 2016 and 2015, respectively. The ratio of expenses excluding deferred income tax benefit to average net assets after waiver was 1.58%, 1.60%, 1.57%, 1.64% and 1.82% for the fiscal years ended November 30, 2019, 2018, 2017, 2016 and 2015, respectively. |
| (g) | In addition to the fees and expenses which the Fund bears directly, it also indirectly bears a pro-rata share of the fees and expenses of the underlying funds in which it invests. Such indirect expenses are not included in the above expense ratios. |
| 16 | MainStay Cushing Energy Income Fund | The notes to the financial statements are an integral part of, and should be read in conjunction with, the financial statements. |
Financial Highlightsselected per share data and ratios
| Year ended November 30, | ||||||||||||||||||||
| Class C | 2019 | 2018 | 2017 | 2016 | 2015 | |||||||||||||||
Net asset value at beginning of year | $ | 3.78 | $ | 4.11 | $ | 4.44 | $ | 4.80 | $ | 12.74 | ||||||||||
|
|
|
|
|
|
|
|
|
| |||||||||||
Net investment income (loss) (a) | (0.01 | ) | 0.04 | 0.03 | 0.02 | (0.08 | ) | |||||||||||||
Net realized and unrealized gain (loss) on investments | (0.78 | ) | (0.19 | ) | (0.19 | ) | (0.05 | ) | (7.06 | ) | ||||||||||
|
|
|
|
|
|
|
|
|
| |||||||||||
Total from investment operations | (0.79 | ) | (0.15 | ) | (0.16 | ) | (0.03 | ) | (7.14 | ) | ||||||||||
|
|
|
|
|
|
|
|
|
| |||||||||||
| Less distributions: | ||||||||||||||||||||
From net investment income | — | (0.07 | ) | — | (0.02 | ) | — | |||||||||||||
From return of capital | (0.15 | ) | (0.11 | ) | (0.17 | ) | (0.31 | ) | (0.80 | ) | ||||||||||
|
|
|
|
|
|
|
|
|
| |||||||||||
Total dividends and distributions | (0.15 | ) | (0.18 | ) | (0.17 | ) | (0.33 | ) | (0.80 | ) | ||||||||||
|
|
|
|
|
|
|
|
|
| |||||||||||
Net asset value at end of year | $ | 2.84 | $ | 3.78 | $ | 4.11 | $ | 4.44 | $ | 4.80 | ||||||||||
|
|
|
|
|
|
|
|
|
| |||||||||||
Total investment return (b) | (21.76 | %) | (4.22 | %)(c) | (3.71 | %) | 1.29 | % | (57.93 | %) | ||||||||||
| Ratios (to average net assets)/Supplemental Data: |
| |||||||||||||||||||
Net investment income (loss) (including net deferred income tax benefit (expense)) | (0.24 | %) | 1.05 | % | 0.73 | %(d) | 0.53 | %(d)(e) | (1.04 | %)(d)(e) | ||||||||||
Net investment income (loss) (excluding net deferred income tax benefit (expense)) | (0.24 | %) | 1.05 | % | 0.72 | %(d) | 0.47 | %(d)(e) | (0.98 | %)(d)(e) | ||||||||||
Net expenses (including net deferred income tax (benefit) expense) (f)(g) | 2.34 | % | 2.35 | % | 2.31 | %(d) | 2.35 | %(d)(e) | 2.59 | % (d)(e) | ||||||||||
Expenses (before waiver/reimbursement, including net deferred income tax (benefit) expense) (f)(g) | 2.85 | % | 2.59 | % | 2.53 | %(d) | 2.73 | %(d)(e) | 2.85 | % (d)(e) | ||||||||||
Portfolio turnover rate | 34 | % | 32 | % | 51 | % | 64 | % | 95 | % | ||||||||||
Net assets at end of year (in 000’s) | $ | 5,357 | $ | 8,842 | $ | 12,644 | $ | 19,075 | $ | 25,053 | ||||||||||
| (a) | Per share data based on average shares outstanding during the period. |
| (b) | Total investment return is calculated exclusive of sales charges and assumes the reinvestment of dividends and distributions. For periods of less than one year, total return is not annualized. |
| (c) | Total investment return may reflect adjustments to conform to generally accepted accounting principles. |
| (d) | Ratios including/excluding net deferred income tax benefit (expense) includes applicable franchise tax expense for the period. |
For the year ended November 30, 2017, the Fund received a franchise tax refund in the amount of $10,487, of which $2,338 is attributable to Class C. |
For the year ended November 30, 2016, the Fund accrued $55,919 in franchise tax benefit, of which $13,411 is attributable to Class C. |
For the year ended November 30, 2015, the Fund accrued $(109,516) in franchise tax expense, of which $(26,603) is attributable to Class C. |
| (e) | For the year ended November 30, 2016, the Fund accrued $13,006 in net current tax expense, of which $3,142 is attributable to Class C. |
For the year ended November 30, 2015, the Fund received a tax refund in the amount of $6,000, of which $1,344 is attributable to Class C. |
| (f) | The ratio of expenses excluding net current and deferred income tax benefit to average net assets before waiver was 2.85%, 2.59%, 2.54%, 2.79% and 2.79% for the fiscal years ended November 30, 2019, 2018, 2017, 2016 and 2015, respectively. The ratio of expenses excluding deferred income tax benefit to average net assets after waiver was 2.34%, 2.35%, 2.32%, 2.41% and 2.53% for the fiscal years ended November 30, 2019, 2018, 2017, 2016 and 2015, respectively. |
| (g) | In addition to the fees and expenses which the Fund bears directly, it also indirectly bears a pro-rata share of the fees and expenses of the underlying funds in which it invests. Such indirect expenses are not included in the above expense ratios. |
| The notes to the financial statements are an integral part of, and should be read in conjunction with, the financial statements. | 17 |
Financial Highlightsselected per share data and ratios
| Year ended November 30, | ||||||||||||||||||||
| Class I | 2019 | 2018 | 2017 | 2016 | 2015 | |||||||||||||||
Net asset value at beginning of year | $ | 3.99 | $ | 4.33 | $ | 4.67 | $ | 5.01 | $ | 13.08 | ||||||||||
|
|
|
|
|
|
|
|
|
| |||||||||||
Net investment income (loss) (a) | 0.03 | 0.09 | 0.09 | 0.06 | (0.00 | )‡ | ||||||||||||||
Net realized and unrealized gain (loss) on investments | (0.82 | ) | (0.20 | ) | (0.22 | ) | (0.04 | ) | (7.27 | ) | ||||||||||
|
|
|
|
|
|
|
|
|
| |||||||||||
Total from investment operations | (0.79 | ) | (0.11 | ) | (0.13 | ) | 0.02 | (7.27 | ) | |||||||||||
|
|
|
|
|
|
|
|
|
| |||||||||||
| Less distributions: | ||||||||||||||||||||
From net investment income | — | (0.09 | ) | — | (0.02 | ) | — | |||||||||||||
From return of capital | (0.19 | ) | (0.14 | ) | (0.21 | ) | (0.34 | ) | (0.80 | ) | ||||||||||
|
|
|
|
|
|
|
|
|
| |||||||||||
Total dividends and distributions | (0.19 | ) | (0.23 | ) | (0.21 | ) | (0.36 | ) | (0.80 | ) | ||||||||||
|
|
|
|
|
|
|
|
|
| |||||||||||
Net asset value at end of year | $ | 3.01 | $ | 3.99 | $ | 4.33 | $ | 4.67 | $ | 5.01 | ||||||||||
|
|
|
|
|
|
|
|
|
| |||||||||||
Total investment return (b) | (20.72 | %) | (3.15 | %)(c) | (2.69 | %) | 2.54 | % | (57.47 | %) | ||||||||||
| Ratios (to average net assets)/Supplemental Data: |
| |||||||||||||||||||
Net investment income (loss) (including net deferred income tax benefit (expense)) | 0.81 | % | 2.13 | % | 2.03 | % (d) | 1.53 | %(d)(e) | (0.03 | %)(d)(e) | ||||||||||
Net investment income (loss) (excluding net deferred income tax benefit (expense)) | 0.81 | % | 2.13 | % | 2.02 | % (d) | 1.47 | %(d)(e) | 0.02 | % (d)(e) | ||||||||||
Net expenses (including net deferred income tax (benefit) expense) (f)(g) | 1.20 | % | 1.20 | % | 1.19 | % (d) | 1.23 | %(d)(e) | 1.54 | % (d)(e) | ||||||||||
Expenses (before waiver/reimbursement, including net deferred income tax (benefit) expense) (f)(g) | 1.71 | % | 1.44 | % | 1.41 | % (d) | 1.62 | %(d)(e) | 1.76 | % (d)(e) | ||||||||||
Portfolio turnover rate | 34 | % | 32 | % | 51 | % | 64 | % | 95 | % | ||||||||||
Net assets at end of year (in 000’s) | $ | 3,658 | $ | 5,289 | $ | 10,904 | $ | 17,831 | $ | 26,161 | ||||||||||
| ‡ | Less than one cent per share. |
| (a) | Per share data based on average shares outstanding during the period. |
| (b) | Total investment return is calculated exclusive of sales charges and assumes the reinvestment of dividends and distributions. Class I shares are not subject to sales charges. For periods of less than one year, total return is not annualized. |
| (c) | Total investment return may reflect adjustment to conform to generally accepted accounting principles. |
| (d) | Ratios including/excluding net deferred income tax benefit (expense) includes applicable franchise tax expense for the period. |
For the year ended November 30, 2017, the Fund received a franchise tax refund in the amount of $10,487, of which $2,001 is attributable to Class I. |
For the year ended November 30, 2016, the Fund accrued $55,919 in franchise tax benefit, of which $10,831 is attributable to Class I. |
For the year ended November 30, 2015, the Fund accrued $(109,516) in franchise tax expense, of which $(28,819) is attributable to Class I. |
| (e) | For the year ended November 30, 2016, the Fund accrued $13,006 in net current tax expense, of which $2,455 is attributable to Class I. |
For the year ended November 30, 2015, the Fund received a tax refund in the amount of $6,000, of which $1,813 is attributable to Class I. |
| (f) | The ratio of expenses excluding net current and deferred income tax benefit to average net assets before waiver was 1.71%, 1.44%, 1.42% 1.68% and 1.71% for the fiscal years ended November 30, 2019, 2018, 2017, 2016 and 2015, respectively. The ratio of expenses excluding deferred income tax benefit to average net assets after waiver was 1.20%, 1.20%, 1.20%, 1.29% and 1.48% for the fiscal years ended November 30, 2019, 2018, 2017, 2016 and 2015, respectively. |
| (g) | In addition to the fees and expenses which the Fund bears directly, it also indirectly bears a pro-rata share of the fees and expenses of the underlying funds in which it invests. Such indirect expenses are not included in the above expense ratios. |
| 18 | MainStay Cushing Energy Income Fund | The notes to the financial statements are an integral part of, and should be read in conjunction with, the financial statements. |
MainStay Cushing MLP Premier Fund
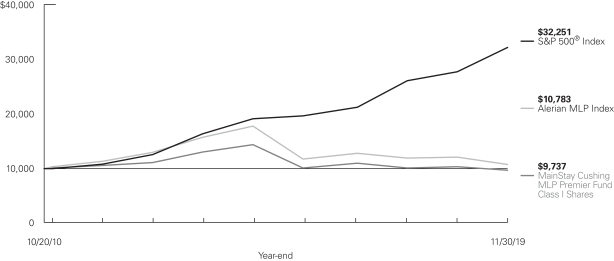
Investment and Performance Comparison1(Unaudited)
Performance data quoted represents past performance. Past performance is no guarantee of future results. Because of market volatility and other factors, current performance may be lower or higher than the figures shown. Investment return and principal value will fluctuate, and as a result, when shares are redeemed, they may be worth more or less than their original cost. The graph below depicts the historical performance of Class I shares of the Fund. Performance will vary from class to class based on differences in class-specific expenses and sales charges. For performance information current to the most recent month-end, please call800-624-6782 or visit nylinvestments.com/funds.
Average Annual Total Returns for the Year Ended November 30, 2019
| Class | Sales Charge | Inception Date | One Year | Five Years or Since Inception | Since Inception | Gross Expense Ratio2 | ||||||||||||||||||
| Class A Shares3 | Maximum 5.5% Initial Sales Charge | With sales charge Excluding sales charge | | 10/20/2010 | | | –11.55 –6.40 | %
| | –8.81 –7.77 | %
| | –1.15 –0.54 | %
| | 1.51 1.51 | %
| |||||||
| Investor Class Shares | Maximum 5.5% Initial Sales Charge | With sales charge Excluding sales charge | | 7/11/2014 | | | –11.54 –6.40 | | | –8.79 –7.75 |
| | –9.07 –8.11 |
| | 1.53 1.53 |
| |||||||
| Class C Shares3 | Maximum 1% CDSC if Redeemed Within One Year of Purchase | With sales charge Excluding sales charge | | 10/20/2010 | | | –7.90 –7.06 | | | –8.46 –8.46 |
| | –1.29 –1.29 |
| | 2.28 2.28 |
| |||||||
| Class I Shares3 | No Sales Charge | 10/20/2010 | –6.12 | –7.54 | –0.29 | 1.26 | ||||||||||||||||||
| 1. | The performance table and graph do not reflect the deduction of taxes that a shareholder would pay on distributions or Fund share redemptions. Total returns reflect maximum applicable sales charges as indicated in the table above, if any, changes in share price, and reinvestment of dividend and capital gain distributions. The graph assumes the initial investment amount shown above and reflects the deduction of all sales charges that would have applied for the period of investment. Performance figures may reflect certain fee waivers and/or expense limitations, without which total returns may have been lower. For more information on share classes and current fee waivers and/or expense limitations (if any), please refer to the Notes to Financial Statements. |
| 2. | The gross expense ratios presented reflect the Fund’s “Total Annual Fund Operating Expenses” from the most recent Prospectus and may differ from other expense ratios disclosed in this report. |
| 3. | Performance figures for Class A shares, Class C shares and Class I shares reflect the historical performance of the then–existing Class A shares, Class C shares and Class I shares, respectively, of the Cushing® MLP Premier Fund (the predecessor to the Fund, which was subject to a different fee structure) for periods prior to July 12, 2014. The Cushing® MLP Premier Fund commenced operations on October 20, 2010. |
The footnotes on the next page are an integral part of the table and graph and should be carefully read in conjunction with them.
| 19 |
| Benchmark Performance | One Year | Five Years | Since Inception | |||||||||
Alerian MLP Index4 | –11.00 | % | –9.56 | % | 0.83 | % | ||||||
Alerian U.S. Midstream Energy Index5 | –2.88 | N/A | N/A | |||||||||
S&P 500® Index6 | 16.11 | 10.98 | 13.71 | |||||||||
Morningstar Energy Limited Partnership Category Average7 | –6.50 | –8.38 | 0.50 | |||||||||
| 4. | Effective March 29, 2019, the Alerian MLP Index is the Fund’s primary benchmark. The Alerian MLP Index is an unmanaged, capped, float-adjusted, capitalization-weighted index and a leading gauge of energy MLPs. |
| 5. | The Alerian U.S. Midstream Energy Index is the Fund’s secondary benchmark. The Alerian U.S. Midstream Energy Index is a broad-based composite of U.S. energy infrastructure companies. The capped, float-adjusted, capitalization-weighted index, is comprised of constituents who earn the majority of their cash flow from midstream activities involving energy commodities. The inception date for the Alerian U.S. Midstream Energy Index is June 25, 2018. Data prior to that date reflects the application of the then-current index methodology to each historical rebalancing date to select and weight index constituents. |
| 6. | Prior to March 29, 2019, the S&P 500® Index was the Fund’s primary benchmark. “S&P 500®” is a trademark of The McGraw-Hill Companies, Inc. The S&P 500® Index is widely regarded as the standard index for measuring large-cap U.S. stock market performance. Results assume reinvestment of all dividends and capital gains. An investment cannot be made directly in an index. |
| 7. | The Morningstar Energy Limited Partnership Category Average is representative of funds that invest primarily a significant amount of their portfolio in energy master limited partnerships. These include but are not limited to limited partnerships specializing in midstream operations in the energy industry. Results are based on average total returns of similar funds with all dividends and capital gain distributions reinvested. |
The footnotes on the preceding page are an integral part of the table and graph and should be carefully read in conjunction with them.
| 20 | MainStay Cushing MLP Premier Fund |
Cost in Dollars of a $1,000 Investment in MainStay Cushing MLP Premier Fund (Unaudited)
The example below is intended to describe the fees and expenses borne by shareholders during thesix-month period from June 1, 2019, to November 30, 2019, and the impact of those costs on your investment.
Example
As a shareholder of the Fund, you incur two types of costs: (1) transaction costs, including exchange fees and sales charges (loads) on purchases (as applicable), and (2) ongoing costs, including management fees, distribution and/or service(12b-1) fees, and other Fund expenses (as applicable). This example is intended to help you understand your ongoing costs (in dollars) of investing in the Fund and to compare these costs with the ongoing costs of investing in other mutual funds. The example is based on an investment of $1,000 made at the beginning of thesix-month period and held for the entire period from June 1, 2019, to November 30, 2019.
This example illustrates your Fund’s ongoing costs in two ways:
Actual Expenses
The second and third data columns in the table below provide information about actual account values and actual expenses. You may use the information in these columns, together with the amount you invested, to estimate the expenses that you paid during the six months ended November 30, 2019. Simply divide your account value by $1,000 (for example, an $8,600 account value divided by $1,000 = 8.6), then
multiply the result by the number under the heading entitled “Expenses Paid During Period” to estimate the expenses you paid on your account during this period.
Hypothetical Example for Comparison Purposes
The fourth and fifth data columns in the table below provide information about hypothetical account values and hypothetical expenses based on the Fund’s actual expense ratio and an assumed rate of return of 5% per year before expenses, which is not the Fund’s actual return. The hypothetical account values and expenses may not be used to estimate the actual ending account balances or expenses you paid forthe six-month period shown. You may use this information to compare the ongoing costs of investing in the Fund with the ongoing costs of investing in other mutual funds. To do so, compare this 5% hypothetical example with the 5% hypothetical examples that appear in the shareholder reports of the other Funds.
Please note that the expenses shown in the table are meant to highlight your ongoing costs only and do not reflect any transactional costs, such as exchange fees or sales charges (loads). Therefore, the fourth and fifth data columns of the table are useful in comparing ongoing costs only and will not help you determine the relative total costs of owning different funds. In addition, if these transactional costs were included, your costs would have been higher.
| Share Class | Beginning Value | Ending Account Value (Based | Expenses During | Ending Account 11/30/19 | Expenses During | Net Expense Ratio During Period2 | ||||||||||||||||
| Class A Shares | $ | 1,000.00 | $ | 908.10 | $ | 7.32 | $ | 1,017.40 | $ | 7.74 | 1.53% | |||||||||||
| Investor Class Shares | $ | 1,000.00 | $ | 908.20 | $ | 7.32 | $ | 1,017.40 | $ | 7.74 | 1.53% | |||||||||||
| Class C Shares | $ | 1,000.00 | $ | 904.60 | $ | 10.84 | $ | 1,013.69 | $ | 11.46 | 2.27% | |||||||||||
| Class I Shares | $ | 1,000.00 | $ | 909.20 | $ | 6.13 | $ | 1,018.65 | $ | 6.48 | 1.28% | |||||||||||
| 1. | Expenses are equal to the Fund’s annualized expense ratio of each class multiplied by the average account value over the period, divided by 365 and multiplied by 183 (to reflect thesix-month period). The table above represents the actual expenses incurred during thesix-month period. Expenses for thesix-month period ended November 30, 2019 excluded a franchise tax expense to the Fund that equaled 0.02% for Class A, 0.02% for Investor Class, 0.01% for Class C, and 0.01% for Class I. |
| 2. | Expenses are equal to the Fund’s annualized expense ratio to reflect thesix-month period. |
| 21 |
Portfolio Composition as of November 30, 2019(1)(Unaudited)
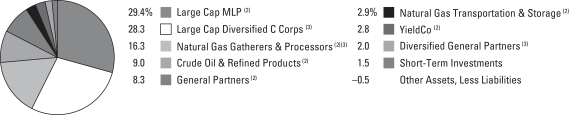
See Portfolio of Investments beginning on page 24 for specific holdings within these categories.
Top Ten Holdings as of November 30, 2019(excluding short-term investments) (Unaudited)
| 1. | ONEOK, Inc. |
| 2. | Enterprise Products Partners, L.P. |
| 3. | Energy Transfer, L.P. |
| 4. | Plains All American Pipeline, L.P. |
| 5. | Magellan Midstream Partners, L.P. |
| 6. | Kinder Morgan, Inc. |
| 7. | MPLX, L.P. |
| 8. | Williams Companies, Inc. |
| 9. | Targa Resources Corporation |
| 10. | Crestwood Equity Partners, L.P. |
| (1) | Fund holdings and sector allocations are subject to change, and there is no assurance that the Fund will continue to hold any particular security. |
| (2) | MLP Investments and Related Companies |
| (3) | Common Stocks |
| 22 | MainStay Cushing MLP Premier Fund |
Portfolio Management Discussion and Analysis(Unaudited)
Questions answered by portfolio managers Jerry V. Swank and Kevin P. Gallagher, CFA,1 of Cushing Asset Management, LP, the Fund’s Subadvisor.
How did MainStay Cushing MLP Premier Fund perform relative to its benchmarks and peer group during the 12 months ended November 30, 2019?
For the 12 months ended November 30, 2019, Class I shares of MainStay Cushing MLP Premier Fund returned –6.12%, outperforming the –11.00% return of the Fund’s primary benchmark, the Alerian MLP Index. Class I shares underperformed the –2.88% return of the Alerian U.S. Midstream Energy Index, which is the Fund’s secondary benchmark, and outperformed the –6.50% return of the Morningstar Energy Limited Partnership Category Average. The Fund’s former primary benchmark, the S&P 500® Index, returned 16.11% during the same period.2
Were there any changes to the Fund during the reporting period?
Effective March 29, 2019, the Fund selected the Alerian MLP Index as its primary benchmark, replacing the S&P 500® Index. We believe that the Alerian MLP Index is more reflective of the Fund’s principal investment strategies. On the same date, the Fund selected the Alerian U.S. Midstream Energy Index as its secondary benchmark.
What factors affected the Fund’s relative performance during the reporting period?
Like the broader equity market, the midstream energy sector, as measured by the performance of the benchmark Alerian MLP Index, dipped sharply in December 2018 and then rebounded strongly in January 2019. After this recovery, the midstream energy sector remained relatively flat throughmid-year 2019, and then weakened through the remainder of the reporting period. While there were stark differences in the performance of various midstream equities, notably between C corporations and master limited partnerships (“MLPs”), both the broader energy space and the midstream energy sector were hurt by ongoing negative investor sentiment and fund outflows, depressed natural gas prices and substantial changes in producer strategy and volume outlooks as exploration and production (“E&P”) companies worked to improve returns and generate positive free cash flows at a time of reduced activity. While many businesses in the midstream energy sector continued to produce significantly positive operating results and financial metrics, investor attention was instead focused on a number of concerns, including legal and regulatory challenges to certain large infrastructure projects, partnership structure and corporate governance, capital allocation and the potential for stock buybacks, producer-customer risks and/or strategic uncertainty with producer-parents, as well as questions related to macroeconomic and political uncertainty, and moderating basin supply growth. In addition, and consequently, it appeared that technical
factors liketax-loss selling negatively affected the midstream sector later in the reporting period.
The largest driver of Fund outperformance compared to the Index came from the Fund’slarge-cap diversified C corporation holdings (which are not in the Index), as the generally larger and more integrated C corporation structured midstream companies appeared to remain the primary focus for investors interested in allocating capital to the midstream sector. Additionally, the Fund’s relative performance benefited from strong individual stock selections in the natural gas gathering & processing subsector. Conversely, underweight exposure to crude oil & refined products companies detracted from relative performance, largely due to the Fund’s underweight exposure to Buckeye Partners, which was the subject of an announced acquisition during the reporting period for a 27.5% premium over the prior price of the company’s shares.
During the reporting period, which subsectors were the strongest positive contributors to the Fund’s relative performance and which subsectors were particularly weak?
The subsectors making the strongest positive contributions to the Fund’s performance relative to the Alerian MLP Index during the reporting period includedlarge-cap diversified C corporations and natural gas gathering & processing companies. (Contributions take weightings and total returns into account.) The Fund’s substantial,out-of-benchmark holdings oflarge-cap diversified C corporations produced positive absolute returns, outperforming the Index average by a significant margin. In the natural gas gathering & processing subsector, relatively strong stock selections bolstered relative performance.
The only subsector that produced material underperformance for the Fund compared with the Index was crude oil & refined products, largely due to the Fund’s underweight exposure to this relatively strong performing group.
During the reporting period, which individual stocks made the strongest positive contributions to the Fund’s absolute performance and which stocks detracted the most?
The stocks that made the strongest positive contributions to the Fund’s absolute performance during the reporting period included oil & gas storage & transportation company ONEOK, Inc. andlarge-cap diversified C corporation Kinder Morgan, Inc. Both companies benefited from continued healthy business fundamentals driven by large integrated asset footprints, as well as their simple financial structures and appealing metrics.
| 1. | Effective January 6, 2020, John M. Musgrave was added as a portfolio manager of the Fund and Kevin P. Gallagher no longer serves as a portfolio manager of the Fund. |
| 2. | See page 19 for other share class returns, which may be higher or lower than Class I share returns. See page 20 for more information on benchmark and peer group returns. |
| 23 |
The two holdings that detracted most from the Fund’s absolute performance werelarge-cap diversified MLP Plains All American Pipeline, L.P., and natural gas transportation & storage MLP EQM Midstream Partners, L.P. We believe Plains All American Pipeline’s performance was negatively affected by market concerns related to slowing growth in the Permian Basin and volume/contract risk tied to overcapacity fears. We believe EQM Midstream Partners’ performance was driven by concerns related to slowing growth in the Marcellus shale play as well as legal and regulatory risks connected with its large planned Mountain Valley pipeline project. The Fund held underweight exposure relative to the Index to both holdings.
What were some of the Fund’s largest purchases and sales during the reporting period?
The Fund’s largest purchases during the reporting period included significantly increased holdings of two existinglarge-cap diversified MLP positions: Plains All American Pipeline and Magellan Midstream Partners, L.P. The Fund added to its position in Plains All American Pipeline based on our conviction that, after a significantsell-off, investor fears about Permian volumes and related earnings were likely overdone. The Fund increased the size of its Magellan position due to several reasons, among them the defensive nature of the company’s
business, its capital discipline and conservative financial metrics, such as its attractive returns on invested capital.
During the reporting period, the Fund partially reduced the size of its holdings in Kinder Morgan, mentioned above, and natural gas distributor Enbridge, taking profits after the companies outperformed. In the case of Enbridge, Inc., the Fund also reduced its exposure in light of regulatory and environmental resistance to certain of the company’s key projects.
How did the Fund’s subsector weightings change during the reporting period?
During the reporting period, the Fund increased its exposure to thelarge-cap diversified MLP and crude oil & refined products subsectors. The Fund reduced its exposure to the natural gas gathering & processing and coal subsectors.
How was the Fund positioned at the end of the reporting period?
At the end of the reporting period, the Fund held its most overweight subsector exposure relative to the Alerian MLP Index inlarge-cap diversified C corporations (because this subsector was not included in the Alerian MLP Index) and yield companies. The Fund’s most underweight subsector exposures relative to the Index includedlarge-cap diversified MLPs and natural gas gathering & processing.
The opinions expressed are those of the portfolio managers as of the date of this report and are subject to change. There is no guarantee that any forecasts will come to pass. This material does not constitute investment advice and is not intended as an endorsement of any specific investment.
| 24 | MainStay Cushing MLP Premier Fund |
Portfolio of InvestmentsNovember 30, 2019
| Shares | Value | |||||||
| Common Stocks 38.9%† |
| |||||||
Diversified General Partners 2.0% |
| |||||||
Canada 2.0% |
| |||||||
Enbridge, Inc. | 530,000 | $ | 20,140,000 | |||||
|
| |||||||
Large Cap Diversified C Corps 28.3% |
| |||||||
Canada 3.5% |
| |||||||
Pembina Pipeline Corporation | 995,000 | 34,825,000 | ||||||
United States 24.8% |
| |||||||
Cheniere Energy, Inc. (a) | 545,000 | 32,994,300 | ||||||
Kinder Morgan, Inc. | 2,955,000 | 57,947,550 | ||||||
ONEOK, Inc. | 1,392,876 | 98,963,840 | ||||||
Williams Companies, Inc. | 2,388,964 | 54,277,262 | ||||||
|
| |||||||
| 279,007,952 | ||||||||
|
| |||||||
Natural Gas Gatherers & Processors 8.6% |
| |||||||
Canada 3.4% | ||||||||
TC Energy Corporation | 660,000 | 33,613,800 | ||||||
United States 5.2% | ||||||||
Antero Midstream Corporation | 1,514,832 | 6,937,930 | ||||||
EnLink Midstream LLC | 1,539,675 | 7,313,456 | ||||||
Targa Resources Corporation | 999,975 | 36,529,087 | ||||||
|
| |||||||
| 84,394,273 | ||||||||
|
| |||||||
Total Common Stocks | 383,542,225 | |||||||
|
| |||||||
| MLP Investments and Related Companies 60.1% |
| |||||||
Crude Oil & Refined Products 9.0% | ||||||||
United States 9.0% | ||||||||
Genesis Energy, L.P. | 1,060,000 | 20,150,600 | ||||||
NuStar Energy, L.P. | 475,000 | 13,404,500 | ||||||
Phillips 66 Partners, L.P. | 602,978 | 33,603,964 | ||||||
Shell Midstream Partners, L.P. | 1,105,000 | 21,724,300 | ||||||
|
| |||||||
| 88,883,364 | ||||||||
|
| |||||||
General Partners 8.3% | ||||||||
United States 8.3% | ||||||||
Energy Transfer, L.P. | 6,917,822 | 81,699,478 | ||||||
|
| |||||||
Large Cap MLP 29.4% | ||||||||
United States 29.4% | ||||||||
Enterprise Products Partners, L.P. | 3,659,750 | 96,324,620 | ||||||
Magellan Midstream Partners, L.P. | 1,039,340 | 60,770,210 | ||||||
MPLX, L.P. | 2,328,126 | 55,060,180 | ||||||
Plains All American Pipeline, L.P. | 4,391,545 | 76,412,883 | ||||||
|
| |||||||
| 288,567,893 | ||||||||
|
| |||||||
Natural Gas Gatherers & Processors 7.7% |
| |||||||
United States 7.7% | ||||||||
Crestwood Equity Partners, L.P. | 1,130,000 | 35,843,600 | ||||||
DCP Midstream Partners, L.P. | 915,123 | 19,318,246 | ||||||
| Shares | Value | |||||||
Natural Gas Gatherers & Processors (continued) |
| |||||||
United States (continued) | ||||||||
Enable Midstream Partners, L.P. | 1,375,000 | $ | 12,636,250 | |||||
Western Midstream Partners, L.P. | 499,615 | 8,858,174 | ||||||
|
| |||||||
| 76,656,270 | ||||||||
|
| |||||||
Natural Gas Transportation & Storage 2.9% |
| |||||||
United States 2.9% | ||||||||
EQM Midstream Partners, L.P. | 1,212,500 | 28,093,625 | ||||||
|
| |||||||
YieldCo 2.8% | ||||||||
United States 2.8% | ||||||||
NextEra Energy Partners, L.P. | 525,000 | 27,893,250 | ||||||
|
| |||||||
Total MLP Investments and Related Companies |
| 591,793,880 | ||||||
|
| |||||||
| Short-Term Investments—Investment Companies 1.5% |
| |||||||
United States 1.5% | ||||||||
First American Government Obligations Fund—Class X, 1.56% (b) | 7,575,289 | 7,575,289 | ||||||
First American Treasury Obligations Fund—Class X, 1.59% (b) | 7,575,288 | 7,575,288 | ||||||
|
| |||||||
Total Short-Term Investments—Investment Companies (Cost $15,150,577) |
| 15,150,577 | ||||||
|
| |||||||
Total Investments | 100.5 | % | 990,486,682 | |||||
Other Assets, Less Liabilities | (0.5 | ) | (5,041,649 | ) | ||||
Net Assets | 100.0 | % | $ | 985,445,033 | ||||
| † | Calculated as a percentage of net assets applicable to common shareholders. |
| (a) | Non-income producing security. |
| (b) | Current yield as of November 30, 2019. |
| The notes to the financial statements are an integral part of, and should be read in conjunction with, the financial statements. | 25 |
Portfolio of InvestmentsNovember 30, 2019 (continued)
The following is a summary of the fair valuations according to the inputs used as of November 30, 2019, for valuing the Fund’s assets.
Description | Quoted Prices in | Significant Other Observable Inputs (Level 2) | Significant Unobservable Inputs (Level 3) | Total | ||||||||||||
Asset Valuation Inputs | ||||||||||||||||
| Investments in Securities (a) | ||||||||||||||||
Common Stocks | $ | 383,542,225 | $ | — | $ | — | $ | 383,542,225 | ||||||||
MLP Investments and Related Companies | 591,793,880 | — | — | 591,793,880 | ||||||||||||
Short-Term Investments—Investment Companies | 15,150,577 | — | — | 15,150,577 | ||||||||||||
|
|
|
|
|
|
|
| |||||||||
| Total Investments in Securities | $ | 990,486,682 | $ | — | $ | — | $ | 990,486,682 | ||||||||
|
|
|
|
|
|
|
| |||||||||
| (a) | For a complete listing of investments and their industries, see the Portfolio of Investments. |
| 26 | MainStay Cushing MLP Premier Fund | The notes to the financial statements are an integral part of, and should be read in conjunction with, the financial statements. |
Statement of Assets and Liabilitiesas of November 30, 2019
| Assets | ||||
Investments, at value | $ | 990,486,682 | ||
Receivables: | ||||
Fund shares sold | 3,069,565 | |||
Dividends and interest | 685,474 | |||
Prepaid expenses | 73,045 | |||
|
| |||
Total assets | 994,314,766 | |||
|
| |||
| Liabilities | ||||
Payables: | ||||
Fund shares redeemed | 6,879,742 | |||
Manager fees (See Note 3) | 932,836 | |||
Transfer agent (See Note 3) | 302,003 | |||
NYLIFE Distributors (See Note 3) | 287,663 | |||
Distributions payable | 133,068 | |||
Dividends payable | 66,750 | |||
Shareholder communication | 66,384 | |||
Professional fees | 38,466 | |||
Trustees | 5,499 | |||
Custodian | 2,547 | |||
Franchise taxes | 139,022 | |||
Accrued expenses | 15,753 | |||
|
| |||
Total liabilities | 8,869,733 | |||
|
| |||
Net assets | $ | 985,445,033 | ||
|
| |||
| Composition of Net Assets | ||||
Shares of beneficial interest outstanding (par value of $.001 per share) unlimited number of shares authorized | $ | 110,169 | ||
Additionalpaid-in capital | 1,422,925,019 | |||
|
| |||
| 1,423,035,188 | ||||
Total distributable earnings (loss), net of income taxes | (437,590,155 | ) | ||
|
| |||
Net assets | $ | 985,445,033 | ||
|
| |||
Class A | ||||
Net assets applicable to outstanding shares | $ | 249,399,061 | ||
|
| |||
Shares of beneficial interest outstanding | 27,429,402 | |||
|
| |||
Net asset value per share outstanding | $ | 9.09 | ||
Maximum sales charge (5.50% of offering price) | 0.53 | |||
|
| |||
Maximum offering price per share outstanding | $ | 9.62 | ||
|
| |||
Investor Class | ||||
Net assets applicable to outstanding shares | $ | 2,446,418 | ||
|
| |||
Shares of beneficial interest outstanding | 268,761 | |||
|
| |||
Net asset value per share outstanding | $ | 9.10 | ||
Maximum sales charge (5.50% of offering price) | 0.53 | |||
|
| |||
Maximum offering price per share outstanding | $ | 9.63 | ||
|
| |||
Class C | ||||
Net assets applicable to outstanding shares | $ | 272,422,521 | ||
|
| |||
Shares of beneficial interest outstanding | 33,470,708 | |||
|
| |||
Net asset value per share outstanding | $ | 8.14 | ||
|
| |||
Class I | ||||
Net assets applicable to outstanding shares | $ | 461,177,033 | ||
|
| |||
Shares of beneficial interest outstanding | 49,000,449 | |||
|
| |||
Net asset value per share outstanding | $ | 9.41 | ||
|
|
| The notes to the financial statements are an integral part of, and should be read in conjunction with, the financial statements. | 27 |
Statement of Operationsfor the year ended November 30, 2019
| Investment Income (Loss) | ||||
Income | ||||
Dividends and distributions | $ | 7,053,885 | ||
Interest | 736,501 | |||
|
| |||
Total income | 7,790,386 | |||
|
| |||
Expenses | ||||
Manager (See Note 3) | 13,426,443 | |||
Distribution/Service—Class A (See Note 3) | 688,865 | |||
Distribution/Service—Investor Class (See Note 3) | 6,617 | |||
Distribution/Service—Class C (See Note 3) | 3,615,700 | |||
Transfer agent (See Note 3) | 1,344,325 | |||
Professional fees | 270,359 | |||
Shareholder communication | 268,926 | |||
Franchise tax | 209,064 | |||
Registration | 153,184 | |||
Trustees | 29,476 | |||
Custodian | 14,709 | |||
Insurance | 13,374 | |||
Miscellaneous | 38,997 | |||
|
| |||
Net expenses | 20,080,039 | |||
|
| |||
Net investment income (loss) | (12,289,653 | ) | ||
|
| |||
| Realized and Unrealized Gain (Loss) on Investments |
| |||
Net realized gain (loss) on: | ||||
Investments, before income taxes | (19,730,626 | ) | ||
Foreign currency transactions | 2,538 | |||
|
| |||
Net realized gain (loss) on investments and foreign currency transactions | (19,728,088 | ) | ||
|
| |||
Net change in unrealized appreciation (depreciation) on investments before income taxes | (38,134,671 | ) | ||
|
| |||
Net realized and unrealized gain (loss) on investments | (57,862,759 | ) | ||
|
| |||
Net increase (decrease) in net assets resulting from operations | $ | (70,152,412 | ) | |
|
| |||
| (a) | Dividends and distributions recorded net of foreign withholding taxes in the amount of $707,777. |
| 28 | MainStay Cushing MLP Premier Fund | The notes to the financial statements are an integral part of, and should be read in conjunction with, the financial statements. |
Statements of Changes in Net Assets
| Year ended November 30, 2019 | Year ended November 30, 2018 | |||||||
| Increase (Decrease) in Net Assets |
| |||||||
Operations: | ||||||||
Net investment income (loss) | $ | (12,289,653 | ) | $ | (10,969,853 | ) | ||
Net realized gain (loss) on investments and foreign currency transactions | (19,728,088 | ) | 29,903,906 | |||||
Net change in unrealized appreciation (depreciation) on investments | (38,134,671 | ) | (4,289,768 | ) | ||||
|
| |||||||
Net increase (decrease) in net assets resulting from operations | (70,152,412 | ) | 14,644,285 | |||||
|
| |||||||
Distributions to shareholders from return of capital: | ||||||||
Class A | (24,758,011 | ) | (32,785,520 | ) | ||||
Investor Class | (236,575 | ) | (313,648 | ) | ||||
Class C | (35,368,999 | ) | (54,327,132 | ) | ||||
Class I | (49,829,343 | ) | (70,360,314 | ) | ||||
|
| |||||||
Total distributions to shareholers | (110,192,928 | ) | (157,786,614 | ) | ||||
|
| |||||||
Capital share transactions: | ||||||||
Net proceeds from sale of shares | 388,297,290 | 618,432,296 | ||||||
Net asset value of shares issued to shareholders in reinvestment of dividends and distributions | 108,574,026 | 155,830,208 | ||||||
Cost of shares redeemed | (672,939,921 | ) | (538,599,614 | ) | ||||
|
| |||||||
Increase (decrease) in net assets derived from capital share transactions | (176,068,605 | ) | 235,662,890 | |||||
|
| |||||||
Net increase (decrease) in net assets | (356,413,945 | ) | 92,520,561 | |||||
| Net Assets |
| |||||||
Beginning of year | 1,341,858,978 | 1,249,338,417 | ||||||
|
| |||||||
End of year | $ | 985,445,033 | $ | 1,341,858,978 | ||||
|
| |||||||
| The notes to the financial statements are an integral part of, and should be read in conjunction with, the financial statements. | 29 |
Financial Highlightsselected per share data and ratios
| Year ended November 30, | ||||||||||||||||||||
| Class A | 2019 | 2018 | 2017 | 2016 | 2015 | |||||||||||||||
Net asset value at beginning of year | $ | 10.64 | $ | 11.71 | $ | 14.09 | $ | 14.47 | $ | 22.15 | ||||||||||
|
|
|
|
|
|
|
|
|
| |||||||||||
Net investment income (loss) (a) | (0.09 | ) | (0.08 | ) | (0.17 | ) | (0.16 | ) | 0.03 | |||||||||||
Net realized and unrealized gain (loss) on investments | (0.52 | ) | 0.35 | (0.87 | ) | 1.23 | (6.37 | ) | ||||||||||||
|
|
|
|
|
|
|
|
|
| |||||||||||
Total from investment operations | (0.61 | ) | 0.27 | (1.04 | ) | 1.07 | (6.34 | ) | ||||||||||||
|
|
|
|
|
|
|
|
|
| |||||||||||
| Less distributions: | ||||||||||||||||||||
From return of capital | (0.94 | ) | (1.34 | ) | (1.34 | ) | (1.45 | ) | (1.34 | ) | ||||||||||
|
|
|
|
|
|
|
|
|
| |||||||||||
Net asset value at end of year | $ | 9.09 | $ | 10.64 | $ | 11.71 | $ | 14.09 | $ | 14.47 | ||||||||||
|
|
|
|
|
|
|
|
|
| |||||||||||
Total investment return (b) | (6.40 | %) | 1.90 | % | (8.19 | %) | 8.75 | % | (29.92 | %) | ||||||||||
| Ratios (to average net assets)/Supplemental Data: | ||||||||||||||||||||
Net investment income (loss) (including net deferred income tax benefit (expense)) (c) | (0.92 | %) | (0.67 | %) | (1.21 | %) | (1.21 | %) | 8.32 | % (d) | ||||||||||
Net investment income (loss) (excluding net deferred income tax benefit (expense)) (c) | (0.90 | %) | (0.66 | %) | (1.20 | %) | (1.22 | %) | (0.24 | %)(d) | ||||||||||
Net expenses (including net deferred income tax (benefit) expense) (c)(e)(f) | 1.54 | % | 1.51 | % | 1.51 | % | 1.52 | % | (7.07 | %)(d) | ||||||||||
Expenses (before waiver/recoupment, including net deferred income tax (benefit) expense) (c)(e)(f) | 1.54 | % | 1.51 | % | 1.51 | % | 1.52 | % | (7.07 | %)(d) | ||||||||||
Portfolio turnover rate | 50 | % | 50 | % | 29 | % | 52 | % | 32 | % | ||||||||||
Net assets at end of year (in 000’s) | $ | 249,399 | $ | 278,507 | $ | 264,449 | $ | 360,473 | $ | 317,903 | ||||||||||
| (a) | Per share data based on average shares outstanding during the period. |
| (b) | Total investment return is calculated exclusive of sales charges and assumes the reinvestment of dividends and distributions. For periods of less than one year, total return is not annualized. |
| (c) | Ratios including/excluding net deferred income tax benefit (expense) includes applicable franchise tax expense for the period. |
For the year ended November 30, 2019, the Fund accrued $(209,064) in franchise tax expense, of which $(48,618) is attributable to Class A. |
For the year ended November 30, 2018, the Fund accrued $(107,814) in franchise tax expense, of which $(22,756) is attributable to Class A. |
For the year ended November 30, 2017, the Fund accrued $(131,121) in franchise tax expense, of which $(29,083) is attributable to Class A. |
For the year ended November 30, 2016, the Fund accrued $43,881 in franchise tax benefit, of which $14,819 is attributable to Class A. |
For the year ended November 30, 2015, the Fund accrued $(517,762) in franchise tax expense, of which $(128,449) is attributable to Class A. |
| (d) | For the year ended November 30, 2015, the Fund accrued $154,807,419 in net deferred income tax benefit, of which $39,834,200 is attributable to Class A. |
| (e) | The ratio of expenses excluding net deferred income tax expense to average net assets before waiver and recoupment was 1.53%, 1.50%, 1.50%, 1.53% and 1.49% for the fiscal years ended November 30, 2019, 2018, 2017, 2016 and 2015, respectively. The ratio of expenses excluding net deferred income tax expense to average net assets after waiver and recoupment was 1.53%, 1.50%, 1.50%, 1.53% and 1.49% for the fiscal years ended November 30, 2019, 2018, 2017, 2016 and 2015, respectively. |
| (f) | In addition to the fees and expenses which the Fund bears directly, it also indirectly bears a pro-rata share of the fees and expenses of the underlying funds in which it invests. Such indirect expenses are not included in the above expense ratios. |
| 30 | MainStay Cushing MLP Premier Fund | The notes to the financial statements are an integral part of, and should be read in conjunction with, the financial statements. |
Financial Highlightsselected per share data and ratios
| Year ended November 30, | ||||||||||||||||||||
| Investor Class | 2019 | 2018 | 2017 | 2016 | 2015 | |||||||||||||||
Net asset value at beginning of year | $ | 10.65 | $ | 11.71 | $ | 14.09 | $ | 14.47 | $ | 22.15 | ||||||||||
|
|
|
|
|
|
|
|
|
| |||||||||||
Net investment income (loss) (a) | (0.09 | ) | (0.08 | ) | (0.17 | ) | (0.15 | ) | (0.00 | )‡ | ||||||||||
Net realized and unrealized gain (loss) on investments | (0.52 | ) | 0.36 | (0.87 | ) | 1.22 | (6.34 | ) | ||||||||||||
|
|
|
|
|
|
|
|
|
| |||||||||||
Total from investment operations | (0.61 | ) | 0.28 | (1.04 | ) | 1.07 | (6.34 | ) | ||||||||||||
|
|
|
|
|
|
|
|
|
| |||||||||||
| Less distributions: | ||||||||||||||||||||
From return of capital | (0.94 | ) | (1.34 | ) | (1.34 | ) | (1.45 | ) | (1.34 | ) | ||||||||||
|
|
|
|
|
|
|
|
|
| |||||||||||
Net asset value at end of year | $ | 9.10 | $ | 10.65 | $ | 11.71 | $ | 14.09 | $ | 14.47 | ||||||||||
|
|
|
|
|
|
|
|
|
| |||||||||||
Total investment return (b) | (6.40 | %) | 1.99 | % | (8.19 | %) | 8.75 | % | (29.91 | %)(c) | ||||||||||
| Ratios (to average net assets)/Supplemental Data: | ||||||||||||||||||||
Net investment income (loss) (including net deferred income tax benefit (expense)) (d) | (0.92 | %) | (0.71 | %) | (1.22 | %) | (1.16 | %) | 8.17 | % (e) | ||||||||||
Net investment income (loss) (excluding net deferred income tax benefit (expense)) (d) | (0.91 | %) | (0.70 | %) | (1.21 | %) | (1.16 | %) | (0.38 | %)(e) | ||||||||||
Net expenses (including net deferred income tax (benefit) expense) (d)(f)(g) | 1.54 | % | 1.53 | % | 1.53 | % | 1.55 | % | (7.05 | %)(e) | ||||||||||
Expenses (before waiver, including net deferred income tax (benefit) expense) (d)(f)(g) | 1.54 | % | 1.53 | % | 1.53 | % | 1.55 | % | (7.05 | %)(e) | ||||||||||
Portfolio turnover rate | 50 | % | 50 | % | 29 | % | 52 | % | 32 | % | ||||||||||
Net assets at end of year (in 000’s) | $ | 2,446 | $ | 2,575 | $ | 2,616 | $ | 3,157 | $ | 2,631 | ||||||||||
| ‡ | Less than one cent per share. |
| (a) | Per share data based on average shares outstanding during the period. |
| (b) | Total investment return is calculated exclusive of sales charges and assumes the reinvestment of dividends and distributions. For periods of less than one year, total return is not annualized. |
| (c) | Total investment return may reflect adjustments to conform to generally accepted accounting principles. |
| (d) | Ratios including/excluding net deferred income tax benefit (expense) includes applicable franchise tax expense for the period. |
For the year ended November 30, 2019, the Fund accrued $(209,064) in franchise tax expense, of which $(466) is attributable to Investor Class. |
For the year ended November 30, 2018, the Fund accrued $(107,814) in franchise tax expense, of which $(218) is attributable to Investor Class. |
For the year ended November 30, 2017, the Fund accrued $(131,121) in franchise tax expense, of which $(333) is attributable to Investor Class. |
For the year ended November 30, 2016, the Fund accrued $43,881 in franchise tax benefit, of which $50 is attributable to Investor Class. |
For the year ended November 30, 2015, the Fund accrued $(517,762) in franchise tax expense, of which $(830) is attributable to Investor Class. |
| (e) | For the year ended November 30, 2015, the Fund accrued $154,807,419 in net deferred income tax benefit, of which $202,049 is attributable to Investor Class. |
| (f) | The ratio of expenses excluding net deferred income tax expense to average net assets before waiver was 1.53%, 1.52%, 1.52%, 1.55% and 1.50% for the fiscal years ended November 30, 2019, 2018, 2017, 2016 and 2015, respectively. The ratio of expenses excluding net deferred income tax expense to average net assets after waiver was 1.53%, 1.52%, 1.52%, 1.55% and 1.50% for the fiscal years ended November 30, 2019, 2018, 2017, 2016 and 2015, respectively. |
| (g) | In addition to the fees and expenses which the Fund bears directly, it also indirectly bears a pro-rata share of the fees and expenses of the underlying funds in which it invests. Such indirect expenses are not included in the above expense ratios. |
| The notes to the financial statements are an integral part of, and should be read in conjunction with, the financial statements. | 31 |
Financial Highlightsselected per share data and ratios
| Year ended November 30, | ||||||||||||||||||||
| Class C | 2019 | 2018 | 2017 | 2016 | 2015 | |||||||||||||||
Net asset value at beginning of year | $ | 9.69 | $ | 10.86 | $ | 13.26 | $ | 13.81 | $ | 21.36 | ||||||||||
|
|
|
|
|
|
|
|
|
| |||||||||||
Net investment income (loss) (a) | (0.15 | ) | (0.16 | ) | (0.25 | ) | (0.24 | ) | (0.12 | ) | ||||||||||
Net realized and unrealized gain (loss) on investments | (0.46 | ) | 0.33 | (0.81 | ) | 1.14 | (6.09 | ) | ||||||||||||
|
|
|
|
|
|
|
|
|
| |||||||||||
Total from investment operations | (0.61 | ) | 0.17 | (1.06 | ) | 0.90 | (6.21 | ) | ||||||||||||
|
|
|
|
|
|
|
|
|
| |||||||||||
| Less distributions: | ||||||||||||||||||||
From return of capital | (0.94 | ) | (1.34 | ) | (1.34 | ) | (1.45 | ) | (1.34 | ) | ||||||||||
|
|
|
|
|
|
|
|
|
| |||||||||||
Net asset value at end of year | $ | 8.14 | $ | 9.69 | $ | 10.86 | $ | 13.26 | $ | 13.81 | ||||||||||
|
|
|
|
|
|
|
| �� |
|
| ||||||||||
Total investment return (b) | (7.06 | %) | 1.09 | % | (8.88 | %) | 7.89 | % | (30.43 | %) | ||||||||||
| Ratios (to average net assets)/Supplemental Data: | ||||||||||||||||||||
Net investment income (loss) (including net deferred income tax benefit (expense)) (c) | (1.65 | %) | (1.45 | %) | (1.99 | %) | (1.95 | %) | 7.56 | % (d) | ||||||||||
Net investment income (loss) (excluding net deferred income tax benefit (expense)) (c) | (1.64 | %) | (1.44 | %) | (1.98 | %) | (1.95 | %) | (1.00 | %)(d) | ||||||||||
Net expenses (including net deferred income tax (benefit) expense) (c)(e)(f) | 2.29 | % | 2.28 | % | 2.28 | % | 2.30 | % | (6.32 | %)(d) | ||||||||||
Expenses (before waiver/recoupment, including net deferred income tax (benefit) expense) (c)(e)(f) | 2.29 | % | 2.28 | % | 2.28 | % | 2.30 | % | (6.32 | %)(d) | ||||||||||
Portfolio turnover rate | 50 | % | 50 | % | 29 | % | 52 | % | 32 | % | ||||||||||
Net assets at end of year (in 000’s) | $ | 272,423 | $ | 397,557 | $ | 445,524 | $ | 538,336 | $ | 553,892 | ||||||||||
| (a) | Per share data based on average shares outstanding during the period. |
| (b) | Total investment return is calculated exclusive of sales charges and assumes the reinvestment of dividends and distributions. For periods of less than one year, total return is not annualized. |
| (c) | Ratios including/excluding net deferred income tax benefit (expense) includes applicable franchise tax expense for the period. |
For the year ended November 30, 2019, the Fund accrued $(209,064) in franchise tax expense, of which $(60,864) is attributable to Class C. |
For the year ended November 30, 2018, the Fund accrued $(107,814) in franchise tax expense, of which $(34,832) is attributable to Class C. |
For the year ended November 30, 2017, the Fund accrued $(131,121) in franchise tax expense, of which $(50,302) is attributable to Class C. |
For the year ended November 30, 2016, the Fund accrued $43,881 in franchise tax benefit, of which $14,231 is attributable to Class C. |
For the year ended November 30, 2015, the Fund accrued $(517,762) in franchise tax expense, of which $(220,745) is attributable to Class C. |
| (d) | For the year ended November 30, 2015, the Fund accrued $154,807,419 in net deferred income tax benefit, of which $66,219,265 is attributable to Class C. |
| (e) | The ratio of expenses excluding net deferred income tax expense to average net assets before waiver and recoupment was 2.28%, 2.27%, 2.27%, 2.30% and 2.24% for the fiscal years ended November 30, 2019, 2018, 2017, 2016 and 2015, respectively. The ratio of expenses excluding net deferred income tax expense to average net assets after waiver and recoupment was 2.28%, 2.27%, 2.27%, 2.30% and 2.24% for the fiscal years ended November 30, 2019, 2018, 2017, 2016 and 2015, respectively. |
| (f) | In addition to the fees and expenses which the Fund bears directly, it also indirectly bears a pro-rata share of the fees and expenses of the underlying funds in which it invests. Such indirect expenses are not included in the above expense ratios. |
| 32 | MainStay Cushing MLP Premier Fund | The notes to the financial statements are an integral part of, and should be read in conjunction with, the financial statements. |
Financial Highlightsselected per share data and ratios
| Year ended November 30, | ||||||||||||||||||||
| Class I | 2019 | 2018 | 2017 | 2016 | 2015 | |||||||||||||||
Net asset value at beginning of year | $ | 10.95 | $ | 11.99 | $ | 14.36 | $ | 14.69 | $ | 22.40 | ||||||||||
|
|
|
|
|
|
|
|
|
| |||||||||||
Net investment income (loss) (a) | (0.07 | ) | (0.05 | ) | (0.14 | ) | (0.12 | ) | 0.07 | |||||||||||
Net realized and unrealized gain (loss) on investments | (0.53 | ) | 0.35 | (0.89 | ) | 1.24 | (6.44 | ) | ||||||||||||
|
|
|
|
|
|
|
|
|
| |||||||||||
Total from investment operations | (0.60 | ) | 0.30 | (1.03 | ) | 1.12 | (6.37 | ) | ||||||||||||
|
|
|
|
|
|
|
|
|
| |||||||||||
| Less distributions: | ||||||||||||||||||||
From return of capital | (0.94 | ) | (1.34 | ) | (1.34 | ) | (1.45 | ) | (1.34 | ) | ||||||||||
|
|
|
|
|
|
|
|
|
| |||||||||||
Net asset value at end of year | $ | 9.41 | $ | 10.95 | $ | 11.99 | $ | 14.36 | $ | 14.69 | ||||||||||
|
|
|
|
|
|
|
|
|
| |||||||||||
Total investment return (b) | (6.12 | %) | 2.12 | % | (7.95 | %) | 8.97 | % | (29.71 | %) | ||||||||||
| Ratios (to average net assets)/Supplemental Data: | ||||||||||||||||||||
Net investment income (loss) (including net deferred income tax benefit (expense)) (c) | (0.65 | %) | (0.41 | %) | (1.01 | %) | (0.93 | %) | 8.53 | % (d) | ||||||||||
Net investment income (loss) (excluding net deferred income tax benefit (expense)) (c) | (0.63 | %) | (0.40 | %) | (1.00 | %) | (0.93 | %) | (0.02 | %)(d) | ||||||||||
Net expenses (including net deferred income tax (benefit) expense) (c)(e)(f) | 1.29 | % | 1.26 | % | 1.26 | % | 1.28 | % | (7.31 | %)(d) | ||||||||||
Expenses (before waiver/recoupment, including net deferred income tax (benefit) expense) (c)(e)(f) | 1.29 | % | 1.26 | % | 1.26 | % | 1.28 | % | (7.31 | %)(d) | ||||||||||
Portfolio turnover rate | 50 | % | 50 | % | 29 | % | 52 | % | 32 | % | ||||||||||
Net assets at end of year (in 000’s) | $ | 461,177 | $ | 663,220 | $ | 536,749 | $ | 481,819 | $ | 449,755 | ||||||||||
| (a) | Per share data based on average shares outstanding during the period. |
| (b) | Total investment return is calculated exclusive of sales charges and assumes the reinvestment of dividends and distributions. Class I shares are not subject to sales charges. For periods of less than one year, total return is not annualized. |
| (c) | Ratios including/excluding net deferred income tax benefit (expense) includes applicable franchise tax expense for the period. |
For the year ended November 30, 2019, the Fund accrued $(209,064) in franchise tax expense, of which $(99,116) is attributable to Class I. |
For the year ended November 30, 2018, the Fund accrued $(107,814) in franchise tax expenses, of which $(50,008) is attributable to Class I. |
For the year ended November 30, 2017, the Fund accrued $(131,121) in franchise tax expense, of which $(51,403) is attributable to Class I. |
For the year ended November 30, 2016, the Fund accrued $43,881 in franchise tax benefit, of which $14,781 is attributable to Class I. |
For the year ended November 30, 2015, the Fund accrued $(517,762) in franchise tax expense, of which $(167,738) is attributable to Class I. |
| (d) | For the year ended November 30, 2015, the Fund accrued $154,807,419 in net deferred income tax benefit, of which $48,551,905 is attributable to Class I. |
| (e) | The ratio of expenses excluding net deferred income tax expense to average net assets before waiver and recoupment was 1.28%, 1.25%, 1.25%, 1.28% and 1.24% for the fiscal years ended November 30, 2019, 2018, 2017, 2016 and 2015, respectively. The ratio of expenses excluding net deferred income tax expense to average net assets after waiver and recoupment was 1.28%, 1.25%, 1.25%, 1.28% and 1.24% for the fiscal years ended November 30, 2019, 2018, 2017, 2016 and 2015, respectively. |
| (f) | In addition to the fees and expenses which the Fund bears directly, it also indirectly bears a pro-rata share of the fees and expenses of the underlying funds in which it invests. Such indirect expenses are not included in the above expense ratios. |
| The notes to the financial statements are an integral part of, and should be read in conjunction with, the financial statements. | 33 |
MainStay Cushing Renaissance Advantage Fund
Investment and Performance Comparison1(Unaudited)
Performance data quoted represents past performance. Past performance is no guarantee of future results. Because of market volatility and other factors, current performance may be lower or higher than the figures shown. Investment return and principal value will fluctuate, and as a result, when shares are redeemed, they may be worth more or less than their original cost. The graph below depicts the historical performance of Class I shares of the Fund. Performance will vary from class to class based on differences in class-specific expenses and sales charges. For performance information current to the most recent month-end, please call800-624-6782 or visit nylinvestments.com/funds.
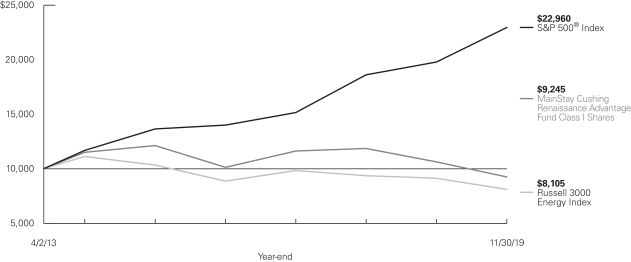
Average Annual Total Returns for the Year Ended November 30, 2019
| Class | Sales Charge | Inception Date | One Year | Five | Since Inception | Gross Expense Ratio2 | ||||||||||||||||||
| Class A Shares3 | Maximum 5.5% Initial Sales Charge | With sales charge Excluding sales charge | 4/2/2013 | | –17.97 –13.20 | %
| | –6.58 –5.52 | %
| | –2.24 –1.41 | %
| | 1.58 1.58 | %
| |||||||||
| Investor Class Shares | Maximum 5.5% Initial Sales Charge | With sales charge Excluding sales charge | 7/11/2014 | | –18.03 –13.26 |
| | –6.70 –5.64 |
| | –8.45 –7.48 |
| | 1.70 1.70 |
| |||||||||
| Class C Shares3 | Maximum 1% CDSC if Redeemed Within One Year of Purchase | With sales charge Excluding sales charge | 4/2/2013 | | –14.77 –13.94 |
| | –6.35 –6.35 |
| | –2.22 –2.22 |
| | 2.45 2.45 |
| |||||||||
| Class I Shares3 | No Sales Charge | 4/2/2013 | –12.95 | –5.27 | –1.17 | 1.33 | ||||||||||||||||||
| 1. | The performance table and graph do not reflect the deduction of taxes that a shareholder would pay on distributions or Fund share redemptions. Total returns reflect maximum applicable sales charges as indicated in the table above, if any, changes in share price, and reinvestment of dividend and capital gain distributions. The graph assumes the initial investment amount shown above and reflects the deduction of all sales charges that would have applied for the period of investment. Performance figures may reflect certain fee waivers and/or expense limitations, without which total returns may have been lower. For more information on share classes and current fee waivers and/or expense limitations (if any), please refer to the Notes to Financial Statements. |
| 2. | The gross expense ratios presented reflect the Fund’s “Total Annual Fund Operating Expenses” from the most recent Prospectus and may differ from other expense ratios disclosed in this report. |
| 3. | Performance figures for Class A shares, Class C shares and Class I shares reflect the historical performance of the then-existing Class A shares, Class C shares and Class I shares, respectively, of the Cushing® Renaissance Advantage Fund (the predecessor to the Fund, which was subject to a different fee structure) for periods prior to July 12, 2014. The Cushing® Renaissance Advantage Fund commenced operations on April 2, 2013. |
The footnotes on the next page are an integral part of the table and graph and should be carefully read in conjunction with them.
| 34 | MainStay Cushing Renaissance Advantage Fund |
| Benchmark Performance | One Year | Five Years | Since Inception | |||||||||
S&P 500® Index4 | 16.11 | % | 10.98 | % | 13.28 | % | ||||||
Russell 3000 Energy Index5 | –11.15 | –4.74 | –3.11 | |||||||||
Morningstar Natural Resources Category Average6 | –0.31 | –1.20 | –1.42 | |||||||||
| 4. | The S&P 500® Index is the Fund’s primary benchmark. “S&P 500®” is a trademark of The McGraw-Hill Companies, Inc. The S&P 500® Index is widely regarded as the standard index for measuring large-cap U.S. stock market performance. Results assume reinvestment of all dividends and capital gains. An investment cannot be made directly in an index. |
| 5. | The Russell 3000 Energy Index is the Fund’s secondary benchmark. The Russell 3000 Energy Index represents the energy sector of the Russell 3000 Index, an index that measures the performance of the largest 3,000 U.S. companies representing approximately 98% of the investable U.S. equity market. |
| 6. | The Morningstar Natural Resources Category Average is representative of funds that invest primarily on Commodity-based industries such as energy, chemicals, minerals, and forest products in the United States or outside of the United States. Some portfolios invest across this spectrum to offer broad natural-resources exposure. Others concentrate heavily or even exclusively in specific industries. Portfolios that concentrate primarily in energy-related industries are part of the equity energy category. Results are based on average total returns of similar funds with all dividends and capital gain distributions reinvested. |
The footnotes on the preceding page are an integral part of the table and graph and should be carefully read in conjunction with them.
| 35 |
Cost in Dollars of a $1,000 Investment in MainStay Cushing Renaissance Advantage Fund (Unaudited)
The example below is intended to describe the fees and expenses borne by shareholders during thesix-month period from June 1, 2019, to November 30, 2019, and the impact of those costs on your investment.
Example
As a shareholder of the Fund, you incur two types of costs: (1) transaction costs, including exchange fees and sales charges (loads) on purchases (as applicable), and (2) ongoing costs, including management fees, distribution and/or service(12b-1) fees, and other Fund expenses (as applicable). This example is intended to help you understand your ongoing costs (in dollars) of investing in the Fund and to compare these costs with the ongoing costs of investing in other mutual funds. The example is based on an investment of $1,000 made at the beginning of thesix-month period and held for the entire period from June 1, 2019, to November 30, 2019.
This example illustrates your Fund’s ongoing costs in two ways:
Actual Expenses
The second and third data columns in the table below provide information about actual account values and actual expenses. You may use the information in these columns, together with the amount you invested, to estimate the expenses that you paid during the six months ended November 30, 2019. Simply divide your account value by $1,000 (for example, an $8,600 account value divided by $1,000 = 8.6), then
multiply the result by the number under the heading entitled “Expenses Paid During Period” to estimate the expenses you paid on your account during this period.
Hypothetical Example for Comparison Purposes
The fourth and fifth data columns in the table below provide information about hypothetical account values and hypothetical expenses based on the Fund’s actual expense ratio and an assumed rate of return of 5% per year before expenses, which is not the Fund’s actual return. The hypothetical account values and expenses may not be used to estimate the actual ending account balances or expenses you paid forthe six-month period shown. You may use this information to compare the ongoing costs of investing in the Fund with the ongoing costs of investing in other mutual funds. To do so, compare this 5% hypothetical example with the 5% hypothetical examples that appear in the shareholder reports of the other Funds.
Please note that the expenses shown in the table are meant to highlight your ongoing costs only and do not reflect any transactional costs, such as exchange fees or sales charges (loads). Therefore, the fourth and fifth data columns of the table are useful in comparing ongoing costs only and will not help you determine the relative total costs of owning different funds. In addition, if these transactional costs were included, your costs would have been higher.
| Share Class | Beginning Value | Ending Account Value (Based | Expenses During | Ending Account Value (Based on Hypothetical 5% Annualized Return and Actual Expenses) 11/30/19 | Expenses During | Net Expense Ratio During Period2 | ||||||||||||||||
| Class A Shares | $ | 1,000.00 | $ | 963.60 | $ | 7.93 | $ | 1,017.00 | $ | 8.14 | 1.61% | |||||||||||
| Investor Class Shares | $ | 1,000.00 | $ | 963.40 | $ | 8.42 | $ | 1,016.50 | $ | 8.64 | 1.71% | |||||||||||
| Class C Shares | $ | 1,000.00 | $ | 960.10 | $ | 12.04 | $ | 1,012.78 | $ | 12.36 | 2.45% | |||||||||||
| Class I Shares | $ | 1,000.00 | $ | 965.40 | $ | 6.55 | $ | 1,018.40 | $ | 6.73 | 1.33% | |||||||||||
| 1. | Expenses are equal to the Fund’s annualized expense ratio of each class multiplied by the average account value over the period, divided by 365 and multiplied by 183 (to reflect thesix-month period). The table above represents the actual expenses incurred during thesix-month period. |
| 2. | Expenses are equal to the Fund’s annualized expense ratio to reflect thesix-month period. |
| 36 | MainStay Cushing Renaissance Advantage Fund |
Portfolio Composition as of November 30, 2019(1)(Unaudited)
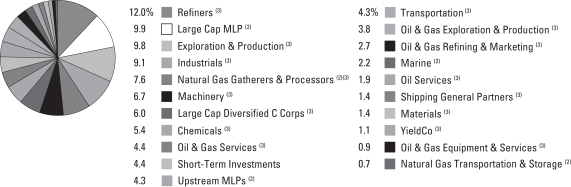
See Portfolio of Investments beginning on page 38 for specific holdings within these categories.
Top Ten Holdings as of November 30, 2019(excluding short-term investments)(Unaudited)
| 1. | Valero Energy Corporation |
| 2. | Jacobs Engineering Group, Inc. |
| 3. | Energy Transfer, L.P. |
| 4. | Cheniere Energy, Inc. |
| 5. | Viper Energy Partners, L.P. |
| 6. | Targa Resources Corporation |
| 7. | Marathon Petroleum Corporation |
| 8. | DCP Midstream Partners, L.P. |
| 9. | Southwest Airlines Company |
| 10. | Diamondback Energy, Inc. |
| (1) | Fund holdings and sector allocations are subject to change, and there is no assurance that the Fund will continue to hold any particular security. |
| (2) | MLP Investments and Related Companies |
| (3) | Common Stocks |
| 37 |
Portfolio Management Discussion and Analysis(Unaudited)
Questions answered by portfolio managers Jerry V. Swank, Matthew A. Lemme, CFA,1 and Saket Kumar of Cushing Asset Management, LP, the Fund’s Subadvisor.
How did MainStay Cushing Renaissance Advantage Fund perform relative to its benchmarks and peer group during the 12 months ended November 30, 2019?
For the 12 months ended November 30, 2019, Class I shares of MainStay Cushing Renaissance Advantage Fund returned –12.95%, underperforming the 16.11% return of the Fund’s primary benchmark, the S&P 500® Index. Over the same period, Class I shares underperformed the –11.15% return of the Russell 3000® Energy Index, which is the Fund’s secondary benchmark, and underperformed the –0.31% return of the Morningstar Natural Resources Category Average.2
Were there any changes to the Fund?
At a meeting held on December 10-11, 2019, the Board approved an Agreement and Plan of Reorganization (“Plan of Reorganization”) with respect to MainStay Cushing Renaissance Advantage Fund, which provides for the reorganization of the Fund with and into MainStay CBRE Global Infrastructure Fund. This Plan of Reorganization is subject to approval by shareholders at a special meeting expected to be held on or about April 27, 2020. (See Note 11—Subsequent Events.)
What factors affected the Fund’s relative performance during the reporting period?
The Fund’s performance lagged its benchmark, the S&P 500® Index, because the Fund’s investment strategy focuses on energy, industrial and manufacturing companies. By comparison, the Index tracks the performance of stocks in a wide variety of sectors. The energy sector components of the Index declined –10.0% for the reporting period, compared to the Index’s overall 16.11% gain for the same period.
During the reporting period, which subsectors were the strongest positive contributors to the Fund’s relative performance and which subsectors were particularly weak?
The subsectors making the largest positive contributions to the Fund’s performance relative to the S&P 500® Index included refiners and industrials. (Contributions take weightings and total returns into account.) The most significant laggards included the exploration & production and oil services subsectors.
During the reporting period, which individual stocks made the strongest positive contributions to the Fund’s absolute performance and which stocks detracted the most?
Holdings in petroleum refiner Valero Energy Corporation and engineering and construction company Jacobs Engineering
Group, Inc. provided the strongest positive contributions to the Fund’s absolute performance during the reporting period. Valero benefited from the curtailment of Canadian crude oil into the United States and anticipation of new ship fuel requirements. Jacobs traded higher on the sale of its execution business in order to improve company margins.
The most substantial detractors from the Fund’s absolute performance included midstream energy company DCP Midstream Partners, L.P. and midstream liquefied natural gas (“LNG”) provider Golar LNG Ltd. Both companies faced pressure resulting from weak natural gas and global LNG prices, prompting the Fund to reduce the size of both positions.
What were some of the Fund’s largest purchases and sales during the reporting period?
The Fund’s largest purchases during the reporting period included Jacobs Engineering Group, mentioned above, and midstream oil and natural gas company Viper Energy Partners, L.P. The Fund initiated its position in Jacobs due to the company’s commitment to changing its portfolio of business lines in an effort to raise margins. The Fund’s purchase of shares in Viper reflected our view that the stock offered an undervalued opportunity to gain exposure to Permian Basin drilling activity in anticipation of a recovery in that area.
The Fund’s largest sales during the reporting period included exits from transportation and logistics services provider XPO Logistics, Inc. and water application engineering company Xylem. The Fund sold its XPO Logistics holdings in response to the company’s lack of execution and sold its position in Xylem due to the company’s absolute and relative valuation.
How did the Fund’s subsector weightings change during the reporting period?
The Fund’s largest subsector increases during the reporting period were in refiners and engineering & construction. The Fund’s most substantial decreases during the reporting period were in the industrials subsector, while exposure to the transportation subsector was also reduced.
How was the Fund positioned at the end of the reporting period?
At the end of the reporting period, the Fund’s largest positions included midstream oil and gas company Energy Transfer, L.P. and midstream LNG provider Cheniere Energy, Inc. As of the same date, the Fund’s smallest positions included midstream energy company EnLink Midstream LLC and industrial transportation and logistics company Schneider National.
| 1. | Effective January 21, 2020, Matthew A. Lemme no longer serves as a portfolio manager of the Fund. |
| 2. | See page 34 for other share class returns, which may be higher or lower than Class I share returns. See page 35 for more information on benchmark and peer group returns. |
The opinions expressed are those of the portfolio managers as of the date of this report and are subject to change. There is no guarantee that any forecasts will come to pass. This material does not constitute investment advice and is not intended as an endorsement of any specific investment.
| 38 | MainStay Cushing Renaissance Advantage Fund |
Portfolio of InvestmentsNovember 30, 2019
| Shares | Value | |||||||
| Common Stocks 75.1%† |
| |||||||
Chemicals 5.4% |
| |||||||
Netherlands 2.2% |
| |||||||
LyondellBasell Industries NV | 7,414 | $ | 686,092 | |||||
United States 3.2% |
| |||||||
Dow, Inc. | 13,282 | 708,860 | ||||||
Westlake Chemical Corporation | 4,613 | 316,821 | ||||||
|
| |||||||
| 1,711,773 | ||||||||
|
| |||||||
Exploration & Production 9.8% |
| |||||||
Canada 1.7% |
| |||||||
Encana Corporation | 136,208 | 536,660 | ||||||
United States 8.1% |
| |||||||
Concho Resources, Inc. | 7,649 | 555,011 | ||||||
Matador Resource Company (a) | 24,495 | 344,890 | ||||||
Occidental Petroleum Corporation | 7,598 | 293,055 | ||||||
Parsley Energy, Inc. | 48,610 | 728,178 | ||||||
Pioneer Natural Resource Company | 4,187 | 535,266 | ||||||
Rosehill Resources, Inc. (a) | 102,790 | 120,264 | ||||||
|
| |||||||
| 3,113,324 | ||||||||
|
| |||||||
Industrials 9.1% |
| |||||||
Ireland 2.0% |
| |||||||
Eaton Corporation PLC | 6,908 | 638,990 | ||||||
United States 7.1% |
| |||||||
Jacobs Engineering Group, Inc. | 18,064 | 1,663,514 | ||||||
United Rentals, Inc. (a) | 3,717 | 568,887 | ||||||
|
| |||||||
| 2,871,391 | ||||||||
|
| |||||||
Large Cap Diversified C Corps 6.0% |
| |||||||
Canada 1.3% |
| |||||||
Pembina Pipeline Corporation | 11,839 | 414,365 | ||||||
United States 4.7% |
| |||||||
Cheniere Energy, Inc. (a) | 24,785 | 1,500,484 | ||||||
|
| |||||||
| 1,914,849 | ||||||||
|
| |||||||
Machinery 6.7% |
| |||||||
United States 6.7% |
| |||||||
Cactus, Inc. | 11,693 | 353,012 | ||||||
Oshkosh Corporation | 6,690 | 605,177 | ||||||
Wabtec Corporation | 10,579 | 831,192 | ||||||
Xylem, Inc. | 4,277 | 331,510 | ||||||
|
| |||||||
| 2,120,891 | ||||||||
|
| |||||||
Materials 1.4% |
| |||||||
United States 1.4% |
| |||||||
Allegheny Technologies, Inc. (a) | 18,613 | 429,216 | ||||||
|
| |||||||
Natural Gas Gatherers & Processors 4.2% |
| |||||||
United States 4.2% |
| |||||||
EnLink Midstream LLC | 25,035 | 118,916 | ||||||
Targa Resources Corporation | 32,930 | 1,202,933 | ||||||
|
| |||||||
| 1,321,849 | ||||||||
|
| |||||||
| Shares | Value | |||||||
Oil & Gas Equipment & Services 0.9% |
| |||||||
United States 0.9% |
| |||||||
FTS International, Inc. (a) | 10,022 | $ | 10,423 | |||||
Select Energy Services, Inc. (a) | 32,988 | 253,348 | ||||||
U.S. Well Services, Inc. (a) | 16,510 | 26,416 | ||||||
|
| |||||||
| 290,187 | ||||||||
|
| |||||||
Oil & Gas Exploration & Production 3.8% |
| |||||||
United States 3.8% |
| |||||||
Cimarex Energy Company | 6,885 | 316,503 | ||||||
Diamondback Energy, Inc. | 11,491 | 888,714 | ||||||
|
| |||||||
| 1,205,217 | ||||||||
|
| |||||||
Oil & Gas Refining & Marketing 2.7% |
| |||||||
United States 2.7% |
| |||||||
WPX Energy, Inc. (a) | 88,393 | 869,787 | ||||||
|
| |||||||
Oil & Gas Services 4.4% |
| |||||||
Curaco 1.4% |
| |||||||
Schlumberger Ltd. | 12,352 | 447,143 | ||||||
United States 3.0% |
| |||||||
New Fortress Energy LLC (a) | 42,184 | 631,494 | ||||||
Patterson Utilities Energy, Inc. | 35,971 | 321,581 | ||||||
|
| |||||||
| 1,400,218 | ||||||||
|
| |||||||
Oil Services 1.9% |
| |||||||
United States 1.9% |
| |||||||
Halliburton Company | 29,468 | 618,533 | ||||||
|
| |||||||
Refiners 12.0% |
| |||||||
United States 12.0% |
| |||||||
HollyFrontier Corporation | 9,365 | 482,766 | ||||||
Marathon Petroleum Corporation | 19,632 | 1,190,484 | ||||||
Phillips 66 | 3,908 | 448,326 | ||||||
Valero Energy Corporation | 17,671 | 1,687,404 | ||||||
|
| |||||||
| 3,808,980 | ||||||||
|
| |||||||
Shipping General Partners 1.4% |
| |||||||
Bermuda 1.4% |
| |||||||
Golar LNG Ltd. | 33,172 | 431,899 | ||||||
|
| |||||||
Transportation 4.3% |
| |||||||
United States 4.3% |
| |||||||
Kirby Corporation (a) | 3,492 | 294,620 | ||||||
Southwest Airlines Company | 18,628 | 1,073,718 | ||||||
|
| |||||||
| 1,368,338 | ||||||||
|
| |||||||
YieldCo 1.1% |
| |||||||
United States 1.1% |
| |||||||
Clearway Energy, Inc. | 17,333 | 343,713 | ||||||
|
| |||||||
Total Common Stocks | 23,820,165 | |||||||
|
| |||||||
| The notes to the financial statements are an integral part of, and should be read in conjunction with, the financial statements. | 39 |
Portfolio of InvestmentsNovember 30, 2019 (continued)
| Shares | Value | |||||||
| MLP Investments and Related Companies 20.5% |
| |||||||
Large Cap MLP 9.9% |
| |||||||
United States 9.9% |
| |||||||
Energy Transfer, L.P. | 130,532 | $ | 1,541,583 | |||||
Enterprise Products Partners, L.P. | 32,108 | 845,083 | ||||||
Plains All American Pipeline, L.P. | 44,376 | 772,142 | ||||||
|
| |||||||
| 3,158,808 | ||||||||
|
| |||||||
Marine 2.2% |
| |||||||
Republic of the Marshall Islands 2.2% |
| |||||||
GasLog Partners, L.P. | 47,142 | 685,916 | ||||||
|
| |||||||
Natural Gas Gatherers & Processors 3.4% |
| |||||||
United States 3.4% |
| |||||||
DCP Midstream Partners, L.P. | 51,319 | 1,083,344 | ||||||
|
| |||||||
Natural Gas Transportation & Storage 0.7% |
| |||||||
United States 0.7% |
| |||||||
EQM Midstream Partners, L.P. | 10,116 | 234,388 | ||||||
|
| |||||||
Upstream MLPs 4.3% |
| |||||||
United States 4.3% |
| |||||||
Viper Energy Partners, L.P. | 57,108 | 1,354,602 | ||||||
|
| |||||||
Total MLP Investments and Related Companies (Cost $7,831,466) | 6,517,058 | |||||||
|
| |||||||
| Shares | Value | |||||||
| Short-Term Investments—Investment Companies 4.4% |
| |||||||
United States 4.4% |
| |||||||
First American Government Obligations Fund—Class X, 1.56% (b) | 689,882 | $ | 689,882 | |||||
First American Treasury Obligations Fund—Class X, 1.59% (b) | 689,882 | 689,882 | ||||||
|
| |||||||
TotalShort-Term Investments—Investment Companies (Cost $1,379,764) |
| 1,379,764 | ||||||
|
| |||||||
Total Investments | 100.0 | % | 31,716,987 | |||||
Other Assets, Less Liabilities | 0.0 | ‡ | (12,200 | ) | ||||
Net Assets | 100.0 | % | $ | 31,704,787 | ||||
| † | Calculated as a percentage of net assets applicable to common shareholders. |
| ‡ | Less than 0.01%. |
| (a) | Non-income producing security. |
| (b) | Current yield as of November 30, 2019. |
The following is a summary of the fair valuations according to the inputs used as of November 30, 2019, for valuing the Fund’s assets.
Description | Quoted Prices in Active Markets for Identical Assets (Level 1) | Significant Other Observable Inputs (Level 2) | Significant Unobservable Inputs (Level 3) | Total | ||||||||||||
Asset Valuation Inputs | ||||||||||||||||
| Investments in Securities (a) | ||||||||||||||||
Common Stocks | $ | 23,820,165 | $ | — | $ | — | $ | 23,820,165 | ||||||||
MLP Investments and Related Companies | 6,517,058 | — | — | 6,517,058 | ||||||||||||
Short-Term Investments—Investment Companies | 1,379,764 | — | — | 1,379,764 | ||||||||||||
|
|
|
|
|
|
|
| |||||||||
| Total Investments in Securities | $ | 31,716,987 | $ | — | $ | — | $ | 31,716,987 | ||||||||
|
|
|
|
|
|
|
| |||||||||
| (a) | For a complete listing of investments and their industries, see the Portfolio of Investments. |
| 40 | MainStay Cushing Renaissance Advantage Fund | The notes to the financial statements are an integral part of, and should be read in conjunction with, the financial statements. |
Statement of Assets and Liabilitiesas of November 30, 2019
| Assets | ||||
Investments, at value | $ | 31,716,987 | ||
Receivables: | ||||
Dividends and interest | 63,825 | |||
Fund shares sold | 7,448 | |||
Prepaid expenses | 23,182 | |||
|
| |||
Total assets | 31,811,442 | |||
|
| |||
| Liabilities | ||||
Payables: | ||||
Manager fees (See Note 3) | 38,065 | |||
Transfer agent (See Note 3) | 21,262 | |||
Fund shares redeemed | 18,845 | |||
Shareholder communication | 10,595 | |||
NYLIFE Distributors (See Note 3) | 8,406 | |||
Professional fees | 3,640 | |||
Custodian | 2,379 | |||
Trustees | 1,932 | |||
Dividends payable | 1,435 | |||
Accrued expenses | 96 | |||
|
| |||
Total liabilities | 106,655 | |||
|
| |||
Net assets | $ | 31,704,787 | ||
|
| |||
| Composition of Net Assets | ||||
Shares of beneficial interest outstanding (par value of $.001 per share) unlimited number of shares authorized | $ | 2,107 | ||
Additionalpaid-in capital | 102,292,444 | |||
|
| |||
| 102,294,551 | ||||
Total distributable earnings (loss) | (70,589,764 | ) | ||
|
| |||
Net assets | $ | 31,704,787 | ||
|
| |||
Class A | ||||
Net assets applicable to outstanding shares | $ | 12,474,797 | ||
|
| |||
Shares of beneficial interest outstanding | 823,887 | |||
|
| |||
Net asset value per share outstanding | $ | 15.14 | ||
Maximum sales charge (5.50% of offering price) | 0.88 | |||
|
| |||
Maximum offering price per share outstanding | $ | 16.02 | ||
|
| |||
Investor Class | ||||
Net assets applicable to outstanding shares | $ | 1,819,415 | ||
|
| |||
Shares of beneficial interest outstanding | 120,906 | |||
|
| |||
Net asset value per share outstanding | $ | 15.05 | ||
Maximum sales charge (5.50% of offering price) | 0.88 | |||
|
| |||
Maximum offering price per share outstanding | $ | 15.93 | ||
|
| |||
Class C | ||||
Net assets applicable to outstanding shares | $ | 6,035,575 | ||
|
| |||
Shares of beneficial interest outstanding | 423,614 | |||
|
| |||
Net asset value per share outstanding | $ | 14.25 | ||
|
| |||
Class I | ||||
Net assets applicable to outstanding shares | $ | 11,375,000 | ||
|
| |||
Shares of beneficial interest outstanding | 738,380 | |||
|
| |||
Net asset value per share outstanding | $ | 15.41 | ||
|
|
| The notes to the financial statements are an integral part of, and should be read in conjunction with, the financial statements. | 41 |
Statement of Operationsfor the year ended November 30, 2019
| Investment Income (Loss) |
| |||
Income | ||||
Dividends and distributions | $ | 570,202 | ||
Interest | 58,489 | |||
|
| |||
Total income | 628,691 | |||
|
| |||
Expenses | ||||
Manager (See Note 3) | 688,432 | |||
Distribution/Service—Class A (See Note 3) | 41,648 | |||
Distribution/Service—Investor Class (See Note 3) | 5,490 | |||
Distribution/Service—Class C (See Note 3) | 83,720 | |||
Transfer agent (See Note 3) | 98,177 | |||
Registration | 79,202 | |||
Professional fees | 47,914 | |||
Shareholder communication | 28,235 | |||
Custodian | 4,917 | |||
Trustees | 2,859 | |||
Insurance | 990 | |||
Miscellaneous | 11,112 | |||
|
| |||
Net total expenses | 1,092,696 | |||
Expense waiver/reimbursement from Manager (See Note 3) | (98,893 | ) | ||
|
| |||
Net expenses | 993,803 | |||
|
| |||
Net investment income (loss) | (365,112 | ) | ||
|
| |||
| Realized and Unrealized Gain (Loss) on Investments |
| |||
Net realized gain (loss) on: | ||||
Investments | (6,746,687 | ) | ||
Foreign currency transactions | 3 | |||
|
| |||
Net realized gain (loss) on investments and foreign currency transactions | (6,746,684 | ) | ||
|
| |||
Net change in unrealized appreciation (depreciation) on investments | (56,613 | ) | ||
|
| |||
Net realized and unrealized gain (loss) on investments | (6,803,297 | ) | ||
|
| |||
Net increase (decrease) in net assets resulting from operations | $ | (7,168,409 | ) | |
|
| |||
| (a) | Dividends and distributions recorded net of foreign withholding taxes in the amount of $6,632. |
| 42 | MainStay Cushing Renaissance Advantage Fund | The notes to the financial statements are an integral part of, and should be read in conjunction with, the financial statements. |
Statements of Changes in Net Assets
| Year ended November 30, 2019 | Year ended November 30, 2018 | |||||||
| Increase (Decrease) in Net Assets |
| |||||||
Operations: | ||||||||
Net investment income (loss) | $ | (365,112 | ) | $ | (1,139,175 | ) | ||
Net realized gain (loss) on investments and foreign currency transactions | (6,746,684 | ) | 10,353,711 | |||||
Net change in unrealized appreciation | ||||||||
(depreciation) on investments | (56,613 | ) | (17,559,398 | ) | ||||
|
| |||||||
Net increase (decrease) in net assets resulting from operations | (7,168,409 | ) | (8,344,862 | ) | ||||
|
| |||||||
Distributions to shareholders from return of capital: | ||||||||
Class A | (557,578 | ) | (677,117 | ) | ||||
Investor Class | (74,359 | ) | (79,671 | ) | ||||
Class C | (291,716 | ) | (429,454 | ) | ||||
Class I | (1,206,050 | ) | (2,006,034 | ) | ||||
|
| |||||||
Total distributions to shareholders | (2,129,703 | ) | (3,192,276 | ) | ||||
|
| |||||||
Capital share transactions: | ||||||||
Net proceeds from sale of shares | 15,285,356 | 21,261,821 | ||||||
Net asset value of shares issued to shareholders in reinvestment of dividends and distributions | 2,062,910 | 3,075,212 | ||||||
Cost of shares redeemed | (66,487,111 | ) | (86,003,681 | ) | ||||
|
| |||||||
Increase (decrease) in net assets derived from capital share transactions | (49,138,845 | ) | (61,666,648 | ) | ||||
|
| |||||||
Net increase (decrease) in net assets | (58,436,957 | ) | (73,203,786 | ) | ||||
| Net Assets | ||||||||
Beginning of year | 90,141,744 | 163,345,530 | ||||||
|
| |||||||
End of year | $ | 31,704,787 | $ | 90,141,744 | ||||
|
| |||||||
| The notes to the financial statements are an integral part of, and should be read in conjunction with, the financial statements. | 43 |
Financial Highlightsselected per share data and ratios
| Year ended November 30, | ||||||||||||||||||||
| Class A | 2019 | 2018 | 2017 | 2016 | 2015 | |||||||||||||||
Net asset value at beginning of year | $ | 18.03 | $ | 20.75 | $ | 20.95 | $ | 18.91 | $ | 23.29 | ||||||||||
|
|
|
|
|
|
|
|
|
| |||||||||||
Net investment income (loss) (a) | (0.11 | ) | (0.20 | ) | (0.21 | ) | (0.01 | ) | 0.03 | |||||||||||
Net realized and unrealized gain (loss) on investments | (2.22 | ) | (1.96 | ) | 0.57 | 2.61 | (3.85 | ) | ||||||||||||
|
|
|
|
|
|
|
|
|
| |||||||||||
Total from investment operations | (2.33 | ) | (2.16 | ) | 0.36 | 2.60 | (3.82 | ) | ||||||||||||
|
|
|
|
|
|
|
|
|
| |||||||||||
| Less distributions: | ||||||||||||||||||||
From net investment income | — | — | — | — | (0.03 | ) | ||||||||||||||
From return of capital | (0.56 | ) | (0.56 | ) | (0.56 | ) | (0.56 | ) | (0.53 | ) | ||||||||||
|
|
|
|
|
|
|
|
|
| |||||||||||
Total dividends and distributions | (0.56 | ) | (0.56 | ) | (0.56 | ) | (0.56 | ) | (0.56 | ) | ||||||||||
|
|
|
|
|
|
|
|
|
| |||||||||||
Net asset value at end of year | $ | 15.14 | $ | 18.03 | $ | 20.75 | $ | 20.95 | $ | 18.91 | ||||||||||
|
|
|
|
|
|
|
|
|
| |||||||||||
Total investment return (b) | (13.20 | %) | (10.77 | %) | 1.87 | % | 14.35 | % | (16.57 | %) | ||||||||||
| Ratios (to average net assets)/Supplemental Data: | ||||||||||||||||||||
Net investment income (loss) | (0.66 | %) | (0.97 | %) | (1.05 | %) | (0.06 | %) | 0.15 | % | ||||||||||
Net expenses (c) | 1.61 | % | 1.61 | % | 1.59 | % | 1.65 | % | 1.69 | % | ||||||||||
Expenses (before waiver/reimbursement) (c) | 1.77 | % | 1.62 | % | 1.59 | % | 1.68 | % | 1.73 | % | ||||||||||
Portfolio turnover rate | 97 | % | 137 | % | 166 | % | 314 | % | 149 | % | ||||||||||
Net assets at end of year (in 000’s) | $ | 12,475 | $ | 19,587 | $ | 27,303 | $ | 38,686 | $ | 42,135 | ||||||||||
| (a) | Per share data based on average shares outstanding during the period. |
| (b) | Total investment return is calculated exclusive of sales charges and assumes the reinvestment of dividends and distributions. For periods of less than one year, total return is not annualized. |
| (c) | In addition to the fees and expenses which the Fund bears directly, it also indirectly bears a pro-rata share of the fees and expenses of the underlying funds in which it invests. Such indirect expenses are not included in the above expense ratios. |
| Year ended November 30, | ||||||||||||||||||||
| Investor Class | 2019 | 2018 | 2017 | 2016 | 2015 | |||||||||||||||
Net asset value at beginning of year | $ | 17.94 | $ | 20.67 | $ | 20.90 | $ | 18.90 | $ | 23.30 | ||||||||||
|
|
|
|
|
|
|
|
|
| |||||||||||
Net investment income (loss) (a) | (0.13 | ) | (0.22 | ) | (0.24 | ) | (0.04 | ) | 0.00 | ‡ | ||||||||||
Net realized and unrealized gain (loss) on investments | (2.20 | ) | (1.95 | ) | 0.57 | 2.60 | (3.84 | ) | ||||||||||||
|
|
|
|
|
|
|
|
|
| |||||||||||
Total from investment operations | (2.33 | ) | (2.17 | ) | 0.33 | 2.56 | (3.84 | ) | ||||||||||||
|
|
|
|
|
|
|
|
|
| |||||||||||
| Less distributions: | ||||||||||||||||||||
From net investment income | — | — | — | — | (0.03 | ) | ||||||||||||||
From return of capital | (0.56 | ) | (0.56 | ) | (0.56 | ) | (0.56 | ) | (0.53 | ) | ||||||||||
|
|
|
|
|
|
|
|
|
| |||||||||||
Total dividends and distributions | (0.56 | ) | (0.56 | ) | (0.56 | ) | (0.56 | ) | (0.56 | ) | ||||||||||
|
|
|
|
|
|
|
|
|
| |||||||||||
Net asset value at end of year | $ | 15.05 | $ | 17.94 | $ | 20.67 | $ | 20.90 | $ | 18.90 | ||||||||||
|
|
|
|
|
|
|
|
|
| |||||||||||
Total investment return (b) | (13.26 | %) | (10.87 | %) | 1.73 | % (c) | 14.15 | % (c) | (16.68 | %)(c) | ||||||||||
| Ratios (to average net assets)/Supplemental Data: | ||||||||||||||||||||
Net investment income (loss) | (0.82 | %) | (1.07 | %) | (1.21 | %) | (0.25 | %) | 0.01 | % | ||||||||||
Net expenses (d) | 1.75 | % | 1.72 | % | 1.74 | % | 1.80 | % | 1.83 | % | ||||||||||
Expenses (before waiver/reimbursement) (d) | 1.91 | % | 1.73 | % | 1.74 | % | 1.83 | % | 1.87 | % | ||||||||||
Portfolio turnover rate | 97 | % | 137 | % | 166 | % | 314 | % | 149 | % | ||||||||||
Net assets at end of year (in 000’s) | $ | 1,819 | $ | 2,427 | $ | 3,382 | $ | 3,985 | $ | 2,989 | ||||||||||
| ‡ | Less than one cent per share. |
| (a) | Per share data based on average shares outstanding during the period. |
| (b) | Total investment return is calculated exclusive of sales charges and assumes the reinvestment of dividends and distributions. For periods of less than one year, total return is not annualized. |
| (c) | Total investment return may reflect adjustments to conform to generally accepted accounting principles. |
| (d) | In addition to the fees and expenses which the Fund bears directly, it also indirectly bears a pro-rata share of the fees and expenses of the underlying funds in which it invests. Such indirect expenses are not included in the above expense ratios. |
| 44 | MainStay Cushing Renaissance Advantage Fund | The notes to the financial statements are an integral part of, and should be read in conjunction with, the financial statements. |
Financial Highlightsselected per share data and ratios
| Year ended November 30, | ||||||||||||||||||||
| Class C | 2019 | 2018 | 2017 | 2016 | 2015 | |||||||||||||||
Net asset value at beginning of year | $ | 17.15 | $ | 19.93 | $ | 20.32 | $ | 18.53 | $ | 23.02 | ||||||||||
|
|
|
|
|
|
|
|
|
| |||||||||||
Net investment income (loss) (a) | (0.24 | ) | (0.37 | ) | (0.37 | ) | (0.16 | ) | (0.15 | ) | ||||||||||
Net realized and unrealized gain (loss) on investments | (2.10 | ) | (1.85 | ) | 0.54 | 2.51 | (3.78 | ) | ||||||||||||
|
|
|
|
|
|
|
|
|
| |||||||||||
Total from investment operations | (2.34 | ) | (2.22 | ) | 0.17 | 2.35 | (3.93 | ) | ||||||||||||
|
|
|
|
|
|
|
|
|
| |||||||||||
| Less distributions: | ||||||||||||||||||||
From net investment income | — | — | — | — | (0.03 | ) | ||||||||||||||
From return of capital | (0.56 | ) | (0.56 | ) | (0.56 | ) | (0.56 | ) | (0.53 | ) | ||||||||||
|
|
|
|
|
|
|
|
|
| |||||||||||
Total dividends and distributions | (0.56 | ) | (0.56 | ) | (0.56 | ) | (0.56 | ) | (0.56 | ) | ||||||||||
|
|
|
|
|
|
|
|
|
| |||||||||||
Net asset value at end of year | $ | 14.25 | $ | 17.15 | $ | 19.93 | $ | 20.32 | $ | 18.53 | ||||||||||
|
|
|
|
|
|
|
|
|
| |||||||||||
Total investment return (b) | (13.94 | %) | (11.53 | %) | 0.98 | % | 13.28 | % | (17.28 | %) | ||||||||||
| Ratios (to average net assets)/Supplemental Data: | ||||||||||||||||||||
Net investment income (loss) | (1.54 | %) | (1.85 | %) | (1.92 | %) | (0.93 | %) | (0.72 | %) | ||||||||||
Net expenses (c) | 2.50 | % | 2.47 | % | 2.49 | % | 2.55 | % | 2.56 | % | ||||||||||
Expenses (before waiver/reimbursement) (c) | 2.66 | % | 2.48 | % | 2.49 | % | 2.58 | % | 2.60 | % | ||||||||||
Portfolio turnover rate | 97 | % | 137 | % | 166 | % | 314 | % | 149 | % | ||||||||||
Net assets at end of year (in 000’s) | $ | 6,036 | $ | 11,174 | $ | 17,216 | $ | 26,223 | $ | 35,398 | ||||||||||
| (a) | Per share data based on average shares outstanding during the period. |
| (b) | Total investment return is calculated exclusive of sales charges and assumes the reinvestment of dividends and distributions. For periods of less than one year, total return is not annualized. |
| (c) | In addition to the fees and expenses which the Fund bears directly, it also indirectly bears a pro-rata share of the fees and expenses of the underlying funds in which it invests. Such indirect expenses are not included in the above expense ratios. |
| Year ended November 30, | ||||||||||||||||||||
| Class I | 2019 | 2018 | 2017 | 2016 | 2015 | |||||||||||||||
Net asset value at beginning of year | $ | 18.29 | $ | 20.98 | $ | 21.13 | $ | 19.02 | $ | 23.36 | ||||||||||
|
|
|
|
|
|
|
|
|
| |||||||||||
Net investment income (loss) (a) | (0.05 | ) | (0.16 | ) | (0.16 | ) | 0.02 | 0.07 | ||||||||||||
Net realized and unrealized gain (loss) on investments | (2.27 | ) | (1.97 | ) | 0.57 | 2.65 | (3.85 | ) | ||||||||||||
|
|
|
|
|
|
|
|
|
| |||||||||||
Total from investment operations | (2.32 | ) | (2.13 | ) | 0.41 | 2.67 | (3.78 | ) | ||||||||||||
|
|
|
|
|
|
|
|
|
| |||||||||||
| Less distributions: | ||||||||||||||||||||
From net investment income | — | — | — | — | (0.03 | ) | ||||||||||||||
From return of capital | (0.56 | ) | (0.56 | ) | (0.56 | ) | (0.56 | ) | (0.53 | ) | ||||||||||
|
|
|
|
|
|
|
|
|
| |||||||||||
Total dividends and distributions | (0.56 | ) | (0.56 | ) | (0.56 | ) | (0.56 | ) | (0.56 | ) | ||||||||||
|
|
|
|
|
|
|
|
|
| |||||||||||
Net asset value at end of year | $ | 15.41 | $ | 18.29 | $ | 20.98 | $ | 21.13 | $ | 19.02 | ||||||||||
|
|
|
|
|
|
|
|
|
| |||||||||||
Total investment return (b) | (12.95 | %)(c) | (10.51 | %)(c) | 2.14 | % | 14.64 | % | (16.34 | %) | ||||||||||
| Ratios (to average net assets)/Supplemental Data: | ||||||||||||||||||||
Net investment income (loss) | (0.31 | %) | (0.73 | %) | (0.80 | %) | 0.12 | % | 0.34 | % | ||||||||||
Net expenses (d) | 1.35 | % | 1.36 | % | 1.34 | % | 1.40 | % | 1.43 | % | ||||||||||
Expenses (before waiver/reimbursement) (d) | 1.51 | % | 1.37 | % | 1.34 | % | 1.43 | % | 1.46 | % | ||||||||||
Portfolio turnover rate | 97 | % | 137 | % | 166 | % | 314 | % | 149 | % | ||||||||||
Net assets at end of year (in 000’s) | $ | 11,375 | $ | 56,953 | $ | 115,445 | $ | 148,250 | $ | 129,677 | ||||||||||
| (a) | Per share data based on average shares outstanding during the period. |
| (b) | Total investment return is calculated exclusive of sales charges and assumes the reinvestment of dividends and distributions. Class I shares are not subject to sales charges. For periods of less than one year, total return is not annualized. |
| (c) | Total investment return may reflect adjustments to conform to generally accepted accounting principles. |
| (d) | In addition to the fees and expenses which the Fund bears directly, it also indirectly bears a pro-rata share of the fees and expenses of the underlying funds in which it invests. Such indirect expenses are not included in the above expense ratios. |
| The notes to the financial statements are an integral part of, and should be read in conjunction with, the financial statements. | 45 |
Note 1–Organization and Business
MainStay Funds Trust (the “Trust”) was organized as a Delaware statutory trust on April 28, 2009 and is governed by a Declaration of Trust. The Trust is registered under the Investment Company Act of 1940, as amended (the “1940 Act”), as an open-end management investment company, and is comprised of thirty funds (collectively referred to as the “Funds” and each individually, referred to as a “Fund”). These financial statements and notes relate to the MainStay Cushing Energy Income Fund, MainStay Cushing MLP Premier Fund and MainStay Cushing Renaissance Advantage Fund (collectively referred to as the “MainStay Cushing Funds” and each individually referred to as a “MainStay Cushing Fund”). The MainStay Cushing Renaissance Advantage Fund is a “diversified” portfolio and the MainStay Cushing Energy Income Fund and the MainStay Cushing MLP Premier Fund are each a “non-diversified” portfolio, as each term is defined in the 1940 Act, as interpreted or modified by regulatory authorities having jurisdiction, from time to time. Each MainStay Cushing Fund is the successor to the corresponding series of The Cushing® Funds Trust (collectively referred to as the “Predecessor Funds” and each individually referred to as a “Predecessor Fund”), for which Cushing® Asset Management, LP, a Texas limited partnership and the MainStay Cushing Funds’ Subadvisor (as defined in Note 3(A)), served as investment adviser. The financial statements of the MainStay Cushing Funds reflect the historical results of the Predecessor Funds prior to their reorganization on July 11, 2014. Upon the completion of the reorganizations, Class A, Class C and Class I shares of each MainStay Cushing Fund assumed the performance, financial and other information of the Predecessor Funds.
TheMainStay Cushing Energy Income Fund currently has five classes of shares registered for sale. Class A, Class C and Class I shares commenced operations on July 2, 2012. Investor Class shares commenced operations on July 11, 2014. Class R6 shares of the Fund were registered for sale effective as of March 31, 2017. As of November 30, 2019, Class R6 shares were not yet offered for sale. The Fund’s investment objective is to seek current income and capital appreciation.
TheMainStay Cushing MLP Premier Fund currently has five classes of shares registered for sale. Class A, Class C and Class I shares commenced operations on October 20, 2010. Investor Class shares commenced operations on July 11, 2014. Class R6 shares of the Fund were registered for sale effective as of March 31, 2017. As of November 30, 2019, Class R6 shares were not yet offered for sale. The Fund’s investment objective is to seek current income and capital appreciation. In seeking current income, the Fund intends to pay current cash distributions to shareholders, regardless of the character of such distributions for tax or accounting purposes.
TheMainStay Cushing Renaissance Advantage Fund currently has five classes of shares registered for sale. Class A, Class C and Class I shares commenced operations on April 2, 2013. Investor Class shares commenced operations on July 11, 2014. Class R6 shares of the Fund were registered for sale effective as of March 31, 2017. As of November 30, 2019, Class R6 shares were not yet offered for sale. The Fund’s investment objective is to seek total return.
Class A and Investor Class shares are offered at net asset value (“NAV”) per share plus an initial sales charge. No initial sales charge applies to investments of $1 million or more (and certain other qualified
purchases) in Class A and Investor Class shares. However, a contingent deferred sales charge (“CDSC”) of 1.00% may be imposed on certain redemptions of Class A and Investor Class shares made within 18 months of the date of purchase on shares that were purchased without an initial sales charge. Class C shares are offered at NAV without an initial sales charge, although a 1.00% CDSC may be imposed on certain redemptions of such shares made within one year of the date of purchase of Class C shares. Class I shares are offered at NAV without a sales charge. Class R6 shares are currently expected to be offered at NAV without a sales charge. Class A shares may convert automatically to Investor Class shares and Investor Class shares may convert automatically to Class A shares. In addition, depending upon eligibility, Class C shares convert to either Class A or Investor Class shares at the end of the calendar quarter ten years after the date they were purchased. Under certain circumstances and as may be permitted by the Trust’s multiple class plan pursuant to Rule 18f-3 under the 1940 Act, specified share classes of a MainStay Cushing Fund may be converted to one or more other share classes of the MainStay Cushing Fund as disclosed in the capital share transactions within these notes. The classes of shares have the same voting (except for issues that relate solely to one class), dividend, liquidation and other rights, and the same terms and conditions, except that, under distribution plans pursuant to Rule 12b-1 under the 1940 Act, Class C shares are subject to higher distribution and/or service fees than Class A and Investor Class shares. Class I and Class R6 shares are not subject to a distribution and/or service fee.
Note 2–Significant Accounting Policies
The MainStay Cushing Funds are investment companies and accordingly follow the investment company accounting and reporting guidance of the Financial Accounting Standards Board (“FASB”) Accounting Standard CodificationTopic 946 Financial Services—Investment Companies. The MainStay Cushing Funds prepare their financial statements in accordance with generally accepted accounting principles (“GAAP”) in the United States and follow the significant accounting policies described below.
(A) Securities Valuation. Investments are usually valued as of the close of regular trading on the New York Stock Exchange (the “Exchange”) (usually 4:00 p.m. Eastern time) on each day the MainStay Cushing Funds are open for business (“valuation date”).
The Board of Trustees of the Trust (the “Board”) adopted procedures establishing methodologies for the valuation of each MainStay Cushing Fund’s securities and other assets and delegated the responsibility for valuation determinations under those procedures to the Valuation Committee of the Trust (the “Valuation Committee”). The Board authorized the Valuation Committee to appoint a Valuation Subcommittee (the “Subcommittee”) to deal in the first instance with establishing the prices of securities for which market quotations are not readily available or the prices of which are not otherwise readily determinable under these procedures. The Subcommittee meets (in person, via electronic mail or via teleconference) on an as-needed basis. Subsequently, the Valuation Committee meets to ensure that actions taken by the Subcommittee were appropriate. The procedures state that, subject to the oversight of the Board and unless otherwise noted, the responsibility for theday-to-day valuation of portfolio assets (including fair value measurements for the MainStay Cushing Funds’
| 46 | MainStay Cushing Funds |
assets and liabilities) rests with New York Life Investment Management LLC (“New York Life Investments” or the “Manager”), aided to whatever extent necessary by the Subadvisor (as defined in Note 3(A)).
To assess the appropriateness of security valuations, the Manager, the Subadvisor, or the MainStay Cushing Funds’ third-party service provider, who is subject to oversight by the Manager, regularly compares prior day prices, prices on comparable securities, and the sale prices to the prior and current day prices and challenges prices with changes exceeding certain tolerance levels with third party pricing services or broker sources. For those securities valued through either a standardized fair valuation methodology or a fair valuation measurement, the Subcommittee deals in the first instance with such valuation and the Valuation Committee reviews and affirms, if appropriate, the reasonableness of the valuation based on such methodologies and measurements on a regular basis after considering information that is reasonably available and deemed relevant by the Valuation Committee. Any action taken by the Subcommittee with respect to the valuation of a portfolio security or other asset is submitted for review and ratification (if appropriate) to the Valuation Committee and the Board at the next regularly scheduled meeting.
“Fair value” is defined as the price a MainStay Cushing Fund would reasonably expect to receive upon selling an asset or liability in an orderly transaction to an independent buyer in the principal or most advantageous market for the asset or liability. Fair value measurements are determined within a framework that establishes a three-tier hierarchy which maximizes the use of observable market data and minimizes the use of unobservable inputs to establish a classification of fair value measurements for disclosure purposes. “Inputs” refer broadly to the assumptions that market participants would use in pricing the asset or liability, including assumptions about risk, such as the risk inherent in a particular valuation technique used to measure fair value using a pricing model and/or the risk inherent in the inputs for the valuation technique. Inputs may be observable or unobservable. Observable inputs reflect the assumptions market participants would use in pricing the asset or liability based on market data obtained from sources independent of each MainStay Cushing Fund. Unobservable inputs reflect each MainStay Cushing Fund’s own assumptions about the assumptions market participants would use in pricing the asset or liability based on the information available. The inputs or methodology used for valuing assets or liabilities may not be an indication of the risks associated with investing in those assets or liabilities. The three-tier hierarchy of inputs is summarized below.
| • | Level 1—quoted prices in active markets for an identical asset or liability |
| • | Level 2—other significant observable inputs (including quoted prices for a similar asset or liability in active markets, interest rates and yield curves, prepayment speeds, credit risk, etc.) |
| • | Level 3—significant unobservable inputs (including each MainStay Cushing Fund’s own assumptions about the assumptions that market participants would use in measuring fair value of an asset or liability) |
The level of an asset or liability within the fair value hierarchy is based on the lowest level of an input, both individually and in the aggregate, that is significant to the fair value measurement. As of November 30, 2019, the aggregate value by input level of each MainStay Cushing
Fund’s assets and liabilities is included at the respective MainStay Cushing Fund’s Portfolio of Investments.
The MainStay Cushing Funds may use third party vendor evaluations, whose prices may be derived from one or more of the following standard inputs, among others:
• Benchmark Yields | • Reported Trades | |
• Broker/Dealer Quotes | • Issuer Spreads | |
• Two-sided markets | • Benchmark securities | |
• Bids/Offers | • Reference Data (corporate actions or material event notices) | |
• Industry and economic events | • Monthly payment information | |
• Comparable bonds |
An asset or liability for which market values cannot be measured using the methodologies described above is valued by methods deemed reasonable in good faith by the Valuation Committee, following the procedures established by the Board, to represent fair value. Under these procedures, the MainStay Cushing Funds generally use a market-based approach which may use related or comparable assets or liabilities, recent transactions, market multiples, book values, and other relevant information. The MainStay Cushing Funds may also use an income-based valuation approach in which the anticipated future cash flows of the asset or liability are discounted to calculate fair value. Discounts may also be applied due to the nature and/or duration of any restrictions on the disposition of the asset or liability. Fair value represents a good faith approximation of the value of a security. Fair value determinations involve the consideration of a number of subjective factors, an analysis of applicable facts and circumstances and the exercise of judgment. As a result, it is possible that the fair value for a security determined in good faith in accordance with the MainStay Cushing Funds’ valuation procedures may differ from valuations for the same security determined by other funds using their own valuation procedures. Although the MainStay Cushing Funds’ valuation procedures are designed to value a security at the price a MainStay Cushing Fund may reasonably expect to receive upon the security’s sale in an orderly transaction, there can be no assurance that any fair value determination thereunder would, in fact, approximate the amount that a MainStay Cushing Fund would actually realize upon the sale of the security or the price at which the security would trade if a reliable market price were readily available. For the year ended November 30, 2019, there were no material changes to the fair value methodologies.
Securities which may be valued in this manner include, but are not limited to: (i) a security for which trading has been halted or suspended; (ii) a debt security that has recently gone into default and for which there is not a current market quotation; (iii) a security of an issuer that has entered into a restructuring; (iv) a security that has been de-listed from a national exchange; (v) a security for which the market price is not readily available from a third party pricing source or, if so provided, does not, in the opinion of the Manager or Subadvisor reflect the security’s market value; (vi) a security subject to trading collars for which no or limited trading takes place; and (vii) a security whose principal market has been temporarily closed at a time when, under normal conditions, it would be open. Securities for which market quotations or observable inputs are not readily available are generally categorized as Level 3 in the hierarchy. As of November 30, 2019, securities that were fair valued
| 47 |
Notes to Financial Statements(continued)
in such a manner are shown in the applicable MainStay Cushing Fund’s Portfolio of Investments.
Certain securities held by the MainStay Cushing Funds may principally trade in foreign markets. Events may occur between the time the foreign markets close and the time at which the MainStay Cushing Funds’ NAVs are calculated. These events may include, but are not limited to, situations relating to a single issuer in a market sector, significant fluctuations in U.S. or foreign markets, natural disasters, armed conflicts, governmental actions or other developments not tied directly to the securities markets. Should the Manager or Subadvisor conclude that such events may have affected the accuracy of the last price of such securities reported on the local foreign market, the Subcommittee may, pursuant to procedures adopted by the Board, adjust the value of the local price to reflect the estimated impact on the price of such securities as a result of such events. In this instance, securities are generally categorized as Level 3 in the hierarchy. Additionally, certain foreign equity securities are also fair valued whenever the movement of a particular index exceeds certain thresholds. In such cases, the securities are fair valued by applying factors provided by a third party vendor in accordance with valuation procedures adopted by the Board and are generally categorized as Level 2 in the hierarchy. As of November 30, 2019, securities that were fair valued in such a manner are shown in the applicable MainStay Cushing Fund’s Portfolio of Investments.
Equity securities, rights, and exchange-traded funds are valued at the last quoted sales prices as of the close of regular trading on the relevant exchange on each valuation date. Securities that are not traded on the valuation date are valued at the mean of the last quoted bid and ask prices. Prices are normally taken from the principal market in which each security trades.
Investments in mutual funds, including money market funds, are valued at their respective NAVs as of the close of the Exchange on the valuation date. These securities are generally categorized as Level 1 in the hierarchy.
Debt securities (other than convertible and municipal bonds) are valued at the evaluated bid prices (evaluated mean prices in the case of convertible and municipal bonds) supplied by a pricing agent or broker selected by the Manager, in consultation with the Subadvisor. Those values reflect broker/dealer supplied prices and electronic data processing techniques, if the evaluated bid or mean prices are deemed by the Manager, in consultation with the Subadvisor, to be representative of market values, at the regular close of trading of the Exchange on each valuation date. Debt securities purchased on a delayed delivery basis are marked to market daily until settlement at the forward settlement date. Debt securities, including corporate bonds, U.S. government & federal agency bonds, municipal bonds, foreign bonds, convertible bonds, asset-backed securities and mortgage-backed securities are generally categorized as Level 2 in the hierarchy.
Temporary cash investments acquired in excess of 60 days to maturity at the time of purchase are valued using the latest bid prices or using valuations based on a matrix system (which considers such factors as security prices, yields, maturities, and ratings), both as furnished by independent pricing services. Other temporary cash investments which mature in 60 days or less at the time of purchase (“Short-Term Investments”) are valued using the amortized cost method of valuation, unless the use of such method would be inappropriate. The amortized
cost method involves valuing a security at its cost on the date of purchase and thereafter assuming a constant amortization to maturity of the difference between such cost and the value on maturity date. Amortized cost approximates the current fair value of a security. Securities valued at amortized cost are not valued using quoted prices in an active market and are generally categorized as Level 2 in the hierarchy.
The information above is not intended to reflect an exhaustive list of the methodologies that may be used to value portfolio investments. The valuation procedures permit the use of a variety of valuation methodologies in connection with valuing portfolio investments. The methodology used for a specific type of investment may vary based on the market data available or other considerations. The methodologies summarized above may not represent the specific means by which portfolio investments are valued on any particular business day.
A portfolio investment may be classified as an illiquid investment under the Trust’s written liquidity risk management program and related procedures (“Liquidity Program”). Illiquidity of an investment might prevent the sale of such investment at a time when the Manager or the Subadvisor might wish to sell, and these investments could have the effect of decreasing the overall level of the Fund’s liquidity. Further, the lack of an established secondary market may make it more difficult to value illiquid investments, requiring the Fund to rely on judgments that may be somewhat subjective in measuring value, which could vary materially from the amount that the Fund could realize upon disposition. Difficulty in selling illiquid investments may result in a loss or may be costly to the Fund. An illiquid investment is any investment that the Manager or Subadvisor reasonably expects cannot be sold or disposed of in current market conditions in seven calendar days or less without the sale or disposition significantly changing the market value of the investment. The liquidity classification of each investment will be made using information obtained after reasonable inquiry and taking into account, among other things, relevant market, trading and investment specific considerations in accordance with the Liquidity Program. Illiquid investments are often valued in accordance with methods deemed by the Board in good faith to be reasonable and appropriate to accurately reflect their fair value. The liquidity of the Fund’s investments, as shown in the Portfolio of Investments, was determined as of November 30, 2019, and can change at any time. Illiquid investments as of November 30, 2019, are shown in the Portfolio of Investments.
(B) Income Taxes. The MainStay Cushing Energy Income Fund invests its assets in a portfolio of energy companies involved in exploring, developing, producing, transporting, gathering and processing, storing, refining, distributing, mining or marketing natural gas, natural gas liquids (including propane), crude oil, refined products or coal. The MainStay Cushing Energy Income Fund has elected to be treated as a regulated investment company (“RIC”) under Subchapter M of the Internal Revenue Code of 1986, as amended (the “Internal Revenue Code”) beginning with its fiscal and taxable year ended November 30, 2016. Consistent with that intention, the MainStay Cushing Energy Income Fund intends to invest no more than 25% of its total assets in securities of energy MLPs.
The MainStay Cushing Energy Income Fund also intends to comply with the requirements of the Internal Revenue Code applicable to RICs, and to distribute all of its taxable income to its shareholders within allowable time limits. Since the MainStay Cushing Energy Income Fund has
| 48 | MainStay Cushing Funds |
elected to be subject to tax as a RIC, effective with its fiscal and taxable year ended November 30, 2016, no federal, state and local income tax provisions are required.
The MainStay Cushing MLP Premier Fund is taxed as a C-corporation and is subject to federal and state income tax on its taxable income. As of November 30, 2019, the federal income tax rate in effect for a corporation is 21%.
The MainStay Cushing MLP Premier Fund invests a majority of its assets in the equity securities of master limited partnerships (“MLPs”), which generally are treated as partnerships for federal income tax purposes. As a limited partner in MLPs, the MainStay Cushing MLP Premier Fund includes its allocable share of each MLP’s taxable income in computing its own taxable income.
The MainStay Cushing MLP Premier Fund’s tax expense or benefit is included in the Statement of Operations based on the component of income or gains (losses) to which such expense or benefit relates. Deferred income taxes reflect the net tax effects of temporary differences between the carrying amounts of assets and liabilities for financial reporting purposes and the amounts used for income tax purposes. A deferred income tax liability balance will be accrued at the effective federal corporate income tax rate at 21% plus an estimated state and local income tax rate for any future tax liability associated capital appreciation of MLP investments and distributions received on MLP investments considered to be a return of capital as well as for any net operating income or gains. A deferred income tax asset balance may also be accrued, which reflects an estimate of future tax benefits associated with net operating losses and/or unrealized losses. A valuation allowance is recognized if, based on the weight of available evidence, it is more likely than not that some portion or all of any deferred income tax asset will not be realized. The factors considered in assessing whether a valuation allowance is recognized include the nature, frequency and magnitude of current and cumulative losses, the duration of the statutory carryforward periods as well as the associated risks that operating and capital loss carryforwards may expire unused. As new information becomes available, the MainStay Cushing MLP Premier Fund may periodically modify its estimates and assumptions regarding its deferred income tax liability or deferred income tax asset balances.
The MainStay Cushing Renaissance Advantage Fund’s policy is to comply with the requirements of the Internal Revenue Code applicable to RICs and to distribute all of the taxable income to the shareholders of the Fund within the allowable time limits. Therefore, no federal, state, and local income tax provisions are required.
Management evaluates each MainStay Cushing Fund’s tax positions to determine if the tax positions taken meet the minimum recognition threshold in connection with accounting for uncertainties in income tax positions taken or expected to be taken for the purposes of measuring and recognizing tax liabilities in the financial statements. Recognition of tax benefits of an uncertain tax position is permitted only to the extent the position is “more likely than not” to be sustained assuming examination by taxing authorities. Management has analyzed the MainStay Cushing Funds’ tax positions taken on federal, state and local income tax returns for all open tax years (for up to three tax years) and has concluded that no provisions for federal, state and local income tax are required in the MainStay Cushing Energy Income Fund and the MainStay Cushing Renaissance Advantage Fund’s financial statements.
Management has concluded that provisions for federal, state and local income tax are required to be included in the financial statements for the MainStay Cushing MLP Premier Fund which is taxed as a corporation and is subject to federal and state income tax on its taxable income. The MainStay Cushing Funds’ federal, state and local income tax and federal excise tax returns for tax years for which the applicable statutes of limitations have not expired are subject to examination by the Internal Revenue Service (“IRS”) and state and local departments of revenue.
(C) Foreign Taxes. The Fund may be subject to foreign taxes on income and other transaction-based taxes imposed by certain countries in which it invests. A portion of the taxes on gains on investments or currency purchases/repatriation may be reclaimable. The Fund will accrue such taxes and reclaims as applicable, based upon its current interpretation of tax rules and regulations that exist in the markets in which it invests. The Fund may be subject to taxation on realized capital gains, repatriation proceeds and other transaction-based taxes imposed by certain countries in which it invests. The Fund will accrue such taxes as applicable based upon its current interpretation of tax rules and regulations that exist in the market in which it invests. Capital gains taxes relating to positions still held are reflected as a liability on the Statement of Assets and Liabilities, as well as an adjustment to the Fund’s net unrealized appreciation (depreciation). Taxes related to capital gains realized, if any, are reflected as part of net realized gain (loss) in the Statement of Operations. Changes in tax liabilities related to capital gains taxes on unrealized investment gains, if any, are reflected as part of the change in net unrealized appreciation (depreciation) on investments in the Statement of Operations. Transaction-based charges are generally assessed as a percentage of the transaction amount.
(D) Dividends and Distributions to Shareholders. Dividends and distributions are recorded on the ex-dividend date. The MainStay Cushing Energy Income Fund and the MainStay Cushing Renaissance Advantage Fund intend to declare and pay distributions from net investment income quarterly and from net capital gains, if any, annually. The MainStay Cushing MLP Premier Fund intends to declare and pay distributions, if any, at least monthly. On a book basis, all realized capital gains net of applicable taxes will be retained by the MainStay Cushing MLP Premier Fund. Unless the shareholder elects otherwise, all dividends and distributions are reinvested in the same class of shares of the respective MainStay Cushing Fund, at NAV. Dividends and distributions to shareholders are determined in accordance with federal income tax regulations and may differ from determinations using GAAP.
The actual tax characterization of the distributions made during the current year will not be determined until after the end of the fiscal year when the Fund can determine its earnings and profits and, therefore, may differ from the preliminary estimates.
(E) Security Transactions and Investment Income. The MainStay Cushing Funds record security transactions on the trade date. Realized gains and losses on security transactions are determined using the identified cost method. Dividend income is recognized on the ex-dividend date; net of any foreign tax withheld at the source, and interest income is accrued as earned using the effective interest rate method. Discounts and premiums on securities purchased for the Fund are accreted and amortized, respectively, on the effective interest rate method over the life of the respective securities. Income from payment-in-kind securities is accreted daily based on the effective interest
| 49 |
Notes to Financial Statements(continued)
method. Distributions from MLPs are generally recorded based on the characterization reported on the MainStay Cushing Fund’s IRS Form 1065, Schedule K-1, received from each MLP. The MainStay Cushing Funds record their pro rata share of the income and deductions, and capital gains and losses allocated from each MLP, as well as adjusting the cost basis of each MLP accordingly.
Distributions received from each of the MainStay Cushing Fund’s investments in energy related U.S. royalty trusts and Canadian royalty trusts and exploration and production companies (collectively, “Energy Trusts”) and MLPs generally are comprised of ordinary income, capital gains and return of capital from the Energy Trusts and MLPs. The MainStay Cushing Funds record investment income on the ex-date of the distributions. For financial statement purposes, the MainStay Cushing Funds use return of capital and income estimates to allocate the dividend income received. Each MainStay Cushing Fund estimates approximately 100% of the distributions received from Energy Trusts and MLPs to be from return of capital. Such estimates are based on historical information available from each Energy Trust, MLP and other industry sources. These estimates may subsequently be revised based on information received from Energy Trusts or MLPs after their tax reporting periods are concluded, as the actual character of these distributions is not known until after the MainStay Cushing Funds’ fiscal year end.
Each MainStay Cushing Fund estimates the allocation of investment income and return of capital for the distributions received from Energy Trusts and MLPs within the Statements of Operations. Investment income and realized and unrealized gains and losses on investments of the MainStay Cushing Funds are allocated pro rata to the separate classes of shares based upon their relative net assets on the date the income is earned or realized and unrealized gains and losses are incurred.
(F) Expenses. Expenses of the Trust are allocated to the individual MainStay Cushing Funds in proportion to the net assets of the respective MainStay Cushing Funds when the expenses are incurred, except where direct allocations of expenses can be made. Expenses (other than transfer agent expenses and fees incurred under the shareholder services plans and/or the distribution plans further discussed in Note 3(B)) are allocated to separate classes of shares pro rata based upon their relative net assets on the date the expenses are incurred. The expenses borne by the MainStay Cushing Funds, including those of related parties to the MainStay Cushing Funds, are shown in the Statement of Operations.
Additionally, the Fund may invest in mutual funds, which are subject to management fees and other fees that may cause the costs of investing in mutual funds to be greater than the costs of owning the underlying securities directly. These indirect expenses of mutual funds are not included in the amounts shown as expenses in the Fund’s Statement of Operations or in the expense ratios included in the Financial Highlights.
(G) Use of Estimates. In preparing financial statements in conformity with GAAP, management makes estimates and assumptions that affect the reported amounts and disclosures in the financial statements. Actual results could differ from those estimates.
(H) Rights and Warrants. Rights are certificates that permit the holder to purchase a certain number of shares, or a fractional share, of a new stock from the issuer at a specific price. Warrants are
instruments that entitle the holder to buy an equity security at a specific price for a specific period of time. These investments can provide a greater potential for profit or loss than an equivalent investment in the underlying security. Prices of these investments do not necessarily move in tandem with the prices of the underlying securities. There is risk involved in the purchase of rights and warrants in that these investments are speculative investments. The Fund could also lose the entire value of its investment in warrants if such warrants are not exercised by the date of its expiration. The Fund is exposed to risk until the sale or exercise of each right or warrant is completed. As of November 30, 2019, the Funds did not hold any warrants.
(I) Concentration of Risk. The MainStay Cushing Energy Income Fund, under normal market conditions, invests at least 80% of its assets (net assets plus any borrowings for investment purposes) in a portfolio of energy companies involved in exploring, developing, producing, transporting, gathering and processing, storing, refining, distributing, mining or marketing natural gas, natural gas liquids (including propane), crude oil, refined products or coal. Under normal market conditions, the MainStay Cushing MLP Premier Fund invests at least 80% of its assets (net assets plus any borrowings for investment purposes) in a portfolio of MLPs and MLP-related investments. Under normal market conditions, the MainStay Cushing Renaissance Advantage Fund invests at least 80% of its assets (net assets plus any borrowings for investment purposes) in a portfolio of (i) companies across the energy supply chain spectrum, including upstream, midstream and downstream energy companies, as well as oil and gas services companies, (ii) energy-intensive chemical, metal and industrial and manufacturing companies and engineering and construction companies that the Subadvisor expects to benefit from growing energy production and lower feedstock costs relative to global costs and, (iii) transportation and logistics companies providing solutions to the U.S. manufacturing industry. Therefore the MainStay Cushing Funds may be subject to more risks than if they were more broadly diversified over numerous industries and sectors of the economy. General changes in market sentiment towards companies in the sectors in which they invest may adversely affect the MainStay Cushing Funds, and the performance of such sectors may lag behind the broader market as a whole.
The MainStay Cushing Funds are also subject to MLP structure risk. Holders of MLP units are subject to certain risks inherent in the structure of MLPs, including (i) tax risks, (ii) the limited ability to elect or remove management or the general partner or managing member, (iii) limited voting rights, except with respect to extraordinary transactions, and (iv) conflicts of interest between the general partner or managing member and its affiliates, on the one hand, and the limited partners or members, on the other hand, including those arising from incentive distribution payments or corporate opportunities.
(J) Indemnifications. Under the Trust’s organizational documents, its officers and trustees are indemnified against certain liabilities that may arise out of performance of their duties to the Trust. Additionally, in the normal course of business, the MainStay Cushing Funds enter into contracts with third-party service providers that contain a variety of representations and warranties and which may provide general indemnifications. The MainStay Cushing Funds’ maximum exposure under these arrangements is unknown, as this would involve future claims that may be made against the MainStay Cushing Funds that have not yet occurred. Based on experience, management is of the view that
| 50 | MainStay Cushing Funds |
the risk of loss in connection with these potential indemnification obligations is remote. However, there can be no assurance that material liabilities related to such obligations will not arise in the future, which could adversely impact the MainStay Cushing Funds.
Note 3–Fees and Related Party Transactions
(A) Manager and Subadvisor. New York Life Investments, a registered investment adviser and an indirect,wholly-owned subsidiary of New York Life Insurance Company (“New York Life”), serves as the MainStay Cushing Funds’ Manager, pursuant to an Amended and Restated Management Agreement (“Management Agreement”). The Manager provides offices, conducts clerical, recordkeeping and bookkeeping services, and keeps most of the financial and accounting records required to be maintained by the MainStay Cushing Funds. Except for the portion of salaries and expenses that are the responsibility of the MainStay Cushing Funds, the Manager pays the salaries and expenses of all personnel affiliated with the MainStay Cushing Funds and certain operational expenses of the MainStay Cushing Funds. The MainStay Cushing Funds reimburse New York Life Investments in an amount equal to a portion of the compensation of the Chief Compliance Officer attributable to the MainStay Cushing Funds. Cushing® Asset Management, LP (“Cushing® Asset Management” or the “Subadvisor”), a registered investment adviser and awholly-owned investment advisory subsidiary of Swank Capital, serves as Subadvisor to the MainStay Cushing Funds and is responsible for theday-to-day portfolio management of the MainStay Cushing Funds. Pursuant to the terms of a Subadvisory Agreement (“Subadvisory Agreement”) between New York Life Investments and Cushing® Asset Management LP, New York Life Investments pays for the services of the Subadvisor.
Under the Management Agreement, the MainStay Cushing Energy Income Fund pays the Manager a monthly fee for services performed and facilities furnished at an annual rate of 0.95% of the Fund’s average daily net assets.
Under the Management Agreement, the MainStay Cushing MLP Premier Fund pays the Manager a monthly fee for services performed and facilities furnished at an annual rate of the Fund’s average daily net assets as follows: 1.10% up to $3 billion and 1.05% over $3 billion.
Under the Management Agreement, the MainStay Cushing Renaissance Advantage Fund pays the Manager a monthly fee for services performed and facilities furnished at an annual rate of the Fund’s average daily net assets as follows: 1.10% up to $500 million and 1.05% over $500 million.
MainStay Cushing Energy Income Fund
New York Life Investments has contractually agreed to waive fees and/or reimburse expenses so that Total Annual Fund Operating Expenses (excluding taxes, deferred income tax expenses, interest, litigation, extraordinary expenses, brokerage and other transaction expenses relating to the purchase or sale of portfolio investments and acquired (underlying) fund fees and expenses) of Class A shares do not exceed 1.45% of its average daily net assets. New York Life Investments will apply an equivalent waiver or reimbursement, in an equal number of basis points, to the other share classes. This agreement will remain in effect until March 31, 2020, and shall renew automatically for one-year
terms unless New York Life Investments provides written notice of termination prior to the start of the next term or upon approval of the Board.
MainStay Cushing MLP Premier Fund
New York Life Investments has contractually agreed to waive fees and/or reimburse expenses so that Total Annual Fund Operating Expenses (excluding taxes, interest, litigation, extraordinary expenses, brokerage and other transaction expenses relating to the purchase or sale of portfolio investments, and acquired (underlying) fund fees and expenses) of Class R6 do not exceed those of Class I. This agreement will remain in effect until March 31, 2020, and shall renew automatically for one-year terms unless New York Life Investments provides written notice of termination prior to the start of the next term or upon approval of the Board.
MainStay Cushing Renaissance Advantage Fund
New York Life Investments has contractually agreed to waive fees and/or reimburse expenses so that Total Annual Fund Operating Expenses (excluding taxes, interest, litigation, extraordinary expenses, brokerage and other transaction expenses relating to the purchase or sale of portfolio investments and acquired (underlying) fund fees and expenses) of Class A shares do not exceed 1.61% of its average daily net assets. New York Life Investments will apply an equivalent waiver or reimbursement, in an equal number of basis points, to the other share classes. This agreement will remain in effect until March 31, 2020, and shall renew automatically for one-year terms unless New York Life Investments provides written notice of termination prior to the start of the next term or upon approval of the Board.
For the year ended November 30, 2019, New York Life Investments earned fees from the MainStay Cushing Funds, waived its fees and/or reimbursed expenses, and paid the Subadvisor as follows:
| Fees Earned | Fees Waived/ Reimbursed | Subadvisor Payments | ||||||||||
MainStay Cushing Energy Income Fund | $ | 283,631 | $ | 151,953 | $ | 65,839 | ||||||
MainStay Cushing MLP Premier Fund | 13,426,443 | — | 6,713,222 | |||||||||
MainStay Cushing Renaissance Advantage Fund | 688,432 | 98,893 | 294,770 | |||||||||
U.S. Bancorp Fund Services, LLC, d/b/a U.S. Bank Global Fund Services (“Fund Services”) providessub-administration andsub-accounting services to the MainStay Cushing Funds pursuant to an agreement with New York Life Investments. These services include calculating the daily NAVs of the MainStay Cushing Funds, maintaining the general ledger andsub-ledger accounts for the calculation of the MainStay Cushing Funds’ respective NAVs, and assisting New York Life Investments in conducting various aspects of the MainStay Cushing Funds’ administrative operations. For providing these services to the MainStay Cushing Funds, Fund Services is compensated by New York Life Investments.
| 51 |
Notes to Financial Statements(continued)
(B) Distribution and Service Fees. The Trust, on behalf of the MainStay Cushing Funds, has entered into a distribution agreement with NYLIFE Distributors LLC (the “Distributor”), an indirect,wholly-owned subsidiary of New York Life. The MainStay Cushing Funds have adopted distribution plans (the “Plans”) in accordance with the provisions of Rule 12b-1 under the 1940 Act.
Pursuant to the Class A and Investor Class Plans, the Distributor receives a monthly distribution fee from Class A and Investor Class shares, at an annual rate of 0.25% of the average daily net assets of the Class A and Investor Class shares for distribution and/or service activities as designated by the Distributor. Pursuant to the Class C Plan, Class C shares pay the Distributor a monthly distribution fee at an annual rate of 0.75% of the average daily net assets of the Class C shares, along with a service fee at an annual rate of 0.25% of the average daily net assets of the Class C shares, for a total 12b-1 fee of 1.00%. Class I and Class R6 shares are not subject to a distribution and/or service fee.
The Plans provide that the distribution and service fees are payable to the Distributor regardless of the amounts actually expended by the Distributor for distribution of the MainStay Cushing Funds’ shares and service activities.
(C) Sales Charges. The MainStay Cushing Funds were advised by the Distributor that the amounts of initial sales charges retained on sales of Class A and Investor Class shares for the year ended November 30, 2019, were as follows:
MainStay Cushing Energy Income Fund | ||||
Class A | $ | 555 | ||
Investor Class | 393 | |||
MainStay Cushing MLP Premier Fund |
| |||
Class A | $ | 87,995 | ||
Investor Class | 1,591 | |||
MainStay Cushing Renaissance Advantage Fund |
| |||
Class A | $ | 1,738 | ||
Investor Class | 476 | |||
The MainStay Cushing Funds were also advised that the Distributor retained CDSCs on redemptions of Class A, Investor Class and Class C shares, for the year ended November 30, 2019, as follows:
MainStay Cushing Energy Income Fund |
| |||
Class C | $ | 603 | ||
MainStay Cushing MLP Premier Fund |
| |||
Class A | $ | 31,335 | ||
Class C | 58,092 | |||
MainStay Cushing Renaissance Advantage Fund |
| |||
Class A | $ | 100 | ||
Class C | 70 | |||
(D) Transfer, Dividend Disbursing and Shareholder Servicing Agent. NYLIM Service Company LLC, an affiliate of New York Life Investments, is the MainStay Cushing Funds’ transfer, dividend disbursing and shareholder servicing agent pursuant to an agreement between NYLIM Service Company LLC and the Trust. NYLIM Service Company LLC has entered into an agreement with DST Asset Manager Solutions, Inc. (“DST”), formerly known as Boston Financial Data Services, Inc. pursuant to which DST performs certain transfer agent services on behalf of NYLIM Service Company LLC. Transfer agent expenses incurred by the MainStay Cushing Funds’ share classes for the year ended November 30, 2019, were as follows:
MainStay Cushing Energy Income Fund |
| |||
Class A | $ | 40,663 | ||
Investor Class | 6,901 | |||
Class C | 26,699 | |||
Class I | 10,076 | |||
MainStay Cushing MLP Premier Fund |
| |||
Class A | $ | 302,667 | ||
Investor Class | 2,933 | |||
Class C | 400,734 | |||
Class I | 637,991 | |||
MainStay Cushing Renaissance Advantage Fund |
| |||
Class A | $ | 22,179 | ||
Investor Class | 6,011 | |||
Class C | 22,915 | |||
Class I | 47,072 | |||
(E) Small Account Fee. Shareholders with small accounts adversely impact the cost of providing transfer agency services. In an effort to reduce total transfer agency expenses, the MainStay Cushing Funds have implemented a small account fee on certain types of accounts. Certain shareholders with an account balance of less than $1,000 are charged an annual per account fee of $20 (assessed semi-annually), the proceeds from which offset transfer agent fees as reflected in the Statement of Operations.
Note 4–Federal Income Tax
MainStay Cushing Energy Income Fund
As of November 30, 2019, the cost and unrealized appreciation (depreciation) of the Fund’s investment portfolio, including other financial instruments, as determined on a federal income tax basis, were as follows:
| Federal Tax Cost | Gross Unrealized Appreciation | Gross Unrealized Depreciation | Net Unrealized Appreciation/ (Depreciation) | |||||||||||||
Investments in Securities | $ | 28,327,057 | $ | 2,199,935 | $ | (7,366,683 | ) | $ | (5,166,748 | ) | ||||||
| 52 | MainStay Cushing Funds |
As of November 30, 2019, the components of accumulated gain (loss) on a tax basis were as follows:
| Ordinary Income | Accumulated Capital and Other Gain (Loss) | Other Temporary Differences | Unrealized Appreciation (Depreciation) | Total Accumulated Gain (Loss) | ||||||||||||
| $— | $ | (234,908,095 | ) | $ | (403,603 | ) | $ | (5,166,748 | ) | $ | (240,478,446 | ) | ||||
The difference between book basis and tax basis unrealized depreciation is primarily due to partnership adjustments.
The following table discloses the current year reclassifications between total distributable earnings (loss) and additional paid-in capital arising from permanent differences; net assets as of November 30, 2019 were not affected. These reclassifications are primarily due to the expiration of capital loss carryforwards.
Total Distributable Earnings (Loss) | Additional Paid-In Capital | |||
| $3,207,187 | $ | (3,207,187 | ) | |
Under the Regulated Investment Company Modernization Act of 2010, the Fund is permitted to carry forward capital losses incurred in taxable years beginning with November 30, 2016 (the Fund’s initial year electing to be taxed as a Regulated Investment Company) for an unlimited period. However, any losses incurred during future years will be required to be utilized prior to the losses incurred in its previous tax years when it was taxed as a C-corporation. As a result of this ordering rule, prior year capital loss carryforwards subject to expiration may be more likely to expire unused. Additionally, future capital losses that are carried forward will retain their character as eithershort-term orlong-term capital losses rather than being considered allshort-term as under previous law.
As of November 30, 2019, for federal income tax purposes, capital loss carryforwards of $234,906,449 were available as shown in the table below, to the extent provided by the Internal Revenue Code, to offset future realized capital gains through the years indicated:
| Capital Loss Available Through | Short-Term Capital Loss Amounts (000’s) | Long-Term Capital Loss Amounts (000’s) | ||||||
| 2020 Unlimited | $
| 117,036 55,434 |
| $
| — 62,436 |
| ||
| Total | $ | 172,470 | $ | 62,436 | ||||
The Fund had $3,090,784 of capital loss carryforwards that expired during the year ended November 30, 2019.
MainStay Cushing MLP Premier Fund
As of November 30, 2019, the cost and unrealized appreciation (depreciation) of the Fund’s investment portfolio, including other financial instruments, as determined on a federal income tax basis, were as follows:
| Federal Tax Cost | Gross Unrealized Appreciation | Gross Unrealized Depreciation | Net Unrealized Appreciation/ (Depreciation) | |||||||||||||
Investments in Securities | $ | 852,005,664 | $ | 202,731,631 | $ | (64,250,613 | ) | $ | 138,481,018 | |||||||
Deferred income taxes reflect the net tax effect of temporary differences between the carrying amount of assets and liabilities for financial reporting and tax purposes. Components of the MainStay Cushing MLP Premier Fund deferred tax assets as of November 30, 2019, are as follows:
MainStay Cushing MLP Premier Fund | ||||
Deferred tax assets | ||||
Federal net operating loss carryforward | $ | 29,657,949 | ||
State net operating loss carryforward | 3,552,025 | |||
Capital loss carryforward | 98,644,057 | |||
| Total deferred tax assets | 131,854,031 | |||
Less deferred tax liabilities | 33,936,651 | |||
| Net deferred tax asset (liability) before valuation allowance | 97,917,380 | |||
Less: valuation allowance | 97,917,380 | |||
Total net deferred tax asset (liability) | $ | — | ||
The MainStay Cushing MLP Premier Fund periodically reviews the recoverability of its deferred tax asset, if any, based on the weight of available evidence. When assessing the recoverability of the MainStay Cushing MLP Premier Fund’s deferred tax asset, significant weight is given to the effects of potential future realized and unrealized gains on investments, and the period over which this deferred tax asset can be realized. Unexpected significant decreases in cash distributions from the MainStay Cushing MLP Premier Fund’s MLP investments or significant declines in the fair value of its investments may change the MainStay Cushing MLP Premier Fund’s assessment regarding the recoverability of its deferred tax assets and may result in a valuation allowance. The MainStay Cushing MLP Premier Fund will continue to assess the need to record a valuation allowance in the future. If the valuation allowance is required to be increased or decreased in the future, it could have a material impact on the MainStay Cushing MLP Premier Fund’s net asset value and results of operations in the period it is recovered.
The MainStay Cushing MLP Premier Fund may rely, to some extent, on information provided by the MLPs, which may not necessarily be timely, to estimate taxable income allocable to MLP units held in its portfolio and to estimate its associated deferred tax benefit (liability). Such estimates are made in good faith. From time to time, as new information becomes available, the MainStay Cushing MLP Premier Fund will modify its estimates or assumptions regarding its tax benefit (liability).
The MainStay Cushing MLP Premier Fund’s net operating loss carryforward and capital loss carryforward are available to offset its future taxable income. For C-corporations, capital losses can only be used to offset capital gains and cannot be used to offset ordinary income. Capital losses of C-corporations may be carried forward for five years and, accordingly, would begin to expire as of November 30, 2020. Net operating losses of C-corporations prior to The Tax Cuts and Jobs Act of 2017 can be carried forward for 20 years and, accordingly, would begin to expire as of November 30, 2034. Any net operating losses arising in tax years ending after December 31, 2017 will have an indefinite carryforward period. Further, as the MainStay Cushing MLP Premier Fund is a fiscal year taxpayer, the 80% limitation on the use of Federal net operating losses will begin to apply for Federal net operating losses created in the tax year ended November 30, 2019. The MainStay Cushing MLP Premier Fund has state net operating losses with various
| 53 |
Notes to Financial Statements(continued)
expiration dates. The MainStay Cushing MLP Premier Fund has the following net operating loss carryover and capital loss carryover amounts:
| MainStay Cushing MLP Premier Fund | ||||||
Fiscal Year Ended Net Operating Loss | Amount | Expiration | ||||
November 30, 2014 | $ | 11,692,455 | November 30, 2034 | |||
| November 30, 2015 | 51,787,077 | November 30, 2035 | ||||
| November 30, 2016 | 21,362,379 | November 30, 2036 | ||||
| November 30, 2017 | 56,386,418 | November 30, 2037 | ||||
| November 30, 2018 | — | Indefinite | ||||
| November 30, 2019 | — | Indefinite | ||||
|
| |||||
| Total | $ | 141,228,329 | ||||
|
| |||||
Fiscal Year Ended Capital Loss | Amount | Expiration | ||||
November 30, 2015 | $ | 61,574,275 | November 30, 2020 | |||
| November 30, 2016 | 308,877,920 | November 30, 2021 | ||||
| November 30, 2019 | 49,040,311 | November 30, 2024 | ||||
|
| |||||
| Total | $ | 419,492,506 | ||||
|
| |||||
The MainStay Cushing MLP Premier Fund’s total income tax benefit (current and deferred) differs from the amount computed by applying the federal statutory income tax rate of 21% to net investment income and realized and unrealized gains (losses) on investments before taxes as of November 30, 2019, as follows:
MainStay Cushing MLP Premier Fund | ||||
Income tax provision (benefit) at the federal statutory rate of 21% | $ | (14,732,006 | ) | |
State income tax (benefit), net of federal benefit | (1,764,399 | ) | ||
Permanent differences, net | (1,308,269 | ) | ||
Change in valuation allowance from current activity | 17,804,674 | |||
|
| |||
Total tax expense (benefit) | $ | — | ||
|
| |||
MainStay Cushing Renaissance Advantage Fund
As of November 30, 2019, the cost and unrealized appreciation (depreciation) of the Fund’s investment portfolio, including other financial instruments, as determined on a federal income tax basis, were as follows:
| Federal Tax Cost | Gross Unrealized Appreciation | Gross Unrealized Depreciation | Net Unrealized Appreciation/ (Depreciation) | |||||||||||||
Investments in Securities | $ | 36,997,293 | $ | 2,808,799 | $ | (8,089,105 | ) | $ | (5,280,306 | ) | ||||||
As of November 30, 2019, the components of accumulated gain (loss) on a tax basis were as follows:
| Ordinary Income | Accumulated Capital and Other Gain (Loss) | Other Temporary Differences | Unrealized Appreciation (Depreciation) | Total Accumulated Gain (Loss) | ||||
| $— | $(64,208,815) | $(1,100,643) | $(5,280,306) | $(70,589,764) | ||||
The difference between book basis and tax basis unrealized depreciation is primarily due to wash sale and partnership adjustments. Other temporary differences are due to a late year loss deferral.
The following table discloses the current year reclassifications total distributable earnings (loss) and additional paid-in capital arising from permanent differences; net assets as of November 30, 2019 were not affected. These reclassifications are primarily due to net operating loss.
| Total Distributable Earnings (Loss) | Additional Paid-In Capital | |||
| $413,533 | $ | (413,533 | ) | |
As of November 30, 2019, for federal income tax purposes, capital loss carryforwards of $64,208,815 were available as shown in the table below, to the extent provided by the Internal Revenue Code, to offset future realized capital gains through the years indicated.
| Capital Loss Available Through | Short-Term Capital Loss Amounts (000’s) | Long-Term Capital Loss Amounts (000’s) | ||
| Unlimited | $60,122 | $4,087 | ||
The tax character of distributions paid by the MainStay Cushing Funds during the years ended November 30, 2019 and November 30, 2018 shown in the Statements of Changes in Net Assets was as follows:
| 2019 | 2018 | |||||||||||||||||||||||
| Tax Based Distributions from Ordinary Income | Tax Based Distributions from Return of Capital | Total | Tax Based Distributions from Ordinary Income | Tax Based Distributions from Return of Capital | Total | |||||||||||||||||||
MainStay Cushing Energy Income Fund | $ | — | $ | 1,465,561 | $ | 1,465,561 | $ | 906,116 | $ | 1,323,772 | $ | 2,229,888 | ||||||||||||
MainStay Cushing MLP Premier Fund | — | 110,192,928 | 110,192,928 | — | 157,786,614 | 157,786,614 | ||||||||||||||||||
MainStay Cushing Renaissance Advantage Fund | — | 2,129,703 | 2,129,703 | — | 3,192,276 | 3,192,276 | ||||||||||||||||||
| 54 | MainStay Cushing Funds |
Note 5–Custodian
U.S. Bank, N.A. is the custodian of cash and securities held by the MainStay Cushing Funds. Custodial fees are charged to the MainStay Cushing Funds based on the MainStay Cushing Funds’ net assets and/or the market value of securities held by the MainStay Cushing Funds and the number of certain cash transactions incurred by the MainStay Cushing Funds.
Note 6–Line of Credit
The MainStay Cushing Funds and certain other funds managed by New York Life Investments maintain a line of credit with a syndicate of banks in order to secure a source of funds for temporary purposes to meet unanticipated or excessive redemption requests.
Effective July 30, 2019, under the credit agreement (the “Credit Agreement”), the aggregate commitment amount is $600,000,000 with an additional uncommitted amount of $100,000,000. The commitment fee is an annual rate of 0.15% of the average commitment amount payable quarterly, regardless of usage, to State Street, who serves as the agent to the syndicate. The commitment fee is allocated among the Fund and certain other funds managed by New York Life Investments based upon their respective net assets and other factors. Interest on any revolving credit loan is charged based upon the Federal Funds Rate or the one-month London Interbank Offered Rate (“LIBOR”), whichever is higher. The Credit Agreement expires on July 28, 2020, although the Fund, certain other funds managed by New York Life Investments and the syndicate of banks may renew the Credit Agreement for an additional year on the same or different terms. Prior to July 30, 2019, the aggregate commitment amount and the commitment fee were the same as those under the current Credit Agreement. During the year ended November 30, 2019, there were no borrowings made or outstanding with respect to the Fund under the Credit Agreement.
Note 7–Interfund Lending Program
Pursuant to an exemptive order issued by the SEC, the MainStay Cushing Funds, along with certain other funds managed by New York Life Investments, may participate in an interfund lending program. The interfund lending program provides an alternative credit facility that permits the MainStay Cushing Funds and certain other funds managed by New York Life Investments to lend or borrow money for temporary purposes directly to or from one another, subject to the conditions of the exemptive order. During the year ended November 30, 2019, there were no interfund loans made or outstanding with respect to the MainStay Cushing Funds.
Note 8–Purchases and Sales of Securities (in 000’s)
For the year ended November 30, 2019, purchases and sales of securities, other thanshort-term securities, were as follows:
| Purchases | Sales | |||||||
MainStay Cushing Energy Income Fund | $ | 9,839 | $ | 16,900 | ||||
MainStay Cushing MLP Premier Fund | 589,791 | 751,626 | ||||||
MainStay Cushing Renaissance Advantage Fund | 58,017 | 109,039 | ||||||
Note 9–Capital Share Transactions
Transactions in capital shares for the years ended November 30, 2019 and November 30, 2018, were as follows:
MainStay Cushing Energy Income Fund
Class A | Shares | Amount | ||||||
Year ended November 30, 2019: | ||||||||
Shares sold | 285,725 | $ | 1,002,906 | |||||
Shares issued to shareholders in reinvestment of dividends and distributions | 235,662 | 830,294 | ||||||
Shares redeemed | (1,618,034 | ) | (5,667,458 | ) | ||||
|
|
|
| |||||
Net increase (decrease) in shares before conversion | (1,096,647 | ) | (3,834,258 | ) | ||||
Shares converted into Class A (See Note 1) | 31,723 | 117,984 | ||||||
Shares converted from Class A (See Note 1) | (79,619 | ) | (287,367 | ) | ||||
|
|
|
| |||||
Net increase (decrease) | (1,144,543 | ) | $ | (4,003,641 | ) | |||
|
| |||||||
Year ended November 30, 2018: | ||||||||
Shares sold | 317,858 | $ | 1,427,849 | |||||
Shares issued to shareholders in reinvestment of dividends and distributions | 273,141 | 1,258,545 | ||||||
Shares redeemed | (2,371,474 | ) | (10,609,363 | ) | ||||
|
|
|
| |||||
Net increase (decrease) in shares before conversion | (1,780,475 | ) | (7,922,969 | ) | ||||
Shares converted into Class A (See Note 1) | 76,892 | 345,711 | ||||||
Shares converted from Class A (See Note 1) | (9,527 | ) | (42,068 | ) | ||||
|
| |||||||
Net increase (decrease) | (1,713,110 | ) | $ | (7,619,326 | ) | |||
|
| |||||||
Investor Class | Shares | Amount | ||||||
Year ended November 30, 2019: | ||||||||
Shares sold | 18,946 | $ | 66,587 | |||||
Shares issued to shareholders in reinvestment of dividends and distributions | 24,426 | 85,356 | ||||||
Shares redeemed | (109,468 | ) | (381,521 | ) | ||||
|
|
|
| |||||
Net increase (decrease) in shares before conversion | (66,096 | ) | (229,578 | ) | ||||
Shares converted into Investor Class (See Note 1) | 96,139 | 346,501 | ||||||
Shares converted from Investor Class (See Note 1) | (22,460 | ) | (83,762 | ) | ||||
|
|
|
| |||||
Net increase (decrease) | 7,583 | $ | 33,161 | |||||
|
| |||||||
Year ended November 30, 2018: | ||||||||
Shares sold | 31,136 | $ | 140,622 | |||||
Shares issued to shareholders in reinvestment of dividends and distributions | 25,002 | 114,760 | ||||||
Shares redeemed | (118,888 | ) | (534,326 | ) | ||||
|
|
|
| |||||
Net increase (decrease) in shares before conversion | (62,750 | ) | (278,944 | ) | ||||
Shares converted into Investor Class (See Note 1) | 9,555 | 42,068 | ||||||
Shares converted from Investor Class (See Note 1) | (77,193 | ) | (345,711 | ) | ||||
|
| |||||||
Net increase (decrease) | (130,388 | ) | $ | (582,587 | ) | |||
|
| |||||||
| 55 |
Notes to Financial Statements(continued)
Class C | Shares | Amount | ||||||
Year ended November 30, 2019: | ||||||||
Shares sold | 550,854 | $ | 1,803,132 | |||||
Shares issued to shareholders in reinvestment of dividends and distributions | 87,252 | 295,268 | ||||||
Shares redeemed | (1,066,926 | ) | (3,594,230 | ) | ||||
|
|
|
| |||||
Net increase (decrease) in shares before conversion | (428,820 | ) | (1,495,830 | ) | ||||
Shares converted from Investor Class (See Note 1) | (26,603 | ) | (93,356 | ) | ||||
|
|
|
| |||||
Net increase (decrease) | (455,423 | ) | $ | (1,589,186 | ) | |||
|
| |||||||
Year ended November 30, 2018: | ||||||||
Shares sold | 199,695 | $ | 847,854 | |||||
Shares issued to shareholders in reinvestment of dividends and distributions | 103,656 | 458,596 | ||||||
Shares redeemed | (1,041,987 | ) | (4,518,937 | ) | ||||
|
| |||||||
Net increase (decrease) | (738,636 | ) | $ | (3,212,487 | ) | |||
|
| |||||||
Class I | Shares | Amount | ||||||
Year ended November 30, 2019: | ||||||||
Shares sold | 1,624,207 | $ | 5,761,316 | |||||
Shares issued to shareholders in reinvestment of dividends and distributions | 60,760 | 218,796 | ||||||
Shares redeemed | (1,794,385 | ) | (6,614,400 | ) | ||||
|
|
|
| |||||
Net increase (decrease) | (109,418 | ) | $ | (634,288 | ) | |||
|
| |||||||
Year ended November 30, 2018: | ||||||||
Shares sold | 413,811 | $ | 1,874,705 | |||||
Shares issued to shareholders in reinvestment of dividends and distributions | 72,285 | 336,972 | ||||||
Shares redeemed | (1,679,563 | ) | (7,697,784 | ) | ||||
|
| |||||||
Net increase (decrease) | (1,193,467 | ) | $ | (5,486,107 | ) | |||
|
| |||||||
| MainStay Cushing MLP Premier Fund |
| |||||||
Class A | Shares | Amount | ||||||
Year ended November 30, 2019: | ||||||||
Shares sold | 7,652,582 | $ | 78,413,358 | |||||
Shares issued to shareholders in reinvestment of dividends and distributions | 2,353,093 | 24,033,531 | ||||||
Shares redeemed | (8,729,685 | ) | (89,730,426 | ) | ||||
|
|
|
| |||||
Net increase (decrease) in shares before conversion | 1,275,990 | 12,716,463 | ||||||
Shares converted into Class A (See Note 1) | 22,229 | 237,093 | ||||||
Shares converted from Class A (See Note 1) | (48,158 | ) | (463,959 | ) | ||||
|
|
|
| |||||
Net increase (decrease) | 1,250,061 | $ | 12,489,597 | |||||
|
| |||||||
Year ended November 30, 2018: | ||||||||
Shares sold | 9,464,495 | $ | 112,910,979 | |||||
Shares issued to shareholders in reinvestment of dividends and distributions | 2,755,086 | 32,018,777 | ||||||
Shares redeemed | (8,727,644 | ) | (103,054,310 | ) | ||||
|
|
|
| |||||
Net increase (decrease) in shares before conversion | 3,491,937 | 41,875,446 | ||||||
Shares converted into Class A (See Note 1) | 142,515 | 1,697,297 | ||||||
Shares converted from Class A (See Note 1) | (33,565 | ) | (383,629 | ) | ||||
|
| |||||||
Net increase (decrease) | 3,600,887 | $ | 43,189,114 | |||||
|
| |||||||
Investor Class | Shares | Amount | ||||||
Year ended November 30, 2019: | ||||||||
Shares sold | 56,998 | $ | 601,099 | |||||
Shares issued to shareholders in reinvestment of dividends and distributions | 21,789 | 222,935 | ||||||
Shares redeemed | (47,020 | ) | (497,020 | ) | ||||
|
|
|
| |||||
Net increase (decrease) in shares before conversion | 31,767 | 327,014 | ||||||
Shares converted into Investor Class (See Note 1) | 11,535 | 122,267 | ||||||
Shares converted from Investor Class (See Note 1) | (16,321 | ) | (172,063 | ) | ||||
|
|
|
| |||||
Net increase (decrease) | 26,981 | $ | 277,218 | |||||
|
| |||||||
Year ended November 30, 2018: | ||||||||
Shares sold | 64,915 | $ | 772,734 | |||||
Shares issued to shareholders in reinvestment of dividends and distributions | 25,691 | 298,831 | ||||||
Shares redeemed | (42,332 | ) | (500,791 | ) | ||||
|
|
|
| |||||
Net increase (decrease) in shares before conversion | 48,274 | 570,774 | ||||||
Shares converted into Investor Class (See Note 1) | 18,185 | 198,590 | ||||||
Shares converted from Investor Class (See Note 1) | (48,046 | ) | (562,959 | ) | ||||
|
| |||||||
Net increase (decrease) | 18,413 | $ | 206,405 | |||||
|
| |||||||
Class C | Shares | Amount | ||||||
Year ended November 30, 2019: | ||||||||
Shares sold | 4,150,662 | $ | 39,192,690 | |||||
Shares issued to shareholders in reinvestment of dividends and distributions | 3,740,780 | 34,605,668 | ||||||
Shares redeemed | (15,429,596 | ) | (141,871,347 | ) | ||||
|
|
|
| |||||
Net increase (decrease) in shares before conversion | (7,538,154 | ) | (68,072,989 | ) | ||||
Shares converted from Class C (See Note 1) | (21,231 | ) | (211,187 | ) | ||||
|
|
|
| |||||
Net increase (decrease) | (7,559,385 | ) | $ | (68,284,176 | ) | |||
|
| |||||||
Year ended November 30, 2018: | ||||||||
Shares sold | 8,349,085 | $ | 92,347,339 | |||||
Shares issued to shareholders in reinvestment of dividends and distributions | 4,991,445 | 53,323,283 | ||||||
Shares redeemed | (13,288,958 | ) | (144,336,678 | ) | ||||
|
|
|
| |||||
Net increase (decrease) in shares before conversion | 51,572 | 1,333,944 | ||||||
Shares converted into Class C (See Note 1) | 1,618 | 17,620 | ||||||
Shares converted from Class C (See Note 1) | (48,459 | ) | (558,792 | ) | ||||
|
| |||||||
Net increase (decrease) | 4,731 | $ | 792,772 | |||||
|
| |||||||
| 56 | MainStay Cushing Funds |
Class I | Shares | Amount | ||||||
Year ended November 30, 2019: | ||||||||
Shares sold | 25,464,638 | $ | 270,090,143 | |||||
Shares issued to shareholders in reinvestment of dividends and distributions | 4,703,301 | 49,711,892 | ||||||
Shares redeemed | (41,767,287 | ) | (440,841,128 | ) | ||||
|
|
|
| |||||
Net increase (decrease) in shares before conversion | (11,599,348 | ) | (121,039,093 | ) | ||||
Shares converted into Class I (See Note 1) | 48,293 | 487,849 | ||||||
|
|
|
| |||||
Net increase (decrease) | (11,551,055 | ) | $ | (120,551,244 | ) | |||
|
| |||||||
Year ended November 30, 2018: | ||||||||
Shares sold | 33,983,472 | $ | 412,401,244 | |||||
Shares issued to shareholders in reinvestment of dividends and distributions | 5,884,972 | 70,189,317 | ||||||
Shares redeemed | (24,038,261 | ) | (290,707,835 | ) | ||||
|
|
|
| |||||
Net increase (decrease) in shares before conversion | 15,830,183 | 191,882,726 | ||||||
Shares converted into Class I (See Note 1) | 58,150 | 743,831 | ||||||
Shares converted from Class I (See Note 1) | (93,314 | ) | (1,151,958 | ) | ||||
|
| |||||||
Net increase (decrease) | 15,795,019 | $ | 191,474,599 | |||||
|
| |||||||
| MainStay Cushing Renaissance Advantage Fund |
| |||||||
Class A | Shares | Amount | ||||||
Year ended November 30, 2019: | ||||||||
Shares sold | 129,738 | $ | 2,152,154 | |||||
Shares issued to shareholders in reinvestment of dividends and distributions | 32,352 | 545,457 | ||||||
Shares redeemed | (418,952 | ) | (6,881,383 | ) | ||||
|
| |||||||
Net increase (decrease) in shares before conversion | (256,862 | ) | (4,183,772 | ) | ||||
Shares converted into Class A (See Note 1) | 8,507 | 147,766 | ||||||
Shares converted from Class A (See Note 1) | (14,100 | ) | (243,323 | ) | ||||
|
| |||||||
Net increase (decrease) | (262,455 | ) | $ | (4,279,329 | ) | |||
|
| |||||||
Year ended November 30, 2018: | ||||||||
Shares sold | 224,700 | $ | 4,872,353 | |||||
Shares issued to shareholders in reinvestment of dividends and distributions | 30,822 | 651,908 | ||||||
Shares redeemed | (510,639 | ) | (10,825,751 | ) | ||||
|
| |||||||
Net increase (decrease) in shares before conversion | (255,117 | ) | (5,301,490 | ) | ||||
Shares converted into Class A (See Note 1) | 28,844 | 616,036 | ||||||
Shares converted from Class A (See Note 1) | (3,391 | ) | (70,804 | ) | ||||
|
| |||||||
Net increase (decrease) | (229,664 | ) | $ | (4,756,258 | ) | |||
|
| |||||||
Investor Class | Shares | Amount | ||||||
Year ended November 30, 2019: | ||||||||
Shares sold | 7,165 | $ | 120,225 | |||||
Shares issued to shareholders in reinvestment of dividends and distributions | 4,412 | 73,894 | ||||||
Shares redeemed | (34,515 | ) | (562,916 | ) | ||||
|
| |||||||
Net increase (decrease) in shares before conversion | (22,938 | ) | (368,797 | ) | ||||
Shares converted into Investor Class (See Note 1) | 15,926 | 272,976 | ||||||
Shares converted from Investor Class (See Note 1) | (7,330 | ) | (126,274 | ) | ||||
|
| |||||||
Net increase (decrease) | (14,342 | ) | $ | (222,095 | ) | |||
|
| |||||||
Year ended November 30, 2018: | ||||||||
Shares sold | 17,984 | $ | 378,915 | |||||
Shares issued to shareholders in reinvestment of dividends and distributions | 3,785 | 79,505 | ||||||
Shares redeemed | (24,577 | ) | (514,994 | ) | ||||
|
| |||||||
Net increase (decrease) in shares before conversion | (2,808 | ) | (56,574 | ) | ||||
Shares converted into Investor Class (See Note 1) | 3,405 | 70,804 | ||||||
Shares converted from Investor Class (See Note 1) | (28,961 | ) | (616,036 | ) | ||||
|
| |||||||
Net increase (decrease) | (28,364 | ) | $ | (601,806 | ) | |||
|
| |||||||
Class C | Shares | Amount | ||||||
Year ended November 30, 2019: | ||||||||
Shares sold | 13,692 | $ | 213,561 | |||||
Shares issued to shareholders in reinvestment of dividends and distributions | 17,208 | 275,032 | ||||||
Shares redeemed | (255,790 | ) | (3,930,132 | ) | ||||
|
| |||||||
Net increase (decrease) in shares before conversion | (224,890 | ) | (3,441,539 | ) | ||||
Shares converted from Class C (See Note 1) | (3,121 | ) | (51,145 | ) | ||||
|
| |||||||
Net increase (decrease) | (228,011 | ) | $ | (3,492,684 | ) | |||
|
| |||||||
Year ended November 30, 2018: | ||||||||
Shares sold | 140,151 | $ | 2,906,622 | |||||
Shares issued to shareholders in reinvestment of dividends and distributions | 19,936 | 403,263 | ||||||
Shares redeemed | (372,360 | ) | (7,538,711 | ) | ||||
|
| |||||||
Net increase (decrease) | (212,273 | ) | $ | (4,228,826 | ) | |||
|
| |||||||
| 57 |
Notes to Financial Statements(continued)
Class I | Shares | Amount | ||||||
Year ended November 30, 2019: | ||||||||
Shares sold | 798,238 | $ | 12,799,416 | |||||
Shares issued to shareholders in reinvestment of dividends and distributions | 66,652 | 1,168,527 | ||||||
Shares redeemed | (3,240,709 | ) | (55,112,680 | ) | ||||
|
| |||||||
Net increase (decrease) in shares before conversion | (2,375,819 | ) | (41,144,737 | ) | ||||
|
| |||||||
Net increase (decrease) | (2,375,819 | ) | $ | (41,144,737 | ) | |||
|
| |||||||
Year ended November 30, 2018: | ||||||||
Shares sold | 611,218 | $ | 13,103,931 | |||||
Shares issued to shareholders in reinvestment of dividends and distributions | 90,569 | 1,940,536 | ||||||
Shares redeemed | (3,088,888 | ) | (67,124,225 | ) | ||||
|
| |||||||
Net increase (decrease) in shares before conversion | (2,387,101 | ) | (52,079,758 | ) | ||||
|
| |||||||
Net increase (decrease) | (2,387,101 | ) | $ | (52,079,758 | ) | |||
|
| |||||||
Note 10–Recent Accounting Pronouncement
In March 2017, the Financial Accounting Standards Board issued an Accounting Standards Update, ASU 2017-08, which amends the amortization period for certain callable debt securities that are held at a premium. The amendment requires the premium to be amortized to the earliest call date. This amendment does not require an accounting change for securities held at a discount. This guidance is effective for fiscal years beginning after December 15, 2018. At this time, management is evaluating the implications of the ASU and any impact on the financial statements has not yet been determined.
To improve the effectiveness of fair value disclosure requirements, the Financial Accounting Standards Board recently issued Accounting Standards Update (ASU) 2018-13, Fair Value Measurement Disclosure Framework—Changes to the Disclosure Requirements for Fair Value Measurement (ASU 2018-13), which adds, removes, and modifies certain aspects relating to fair value disclosure. ASU 2018-13 is effective for interim and annual reporting periods beginning after December 15, 2019; early adoptions of the entire ASU 2018 13, or portions thereof, is permitted. Management has evaluated the implications of certain other provisions of the ASU and has determined to early adopt aspects related to the removal and modifications of certain fair value measurement disclosures under the ASU effective immediately. At this time, management is evaluating the implications of certain other provisions of the ASU related to new disclosure requirements and any impact on the financial statement disclosures has not yet been determined.
Note 11–Subsequent Events
In connection with the preparation of the financial statements of the MainStay Cushing Funds as of and for the year ended November 30, 2019, events and transactions subsequent to November 30, 2019, through the date the financial statements were issued have been evaluated by the MainStay Cushing Funds’ management for possible adjustment and/or disclosure. No subsequent events requiring financial statement adjustment or disclosure have been identified other than the following:
At a meeting held on December 10-11, 2019, the Board approved Agreements and Plans of Reorganization (each, a “Plan of Reorganization”) with respect to the MainStay Cushing Energy Income Fund and the MainStay Cushing Renaissance Advantage Fund, which provide for the reorganizations (the “Reorganizations”) of each with and into MainStay CBRE Global Infrastructure Fund, a series of the Trust. Each Plan of Reorganization is subject to approval by shareholders of the corresponding MainStay Cushing Fund at a special meeting of shareholders expected to be held on or about April 27, 2020.
On January 17, 2020 the MainStay Cushing Energy Income Fund declared distributions of $0.0442, $0.0454, $0.0401 and $0.0464 per share, to Class A shareholders, Investor Class shareholders, Class C shareholders and Class I shareholders of record on January 16, 2020, which were payable on January 17, 2020.
On December 31, 2019, the MainStay Cushing MLP Premier Fund declared a distribution payable of $0.0750 per share, to Class A shareholders, Investor Class shareholders, Class C shareholders and Class I shareholders of record on December 30, 2019, which were payable on December 31, 2019.
On January 17, 2020 the MainStay Cushing Renaissance Advantage Fund declared a distribution payable of $0.1400 per share, to Class A shareholders, Investor Class shareholders, Class C shareholders and Class I shareholders of record on January 16, 2020, which were payable on January 17, 2020.
| 58 | MainStay Cushing Funds |
Report of Independent Registered Public Accounting Firm
To the Shareholders and Board of Trustees
MainStay Funds Trust:
Opinion on the Financial Statements
We have audited the accompanying statements of assets and liabilities of MainStay Cushing® Energy Income Fund, MainStay Cushing® MLP Premier Fund, and MainStay Cushing® Renaissance Advantage Fund (the Funds), three of the funds constituting MainStay Funds Trust, including the portfolios of investments, as of November 30, 2019, the related statements of operations for the year then ended, the statements of changes in net assets for each of the years in the two-year period then ended, and the related notes (collectively, the financial statements) and the financial highlights for each of the years in the five-year period then ended. In our opinion, the financial statements and financial highlights present fairly, in all material respects, the financial position of the Funds as of November 30, 2019, the results of their operations for the year then ended, the changes in their net assets for each of the years in the two-year period then ended, and the financial highlights for each of the years in the five-year period then ended, in conformity with U.S. generally accepted accounting principles.
Basis for Opinion
These financial statements and financial highlights are the responsibility of the Funds’ management. Our responsibility is to express an opinion on these financial statements and financial highlights based on our audits. We are a public accounting firm registered with the Public Company Accounting Oversight Board (United States) (PCAOB) and are required to be independent with respect to the Funds in accordance with the U.S. federal securities laws and the applicable rules and regulations of the Securities and Exchange Commission and the PCAOB.
We conducted our audits in accordance with the standards of the PCAOB. Those standards require that we plan and perform the audit to obtain reasonable assurance about whether the financial statements and financial highlights are free of material misstatement, whether due to error or fraud. Our audits included performing procedures to assess the risks of material misstatement of the financial statements and financial highlights, whether due to error or fraud, and performing procedures that respond to those risks. Such procedures included examining, on a test basis, evidence regarding the amounts and disclosures in the financial statements and financial highlights. Such procedures also included confirmation of securities owned as of November 30, 2019, by correspondence with custodians and brokers or by other appropriate auditing procedures when replies from brokers were not received. Our audits also included evaluating the accounting principles used and significant estimates made by management, as well as evaluating the overall presentation of the financial statements and financial highlights. We believe that our audits provide a reasonable basis for our opinion.

We have served as the auditor of one or more New York Life Investment Management investment companies since 2003.
Philadelphia, Pennsylvania
January 27, 2020
| 59 |
Proxy Voting Policies and Procedures and Proxy Voting Record(Unaudited)
A description of the policies and procedures that New York Life Investments uses to vote proxies related to the Cushing Funds’ securities is available without charge, upon request, by visiting the MainStay Funds’ website atnylinvestments.com/funds or visiting the Securities and Exchange Commission’s (“SEC”) website atwww.sec.gov.
The Cushing Funds are required to file with the SEC their proxy voting record for the 12-month period ending June 30 on Form N-PX. The Cushing Funds’ most recent Form N-PX is available free of charge upon request by calling 800-624-6782; visiting the MainStay Funds’ website atnylinvestments.com/funds; or visiting the SEC’s website atwww.sec.gov.
Shareholder Reports and Quarterly Portfolio Disclosure(Unaudited)
Each Cushing Fund is required to file its complete schedule of portfolio holdings with the SEC for its first and third fiscal quarters on Form N-Q or Part F of Form N-PORT (beginning with filings after March 31, 2019). Each Cushing Fund’s Form N-Q or Part F of Form N-PORT is available free of charge by visiting the SEC’s website atwww.sec.gov or upon request by calling New York Life Investments at 800-624-6782.
| 60 | MainStay Cushing Funds |
Board of Trustees and Officers (Unaudited)
The Trustees and officers of the Funds are listed below. The Board oversees the MainStay Group of Funds (which consists of MainStay Funds and MainStay Funds Trust), MainStay VP Funds Trust, MainStay MacKay DefinedTerm Municipal Opportunities Fund, the Manager and the Subadvisors, and elects the officers of the Funds who are responsible for theday-to-day operations of the Funds. Information pertaining to the Trustees and officers is set forth below. Each Trustee serves until his or her successor is elected and qualified or until his or her
resignation, death or removal. Under the Board’s retirement policy, unless an exception is made, a Trustee must tender his or her resignation by the end of the calendar year during which he or she reaches the age of 75. Officers are elected annually by the Board. The business address of each Trustee and officer listed below is 51 Madison Avenue, New York, New York 10010. A majority of the Trustees are not “interested persons” (as defined by the 1940 Act and rules adopted by the SEC thereunder) of the Fund (“Independent Trustees”).
| Name and Year of Birth | Term of Office, Position(s) Held and Length of Service | Principal Occupation(s) During Past Five Years | Number of Portfolios in Fund Complex Overseen by Trustee | Other Directorships Held by Trustee | ||||||||
Interested Trustee | Yie-Hsin Hung* 1962 | MainStay Funds: Trustee since 2017; MainStay Funds Trust:Trustee since 2017. | Senior Vice President of New York Life since joining in 2010, Member of the Executive Management Committee since 2017, Chief Executive Officer, New York Life Investment Management Holdings LLC & New York Life Investment Management LLC since 2015. Senior Managing Director andCo-President of New York Life Investment Management LLC from January 2014 to May 2015. Previously held positions of increasing responsibility, including head of NYLIM International, Alternative Growth Businesses, and Institutional investments since joining New York Life in 2010. | 74 | MainStay VP Funds Trust: Trustee since 2017 (31 portfolios); and MainStay MacKay DefinedTerm Municipal Opportunities Fund: Trustee since 2017. |
| * | This Trustee is considered to be an “interested person” of the MainStay Group of Funds, MainStay VP Funds Trust and MainStay MacKay DefinedTerm Municipal Opportunities Fund, within the meaning of the 1940 Act because of her affiliation with New York Life Insurance Company, New York Life Investment Management LLC, Candriam Belgium S.A., Candriam Luxembourg S.C.A., IndexIQ Advisors LLC, MacKay Shields LLC, NYL Investors LLC, NYLIFE Securities LLC and/or NYLIFE Distributors LLC, as described in detail above in the column entitled “Principal Occupation(s) During Past Five Years.” |
| 61 |
| Name and Year of Birth | Term of Office, Position(s) Held and Length of Service | Principal Occupation(s) During Past Five Years | Number of Portfolios in Fund Complex Overseen by Trustee | Other Directorships Held by Trustee | ||||||||
Independent Trustees | David H. Chow 1957 | MainStay Funds: Trustee since 2016, Advisory Board Member (June 2015 to December 2015); MainStay Funds Trust:Trustee since 2016, Advisory Board Member (June 2015 to December 2015). | Founder and CEO, DanCourt Management, LLC (since 1999) | 74 | MainStay VP Funds Trust: Trustee since 2016, Advisory Board Member (June 2015 to December 2015) (31 portfolios); MainStay MacKay DefinedTerm Municipal Opportunities Fund: Trustee since 2016, Advisory Board Member (June 2015 to December 2015); Market Vectors Group of Exchange-Traded Funds: Independent Chairman of the Board of Trustees since 2008 and Trustee since 2006 (56 portfolios); and Berea College of Kentucky: Trustee since 2009. | |||||||
Susan B. Kerley 1951 | MainStay Funds: Chairman since 2017 and Trustee since 2007; MainStay Funds Trust:Chairman since 2017 and Trustee since 1990.** | President, Strategic Management Advisors LLC (since 1990) | 74 | MainStay VP Funds Trust: Chairman since January 2017 and Trustee since 2007 (31 portfolios)***; MainStay MacKay DefinedTerm Municipal Opportunities Fund: Chairman since 2017 and Trustee since 2011; and Legg Mason Partners Funds: Trustee since 1991 (45 portfolios). | ||||||||
Alan R. Latshaw 1951 | MainStay Funds: Trustee; MainStay Funds Trust: Trustee and Audit Committee Financial Expert since 2007.** | Retired; Partner, Ernst & Young LLP (2002 to 2003); Partner, Arthur Andersen LLP (1989 to 2002); Consultant to the MainStay Funds Audit and Compliance Committee (2004 to 2006) | 74 | MainStay VP Funds Trust: Trustee and Audit Committee Financial Expert since 2007 (31 portfolios)***; MainStay MacKay DefinedTerm Municipal Opportunities Fund: Trustee and Audit Committee Financial Expert since 2011; State Farm Associates Funds Trusts: Trustee since 2005 (4 portfolios); and State Farm Variable Product Trust: Trustee since 2005 (9 portfolios). | ||||||||
Richard H. Nolan, Jr. 1946 | MainStay Funds: Trustee since 2007; MainStay Funds Trust:Trustee since 2007.** | Managing Director, ICC Capital Management (since 2004); President—Shields/Alliance, Alliance Capital Management (1994 to 2004) | 74 | MainStay VP Funds Trust: Trustee since 2006 (31 portfolios)***; and MainStay MacKay DefinedTerm Municipal Opportunities Fund: Trustee since 2011. | ||||||||
Jacques P. Perold 1958 | MainStay Funds: Trustee since 2016, Advisory Board Member (June 2015 to December 2015); MainStay Funds Trust:Trustee since 2016, Advisory Board Member (June 2015 to December 2015). | Retired; President, Fidelity Management & Research Company (2009 to 2014); Founder, President and Chief Executive Officer, Geode Capital Management, LLC (2001 to 2009) | 74 | MainStay VP Funds Trust: Trustee since 2016, Advisory Board Member (June 2015 to December 2015) (31 portfolios); MainStay MacKay DefinedTerm Municipal Opportunities Fund: Trustee since 2016, Advisory Board Member (June 2015 to December 2015); Allstate Corporation: Director since 2015;MSCI, Inc.: Director since 2017 and Boston University: Trustee since 2014. |
| 62 | MainStay Cushing Funds |
| Name and Year of Birth | Term of Office, Position(s) Held and Length of Service | Principal Occupation(s) During Past Five Years | Number of Portfolios in Fund Complex Overseen by Trustee | Other Directorships Held by Trustee | ||||||||
Independent Trustees | Richard S. Trutanic 1952 | MainStay Funds: Trustee since 1994; MainStay Funds Trust: Trustee since 2007.** | Chairman and Chief Executive Officer, Somerset & Company (financial advisory firm) (since 2004); Managing Director, The Carlyle Group (private investment firm) (2002 to 2004); Senior Managing Director, Partner and Board Member, Groupe Arnault S.A. (private investment firm) (1999 to 2002) | 74 | MainStay VP Funds Trust: Trustee since 2007 (31 portfolios)***; and MainStay MacKay DefinedTerm Municipal Opportunities Fund: Trustee since 2011. |
| ** | Includes prior service as a Director/Trustee of certain predecessor entities to MainStay Funds Trust. |
| *** | Includes prior service as a Director of MainStay VP Series Fund, Inc., the predecessor to MainStay VP Funds Trust. |
| 63 |
| Name and Year of Birth | Position(s) Held and Length of Service | Principal Occupation(s) During Past Five Years | ||||||
Officers | Kirk C. Lehneis 1974 | President, MainStay Funds, MainStay Funds Trust (since 2017) | Chief Operating Officer and Senior Managing Director (since 2016), New York Life Investment Management LLC; Chairman of the Board (since 2017), NYLIFE Distributors LLC; Chairman of the Board, NYLIM Service Company LLC (since 2017); Trustee, President and Principal Executive Officer of IndexIQ Trust, IndexIQ ETF Trust and IndexIQ Active ETF Trust (since January 2018); President, MainStay MacKay DefinedTerm Municipal Opportunities Fund and MainStay VP Funds Trust (since 2017)**; Senior Managing Director, Global Product Development (2015 to 2016); Managing Director, Product Development (2010 to 2015), New York Life Investment Management LLC | |||||
Jack R. Benintende 1964 | Treasurer and Principal Financial and Accounting Officer, MainStay Funds (since 2007), MainStay Funds Trust (since 2009) | Managing Director, New York Life Investment Management LLC (since 2007); Treasurer and Principal Financial and Accounting Officer, MainStay MacKay DefinedTerm Municipal Opportunities Fund (since 2011) and MainStay VP Funds Trust (since 2007)**; and Assistant Treasurer, New York Life Investment Management Holdings LLC (2008 to 2012) | ||||||
Kevin M. Bopp 1969 | Vice President and Chief Compliance Officer, MainStay Funds and MainStay Funds Trust (since 2014) | Chief Compliance Officer, New York Life Investment Management LLC, IndexIQ Trust, IndexIQ ETF Trust and IndexIQ Active ETF Trust (since 2016), Director and Associate General Counsel (2011 to 2014) and Vice President and Assistant General Counsel (2010 to 2011), New York Life Investment Management LLC; Vice President and Chief Compliance Officer, MainStay VP Funds Trust, MainStay MacKay DefinedTerm Municipal Opportunities Fund (since 2014); Assistant Secretary, MainStay Funds, MainStay Funds Trust and MainStay VP Funds Trust (2010 to 2014)**, MainStay MacKay DefinedTerm Municipal Opportunities Fund (2011 to 2014) | ||||||
J. Kevin Gao 1967 | Secretary and Chief Legal Officer, MainStay Funds and MainStay Funds Trust (since 2010) | Managing Director and Associate General Counsel, New York Life Investment Management LLC (since 2010); Secretary and Chief Legal Officer, MainStay MacKay DefinedTerm Municipal Opportunities Fund (since 2011) and MainStay VP Funds Trust (since 2010)** | ||||||
Scott T. Harrington 1959 | Vice President—Administration, MainStay Funds (since 2005), MainStay Funds Trust (since 2009) | Managing Director, New York Life Investment Management LLC (including predecessor advisory organizations) (since 2000); Member of the Board of Directors, New York Life Trust Company (since 2009); Vice President—Administration, MainStay MacKay DefinedTerm Municipal Opportunities Fund (since 2011) and MainStay VP Funds Trust (since 2005)** |
| * | The officers listed above are considered to be “interested persons” of the MainStay Group of Funds, MainStay VP Funds Trust and MainStay MacKay Defined Term Municipal Opportunities Fund within the meaning of the 1940 Act because of their affiliation with the MainStay Group of Funds, New York Life Insurance Company and/or its affiliates, including New York Life Investment Management LLC, NYLIM Service Company LLC, NYLIFE Securities LLC and/or NYLIFE Distributors LLC, as described in detail in the column captioned “Principal Occupation(s) During Past Five Years.” Officers are elected annually by the Board. |
| ** | Includes prior service as an Officer of MainStay VP Series Fund, Inc., the predecessor to MainStay VP Funds Trust. |
| 64 | MainStay Cushing Funds |
MainStay Funds
Equity
U.S. Equity
MainStay Epoch U.S. All Cap Fund
MainStay Epoch U.S. Equity Yield Fund
MainStay Large Cap Growth Fund
MainStay MacKay Common Stock Fund
MainStay MacKay Growth Fund
MainStay MacKay S&P 500 Index Fund
MainStay MacKay Small Cap Core Fund1
MainStay MacKay U.S. Equity Opportunities Fund
MainStay MAP Equity Fund
International Equity
MainStay Epoch International Choice Fund
MainStay MacKay International Equity Fund
MainStay MacKay International Opportunities Fund
Emerging Markets Equity
MainStay Candriam Emerging Markets Equity Fund
MainStay MacKay Emerging Markets Equity Fund
Global Equity
MainStay Epoch Capital Growth Fund
MainStay Epoch Global Equity Yield Fund
Fixed Income
Taxable Income
MainStay Candriam Emerging Markets Debt Fund2
MainStay Floating Rate Fund
MainStay MacKay High Yield Corporate Bond Fund
MainStay MacKay Infrastructure Bond Fund
MainStay MacKay Short Duration High Yield Fund
MainStay Short Term Bond Fund3
MainStay MacKay Total Return Bond Fund
MainStay MacKay Unconstrained Bond Fund
Tax-Exempt Income
MainStay MacKay California Tax Free Opportunities Fund4
MainStay MacKay High Yield Municipal Bond Fund
MainStay MacKay Intermediate Tax Free Bond Fund
MainStay MacKay New York Tax Free Opportunities Fund5
MainStay MacKay Short Term Municipal Fund
MainStay MacKay Tax Free Bond Fund
Money Market
MainStay Money Market Fund
Mixed Asset
MainStay Balanced Fund
MainStay Income Builder Fund
MainStay MacKay Convertible Fund
Speciality
MainStay Cushing Energy Income Fund
MainStay Cushing MLP Premier Fund
MainStay Cushing Renaissance Advantage Fund
Asset Allocation
MainStay Conservative Allocation Fund
MainStay Growth Allocation Fund
MainStay Moderate Allocation Fund
MainStay Moderate Growth Allocation Fund
Manager
New York Life Investment Management LLC
New York, New York
Subadvisors
Candriam Belgium S.A.6
Brussels, Belgium
Candriam Luxembourg S.C.A.6
Strassen, Luxembourg
Cushing Asset Management, LP
Dallas, Texas
Epoch Investment Partners, Inc.
New York, New York
MacKay Shields LLC6
New York, New York
Markston International LLC
White Plains, New York
NYL Investors LLC6
New York, New York
Winslow Capital Management, LLC
Minneapolis, Minnesota
Legal Counsel
Dechert LLP
Washington, District of Columbia
Independent Registered Public Accounting Firm
KPMG LLP
Philadelphia, Pennsylvania
| 1. | Formerly known as MainStay Epoch U.S. Small Cap Fund. |
| 2. | Formerly known as MainStay MacKay Emerging Markets Debt Fund. |
| 3. | Formerly known as MainStay Indexed Bond Fund. |
| 4. | Class A and Class I shares of this Fund are registered for sale in AZ, CA, MI, NV, OR, TX, UT and WA. Class I shares are registered for sale in CO, FL, GA, HI, ID, MA, MD, NH, NJ and NY. |
| 5. | This Fund is registered for sale in CA, CT, DE, FL, MA, NJ, NY and VT. |
| 6. | An affiliate of New York Life Investment Management LLC. |
Not part of the Annual Report
For more information
800-624-6782
nylinvestments.com/funds
“New York Life Investments” is both a service mark, and the common trade name, of the investment advisors affiliated with New York Life Insurance Company. The MainStay Funds® are managed by New York Life Investment Management LLC and distributed by NYLIFE Distributors LLC, 30 Hudson Street, Jersey City, NJ 07302, a wholly owned subsidiary of New York Life Insurance Company. NYLIFE Distributors LLC is a Member FINRA/SIPC.
©2020 NYLIFE Distributors LLC. All rights reserved.
| 1720364 MS011-20 | MSCU11-01/20 (NYLIM) NL258 |
| Item 2. | Code of Ethics. |
As of the end of the period covered by this report, the Registrant has adopted a code of ethics (the “Code”) that applies to the Registrant’s principal executive officer (“PEO”) and principal financial officer (“PFO”). A copy of the Code is filed herewith. The Registrant did not grant any waivers, including implicit waivers, from any provisions of the Code to the PEO or PFO during the period covered by this report.
| Item 3. | Audit Committee Financial Expert. |
The Board of Trustees has determined that the Registrant has three audit committee financial experts serving on its Audit Committee. The Audit Committee financial experts are Alan R. Latshaw, David H. Chow and Susan B. Kerley. Mr. Latshaw, Mr. Chow and Ms. Kerley are “independent” within the meaning of that term under the Investment Company Act of 1940.
| Item 4. | Principal Accountant Fees and Services. |
(a) Audit Fees
The aggregate fees billed for the fiscal year ended November 30, 2019 for professional services rendered by KPMG LLP (“KPMG”) for the audit of the Registrant’s annual financial statements or services that are normally provided by KPMG in connection with statutory and regulatory filings or engagements for that fiscal year were $216,600.
The aggregate fees billed for the fiscal year ended November 30, 2018 for professional services rendered by KPMG LLP (“KPMG”) for the audit of the Registrant’s annual financial statements or services that are normally provided by KPMG in connection with statutory and regulatory filings or engagements for that fiscal year were $211,600.
(b) Audit-Related Fees
The aggregate fees billed for assurance and related services by KPMG that are reasonably related to the performance of the audit of the Registrant’s financial statements and are not reported under paragraph (a) of this Item were: (i) $0 for the fiscal year ended November 30, 2019, and (ii) $0 for the fiscal year ended November 30, 2018.
(c) Tax Fees
The aggregate fees billed for professional services rendered by KPMG for tax compliance, tax advice, and tax planning were: (i) $0 for the fiscal year ended November 30, 2019; and (ii) $0 for the fiscal year ended November 30, 2018. These services primarily included preparation of federal, state and local income tax returns and excise tax returns, as well as services relating to excise tax distribution requirements.
(d) All Other Fees
The aggregate fees billed for products and services provided by KPMG, other than the services reported in paragraphs (a) through (c) of this Item were: (i) $0 during the fiscal year ended November 30, 2019; and (ii) $0 during the fiscal year ended November 30, 2018.
(e) Pre-Approval Policies and Procedures
| (1) | The Registrant’s Audit Committee has adoptedpre-approval policies and procedures (the “Procedures”) to govern the Committee’spre-approval of (i) all audit services and permissiblenon-audit services to be provided to the Registrant by its independent accountant, and (ii) all permissiblenon-audit services to be provided by such independent accountant to the Registrant’s investment adviser and to any entity controlling, controlled by or under common control with the investment adviser that provides ongoing services to the Registrant (collectively, the “Service Affiliates”) if the services directly relate to the Registrant’s operations and financial reporting. In accordance with the Procedures, the Audit Committee is responsible for the engagement of the independent accountant to certify the Registrant’s financial statements for each fiscal year. With respect to thepre-approval ofnon-audit services provided to the Registrant and its Service Affiliates, the Procedures provide that the Audit Committee may annuallypre-approve a list of the types of services that may be provided to the Registrant or its Service Affiliates, or the Audit Committee maypre-approve such services on aproject-by-project basis as they arise. Unless a type of service has received generalpre-approval, it will require specificpre-approval by the Audit Committee if it is to be provided by the independent accountant. The Procedures also permit the Audit Committee to delegate authority to one or more of its members topre-approve any proposednon-audit services that have not been previouslypre-approved by the Audit Committee, subject to the ratification by the full Audit Committee no later than its next scheduled meeting. To date, the Audit Committee has not delegated such authority. |
| (2) | With respect to the services described in paragraphs (b) through (d) of this Item 4, no amount was approved by the Audit Committee pursuant to paragraph (c)(7)(i)(C) of Rule2-01 of RegulationS-X. |
(f) There were no hours expended on KPMG’s engagement to audit the Registrant’s financial statements for the most recent fiscal year was attributable to work performed by persons other than KPMG’s full-time, permanent employees.
(g) Allnon-audit fees billed by KPMG for services rendered to the Registrant for the fiscal years ended November 30, 2019 and November 30, 2018 are disclosed in 4(b)-(d) above.
The aggregatenon-audit fees billed by KPMG for services rendered to the Registrant’s investment adviser (not including anysub-adviser whose role is primarily portfolio management and is subcontracted with or overseen by another investment adviser), and any entity controlling, controlled by, or under common
control with the adviser that provides ongoing services to the Registrant were approximately: (i) $24,200 for the fiscal year ended November 30, 2019; and (ii) $331,321 for the fiscal year ended November 30, 2018.
(h) The Registrant’s Audit Committee has determined that thenon-audit services rendered by KPMG for the fiscal year ended November 30, 2019 to the Registrant’s investment adviser and any entity controlling, controlled by, or under common control with the Registrant’s investment adviser that provides ongoing services to the Registrant that were not required to bepre-approved by the Audit Committee because they did not relate directly to the operations and financial reporting of the registrant were compatible with maintaining the respective independence of KPMG during the relevant time period.
| Item 5. | Audit Committee of Listed Registrants |
Not applicable.
| Item 6. | Schedule of Investments |
The Schedule of Investments is included as part of Item 1 of this report.
| Item 7. | Disclosure of Proxy Voting Policies and Procedures forClosed-End Management Investment Companies. |
Not applicable.
| Item 8. | Portfolio Managers ofClosed-End Management Investment Companies. |
Not applicable.
| Item 9. | Purchases of Equity Securities byClosed-End Management Investment Company and Affiliated Purchasers. |
Not Applicable.
| Item 10. | Submission of Matters to a Vote of Security Holders. |
Since the Registrant’s last response to this Item, there have been no material changes to the procedures by which shareholders may recommend nominees to the Registrant’s Board of Trustees.
| Item 11. | Controls and Procedures. |
(a) Based on an evaluation of the Registrant’s Disclosure Controls and Procedures (as defined in Rule30a-3(c) under the Investment Company Act of 1940) (the “Disclosure Controls”), as of a date within 90 days prior to the filing date (the “Filing Date”) of this FormN-CSR (the “Report”), the Registrant’s principal executive officer and principal financial officer have concluded that the Disclosure Controls are reasonably designed to ensure that information required to be disclosed by the Registrant in the Report is recorded, processed, summarized and reported by the Filing Date, including ensuring that information required to be disclosed in the Report is accumulated and communicated to the Registrant’s management, including the Registrant’s principal executive officer and principal financial officer, as appropriate to allow timely decisions regarding required disclosure.
(b) There were no changes in the Registrant’s internal control over financial reporting (as defined in Rule30a-3(d)) under the Investment Company Act of 1940 that occurred during the period covered by this report that has materially affected, or is reasonably likely to materially affect, the Registrant’s internal control over financial reporting.
| Item 12. | Disclosure of Securities Lending Activities forClosed-End Management Investment Companies. |
Not applicable.
| Item 13. | Exhibits. |
| (a)(1) | Code of Ethics |
| (a)(2) | Certifications of principal executive officer and principal financial officer as required by Rule30a-2 under the Investment Company Act of 1940. |
| (b) | Certifications of principal executive officer and principal financial officer as required by Section 906 of the Sarbanes-Oxley Act of 2002. |
SIGNATURES
Pursuant to the requirements of the Securities Exchange Act of 1934 and the Investment Company Act of 1940, the Registrant has duly caused this Report to be signed on its behalf by the undersigned, thereunto duly authorized.
MAINSTAY FUNDS TRUST
| By: | /s/ Kirk C. Lehneis | |
Kirk C. Lehneis President and Principal Executive Officer | ||
| Date: | February 7, 2020 | |
Pursuant to the requirements of the Securities Exchange Act of 1934 and the Investment Company Act of 1940, this Report has been signed below by the following persons on behalf of the Registrant and in the capacities and on the dates indicated.
| By: | /s/ Kirk C. Lehneis | |
Kirk C. Lehneis President and Principal Executive Officer | ||
| Date: | February 7, 2020 | |
| By: | /s/ Jack R. Benintende | |
Jack R. Benintende Treasurer and Principal Financial and Accounting Officer | ||
| Date: | February 7, 2020 | |
EXHIBIT INDEX
| (a)(1) | Code of Ethics | |
| (a)(2) | Certifications of principal executive officer and principal financial officer as required by Rule30a-2 under the Investment Company Act of 1940. | |
| (b) | Certification of principal executive officer and principal financial officer as required by Section 906 of the Sarbanes-Oxley Act of 2002. | |