UNITED STATES
SECURITIES AND EXCHANGE COMMISSION
Washington, D.C. 20549
Form N-CSR
CERTIFIED SHAREHOLDER REPORT OF REGISTERED MANAGEMENT
INVESTMENT COMPANIES
Investment Company Act File Number 811-22321
MAINSTAY FUNDS TRUST
(Exact name of Registrant as specified in charter)
51 Madison Avenue, New York, NY 10010
(Address of principal executive offices) (Zip code)
J. Kevin Gao, Esq.
30 Hudson Street
Jersey City, New Jersey 07302
(Name and address of agent for service)
Registrant’s telephone number, including area code: (212) 576-7000
Date of fiscal year end: October 31
Date of reporting period: April 30, 2022
| Item 1. | Reports to Stockholders. |
Message from the President and Semiannual Report
please log in to newyorklifeinvestments.com/accounts.
Not FDIC/NCUA Insured | Not a Deposit | May Lose Value | No Bank Guarantee | Not Insured by Any Government Agency |


5 | |
9 | |
12 | |
21 | |
30 | |
40 | |
45 | |
46 | |
46 |
Investors should refer to the Fund’s Summary Prospectus and/or Prospectus and consider the Fund’s investment objectives, strategies, risks, charges and expenses carefully before investing. The Summary Prospectus and/or Prospectus contain this and other information about the Fund. You may obtain copies of the Fund’s Summary Prospectus, Prospectus and Statement of Additional Information, which includes information about MainStay Funds Trust's Trustees, free of charge, upon request, by calling toll-free 800-624-6782, by writing to NYLIFE Distributors LLC, Attn: MainStay Marketing Department, 30 Hudson Street, Jersey City, NJ 07302 or by sending an e-mail to MainStayShareholderServices@nylim.com. These documents are also available via the MainStay Funds’ website at newyorklifeinvestments.com. Please read the Fund’s Summary Prospectus and/or Prospectus carefully before investing.

Average Annual Total Returns for the Period-Ended April 30, 2022 | ||||||||
Class | Sales Charge | Inception Date1 | Six Months2 | One Year | Five Years | Ten Years or Since Inception | Gross Expense Ratio3 | |
Class A Shares4 | Maximum 3% Initial Sales Charge | With sales charges | 1/2/2004 | -6.44% | -3.11% | 5.07% | 7.07% | 1.07% |
Excluding sales charges | -3.55 | -0.11 | 6.26 | 7.68 | 1.07 | |||
Investor Class Shares4, 5 | Maximum 2.5% Initial Sales Charge | With sales charges | 2/28/2008 | -6.06 | -2.85 | 4.83 | 6.86 | 1.36 |
Excluding sales charges | -3.65 | -0.36 | 6.03 | 7.47 | 1.36 | |||
Class B Shares6 | Maximum 5% CDSC | With sales charges | 1/2/2004 | -7.90 | -5.14 | 4.93 | 6.66 | 2.11 |
if Redeemed Within the First Six Years of Purchase | Excluding sales charges | -4.02 | -1.14 | 5.22 | 6.66 | 2.11 | ||
Class C Shares | Maximum 1% CDSC | With sales charges | 12/30/2002 | -4.80 | -1.91 | 5.23 | 6.67 | 2.11 |
if Redeemed Within One Year of Purchase | Excluding sales charges | -4.02 | -1.11 | 5.23 | 6.67 | 2.11 | ||
Class I Shares | No Sales Charge | 5/1/1989 | -3.42 | 0.13 | 6.52 | 7.94 | 0.83 | |
Class R1 Shares | No Sales Charge | 1/2/2004 | -3.47 | 0.04 | 6.42 | 7.84 | 0.93 | |
Class R2 Shares | No Sales Charge | 1/2/2004 | -3.59 | -0.21 | 6.18 | 7.58 | 1.18 | |
Class R3 Shares | No Sales Charge | 4/28/2006 | -3.74 | -0.48 | 5.88 | 7.29 | 1.43 | |
Class R6 Shares | No Sales Charge | 12/15/2017 | -3.38 | 0.22 | N/A | 6.19 | 0.73 | |
1. | Effective March 5, 2021, the Fund replaced the subadvisor to the equity portion of the Fund and modified its principal investment strategies. The past performance in the graph and table prior to that date reflects the Fund’s prior subadvisor and principal investment strategies for the equity portion of the Fund. |
2. | Not annualized. |
3. | The gross expense ratios presented reflect the Fund’s “Total Annual Fund Operating Expenses” from the most recent Prospectus, as supplemented, and may differ from other expense ratios disclosed in this report. |
4. | Prior to November 4, 2019, the maximum initial sales charge was 5.5%, which is reflected in the applicable average annual total return figures shown. |
5. | Prior to June 30, 2020, the maximum initial sales charge was 3%, which is reflected in the applicable average annual total return figures shown. |
6. | Class B shares are closed to all new purchases as well as additional investments by existing Class B shareholders. |
Benchmark Performance* | Six Months1 | One Year | Five Years | Ten Years |
Russell 1000® Value Index2 | -3.94% | 1.32% | 9.06% | 11.17% |
Bloomberg U.S. Intermediate Government/Credit Bond Index3 | -6.43 | -6.48 | 1.27 | 1.55 |
Balanced Composite Index4 | -4.83 | -1.71 | 6.25 | 7.49 |
Russell Midcap® Value Index5 | -4.84 | 0.00 | 8.61 | 11.40 |
Morningstar Allocation-50% to 70% Equity Category Average6 | -8.84 | -4.42 | 6.71 | 6.88 |
* | Returns for indices reflect no deductions for fees, expenses or taxes, except for foreign withholding taxes where applicable. |
1. | Not annualized. |
2. | The Fund has selected the Russell 1000® Value Index as its primary benchmark. The Russell 1000® Value Index measures the performance of the large-cap value segment of the U.S. equity universe. It includes those Russell 1000® Index companies with lower price-to-book ratios and lower expected growth values. Results assume reinvestment of all dividends and capital gains. An investment cannot be made directly in an index. |
3. | The Fund has selected the Bloomberg U.S. Intermediate Government/Credit Bond Index as a secondary benchmark. The Bloomberg U.S. Intermediate Government/Credit Bond Index measures the performance of U.S. dollar denominated U.S. treasuries, government related and investment grade U.S. corporate securities that have a remaining maturity of greater than one year and less than ten years. Results assume reinvestment of all dividends and capital gains. An investment cannot be made directly in an index. |
4. | The Fund has selected the Balanced Composite Index as an additional benchmark. The Balanced Composite Index consists of the Russell Midcap® Value Index and the Bloomberg U.S. Intermediate Government/Credit Bond Index weighted 60% and 40%, respectively. Results assume reinvestment of all dividends and capital gains. An investment cannot be made directly in an index. |
5. | The Fund's Russell Midcap® Value Index has been replaced as the Fund’s primary broad-based securities market index for comparison purposes. The Russell Midcap® Value Index measures the performance of the mid-cap value segment of the U.S. equity universe. It includes those Russell Midcap® Index companies with lower price-to-book ratios and lower forecasted growth values. Results assume reinvestment of all dividends and capital gains. An investment cannot be made directly in an index. |
6. | The Morningstar Allocation – 50% to 70% Equity Category Average is representative of funds that seek to provide both income and capital appreciation by investing in multiple asset classes, including stocks, bonds, and cash. These portfolios are dominated by domestic holdings and have equity exposures between 50% and 70%. Results are based on average total returns of similar funds with all dividends and capital gain distributions reinvested. |
6 | MainStay Balanced Fund |
Share Class | Beginning Account Value 11/1/21 | Ending Account Value (Based on Actual Returns and Expenses) 4/30/22 | Expenses Paid During Period1 | Ending Account Value (Based on Hypothetical 5% Annualized Return and Actual Expenses) 4/30/22 | Expenses Paid During Period1 | Net Expense Ratio During Period2 |
Class A Shares | $1,000.00 | $964.50 | $5.16 | $1,019.54 | $5.31 | 1.06% |
Investor Class Shares | $1,000.00 | $963.50 | $6.43 | $1,018.25 | $6.61 | 1.32% |
Class B Shares | $1,000.00 | $959.80 | $10.06 | $1,014.53 | $10.34 | 2.07% |
Class C Shares | $1,000.00 | $959.80 | $10.06 | $1,014.53 | $10.34 | 2.07% |
Class I Shares | $1,000.00 | $965.80 | $3.95 | $1,020.78 | $4.06 | 0.81% |
Class R1 Shares | $1,000.00 | $965.30 | $4.43 | $1,020.28 | $4.56 | 0.91% |
Class R2 Shares | $1,000.00 | $964.10 | $5.65 | $1,019.04 | $5.81 | 1.16% |
Class R3 Shares | $1,000.00 | $962.60 | $6.86 | $1,017.80 | $7.05 | 1.41% |
Class R6 Shares | $1,000.00 | $966.20 | $3.56 | $1,021.18 | $3.66 | 0.73% |
1. | Expenses are equal to the Fund’s annualized expense ratio of each class multiplied by the average account value over the period, divided by 365 and multiplied by 181 (to reflect the six-month period). The table above represents the actual expenses incurred during the six-month period. In addition to the fees and expenses which the Fund bears directly, it also indirectly bears a pro rata share of the fees and expenses of the underlying funds in which it invests. Such indirect expenses are not included in the above-reported expense figures. |
2. | Expenses are equal to the Fund's annualized expense ratio to reflect the six-month period. |
Portfolio Composition as of April 30, 2022 (Unaudited)

Top Ten Holdings and/or Issuers Held as of April 30, 2022 (excluding short-term investments) (Unaudited)
1. | U.S. Treasury Notes, 1.875%-2.75%, due 3/31/23–2/15/32 |
2. | iShares Russell 1000 Value ETF |
3. | UnitedHealth Group, Inc. |
4. | JPMorgan Chase & Co. |
5. | Pfizer, Inc. |
6. | Anthem, Inc. |
7. | Cisco Systems, Inc. |
8. | Merck & Co., Inc. |
9. | ConocoPhillips |
10. | Morgan Stanley |
8 | MainStay Balanced Fund |
10 | MainStay Balanced Fund |
Principal Amount | Value | |
Long-Term Bonds 33.2% | ||
Asset-Backed Securities 2.4% | ||
Other Asset-Backed Securities 2.4% | ||
AIG CLO LLC | ||
Series 2020-1A, Class AR | ||
2.204% (3 Month LIBOR + 1.16%), due 4/15/34 (a)(b) | $ 500,000 | $ 490,312 |
Apidos CLO XXX | ||
Series XXXA, Class A2 | ||
2.644% (3 Month LIBOR + 1.60%), due 10/18/31 (a)(b) | 600,000 | 592,573 |
Apidos CLO XXXII | ||
Series 2019-32A, Class A1 | ||
2.383% (3 Month LIBOR + 1.32%), due 1/20/33 (a)(b) | 600,000 | 598,867 |
ARES L CLO Ltd. | ||
Series 2018-50A, Class AR | ||
2.094% (3 Month LIBOR + 1.05%), due 1/15/32 (a)(b) | 500,000 | 495,732 |
ARES XXXVIII CLO Ltd. | ||
Series 2015-38A, Class BR | ||
2.463% (3 Month LIBOR + 1.40%), due 4/20/30 (a)(b) | 600,000 | 589,444 |
CAL Funding IV Ltd. | ||
Series 2020-1A, Class A | ||
2.22%, due 9/25/45 (a) | 1,081,771 | 993,522 |
Carlyle Global Market Strategies CLO Ltd. | ||
Series 2013-3A, Class A2R | ||
2.444% (3 Month LIBOR + 1.40%), due 10/15/30 (a)(b) | 1,100,000 | 1,081,068 |
Cedar Funding XII CLO Ltd. | ||
Series 2020-12A, Class A1R | ||
2.314% (3 Month LIBOR + 1.13%), due 10/25/34 (a)(b) | 600,000 | 590,516 |
ELFI Graduate Loan Program LLC | ||
Series 2021-A, Class A | ||
1.53%, due 12/26/46 (a) | 348,137 | 320,118 |
Global SC Finance VII SRL | ||
Series 2021-2A, Class A | ||
1.95%, due 8/17/41 (a) | 557,140 | 507,633 |
Neuberger Berman Loan Advisers CLO 35 Ltd. | ||
Series 2019-35A, Class A1 | ||
2.384% (3 Month LIBOR + 1.34%), due 1/19/33 (a)(b) | 900,000 | 898,284 |
Oaktree CLO Ltd. | ||
Series 2020-1A, Class BR | ||
2.694% (3 Month LIBOR + 1.65%), due 7/15/34 (a)(b) | 500,000 | 489,031 |
Principal Amount | Value | |
Other Asset-Backed Securities (continued) | ||
Palmer Square CLO Ltd. | ||
Series 2015-2A, Class A2R2 | ||
2.613% (3 Month LIBOR + 1.55%), due 7/20/30 (a)(b) | $ 250,000 | $ 248,114 |
Palmer Square Loan Funding Ltd. | ||
Series 2021-3A, Class A2 | ||
2.463% (3 Month LIBOR + 1.40%), due 7/20/29 (a)(b) | 500,000 | 494,449 |
Regatta XIV Funding Ltd. | ||
Series 2018-3A, Class A | ||
2.374% (3 Month LIBOR + 1.19%), due 10/25/31 (a)(b) | 400,000 | 396,936 |
STORE Master Funding I-VII XIV XIX XX | ||
Series 2021-1A, Class A1 | ||
2.12%, due 6/20/51 (a) | 307,464 | 270,904 |
THL Credit Wind River CLO Ltd. | ||
Series 2017-4A, Class A | ||
1.63% (3 Month LIBOR + 1.15%), due 11/20/30 (a)(b) | 507,000 | 504,814 |
TICP CLO X Ltd. | ||
Series 2018-10A, Class A | ||
2.063% (3 Month LIBOR + 1.00%), due 4/20/31 (a)(b) | 400,000 | 397,168 |
Trestles CLO IV Ltd. | ||
Series 2021-4A, Class A | ||
2.268% (3 Month LIBOR + 1.17%), due 7/21/34 (a)(b) | 400,000 | 395,166 |
Vantage Data Centers Issuer LLC | ||
Series 2020-1A, Class A2 | ||
1.645%, due 9/15/45 (a) | 850,000 | 778,612 |
Wellfleet CLO Ltd. | ||
Series 2021-2A, Class A1 | ||
2.244% (3 Month LIBOR + 1.20%), due 7/15/34 (a)(b) | 466,667 | 461,024 |
Total Asset-Backed Securities (Cost $11,947,118) | 11,594,287 | |
Corporate Bonds 11.3% | ||
Aerospace & Defense 0.2% | ||
Boeing Co. (The) | ||
3.10%, due 5/1/26 | 285,000 | 269,556 |
3.25%, due 2/1/28 | 400,000 | 368,688 |
5.15%, due 5/1/30 | 450,000 | 446,440 |
1,084,684 | ||
12 | MainStay Balanced Fund |
Principal Amount | Value | |
Corporate Bonds (continued) | ||
Apparel 0.0% ‡ | ||
Ralph Lauren Corp. | ||
1.70%, due 6/15/22 | $ 200,000 | $ 200,098 |
Auto Manufacturers 1.0% | ||
Daimler Finance North America LLC | ||
2.625%, due 3/10/30 (a) | 350,000 | 313,545 |
Daimler Trucks Finance North America LLC | ||
3.65%, due 4/7/27 (a) | 600,000 | 585,092 |
Ford Motor Credit Co. LLC | ||
3.087%, due 1/9/23 | 575,000 | 575,506 |
3.664%, due 9/8/24 | 1,075,000 | 1,040,063 |
General Motors Financial Co., Inc. | ||
1.05%, due 3/8/24 | 250,000 | 238,640 |
1.50%, due 6/10/26 | 1,555,000 | 1,384,444 |
Hyundai Capital America (a) | ||
1.80%, due 1/10/28 | 250,000 | 215,395 |
2.375%, due 10/15/27 | 425,000 | 378,334 |
4,731,019 | ||
Banks 2.3% | ||
Bank of America Corp. (c) | ||
2.087%, due 6/14/29 | 1,250,000 | 1,085,429 |
4.571%, due 4/27/33 | 550,000 | 547,554 |
Citigroup, Inc. | ||
3.20%, due 10/21/26 | 1,100,000 | 1,060,261 |
Fifth Third Bancorp | ||
4.055%, due 4/25/28 (c) | 1,050,000 | 1,042,566 |
Goldman Sachs Group, Inc. (The) | ||
2.64%, due 2/24/28 (c) | 600,000 | 551,352 |
JPMorgan Chase & Co. (c) | ||
1.578%, due 4/22/27 | 1,280,000 | 1,157,914 |
2.963%, due 1/25/33 | 985,000 | 866,576 |
Lloyds Banking Group plc | ||
0.695% (1 Year Treasury Constant Maturity Rate + 0.55%), due 5/11/24 (b) | 650,000 | 630,810 |
Morgan Stanley (c) | ||
1.512%, due 7/20/27 | 195,000 | 173,590 |
5.297%, due 4/20/37 | 375,000 | 375,070 |
Santander UK Group Holdings plc | ||
2.469%, due 1/11/28 (c) | 1,100,000 | 992,451 |
Societe Generale SA | ||
1.792% (1 Year Treasury Constant Maturity Rate + 1.00%), due 6/9/27 (a)(b) | 525,000 | 463,309 |
Principal Amount | Value | |
Banks (continued) | ||
Standard Chartered plc (a)(b) | ||
0.991% (1 Year Treasury Constant Maturity Rate + 0.78%), due 1/12/25 | $ 300,000 | $ 284,802 |
2.608% (1 Year Treasury Constant Maturity Rate + 1.18%), due 1/12/28 | 275,000 | 248,613 |
State Street Corp. | ||
2.203%, due 2/7/28 (c) | 350,000 | 324,760 |
Sumitomo Mitsui Trust Bank Ltd. | ||
1.35%, due 9/16/26 (a) | 425,000 | 380,608 |
UBS Group AG (a)(b) | ||
1.364% (1 Year Treasury Constant Maturity Rate + 1.08%), due 1/30/27 | 675,000 | 605,629 |
2.746% (1 Year Treasury Constant Maturity Rate + 1.10%), due 2/11/33 | 550,000 | 461,727 |
11,253,021 | ||
Beverages 0.1% | ||
Diageo Capital plc | ||
2.125%, due 4/29/32 | 475,000 | 404,564 |
Building Materials 0.2% | ||
Martin Marietta Materials, Inc. | ||
3.45%, due 6/1/27 | 450,000 | 436,294 |
Owens Corning | ||
3.95%, due 8/15/29 | 775,000 | 757,903 |
1,194,197 | ||
Chemicals 0.1% | ||
International Flavors & Fragrances, Inc. | ||
1.832%, due 10/15/27 (a) | 425,000 | 374,471 |
LYB International Finance III LLC | ||
1.25%, due 10/1/25 | 197,000 | 180,605 |
555,076 | ||
Commercial Services 0.2% | ||
Ashtead Capital, Inc. | ||
2.45%, due 8/12/31 (a) | 575,000 | 468,908 |
Global Payments, Inc. | ||
2.15%, due 1/15/27 | 400,000 | 362,662 |
831,570 | ||
Diversified Financial Services 1.4% | ||
AerCap Ireland Capital DAC | ||
3.00%, due 10/29/28 | 850,000 | 738,770 |
Principal Amount | Value | |
Corporate Bonds (continued) | ||
Diversified Financial Services (continued) | ||
Air Lease Corp. | ||
0.70%, due 2/15/24 | $ 1,425,000 | $ 1,350,800 |
Aircastle Ltd. | ||
2.85%, due 1/26/28 (a) | 675,000 | 589,165 |
Antares Holdings LP | ||
3.95%, due 7/15/26 (a) | 750,000 | 688,227 |
Aviation Capital Group LLC (a) | ||
1.95%, due 1/30/26 | 275,000 | 245,664 |
1.95%, due 9/20/26 | 575,000 | 503,181 |
Blackstone Holdings Finance Co. LLC | ||
1.625%, due 8/5/28 (a) | 425,000 | 365,082 |
BOC Aviation USA Corp. | ||
1.625%, due 4/29/24 (a) | 425,000 | 407,273 |
LSEGA Financing plc | ||
2.00%, due 4/6/28 (a) | 2,065,000 | 1,824,686 |
Thirax 1 LLC | ||
0.968%, due 1/14/33 | 315,828 | 275,983 |
6,988,831 | ||
Electric 0.9% | ||
Commonwealth Edison Co. | ||
3.10%, due 11/1/24 | 290,000 | 288,103 |
Entergy Arkansas LLC | ||
3.70%, due 6/1/24 | 665,000 | 671,957 |
Entergy Corp. | ||
4.00%, due 7/15/22 | 1,195,000 | 1,197,210 |
FirstEnergy Transmission LLC | ||
4.35%, due 1/15/25 (a) | 1,210,000 | 1,207,423 |
Pinnacle West Capital Corp. | ||
1.30%, due 6/15/25 | 675,000 | 624,014 |
Tampa Electric Co. | ||
2.40%, due 3/15/31 | 250,000 | 219,303 |
4,208,010 | ||
Electrical Components & Equipment 0.2% | ||
Emerson Electric Co. | ||
1.80%, due 10/15/27 | 450,000 | 406,862 |
2.00%, due 12/21/28 | 350,000 | 312,853 |
719,715 | ||
Electronics 0.1% | ||
Flex Ltd. | ||
3.75%, due 2/1/26 | 350,000 | 341,556 |
Entertainment 0.3% | ||
Magallanes, Inc. | ||
4.054%, due 3/15/29 (a) | 1,550,000 | 1,480,046 |
Principal Amount | Value | |
Environmental Control 0.1% | ||
Waste Management, Inc. | ||
4.15%, due 4/15/32 (d) | $ 410,000 | $ 407,827 |
Food 0.1% | ||
Conagra Brands, Inc. | ||
4.85%, due 11/1/28 | 615,000 | 618,284 |
Forest Products & Paper 0.1%��� | ||
Georgia-Pacific LLC | ||
0.95%, due 5/15/26 (a) | 275,000 | 247,889 |
Healthcare-Products 0.1% | ||
Baxter International, Inc. | ||
2.272%, due 12/1/28 (a) | 750,000 | 667,788 |
Healthcare-Services 0.2% | ||
Fresenius Medical Care U.S. Finance III, Inc. (a) | ||
1.875%, due 12/1/26 | 275,000 | 249,001 |
2.375%, due 2/16/31 | 640,000 | 520,174 |
769,175 | ||
Home Builders 0.2% | ||
MDC Holdings, Inc. | ||
2.50%, due 1/15/31 | 275,000 | 220,804 |
PulteGroup, Inc. | ||
5.50%, due 3/1/26 | 665,000 | 693,852 |
914,656 | ||
Insurance 0.4% | ||
Brighthouse Financial Global Funding | ||
1.00%, due 4/12/24 (a) | 1,275,000 | 1,213,824 |
Corebridge Financial, Inc. | ||
3.85%, due 4/5/29 (a) | 325,000 | 310,291 |
Principal Life Global Funding II | ||
1.25%, due 8/16/26 (a) | 425,000 | 380,827 |
1,904,942 | ||
Investment Companies 0.1% | ||
Blackstone Secured Lending Fund | ||
2.125%, due 2/15/27 (a) | 225,000 | 195,461 |
Prospect Capital Corp. | ||
3.437%, due 10/15/28 | 585,000 | 487,169 |
682,630 | ||
Iron & Steel 0.1% | ||
Nucor Corp. | ||
2.00%, due 6/1/25 | 350,000 | 334,846 |
14 | MainStay Balanced Fund |
Principal Amount | Value | |
Corporate Bonds (continued) | ||
Media 0.2% | ||
Charter Communications Operating LLC | ||
2.25%, due 1/15/29 | $ 400,000 | $ 340,851 |
Thomson Reuters Corp. | ||
3.85%, due 9/29/24 | 400,000 | 400,789 |
741,640 | ||
Mining 0.2% | ||
Anglo American Capital plc (a) | ||
2.25%, due 3/17/28 | 700,000 | 621,167 |
5.625%, due 4/1/30 | 550,000 | 576,514 |
1,197,681 | ||
Oil & Gas 0.0% ‡ | ||
Valero Energy Corp. | ||
2.85%, due 4/15/25 | 202,000 | 196,490 |
Oil & Gas Services 0.3% | ||
Schlumberger Holdings Corp. | ||
3.75%, due 5/1/24 (a) | 1,195,000 | 1,202,258 |
Packaging & Containers 0.2% | ||
WRKCo, Inc. | ||
3.75%, due 3/15/25 | 1,145,000 | 1,150,955 |
Pharmaceuticals 0.4% | ||
AbbVie, Inc. | ||
4.25%, due 11/14/28 | 575,000 | 573,133 |
Bayer US Finance II LLC | ||
4.375%, due 12/15/28 (a) | 885,000 | 877,716 |
CVS Health Corp. | ||
1.875%, due 2/28/31 | 630,000 | 517,178 |
Merck & Co., Inc. | ||
2.15%, due 12/10/31 | 150,000 | 130,593 |
2,098,620 | ||
Real Estate Investment Trusts 0.7% | ||
American Campus Communities Operating Partnership LP | ||
3.30%, due 7/15/26 | 1,030,000 | 1,015,372 |
Brixmor Operating Partnership LP | ||
2.50%, due 8/16/31 | 150,000 | 124,166 |
CubeSmart LP | ||
2.25%, due 12/15/28 | 650,000 | 570,377 |
Realty Income Corp. | ||
3.95%, due 8/15/27 | 1,045,000 | 1,037,151 |
Principal Amount | Value | |
Real Estate Investment Trusts (continued) | ||
Simon Property Group LP | ||
1.75%, due 2/1/28 | $ 425,000 | $ 372,155 |
Spirit Realty LP | ||
2.70%, due 2/15/32 | 225,000 | 188,693 |
3,307,914 | ||
Retail 0.1% | ||
Advance Auto Parts, Inc. | ||
1.75%, due 10/1/27 | 175,000 | 153,411 |
Dick's Sporting Goods, Inc. | ||
3.15%, due 1/15/32 | 200,000 | 167,002 |
320,413 | ||
Semiconductors 0.1% | ||
Skyworks Solutions, Inc. | ||
1.80%, due 6/1/26 | 450,000 | 409,443 |
Telecommunications 0.7% | ||
AT&T, Inc. | ||
4.35%, due 3/1/29 | 955,000 | 964,113 |
T-Mobile US, Inc. | ||
2.55%, due 2/15/31 | 975,000 | 828,111 |
Verizon Communications, Inc. | ||
2.10%, due 3/22/28 | 400,000 | 358,216 |
3.376%, due 2/15/25 | 8,000 | 7,992 |
4.016%, due 12/3/29 | 1,031,000 | 1,008,649 |
3,167,081 | ||
Total Corporate Bonds (Cost $58,496,907) | 54,332,919 | |
Foreign Government Bond 0.1% | ||
Philippines 0.1% | ||
Philippine Government Bond | ||
3.00%, due 2/1/28 | 325,000 | 312,304 |
Total Foreign Government Bond (Cost $317,505) | 312,304 | |
Mortgage-Backed Securities 0.5% | ||
Commercial Mortgage Loans (Collateralized Mortgage Obligations) 0.5% | ||
BFLD Trust | ||
Series 2021-FPM, Class A | ||
2.155% (1 Month LIBOR + 1.60%), due 6/15/38 (a)(b) | 600,000 | 591,720 |
Principal Amount | Value | |
Mortgage-Backed Securities (continued) | ||
Commercial Mortgage Loans (Collateralized Mortgage Obligations) (continued) | ||
Citigroup Commercial Mortgage Trust | ||
Series 2020-420K, Class A | ||
2.456%, due 11/10/42 (a) | $ 600,000 | $ 529,940 |
Series 2020-GC46, Class A5 | ||
2.717%, due 2/15/53 | 1,000,000 | 915,883 |
CSMC WEST Trust | ||
Series 2020-WEST, Class A | ||
3.04%, due 2/15/35 (a) | 550,000 | 495,840 |
Total Mortgage-Backed Securities (Cost $2,799,506) | 2,533,383 | |
U.S. Government & Federal Agencies 18.9% | ||
Federal Home Loan Mortgage Corporation (Mortgage Pass-Through Securities) 1.2% | ||
FFCB | ||
2.03%, due 1/21/28 | 1,200,000 | 1,138,113 |
2.13%, due 4/19/34 | 550,000 | 471,969 |
FHLB | ||
3.00%, due 3/25/27 | 700,000 | 691,211 |
3.125%, due 9/12/25 | 800,000 | 804,152 |
4.00%, due 5/26/27 | 1,250,000 | 1,249,649 |
4.00%, due 4/20/29 | 1,175,000 | 1,173,697 |
5,528,791 | ||
United States Treasury Notes 17.7% | ||
U.S. Treasury Notes | ||
1.875%, due 2/15/32 | 9,575,000 | 8,743,172 |
2.375%, due 3/31/29 | 9,775,000 | 9,423,711 |
2.50%, due 3/31/23 | 6,200,000 | 6,223,976 |
2.50%, due 4/30/24 | 18,950,000 | 18,870,055 |
2.625%, due 4/15/25 | 19,830,000 | 19,687,472 |
2.75%, due 4/30/27 | 22,775,000 | 22,579,277 |
85,527,663 | ||
Total U.S. Government & Federal Agencies (Cost $92,273,126) | 91,056,454 | |
Total Long-Term Bonds (Cost $165,834,162) | 159,829,347 | |
Shares | ||
Common Stocks 57.1% | ||
Aerospace & Defense 3.6% | ||
General Dynamics Corp. | 18,156 | 4,294,439 |
Shares | Value | |
Aerospace & Defense (continued) | ||
L3Harris Technologies, Inc. | 19,603 | $ 4,552,993 |
Northrop Grumman Corp. | 8,809 | 3,870,674 |
Raytheon Technologies Corp. | 49,954 | 4,741,134 |
17,459,240 | ||
Auto Components 0.8% | ||
Gentex Corp. | 124,592 | 3,656,775 |
Banks 4.1% | ||
JPMorgan Chase & Co. | 66,639 | 7,954,031 |
M&T Bank Corp. | 31,909 | 5,317,316 |
PNC Financial Services Group, Inc. (The) | 20,728 | 3,442,921 |
Truist Financial Corp. | 67,804 | 3,278,323 |
19,992,591 | ||
Beverages 0.8% | ||
Keurig Dr Pepper, Inc. | 98,537 | 3,685,284 |
Building Products 1.3% | ||
Fortune Brands Home & Security, Inc. | 31,393 | 2,236,751 |
Johnson Controls International plc | 66,424 | 3,976,805 |
6,213,556 | ||
Capital Markets 2.6% | ||
Ares Management Corp. | 49,461 | 3,275,307 |
LPL Financial Holdings, Inc. | 20,518 | 3,854,717 |
Morgan Stanley | 69,120 | 5,570,381 |
12,700,405 | ||
Chemicals 0.6% | ||
Axalta Coating Systems Ltd. (e) | 107,482 | 2,726,818 |
Communications Equipment 2.1% | ||
Cisco Systems, Inc. | 140,571 | 6,885,167 |
F5, Inc. (e) | 19,826 | 3,319,071 |
10,204,238 | ||
Containers & Packaging 0.6% | ||
Sealed Air Corp. | 45,386 | 2,914,235 |
Electric Utilities 1.7% | ||
Duke Energy Corp. | 38,519 | 4,243,253 |
Exelon Corp. | 83,155 | 3,889,991 |
8,133,244 | ||
Electrical Equipment 0.7% | ||
Hubbell, Inc. | 17,765 | 3,470,571 |
16 | MainStay Balanced Fund |
Shares | Value | |
Common Stocks (continued) | ||
Electronic Equipment, Instruments & Components 1.0% | ||
Corning, Inc. | 134,495 | $ 4,732,879 |
Entertainment 0.8% | ||
Electronic Arts, Inc. | 32,287 | 3,811,480 |
Equity Real Estate Investment Trusts 2.3% | ||
Gaming and Leisure Properties, Inc. | 89,796 | 3,985,147 |
Host Hotels & Resorts, Inc. | 171,665 | 3,493,383 |
Welltower, Inc. | 37,703 | 3,423,809 |
10,902,339 | ||
Food Products 0.9% | ||
Mondelez International, Inc., Class A | 66,657 | 4,298,043 |
Health Care Equipment & Supplies 2.5% | ||
Becton Dickinson and Co. | 16,136 | 3,988,658 |
Boston Scientific Corp. (e) | 85,882 | 3,616,491 |
Medtronic plc | 41,332 | 4,313,407 |
11,918,556 | ||
Health Care Providers & Services 4.7% | ||
Anthem, Inc. | 14,213 | 7,133,931 |
Centene Corp. (e) | 58,318 | 4,697,515 |
UnitedHealth Group, Inc. | 21,101 | 10,730,914 |
22,562,360 | ||
Household Durables 0.5% | ||
Lennar Corp., Class A | 29,815 | 2,280,549 |
Insurance 3.9% | ||
Assurant, Inc. | 19,580 | 3,561,210 |
Chubb Ltd. | 27,714 | 5,721,555 |
MetLife, Inc. | 89,569 | 5,882,892 |
Progressive Corp. (The) | 35,860 | 3,849,930 |
19,015,587 | ||
Interactive Media & Services 1.1% | ||
Alphabet, Inc., Class C (e) | 2,351 | 5,405,725 |
IT Services 1.4% | ||
Amdocs Ltd. | 38,491 | 3,067,348 |
Global Payments, Inc. | 28,120 | 3,851,877 |
6,919,225 | ||
Machinery 0.7% | ||
Middleby Corp. (The) (e) | 22,504 | 3,463,141 |
Shares | Value | |
Media 1.8% | ||
Comcast Corp., Class A | 147,060 | $ 5,847,106 |
Omnicom Group, Inc. | 37,873 | 2,883,271 |
8,730,377 | ||
Multi-Utilities 1.8% | ||
Dominion Energy, Inc. | 52,833 | 4,313,286 |
Sempra Energy | 27,915 | 4,504,365 |
8,817,651 | ||
Oil, Gas & Consumable Fuels 3.3% | ||
ConocoPhillips | 64,558 | 6,166,580 |
Phillips 66 | 49,964 | 4,334,877 |
Pioneer Natural Resources Co. | 22,752 | 5,289,157 |
15,790,614 | ||
Pharmaceuticals 5.8% | ||
AstraZeneca plc, Sponsored ADR | 62,978 | 4,181,739 |
Eli Lilly and Co. | 20,422 | 5,965,879 |
Merck & Co., Inc. | 69,327 | 6,148,612 |
Pfizer, Inc. | 170,827 | 8,382,481 |
Roche Holding AG (Switzerland) | 8,570 | 3,174,042 |
27,852,753 | ||
Real Estate Management & Development 0.6% | ||
CBRE Group, Inc., Class A (e) | 32,569 | 2,704,530 |
Road & Rail 0.5% | ||
Knight-Swift Transportation Holdings, Inc. | 49,780 | 2,383,964 |
Semiconductors & Semiconductor Equipment 2.4% | ||
Analog Devices, Inc. | 31,789 | 4,907,586 |
Micron Technology, Inc. | 51,622 | 3,520,104 |
Qorvo, Inc. (e) | 29,546 | 3,361,744 |
11,789,434 | ||
Software 0.4% | ||
VMware, Inc., Class A | 17,512 | 1,891,997 |
Specialty Retail 1.8% | ||
Home Depot, Inc. (The) | 9,325 | 2,801,230 |
TJX Cos., Inc. (The) | 49,671 | 3,043,839 |
Victoria's Secret & Co. (e) | 65,079 | 3,066,522 |
8,911,591 | ||
Total Common Stocks (Cost $238,725,125) | 275,339,752 | |
Shares | Value | |
Exchange-Traded Funds 5.9% | ||
iShares iBoxx $ Investment Grade Corporate Bond ETF | 41,740 | $ 4,699,924 |
iShares Russell 1000 Value ETF | 153,070 | 23,944,740 |
Total Exchange-Traded Funds (Cost $29,768,621) | 28,644,664 | |
Short-Term Investment 1.6% | ||
Affiliated Investment Company 1.6% | ||
MainStay U.S. Government Liquidity Fund, 0.397% (f) | 7,905,212 | 7,905,212 |
Total Short-Term Investment (Cost $7,905,212) | 7,905,212 | |
Total Investments (Cost $442,233,120) | 97.8% | 471,718,975 |
Other Assets, Less Liabilities | 2.2 | 10,553,751 |
Net Assets | 100.0% | $ 482,272,726 |
† | Percentages indicated are based on Fund net assets. |
‡ | Less than one-tenth of a percent. |
(a) | May be sold to institutional investors only under Rule 144A or securities offered pursuant to Section 4(a)(2) of the Securities Act of 1933, as amended. |
(b) | Floating rate—Rate shown was the rate in effect as of April 30, 2022. |
(c) | Fixed to floating rate—Rate shown was the rate in effect as of April 30, 2022. |
(d) | Delayed delivery security. |
(e) | Non-income producing security. |
(f) | Current yield as of April 30, 2022. |
Affiliated Investment Companies | Value, Beginning of Period | Purchases at Cost | Proceeds from Sales | Net Realized Gain/(Loss) on Sales | Change in Unrealized Appreciation/ (Depreciation) | Value, End of Period | Dividend Income | Other Distributions | Shares End of Period |
MainStay U.S. Government Liquidity Fund | $ 3,803 | $ 53,312 | $ (49,210) | $ — | $ — | $ 7,905 | $ 1 | $ — | 7,905 |
18 | MainStay Balanced Fund |
Type | Number of Contracts | Expiration Date | Value at Trade Date | Current Notional Amount | Unrealized Appreciation (Depreciation)2 |
Long Contracts | |||||
U.S. Treasury 10 Year Notes | 19 | June 2022 | $ 2,317,065 | $ 2,263,969 | $ (53,096) |
U.S. Treasury 10 Year Ultra Bonds | 28 | June 2022 | 3,646,416 | 3,612,000 | (34,416) |
Total Long Contracts | (87,512) | ||||
Short Contracts | |||||
U.S. Treasury 2 Year Notes | (101) | June 2022 | (21,346,649) | (21,292,062) | 54,587 |
U.S. Treasury 5 Year Notes | (4) | June 2022 | (450,993) | (450,687) | 306 |
U.S. Treasury Long Bonds | (6) | June 2022 | (900,739) | (844,125) | 56,614 |
U.S. Treasury Ultra Bonds | (4) | June 2022 | (708,993) | (641,750) | 67,243 |
Total Short Contracts | 178,750 | ||||
Net Unrealized Appreciation | $ 91,238 |
1. | As of April 30, 2022, cash in the amount of $113,447 was on deposit with a broker or futures commission merchant for futures transactions. |
2. | Represents the difference between the value of the contracts at the time they were opened and the value as of April 30, 2022. |
Abbreviation(s): |
ADR—American Depositary Receipt |
CLO—Collateralized Loan Obligation |
ETF—Exchange-Traded Fund |
FFCB—Federal Farm Credit Bank |
FHLB—Federal Home Loan Bank |
LIBOR—London Interbank Offered Rate |
Description | Quoted Prices in Active Markets for Identical Assets (Level 1) | Significant Other Observable Inputs (Level 2) | Significant Unobservable Inputs (Level 3) | Total |
Asset Valuation Inputs | ||||
Investments in Securities (a) | ||||
Long-Term Bonds | ||||
Asset-Backed Securities | $ — | $ 11,594,287 | $ — | $ 11,594,287 |
Corporate Bonds | — | 54,332,919 | — | 54,332,919 |
Foreign Government Bond | — | 312,304 | — | 312,304 |
Mortgage-Backed Securities | — | 2,533,383 | — | 2,533,383 |
U.S. Government & Federal Agencies | — | 91,056,454 | — | 91,056,454 |
Total Long-Term Bonds | — | 159,829,347 | — | 159,829,347 |
Common Stocks | ||||
Pharmaceuticals | 24,678,711 | 3,174,042 | — | 27,852,753 |
All Other Industries | 247,486,999 | — | — | 247,486,999 |
Total Common Stocks | 272,165,710 | 3,174,042 | — | 275,339,752 |
Exchange-Traded Funds | 28,644,664 | — | — | 28,644,664 |
Short-Term Investment | ||||
Affiliated Investment Company | 7,905,212 | — | — | 7,905,212 |
Total Investments in Securities | 308,715,586 | 163,003,389 | — | 471,718,975 |
Other Financial Instruments | ||||
Futures Contracts (b) | 178,750 | — | — | 178,750 |
Total Investments in Securities and Other Financial Instruments | $ 308,894,336 | $ 163,003,389 | $ — | $ 471,897,725 |
Liability Valuation Inputs | ||||
Other Financial Instruments | ||||
Futures Contracts (b) | $ (87,512) | $ — | $ — | $ (87,512) |
(a) | For a complete listing of investments and their industries, see the Portfolio of Investments. |
(b) | The value listed for these securities reflects unrealized appreciation (depreciation) as shown on the Portfolio of Investments. |
20 | MainStay Balanced Fund |
Assets | |
Investment in unaffiliated securities, at value (identified cost $434,327,908) | $463,813,763 |
Investment in affiliated investment companies, at value (identified cost $7,905,212) | 7,905,212 |
Cash | 53,051,065 |
Cash collateral on deposit at broker for futures contracts | 113,447 |
Receivables: | |
Investment securities sold | 9,074,613 |
Fund shares sold | 1,510,267 |
Dividends and interest | 653,435 |
Variation margin on futures contracts | 26,438 |
Other assets | 72,661 |
Total assets | 536,220,901 |
Liabilities | |
Payables: | |
Investment securities purchased | 53,160,171 |
Manager (See Note 3) | 264,167 |
Fund shares redeemed | 190,215 |
Transfer agent (See Note 3) | 127,174 |
NYLIFE Distributors (See Note 3) | 107,543 |
Shareholder communication | 38,760 |
Professional fees | 31,403 |
Custodian | 22,509 |
Trustees | 1,583 |
Securities lending | 205 |
Accrued expenses | 4,445 |
Total liabilities | 53,948,175 |
Net assets | $482,272,726 |
Composition of Net Assets | |
Shares of beneficial interest outstanding (par value of $.001 per share) unlimited number of shares authorized | $16,669 |
Additional paid-in-capital | 449,933,030 |
449,949,699 | |
Total distributable earnings (loss) | 32,323,027 |
Net assets | $482,272,726 |
Class A | |
Net assets applicable to outstanding shares | $351,263,418 |
Shares of beneficial interest outstanding | 12,135,733 |
Net asset value per share outstanding | $28.94 |
Maximum sales charge (3.00% of offering price) | 0.90 |
Maximum offering price per share outstanding | $29.84 |
Investor Class | |
Net assets applicable to outstanding shares | $42,121,378 |
Shares of beneficial interest outstanding | 1,455,334 |
Net asset value per share outstanding | $28.94 |
Maximum sales charge (2.50% of offering price) | 0.74 |
Maximum offering price per share outstanding | $29.68 |
Class B | |
Net assets applicable to outstanding shares | $7,527,210 |
Shares of beneficial interest outstanding | 263,880 |
Net asset value and offering price per share outstanding | $28.53 |
Class C | |
Net assets applicable to outstanding shares | $20,081,500 |
Shares of beneficial interest outstanding | 704,274 |
Net asset value and offering price per share outstanding | $28.51 |
Class I | |
Net assets applicable to outstanding shares | $58,407,329 |
Shares of beneficial interest outstanding | 2,010,633 |
Net asset value and offering price per share outstanding | $29.05 |
Class R1 | |
Net assets applicable to outstanding shares | $112,007 |
Shares of beneficial interest outstanding | 3,863 |
Net asset value and offering price per share outstanding | $28.99 |
Class R2 | |
Net assets applicable to outstanding shares | $721,946 |
Shares of beneficial interest outstanding | 24,896 |
Net asset value and offering price per share outstanding | $29.00 |
Class R3 | |
Net assets applicable to outstanding shares | $1,983,879 |
Shares of beneficial interest outstanding | 68,749 |
Net asset value and offering price per share outstanding | $28.86 |
Class R6 | |
Net assets applicable to outstanding shares | $54,059 |
Shares of beneficial interest outstanding | 1,859 |
Net asset value and offering price per share outstanding | $29.08 |
Investment Income (Loss) | |
Income | |
Dividends-unaffiliated (net of foreign tax withholding of $14,177) | $3,611,126 |
Interest | 1,437,379 |
Securities lending | 7,309 |
Dividends-affiliated | 1,020 |
Total income | 5,056,834 |
Expenses | |
Manager (See Note 3) | 1,597,702 |
Distribution/Service—Class A (See Note 3) | 436,823 |
Distribution/Service—Investor Class (See Note 3) | 55,828 |
Distribution/Service—Class B (See Note 3) | 43,266 |
Distribution/Service—Class C (See Note 3) | 115,477 |
Distribution/Service—Class R2 (See Note 3) | 1,116 |
Distribution/Service—Class R3 (See Note 3) | 5,164 |
Transfer agent (See Note 3) | 314,799 |
Registration | 59,008 |
Professional fees | 49,007 |
Custodian | 29,073 |
Shareholder communication | 27,361 |
Trustees | 5,533 |
Shareholder service (See Note 3) | 1,536 |
Miscellaneous | 13,246 |
Total expenses before waiver/reimbursement | 2,754,939 |
Expense waiver/reimbursement from Manager (See Note 3) | (10,293) |
Net expenses | 2,744,646 |
Net investment income (loss) | 2,312,188 |
Realized and Unrealized Gain (Loss) | |
Net realized gain (loss) on: | |
Unaffiliated investment transactions | 3,045,108 |
Futures transactions | (7,995) |
Foreign currency transactions | 1,091 |
Net realized gain (loss) | 3,038,204 |
Net change in unrealized appreciation (depreciation) on: | |
Unaffiliated investments | (23,624,432) |
Futures contracts | 211,150 |
Translation of other assets and liabilities in foreign currencies | (2,044) |
Net change in unrealized appreciation (depreciation) | (23,415,326) |
Net realized and unrealized gain (loss) | (20,377,122) |
Net increase (decrease) in net assets resulting from operations | $(18,064,934) |
22 | MainStay Balanced Fund |
for the six months ended April 30, 2022 (Unaudited) and the year ended October 31, 2021
2022 | 2021 | |
Increase (Decrease) in Net Assets | ||
Operations: | ||
Net investment income (loss) | $2,312,188 | $3,863,884 |
Net realized gain (loss) | 3,038,204 | 110,195,771 |
Net change in unrealized appreciation (depreciation) | (23,415,326) | 13,015,252 |
Net increase (decrease) in net assets resulting from operations | (18,064,934) | 127,074,907 |
Distributions to shareholders: | ||
Class A | (65,837,630) | (5,189,504) |
Investor Class | (8,811,945) | (785,979) |
Class B | (1,797,239) | (135,897) |
Class C | (4,764,287) | (390,180) |
Class I | (12,358,500) | (2,749,887) |
Class R1 | (21,194) | (1,742) |
Class R2 | (190,582) | (32,212) |
Class R3 | (433,721) | (35,197) |
Class R6 | (11,667) | (1,167) |
Total distributions to shareholders | (94,226,765) | (9,321,765) |
Capital share transactions: | ||
Net proceeds from sales of shares | 52,070,937 | 70,944,777 |
Net asset value of shares issued to shareholders in reinvestment of distributions | 92,545,307 | 9,150,987 |
Cost of shares redeemed | (51,747,270) | (193,633,246) |
Increase (decrease) in net assets derived from capital share transactions | 92,868,974 | (113,537,482) |
Net increase (decrease) in net assets | (19,422,725) | 4,215,660 |
Net Assets | ||
Beginning of period | 501,695,451 | 497,479,791 |
End of period | $482,272,726 | $501,695,451 |
Six months ended April 30, 2022* | Year Ended October 31, | |||||
Class A | 2021 | 2020 | 2019 | 2018 | 2017 | |
Net asset value at beginning of period | $37.09 | $29.72 | $30.98 | $31.49 | $33.63 | $31.27 |
Net investment income (loss) (a) | 0.15 | 0.27 | 0.36 | 0.44 | 0.44 | 0.39 |
Net realized and unrealized gain (loss) | (1.28) | 7.70 | (0.54) | 1.58 | (0.23) | 2.80 |
Total from investment operations | (1.13) | 7.97 | (0.18) | 2.02 | 0.21 | 3.19 |
Less distributions: | ||||||
From net investment income | (0.14) | (0.28) | (0.41) | (0.46) | (0.48) | (0.39) |
From net realized gain on investments | (6.88) | (0.32) | (0.67) | (2.07) | (1.87) | (0.44) |
Total distributions | (7.02) | (0.60) | (1.08) | (2.53) | (2.35) | (0.83) |
Net asset value at end of period | $28.94 | $37.09 | $29.72 | $30.98 | $31.49 | $33.63 |
Total investment return (b) | (3.55)% | 27.03% | (0.53)% | 7.07% | 0.48%(c) | 10.32% |
Ratios (to average net assets)/Supplemental Data: | ||||||
Net investment income (loss) | 1.00%†† | 0.78% | 1.21% | 1.47% | 1.35% | 1.19% |
Net expenses (d) | 1.06%†† | 1.08% | 1.13% | 1.12% | 1.10% | 1.10% |
Portfolio turnover rate | 126% | 182% | 217% | 194% | 200% | 191% |
Net assets at end of period (in 000’s) | $351,263 | $343,224 | $252,574 | $279,636 | $265,314 | $281,174 |
* | Unaudited. |
†† | Annualized. |
(a) | Per share data based on average shares outstanding during the period. |
(b) | Total investment return is calculated exclusive of sales charges and assumes the reinvestment of dividends and distributions. For periods of less than one year, total return is not annualized. |
(c) | Total investment return may reflect adjustments to conform to generally accepted accounting principles. |
(d) | In addition to the fees and expenses which the Fund bears directly, it also indirectly bears a pro-rata share of the fees and expenses of the underlying funds in which it invests. Such indirect expenses are not included in the above expense ratios. |
Six months ended April 30, 2022* | Year Ended October 31, | |||||
Investor Class | 2021 | 2020 | 2019 | 2018 | 2017 | |
Net asset value at beginning of period | $37.10 | $29.75 | $31.01 | $31.51 | $33.65 | $31.29 |
Net investment income (loss) (a) | 0.11 | 0.19 | 0.29 | 0.38 | 0.38 | 0.34 |
Net realized and unrealized gain (loss) | (1.27) | 7.69 | (0.55) | 1.58 | (0.23) | 2.79 |
Total from investment operations | (1.16) | 7.88 | (0.26) | 1.96 | 0.15 | 3.13 |
Less distributions: | ||||||
From net investment income | (0.12) | (0.21) | (0.33) | (0.39) | (0.42) | (0.33) |
From net realized gain on investments | (6.88) | (0.32) | (0.67) | (2.07) | (1.87) | (0.44) |
Total distributions | (7.00) | (0.53) | (1.00) | (2.46) | (2.29) | (0.77) |
Net asset value at end of period | $28.94 | $37.10 | $29.75 | $31.01 | $31.51 | $33.65 |
Total investment return (b) | (3.65)% | 26.68% | (0.75)% | 6.79% | 0.29% | 10.13% |
Ratios (to average net assets)/Supplemental Data: | ||||||
Net investment income (loss) | 0.74%†† | 0.54% | 0.97% | 1.26% | 1.18% | 1.05% |
Net expenses (c) | 1.32%†† | 1.35% | 1.38% | 1.33% | 1.28% | 1.26% |
Expenses (before waiver/reimbursement) (c) | 1.35%†† | 1.37% | 1.40% | 1.35% | 1.30% | 1.26% |
Portfolio turnover rate | 126% | 182% | 217% | 194% | 200% | 191% |
Net assets at end of period (in 000's) | $42,121 | $46,706 | $47,358 | $53,006 | $51,128 | $55,541 |
* | Unaudited. |
†† | Annualized. |
(a) | Per share data based on average shares outstanding during the period. |
(b) | Total investment return is calculated exclusive of sales charges and assumes the reinvestment of dividends and distributions. For periods of less than one year, total return is not annualized. |
(c) | In addition to the fees and expenses which the Fund bears directly, it also indirectly bears a pro-rata share of the fees and expenses of the underlying funds in which it invests. Such indirect expenses are not included in the above expense ratios. |
24 | MainStay Balanced Fund |
Six months ended April 30, 2022* | Year Ended October 31, | |||||
Class B | 2021 | 2020 | 2019 | 2018 | 2017 | |
Net asset value at beginning of period | $36.72 | $29.56 | $30.82 | $31.35 | $33.48 | $31.15 |
Net investment income (loss) (a) | (0.00)‡ | (0.07) | 0.07 | 0.16 | 0.14 | 0.09 |
Net realized and unrealized gain (loss) | (1.26) | 7.63 | (0.54) | 1.54 | (0.23) | 2.78 |
Total from investment operations | (1.26) | 7.56 | (0.47) | 1.70 | (0.09) | 2.87 |
Less distributions: | ||||||
From net investment income | (0.05) | (0.08) | (0.12) | (0.16) | (0.17) | (0.10) |
From net realized gain on investments | (6.88) | (0.32) | (0.67) | (2.07) | (1.87) | (0.44) |
Total distributions | (6.93) | (0.40) | (0.79) | (2.23) | (2.04) | (0.54) |
Net asset value at end of period | $28.53 | $36.72 | $29.56 | $30.82 | $31.35 | $33.48 |
Total investment return (b) | (4.02)% | 25.74% | (1.51)% | 6.00% | (0.45)%(c) | 9.31% |
Ratios (to average net assets)/Supplemental Data: | ||||||
Net investment income (loss) | (0.00)%‡‡†† | (0.21)% | 0.23% | 0.54% | 0.43% | 0.29% |
Net expenses (d) | 2.07%†† | 2.10% | 2.13% | 2.08% | 2.03% | 2.02% |
Expenses (before waiver/reimbursement) (d) | 2.10%†† | 2.12% | 2.15% | 2.10% | 2.05% | 2.02% |
Portfolio turnover rate | 126% | 182% | 217% | 194% | 200% | 191% |
Net assets at end of period (in 000’s) | $7,527 | $9,645 | $10,671 | $15,049 | $18,795 | $24,551 |
* | Unaudited. |
‡ | Less than one cent per share. |
‡‡ | Less than one-tenth percent. |
†† | Annualized. |
(a) | Per share data based on average shares outstanding during the period. |
(b) | Total investment return is calculated exclusive of sales charges and assumes the reinvestment of dividends and distributions. For periods of less than one year, total return is not annualized. |
(c) | Total investment return may reflect adjustments to conform to generally accepted accounting principles. |
(d) | In addition to the fees and expenses which the Fund bears directly, it also indirectly bears a pro-rata share of the fees and expenses of the underlying funds in which it invests. Such indirect expenses are not included in the above expense ratios. |
Six months ended April 30, 2022* | Year Ended October 31, | |||||
Class C | 2021 | 2020 | 2019 | 2018 | 2017 | |
Net asset value at beginning of period | $36.71 | $29.55 | $30.81 | $31.33 | $33.46 | $31.13 |
Net investment income (loss) (a) | (0.00)‡ | (0.07) | 0.07 | 0.18 | 0.14 | 0.09 |
Net realized and unrealized gain (loss) | (1.27) | 7.63 | (0.54) | 1.53 | (0.23) | 2.78 |
Total from investment operations | (1.27) | 7.56 | (0.47) | 1.71 | (0.09) | 2.87 |
Less distributions: | ||||||
From net investment income | (0.05) | (0.08) | (0.12) | (0.16) | (0.17) | (0.10) |
From net realized gain on investments | (6.88) | (0.32) | (0.67) | (2.07) | (1.87) | (0.44) |
Total distributions | (6.93) | (0.40) | (0.79) | (2.23) | (2.04) | (0.54) |
Net asset value at end of period | $28.51 | $36.71 | $29.55 | $30.81 | $31.33 | $33.46 |
Total investment return (b) | (4.02)% | 25.75% | (1.51)% | 6.03% | (0.45)%(c) | 9.32% |
Ratios (to average net assets)/Supplemental Data: | ||||||
Net investment income (loss) | (0.00)%‡‡†† | (0.20)% | 0.23% | 0.59% | 0.43% | 0.29% |
Net expenses (d) | 2.07%†† | 2.10% | 2.13% | 2.08% | 2.03% | 2.02% |
Expenses (before waiver/reimbursement) (d) | 2.10%†† | 2.12% | 2.15% | 2.10% | 2.05% | 2.02% |
Portfolio turnover rate | 126% | 182% | 217% | 194% | 200% | 191% |
Net assets at end of period (in 000’s) | $20,082 | $26,050 | $30,769 | $45,437 | $76,233 | $94,447 |
* | Unaudited. |
‡ | Less than one cent per share. |
‡‡ | Less than one-tenth percent. |
†† | Annualized. |
(a) | Per share data based on average shares outstanding during the period. |
(b) | Total investment return is calculated exclusive of sales charges and assumes the reinvestment of dividends and distributions. For periods of less than one year, total return is not annualized. |
(c) | Total investment return may reflect adjustments to conform to generally accepted accounting principles. |
(d) | In addition to the fees and expenses which the Fund bears directly, it also indirectly bears a pro-rata share of the fees and expenses of the underlying funds in which it invests. Such indirect expenses are not included in the above expense ratios. |
26 | MainStay Balanced Fund |
Six months ended April 30, 2022* | Year Ended October 31, | |||||
Class I | 2021 | 2020 | 2019 | 2018 | 2017 | |
Net asset value at beginning of period | $37.19 | $29.80 | $31.06 | $31.56 | $33.71 | $31.35 |
Net investment income (loss) (a) | 0.20 | 0.37 | 0.44 | 0.53 | 0.52 | 0.47 |
Net realized and unrealized gain (loss) | (1.28) | 7.70 | (0.55) | 1.57 | (0.24) | 2.80 |
Total from investment operations | (1.08) | 8.07 | (0.11) | 2.10 | 0.28 | 3.27 |
Less distributions: | ||||||
From net investment income | (0.18) | (0.36) | (0.48) | (0.53) | (0.56) | (0.47) |
From net realized gain on investments | (6.88) | (0.32) | (0.67) | (2.07) | (1.87) | (0.44) |
Total distributions | (7.06) | (0.68) | (1.15) | (2.60) | (2.43) | (0.91) |
Net asset value at end of period | $29.05 | $37.19 | $29.80 | $31.06 | $31.56 | $33.71 |
Total investment return (b) | (3.42)% | 27.32% | (0.27)% | 7.32% | 0.70% | 10.57% |
Ratios (to average net assets)/Supplemental Data: | ||||||
Net investment income (loss) | 1.27%†† | 1.08% | 1.47% | 1.75% | 1.61% | 1.45% |
Net expenses (c) | 0.81%†† | 0.84% | 0.88% | 0.87% | 0.85% | 0.85% |
Portfolio turnover rate | 126% | 182% | 217% | 194% | 200% | 191% |
Net assets at end of period (in 000’s) | $58,407 | $72,481 | $152,036 | $177,076 | $217,380 | $291,941 |
* | Unaudited. |
†† | Annualized. |
(a) | Per share data based on average shares outstanding during the period. |
(b) | Total investment return is calculated exclusive of sales charges and assumes the reinvestment of dividends and distributions. Class I shares are not subject to sales charges. For periods of less than one year, total return is not annualized. |
(c) | In addition to the fees and expenses which the Fund bears directly, it also indirectly bears a pro-rata share of the fees and expenses of the underlying funds in which it invests. Such indirect expenses are not included in the above expense ratios. |
Six months ended April 30, 2022* | Year Ended October 31, | |||||
Class R1 | 2021 | 2020 | 2019 | 2018 | 2017 | |
Net asset value at beginning of period | $37.14 | $29.76 | $31.02 | $31.52 | $33.66 | $31.30 |
Net investment income (loss) (a) | 0.18 | 0.33 | 0.49 | 0.50 | 0.49 | 0.44 |
Net realized and unrealized gain (loss) | (1.29) | 7.70 | (0.63) | 1.57 | (0.24) | 2.79 |
Total from investment operations | (1.11) | 8.03 | (0.14) | 2.07 | 0.25 | 3.23 |
Less distributions: | ||||||
From net investment income | (0.16) | (0.33) | (0.45) | (0.50) | (0.52) | (0.43) |
From net realized gain on investments | (6.88) | (0.32) | (0.67) | (2.07) | (1.87) | (0.44) |
Total distributions | (7.04) | (0.65) | (1.12) | (2.57) | (2.39) | (0.87) |
Net asset value at end of period | $28.99 | $37.14 | $29.76 | $31.02 | $31.52 | $33.66 |
Total investment return (b) | (3.47)% | 27.20% | (0.38)% | 7.22% | 0.62% | 10.47% |
Ratios (to average net assets)/Supplemental Data: | ||||||
Net investment income (loss) | 1.14%†† | 0.93% | 1.60% | 1.67% | 1.50% | 1.35% |
Net expenses (c) | 0.91%†† | 0.94% | 0.98% | 0.97% | 0.95% | 0.95% |
Portfolio turnover rate | 126% | 182% | 217% | 194% | 200% | 191% |
Net assets at end of period (in 000’s) | $112 | $110 | $78 | $1,286 | $1,805 | $2,016 |
* | Unaudited. |
†† | Annualized. |
(a) | Per share data based on average shares outstanding during the period. |
(b) | Total investment return is calculated exclusive of sales charges and assumes the reinvestment of dividends and distributions. Class R1 shares are not subject to sales charges. For periods of less than one year, total return is not annualized. |
(c) | In addition to the fees and expenses which the Fund bears directly, it also indirectly bears a pro-rata share of the fees and expenses of the underlying funds in which it invests. Such indirect expenses are not included in the above expense ratios. |
Six months ended April 30, 2022* | Year Ended October 31, | |||||
Class R2 | 2021 | 2020 | 2019 | 2018 | 2017 | |
Net asset value at beginning of period | $37.13 | $29.77 | $31.02 | $31.53 | $33.67 | $31.26 |
Net investment income (loss) (a) | 0.14 | 0.24 | 0.34 | 0.42 | 0.41 | 0.39 |
Net realized and unrealized gain (loss) | (1.27) | 7.69 | (0.55) | 1.56 | (0.24) | 2.81 |
Total from investment operations | (1.13) | 7.93 | (0.21) | 1.98 | 0.17 | 3.20 |
Less distributions: | ||||||
From net investment income | (0.12) | (0.25) | (0.37) | (0.42) | (0.44) | (0.35) |
From net realized gain on investments | (6.88) | (0.32) | (0.67) | (2.07) | (1.87) | (0.44) |
Total distributions | (7.00) | (0.57) | (1.04) | (2.49) | (2.31) | (0.79) |
Net asset value at end of period | $29.00 | $37.13 | $29.77 | $31.02 | $31.53 | $33.67 |
Total investment return (b) | (3.59)% | 26.89% | (0.60)% | 6.95% | 0.37%(c) | 10.37% |
Ratios (to average net assets)/Supplemental Data: | ||||||
Net investment income (loss) | 0.90%†† | 0.69% | 1.14% | 1.40% | 1.26% | 1.19% |
Net expenses (d) | 1.16%†† | 1.19% | 1.23% | 1.22% | 1.20% | 1.21% |
Portfolio turnover rate | 126% | 182% | 217% | 194% | 200% | 191% |
Net assets at end of period (in 000’s) | $722 | $1,128 | $1,693 | $2,882 | $3,496 | $5,234 |
* | Unaudited. |
†† | Annualized. |
(a) | Per share data based on average shares outstanding during the period. |
(b) | Total investment return is calculated exclusive of sales charges and assumes the reinvestment of dividends and distributions. Class R2 shares are not subject to sales charges. For periods of less than one year, total return is not annualized. |
(c) | Total investment return may reflect adjustments to conform to generally accepted accounting principles. |
(d) | In addition to the fees and expenses which the Fund bears directly, it also indirectly bears a pro-rata share of the fees and expenses of the underlying funds in which it invests. Such indirect expenses are not included in the above expense ratios. |
Six months ended April 30, 2022* | Year Ended October 31, | |||||
Class R3 | 2021 | 2020 | 2019 | 2018 | 2017 | |
Net asset value at beginning of period | $37.03 | $29.70 | $30.95 | $31.45 | $33.59 | $31.25 |
Net investment income (loss) (a) | 0.10 | 0.16 | 0.26 | 0.35 | 0.33 | 0.27 |
Net realized and unrealized gain (loss) | (1.28) | 7.68 | (0.55) | 1.56 | (0.24) | 2.78 |
Total from investment operations | (1.18) | 7.84 | (0.29) | 1.91 | 0.09 | 3.05 |
Less distributions: | ||||||
From net investment income | (0.11) | (0.19) | (0.29) | (0.34) | (0.36) | (0.27) |
From net realized gain on investments | (6.88) | (0.32) | (0.67) | (2.07) | (1.87) | (0.44) |
Total distributions | (6.99) | (0.51) | (0.96) | (2.41) | (2.23) | (0.71) |
Net asset value at end of period | $28.86 | $37.03 | $29.70 | $30.95 | $31.45 | $33.59 |
Total investment return (b) | (3.74)% | 26.59% | (0.88)% | 6.68% | 0.12% | 9.88% |
Ratios (to average net assets)/Supplemental Data: | ||||||
Net investment income (loss) | 0.66%†† | 0.45% | 0.86% | 1.15% | 1.00% | 0.82% |
Net expenses (c) | 1.41%†† | 1.44% | 1.48% | 1.47% | 1.45% | 1.45% |
Portfolio turnover rate | 126% | 182% | 217% | 194% | 200% | 191% |
Net assets at end of period (in 000’s) | $1,984 | $2,290 | $2,252 | $3,048 | $3,880 | $5,490 |
* | Unaudited. |
†† | Annualized. |
(a) | Per share data based on average shares outstanding during the period. |
(b) | Total investment return is calculated exclusive of sales charges and assumes the reinvestment of dividends and distributions. Class R3 shares are not subject to sales charges. For periods of less than one year, total return is not annualized. |
(c) | In addition to the fees and expenses which the Fund bears directly, it also indirectly bears a pro-rata share of the fees and expenses of the underlying funds in which it invests. Such indirect expenses are not included in the above expense ratios. |
28 | MainStay Balanced Fund |
Six months ended April 30, 2022* | Year Ended October 31, | December 15, 2017^ through October 31, 2018 | |||
Class R6 | 2021 | 2020 | 2019 | ||
Net asset value at beginning of period | $37.23 | $29.83 | $31.06 | $31.57 | $32.52 |
Net investment income (loss) (a) | 0.21 | 0.39 | 0.61 | 0.53 | 0.48 |
Net realized and unrealized gain (loss) | (1.29) | 7.73 | (0.69) | 1.59 | (0.95) |
Total from investment operations | (1.08) | 8.12 | (0.08) | 2.12 | (0.47) |
Less distributions: | |||||
From net investment income | (0.19) | (0.40) | (0.48) | (0.56) | (0.48) |
From net realized gain on investments | (6.88) | (0.32) | (0.67) | (2.07) | — |
Total distributions | (7.07) | (0.72) | (1.15) | (2.63) | (0.48) |
Net asset value at end of period | $29.08 | $37.23 | $29.83 | $31.06 | $31.57 |
Total investment return (b) | (3.38)% | 27.45% | (0.17)% | 7.40% | (1.48)% |
Ratios (to average net assets)/Supplemental Data: | |||||
Net investment income (loss) | 1.33%†† | 1.12% | 1.94% | 1.75% | 1.65%†† |
Net expenses (c) | 0.73%†† | 0.74% | 0.78% | 0.77% | 0.76%†† |
Portfolio turnover rate | 126% | 182% | 217% | 194% | 200% |
Net assets at end of period (in 000’s) | $54 | $61 | $49 | $14,697 | $48 |
* | Unaudited. |
^ | Inception date. |
†† | Annualized. |
(a) | Per share data based on average shares outstanding during the period. |
(b) | Total investment return is calculated exclusive of sales charges and assumes the reinvestment of dividends and distributions. Class R6 shares are not subject to sales charges. For periods of less than one year, total return is not annualized. |
(c) | In addition to the fees and expenses which the Fund bears directly, it also indirectly bears a pro-rata share of the fees and expenses of the underlying funds in which it invests. Such indirect expenses are not included in the above expense ratios. |
Class | Commenced Operations |
Class A | January 2, 2004 |
Investor Class | February 28, 2008 |
Class B | January 2, 2004 |
Class C | December 30, 2002 |
Class I | May 1, 1989 |
Class R1 | January 2, 2004 |
Class R2 | January 2, 2004 |
Class R3 | April 28, 2006 |
Class R6 | December 15, 2017 |
SIMPLE Class | N/A* |
* | SIMPLE Class shares were registered for sale effective as of August 31, 2020 but have not yet commenced operations. |
30 | MainStay Balanced Fund |
• Benchmark yields | • Reported trades |
• Broker/dealer quotes | • Issuer spreads |
• Two-sided markets | • Benchmark securities |
• Bids/offers | • Reference data (corporate actions or material event notices) |
• Industry and economic events | • Comparable bonds |
• Monthly payment information |
32 | MainStay Balanced Fund |
34 | MainStay Balanced Fund |
Asset Derivatives | Interest Rate Contracts Risk | Total |
Futures Contracts - Net Assets—Net unrealized appreciation on futures contracts (a) | $178,750 | $178,750 |
Total Fair Value | $178,750 | $178,750 |
(a) | Includes cumulative appreciation (depreciation) of futures contracts as reported in the Portfolio of Investments. Only current day’s variation margin is reported within the Statement of Assets and Liabilities. |
Liability Derivatives | Interest Rate Contracts Risk | Total |
Futures Contracts - Net Assets—Net unrealized depreciation on futures contracts (a) | $(87,512) | $(87,512) |
Total Fair Value | $(87,512) | $(87,512) |
(a) | Includes cumulative appreciation (depreciation) of futures contracts as reported in the Portfolio of Investments. Only current day’s variation margin is reported within the Statement of Assets and Liabilities. |
Net Realized Gain (Loss) from: | Interest Rate Contracts Risk | Total |
Futures Contracts | $(7,995) | $(7,995) |
Total Net Realized Gain (Loss) | $(7,995) | $(7,995) |
Net Change in Unrealized Appreciation (Depreciation) | Interest Rate Contracts Risk | Total |
Futures Contracts | $211,150 | $211,150 |
Total Net Change in Unrealized Appreciation (Depreciation) | $211,150 | $211,150 |
Average Notional Amount | Total |
Futures Contracts Long | $13,826,619 |
Futures Contracts Short | $(8,451,762) |
Class R1 | $56 |
Class R2 | 447 |
Class R3 | 1,033 |
36 | MainStay Balanced Fund |
Class | Expense | Waived |
Class A | $144,132 | $— |
Investor Class | 83,968 | (5,962) |
Class B | 16,295 | (1,180) |
Class C | 43,492 | (3,151) |
Class I | 25,653 | — |
Class R1 | 47 | — |
Class R2 | 363 | — |
Class R3 | 847 | — |
Class R6 | 2 | — |
Class R6 | $32,520 | 60.2% |
Federal Tax Cost | Gross Unrealized Appreciation | Gross Unrealized (Depreciation) | Net Unrealized Appreciation/ (Depreciation) | |
Investments in Securities | $442,797,624 | $45,191,453 | $(16,270,102) | $28,921,351 |
2021 | |
Distributions paid from: | |
Ordinary Income | $4,025,384 |
Long-Term Capital Gains | 5,296,381 |
Total | $9,321,765 |
Class A | Shares | Amount |
Six-month period ended April 30, 2022: | ||
Shares sold | 1,463,439 | $45,316,812 |
Shares issued to shareholders in reinvestment of distributions | 2,160,389 | 64,624,631 |
Shares redeemed | (883,329) | (27,265,145) |
Net increase (decrease) in shares outstanding before conversion | 2,740,499 | 82,676,298 |
Shares converted into Class A (See Note 1) | 140,925 | 4,293,724 |
Shares converted from Class A (See Note 1) | (475) | (14,440) |
Net increase (decrease) | 2,880,949 | $86,955,582 |
Year ended October 31, 2021: | ||
Shares sold | 1,354,099 | $47,965,141 |
Shares issued to shareholders in reinvestment of distributions | 150,157 | 5,061,558 |
Shares redeemed | (1,195,537) | (41,490,356) |
Net increase (decrease) in shares outstanding before conversion | 308,719 | 11,536,343 |
Shares converted into Class A (See Note 1) | 448,349 | 15,466,707 |
Shares converted from Class A (See Note 1) | (151) | (5,190) |
Net increase (decrease) | 756,917 | $26,997,860 |
Investor Class | Shares | Amount |
Six-month period ended April 30, 2022: | ||
Shares sold | 61,103 | $1,901,010 |
Shares issued to shareholders in reinvestment of distributions | 293,995 | 8,797,092 |
Shares redeemed | (63,322) | (1,967,499) |
Net increase (decrease) in shares outstanding before conversion | 291,776 | 8,730,603 |
Shares converted into Investor Class (See Note 1) | 14,683 | 437,460 |
Shares converted from Investor Class (See Note 1) | (110,111) | (3,363,149) |
Net increase (decrease) | 196,348 | $5,804,914 |
Year ended October 31, 2021: | ||
Shares sold | 96,125 | $3,343,506 |
Shares issued to shareholders in reinvestment of distributions | 23,555 | 784,434 |
Shares redeemed | (124,594) | (4,313,833) |
Net increase (decrease) in shares outstanding before conversion | (4,914) | (185,893) |
Shares converted into Investor Class (See Note 1) | 39,661 | 1,396,885 |
Shares converted from Investor Class (See Note 1) | (367,545) | (12,630,334) |
Net increase (decrease) | (332,798) | $(11,419,342) |
Class B | Shares | Amount |
Six-month period ended April 30, 2022: | ||
Shares sold | 5,463 | $165,959 |
Shares issued to shareholders in reinvestment of distributions | 55,760 | 1,646,078 |
Shares redeemed | (34,407) | (1,050,465) |
Net increase (decrease) in shares outstanding before conversion | 26,816 | 761,572 |
Shares converted from Class B (See Note 1) | (25,595) | (757,718) |
Net increase (decrease) | 1,221 | $3,854 |
Year ended October 31, 2021: | ||
Shares sold | 6,425 | $226,427 |
Shares issued to shareholders in reinvestment of distributions | 3,830 | 124,552 |
Shares redeemed | (53,970) | (1,853,573) |
Net increase (decrease) in shares outstanding before conversion | (43,715) | (1,502,594) |
Shares converted from Class B (See Note 1) | (54,584) | (1,900,545) |
Net increase (decrease) | (98,299) | $(3,403,139) |
Class C | Shares | Amount |
Six-month period ended April 30, 2022: | ||
Shares sold | 38,853 | $1,195,270 |
Shares issued to shareholders in reinvestment of distributions | 161,173 | 4,756,361 |
Shares redeemed | (185,121) | (5,708,164) |
Net increase (decrease) in shares outstanding before conversion | 14,905 | 243,467 |
Shares converted from Class C (See Note 1) | (20,350) | (602,771) |
Net increase (decrease) | (5,445) | $(359,304) |
Year ended October 31, 2021: | ||
Shares sold | 39,332 | $1,374,443 |
Shares issued to shareholders in reinvestment of distributions | 11,959 | 388,510 |
Shares redeemed | (316,160) | (10,913,710) |
Net increase (decrease) in shares outstanding before conversion | (264,869) | (9,150,757) |
Shares converted from Class C (See Note 1) | (66,531) | (2,316,844) |
Net increase (decrease) | (331,400) | $(11,467,601) |
38 | MainStay Balanced Fund |
Class I | Shares | Amount |
Six-month period ended April 30, 2022: | ||
Shares sold | 101,865 | $3,233,089 |
Shares issued to shareholders in reinvestment of distributions | 404,624 | 12,144,210 |
Shares redeemed | (444,837) | (14,973,154) |
Net increase (decrease) in shares outstanding before conversion | 61,652 | 404,145 |
Shares converted into Class I (See Note 1) | 223 | 6,894 |
Net increase (decrease) | 61,875 | $411,039 |
Year ended October 31, 2021: | ||
Shares sold | 504,349 | $17,414,410 |
Shares issued to shareholders in reinvestment of distributions | 81,649 | 2,728,015 |
Shares redeemed | (3,739,247) | (132,973,686) |
Net increase (decrease) in shares outstanding before conversion | (3,153,249) | (112,831,261) |
Shares converted into Class I (See Note 1) | 344 | 11,556 |
Net increase (decrease) | (3,152,905) | $(112,819,705) |
Class R1 | Shares | Amount |
Six-month period ended April 30, 2022: | ||
Shares sold | 259 | $8,064 |
Shares issued to shareholders in reinvestment of distributions | 707 | 21,194 |
Shares redeemed | (60) | (1,775) |
Net increase (decrease) | 906 | $27,483 |
Year ended October 31, 2021: | ||
Shares sold | 424 | $14,788 |
Shares issued to shareholders in reinvestment of distributions | 51 | 1,742 |
Shares redeemed | (135) | (4,437) |
Net increase (decrease) | 340 | $12,093 |
Class R2 | Shares | Amount |
Six-month period ended April 30, 2022: | ||
Shares sold | 2,449 | $74,082 |
Shares issued to shareholders in reinvestment of distributions | 4,348 | 130,308 |
Shares redeemed | (12,266) | (391,653) |
Net increase (decrease) | (5,469) | $(187,263) |
Year ended October 31, 2021: | ||
Shares sold | 4,917 | $171,250 |
Shares issued to shareholders in reinvestment of distributions | 811 | 27,261 |
Shares redeemed | (31,644) | (1,156,562) |
Net increase (decrease) in shares outstanding before conversion | (25,916) | (958,051) |
Shares converted from Class R2 (See Note 1) | (597) | (22,235) |
Net increase (decrease) | (26,513) | $(980,286) |
Class R3 | Shares | Amount |
Six-month period ended April 30, 2022: | ||
Shares sold | 5,780 | $176,651 |
Shares issued to shareholders in reinvestment of distributions | 13,865 | 413,767 |
Shares redeemed | (12,747) | (384,176) |
Net increase (decrease) | 6,898 | $206,242 |
Year ended October 31, 2021: | ||
Shares sold | 12,366 | $434,812 |
Shares issued to shareholders in reinvestment of distributions | 1,017 | 33,747 |
Shares redeemed | (27,360) | (926,559) |
Net increase (decrease) | (13,977) | $(458,000) |
Class R6 | Shares | Amount |
Six-month period ended April 30, 2022: | ||
Shares issued to shareholders in reinvestment of distributions | 388 | $11,666 |
Shares redeemed | (174) | (5,239) |
Net increase (decrease) | 214 | $6,427 |
Year ended October 31, 2021: | ||
Shares issued to shareholders in reinvestment of distributions | 35 | $1,168 |
Shares redeemed | (16) | (530) |
Net increase (decrease) | 19 | $638 |
40 | MainStay Balanced Fund |
42 | MainStay Balanced Fund |
44 | MainStay Balanced Fund |
46 | MainStay Balanced Fund |
For more information
Message from the President and Semiannual Report
please log in to newyorklifeinvestments.com/accounts.
Not FDIC/NCUA Insured | Not a Deposit | May Lose Value | No Bank Guarantee | Not Insured by Any Government Agency |


5 | |
9 | |
11 | |
16 | |
22 | |
31 | |
35 | |
36 | |
36 |
Investors should refer to the Fund’s Summary Prospectus and/or Prospectus and consider the Fund’s investment objectives, strategies, risks, charges and expenses carefully before investing. The Summary Prospectus and/or Prospectus contain this and other information about the Fund. You may obtain copies of the Fund’s Summary Prospectus, Prospectus and Statement of Additional Information, which includes information about MainStay Funds Trust's Trustees, free of charge, upon request, by calling toll-free 800-624-6782, by writing to NYLIFE Distributors LLC, Attn: MainStay Marketing Department, 30 Hudson Street, Jersey City, NJ 07302 or by sending an e-mail to MainStayShareholderServices@nylim.com. These documents are also available via the MainStay Funds’ website at newyorklifeinvestments.com. Please read the Fund’s Summary Prospectus and/or Prospectus carefully before investing.

Average Annual Total Returns for the Period-Ended April 30, 2022 | |||||||
Class | Sales Charge | Inception Date | Six Months1 | One Year | Since Inception | Gross Expense Ratio2 | |
Class A Shares | Maximum 5.5% Initial Sales Charge | With sales charges | 11/15/2017 | -23.01% | -27.02% | 0.14% | 1.75% |
Excluding sales charges | -18.53 | -22.77 | 1.42 | 1.75 | |||
Investor Class Shares3 | Maximum 5% Initial Sales Charge | With sales charges | 11/15/2017 | -22.68 | -26.83 | -0.01 | 1.81 |
Excluding sales charges | -18.61 | -22.98 | 1.27 | 1.81 | |||
Class C Shares | Maximum 1% CDSC | With sales charges | 11/15/2017 | -19.72 | -24.27 | 0.54 | 2.56 |
if Redeemed Within One Year of Purchase | Excluding sales charges | -18.91 | -23.51 | 0.54 | 2.56 | ||
Class I Shares | No Sales Charge | 11/15/2017 | -18.34 | -22.55 | 1.75 | 1.52 | |
Class R6 Shares | No Sales Charge | 11/15/2017 | -18.40 | -22.57 | 1.77 | 1.32 | |
1. | Not annualized. |
2. | The gross expense ratios presented reflect the Fund’s “Total Annual Fund Operating Expenses” from the most recent Prospectus, as supplemented, and may differ from other expense ratios disclosed in this report. |
3. | Prior to June 30, 2020, the maximum initial sales charge was 5.5%, which is reflected in the applicable average annual total return figures shown. |
Benchmark Performance* | Six Months1 | One Year | Since Inception |
MSCI Emerging Markets Index (Net)2 | -14.15% | -18.33% | 1.55% |
Morningstar Diversified Emerging Markets Category Average3 | -16.44 | -18.97 | 1.09 |
* | Returns for indices reflect no deductions for fees, expenses or taxes, except for foreign withholding taxes where applicable. |
1. | Not annualized. |
2. | The MSCI Emerging Markets Index (Net) is the Fund's primary benchmark. The MSCI Emerging Markets Index (Net) is a broad-based benchmark that is a free float-adjusted market capitalization index that is designed to measure equity market performance in the global emerging markets. Results assume reinvestment of all dividends and capital gains. An investment cannot be made directly in an index. |
3. | The Morningstar Diversified Emerging Markets Category Average is representative of funds that tend to divide their assets among 20 or more nations, although they tend to focus on the emerging markets of Asia and Latin America rather than on those of the Middle East, Africa, or Europe. These funds invest predominantly in emerging market equities, but some funds also invest in both equities and fixed income investments from emerging markets. Results are based on average total returns of similar funds with all dividends and capital gain distributions reinvested. |
6 | MainStay Candriam Emerging Markets Equity Fund |
Share Class | Beginning Account Value 11/1/21 | Ending Account Value (Based on Actual Returns and Expenses) 4/30/22 | Expenses Paid During Period1 | Ending Account Value (Based on Hypothetical 5% Annualized Return and Actual Expenses) 4/30/22 | Expenses Paid During Period1 | Net Expense Ratio During Period2 |
Class A Shares | $1,000.00 | $814.70 | $6.66 | $1,017.46 | $7.40 | 1.48% |
Investor Class Shares | $1,000.00 | $813.90 | $7.24 | $1,016.81 | $8.05 | 1.61% |
Class C Shares | $1,000.00 | $810.90 | $10.60 | $1,013.09 | $11.78 | 2.36% |
Class I Shares | $1,000.00 | $816.60 | $4.95 | $1,019.34 | $5.51 | 1.10% |
Class R6 Shares | $1,000.00 | $816.00 | $4.95 | $1,019.34 | $5.51 | 1.10% |
1. | Expenses are equal to the Fund’s annualized expense ratio of each class multiplied by the average account value over the period, divided by 365 and multiplied by 181 (to reflect the six-month period). The table above represents the actual expenses incurred during the six-month period. In addition to the fees and expenses which the Fund bears directly, it also indirectly bears a pro rata share of the fees and expenses of the underlying funds in which it invests. Such indirect expenses are not included in the above-reported expense figures. |
2. | Expenses are equal to the Fund's annualized expense ratio to reflect the six-month period. |
Country Composition as of April 30, 2022 (Unaudited)
China | 25.8% |
Republic of Korea | 11.7 |
Taiwan | 11.2 |
India | 10.9 |
Brazil | 8.3 |
South Africa | 5.8 |
Thailand | 5.6 |
Mexico | 3.0 |
Indonesia | 2.7 |
Peru | 2.4 |
Malaysia | 1.8 |
United States | 1.7% |
Chile | 1.7 |
Colombia | 1.0 |
Hungary | 0.6 |
Poland | 0.5 |
Uruguay | 0.3 |
Russia | 0.0‡ |
Other Assets, Less Liabilities | 5.0 |
100.0% |
Top Ten Holdings and/or Issuers Held as of April 30, 2022 (excluding short-term investments) (Unaudited)
1. | Taiwan Semiconductor Manufacturing Co. Ltd. |
2. | Samsung Electronics Co. Ltd. |
3. | Tencent Holdings Ltd. |
4. | Alibaba Group Holding Ltd. |
5. | Reliance Industries Ltd. |
6. | KB Financial Group, Inc. |
7. | Infosys Ltd. |
8. | Bank Central Asia Tbk. PT |
9. | E.Sun Financial Holding Co. Ltd. |
10. | Cosan SA |
8 | MainStay Candriam Emerging Markets Equity Fund |
10 | MainStay Candriam Emerging Markets Equity Fund |
Shares | Value | |
Common Stocks 91.2% | ||
Brazil 7.3% | ||
Banco Santander Brasil SA (Banks) | 110,000 | $ 706,419 |
BB Seguridade Participacoes SA (Insurance) | 220,000 | 1,131,605 |
Cosan SA (Oil, Gas & Consumable Fuels) | 430,000 | 1,826,475 |
Equatorial Energia SA (Electric Utilities) | 124,000 | 643,081 |
Localiza Rent a Car SA (Road & Rail) | 90,000 | 963,723 |
MercadoLibre, Inc. (Internet & Direct Marketing Retail) (a) | 670 | 652,332 |
SLC Agricola SA (Food Products) (a) | 88,000 | 941,773 |
WEG SA (Electrical Equipment) | 190,000 | 1,156,768 |
8,022,176 | ||
China 25.8% | ||
Airtac International Group (Machinery) | 22,096 | 600,275 |
Alibaba Group Holding Ltd. (Internet & Direct Marketing Retail) (a) | 238,000 | 2,908,789 |
Bank of Ningbo Co. Ltd., Class A (Banks) | 246,000 | 1,342,740 |
Beijing United Information Technology Co. Ltd., Class A (Trading Companies & Distributors) | 33,995 | 492,736 |
BYD Co. Ltd., Class H (Automobiles) | 30,000 | 881,419 |
China Meidong Auto Holdings Ltd. (Specialty Retail) | 68,000 | 222,325 |
China Mengniu Dairy Co. Ltd. (Food Products) | 220,000 | 1,183,632 |
China Merchants Bank Co. Ltd., Class H (Banks) | 180,000 | 1,083,518 |
Contemporary Amperex Technology Co. Ltd., Class A (Electrical Equipment) | 7,995 | 487,998 |
Country Garden Services Holdings Co. Ltd. (Real Estate Management & Development) | 106,000 | 446,403 |
East Money Information Co. Ltd., Class A (Capital Markets) | 220,800 | 750,145 |
Flat Glass Group Co. Ltd., Class H (Semiconductors & Semiconductor Equipment) (b) | 136,000 | 487,906 |
Ganfeng Lithium Co. Ltd., Class A (Metals & Mining) | 20,999 | 348,139 |
Ginlong Technologies Co. Ltd., Class A (Electrical Equipment) | 10,998 | 321,742 |
Jafron Biomedical Co. Ltd., Class A (Health Care Equipment & Supplies) | 33,999 | 212,031 |
JD.com, Inc., Class A (Internet & Direct Marketing Retail) (a) | 43,000 | 1,340,331 |
Jiumaojiu International Holdings Ltd. (Hotels, Restaurants & Leisure) (c) | 260,000 | 572,606 |
Shares | Value | |
China (continued) | ||
Lenovo Group Ltd. (Technology Hardware, Storage & Peripherals) | 1,140,000 | $ 1,105,793 |
Li Ning Co. Ltd. (Textiles, Apparel & Luxury Goods) | 72,000 | 563,022 |
Longfor Group Holdings Ltd. (Real Estate Management & Development) | 256,000 | 1,247,335 |
Meituan (Internet & Direct Marketing Retail) (a) | 58,000 | 1,244,911 |
NARI Technology Co. Ltd., Class A (Electrical Equipment) | 55,997 | 269,202 |
NetEase, Inc. (Entertainment) | 44,000 | 840,793 |
Ping An Insurance Group Co. of China Ltd., Class H (Insurance) | 196,000 | 1,260,458 |
Postal Savings Bank of China Co. Ltd., Class H (Banks) (c) | 2,160,000 | 1,642,139 |
Shanghai Baosight Software Co. Ltd., Class A (Software) | 37,929 | 271,240 |
Shenzhen Inovance Technology Co. Ltd., Class A (Machinery) | 36,937 | 319,822 |
Tencent Holdings Ltd. (Interactive Media & Services) | 86,000 | 4,033,864 |
WuXi AppTec Co. Ltd., Class H (Life Sciences Tools & Services) (c) | 46,000 | 616,099 |
Yunnan Energy New Material Co. Ltd. (Chemicals) (a) | 12,000 | 366,196 |
Zijin Mining Group Co. Ltd., Class H (Metals & Mining) | 630,000 | 926,401 |
28,390,010 | ||
Colombia 1.0% | ||
Ecopetrol SA, Sponsored ADR (Oil, Gas & Consumable Fuels) (b) | 65,000 | 1,054,950 |
Hungary 0.6% | ||
MOL Hungarian Oil & Gas plc (Oil, Gas & Consumable Fuels) | 76,000 | 648,381 |
India 10.9% | ||
Asian Paints Ltd. (Chemicals) | 20,000 | 840,051 |
Bharti Airtel Ltd. (Wireless Telecommunication Services) (a) | 160,000 | 1,537,388 |
Divi's Laboratories Ltd. (Life Sciences Tools & Services) | 11,000 | 642,033 |
GAIL India Ltd. (Gas Utilities) | 480,000 | 994,093 |
HDFC Bank Ltd. (Banks) | 34,000 | 610,498 |
Infosys Ltd. (IT Services) | 92,000 | 1,866,718 |
JSW Steel Ltd. (Metals & Mining) | 120,000 | 1,133,703 |
Shares | Value | |
Common Stocks (continued) | ||
India (continued) | ||
Oil & Natural Gas Corp. Ltd. (Oil, Gas & Consumable Fuels) | 320,000 | $ 668,614 |
Reliance Industries Ltd. (Oil, Gas & Consumable Fuels) | 74,000 | 2,675,784 |
State Bank of India (Banks) | 160,000 | 1,026,834 |
11,995,716 | ||
Indonesia 2.7% | ||
Aneka Tambang Tbk. (Metals & Mining) (a)(d) | 6,400,000 | 1,150,086 |
Bank Central Asia Tbk. PT (Banks) (d) | 3,300,000 | 1,845,689 |
2,995,775 | ||
Malaysia 1.8% | ||
Petronas Chemicals Group Bhd. (Chemicals) | 450,000 | 1,056,345 |
Press Metal Aluminium Holdings Bhd. (Metals & Mining) | 650,000 | 891,349 |
1,947,694 | ||
Mexico 3.0% | ||
Gruma SAB de CV, Class B (Food Products) | 56,000 | 665,172 |
Grupo Aeroportuario del Pacifico SAB de CV, Class B (Transportation Infrastructure) (a) | 58,000 | 892,546 |
Grupo Financiero Banorte SAB de CV, Class O (Banks) | 268,000 | 1,769,156 |
3,326,874 | ||
Peru 2.4% | ||
Credicorp Ltd. (Banks) | 7,800 | 1,083,342 |
Southern Copper Corp. (Metals & Mining) | 25,000 | 1,556,750 |
2,640,092 | ||
Poland 0.5% | ||
Dino Polska SA (Food & Staples Retailing) (a)(c) | 8,000 | 516,304 |
Republic of Korea 11.7% | ||
Kakao Corp. (Interactive Media & Services) | 4,400 | 306,700 |
KB Financial Group, Inc. (Banks) | 43,000 | 1,987,205 |
Kia Corp. (Automobiles) | 8,800 | 578,912 |
LG Energy Solution (Electrical Equipment) (a) | 600 | 194,244 |
Samsung Biologics Co. Ltd. (Life Sciences Tools & Services) (a)(c) | 1,160 | 766,424 |
Samsung Electronics Co. Ltd. (Technology Hardware, Storage & Peripherals) | 88,000 | 4,675,802 |
Shares | Value | |
Republic of Korea (continued) | ||
Samsung Engineering Co. Ltd. (Construction & Engineering) (a) | 74,000 | $ 1,509,856 |
SK Hynix, Inc. (Semiconductors & Semiconductor Equipment) | 15,800 | 1,376,539 |
SK Telecom Co. Ltd. (Wireless Telecommunication Services) | 24,000 | 1,080,632 |
S-Oil Corp. (Oil, Gas & Consumable Fuels) | 5,200 | 422,941 |
12,899,255 | ||
Russia 0.0% ‡ | ||
Magnit PJSC (Food & Staples Retailing) (d)(e)(f) | 6,769 | — |
South Africa 5.8% | ||
Capitec Bank Holdings Ltd. (Banks) | 9,600 | 1,339,589 |
FirstRand Ltd. (Diversified Financial Services) | 306,000 | 1,317,977 |
Gold Fields Ltd. (Metals & Mining) | 80,000 | 1,080,162 |
Impala Platinum Holdings Ltd. (Metals & Mining) | 72,000 | 939,689 |
Kumba Iron Ore Ltd. (Metals & Mining) | 16,000 | 532,305 |
Shoprite Holdings Ltd. (Food & Staples Retailing) | 78,000 | 1,125,304 |
6,335,026 | ||
Taiwan 11.2% | ||
Alchip Technologies Ltd. (Semiconductors & Semiconductor Equipment) | 17,000 | 497,895 |
ASPEED Technology, Inc. (Semiconductors & Semiconductor Equipment) | 6,000 | 529,543 |
Chailease Holding Co. Ltd. (Diversified Financial Services) | 230,000 | 1,824,838 |
E.Sun Financial Holding Co. Ltd. (Banks) | 1,600,000 | 1,832,653 |
Nan Ya Printed Circuit Board Corp. (Electronic Equipment, Instruments & Components) | 19,000 | 252,317 |
Taiwan Semiconductor Manufacturing Co. Ltd. (Semiconductors & Semiconductor Equipment) | 364,000 | 6,639,359 |
Wiwynn Corp. (Technology Hardware, Storage & Peripherals) | 21,000 | 719,126 |
12,295,731 | ||
Thailand 5.6% | ||
Advanced Info Service PCL, NVDR (Wireless Telecommunication Services) | 164,000 | 1,024,606 |
Bangkok Dusit Medical Services PCL, NVDR (Health Care Providers & Services) | 1,740,000 | 1,302,384 |
12 | MainStay Candriam Emerging Markets Equity Fund |
Shares | Value | |
Common Stocks (continued) | ||
Thailand (continued) | ||
CP ALL PCL, NVDR (Food & Staples Retailing) | 660,000 | $ 1,244,874 |
Energy Absolute PCL, NVDR (Independent Power and Renewable Electricity Producers) | 420,000 | 1,074,305 |
Kasikornbank PCL, NVDR (Banks) | 270,000 | 1,195,975 |
Minor International PCL, NVDR (Hotels, Restaurants & Leisure) (a) | 360,000 | 362,155 |
6,204,299 | ||
United States 0.6% | ||
Globant SA (IT Services) (a) | 3,100 | 669,569 |
Uruguay 0.3% | ||
Dlocal Ltd. (IT Services) (a)(b) | 12,800 | 290,176 |
Total Common Stocks (Cost $101,231,994) | 100,232,028 | |
Preferred Stocks 2.7% | ||
Brazil 1.0% | ||
Itau Unibanco Holding SA (Banks) | 230,000 | 1,110,468 |
Chile 1.7% | ||
Sociedad Quimica y Minera de Chile SA, Sponsored ADR (Chemicals) | 24,400 | 1,800,720 |
Total Preferred Stocks (Cost $2,420,742) | 2,911,188 | |
Short-Term Investment 1.1% | ||
Unaffiliated Investment Company 1.1% | ||
United States 1.1% | ||
Invesco Government & Agency Portfolio, 0.419% (g)(h) | 1,198,433 | 1,198,433 |
Total Short-Term Investment (Cost $1,198,433) | 1,198,433 | |
Total Investments (Cost $104,851,169) | 95.0% | 104,341,649 |
Other Assets, Less Liabilities | 5.0 | 5,534,924 |
Net Assets | 100.0% | $ 109,876,573 |
† | Percentages indicated are based on Fund net assets. |
‡ | Less than one-tenth of a percent. |
(a) | Non-income producing security. |
(b) | All or a portion of this security was held on loan. As of April 30, 2022, the aggregate market value of securities on loan was $1,560,938; the total market value of collateral held by the Fund was $1,682,574. The market value of the collateral held included non-cash collateral in the form of U.S. Treasury securities with a value of $484,141. The Fund received cash collateral with a value of $1,198,433. (See Note 2(J)) |
(c) | May be sold to institutional investors only under Rule 144A or securities offered pursuant to Section 4(a)(2) of the Securities Act of 1933, as amended. |
(d) | Illiquid security—As of April 30, 2022, the total market value deemed illiquid under procedures approved by the Board of Trustees was $2,995,775, which represented 2.7% of the Fund’s net assets. |
(e) | Fair valued security—Represents fair value as measured in good faith under procedures approved by the Board of Trustees. As of April 30, 2022, the total market value was $0, which represented less than one-tenth of a percent of the Fund’s net assets. |
(f) | Security in which significant unobservable inputs (Level 3) were used in determining fair value. |
(g) | Current yield as of April 30, 2022. |
(h) | Represents a security purchased with cash collateral received for securities on loan. |
Currency Purchased | Currency Sold | Counterparty | Settlement Date | Unrealized Appreciation (Depreciation) | ||
IDR | 816,570,127 | USD | 56,443 | JPMorgan Chase Bank N.A. | 5/9/22 | $ (138) |
Total Unrealized Depreciation | $ (138) | |||||
1. | Foreign Currency Forward Contracts are subject to limitations such that they cannot be “sold or repurchased,” although the Fund would be able to exit the transaction through other means, such as through the execution of an offsetting transaction. |
Abbreviation(s): |
ADR—American Depositary Receipt |
IDR—Indonesia Rupiah |
NVDR—Non-Voting Depositary Receipt |
PCL—Provision for Credit Losses |
USD—United States Dollar |
Description | Quoted Prices in Active Markets for Identical Assets (Level 1) | Significant Other Observable Inputs (Level 2) | Significant Unobservable Inputs (Level 3) | Total |
Asset Valuation Inputs | ||||
Investments in Securities (a) | ||||
Common Stocks | ||||
China | $ — | ��$ 28,390,010 | $ — | $ 28,390,010 |
Hungary | — | 648,381 | — | 648,381 |
India | — | 11,995,716 | — | 11,995,716 |
Indonesia | — | 2,995,775 | — | 2,995,775 |
Malaysia | — | 1,947,694 | — | 1,947,694 |
Poland | — | 516,304 | — | 516,304 |
Republic of Korea | — | 12,899,255 | — | 12,899,255 |
South Africa | — | 6,335,026 | — | 6,335,026 |
Taiwan | — | 12,295,731 | — | 12,295,731 |
Thailand | — | 6,204,299 | — | 6,204,299 |
All Other Countries | 16,003,837 | — | — | 16,003,837 |
Total Common Stocks | 16,003,837 | 84,228,191 | — | 100,232,028 |
Preferred Stocks | 2,911,188 | — | — | 2,911,188 |
Short-Term Investment | ||||
Unaffiliated Investment Company | 1,198,433 | — | — | 1,198,433 |
Total Investments in Securities | $ 20,113,458 | $ 84,228,191 | $ — | $ 104,341,649 |
Liability Valuation Inputs | ||||
Other Financial Instruments | ||||
Foreign Currency Forward Contracts (b) | $ — | $ (138) | $ — | $ (138) |
(a) | For a complete listing of investments and their industries, see the Portfolio of Investments. |
(b) | The value listed for these securities reflects unrealized appreciation (depreciation) as shown on the Portfolio of Investments. |
14 | MainStay Candriam Emerging Markets Equity Fund |
Value | Percent † | |
Automobiles | $1,460,331 | 1.3% |
Banks | 18,576,225 | 16.9 |
Capital Markets | 750,145 | 0.7 |
Chemicals | 4,063,312 | 3.8 |
Construction & Engineering | 1,509,856 | 1.4 |
Diversified Financial Services | 3,142,815 | 2.9 |
Electric Utilities | 643,081 | 0.6 |
Electrical Equipment | 2,429,954 | 2.1 |
Electronic Equipment, Instruments & Components | 252,317 | 0.2 |
Entertainment | 840,793 | 0.8 |
Food & Staples Retailing | 2,886,482 | 2.6 |
Food Products | 2,790,577 | 2.6 |
Gas Utilities | 994,093 | 0.9 |
Health Care Equipment & Supplies | 212,031 | 0.2 |
Health Care Providers & Services | 1,302,384 | 1.2 |
Hotels, Restaurants & Leisure | 934,761 | 0.8 |
Independent Power and Renewable Electricity Producers | 1,074,305 | 1.0 |
Insurance | 2,392,063 | 2.2 |
Interactive Media & Services | 4,340,564 | 4.0 |
Internet & Direct Marketing Retail | 6,146,363 | 5.6 |
IT Services | 2,826,463 | 2.6 |
Life Sciences Tools & Services | 2,024,556 | 1.9 |
Machinery | 920,097 | 0.8 |
Metals & Mining | 8,558,584 | 7.7 |
Oil, Gas & Consumable Fuels | 7,297,145 | 6.7 |
Real Estate Management & Development | 1,693,738 | 1.5 |
Road & Rail | 963,723 | 0.9 |
Semiconductors & Semiconductor Equipment | 9,531,242 | 8.5 |
Software | 271,240 | 0.3 |
Specialty Retail | 222,325 | 0.2 |
Technology Hardware, Storage & Peripherals | 6,500,721 | 5.9 |
Textiles, Apparel & Luxury Goods | 563,022 | 0.5 |
Trading Companies & Distributors | 492,736 | 0.5 |
Transportation Infrastructure | 892,546 | 0.8 |
Wireless Telecommunication Services | 3,642,626 | 3.3 |
103,143,216 | 93.9 | |
Short-Term Investment | 1,198,433 | 1.1 |
Other Assets, Less Liabilities | 5,534,924 | 5.0 |
Net Assets | $109,876,573 | 100.0% |
† | Percentages indicated are based on Fund net assets. |
Assets | |
Investment in securities, at value (identified cost $104,851,169) including securities on loan of $1,560,938 | $104,341,649 |
Cash | 6,508,507 |
Receivables: | |
Fund shares sold | 1,418,721 |
Investment securities sold | 571,816 |
Dividends | 92,237 |
Securities lending | 3,807 |
Other assets | 45,340 |
Total assets | 112,982,077 |
Liabilities | |
Cash collateral received for securities on loan | 1,198,433 |
Foreign currency due to custodian, at value | 1,339 |
Payables: | |
Investment securities purchased | 1,611,468 |
Foreign capital gains tax (See Note 2) | 163,293 |
Manager (See Note 3) | 57,974 |
Custodian | 43,248 |
Fund shares redeemed | 13,773 |
Shareholder communication | 6,402 |
Transfer agent (See Note 3) | 2,358 |
NYLIFE Distributors (See Note 3) | 788 |
Professional fees | 467 |
Trustees | 122 |
Accrued expenses | 5,701 |
Unrealized depreciation on foreign currency forward contracts | 138 |
Total liabilities | 3,105,504 |
Net assets | $109,876,573 |
Composition of Net Assets | |
Shares of beneficial interest outstanding (par value of $.001 per share) unlimited number of shares authorized | $10,623 |
Additional paid-in-capital | 115,041,824 |
115,052,447 | |
Total distributable earnings (loss) | (5,175,874) |
Net assets | $109,876,573 |
Class A | |
Net assets applicable to outstanding shares | $2,792,441 |
Shares of beneficial interest outstanding | 270,792 |
Net asset value per share outstanding | $10.31 |
Maximum sales charge (5.50% of offering price) | 0.60 |
Maximum offering price per share outstanding | $10.91 |
Investor Class | |
Net assets applicable to outstanding shares | $362,381 |
Shares of beneficial interest outstanding | 35,238 |
Net asset value per share outstanding | $10.28 |
Maximum sales charge (5.00% of offering price) | 0.54 |
Maximum offering price per share outstanding | $10.82 |
Class C | |
Net assets applicable to outstanding shares | $178,867 |
Shares of beneficial interest outstanding | 17,684 |
Net asset value and offering price per share outstanding | $10.11 |
Class I | |
Net assets applicable to outstanding shares | $10,308,811 |
Shares of beneficial interest outstanding | 990,531 |
Net asset value and offering price per share outstanding | $10.41 |
Class R6 | |
Net assets applicable to outstanding shares | $96,234,073 |
Shares of beneficial interest outstanding | 9,309,091 |
Net asset value and offering price per share outstanding | $10.34 |
16 | MainStay Candriam Emerging Markets Equity Fund |
Investment Income (Loss) | |
Income | |
Dividends (net of foreign tax withholding of $114,891) | $1,077,457 |
Securities lending | 9,837 |
Other | 31 |
Total income | 1,087,325 |
Expenses | |
Manager (See Note 3) | 457,011 |
Custodian | 65,516 |
Professional fees | 55,753 |
Registration | 36,625 |
Transfer agent (See Note 3) | 7,751 |
Distribution/Service—Class A (See Note 3) | 3,309 |
Distribution/Service—Investor Class (See Note 3) | 555 |
Distribution/Service—Class C (See Note 3) | 985 |
Shareholder communication | 3,232 |
Trustees | 933 |
Miscellaneous | 6,765 |
Total expenses before waiver/reimbursement | 638,435 |
Expense waiver/reimbursement from Manager (See Note 3) | (128,334) |
Net expenses | 510,101 |
Net investment income (loss) | 577,224 |
Realized and Unrealized Gain (Loss) | |
Net realized gain (loss) on: | |
Unaffiliated investment transactions(a) | (3,535,276) |
Foreign currency transactions | (63,863) |
Foreign currency forward transactions | (23,516) |
Net realized gain (loss) | (3,622,655) |
Net change in unrealized appreciation (depreciation) on: | |
Unaffiliated investments(b) | (16,669,267) |
Foreign currency forward contracts | (138) |
Translation of other assets and liabilities in foreign currencies | (999) |
Net change in unrealized appreciation (depreciation) | (16,670,404) |
Net realized and unrealized gain (loss) | (20,293,059) |
Net increase (decrease) in net assets resulting from operations | $(19,715,835) |
(a) | Realized gain (loss) on security transactions recorded net of foreign capital gains tax in the amount of $(160,919). |
(b) | Net change in unrealized appreciation (depreciation) on investments recorded net of foreign capital gains tax in the amount of $328,137. |
for the six months ended April 30, 2022 (Unaudited) and the year ended October 31, 2021
2022 | 2021 | |
Increase (Decrease) in Net Assets | ||
Operations: | ||
Net investment income (loss) | $577,224 | $500,176 |
Net realized gain (loss) | (3,622,655) | 15,334,663 |
Net change in unrealized appreciation (depreciation) | (16,670,404) | 1,297,499 |
Net increase (decrease) in net assets resulting from operations | (19,715,835) | 17,132,338 |
Distributions to shareholders: | ||
Class A | (13,154) | (3,773) |
Investor Class | (2,228) | (842) |
Class I | (35,091) | (210) |
Class R6 | (751,850) | (446,085) |
Total distributions to shareholders | (802,323) | (450,910) |
Capital share transactions: | ||
Net proceeds from sales of shares | 40,811,924 | 18,126,480 |
Net asset value of shares issued to shareholders in reinvestment of distributions | 792,715 | 450,676 |
Cost of shares redeemed | (3,298,084) | (28,117,993) |
Increase (decrease) in net assets derived from capital share transactions | 38,306,555 | (9,540,837) |
Net increase (decrease) in net assets | 17,788,397 | 7,140,591 |
Net Assets | ||
Beginning of period | 92,088,176 | 84,947,585 |
End of period | $109,876,573 | $92,088,176 |
18 | MainStay Candriam Emerging Markets Equity Fund |
Six months ended April 30, 2022* | Year Ended October 31, | November 15, 2017 through October 31, 2018^ | |||
Class A | 2021 | 2020 | 2019 | ||
Net asset value at beginning of period | $12.73 | $10.66 | $8.97 | $7.98 | $10.00 |
Net investment income (loss) (a) | 0.05 | 0.04 | 0.02 | 0.10 | 0.05 |
Net realized and unrealized gain (loss) | (2.41) | 2.06 | 1.85 | 0.93 | (2.07) |
Total from investment operations | (2.36) | 2.10 | 1.87 | 1.03 | (2.02) |
Less distributions: | |||||
From net investment income | (0.06) | (0.03) | (0.18) | (0.04) | — |
Net asset value at end of period | $10.31 | $12.73 | $10.66 | $8.97 | $7.98 |
Total investment return (b) | (18.53)% | 19.68% | 21.14% | 12.96% | (20.20)% |
Ratios (to average net assets)/Supplemental Data: | |||||
Net investment income (loss) | 0.87%†† | 0.30% | 0.22% | 1.18% | 0.51%†† |
Net expenses (c) | 1.48%†† | 1.47% | 1.50% | 1.50% | 1.50%†† |
Expenses (before waiver/reimbursement) (c) | 1.75%†† | 1.75% | 2.00% | 1.77% | 1.89%†† |
Portfolio turnover rate | 51% | 74% | 122% | 107% | 80% |
Net assets at end of period (in 000’s) | $2,792 | $2,921 | $1,111 | $77 | $35 |
* | Unaudited. |
^ | Inception date. |
†† | Annualized. |
(a) | Per share data based on average shares outstanding during the period. |
(b) | Total investment return is calculated exclusive of sales charges and assumes the reinvestment of dividends and distributions. For periods of less than one year, total return is not annualized. |
(c) | In addition to the fees and expenses which the Fund bears directly, it also indirectly bears a pro-rata share of the fees and expenses of the underlying funds in which it invests. Such indirect expenses are not included in the above expense ratios. |
Six months ended April 30, 2022* | Year Ended October 31, | November 15, 2017 through October 31, 2018^ | |||
Investor Class | 2021 | 2020 | 2019 | ||
Net asset value at beginning of period | $12.70 | $10.65 | $8.95 | $7.97 | $10.00 |
Net investment income (loss) (a) | 0.04 | 0.02 | 0.02 | 0.07 | 0.05 |
Net realized and unrealized gain (loss) | (2.41) | 2.05 | 1.84 | 0.94 | (2.08) |
Total from investment operations | (2.37) | 2.07 | 1.86 | 1.01 | (2.03) |
Less distributions: | |||||
From net investment income | (0.05) | (0.02) | (0.16) | (0.03) | — |
Net asset value at end of period | $10.28 | $12.70 | $10.65 | $8.95 | $7.97 |
Total investment return (b) | (18.61)% | 19.49% | 21.11%(c) | 12.71%(c) | (20.30)%(c) |
Ratios (to average net assets)/Supplemental Data: | |||||
Net investment income (loss) | 0.75%†† | 0.15% | 0.17% | 0.76% | 0.53%†† |
Net expenses (d) | 1.61%†† | 1.52% | 1.52% | 1.66% | 1.68%†† |
Expenses (before waiver/reimbursement) (d) | 1.87%†† | 1.81% | 2.03% | 1.92% | 2.03%†† |
Portfolio turnover rate | 51% | 74% | 122% | 107% | 80% |
Net assets at end of period (in 000's) | $362 | $507 | $360 | $121 | $108 |
* | Unaudited. |
^ | Inception date. |
†† | Annualized. |
(a) | Per share data based on average shares outstanding during the period. |
(b) | Total investment return is calculated exclusive of sales charges and assumes the reinvestment of dividends and distributions. For periods of less than one year, total return is not annualized. |
(c) | Total investment return may reflect adjustments to conform to generally accepted accounting principles. |
(d) | In addition to the fees and expenses which the Fund bears directly, it also indirectly bears a pro-rata share of the fees and expenses of the underlying funds in which it invests. Such indirect expenses are not included in the above expense ratios. |
Six months ended April 30, 2022* | Year Ended October 31, | November 15, 2017 through October 31, 2018^ | |||
Class C | 2021 | 2020 | 2019 | ||
Net asset value at beginning of period | $12.48 | $10.52 | $8.85 | $7.91 | $10.00 |
Net investment income (loss) (a) | (0.00)‡ | (0.08) | (0.05) | (0.01) | 0.00‡ |
Net realized and unrealized gain (loss) | (2.37) | 2.04 | 1.83 | 0.95 | (2.09) |
Total from investment operations | (2.37) | 1.96 | 1.78 | 0.94 | (2.09) |
Less distributions: | |||||
From net investment income | — | — | (0.11) | — | — |
Net asset value at end of period | $10.11 | $12.48 | $10.52 | $8.85 | $7.91 |
Total investment return (b) | (18.99)%(c) | 18.63%(c) | 20.23% | 11.88% | (20.90)% |
Ratios (to average net assets)/Supplemental Data: | |||||
Net investment income (loss) | (0.01)%†† | (0.63)% | (0.52)% | (0.13)% | 0.04%†† |
Net expenses (d) | 2.36%†† | 2.27% | 2.27% | 2.40% | 2.44%†† |
Expenses (before waiver/reimbursement) (d) | 2.63%†† | 2.57% | 2.78% | 2.67% | 2.73%†† |
Portfolio turnover rate | 51% | 74% | 122% | 107% | 80% |
Net assets at end of period (in 000’s) | $179 | $212 | $217 | $56 | $93 |
* | Unaudited. |
^ | Inception date. |
‡ | Less than one cent per share. |
†† | Annualized. |
(a) | Per share data based on average shares outstanding during the period. |
(b) | Total investment return is calculated exclusive of sales charges and assumes the reinvestment of dividends and distributions. For periods of less than one year, total return is not annualized. |
(c) | Total investment return may reflect adjustments to conform to generally accepted accounting principles. |
(d) | In addition to the fees and expenses which the Fund bears directly, it also indirectly bears a pro-rata share of the fees and expenses of the underlying funds in which it invests. Such indirect expenses are not included in the above expense ratios. |
Six months ended April 30, 2022* | Year Ended October 31, | November 15, 2017 through October 31, 2018^ | |||
Class I | 2021 | 2020 | 2019 | ||
Net asset value at beginning of period | $12.85 | $10.77 | $8.99 | $8.00 | $10.00 |
Net investment income (loss) | 0.08 | 0.05(a) | 0.05(a) | (0.02)(a) | 0.03(a) |
Net realized and unrealized gain (loss) | (2.42) | 2.11 | 1.87 | 1.07 | (2.03) |
Total from investment operations | (2.34) | 2.16 | 1.92 | 1.05 | (2.00) |
Less distributions: | |||||
From net investment income | (0.10) | (0.08) | (0.14) | (0.06) | (0.00)‡ |
Net asset value at end of period | $10.41 | $12.85 | $10.77 | $8.99 | $8.00 |
Total investment return (b) | (18.34)% | 20.05% | 21.60% | 13.28% | (19.99)% |
Ratios (to average net assets)/Supplemental Data: | |||||
Net investment income (loss) | 1.31%†† | 0.38% | 0.55% | (0.26)% | 0.34%†† |
Net expenses (c) | 1.10%†† | 1.07% | 1.15% | 1.15% | 1.19%†† |
Expenses (before waiver/reimbursement) (c) | 1.51%†† | 1.52% | 1.79% | 1.52% | 1.79%†† |
Portfolio turnover rate | 51% | 74% | 122% | 107% | 80% |
Net assets at end of period (in 000’s) | $10,309 | $4,532 | $30 | $40 | $7,934 |
* | Unaudited. |
^ | Inception date. |
‡ | Less than one cent per share. |
†† | Annualized. |
(a) | Per share data based on average shares outstanding during the period. |
(b) | Total investment return is calculated exclusive of sales charges and assumes the reinvestment of dividends and distributions. Class I shares are not subject to sales charges. For periods of less than one year, total return is not annualized. |
(c) | In addition to the fees and expenses which the Fund bears directly, it also indirectly bears a pro-rata share of the fees and expenses of the underlying funds in which it invests. Such indirect expenses are not included in the above expense ratios. |
20 | MainStay Candriam Emerging Markets Equity Fund |
Six months ended April 30, 2022* | Year Ended October 31, | November 15, 2017 through October 31, 2018^ | |||
Class R6 | 2021 | 2020 | 2019 | ||
Net asset value at beginning of period | $12.79 | $10.71 | $9.00 | $8.01 | $10.00 |
Net investment income (loss) | 0.07 | 0.08(a) | 0.05(a) | 0.10(a) | 0.14(a) |
Net realized and unrealized gain (loss) | (2.41) | 2.06 | 1.86 | 0.95 | (2.13) |
Total from investment operations | (2.34) | 2.14 | 1.91 | 1.05 | (1.99) |
Less distributions: | |||||
From net investment income | (0.11) | (0.06) | (0.20) | (0.06) | (0.00)‡ |
Net asset value at end of period | $10.34 | $12.79 | $10.71 | $9.00 | $8.01 |
Total investment return (b) | (18.40)% | 20.05% | 21.61% | 13.29% | (19.89)% |
Ratios (to average net assets)/Supplemental Data: | |||||
Net investment income (loss) | 1.28%†† | 0.58% | 0.51% | 1.11% | 1.54%†† |
Net expenses (c) | 1.10%†† | 1.07% | 1.15% | 1.15% | 1.15%†† |
Expenses (before waiver/reimbursement) (c) | 1.37%†† | 1.32% | 1.53% | 1.42% | 1.43%†† |
Portfolio turnover rate | 51% | 74% | 122% | 107% | 80% |
Net assets at end of period (in 000’s) | $96,234 | $83,916 | $83,230 | $49,111 | $62,635 |
* | Unaudited. |
^ | Inception date. |
‡ | Less than one cent per share. |
†† | Annualized. |
(a) | Per share data based on average shares outstanding during the period. |
(b) | Total investment return is calculated exclusive of sales charges and assumes the reinvestment of dividends and distributions. Class R6 shares are not subject to sales charges. For periods of less than one year, total return is not annualized. |
(c) | In addition to the fees and expenses which the Fund bears directly, it also indirectly bears a pro-rata share of the fees and expenses of the underlying funds in which it invests. Such indirect expenses are not included in the above expense ratios. |
Class | Commenced Operations |
Class A | November 15, 2017 |
Investor Class | November 15, 2017 |
Class C | November 15, 2017 |
Class I | November 15, 2017 |
Class R6 | November 15, 2017 |
SIMPLE Class | N/A* |
* | SIMPLE Class shares were registered for sale effective as of August 31, 2020 but have not yet commenced operations. |
22 | MainStay Candriam Emerging Markets Equity Fund |
• Broker/dealer quotes | • Benchmark securities |
• Two-sided markets | • Reference data (corporate actions or material event notices) |
• Bids/offers | • Monthly payment information |
• Industry and economic events | • Reported trades |
24 | MainStay Candriam Emerging Markets Equity Fund |
Liability Derivatives | Foreign Exchange Contracts Risk | Total |
Forward Contracts - Unrealized depreciation on foreign currency forward contracts | $(138) | $(138) |
Total Fair Value | $(138) | $(138) |
Net Realized Gain (Loss) from: | Foreign Exchange Contracts Risk | Total |
Forward Contracts | $(23,516) | $(23,516) |
Total Net Realized Gain (Loss) | $(23,516) | $(23,516) |
26 | MainStay Candriam Emerging Markets Equity Fund |
Net Change in Unrealized Appreciation (Depreciation) | Foreign Exchange Contracts Risk | Total |
Forward Contracts | $(138) | $(138) |
Total Net Change in Unrealized Appreciation (Depreciation) | $(138) | $(138) |
Average Notional Amount | Total |
Forward Contracts Long (a) | $56,443 |
(a) | Position was open one month during the reporting period. |
Class | Expense | Waived |
Class A | $1,720 | $— |
Investor Class | 570 | — |
Class C | 254 | — |
Class I | 3,544 | — |
Class R6 | 1,663 | — |
Class I | $29,574 | 0.3% |
Class R6 | 29,554 | 0.0‡ |
‡ | Less than one-tenth of a percent. |
Federal Tax Cost | Gross Unrealized Appreciation | Gross Unrealized (Depreciation) | Net Unrealized Appreciation/ (Depreciation) | |
Investments in Securities | $105,239,457 | $6,655,253 | $(7,553,061) | $(897,808) |
Capital Loss Available Through | Short-Term Capital Loss Amounts (000’s) | Long-Term Capital Loss Amounts (000’s) |
Unlimited | $728 | $— |
2021 | |
Distributions paid from: | |
Ordinary Income | $450,910 |
28 | MainStay Candriam Emerging Markets Equity Fund |
Class A | Shares | Amount |
Six-month period ended April 30, 2022: | ||
Shares sold | 94,113 | $1,049,920 |
Shares issued to shareholders in reinvestment of distributions | 1,080 | 13,154 |
Shares redeemed | (57,097) | (656,654) |
Net increase (decrease) in shares outstanding before conversion | 38,096 | 406,420 |
Shares converted into Class A (See Note 1) | 3,188 | 38,357 |
Net increase (decrease) | 41,284 | $444,777 |
Year ended October 31, 2021: | ||
Shares sold | 183,552 | $2,422,744 |
Shares issued to shareholders in reinvestment of distributions | 294 | 3,539 |
Shares redeemed | (73,552) | (961,047) |
Net increase (decrease) in shares outstanding before conversion | 110,294 | 1,465,236 |
Shares converted into Class A (See Note 1) | 14,968 | 188,531 |
Net increase (decrease) | 125,262 | $1,653,767 |
Investor Class | Shares | Amount |
Six-month period ended April 30, 2022: | ||
Shares sold | 3,394 | $40,328 |
Shares issued to shareholders in reinvestment of distributions | 183 | 2,228 |
Shares redeemed | (5,115) | (58,563) |
Net increase (decrease) in shares outstanding before conversion | (1,538) | (16,007) |
Shares converted into Investor Class (See Note 1) | 33 | 379 |
Shares converted from Investor Class (See Note 1) | (3,196) | (38,357) |
Net increase (decrease) | (4,701) | $(53,985) |
Year ended October 31, 2021: | ||
Shares sold | 28,442 | $373,741 |
Shares issued to shareholders in reinvestment of distributions | 70 | 842 |
Shares redeemed | (8,659) | (111,752) |
Net increase (decrease) in shares outstanding before conversion | 19,853 | 262,831 |
Shares converted into Investor Class (See Note 1) | 1,158 | 15,431 |
Shares converted from Investor Class (See Note 1) | (14,872) | (187,174) |
Net increase (decrease) | 6,139 | $91,088 |
Class C | Shares | Amount |
Six-month period ended April 30, 2022: | ||
Shares sold | 2,571 | $28,268 |
Shares redeemed | (1,811) | (18,804) |
Net increase (decrease) in shares outstanding before conversion | 760 | 9,464 |
Shares converted from Class C (See Note 1) | (34) | (379) |
Net increase (decrease) | 726 | $9,085 |
Year ended October 31, 2021: | ||
Shares sold | 3,454 | $44,739 |
Shares redeemed | (5,870) | (74,767) |
Net increase (decrease) in shares outstanding before conversion | (2,416) | (30,028) |
Shares converted from Class C (See Note 1) | (1,278) | (16,788) |
Net increase (decrease) | (3,694) | $(46,816) |
Class I | Shares | Amount |
Six-month period ended April 30, 2022: | ||
Shares sold | 729,198 | $8,140,554 |
Shares issued to shareholders in reinvestment of distributions | 2,077 | 25,483 |
Shares redeemed | (93,264) | (1,018,350) |
Net increase (decrease) | 638,011 | $7,147,687 |
Year ended October 31, 2021: | ||
Shares sold | 628,742 | $8,155,416 |
Shares issued to shareholders in reinvestment of distributions | 17 | 210 |
Shares redeemed | (279,040) | (3,577,313) |
Net increase (decrease) | 349,719 | $4,578,313 |
Class R6 | Shares | Amount |
Six-month period ended April 30, 2022: | ||
Shares sold | 2,817,895 | $31,552,854 |
Shares issued to shareholders in reinvestment of distributions | 61,678 | 751,850 |
Shares redeemed | (130,893) | (1,545,713) |
Net increase (decrease) | 2,748,680 | $30,758,991 |
Year ended October 31, 2021: | ||
Shares sold | 541,627 | $7,129,840 |
Shares issued to shareholders in reinvestment of distributions | 37,020 | 446,085 |
Shares redeemed | (1,790,189) | (23,393,114) |
Net increase (decrease) | (1,211,542) | $(15,817,189) |
30 | MainStay Candriam Emerging Markets Equity Fund |
32 | MainStay Candriam Emerging Markets Equity Fund |
34 | MainStay Candriam Emerging Markets Equity Fund |
36 | MainStay Candriam Emerging Markets Equity Fund |
For more information
Message from the President and Semiannual Report
MainStay Conservative Allocation Fund |
MainStay Moderate Allocation Fund |
MainStay Growth Allocation Fund |
MainStay Equity Allocation Fund |
please log in to newyorklifeinvestments.com/accounts.
Not FDIC/NCUA Insured | Not a Deposit | May Lose Value | No Bank Guarantee | Not Insured by Any Government Agency |


5 | |
23 | |
41 | |
59 | |
76 | |
93 | |
97 | |
98 | |
98 |
Investors should refer to each Fund’s Summary Prospectus and/or Prospectus and consider each Fund’s investment objectives, strategies, risks, charges and expenses carefully before investing. The Summary Prospectus and/or Prospectus contain this and other information about each Fund. You may obtain copies of each Fund’s Summary Prospectus, Prospectus and Statement of Additional Information, which includes information about MainStay Funds Trust's Trustees, free of charge, upon request, by calling toll-free 800-624-6782, by writing to NYLIFE Distributors LLC, Attn: MainStay Marketing Department, 30 Hudson Street, Jersey City, NJ 07302 or by sending an e-mail to MainStayShareholderServices@nylim.com. These documents are also available via the MainStay Funds’ website at newyorklifeinvestments.com. Please read each Fund’s Summary Prospectus and/or Prospectus carefully before investing.
Investment and Performance Comparison (Unaudited)

Average Annual Total Returns for the Period-Ended April 30, 2022 | ||||||||
Class | Sales Charge | Inception Date | Six Months1 | One Year | Five Years | Ten Years or Since Inception | Gross Expense Ratio2 | |
Class A Shares3 | Maximum 3% Initial Sales Charge | With sales charges | 4/4/2005 | -11.53% | -8.57% | 2.91% | 4.34% | 0.90% |
Excluding sales charges | -8.79 | -5.74 | 4.08 | 4.93 | 0.90 | |||
Investor Class Shares3, 4 | Maximum 2.5% Initial Sales Charge | With sales charges | 2/28/2008 | -11.16 | -8.21 | 2.75 | 4.16 | 1.17 |
Excluding sales charges | -8.88 | -5.86 | 3.92 | 4.75 | 1.17 | |||
Class B Shares5 | Maximum 5% CDSC | With sales charges | 4/4/2005 | -13.55 | -11.01 | 2.78 | 3.97 | 1.92 |
if Redeemed Within the First Six Years of Purchase | Excluding sales charges | -9.32 | -6.65 | 3.12 | 3.97 | 1.92 | ||
Class C Shares | Maximum 1% CDSC | With sales charges | 4/4/2005 | -10.09 | -7.52 | 3.13 | 3.97 | 1.92 |
if Redeemed Within One Year of Purchase | Excluding sales charges | -9.24 | -6.65 | 3.13 | 3.97 | 1.92 | ||
Class I Shares | No Sales Charge | 4/4/2005 | -8.73 | -5.54 | 4.35 | 5.19 | 0.65 | |
Class R2 Shares | No Sales Charge | 6/14/2019 | -8.84 | -5.78 | N/A | 4.71 | 1.00 | |
Class R3 Shares | No Sales Charge | 2/29/2016 | -9.00 | -6.07 | 3.72 | 5.11 | 1.25 | |
SIMPLE Class Shares | No Sales Charge | 8/31/2020 | -9.02 | -6.17 | N/A | 1.02 | 1.42 | |
1. | Not annualized. |
2. | The gross expense ratios presented reflect the Fund’s “Total Annual Fund Operating Expenses” from the most recent Prospectus, as supplemented, and may differ from other expense ratios disclosed in this report. |
3. | Prior to July 22, 2019, the maximum initial sales charge was 5.5%, which is reflected in the applicable average annual total return figures shown. |
4. | Prior to June 30, 2020, the maximum initial sales charge was 3%, which is reflected in the applicable average annual total return figures shown. |
5. | Class B shares are closed to all new purchases as well as additional investments by existing Class B shareholders. |
Benchmark Performance* | Six Months1 | One Year | Five Years | Ten Years |
S&P 500® Index2 | -9.65% | 0.21% | 13.66% | 13.67% |
MSCI EAFE® Index (Net)3 | -11.80 | -8.15 | 4.77 | 5.77 |
Bloomberg U.S. Aggregate Bond Index4 | -9.47 | -8.51 | 1.20 | 1.73 |
Conservative Allocation Composite Index5 | -9.64 | -5.74 | 5.49 | 5.86 |
Morningstar Allocation-30% to 50% Equity Category Average6 | -8.56 | -5.63 | 4.17 | 4.35 |
* | Returns for indices reflect no deductions for fees, expenses or taxes, except for foreign withholding taxes where applicable. |
1. | Not annualized. |
2. | The S&P 500® Index is the Fund's primary benchmark. S&P 500® is a trademark of The McGraw-Hill Companies, Inc. The S&P 500® Index is widely regarded as the standard index for measuring large-cap U.S. stock market performance. Results assume reinvestment of all dividends and capital gains. An investment cannot be made directly in an index. |
3. | The MSCI EAFE® Index (Net) is the Fund's secondary benchmark. The MSCI EAFE® Index (Net) consists of international stocks representing the developed world outside of North America. Results assume reinvestment of all dividends and capital gains. An investment cannot be made directly in an index. |
4. | The Fund has selected the Bloomberg U.S. Aggregate Bond Index as an additional benchmark. The Bloomberg U.S. Aggregate Bond Index is a broad-based benchmark that measures the performance of the investment grade, U.S. dollar-denominated, fixed-rate taxable bond market, including Treasurys, government-related and corporate securities, mortgage-backed securities (agency fixed-rate and hybrid adjustable rate mortgage pass-throughs), asset-backed securities, and commercial mortgage-backed securities. Results assume reinvestment of all dividends and capital gains. An investment cannot be made directly in an index. |
5. | The Fund has selected the Conservative Allocation Composite Index as an additional benchmark. The Conservative Allocation Composite Index consists of the S&P 500® Index, the MSCI EAFE® Index (Net) and the Bloomberg U.S. Aggregate Bond Index weighted 30%, 10% and 60%, respectively. Results assume reinvestment of all dividends and capital gains. An investment cannot be made directly in an index. |
6. | The Morningstar Allocation – 30% to 50% Equity Category Average is representative of funds that seek to provide both income and capital appreciation by investing in multiple asset classes, including stocks, bonds, and cash. These portfolios are dominated by domestic holdings and have equity exposures between 30% and 50%. Results are based on average total returns of similar funds with all dividends and capital gain distributions reinvested. |
6 | MainStay Conservative Allocation Fund |
Share Class | Beginning Account Value 11/1/21 | Ending Account Value (Based on Actual Returns and Expenses) 4/30/22 | Expenses Paid During Period1 | Ending Account Value (Based on Hypothetical 5% Annualized Return and Actual Expenses) 4/30/22 | Expenses Paid During Period1 | Net Expense Ratio During Period2 |
Class A Shares | $1,000.00 | $912.10 | $1.66 | $1,023.06 | $1.76 | 0.35% |
Investor Class Shares | $1,000.00 | $911.20 | $2.61 | $1,022.07 | $2.76 | 0.55% |
Class B Shares | $1,000.00 | $906.80 | $6.15 | $1,018.35 | $6.51 | 1.30% |
Class C Shares | $1,000.00 | $907.60 | $6.15 | $1,018.35 | $6.51 | 1.30% |
Class I Shares | $1,000.00 | $912.70 | $0.47 | $1,024.30 | $0.50 | 0.10% |
Class R2 Shares | $1,000.00 | $911.60 | $2.13 | $1,022.56 | $2.26 | 0.45% |
Class R3 Shares | $1,000.00 | $910.00 | $3.32 | $1,021.32 | $3.51 | 0.70% |
SIMPLE Class Shares | $1,000.00 | $909.80 | $3.79 | $1,020.83 | $4.01 | 0.80% |
1. | Expenses are equal to the Fund’s annualized expense ratio of each class multiplied by the average account value over the period, divided by 365 and multiplied by 181 (to reflect the six-month period). The table above represents the actual expenses incurred during the six-month period. In addition to the fees and expenses which the Fund bears directly, it also indirectly bears a pro rata share of the fees and expenses of the underlying funds in which it invests. Such indirect expenses are not included in the above-reported expense figures. |
2. | Expenses are equal to the Fund's annualized expense ratio to reflect the six-month period. |
Asset Diversification as of April 30, 2022 (Unaudited)
Equity Funds | 35.1% |
Fixed Income Funds | 55.3 |
Short-Term Investment | 9.7 |
Other Assets, Less Liabilities | (0.1) |
8 | MainStay Conservative Allocation Fund |
10 | MainStay Conservative Allocation Fund |
Shares | Value | |
Affiliated Investment Companies 90.4% | ||
Equity Funds 35.1% | ||
IQ 50 Percent Hedged FTSE International ETF | 409,863 | $ 9,262,699 |
IQ 500 International ETF | 258,678 | 7,688,169 |
IQ Candriam ESG International Equity ETF | 293,031 | 7,563,072 |
IQ Candriam ESG U.S. Equity ETF | 436,759 | 15,522,284 |
IQ Chaikin U.S. Large Cap ETF | 364,964 | 11,756,877 |
IQ Chaikin U.S. Small Cap ETF | 215,056 | 6,838,179 |
MainStay Candriam Emerging Markets Equity Fund Class R6 (a) | 636,130 | 6,579,050 |
MainStay Epoch Capital Growth Fund Class I | 142,359 | 1,556,108 |
MainStay Epoch International Choice Fund Class I | 133,322 | 4,545,443 |
MainStay Epoch U.S. Equity Yield Fund Class R6 (a) | 642,843 | 12,651,976 |
MainStay MacKay International Equity Fund Class R6 | 268,108 | 4,364,261 |
MainStay S&P 500 Index Fund Class I | 126,474 | 6,643,605 |
MainStay Winslow Large Cap Growth Fund Class R6 | 1,459,345 | 15,139,389 |
MainStay WMC Enduring Capital Fund Class R6 (a) | 375,707 | 11,658,447 |
MainStay WMC Growth Fund Class R6 (a) | 424,623 | 14,963,680 |
MainStay WMC International Research Equity Fund Class I | 657,839 | 4,463,108 |
MainStay WMC Small Companies Fund Class I (a) | 320,416 | 7,560,675 |
MainStay WMC Value Fund Class R6 | 401,325 | 12,154,562 |
Total Equity Funds (Cost $142,603,952) | 160,911,584 | |
Shares | Value | |
Fixed Income Funds 55.3% | ||
IQ MacKay ESG Core Plus Bond ETF (a) | 2,136,660 | $ 47,818,665 |
MainStay Floating Rate Fund Class R6 (a) | 3,986,551 | 35,744,216 |
MainStay MacKay High Yield Corporate Bond Fund Class R6 | 3,631,439 | 18,832,641 |
MainStay MacKay Short Duration High Yield Fund Class I | 3,520,112 | 33,278,435 |
MainStay MacKay Total Return Bond Fund Class R6 (a) | 12,328,864 | 117,895,995 |
Total Fixed Income Funds (Cost $271,628,692) | 253,569,952 | |
Total Affiliated Investment Companies (Cost $414,232,644) | 414,481,536 | |
Short-Term Investment 9.7% | ||
Affiliated Investment Company 9.7% | ||
MainStay U.S. Government Liquidity Fund, 0.397% (b) | 44,444,648 | 44,444,648 |
Total Short-Term Investment (Cost $44,444,648) | 9.7% | 44,444,648 |
Total Investments (Cost $458,677,292) | 100.1% | 458,926,184 |
Other Assets, Less Liabilities | (0.1) | (681,640) |
Net Assets | 100.0% | $ 458,244,544 |
† | Percentages indicated are based on Fund net assets. |
(a) | As of April 30, 2022, the Fund's ownership exceeds 5% of the outstanding shares of the Underlying Fund's share class. |
(b) | Current yield as of April 30, 2022. |
12 | MainStay Conservative Allocation Fund |
Affiliated Investment Companies | Value, Beginning of Period | Purchases at Cost | Proceeds from Sales | Net Realized Gain/(Loss) on Sales | Change in Unrealized Appreciation/ (Depreciation) | Value, End of Period | Dividend Income | Other Distributions | Shares End of Period |
IQ 50 Percent Hedged FTSE International ETF | $ 10,170 | $ 432 | $ (384) | $ (2) | $ (953) | $ 9,263 | $ 116 | $ — | 410 |
IQ 500 International ETF | 8,948 | 358 | (753) | 40 | (905) | 7,688 | 145 | — | 259 |
IQ Candriam ESG International Equity ETF | 8,695 | 459 | (332) | 49 | (1,308) | 7,563 | 97 | — | 293 |
IQ Candriam ESG U.S. Equity ETF | 18,855 | 430 | (1,802) | 276 | (2,237) | 15,522 | 108 | — | 437 |
IQ Chaikin U.S. Large Cap ETF | 12,726 | 532 | (468) | (21) | (1,012) | 11,757 | 81 | — | 365 |
IQ Chaikin U.S. Small Cap ETF | 8,996 | 180 | (1,350) | 358 | (1,346) | 6,838 | 57 | — | 215 |
IQ MacKay ESG Core Plus Bond ETF | — | 49,689 | — | — | (1,870) | 47,819 | 70 | — | 2,137 |
MainStay Candriam Emerging Markets Equity Fund Class R6 | 7,538 | 650 | (104) | (12) | (1,493) | 6,579 | 68 | — | 636 |
MainStay Epoch Capital Growth Fund Class I | 1,886 | 493 | (82) | (6) | (735) | 1,556 | 2 | 420 | 142 |
MainStay Epoch International Choice Fund Class I | 5,144 | 491 | (168) | (13) | (909) | 4,545 | 131 | — | 133 |
MainStay Epoch U.S. Equity Yield Fund Class R6 | 14,602 | 181 | (2,019) | 67 | (179) | 12,652 | 137 | — | 643 |
MainStay Floating Rate Fund Class R6 | 38,149 | 941 | (2,671) | (29) | (646) | 35,744 | 579 | — | 3,987 |
MainStay MacKay High Yield Corporate Bond Fund Class R6 | 20,305 | 945 | (866) | (42) | (1,509) | 18,833 | 523 | — | 3,631 |
MainStay MacKay International Equity Fund Class R6 | 4,948 | 1,375 | (187) | (71) | (1,701) | 4,364 | 19 | 612 | 268 |
MainStay MacKay Short Duration High Yield Fund Class I | 25,436 | 11,161 | (2,013) | (57) | (1,249) | 33,278 | 607 | — | 3,520 |
MainStay MacKay Total Return Bond Fund Class R6 | 193,306 | 8,242 | (58,289) | (4,798) | (20,565) | 117,896 | 2,457 | 5,785 | 12,329 |
MainStay S&P 500 Index Fund Class I (a) | 8,546 | 448 | (1,264) | 383 | (1,469) | 6,644 | 92 | 294 | 126 |
MainStay Short Term Bond Fund Class I | 2,536 | 2 | (2,516) | (50) | 28 | — | 5 | 7 | — |
MainStay U.S. Government Liquidity Fund | 45,132 | 75,023 | (75,710) | — | — | 44,445 | 7 | — | 44,445 |
MainStay Winslow Large Cap Growth Fund Class R6 | 19,359 | 5,643 | (1,661) | (63) | (8,139) | 15,139 | — | 3,580 | 1,459 |
MainStay WMC Enduring Capital Fund Class R6 | 12,610 | 1,619 | (425) | (58) | (2,088) | 11,658 | 42 | 1,033 | 376 |
MainStay WMC Growth Fund Class R6 | 17,634 | 5,677 | (398) | (190) | (7,759) | 14,964 | — | 3,520 | 425 |
MainStay WMC International Research Equity Fund Class I | 5,054 | 511 | (200) | (15) | (887) | 4,463 | 133 | — | 658 |
MainStay WMC Small Companies Fund Class I | 8,471 | 2,595 | (768) | (286) | (2,451) | 7,561 | — | 1,946 | 320 |
MainStay WMC Value Fund Class R6 | 13,224 | 6,180 | (1,051) | (144) | (6,054) | 12,155 | 124 | 5,850 | 401 |
$512,270 | $174,257 | $(155,481) | $(4,684) | $(67,436) | $458,926 | $5,600 | $23,047 |
(a) | Prior to February 28, 2022, known as MainStay MacKay S&P 500 Index Fund Class I. |
Swap Counterparty | Reference Obligation | Floating Rate2 | Termination Date(s) | Payment Frequency Paid/ Received | Notional Amount Long/ (Short) (000)3 | Unrealized Appreciation/ (Depreciation)4 |
Citibank NA | Invesco S&P 500 Low Volatility ETF | 1 day FEDF plus 0.45% | 12/2/22 | Daily | 7,100 | $ — |
Citibank NA | iShares 20+ Year Treasury Bond ETF | 1 day FEDF plus 0.35% | 12/2/22 | Daily | 4,531 | — |
Citibank NA | iShares Semiconductor ETF | 1 day FEDF plus 0.35% | 12/2/22 | Daily | 1,367 | — |
Citibank NA | Russell 1000 Growth Total Return Index | 1 day FEDF minus 0.20% | 12/2/22 | Daily | (12,872) | — |
Citibank NA | Russell 1000 Value Total Return Index | 1 day FEDF | 12/2/22 | Daily | (2,224) | — |
Citibank NA | Russell Midcap Total Return Index | 1 day FEDF plus 0.40% | 12/2/22 | Daily | 7,487 | — |
Citibank NA | S&P 500 Health Care Sector | 1 day FEDF plus 0.45% | 12/2/22 | Daily | 2,288 | — |
Citibank NA | S&P 500 Total Return Index | 1 day FEDF plus 0.11% | 12/2/22 | Daily | (2,713) | — |
Citibank NA | S&P 600 Total Return | 1 day FEDF plus 0.40% | 12/2/22 | Daily | 25,957 | — |
Citibank NA | SPDR S&P Oil & Gas Exploration & Production ETF | 1 day FEDF plus 0.40% | 12/2/22 | Daily | 3,747 | — |
Swap Counterparty | Reference Obligation | Floating Rate2 | Termination Date(s) | Payment Frequency Paid/ Received | Notional Amount Long/ (Short) (000)3 | Unrealized Appreciation/ (Depreciation)4 |
Citibank NA | VanEck Gold Miners ETF | 1 day FEDF plus 0.55% | 12/2/22 | Daily | 5,574 | $ — |
Citibank NA | VanEck Oil Services ETF | 1 day FEDF plus 0.40% | 12/2/22 | Daily | 3,330 | — |
$ — |
1. | As of April 30, 2022, cash in the amount $1,145,334 was pledged from brokers for OTC swap contracts. |
2. | Fund pays the floating rate and receives the total return of the reference entity. |
3. | Notional amounts reflected as a positive value indicate a long position held by the Fund or Index and a negative value indicates a short position. |
4. | Reflects the value at reset date as of April 30, 2022. |
Abbreviation(s): |
ETF—Exchange-Traded Fund |
FEDF—Federal Funds Rate |
FTSE—Financial Times Stock Exchange |
SPDR—Standard & Poor’s Depositary Receipt |
Description | Quoted Prices in Active Markets for Identical Assets (Level 1) | Significant Other Observable Inputs (Level 2) | Significant Unobservable Inputs (Level 3) | Total |
Asset Valuation Inputs | ||||
Investments in Securities (a) | ||||
Affiliated Investment Companies | ||||
Equity Funds | $ 160,911,584 | $ — | $ — | $ 160,911,584 |
Fixed Income Funds | 253,569,952 | — | — | 253,569,952 |
Total Affiliated Investment Companies | 414,481,536 | — | — | 414,481,536 |
Short-Term Investment | ||||
Affiliated Investment Company | 44,444,648 | — | — | 44,444,648 |
Total Investments in Securities | $ 458,926,184 | $ — | $ — | $ 458,926,184 |
(a) | For a complete listing of investments, see the Portfolio of Investments. |
14 | MainStay Conservative Allocation Fund |
Assets | |
Investment in affiliated investment companies, at value (identified cost $458,677,292) | $458,926,184 |
Cash | 379,863 |
Cash collateral on deposit at broker for swap contracts | 1,145,334 |
Receivables: | |
Dividends and interest | 98,985 |
Fund shares sold | 93,840 |
Other assets | 85,682 |
Total assets | 460,729,888 |
Liabilities | |
Payables: | |
Dividends and interest on OTC swaps contracts | 1,819,676 |
Fund shares redeemed | 308,647 |
Transfer agent (See Note 3) | 117,419 |
NYLIFE Distributors (See Note 3) | 116,988 |
Shareholder communication | 71,894 |
Professional fees | 31,576 |
Custodian | 13,785 |
Manager (See Note 3) | 1,513 |
Trustees | 774 |
Accrued expenses | 3,072 |
Total liabilities | 2,485,344 |
Net assets | $458,244,544 |
Composition of Net Assets | |
Shares of beneficial interest outstanding (par value of $.001 per share) unlimited number of shares authorized | $39,932 |
Additional paid-in-capital | 447,269,819 |
447,309,751 | |
Total distributable earnings (loss) | 10,934,793 |
Net assets | $458,244,544 |
Class A | |
Net assets applicable to outstanding shares | $380,103,422 |
Shares of beneficial interest outstanding | 33,083,106 |
Net asset value per share outstanding | $11.49 |
Maximum sales charge (3.00% of offering price) | 0.36 |
Maximum offering price per share outstanding | $11.85 |
Investor Class | |
Net assets applicable to outstanding shares | $35,975,603 |
Shares of beneficial interest outstanding | 3,132,319 |
Net asset value per share outstanding | $11.49 |
Maximum sales charge (2.50% of offering price) | 0.29 |
Maximum offering price per share outstanding | $11.78 |
Class B | |
Net assets applicable to outstanding shares | $7,879,340 |
Shares of beneficial interest outstanding | 698,858 |
Net asset value and offering price per share outstanding | $11.27 |
Class C | |
Net assets applicable to outstanding shares | $23,497,646 |
Shares of beneficial interest outstanding | 2,084,653 |
Net asset value and offering price per share outstanding | $11.27 |
Class I | |
Net assets applicable to outstanding shares | $7,433,824 |
Shares of beneficial interest outstanding | 639,526 |
Net asset value and offering price per share outstanding | $11.62 |
Class R2 | |
Net assets applicable to outstanding shares | $138,043 |
Shares of beneficial interest outstanding | 12,019 |
Net asset value and offering price per share outstanding | $11.49 |
Class R3 | |
Net assets applicable to outstanding shares | $2,261,573 |
Shares of beneficial interest outstanding | 197,809 |
Net asset value and offering price per share outstanding | $11.43 |
SIMPLE Class | |
Net assets applicable to outstanding shares | $955,093 |
Shares of beneficial interest outstanding | 83,313 |
Net asset value and offering price per share outstanding | $11.46 |
Investment Income (Loss) | |
Income | |
Dividend distributions from affiliated investment companies | $5,599,599 |
Expenses | |
Distribution/Service—Class A (See Note 3) | 506,848 |
Distribution/Service—Investor Class (See Note 3) | 48,765 |
Distribution/Service—Class B (See Note 3) | 48,760 |
Distribution/Service—Class C (See Note 3) | 134,595 |
Distribution/Service—Class R2 (See Note 3) | 176 |
Distribution/Service—Class R3 (See Note 3) | 4,556 |
Distribution/Service—SIMPLE Class (See Note 3) | 1,496 |
Transfer agent (See Note 3) | 217,772 |
Registration | 53,546 |
Professional fees | 26,130 |
Shareholder communication | 16,811 |
Custodian | 16,688 |
Trustees | 5,221 |
Shareholder service (See Note 3) | 981 |
Miscellaneous | 11,092 |
Total expenses before waiver/reimbursement | 1,093,437 |
Expense waiver/reimbursement from Manager (See Note 3) | (21,876) |
Net expenses | 1,071,561 |
Net investment income (loss) | 4,528,038 |
Realized and Unrealized Gain (Loss) | |
Net realized gain (loss) on: | |
Affiliated investment company transactions | (4,683,553) |
Realized capital gain distributions from affiliated investment companies | 23,046,741 |
Swap transactions | (483,751) |
Net realized gain (loss) | 17,879,437 |
Net change in unrealized appreciation (depreciation) on: Affiliated investments companies | (67,436,140) |
Net realized and unrealized gain (loss) | (49,556,703) |
Net increase (decrease) in net assets resulting from operations | $(45,028,665) |
16 | MainStay Conservative Allocation Fund |
for the six months ended April 30, 2022 (Unaudited) and the year ended October 31, 2021
2022 | 2021 | |
Increase (Decrease) in Net Assets | ||
Operations: | ||
Net investment income (loss) | $4,528,038 | $7,796,752 |
Net realized gain (loss) | 17,879,437 | 26,317,771 |
Net change in unrealized appreciation (depreciation) | (67,436,140) | 35,512,215 |
Net increase (decrease) in net assets resulting from operations | (45,028,665) | 69,626,738 |
Distributions to shareholders: | ||
Class A | (29,295,135) | (16,481,132) |
Investor Class | (2,743,604) | (1,733,066) |
Class B | (702,769) | (498,090) |
Class C | (1,862,412) | (1,405,781) |
Class I | (605,589) | (385,287) |
Class R2 | (9,989) | (4,957) |
Class R3 | (126,941) | (54,586) |
SIMPLE Class | (34,627) | (3,866) |
Total distributions to shareholders | (35,381,066) | (20,566,765) |
Capital share transactions: | ||
Net proceeds from sales of shares | 32,919,408 | 59,958,845 |
Net asset value of shares issued to shareholders in reinvestment of distributions | 34,971,439 | 20,354,709 |
Cost of shares redeemed | (42,504,282) | (72,335,582) |
Increase (decrease) in net assets derived from capital share transactions | 25,386,565 | 7,977,972 |
Net increase (decrease) in net assets | (55,023,166) | 57,037,945 |
Net Assets | ||
Beginning of period | 513,267,710 | 456,229,765 |
End of period | $458,244,544 | $513,267,710 |
Six months ended April 30, 2022* | Year Ended October 31, | |||||
Class A | 2021 | 2020 | 2019 | 2018 | 2017 | |
Net asset value at beginning of period | $13.53 | $12.23 | $11.96 | $11.69 | $12.51 | $11.60 |
Net investment income (loss) (a) | 0.12 | 0.22 | 0.25 | 0.24 | 0.22 | 0.22 |
Net realized and unrealized gain (loss) | (1.22) | 1.64 | 0.33 | 0.69 | (0.55) | 0.95 |
Total from investment operations | (1.10) | 1.86 | 0.58 | 0.93 | (0.33) | 1.17 |
Less distributions: | ||||||
From net investment income | (0.36) | (0.19) | (0.26) | (0.28) | (0.25) | (0.23) |
From net realized gain on investments | (0.58) | (0.37) | (0.05) | (0.38) | (0.24) | (0.03) |
Total distributions | (0.94) | (0.56) | (0.31) | (0.66) | (0.49) | (0.26) |
Net asset value at end of period | $11.49 | $13.53 | $12.23 | $11.96 | $11.69 | $12.51 |
Total investment return (b) | (8.79)% | 15.51% | 5.00% | 8.54% | (2.73)% | 10.36% |
Ratios (to average net assets)/Supplemental Data: | ||||||
Net investment income (loss) | 1.92%†† | 1.67% | 2.10% | 2.11% | 1.77% | 1.83% |
Net expenses (c) | 0.35%†† | 0.37% | 0.37% | 0.38% | 0.36% | 0.36% |
Portfolio turnover rate | 18% | 25% | 70% | 46% | 59% | 36% |
Net assets at end of period (in 000’s) | $380,103 | $419,554 | $355,167 | $334,242 | $299,016 | $314,722 |
* | Unaudited. |
†† | Annualized. |
(a) | Per share data based on average shares outstanding during the period. |
(b) | Total investment return is calculated exclusive of sales charges and assumes the reinvestment of dividends and distributions. For periods of less than one year, total return is not annualized. |
(c) | In addition to the fees and expenses which the Fund bears directly, it also indirectly bears a pro-rata share of the fees and expenses of the underlying funds in which it invests. Such indirect expenses are not included in the above expense ratios. |
Six months ended April 30, 2022* | Year Ended October 31, | |||||
Investor Class | 2021 | 2020 | 2019 | 2018 | 2017 | |
Net asset value at beginning of period | $13.53 | $12.23 | $11.97 | $11.69 | $12.51 | $11.59 |
Net investment income (loss) (a) | 0.11 | 0.20 | 0.23 | 0.22 | 0.20 | 0.20 |
Net realized and unrealized gain (loss) | (1.23) | 1.64 | 0.33 | 0.70 | (0.54) | 0.96 |
Total from investment operations | (1.12) | 1.84 | 0.56 | 0.92 | (0.34) | 1.16 |
Less distributions: | ||||||
From net investment income | (0.34) | (0.17) | (0.25) | (0.26) | (0.24) | (0.21) |
From net realized gain on investments | (0.58) | (0.37) | (0.05) | (0.38) | (0.24) | (0.03) |
Total distributions | (0.92) | (0.54) | (0.30) | (0.64) | (0.48) | (0.24) |
Net asset value at end of period | $11.49 | $13.53 | $12.23 | $11.97 | $11.69 | $12.51 |
Total investment return (b) | (8.88)% | 15.33% | 4.80% | 8.43% | (2.88)% | 10.18% |
Ratios (to average net assets)/Supplemental Data: | ||||||
Net investment income (loss) | 1.73%†† | 1.49% | 1.93% | 1.92% | 1.60% | 1.63% |
Net expenses (c) | 0.55%†† | 0.55% | 0.55% | 0.55% | 0.51% | 0.51% |
Expenses (before waiver/reimbursement) (c) | 0.61%†† | 0.64% | 0.61% | 0.59% | 0.54% | 0.51% |
Portfolio turnover rate | 18% | 25% | 70% | 46% | 59% | 36% |
Net assets at end of period (in 000's) | $35,976 | $41,154 | $41,762 | $44,934 | $37,828 | $37,533 |
* | Unaudited. |
†† | Annualized. |
(a) | Per share data based on average shares outstanding during the period. |
(b) | Total investment return is calculated exclusive of sales charges and assumes the reinvestment of dividends and distributions. For periods of less than one year, total return is not annualized. |
(c) | In addition to the fees and expenses which the Fund bears directly, it also indirectly bears a pro-rata share of the fees and expenses of the underlying funds in which it invests. Such indirect expenses are not included in the above expense ratios. |
18 | MainStay Conservative Allocation Fund |
Six months ended April 30, 2022* | Year Ended October 31, | |||||
Class B | 2021 | 2020 | 2019 | 2018 | 2017 | |
Net asset value at beginning of period | $13.30 | $12.07 | $11.84 | $11.64 | $12.46 | $11.55 |
Net investment income (loss) (a) | 0.06 | 0.09 | 0.15 | 0.14 | 0.11 | 0.11 |
Net realized and unrealized gain (loss) | (1.21) | 1.63 | 0.31 | 0.69 | (0.55) | 0.95 |
Total from investment operations | (1.15) | 1.72 | 0.46 | 0.83 | (0.44) | 1.06 |
Less distributions: | ||||||
From net investment income | (0.30) | (0.12) | (0.18) | (0.25) | (0.14) | (0.12) |
From net realized gain on investments | (0.58) | (0.37) | (0.05) | (0.38) | (0.24) | (0.03) |
Total distributions | (0.88) | (0.49) | (0.23) | (0.63) | (0.38) | (0.15) |
Net asset value at end of period | $11.27 | $13.30 | $12.07 | $11.84 | $11.64 | $12.46 |
Total investment return (b) | (9.32)% | 14.49% | 3.99% | 7.61% | (3.63)% | 9.30% |
Ratios (to average net assets)/Supplemental Data: | ||||||
Net investment income (loss) | 1.00%†† | 0.72% | 1.23% | 1.22% | 0.89% | 0.95% |
Net expenses (c) | 1.30%†† | 1.30% | 1.30% | 1.30% | 1.26% | 1.27% |
Expenses (before waiver/reimbursement) (c) | 1.36%†† | 1.39% | 1.36% | 1.34% | 1.29% | 1.27% |
Portfolio turnover rate | 18% | 25% | 70% | 46% | 59% | 36% |
Net assets at end of period (in 000’s) | $7,879 | $11,550 | $13,236 | $17,273 | $21,988 | $29,807 |
* | Unaudited. |
†† | Annualized. |
(a) | Per share data based on average shares outstanding during the period. |
(b) | Total investment return is calculated exclusive of sales charges and assumes the reinvestment of dividends and distributions. For periods of less than one year, total return is not annualized. |
(c) | In addition to the fees and expenses which the Fund bears directly, it also indirectly bears a pro-rata share of the fees and expenses of the underlying funds in which it invests. Such indirect expenses are not included in the above expense ratios. |
Six months ended April 30, 2022* | Year Ended October 31, | |||||
Class C | 2021 | 2020 | 2019 | 2018 | 2017 | |
Net asset value at beginning of period | $13.29 | $12.07 | $11.84 | $11.64 | $12.45 | $11.54 |
Net investment income (loss) (a) | 0.06 | 0.09 | 0.14 | 0.14 | 0.11 | 0.11 |
Net realized and unrealized gain (loss) | (1.20) | 1.62 | 0.32 | 0.69 | (0.54) | 0.95 |
Total from investment operations | (1.14) | 1.71 | 0.46 | 0.83 | (0.43) | 1.06 |
Less distributions: | ||||||
From net investment income | (0.30) | (0.12) | (0.18) | (0.25) | (0.14) | (0.12) |
From net realized gain on investments | (0.58) | (0.37) | (0.05) | (0.38) | (0.24) | (0.03) |
Total distributions | (0.88) | (0.49) | (0.23) | (0.63) | (0.38) | (0.15) |
Net asset value at end of period | $11.27 | $13.29 | $12.07 | $11.84 | $11.64 | $12.45 |
Total investment return (b) | (9.24)% | 14.41% | 3.99% | 7.61% | (3.56)% | 9.31% |
Ratios (to average net assets)/Supplemental Data: | ||||||
Net investment income (loss) | 0.98%†† | 0.73% | 1.21% | 1.24% | 0.89% | 0.93% |
Net expenses (c) | 1.30%†† | 1.30% | 1.30% | 1.30% | 1.26% | 1.27% |
Expenses (before waiver/reimbursement) (c) | 1.36%†† | 1.39% | 1.36% | 1.34% | 1.29% | 1.27% |
Portfolio turnover rate | 18% | 25% | 70% | 46% | 59% | 36% |
Net assets at end of period (in 000’s) | $23,498 | $29,825 | $36,802 | $44,222 | $57,482 | $74,457 |
* | Unaudited. |
†† | Annualized. |
(a) | Per share data based on average shares outstanding during the period. |
(b) | Total investment return is calculated exclusive of sales charges and assumes the reinvestment of dividends and distributions. For periods of less than one year, total return is not annualized. |
(c) | In addition to the fees and expenses which the Fund bears directly, it also indirectly bears a pro-rata share of the fees and expenses of the underlying funds in which it invests. Such indirect expenses are not included in the above expense ratios. |
Six months ended April 30, 2022* | Year Ended October 31, | |||||
Class I | 2021 | 2020 | 2019 | 2018 | 2017 | |
Net asset value at beginning of period | $13.68 | $12.36 | $12.08 | $11.80 | $12.61 | $11.69 |
Net investment income (loss) (a) | 0.14 | 0.25 | 0.29 | 0.28 | 0.26 | 0.25 |
Net realized and unrealized gain (loss) | (1.25) | 1.66 | 0.33 | 0.69 | (0.54) | 0.96 |
Total from investment operations | (1.11) | 1.91 | 0.62 | 0.97 | (0.28) | 1.21 |
Less distributions: | ||||||
From net investment income | (0.37) | (0.22) | (0.29) | (0.31) | (0.29) | (0.26) |
From net realized gain on investments | (0.58) | (0.37) | (0.05) | (0.38) | (0.24) | (0.03) |
Total distributions | (0.95) | (0.59) | (0.34) | (0.69) | (0.53) | (0.29) |
Net asset value at end of period | $11.62 | $13.68 | $12.36 | $12.08 | $11.80 | $12.61 |
Total investment return (b) | (8.73)% | 15.79% | 5.30% | 8.91% | (2.38)%(c) | 10.54% |
Ratios (to average net assets)/Supplemental Data: | ||||||
Net investment income (loss) | 2.17%†† | 1.91% | 2.40% | 2.38% | 2.12% | 2.05% |
Net expenses (d) | 0.10%†† | 0.12% | 0.12% | 0.13% | 0.11% | 0.12% |
Portfolio turnover rate | 18% | 25% | 70% | 46% | 59% | 36% |
Net assets at end of period (in 000’s) | $7,434 | $8,909 | $7,878 | $9,272 | $8,036 | $12,532 |
* | Unaudited. |
†† | Annualized. |
(a) | Per share data based on average shares outstanding during the period. |
(b) | Total investment return is calculated exclusive of sales charges and assumes the reinvestment of dividends and distributions. Class I shares are not subject to sales charges. For periods of less than one year, total return is not annualized. |
(c) | Total investment return may reflect adjustments to conform to generally accepted accounting principles. |
(d) | In addition to the fees and expenses which the Fund bears directly, it also indirectly bears a pro-rata share of the fees and expenses of the underlying funds in which it invests. Such indirect expenses are not included in the above expense ratios. |
Six months ended April 30, 2022* | Year Ended October 31, | June 14, 2019^ through October 31, 2019 | ||
Class R2 | 2021 | 2020 | ||
Net asset value at beginning of period | $13.53 | $12.23 | $11.96 | $11.61 |
Net investment income (loss) (a) | 0.11 | 0.21 | 0.24 | 0.08 |
Net realized and unrealized gain (loss) | (1.22) | 1.64 | 0.34 | 0.32 |
Total from investment operations | (1.11) | 1.85 | 0.58 | 0.40 |
Less distributions: | ||||
From net investment income | (0.35) | (0.18) | (0.26) | (0.05) |
From net realized gain on investments | (0.58) | (0.37) | (0.05) | — |
Total distributions | (0.93) | (0.55) | (0.31) | (0.05) |
Net asset value at end of period | $11.49 | $13.53 | $12.23 | $11.96 |
Total investment return (b) | (8.84)% | 15.40% | 4.93% | 3.44% |
Ratios (to average net assets)/Supplemental Data: | ||||
Net investment income (loss) | 1.82%†† | 1.56% | 2.00% | 1.83%†† |
Net expenses (c) | 0.45%†† | 0.47% | 0.47% | 0.49%†† |
Portfolio turnover rate | 18% | 25% | 70% | 46% |
Net assets at end of period (in 000’s) | $138 | $141 | $109 | $100 |
* | Unaudited. |
^ | Inception date. |
†† | Annualized. |
(a) | Per share data based on average shares outstanding during the period. |
(b) | Total investment return is calculated exclusive of sales charges and assumes the reinvestment of dividends and distributions. Class R2 shares are not subject to sales charges. For periods of less than one year, total return is not annualized. |
(c) | In addition to the fees and expenses which the Fund bears directly, it also indirectly bears a pro-rata share of the fees and expenses of the underlying funds in which it invests. Such indirect expenses are not included in the above expense ratios. |
20 | MainStay Conservative Allocation Fund |
Six months ended April 30, 2022* | Year Ended October 31, | |||||
Class R3 | 2021 | 2020 | 2019 | 2018 | 2017 | |
Net asset value at beginning of period | $13.47 | $12.19 | $11.94 | $11.67 | $12.50 | $11.58 |
Net investment income (loss) (a) | 0.10 | 0.17 | 0.20 | 0.19 | 0.15 | 0.18 |
Net realized and unrealized gain (loss) | (1.23) | 1.64 | 0.34 | 0.70 | (0.52) | 0.96 |
Total from investment operations | (1.13) | 1.81 | 0.54 | 0.89 | (0.37) | 1.14 |
Less distributions: | ||||||
From net investment income | (0.33) | (0.16) | (0.24) | (0.24) | (0.22) | (0.19) |
From net realized gain on investments | (0.58) | (0.37) | (0.05) | (0.38) | (0.24) | (0.03) |
Total distributions | (0.91) | (0.53) | (0.29) | (0.62) | (0.46) | (0.22) |
Net asset value at end of period | $11.43 | $13.47 | $12.19 | $11.94 | $11.67 | $12.50 |
Total investment return (b) | (9.00)% | 15.12% | 4.59% | 8.20% | (3.06)% | 9.98% |
Ratios (to average net assets)/Supplemental Data: | ||||||
Net investment income (loss) | 1.62%†† | 1.32% | 1.66% | 1.68% | 1.25% | 1.46% |
Net expenses (c) | 0.70%†† | 0.72% | 0.73% | 0.73% | 0.71% | 0.71% |
Portfolio turnover rate | 18% | 25% | 70% | 46% | 59% | 36% |
Net assets at end of period (in 000’s) | $2,262 | $1,831 | $1,249 | $739 | $442 | $62 |
* | Unaudited. |
†† | Annualized. |
(a) | Per share data based on average shares outstanding during the period. |
(b) | Total investment return is calculated exclusive of sales charges and assumes the reinvestment of dividends and distributions. Class R3 shares are not subject to sales charges. For periods of less than one year, total return is not annualized. |
(c) | In addition to the fees and expenses which the Fund bears directly, it also indirectly bears a pro-rata share of the fees and expenses of the underlying funds in which it invests. Such indirect expenses are not included in the above expense ratios. |
Six months ended April 30, 2022* | Year Ended October 31, | August 31, 2020^ through October 31, | |
SIMPLE Class | 2021 | 2020 | |
Net asset value at beginning of period | $13.50 | $12.23 | $12.58** |
Net investment income (loss) (a) | 0.09 | 0.17 | 0.03 |
Net realized and unrealized gain (loss) | (1.22) | 1.63 | (0.38) |
Total from investment operations | (1.13) | 1.80 | (0.35) |
Less distributions: | |||
From net investment income | (0.33) | (0.16) | — |
From net realized gain on investments | (0.58) | (0.37) | — |
Total distributions | (0.91) | (0.53) | — |
Net asset value at end of period | $11.46 | $13.50 | $12.23 |
Total investment return (b) | (9.02)% | 14.98% | (2.78)% |
Ratios (to average net assets)/Supplemental Data: | |||
Net investment income (loss) | 1.45%†† | 1.27% | 1.25%†† |
Net expenses (c) | 0.80%†† | 0.80% | 0.80%†† |
Expenses (before waiver/reimbursement) (c) | 0.85%†† | 0.89% | 0.88%†† |
Portfolio turnover rate | 18% | 25% | 70% |
Net assets at end of period (in 000’s) | $955 | $304 | $27 |
* | Unaudited. |
^ | Inception date. |
** | Based on the net asset value of Investor Class as of August 31, 2020. |
†† | Annualized. |
(a) | Per share data based on average shares outstanding during the period. |
(b) | Total investment return is calculated exclusive of sales charges and assumes the reinvestment of dividends and distributions. SIMPLE Class shares are not subject to sales charges. For periods of less than one year, total return is not annualized. |
(c) | In addition to the fees and expenses which the Fund bears directly, it also indirectly bears a pro-rata share of the fees and expenses of the underlying funds in which it invests. Such indirect expenses are not included in the above expense ratios. |
22 | MainStay Conservative Allocation Fund |
Investment and Performance Comparison (Unaudited)

Average Annual Total Returns for the Period-Ended April 30, 2022 | ||||||||
Class | Sales Charge | Inception Date | Six Months1 | One Year | Five Years | Ten Years or Since Inception | Gross Expense Ratio2 | |
Class A Shares3 | Maximum 3% Initial Sales Charge | With sales charges | 4/4/2005 | -12.42% | -8.44% | 4.50% | 5.98% | 0.88% |
Excluding sales charges | -9.71 | -5.61 | 5.69 | 6.58 | 0.88 | |||
Investor Class Shares3, 4 | Maximum 2.5% Initial Sales Charge | With sales charges | 2/28/2008 | -12.02 | -8.15 | 4.31 | 5.79 | 1.20 |
Excluding sales charges | -9.77 | -5.80 | 5.49 | 6.39 | 1.20 | |||
Class B Shares5 | Maximum 5% CDSC | With sales charges | 4/4/2005 | -14.27 | -10.80 | 4.37 | 5.60 | 1.95 |
if Redeemed Within the First Six Years of Purchase | Excluding sales charges | -10.13 | -6.50 | 4.69 | 5.60 | 1.95 | ||
Class C Shares | Maximum 1% CDSC | With sales charges | 4/4/2005 | -10.96 | -7.35 | 4.71 | 5.60 | 1.95 |
if Redeemed Within One Year of Purchase | Excluding sales charges | -10.13 | -6.49 | 4.71 | 5.60 | 1.95 | ||
Class I Shares | No Sales Charge | 4/4/2005 | -9.54 | -5.34 | 5.96 | 6.85 | 0.63 | |
Class R2 Shares | No Sales Charge | 6/14/2019 | -9.68 | -5.64 | N/A | 6.87 | 0.98 | |
Class R3 Shares | No Sales Charge | 2/29/2016 | -9.87 | -5.95 | 5.34 | 7.03 | 1.23 | |
SIMPLE Class Shares | No Sales Charge | 8/31/2020 | -9.88 | -6.03 | N/A | 3.74 | 1.45 | |
1. | Not annualized. |
2. | The gross expense ratios presented reflect the Fund’s “Total Annual Fund Operating Expenses” from the most recent Prospectus, as supplemented, and may differ from other expense ratios disclosed in this report. |
3. | Prior to July 22, 2019, the maximum initial sales charge was 5.5%, which is reflected in the applicable average annual total return figures shown. |
4. | Prior to June 30, 2020, the maximum initial sales charge was 3%, which is reflected in the applicable average annual total return figures shown. |
5. | Class B shares are closed to all new purchases as well as additional investments by existing Class B shareholders. |
Benchmark Performance* | Six Months1 | One Year | Five Years | Ten Years |
S&P 500® Index2 | -9.65% | 0.21% | 13.66% | 13.67% |
MSCI EAFE® Index (Net)3 | -11.80 | -8.15 | 4.77 | 5.77 |
Bloomberg U.S. Aggregate Bond Index4 | -9.47 | -8.51 | 1.20 | 1.73 |
Moderate Allocation Composite Index5 | -9.78 | -4.42 | 7.54 | 7.86 |
Morningstar Allocation-50% to 70% Equity Category Average6 | -8.84 | -4.42 | 6.71 | 6.88 |
* | Returns for indices reflect no deductions for fees, expenses or taxes, except for foreign withholding taxes where applicable. |
1. | Not annualized. |
2. | The S&P 500® Index is the Fund's primary benchmark. S&P 500® is a trademark of The McGraw-Hill Companies, Inc. The S&P 500® Index is widely regarded as the standard index for measuring large-cap U.S. stock market performance. Results assume reinvestment of all dividends and capital gains. An investment cannot be made directly in an index. |
3. | The MSCI EAFE® Index (Net) is the Fund's secondary benchmark. The MSCI EAFE® Index (Net) consists of international stocks representing the developed world outside of North America. Results assume reinvestment of all dividends and capital gains. An investment cannot be made directly in an index. |
4. | The Fund has selected the Bloomberg U.S. Aggregate Bond Index as an additional benchmark. The Bloomberg U.S. Aggregate Bond Index is a broad-based benchmark that measures the performance of the investment grade, U.S. dollar-denominated, fixed-rate taxable bond market, including Treasurys, government-related and corporate securities, mortgage-backed securities (agency fixed-rate and hybrid adjustable rate mortgage pass-throughs), asset-backed securities, and commercial mortgage-backed securities. Results assume reinvestment of all dividends and capital gains. An investment cannot be made directly in an index. |
5. | The Fund has selected the Moderate Allocation Composite Index as an additional benchmark. The Moderate Allocation Composite Index consists of the S&P 500® Index, the MSCI EAFE® Index (Net) and the Bloomberg U.S. Aggregate Bond Index weighted 45%, 15% and 40%, respectively. Results assume reinvestment of all dividends and capital gains. An investment cannot be made directly in an index. |
6. | The Morningstar Allocation – 50% to 70% Equity Category Average is representative of funds that seek to provide both income and capital appreciation by investing in multiple asset classes, including stocks, bonds, and cash. These portfolios are dominated by domestic holdings and have equity exposures between 50% and 70%. Results are based on average total returns of similar funds with all dividends and capital gain distributions reinvested. |
24 | MainStay Moderate Allocation Fund |
Share Class | Beginning Account Value 11/1/21 | Ending Account Value (Based on Actual Returns and Expenses) 4/30/22 | Expenses Paid During Period1 | Ending Account Value (Based on Hypothetical 5% Annualized Return and Actual Expenses) 4/30/22 | Expenses Paid During Period1 | Net Expense Ratio During Period2 |
Class A Shares | $1,000.00 | $902.90 | $1.60 | $1,023.11 | $1.71 | 0.34% |
Investor Class Shares | $1,000.00 | $902.30 | $2.59 | $1,022.07 | $2.76 | 0.55% |
Class B Shares | $1,000.00 | $898.70 | $6.12 | $1,018.35 | $6.51 | 1.30% |
Class C Shares | $1,000.00 | $898.70 | $6.12 | $1,018.35 | $6.51 | 1.30% |
Class I Shares | $1,000.00 | $904.60 | $0.43 | $1,024.35 | $0.45 | 0.09% |
Class R2 Shares | $1,000.00 | $903.20 | $2.08 | $1,022.61 | $2.21 | 0.44% |
Class R3 Shares | $1,000.00 | $901.30 | $3.25 | $1,021.37 | $3.46 | 0.69% |
SIMPLE Class Shares | $1,000.00 | $901.20 | $3.77 | $1,020.83 | $4.01 | 0.80% |
1. | Expenses are equal to the Fund’s annualized expense ratio of each class multiplied by the average account value over the period, divided by 365 and multiplied by 181 (to reflect the six-month period). The table above represents the actual expenses incurred during the six-month period. In addition to the fees and expenses which the Fund bears directly, it also indirectly bears a pro rata share of the fees and expenses of the underlying funds in which it invests. Such indirect expenses are not included in the above-reported expense figures. |
2. | Expenses are equal to the Fund's annualized expense ratio to reflect the six-month period. |
Asset Diversification as of April 30, 2022 (Unaudited)
Equity Funds | 54.8% |
Fixed Income Funds | 35.1 |
Short-Term Investment | 10.2 |
Other Assets, Less Liabilities | (0.1) |
26 | MainStay Moderate Allocation Fund |
28 | MainStay Moderate Allocation Fund |
Shares | Value | |
Affiliated Investment Companies 89.9% | ||
Equity Funds 54.8% | ||
IQ 50 Percent Hedged FTSE International ETF (a) | 723,678 | $ 16,354,761 |
IQ 500 International ETF (a) | 675,970 | 20,090,504 |
IQ Candriam ESG International Equity ETF (a) | 765,849 | 19,766,409 |
IQ Candriam ESG U.S. Equity ETF (a) | 1,275,086 | 45,316,174 |
IQ Chaikin U.S. Large Cap ETF (a) | 1,085,108 | 34,955,452 |
IQ Chaikin U.S. Small Cap ETF (a) | 465,982 | 14,816,923 |
MainStay Candriam Emerging Markets Equity Fund Class R6 (a) | 1,870,614 | 19,346,453 |
MainStay Epoch Capital Growth Fund Class I (a) | 251,706 | 2,751,372 |
MainStay Epoch International Choice Fund Class I (a) | 423,862 | 14,451,056 |
MainStay Epoch U.S. Equity Yield Fund Class R6 (a) | 1,926,016 | 37,906,496 |
MainStay MacKay International Equity Fund Class R6 (a) | 852,576 | 13,878,236 |
MainStay S&P 500 Index Fund Class I | 223,363 | 11,733,149 |
MainStay Winslow Large Cap Growth Fund Class R6 | 4,260,280 | 44,196,573 |
MainStay WMC Enduring Capital Fund Class R6 (a) | 1,115,301 | 34,608,563 |
MainStay WMC Growth Fund Class R6 (a) | 1,237,298 | 43,602,261 |
MainStay WMC International Research Equity Fund Class I (a) | 2,091,635 | 14,190,699 |
MainStay WMC Small Companies Fund Class I (a) | 733,651 | 17,311,513 |
MainStay WMC Value Fund Class R6 (a) | 1,191,612 | 36,089,266 |
Total Equity Funds (Cost $395,516,378) | 441,365,860 | |
Shares | Value | |
Fixed Income Funds 35.1% | ||
IQ MacKay ESG Core Plus Bond ETF (a) | 2,348,138 | $ 52,551,563 |
MainStay Floating Rate Fund Class R6 (a) | 4,698,056 | 42,123,708 |
MainStay MacKay High Yield Corporate Bond Fund Class R6 | 6,409,011 | 33,237,133 |
MainStay MacKay Short Duration High Yield Fund Class I | 4,005,510 | 37,867,288 |
MainStay MacKay Total Return Bond Fund Class R6 (a) | 12,188,181 | 116,550,704 |
Total Fixed Income Funds (Cost $301,582,603) | 282,330,396 | |
Total Affiliated Investment Companies (Cost $697,098,981) | 723,696,256 | |
Short-Term Investment 10.2% | ||
Affiliated Investment Company 10.2% | ||
MainStay U.S. Government Liquidity Fund, 0.397% (a)(b) | 81,768,909 | 81,768,909 |
Total Short-Term Investment (Cost $81,768,909) | 10.2% | 81,768,909 |
Total Investments (Cost $778,867,890) | 100.1% | 805,465,165 |
Other Assets, Less Liabilities | (0.1) | (862,545) |
Net Assets | 100.0% | $ 804,602,620 |
† | Percentages indicated are based on Fund net assets. |
(a) | As of April 30, 2022, the Fund's ownership exceeds 5% of the outstanding shares of the Underlying Fund's share class. |
(b) | Current yield as of April 30, 2022. |
30 | MainStay Moderate Allocation Fund |
Affiliated Investment Companies | Value, Beginning of Period | Purchases at Cost | Proceeds from Sales | Net Realized Gain/(Loss) on Sales | Change in Unrealized Appreciation/ (Depreciation) | Value, End of Period | Dividend Income | Other Distributions | Shares End of Period |
IQ 50 Percent Hedged FTSE International ETF | $ 17,601 | $ 857 | $ (426) | $ (26) | $ (1,651) | $ 16,355 | $ 202 | $ — | 724 |
IQ 500 International ETF | 23,168 | 856 | (1,687) | 20 | (2,266) | 20,091 | 381 | — | 676 |
IQ Candriam ESG International Equity ETF | 22,592 | 1,088 | (633) | (23) | (3,258) | 19,766 | 253 | — | 766 |
IQ Candriam ESG U.S. Equity ETF | 56,419 | 1,121 | (6,518) | 387 | (6,093) | 45,316 | 315 | — | 1,275 |
IQ Chaikin U.S. Large Cap ETF | 36,057 | 2,539 | (608) | (22) | (3,011) | 34,955 | 233 | — | 1,085 |
IQ Chaikin U.S. Small Cap ETF | 25,705 | 659 | (9,349) | 2,707 | (4,905) | 14,817 | 129 | — | 466 |
IQ MacKay ESG Core Plus Bond ETF | — | 54,563 | — | — | (2,011) | 52,552 | 71 | — | 2,348 |
MainStay Candriam Emerging Markets Equity Fund Class R6 | 21,671 | 2,291 | (221) | (27) | (4,368) | 19,346 | 193 | — | 1,871 |
MainStay Epoch Capital Growth Fund Class I | 3,284 | 842 | (77) | (4) | (1,294) | 2,751 | 4 | 732 | 252 |
MainStay Epoch International Choice Fund Class I | 15,971 | 1,617 | (226) | (19) | (2,892) | 14,451 | 408 | — | 424 |
MainStay Epoch U.S. Equity Yield Fund Class R6 | 37,443 | 2,500 | (1,591) | 9 | (455) | 37,906 | 378 | — | 1,926 |
MainStay Floating Rate Fund Class R6 | 44,123 | 1,212 | (2,418) | (31) | (762) | 42,124 | 674 | — | 4,698 |
MainStay MacKay High Yield Corporate Bond Fund Class R6 | 35,227 | 2,040 | (1,311) | (71) | (2,648) | 33,237 | 914 | — | 6,409 |
MainStay MacKay International Equity Fund Class R6 | 15,438 | 4,445 | (437) | (166) | (5,402) | 13,878 | 59 | 1,909 | 853 |
MainStay MacKay Short Duration High Yield Fund Class I | 22,064 | 18,824 | (1,582) | (39) | (1,400) | 37,867 | 646 | — | 4,006 |
MainStay MacKay Total Return Bond Fund Class R6 | 202,770 | 8,560 | (69,017) | (5,823) | (19,939) | 116,551 | 2,492 | 6,068 | 12,188 |
MainStay S&P 500 Index Fund Class I (a) | 21,605 | 1,003 | (8,811) | 3,171 | (5,235) | 11,733 | 234 | 744 | 223 |
MainStay Short Term Bond Fund Class I | 4,399 | 3 | (4,365) | (85) | 48 | — | 8 | 11 | — |
MainStay U.S. Government Liquidity Fund | 77,521 | 96,180 | (91,932) | — | — | 81,769 | 13 | — | 81,769 |
MainStay Winslow Large Cap Growth Fund Class R6 | 52,905 | 15,433 | (915) | (141) | (23,085) | 44,197 | — | 9,785 | 4,260 |
MainStay WMC Enduring Capital Fund Class R6 | 36,462 | 5,380 | (998) | (50) | (6,185) | 34,609 | 121 | 2,987 | 1,115 |
MainStay WMC Growth Fund Class R6 | 43,355 | 22,179 | (674) | (346) | (20,912) | 43,602 | — | 8,655 | 1,237 |
MainStay WMC International Research Equity Fund Class I | 15,814 | 1,524 | (301) | (29) | (2,817) | 14,191 | 417 | — | 2,092 |
MainStay WMC Small Companies Fund Class I | 24,633 | 5,657 | (5,456) | (72) | (7,450) | 17,312 | — | 5,657 | 734 |
MainStay WMC Value Fund Class R6 | 35,940 | 18,191 | (1,043) | (663) | (16,336) | 36,089 | 337 | 15,899 | 1,192 |
$892,167 | $269,564 | $(210,596) | $(1,343) | $(144,327) | $805,465 | $8,482 | $52,447 |
(a) | Prior to February 28, 2022, known as MainStay MacKay S&P 500 Index Fund Class I. |
Swap Counterparty | Reference Obligation | Floating Rate2 | Termination Date(s) | Payment Frequency Paid/ Received | Notional Amount Long/ (Short) (000)3 | Unrealized Appreciation/ (Depreciation)4 |
Citibank NA | Invesco S&P 500 Low Volatility ETF | 1 day FEDF plus 0.45% | 12/2/22 | Daily | 12,524 | $ — |
Citibank NA | iShares 20+ Year Treasury Bond ETF | 1 day FEDF plus 0.35% | 12/2/22 | Daily | 8,000 | — |
Citibank NA | iShares Semiconductor ETF | 1 day FEDF plus 0.35% | 12/2/22 | Daily | 2,398 | — |
Citibank NA | Russell 1000 Growth Total Return Index | 1 day FEDF minus 0.20% | 12/2/22 | Daily | (22,831) | — |
Citibank NA | Russell 1000 Value Total Return Index | 1 day FEDF | 12/2/22 | Daily | (3,944) | — |
Citibank NA | Russell Midcap Total Return Index | 1 day FEDF plus 0.40% | 12/2/22 | Daily | 14,974 | — |
Citibank NA | S&P 500 Health Care Sector | 1 day FEDF plus 0.45% | 12/2/22 | Daily | 4,038 | — |
Citibank NA | S&P 500 Total Return Index | 1 day FEDF plus 0.10% | 12/2/22 | Daily | (4,748) | — |
Citibank NA | S&P 600 Total Return | 1 day FEDF plus 0.40% | 12/2/22 | Daily | 44,003 | — |
Citibank NA | SPDR S&P Oil & Gas Exploration & Production ETF | 1 day FEDF plus 0.40% | 12/2/22 | Daily | 6,538 | — |
Swap Counterparty | Reference Obligation | Floating Rate2 | Termination Date(s) | Payment Frequency Paid/ Received | Notional Amount Long/ (Short) (000)3 | Unrealized Appreciation/ (Depreciation)4 |
Citibank NA | VanEck Gold Miners ETF | 1 day FEDF plus 0.55% | 12/2/22 | Daily | 9,779 | $ — |
Citibank NA | VanEck Oil Services ETF | 1 day FEDF plus 0.40% | 12/2/22 | Daily | 5,879 | — |
$ — |
1. | As of April 30, 2022, cash in the amount $1,920,413 was pledged from brokers for OTC swap contracts. |
2. | Fund pays the floating rate and receives the total return of the reference entity. |
3. | Notional amounts reflected as a positive value indicate a long position held by the Fund or Index and a negative value indicates a short position. |
4. | Reflects the value at reset date as of April 30, 2022. |
Abbreviation(s): |
ETF—Exchange-Traded Fund |
FEDF—Federal Funds Rate |
FTSE—Financial Times Stock Exchange |
SPDR—Standard & Poor’s Depositary Receipt |
Description | Quoted Prices in Active Markets for Identical Assets (Level 1) | Significant Other Observable Inputs (Level 2) | Significant Unobservable Inputs (Level 3) | Total |
Asset Valuation Inputs | ||||
Investments in Securities (a) | ||||
Affiliated Investment Companies | ||||
Equity Funds | $ 441,365,860 | $ — | $ — | $ 441,365,860 |
Fixed Income Funds | 282,330,396 | — | — | 282,330,396 |
Total Affiliated Investment Companies | 723,696,256 | — | — | 723,696,256 |
Short-Term Investment | ||||
Affiliated Investment Company | 81,768,909 | — | — | 81,768,909 |
Total Investments in Securities | $ 805,465,165 | $ — | $ — | $ 805,465,165 |
(a) | For a complete listing of investments, see the Portfolio of Investments. |
32 | MainStay Moderate Allocation Fund |
Assets | |
Investment in affiliated investment companies, at value (identified cost $778,867,890) | $805,465,165 |
Cash | 711,297 |
Cash collateral on deposit at broker for swap contracts | 1,920,413 |
Receivables: | |
Fund shares sold | 279,518 |
Dividends and interest | 119,617 |
Manager (See Note 3) | 2,356 |
Other assets | 91,028 |
Total assets | 808,589,394 |
Liabilities | |
Payables: | |
Dividends and interest on OTC swaps contracts | 3,110,684 |
Fund shares redeemed | 298,313 |
Transfer agent (See Note 3) | 247,898 |
NYLIFE Distributors (See Note 3) | 199,373 |
Shareholder communication | 98,890 |
Custodian | 14,509 |
Professional fees | 13,801 |
Trustees | 967 |
Accrued expenses | 2,339 |
Total liabilities | 3,986,774 |
Net assets | $804,602,620 |
Composition of Net Assets | |
Shares of beneficial interest outstanding (par value of $.001 per share) unlimited number of shares authorized | $62,414 |
Additional paid-in-capital | 744,856,659 |
744,919,073 | |
Total distributable earnings (loss) | 59,683,547 |
Net assets | $804,602,620 |
Class A | |
Net assets applicable to outstanding shares | $658,825,742 |
Shares of beneficial interest outstanding | 51,095,072 |
Net asset value per share outstanding | $12.89 |
Maximum sales charge (3.00% of offering price) | 0.40 |
Maximum offering price per share outstanding | $13.29 |
Investor Class | |
Net assets applicable to outstanding shares | $88,776,278 |
Shares of beneficial interest outstanding | 6,868,939 |
Net asset value per share outstanding | $12.92 |
Maximum sales charge (2.50% of offering price) | 0.33 |
Maximum offering price per share outstanding | $13.25 |
Class B | |
Net assets applicable to outstanding shares | $19,956,147 |
Shares of beneficial interest outstanding | 1,563,463 |
Net asset value and offering price per share outstanding | $12.76 |
Class C | |
Net assets applicable to outstanding shares | $23,611,122 |
Shares of beneficial interest outstanding | 1,850,417 |
Net asset value and offering price per share outstanding | $12.76 |
Class I | |
Net assets applicable to outstanding shares | $9,782,630 |
Shares of beneficial interest outstanding | 752,628 |
Net asset value and offering price per share outstanding | $13.00 |
Class R2 | |
Net assets applicable to outstanding shares | $163,145 |
Shares of beneficial interest outstanding | 12,658 |
Net asset value and offering price per share outstanding | $12.89 |
Class R3 | |
Net assets applicable to outstanding shares | $1,589,724 |
Shares of beneficial interest outstanding | 123,584 |
Net asset value and offering price per share outstanding | $12.86 |
SIMPLE Class | |
Net assets applicable to outstanding shares | $1,897,832 |
Shares of beneficial interest outstanding | 146,974 |
Net asset value and offering price per share outstanding | $12.91 |
Investment Income (Loss) | |
Income | |
Dividend distributions from affiliated investment companies | $8,482,363 |
Expenses | |
Distribution/Service—Class A (See Note 3) | 875,304 |
Distribution/Service—Investor Class (See Note 3) | 120,128 |
Distribution/Service—Class B (See Note 3) | 118,723 |
Distribution/Service—Class C (See Note 3) | 136,668 |
Distribution/Service—Class R2 (See Note 3) | 215 |
Distribution/Service—Class R3 (See Note 3) | 3,978 |
Distribution/Service—SIMPLE Class (See Note 3) | 3,526 |
Transfer agent (See Note 3) | 446,427 |
Registration | 54,021 |
Professional fees | 36,443 |
Shareholder communication | 32,747 |
Custodian | 18,055 |
Trustees | 8,942 |
Shareholder service (See Note 3) | 881 |
Miscellaneous | 16,644 |
Total expenses before waiver/reimbursement | 1,872,702 |
Expense waiver/reimbursement from Manager (See Note 3) | (73,160) |
Net expenses | 1,799,542 |
Net investment income (loss) | 6,682,821 |
Realized and Unrealized Gain (Loss) | |
Net realized gain (loss) on: | |
Affiliated investment company transactions | (1,343,456) |
Realized capital gain distributions from affiliated investment companies | 52,446,714 |
Swap transactions | (206,211) |
Net realized gain (loss) | 50,897,047 |
Net change in unrealized appreciation (depreciation) on: Affiliated investments companies | (144,326,754) |
Net realized and unrealized gain (loss) | (93,429,707) |
Net increase (decrease) in net assets resulting from operations | $(86,746,886) |
34 | MainStay Moderate Allocation Fund |
for the six months ended April 30, 2022 (Unaudited) and the year ended October 31, 2021
2022 | 2021 | |
Increase (Decrease) in Net Assets | ||
Operations: | ||
Net investment income (loss) | $6,682,821 | $10,446,065 |
Net realized gain (loss) | 50,897,047 | 61,005,396 |
Net change in unrealized appreciation (depreciation) | (144,326,754) | 98,856,644 |
Net increase (decrease) in net assets resulting from operations | (86,746,886) | 170,308,105 |
Distributions to shareholders: | ||
Class A | (64,025,940) | (34,271,649) |
Investor Class | (8,434,925) | (5,400,815) |
Class B | (1,976,049) | (1,464,688) |
Class C | (2,293,599) | (1,732,553) |
Class I | (1,040,013) | (525,585) |
Class R2 | (15,531) | (8,311) |
Class R3 | (139,179) | (53,511) |
SIMPLE Class | (100,733) | (5,676) |
Total distributions to shareholders | (78,025,969) | (43,462,788) |
Capital share transactions: | ||
Net proceeds from sales of shares | 51,937,770 | 85,932,952 |
Net asset value of shares issued to shareholders in reinvestment of distributions | 77,442,907 | 43,197,194 |
Cost of shares redeemed | (53,685,834) | (109,098,684) |
Increase (decrease) in net assets derived from capital share transactions | 75,694,843 | 20,031,462 |
Net increase (decrease) in net assets | (89,078,012) | 146,876,779 |
Net Assets | ||
Beginning of period | 893,680,632 | 746,803,853 |
End of period | $804,602,620 | $893,680,632 |
Six months ended April 30, 2022* | Year Ended October 31, | |||||
Class A | 2021 | 2020 | 2019 | 2018 | 2017 | |
Net asset value at beginning of period | $15.64 | $13.41 | $13.28 | $13.14 | $14.23 | $12.83 |
Net investment income (loss) (a) | 0.12 | 0.20 | 0.24 | 0.23 | 0.20 | 0.20 |
Net realized and unrealized gain (loss) | (1.50) | 2.83 | 0.41 | 0.81 | (0.53) | 1.67 |
Total from investment operations | (1.38) | 3.03 | 0.65 | 1.04 | (0.33) | 1.87 |
Less distributions: | ||||||
From net investment income | (0.53) | (0.23) | (0.26) | (0.27) | (0.31) | (0.25) |
From net realized gain on investments | (0.84) | (0.57) | (0.26) | (0.63) | (0.45) | (0.22) |
Total distributions | (1.37) | (0.80) | (0.52) | (0.90) | (0.76) | (0.47) |
Net asset value at end of period | $12.89 | $15.64 | $13.41 | $13.28 | $13.14 | $14.23 |
Total investment return (b) | (9.71)% | 23.28% | 4.96% | 8.88% | (2.58)% | 14.98% |
Ratios (to average net assets)/Supplemental Data: | ||||||
Net investment income (loss) | 1.63%†† | 1.32% | 1.87% | 1.82% | 1.47% | 1.52% |
Net expenses (c) | 0.34%†† | 0.35% | 0.36% | 0.36% | 0.34% | 0.35% |
Portfolio turnover rate | 15% | 29% | 59% | 45% | 52% | 33% |
Net assets at end of period (in 000’s) | $658,826 | $721,363 | $568,079 | $553,530 | $480,956 | $500,627 |
* | Unaudited. |
†† | Annualized. |
(a) | Per share data based on average shares outstanding during the period. |
(b) | Total investment return is calculated exclusive of sales charges and assumes the reinvestment of dividends and distributions. For periods of less than one year, total return is not annualized. |
(c) | In addition to the fees and expenses which the Fund bears directly, it also indirectly bears a pro-rata share of the fees and expenses of the underlying funds in which it invests. Such indirect expenses are not included in the above expense ratios. |
Six months ended April 30, 2022* | Year Ended October 31, | |||||
Investor Class | 2021 | 2020 | 2019 | 2018 | 2017 | |
Net asset value at beginning of period | $15.65 | $13.42 | $13.28 | $13.14 | $14.22 | $12.81 |
Net investment income (loss) (a) | 0.10 | 0.17 | 0.22 | 0.21 | 0.18 | 0.18 |
Net realized and unrealized gain (loss) | (1.49) | 2.82 | 0.41 | 0.81 | (0.54) | 1.67 |
Total from investment operations | (1.39) | 2.99 | 0.63 | 1.02 | (0.36) | 1.85 |
Less distributions: | ||||||
From net investment income | (0.50) | (0.19) | (0.23) | (0.25) | (0.27) | (0.22) |
From net realized gain on investments | (0.84) | (0.57) | (0.26) | (0.63) | (0.45) | (0.22) |
Total distributions | (1.34) | (0.76) | (0.49) | (0.88) | (0.72) | (0.44) |
Net asset value at end of period | $12.92 | $15.65 | $13.42 | $13.28 | $13.14 | $14.22 |
Total investment return (b) | (9.77)% | 22.97% | 4.83% | 8.64% | (2.78)% | 14.89% |
Ratios (to average net assets)/Supplemental Data: | ||||||
Net investment income (loss) | 1.43%†† | 1.12% | 1.68% | 1.60% | 1.30% | 1.32% |
Net expenses (c) | 0.55%†† | 0.55% | 0.55% | 0.55% | 0.51% | 0.53% |
Expenses (before waiver/reimbursement) (c) | 0.65%†† | 0.67% | 0.66% | 0.64% | 0.58% | 0.53% |
Portfolio turnover rate | 15% | 29% | 59% | 45% | 52% | 33% |
Net assets at end of period (in 000's) | $88,776 | $101,233 | $101,831 | $104,946 | $84,202 | $84,951 |
* | Unaudited. |
†† | Annualized. |
(a) | Per share data based on average shares outstanding during the period. |
(b) | Total investment return is calculated exclusive of sales charges and assumes the reinvestment of dividends and distributions. For periods of less than one year, total return is not annualized. |
(c) | In addition to the fees and expenses which the Fund bears directly, it also indirectly bears a pro-rata share of the fees and expenses of the underlying funds in which it invests. Such indirect expenses are not included in the above expense ratios. |
36 | MainStay Moderate Allocation Fund |
Six months ended April 30, 2022* | Year Ended October 31, | |||||
Class B | 2021 | 2020 | 2019 | 2018 | 2017 | |
Net asset value at beginning of period | $15.42 | $13.23 | $13.09 | $12.94 | $14.00 | $12.62 |
Net investment income (loss) (a) | 0.05 | 0.06 | 0.13 | 0.12 | 0.08 | 0.08 |
Net realized and unrealized gain (loss) | (1.48) | 2.79 | 0.39 | 0.79 | (0.53) | 1.65 |
Total from investment operations | (1.43) | 2.85 | 0.52 | 0.91 | (0.45) | 1.73 |
Less distributions: | ||||||
From net investment income | (0.39) | (0.09) | (0.12) | (0.13) | (0.16) | (0.13) |
From net realized gain on investments | (0.84) | (0.57) | (0.26) | (0.63) | (0.45) | (0.22) |
Total distributions | (1.23) | (0.66) | (0.38) | (0.76) | (0.61) | (0.35) |
Net asset value at end of period | $12.76 | $15.42 | $13.23 | $13.09 | $12.94 | $14.00 |
Total investment return (b) | (10.13)% | 22.04% | 4.03% | 7.82% | (3.45)% | 13.98% |
Ratios (to average net assets)/Supplemental Data: | ||||||
Net investment income (loss) | 0.70%†† | 0.43% | 1.00% | 0.96% | 0.60% | 0.63% |
Net expenses (c) | 1.30%†† | 1.30% | 1.30% | 1.30% | 1.26% | 1.29% |
Expenses (before waiver/reimbursement) (c) | 1.40%†† | 1.42% | 1.40% | 1.38% | 1.33% | 1.29% |
Portfolio turnover rate | 15% | 29% | 59% | 45% | 52% | 33% |
Net assets at end of period (in 000’s) | $19,956 | $27,037 | $31,682 | $40,817 | $50,416 | $67,352 |
* | Unaudited. |
†† | Annualized. |
(a) | Per share data based on average shares outstanding during the period. |
(b) | Total investment return is calculated exclusive of sales charges and assumes the reinvestment of dividends and distributions. For periods of less than one year, total return is not annualized. |
(c) | In addition to the fees and expenses which the Fund bears directly, it also indirectly bears a pro-rata share of the fees and expenses of the underlying funds in which it invests. Such indirect expenses are not included in the above expense ratios. |
Six months ended April 30, 2022* | Year Ended October 31, | |||||
Class C | 2021 | 2020 | 2019 | 2018 | 2017 | |
Net asset value at beginning of period | $15.42 | $13.23 | $13.08 | $12.93 | $14.00 | $12.62 |
Net investment income (loss) (a) | 0.05 | 0.06 | 0.13 | 0.13 | 0.08 | 0.08 |
Net realized and unrealized gain (loss) | (1.48) | 2.79 | 0.40 | 0.78 | (0.54) | 1.65 |
Total from investment operations | (1.43) | 2.85 | 0.53 | 0.91 | (0.46) | 1.73 |
Less distributions: | ||||||
From net investment income | (0.39) | (0.09) | (0.12) | (0.13) | (0.16) | (0.13) |
From net realized gain on investments | (0.84) | (0.57) | (0.26) | (0.63) | (0.45) | (0.22) |
Total distributions | (1.23) | (0.66) | (0.38) | (0.76) | (0.61) | (0.35) |
Net asset value at end of period | $12.76 | $15.42 | $13.23 | $13.08 | $12.93 | $14.00 |
Total investment return (b) | (10.13)% | 22.05% | 4.11% | 7.83% | (3.52)% | 13.98% |
Ratios (to average net assets)/Supplemental Data: | ||||||
Net investment income (loss) | 0.69%†† | 0.40% | 0.99% | 1.00% | 0.59% | 0.61% |
Net expenses (c) | 1.30%†† | 1.30% | 1.30% | 1.30% | 1.26% | 1.29% |
Expenses (before waiver/reimbursement) (c) | 1.40%†† | 1.42% | 1.40% | 1.38% | 1.33% | 1.29% |
Portfolio turnover rate | 15% | 29% | 59% | 45% | 52% | 33% |
Net assets at end of period (in 000’s) | $23,611 | $30,309 | $35,483 | $43,681 | $57,496 | $69,641 |
* | Unaudited. |
†† | Annualized. |
(a) | Per share data based on average shares outstanding during the period. |
(b) | Total investment return is calculated exclusive of sales charges and assumes the reinvestment of dividends and distributions. For periods of less than one year, total return is not annualized. |
(c) | In addition to the fees and expenses which the Fund bears directly, it also indirectly bears a pro-rata share of the fees and expenses of the underlying funds in which it invests. Such indirect expenses are not included in the above expense ratios. |
Six months ended April 30, 2022* | Year Ended October 31, | |||||
Class I | 2021 | 2020 | 2019 | 2018 | 2017 | |
Net asset value at beginning of period | $15.77 | $13.52 | $13.37 | $13.24 | $14.34 | $12.92 |
Net investment income (loss) (a) | 0.14 | 0.23 | 0.30 | 0.28 | 0.24 | 0.24 |
Net realized and unrealized gain (loss) | (1.50) | 2.85 | 0.40 | 0.79 | (0.54) | 1.68 |
Total from investment operations | (1.36) | 3.08 | 0.70 | 1.07 | (0.30) | 1.92 |
Less distributions: | ||||||
From net investment income | (0.57) | (0.26) | (0.29) | (0.31) | (0.35) | (0.28) |
From net realized gain on investments | (0.84) | (0.57) | (0.26) | (0.63) | (0.45) | (0.22) |
Total distributions | (1.41) | (0.83) | (0.55) | (0.94) | (0.80) | (0.50) |
Net asset value at end of period | $13.00 | $15.77 | $13.52 | $13.37 | $13.24 | $14.34 |
Total investment return (b) | (9.54)% | 23.52% | 5.33% | 9.04% | (2.39)% | 15.32% |
Ratios (to average net assets)/Supplemental Data: | ||||||
Net investment income (loss) | 1.90%†† | 1.55% | 2.31% | 2.15% | 1.75% | 1.76% |
Net expenses (c) | 0.09%†† | 0.10% | 0.11% | 0.11% | 0.09% | 0.10% |
Portfolio turnover rate | 15% | 29% | 59% | 45% | 52% | 33% |
Net assets at end of period (in 000’s) | $9,783 | $11,150 | $8,586 | $11,687 | $13,108 | $14,973 |
* | Unaudited. |
†† | Annualized. |
(a) | Per share data based on average shares outstanding during the period. |
(b) | Total investment return is calculated exclusive of sales charges and assumes the reinvestment of dividends and distributions. Class I shares are not subject to sales charges. For periods of less than one year, total return is not annualized. |
(c) | In addition to the fees and expenses which the Fund bears directly, it also indirectly bears a pro-rata share of the fees and expenses of the underlying funds in which it invests. Such indirect expenses are not included in the above expense ratios. |
Six months ended April 30, 2022* | Year Ended October 31, | June 14, 2019^ through October 31, 2019 | ||
Class R2 | 2021 | 2020 | ||
Net asset value at beginning of period | $15.62 | $13.40 | $13.27 | $12.78 |
Net investment income (loss) (a) | 0.11 | 0.18 | 0.24 | 0.06 |
Net realized and unrealized gain (loss) | (1.48) | 2.82 | 0.40 | 0.43 |
Total from investment operations | (1.37) | 3.00 | 0.64 | 0.49 |
Less distributions: | ||||
From net investment income | (0.52) | (0.21) | (0.25) | — |
From net realized gain on investments | (0.84) | (0.57) | (0.26) | — |
Total distributions | (1.36) | (0.78) | (0.51) | — |
Net asset value at end of period | $12.89 | $15.62 | $13.40 | $13.27 |
Total investment return (b) | (9.68)% | 23.10% | 4.89% | 3.83% |
Ratios (to average net assets)/Supplemental Data: | ||||
Net investment income (loss) | 1.53%†† | 1.22% | 1.81% | 1.13%†† |
Net expenses (c) | 0.44%†† | 0.45% | 0.46% | 0.47%†† |
Portfolio turnover rate | 15% | 29% | 59% | 45% |
Net assets at end of period (in 000’s) | $163 | $177 | $141 | $147 |
* | Unaudited. |
^ | Inception date. |
†† | Annualized. |
(a) | Per share data based on average shares outstanding during the period. |
(b) | Total investment return is calculated exclusive of sales charges and assumes the reinvestment of dividends and distributions. Class R2 shares are not subject to sales charges. For periods of less than one year, total return is not annualized. |
(c) | In addition to the fees and expenses which the Fund bears directly, it also indirectly bears a pro-rata share of the fees and expenses of the underlying funds in which it invests. Such indirect expenses are not included in the above expense ratios. |
38 | MainStay Moderate Allocation Fund |
Six months ended April 30, 2022* | Year Ended October 31, | |||||
Class R3 | 2021 | 2020 | 2019 | 2018 | 2017 | |
Net asset value at beginning of period | $15.58 | $13.37 | $13.24 | $13.09 | $14.20 | $12.80 |
Net investment income (loss) (a) | 0.09 | 0.14 | 0.20 | 0.17 | 0.13 | 0.09 |
Net realized and unrealized gain (loss) | (1.49) | 2.82 | 0.42 | 0.82 | (0.50) | 1.73 |
Total from investment operations | (1.40) | 2.96 | 0.62 | 0.99 | (0.37) | 1.82 |
Less distributions: | ||||||
From net investment income | (0.48) | (0.18) | (0.23) | (0.21) | (0.29) | (0.20) |
From net realized gain on investments | (0.84) | (0.57) | (0.26) | (0.63) | (0.45) | (0.22) |
Total distributions | (1.32) | (0.75) | (0.49) | (0.84) | (0.74) | (0.42) |
Net asset value at end of period | $12.86 | $15.58 | $13.37 | $13.24 | $13.09 | $14.20 |
Total investment return (b) | (9.87)% | 22.79% | 4.70% | 8.46% | (2.91)% | 14.63% |
Ratios (to average net assets)/Supplemental Data: | ||||||
Net investment income (loss) | 1.27%†† | 0.96% | 1.54% | 1.32% | 0.94% | 0.64% |
Net expenses (c) | 0.69%†† | 0.70% | 0.71% | 0.71% | 0.69% | 0.69% |
Portfolio turnover rate | 15% | 29% | 59% | 45% | 52% | 33% |
Net assets at end of period (in 000’s) | $1,590 | $1,557 | $964 | $1,004 | $459 | $212 |
* | Unaudited. |
†† | Annualized. |
(a) | Per share data based on average shares outstanding during the period. |
(b) | Total investment return is calculated exclusive of sales charges and assumes the reinvestment of dividends and distributions. Class R3 shares are not subject to sales charges. For periods of less than one year, total return is not annualized. |
(c) | In addition to the fees and expenses which the Fund bears directly, it also indirectly bears a pro-rata share of the fees and expenses of the underlying funds in which it invests. Such indirect expenses are not included in the above expense ratios. |
Six months ended April 30, 2022* | Year Ended October 31, | August 31, 2020^ through October 31, | |
SIMPLE Class | 2021 | 2020 | |
Net asset value at beginning of period | $15.62 | $13.42 | $13.95** |
Net investment income (loss) (a) | 0.08 | 0.11 | 0.02 |
Net realized and unrealized gain (loss) | (1.49) | 2.84 | (0.55) |
Total from investment operations | (1.41) | 2.95 | (0.53) |
Less distributions: | |||
From net investment income | (0.46) | (0.18) | — |
From net realized gain on investments | (0.84) | (0.57) | — |
Total distributions | (1.30) | (0.75) | — |
Net asset value at end of period | $12.91 | $15.62 | $13.42 |
Total investment return (b) | (9.88)% | 22.61% | (3.80)% |
Ratios (to average net assets)/Supplemental Data: | |||
Net investment income (loss) | 1.08%†† | 0.75% | 0.95%†† |
Net expenses (c) | 0.80%†† | 0.80% | 0.80%†† |
Expenses (before waiver/reimbursement) (c) | 0.90%†† | 0.92% | 0.93%†† |
Portfolio turnover rate | 15% | 29% | 59% |
Net assets at end of period (in 000’s) | $1,898 | $853 | $38 |
* | Unaudited. |
^ | Inception date. |
** | Based on the net asset value of Investor Class as of August 31, 2020. |
†† | Annualized. |
(a) | Per share data based on average shares outstanding during the period. |
(b) | Total investment return is calculated exclusive of sales charges and assumes the reinvestment of dividends and distributions. SIMPLE Class shares are not subject to sales charges. For periods of less than one year, total return is not annualized. |
(c) | In addition to the fees and expenses which the Fund bears directly, it also indirectly bears a pro-rata share of the fees and expenses of the underlying funds in which it invests. Such indirect expenses are not included in the above expense ratios. |
40 | MainStay Moderate Allocation Fund |
Investment and Performance Comparison (Unaudited)

Average Annual Total Returns for the Period-Ended April 30, 2022 | ||||||||
Class | Sales Charge | Inception Date | Six Months1 | One Year | Five Years | Ten Years or Since Inception | Gross Expense Ratio2 | |
Class A Shares3 | Maximum 3% Initial Sales Charge | With sales charges | 4/4/2005 | -12.69% | -7.80% | 5.66% | 7.29% | 0.90% |
Excluding sales charges | -9.99 | -4.95 | 6.86 | 7.90 | 0.90 | |||
Investor Class Shares3, 4 | Maximum 2.5% Initial Sales Charge | With sales charges | 2/28/2008 | -12.35 | -7.49 | 5.47 | 7.11 | 1.23 |
Excluding sales charges | -10.10 | -5.12 | 6.67 | 7.72 | 1.23 | |||
Class B Shares5 | Maximum 5% CDSC | With sales charges | 4/4/2005 | -14.56 | -10.17 | 5.54 | 6.90 | 1.98 |
if Redeemed Within the First Six Years of Purchase | Excluding sales charges | -10.50 | -5.90 | 5.85 | 6.90 | 1.98 | ||
Class C Shares | Maximum 1% CDSC | With sales charges | 4/4/2005 | -11.25 | -6.69 | 5.86 | 6.91 | 1.98 |
if Redeemed Within One Year of Purchase | Excluding sales charges | -10.44 | -5.84 | 5.86 | 6.91 | 1.98 | ||
Class I Shares | No Sales Charge | 4/4/2005 | -9.91 | -4.71 | 7.13 | 8.18 | 0.65 | |
Class R2 Shares | No Sales Charge | 6/14/2019 | -10.09 | -5.04 | N/A | 8.85 | 1.00 | |
Class R3 Shares | No Sales Charge | 2/29/2016 | -10.19 | -5.29 | 6.49 | 8.61 | 1.25 | |
SIMPLE Class Shares | No Sales Charge | 8/31/2020 | -10.22 | -5.35 | N/A | 7.07 | 1.48 | |
1. | Not annualized. |
2. | The gross expense ratios presented reflect the Fund’s “Total Annual Fund Operating Expenses” from the most recent Prospectus, as supplemented, and may differ from other expense ratios disclosed in this report. |
3. | Prior to July 22, 2019, the maximum initial sales charge was 5.5%, which is reflected in the applicable average annual total return figures shown. |
4. | Prior to June 30, 2020, the maximum initial sales charge was 3%, which is reflected in the applicable average annual total return figures shown. |
5. | Class B shares are closed to all new purchases as well as additional investments by existing Class B shareholders. |
Benchmark Performance* | Six Months1 | One Year | Five Years | Ten Years |
S&P 500® Index2 | -9.65% | 0.21% | 13.66% | 13.67% |
MSCI EAFE® Index (Net)3 | -11.80 | -8.15 | 4.77 | 5.77 |
Bloomberg U.S. Aggregate Bond Index4 | -9.47 | -8.51 | 1.20 | 1.73 |
Growth Allocation Composite Index5 | -9.96 | -3.12 | 9.52 | 9.81 |
Morningstar Allocation-70% to 85% Equity Category Average6 | -10.30 | -5.43 | 6.96 | 7.51 |
* | Returns for indices reflect no deductions for fees, expenses or taxes, except for foreign withholding taxes where applicable. |
1. | Not annualized. |
2. | The S&P 500® Index is the Fund's primary benchmark. S&P 500® is a trademark of The McGraw-Hill Companies, Inc. The S&P 500® Index is widely regarded as the standard index for measuring large-cap U.S. stock market performance. Results assume reinvestment of all dividends and capital gains. An investment cannot be made directly in an index. |
3. | The MSCI EAFE® Index (Net) is the Fund's secondary benchmark. The MSCI EAFE® Index (Net) consists of international stocks representing the developed world outside of North America. Results assume reinvestment of all dividends and capital gains. An investment cannot be made directly in an index. |
4. | The Fund has selected the Bloomberg U.S. Aggregate Bond Index as an additional benchmark. The Bloomberg U.S. Aggregate Bond Index is a broad-based benchmark that measures the performance of the investment grade, U.S. dollar-denominated, fixed-rate taxable bond market, including Treasurys, government-related and corporate securities, mortgage-backed securities (agency fixed-rate and hybrid adjustable rate mortgage pass-throughs), asset-backed securities, and commercial mortgage-backed securities. Results assume reinvestment of all dividends and capital gains. An investment cannot be made directly in an index. |
5. | The Fund has selected the Growth Allocation Composite Index as an additional benchmark. The Growth Allocation Composite Index consists of the S&P 500® Index, the MSCI EAFE® Index (Net) and the Bloomberg U.S. Aggregate Bond Index weighted 60%, 20% and 20%, respectively. Results assume reinvestment of all dividends and capital gains. An investment cannot be made directly in an index. |
6. | The Morningstar Allocation – 70% to 85% Equity Category Average is representative of funds that seek to provide both income and capital appreciation by investing in multiple asset classes, including stocks, bonds, and cash. These portfolios are dominated by domestic holdings and have equity exposures between 70% and 85%. Results are based on average total returns of similar funds with all dividends and capital gain distributions reinvested. |
42 | MainStay Growth Allocation Fund |
Share Class | Beginning Account Value 11/1/21 | Ending Account Value (Based on Actual Returns and Expenses) 4/30/22 | Expenses Paid During Period1 | Ending Account Value (Based on Hypothetical 5% Annualized Return and Actual Expenses) 4/30/22 | Expenses Paid During Period1 | Net Expense Ratio During Period2 |
Class A Shares | $1,000.00 | $900.10 | $1.65 | $1,023.06 | $1.76 | 0.35% |
Investor Class Shares | $1,000.00 | $899.00 | $2.59 | $1,022.07 | $2.76 | 0.55% |
Class B Shares | $1,000.00 | $895.00 | $6.11 | $1,018.35 | $6.51 | 1.30% |
Class C Shares | $1,000.00 | $895.60 | $6.11 | $1,018.35 | $6.51 | 1.30% |
Class I Shares | $1,000.00 | $900.90 | $0.47 | $1,024.30 | $0.50 | 0.10% |
Class R2 Shares | $1,000.00 | $899.10 | $2.07 | $1,022.61 | $2.21 | 0.44% |
Class R3 Shares | $1,000.00 | $898.10 | $3.29 | $1,021.32 | $3.51 | 0.70% |
SIMPLE Class Shares | $1,000.00 | $897.80 | $3.76 | $1,020.83 | $4.01 | 0.80% |
1. | Expenses are equal to the Fund’s annualized expense ratio of each class multiplied by the average account value over the period, divided by 365 and multiplied by 181 (to reflect the six-month period). The table above represents the actual expenses incurred during the six-month period. In addition to the fees and expenses which the Fund bears directly, it also indirectly bears a pro rata share of the fees and expenses of the underlying funds in which it invests. Such indirect expenses are not included in the above-reported expense figures. |
2. | Expenses are equal to the Fund's annualized expense ratio to reflect the six-month period. |
Asset Diversification as of April 30, 2022 (Unaudited)
Equity Funds | 75.1% |
Fixed Income Funds | 14.7 |
Short-Term Investment | 10.3 |
Other Assets, Less Liabilities | (0.1) |
44 | MainStay Growth Allocation Fund |
46 | MainStay Growth Allocation Fund |
Shares | Value | |
Affiliated Investment Companies 89.8% | ||
Equity Funds 75.1% | ||
IQ 50 Percent Hedged FTSE International ETF (a) | 736,851 | $ 16,652,464 |
IQ 500 International ETF (a) | 909,579 | 27,033,597 |
IQ Candriam ESG International Equity ETF (a) | 1,032,463 | 26,647,664 |
IQ Candriam ESG U.S. Equity ETF (a) | 1,531,029 | 54,412,311 |
IQ Chaikin U.S. Large Cap ETF (a) | 1,485,385 | 47,849,895 |
IQ Chaikin U.S. Small Cap ETF (a) | 1,229,077 | 39,081,207 |
MainStay Candriam Emerging Markets Equity Fund Class R6 (a) | 2,671,326 | 27,627,657 |
MainStay Epoch Capital Growth Fund Class I (a) | 255,585 | 2,793,775 |
MainStay Epoch International Choice Fund Class I (a) | 622,011 | 21,206,733 |
MainStay Epoch U.S. Equity Yield Fund Class R6 (a) | 2,554,962 | 50,284,983 |
MainStay MacKay International Equity Fund Class R6 (a) | 1,253,845 | 20,410,082 |
MainStay S&P 500 Index Fund Class I | 227,339 | 11,942,031 |
MainStay Winslow Large Cap Growth Fund Class R6 | 5,113,566 | 53,048,644 |
MainStay WMC Enduring Capital Fund Class R6 (a) | 1,538,220 | 47,732,049 |
MainStay WMC Growth Fund Class R6 (a) | 1,495,967 | 52,717,713 |
MainStay WMC International Research Equity Fund Class I (a) | 3,075,657 | 20,866,793 |
MainStay WMC Small Companies Fund Class I (a) | 1,716,134 | 40,494,575 |
MainStay WMC Value Fund Class R6 (a) | 1,626,408 | 49,257,554 |
Total Equity Funds (Cost $537,916,201) | 610,059,727 | |
Shares | Value | |
Fixed Income Funds 14.7% | ||
IQ MacKay ESG Core Plus Bond ETF (a) | 85,293 | $ 1,908,866 |
MainStay Floating Rate Fund Class R6 (a) | 4,780,111 | 42,859,427 |
MainStay MacKay High Yield Corporate Bond Fund Class R6 | 6,520,651 | 33,816,096 |
MainStay MacKay Short Duration High Yield Fund Class I | 4,070,487 | 38,481,573 |
MainStay MacKay Total Return Bond Fund Class R6 | 240,255 | 2,297,460 |
Total Fixed Income Funds (Cost $123,599,916) | 119,363,422 | |
Total Affiliated Investment Companies (Cost $661,516,117) | 729,423,149 | |
Short-Term Investment 10.3% | ||
Affiliated Investment Company 10.3% | ||
MainStay U.S. Government Liquidity Fund, 0.397% (a)(b) | 83,676,265 | 83,676,265 |
Total Short-Term Investment (Cost $83,676,265) | 10.3% | 83,676,265 |
Total Investments (Cost $745,192,382) | 100.1% | 813,099,414 |
Other Assets, Less Liabilities | (0.1) | (607,582) |
Net Assets | 100.0% | $ 812,491,832 |
† | Percentages indicated are based on Fund net assets. |
(a) | As of April 30, 2022, the Fund's ownership exceeds 5% of the outstanding shares of the Underlying Fund's share class. |
(b) | Current yield as of April 30, 2022. |
48 | MainStay Growth Allocation Fund |
Affiliated Investment Companies | Value, Beginning of Period | Purchases at Cost | Proceeds from Sales | Net Realized Gain/(Loss) on Sales | Change in Unrealized Appreciation/ (Depreciation) | Value, End of Period | Dividend Income | Other Distributions | Shares End of Period |
IQ 50 Percent Hedged FTSE International ETF | $ 18,364 | $ 437 | $ (420) | $ 28 | $ (1,757) | $ 16,652 | $ 208 | $ — | 737 |
IQ 500 International ETF | 31,518 | 425 | (1,791) | 173 | (3,291) | 27,034 | 520 | — | 910 |
IQ Candriam ESG International Equity ETF | 30,446 | 1,112 | (462) | (28) | (4,420) | 26,648 | 341 | — | 1,032 |
IQ Candriam ESG U.S. Equity ETF | 69,277 | — | (7,836) | 698 | (7,727) | 54,412 | 387 | — | 1,531 |
IQ Chaikin U.S. Large Cap ETF | 49,858 | 2,441 | (326) | (23) | (4,100) | 47,850 | 311 | — | 1,485 |
IQ Chaikin U.S. Small Cap ETF | 43,922 | 1,352 | (692) | (45) | (5,456) | 39,081 | 315 | — | 1,229 |
IQ MacKay ESG Core Plus Bond ETF | — | 1,980 | — | — | (71) | 1,909 | 2 | — | 85 |
MainStay Candriam Emerging Markets Equity Fund Class R6 | 31,337 | 2,991 | (433) | (36) | (6,231) | 27,628 | 281 | — | 2,671 |
MainStay Epoch Capital Growth Fund Class I | 3,402 | 780 | (43) | (2) | (1,343) | 2,794 | 5 | 758 | 256 |
MainStay Epoch International Choice Fund Class I | 24,126 | 1,829 | (393) | (3) | (4,352) | 21,207 | 617 | — | 622 |
MainStay Epoch U.S. Equity Yield Fund Class R6 | 49,334 | 2,267 | (681) | (32) | (603) | 50,285 | 494 | — | 2,555 |
MainStay Floating Rate Fund Class R6 | 45,562 | 1,426 | (3,316) | (44) | (769) | 42,859 | 690 | — | 4,780 |
MainStay MacKay High Yield Corporate Bond Fund Class R6 | 36,407 | 1,509 | (1,312) | (70) | (2,718) | 33,816 | 937 | — | 6,521 |
MainStay MacKay International Equity Fund Class R6 | 23,131 | 5,979 | (528) | (200) | (7,972) | 20,410 | 89 | 2,860 | 1,254 |
MainStay MacKay Short Duration High Yield Fund Class I | 22,784 | 27,990 | (10,829) | (285) | (1,179) | 38,481 | 628 | — | 4,070 |
MainStay MacKay Total Return Bond Fund Class R6 | 27,310 | 979 | (24,269) | (914) | (809) | 2,297 | 163 | 817 | 240 |
MainStay S&P 500 Index Fund Class I (a) | 40,628 | 1,839 | (27,060) | 8,492 | (11,957) | 11,942 | 439 | 1,399 | 227 |
MainStay Short Term Bond Fund Class I | 4,542 | 3 | (4,507) | (88) | 50 | — | 8 | 12 | — |
MainStay U.S. Government Liquidity Fund | 77,898 | 58,004 | (52,226) | — | — | 83,676 | 13 | — | 83,676 |
MainStay Winslow Large Cap Growth Fund Class R6 | 70,521 | 16,450 | (4,629) | 48 | (29,341) | 53,049 | — | 13,043 | 5,114 |
MainStay WMC Enduring Capital Fund Class R6 | 51,881 | 5,545 | (901) | (64) | (8,729) | 47,732 | 173 | 4,250 | 1,538 |
MainStay WMC Growth Fund Class R6 | 52,771 | 25,357 | (60) | (31) | (25,319) | 52,718 | — | 10,534 | 1,496 |
MainStay WMC International Research Equity Fund Class I | 23,755 | 1,785 | (433) | (24) | (4,216) | 20,867 | 626 | — | 3,076 |
MainStay WMC Small Companies Fund Class I | 44,757 | 11,369 | (1,199) | (209) | (14,223) | 40,495 | — | 10,279 | 1,716 |
MainStay WMC Value Fund Class R6 | 50,079 | 23,341 | (469) | (139) | (23,555) | 49,257 | 469 | 22,154 | 1,626 |
$923,610 | $197,190 | $(144,815) | $7,202 | $(170,088) | $813,099 | $7,716 | $66,106 |
(a) | Prior to February 28, 2022, known as MainStay MacKay S&P 500 Index Fund Class I. |
Swap Counterparty | Reference Obligation | Floating Rate2 | Termination Date(s) | Payment Frequency Paid/ Received | Notional Amount Long/ (Short) (000)3 | Unrealized Appreciation/ (Depreciation)4 |
Citibank NA | Invesco S&P 500 Low Volatility ETF | 1 day FEDF plus 0.45% | 12/2/22 | Daily | 12,773 | $ — |
Citibank NA | iShares 20+ Year Treasury Bond ETF | 1 day FEDF plus 0.35% | 12/2/22 | Daily | 8,145 | — |
Citibank NA | iShares Semiconductor ETF | 1 day FEDF plus 0.35% | 12/2/22 | Daily | 2,442 | — |
Citibank NA | Russell 1000 Growth Total Return Index | 1 day FEDF minus 0.20% | 12/2/22 | Daily | (23,311) | — |
Citibank NA | Russell 1000 Value Total Return Index | 1 day FEDF | 12/2/22 | Daily | (4,027) | — |
Swap Counterparty | Reference Obligation | Floating Rate2 | Termination Date(s) | Payment Frequency Paid/ Received | Notional Amount Long/ (Short) (000)3 | Unrealized Appreciation/ (Depreciation)4 |
Citibank NA | Russell Midcap Total Return Index | 1 day FEDF plus 0.40% | 12/2/22 | Daily | 16,148 | $ — |
Citibank NA | S&P 500 Financials Sector | 1 day FEDF plus 0.17% | 12/2/22 | Daily | (4,976) | — |
Citibank NA | S&P 500 Health Care Sector | 1 day FEDF plus 0.45% | 12/2/22 | Daily | 4,118 | — |
Citibank NA | S&P 500 Industrials Sector | 1 day FEDF plus 0.10% | 12/22/22 | Daily | (2,690) | — |
Citibank NA | S&P 500 Total Return Index | 1 day FEDF plus 0.10% | 12/2/22 | Daily | 2,531 | — |
Citibank NA | S&P 600 Total Return | 1 day FEDF plus 0.40% | 12/2/22 | Daily | 44,102 | — |
Citibank NA | SPDR S&P Oil & Gas Exploration & Production ETF | 1 day FEDF plus 0.40% | 12/2/22 | Daily | 6,589 | — |
Citibank NA | VanEck Gold Miners ETF | 1 day FEDF plus 0.55% | 12/2/22 | Daily | 9,965 | — |
Citibank NA | VanEck Oil Services ETF | 1 day FEDF plus 0.40% | 12/2/22 | Daily | 5,976 | — |
$ — |
1. | As of April 30, 2022, cash in the amount $2,170,745 was pledged from brokers for OTC swap contracts. |
2. | Fund pays the floating rate and receives the total return of the reference entity. |
3. | Notional amounts reflected as a positive value indicate a long position held by the Fund or Index and a negative value indicates a short position. |
4. | Reflects the value at reset date as of April 30, 2022. |
Abbreviation(s): |
ETF—Exchange-Traded Fund |
FEDF—Federal Funds Rate |
FTSE—Financial Times Stock Exchange |
SPDR—Standard & Poor’s Depositary Receipt |
Description | Quoted Prices in Active Markets for Identical Assets (Level 1) | Significant Other Observable Inputs (Level 2) | Significant Unobservable Inputs (Level 3) | Total |
Asset Valuation Inputs | ||||
Investments in Securities (a) | ||||
Affiliated Investment Companies | ||||
Equity Funds | $ 610,059,727 | $ — | $ — | $ 610,059,727 |
Fixed Income Funds | 119,363,422 | — | — | 119,363,422 |
Total Affiliated Investment Companies | 729,423,149 | — | — | 729,423,149 |
Short-Term Investment | ||||
Affiliated Investment Company | 83,676,265 | — | — | 83,676,265 |
Total Investments in Securities | $ 813,099,414 | $ — | $ — | $ 813,099,414 |
(a) | For a complete listing of investments, see the Portfolio of Investments. |
50 | MainStay Growth Allocation Fund |
Assets | |
Investment in affiliated investment companies, at value (identified cost $745,192,382) | $813,099,414 |
Cash | 809,882 |
Cash collateral on deposit at broker for swap contracts | 2,170,745 |
Receivables: | |
Fund shares sold | 456,918 |
Dividends and interest | 121,845 |
Manager (See Note 3) | 1,448 |
Other assets | 91,495 |
Total assets | 816,751,747 |
Liabilities | |
Payables: | |
Dividends and interest on OTC swaps contracts | 3,421,662 |
Transfer agent (See Note 3) | 290,186 |
NYLIFE Distributors (See Note 3) | 204,711 |
Fund shares redeemed | 185,502 |
Shareholder communication | 104,094 |
Professional fees | 34,495 |
Custodian | 14,714 |
Trustees | 1,110 |
Accrued expenses | 3,441 |
Total liabilities | 4,259,915 |
Net assets | $812,491,832 |
Composition of Net Assets | |
Shares of beneficial interest outstanding (par value of $.001 per share) unlimited number of shares authorized | $56,068 |
Additional paid-in-capital | 697,332,411 |
697,388,479 | |
Total distributable earnings (loss) | 115,103,353 |
Net assets | $812,491,832 |
Class A | |
Net assets applicable to outstanding shares | $651,283,081 |
Shares of beneficial interest outstanding | 44,923,587 |
Net asset value per share outstanding | $14.50 |
Maximum sales charge (3.00% of offering price) | 0.45 |
Maximum offering price per share outstanding | $14.95 |
Investor Class | |
Net assets applicable to outstanding shares | $104,415,718 |
Shares of beneficial interest outstanding | 7,188,759 |
Net asset value per share outstanding | $14.52 |
Maximum sales charge (2.50% of offering price) | 0.37 |
Maximum offering price per share outstanding | $14.89 |
Class B | |
Net assets applicable to outstanding shares | $22,397,024 |
Shares of beneficial interest outstanding | 1,567,161 |
Net asset value and offering price per share outstanding | $14.29 |
Class C | |
Net assets applicable to outstanding shares | $23,683,220 |
Shares of beneficial interest outstanding | 1,656,677 |
Net asset value and offering price per share outstanding | $14.30 |
Class I | |
Net assets applicable to outstanding shares | $7,255,061 |
Shares of beneficial interest outstanding | 493,288 |
Net asset value and offering price per share outstanding | $14.71 |
Class R2 | |
Net assets applicable to outstanding shares | $82,927 |
Shares of beneficial interest outstanding | 5,722 |
Net asset value and offering price per share outstanding | $14.49 |
Class R3 | |
Net assets applicable to outstanding shares | $1,154,722 |
Shares of beneficial interest outstanding | 80,066 |
Net asset value and offering price per share outstanding | $14.42 |
SIMPLE Class | |
Net assets applicable to outstanding shares | $2,220,079 |
Shares of beneficial interest outstanding | 152,828 |
Net asset value and offering price per share outstanding | $14.53 |
Investment Income (Loss) | |
Income | |
Dividend distributions from affiliated investment companies | $7,716,108 |
Expenses | |
Distribution/Service—Class A (See Note 3) | 875,945 |
Distribution/Service—Investor Class (See Note 3) | 143,048 |
Distribution/Service—Class B (See Note 3) | 134,521 |
Distribution/Service—Class C (See Note 3) | 134,316 |
Distribution/Service—Class R2 (See Note 3) | 111 |
Distribution/Service—Class R3 (See Note 3) | 3,631 |
Distribution/Service—SIMPLE Class (See Note 3) | 4,921 |
Transfer agent (See Note 3) | 507,296 |
Registration | 54,923 |
Shareholder communication | 35,749 |
Professional fees | 33,960 |
Custodian | 18,140 |
Trustees | 9,249 |
Shareholder service (See Note 3) | 798 |
Miscellaneous | 17,309 |
Total expenses before waiver/reimbursement | 1,973,917 |
Expense waiver/reimbursement from Manager (See Note 3) | (82,463) |
Net expenses | 1,891,454 |
Net investment income (loss) | 5,824,654 |
Realized and Unrealized Gain (Loss) | |
Net realized gain (loss) on: | |
Affiliated investment company transactions | 7,201,809 |
Realized capital gain distributions from affiliated investment companies | 66,106,351 |
Swap transactions | (623,215) |
Net realized gain (loss) | 72,684,945 |
Net change in unrealized appreciation (depreciation) on: Affiliated investments companies | (170,088,316) |
Net realized and unrealized gain (loss) | (97,403,371) |
Net increase (decrease) in net assets resulting from operations | $(91,578,717) |
52 | MainStay Growth Allocation Fund |
for the six months ended April 30, 2022 (Unaudited) and the year ended October 31, 2021
2022 | 2021 | |
Increase (Decrease) in Net Assets | ||
Operations: | ||
Net investment income (loss) | $5,824,654 | $7,822,013 |
Net realized gain (loss) | 72,684,945 | 71,646,065 |
Net change in unrealized appreciation (depreciation) | (170,088,316) | 148,908,402 |
Net increase (decrease) in net assets resulting from operations | (91,578,717) | 228,376,480 |
Distributions to shareholders: | ||
Class A | (73,906,840) | (31,498,716) |
Investor Class | (11,530,238) | (6,212,150) |
Class B | (2,637,375) | (1,465,424) |
Class C | (2,609,496) | (1,469,549) |
Class I | (800,930) | (489,405) |
Class R1(a) | (6,054) | (1,919) |
Class R2 | (9,226) | (4,993) |
Class R3 | (167,463) | (56,274) |
SIMPLE Class | (191,431) | (16,390) |
Total distributions to shareholders | (91,859,053) | (41,214,820) |
Capital share transactions: | ||
Net proceeds from sales of shares | 36,973,686 | 77,741,470 |
Net asset value of shares issued to shareholders in reinvestment of distributions | 91,467,179 | 41,061,476 |
Cost of shares redeemed | (57,561,563) | (124,117,592) |
Increase (decrease) in net assets derived from capital share transactions | 70,879,302 | (5,314,646) |
Net increase (decrease) in net assets | (112,558,468) | 181,847,014 |
Net Assets | ||
Beginning of period | 925,050,300 | 743,203,286 |
End of period | $812,491,832 | $925,050,300 |
(a) | Class R1 liquidated and no longer offered for sale as of April 26, 2022. |
Six months ended April 30, 2022* | Year Ended October 31, | |||||
Class A | 2021 | 2020 | 2019 | 2018 | 2017 | |
Net asset value at beginning of period | $17.89 | $14.33 | $14.40 | $14.76 | $15.96 | $13.90 |
Net investment income (loss) (a) | 0.11 | 0.16 | 0.24 | 0.22 | 0.16 | 0.17 |
Net realized and unrealized gain (loss) | (1.69) | 4.22 | 0.32 | 0.77 | (0.55) | 2.41 |
Total from investment operations | (1.58) | 4.38 | 0.56 | 0.99 | (0.39) | 2.58 |
Less distributions: | ||||||
From net investment income | (0.66) | (0.17) | (0.26) | (0.28) | (0.36) | (0.20) |
From net realized gain on investments | (1.15) | (0.65) | (0.37) | (1.07) | (0.45) | (0.32) |
Total distributions | (1.81) | (0.82) | (0.63) | (1.35) | (0.81) | (0.52) |
Net asset value at end of period | $14.50 | $17.89 | $14.33 | $14.40 | $14.76 | $15.96 |
Total investment return (b) | (9.99)% | 31.45% | 3.89% | 8.17% | (2.75)% | 19.05% |
Ratios (to average net assets)/Supplemental Data: | ||||||
Net investment income (loss) | 1.40%†† | 0.98% | 1.69% | 1.55% | 1.02% | 1.16% |
Net expenses (c) | 0.35%†† | 0.35% | 0.37% | 0.37% | 0.35% | 0.36% |
Portfolio turnover rate | 12% | 29% | 47% | 42% | 47% | 32% |
Net assets at end of period (in 000’s) | $651,283 | $728,402 | $542,938 | $545,586 | $484,182 | $499,998 |
* | Unaudited. |
†† | Annualized. |
(a) | Per share data based on average shares outstanding during the period. |
(b) | Total investment return is calculated exclusive of sales charges and assumes the reinvestment of dividends and distributions. For periods of less than one year, total return is not annualized. |
(c) | In addition to the fees and expenses which the Fund bears directly, it also indirectly bears a pro-rata share of the fees and expenses of the underlying funds in which it invests. Such indirect expenses are not included in the above expense ratios. |
Six months ended April 30, 2022* | Year Ended October 31, | |||||
Investor Class | 2021 | 2020 | 2019 | 2018 | 2017 | |
Net asset value at beginning of period | $17.91 | $14.33 | $14.40 | $14.76 | $15.93 | $13.88 |
Net investment income (loss) (a) | 0.10 | 0.14 | 0.21 | 0.18 | 0.14 | 0.14 |
Net realized and unrealized gain (loss) | (1.72) | 4.22 | 0.32 | 0.79 | (0.55) | 2.40 |
Total from investment operations | (1.62) | 4.36 | 0.53 | 0.97 | (0.41) | 2.54 |
Less distributions: | ||||||
From net investment income | (0.62) | (0.13) | (0.23) | (0.26) | (0.31) | (0.17) |
From net realized gain on investments | (1.15) | (0.65) | (0.37) | (1.07) | (0.45) | (0.32) |
Total distributions | (1.77) | (0.78) | (0.60) | (1.33) | (0.76) | (0.49) |
Net asset value at end of period | $14.52 | $17.91 | $14.33 | $14.40 | $14.76 | $15.93 |
Total investment return (b) | (10.10)% | 31.27% | 3.70% | 7.94% | (2.86)% | 18.80% |
Ratios (to average net assets)/Supplemental Data: | ||||||
Net investment income (loss) | 1.22%†† | 0.82% | 1.54% | 1.32% | 0.87% | 0.96% |
Net expenses (c) | 0.55%†† | 0.55% | 0.55% | 0.55% | 0.52% | 0.55% |
Expenses (before waiver/reimbursement) (c) | 0.65%†† | 0.68% | 0.67% | 0.68% | 0.61% | 0.55% |
Portfolio turnover rate | 12% | 29% | 47% | 42% | 47% | 32% |
Net assets at end of period (in 000's) | $104,416 | $122,265 | $126,514 | $139,892 | $110,200 | $116,058 |
* | Unaudited. |
†† | Annualized. |
(a) | Per share data based on average shares outstanding during the period. |
(b) | Total investment return is calculated exclusive of sales charges and assumes the reinvestment of dividends and distributions. For periods of less than one year, total return is not annualized. |
(c) | In addition to the fees and expenses which the Fund bears directly, it also indirectly bears a pro-rata share of the fees and expenses of the underlying funds in which it invests. Such indirect expenses are not included in the above expense ratios. |
54 | MainStay Growth Allocation Fund |
Six months ended April 30, 2022* | Year Ended October 31, | |||||
Class B | 2021 | 2020 | 2019 | 2018 | 2017 | |
Net asset value at beginning of period | $17.59 | $14.10 | $14.16 | $14.50 | $15.66 | $13.65 |
Net investment income (loss) (a) | 0.04 | 0.02 | 0.12 | 0.10 | 0.03 | 0.04 |
Net realized and unrealized gain (loss) | (1.69) | 4.14 | 0.30 | 0.76 | (0.55) | 2.36 |
Total from investment operations | (1.65) | 4.16 | 0.42 | 0.86 | (0.52) | 2.40 |
Less distributions: | ||||||
From net investment income | (0.50) | (0.02) | (0.11) | (0.13) | (0.19) | (0.07) |
From net realized gain on investments | (1.15) | (0.65) | (0.37) | (1.07) | (0.45) | (0.32) |
Total distributions | (1.65) | (0.67) | (0.48) | (1.20) | (0.64) | (0.39) |
Net asset value at end of period | $14.29 | $17.59 | $14.10 | $14.16 | $14.50 | $15.66 |
Total investment return (b) | (10.50)% | 30.24% | 2.97% | 7.14% | (3.60)% | 17.91% |
Ratios (to average net assets)/Supplemental Data: | ||||||
Net investment income (loss) | 0.50%†† | 0.11% | 0.87% | 0.73% | 0.18% | 0.31% |
Net expenses (c) | 1.30%†† | 1.30% | 1.30% | 1.30% | 1.27% | 1.30% |
Expenses (before waiver/reimbursement) (c) | 1.40%†† | 1.43% | 1.42% | 1.42% | 1.36% | 1.31% |
Portfolio turnover rate | 12% | 29% | 47% | 42% | 47% | 32% |
Net assets at end of period (in 000’s) | $22,397 | $30,461 | $32,739 | $43,800 | $55,493 | $75,863 |
* | Unaudited. |
†† | Annualized. |
(a) | Per share data based on average shares outstanding during the period. |
(b) | Total investment return is calculated exclusive of sales charges and assumes the reinvestment of dividends and distributions. For periods of less than one year, total return is not annualized. |
(c) | In addition to the fees and expenses which the Fund bears directly, it also indirectly bears a pro-rata share of the fees and expenses of the underlying funds in which it invests. Such indirect expenses are not included in the above expense ratios. |
Six months ended April 30, 2022* | Year Ended October 31, | |||||
Class C | 2021 | 2020 | 2019 | 2018 | 2017 | |
Net asset value at beginning of period | $17.59 | $14.10 | $14.16 | $14.50 | $15.66 | $13.65 |
Net investment income (loss) (a) | 0.04 | 0.02 | 0.11 | 0.10 | 0.02 | 0.04 |
Net realized and unrealized gain (loss) | (1.68) | 4.14 | 0.31 | 0.76 | (0.54) | 2.36 |
Total from investment operations | (1.64) | 4.16 | 0.42 | 0.86 | (0.52) | 2.40 |
Less distributions: | ||||||
From net investment income | (0.50) | (0.02) | (0.11) | (0.13) | (0.19) | (0.07) |
From net realized gain on investments | (1.15) | (0.65) | (0.37) | (1.07) | (0.45) | (0.32) |
Total distributions | (1.65) | (0.67) | (0.48) | (1.20) | (0.64) | (0.39) |
Net asset value at end of period | $14.30 | $17.59 | $14.10 | $14.16 | $14.50 | $15.66 |
Total investment return (b) | (10.44)% | 30.23% | 2.97% | 7.14% | (3.60)% | 17.91% |
Ratios (to average net assets)/Supplemental Data: | ||||||
Net investment income (loss) | 0.48%†† | 0.09% | 0.81% | 0.76% | 0.14% | 0.25% |
Net expenses (c) | 1.30%†† | 1.30% | 1.30% | 1.30% | 1.27% | 1.30% |
Expenses (before waiver/reimbursement) (c) | 1.40%†† | 1.43% | 1.42% | 1.42% | 1.36% | 1.31% |
Portfolio turnover rate | 12% | 29% | 47% | 42% | 47% | 32% |
Net assets at end of period (in 000’s) | $23,683 | $29,440 | $31,564 | $36,721 | $47,590 | $55,873 |
* | Unaudited. |
†† | Annualized. |
(a) | Per share data based on average shares outstanding during the period. |
(b) | Total investment return is calculated exclusive of sales charges and assumes the reinvestment of dividends and distributions. For periods of less than one year, total return is not annualized. |
(c) | In addition to the fees and expenses which the Fund bears directly, it also indirectly bears a pro-rata share of the fees and expenses of the underlying funds in which it invests. Such indirect expenses are not included in the above expense ratios. |
Six months ended April 30, 2022* | Year Ended October 31, | |||||
Class I | 2021 | 2020 | 2019 | 2018 | 2017 | |
Net asset value at beginning of period | $18.15 | $14.52 | $14.58 | $14.94 | $16.14 | $14.05 |
Net investment income (loss) (a) | 0.13 | 0.21 | 0.31 | 0.25 | 0.21 | 0.21 |
Net realized and unrealized gain (loss) | (1.72) | 4.27 | 0.30 | 0.78 | (0.56) | 2.43 |
Total from investment operations | (1.59) | 4.48 | 0.61 | 1.03 | (0.35) | 2.64 |
Less distributions: | ||||||
From net investment income | (0.70) | (0.20) | (0.30) | (0.32) | (0.40) | (0.23) |
From net realized gain on investments | (1.15) | (0.65) | (0.37) | (1.07) | (0.45) | (0.32) |
Total distributions | (1.85) | (0.85) | (0.67) | (1.39) | (0.85) | (0.55) |
Net asset value at end of period | $14.71 | $18.15 | $14.52 | $14.58 | $14.94 | $16.14 |
Total investment return (b) | (9.91)% | 31.82% | 4.16% | 8.40% | (2.48)% | 19.35% |
Ratios (to average net assets)/Supplemental Data: | ||||||
Net investment income (loss) | 1.58%†† | 1.23% | 2.18% | 1.74% | 1.32% | 1.40% |
Net expenses (c) | 0.10%†† | 0.10% | 0.11% | 0.13% | 0.10% | 0.11% |
Portfolio turnover rate | 12% | 29% | 47% | 42% | 47% | 32% |
Net assets at end of period (in 000’s) | $7,255 | $11,142 | $8,063 | $11,037 | $8,129 | $8,435 |
* | Unaudited. |
†† | Annualized. |
(a) | Per share data based on average shares outstanding during the period. |
(b) | Total investment return is calculated exclusive of sales charges and assumes the reinvestment of dividends and distributions. Class I shares are not subject to sales charges. For periods of less than one year, total return is not annualized. |
(c) | In addition to the fees and expenses which the Fund bears directly, it also indirectly bears a pro-rata share of the fees and expenses of the underlying funds in which it invests. Such indirect expenses are not included in the above expense ratios. |
Six months ended April 30, 2022* | Year Ended October 31, | June 14, 2019^ through October 31, 2019 | ||
Class R2 | 2021 | 2020 | ||
Net asset value at beginning of period | $17.88 | $14.32 | $14.40 | $13.82 |
Net investment income (loss) (a) | 0.10 | 0.15 | 0.25 | 0.04 |
Net realized and unrealized gain (loss) | (1.70) | 4.21 | 0.29 | 0.54 |
Total from investment operations | (1.60) | 4.36 | 0.54 | 0.58 |
Less distributions: | ||||
From net investment income | (0.64) | (0.15) | (0.25) | — |
From net realized gain on investments | (1.15) | (0.65) | (0.37) | — |
Total distributions | (1.79) | (0.80) | (0.62) | — |
Net asset value at end of period | $14.49 | $17.88 | $14.32 | $14.40 |
Total investment return (b) | (10.09)% | 31.34% | 3.75% | 4.20% |
Ratios (to average net assets)/Supplemental Data: | ||||
Net investment income (loss) | 1.31%†† | 0.90% | 1.79% | 0.68%†† |
Net expenses (c) | 0.44%†† | 0.45% | 0.47% | 0.49%†† |
Portfolio turnover rate | 12% | 29% | 47% | 42% |
Net assets at end of period (in 000’s) | $83 | $92 | $89 | $130 |
* | Unaudited. |
^ | Inception date. |
†† | Annualized. |
(a) | Per share data based on average shares outstanding during the period. |
(b) | Total investment return is calculated exclusive of sales charges and assumes the reinvestment of dividends and distributions. Class R2 shares are not subject to sales charges. For periods of less than one year, total return is not annualized. |
(c) | In addition to the fees and expenses which the Fund bears directly, it also indirectly bears a pro-rata share of the fees and expenses of the underlying funds in which it invests. Such indirect expenses are not included in the above expense ratios. |
56 | MainStay Growth Allocation Fund |
Six months ended April 30, 2022* | Year Ended October 31, | |||||
Class R3 | 2021 | 2020 | 2019 | 2018 | 2017 | |
Net asset value at beginning of period | $17.78 | $14.24 | $14.33 | $14.68 | $15.90 | $13.87 |
Net investment income (loss) (a) | 0.09 | 0.10 | 0.20 | 0.12 | 0.06 | 0.03 |
Net realized and unrealized gain (loss) | (1.70) | 4.20 | 0.31 | 0.83 | (0.49) | 2.48 |
Total from investment operations | (1.61) | 4.30 | 0.51 | 0.95 | (0.43) | 2.51 |
Less distributions: | ||||||
From net investment income | (0.60) | (0.11) | (0.23) | (0.23) | (0.34) | (0.16) |
From net realized gain on investments | (1.15) | (0.65) | (0.37) | (1.07) | (0.45) | (0.32) |
Total distributions | (1.75) | (0.76) | (0.60) | (1.30) | (0.79) | (0.48) |
Net asset value at end of period | $14.42 | $17.78 | $14.24 | $14.33 | $14.68 | $15.90 |
Total investment return (b) | (10.19)% | 30.99% | 3.53% | 7.81% | (3.04)% | 18.58% |
Ratios (to average net assets)/Supplemental Data: | ||||||
Net investment income (loss) | 1.14%†† | 0.60% | 1.43% | 0.90% | 0.38% | 0.21% |
Net expenses (c) | 0.70%†† | 0.70% | 0.72% | 0.73% | 0.70% | 0.70% |
Portfolio turnover rate | 12% | 29% | 47% | 42% | 47% | 32% |
Net assets at end of period (in 000’s) | $1,155 | $1,622 | $1,084 | $1,262 | $449 | $185 |
* | Unaudited. |
†† | Annualized. |
(a) | Per share data based on average shares outstanding during the period. |
(b) | Total investment return is calculated exclusive of sales charges and assumes the reinvestment of dividends and distributions. Class R3 shares are not subject to sales charges. For periods of less than one year, total return is not annualized. |
(c) | In addition to the fees and expenses which the Fund bears directly, it also indirectly bears a pro-rata share of the fees and expenses of the underlying funds in which it invests. Such indirect expenses are not included in the above expense ratios. |
Six months ended April 30, 2022* | Year Ended October 31, | August 31, 2020^ through October 31, | |
SIMPLE Class | 2021 | 2020 | |
Net asset value at beginning of period | $17.89 | $14.33 | $15.03** |
Net investment income (loss) (a) | 0.07 | 0.06 | 0.02 |
Net realized and unrealized gain (loss) | (1.70) | 4.25 | (0.72) |
Total from investment operations | (1.63) | 4.31 | (0.70) |
Less distributions: | |||
From net investment income | (0.58) | (0.10) | — |
From net realized gain on investments | (1.15) | (0.65) | — |
Total distributions | (1.73) | (0.75) | — |
Net asset value at end of period | $14.53 | $17.89 | $14.33 |
Total investment return (b) | (10.22)% | 30.89% | (4.66)% |
Ratios (to average net assets)/Supplemental Data: | |||
Net investment income (loss) | 0.86%†† | 0.37% | 0.80%†† |
Net expenses (c) | 0.80%†† | 0.80% | 0.80%†† |
Expenses (before waiver/reimbursement) (c) | 0.90%†† | 0.93% | 0.95%†† |
Portfolio turnover rate | 12% | 29% | 47% |
Net assets at end of period (in 000’s) | $2,220 | $1,567 | $180 |
* | Unaudited. |
^ | Inception date. |
** | Based on the net asset value of Investor Class as of August 31, 2020. |
†† | Annualized. |
(a) | Per share data based on average shares outstanding during the period. |
(b) | Total investment return is calculated exclusive of sales charges and assumes the reinvestment of dividends and distributions. SIMPLE Class shares are not subject to sales charges. For periods of less than one year, total return is not annualized. |
(c) | In addition to the fees and expenses which the Fund bears directly, it also indirectly bears a pro-rata share of the fees and expenses of the underlying funds in which it invests. Such indirect expenses are not included in the above expense ratios. |
58 | MainStay Growth Allocation Fund |
Investment and Performance Comparison (Unaudited)

Average Annual Total Returns for the Period-Ended April 30, 2022 | ||||||||
Class | Sales Charge | Inception Date | Six Months1 | One Year | Five Years | Ten Years or Since Inception | Gross Expense Ratio2 | |
Class A Shares3 | Maximum 3% Initial Sales Charge | With sales charges | 4/4/2005 | -14.63% | -8.93% | 6.72% | 8.28% | 0.94% |
Excluding sales charges | -11.99 | -6.11 | 7.94 | 8.90 | 0.94 | |||
Investor Class Shares3, 4 | Maximum 2.5% Initial Sales Charge | With sales charges | 2/28/2008 | -14.24 | -8.60 | 6.55 | 8.12 | 1.27 |
Excluding sales charges | -12.04 | -6.26 | 7.76 | 8.73 | 1.27 | |||
Class B Shares5 | Maximum 5% CDSC | With sales charges | 4/4/2005 | -16.28 | -11.10 | 6.66 | 7.93 | 2.02 |
if Redeemed Within the First Six Years of Purchase | Excluding sales charges | -12.36 | -6.95 | 6.96 | 7.93 | 2.02 | ||
Class C Shares | Maximum 1% CDSC | With sales charges | 4/4/2005 | -13.18 | -7.77 | 6.96 | 7.92 | 2.02 |
if Redeemed Within One Year of Purchase | Excluding sales charges | -12.39 | -6.94 | 6.96 | 7.92 | 2.02 | ||
Class I Shares | No Sales Charge | 4/4/2005 | -11.83 | -5.82 | 8.21 | 9.18 | 0.69 | |
Class R3 Shares | No Sales Charge | 2/29/2016 | -12.13 | -6.41 | 7.56 | 9.93 | 1.29 | |
SIMPLE Class Shares | No Sales Charge | 8/31/2020 | -12.12 | -6.49 | N/A | 9.10 | 1.52 | |
1. | Not annualized. |
2. | The gross expense ratios presented reflect the Fund’s “Total Annual Fund Operating Expenses” from the most recent Prospectus, as supplemented, and may differ from other expense ratios disclosed in this report. |
3. | Prior to July 22, 2019, the maximum initial sales charge was 5.5%, which is reflected in the applicable average annual total return figures shown. |
4. | Prior to June 30, 2020, the maximum initial sales charge was 3%, which is reflected in the applicable average annual total return figures shown. |
5. | Class B shares are closed to all new purchases as well as additional investments by existing Class B shareholders. |
Benchmark Performance* | Six Months1 | One Year | Five Years | Ten Years |
S&P 500® Index2 | -9.65% | 0.21% | 13.66% | 13.67% |
MSCI EAFE® Index (Net)3 | -11.80 | -8.15 | 4.77 | 5.77 |
Equity Allocation Composite Index4 | -10.16 | -1.87 | 11.43 | 11.72 |
Morningstar Allocation-85%+ Equity Category Average5 | -13.73 | -8.07 | 7.75 | 8.67 |
* | Returns for indices reflect no deductions for fees, expenses or taxes, except for foreign withholding taxes where applicable. |
1. | Not annualized. |
2. | The S&P 500® Index is the Fund's primary benchmark. S&P 500® is a trademark of The McGraw-Hill Companies, Inc. The S&P 500® Index is widely regarded as the standard index for measuring large-cap U.S. stock market performance. Results assume reinvestment of all dividends and capital gains. An investment cannot be made directly in an index. |
3. | The MSCI EAFE® Index (Net) is the Fund's secondary benchmark. The MSCI EAFE® Index (Net) consists of international stocks representing the developed world outside of North America. Results assume reinvestment of all dividends and capital gains. An investment cannot be made directly in an index. |
4. | The Fund has selected the Equity Allocation Composite Index as an additional benchmark. Effective February 28, 2014, the Equity Allocation Composite Index consists of the S&P 500®Index and the MSCI EAFE® Index (Net) weighted 75% and 25%, respectively. Prior to February 28, 2014, the Equity Allocation Composite Index consisted of the S&P 500® Index and the MSCI EAFE® Index (Net) weighted 80% and 20%, respectively. Results assume reinvestment of all dividends and capital gains. An investment cannot be made directly in an index. |
5. | The Morningstar Allocation – 85%+ Equity Category Average is representative of funds that seek to provide both income and capital appreciation by investing in multiple asset classes, including stocks, bonds, and cash. These portfolios are dominated by domestic holdings and have equity exposures of over 85%. These funds typically allocate at least 10% to equities of foreign companies and do not exclusively allocate between cash and equities. Results are based on average total returns of similar funds with all dividends and capital gain distributions reinvested. |
60 | MainStay Equity Allocation Fund |
Share Class | Beginning Account Value 11/1/21 | Ending Account Value (Based on Actual Returns and Expenses) 4/30/22 | Expenses Paid During Period1 | Ending Account Value (Based on Hypothetical 5% Annualized Return and Actual Expenses) 4/30/22 | Expenses Paid During Period1 | Net Expense Ratio During Period2 |
Class A Shares | $1,000.00 | $880.10 | $1.72 | $1,022.96 | $1.86 | 0.37% |
Investor Class Shares | $1,000.00 | $879.60 | $2.56 | $1,022.07 | $2.76 | 0.55% |
Class B Shares | $1,000.00 | $876.40 | $6.05 | $1,018.35 | $6.51 | 1.30% |
Class C Shares | $1,000.00 | $876.10 | $6.05 | $1,018.35 | $6.51 | 1.30% |
Class I Shares | $1,000.00 | $881.70 | $0.56 | $1,024.20 | $0.60 | 0.12% |
Class R3 Shares | $1,000.00 | $878.70 | $3.35 | $1,021.22 | $3.61 | 0.72% |
SIMPLE Class Shares | $1,000.00 | $878.80 | $3.73 | $1,020.83 | $4.01 | 0.80% |
1. | Expenses are equal to the Fund’s annualized expense ratio of each class multiplied by the average account value over the period, divided by 365 and multiplied by 181 (to reflect the six-month period). The table above represents the actual expenses incurred during the six-month period. In addition to the fees and expenses which the Fund bears directly, it also indirectly bears a pro rata share of the fees and expenses of the underlying funds in which it invests. Such indirect expenses are not included in the above-reported expense figures. |
2. | Expenses are equal to the Fund's annualized expense ratio to reflect the six-month period. |
Asset Diversification as of April 30, 2022 (Unaudited)
Equity Funds | 96.5% |
Short-Term Investment | 3.6 |
Other Assets, Less Liabilities | (0.1) |
62 | MainStay Equity Allocation Fund |
64 | MainStay Equity Allocation Fund |
Shares | Value | |
Affiliated Investment Companies 96.5% | ||
Equity Funds 96.5% | ||
IQ 50 Percent Hedged FTSE International ETF | 391,430 | $ 8,846,122 |
IQ 500 International ETF (a) | 584,365 | 17,367,912 |
IQ Candriam ESG International Equity ETF (a) | 664,758 | 17,157,271 |
IQ Candriam ESG U.S. Equity ETF (a) | 1,019,735 | 36,241,076 |
IQ Chaikin U.S. Large Cap ETF (a) | 989,234 | 31,866,986 |
IQ Chaikin U.S. Small Cap ETF (a) | 827,878 | 26,324,202 |
MainStay Candriam Emerging Markets Equity Fund Class R6 (a) | 2,016,580 | 20,856,077 |
MainStay Epoch Capital Growth Fund Class I | 135,150 | 1,477,309 |
MainStay Epoch International Choice Fund Class I (a) | 417,858 | 14,246,363 |
MainStay Epoch U.S. Equity Yield Fund Class R6 (a) | 1,728,767 | 34,024,387 |
MainStay MacKay International Equity Fund Class R6 (a) | 844,951 | 13,754,119 |
MainStay S&P 500 Index Fund Class I | 193,478 | 10,163,326 |
MainStay Winslow Large Cap Growth Fund Class R6 | 3,345,412 | 34,705,634 |
MainStay WMC Enduring Capital Fund Class R6 (a) | 1,023,642 | 31,764,339 |
MainStay WMC Growth Fund Class R6 (a) | 978,384 | 34,478,162 |
Shares | Value | |
Equity Funds (continued) | ||
MainStay WMC International Research Equity Fund Class I (a) | 2,069,069 | $ 14,037,602 |
MainStay WMC Small Companies Fund Class I (a) | 1,163,555 | 27,455,706 |
MainStay WMC Value Fund Class R6 (a) | 1,097,709 | 33,245,318 |
Total Affiliated Investment Companies (Cost $371,739,735) | 408,011,911 | |
Short-Term Investment 3.6% | ||
Affiliated Investment Company 3.6% | ||
MainStay U.S. Government Liquidity Fund, 0.397% (b) | 15,108,339 | 15,108,339 |
Total Short-Term Investment (Cost $15,108,339) | 3.6% | 15,108,339 |
Total Investments (Cost $386,848,074) | 100.1% | 423,120,250 |
Other Assets, Less Liabilities | (0.1) | (230,574) |
Net Assets | 100.0% | $ 422,889,676 |
† | Percentages indicated are based on Fund net assets. |
(a) | As of April 30, 2022, the Fund's ownership exceeds 5% of the outstanding shares of the Underlying Fund's share class. |
(b) | Current yield as of April 30, 2022. |
Affiliated Investment Companies | Value, Beginning of Period | Purchases at Cost | Proceeds from Sales | Net Realized Gain/(Loss) on Sales | Change in Unrealized Appreciation/ (Depreciation) | Value, End of Period | Dividend Income | Other Distributions | Shares End of Period |
IQ 50 Percent Hedged FTSE International ETF | $ 9,607 | $ 282 | $ (126) | $ (10) | $ (907) | $ 8,846 | $ 109 | $ — | 391 |
IQ 500 International ETF | 20,659 | 603 | (1,943) | 122 | (2,073) | 17,368 | 341 | — | 584 |
IQ Candriam ESG International Equity ETF | 20,184 | 648 | (791) | (35) | (2,849) | 17,157 | 224 | — | 665 |
IQ Candriam ESG U.S. Equity ETF | 45,944 | 520 | (5,653) | 737 | (5,307) | 36,241 | 248 | — | 1,020 |
IQ Chaikin U.S. Large Cap ETF | 31,234 | 3,456 | (66) | (5) | (2,752) | 31,867 | 205 | — | 989 |
IQ Chaikin U.S. Small Cap ETF | 26,204 | 3,804 | (87) | (6) | (3,591) | 26,324 | 202 | — | 828 |
MainStay Candriam Emerging Markets Equity Fund Class R6 | 23,328 | 2,923 | (641) | (79) | (4,675) | 20,856 | 209 | — | 2,017 |
MainStay Epoch Capital Growth Fund Class I | 1,805 | 434 | (52) | (3) | (707) | 1,477 | 2 | 402 | 135 |
MainStay Epoch International Choice Fund Class I | 16,037 | 1,361 | (243) | (17) | (2,891) | 14,247 | 410 | — | 418 |
MainStay Epoch U.S. Equity Yield Fund Class R6 | 35,655 | 369 | (1,597) | 25 | (427) | 34,025 | 349 | — | 1,729 |
MainStay MacKay International Equity Fund Class R6 | 14,977 | 4,531 | (277) | (105) | (5,372) | 13,754 | 57 | 1,852 | 845 |
MainStay S&P 500 Index Fund Class I (a) | 35,121 | 1,589 | (23,309) | 5,501 | (8,739) | 10,163 | 380 | 1,209 | 193 |
MainStay U.S. Government Liquidity Fund | 17,193 | 18,230 | (20,315) | — | — | 15,108 | 3 | — | 15,108 |
MainStay Winslow Large Cap Growth Fund Class R6 | 46,321 | 11,917 | (4,540) | 47 | (19,039) | 34,706 | — | 8,567 | 3,345 |
MainStay WMC Enduring Capital Fund Class R6 | 28,553 | 8,790 | (197) | (31) | (5,351) | 31,764 | 95 | 2,339 | 1,024 |
MainStay WMC Growth Fund Class R6 | 38,251 | 13,681 | — | — | (17,454) | 34,478 | — | 7,636 | 978 |
MainStay WMC International Research Equity Fund Class I | 15,897 | 1,282 | (292) | (24) | (2,825) | 14,038 | 419 | — | 2,069 |
MainStay WMC Small Companies Fund Class I | 26,834 | 9,514 | — | — | (8,892) | 27,456 | — | 6,163 | 1,164 |
MainStay WMC Value Fund Class R6 | 36,016 | 16,279 | (2,098) | (9) | (16,943) | 33,245 | 337 | 15,933 | 1,098 |
$489,820 | $100,213 | $(62,227) | $6,108 | $(110,794) | $423,120 | $3,590 | $44,101 |
(a) | Prior to February 28, 2022, known as MainStay MacKay S&P 500 Index Fund Class I. |
Swap Counterparty | Reference Obligation | Floating Rate2 | Termination Date(s) | Payment Frequency Paid/ Received | Notional Amount Long/ (Short) (000)3 | Unrealized Appreciation/ (Depreciation)4 |
Citibank NA | Invesco S&P 500 Low Volatility ETF | 1 day FEDF plus 0.45% | 12/2/22 | Daily | 6,777 | $ — |
Citibank NA | iShares Semiconductor ETF | 1 day FEDF plus 0.35% | 12/2/22 | Daily | 1,295 | — |
Citibank NA | Russell 1000 Growth Total Return Index | 1 day FEDF minus 0.20% | 12/2/22 | Daily | (12,293) | — |
Citibank NA | Russell 1000 Value Total Return Index | 1 day FEDF | 12/2/22 | Daily | (2,124) | — |
Citibank NA | Russell Midcap Total Return Index | 1 day FEDF plus 0.40% | 12/2/22 | Daily | 7,689 | — |
Citibank NA | S&P 500 Financials Sector | 1 day FEDF plus 0.18% | 12/2/22 | Daily | (3,737) | — |
Citibank NA | S&P 500 Health Care Sector | 1 day FEDF plus 0.45% | 12/2/22 | Daily | 2,185 | — |
Citibank NA | S&P 500 Industrials Sector | 1 day FEDF plus 0.20% | 12/2/22 | Daily | (2,860) | — |
Citibank NA | S&P 500 Total Return Index | 1 day FEDF plus 0.11% | 12/2/22 | Daily | (600) | — |
Citibank NA | S&P 600 Total Return | 1 day FEDF plus 0.40% | 12/2/22 | Daily | 13,250 | — |
Citibank NA | SPDR S&P Oil & Gas Exploration & Production ETF | 1 day FEDF plus 0.40% | 12/2/22 | Daily | 3,456 | — |
Citibank NA | VanEck Gold Miners ETF | 1 day FEDF plus 0.55% | 12/2/22 | Daily | 2,612 | — |
66 | MainStay Equity Allocation Fund |
Swap Counterparty | Reference Obligation | Floating Rate2 | Termination Date(s) | Payment Frequency Paid/ Received | Notional Amount Long/ (Short) (000)3 | Unrealized Appreciation/ (Depreciation)4 |
Citibank NA | VanEck Oil Services ETF | 1 day FEDF plus 0.40% | 12/2/22 | Daily | 3,141 | $ — |
$ — |
1. | As of April 30, 2022, cash in the amount $422,772 was pledged from brokers for OTC swap contracts. |
2. | Fund pays the floating rate and receives the total return of the reference entity. |
3. | Notional amounts reflected as a positive value indicate a long position held by the Fund or Index and a negative value indicates a short position. |
4. | Reflects the value at reset date as of April 30, 2022. |
Abbreviation(s): |
ETF—Exchange-Traded Fund |
FEDF—Federal Funds Rate |
FTSE—Financial Times Stock Exchange |
SPDR—Standard & Poor’s Depositary Receipt |
Description | Quoted Prices in Active Markets for Identical Assets (Level 1) | Significant Other Observable Inputs (Level 2) | Significant Unobservable Inputs (Level 3) | Total |
Asset Valuation Inputs | ||||
Investments in Securities (a) | ||||
Affiliated Investment Companies | ||||
Equity Funds | $ 408,011,911 | $ — | $ — | $ 408,011,911 |
Short-Term Investment | ||||
Affiliated Investment Company | 15,108,339 | — | — | 15,108,339 |
Total Investments in Securities | $ 423,120,250 | $ — | $ — | $ 423,120,250 |
(a) | For a complete listing of investments, see the Portfolio of Investments. |
Assets | |
Investment in affiliated investment companies, at value (identified cost $386,848,074) | $423,120,250 |
Cash | 209,287 |
Cash collateral on deposit at broker for swap contracts | 422,772 |
Receivables: | |
Fund shares sold | 165,350 |
Manager (See Note 3) | 2,380 |
Interest | 1,858 |
Other assets | 77,923 |
Total assets | 423,999,820 |
Liabilities | |
Payables: | |
Dividends and interest on OTC swaps contracts | 458,918 |
Fund shares redeemed | 280,601 |
Transfer agent (See Note 3) | 169,266 |
NYLIFE Distributors (See Note 3) | 109,247 |
Shareholder communication | 65,828 |
Custodian | 12,174 |
Professional fees | 11,558 |
Trustees | 467 |
Accrued expenses | 2,085 |
Total liabilities | 1,110,144 |
Net assets | $422,889,676 |
Composition of Net Assets | |
Shares of beneficial interest outstanding (par value of $.001 per share) unlimited number of shares authorized | $27,370 |
Additional paid-in-capital | 353,656,335 |
353,683,705 | |
Total distributable earnings (loss) | 69,205,971 |
Net assets | $422,889,676 |
Class A | |
Net assets applicable to outstanding shares | $326,496,300 |
Shares of beneficial interest outstanding | 21,087,880 |
Net asset value per share outstanding | $15.48 |
Maximum sales charge (3.00% of offering price) | 0.48 |
Maximum offering price per share outstanding | $15.96 |
Investor Class | |
Net assets applicable to outstanding shares | $61,510,819 |
Shares of beneficial interest outstanding | 3,973,561 |
Net asset value per share outstanding | $15.48 |
Maximum sales charge (2.50% of offering price) | 0.40 |
Maximum offering price per share outstanding | $15.88 |
Class B | |
Net assets applicable to outstanding shares | $13,642,477 |
Shares of beneficial interest outstanding | 914,633 |
Net asset value and offering price per share outstanding | $14.92 |
Class C | |
Net assets applicable to outstanding shares | $12,572,888 |
Shares of beneficial interest outstanding | 841,163 |
Net asset value and offering price per share outstanding | $14.95 |
Class I | |
Net assets applicable to outstanding shares | $5,907,497 |
Shares of beneficial interest outstanding | 373,280 |
Net asset value and offering price per share outstanding | $15.83 |
Class R3 | |
Net assets applicable to outstanding shares | $1,973,658 |
Shares of beneficial interest outstanding | 128,512 |
Net asset value and offering price per share outstanding | $15.36 |
SIMPLE Class | |
Net assets applicable to outstanding shares | $786,037 |
Shares of beneficial interest outstanding | 50,788 |
Net asset value and offering price per share outstanding | $15.48 |
68 | MainStay Equity Allocation Fund |
Investment Income (Loss) | |
Income | |
Dividend distributions from affiliated investment companies | $3,590,149 |
Expenses | |
Distribution/Service—Class A (See Note 3) | 447,787 |
Distribution/Service—Investor Class (See Note 3) | 85,410 |
Distribution/Service—Class B (See Note 3) | 82,358 |
Distribution/Service—Class C (See Note 3) | 72,552 |
Distribution/Service—Class R3 (See Note 3) | 5,214 |
Distribution/Service—SIMPLE Class (See Note 3) | 1,631 |
Transfer agent (See Note 3) | 297,343 |
Registration | 50,644 |
Professional fees | 28,867 |
Custodian | 15,658 |
Shareholder communication | 15,635 |
Trustees | 4,834 |
Shareholder service (See Note 3) | 1,043 |
Miscellaneous | 12,278 |
Total expenses before waiver/reimbursement | 1,121,254 |
Expense waiver/reimbursement from Manager (See Note 3) | (59,203) |
Net expenses | 1,062,051 |
Net investment income (loss) | 2,528,098 |
Realized and Unrealized Gain (Loss) | |
Net realized gain (loss) on: | |
Affiliated investment company transactions | 6,107,706 |
Realized capital gain distributions from affiliated investment companies | 44,100,837 |
Swap transactions | (210,814) |
Net realized gain (loss) | 49,997,729 |
Net change in unrealized appreciation (depreciation) on: Affiliated investments companies | (110,794,390) |
Net realized and unrealized gain (loss) | (60,796,661) |
Net increase (decrease) in net assets resulting from operations | $(58,268,563) |
for the six months ended April 30, 2022 (Unaudited) and the year ended October 31, 2021
2022 | 2021 | |
Increase (Decrease) in Net Assets | ||
Operations: | ||
Net investment income (loss) | $2,528,098 | $2,356,690 |
Net realized gain (loss) | 49,997,729 | 42,435,715 |
Net change in unrealized appreciation (depreciation) | (110,794,390) | 100,435,412 |
Net increase (decrease) in net assets resulting from operations | (58,268,563) | 145,227,817 |
Distributions to shareholders: | ||
Class A | (42,722,061) | (14,572,968) |
Investor Class | (7,837,075) | (3,373,691) |
Class B | (1,882,929) | (929,852) |
Class C | (1,656,670) | (786,948) |
Class I | (777,037) | (264,076) |
Class R3 | (237,105) | (71,345) |
SIMPLE Class | (69,631) | (3,946) |
Total distributions to shareholders | (55,182,508) | (20,002,826) |
Capital share transactions: | ||
Net proceeds from sales of shares | 22,232,395 | 41,972,232 |
Net asset value of shares issued to shareholders in reinvestment of distributions | 54,835,251 | 19,905,540 |
Cost of shares redeemed | (30,714,266) | (70,932,485) |
Increase (decrease) in net assets derived from capital share transactions | 46,353,380 | (9,054,713) |
Net increase (decrease) in net assets | (67,097,691) | 116,170,278 |
Net Assets | ||
Beginning of period | 489,987,367 | 373,817,089 |
End of period | $422,889,676 | $489,987,367 |
70 | MainStay Equity Allocation Fund |
Six months ended April 30, 2022* | Year Ended October 31, | |||||
Class A | 2021 | 2020 | 2019 | 2018 | 2017 | |
Net asset value at beginning of period | $19.80 | $14.86 | $15.10 | $15.60 | $17.01 | $14.37 |
Net investment income (loss) (a) | 0.10 | 0.11 | 0.19 | 0.15 | 0.12 | 0.12 |
Net realized and unrealized gain (loss) | (2.17) | 5.64 | 0.38 | 0.93 | (0.59) | 3.08 |
Total from investment operations | (2.07) | 5.75 | 0.57 | 1.08 | (0.47) | 3.20 |
Less distributions: | ||||||
From net investment income | (0.86) | (0.08) | (0.28) | (0.18) | (0.36) | (0.13) |
From net realized gain on investments | (1.39) | (0.73) | (0.53) | (1.40) | (0.58) | (0.43) |
Total distributions | (2.25) | (0.81) | (0.81) | (1.58) | (0.94) | (0.56) |
Net asset value at end of period | $15.48 | $19.80 | $14.86 | $15.10 | $15.60 | $17.01 |
Total investment return (b) | (11.99)% | 39.73% | 3.70% | 8.72% | (3.15)% | 22.91% |
Ratios (to average net assets)/Supplemental Data: | ||||||
Net investment income (loss) | 1.16%†† | 0.60% | 1.29% | 1.06% | 0.69% | 0.73% |
Net expenses (c) | 0.37%†† | 0.38% | 0.41% | 0.43% | 0.38% | 0.40% |
Portfolio turnover rate | 9% | 27% | 36% | 35% | 48% | 30% |
Net assets at end of period (in 000’s) | $326,496 | $372,926 | $258,743 | $248,068 | $236,201 | $242,172 |
* | Unaudited. |
†† | Annualized. |
(a) | Per share data based on average shares outstanding during the period. |
(b) | Total investment return is calculated exclusive of sales charges and assumes the reinvestment of dividends and distributions. For periods of less than one year, total return is not annualized. |
(c) | In addition to the fees and expenses which the Fund bears directly, it also indirectly bears a pro-rata share of the fees and expenses of the underlying funds in which it invests. Such indirect expenses are not included in the above expense ratios. |
Six months ended April 30, 2022* | Year Ended October 31, | |||||
Investor Class | 2021 | 2020 | 2019 | 2018 | 2017 | |
Net asset value at beginning of period | $19.78 | $14.84 | $15.08 | $15.58 | $16.98 | $14.34 |
Net investment income (loss) (a) | 0.09 | 0.09 | 0.17 | 0.13 | 0.09 | 0.09 |
Net realized and unrealized gain (loss) | (2.17) | 5.62 | 0.38 | 0.93 | (0.59) | 3.09 |
Total from investment operations | (2.08) | 5.71 | 0.55 | 1.06 | (0.50) | 3.18 |
Less distributions: | ||||||
From net investment income | (0.83) | (0.04) | (0.26) | (0.16) | (0.32) | (0.11) |
From net realized gain on investments | (1.39) | (0.73) | (0.53) | (1.40) | (0.58) | (0.43) |
Total distributions | (2.22) | (0.77) | (0.79) | (1.56) | (0.90) | (0.54) |
Net asset value at end of period | $15.48 | $19.78 | $14.84 | $15.08 | $15.58 | $16.98 |
Total investment return (b) | (12.04)% | 39.50% | 3.55% | 8.52% | (3.34)% | 22.80% |
Ratios (to average net assets)/Supplemental Data: | ||||||
Net investment income (loss) | 1.01%†† | 0.48% | 1.18% | 0.89% | 0.56% | 0.61% |
Net expenses (c) | 0.55%†† | 0.55% | 0.55% | 0.55% | 0.55% | 0.55% |
Expenses (before waiver/reimbursement) (c) | 0.67%†† | 0.71% | 0.72% | 0.72% | 0.64% | 0.59% |
Portfolio turnover rate | 9% | 27% | 36% | 35% | 48% | 30% |
Net assets at end of period (in 000's) | $61,511 | $73,138 | $73,492 | $75,913 | $66,924 | $71,378 |
* | Unaudited. |
†† | Annualized. |
(a) | Per share data based on average shares outstanding during the period. |
(b) | Total investment return is calculated exclusive of sales charges and assumes the reinvestment of dividends and distributions. For periods of less than one year, total return is not annualized. |
(c) | In addition to the fees and expenses which the Fund bears directly, it also indirectly bears a pro-rata share of the fees and expenses of the underlying funds in which it invests. Such indirect expenses are not included in the above expense ratios. |
Six months ended April 30, 2022* | Year Ended October 31, | |||||
Class B | 2021 | 2020 | 2019 | 2018 | 2017 | |
Net asset value at beginning of period | $19.07 | $14.40 | $14.64 | $15.13 | $16.51 | $13.96 |
Net investment income (loss) (a) | 0.02 | (0.03) | 0.08 | 0.04 | (0.02) | (0.01) |
Net realized and unrealized gain (loss) | (2.09) | 5.43 | 0.34 | 0.89 | (0.60) | 2.99 |
Total from investment operations | (2.07) | 5.40 | 0.42 | 0.93 | (0.62) | 2.98 |
Less distributions: | ||||||
From net investment income | (0.69) | — | (0.13) | (0.02) | (0.18) | (0.00)‡ |
From net realized gain on investments | (1.39) | (0.73) | (0.53) | (1.40) | (0.58) | (0.43) |
Total distributions | (2.08) | (0.73) | (0.66) | (1.42) | (0.76) | (0.43) |
Net asset value at end of period | $14.92 | $19.07 | $14.40 | $14.64 | $15.13 | $16.51 |
Total investment return (b) | (12.36)% | 38.44% | 2.80% | 7.73% | (4.09)% | 21.85% |
Ratios (to average net assets)/Supplemental Data: | ||||||
Net investment income (loss) | 0.29%†† | (0.19)% | 0.55% | 0.28% | (0.13)% | (0.05)% |
Net expenses (c) | 1.30%†† | 1.30% | 1.30% | 1.30% | 1.30% | 1.30% |
Expenses (before waiver/reimbursement) (c) | 1.42%†† | 1.46% | 1.47% | 1.47% | 1.39% | 1.35% |
Portfolio turnover rate | 9% | 27% | 36% | 35% | 48% | 30% |
Net assets at end of period (in 000’s) | $13,642 | $18,670 | $19,651 | $25,905 | $32,586 | $43,643 |
* | Unaudited. |
‡ | Less than one cent per share. |
†† | Annualized. |
(a) | Per share data based on average shares outstanding during the period. |
(b) | Total investment return is calculated exclusive of sales charges and assumes the reinvestment of dividends and distributions. For periods of less than one year, total return is not annualized. |
(c) | In addition to the fees and expenses which the Fund bears directly, it also indirectly bears a pro-rata share of the fees and expenses of the underlying funds in which it invests. Such indirect expenses are not included in the above expense ratios. |
72 | MainStay Equity Allocation Fund |
Six months ended April 30, 2022* | Year Ended October 31, | |||||
Class C | 2021 | 2020 | 2019 | 2018 | 2017 | |
Net asset value at beginning of period | $19.11 | $14.42 | $14.66 | $15.15 | $16.53 | $13.97 |
Net investment income (loss) (a) | 0.02 | (0.04) | 0.07 | 0.05 | (0.03) | (0.02) |
Net realized and unrealized gain (loss) | (2.10) | 5.46 | 0.35 | 0.88 | (0.59) | 3.01 |
Total from investment operations | (2.08) | 5.42 | 0.42 | 0.93 | (0.62) | 2.99 |
Less distributions: | ||||||
From net investment income | (0.69) | — | (0.13) | (0.02) | (0.18) | (0.00)‡ |
From net realized gain on investments | (1.39) | (0.73) | (0.53) | (1.40) | (0.58) | (0.43) |
Total distributions | (2.08) | (0.73) | (0.66) | (1.42) | (0.76) | (0.43) |
Net asset value at end of period | $14.95 | $19.11 | $14.42 | $14.66 | $15.15 | $16.53 |
Total investment return (b) | (12.39)% | 38.53% | 2.79% | 7.72% | (4.08)% | 21.90% |
Ratios (to average net assets)/Supplemental Data: | ||||||
Net investment income (loss) | 0.27%†† | (0.25)% | 0.49% | 0.33% | (0.16)% | (0.15)% |
Net expenses (c) | 1.30%†† | 1.30% | 1.30% | 1.30% | 1.30% | 1.30% |
Expenses (before waiver/reimbursement) (c) | 1.42%†† | 1.46% | 1.47% | 1.47% | 1.39% | 1.35% |
Portfolio turnover rate | 9% | 27% | 36% | 35% | 48% | 30% |
Net assets at end of period (in 000’s) | $12,573 | $16,001 | $15,805 | $18,411 | $23,998 | $29,233 |
* | Unaudited. |
‡ | Less than one cent per share. |
†† | Annualized. |
(a) | Per share data based on average shares outstanding during the period. |
(b) | Total investment return is calculated exclusive of sales charges and assumes the reinvestment of dividends and distributions. For periods of less than one year, total return is not annualized. |
(c) | In addition to the fees and expenses which the Fund bears directly, it also indirectly bears a pro-rata share of the fees and expenses of the underlying funds in which it invests. Such indirect expenses are not included in the above expense ratios. |
Six months ended April 30, 2022* | Year Ended October 31, | |||||
Class I | 2021 | 2020 | 2019 | 2018 | 2017 | |
Net asset value at beginning of period | $20.21 | $15.15 | $15.37 | $15.86 | $17.29 | $14.59 |
Net investment income (loss) (a) | 0.13 | 0.16 | 0.24 | 0.21 | 0.16 | 0.15 |
Net realized and unrealized gain (loss) | (2.22) | 5.74 | 0.39 | 0.93 | (0.61) | 3.15 |
Total from investment operations | (2.09) | 5.90 | 0.63 | 1.14 | (0.45) | 3.30 |
Less distributions: | ||||||
From net investment income | (0.90) | (0.11) | (0.32) | (0.23) | (0.40) | (0.17) |
From net realized gain on investments | (1.39) | (0.73) | (0.53) | (1.40) | (0.58) | (0.43) |
Total distributions | (2.29) | (0.84) | (0.85) | (1.63) | (0.98) | (0.60) |
Net asset value at end of period | $15.83 | $20.21 | $15.15 | $15.37 | $15.86 | $17.29 |
Total investment return (b) | (11.83)% | 40.05% | 4.02% | 8.97% | (2.98)% | 23.27% |
Ratios (to average net assets)/Supplemental Data: | ||||||
Net investment income (loss) | 1.44%†† | 0.86% | 1.60% | 1.40% | 0.96% | 0.95% |
Net expenses (c) | 0.12%†† | 0.13% | 0.16% | 0.16% | 0.13% | 0.15% |
Portfolio turnover rate | 9% | 27% | 36% | 35% | 48% | 30% |
Net assets at end of period (in 000’s) | $5,907 | $6,649 | $4,727 | $4,894 | $5,915 | $6,751 |
* | Unaudited. |
†† | Annualized. |
(a) | Per share data based on average shares outstanding during the period. |
(b) | Total investment return is calculated exclusive of sales charges and assumes the reinvestment of dividends and distributions. Class I shares are not subject to sales charges. For periods of less than one year, total return is not annualized. |
(c) | In addition to the fees and expenses which the Fund bears directly, it also indirectly bears a pro-rata share of the fees and expenses of the underlying funds in which it invests. Such indirect expenses are not included in the above expense ratios. |
Six months ended April 30, 2022* | Year Ended October 31, | |||||
Class R3 | 2021 | 2020 | 2019 | 2018 | 2017 | |
Net asset value at beginning of period | $19.63 | $14.74 | $15.00 | $15.51 | $16.96 | $14.34 |
Net investment income (loss) (a) | 0.07 | 0.04 | 0.11 | 0.06 | 0.00‡ | 0.01 |
Net realized and unrealized gain (loss) | (2.16) | 5.61 | 0.40 | 0.97 | (0.53) | 3.13 |
Total from investment operations | (2.09) | 5.65 | 0.51 | 1.03 | (0.53) | 3.14 |
Less distributions: | ||||||
From net investment income | (0.79) | (0.03) | (0.24) | (0.14) | (0.34) | (0.09) |
From net realized gain on investments | (1.39) | (0.73) | (0.53) | (1.40) | (0.58) | (0.43) |
Total distributions | (2.18) | (0.76) | (0.77) | (1.54) | (0.92) | (0.52) |
Net asset value at end of period | $15.36 | $19.63 | $14.74 | $15.00 | $15.51 | $16.96 |
Total investment return (b) | (12.13)% | 39.29% | 3.30% | 8.34% | (3.51)% | 22.46% |
Ratios (to average net assets)/Supplemental Data: | ||||||
Net investment income (loss) | 0.80%†† | 0.23% | 0.78% | 0.40% | 0.01% | 0.06% |
Net expenses (c) | 0.72%†† | 0.73% | 0.76% | 0.77% | 0.73% | 0.73% |
Portfolio turnover rate | 9% | 27% | 36% | 35% | 48% | 30% |
Net assets at end of period (in 000’s) | $1,974 | $2,140 | $1,375 | $1,060 | $405 | $204 |
* | Unaudited. |
‡ | Less than one cent per share. |
†† | Annualized. |
(a) | Per share data based on average shares outstanding during the period. |
(b) | Total investment return is calculated exclusive of sales charges and assumes the reinvestment of dividends and distributions. Class R3 shares are not subject to sales charges. For periods of less than one year, total return is not annualized. |
(c) | In addition to the fees and expenses which the Fund bears directly, it also indirectly bears a pro-rata share of the fees and expenses of the underlying funds in which it invests. Such indirect expenses are not included in the above expense ratios. |
74 | MainStay Equity Allocation Fund |
Six months ended April 30, 2022* | Year Ended October 31, | August 31, 2020^ through October 31, | |
SIMPLE Class | 2021 | 2020 | |
Net asset value at beginning of period | $19.75 | $14.84 | $15.70** |
Net investment income (loss) (a) | 0.05 | (0.01) | (0.01) |
Net realized and unrealized gain (loss) | (2.15) | 5.68 | (0.85) |
Total from investment operations | (2.10) | 5.67 | (0.86) |
Less distributions: | |||
From net investment income | (0.78) | (0.03) | — |
From net realized gain on investments | (1.39) | (0.73) | — |
Total distributions | (2.17) | (0.76) | — |
Net asset value at end of period | $15.48 | $19.75 | $14.84 |
Total investment return (b) | (12.12)% | 39.15% | (5.48)% |
Ratios (to average net assets)/Supplemental Data: | |||
Net investment income (loss) | 0.58%†† | (0.07)% | (0.27)%†† |
Net expenses (c) | 0.80%†† | 0.80% | 0.80%†† |
Expenses (before waiver/reimbursement) (c) | 0.91%†† | 0.96% | 0.97%†† |
Portfolio turnover rate | 9% | 27% | 36% |
Net assets at end of period (in 000’s) | $786 | $463 | $24 |
* | Unaudited. |
^ | Inception date. |
** | Based on the net asset value of Investor Class as of August 31, 2020. |
†† | Annualized. |
(a) | Per share data based on average shares outstanding during the period. |
(b) | Total investment return is calculated exclusive of sales charges and assumes the reinvestment of dividends and distributions. SIMPLE Class shares are not subject to sales charges. For periods of less than one year, total return is not annualized. |
(c) | In addition to the fees and expenses which the Fund bears directly, it also indirectly bears a pro-rata share of the fees and expenses of the underlying funds in which it invests. Such indirect expenses are not included in the above expense ratios. |
Fund | Share Classes Commenced Operations1 |
MainStay Conservative Allocation Fund2 | Class A, Investor Class, Class B, Class C, Class I, Class R2, Class R3 and SIMPLE Class |
MainStay Moderate Allocation Fund2 | Class A, Investor Class, Class B, Class C, Class I, Class R2, Class R3 and SIMPLE Class |
MainStay Growth Allocation Fund | Class A, Investor Class, Class B, Class C, Class I, Class R2, Class R3 and SIMPLE Class |
MainStay Equity Allocation Fund2,3 | Class A, Investor Class, Class B, Class C, Class I, Class R2, Class R3 and SIMPLE Class |
76 | MainStay Asset Allocation Funds |
78 | MainStay Asset Allocation Funds |
Net Realized Gain (Loss) from: | Equity Contracts Risk | Total |
Swap Contracts | $(483,751) | $(483,751) |
Total Net Realized Gain (Loss) | $(483,751) | $(483,751) |
Average Notional Amount | Total |
Swap Contracts Long | $70,672,452 |
Swap Contracts Short | $(26,613,393) |
Net Realized Gain (Loss) from: | Equity Contracts Risk | Total |
Swap Contracts | $(206,211) | $(206,211) |
Total Net Realized Gain (Loss) | $(206,211) | $(206,211) |
Average Notional Amount | Total |
Swap Contracts Long | $124,314,265 |
Swap Contracts Short | $(47,825,512) |
80 | MainStay Asset Allocation Funds |
Net Realized Gain (Loss) from: | Equity Contracts Risk | Total |
Swap Contracts | $(623,215) | $(623,215) |
Total Net Realized Gain (Loss) | $(623,215) | $(623,215) |
Average Notional Amount | Total |
Swap Contracts Long | $125,976,527 |
Swap Contracts Short | $(49,475,970) |
Net Realized Gain (Loss) from: | Equity Contracts Risk | Total |
Swap Contracts | $(210,814) | $(210,814) |
Total Net Realized Gain (Loss) | $(210,814) | $(210,814) |
Average Notional Amount | Total |
Swap Contracts Long | $48,162,857 |
Swap Contracts Short | $(29,625,203) |
Fund | Class A | Investor Class | Class B | Class C | Class I | Class R1 | Class R2 | Class R3 | SIMPLE Class |
MainStay Conservative Allocation Fund | 0.50% | 0.55% | 1.30% | 1.30% | 0.25% | N/A | 0.60% | 0.85% | 0.80% |
MainStay Moderate Allocation Fund | 0.50 | 0.55 | 1.30 | 1.30 | 0.25 | N/A | 0.60 | 0.85 | 0.80 |
MainStay Growth Allocation Fund | 0.50 | 0.55 | 1.30 | 1.30 | 0.25 | 0.35% | 0.60 | 0.85 | 0.80 |
MainStay Equity Allocation Fund | 0.50 | 0.55 | 1.30 | 1.30 | 0.25 | N/A | N/A | 0.85 | 0.80 |
Fund | Total |
MainStay Conservative Allocation Fund | $21,876 |
MainStay Moderate Allocation Fund | 73,160 |
MainStay Growth Allocation Fund | 82,463 |
MainStay Equity Allocation Fund | 59,203 |
MainStay Conservative Allocation Fund | |
Class R2 | $70 |
Class R3 | 911 |
MainStay Moderate Allocation Fund | |
Class R2 | $86 |
Class R3 | 795 |
82 | MainStay Asset Allocation Funds |
MainStay Growth Allocation Fund | |
Class R1 | $28 |
Class R2 | 44 |
Class R3 | 726 |
MainStay Equity Allocation Fund | |
Class R3 | $1,043 |
MainStay Conservative Allocation Fund | |
Class A | $19,848 |
Investor Class | 5,736 |
MainStay Moderate Allocation Fund | |
Class A | $44,814 |
Investor Class | 18,712 |
MainStay Growth Allocation Fund | |
Class A | $42,441 |
Investor Class | 17,390 |
MainStay Equity Allocation Fund | |
Class A | $22,213 |
Investor Class | 10,990 |
MainStay Conservative Allocation Fund | |
Class A | $9,847 |
Class B | 31,275 |
Class C | 1,191 |
MainStay Moderate Allocation Fund | |
Class A | $2,446 |
Investor Class | 25 |
Class B | 2,614 |
Class C | 1,883 |
MainStay Growth Allocation Fund | |
Class A | $6,695 |
Investor Class | 22 |
Class B | 2,337 |
Class C | 1,104 |
MainStay Equity Allocation Fund | |
Class A | $1,409 |
Class C | 273 |
MainStay Conservative Allocation Fund | Expense | Waived |
Class A | $99,093 | $ — |
Investor Class | 59,327 | — |
Class B | 14,911 | — |
Class C | 41,034 | — |
Class I | 2,020 | — |
Class R2 | 34 | — |
Class R3 | 446 | — |
SIMPLE Class | 907 | — |
MainStay Moderate Allocation Fund | Expense | Waived |
Class A | $175,993 | $ — |
Investor Class | 172,497 | — |
Class B | 42,932 | — |
Class C | 49,325 | — |
Class I | 2,711 | — |
Class R2 | 43 | — |
Class R3 | 400 | — |
SIMPLE Class | 2,526 | — |
MainStay Growth Allocation Fund | Expense | Waived |
Class A | $200,069 | $ — |
Investor Class | 204,427 | — |
Class B | 48,376 | — |
Class C | 48,120 | — |
Class I | 2,331 | — |
Class R1 | 16 | — |
Class R2 | 25 | — |
Class R3 | 414 | — |
SIMPLE Class | 3,518 | — |
MainStay Equity Allocation Fund | Expense | Waived |
Class A | $113,305 | $ — |
Investor Class | 123,777 | — |
Class B | 30,027 | — |
Class C | 26,362 | — |
Class I | 2,059 | — |
Class R3 | 660 | — |
SIMPLE Class | 1,153 | — |
MainStay Conservative Allocation Fund | ||
SIMPLE Class | $25,424 | 2.7% |
MainStay Moderate Allocation Fund | ||
SIMPLE Class | $26,575 | 1.4% |
MainStay Growth Allocation Fund | ||
SIMPLE Class | $28,009 | 1.3% |
MainStay Equity Allocation Fund | ||
SIMPLE Class | $28,895 | 3.7% |
MainStay Conservative Allocation Fund | ||||
Federal Tax Cost | Gross Unrealized Appreciation | Gross Unrealized (Depreciation) | Net Unrealized Appreciation/ (Depreciation) | |
Investments in Securities | $460,197,617 | $22,020,726 | $(23,292,159) | $(1,271,433) |
MainStay Moderate Allocation Fund | ||||
Federal Tax Cost | Gross Unrealized Appreciation | Gross Unrealized (Depreciation) | Net Unrealized Appreciation/ (Depreciation) | |
Investments in Securities | $784,176,642 | $54,186,940 | $(32,898,417) | $21,288,523 |
MainStay Growth Allocation Fund | ||||
Federal Tax Cost | Gross Unrealized Appreciation | Gross Unrealized (Depreciation) | Net Unrealized Appreciation/ (Depreciation) | |
Investments in Securities | $751,708,227 | $78,427,575 | $(17,036,388) | $61,391,187 |
MainStay Equity Allocation Fund | ||||
Federal Tax Cost | Gross Unrealized Appreciation | Gross Unrealized (Depreciation) | Net Unrealized Appreciation/ (Depreciation) | |
Investments in Securities | $391,244,575 | $41,550,401 | $(9,674,726) | $31,875,675 |
84 | MainStay Asset Allocation Funds |
2021 | |||
Fund | Ordinary Income | Long-Term Capital Gains | Total |
MainStay Conservative Allocation Fund | $6,972,852 | $13,593,913 | $20,566,765 |
MainStay Moderate Allocation Fund | 13,578,645 | 29,884,143 | 43,462,788 |
MainStay Growth Allocation Fund | 8,096,188 | 33,118,632 | 41,214,820 |
MainStay Equity Allocation Fund | 2,177,837 | 17,824,989 | 20,002,826 |
Fund | Purchases | Sales |
MainStay Conservative Allocation Fund | $99,234 | $79,770 |
MainStay Moderate Allocation Fund | 173,385 | 118,664 |
MainStay Growth Allocation Fund | 139,183 | 92,586 |
MainStay Equity Allocation Fund | 81,984 | 41,913 |
Class A | Shares | Amount |
Six-month period ended April 30, 2022: | ||
Shares sold | 2,182,520 | $27,569,842 |
Shares issued to shareholders in reinvestment of distributions | 2,282,425 | 28,937,034 |
Shares redeemed | (2,744,957) | (34,159,114) |
Net increase (decrease) in shares outstanding before conversion | 1,719,988 | 22,347,762 |
Shares converted into Class A (See Note 1) | 359,048 | 4,612,693 |
Net increase (decrease) | 2,079,036 | $26,960,455 |
Year ended October 31, 2021: | ||
Shares sold | 3,622,029 | $47,604,056 |
Shares issued to shareholders in reinvestment of distributions | 1,278,445 | 16,300,876 |
Shares redeemed | (4,209,736) | (55,202,891) |
Net increase (decrease) in shares outstanding before conversion | 690,738 | 8,702,041 |
Shares converted into Class A (See Note 1) | 1,278,968 | 16,732,719 |
Shares converted from Class A (See Note 1) | (3,704) | (47,762) |
Net increase (decrease) | 1,966,002 | $25,386,998 |
Investor Class | Shares | Amount |
Six-month period ended April 30, 2022: | ||
Shares sold | 201,264 | $2,538,574 |
Shares issued to shareholders in reinvestment of distributions | 215,731 | 2,736,063 |
Shares redeemed | (193,714) | (2,420,043) |
Net increase (decrease) in shares outstanding before conversion | 223,281 | 2,854,594 |
Shares converted into Investor Class (See Note 1) | 60,347 | 753,474 |
Shares converted from Investor Class (See Note 1) | (193,801) | (2,516,846) |
Net increase (decrease) | 89,827 | $1,091,222 |
Year ended October 31, 2021: | ||
Shares sold | 453,396 | $5,928,657 |
Shares issued to shareholders in reinvestment of distributions | 135,865 | 1,729,851 |
Shares redeemed | (393,553) | (5,154,246) |
Net increase (decrease) in shares outstanding before conversion | 195,708 | 2,504,262 |
Shares converted into Investor Class (See Note 1) | 198,558 | 2,602,063 |
Shares converted from Investor Class (See Note 1) | (766,422) | (10,067,218) |
Net increase (decrease) | (372,156) | $(4,960,893) |
Class B | Shares | Amount |
Six-month period ended April 30, 2022: | ||
Shares sold | 7,252 | $89,614 |
Shares issued to shareholders in reinvestment of distributions | 54,619 | 681,634 |
Shares redeemed | (122,061) | (1,503,148) |
Net increase (decrease) in shares outstanding before conversion | (60,190) | (731,900) |
Shares converted from Class B (See Note 1) | (109,596) | (1,356,287) |
Net increase (decrease) | (169,786) | $(2,088,187) |
Year ended October 31, 2021: | ||
Shares sold | 80,278 | $1,016,936 |
Shares issued to shareholders in reinvestment of distributions | 38,276 | 480,251 |
Shares redeemed | (139,174) | (1,791,406) |
Net increase (decrease) in shares outstanding before conversion | (20,620) | (294,219) |
Shares converted from Class B (See Note 1) | (207,082) | (2,691,195) |
Net increase (decrease) | (227,702) | $(2,985,414) |
Class C | Shares | Amount |
Six-month period ended April 30, 2022: | ||
Shares sold | 77,815 | $957,713 |
Shares issued to shareholders in reinvestment of distributions | 148,289 | 1,849,121 |
Shares redeemed | (264,534) | (3,275,116) |
Net increase (decrease) in shares outstanding before conversion | (38,430) | (468,282) |
Shares converted from Class C (See Note 1) | (120,581) | (1,493,034) |
Net increase (decrease) | (159,011) | $(1,961,316) |
Year ended October 31, 2021: | ||
Shares sold | 232,887 | $2,996,141 |
Shares issued to shareholders in reinvestment of distributions | 111,652 | 1,400,695 |
Shares redeemed | (634,837) | (8,169,894) |
Net increase (decrease) in shares outstanding before conversion | (290,298) | (3,773,058) |
Shares converted from Class C (See Note 1) | (515,459) | (6,575,466) |
Net increase (decrease) | (805,757) | $(10,348,524) |
Class I | Shares | Amount |
Six-month period ended April 30, 2022: | ||
Shares sold | 28,164 | $362,722 |
Shares issued to shareholders in reinvestment of distributions | 47,042 | 603,267 |
Shares redeemed | (86,909) | (1,090,637) |
Net increase (decrease) | (11,703) | $(124,648) |
Year ended October 31, 2021: | ||
Shares sold | 119,101 | $1,583,117 |
Shares issued to shareholders in reinvestment of distributions | 29,744 | 383,843 |
Shares redeemed | (135,168) | (1,804,019) |
Net increase (decrease) | 13,677 | $162,941 |
Class R2 | Shares | Amount |
Six-month period ended April 30, 2022: | ||
Shares sold | 842 | $10,627 |
Shares issued to shareholders in reinvestment of distributions | 788 | 9,989 |
Shares redeemed | (20) | (251) |
Net increase (decrease) | 1,610 | $20,365 |
Year ended October 31, 2021: | ||
Shares sold | 1,144 | $15,213 |
Shares issued to shareholders in reinvestment of distributions | 389 | 4,956 |
Shares redeemed | (48) | (629) |
Net increase (decrease) | 1,485 | $19,540 |
86 | MainStay Asset Allocation Funds |
Class R3 | Shares | Amount |
Six-month period ended April 30, 2022: | ||
Shares sold | 53,213 | $625,226 |
Shares issued to shareholders in reinvestment of distributions | 9,481 | 119,704 |
Shares redeemed | (780) | (10,207) |
Net increase (decrease) | 61,914 | $734,723 |
Year ended October 31, 2021: | ||
Shares sold | 44,607 | $584,978 |
Shares issued to shareholders in reinvestment of distributions | 3,966 | 50,389 |
Shares redeemed | (15,101) | (199,590) |
Net increase (decrease) | 33,472 | $435,777 |
SIMPLE Class | Shares | Amount |
Six-month period ended April 30, 2022: | ||
Shares sold | 61,625 | $765,090 |
Shares issued to shareholders in reinvestment of distributions | 2,736 | 34,627 |
Shares redeemed | (3,579) | (45,766) |
Net increase (decrease) | 60,782 | $753,951 |
Year ended October 31, 2021: | ||
Shares sold | 17,345 | $229,747 |
Shares issued to shareholders in reinvestment of distributions | 301 | 3,848 |
Shares redeemed | (969) | (12,907) |
Net increase (decrease) in shares outstanding before conversion | 16,677 | 220,688 |
Shares converted into SIMPLE Class (See Note 1) | 3,638 | 46,859 |
Net increase (decrease) | 20,315 | $267,547 |
Class A | Shares | Amount |
Six-month period ended April 30, 2022: | ||
Shares sold | 2,788,658 | $39,774,775 |
Shares issued to shareholders in reinvestment of distributions | 4,408,798 | 63,486,682 |
Shares redeemed | (2,974,483) | (42,104,821) |
Net increase (decrease) in shares outstanding before conversion | 4,222,973 | 61,156,636 |
Shares converted into Class A (See Note 1) | 761,853 | 11,263,042 |
Shares converted from Class A (See Note 1) | (19,872) | (311,908) |
Net increase (decrease) | 4,964,954 | $72,107,770 |
Year ended October 31, 2021: | ||
Shares sold | 4,076,035 | $60,817,637 |
Shares issued to shareholders in reinvestment of distributions | 2,419,820 | 34,046,873 |
Shares redeemed | (5,667,732) | (83,972,232) |
Net increase (decrease) in shares outstanding before conversion | 828,123 | 10,892,278 |
Shares converted into Class A (See Note 1) | 2,964,650 | 43,988,773 |
Shares converted from Class A (See Note 1) | (10,385) | (152,287) |
Net increase (decrease) | 3,782,388 | $54,728,764 |
Investor Class | Shares | Amount |
Six-month period ended April 30, 2022: | ||
Shares sold | 574,460 | $8,178,153 |
Shares issued to shareholders in reinvestment of distributions | 583,101 | 8,425,811 |
Shares redeemed | (365,960) | (5,220,615) |
Net increase (decrease) in shares outstanding before conversion | 791,601 | 11,383,349 |
Shares converted into Investor Class (See Note 1) | 103,880 | 1,469,831 |
Shares converted from Investor Class (See Note 1) | (493,753) | (7,360,746) |
Net increase (decrease) | 401,728 | $5,492,434 |
Year ended October 31, 2021: | ||
Shares sold | 1,247,981 | $18,511,785 |
Shares issued to shareholders in reinvestment of distributions | 382,348 | 5,394,936 |
Shares redeemed | (759,247) | (11,250,524) |
Net increase (decrease) in shares outstanding before conversion | 871,082 | 12,656,197 |
Shares converted into Investor Class (See Note 1) | 286,927 | 4,289,689 |
Shares converted from Investor Class (See Note 1) | (2,276,751) | (33,878,257) |
Net increase (decrease) | (1,118,742) | $(16,932,371) |
Class B | Shares | Amount |
Six-month period ended April 30, 2022: | ||
Shares sold | 6,586 | $91,793 |
Shares issued to shareholders in reinvestment of distributions | 137,033 | 1,960,943 |
Shares redeemed | (96,230) | (1,373,180) |
Net increase (decrease) in shares outstanding before conversion | 47,389 | 679,556 |
Shares converted from Class B (See Note 1) | (237,058) | (3,380,196) |
Net increase (decrease) | (189,669) | $(2,700,640) |
Year ended October 31, 2021: | ||
Shares sold | 29,004 | $430,134 |
Shares issued to shareholders in reinvestment of distributions | 103,272 | 1,444,773 |
Shares redeemed | (284,806) | (4,171,780) |
Net increase (decrease) in shares outstanding before conversion | (152,530) | (2,296,873) |
Shares converted from Class B (See Note 1) | (488,746) | (7,231,334) |
Net increase (decrease) | (641,276) | $(9,528,207) |
Class C | Shares | Amount |
Six-month period ended April 30, 2022: | ||
Shares sold | 82,679 | $1,151,418 |
Shares issued to shareholders in reinvestment of distributions | 160,147 | 2,290,107 |
Shares redeemed | (220,127) | (3,066,944) |
Net increase (decrease) in shares outstanding before conversion | 22,699 | 374,581 |
Shares converted from Class C (See Note 1) | (138,321) | (1,983,988) |
Net increase (decrease) | (115,622) | $(1,609,407) |
Year ended October 31, 2021: | ||
Shares sold | 182,775 | $2,686,085 |
Shares issued to shareholders in reinvestment of distributions | 123,469 | 1,726,099 |
Shares redeemed | (526,780) | (7,687,350) |
Net increase (decrease) in shares outstanding before conversion | (220,536) | (3,275,166) |
Shares converted from Class C (See Note 1) | (496,125) | (7,212,281) |
Net increase (decrease) | (716,661) | $(10,487,447) |
Class I | Shares | Amount |
Six-month period ended April 30, 2022: | ||
Shares sold | 83,393 | $1,203,341 |
Shares issued to shareholders in reinvestment of distributions | 70,570 | 1,023,972 |
Shares redeemed | (127,505) | (1,798,003) |
Net increase (decrease) in shares outstanding before conversion | 26,458 | 429,310 |
Shares converted into Class I (See Note 1) | 19,144 | 303,965 |
Net increase (decrease) | 45,602 | $733,275 |
Year ended October 31, 2021: | ||
Shares sold | 139,907 | $2,077,360 |
Shares issued to shareholders in reinvestment of distributions | 36,516 | 517,062 |
Shares redeemed | (109,545) | (1,612,749) |
Net increase (decrease) in shares outstanding before conversion | 66,878 | 981,673 |
Shares converted into Class I (See Note 1) | 5,153 | 76,769 |
Net increase (decrease) | 72,031 | $1,058,442 |
Class R2 | Shares | Amount |
Six-month period ended April 30, 2022: | ||
Shares sold | 257 | $3,713 |
Shares issued to shareholders in reinvestment of distributions | 1,079 | 15,531 |
Shares redeemed | — | (1) |
Net increase (decrease) | 1,336 | $19,243 |
Year ended October 31, 2021: | ||
Shares sold | 188 | $2,922 |
Shares issued to shareholders in reinvestment of distributions | 591 | 8,311 |
Shares redeemed | — | (2) |
Net increase (decrease) | 779 | $11,231 |
Class R3 | Shares | Amount |
Six-month period ended April 30, 2022: | ||
Shares sold | 18,695 | $263,064 |
Shares issued to shareholders in reinvestment of distributions | 9,669 | 139,128 |
Shares redeemed | (4,760) | (65,415) |
Net increase (decrease) | 23,604 | $336,777 |
Year ended October 31, 2021: | ||
Shares sold | 45,884 | $676,042 |
Shares issued to shareholders in reinvestment of distributions | 3,804 | 53,481 |
Shares redeemed | (21,774) | (318,343) |
Net increase (decrease) | 27,914 | $411,180 |
88 | MainStay Asset Allocation Funds |
SIMPLE Class | Shares | Amount |
Six-month period ended April 30, 2022: | ||
Shares sold | 89,418 | $1,271,513 |
Shares issued to shareholders in reinvestment of distributions | 6,971 | 100,733 |
Shares redeemed | (4,022) | (56,855) |
Net increase (decrease) | 92,367 | $1,315,391 |
Year ended October 31, 2021: | ||
Shares sold | 49,066 | $730,987 |
Shares issued to shareholders in reinvestment of distributions | 401 | 5,659 |
Shares redeemed | (5,879) | (85,704) |
Net increase (decrease) in shares outstanding before conversion | 43,588 | 650,942 |
Shares converted into SIMPLE Class (See Note 1) | 8,204 | 118,928 |
Net increase (decrease) | 51,792 | $769,870 |
Class A | Shares | Amount |
Six-month period ended April 30, 2022: | ||
Shares sold | 1,636,578 | $26,522,688 |
Shares issued to shareholders in reinvestment of distributions | 4,508,625 | 73,580,752 |
Shares redeemed | (2,694,821) | (43,320,849) |
Net increase (decrease) in shares outstanding before conversion | 3,450,382 | 56,782,591 |
Shares converted into Class A (See Note 1) | 765,496 | 13,049,943 |
Shares converted from Class A (See Note 1) | (699) | (10,390) |
Net increase (decrease) | 4,215,179 | $69,822,144 |
Year ended October 31, 2021: | ||
Shares sold | 3,172,649 | $53,192,811 |
Shares issued to shareholders in reinvestment of distributions | 2,020,572 | 31,376,297 |
Shares redeemed | (5,813,797) | (96,740,855) |
Net increase (decrease) in shares outstanding before conversion | (620,576) | (12,171,747) |
Shares converted into Class A (See Note 1) | 3,466,843 | 57,511,022 |
Shares converted from Class A (See Note 1) | (24,581) | (396,778) |
Net increase (decrease) | 2,821,686 | $44,942,497 |
Investor Class | Shares | Amount |
Six-month period ended April 30, 2022: | ||
Shares sold | 446,889 | $7,222,362 |
Shares issued to shareholders in reinvestment of distributions | 704,003 | 11,517,496 |
Shares redeemed | (339,714) | (5,501,806) |
Net increase (decrease) in shares outstanding before conversion | 811,178 | 13,238,052 |
Shares converted into Investor Class (See Note 1) | 100,090 | 1,603,037 |
Shares converted from Investor Class (See Note 1) | (550,922) | (9,511,202) |
Net increase (decrease) | 360,346 | $5,329,887 |
Year ended October 31, 2021: | ||
Shares sold | 1,087,072 | $18,055,508 |
Shares issued to shareholders in reinvestment of distributions | 398,601 | 6,206,219 |
Shares redeemed | (841,538) | (13,956,069) |
Net increase (decrease) in shares outstanding before conversion | 644,135 | 10,305,658 |
Shares converted into Investor Class (See Note 1) | 246,679 | 4,143,950 |
Shares converted from Investor Class (See Note 1) | (2,888,823) | (47,952,711) |
Net increase (decrease) | (1,998,009) | $(33,503,103) |
Class B | Shares | Amount |
Six-month period ended April 30, 2022: | ||
Shares sold | 1,739 | $27,727 |
Shares issued to shareholders in reinvestment of distributions | 163,164 | 2,633,473 |
Shares redeemed | (100,911) | (1,600,480) |
Net increase (decrease) in shares outstanding before conversion | 63,992 | 1,060,720 |
Shares converted from Class B (See Note 1) | (229,057) | (3,682,138) |
Net increase (decrease) | (165,065) | $(2,621,418) |
Year ended October 31, 2021: | ||
Shares sold | 9,479 | $154,168 |
Shares issued to shareholders in reinvestment of distributions | 95,067 | 1,462,126 |
Shares redeemed | (251,842) | (4,127,837) |
Net increase (decrease) in shares outstanding before conversion | (147,296) | (2,511,543) |
Shares converted from Class B (See Note 1) | (442,986) | (7,342,690) |
Net increase (decrease) | (590,282) | $(9,854,233) |
Class C | Shares | Amount |
Six-month period ended April 30, 2022: | ||
Shares sold | 64,912 | $1,032,768 |
Shares issued to shareholders in reinvestment of distributions | 161,426 | 2,607,025 |
Shares redeemed | (154,074) | (2,491,976) |
Net increase (decrease) in shares outstanding before conversion | 72,264 | 1,147,817 |
Shares converted from Class C (See Note 1) | (89,418) | (1,449,250) |
Net increase (decrease) | (17,154) | $(301,433) |
Year ended October 31, 2021: | ||
Shares sold | 132,849 | $2,172,795 |
Shares issued to shareholders in reinvestment of distributions | 95,378 | 1,467,859 |
Shares redeemed | (401,610) | (6,569,620) |
Net increase (decrease) in shares outstanding before conversion | (173,383) | (2,928,966) |
Shares converted from Class C (See Note 1) | (391,551) | (6,382,146) |
Net increase (decrease) | (564,934) | $(9,311,112) |
Class I | Shares | Amount |
Six-month period ended April 30, 2022: | ||
Shares sold | 55,649 | $877,134 |
Shares issued to shareholders in reinvestment of distributions | 46,454 | 768,348 |
Shares redeemed | (222,735) | (3,874,491) |
Net increase (decrease) | (120,632) | $(2,229,009) |
Year ended October 31, 2021: | ||
Shares sold | 148,062 | $2,486,680 |
Shares issued to shareholders in reinvestment of distributions | 30,069 | 472,689 |
Shares redeemed | (121,741) | (2,087,635) |
Net increase (decrease) in shares outstanding before conversion | 56,390 | 871,734 |
Shares converted into Class I (See Note 1) | 2,890 | 45,971 |
Shares converted from Class I (See Note 1) | (569) | (9,450) |
Net increase (decrease) | 58,711 | $908,255 |
Class R1 | Shares | Amount |
Six-month period ended April 30, 2022: (a) | ||
Shares sold | 217 | $3,599 |
Shares issued to shareholders in reinvestment of distributions | 366 | 6,054 |
Shares redeemed | (3,812) | (57,535) |
Net increase (decrease) | (3,229) | $(47,882) |
Year ended October 31, 2021: | ||
Shares sold | 927 | $15,923 |
Shares issued to shareholders in reinvestment of distributions | 122 | 1,920 |
Shares redeemed | (13) | (231) |
Net increase (decrease) | 1,036 | $17,612 |
Class R2 | Shares | Amount |
Six-month period ended April 30, 2022: | ||
Shares issued to shareholders in reinvestment of distributions | 565 | $9,226 |
Shares redeemed | (8) | (121) |
Net increase (decrease) | 557 | $9,105 |
Year ended October 31, 2021: | ||
Shares issued to shareholders in reinvestment of distributions | 322 | $4,993 |
Shares redeemed | (1,354) | (23,014) |
Net increase (decrease) | (1,032) | $(18,021) |
Class R3 | Shares | Amount |
Six-month period ended April 30, 2022: | ||
Shares sold | 15,725 | $256,715 |
Shares issued to shareholders in reinvestment of distributions | 9,438 | 153,374 |
Shares redeemed | (36,340) | (567,179) |
Net increase (decrease) | (11,177) | $(157,090) |
Year ended October 31, 2021: | ||
Shares sold | 34,815 | $583,481 |
Shares issued to shareholders in reinvestment of distributions | 3,423 | 52,983 |
Shares redeemed | (23,149) | (385,476) |
Net increase (decrease) | 15,089 | $250,988 |
SIMPLE Class | Shares | Amount |
Six-month period ended April 30, 2022: | ||
Shares sold | 62,974 | $1,030,693 |
Shares issued to shareholders in reinvestment of distributions | 11,687 | 191,431 |
Shares redeemed | (9,439) | (147,126) |
Net increase (decrease) | 65,222 | $1,074,998 |
Year ended October 31, 2021: | ||
Shares sold | 64,224 | $1,080,104 |
Shares issued to shareholders in reinvestment of distributions | 1,052 | 16,390 |
Shares redeemed | (13,851) | (226,855) |
Net increase (decrease) in shares outstanding before conversion | 51,425 | 869,639 |
Shares converted into SIMPLE Class (See Note 1) | 23,642 | 382,832 |
Net increase (decrease) | 75,067 | $1,252,471 |
(a) | Class R1 liquidated and no longer offered for sale as of April 26, 2022. |
90 | MainStay Asset Allocation Funds |
Class A | Shares | Amount |
Six-month period ended April 30, 2022: | ||
Shares sold | 897,224 | $15,884,920 |
Shares issued to shareholders in reinvestment of distributions | 2,377,049 | 42,430,331 |
Shares redeemed | (1,410,293) | (24,463,271) |
Net increase (decrease) in shares outstanding before conversion | 1,863,980 | 33,851,980 |
Shares converted into Class A (See Note 1) | 389,098 | 7,296,615 |
Shares converted from Class A (See Note 1) | (34) | (569) |
Net increase (decrease) | 2,253,044 | $41,148,026 |
Year ended October 31, 2021: | ||
Shares sold | 1,494,848 | $27,006,566 |
Shares issued to shareholders in reinvestment of distributions | 872,425 | 14,499,695 |
Shares redeemed | (2,978,513) | (53,821,402) |
Net increase (decrease) in shares outstanding before conversion | (611,240) | (12,315,141) |
Shares converted into Class A (See Note 1) | 2,041,426 | 36,649,970 |
Shares converted from Class A (See Note 1) | (11,978) | (210,797) |
Net increase (decrease) | 1,418,208 | $24,124,032 |
Investor Class | Shares | Amount |
Six-month period ended April 30, 2022: | ||
Shares sold | 255,715 | $4,497,778 |
Shares issued to shareholders in reinvestment of distributions | 438,842 | 7,833,330 |
Shares redeemed | (183,631) | (3,243,127) |
Net increase (decrease) in shares outstanding before conversion | 510,926 | 9,087,981 |
Shares converted into Investor Class (See Note 1) | 52,009 | 914,003 |
Shares converted from Investor Class (See Note 1) | (286,608) | (5,437,527) |
Net increase (decrease) | 276,327 | $4,564,457 |
Year ended October 31, 2021: | ||
Shares sold | 653,167 | $11,715,859 |
Shares issued to shareholders in reinvestment of distributions | 202,761 | 3,371,913 |
Shares redeemed | (436,864) | (7,851,483) |
Net increase (decrease) in shares outstanding before conversion | 419,064 | 7,236,289 |
Shares converted into Investor Class (See Note 1) | 127,858 | 2,335,995 |
Shares converted from Investor Class (See Note 1) | (1,802,767) | (32,287,138) |
Net increase (decrease) | (1,255,845) | $(22,714,854) |
Class B | Shares | Amount |
Six-month period ended April 30, 2022: | ||
Shares sold | 1,486 | $26,952 |
Shares issued to shareholders in reinvestment of distributions | 108,254 | 1,867,379 |
Shares redeemed | (54,598) | (932,899) |
Net increase (decrease) in shares outstanding before conversion | 55,142 | 961,432 |
Shares converted from Class B (See Note 1) | (119,319) | (2,052,165) |
Net increase (decrease) | (64,177) | $(1,090,733) |
Year ended October 31, 2021: | ||
Shares sold | 12,121 | $211,656 |
Shares issued to shareholders in reinvestment of distributions | 56,825 | 916,583 |
Shares redeemed | (199,101) | (3,459,502) |
Net increase (decrease) in shares outstanding before conversion | (130,155) | (2,331,263) |
Shares converted from Class B (See Note 1) | (255,906) | (4,519,402) |
Net increase (decrease) | (386,061) | $(6,850,665) |
Class C | Shares | Amount |
Six-month period ended April 30, 2022: | ||
Shares sold | 28,016 | $474,970 |
Shares issued to shareholders in reinvestment of distributions | 95,779 | 1,656,021 |
Shares redeemed | (79,013) | (1,343,516) |
Net increase (decrease) in shares outstanding before conversion | 44,782 | 787,475 |
Shares converted from Class C (See Note 1) | (41,097) | (720,357) |
Net increase (decrease) | 3,685 | $67,118 |
Year ended October 31, 2021: | ||
Shares sold | 65,817 | $1,155,539 |
Shares issued to shareholders in reinvestment of distributions | 48,679 | 786,655 |
Shares redeemed | (241,072) | (4,191,419) |
Net increase (decrease) in shares outstanding before conversion | (126,576) | (2,249,225) |
Shares converted from Class C (See Note 1) | (131,844) | (2,306,142) |
Net increase (decrease) | (258,420) | $(4,555,367) |
Class I | Shares | Amount |
Six-month period ended April 30, 2022: | ||
Shares sold | 36,949 | $712,852 |
Shares issued to shareholders in reinvestment of distributions | 42,339 | 771,834 |
Shares redeemed | (34,947) | (646,007) |
Net increase (decrease) | 44,341 | $838,679 |
Year ended October 31, 2021: | ||
Shares sold | 59,525 | $1,085,155 |
Shares issued to shareholders in reinvestment of distributions | 15,490 | 262,250 |
Shares redeemed | (59,385) | (1,095,430) |
Net increase (decrease) in shares outstanding before conversion | 15,630 | 251,975 |
Shares converted into Class I (See Note 1) | 1,172 | 22,557 |
Net increase (decrease) | 16,802 | $274,532 |
Class R3 | Shares | Amount |
Six-month period ended April 30, 2022: | ||
Shares sold | 11,403 | $197,352 |
Shares issued to shareholders in reinvestment of distributions | 11,666 | 206,725 |
Shares redeemed | (3,610) | (65,344) |
Net increase (decrease) | 19,459 | $338,733 |
Year ended October 31, 2021: | ||
Shares sold | 25,036 | $444,290 |
Shares issued to shareholders in reinvestment of distributions | 3,904 | 64,497 |
Shares redeemed | (13,180) | (240,690) |
Net increase (decrease) | 15,760 | $268,097 |
SIMPLE Class | Shares | Amount |
Six-month period ended April 30, 2022: | ||
Shares sold | 24,547 | $437,571 |
Shares issued to shareholders in reinvestment of distributions | 3,897 | 69,631 |
Shares redeemed | (1,116) | (20,102) |
Net increase (decrease) | 27,328 | $487,100 |
Year ended October 31, 2021: | ||
Shares sold | 19,167 | $353,167 |
Shares issued to shareholders in reinvestment of distributions | 237 | 3,947 |
Shares redeemed | (15,601) | (272,559) |
Net increase (decrease) in shares outstanding before conversion | 3,803 | 84,555 |
Shares converted into SIMPLE Class (See Note 1) | 18,059 | 314,957 |
Net increase (decrease) | 21,862 | $399,512 |
92 | MainStay Asset Allocation Funds |
94 | MainStay Asset Allocation Funds |
96 | MainStay Asset Allocation Funds |
98 | MainStay Asset Allocation Funds |
For more information
Message from the President and Semiannual Report
please log in to newyorklifeinvestments.com/accounts.
Not FDIC/NCUA Insured | Not a Deposit | May Lose Value | No Bank Guarantee | Not Insured by Any Government Agency |


5 | |
9 | |
11 | |
16 | |
21 | |
29 | |
34 | |
35 | |
35 |
Investors should refer to the Fund’s Summary Prospectus and/or Prospectus and consider the Fund’s investment objectives, strategies, risks, charges and expenses carefully before investing. The Summary Prospectus and/or Prospectus contain this and other information about the Fund. You may obtain copies of the Fund’s Summary Prospectus, Prospectus and Statement of Additional Information, which includes information about MainStay Funds Trust's Trustees, free of charge, upon request, by calling toll-free 800-624-6782, by writing to NYLIFE Distributors LLC, Attn: MainStay Marketing Department, 30 Hudson Street, Jersey City, NJ 07302 or by sending an e-mail to MainStayShareholderServices@nylim.com. These documents are also available via the MainStay Funds’ website at newyorklifeinvestments.com. Please read the Fund’s Summary Prospectus and/or Prospectus carefully before investing.

Average Annual Total Returns for the Period-Ended April 30, 2022 | ||||||||
Class | Sales Charge | Inception Date | Six Months1 | One Year | Five Years | Since Inception | Gross Expense Ratio2 | |
Class A Shares | Maximum 5.5% Initial Sales Charge | With sales charges | 6/30/2016 | -21.92% | -13.97% | 10.77% | 11.61% | 1.35% |
Excluding sales charges | -17.38 | -8.96 | 12.03 | 12.70 | 1.35 | |||
Investor Class Shares3 | Maximum 5% Initial Sales Charge | With sales charges | 6/30/2016 | -21.65 | -13.80 | 10.46 | 11.35 | 1.59 |
Excluding sales charges | -17.53 | -9.27 | 11.72 | 12.43 | 1.59 | |||
Class C Shares | Maximum 1% CDSC | With sales charges | 6/30/2016 | -18.41 | -10.61 | 10.90 | 11.62 | 2.34 |
if Redeemed Within One Year of Purchase | Excluding sales charges | -17.79 | -9.92 | 10.90 | 11.62 | 2.34 | ||
Class I Shares | No Sales Charge | 6/30/2016 | -17.30 | -8.73 | 12.29 | 12.96 | 1.10 | |
1. | Not annualized. |
2. | The gross expense ratios presented reflect the Fund’s “Total Annual Fund Operating Expenses” from the most recent Prospectus, as supplemented, and may differ from other expense ratios disclosed in this report. |
3. | Prior to June 30, 2020, the maximum initial sales charge was 5.5%, which is reflected in the applicable average annual total return figures shown. |
Benchmark Performance* | Six Months1 | One Year | Five Years | Since Inception |
MSCI World Index (Net)2 | -11.30% | -3.52% | 10.17% | 11.34% |
Morningstar Global Large Stock Growth Category Average3 | -23.44 | -17.98 | 10.06 | 11.35 |
* | Returns for indices reflect no deductions for fees, expenses or taxes, except for foreign withholding taxes where applicable. |
1. | Not annualized. |
2. | The MSCI World Index (Net) is the Fund's primary broad-based securities market index for comparison purposes. The MSCI World Index (Net) is a free float-adjusted market capitalization weighted index that is designed to measure the equity market performance of developed markets. Results assume reinvestment of all dividends and capital gains. An investment cannot be made directly in an index. |
3. | The Morningstar Global Large Stock Growth Category Average is a representative of funds that invest in a variety of international stocks and typically skew towards large caps that are more expensive or projected to grow faster than other global large-cap stocks. World large stock growth portfolios have few geographical limitations. It is common for these portfolios to invest the majority of their assets in developed markets, with the remainder divided among the globe's emerging markets. These portfolios are not significantly overweight U.S. equity exposure relative to the Morningstar Global Market Index and maintain at least a 20% absolute U.S. exposure. Results are based on average total returns of similar funds with all dividends and capital gain distributions reinvested. |
6 | MainStay Epoch Capital Growth Fund |
Share Class | Beginning Account Value 11/1/21 | Ending Account Value (Based on Actual Returns and Expenses) 4/30/22 | Expenses Paid During Period1 | Ending Account Value (Based on Hypothetical 5% Annualized Return and Actual Expenses) 4/30/22 | Expenses Paid During Period1 | Net Expense Ratio During Period2 |
Class A Shares | $1,000.00 | $826.20 | $5.21 | $1,019.09 | $5.76 | 1.15% |
Investor Class Shares | $1,000.00 | $824.70 | $6.42 | $1,017.75 | $7.10 | 1.42% |
Class C Shares | $1,000.00 | $822.10 | $9.80 | $1,014.03 | $10.84 | 2.17% |
Class I Shares | $1,000.00 | $827.00 | $4.08 | $1,020.33 | $4.51 | 0.90% |
1. | Expenses are equal to the Fund’s annualized expense ratio of each class multiplied by the average account value over the period, divided by 365 and multiplied by 181 (to reflect the six-month period). The table above represents the actual expenses incurred during the six-month period. In addition to the fees and expenses which the Fund bears directly, it also indirectly bears a pro rata share of the fees and expenses of the underlying funds in which it invests. Such indirect expenses are not included in the above-reported expense figures. |
2. | Expenses are equal to the Fund's annualized expense ratio to reflect the six-month period. |
Country Composition as of April 30, 2022 (Unaudited)
United States | 66.1% |
Japan | 3.8 |
Australia | 3.2 |
Denmark | 3.2 |
Switzerland | 3.0 |
Sweden | 2.8 |
China | 2.7 |
United Kingdom | 2.6 |
Canada | 2.4 |
France | 2.3 |
Italy | 2.2 |
Netherlands | 1.5 |
Spain | 1.2% |
Malta | 1.0 |
Jordan | 0.8 |
Mexico | 0.8 |
Singapore | 0.7 |
Indonesia | 0.6 |
South Africa | 0.6 |
Taiwan | 0.5 |
Hong Kong | 0.4 |
Other Assets, Less Liabilities | –2.4 |
100.0% |
Top Ten Holdings and/or Issuers Held as of April 30, 2022 (excluding short-term investments) (Unaudited)
1. | LPL Financial Holdings, Inc. |
2. | Eli Lilly and Co. |
3. | Costco Wholesale Corp. |
4. | Microsoft Corp. |
5. | Zoetis, Inc. |
6. | Gentex Corp. |
7. | Monster Beverage Corp. |
8. | Alphabet, Inc., Class A |
9. | Edenred |
10. | Fastenal Co. |
8 | MainStay Epoch Capital Growth Fund |
10 | MainStay Epoch Capital Growth Fund |
Shares | Value | |
Common Stocks 100.0% | ||
Australia 3.2% | ||
Aristocrat Leisure Ltd. (Hotels, Restaurants & Leisure) | 24,548 | $ 567,409 |
CSL Ltd. (Biotechnology) | 4,695 | 888,572 |
REA Group Ltd. (Interactive Media & Services) | 3,463 | 307,317 |
Silver Lake Resources Ltd. (Metals & Mining) (a) | 248,683 | 321,482 |
2,084,780 | ||
Canada 2.4% | ||
Alimentation Couche-Tard, Inc. (Food & Staples Retailing) | 15,505 | 690,251 |
Constellation Software, Inc. (Software) | 559 | 879,792 |
1,570,043 | ||
China 2.7% | ||
A-Living Smart City Services Co. Ltd. (Real Estate Management & Development) (b) | 109,750 | 172,415 |
Chongqing Brewery Co. Ltd., Class A (Beverages) (a) | 18,174 | 343,628 |
Silergy Corp. (Semiconductors & Semiconductor Equipment) | 6,000 | 529,934 |
SITC International Holdings Co. Ltd. (Marine) | 216,000 | 721,108 |
1,767,085 | ||
Denmark 3.2% | ||
Coloplast A/S, Class B (Health Care Equipment & Supplies) | 3,474 | 469,039 |
Genmab A/S (Biotechnology) (a) | 2,074 | 731,610 |
Novo Nordisk A/S, Class B (Pharmaceuticals) | 7,559 | 864,538 |
2,065,187 | ||
France 2.3% | ||
Edenred (IT Services) | 21,495 | 1,077,434 |
Sartorius Stedim Biotech (Life Sciences Tools & Services) | 1,341 | 436,490 |
1,513,924 | ||
Hong Kong 0.4% | ||
Hong Kong Exchanges & Clearing Ltd. (Capital Markets) | 5,800 | 245,979 |
Indonesia 0.6% | ||
Bank Central Asia Tbk. PT (Banks) (c) | 721,200 | 403,367 |
Shares | Value | |
Italy 2.2% | ||
DiaSorin SpA (Health Care Equipment & Supplies) | 2,550 | $ 333,335 |
FinecoBank Banca Fineco SpA (Banks) | 45,124 | 621,647 |
Recordati Industria Chimica e Farmaceutica SpA (Pharmaceuticals) | 9,004 | 431,046 |
1,386,028 | ||
Japan 3.8% | ||
Digital Arts, Inc. (Software) | 2,900 | 162,551 |
Goldwin, Inc. (Textiles, Apparel & Luxury Goods) | 3,800 | 188,540 |
Hoya Corp. (Health Care Equipment & Supplies) | 4,200 | 418,443 |
MedPeer, Inc. (Health Care Technology) (a) | 9,900 | 222,776 |
Nexon Co. Ltd. (Entertainment) | 22,000 | 502,375 |
Unicharm Corp. (Household Products) | 18,600 | 646,960 |
Zenkoku Hosho Co. Ltd. (Diversified Financial Services) | 8,600 | 301,861 |
2,443,506 | ||
Jordan 0.8% | ||
Hikma Pharmaceuticals plc (Pharmaceuticals) | 22,990 | 541,239 |
Malta 1.0% | ||
Kindred Group plc SDR (Hotels, Restaurants & Leisure) | 75,313 | 660,111 |
Mexico 0.8% | ||
Wal-Mart de Mexico SAB de CV (Food & Staples Retailing) | 138,900 | 491,168 |
Netherlands 1.5% | ||
ASML Holding NV (Semiconductors & Semiconductor Equipment) | 970 | 548,796 |
BE Semiconductor Industries NV (Semiconductors & Semiconductor Equipment) | 6,994 | 423,514 |
972,310 | ||
Singapore 0.7% | ||
Singapore Exchange Ltd. (Capital Markets) | 67,300 | 473,928 |
South Africa 0.6% | ||
FirstRand Ltd. (Diversified Financial Services) | 89,352 | 384,849 |
Shares | Value | |
Common Stocks (continued) | ||
Spain 1.2% | ||
Amadeus IT Group SA (IT Services) (a) | 6,498 | $ 405,171 |
Industria de Diseno Textil SA (Specialty Retail) (d) | 18,369 | 385,197 |
790,368 | ||
Sweden 2.8% | ||
Atlas Copco AB, Class B (Machinery) (d) | 9,167 | 362,291 |
Epiroc AB, Class B (Machinery) | 25,764 | 446,858 |
Evolution AB (Hotels, Restaurants & Leisure) (b) | 4,592 | 472,188 |
Swedish Match AB (Tobacco) (d) | 62,329 | 496,682 |
1,778,019 | ||
Switzerland 3.0% | ||
Kuehne + Nagel International AG (Registered) (Marine) | 2,459 | 689,531 |
Logitech International SA (Registered) (Technology Hardware, Storage & Peripherals) | 8,004 | 518,646 |
Partners Group Holding AG (Capital Markets) | 422 | 447,166 |
Tecan Group AG (Registered) (Life Sciences Tools & Services) | 947 | 284,591 |
1,939,934 | ||
Taiwan 0.5% | ||
Taiwan Semiconductor Manufacturing Co. Ltd. (Semiconductors & Semiconductor Equipment) | 17,000 | 310,080 |
United Kingdom 2.6% | ||
Diageo plc (Beverages) | 7,154 | 354,517 |
Fevertree Drinks plc (Beverages) | 13,195 | 297,751 |
Games Workshop Group plc (Leisure Products) | 4,541 | 420,393 |
Howden Joinery Group plc (Trading Companies & Distributors) | 62,076 | 586,728 |
1,659,389 | ||
United States 63.7% | ||
Accenture plc, Class A (IT Services) | 2,510 | 753,904 |
Adobe, Inc. (Software) (a) | 970 | 384,071 |
Align Technology, Inc. (Health Care Equipment & Supplies) (a) | 1,001 | 290,200 |
Alphabet, Inc., Class A (Interactive Media & Services) (a) | 479 | 1,093,169 |
Ameriprise Financial, Inc. (Capital Markets) | 1,746 | 463,546 |
Shares | Value | |
United States (continued) | ||
Apple, Inc. (Technology Hardware, Storage & Peripherals) | 5,134 | $ 809,375 |
Applied Materials, Inc. (Semiconductors & Semiconductor Equipment) | 5,220 | 576,027 |
Arista Networks, Inc. (Communications Equipment) (a) | 8,004 | 925,022 |
Artisan Partners Asset Management, Inc., Class A (Capital Markets) | 15,722 | 505,305 |
Automatic Data Processing, Inc. (IT Services) | 3,531 | 770,394 |
Booking Holdings, Inc. (Hotels, Restaurants & Leisure) (a) | 222 | 490,689 |
Bruker Corp. (Life Sciences Tools & Services) | 5,465 | 314,183 |
Cadence Design Systems, Inc. (Software) (a) | 3,460 | 521,941 |
Chemed Corp. (Health Care Providers & Services) | 1,363 | 669,765 |
Corcept Therapeutics, Inc. (Pharmaceuticals) (a)(d) | 21,775 | 468,380 |
Costco Wholesale Corp. (Food & Staples Retailing) | 2,259 | 1,201,155 |
Deckers Outdoor Corp. (Textiles, Apparel & Luxury Goods) (a) | 2,019 | 536,549 |
Domino's Pizza, Inc. (Hotels, Restaurants & Leisure) | 1,557 | 526,266 |
Donaldson Co., Inc. (Machinery) | 9,351 | 458,573 |
Electronic Arts, Inc. (Entertainment) | 4,056 | 478,811 |
Eli Lilly and Co. (Pharmaceuticals) | 4,353 | 1,271,642 |
eXp World Holdings, Inc. (Real Estate Management & Development) (d) | 7,631 | 102,179 |
Expeditors International of Washington, Inc. (Air Freight & Logistics) | 3,759 | 372,404 |
Exponent, Inc. (Professional Services) | 3,155 | 302,281 |
Fastenal Co. (Trading Companies & Distributors) | 19,265 | 1,065,547 |
Ferguson plc (Trading Companies & Distributors) | 7,519 | 948,247 |
Fortinet, Inc. (Software) (a) | 3,560 | 1,028,876 |
Gentex Corp. (Auto Components) | 38,558 | 1,131,677 |
Graco, Inc. (Machinery) | 6,070 | 376,461 |
Home Depot, Inc. (The) (Specialty Retail) | 2,128 | 639,251 |
Intuitive Surgical, Inc. (Health Care Equipment & Supplies) (a) | 1,095 | 262,033 |
KLA Corp. (Semiconductors & Semiconductor Equipment) | 2,761 | 881,477 |
Lam Research Corp. (Semiconductors & Semiconductor Equipment) | 1,552 | 722,859 |
Liberty Media Corp-Liberty SiriusXM (a) | ||
Class A (Media) | 11,877 | 496,815 |
12 | MainStay Epoch Capital Growth Fund |
Shares | Value | |
Common Stocks (continued) | ||
United States (continued) | ||
Liberty Media Corp-Liberty SiriusXM (a) (continued) | ||
Class C (Media) | 662 | $ 27,725 |
LPL Financial Holdings, Inc. (Capital Markets) | 6,965 | 1,308,515 |
Manhattan Associates, Inc. (Software) (a) | 2,213 | 288,907 |
Mastercard, Inc., Class A (IT Services) | 2,852 | 1,036,360 |
Medpace Holdings, Inc. (Life Sciences Tools & Services) (a) | 5,919 | 790,601 |
Meta Platforms, Inc., Class A (Interactive Media & Services) (a) | 2,673 | 535,856 |
Mettler-Toledo International, Inc. (Life Sciences Tools & Services) (a) | 422 | 539,118 |
Microsoft Corp. (Software) | 4,313 | 1,196,944 |
Monster Beverage Corp. (Beverages) (a) | 12,847 | 1,100,731 |
Paychex, Inc. (IT Services) | 8,226 | 1,042,481 |
Rollins, Inc. (Commercial Services & Supplies) | 14,555 | 488,175 |
Starbucks Corp. (Hotels, Restaurants & Leisure) | 7,074 | 528,003 |
SVB Financial Group (Banks) (a) | 993 | 484,226 |
Take-Two Interactive Software, Inc. (Entertainment) (a) | 3,235 | 386,615 |
Texas Instruments, Inc. (Semiconductors & Semiconductor Equipment) | 4,323 | 735,991 |
TJX Cos., Inc. (The) (Specialty Retail) | 6,298 | 385,941 |
TTEC Holdings, Inc. (IT Services) | 3,988 | 294,354 |
Union Pacific Corp. (Road & Rail) | 3,862 | 904,828 |
UnitedHealth Group, Inc. (Health Care Providers & Services) | 1,865 | 948,446 |
Veeva Systems, Inc., Class A (Health Care Technology) (a) | 2,687 | 488,900 |
Vertex Pharmaceuticals, Inc. (Biotechnology) (a) | 2,827 | 772,393 |
Visa, Inc., Class A (IT Services) | 1,477 | 314,793 |
VMware, Inc., Class A (Software) | 5,751 | 621,338 |
Waters Corp. (Life Sciences Tools & Services) (a) | 1,067 | 323,322 |
West Pharmaceutical Services, Inc. (Life Sciences Tools & Services) | 1,290 | 406,427 |
Western Alliance Bancorp (Banks) | 5,579 | 424,618 |
Wingstop, Inc. (Hotels, Restaurants & Leisure) (d) | 6,749 | 619,288 |
Shares | Value | |
United States (continued) | ||
World Wrestling Entertainment, Inc., Class A (Entertainment) | 12,778 | $ 746,107 |
Yum! Brands, Inc. (Hotels, Restaurants & Leisure) | 3,988 | 466,636 |
Zoetis, Inc. (Pharmaceuticals) | 6,435 | 1,140,604 |
41,187,317 | ||
Total Common Stocks (Cost $57,414,395) | 64,668,611 | |
Short-Term Investments 2.4% | ||
Affiliated Investment Company 0.5% | ||
United States 0.5% | ||
MainStay U.S. Government Liquidity Fund, 0.397% (e) | 305,406 | 305,406 |
Unaffiliated Investment Company 1.9% | ||
United States 1.9% | ||
Invesco Government & Agency Portfolio, 0.419% (e)(f) | 1,250,598 | 1,250,598 |
Total Short-Term Investments (Cost $1,556,004) | 1,556,004 | |
Total Investments (Cost $58,970,399) | 102.4% | 66,224,615 |
Other Assets, Less Liabilities | (2.4) | (1,529,865) |
Net Assets | 100.0% | $ 64,694,750 |
† | Percentages indicated are based on Fund net assets. |
(a) | Non-income producing security. |
(b) | May be sold to institutional investors only under Rule 144A or securities offered pursuant to Section 4(a)(2) of the Securities Act of 1933, as amended. |
(c) | Illiquid security—As of April 30, 2022, the total market value deemed illiquid under procedures approved by the Board of Trustees was $403,367, which represented 0.6% of the Fund’s net assets. |
(d) | All or a portion of this security was held on loan. As of April 30, 2022, the aggregate market value of securities on loan was $1,196,362. The Fund received cash collateral with a value of $1,250,598. (See Note 2(I)) |
(e) | Current yield as of April 30, 2022. |
(f) | Represents a security purchased with cash collateral received for securities on loan. |
Affiliated Investment Companies | Value, Beginning of Period | Purchases at Cost | Proceeds from Sales | Net Realized Gain/(Loss) on Sales | Change in Unrealized Appreciation/ (Depreciation) | Value, End of Period | Dividend Income | Other Distributions | Shares End of Period |
MainStay U.S. Government Liquidity Fund | $ 989 | $ 8,640 | $ (9,324) | $ — | $ — | $ 305 | $ —(a) | $ — | 305 |
(a) | Less than $500. |
Abbreviation(s): |
SDR—Special Drawing Right |
Description | Quoted Prices in Active Markets for Identical Assets (Level 1) | Significant Other Observable Inputs (Level 2) | Significant Unobservable Inputs (Level 3) | Total |
Asset Valuation Inputs | ||||
Investments in Securities (a) | ||||
Common Stocks | ||||
Australia | $ — | $ 2,084,780 | $ — | $ 2,084,780 |
China | — | 1,767,085 | — | 1,767,085 |
Denmark | — | 2,065,187 | — | 2,065,187 |
France | — | 1,513,924 | — | 1,513,924 |
Hong Kong | — | 245,979 | — | 245,979 |
Indonesia | — | 403,367 | — | 403,367 |
Italy | — | 1,386,028 | — | 1,386,028 |
Japan | — | 2,443,506 | — | 2,443,506 |
Jordan | — | 541,239 | — | 541,239 |
Malta | — | 660,111 | — | 660,111 |
Netherlands | — | 972,310 | — | 972,310 |
Singapore | — | 473,928 | — | 473,928 |
South Africa | — | 384,849 | — | 384,849 |
Spain | — | 790,368 | — | 790,368 |
Sweden | — | 1,778,019 | — | 1,778,019 |
Switzerland | — | 1,939,934 | — | 1,939,934 |
Taiwan | — | 310,080 | — | 310,080 |
United Kingdom | — | 1,659,389 | — | 1,659,389 |
United States | 40,239,070 | 948,247 | — | 41,187,317 |
All Other Countries | 2,061,211 | — | — | 2,061,211 |
Total Common Stocks | 42,300,281 | 22,368,330 | — | 64,668,611 |
Short-Term Investments | ||||
Affiliated Investment Company | 305,406 | — | — | 305,406 |
Unaffiliated Investment Company | 1,250,598 | — | — | 1,250,598 |
Total Short-Term Investments | 1,556,004 | — | — | 1,556,004 |
Total Investments in Securities | $ 43,856,285 | $ 22,368,330 | $ — | $ 66,224,615 |
(a) | For a complete listing of investments and their industries, see the Portfolio of Investments. |
14 | MainStay Epoch Capital Growth Fund |
Value | Percent † | |
Air Freight & Logistics | $372,404 | 0.6% |
Auto Components | 1,131,677 | 1.7 |
Banks | 1,933,858 | 3.0 |
Beverages | 2,096,627 | 3.2 |
Biotechnology | 2,392,575 | 3.6 |
Capital Markets | 3,444,439 | 5.3 |
Commercial Services & Supplies | 488,175 | 0.8 |
Communications Equipment | 925,022 | 1.4 |
Diversified Financial Services | 686,710 | 1.1 |
Entertainment | 2,113,908 | 3.3 |
Food & Staples Retailing | 2,382,574 | 3.8 |
Health Care Equipment & Supplies | 1,773,050 | 2.6 |
Health Care Providers & Services | 1,618,211 | 2.5 |
Health Care Technology | 711,676 | 1.1 |
Hotels, Restaurants & Leisure | 4,330,590 | 6.7 |
Household Products | 646,960 | 1.0 |
Interactive Media & Services | 1,936,342 | 3.0 |
IT Services | 5,694,891 | 8.8 |
Leisure Products | 420,393 | 0.7 |
Life Sciences Tools & Services | 3,094,732 | 4.7 |
Machinery | 1,644,183 | 2.6 |
Marine | 1,410,639 | 2.2 |
Media | 524,540 | 0.8 |
Metals & Mining | 321,482 | 0.5 |
Pharmaceuticals | 4,717,449 | 7.4 |
Professional Services | 302,281 | 0.5 |
Real Estate Management & Development | 274,594 | 0.5 |
Road & Rail | 904,828 | 1.4 |
Semiconductors & Semiconductor Equipment | 4,728,678 | 7.3 |
Software | 5,084,420 | 7.8 |
Specialty Retail | 1,410,389 | 2.2 |
Technology Hardware, Storage & Peripherals | 1,328,021 | 2.0 |
Textiles, Apparel & Luxury Goods | 725,089 | 1.1 |
Tobacco | 496,682 | 0.8 |
Trading Companies & Distributors | 2,600,522 | 4.0 |
64,668,611 | 100.0 | |
Short-Term Investments | 1,556,004 | 2.4 |
Other Assets, Less Liabilities | (1,529,865) | (2.4) |
Net Assets | $64,694,750 | 100.0% |
† | Percentages indicated are based on Fund net assets. |
Assets | |
Investment in unaffiliated securities, at value (identified cost $58,664,993) including securities on loan of $1,196,362 | $65,919,209 |
Investment in affiliated investment companies, at value (identified cost $305,406) | 305,406 |
Receivables: | |
Dividends | 182,421 |
Fund shares sold | 11,238 |
Securities lending | 340 |
Other assets | 20,855 |
Total assets | 66,439,469 |
Liabilities | |
Cash collateral received for securities on loan | 1,250,598 |
Foreign currency due to custodian, at value | 2,710 |
Payables: | |
Investment securities purchased | 325,985 |
Professional fees | 43,847 |
Fund shares redeemed | 42,382 |
Manager (See Note 3) | 38,877 |
Shareholder communication | 13,041 |
Custodian | 12,002 |
NYLIFE Distributors (See Note 3) | 5,532 |
Transfer agent (See Note 3) | 2,966 |
Trustees | 402 |
Accrued expenses | 6,377 |
Total liabilities | 1,744,719 |
Net assets | $64,694,750 |
Composition of Net Assets | |
Shares of beneficial interest outstanding (par value of $.001 per share) unlimited number of shares authorized | $5,932 |
Additional paid-in-capital | 56,261,556 |
56,267,488 | |
Total distributable earnings (loss) | 8,427,262 |
Net assets | $64,694,750 |
Class A | |
Net assets applicable to outstanding shares | $20,207,134 |
Shares of beneficial interest outstanding | 1,855,716 |
Net asset value per share outstanding | $10.89 |
Maximum sales charge (5.50% of offering price) | 0.63 |
Maximum offering price per share outstanding | $11.52 |
Investor Class | |
Net assets applicable to outstanding shares | $1,237,772 |
Shares of beneficial interest outstanding | 114,475 |
Net asset value per share outstanding | $10.81 |
Maximum sales charge (5.00% of offering price) | 0.57 |
Maximum offering price per share outstanding | $11.38 |
Class C | |
Net assets applicable to outstanding shares | $910,307 |
Shares of beneficial interest outstanding | 88,044 |
Net asset value and offering price per share outstanding | $10.34 |
Class I | |
Net assets applicable to outstanding shares | $42,339,537 |
Shares of beneficial interest outstanding | 3,873,362 |
Net asset value and offering price per share outstanding | $10.93 |
16 | MainStay Epoch Capital Growth Fund |
Investment Income (Loss) | |
Income | |
Dividends-unaffiliated (net of foreign tax withholding of $20,261) | $490,876 |
Securities lending | 1,110 |
Dividends-affiliated | 73 |
Total income | 492,059 |
Expenses | |
Manager (See Note 3) | 276,184 |
Distribution/Service—Class A (See Note 3) | 27,779 |
Distribution/Service—Investor Class (See Note 3) | 1,804 |
Distribution/Service—Class C (See Note 3) | 5,562 |
Registration | 30,589 |
Professional fees | 22,130 |
Custodian | 18,585 |
Transfer agent (See Note 3) | 17,752 |
Shareholder communication | 3,240 |
Trustees | 851 |
Miscellaneous | 7,191 |
Total expenses before waiver/reimbursement | 411,667 |
Expense waiver/reimbursement from Manager (See Note 3) | (41,653) |
Net expenses | 370,014 |
Net investment income (loss) | 122,045 |
Realized and Unrealized Gain (Loss) | |
Net realized gain (loss) on: | |
Unaffiliated investment transactions | 1,329,804 |
Foreign currency transactions | (3,691) |
Net realized gain (loss) | 1,326,113 |
Net change in unrealized appreciation (depreciation) on: | |
Unaffiliated investments | (15,143,050) |
Translation of other assets and liabilities in foreign currencies | (8,492) |
Net change in unrealized appreciation (depreciation) | (15,151,542) |
Net realized and unrealized gain (loss) | (13,825,429) |
Net increase (decrease) in net assets resulting from operations | $(13,703,384) |
for the six months ended April 30, 2022 (Unaudited) and the year ended October 31, 2021
2022 | 2021 | |
Increase (Decrease) in Net Assets | ||
Operations: | ||
Net investment income (loss) | $122,045 | $82,382 |
Net realized gain (loss) | 1,326,113 | 19,506,272 |
Net change in unrealized appreciation (depreciation) | (15,151,542) | 5,298,259 |
Net increase (decrease) in net assets resulting from operations | (13,703,384) | 24,886,913 |
Distributions to shareholders: | ||
Class A | (4,992,940) | (1,425,751) |
Investor Class | (363,357) | (268,568) |
Class C | (298,992) | (201,859) |
Class I | (12,067,689) | (10,411,550) |
Total distributions to shareholders | (17,722,978) | (12,307,728) |
Capital share transactions: | ||
Net proceeds from sales of shares | 7,769,219 | 38,605,038 |
Net asset value of shares issued to shareholders in reinvestment of distributions | 17,496,640 | 12,162,981 |
Cost of shares redeemed | (7,792,593) | (50,502,481) |
Increase (decrease) in net assets derived from capital share transactions | 17,473,266 | 265,538 |
Net increase (decrease) in net assets | (13,953,096) | 12,844,723 |
Net Assets | ||
Beginning of period | 78,647,846 | 65,803,123 |
End of period | $64,694,750 | $78,647,846 |
18 | MainStay Epoch Capital Growth Fund |
Six months ended April 30, 2022* | Year Ended October 31, | |||||
Class A | 2021 | 2020 | 2019 | 2018 | 2017 | |
Net asset value at beginning of period | $17.09 | $14.43 | $13.20 | $12.21 | $12.55 | $10.10 |
Net investment income (loss) (a) | 0.01 | (0.01) | 0.00‡ | 0.07 | 0.07 | 0.05 |
Net realized and unrealized gain (loss) | (2.39) | 5.43 | 1.92 | 1.81 | 0.02 | 2.42 |
Total from investment operations | (2.38) | 5.42 | 1.92 | 1.88 | 0.09 | 2.47 |
Less distributions: | ||||||
From net investment income | — | (0.03) | (0.07) | (0.08) | (0.07) | (0.02) |
From net realized gain on investments | (3.82) | (2.73) | (0.62) | (0.81) | (0.36) | — |
Total distributions | (3.82) | (2.76) | (0.69) | (0.89) | (0.43) | (0.02) |
Net asset value at end of period | $10.89 | $17.09 | $14.43 | $13.20 | $12.21 | $12.55 |
Total investment return (b) | (17.38)% | 42.61% | 15.31% | 16.82% | 0.63% | 24.52% |
Ratios (to average net assets)/Supplemental Data: | ||||||
Net investment income (loss) | 0.19%†† | (0.08)% | 0.01% | 0.58% | 0.57% | 0.46% |
Net expenses (c) | 1.15%†† | 1.15% | 1.13% | 1.15% | 1.15% | 1.15% |
Expenses (before waiver/reimbursement) (c) | 1.26%†† | 1.36% | 1.16% | 1.27% | 1.15% | 1.15% |
Portfolio turnover rate | 15% | 80% | 43% | 46% | 51% | 56% |
Net assets at end of period (in 000’s) | $20,207 | $21,767 | $6,733 | $4,041 | $268 | $110 |
* | Unaudited. |
‡ | Less than one cent per share. |
†† | Annualized. |
(a) | Per share data based on average shares outstanding during the period. |
(b) | Total investment return is calculated exclusive of sales charges and assumes the reinvestment of dividends and distributions. For periods of less than one year, total return is not annualized. |
(c) | In addition to the fees and expenses which the Fund bears directly, it also indirectly bears a pro-rata share of the fees and expenses of the underlying funds in which it invests. Such indirect expenses are not included in the above expense ratios. |
Six months ended April 30, 2022* | Year Ended October 31, | |||||
Investor Class | 2021 | 2020 | 2019 | 2018 | 2017 | |
Net asset value at beginning of period | $17.02 | $14.40 | $13.16 | $12.18 | $12.54 | $10.10 |
Net investment income (loss) (a) | (0.01) | (0.05) | (0.02) | 0.04 | 0.05 | 0.05 |
Net realized and unrealized gain (loss) | (2.38) | 5.40 | 1.92 | 1.80 | 0.01 | 2.41 |
Total from investment operations | (2.39) | 5.35 | 1.90 | 1.84 | 0.06 | 2.46 |
Less distributions: | ||||||
From net investment income | — | (0.00)‡ | (0.04) | (0.05) | (0.06) | (0.02) |
From net realized gain on investments | (3.82) | (2.73) | (0.62) | (0.81) | (0.36) | — |
Total distributions | (3.82) | (2.73) | (0.66) | (0.86) | (0.42) | (0.02) |
Net asset value at end of period | $10.81 | $17.02 | $14.40 | $13.16 | $12.18 | $12.54 |
Total investment return (b) | (17.53)% | 42.05% | 15.14% | 16.42% | 0.40% | 24.43% |
Ratios (to average net assets)/Supplemental Data: | ||||||
Net investment income (loss) | (0.09)%†† | (0.31)% | (0.17)% | 0.30% | 0.40% | 0.39% |
Net expenses (c) | 1.42%†† | 1.42% | 1.34% | 1.43% | 1.40% | 1.27% |
Expenses (before waiver/reimbursement) (c) | 1.50%†† | 1.59% | 1.36% | 1.54% | 1.40% | 1.27% |
Portfolio turnover rate | 15% | 80% | 43% | 46% | 51% | 56% |
Net assets at end of period (in 000's) | $1,238 | $1,648 | $1,416 | $1,177 | $78 | $75 |
* | Unaudited. |
‡ | Less than one cent per share. |
†† | Annualized. |
(a) | Per share data based on average shares outstanding during the period. |
(b) | Total investment return is calculated exclusive of sales charges and assumes the reinvestment of dividends and distributions. For periods of less than one year, total return is not annualized. |
(c) | In addition to the fees and expenses which the Fund bears directly, it also indirectly bears a pro-rata share of the fees and expenses of the underlying funds in which it invests. Such indirect expenses are not included in the above expense ratios. |
Six months ended April 30, 2022* | Year Ended October 31, | |||||
Class C | 2021 | 2020 | 2019 | 2018 | 2017 | |
Net asset value at beginning of period | $16.49 | $14.10 | $12.97 | $12.04 | $12.44 | $10.08 |
Net investment income (loss) (a) | (0.05) | (0.16) | (0.12) | (0.06) | (0.05) | (0.03) |
Net realized and unrealized gain (loss) | (2.28) | 5.28 | 1.87 | 1.80 | 0.01 | 2.39 |
Total from investment operations | (2.33) | 5.12 | 1.75 | 1.74 | (0.04) | 2.36 |
Less distributions: | ||||||
From net investment income | — | — | (0.62) | (0.81) | (0.36) | — |
From net realized gain on investments | (3.82) | (2.73) | — | — | — | — |
Total distributions | (3.82) | (2.73) | (0.62) | (0.81) | (0.36) | — |
Net asset value at end of period | $10.34 | $16.49 | $14.10 | $12.97 | $12.04 | $12.44 |
Total investment return (b) | (17.79)% | 41.17% | 14.24% | 15.59% | (0.38)% | 23.41% |
Ratios (to average net assets)/Supplemental Data: | ||||||
Net investment income (loss) | (0.85)%†† | (1.09)% | (0.92)% | (0.46)% | (0.40)% | (0.27)% |
Net expenses (c) | 2.17%†† | 2.17% | 2.09% | 2.17% | 2.15% | 1.99% |
Expenses (before waiver/reimbursement) (c) | 2.25%†† | 2.34% | 2.11% | 2.27% | 2.15% | 1.99% |
Portfolio turnover rate | 15% | 80% | 43% | 46% | 51% | 56% |
Net assets at end of period (in 000’s) | $910 | $1,288 | $1,152 | $1,236 | $41 | $41 |
* | Unaudited. |
†† | Annualized. |
(a) | Per share data based on average shares outstanding during the period. |
(b) | Total investment return is calculated exclusive of sales charges and assumes the reinvestment of dividends and distributions. For periods of less than one year, total return is not annualized. |
(c) | In addition to the fees and expenses which the Fund bears directly, it also indirectly bears a pro-rata share of the fees and expenses of the underlying funds in which it invests. Such indirect expenses are not included in the above expense ratios. |
Six months ended April 30, 2022* | Year Ended October 31, | |||||
Class I | 2021 | 2020 | 2019 | 2018 | 2017 | |
Net asset value at beginning of period | $17.15 | $14.47 | $13.23 | $12.24 | $12.57 | $10.11 |
Net investment income (loss) (a) | 0.03 | 0.03 | 0.04 | 0.08 | 0.11 | 0.09 |
Net realized and unrealized gain (loss) | (2.41) | 5.45 | 1.92 | 1.83 | 0.01 | 2.40 |
Total from investment operations | (2.38) | 5.48 | 1.96 | 1.91 | 0.12 | 2.49 |
Less distributions: | ||||||
From net investment income | (0.02) | (0.07) | (0.10) | (0.11) | (0.09) | (0.03) |
From net realized gain on investments | (3.82) | (2.73) | (0.62) | (0.81) | (0.36) | — |
Total distributions | (3.84) | (2.80) | (0.72) | (0.92) | (0.45) | (0.03) |
Net asset value at end of period | $10.93 | $17.15 | $14.47 | $13.23 | $12.24 | $12.57 |
Total investment return (b) | (17.30)% | 42.99% | 15.58% | 17.11% | 0.87% | 24.74% |
Ratios (to average net assets)/Supplemental Data: | ||||||
Net investment income (loss) | 0.43%†† | 0.21% | 0.29% | 0.66% | 0.83% | 0.78% |
Net expenses (c) | 0.90%†† | 0.90% | 0.90% | 0.90% | 0.90% | 0.93% |
Expenses (before waiver/reimbursement) (c) | 1.02%†† | 1.10% | 0.93% | 1.00% | 0.90% | 0.93% |
Portfolio turnover rate | 15% | 80% | 43% | 46% | 51% | 56% |
Net assets at end of period (in 000’s) | $42,340 | $53,944 | $56,502 | $119,464 | $106,925 | $107,596 |
* | Unaudited. |
†† | Annualized. |
(a) | Per share data based on average shares outstanding during the period. |
(b) | Total investment return is calculated exclusive of sales charges and assumes the reinvestment of dividends and distributions. Class I shares are not subject to sales charges. For periods of less than one year, total return is not annualized. |
(c) | In addition to the fees and expenses which the Fund bears directly, it also indirectly bears a pro-rata share of the fees and expenses of the underlying funds in which it invests. Such indirect expenses are not included in the above expense ratios. |
20 | MainStay Epoch Capital Growth Fund |
Class | Commenced Operations |
Class A | June 30, 2016 |
Investor Class | June 30, 2016 |
Class C | June 30, 2016 |
Class I | June 30, 2016 |
Class R6 | N/A* |
SIMPLE Class | N/A* |
* | Class R6 shares were registered for sale effective as of February 28, 2017 and SIMPLE Class shares were registered for sale effective as of August 31, 2020 but have not yet commenced operations. |
• Broker/dealer quotes | • Benchmark securities |
• Two-sided markets | • Reference data (corporate actions or material event notices) |
• Bids/offers | • Monthly payment information |
• Industry and economic events | • Reported trades |
22 | MainStay Epoch Capital Growth Fund |
24 | MainStay Epoch Capital Growth Fund |
Class | Expense | Waived |
Class A | $4,483 | $— |
Investor Class | 1,947 | — |
Class C | 1,500 | — |
Class I | 9,822 | — |
Federal Tax Cost | Gross Unrealized Appreciation | Gross Unrealized (Depreciation) | Net Unrealized Appreciation/ (Depreciation) | |
Investments in Securities | $59,177,826 | $11,396,666 | $(4,349,877) | $7,046,789 |
2021 | |
Distributions paid from: | |
Ordinary Income | $1,475,154 |
Long-Term Capital Gains | 10,832,574 |
Total | $12,307,728 |
26 | MainStay Epoch Capital Growth Fund |
Class A | Shares | Amount |
Six-month period ended April 30, 2022: | ||
Shares sold | 455,842 | $5,933,457 |
Shares issued to shareholders in reinvestment of distributions | 384,632 | 4,954,057 |
Shares redeemed | (271,108) | (3,341,822) |
Net increase (decrease) in shares outstanding before conversion | 569,366 | 7,545,692 |
Shares converted into Class A (See Note 1) | 12,715 | 184,112 |
Net increase (decrease) | 582,081 | $7,729,804 |
Year ended October 31, 2021: | ||
Shares sold | 849,654 | $13,153,711 |
Shares issued to shareholders in reinvestment of distributions | 103,916 | 1,408,059 |
Shares redeemed | (199,599) | (3,086,554) |
Net increase (decrease) in shares outstanding before conversion | 753,971 | 11,475,216 |
Shares converted into Class A (See Note 1) | 53,113 | 800,905 |
Net increase (decrease) | 807,084 | $12,276,121 |
Investor Class | Shares | Amount |
Six-month period ended April 30, 2022: | ||
Shares sold | 8,759 | $120,345 |
Shares issued to shareholders in reinvestment of distributions | 28,387 | 363,357 |
Shares redeemed | (6,756) | (86,317) |
Net increase (decrease) in shares outstanding before conversion | 30,390 | 397,385 |
Shares converted from Investor Class (See Note 1) | (12,756) | (183,682) |
Net increase (decrease) | 17,634 | $213,703 |
Year ended October 31, 2021: | ||
Shares sold | 37,171 | $556,301 |
Shares issued to shareholders in reinvestment of distributions | 19,835 | 268,568 |
Shares redeemed | (13,478) | (204,246) |
Net increase (decrease) in shares outstanding before conversion | 43,528 | 620,623 |
Shares converted into Investor Class (See Note 1) | 4,200 | 62,596 |
Shares converted from Investor Class (See Note 1) | (49,222) | (739,778) |
Net increase (decrease) | (1,494) | $(56,559) |
Class C | Shares | Amount |
Six-month period ended April 30, 2022: | ||
Shares sold | 11,559 | $134,730 |
Shares issued to shareholders in reinvestment of distributions | 23,870 | 293,121 |
Shares redeemed | (25,455) | (296,725) |
Net increase (decrease) in shares outstanding before conversion | 9,974 | 131,126 |
Shares converted from Class C (See Note 1) | (38) | (430) |
Net increase (decrease) | 9,936 | $130,696 |
Year ended October 31, 2021: | ||
Shares sold | 33,628 | $491,294 |
Shares issued to shareholders in reinvestment of distributions | 15,244 | 201,064 |
Shares redeemed | (44,021) | (635,564) |
Net increase (decrease) in shares outstanding before conversion | 4,851 | 56,794 |
Shares converted from Class C (See Note 1) | (8,445) | (123,723) |
Net increase (decrease) | (3,594) | $(66,929) |
Class I | Shares | Amount |
Six-month period ended April 30, 2022: | ||
Shares sold | 123,847 | $1,580,687 |
Shares issued to shareholders in reinvestment of distributions | 920,690 | 11,886,105 |
Shares redeemed | (316,579) | (4,067,729) |
Net increase (decrease) | 727,958 | $9,399,063 |
Year ended October 31, 2021: | ||
Shares sold | 1,780,134 | $24,403,732 |
Shares issued to shareholders in reinvestment of distributions | 758,502 | 10,285,290 |
Shares redeemed | (3,298,049) | (46,576,117) |
Net increase (decrease) | (759,413) | $(11,887,095) |
28 | MainStay Epoch Capital Growth Fund |
30 | MainStay Epoch Capital Growth Fund |
32 | MainStay Epoch Capital Growth Fund |
34 | MainStay Epoch Capital Growth Fund |
For more information
Message from the President and Semiannual Report
please log in to newyorklifeinvestments.com/accounts.
Not FDIC/NCUA Insured | Not a Deposit | May Lose Value | No Bank Guarantee | Not Insured by Any Government Agency |


5 | |
9 | |
12 | |
17 | |
24 | |
33 | |
38 | |
39 | |
39 |
Investors should refer to the Fund’s Summary Prospectus and/or Prospectus and consider the Fund’s investment objectives, strategies, risks, charges and expenses carefully before investing. The Summary Prospectus and/or Prospectus contain this and other information about the Fund. You may obtain copies of the Fund’s Summary Prospectus, Prospectus and Statement of Additional Information, which includes information about MainStay Funds Trust's Trustees, free of charge, upon request, by calling toll-free 800-624-6782, by writing to NYLIFE Distributors LLC, Attn: MainStay Marketing Department, 30 Hudson Street, Jersey City, NJ 07302 or by sending an e-mail to MainStayShareholderServices@nylim.com. These documents are also available via the MainStay Funds’ website at newyorklifeinvestments.com. Please read the Fund’s Summary Prospectus and/or Prospectus carefully before investing.

Average Annual Total Returns for the Period-Ended April 30, 2022 | ||||||||
Class | Sales Charge | Inception Date | Six Months1 | One Year | Five Years | Ten Years or Since Inception | Gross Expense Ratio2 | |
Class A Shares | Maximum 5.5% Initial Sales Charge | With sales charges | 8/2/2006 | -7.12% | -4.31% | 4.35% | 6.34% | 1.16% |
Excluding sales charges | -1.71 | 1.26 | 5.53 | 6.94 | 1.16 | |||
Investor Class Shares3 | Maximum 5% Initial Sales Charge | With sales charges | 11/16/2009 | -6.64 | -3.84 | 4.32 | 6.32 | 1.16 |
Excluding sales charges | -1.73 | 1.22 | 5.51 | 6.92 | 1.16 | |||
Class C Shares | Maximum 1% CDSC | With sales charges | 11/16/2009 | -3.07 | -0.53 | 4.74 | 6.14 | 1.91 |
if Redeemed Within One Year of Purchase | Excluding sales charges | -2.10 | 0.46 | 4.74 | 6.14 | 1.91 | ||
Class I Shares | No Sales Charge | 12/27/2005 | -1.59 | 1.47 | 5.78 | 7.20 | 0.91 | |
Class R2 Shares | No Sales Charge | 2/28/2014 | -1.77 | 1.14 | 5.37 | 4.80 | 1.26 | |
Class R3 Shares | No Sales Charge | 2/29/2016 | -1.91 | 0.82 | 5.09 | 6.46 | 1.51 | |
Class R6 Shares | No Sales Charge | 6/17/2013 | -1.56 | 1.55 | 5.64 | 6.13 | 0.75 | |
1. | Not annualized. |
2. | The gross expense ratios presented reflect the Fund’s “Total Annual Fund Operating Expenses” from the most recent Prospectus, as supplemented, and may differ from other expense ratios disclosed in this report. |
3. | Prior to June 30, 2020, the maximum initial sales charge was 5.5%, which is reflected in the applicable average annual total return figures shown. |
Benchmark Performance* | Six Months1 | One Year | Five Years | Ten Years |
MSCI World Index (Net)2 | -11.30% | -3.52% | 10.17% | 10.05% |
Global Equity Yield Composite Index3 | -1.07 | 2.64 | 7.36 | 8.32 |
Morningstar Global Large Stock Value Category Average4 | -5.15 | -2.24 | 6.14 | 7.63 |
* | Returns for indices reflect no deductions for fees, expenses or taxes, except for foreign withholding taxes where applicable. |
1. | Not annualized. |
2. | The MSCI World Index (Net) is the Fund's primary broad-based securities market index for comparison purposes. The MSCI World Index (Net) is a free float-adjusted market capitalization weighted index that is designed to measure the equity market performance of developed markets. Results assume reinvestment of all dividends and capital gains. An investment cannot be made directly in an index. |
3. | The Fund has selected the Global Equity Yield Composite Index as its secondary benchmark. The Global Equity Yield Composite Index consists of the MSCI World High Dividend Yield Index and the MSCI World Minimum Volatility (USD) Index weighted at 60% and 40%, respectively. The MSCI World High Dividend Yield Index is based on the MSCI World Index and is designed to reflect the performance of equities in the MSCI World Index (excluding real estate investment trusts) with higher dividend income and quality characteristics than average dividend yields that are both sustainable and persistent. The MSCI World Minimum Volatility (USD) Index aims to reflect the performance characteristics of a minimum variance strategy applied to the MSCI large and mid-cap equity universe across 23 developed markets countries. The MSCI World Minimum Volatility (USD) Index is calculated by optimizing the MSCI World Index for the lowest absolute risk (within a given set of constraints). Results assume reinvestment of all dividends and capital gains. An investment cannot be made directly in an index. |
4. | Morningstar Global Large Stock Value portfolios invest in a variety of international stocks and typically skew towards large caps that are less expensive or growing more slowly than other global large-cap stocks. Global large stock value portfolios have few geographical limitations. It is common for these portfolios to invest the majority of their assets in developed markets, with the remainder divided among the globe’s emerging markets. These portfolios are not significantly overweight U.S. equity exposure relative to the Morningstar Global Market Index and maintain at least a 20% absolute U.S. exposure. |
6 | MainStay Epoch Global Equity Yield Fund |
Share Class | Beginning Account Value 11/1/21 | Ending Account Value (Based on Actual Returns and Expenses) 4/30/22 | Expenses Paid During Period1 | Ending Account Value (Based on Hypothetical 5% Annualized Return and Actual Expenses) 4/30/22 | Expenses Paid During Period1 | Net Expense Ratio During Period2 |
Class A Shares | $1,000.00 | $982.90 | $5.36 | $1,019.39 | $5.46 | 1.09% |
Investor Class Shares | $1,000.00 | $982.70 | $5.65 | $1,019.09 | $5.76 | 1.15% |
Class C Shares | $1,000.00 | $979.00 | $9.03 | $1,015.67 | $9.20 | 1.84% |
Class I Shares | $1,000.00 | $984.10 | $4.13 | $1,020.63 | $4.21 | 0.84% |
Class R2 Shares | $1,000.00 | $982.30 | $6.05 | $1,018.70 | $6.16 | 1.23% |
Class R3 Shares | $1,000.00 | $980.90 | $7.27 | $1,017.46 | $7.40 | 1.48% |
Class R6 Shares | $1,000.00 | $984.40 | $3.64 | $1,021.13 | $3.71 | 0.74% |
1. | Expenses are equal to the Fund’s annualized expense ratio of each class multiplied by the average account value over the period, divided by 365 and multiplied by 181 (to reflect the six-month period). The table above represents the actual expenses incurred during the six-month period. In addition to the fees and expenses which the Fund bears directly, it also indirectly bears a pro rata share of the fees and expenses of the underlying funds in which it invests. Such indirect expenses are not included in the above-reported expense figures. |
2. | Expenses are equal to the Fund's annualized expense ratio to reflect the six-month period. |
Country Composition as of April 30, 2022 (Unaudited)
United States | 66.2% |
United Kingdom | 8.3 |
Canada | 7.0 |
Germany | 5.4 |
France | 4.7 |
Switzerland | 2.1 |
Japan | 1.6 |
Norway | 1.1 |
Taiwan | 1.1% |
Italy | 1.0 |
Republic of Korea | 0.8 |
China | 0.6 |
Spain | 0.5 |
Other Assets, Less Liabilities | –0.4 |
100.0% |
Top Ten Holdings and/or Issuers Held as of April 30, 2022 (excluding short-term investments) (Unaudited)
1. | Broadcom, Inc. |
2. | Microsoft Corp. |
3. | International Business Machines Corp. |
4. | Apple, Inc. |
5. | Analog Devices, Inc. |
6. | Emerson Electric Co. |
7. | AstraZeneca plc, Sponsored ADR |
8. | Cisco Systems, Inc. |
9. | Medtronic plc |
10. | Coca-Cola Europacific Partners plc |
8 | MainStay Epoch Global Equity Yield Fund |
10 | MainStay Epoch Global Equity Yield Fund |
Shares | Value | |
Common Stocks 97.4% | ||
Canada 7.0% | ||
Enbridge, Inc. (Oil, Gas & Consumable Fuels) | 152,459 | $ 6,653,058 |
Fortis, Inc. (Electric Utilities) | 129,379 | 6,295,475 |
Great-West Lifeco, Inc. (Insurance) | 211,045 | 5,822,158 |
Manulife Financial Corp. (Insurance) | 444,173 | 8,685,343 |
Nutrien Ltd. (Chemicals) | 149,097 | 14,648,780 |
Restaurant Brands International, Inc. (Hotels, Restaurants & Leisure) | 306,532 | 17,499,912 |
Royal Bank of Canada (Banks) | 126,100 | 12,736,134 |
TELUS Corp. (Diversified Telecommunication Services) | 271,713 | 6,797,848 |
79,138,708 | ||
China 0.6% | ||
China Resources Gas Group Ltd. (Gas Utilities) | 1,684,000 | 6,347,837 |
France 4.7% | ||
AXA SA (Insurance) | 253,891 | 6,721,934 |
Cie Generale des Etablissements Michelin SCA (Auto Components) | 47,570 | 5,880,813 |
Danone SA (Food Products) | 104,539 | 6,284,619 |
Orange SA (Diversified Telecommunication Services) | 710,183 | 8,458,400 |
Sanofi (Pharmaceuticals) | 103,883 | 10,933,793 |
TotalEnergies SE (Oil, Gas & Consumable Fuels) | 319,346 | 15,734,687 |
54,014,246 | ||
Germany 5.4% | ||
Allianz SE (Registered) (Insurance) | 38,049 | 8,666,238 |
BASF SE (Chemicals) (a) | 107,910 | 5,736,230 |
Bayer AG (Registered) (Pharmaceuticals) (a) | 118,311 | 7,798,197 |
Deutsche Post AG (Registered) (Air Freight & Logistics) | 213,576 | 9,219,546 |
Deutsche Telekom AG (Registered) (Diversified Telecommunication Services) | 941,378 | 17,339,847 |
Muenchener Rueckversicherungs-Gesellschaft AG (Registered) (Insurance) | 24,338 | 5,823,838 |
Siemens AG (Registered) (Industrial Conglomerates) | 59,644 | 7,418,817 |
62,002,713 | ||
Shares | Value | |
Italy 1.0% | ||
Assicurazioni Generali SpA (Insurance) (b) | 298,084 | $ 5,625,478 |
Snam SpA (Gas Utilities) | 1,052,246 | 5,774,431 |
11,399,909 | ||
Japan 1.6% | ||
Bridgestone Corp. (Auto Components) | 184,300 | 6,745,593 |
Tokio Marine Holdings, Inc. (Insurance) | 104,700 | 5,650,111 |
Toyota Motor Corp. (Automobiles) | 323,300 | 5,509,020 |
17,904,724 | ||
Norway 1.1% | ||
Orkla ASA (Food Products) | 702,903 | 5,717,563 |
Telenor ASA (Diversified Telecommunication Services) | 487,590 | 6,879,929 |
12,597,492 | ||
Republic of Korea 0.8% | ||
Samsung Electronics Co. Ltd., GDR (Technology Hardware, Storage & Peripherals) | 7,087 | 9,268,749 |
Spain 0.5% | ||
Industria de Diseno Textil SA (Specialty Retail) (b) | 270,002 | 5,661,929 |
Switzerland 2.1% | ||
Nestle SA (Registered) (Food Products) | 66,513 | 8,587,192 |
Novartis AG (Registered) (Pharmaceuticals) | 104,032 | 9,203,443 |
Roche Holding AG (Pharmaceuticals) | 15,279 | 5,658,832 |
23,449,467 | ||
Taiwan 1.1% | ||
Taiwan Semiconductor Manufacturing Co. Ltd., Sponsored ADR (Semiconductors & Semiconductor Equipment) | 135,396 | 12,582,350 |
United Kingdom 8.3% | ||
AstraZeneca plc, Sponsored ADR (Pharmaceuticals) | 306,195 | 20,331,348 |
B&M European Value Retail SA (Multiline Retail) | 827,680 | 5,074,628 |
BAE Systems plc (Aerospace & Defense) | 828,969 | 7,721,455 |
British American Tobacco plc (Tobacco) | 269,633 | 11,363,161 |
12 | MainStay Epoch Global Equity Yield Fund |
Shares | Value | |
Common Stocks (continued) | ||
United Kingdom (continued) | ||
Coca-Cola Europacific Partners plc (Beverages) | 360,704 | $ 18,017,165 |
Linde plc (Chemicals) | 41,788 | 13,036,184 |
National Grid plc (Multi-Utilities) | 427,914 | 6,362,297 |
RELX plc (Professional Services) | 207,213 | 6,177,664 |
Unilever plc (Personal Products) | 131,613 | 6,113,163 |
94,197,065 | ||
United States 63.2% | ||
AbbVie, Inc. (Biotechnology) | 90,191 | 13,247,254 |
Air Products and Chemicals, Inc. (Chemicals) | 31,016 | 7,259,915 |
Ally Financial, Inc. (Consumer Finance) | 231,414 | 9,247,303 |
Altria Group, Inc. (Tobacco) | 159,799 | 8,880,030 |
Ameren Corp. (Multi-Utilities) | 68,660 | 6,378,514 |
American Electric Power Co., Inc. (Electric Utilities) | 134,780 | 13,358,046 |
American Tower Corp. (Equity Real Estate Investment Trusts) | 25,082 | 6,045,264 |
Amgen, Inc. (Biotechnology) | 25,997 | 6,062,240 |
Analog Devices, Inc. (Semiconductors & Semiconductor Equipment) | 142,866 | 22,055,653 |
Apple, Inc. (Technology Hardware, Storage & Peripherals) | 142,435 | 22,454,878 |
Arthur J. Gallagher & Co. (Insurance) | 66,110 | 11,138,874 |
AT&T, Inc. (Diversified Telecommunication Services) | 447,137 | 8,433,004 |
Bank of America Corp. (Banks) | 286,129 | 10,209,083 |
Broadcom, Inc. (Semiconductors & Semiconductor Equipment) | 46,518 | 25,789,114 |
Chevron Corp. (Oil, Gas & Consumable Fuels) | 52,983 | 8,300,847 |
Cisco Systems, Inc. (Communications Equipment) | 413,881 | 20,271,891 |
Coca-Cola Co. (The) (Beverages) | 175,286 | 11,325,228 |
Comcast Corp., Class A (Media) | 233,918 | 9,300,580 |
Cummins, Inc. (Machinery) | 54,306 | 10,274,152 |
Dow, Inc. (Chemicals) | 108,197 | 7,195,100 |
Duke Energy Corp. (Electric Utilities) | 60,023 | 6,612,134 |
Eaton Corp. plc (Electrical Equipment) | 75,691 | 10,976,709 |
Eli Lilly and Co. (Pharmaceuticals) | 44,906 | 13,118,390 |
Emerson Electric Co. (Electrical Equipment) | 242,685 | 21,885,333 |
Entergy Corp. (Electric Utilities) | 55,981 | 6,653,342 |
Enterprise Products Partners LP (Oil, Gas & Consumable Fuels) | 452,579 | 11,726,322 |
Evergy, Inc. (Electric Utilities) | 89,361 | 6,063,144 |
Shares | Value | |
United States (continued) | ||
GlaxoSmithKline plc (Pharmaceuticals) | 292,308 | $ 6,581,924 |
Hanesbrands, Inc. (Textiles, Apparel & Luxury Goods) | 414,360 | 5,494,414 |
Hasbro, Inc. (Leisure Products) | 133,843 | 11,786,215 |
Home Depot, Inc. (The) (Specialty Retail) | 22,447 | 6,743,079 |
Honeywell International, Inc. (Industrial Conglomerates) | 53,339 | 10,321,630 |
Hubbell, Inc. (Electrical Equipment) | 46,160 | 9,017,818 |
Intel Corp. (Semiconductors & Semiconductor Equipment) | 188,690 | 8,224,997 |
International Business Machines Corp. (IT Services) | 173,101 | 22,885,683 |
Iron Mountain, Inc. (Equity Real Estate Investment Trusts) | 137,387 | 7,381,803 |
Johnson & Johnson (Pharmaceuticals) | 43,030 | 7,765,194 |
JPMorgan Chase & Co. (Banks) | 96,174 | 11,479,329 |
KLA Corp. (Semiconductors & Semiconductor Equipment) | 40,790 | 13,022,615 |
Lazard Ltd., Class A (Capital Markets) (b) | 208,801 | 6,842,409 |
Leggett & Platt, Inc. (Household Durables) | 176,873 | 6,301,985 |
Lockheed Martin Corp. (Aerospace & Defense) | 14,623 | 6,318,891 |
LyondellBasell Industries NV, Class A (Chemicals) | 64,718 | 6,862,049 |
Magellan Midstream Partners LP (Oil, Gas & Consumable Fuels) | 137,571 | 6,665,315 |
McDonald's Corp. (Hotels, Restaurants & Leisure) | 30,029 | 7,482,026 |
Medtronic plc (Health Care Equipment & Supplies) | 178,400 | 18,617,824 |
Merck & Co., Inc. (Pharmaceuticals) | 137,904 | 12,230,706 |
MetLife, Inc. (Insurance) | 169,119 | 11,107,736 |
Microsoft Corp. (Software) | 84,342 | 23,406,592 |
MSC Industrial Direct Co., Inc., Class A (Trading Companies & Distributors) | 130,142 | 10,783,566 |
NextEra Energy, Inc. (Electric Utilities) | 85,687 | 6,085,491 |
NiSource, Inc. (Multi-Utilities) | 209,437 | 6,098,805 |
Omnicom Group, Inc. (Media) | 87,200 | 6,638,536 |
Pfizer, Inc. (Pharmaceuticals) | 112,558 | 5,523,221 |
Philip Morris International, Inc. (Tobacco) | 97,900 | 9,790,000 |
PNC Financial Services Group, Inc. (The) (Banks) | 41,972 | 6,971,549 |
Procter & Gamble Co. (The) (Household Products) | 39,406 | 6,326,633 |
Shares | Value | |
Common Stocks (continued) | ||
United States (continued) | ||
Raytheon Technologies Corp. (Aerospace & Defense) | 115,678 | $ 10,978,999 |
Realty Income Corp. (Equity Real Estate Investment Trusts) | 91,158 | 6,322,719 |
Target Corp. (Multiline Retail) | 50,704 | 11,593,470 |
Texas Instruments, Inc. (Semiconductors & Semiconductor Equipment) | 64,902 | 11,049,565 |
Travelers Cos., Inc. (The) (Insurance) | 47,207 | 8,075,229 |
Truist Financial Corp. (Banks) | 124,972 | 6,042,396 |
United Parcel Service, Inc., Class B (Air Freight & Logistics) | 54,099 | 9,736,738 |
UnitedHealth Group, Inc. (Health Care Providers & Services) | 18,765 | 9,542,941 |
Vail Resorts, Inc. (Hotels, Restaurants & Leisure) | 37,438 | 9,515,242 |
Verizon Communications, Inc. (Diversified Telecommunication Services) | 123,569 | 5,721,245 |
Walmart, Inc. (Food & Staples Retailing) | 77,731 | 11,892,066 |
WEC Energy Group, Inc. (Multi-Utilities) | 63,505 | 6,353,675 |
Welltower, Inc. (Equity Real Estate Investment Trusts) | 74,463 | 6,761,985 |
WP Carey, Inc. (Equity Real Estate Investment Trusts) | 77,696 | 6,275,506 |
718,882,155 | ||
Total Common Stocks (Cost $943,864,119) | 1,107,447,344 | |
Shares | Value | |
Short-Term Investments 3.0% | ||
Affiliated Investment Company 1.5% | ||
United States 1.5% | ||
MainStay U.S. Government Liquidity Fund, 0.397% (c) | 16,582,754 | $ 16,582,754 |
Unaffiliated Investment Company 1.5% | ||
United States 1.5% | ||
Invesco Government & Agency Portfolio, 0.419% (c)(d) | 17,583,116 | 17,583,116 |
Total Short-Term Investments (Cost $34,165,870) | 34,165,870 | |
Total Investments (Cost $978,029,989) | 100.4% | 1,141,613,214 |
Other Assets, Less Liabilities | (0.4) | (4,449,168) |
Net Assets | 100.0% | $ 1,137,164,046 |
† | Percentages indicated are based on Fund net assets. |
(a) | Non-income producing security. |
(b) | All or a portion of this security was held on loan. As of April 30, 2022, the aggregate market value of securities on loan was $16,572,379; the total market value of collateral held by the Fund was $17,587,848. The market value of the collateral held included non-cash collateral in the form of U.S. Treasury securities with a value of $4,732. The Fund received cash collateral with a value of $17,583,116. (See Note 2(I)) |
(c) | Current yield as of April 30, 2022. |
(d) | Represents a security purchased with cash collateral received for securities on loan. |
Affiliated Investment Companies | Value, Beginning of Period | Purchases at Cost | Proceeds from Sales | Net Realized Gain/(Loss) on Sales | Change in Unrealized Appreciation/ (Depreciation) | Value, End of Period | Dividend Income | Other Distributions | Shares End of Period |
MainStay U.S. Government Liquidity Fund | $ 19,800 | $ 81,656 | $ (84,873) | $ — | $ — | $ 16,583 | $ 2 | $ — | 16,583 |
Abbreviation(s): |
ADR—American Depositary Receipt |
GDR—Global Depositary Receipt |
14 | MainStay Epoch Global Equity Yield Fund |
Description | Quoted Prices in Active Markets for Identical Assets (Level 1) | Significant Other Observable Inputs (Level 2) | Significant Unobservable Inputs (Level 3) | Total |
Asset Valuation Inputs | ||||
Investments in Securities (a) | ||||
Common Stocks | ||||
China | $ — | $ 6,347,837 | $ — | $ 6,347,837 |
France | — | 54,014,246 | — | 54,014,246 |
Germany | — | 62,002,713 | — | 62,002,713 |
Italy | — | 11,399,909 | — | 11,399,909 |
Japan | — | 17,904,724 | — | 17,904,724 |
Norway | — | 12,597,492 | — | 12,597,492 |
Republic of Korea | — | 9,268,749 | — | 9,268,749 |
Spain | — | 5,661,929 | — | 5,661,929 |
Switzerland | — | 23,449,467 | — | 23,449,467 |
United Kingdom | 51,384,697 | 42,812,368 | — | 94,197,065 |
United States | 712,300,231 | 6,581,924 | — | 718,882,155 |
All Other Countries | 91,721,058 | — | — | 91,721,058 |
Total Common Stocks | 855,405,986 | 252,041,358 | — | 1,107,447,344 |
Short-Term Investments | ||||
Affiliated Investment Company | 16,582,754 | — | — | 16,582,754 |
Unaffiliated Investment Company | 17,583,116 | — | — | 17,583,116 |
Total Short-Term Investments | 34,165,870 | — | — | 34,165,870 |
Total Investments in Securities | $ 889,571,856 | $ 252,041,358 | $ — | $ 1,141,613,214 |
(a) | For a complete listing of investments and their industries, see the Portfolio of Investments. |
Value | Percent | |
Aerospace & Defense | $25,019,345 | 2.3% |
Air Freight & Logistics | 18,956,284 | 1.7 |
Auto Components | 12,626,406 | 1.1 |
Automobiles | 5,509,020 | 0.5 |
Banks | 47,438,491 | 4.1 |
Beverages | 29,342,393 | 2.6 |
Biotechnology | 19,309,494 | 1.7 |
Capital Markets | 6,842,409 | 0.6 |
Chemicals | 54,738,258 | 4.8 |
Communications Equipment | 20,271,891 | 1.8 |
Consumer Finance | 9,247,303 | 0.8 |
Diversified Telecommunication Services | 53,630,273 | 4.6 |
Electric Utilities | 45,067,632 | 4.0 |
Electrical Equipment | 41,879,860 | 3.7 |
Equity Real Estate Investment Trusts | 32,787,277 | 2.8 |
Food & Staples Retailing | 11,892,066 | 1.0 |
Food Products | 20,589,374 | 1.8 |
Gas Utilities | 12,122,268 | 1.1 |
Health Care Equipment & Supplies | 18,617,824 | 1.6 |
Health Care Providers & Services | 9,542,941 | 0.8 |
Hotels, Restaurants & Leisure | 34,497,180 | 3.0 |
Household Durables | 6,301,985 | 0.6 |
Household Products | 6,326,633 | 0.6 |
Industrial Conglomerates | 17,740,447 | 1.5 |
Insurance | 77,316,939 | 6.9 |
IT Services | 22,885,683 | 2.0 |
Leisure Products | 11,786,215 | 1.0 |
Machinery | 10,274,152 | 0.9 |
Media | 15,939,116 | 1.4 |
Multiline Retail | 16,668,098 | 1.4 |
Multi-Utilities | 25,193,291 | 2.3 |
Oil, Gas & Consumable Fuels | 49,080,229 | 4.3 |
Personal Products | 6,113,163 | 0.5 |
Pharmaceuticals | 99,145,048 | 8.9 |
Professional Services | 6,177,664 | 0.5 |
Semiconductors & Semiconductor Equipment | 92,724,294 | 8.1 |
Software | 23,406,592 | 2.1 |
Specialty Retail | 12,405,008 | 1.1 |
Technology Hardware, Storage & Peripherals | 31,723,627 | 2.8 |
Textiles, Apparel & Luxury Goods | 5,494,414 | 0.5 |
Tobacco | 30,033,191 | 2.7 |
Trading Companies & Distributors | 10,783,566 | 0.9 |
1,107,447,344 | 97.4 |
Value | Percent | |
Short-Term Investments | $34,165,870 | 3.0% |
Other Assets, Less Liabilities | (4,449,168) | (0.4) |
Net Assets | $1,137,164,046 | 100.0% |
† | Percentages indicated are based on Fund net assets. |
16 | MainStay Epoch Global Equity Yield Fund |
Assets | |
Investment in unaffiliated securities, at value (identified cost $961,447,235) including securities on loan of $16,572,379 | $1,125,030,460 |
Investment in affiliated investment companies, at value (identified cost $16,582,754) | 16,582,754 |
Cash | 114,700 |
Cash denominated in foreign currencies (identified cost $104) | 99 |
Receivables: | |
Investment securities sold | 24,044,591 |
Dividends and interest | 5,532,806 |
Fund shares sold | 1,562,106 |
Securities lending | 26,356 |
Other assets | 75,130 |
Total assets | 1,172,969,002 |
Liabilities | |
Cash collateral received for securities on loan | 17,583,116 |
Payables: | |
Investment securities purchased | 16,539,778 |
Manager (See Note 3) | 628,845 |
Fund shares redeemed | 491,000 |
Transfer agent (See Note 3) | 287,478 |
Shareholder communication | 138,196 |
NYLIFE Distributors (See Note 3) | 48,941 |
Professional fees | 32,470 |
Custodian | 30,192 |
Trustees | 7,403 |
Accrued expenses | 17,537 |
Total liabilities | 35,804,956 |
Net assets | $1,137,164,046 |
Composition of Net Assets | |
Shares of beneficial interest outstanding (par value of $.001 per share) unlimited number of shares authorized | $58,032 |
Additional paid-in-capital | 1,017,988,044 |
1,018,046,076 | |
Total distributable earnings (loss) | 119,117,970 |
Net assets | $1,137,164,046 |
Class A | |
Net assets applicable to outstanding shares | $130,829,532 |
Shares of beneficial interest outstanding | 6,661,507 |
Net asset value per share outstanding | $19.64 |
Maximum sales charge (5.50% of offering price) | 1.14 |
Maximum offering price per share outstanding | $20.78 |
Investor Class | |
Net assets applicable to outstanding shares | $8,655,939 |
Shares of beneficial interest outstanding | 441,716 |
Net asset value per share outstanding | $19.60 |
Maximum sales charge (5.00% of offering price) | 1.03 |
Maximum offering price per share outstanding | $20.63 |
Class C | |
Net assets applicable to outstanding shares | $21,464,680 |
Shares of beneficial interest outstanding | 1,099,033 |
Net asset value and offering price per share outstanding | $19.53 |
Class I | |
Net assets applicable to outstanding shares | $972,843,125 |
Shares of beneficial interest outstanding | 49,655,790 |
Net asset value and offering price per share outstanding | $19.59 |
Class R2 | |
Net assets applicable to outstanding shares | $224,267 |
Shares of beneficial interest outstanding | 11,408 |
Net asset value and offering price per share outstanding | $19.66 |
Class R3 | |
Net assets applicable to outstanding shares | $622,486 |
Shares of beneficial interest outstanding | 31,720 |
Net asset value and offering price per share outstanding | $19.62 |
Class R6 | |
Net assets applicable to outstanding shares | $2,524,017 |
Shares of beneficial interest outstanding | 130,480 |
Net asset value and offering price per share outstanding | $19.34 |
Investment Income (Loss) | |
Income | |
Dividends-unaffiliated (net of foreign tax withholding of $756,127) | $17,638,498 |
Securities lending | 44,641 |
Dividends-affiliated | 2,231 |
Total income | 17,685,370 |
Expenses | |
Manager (See Note 3) | 4,099,847 |
Transfer agent (See Note 3) | 866,197 |
Distribution/Service—Class A (See Note 3) | 167,679 |
Distribution/Service—Investor Class (See Note 3) | 11,137 |
Distribution/Service—Class C (See Note 3) | 126,275 |
Distribution/Service—Class R2 (See Note 3) | 287 |
Distribution/Service—Class R3 (See Note 3) | 1,595 |
Professional fees | 55,997 |
Registration | 47,400 |
Shareholder communication | 41,101 |
Custodian | 35,218 |
Trustees | 13,946 |
Shareholder service (See Note 3) | 434 |
Miscellaneous | 35,632 |
Total expenses before waiver/reimbursement | 5,502,745 |
Expense waiver/reimbursement from Manager (See Note 3) | (273,407) |
Net expenses | 5,229,338 |
Net investment income (loss) | 12,456,032 |
Realized and Unrealized Gain (Loss) | |
Net realized gain (loss) on: | |
Unaffiliated investment transactions | 42,998,045 |
Foreign currency transactions | 176,521 |
Net realized gain (loss) | 43,174,566 |
Net change in unrealized appreciation (depreciation) on: | |
Unaffiliated investments | (73,621,542) |
Translation of other assets and liabilities in foreign currencies | (305,905) |
Net change in unrealized appreciation (depreciation) | (73,927,447) |
Net realized and unrealized gain (loss) | (30,752,881) |
Net increase (decrease) in net assets resulting from operations | $(18,296,849) |
18 | MainStay Epoch Global Equity Yield Fund |
for the six months ended April 30, 2022 (Unaudited) and the year ended October 31, 2021
2022 | 2021 | |
Increase (Decrease) in Net Assets | ||
Operations: | ||
Net investment income (loss) | $12,456,032 | $30,455,754 |
Net realized gain (loss) | 43,174,566 | 134,496,684 |
Net change in unrealized appreciation (depreciation) | (73,927,447) | 172,222,843 |
Net increase (decrease) in net assets resulting from operations | (18,296,849) | 337,175,281 |
Distributions to shareholders: | ||
Class A | (1,340,037) | (3,483,019) |
Investor Class | (88,068) | (241,824) |
Class C | (142,757) | (643,860) |
Class I | (11,253,212) | (30,164,398) |
Class R2 | (2,160) | (12,269) |
Class R3 | (4,770) | (12,566) |
Class R6 | (19,009) | (19,563) |
Total distributions to shareholders | (12,850,013) | (34,577,499) |
Capital share transactions: | ||
Net proceeds from sales of shares | 91,328,722 | 212,090,447 |
Net asset value of shares issued to shareholders in reinvestment of distributions | 11,544,139 | 30,532,850 |
Cost of shares redeemed | (111,715,629) | (629,451,002) |
Increase (decrease) in net assets derived from capital share transactions | (8,842,768) | (386,827,705) |
Net increase (decrease) in net assets | (39,989,630) | (84,229,923) |
Net Assets | ||
Beginning of period | 1,177,153,676 | 1,261,383,599 |
End of period | $1,137,164,046 | $1,177,153,676 |
Six months ended April 30, 2022* | Year Ended October 31, | |||||
Class A | 2021 | 2020 | 2019 | 2018 | 2017 | |
Net asset value at beginning of period | $20.18 | $15.83 | $18.75 | $18.38 | $19.66 | $17.42 |
Net investment income (loss) (a) | 0.20 | 0.45 | 0.46 | 0.57 | 0.60 | 0.49 |
Net realized and unrealized gain (loss) | (0.54) | 4.43 | (2.59) | 1.42 | (1.30) | 2.24 |
Total from investment operations | (0.34) | 4.88 | (2.13) | 1.99 | (0.70) | 2.73 |
Less distributions: | ||||||
From net investment income | (0.20) | (0.53) | (0.45) | (0.59) | (0.56) | (0.49) |
From net realized gain on investments | — | — | (0.34) | (1.03) | (0.02) | — |
Total distributions | (0.20) | (0.53) | (0.79) | (1.62) | (0.58) | (0.49) |
Net asset value at end of period | $19.64 | $20.18 | $15.83 | $18.75 | $18.38 | $19.66 |
Total investment return (b) | (1.71)% | 30.98% | (11.48)% | 11.66% | (3.64)% | 15.88% |
Ratios (to average net assets)/Supplemental Data: | ||||||
Net investment income (loss) | 1.93%†† | 2.32% | 2.74% | 3.17% | 3.07% | 2.62% |
Net expenses (c) | 1.09%†† | 1.09%(d) | 1.09%(d) | 1.10%(d) | 1.10% | 1.14% |
Expenses (before waiver/reimbursement) (c) | 1.14%†† | 1.16%(d) | 1.14%(d) | 1.14%(d) | 1.16% | 1.14% |
Portfolio turnover rate | 34% | 27% | 40% | 24% | 15% | 18% |
Net assets at end of period (in 000’s) | $130,830 | $134,982 | $103,166 | $125,791 | $134,136 | $782,204 |
* | Unaudited. |
†† | Annualized. |
(a) | Per share data based on average shares outstanding during the period. |
(b) | Total investment return is calculated exclusive of sales charges and assumes the reinvestment of dividends and distributions. For periods of less than one year, total return is not annualized. |
(c) | In addition to the fees and expenses which the Fund bears directly, it also indirectly bears a pro-rata share of the fees and expenses of the underlying funds in which it invests. Such indirect expenses are not included in the above expense ratios. |
(d) | Net of interest expense of less than 0.01%. (See Note 6) |
Six months ended April 30, 2022* | Year Ended October 31, | |||||
Investor Class | 2021 | 2020 | 2019 | 2018 | 2017 | |
Net asset value at beginning of period | $20.14 | $15.80 | $18.72 | $18.35 | $19.63 | $17.39 |
Net investment income (loss) (a) | 0.19 | 0.44 | 0.46 | 0.57 | 0.54 | 0.49 |
Net realized and unrealized gain (loss) | (0.53) | 4.42 | (2.59) | 1.42 | (1.24) | 2.25 |
Total from investment operations | (0.34) | 4.86 | (2.13) | 1.99 | (0.70) | 2.74 |
Less distributions: | ||||||
From net investment income | (0.20) | (0.52) | (0.45) | (0.59) | (0.56) | (0.50) |
From net realized gain on investments | — | — | (0.34) | (1.03) | (0.02) | — |
Total distributions | (0.20) | (0.52) | (0.79) | (1.62) | (0.58) | (0.50) |
Net asset value at end of period | $19.60 | $20.14 | $15.80 | $18.72 | $18.35 | $19.63 |
Total investment return (b) | (1.73)% | 30.91% | (11.53)% | 11.67% | (3.65)% | 15.93% |
Ratios (to average net assets)/Supplemental Data: | ||||||
Net investment income (loss) | 1.87%†† | 2.29% | 2.70% | 3.15% | 2.80% | 2.66% |
Net expenses (c) | 1.15%†† | 1.15%(d) | 1.13%(d) | 1.11%(d) | 1.10% | 1.11% |
Expenses (before waiver/reimbursement) (c) | 1.15%†† | 1.16%(d) | 1.13%(d) | 1.11%(d) | 1.10% | 1.11% |
Portfolio turnover rate | 34% | 27% | 40% | 24% | 15% | 18% |
Net assets at end of period (in 000's) | $8,656 | $9,081 | $7,897 | $10,067 | $9,582 | $10,849 |
* | Unaudited. |
†† | Annualized. |
(a) | Per share data based on average shares outstanding during the period. |
(b) | Total investment return is calculated exclusive of sales charges and assumes the reinvestment of dividends and distributions. For periods of less than one year, total return is not annualized. |
(c) | In addition to the fees and expenses which the Fund bears directly, it also indirectly bears a pro-rata share of the fees and expenses of the underlying funds in which it invests. Such indirect expenses are not included in the above expense ratios. |
(d) | Net of interest expense of less than 0.01%. (See Note 6) |
20 | MainStay Epoch Global Equity Yield Fund |
Six months ended April 30, 2022* | Year Ended October 31, | |||||
Class C | 2021 | 2020 | 2019 | 2018 | 2017 | |
Net asset value at beginning of period | $20.07 | $15.73 | $18.62 | $18.25 | $19.53 | $17.30 |
Net investment income (loss) (a) | 0.12 | 0.30 | 0.34 | 0.44 | 0.40 | 0.35 |
Net realized and unrealized gain (loss) | (0.54) | 4.40 | (2.57) | 1.41 | (1.25) | 2.24 |
Total from investment operations | (0.42) | 4.70 | (2.23) | 1.85 | (0.85) | 2.59 |
Less distributions: | ||||||
From net investment income | (0.12) | (0.36) | (0.32) | (0.45) | (0.41) | (0.36) |
From net realized gain on investments | — | — | (0.34) | (1.03) | (0.02) | — |
Total distributions | (0.12) | (0.36) | (0.66) | (1.48) | (0.43) | (0.36) |
Net asset value at end of period | $19.53 | $20.07 | $15.73 | $18.62 | $18.25 | $19.53 |
Total investment return (b) | (2.10)% | 30.00% | (12.14)% | 10.88% | (4.41)% | 15.08% |
Ratios (to average net assets)/Supplemental Data: | ||||||
Net investment income (loss) | 1.17%†† | 1.59% | 2.00% | 2.47% | 2.08% | 1.91% |
Net expenses (c) | 1.84%†† | 1.84%(d) | 1.84%(d) | 1.85%(d) | 1.84% | 1.86% |
Expenses (before waiver/reimbursement) (c) | 1.90%†† | 1.91%(d) | 1.88%(d) | 1.87%(d) | 1.85% | 1.86% |
Portfolio turnover rate | 34% | 27% | 40% | 24% | 15% | 18% |
Net assets at end of period (in 000’s) | $21,465 | $27,874 | $42,298 | $97,872 | $138,182 | $189,291 |
* | Unaudited. |
†† | Annualized. |
(a) | Per share data based on average shares outstanding during the period. |
(b) | Total investment return is calculated exclusive of sales charges and assumes the reinvestment of dividends and distributions. For periods of less than one year, total return is not annualized. |
(c) | In addition to the fees and expenses which the Fund bears directly, it also indirectly bears a pro-rata share of the fees and expenses of the underlying funds in which it invests. Such indirect expenses are not included in the above expense ratios. |
(d) | Net of interest expense of less than 0.01%. (See Note 6) |
Six months ended April 30, 2022* | Year Ended October 31, | |||||
Class I | 2021 | 2020 | 2019 | 2018 | 2017 | |
Net asset value at beginning of period | $20.13 | $15.79 | $18.72 | $18.34 | $19.63 | $17.39 |
Net investment income (loss) (a) | 0.22 | 0.50 | 0.50 | 0.62 | 0.59 | 0.53 |
Net realized and unrealized gain (loss) | (0.53) | 4.42 | (2.59) | 1.43 | (1.25) | 2.25 |
Total from investment operations | (0.31) | 4.92 | (2.09) | 2.05 | (0.66) | 2.78 |
Less distributions: | ||||||
From net investment income | (0.23) | (0.58) | (0.50) | (0.64) | (0.61) | (0.54) |
From net realized gain on investments | — | — | (0.34) | (1.03) | (0.02) | — |
Total distributions | (0.23) | (0.58) | (0.84) | (1.67) | (0.63) | (0.54) |
Net asset value at end of period | $19.59 | $20.13 | $15.79 | $18.72 | $18.34 | $19.63 |
Total investment return (b) | (1.59)% | 31.32% | (11.31)% | 12.03% | (3.44)% | 16.20% |
Ratios (to average net assets)/Supplemental Data: | ||||||
Net investment income (loss) | 2.18%†† | 2.59% | 2.98% | 3.44% | 3.03% | 2.87% |
Net expenses (c) | 0.84%†† | 0.84%(d) | 0.84%(d) | 0.85%(d) | 0.85% | 0.89% |
Expenses (before waiver/reimbursement) (c) | 0.89%†† | 0.91%(d) | 0.89%(d) | 0.89%(d) | 0.91% | 0.89% |
Portfolio turnover rate | 34% | 27% | 40% | 24% | 15% | 18% |
Net assets at end of period (in 000’s) | $972,843 | $1,003,575 | $1,106,793 | $1,657,341 | $2,279,815 | $2,850,185 |
* | Unaudited. |
†† | Annualized. |
(a) | Per share data based on average shares outstanding during the period. |
(b) | Total investment return is calculated exclusive of sales charges and assumes the reinvestment of dividends and distributions. Class I shares are not subject to sales charges. For periods of less than one year, total return is not annualized. |
(c) | In addition to the fees and expenses which the Fund bears directly, it also indirectly bears a pro-rata share of the fees and expenses of the underlying funds in which it invests. Such indirect expenses are not included in the above expense ratios. |
(d) | Net of interest expense of less than 0.01%. (See Note 6) |
Six months ended April 30, 2022* | Year Ended October 31, | |||||
Class R2 | 2021 | 2020 | 2019 | 2018 | 2017 | |
Net asset value at beginning of period | $20.20 | $15.84 | $18.77 | $18.39 | $19.67 | $17.42 |
Net investment income (loss) (a) | 0.18 | 0.45 | 0.44 | 0.55 | 0.50 | 0.48 |
Net realized and unrealized gain (loss) | (0.53) | 4.40 | (2.60) | 1.42 | (1.24) | 2.25 |
Total from investment operations | (0.35) | 4.85 | (2.16) | 1.97 | (0.74) | 2.73 |
Less distributions: | ||||||
From net investment income | (0.19) | (0.49) | (0.43) | (0.56) | (0.52) | (0.48) |
From net realized gain on investments | — | — | (0.34) | (1.03) | (0.02) | — |
Total distributions | (0.19) | (0.49) | (0.77) | (1.59) | (0.54) | (0.48) |
Net asset value at end of period | $19.66 | $20.20 | $15.84 | $18.77 | $18.39 | $19.67 |
Total investment return (b) | (1.77)% | 30.76% | (11.66)% | 11.55% | (3.81)% | 15.83% |
Ratios (to average net assets)/Supplemental Data: | ||||||
Net investment income (loss) | 1.79%†† | 2.35% | 2.59% | 3.02% | 2.60% | 2.58% |
Net expenses (c) | 1.23%†† | 1.26%(d) | 1.24%(d) | 1.24%(d) | 1.27% | 1.23% |
Expenses (before waiver/reimbursement) (c) | 1.24%†† | 1.28%(d) | 1.24%(d) | 1.24%(d) | 1.27% | 1.23% |
Portfolio turnover rate | 34% | 27% | 40% | 24% | 15% | 18% |
Net assets at end of period (in 000’s) | $224 | $228 | $459 | $632 | $583 | $293 |
* | Unaudited. |
†† | Annualized. |
(a) | Per share data based on average shares outstanding during the period. |
(b) | Total investment return is calculated exclusive of sales charges and assumes the reinvestment of dividends and distributions. Class R2 shares are not subject to sales charges. For periods of less than one year, total return is not annualized. |
(c) | In addition to the fees and expenses which the Fund bears directly, it also indirectly bears a pro-rata share of the fees and expenses of the underlying funds in which it invests. Such indirect expenses are not included in the above expense ratios. |
(d) | Net of interest expense of less than 0.01%. (See Note 6) |
Six months ended April 30, 2022* | Year Ended October 31, | |||||
Class R3 | 2021 | 2020 | 2019 | 2018 | 2017 | |
Net asset value at beginning of period | $20.16 | $15.82 | $18.74 | $18.36 | $19.65 | $17.41 |
Net investment income (loss) (a) | 0.15 | 0.37 | 0.40 | 0.53 | 0.47 | 0.29 |
Net realized and unrealized gain (loss) | (0.53) | 4.42 | (2.60) | 1.40 | (1.26) | 2.39 |
Total from investment operations | (0.38) | 4.79 | (2.20) | 1.93 | (0.79) | 2.68 |
Less distributions: | ||||||
From net investment income | (0.16) | (0.45) | (0.38) | (0.52) | (0.48) | (0.44) |
From net realized gain on investments | — | — | (0.34) | (1.03) | (0.02) | — |
Total distributions | (0.16) | (0.45) | (0.72) | (1.55) | (0.50) | (0.44) |
Net asset value at end of period | $19.62 | $20.16 | $15.82 | $18.74 | $18.36 | $19.65 |
Total investment return (b) | (1.91)% | 30.42% | (11.87)% | 11.28% | (4.10)% | 15.53% |
Ratios (to average net assets)/Supplemental Data: | ||||||
Net investment income (loss) | 1.52%†† | 1.90% | 2.33% | 2.92% | 2.42% | 1.54% |
Net expenses (c) | 1.48%†† | 1.50%(d) | 1.49%(d) | 1.49%(d) | 1.52% | 1.50% |
Expenses (before waiver/reimbursement) (c) | 1.49%†† | 1.51%(d) | 1.49%(d) | 1.49%(d) | 1.52% | 1.50% |
Portfolio turnover rate | 34% | 27% | 40% | 24% | 15% | 18% |
Net assets at end of period (in 000’s) | $622 | $643 | $446 | $568 | $690 | $543 |
* | Unaudited. |
†† | Annualized. |
(a) | Per share data based on average shares outstanding during the period. |
(b) | Total investment return is calculated exclusive of sales charges and assumes the reinvestment of dividends and distributions. Class R3 shares are not subject to sales charges. For periods of less than one year, total return is not annualized. |
(c) | In addition to the fees and expenses which the Fund bears directly, it also indirectly bears a pro-rata share of the fees and expenses of the underlying funds in which it invests. Such indirect expenses are not included in the above expense ratios. |
(d) | Net of interest expense of less than 0.01%. (See Note 6) |
22 | MainStay Epoch Global Equity Yield Fund |
Six months ended April 30, 2022* | Year Ended October 31, | |||||
Class R6 | 2021 | 2020 | 2019 | 2018 | 2017 | |
Net asset value at beginning of period | $19.88 | $15.60 | $18.73 | $18.35 | $19.64 | $17.40 |
Net investment income (loss) (a) | 0.23 | 0.54 | 0.54 | 0.63 | 0.63 | 0.48 |
Net realized and unrealized gain (loss) | (0.53) | 4.34 | (2.81) | 1.43 | (1.27) | 2.33 |
Total from investment operations | (0.30) | 4.88 | (2.27) | 2.06 | (0.64) | 2.81 |
Less distributions: | ||||||
From net investment income | (0.24) | (0.60) | (0.52) | (0.65) | (0.63) | (0.57) |
From net realized gain on investments | — | — | (0.34) | (1.03) | (0.02) | — |
Total distributions | (0.24) | (0.60) | (0.86) | (1.68) | (0.65) | (0.57) |
Net asset value at end of period | $19.34 | $19.88 | $15.60 | $18.73 | $18.35 | $19.64 |
Total investment return (b) | (1.56)% | 31.45% | (12.32)% | 12.14% | (3.32)% | 16.36% |
Ratios (to average net assets)/Supplemental Data: | ||||||
Net investment income (loss) | 2.32%†† | 2.81% | 3.18% | 3.50% | 3.25% | 2.55% |
Net expenses (c) | 0.74%†† | 0.74%(d) | 0.74%(d) | 0.75%(d) | 0.74% | 0.74% |
Expenses (before waiver/reimbursement) (c) | 0.74%†† | 0.75%(d) | 0.76%(d) | 0.75%(d) | 0.74% | 0.74% |
Portfolio turnover rate | 34% | 27% | 40% | 24% | 15% | 18% |
Net assets at end of period (in 000’s) | $2,524 | $769 | $325 | $67,054 | $83,418 | $111,720 |
* | Unaudited. |
†† | Annualized. |
(a) | Per share data based on average shares outstanding during the period. |
(b) | Total investment return is calculated exclusive of sales charges and assumes the reinvestment of dividends and distributions. Class R6 shares are not subject to sales charges. For periods of less than one year, total return is not annualized. |
(c) | In addition to the fees and expenses which the Fund bears directly, it also indirectly bears a pro-rata share of the fees and expenses of the underlying funds in which it invests. Such indirect expenses are not included in the above expense ratios. |
(d) | Net of interest expense of less than 0.01%. (See Note 6) |
Class | Commenced Operations |
Class A | August 2, 2006 |
Investor Class | November 16, 2009 |
Class C | November 16, 2009 |
Class I | December 27, 2005 |
Class R2 | February 28, 2014 |
Class R3 | February 29, 2016 |
Class R6 | June 17, 2013 |
SIMPLE Class | N/A* |
* | SIMPLE Class shares were registered for sale effective as of August 31, 2020 but have not yet commenced operations. |
24 | MainStay Epoch Global Equity Yield Fund |
• Broker/dealer quotes | • Benchmark securities |
• Two-sided markets | • Reference data (corporate actions or material event notices) |
• Bids/offers | • Monthly payment information |
• Industry and economic events | • Reported trades |
26 | MainStay Epoch Global Equity Yield Fund |
28 | MainStay Epoch Global Equity Yield Fund |
Class R2 | $115 |
Class R3 | 319 |
Class | Expense | Waived |
Class A | $99,030 | $— |
Investor Class | 7,241 | — |
Class C | 20,456 | — |
Class I | 738,802 | — |
Class R2 | 169 | — |
Class R3 | 471 | — |
Class R6 | 28 | — |
Class R2 | $36,686 | 16.4% |
Class R3 | 36,783 | 5.9 |
Federal Tax Cost | Gross Unrealized Appreciation | Gross Unrealized (Depreciation) | Net Unrealized Appreciation/ (Depreciation) | |
Investments in Securities | $1,001,802,628 | $173,758,903 | $(33,948,317) | $139,810,586 |
Capital Loss Available Through | Short-Term Capital Loss Amounts (000’s) | Long-Term Capital Loss Amounts (000’s) |
Unlimited | $41,496 | $25,160 |
2021 | |
Distributions paid from: | |
Ordinary Income | $34,577,499 |
Class A | Shares | Amount |
Six-month period ended April 30, 2022: | ||
Shares sold | 407,842 | $8,309,965 |
Shares issued to shareholders in reinvestment of distributions | 53,537 | 1,095,282 |
Shares redeemed | (502,894) | (10,238,765) |
Net increase (decrease) in shares outstanding before conversion | (41,515) | (833,518) |
Shares converted into Class A (See Note 1) | 19,848 | 409,738 |
Shares converted from Class A (See Note 1) | (5,716) | (118,732) |
Net increase (decrease) | (27,383) | $(542,512) |
Year ended October 31, 2021: | ||
Shares sold | 1,422,975 | $27,830,579 |
Shares issued to shareholders in reinvestment of distributions | 146,494 | 2,853,734 |
Shares redeemed | (1,478,201) | (28,274,577) |
Net increase (decrease) in shares outstanding before conversion | 91,268 | 2,409,736 |
Shares converted into Class A (See Note 1) | 80,646 | 1,573,124 |
Shares converted from Class A (See Note 1) | (428) | (8,525) |
Net increase (decrease) | 171,486 | $3,974,335 |
Investor Class | Shares | Amount |
Six-month period ended April 30, 2022: | ||
Shares sold | 23,496 | $472,810 |
Shares issued to shareholders in reinvestment of distributions | 4,304 | 87,830 |
Shares redeemed | (26,279) | (535,672) |
Net increase (decrease) in shares outstanding before conversion | 1,521 | 24,968 |
Shares converted into Investor Class (See Note 1) | 5,737 | 113,346 |
Shares converted from Investor Class (See Note 1) | (16,427) | (339,149) |
Net increase (decrease) | (9,169) | $(200,835) |
Year ended October 31, 2021: | ||
Shares sold | 51,765 | $1,021,051 |
Shares issued to shareholders in reinvestment of distributions | 12,390 | 240,393 |
Shares redeemed | (82,034) | (1,590,170) |
Net increase (decrease) in shares outstanding before conversion | (17,879) | (328,726) |
Shares converted into Investor Class (See Note 1) | 14,123 | 275,582 |
Shares converted from Investor Class (See Note 1) | (45,293) | (886,846) |
Net increase (decrease) | (49,049) | $(939,990) |
30 | MainStay Epoch Global Equity Yield Fund |
Class C | Shares | Amount |
Six-month period ended April 30, 2022: | ||
Shares sold | 20,953 | $425,915 |
Shares issued to shareholders in reinvestment of distributions | 6,543 | 133,417 |
Shares redeemed | (308,296) | (6,253,139) |
Net increase (decrease) in shares outstanding before conversion | (280,800) | (5,693,807) |
Shares converted from Class C (See Note 1) | (9,236) | (183,935) |
Net increase (decrease) | (290,036) | $(5,877,742) |
Year ended October 31, 2021: | ||
Shares sold | 47,423 | $916,407 |
Shares issued to shareholders in reinvestment of distributions | 31,075 | 600,521 |
Shares redeemed | (1,331,504) | (25,474,798) |
Net increase (decrease) in shares outstanding before conversion | (1,253,006) | (23,957,870) |
Shares converted from Class C (See Note 1) | (47,266) | (914,626) |
Net increase (decrease) | (1,300,272) | $(24,872,496) |
Class I | Shares | Amount |
Six-month period ended April 30, 2022: | ||
Shares sold | 3,934,819 | $80,065,151 |
Shares issued to shareholders in reinvestment of distributions | 500,293 | 10,201,690 |
Shares redeemed | (4,634,637) | (94,443,326) |
Net increase (decrease) in shares outstanding before conversion | (199,525) | (4,176,485) |
Shares converted into Class I (See Note 1) | 5,728 | 118,732 |
Net increase (decrease) | (193,797) | $(4,057,753) |
Year ended October 31, 2021: | ||
Shares sold | 9,426,765 | $181,570,372 |
Shares issued to shareholders in reinvestment of distributions | 1,382,808 | 26,793,856 |
Shares redeemed | (31,039,645) | (573,368,338) |
Net increase (decrease) in shares outstanding before conversion | (20,230,072) | (365,004,110) |
Shares converted into Class I (See Note 1) | 663 | 12,348 |
Shares converted from Class I (See Note 1) | (2,856) | (51,057) |
Net increase (decrease) | (20,232,265) | $(365,042,819) |
Class R2 | Shares | Amount |
Six-month period ended April 30, 2022: | ||
Shares issued to shareholders in reinvestment of distributions | 106 | $2,160 |
Shares redeemed | (6) | (100) |
Net increase (decrease) | 100 | $2,060 |
Year ended October 31, 2021: | ||
Shares issued to shareholders in reinvestment of distributions | 630 | $12,269 |
Shares redeemed | (18,274) | (360,203) |
Net increase (decrease) | (17,644) | $(347,934) |
Class R3 | Shares | Amount |
Six-month period ended April 30, 2022: | ||
Shares sold | 4,106 | $83,611 |
Shares issued to shareholders in reinvestment of distributions | 232 | 4,751 |
Shares redeemed | (4,527) | (88,097) |
Net increase (decrease) | (189) | $265 |
Year ended October 31, 2021: | ||
Shares sold | 5,512 | $109,021 |
Shares issued to shareholders in reinvestment of distributions | 642 | 12,514 |
Shares redeemed | (2,421) | (45,206) |
Net increase (decrease) | 3,733 | $76,329 |
Class R6 | Shares | Amount |
Six-month period ended April 30, 2022: | ||
Shares sold | 98,565 | $1,971,270 |
Shares issued to shareholders in reinvestment of distributions | 943 | 19,009 |
Shares redeemed | (7,729) | (156,530) |
Net increase (decrease) | 91,779 | $1,833,749 |
Year ended October 31, 2021: | ||
Shares sold | 33,713 | $643,017 |
Shares issued to shareholders in reinvestment of distributions | 1,015 | 19,563 |
Shares redeemed | (16,856) | (337,710) |
Net increase (decrease) | 17,872 | $324,870 |
32 | MainStay Epoch Global Equity Yield Fund |
34 | MainStay Epoch Global Equity Yield Fund |
36 | MainStay Epoch Global Equity Yield Fund |
38 | MainStay Epoch Global Equity Yield Fund |
For more information
Message from the President and Semiannual Report
please log in to newyorklifeinvestments.com/accounts.
Not FDIC/NCUA Insured | Not a Deposit | May Lose Value | No Bank Guarantee | Not Insured by Any Government Agency |


5 | |
9 | |
11 | |
15 | |
22 | |
31 | |
36 | |
37 | |
37 |
Investors should refer to the Fund’s Summary Prospectus and/or Prospectus and consider the Fund’s investment objectives, strategies, risks, charges and expenses carefully before investing. The Summary Prospectus and/or Prospectus contain this and other information about the Fund. You may obtain copies of the Fund’s Summary Prospectus, Prospectus and Statement of Additional Information, which includes information about MainStay Funds Trust's Trustees, free of charge, upon request, by calling toll-free 800-624-6782, by writing to NYLIFE Distributors LLC, Attn: MainStay Marketing Department, 30 Hudson Street, Jersey City, NJ 07302 or by sending an e-mail to MainStayShareholderServices@nylim.com. These documents are also available via the MainStay Funds’ website at newyorklifeinvestments.com. Please read the Fund’s Summary Prospectus and/or Prospectus carefully before investing.

Average Annual Total Returns for the Period-Ended April 30, 2022 | ||||||||
Class | Sales Charge | Inception Date | Six Months1 | One Year | Five Years | Ten Years or Since Inception | Gross Expense Ratio2 | |
Class A Shares | Maximum 5.5% Initial Sales Charge | With sales charges | 9/1/2006 | -20.46% | -20.44% | 1.31% | 3.16% | 1.21% |
Excluding sales charges | -15.83 | -15.81 | 2.46 | 3.75 | 1.21 | |||
Investor Class Shares3 | Maximum 5% Initial Sales Charge | With sales charges | 4/29/2008 | -20.14 | -20.24 | 1.06 | 2.97 | 1.59 |
Excluding sales charges | -15.94 | -16.04 | 2.21 | 3.56 | 1.59 | |||
Class C Shares | Maximum 1% CDSC | With sales charges | 9/1/2006 | -17.10 | -17.51 | 1.40 | 2.76 | 2.34 |
if Redeemed Within One Year of Purchase | Excluding sales charges | -16.26 | -16.68 | 1.40 | 2.76 | 2.34 | ||
Class I Shares | No Sales Charge | 12/31/1997 | -15.73 | -15.61 | 2.70 | 4.03 | 0.96 | |
Class R1 Shares | No Sales Charge | 9/1/2006 | -15.80 | -15.72 | 2.60 | 3.92 | 1.06 | |
Class R2 Shares | No Sales Charge | 9/1/2006 | -15.86 | -15.90 | 2.35 | 3.66 | 1.31 | |
Class R3 Shares | No Sales Charge | 9/1/2006 | -15.97 | -16.11 | 2.11 | 3.39 | 1.56 | |
SIMPLE Class Shares | No Sales Charge | 8/31/2020 | -16.07 | -16.27 | N/A | -1.97 | 1.84 | |
1. | Not annualized. |
2. | The gross expense ratios presented reflect the Fund’s “Total Annual Fund Operating Expenses” from the most recent Prospectus, as supplemented, and may differ from other expense ratios disclosed in this report. |
3. | Prior to June 30, 2020, the maximum initial sales charge was 5.5%, which is reflected in the applicable average annual total return figures shown. |
Benchmark Performance* | Six Months1 | One Year | Five Years | Ten Years |
MSCI EAFE® Index (Net)2 | -11.80% | -8.15% | 4.77% | 5.77% |
Morningstar Foreign Large Blend Category Average3 | -12.93 | -10.30 | 4.16 | 5.00 |
* | Returns for indices reflect no deductions for fees, expenses or taxes, except for foreign withholding taxes where applicable. |
1. | Not annualized. |
2. | The MSCI EAFE® Index (Net) is the Fund's primary broad-based securities market index for comparison purposes. The MSCI EAFE® Index (Net) consists of international stocks representing the developed world outside of North America. Results assume reinvestment of all dividends and capital gains. An investment cannot be made directly in an index. |
3. | The Morningstar Foreign Large Blend Category Average is representative of funds that invest in a variety of big international stocks. Most of these portfolios divide their assets among a dozen or more developed markets, including Japan, Britain, France, and Germany. These portfolios primarily invest in stocks that have market caps in the top 70% of each economically integrated market (such as Europe or Asia ex-Japan). The blend style is assigned to portfolios where neither growth nor value characteristics predominate. These portfolios typically will have less than 20% of assets invested in U.S. stocks. Results are based on average total returns of similar funds with all dividends and capital gain distributions reinvested. |
6 | MainStay Epoch International Choice Fund |
Share Class | Beginning Account Value 11/1/21 | Ending Account Value (Based on Actual Returns and Expenses) 4/30/22 | Expenses Paid During Period1 | Ending Account Value (Based on Hypothetical 5% Annualized Return and Actual Expenses) 4/30/22 | Expenses Paid During Period1 | Net Expense Ratio During Period2 |
Class A Shares | $1,000.00 | $841.70 | $5.53 | $1,018.79 | $6.06 | 1.21% |
Investor Class Shares | $1,000.00 | $840.60 | $6.85 | $1,017.36 | $7.50 | 1.50% |
Class C Shares | $1,000.00 | $837.40 | $10.25 | $1,013.64 | $11.23 | 2.25% |
Class I Shares | $1,000.00 | $842.70 | $4.34 | $1,020.08 | $4.76 | 0.95% |
Class R1 Shares | $1,000.00 | $842.00 | $4.80 | $1,019.59 | $5.26 | 1.05% |
Class R2 Shares | $1,000.00 | $841.40 | $5.94 | $1,018.35 | $6.51 | 1.30% |
Class R3 Shares | $1,000.00 | $840.30 | $7.12 | $1,017.06 | $7.80 | 1.56% |
SIMPLE Class Shares | $1,000.00 | $839.30 | $7.98 | $1,016.12 | $8.75 | 1.75% |
1. | Expenses are equal to the Fund’s annualized expense ratio of each class multiplied by the average account value over the period, divided by 365 and multiplied by 181 (to reflect the six-month period). The table above represents the actual expenses incurred during the six-month period. In addition to the fees and expenses which the Fund bears directly, it also indirectly bears a pro rata share of the fees and expenses of the underlying funds in which it invests. Such indirect expenses are not included in the above-reported expense figures. |
2. | Expenses are equal to the Fund's annualized expense ratio to reflect the six-month period. |
Country Composition as of April 30, 2022 (Unaudited)
United Kingdom | 24.3% |
France | 23.8 |
Japan | 18.2 |
United States | 11.1 |
Spain | 4.6 |
Germany | 4.3 |
Finland | 3.7 |
Netherlands | 3.5% |
Republic of Korea | 2.5 |
Taiwan | 2.3 |
Switzerland | 2.2 |
Other Assets, Less Liabilities | –0.5 |
100.0% |
Top Ten Holdings and/or Issuers Held as of April 30, 2022 (excluding short-term investments) (Unaudited)
1. | Sony Group Corp. |
2. | TotalEnergies SE |
3. | Deutsche Telekom AG (Registered) |
4. | Linde plc |
5. | Compass Group plc |
6. | Coca-Cola Europacific Partners plc |
7. | Rentokil Initial plc |
8. | Sanofi |
9. | AXA SA |
10. | Swiss Re AG |
8 | MainStay Epoch International Choice Fund |
10 | MainStay Epoch International Choice Fund |
Shares | Value | |
Common Stocks 97.9% | ||
Finland 3.7% | ||
Nordea Bank Abp (Banks) | 866,829 | $ 8,633,812 |
France 23.8% | ||
AXA SA (Insurance) | 333,802 | 8,837,631 |
Edenred (IT Services) | 145,501 | 7,293,216 |
LVMH Moet Hennessy Louis Vuitton SE (Textiles, Apparel & Luxury Goods) | 6,994 | 4,475,430 |
Pernod Ricard SA (Beverages) | 26,304 | 5,419,539 |
Sanofi (Pharmaceuticals) | 85,818 | 9,032,433 |
Sartorius Stedim Biotech (Life Sciences Tools & Services) | 20,208 | 6,577,629 |
TotalEnergies SE (Oil, Gas & Consumable Fuels) | 209,116 | 10,303,479 |
Ubisoft Entertainment SA (Entertainment) (a) | 91,718 | 4,141,173 |
56,080,530 | ||
Germany 4.3% | ||
Deutsche Telekom AG (Registered) (Diversified Telecommunication Services) | 548,678 | 10,106,453 |
Japan 18.2% | ||
Asahi Group Holdings Ltd. (Beverages) | 136,500 | 5,096,558 |
Hoya Corp. (Health Care Equipment & Supplies) | 63,300 | 6,306,533 |
Keyence Corp. (Electronic Equipment, Instruments & Components) | 18,400 | 7,423,597 |
SoftBank Group Corp. (Wireless Telecommunication Services) | 188,500 | 7,609,955 |
Sony Group Corp. (Household Durables) | 120,600 | 10,365,747 |
Toyota Industries Corp. (Machinery) | 103,000 | 6,155,815 |
42,958,205 | ||
Netherlands 3.5% | ||
ASML Holding NV (Semiconductors & Semiconductor Equipment) | 14,750 | 8,345,089 |
Republic of Korea 2.5% | ||
Samsung Electronics Co. Ltd. GDR (Technology Hardware, Storage & Peripherals) | 4,468 | 5,844,861 |
Spain 4.6% | ||
Amadeus IT Group SA (IT Services) (a) | 105,319 | 6,566,980 |
Shares | Value | |
Spain (continued) | ||
Industria de Diseno Textil SA (Specialty Retail) (b) | 203,394 | $ 4,265,162 |
10,832,142 | ||
Switzerland 2.2% | ||
Roche Holding AG (Pharmaceuticals) | 13,862 | 5,134,023 |
Taiwan 2.3% | ||
Taiwan Semiconductor Manufacturing Co. Ltd., Sponsored ADR (Semiconductors & Semiconductor Equipment) | 59,675 | 5,545,598 |
United Kingdom 24.3% | ||
Coca-Cola Europacific Partners plc (Beverages) | 195,892 | 9,784,805 |
Compass Group plc (Hotels, Restaurants & Leisure) | 465,170 | 9,798,148 |
InterContinental Hotels Group plc (Hotels, Restaurants & Leisure) | 89,167 | 5,692,552 |
Linde plc (Chemicals) | 32,159 | 10,032,322 |
Lloyds Banking Group plc (Banks) | 11,635,501 | 6,559,929 |
Rentokil Initial plc (Commercial Services & Supplies) | 1,405,936 | 9,659,613 |
Unilever plc (Personal Products) | 125,375 | 5,823,420 |
57,350,789 | ||
United States 8.5% | ||
Ferguson plc (Trading Companies & Distributors) | 42,523 | 5,362,722 |
Schneider Electric SE (Electrical Equipment) | 41,053 | 5,846,934 |
Swiss Re AG (Insurance) | 106,898 | 8,766,798 |
19,976,454 | ||
Total Common Stocks (Cost $241,040,283) | 230,807,956 | |
Short-Term Investments 2.6% | ||
Affiliated Investment Company 0.9% | ||
United States 0.9% | ||
MainStay U.S. Government Liquidity Fund, 0.397% (c) | 2,140,222 | 2,140,222 |
Shares | Value | |
Short-Term Investments (continued) | ||
Unaffiliated Investment Company 1.7% | ||
United States 1.7% | ||
Invesco Government & Agency Portfolio, 0.419% (c)(d) | 3,981,304 | $ 3,981,304 |
Total Short-Term Investments (Cost $6,121,526) | 6,121,526 | |
Total Investments (Cost $247,161,809) | 100.5% | 236,929,482 |
Other Assets, Less Liabilities | (0.5) | (1,250,322) |
Net Assets | 100.0% | $ 235,679,160 |
† | Percentages indicated are based on Fund net assets. |
(a) | Non-income producing security. |
(b) | All or a portion of this security was held on loan. As of April 30, 2022, the aggregate market value of securities on loan was $3,752,258. The Fund received cash collateral with a value of $3,981,304. (See Note 2(H)) |
(c) | Current yield as of April 30, 2022. |
(d) | Represents a security purchased with cash collateral received for securities on loan. |
Affiliated Investment Companies | Value, Beginning of Period | Purchases at Cost | Proceeds from Sales | Net Realized Gain/(Loss) on Sales | Change in Unrealized Appreciation/ (Depreciation) | Value, End of Period | Dividend Income | Other Distributions | Shares End of Period |
MainStay U.S. Government Liquidity Fund | $ 6,568 | $ 25,892 | $ (30,320) | $ — | $ — | $ 2,140 | $ —(a) | $ — | 2,140 |
(a) | Less than $500. |
Abbreviation(s): |
ADR—American Depositary Receipt |
GDR—Global Depositary Receipt |
12 | MainStay Epoch International Choice Fund |
Description | Quoted Prices in Active Markets for Identical Assets (Level 1) | Significant Other Observable Inputs (Level 2) | Significant Unobservable Inputs (Level 3) | Total |
Asset Valuation Inputs | ||||
Investments in Securities (a) | ||||
Common Stocks | ||||
Finland | $ — | $ 8,633,812 | $ — | $ 8,633,812 |
France | — | 56,080,530 | — | 56,080,530 |
Germany | — | 10,106,453 | — | 10,106,453 |
Japan | — | 42,958,205 | — | 42,958,205 |
Netherlands | — | 8,345,089 | — | 8,345,089 |
Republic of Korea | — | 5,844,861 | — | 5,844,861 |
Spain | — | 10,832,142 | — | 10,832,142 |
Switzerland | — | 5,134,023 | — | 5,134,023 |
United Kingdom | 19,817,127 | 37,533,662 | — | 57,350,789 |
United States | — | 19,976,454 | — | 19,976,454 |
All Other Countries | 5,545,598 | — | — | 5,545,598 |
Total Common Stocks | 25,362,725 | 205,445,231 | — | 230,807,956 |
Short-Term Investments | ||||
Affiliated Investment Company | 2,140,222 | — | — | 2,140,222 |
Unaffiliated Investment Company | 3,981,304 | — | — | 3,981,304 |
Total Short-Term Investments | 6,121,526 | — | — | 6,121,526 |
Total Investments in Securities | $ 31,484,251 | $ 205,445,231 | $ — | $ 236,929,482 |
(a) | For a complete listing of investments and their industries, see the Portfolio of Investments. |
Value | Percent | |
Banks | $15,193,741 | 6.5% |
Beverages | 20,300,902 | 8.6 |
Chemicals | 10,032,322 | 4.2 |
Commercial Services & Supplies | 9,659,613 | 4.1 |
Diversified Telecommunication Services | 10,106,453 | 4.3 |
Electrical Equipment | 5,846,934 | 2.5 |
Electronic Equipment, Instruments & Components | 7,423,597 | 3.1 |
Entertainment | 4,141,173 | 1.8 |
Health Care Equipment & Supplies | 6,306,533 | 2.7 |
Hotels, Restaurants & Leisure | 15,490,700 | 6.6 |
Household Durables | 10,365,747 | 4.4 |
Insurance | 17,604,429 | 7.4 |
IT Services | 13,860,196 | 5.9 |
Life Sciences Tools & Services | 6,577,629 | 2.8 |
Machinery | 6,155,815 | 2.6 |
Oil, Gas & Consumable Fuels | 10,303,479 | 4.4 |
Personal Products | 5,823,420 | 2.5 |
Pharmaceuticals | 14,166,456 | 6.0 |
Semiconductors & Semiconductor Equipment | 13,890,687 | 5.8 |
Specialty Retail | 4,265,162 | 1.8 |
Technology Hardware, Storage & Peripherals | 5,844,861 | 2.5 |
Textiles, Apparel & Luxury Goods | 4,475,430 | 1.9 |
Trading Companies & Distributors | 5,362,722 | 2.3 |
Wireless Telecommunication Services | 7,609,955 | 3.2 |
230,807,956 | 97.9 | |
Short-Term Investments | 6,121,526 | 2.6 |
Other Assets, Less Liabilities | (1,250,322) | (0.5) |
Net Assets | $235,679,160 | 100.0% |
† | Percentages indicated are based on Fund net assets. |
14 | MainStay Epoch International Choice Fund |
Assets | |
Investment in unaffiliated securities, at value (identified cost $245,021,587) including securities on loan of $3,752,258 | $234,789,260 |
Investment in affiliated investment companies, at value (identified cost $2,140,222) | 2,140,222 |
Cash | 28,325 |
Receivables: | |
Dividends | 3,983,734 |
Fund shares sold | 13,730 |
Securities lending | 244 |
Other assets | 57,355 |
Total assets | 241,012,870 |
Liabilities | |
Cash collateral received for securities on loan | 3,981,304 |
Foreign currency due to custodian, at value | 5,756 |
Payables: | |
Fund shares redeemed | 1,062,191 |
Manager (See Note 3) | 161,997 |
Transfer agent (See Note 3) | 42,140 |
Custodian | 25,935 |
Professional fees | 17,531 |
Shareholder communication | 15,741 |
NYLIFE Distributors (See Note 3) | 10,294 |
Trustees | 1,640 |
Investment securities purchased | 128 |
Accrued expenses | 9,053 |
Total liabilities | 5,333,710 |
Net assets | $235,679,160 |
Composition of Net Assets | |
Shares of beneficial interest outstanding (par value of $.001 per share) unlimited number of shares authorized | $6,913 |
Additional paid-in-capital | 310,865,938 |
310,872,851 | |
Total distributable earnings (loss) | (75,193,691) |
Net assets | $235,679,160 |
Class A | |
Net assets applicable to outstanding shares | $21,872,093 |
Shares of beneficial interest outstanding | 641,017 |
Net asset value per share outstanding | $34.12 |
Maximum sales charge (5.50% of offering price) | 1.99 |
Maximum offering price per share outstanding | $36.11 |
Investor Class | |
Net assets applicable to outstanding shares | $4,310,599 |
Shares of beneficial interest outstanding | 126,454 |
Net asset value per share outstanding | $34.09 |
Maximum sales charge (5.00% of offering price) | 1.79 |
Maximum offering price per share outstanding | $35.88 |
Class C | |
Net assets applicable to outstanding shares | $736,101 |
Shares of beneficial interest outstanding | 21,888 |
Net asset value and offering price per share outstanding | $33.63 |
Class I | |
Net assets applicable to outstanding shares | $198,970,324 |
Shares of beneficial interest outstanding | 5,835,950 |
Net asset value and offering price per share outstanding | $34.09 |
Class R1 | |
Net assets applicable to outstanding shares | $34,693 |
Shares of beneficial interest outstanding | 1,020 |
Net asset value and offering price per share outstanding | $34.01 |
Class R2 | |
Net assets applicable to outstanding shares | $6,589,332 |
Shares of beneficial interest outstanding | 193,137 |
Net asset value and offering price per share outstanding | $34.12 |
Class R3 | |
Net assets applicable to outstanding shares | $3,137,299 |
Shares of beneficial interest outstanding | 92,475 |
Net asset value and offering price per share outstanding | $33.93 |
SIMPLE Class | |
Net assets applicable to outstanding shares | $28,719 |
Shares of beneficial interest outstanding | 843 |
Net asset value and offering price per share outstanding(a) | $34.07 |
(a) | The difference between the recalculated and stated NAV was caused by rounding. |
Investment Income (Loss) | |
Income | |
Dividends-unaffiliated (net of foreign tax withholding of $243,677) | $3,388,893 |
Securities lending | 26,832 |
Dividends-affiliated | 370 |
Total income | 3,416,095 |
Expenses | |
Manager (See Note 3) | 1,068,380 |
Transfer agent (See Note 3) | 95,095 |
Distribution/Service—Class A (See Note 3) | 31,009 |
Distribution/Service—Investor Class (See Note 3) | 6,170 |
Distribution/Service—Class C (See Note 3) | 4,603 |
Distribution/Service—Class R2 (See Note 3) | 10,357 |
Distribution/Service—Class R3 (See Note 3) | 9,799 |
Distribution/Service—SIMPLE Class (See Note 3) | 80 |
Registration | 46,035 |
Professional fees | 36,380 |
Custodian | 25,905 |
Shareholder communication | 9,765 |
Shareholder service (See Note 3) | 6,173 |
Trustees | 3,505 |
Miscellaneous | 12,966 |
Total expenses before waiver/reimbursement | 1,366,222 |
Expense waiver/reimbursement from Manager (See Note 3) | (18,707) |
Net expenses | 1,347,515 |
Net investment income (loss) | 2,068,580 |
Realized and Unrealized Gain (Loss) | |
Net realized gain (loss) on: | |
Unaffiliated investment transactions | 12,711,244 |
Payments from affiliates (See Note 3) | 148,000 |
Foreign currency transactions | (23,384) |
Net realized gain (loss) | 12,835,860 |
Net change in unrealized appreciation (depreciation) on: | |
Unaffiliated investments | (58,376,585) |
Translation of other assets and liabilities in foreign currencies | (232,988) |
Net change in unrealized appreciation (depreciation) | (58,609,573) |
Net realized and unrealized gain (loss) | (45,773,713) |
Net increase (decrease) in net assets resulting from operations | $(43,705,133) |
16 | MainStay Epoch International Choice Fund |
for the six months ended April 30, 2022 (Unaudited) and the year ended October 31, 2021
2022 | 2021 | |
Increase (Decrease) in Net Assets | ||
Operations: | ||
Net investment income (loss) | $2,068,580 | $2,971,564 |
Net realized gain (loss) | 12,835,860 | 46,948,818 |
Net change in unrealized appreciation (depreciation) | (58,609,573) | 19,130,791 |
Net increase (decrease) in net assets resulting from operations | (43,705,133) | 69,051,173 |
Distributions to shareholders: | ||
Class A | (609,561) | (107,083) |
Investor Class | (106,243) | (14,596) |
Class C | (4,372) | — |
Class I | (6,137,693) | (2,007,419) |
Class R1 | (3,987) | (1,681) |
Class R2 | (192,553) | (33,206) |
Class R3 | (78,119) | (7,839) |
SIMPLE Class | (630) | — |
Total distributions to shareholders | (7,133,158) | (2,171,824) |
Capital share transactions: | ||
Net proceeds from sales of shares | 8,456,819 | 15,067,092 |
Net asset value of shares issued to shareholders in reinvestment of distributions | 7,075,921 | 2,142,671 |
Cost of shares redeemed | (16,322,894) | (92,410,629) |
Increase (decrease) in net assets derived from capital share transactions | (790,154) | (75,200,866) |
Net increase (decrease) in net assets | (51,628,445) | (8,321,517) |
Net Assets | ||
Beginning of period | 287,307,605 | 295,629,122 |
End of period | $235,679,160 | $287,307,605 |
Six months ended April 30, 2022* | Year Ended October 31, | |||||
Class A | 2021 | 2020 | 2019 | 2018 | 2017 | |
Net asset value at beginning of period | $41.50 | $33.68 | $35.57 | $33.37 | $36.20 | $30.39 |
Net investment income (loss) (a) | 0.26 | 0.34 | 0.17 | 0.74 | 0.50 | 0.34 |
Net realized and unrealized gain (loss) | (6.68) | 7.66 | (1.14) | 1.96 | (2.94) | 6.41 |
Total from investment operations | (6.42) | 8.00 | (0.97) | 2.70 | (2.44) | 6.75 |
Less distributions: | ||||||
From net investment income | (0.96) | (0.18) | (0.92) | (0.50) | (0.39) | (0.94) |
Net asset value at end of period | $34.12 | $41.50 | $33.68 | $35.57 | $33.37 | $36.20 |
Total investment return (b) | (15.83)%(c) | 23.80% | (2.87)% | 8.30% | (6.82)% | 22.95% |
Ratios (to average net assets)/Supplemental Data: | ||||||
Net investment income (loss) | 1.34%†† | 0.83% | 0.48% | 2.19% | 1.40% | 1.05% |
Net expenses (d) | 1.21%†† | 1.21% | 1.20%(e) | 1.19%(e) | 1.18%(e) | 1.23% |
Portfolio turnover rate | 32% | 43% | 52% | 47% | 44% | 8% |
Net assets at end of period (in 000’s) | $21,872 | $26,613 | $20,108 | $23,114 | $23,409 | $33,997 |
* | Unaudited. |
†† | Annualized. |
(a) | Per share data based on average shares outstanding during the period. |
(b) | Total investment return is calculated exclusive of sales charges and assumes the reinvestment of dividends and distributions. For periods of less than one year, total return is not annualized. |
(c) | In 2022, the Fund’s total investment return includes impact of payments from affiliates due to trade communications error. Excluding these items, total return would have been (15.88)%. |
(d) | In addition to the fees and expenses which the Fund bears directly, it also indirectly bears a pro-rata share of the fees and expenses of the underlying funds in which it invests. Such indirect expenses are not included in the above expense ratios. |
(e) | Net of interest expense of less than 0.01%. |
Six months ended April 30, 2022* | Year Ended October 31, | |||||
Investor Class | 2021 | 2020 | 2019 | 2018 | 2017 | |
Net asset value at beginning of period | $41.39 | $33.60 | $35.49 | $33.30 | $36.13 | $30.36 |
Net investment income (loss)���(a) | 0.20 | 0.20 | 0.08 | 0.66 | 0.45 | 0.30 |
Net realized and unrealized gain (loss) | (6.67) | 7.68 | (1.13) | 1.95 | (2.96) | 6.39 |
Total from investment operations | (6.47) | 7.88 | (1.05) | 2.61 | (2.51) | 6.69 |
Less distributions: | ||||||
From net investment income | (0.83) | (0.09) | (0.84) | (0.42) | (0.32) | (0.92) |
Net asset value at end of period | $34.09 | $41.39 | $33.60 | $35.49 | $33.30 | $36.13 |
Total investment return (b) | (15.94)%(c) | 23.48% | (3.10)% | 8.02% | (7.00)% | 22.74% |
Ratios (to average net assets)/Supplemental Data: | ||||||
Net investment income (loss) | 1.03%†† | 0.50% | 0.23% | 1.97% | 1.27% | 0.92% |
Net expenses (d) | 1.50%†† | 1.50% | 1.46%(e) | 1.41%(e) | 1.38%(e) | 1.39% |
Expenses (before waiver/reimbursement) (d) | 1.65%†† | 1.59% | 1.46%(e) | 1.42%(e) | 1.38%(e) | 1.39% |
Portfolio turnover rate | 32% | 43% | 52% | 47% | 44% | 8% |
Net assets at end of period (in 000's) | $4,311 | $5,341 | $5,308 | $6,306 | $5,901 | $6,757 |
* | Unaudited. |
†† | Annualized. |
(a) | Per share data based on average shares outstanding during the period. |
(b) | Total investment return is calculated exclusive of sales charges and assumes the reinvestment of dividends and distributions. For periods of less than one year, total return is not annualized. |
(c) | In 2022, the Fund’s total investment return includes impact of payments from affiliates due to trade communications error. Excluding these items, total return would have been (15.99)%. |
(d) | In addition to the fees and expenses which the Fund bears directly, it also indirectly bears a pro-rata share of the fees and expenses of the underlying funds in which it invests. Such indirect expenses are not included in the above expense ratios. |
(e) | Net of interest expense of less than 0.01%. |
18 | MainStay Epoch International Choice Fund |
Six months ended April 30, 2022* | Year Ended October 31, | |||||
Class C | 2021 | 2020 | 2019 | 2018 | 2017 | |
Net asset value at beginning of period | $40.33 | $32.90 | $34.73 | $32.54 | $35.41 | $29.74 |
Net investment income (loss) (a) | 0.04 | (0.28) | (0.17) | 0.42 | 0.19 | 0.04 |
Net realized and unrealized gain (loss) | (6.57) | 7.71 | (1.13) | 1.92 | (3.00) | 6.30 |
Total from investment operations | (6.53) | 7.43 | (1.30) | 2.34 | (2.81) | 6.34 |
Less distributions: | ||||||
From net investment income | (0.17) | — | (0.53) | (0.15) | (0.06) | (0.67) |
Net asset value at end of period | $33.63 | $40.33 | $32.90 | $34.73 | $32.54 | $35.41 |
Total investment return (b) | (16.26)%(c) | 22.55% | (3.81)% | 7.25% | (7.96)% | 21.82% |
Ratios (to average net assets)/Supplemental Data: | ||||||
Net investment income (loss) | 0.19%†† | (0.71)% | (0.51)% | 1.27% | 0.53% | 0.13% |
Net expenses (d) | 2.25%†† | 2.25% | 2.21%(e) | 2.16%(e) | 2.13%(e) | 2.14% |
Expenses (before waiver/reimbursement) (d) | 2.40%†† | 2.28% | 2.21%(e) | 2.17%(e) | 2.13%(e) | 2.14% |
Portfolio turnover rate | 32% | 43% | 52% | 47% | 44% | 8% |
Net assets at end of period (in 000’s) | $736 | $1,081 | $4,740 | $6,416 | $9,354 | $11,625 |
* | Unaudited. |
†† | Annualized. |
(a) | Per share data based on average shares outstanding during the period. |
(b) | Total investment return is calculated exclusive of sales charges and assumes the reinvestment of dividends and distributions. For periods of less than one year, total return is not annualized. |
(c) | In 2022, the Fund’s total investment return includes impact of payments from affiliates due to trade communications error. Excluding these items, total return would have been (16.31)%. |
(d) | In addition to the fees and expenses which the Fund bears directly, it also indirectly bears a pro-rata share of the fees and expenses of the underlying funds in which it invests. Such indirect expenses are not included in the above expense ratios. |
(e) | Net of interest expense of less than 0.01%. |
Six months ended April 30, 2022* | Year Ended October 31, | |||||
Class I | 2021 | 2020 | 2019 | 2018 | 2017 | |
Net asset value at beginning of period | $41.52 | $33.69 | $35.58 | $33.40 | $36.25 | $30.46 |
Net investment income (loss) (a) | 0.31 | 0.40 | 0.26 | 0.80 | 0.60 | 0.39 |
Net realized and unrealized gain (loss) | (6.68) | 7.70 | (1.14) | 1.98 | (2.96) | 6.45 |
Total from investment operations | (6.37) | 8.10 | (0.88) | 2.78 | (2.36) | 6.84 |
Less distributions: | ||||||
From net investment income | (1.06) | (0.27) | (1.01) | (0.60) | (0.49) | (1.05) |
Net asset value at end of period | $34.09 | $41.52 | $33.69 | $35.58 | $33.40 | $36.25 |
Total investment return (b) | (15.73)%(c) | 24.11% | (2.61)% | 8.57% | (6.62)% | 23.29% |
Ratios (to average net assets)/Supplemental Data: | ||||||
Net investment income (loss) | 1.61%†† | 0.99% | 0.76% | 2.40% | 1.67% | 1.21% |
Net expenses (d) | 0.95%†† | 0.95% | 0.95%(e) | 0.94%(e) | 0.93%(e) | 0.95% |
Expenses (before waiver/reimbursement) (d) | 0.96%†† | 0.96% | 0.96%(e) | 0.94%(e) | 0.93%(e) | 0.99% |
Portfolio turnover rate | 32% | 43% | 52% | 47% | 44% | 8% |
Net assets at end of period (in 000’s) | $198,970 | $241,084 | $252,974 | $355,348 | $479,523 | $549,162 |
* | Unaudited. |
†† | Annualized. |
(a) | Per share data based on average shares outstanding during the period. |
(b) | Total investment return is calculated exclusive of sales charges and assumes the reinvestment of dividends and distributions. Class I shares are not subject to sales charges. For periods of less than one year, total return is not annualized. |
(c) | In 2022, the Fund’s total investment return includes impact of payments from affiliates due to trade communications error. Excluding these items, total return would have been (15.78)%. |
(d) | In addition to the fees and expenses which the Fund bears directly, it also indirectly bears a pro-rata share of the fees and expenses of the underlying funds in which it invests. Such indirect expenses are not included in the above expense ratios. |
(e) | Net of interest expense of less than 0.01%. |
Six months ended April 30, 2022* | Year Ended October 31, | |||||
Class R1 | 2021 | 2020 | 2019 | 2018 | 2017 | |
Net asset value at beginning of period | $41.39 | $33.60 | $35.48 | $33.30 | $36.18 | $30.39 |
Net investment income (loss) (a) | 0.28 | 0.36 | 0.21 | 0.81 | 0.64 | 0.36 |
Net realized and unrealized gain (loss) | (6.66) | 7.68 | (1.12) | 1.93 | (3.04) | 6.44 |
Total from investment operations | (6.38) | 8.04 | (0.91) | 2.74 | (2.40) | 6.80 |
Less distributions: | ||||||
From net investment income | (1.00) | (0.25) | (0.97) | (0.56) | (0.48) | (1.01) |
Net asset value at end of period | $34.01 | $41.39 | $33.60 | $35.48 | $33.30 | $36.18 |
Total investment return (b) | (15.80)%(c) | 24.00% | (2.69)% | 8.45% | (6.72)% | 23.16% |
Ratios (to average net assets)/Supplemental Data: | ||||||
Net investment income (loss) | 1.43%†† | 0.88% | 0.63% | 2.43% | 1.79% | 1.14% |
Net expenses (d) | 1.05%†† | 1.05% | 1.05%(e) | 1.04%(e) | 1.03%(e) | 1.05% |
Expenses (before waiver/reimbursement) (d) | 1.06%†† | 1.06% | 1.06%(e) | 1.04%(e) | 1.03%(e) | 1.12% |
Portfolio turnover rate | 32% | 43% | 52% | 47% | 44% | 8% |
Net assets at end of period (in 000’s) | $35 | $164 | $201 | $230 | $229 | $257 |
* | Unaudited. |
†† | Annualized. |
(a) | Per share data based on average shares outstanding during the period. |
(b) | Total investment return is calculated exclusive of sales charges and assumes the reinvestment of dividends and distributions. Class R1 shares are not subject to sales charges. For periods of less than one year, total return is not annualized. |
(c) | In 2022, the Fund’s total investment return includes impact of payments from affiliates due to trade communications error. Excluding these items, total return would have been (15.85)%. |
(d) | In addition to the fees and expenses which the Fund bears directly, it also indirectly bears a pro-rata share of the fees and expenses of the underlying funds in which it invests. Such indirect expenses are not included in the above expense ratios. |
(e) | Net of interest expense of less than 0.01%. |
Six months ended April 30, 2022* | Year Ended October 31, | |||||
Class R2 | 2021 | 2020 | 2019 | 2018 | 2017 | |
Net asset value at beginning of period | $41.47 | $33.65 | $35.54 | $33.33 | $36.16 | $30.37 |
Net investment income (loss) (a) | 0.24 | 0.27 | 0.13 | 0.71 | 0.48 | 0.31 |
Net realized and unrealized gain (loss) | (6.68) | 7.69 | (1.14) | 1.96 | (2.96) | 6.41 |
Total from investment operations | (6.44) | 7.96 | (1.01) | 2.67 | (2.48) | 6.72 |
Less distributions: | ||||||
From net investment income | (0.91) | (0.14) | (0.88) | (0.46) | (0.35) | (0.93) |
Net asset value at end of period | $34.12 | $41.47 | $33.65 | $35.54 | $33.33 | $36.16 |
Total investment return (b) | (15.86)%(c) | 23.69% | (2.94)% | 8.17% | (6.92)% | 22.83% |
Ratios (to average net assets)/Supplemental Data: | ||||||
Net investment income (loss) | 1.25%†† | 0.67% | 0.39% | 2.12% | 1.33% | 0.96% |
Net expenses (d) | 1.30%†† | 1.30% | 1.30%(e) | 1.29%(e) | 1.28%(e) | 1.30% |
Expenses (before waiver/reimbursement) (d) | 1.31%†† | 1.31% | 1.31%(e) | 1.29%(e) | 1.28%(e) | 1.34% |
Portfolio turnover rate | 32% | 43% | 52% | 47% | 44% | 8% |
Net assets at end of period (in 000’s) | $6,589 | $8,886 | $7,827 | $10,884 | $14,656 | $23,119 |
* | Unaudited. |
†† | Annualized. |
(a) | Per share data based on average shares outstanding during the period. |
(b) | Total investment return is calculated exclusive of sales charges and assumes the reinvestment of dividends and distributions. Class R2 shares are not subject to sales charges. For periods of less than one year, total return is not annualized. |
(c) | In 2022, the Fund’s total investment return includes impact of payments from affiliates due to trade communications error. Excluding these items, total return would have been (15.91)%. |
(d) | In addition to the fees and expenses which the Fund bears directly, it also indirectly bears a pro-rata share of the fees and expenses of the underlying funds in which it invests. Such indirect expenses are not included in the above expense ratios. |
(e) | Net of interest expense of less than 0.01%. |
20 | MainStay Epoch International Choice Fund |
Six months ended April 30, 2022* | Year Ended October 31, | |||||
Class R3 | 2021 | 2020 | 2019 | 2018 | 2017 | |
Net asset value at beginning of period | $41.18 | $33.43 | $35.31 | $33.10 | $35.90 | $30.13 |
Net investment income (loss) (a) | 0.19 | 0.17 | 0.04 | 0.62 | 0.40 | 0.24 |
Net realized and unrealized gain (loss) | (6.64) | 7.64 | (1.13) | 1.95 | (2.95) | 6.36 |
Total from investment operations | (6.45) | 7.81 | (1.09) | 2.57 | (2.55) | 6.60 |
Less distributions: | ||||||
From net investment income | (0.80) | (0.06) | (0.79) | (0.36) | (0.25) | (0.83) |
Net asset value at end of period | $33.93 | $41.18 | $33.43 | $35.31 | $33.10 | $35.90 |
Total investment return (b) | (15.97)%(c) | 23.37% | (3.21)% | 7.90% | (7.15)% | 22.53% |
Ratios (to average net assets)/Supplemental Data: | ||||||
Net investment income (loss) | 0.99%†† | 0.41% | 0.12% | 1.85% | 1.13% | 0.74% |
Net expenses (d) | 1.56%†† | 1.55% | 1.55%(e) | 1.54%(e) | 1.53%(e) | 1.59% |
Portfolio turnover rate | 32% | 43% | 52% | 47% | 44% | 8% |
Net assets at end of period (in 000’s) | $3,137 | $4,104 | $4,447 | $5,134 | $5,609 | $7,360 |
* | Unaudited. |
†† | Annualized. |
(a) | Per share data based on average shares outstanding during the period. |
(b) | Total investment return is calculated exclusive of sales charges and assumes the reinvestment of dividends and distributions. Class R3 shares are not subject to sales charges. For periods of less than one year, total return is not annualized. |
(c) | In 2022, the Fund’s total investment return includes impact of payments from affiliates due to trade communications error. Excluding these items, total return would have been (16.02)%. |
(d) | In addition to the fees and expenses which the Fund bears directly, it also indirectly bears a pro-rata share of the fees and expenses of the underlying funds in which it invests. Such indirect expenses are not included in the above expense ratios. |
(e) | Net of interest expense of less than 0.01%. |
Six months ended April 30, 2022* | Year Ended October 31, | August 31, 2020^ through October 31, | |
SIMPLE Class | 2021 | 2020 | |
Net asset value at beginning of period | $41.39 | $33.59 | $35.90** |
Net investment income (loss) (a) | 0.16 | 0.11 | (0.02) |
Net realized and unrealized gain (loss) | (6.71) | 7.69 | (2.29) |
Total from investment operations | (6.55) | 7.80 | (2.31) |
Less distributions: | |||
From net investment income | (0.77) | — | — |
Net asset value at end of period | $34.07 | $41.39 | $33.59 |
Total investment return (b) | (16.07)%(c) | 23.19% | (6.43)% |
Ratios (to average net assets)/Supplemental Data: | |||
Net investment income (loss) | 0.81%†† | 0.27% | (0.29)% |
Net expenses (d) | 1.75%†† | 1.74% | 1.69%(e) |
Expenses (before waiver/reimbursement) (d) | 1.90%†† | 1.86% | 1.69%(e) |
Portfolio turnover rate | 32% | 43% | 52% |
Net assets at end of period (in 000’s) | $29 | $34 | $23 |
* | Unaudited. |
^ | Inception date. |
** | Based on the net asset value of Investor Class as of August 31, 2020. |
†† | Annualized. |
(a) | Per share data based on average shares outstanding during the period. |
(b) | Total investment return is calculated exclusive of sales charges and assumes the reinvestment of dividends and distributions. SIMPLE Class shares are not subject to sales charges. For periods of less than one year, total return is not annualized. |
(c) | In 2022, the Fund’s total investment return includes impact of payments from affiliates due to trade communications error. Excluding these items, total return would have been (16.12)%. |
(d) | In addition to the fees and expenses which the Fund bears directly, it also indirectly bears a pro-rata share of the fees and expenses of the underlying funds in which it invests. Such indirect expenses are not included in the above expense ratios. |
(e) | Net of interest expense of less than 0.01%. |
Class | Commenced Operations |
Class A | September 1, 2006 |
Investor Class | April 29, 2008 |
Class C | September 1, 2006 |
Class I | December 31, 1997 |
Class R1 | September 1, 2006 |
Class R2 | September 1, 2006 |
Class R3 | September 1, 2006 |
SIMPLE Class | August 31, 2020 |
Class R6 | N/A* |
* | Class R6 shares were registered for sale effective as of February 28, 2017 but have not yet commenced operations. |
22 | MainStay Epoch International Choice Fund |
• Broker/dealer quotes | • Benchmark securities |
• Two-sided markets | • Reference data (corporate actions or material event notices) |
• Bids/offers | • Monthly payment information |
• Industry and economic events | • Reported trades |
24 | MainStay Epoch International Choice Fund |
26 | MainStay Epoch International Choice Fund |
Class R1 | $70 |
Class R2 | 4,143 |
Class R3 | 1,960 |
Class | Expense | Waived |
Class A | $7,627 | $— |
Investor Class | 12,400 | (3,762) |
Class C | 2,309 | (698) |
Class I | 68,883 | — |
Class R1 | 43 | — |
Class R2 | 2,548 | — |
Class R3 | 1,205 | — |
SIMPLE Class | 80 | (24) |
SIMPLE Class | $24,185 | 84.2% |
Federal Tax Cost | Gross Unrealized Appreciation | Gross Unrealized (Depreciation) | Net Unrealized Appreciation/ (Depreciation) | |
Investments in Securities | $247,442,558 | $(30,248,888) | $19,735,812 | $(10,513,076) |
Capital Loss Available Through | Short-Term Capital Loss Amounts (000’s) | Long-Term Capital Loss Amounts (000’s) |
Unlimited | $75,754 | $3,747 |
2021 | |
Distributions paid from: | |
Ordinary Income | $2,171,824 |
Class A | Shares | Amount |
Six-month period ended April 30, 2022: | ||
Shares sold | 21,345 | $814,156 |
Shares issued to shareholders in reinvestment of distributions | 14,871 | 600,059 |
Shares redeemed | (37,806) | (1,454,330) |
Net increase (decrease) in shares outstanding before conversion | (1,590) | (40,115) |
Shares converted into Class A (See Note 1) | 1,289 | 48,969 |
Net increase (decrease) | (301) | $8,854 |
Year ended October 31, 2021: | ||
Shares sold | 118,268 | $4,756,256 |
Shares issued to shareholders in reinvestment of distributions | 2,704 | 104,608 |
Shares redeemed | (99,267) | (4,002,536) |
Net increase (decrease) in shares outstanding before conversion | 21,705 | 858,328 |
Shares converted into Class A (See Note 1) | 22,815 | 921,028 |
Shares converted from Class A (See Note 1) | (267) | (11,431) |
Net increase (decrease) | 44,253 | $1,767,925 |
Investor Class | Shares | Amount |
Six-month period ended April 30, 2022: | ||
Shares sold | 2,022 | $76,012 |
Shares issued to shareholders in reinvestment of distributions | 2,628 | 106,090 |
Shares redeemed | (6,861) | (267,542) |
Net increase (decrease) in shares outstanding before conversion | (2,211) | (85,440) |
Shares converted into Investor Class (See Note 1) | 709 | 27,845 |
Shares converted from Investor Class (See Note 1) | (1,084) | (41,053) |
Net increase (decrease) | (2,586) | $(98,648) |
Year ended October 31, 2021: | ||
Shares sold | 6,666 | $270,942 |
Shares issued to shareholders in reinvestment of distributions | 377 | 14,577 |
Shares redeemed | (16,054) | (653,856) |
Net increase (decrease) in shares outstanding before conversion | (9,011) | (368,337) |
Shares converted into Investor Class (See Note 1) | 2,359 | 95,793 |
Shares converted from Investor Class (See Note 1) | (22,276) | (898,243) |
Net increase (decrease) | (28,928) | $(1,170,787) |
28 | MainStay Epoch International Choice Fund |
Class C | Shares | Amount |
Six-month period ended April 30, 2022: | ||
Shares sold | 60 | $2,343 |
Shares issued to shareholders in reinvestment of distributions | 109 | 4,352 |
Shares redeemed | (4,170) | (160,476) |
Net increase (decrease) in shares outstanding before conversion | (4,001) | (153,781) |
Shares converted from Class C (See Note 1) | (926) | (35,761) |
Net increase (decrease) | (4,927) | $(189,542) |
Year ended October 31, 2021: | ||
Shares sold | 1,153 | $43,419 |
Shares redeemed | (115,417) | (4,517,395) |
Net increase (decrease) in shares outstanding before conversion | (114,264) | (4,473,976) |
Shares converted from Class C (See Note 1) | (2,984) | (118,578) |
Net increase (decrease) | (117,248) | $(4,592,554) |
Class I | Shares | Amount |
Six-month period ended April 30, 2022: | ||
Shares sold | 185,085 | $6,495,351 |
Shares issued to shareholders in reinvestment of distributions | 151,372 | 6,097,248 |
Shares redeemed | (307,278) | (12,047,820) |
Net increase (decrease) | 29,179 | $544,779 |
Year ended October 31, 2021: | ||
Shares sold | 194,281 | $7,889,373 |
Shares issued to shareholders in reinvestment of distributions | 51,337 | 1,982,113 |
Shares redeemed | (1,948,578) | (78,940,526) |
Net increase (decrease) in shares outstanding before conversion | (1,702,960) | (69,069,040) |
Shares converted into Class I (See Note 1) | 267 | 11,431 |
Net increase (decrease) | (1,702,693) | $(69,057,609) |
Class R1 | Shares | Amount |
Six-month period ended April 30, 2022: | ||
Shares sold | 578 | $22,348 |
Shares issued to shareholders in reinvestment of distributions | 99 | 3,987 |
Shares redeemed | (3,620) | (131,283) |
Net increase (decrease) | (2,943) | $(104,948) |
Year ended October 31, 2021: | ||
Shares sold | 1,217 | $47,935 |
Shares issued to shareholders in reinvestment of distributions | 44 | 1,681 |
Shares redeemed | (3,293) | (137,223) |
Net increase (decrease) | (2,032) | $(87,607) |
Class R2 | Shares | Amount |
Six-month period ended April 30, 2022: | ||
Shares sold | 15,413 | $598,237 |
Shares issued to shareholders in reinvestment of distributions | 4,626 | 186,691 |
Shares redeemed | (41,183) | (1,506,128) |
Net increase (decrease) | (21,144) | $(721,200) |
Year ended October 31, 2021: | ||
Shares sold | 33,596 | $1,365,655 |
Shares issued to shareholders in reinvestment of distributions | 826 | 31,942 |
Shares redeemed | (52,731) | (2,138,343) |
Net increase (decrease) | (18,309) | $(740,746) |
Class R3 | Shares | Amount |
Six-month period ended April 30, 2022: | ||
Shares sold | 11,683 | $448,101 |
Shares issued to shareholders in reinvestment of distributions | 1,913 | 76,864 |
Shares redeemed | (20,799) | (755,315) |
Net increase (decrease) | (7,203) | $(230,350) |
Year ended October 31, 2021: | ||
Shares sold | 17,050 | $688,346 |
Shares issued to shareholders in reinvestment of distributions | 201 | 7,750 |
Shares redeemed | (50,601) | (2,020,750) |
Net increase (decrease) | (33,350) | $(1,324,654) |
SIMPLE Class | Shares | Amount |
Six-month period ended April 30, 2022: | ||
Shares sold | 8 | $271 |
Shares issued to shareholders in reinvestment of distributions | 16 | 630 |
Net increase (decrease) | 24 | $901 |
Year ended October 31, 2021: | ||
Shares sold | 123 | $5,166 |
Net increase (decrease) | 123 | $5,166 |
30 | MainStay Epoch International Choice Fund |
32 | MainStay Epoch International Choice Fund |
34 | MainStay Epoch International Choice Fund |
36 | MainStay Epoch International Choice Fund |
For more information
Yield Fund
Message from the President and Semiannual Report
please log in to newyorklifeinvestments.com/accounts.
Not FDIC/NCUA Insured | Not a Deposit | May Lose Value | No Bank Guarantee | Not Insured by Any Government Agency |


5 | |
9 | |
12 | |
16 | |
29 | |
38 | |
43 | |
44 | |
44 |
Investors should refer to the Fund’s Summary Prospectus and/or Prospectus and consider the Fund’s investment objectives, strategies, risks, charges and expenses carefully before investing. The Summary Prospectus and/or Prospectus contain this and other information about the Fund. You may obtain copies of the Fund’s Summary Prospectus, Prospectus and Statement of Additional Information, which includes information about MainStay Funds Trust's Trustees, free of charge, upon request, by calling toll-free 800-624-6782, by writing to NYLIFE Distributors LLC, Attn: MainStay Marketing Department, 30 Hudson Street, Jersey City, NJ 07302 or by sending an e-mail to MainStayShareholderServices@nylim.com. These documents are also available via the MainStay Funds’ website at newyorklifeinvestments.com. Please read the Fund’s Summary Prospectus and/or Prospectus carefully before investing.

Average Annual Total Returns for the Period-Ended April 30, 2022 | ||||||||
Class | Sales Charge | Inception Date | Six Months1 | One Year | Five Years | Ten Years or Since Inception | Gross Expense Ratio2 | |
Class A Shares | Maximum 5.5% Initial Sales Charge | With sales charges | 2/3/2009 | -5.83% | -0.40% | 7.51% | 9.77% | 1.07% |
Excluding sales charges | -0.35 | 5.40 | 8.73 | 10.40 | 1.07 | |||
Investor Class Shares3 | Maximum 5% Initial Sales Charge | With sales charges | 11/16/2009 | -5.51 | -0.22 | 7.26 | 9.57 | 1.39 |
Excluding sales charges | -0.53 | 5.03 | 8.48 | 10.19 | 1.39 | |||
Class B Shares4 | Maximum 5% CDSC | With sales charges | 5/8/2017 | -5.81 | -0.73 | N/A | 7.32 | 2.14 |
if Redeemed Within the First Six Years of Purchase | Excluding sales charges | -0.87 | 4.27 | N/A | 7.62 | 2.14 | ||
Class C Shares | Maximum 1% CDSC | With sales charges | 11/16/2009 | -1.86 | 3.33 | 7.67 | 9.38 | 2.14 |
if Redeemed Within One Year of Purchase | Excluding sales charges | -0.87 | 4.33 | 7.67 | 9.38 | 2.14 | ||
Class I Shares | No Sales Charge | 12/3/2008 | -0.19 | 5.68 | 9.05 | 10.69 | 0.82 | |
Class R1 Shares | No Sales Charge | 5/8/2017 | -0.27 | 5.50 | N/A | 8.83 | 0.92 | |
Class R2 Shares | No Sales Charge | 5/8/2017 | -0.41 | 5.23 | N/A | 8.54 | 1.17 | |
Class R3 Shares | No Sales Charge | 5/8/2017 | -0.57 | 4.97 | N/A | 8.27 | 1.42 | |
Class R6 Shares | No Sales Charge | 5/8/2017 | -0.24 | 5.68 | N/A | 9.04 | 0.73 | |
SIMPLE Class Shares | No Sales Charge | 8/31/2020 | -0.64 | 4.78 | N/A | 15.59 | 1.64 | |
1. | Not annualized. |
2. | The gross expense ratios presented reflect the Fund’s “Total Annual Fund Operating Expenses” from the most recent Prospectus, as supplemented, and may differ from other expense ratios disclosed in this report. |
3. | Prior to June 30, 2020, the maximum initial sales charge was 5.5%, which is reflected in the applicable average annual total return figures shown. |
4. | Class B shares are closed to all new purchases as well as additional investments by existing Class B shareholders. |
Benchmark Performance* | Six Months1 | One Year | Five Years | Ten Years |
Russell 1000® Value Index2 | -3.94% | 1.32% | 9.06% | 11.17% |
U.S. Equity Yield Composite Index3 | -1.83 | 3.65 | 9.36 | 11.03 |
Morningstar Large Value Category Average4 | -2.33 | 3.08 | 9.33 | 10.37 |
* | Returns for indices reflect no deductions for fees, expenses or taxes, except for foreign withholding taxes where applicable. |
1. | Not annualized. |
2. | The Fund has selected the Russell 1000® Value Index as its primary benchmark. The Russell 1000® Value Index measures the performance of the large-cap value segment of the U.S. equity universe. It includes those Russell 1000® Index companies with lower price-to-book ratios and lower expected growth values. Results assume reinvestment of all dividends and capital gains. An investment cannot be made directly in an index. |
3. | The Fund has selected the U.S. Equity Yield Composite Index as its secondary benchmark. The U.S. Equity Yield Composite Index consists of the MSCI USA High Dividend Yield Index and the MSCI USA Minimum Volatility (USD) Index weighted at 60% and 40%, respectively. The MSCI USA High Dividend Yield Index is based on the MSCI USA Index and includes large and mid-cap stocks. The MSCI USA High Dividend Yield Index is designed to reflect the performance of equities in the MSCI USA Index (excluding real estate investment trusts) with higher dividend income and quality characteristics than average dividend yields that are both sustainable and persistent. The MSCI USA Minimum Volatility (USD) Index aims to reflect the performance characteristics of a minimum variance strategy applied to the large and mid-cap USA equity universe. The MSCI USA Minimum Volatility (USD) Index is calculated by optimizing the MSCI USA Index in USD for the lowest absolute risk (within a given set of constraints). Results assume reinvestment of all dividends and capital gains. An investment cannot be made directly in an index. |
4. | The Morningstar Large Value Category Average is representative of funds that invest primarily in big U.S. companies that are less expensive or growing more slowly than other large-cap stocks. Results are based on average total returns of similar funds with all dividends and capital gain distributions reinvested. |
6 | MainStay Epoch U.S. Equity Yield Fund |
Share Class | Beginning Account Value 11/1/21 | Ending Account Value (Based on Actual Returns and Expenses) 4/30/22 | Expenses Paid During Period1 | Ending Account Value (Based on Hypothetical 5% Annualized Return and Actual Expenses) 4/30/22 | Expenses Paid During Period1 | Net Expense Ratio During Period2 |
Class A Shares | $1,000.00 | $996.50 | $5.20 | $1,019.59 | $5.26 | 1.05% |
Investor Class Shares | $1,000.00 | $994.70 | $6.53 | $1,018.25 | $6.61 | 1.32% |
Class B Shares | $1,000.00 | $991.30 | $10.22 | $1,014.53 | $10.34 | 2.07% |
Class C Shares | $1,000.00 | $991.30 | $10.22 | $1,014.53 | $10.34 | 2.07% |
Class I Shares | $1,000.00 | $998.10 | $3.62 | $1,021.18 | $3.66 | 0.73% |
Class R1 Shares | $1,000.00 | $997.30 | $4.46 | $1,020.33 | $4.51 | 0.90% |
Class R2 Shares | $1,000.00 | $995.90 | $5.69 | $1,019.09 | $5.76 | 1.15% |
Class R3 Shares | $1,000.00 | $994.30 | $6.92 | $1,017.85 | $7.00 | 1.40% |
Class R6 Shares | $1,000.00 | $997.60 | $3.62 | $1,021.18 | $3.66 | 0.73% |
SIMPLE Class Shares | $1,000.00 | $993.60 | $7.71 | $1,017.06 | $7.80 | 1.56% |
1. | Expenses are equal to the Fund’s annualized expense ratio of each class multiplied by the average account value over the period, divided by 365 and multiplied by 181 (to reflect the six-month period). The table above represents the actual expenses incurred during the six-month period. In addition to the fees and expenses which the Fund bears directly, it also indirectly bears a pro rata share of the fees and expenses of the underlying funds in which it invests. Such indirect expenses are not included in the above-reported expense figures. |
2. | Expenses are equal to the Fund's annualized expense ratio to reflect the six-month period. |
Industry Composition as of April 30, 2022 (Unaudited)
Banks | 6.5% |
Pharmaceuticals | 6.3 |
Electric Utilities | 6.0 |
Semiconductors & Semiconductor Equipment | 5.8 |
Chemicals | 5.3 |
Oil, Gas & Consumable Fuels | 5.2 |
Insurance | 5.1 |
Equity Real Estate Investment Trusts | 4.3 |
Electrical Equipment | 4.2 |
Biotechnology | 3.4 |
Multi–Utilities | 3.2 |
Health Care Providers & Services | 3.2 |
Capital Markets | 3.1 |
Tobacco | 2.9 |
Household Products | 2.9 |
Aerospace & Defense | 2.7 |
IT Services | 2.5 |
Beverages | 2.5 |
Media | 2.2 |
Health Care Equipment & Supplies | 1.8 |
Diversified Telecommunication Services | 1.6 |
Hotels, Restaurants & Leisure | 1.5% |
Food & Staples Retailing | 1.5 |
Commercial Services & Supplies | 1.3 |
Communications Equipment | 1.3 |
Software | 1.3 |
Multiline Retail | 1.3 |
Specialty Retail | 1.2 |
Leisure Products | 1.2 |
Trading Companies & Distributors | 1.2 |
Consumer Finance | 1.1 |
Industrial Conglomerates | 1.0 |
Containers & Packaging | 0.9 |
Air Freight & Logistics | 0.8 |
Technology Hardware, Storage & Peripherals | 0.7 |
Machinery | 0.6 |
Household Durables | 0.6 |
Textiles, Apparel & Luxury Goods | 0.5 |
Short–Term Investments | 1.6 |
Other Assets, Less Liabilities | –0.3 |
100.0% |
Top Ten Holdings and/or Issuers Held as of April 30, 2022 (excluding short-term investments) (Unaudited)
1. | AbbVie, Inc. |
2. | Chevron Corp. |
3. | Merck & Co., Inc. |
4. | UnitedHealth Group, Inc. |
5. | Broadcom, Inc. |
6. | MetLife, Inc. |
7. | Johnson & Johnson |
8. | Medtronic plc |
9. | Emerson Electric Co. |
10. | Arthur J. Gallagher & Co. |
8 | MainStay Epoch U.S. Equity Yield Fund |
10 | MainStay Epoch U.S. Equity Yield Fund |
Shares | Value | |
Common Stocks 98.7% | ||
Aerospace & Defense 2.7% | ||
General Dynamics Corp. | 35,178 | $ 8,320,652 |
Lockheed Martin Corp. | 21,309 | 9,208,045 |
Raytheon Technologies Corp. | 128,872 | 12,231,242 |
29,759,939 | ||
Air Freight & Logistics 0.8% | ||
United Parcel Service, Inc., Class B | 50,060 | 9,009,799 |
Banks 6.5% | ||
Bank of America Corp. | 509,778 | 18,188,879 |
JPMorgan Chase & Co. | 133,607 | 15,947,332 |
PNC Financial Services Group, Inc. (The) | 53,443 | 8,876,882 |
Truist Financial Corp. | 295,627 | 14,293,566 |
U.S. Bancorp | 274,824 | 13,345,453 |
70,652,112 | ||
Beverages 2.5% | ||
Coca-Cola Co. (The) | 135,637 | 8,763,506 |
Coca-Cola Europacific Partners plc | 241,508 | 12,063,325 |
PepsiCo, Inc. | 34,839 | 5,982,205 |
26,809,036 | ||
Biotechnology 3.4% | ||
AbbVie, Inc. | 165,956 | 24,375,617 |
Amgen, Inc. | 52,176 | 12,166,922 |
36,542,539 | ||
Capital Markets 3.1% | ||
BlackRock, Inc. | 17,589 | 10,987,497 |
CME Group, Inc. | 34,501 | 7,567,449 |
Lazard Ltd., Class A (a) | 316,260 | 10,363,840 |
T. Rowe Price Group, Inc. | 39,237 | 4,827,720 |
33,746,506 | ||
Chemicals 5.3% | ||
Air Products and Chemicals, Inc. | 32,139 | 7,522,776 |
Dow, Inc. | 175,211 | 11,651,531 |
Linde plc | 28,074 | 8,757,965 |
LyondellBasell Industries NV, Class A | 95,385 | 10,113,672 |
Nutrien Ltd. | 114,232 | 11,223,294 |
PPG Industries, Inc. | 62,571 | 8,008,462 |
57,277,700 | ||
Commercial Services & Supplies 1.3% | ||
Republic Services, Inc. | 59,531 | 7,993,228 |
Waste Management, Inc. | 39,237 | 6,452,132 |
14,445,360 | ||
Shares | Value | |
Communications Equipment 1.3% | ||
Cisco Systems, Inc. | 283,227 | $ 13,872,458 |
Consumer Finance 1.1% | ||
Ally Financial, Inc. | 311,817 | 12,460,207 |
Containers & Packaging 0.9% | ||
Amcor plc | 828,026 | 9,820,388 |
Diversified Telecommunication Services 1.6% | ||
AT&T, Inc. | 438,530 | 8,270,676 |
Verizon Communications, Inc. | 202,609 | 9,380,796 |
17,651,472 | ||
Electric Utilities 6.0% | ||
Alliant Energy Corp. | 106,547 | 6,266,029 |
American Electric Power Co., Inc. | 158,637 | 15,722,513 |
Duke Energy Corp. | 61,899 | 6,818,794 |
Entergy Corp. | 98,768 | 11,738,577 |
Evergy, Inc. | 137,666 | 9,340,638 |
Eversource Energy | 85,576 | 7,479,342 |
NextEra Energy, Inc. | 104,739 | 7,438,564 |
64,804,457 | ||
Electrical Equipment 4.2% | ||
Eaton Corp. plc | 104,180 | 15,108,184 |
Emerson Electric Co. | 211,404 | 19,064,413 |
Hubbell, Inc. | 59,193 | 11,563,944 |
45,736,541 | ||
Equity Real Estate Investment Trusts 4.3% | ||
American Tower Corp. | 29,427 | 7,092,496 |
Iron Mountain, Inc. | 287,847 | 15,466,019 |
Realty Income Corp. | 101,812 | 7,061,680 |
Welltower, Inc. (a) | 65,281 | 5,928,168 |
WP Carey, Inc. | 140,034 | 11,310,546 |
46,858,909 | ||
Food & Staples Retailing 1.5% | ||
Walmart, Inc. | 106,886 | 16,352,489 |
Health Care Equipment & Supplies 1.8% | ||
Medtronic plc | 189,004 | 19,724,457 |
Health Care Providers & Services 3.2% | ||
CVS Health Corp. | 133,355 | 12,819,416 |
UnitedHealth Group, Inc. | 43,366 | 22,053,779 |
34,873,195 | ||
12 | MainStay Epoch U.S. Equity Yield Fund |
Shares | Value | |
Common Stocks (continued) | ||
Hotels, Restaurants & Leisure 1.5% | ||
McDonald's Corp. | 44,987 | $ 11,208,961 |
Vail Resorts, Inc. | 21,648 | 5,502,056 |
16,711,017 | ||
Household Durables 0.6% | ||
Leggett & Platt, Inc. | 172,865 | 6,159,180 |
Household Products 2.9% | ||
Colgate-Palmolive Co. | 69,679 | 5,368,767 |
Kimberly-Clark Corp. | 61,561 | 8,546,514 |
Procter & Gamble Co. (The) | 107,224 | 17,214,813 |
31,130,094 | ||
Industrial Conglomerates 1.0% | ||
Honeywell International, Inc. | 54,458 | 10,538,168 |
Insurance 5.1% | ||
Arthur J. Gallagher & Co. | 112,636 | 18,978,040 |
Marsh & McLennan Cos., Inc. | 50,737 | 8,204,173 |
MetLife, Inc. | 330,466 | 21,705,007 |
Travelers Cos., Inc. (The) | 39,575 | 6,769,699 |
55,656,919 | ||
IT Services 2.5% | ||
Automatic Data Processing, Inc. | 28,751 | 6,272,893 |
International Business Machines Corp. | 105,871 | 13,997,205 |
Paychex, Inc. | 54,796 | 6,944,297 |
27,214,395 | ||
Leisure Products 1.2% | ||
Hasbro, Inc. | 149,166 | 13,135,558 |
Machinery 0.6% | ||
Cummins, Inc. | 33,825 | 6,399,352 |
Media 2.2% | ||
Comcast Corp., Class A | 337,231 | 13,408,305 |
Omnicom Group, Inc. | 134,454 | 10,235,983 |
23,644,288 | ||
Multiline Retail 1.3% | ||
Target Corp. | 59,697 | 13,649,719 |
Multi-Utilities 3.2% | ||
Ameren Corp. | 103,503 | 9,615,428 |
CMS Energy Corp. | 86,929 | 5,971,153 |
Shares | Value | |
Multi-Utilities (continued) | ||
Dominion Energy, Inc. | 86,253 | $ 7,041,695 |
NiSource, Inc. | 223,242 | 6,500,807 |
WEC Energy Group, Inc. | 60,676 | 6,070,634 |
35,199,717 | ||
Oil, Gas & Consumable Fuels 5.2% | ||
Chevron Corp. | 152,211 | 23,846,897 |
Enterprise Products Partners LP | 671,389 | 17,395,689 |
Magellan Midstream Partners LP | 160,329 | 7,767,940 |
TotalEnergies SE, Sponsored ADR | 153,226 | 7,463,639 |
56,474,165 | ||
Pharmaceuticals 6.3% | ||
Eli Lilly and Co. | 45,161 | 13,192,883 |
Johnson & Johnson | 117,710 | 21,241,947 |
Merck & Co., Inc. | 262,141 | 23,249,285 |
Pfizer, Inc. | 227,501 | 11,163,474 |
68,847,589 | ||
Semiconductors & Semiconductor Equipment 5.8% | ||
Analog Devices, Inc. | 104,518 | 16,135,489 |
Broadcom, Inc. | 39,237 | 21,752,601 |
Intel Corp. | 120,754 | 5,263,667 |
KLA Corp. | 34,828 | 11,119,187 |
Texas Instruments, Inc. | 53,781 | 9,156,215 |
63,427,159 | ||
Software 1.3% | ||
Microsoft Corp. | 49,384 | 13,705,048 |
Specialty Retail 1.2% | ||
Home Depot, Inc. (The) | 44,987 | 13,514,095 |
Technology Hardware, Storage & Peripherals 0.7% | ||
Apple, Inc. | 51,602 | 8,135,055 |
Textiles, Apparel & Luxury Goods 0.5% | ||
Hanesbrands, Inc. | 389,183 | 5,160,567 |
Tobacco 2.9% | ||
Altria Group, Inc. | 208,698 | 11,597,348 |
British American Tobacco plc, Sponsored ADR | 180,115 | 7,525,204 |
Philip Morris International, Inc. | 125,151 | 12,515,100 |
31,637,652 | ||
Shares | Value | |
Common Stocks (continued) | ||
Trading Companies & Distributors 1.2% | ||
MSC Industrial Direct Co., Inc., Class A | 155,593 | $ 12,892,436 |
Total Common Stocks (Cost $817,536,932) | 1,073,629,737 | |
Short-Term Investments 1.6% | ||
Affiliated Investment Company 0.7% | ||
MainStay U.S. Government Liquidity Fund, 0.397% (b) | 7,698,548 | 7,698,548 |
Unaffiliated Investment Company 0.9% | ||
Invesco Government & Agency Portfolio, 0.419% (b)(c) | 9,961,910 | 9,961,910 |
Total Short-Term Investments (Cost $17,660,458) | 17,660,458 | |
Total Investments (Cost $835,197,390) | 100.3% | 1,091,290,195 |
Other Assets, Less Liabilities | (0.3) | (3,382,032) |
Net Assets | 100.0% | $ 1,087,908,163 |
† | Percentages indicated are based on Fund net assets. |
(a) | All or a portion of this security was held on loan. As of April 30, 2022, the aggregate market value of securities on loan was $11,446,155; the total market value of collateral held by the Fund was $12,210,132. The market value of the collateral held included non-cash collateral in the form of U.S. Treasury securities with a value of $2,248,222. The Fund received cash collateral with a value of $9,961,910. (See Note 2(G)) |
(b) | Current yield as of April 30, 2022. |
(c) | Represents a security purchased with cash collateral received for securities on loan. |
Affiliated Investment Companies | Value, Beginning of Period | Purchases at Cost | Proceeds from Sales | Net Realized Gain/(Loss) on Sales | Change in Unrealized Appreciation/ (Depreciation) | Value, End of Period | Dividend Income | Other Distributions | Shares End of Period |
MainStay U.S. Government Liquidity Fund | $ 35,199 | $ 75,062 | $ (102,562) | $ — | $ — | $ 7,699 | $ 1 | $ — | 7,699 |
Abbreviation(s): |
ADR—American Depositary Receipt |
14 | MainStay Epoch U.S. Equity Yield Fund |
Description | Quoted Prices in Active Markets for Identical Assets (Level 1) | Significant Other Observable Inputs (Level 2) | Significant Unobservable Inputs (Level 3) | Total |
Asset Valuation Inputs | ||||
Investments in Securities (a) | ||||
Common Stocks | $ 1,073,629,737 | $ — | $ — | $ 1,073,629,737 |
Short-Term Investments | ||||
Affiliated Investment Company | 7,698,548 | — | — | 7,698,548 |
Unaffiliated Investment Company | 9,961,910 | — | — | 9,961,910 |
Total Short-Term Investments | 17,660,458 | — | — | 17,660,458 |
Total Investments in Securities | $ 1,091,290,195 | $ — | $ — | $ 1,091,290,195 |
(a) | For a complete listing of investments and their industries, see the Portfolio of Investments. |
Assets | |
Investment in unaffiliated securities, at value (identified cost $827,498,842) including securities on loan of $11,446,155 | $1,083,591,647 |
Investment in affiliated investment companies, at value (identified cost $7,698,548) | 7,698,548 |
Cash | 111,344 |
Receivables: | |
Investment securities sold | 20,106,624 |
Dividends | 2,121,297 |
Fund shares sold | 749,961 |
Securities lending | 573 |
Other assets | 107,195 |
Total assets | 1,114,487,189 |
Liabilities | |
Cash collateral received for securities on loan | 9,961,910 |
Payables: | |
Investment securities purchased | 15,115,664 |
Manager (See Note 3) | 619,477 |
Fund shares redeemed | 359,438 |
Transfer agent (See Note 3) | 259,193 |
NYLIFE Distributors (See Note 3) | 143,619 |
Shareholder communication | 87,464 |
Professional fees | 14,292 |
Custodian | 12,623 |
Trustees | 1,005 |
Accrued expenses | 4,341 |
Total liabilities | 26,579,026 |
Net assets | $1,087,908,163 |
Composition of Net Assets | |
Shares of beneficial interest outstanding (par value of $.001 per share) unlimited number of shares authorized | $55,673 |
Additional paid-in-capital | 810,029,064 |
810,084,737 | |
Total distributable earnings (loss) | 277,823,426 |
Net assets | $1,087,908,163 |
Class A | |
Net assets applicable to outstanding shares | $507,607,674 |
Shares of beneficial interest outstanding | 26,076,104 |
Net asset value per share outstanding | $19.47 |
Maximum sales charge (5.50% of offering price) | 1.13 |
Maximum offering price per share outstanding | $20.60 |
Investor Class | |
Net assets applicable to outstanding shares | $77,365,438 |
Shares of beneficial interest outstanding | 3,993,523 |
Net asset value per share outstanding | $19.37 |
Maximum sales charge (5.00% of offering price) | 1.02 |
Maximum offering price per share outstanding | $20.39 |
Class B | |
Net assets applicable to outstanding shares | $6,244,709 |
Shares of beneficial interest outstanding | 332,734 |
Net asset value and offering price per share outstanding | $18.77 |
Class C | |
Net assets applicable to outstanding shares | $12,697,783 |
Shares of beneficial interest outstanding | 676,581 |
Net asset value and offering price per share outstanding | $18.77 |
Class I | |
Net assets applicable to outstanding shares | $334,700,921 |
Shares of beneficial interest outstanding | 17,006,536 |
Net asset value and offering price per share outstanding | $19.68 |
Class R1 | |
Net assets applicable to outstanding shares | $666,280 |
Shares of beneficial interest outstanding | 33,876 |
Net asset value and offering price per share outstanding | $19.67 |
Class R2 | |
Net assets applicable to outstanding shares | $1,391,287 |
Shares of beneficial interest outstanding | 71,485 |
Net asset value and offering price per share outstanding | $19.46 |
Class R3 | |
Net assets applicable to outstanding shares | $3,174,776 |
Shares of beneficial interest outstanding | 163,101 |
Net asset value and offering price per share outstanding | $19.47 |
Class R6 | |
Net assets applicable to outstanding shares | $143,984,635 |
Shares of beneficial interest outstanding | 7,315,591 |
Net asset value and offering price per share outstanding | $19.68 |
SIMPLE Class | |
Net assets applicable to outstanding shares | $74,660 |
Shares of beneficial interest outstanding | 3,846 |
Net asset value and offering price per share outstanding | $19.41 |
16 | MainStay Epoch U.S. Equity Yield Fund |
Investment Income (Loss) | |
Income | |
Dividends-unaffiliated (net of foreign tax withholding of $30,571) | $16,649,974 |
Securities lending | 2,410 |
Dividends-affiliated | 1,295 |
Total income | 16,653,679 |
Expenses | |
Manager (See Note 3) | 3,795,319 |
Distribution/Service—Class A (See Note 3) | 639,403 |
Distribution/Service—Investor Class (See Note 3) | 102,904 |
Distribution/Service—Class B (See Note 3) | 35,781 |
Distribution/Service—Class C (See Note 3) | 68,087 |
Distribution/Service—Class R2 (See Note 3) | 1,945 |
Distribution/Service—Class R3 (See Note 3) | 8,158 |
Distribution/Service—SIMPLE Class (See Note 3) | 164 |
Transfer agent (See Note 3) | 530,343 |
Registration | 65,955 |
Professional fees | 51,418 |
Shareholder communication | 31,144 |
Custodian | 15,066 |
Trustees | 11,370 |
Shareholder service (See Note 3) | 2,774 |
Miscellaneous | 20,751 |
Total expenses before waiver/reimbursement | 5,380,582 |
Expense waiver/reimbursement from Manager (See Note 3) | (134,375) |
Net expenses | 5,246,207 |
Net investment income (loss) | 11,407,472 |
Realized and Unrealized Gain (Loss) | |
Net realized gain (loss) on unaffiliated investments | 35,843,006 |
Net change in unrealized appreciation (depreciation) on unaffiliated investments | (50,496,928) |
Net realized and unrealized gain (loss) | (14,653,922) |
Net increase (decrease) in net assets resulting from operations | $(3,246,450) |
for the six months ended April 30, 2022 (Unaudited) and the year ended October 31, 2021
2022 | 2021 | |
Increase (Decrease) in Net Assets | ||
Operations: | ||
Net investment income (loss) | $11,407,472 | $19,263,207 |
Net realized gain (loss) | 35,843,006 | 33,774,174 |
Net change in unrealized appreciation (depreciation) | (50,496,928) | 237,975,102 |
Net increase (decrease) in net assets resulting from operations | (3,246,450) | 291,012,483 |
Distributions to shareholders: | ||
Class A | (4,265,110) | (9,072,614) |
Investor Class | (580,243) | (1,494,104) |
Class B | (25,034) | (89,076) |
Class C | (47,386) | (169,662) |
Class I | (3,386,190) | (7,402,130) |
Class R1 | (6,637) | (16,551) |
Class R2 | (11,698) | (34,197) |
Class R3 | (21,331) | (55,673) |
Class R6 | (1,431,477) | (2,673,834) |
SIMPLE Class | (355) | (427) |
Total distributions to shareholders | (9,775,461) | (21,008,268) |
Capital share transactions: | ||
Net proceeds from sales of shares | 65,702,613 | 131,984,621 |
Net asset value of shares issued to shareholders in reinvestment of distributions | 9,652,409 | 20,724,582 |
Cost of shares redeemed | (98,366,873) | (169,506,829) |
Increase (decrease) in net assets derived from capital share transactions | (23,011,851) | (16,797,626) |
Net increase (decrease) in net assets | (36,033,762) | 253,206,589 |
Net Assets | ||
Beginning of period | 1,123,941,925 | 870,735,336 |
End of period | $1,087,908,163 | $1,123,941,925 |
18 | MainStay Epoch U.S. Equity Yield Fund |
Six months ended April 30, 2022* | Year Ended October 31, | |||||
Class A | 2021 | 2020 | 2019 | 2018 | 2017 | |
Net asset value at beginning of period | $19.70 | $14.96 | $17.07 | $15.70 | $16.31 | $14.23 |
Net investment income (loss) (a) | 0.19 | 0.32 | 0.36 | 0.36 | 0.33 | 0.31 |
Net realized and unrealized gain (loss) | (0.25) | 4.78 | (1.83) | 1.84 | (0.06) | 2.13 |
Total from investment operations | (0.06) | 5.10 | (1.47) | 2.20 | 0.27 | 2.44 |
Less distributions: | ||||||
From net investment income | (0.17) | (0.36) | (0.34) | (0.37) | (0.32) | (0.30) |
From net realized gain on investments | — | — | (0.30) | (0.46) | (0.56) | (0.06) |
Total distributions | (0.17) | (0.36) | (0.64) | (0.83) | (0.88) | (0.36) |
Net asset value at end of period | $19.47 | $19.70 | $14.96 | $17.07 | $15.70 | $16.31 |
Total investment return (b) | (0.35)% | 34.30% | (8.77)% | 14.49% | 1.62% | 17.34% |
Ratios (to average net assets)/Supplemental Data: | ||||||
Net investment income (loss) | 1.96%†† | 1.76% | 2.31% | 2.21% | 2.06% | 1.92% |
Net expenses (c) | 1.05%†† | 1.07% | 1.08%(d) | 1.08% | 1.07% | 1.08% |
Expenses (before waiver/reimbursement) (c) | 1.05%†† | 1.07% | 1.09% | 1.08% | 1.07% | 1.08% |
Portfolio turnover rate | 14% | 16% | 29% | 18% | 17% | 28% |
Net assets at end of period (in 000’s) | $507,608 | $508,888 | $379,695 | $450,979 | $405,863 | $435,116 |
* | Unaudited. |
†† | Annualized. |
(a) | Per share data based on average shares outstanding during the period. |
(b) | Total investment return is calculated exclusive of sales charges and assumes the reinvestment of dividends and distributions. For periods of less than one year, total return is not annualized. |
(c) | In addition to the fees and expenses which the Fund bears directly, it also indirectly bears a pro-rata share of the fees and expenses of the underlying funds in which it invests. Such indirect expenses are not included in the above expense ratios. |
(d) | Net of interest expense of less than 0.01%. |
Six months ended April 30, 2022* | Year Ended October 31, | |||||
Investor Class | 2021 | 2020 | 2019 | 2018 | 2017 | |
Net asset value at beginning of period | $19.61 | $14.89 | $16.99 | $15.63 | $16.24 | $14.17 |
Net investment income (loss) (a) | 0.17 | 0.28 | 0.32 | 0.32 | 0.30 | 0.30 |
Net realized and unrealized gain (loss) | (0.27) | 4.75 | (1.82) | 1.83 | (0.06) | 2.10 |
Total from investment operations | (0.10) | 5.03 | (1.50) | 2.15 | 0.24 | 2.40 |
Less distributions: | ||||||
From net investment income | (0.14) | (0.31) | (0.30) | (0.33) | (0.29) | (0.27) |
From net realized gain on investments | — | — | (0.30) | (0.46) | (0.56) | (0.06) |
Total distributions | (0.14) | (0.31) | (0.60) | (0.79) | (0.85) | (0.33) |
Net asset value at end of period | $19.37 | $19.61 | $14.89 | $16.99 | $15.63 | $16.24 |
Total investment return (b) | (0.53)% | 33.96% | (8.99)% | 14.25% | 1.45% | 17.12% |
Ratios (to average net assets)/Supplemental Data: | ||||||
Net investment income (loss) | 1.70%†† | 1.53% | 2.07% | 2.01% | 1.90% | 1.89% |
Net expenses (c) | 1.32%†† | 1.33% | 1.33%(d) | 1.30% | 1.24% | 1.28% |
Expenses (before waiver/reimbursement) (c) | 1.35%†† | 1.39% | 1.38% | 1.35% | 1.29% | 1.28% |
Portfolio turnover rate | 14% | 16% | 29% | 18% | 17% | 28% |
Net assets at end of period (in 000's) | $77,365 | $86,155 | $81,365 | $100,602 | $98,939 | $114,150 |
* | Unaudited. |
†† | Annualized. |
(a) | Per share data based on average shares outstanding during the period. |
(b) | Total investment return is calculated exclusive of sales charges and assumes the reinvestment of dividends and distributions. For periods of less than one year, total return is not annualized. |
(c) | In addition to the fees and expenses which the Fund bears directly, it also indirectly bears a pro-rata share of the fees and expenses of the underlying funds in which it invests. Such indirect expenses are not included in the above expense ratios. |
(d) | Net of interest expense of less than 0.01%. |
20 | MainStay Epoch U.S. Equity Yield Fund |
Six months ended April 30, 2022* | Year Ended October 31, | May 8, 2017^ through October 31, 2017 | ||||
Class B | 2021 | 2020 | 2019 | 2018 | ||
Net asset value at beginning of period | $19.00 | $14.43 | $16.48 | $15.18 | $15.79 | $14.97 |
Net investment income (loss) (a) | 0.09 | 0.14 | 0.21 | 0.20 | 0.18 | 0.07 |
Net realized and unrealized gain (loss) | (0.25) | 4.60 | (1.78) | 1.77 | (0.06) | 0.84 |
Total from investment operations | (0.16) | 4.74 | (1.57) | 1.97 | 0.12 | 0.91 |
Less distributions: | ||||||
From net investment income | (0.07) | (0.17) | (0.18) | (0.21) | (0.17) | (0.09) |
From net realized gain on investments | — | — | (0.30) | (0.46) | (0.56) | — |
Total distributions | (0.07) | (0.17) | (0.48) | (0.67) | (0.73) | (0.09) |
Net asset value at end of period | $18.77 | $19.00 | $14.43 | $16.48 | $15.18 | $15.79 |
Total investment return (b) | (0.87)% | 32.98% | (9.71)% | 13.40% | 0.70% | 6.11% |
Ratios (to average net assets)/Supplemental Data: | ||||||
Net investment income (loss) | 0.97%†† | 0.80% | 1.36% | 1.29% | 1.18% | 0.98%†† |
Net expenses (c) | 2.07%†† | 2.08% | 2.08%(d) | 2.05% | 1.99% | 2.04%†† |
Expenses (before waiver/reimbursement) (c) | 2.10%†† | 2.14% | 2.13% | 2.10% | 2.04% | 2.04%†† |
Portfolio turnover rate | 14% | 16% | 29% | 18% | 17% | 28% |
Net assets at end of period (in 000’s) | $6,245 | $7,840 | $8,894 | $14,579 | $17,984 | $26,167 |
* | Unaudited. |
^ | Inception date. |
†† | Annualized. |
(a) | Per share data based on average shares outstanding during the period. |
(b) | Total investment return is calculated exclusive of sales charges and assumes the reinvestment of dividends and distributions. For periods of less than one year, total return is not annualized. |
(c) | In addition to the fees and expenses which the Fund bears directly, it also indirectly bears a pro-rata share of the fees and expenses of the underlying funds in which it invests. Such indirect expenses are not included in the above expense ratios. |
(d) | Net of interest expense of less than 0.01%. |
Six months ended April 30, 2022* | Year Ended October 31, | |||||
Class C | 2021 | 2020 | 2019 | 2018 | 2017 | |
Net asset value at beginning of period | $19.00 | $14.43 | $16.47 | $15.17 | $15.79 | $13.80 |
Net investment income (loss) (a) | 0.09 | 0.14 | 0.20 | 0.20 | 0.18 | 0.16 |
Net realized and unrealized gain (loss) | (0.25) | 4.60 | (1.76) | 1.77 | (0.07) | 2.06 |
Total from investment operations | (0.16) | 4.74 | (1.56) | 1.97 | 0.11 | 2.22 |
Less distributions: | ||||||
From net investment income | (0.07) | (0.17) | (0.18) | (0.21) | (0.17) | (0.17) |
From net realized gain on investments | — | — | (0.30) | (0.46) | (0.56) | (0.06) |
Total distributions | (0.07) | (0.17) | (0.48) | (0.67) | (0.73) | (0.23) |
Net asset value at end of period | $18.77 | $19.00 | $14.43 | $16.47 | $15.17 | $15.79 |
Total investment return (b) | (0.87)% | 32.98% | (9.66)% | 13.41% | 0.63% | 16.20% |
Ratios (to average net assets)/Supplemental Data: | ||||||
Net investment income (loss) | 0.95%†† | 0.81% | 1.35% | 1.30% | 1.16% | 1.06% |
Net expenses (c) | 2.07%†† | 2.08% | 2.08%(d) | 2.05% | 1.99% | 2.04% |
Expenses (before waiver/reimbursement) (c) | 2.10%†† | 2.14% | 2.13% | 2.10% | 2.04% | 2.04% |
Portfolio turnover rate | 14% | 16% | 29% | 18% | 17% | 28% |
Net assets at end of period (in 000’s) | $12,698 | $14,435 | $17,920 | $30,663 | $40,888 | $54,550 |
* | Unaudited. |
†† | Annualized. |
(a) | Per share data based on average shares outstanding during the period. |
(b) | Total investment return is calculated exclusive of sales charges and assumes the reinvestment of dividends and distributions. For periods of less than one year, total return is not annualized. |
(c) | In addition to the fees and expenses which the Fund bears directly, it also indirectly bears a pro-rata share of the fees and expenses of the underlying funds in which it invests. Such indirect expenses are not included in the above expense ratios. |
(d) | Net of interest expense of less than 0.01%. |
22 | MainStay Epoch U.S. Equity Yield Fund |
Six months ended April 30, 2022* | Year Ended October 31, | |||||
Class I | 2021 | 2020 | 2019 | 2018 | 2017 | |
Net asset value at beginning of period | $19.91 | $15.11 | $17.24 | $15.85 | $16.46 | $14.35 |
Net investment income (loss) (a) | 0.23 | 0.39 | 0.41 | 0.40 | 0.39 | 0.37 |
Net realized and unrealized gain (loss) | (0.26) | 4.82 | (1.85) | 1.86 | (0.08) | 2.13 |
Total from investment operations | (0.03) | 5.21 | (1.44) | 2.26 | 0.31 | 2.50 |
Less distributions: | ||||||
From net investment income | (0.20) | (0.41) | (0.39) | (0.41) | (0.36) | (0.33) |
From net realized gain on investments | — | — | (0.30) | (0.46) | (0.56) | (0.06) |
Total distributions | (0.20) | (0.41) | (0.69) | (0.87) | (0.92) | (0.39) |
Net asset value at end of period | $19.68 | $19.91 | $15.11 | $17.24 | $15.85 | $16.46 |
Total investment return (b) | (0.19)% | 34.78% | (8.50)% | 14.76% | 1.86% | 17.66% |
Ratios (to average net assets)/Supplemental Data: | ||||||
Net investment income (loss) | 2.29%†† | 2.10% | 2.63% | 2.46% | 2.37% | 2.31% |
Net expenses (c) | 0.73%†† | 0.73% | 0.76%(d) | 0.83% | 0.81% | 0.83% |
Expenses (before waiver/reimbursement) (c) | 0.80%†† | 0.82% | 0.84% | 0.83% | 0.81% | 0.83% |
Portfolio turnover rate | 14% | 16% | 29% | 18% | 17% | 28% |
Net assets at end of period (in 000’s) | $334,701 | $357,565 | $269,100 | $313,261 | $276,587 | $587,427 |
* | Unaudited. |
†† | Annualized. |
(a) | Per share data based on average shares outstanding during the period. |
(b) | Total investment return is calculated exclusive of sales charges and assumes the reinvestment of dividends and distributions. Class I shares are not subject to sales charges. For periods of less than one year, total return is not annualized. |
(c) | In addition to the fees and expenses which the Fund bears directly, it also indirectly bears a pro-rata share of the fees and expenses of the underlying funds in which it invests. Such indirect expenses are not included in the above expense ratios. |
(d) | Net of interest expense of less than 0.01%. |
Six months ended April 30, 2022* | Year Ended October 31, | May 8, 2017^ through October 31, 2017 | ||||
Class R1 | 2021 | 2020 | 2019 | 2018 | ||
Net asset value at beginning of period | $19.90 | $15.11 | $17.24 | $15.84 | $16.45 | $15.59 |
Net investment income (loss) (a) | 0.21 | 0.35 | 0.41 | 0.38 | 0.37 | 0.17 |
Net realized and unrealized gain (loss) | (0.26) | 4.82 | (1.88) | 1.87 | (0.07) | 0.86 |
Total from investment operations | (0.05) | 5.17 | (1.47) | 2.25 | 0.30 | 1.03 |
Less distributions: | ||||||
From net investment income | (0.18) | (0.38) | (0.36) | (0.39) | (0.35) | (0.17) |
From net realized gain on investments | — | — | (0.30) | (0.46) | (0.56) | — |
Total distributions | (0.18) | (0.38) | (0.66) | (0.85) | (0.91) | (0.17) |
Net asset value at end of period | $19.67 | $19.90 | $15.11 | $17.24 | $15.84 | $16.45 |
Total investment return (b) | (0.27)% | 34.50% | (8.66)% | 14.73% | 1.69% | 6.70% |
Ratios (to average net assets)/Supplemental Data: | ||||||
Net investment income (loss) | 2.11%†† | 1.91% | 2.54% | 2.32% | 2.31% | 2.15%†† |
Net expenses (c) | 0.90%†† | 0.92% | 0.93%(d) | 0.93% | 0.92% | 0.92%†† |
Expenses (before waiver/reimbursement) (c) | 0.90%†† | 0.92% | 0.94% | 0.93% | 0.92% | 0.92%†† |
Portfolio turnover rate | 14% | 16% | 29% | 18% | 17% | 28% |
Net assets at end of period (in 000’s) | $666 | $719 | $530 | $1,009 | $778 | $1,835 |
* | Unaudited. |
^ | Inception date. |
†† | Annualized. |
(a) | Per share data based on average shares outstanding during the period. |
(b) | Total investment return is calculated exclusive of sales charges and assumes the reinvestment of dividends and distributions. Class R1 shares are not subject to sales charges. For periods of less than one year, total return is not annualized. |
(c) | In addition to the fees and expenses which the Fund bears directly, it also indirectly bears a pro-rata share of the fees and expenses of the underlying funds in which it invests. Such indirect expenses are not included in the above expense ratios. |
(d) | Net of interest expense of less than 0.01%. |
24 | MainStay Epoch U.S. Equity Yield Fund |
Six months ended April 30, 2022* | Year Ended October 31, | May 8, 2017^ through October 31, 2017 | ||||
Class R2 | 2021 | 2020 | 2019 | 2018 | ||
Net asset value at beginning of period | $19.69 | $14.95 | $17.06 | $15.69 | $16.30 | $15.46 |
Net investment income (loss) (a) | 0.19 | 0.32 | 0.35 | 0.34 | 0.32 | 0.15 |
Net realized and unrealized gain (loss) | (0.27) | 4.76 | (1.84) | 1.84 | (0.06) | 0.84 |
Total from investment operations | (0.08) | 5.08 | (1.49) | 2.18 | 0.26 | 0.99 |
Less distributions: | ||||||
From net investment income | (0.15) | (0.34) | (0.32) | (0.35) | (0.31) | (0.15) |
From net realized gain on investments | — | — | (0.30) | (0.46) | (0.56) | — |
Total distributions | (0.15) | (0.34) | (0.62) | (0.81) | (0.87) | (0.15) |
Net asset value at end of period | $19.46 | $19.69 | $14.95 | $17.06 | $15.69 | $16.30 |
Total investment return (b) | (0.41)% | 34.20% | (8.87)% | 14.39% | 1.51% | 6.45% |
Ratios (to average net assets)/Supplemental Data: | ||||||
Net investment income (loss) | 1.88%†† | 1.76% | 2.23% | 2.12% | 2.02% | 1.85%†† |
Net expenses (c) | 1.15%†† | 1.17% | 1.18%(d) | 1.18% | 1.17% | 1.17%†† |
Expenses (before waiver/reimbursement) (c) | 1.15%†† | 1.17% | 1.19% | 1.18% | 1.17% | 1.17%†† |
Portfolio turnover rate | 14% | 16% | 29% | 18% | 17% | 28% |
Net assets at end of period (in 000’s) | $1,391 | $1,609 | $2,135 | $2,812 | $2,665 | $5,506 |
* | Unaudited. |
^ | Inception date. |
†† | Annualized. |
(a) | Per share data based on average shares outstanding during the period. |
(b) | Total investment return is calculated exclusive of sales charges and assumes the reinvestment of dividends and distributions. Class R2 shares are not subject to sales charges. For periods of less than one year, total return is not annualized. |
(c) | In addition to the fees and expenses which the Fund bears directly, it also indirectly bears a pro-rata share of the fees and expenses of the underlying funds in which it invests. Such indirect expenses are not included in the above expense ratios. |
(d) | Net of interest expense of less than 0.01%. |
Six months ended April 30, 2022* | Year Ended October 31, | May 8, 2017^ through October 31, 2017 | ||||
Class R3 | 2021 | 2020 | 2019 | 2018 | ||
Net asset value at beginning of period | $19.70 | $14.96 | $17.06 | $15.69 | $16.30 | $15.46 |
Net investment income (loss) (a) | 0.16 | 0.26 | 0.31 | 0.30 | 0.28 | 0.12 |
Net realized and unrealized gain (loss) | (0.26) | 4.77 | (1.83) | 1.84 | (0.07) | 0.86 |
Total from investment operations | (0.10) | 5.03 | (1.52) | 2.14 | 0.21 | 0.98 |
Less distributions: | ||||||
From net investment income | (0.13) | (0.29) | (0.28) | (0.31) | (0.26) | (0.14) |
From net realized gain on investments | — | — | (0.30) | (0.46) | (0.56) | — |
Total distributions | (0.13) | (0.29) | (0.58) | (0.77) | (0.82) | (0.14) |
Net asset value at end of period | $19.47 | $19.70 | $14.96 | $17.06 | $15.69 | $16.30 |
Total investment return (b) | (0.57)% | 33.83% | (9.06)% | 14.11% | 1.25% | 6.34% |
Ratios (to average net assets)/Supplemental Data: | ||||||
Net investment income (loss) | 1.62%†† | 1.45% | 1.96% | 1.86% | 1.75% | 1.55%†† |
Net expenses (c) | 1.40%†† | 1.42% | 1.43%(d) | 1.43% | 1.42% | 1.42%†† |
Expenses (before waiver/reimbursement) (c) | 1.40%†† | 1.42% | 1.44% | 1.43% | 1.42% | 1.42%†† |
Portfolio turnover rate | 14% | 16% | 29% | 18% | 17% | 28% |
Net assets at end of period (in 000’s) | $3,175 | $3,252 | $3,184 | $4,339 | $3,817 | $5,422 |
* | Unaudited. |
^ | Inception date. |
†† | Annualized. |
(a) | Per share data based on average shares outstanding during the period. |
(b) | Total investment return is calculated exclusive of sales charges and assumes the reinvestment of dividends and distributions. Class R3 shares are not subject to sales charges. For periods of less than one year, total return is not annualized. |
(c) | In addition to the fees and expenses which the Fund bears directly, it also indirectly bears a pro-rata share of the fees and expenses of the underlying funds in which it invests. Such indirect expenses are not included in the above expense ratios. |
(d) | Net of interest expense of less than 0.01%. |
26 | MainStay Epoch U.S. Equity Yield Fund |
Six months ended April 30, 2022* | Year Ended October 31, | May 8, 2017^ through October 31, 2017 | ||||
Class R6 | 2021 | 2020 | 2019 | 2018 | ||
Net asset value at beginning of period | $19.92 | $15.12 | $17.25 | $15.85 | $16.46 | $15.59 |
Net investment income (loss) (a) | 0.23 | 0.39 | 0.42 | 0.42 | 0.37 | 0.23 |
Net realized and unrealized gain (loss) | (0.27) | 4.83 | (1.86) | 1.86 | (0.04) | 0.82 |
Total from investment operations | (0.04) | 5.22 | (1.44) | 2.28 | 0.33 | 1.05 |
Less distributions: | ||||||
From net investment income | (0.20) | (0.42) | (0.39) | (0.42) | (0.38) | (0.18) |
From net realized gain on investments | — | — | (0.30) | (0.46) | (0.56) | — |
Total distributions | (0.20) | (0.42) | (0.69) | (0.88) | (0.94) | (0.18) |
Net asset value at end of period | $19.68 | $19.92 | $15.12 | $17.25 | $15.85 | $16.46 |
Total investment return (b) | (0.24)% | 34.78% | (8.46)% | 14.94% | 1.95% | 6.79% |
Ratios (to average net assets)/Supplemental Data: | ||||||
Net investment income (loss) | 2.28%†† | 2.11% | 2.68% | 2.60% | 2.31% | 2.94%†† |
Net expenses (c) | 0.73%†† | 0.73% | 0.73%(d) | 0.73% | 0.73% | 0.72%†† |
Expenses (before waiver/reimbursement) (c) | 0.73%†† | 0.73% | 0.74% | 0.73% | 0.73% | 0.72%†† |
Portfolio turnover rate | 14% | 16% | 29% | 18% | 17% | 28% |
Net assets at end of period (in 000’s) | $143,985 | $143,436 | $107,887 | $165,999 | $190,456 | $723 |
* | Unaudited. |
^ | Inception date. |
†† | Annualized. |
(a) | Per share data based on average shares outstanding during the period. |
(b) | Total investment return is calculated exclusive of sales charges and assumes the reinvestment of dividends and distributions. Class R6 shares are not subject to sales charges. For periods of less than one year, total return is not annualized. |
(c) | In addition to the fees and expenses which the Fund bears directly, it also indirectly bears a pro-rata share of the fees and expenses of the underlying funds in which it invests. Such indirect expenses are not included in the above expense ratios. |
(d) | Net of interest expense of less than 0.01%. |
Six months ended April 30, 2022* | Year Ended October 31, | August 31, 2020^ through October 31, | |
SIMPLE Class | 2021 | 2020 | |
Net asset value at beginning of period | $19.65 | $14.89 | $15.57** |
Net investment income (loss) (a) | 0.14 | 0.22 | 0.03 |
Net realized and unrealized gain (loss) | (0.26) | 4.76 | (0.68) |
Total from investment operations | (0.12) | 4.98 | (0.65) |
Less distributions: | |||
From net investment income | (0.12) | (0.22) | (0.03) |
Net asset value at end of period | $19.41 | $19.65 | $14.89 |
Total investment return (b) | (0.64)% | 33.61% | (4.16)% |
Ratios (to average net assets)/Supplemental Data: | |||
Net investment income (loss) | 1.38%†† | 1.20% | 0.98%†† |
Net expenses (c) | 1.56%†† | 1.58% | 1.57%††(d) |
Expenses (before waiver/reimbursement) (c) | 1.60%†† | 1.65% | 1.63%†† |
Portfolio turnover rate | 14% | 16% | 29% |
Net assets at end of period (in 000’s) | $75 | $43 | $24 |
* | Unaudited. |
^ | Inception date. |
** | Based on the net asset value of Investor Class as of August 31, 2020. |
†† | Annualized. |
(a) | Per share data based on average shares outstanding during the period. |
(b) | Total investment return is calculated exclusive of sales charges and assumes the reinvestment of dividends and distributions. SIMPLE Class shares are not subject to sales charges. For periods of less than one year, total return is not annualized. |
(c) | In addition to the fees and expenses which the Fund bears directly, it also indirectly bears a pro-rata share of the fees and expenses of the underlying funds in which it invests. Such indirect expenses are not included in the above expense ratios. |
(d) | Net of interest expense of less than 0.01%. |
28 | MainStay Epoch U.S. Equity Yield Fund |
Class | Commenced Operations |
Class A | February 3, 2009 |
Investor Class | November 16, 2009 |
Class B | May 08, 2017 |
Class C | November 16, 2009 |
Class I | December 3, 2008 |
Class R1 | May 8, 2017 |
Class R2 | May 8, 2017 |
Class R3 | May 8, 2017 |
Class R6 | May 8, 2017 |
SIMPLE Class | August 31, 2020 |
• Broker/dealer quotes | • Benchmark securities |
• Two-sided markets | • Reference data (corporate actions or material event notices) |
• Bids/offers | • Monthly payment information |
• Industry and economic events | • Reported trades |
30 | MainStay Epoch U.S. Equity Yield Fund |
32 | MainStay Epoch U.S. Equity Yield Fund |
Class R1 | $364 |
Class R2 | 778 |
Class R3 | 1,632 |
Class | Expense | Waived |
Class A | $198,120 | $— |
Investor Class | 156,467 | (13,020) |
Class B | 13,673 | (1,198) |
Class C | 25,905 | (2,175) |
Class I | 130,987 | — |
Class R1 | 282 | — |
Class R2 | 602 | — |
Class R3 | 1,264 | — |
Class R6 | 2,921 | — |
SIMPLE Class | 122 | (11) |
SIMPLE Class | $31,809 | 42.6% |
Federal Tax Cost | Gross Unrealized Appreciation | Gross Unrealized (Depreciation) | Net Unrealized Appreciation/ (Depreciation) | |
Investments in Securities | $828,514,619 | $288,279,419 | $(25,503,843) | $262,775,576 |
Capital Loss Available Through | Short-Term Capital Loss Amounts (000’s) | Long-Term Capital Loss Amounts (000’s) |
Unlimited | $15,365 | $— |
2021 | |
Distributions paid from: | |
Ordinary Income | $21,008,268 |
34 | MainStay Epoch U.S. Equity Yield Fund |
Class A | Shares | Amount |
Six-month period ended April 30, 2022: | ||
Shares sold | 1,129,233 | $22,495,823 |
Shares issued to shareholders in reinvestment of distributions | 209,377 | 4,179,753 |
Shares redeemed | (1,494,623) | (29,679,239) |
Net increase (decrease) in shares outstanding before conversion | (156,013) | (3,003,663) |
Shares converted into Class A (See Note 1) | 400,893 | 8,092,065 |
Shares converted from Class A (See Note 1) | (1,032) | (21,050) |
Net increase (decrease) | 243,848 | $5,067,352 |
Year ended October 31, 2021: | ||
Shares sold | 2,249,277 | $40,750,326 |
Shares issued to shareholders in reinvestment of distributions | 493,273 | 8,889,039 |
Shares redeemed | (3,390,878) | (60,776,692) |
Net increase (decrease) in shares outstanding before conversion | (648,328) | (11,137,327) |
Shares converted into Class A (See Note 1) | 1,123,748 | 20,572,925 |
Shares converted from Class A (See Note 1) | (28,366) | (495,003) |
Net increase (decrease) | 447,054 | $8,940,595 |
Investor Class | Shares | Amount |
Six-month period ended April 30, 2022: | ||
Shares sold | 69,977 | $1,392,275 |
Shares issued to shareholders in reinvestment of distributions | 29,065 | 577,246 |
Shares redeemed | (169,999) | (3,361,841) |
Net increase (decrease) in shares outstanding before conversion | (70,957) | (1,392,320) |
Shares converted into Investor Class (See Note 1) | 28,773 | 560,852 |
Shares converted from Investor Class (See Note 1) | (358,557) | (7,213,716) |
Net increase (decrease) | (400,741) | $(8,045,184) |
Year ended October 31, 2021: | ||
Shares sold | 166,473 | $3,006,614 |
Shares issued to shareholders in reinvestment of distributions | 83,434 | 1,486,548 |
Shares redeemed | (416,188) | (7,482,548) |
Net increase (decrease) in shares outstanding before conversion | (166,281) | (2,989,386) |
Shares converted into Investor Class (See Note 1) | 77,902 | 1,417,638 |
Shares converted from Investor Class (See Note 1) | (983,460) | (17,902,208) |
Net increase (decrease) | (1,071,839) | $(19,473,956) |
Class B | Shares | Amount |
Six-month period ended April 30, 2022: | ||
Shares sold | 3,186 | $61,741 |
Shares issued to shareholders in reinvestment of distributions | 1,297 | 24,941 |
Shares redeemed | (26,812) | (516,648) |
Net increase (decrease) in shares outstanding before conversion | (22,329) | (429,966) |
Shares converted from Class B (See Note 1) | (57,571) | (1,101,404) |
Net increase (decrease) | (79,900) | $(1,531,370) |
Year ended October 31, 2021: | ||
Shares sold | 4,665 | $79,966 |
Shares issued to shareholders in reinvestment of distributions | 5,177 | 88,331 |
Shares redeemed | (65,970) | (1,149,355) |
Net increase (decrease) in shares outstanding before conversion | (56,128) | (981,058) |
Shares converted from Class B (See Note 1) | (147,557) | (2,611,509) |
Net increase (decrease) | (203,685) | $(3,592,567) |
Class C | Shares | Amount |
Six-month period ended April 30, 2022: | ||
Shares sold | 56,267 | $1,082,045 |
Shares issued to shareholders in reinvestment of distributions | 2,456 | 47,262 |
Shares redeemed | (124,330) | (2,384,751) |
Net increase (decrease) in shares outstanding before conversion | (65,607) | (1,255,444) |
Shares converted from Class C (See Note 1) | (17,690) | (337,797) |
Net increase (decrease) | (83,297) | $(1,593,241) |
Year ended October 31, 2021: | ||
Shares sold | 89,457 | $1,571,337 |
Shares issued to shareholders in reinvestment of distributions | 9,938 | 168,966 |
Shares redeemed | (498,460) | (8,636,960) |
Net increase (decrease) in shares outstanding before conversion | (399,065) | (6,896,657) |
Shares converted from Class C (See Note 1) | (82,979) | (1,467,646) |
Net increase (decrease) | (482,044) | $(8,364,303) |
Class I | Shares | Amount |
Six-month period ended April 30, 2022: | ||
Shares sold | 1,582,897 | $32,058,132 |
Shares issued to shareholders in reinvestment of distributions | 166,182 | 3,352,093 |
Shares redeemed | (2,699,981) | (54,359,459) |
Net increase (decrease) in shares outstanding before conversion | (950,902) | (18,949,234) |
Shares converted into Class I (See Note 1) | 1,021 | 21,050 |
Net increase (decrease) | (949,881) | $(18,928,184) |
Year ended October 31, 2021: | ||
Shares sold | 3,124,739 | $57,647,200 |
Shares issued to shareholders in reinvestment of distributions | 400,983 | 7,312,490 |
Shares redeemed | (3,403,222) | (62,224,726) |
Net increase (decrease) in shares outstanding before conversion | 122,500 | 2,734,964 |
Shares converted into Class I (See Note 1) | 27,561 | 485,803 |
Net increase (decrease) | 150,061 | $3,220,767 |
Class R1 | Shares | Amount |
Six-month period ended April 30, 2022: | ||
Shares sold | 2,920 | $58,681 |
Shares issued to shareholders in reinvestment of distributions | 329 | 6,637 |
Shares redeemed | (5,494) | (112,403) |
Net increase (decrease) | (2,245) | $(47,085) |
Year ended October 31, 2021: | ||
Shares sold | 17,145 | $302,082 |
Shares issued to shareholders in reinvestment of distributions | 910 | 16,551 |
Shares redeemed | (17,025) | (317,998) |
Net increase (decrease) | 1,030 | $635 |
Class R2 | Shares | Amount |
Six-month period ended April 30, 2022: | ||
Shares sold | 15,084 | $294,632 |
Shares issued to shareholders in reinvestment of distributions | 567 | 11,314 |
Shares redeemed | (25,873) | (503,101) |
Net increase (decrease) | (10,222) | $(197,155) |
Year ended October 31, 2021: | ||
Shares sold | 9,968 | $179,455 |
Shares issued to shareholders in reinvestment of distributions | 1,871 | 33,157 |
Shares redeemed | (72,897) | (1,231,050) |
Net increase (decrease) | (61,058) | $(1,018,438) |
Class R3 | Shares | Amount |
Six-month period ended April 30, 2022: | ||
Shares sold | 18,716 | $373,352 |
Shares issued to shareholders in reinvestment of distributions | 1,069 | 21,331 |
Shares redeemed | (21,782) | (433,360) |
Net increase (decrease) | (1,997) | $(38,677) |
Year ended October 31, 2021: | ||
Shares sold | 28,384 | $515,537 |
Shares issued to shareholders in reinvestment of distributions | 3,088 | 55,239 |
Shares redeemed | (79,294) | (1,433,508) |
Net increase (decrease) | (47,822) | $(862,732) |
Class R6 | Shares | Amount |
Six-month period ended April 30, 2022: | ||
Shares sold | 390,640 | $7,852,435 |
Shares issued to shareholders in reinvestment of distributions | 70,928 | 1,431,477 |
Shares redeemed | (348,232) | (7,015,858) |
Net increase (decrease) | 113,336 | $2,268,054 |
Year ended October 31, 2021: | ||
Shares sold | 1,419,176 | $27,921,772 |
Shares issued to shareholders in reinvestment of distributions | 146,875 | 2,673,834 |
Shares redeemed | (1,500,982) | (26,253,992) |
Net increase (decrease) | 65,069 | $4,341,614 |
SIMPLE Class | Shares | Amount |
Six-month period ended April 30, 2022: | ||
Shares sold | 1,660 | $33,497 |
Shares issued to shareholders in reinvestment of distributions | 18 | 355 |
Shares redeemed | (10) | (213) |
Net increase (decrease) | 1,668 | $33,639 |
Year ended October 31, 2021: | ||
Shares sold | 546 | $10,332 |
Shares issued to shareholders in reinvestment of distributions | 23 | 427 |
Net increase (decrease) | 569 | $10,759 |
36 | MainStay Epoch U.S. Equity Yield Fund |
38 | MainStay Epoch U.S. Equity Yield Fund |
40 | MainStay Epoch U.S. Equity Yield Fund |
42 | MainStay Epoch U.S. Equity Yield Fund |
44 | MainStay Epoch U.S. Equity Yield Fund |
For more information
Message from the President and Semiannual Report
please log in to newyorklifeinvestments.com/accounts.
Not FDIC/NCUA Insured | Not a Deposit | May Lose Value | No Bank Guarantee | Not Insured by Any Government Agency |


5 | |
10 | |
12 | |
40 | |
47 | |
58 | |
62 | |
63 | |
63 |
Investors should refer to the Fund’s Summary Prospectus and/or Prospectus and consider the Fund’s investment objectives, strategies, risks, charges and expenses carefully before investing. The Summary Prospectus and/or Prospectus contain this and other information about the Fund. You may obtain copies of the Fund’s Summary Prospectus, Prospectus and Statement of Additional Information, which includes information about MainStay Funds Trust's Trustees, free of charge, upon request, by calling toll-free 800-624-6782, by writing to NYLIFE Distributors LLC, Attn: MainStay Marketing Department, 30 Hudson Street, Jersey City, NJ 07302 or by sending an e-mail to MainStayShareholderServices@nylim.com. These documents are also available via the MainStay Funds’ website at newyorklifeinvestments.com. Please read the Fund’s Summary Prospectus and/or Prospectus carefully before investing.
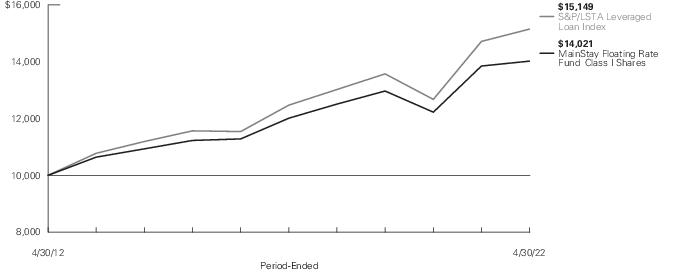
Average Annual Total Returns for the Period-Ended April 30, 2022 | ||||||||
Class | Sales Charge | Inception Date | Six Months1 | One Year | Five Years | Ten Years or Since Inception | Gross Expense Ratio2 | |
Class A Shares | Maximum 3% Initial Sales Charge | With sales charges | 5/3/2004 | -3.49% | -2.03% | 2.26% | 2.87% | 1.04% |
Excluding sales charges | -0.50 | 1.00 | 2.89 | 3.18 | 1.04 | |||
Investor Class Shares3 | Maximum 2.5% Initial Sales Charge | With sales charges | 2/28/2008 | -3.04 | -1.63 | 2.23 | 2.85 | 1.14 |
Excluding sales charges | -0.55 | 0.89 | 2.86 | 3.16 | 1.14 | |||
Class B Shares4 | Maximum 3% CDSC | With sales charges | 5/3/2004 | -3.87 | -2.82 | 2.09 | 2.39 | 1.89 |
if Redeemed Within the First Four Years of Purchase | Excluding sales charges | -0.92 | 0.13 | 2.09 | 2.39 | 1.89 | ||
Class C Shares | Maximum 1% CDSC | With sales charges | 5/3/2004 | -1.80 | -0.85 | 2.09 | 2.39 | 1.89 |
if Redeemed Within One Year of Purchase | Excluding sales charges | -0.81 | 0.13 | 2.09 | 2.39 | 1.89 | ||
Class I Shares | No Sales Charge | 5/3/2004 | -0.39 | 1.24 | 3.14 | 3.44 | 0.79 | |
Class R3 Shares | No Sales Charge | 2/29/2016 | -0.68 | 0.54 | 2.53 | 3.65 | 1.39 | |
Class R6 Shares | No Sales Charge | 2/28/2019 | -0.22 | 1.36 | N/A | 3.13 | 0.64 | |
SIMPLE Class Shares | No Sales Charge | 8/31/2020 | -0.68 | 0.50 | N/A | 3.30 | 1.39 | |
1. | Not annualized. |
2. | The gross expense ratios presented reflect the Fund’s “Total Annual Fund Operating Expenses” from the most recent Prospectus, as supplemented, and may differ from other expense ratios disclosed in this report. |
3. | Prior to June 30, 2020, the maximum initial sales charge was 3%, which is reflected in the applicable average annual total return figures shown. |
4. | Class B shares are closed to all new purchases as well as additional investments by existing Class B shareholders. |
Benchmark Performance* | Six Months1 | One Year | Five Years | Ten Years |
S&P/LSTA Leveraged Loan Index2 | 0.59% | 2.95% | 3.97% | 4.24% |
Morningstar Bank Loan Category Average3 | -0.45 | 1.44 | 2.72 | 3.34 |
* | Returns for indices reflect no deductions for fees, expenses or taxes, except for foreign withholding taxes where applicable. |
1. | Not annualized. |
2. | The S&P/LSTA Leveraged Loan Index is the Fund's primary broad-based securities market index for comparison purposes. The S&P/LSTA Leveraged Loan Index is a broad-based index designed to reflect the performance of U.S. dollar facilities in the leveraged loan market. Results assume reinvestment of all dividends and capital gains. An investment cannot be made directly in an index. |
3. | The Morningstar Bank Loan Category Average is representative of funds that invest in floating-rate bank loans instead of bonds. In exchange for their credit risk, these loans offer high interest payments that typically float above a common short-term benchmark. Results are based on average total returns of similar funds with all dividends and capital gain distributions reinvested. |
6 | MainStay Floating Rate Fund |
Share Class | Beginning Account Value 11/1/21 | Ending Account Value (Based on Actual Returns and Expenses) 4/30/22 | Expenses Paid During Period1 | Ending Account Value (Based on Hypothetical 5% Annualized Return and Actual Expenses) 4/30/22 | Expenses Paid During Period1 | Net Expense Ratio During Period2 |
Class A Shares | $1,000.00 | $995.00 | $4.80 | $1,019.98 | $4.86 | 0.97% |
Investor Class Shares | $1,000.00 | $994.50 | $5.34 | $1,019.44 | $5.41 | 1.08% |
Class B Shares | $1,000.00 | $990.80 | $9.03 | $1,015.72 | $9.15 | 1.83% |
Class C Shares | $1,000.00 | $991.90 | $9.04 | $1,015.72 | $9.15 | 1.83% |
Class I Shares | $1,000.00 | $996.10 | $3.56 | $1,021.22 | $3.61 | 0.72% |
Class R3 Shares | $1,000.00 | $993.20 | $6.52 | $1,018.25 | $6.61 | 1.32% |
Class R6 Shares | $1,000.00 | $997.80 | $3.07 | $1,021.72 | $3.11 | 0.62% |
SIMPLE Class Shares | $1,000.00 | $993.20 | $6.57 | $1,018.20 | $6.66 | 1.33% |
1. | Expenses are equal to the Fund’s annualized expense ratio of each class multiplied by the average account value over the period, divided by 365 and multiplied by 181 (to reflect the six-month period). The table above represents the actual expenses incurred during the six-month period. In addition to the fees and expenses which the Fund bears directly, it also indirectly bears a pro rata share of the fees and expenses of the underlying funds in which it invests. Such indirect expenses are not included in the above-reported expense figures. |
2. | Expenses are equal to the Fund's annualized expense ratio to reflect the six-month period. |
Industry Composition as of April 30, 2022 (Unaudited)
Electronics | 7.4% |
Finance | 6.3 |
Healthcare, Education & Childcare | 5.9 |
Chemicals, Plastics & Rubber | 5.0 |
Services: Business | 4.7 |
Hotels, Motels, Inns & Gaming | 3.8 |
Software | 3.7 |
Insurance | 3.6 |
Telecommunications | 3.4 |
Diversified/Conglomerate Service | 2.5 |
Broadcasting & Entertainment | 2.5 |
Aerospace & Defense | 2.5 |
Healthcare | 2.4 |
Diversified/Conglomerate Manufacturing | 2.3 |
Beverage, Food & Tobacco | 2.3 |
Other Asset-Backed Securities | 2.3 |
Containers, Packaging & Glass | 2.2 |
Buildings & Real Estate | 2.0 |
Media | 1.9 |
Oil & Gas | 1.9 |
Manufacturing | 1.9 |
Automobile | 1.8 |
Personal & Nondurable Consumer Products | 1.8 |
Exchange-Traded Funds | 1.8 |
Healthcare & Pharmaceuticals | 1.6 |
Personal, Food & Miscellaneous Services | 1.5 |
High Tech Industries | 1.5 |
Retail Store | 1.4 |
Utilities | 1.4 |
Entertainment | 1.2 |
Machinery (Non-Agriculture, Non-Construct & Non-Electronic) | 1.0 |
Banking | 0.9 |
Retail | 0.9 |
Mining, Steel, Iron & Non-Precious Metals | 0.8 |
Leisure, Amusement, Motion Pictures & Entertainment | 0.7 |
Commercial Services | 0.6 |
Printing & Publishing | 0.6 |
Personal Transportation | 0.6 |
Personal & Nondurable Consumer Products (Manufacturing Only) | 0.5 |
Affiliated Investment Company | 0.4% |
Cargo Transport | 0.4 |
Ecological | 0.4 |
Pharmaceuticals | 0.3 |
Chemicals | 0.3 |
Water | 0.3 |
Consumer Durables | 0.2 |
Packaging | 0.2 |
Energy (Electricity) | 0.2 |
Environmental Control | 0.2 |
Home and Office Furnishings, Housewares & Durable Consumer Products | 0.1 |
Animal Food | 0.1 |
Electric | 0.1 |
Lodging | 0.1 |
Auto Manufacturers | 0.1 |
Food | 0.1 |
Packaging & Containers | 0.1 |
Building Materials | 0.1 |
Real Estate | 0.1 |
Airlines | 0.1 |
Radio and TV Broadcasting | 0.0‡ |
Healthcare-Services | 0.0‡ |
Iron & Steel | 0.0‡ |
Machinery-Diversified | 0.0‡ |
Distribution & Wholesale | 0.0‡ |
Real Estate Investment Trusts | 0.0‡ |
Oil & Gas Services | 0.0‡ |
Healthcare-Products | 0.0‡ |
Health Care Equipment & Supplies | 0.0‡ |
Health Care Providers & Services | 0.0‡ |
Metals & Mining | 0.0‡ |
Communications Equipment | 0.0‡ |
Independent Power and Renewable Electricity Producers | 0.0‡ |
Short-Term Investments | 16.6 |
Other Assets, Less Liabilities | -11.6 |
100.0% |
‡ | Less than one-tenth of a percent. |
8 | MainStay Floating Rate Fund |
Top Ten Holdings and/or Issuers Held as of April 30, 2022 (excluding short-term investments) (Unaudited)
1. | Invesco Senior Loan ETF |
2. | Asurion LLC, 3.764%-6.014%, due 11/3/23–1/20/29 |
3. | UKG, Inc., 4.212%-6.212%, due 5/4/26–5/3/27 |
4. | SPDR Blackstone Senior Loan ETF |
5. | Sunshine Luxembourg VII SARL, 4.756%, due 10/1/26 |
6. | Bausch Health Cos., Inc., TBD - 5.50%, due 6/2/25–1/27/27 |
7. | Clydesdale Acquisition Holdings, Inc., 4.783%-8.75%, due 4/13/29–4/15/30 |
8. | GFL Environmental, Inc., 3.75%-4.75%, due 5/30/25–6/15/29 |
9. | Caesars Resort Collection LLC, 3.514%-5.75%, due 12/23/24–7/21/25 |
10. | IRB Holding Corp., 3.75%-7.00%, due 2/5/25–12/15/27 |
10 | MainStay Floating Rate Fund |
Principal Amount | Value | |
Long-Term Bonds 92.8% | ||
Asset-Backed Securities 2.3% | ||
Other Asset-Backed Securities 2.3% | ||
AIMCO CLO 16 Ltd. (a)(b) | ||
Series 2021-16A, Class B | ||
1.895% (3 Month LIBOR + 1.65%), due 1/17/35 | $ 2,500,000 | $ 2,455,518 |
Series 2021-16A, Class E | ||
6.445% (3 Month LIBOR + 6.20%), due 1/17/35 | 2,500,000 | 2,349,270 |
Bain Capital Credit CLO Ltd. (a)(b) | ||
Series 2021-6A, Class B | ||
2.748% (3 Month LIBOR + 1.65%), due 10/21/34 | 2,500,000 | 2,467,203 |
Series 2021-6A, Class E | ||
7.598% (3 Month LIBOR + 6.50%), due 10/21/34 | 2,500,000 | 2,382,243 |
Carlyle US CLO Ltd. (a)(b) | ||
Series 2022-2A, Class D | ||
(zero coupon) (3 Month SOFR + 7.40%), due 4/20/35 (c) | 2,500,000 | 2,489,057 |
Series 2022-2A, Class A2 | ||
(zero coupon) (3 Month SOFR + 2.00%), due 4/20/35 (c) | 2,500,000 | 2,497,812 |
Series 2021-5A, Class B | ||
2.663% (3 Month LIBOR + 1.60%), due 7/20/34 | 2,500,000 | 2,456,495 |
Series 2021-5A, Class E | ||
7.313% (3 Month LIBOR + 6.25%), due 7/20/34 | 2,500,000 | 2,385,925 |
Dryden 87 CLO Ltd. (a)(b) | ||
Series 2021-87A, Class B | ||
2.03% (3 Month LIBOR + 1.55%), due 5/20/34 | 2,500,000 | 2,451,828 |
Series 2021-87A, Class E | ||
6.63% (3 Month LIBOR + 6.15%), due 5/20/34 | 2,500,000 | 2,385,988 |
Elmwood CLO 16 Ltd. (a)(b) | ||
Series 2022-3A, Class B | ||
3.446% (3 Month SOFR + 1.95%), due 4/20/34 | 2,500,000 | 2,493,702 |
Series 2022-3A, Class E | ||
8.716% (3 Month SOFR + 7.22%), due 4/20/34 | 2,500,000 | 2,464,360 |
Elmwood CLO XII Ltd. (a)(b) | ||
Series 2021-5A, Class B | ||
2.763% (3 Month LIBOR + 1.70%), due 1/20/35 | 2,500,000 | 2,470,037 |
Principal Amount | Value | |
Other Asset-Backed Securities (continued) | ||
Elmwood CLO XII Ltd. (a)(b) (continued) | ||
Series 2021-5A, Class E | ||
7.413% (3 Month LIBOR + 6.35%), due 1/20/35 | $ 2,500,000 | $ 2,393,063 |
Magnetite XXXI Ltd. (a)(b) | ||
Series 2021-31A, Class B | ||
2.694% (3 Month LIBOR + 1.65%), due 7/15/34 | 2,500,000 | 2,470,817 |
Series 2021-31A, Class E | ||
7.044% (3 Month LIBOR + 6.00%), due 7/15/34 | 2,500,000 | 2,389,015 |
Neuberger Berman Loan Advisers CLO 43 Ltd. (a)(b) | ||
Series 2021-43A, Class C | ||
2.994% (3 Month LIBOR + 1.95%), due 7/17/35 | 2,500,000 | 2,448,250 |
Series 2021-43A, Class E | ||
7.044% (3 Month LIBOR + 6.00%), due 7/17/35 | 2,500,000 | 2,389,170 |
Octagon 59 Ltd. (a)(b) | ||
Series 2022-1A, Class B | ||
2.956% (3 Month SOFR + 1.95%), due 5/15/35 | 2,500,000 | 2,493,682 |
Series 2022-1A, Class E | ||
8.606% (3 Month SOFR + 7.60%), due 5/15/35 | 2,500,000 | 2,466,660 |
Octagon Investment Partners 51 Ltd. (a)(b) | ||
Series 2021-1A, Class B | ||
2.763% (3 Month LIBOR + 1.70%), due 7/20/34 | 2,500,000 | 2,467,712 |
Series 2021-1A, Class E | ||
7.813% (3 Month LIBOR + 6.75%), due 7/20/34 | 2,500,000 | 2,411,855 |
Palmer Square CLO Ltd. (a)(b) | ||
Series 2021-4A, Class B | ||
2.694% (3 Month LIBOR + 1.65%), due 10/15/34 | 2,500,000 | 2,466,685 |
Series 2021-4A, Class E | ||
7.094% (3 Month LIBOR + 6.05%), due 10/15/34 | 2,500,000 | 2,385,723 |
Rockland Park CLO Ltd. (a)(b) | ||
Series 2021-1A, Class B | ||
2.713% (3 Month LIBOR + 1.65%), due 4/20/34 | 2,500,000 | 2,458,073 |
Series 2021-1A, Class E | ||
7.313% (3 Month LIBOR + 6.25%), due 4/20/34 | 2,500,000 | 2,385,350 |
Total Asset-Backed Securities (Cost $64,949,766) | 63,375,493 | |
12 | MainStay Floating Rate Fund |
Principal Amount | Value | |
Corporate Bonds 2.1% | ||
Aerospace & Defense 0.1% | ||
Howmet Aerospace, Inc. | ||
6.875%, due 5/1/25 | $ 500,000 | $ 528,740 |
Spirit AeroSystems, Inc. | ||
7.50%, due 4/15/25 (a) | 2,100,000 | 2,126,250 |
2,654,990 | ||
Airlines 0.1% | ||
United Airlines, Inc. (a) | ||
4.375%, due 4/15/26 | 800,000 | 772,400 |
4.625%, due 4/15/29 | 2,400,000 | 2,202,000 |
2,974,400 | ||
Auto Manufacturers 0.1% | ||
Ford Motor Co. | ||
9.00%, due 4/22/25 | 1,400,000 | 1,560,083 |
Building Materials 0.1% | ||
JELD-WEN, Inc. (a) | ||
4.625%, due 12/15/25 | 590,000 | 556,075 |
4.875%, due 12/15/27 | 780,000 | 707,320 |
Koppers, Inc. | ||
6.00%, due 2/15/25 (a) | 2,000,000 | 1,935,000 |
3,198,395 | ||
Chemicals 0.1% | ||
ASP Unifrax Holdings, Inc. | ||
5.25%, due 9/30/28 (a) | 730,000 | 643,451 |
SCIL IV LLC | ||
5.375%, due 11/1/26 (a) | 660,000 | 602,250 |
WR Grace Holdings LLC | ||
5.625%, due 8/15/29 (a) | 700,000 | 596,330 |
1,842,031 | ||
Commercial Services 0.2% | ||
Herc Holdings, Inc. | ||
5.50%, due 7/15/27 (a) | 850,000 | 832,745 |
PECF USS Intermediate Holding III Corp. | ||
8.00%, due 11/15/29 (a) | 420,000 | 387,450 |
Prime Security Services Borrower LLC | ||
6.25%, due 1/15/28 (a) | 1,000,000 | 896,350 |
Sotheby's | ||
5.875%, due 6/1/29 (a) | 2,100,000 | 1,972,443 |
Team Health Holdings, Inc. | ||
6.375%, due 2/1/25 (a) | 1,000,000 | 852,240 |
4,941,228 | ||
Principal Amount | Value | |
Distribution & Wholesale 0.0% ‡ | ||
IAA, Inc. | ||
5.50%, due 6/15/27 (a) | $ 500,000 | $ 488,750 |
KAR Auction Services, Inc. | ||
5.125%, due 6/1/25 (a) | 400,000 | 404,500 |
893,250 | ||
Electric 0.1% | ||
Vistra Operations Co. LLC | ||
5.00%, due 7/31/27 (a) | 1,500,000 | 1,428,750 |
Entertainment 0.1% | ||
Caesars Resort Collection LLC | ||
5.75%, due 7/1/25 (a) | 500,000 | 510,625 |
Scientific Games International, Inc. | ||
7.00%, due 5/15/28 (a) | 1,350,000 | 1,382,113 |
1,892,738 | ||
Environmental Control 0.2% | ||
GFL Environmental, Inc. (a) | ||
3.75%, due 8/1/25 | 2,000,000 | 1,895,000 |
4.25%, due 6/1/25 | 1,200,000 | 1,163,868 |
4.75%, due 6/15/29 | 4,000,000 | 3,630,000 |
6,688,868 | ||
Food 0.1% | ||
Post Holdings, Inc. | ||
5.50%, due 12/15/29 (a) | 240,000 | 218,400 |
U.S. Foods, Inc. | ||
6.25%, due 4/15/25 (a) | 1,200,000 | 1,232,772 |
1,451,172 | ||
Healthcare-Products 0.0% ‡ | ||
Mozart Debt Merger Sub, Inc. | ||
5.25%, due 10/1/29 (a) | 470,000 | 408,900 |
Healthcare-Services 0.0% ‡ | ||
Acadia Healthcare Co., Inc. | ||
5.00%, due 4/15/29 (a) | 240,000 | 227,400 |
Insurance 0.0% ‡ | ||
GTCR AP Finance, Inc. | ||
8.00%, due 5/15/27 (a) | 900,000 | 896,584 |
Iron & Steel 0.0% ‡ | ||
Carpenter Technology Corp. | ||
6.375%, due 7/15/28 | 630,000 | 627,707 |
Principal Amount | Value | |
Corporate Bonds (continued) | ||
Lodging 0.1% | ||
Boyd Gaming Corp. | ||
4.75%, due 12/1/27 | $ 600,000 | $ 567,084 |
8.625%, due 6/1/25 (a) | 1,000,000 | 1,042,490 |
Hilton Domestic Operating Co., Inc. | ||
5.375%, due 5/1/25 (a) | 1,000,000 | 1,020,310 |
2,629,884 | ||
Machinery-Diversified 0.0% ‡ | ||
GrafTech Finance, Inc. | ||
4.625%, due 12/15/28 (a) | 430,000 | 392,483 |
Media 0.1% | ||
Radiate Holdco LLC | ||
4.50%, due 9/15/26 (a) | 730,000 | 672,250 |
Univision Communications, Inc. | ||
6.625%, due 6/1/27 (a) | 1,400,000 | 1,403,500 |
2,075,750 | ||
Oil & Gas Services 0.0% ‡ | ||
USA Compression Partners LP | ||
6.875%, due 4/1/26 | 640,000 | 627,200 |
Packaging & Containers 0.1% | ||
Ardagh Metal Packaging Finance USA LLC | ||
4.00%, due 9/1/29 (a) | 1,600,000 | 1,371,248 |
Ardagh Packaging Finance plc | ||
5.25%, due 4/30/25 (a) | 1,000,000 | 993,326 |
Clydesdale Acquisition Holdings, Inc. | ||
8.75%, due 4/15/30 (a) | 900,000 | 822,546 |
3,187,120 | ||
Pharmaceuticals 0.1% | ||
Bausch Health Cos., Inc. | ||
5.50%, due 11/1/25 (a) | 700,000 | 677,250 |
Organon & Co. | ||
5.125%, due 4/30/31 (a) | 1,400,000 | 1,265,250 |
1,942,500 | ||
Real Estate 0.1% | ||
Realogy Group LLC | ||
5.75%, due 1/15/29 (a) | 1,670,000 | 1,399,911 |
Real Estate Investment Trusts 0.0% ‡ | ||
Iron Mountain, Inc. | ||
5.00%, due 7/15/28 (a) | 650,000 | 615,764 |
Principal Amount | Value | |
Real Estate Investment Trusts (continued) ‡ | ||
RHP Hotel Properties LP | ||
4.75%, due 10/15/27 | $ 300,000 | $ 279,738 |
895,502 | ||
Retail 0.3% | ||
1011778 B.C. Unlimited Liability Co. | ||
4.00%, due 10/15/30 (a) | 3,120,000 | 2,667,132 |
IRB Holding Corp. | ||
7.00%, due 6/15/25 (a) | 580,000 | 596,921 |
LBM Acquisition LLC | ||
6.25%, due 1/15/29 (a) | 2,000,000 | 1,627,500 |
Michaels Cos., Inc. (The) (a) | ||
5.25%, due 5/1/28 | 1,050,000 | 902,391 |
7.875%, due 5/1/29 | 1,400,000 | 1,102,500 |
6,896,444 | ||
Software 0.0% ‡ | ||
Clarivate Science Holdings Corp. (a) | ||
3.875%, due 7/1/28 | 700,000 | 623,000 |
4.875%, due 7/1/29 | 700,000 | 616,896 |
1,239,896 | ||
Telecommunications 0.1% | ||
Frontier Communications Holdings LLC | ||
5.875%, due 10/15/27 (a) | 560,000 | 536,200 |
LogMeIn, Inc. | ||
5.50%, due 9/1/27 (a) | 2,200,000 | 1,925,000 |
Lumen Technologies, Inc. | ||
4.50%, due 1/15/29 (a) | 1,330,000 | 1,050,899 |
Telesat Canada | ||
4.875%, due 6/1/27 (a) | 900,000 | 612,000 |
4,124,099 | ||
Total Corporate Bonds (Cost $61,637,464) | 57,097,285 | |
Loan Assignments 88.4% | ||
Aerospace & Defense 2.4% | ||
AI Convoy (Luxembourg) SARL | ||
USD Facility Term Loan B 4.544%-5.052% | ||
(2 Month LIBOR + 3.50%, 6 Month LIBOR + 3.50%), due 1/18/27 (b) | 1,588,027 | 1,575,455 |
Amentum Government Services Holdings LLC (b) | ||
First Lien Tranche Term Loan 3 4.50%-4.777% | ||
(3 Month LIBOR + 4.00%, 6 Month LIBOR + 4.00%), due 2/15/29 | 4,083,333 | 4,047,604 |
14 | MainStay Floating Rate Fund |
Principal Amount | Value | |
Loan Assignments (continued) | ||
Aerospace & Defense (continued) | ||
Amentum Government Services Holdings LLC (b) (continued) | ||
First Lien Tranche Term Loan 1 | ||
4.264% (1 Month LIBOR + 3.50%), due 1/29/27 | $ 7,058,147 | $ 7,009,623 |
Arcline FM Holdings LLC | ||
First Lien Initial Term Loan | ||
5.50% (3 Month LIBOR + 4.75%), due 6/23/28 (b) | 7,206,643 | 7,107,551 |
Asplundh Tree Expert LLC | ||
Amendment No. 1 Term Loan | ||
2.514% (1 Month LIBOR + 1.75%), due 9/7/27 (b) | 3,826,318 | 3,786,141 |
Cobham Ultra U.S. Co-borrower LLC | ||
Term Loan | ||
TBD, due 11/17/28 | 5,400,000 | 5,356,125 |
Dynasty Acquisition Co., Inc. (b) | ||
2020 Term Loan B1 | ||
4.506% (3 Month LIBOR + 3.50%), due 4/6/26 | 1,798,975 | 1,757,598 |
2020 Term Loan B2 | ||
4.506% (3 Month LIBOR + 3.50%), due 4/6/26 | 967,191 | 944,945 |
Kestrel Bidco, Inc. | ||
Term Loan | ||
4.00% (3 Month LIBOR + 3.00%), due 12/11/26 (b) | 6,181,317 | 5,960,335 |
Russell Investments U.S. Institutional Holdco, Inc. | ||
2025 Term Loan | ||
5.00% (3 Month LIBOR + 3.50%), due 5/30/25 (b) | 7,487,270 | 7,395,551 |
SkyMiles IP Ltd. | ||
Initial Term Loan | ||
4.75% (3 Month LIBOR + 3.75%), due 10/20/27 (b) | 3,814,286 | 3,936,659 |
Spirit Aerosystems, Inc. | ||
2021 Refinancing Term Loan | ||
4.25% (1 Month LIBOR + 3.75%), due 1/15/25 (b) | 497,500 | 495,990 |
TransDigm, Inc. (b) | ||
Tranche Refinancing Term Loan G | ||
3.014% (1 Month LIBOR + 2.25%), due 8/22/24 | 1,984,772 | 1,953,347 |
Tranche Refinancing Term Loan E | ||
3.014% (1 Month LIBOR + 2.25%), due 5/30/25 | 960,394 | 941,936 |
Principal Amount | Value | |
Aerospace & Defense (continued) | ||
TransDigm, Inc. (b) (continued) | ||
Tranche Refinancing Term Loan F | ||
3.014% (1 Month LIBOR + 2.25%), due 12/9/25 | $ 8,301,180 | $ 8,135,157 |
United AirLines, Inc. | ||
Term Loan B | ||
4.50% (3 Month LIBOR + 3.75%), due 4/21/28 (b) | 4,158,000 | 4,121,040 |
64,525,057 | ||
Animal Food 0.1% | ||
Alltech, Inc. | ||
Term Loan B | ||
4.764% (1 Month LIBOR + 4.00%), due 10/13/28 (b) | 4,123,000 | 4,056,001 |
Automobile 1.8% | ||
American Auto Auction Group LLC | ||
First Lien Tranche Term Loan B | ||
5.801% (3 Month LIBOR + 5.00%), due 12/30/27 (b) | 5,985,000 | 5,895,225 |
American Axle & Manufacturing, Inc. | ||
Tranche Term Loan B | ||
3.00% (1 Month LIBOR + 2.25%), due 4/6/24 (b) | 1,401,206 | 1,394,200 |
Autokiniton U.S. Holdings, Inc. | ||
Closing Date Term Loan B | ||
5.00% (3 Month LIBOR + 4.50%), due 4/6/28 (b) | 7,126,150 | 7,010,350 |
Belron Finance 2019 LLC | ||
Dollar Second Incremental Term Loan | ||
3.50% (3 Month LIBOR + 2.25%), due 10/30/26 (b) | 4,221,875 | 4,187,572 |
Belron Group SA | ||
Dollar Third Incremental Term Loan | ||
3.875% (3 Month LIBOR + 2.75%), due 4/13/28 (b) | 6,379,487 | 6,343,602 |
Chassix, Inc. | ||
Initial Term Loan | ||
6.50% (3 Month LIBOR + 5.50%), due 11/15/23 (b) | 3,518,397 | 3,136,650 |
Clarios Global LP | ||
First Lien Amendment No. 1 Dollar Term Loan | ||
4.014% (1 Month LIBOR + 3.25%), due 4/30/26 (b) | 8,145,827 | 8,005,312 |
First Brands Group LLC | ||
First Lien Term Loan | ||
TBD, due 3/30/27 | 5,000,000 | 4,977,085 |
Principal Amount | Value | |
Loan Assignments (continued) | ||
Automobile (continued) | ||
KAR Auction Services, Inc. | ||
Tranche Term Loan B6 | ||
3.063% (1 Month LIBOR + 2.25%), due 9/19/26 (b) | $ 728,806 | $ 724,707 |
Wand Newco 3, Inc. | ||
First Lien Tranche Term Loan B1 3.457%-3.763% | ||
(1 Month LIBOR + 3.00%), due 2/5/26 (b) | 9,161,234 | 8,714,624 |
50,389,327 | ||
Banking 0.9% | ||
Apollo Commercial Real Estate Finance, Inc. (b) | ||
Initial Term Loan | ||
3.514% (1 Month LIBOR + 2.75%), due 5/15/26 | 3,453,622 | 3,358,647 |
Term Loan B1 | ||
4.132% (1 Month LIBOR + 3.50%), due 3/11/28 | 2,970,000 | 2,925,450 |
Brookfield Property REIT, Inc. | ||
Initial Term Loan B | ||
3.30% (1 Month LIBOR + 2.50%), due 8/27/25 (b) | 1,153,015 | 1,134,999 |
Edelman Financial Engines Center LLC (The) | ||
First Lien 2021 Initial Term Loan | ||
4.264% (1 Month LIBOR + 3.50%), due 4/7/28 (b) | 7,678,972 | 7,611,781 |
Greenhill & Co., Inc. | ||
New Term Loan | ||
4.014% (1 Month LIBOR + 3.25%), due 4/12/24 (b)(d) | 1,299,454 | 1,288,084 |
Jane Street Group LLC | ||
Dollar Term Loan | ||
3.514% (1 Month LIBOR + 2.75%), due 1/26/28 (b) | 8,807,712 | 8,699,818 |
25,018,779 | ||
Beverage, Food & Tobacco 2.3% | ||
8th Avenue Food & Provisions, Inc. | ||
First Lien Term Loan | ||
4.514% (1 Month LIBOR + 3.75%), due 10/1/25 (b) | 6,278,554 | 5,399,557 |
American Seafoods Group LLC | ||
First Lien Tranche Term Loan B | ||
3.75% (3 Month LIBOR + 2.75%), due 8/21/23 (b) | 1,020,051 | 1,008,576 |
Principal Amount | Value | |
Beverage, Food & Tobacco (continued) | ||
Arctic Glacier Group Holdings, Inc. | ||
Specified Refinancing Term Loan | ||
4.506% (3 Month LIBOR + 3.50%), due 3/20/24 (b)(d) | $ 961,552 | $ 890,036 |
B&G Foods, Inc. | ||
Tranche Term Loan B4 | ||
2.957% (1 Month LIBOR + 2.50%), due 10/10/26 (b) | 825,833 | 806,908 |
CHG PPC Parent LLC | ||
First Lien 2021-1 U.S. Term Loan | ||
3.813% (1 Month LIBOR + 3.00%), due 12/8/28 (b) | 7,840,000 | 7,683,200 |
Froneri International Ltd. | ||
First Lien Facility Term Loan B2 | ||
3.014% (1 Month LIBOR + 2.25%), due 1/29/27 (b) | 2,962,238 | 2,884,479 |
H-Food Holdings LLC | ||
Initial Term Loan | ||
4.451% (1 Month LIBOR + 3.688%), due 5/23/25 (b) | 9,555,362 | 9,133,331 |
JBS USA Lux SA | ||
New Term Loan | ||
2.804% (3 Month LIBOR + 2.00%), due 5/1/26 (b) | 7,557,691 | 7,523,681 |
Naked Juice LLC (b) | ||
First Lien Initial Term Loan | ||
4.001% (3 Month LIBOR + 3.25%), due 1/24/29 | 6,666,667 | 6,534,260 |
Second Lien Initial Term Loan | ||
6.651% (3 Month LIBOR + 6.00%), due 1/24/30 | 1,400,000 | 1,389,500 |
Sotheby's | ||
2021 Second Refinancing Term Loan | ||
5.544% (3 Month LIBOR + 4.50%), due 1/15/27 (b) | 2,273,975 | 2,267,342 |
Sunshine Investments BV | ||
Facility Term Loan B3 | ||
3.219% (3 Month LIBOR + 2.75%), due 3/28/25 (b) | 6,151,482 | 6,105,345 |
U.S. Foods, Inc. | ||
Incremental Term Loan B | ||
3.258% (3 Month LIBOR + 2.75%), due 11/22/28 (b) | 4,955,100 | 4,921,807 |
United Natural Foods, Inc. | ||
Initial Term Loan | ||
4.014% (1 Month LIBOR + 3.25%), due 10/22/25 (b) | 5,535,736 | 5,498,541 |
62,046,563 | ||
16 | MainStay Floating Rate Fund |
Principal Amount | Value | |
Loan Assignments (continued) | ||
Broadcasting & Entertainment 2.5% | ||
Altice France SA | ||
USD Incremental Term Loan B13 | ||
4.506% (3 Month LIBOR + 4.00%), due 8/14/26 (b) | $ 6,946,477 | $ 6,888,592 |
Charter Communications Operating LLC | ||
Term Loan B1 | ||
2.52% (1 Month LIBOR + 1.75%), due 4/30/25 (b) | 9,575,000 | 9,496,006 |
Clear Channel Outdoor Holdings, Inc. | ||
Term Loan B 4.264%-4.739% | ||
(1 Month LIBOR + 3.50%, 3 Month LIBOR + 3.50%), due 8/21/26 (b) | 7,203,405 | 7,035,702 |
CMG Media Corp. | ||
First Lien 2021 Term Loan B | ||
4.264% (1 Month LIBOR + 3.50%), due 12/17/26 (b) | 11,810,206 | 11,626,722 |
Gray Television, Inc. (b) | ||
Term Loan C | ||
2.955% (1 Month LIBOR + 2.50%), due 1/2/26 | 3,011,962 | 2,988,536 |
Term Loan D | ||
3.455% (1 Month LIBOR + 3.00%), due 12/1/28 | 6,391,500 | 6,343,564 |
Nexstar Media, Inc. | ||
Term Loan B4 | ||
2.955% (1 Month LIBOR + 2.50%), due 9/18/26 (b) | 7,480,394 | 7,417,275 |
Numericable U.S. LLC (b) | ||
USD Term Loan B11 | ||
3.989% (3 Month LIBOR + 2.75%), due 7/31/25 | 431,319 | 422,846 |
USD Term Loan B12 | ||
4.732% (3 Month LIBOR + 3.688%), due 1/31/26 | 3,819,976 | 3,774,136 |
Univision Communications, Inc. (b) | ||
First Lien 2017 Replacement Repriced Term Loan | ||
3.75% (1 Month LIBOR + 2.75%), due 3/15/24 | 4,966,237 | 4,941,406 |
First Lien Initial Term Loan | ||
4.014% (1 Month LIBOR + 3.25%), due 1/31/29 | 6,520,000 | 6,449,910 |
67,384,695 | ||
Principal Amount | Value | |
Buildings & Real Estate 2.0% | ||
Allspring Buyer LLC | ||
Initial Term Loan | ||
4.313% (3 Month LIBOR + 3.25%), due 11/1/28 (b) | $ 5,725,807 | $ 5,711,492 |
Beacon Roofing Supply, Inc. | ||
2028 Term Loan | ||
3.014% (1 Month LIBOR + 2.25%), due 5/19/28 (b) | 3,473,750 | 3,423,224 |
Core & Main LP | ||
Tranche Term Loan B 3.198%-4.319% | ||
(1 Month LIBOR + 2.50%, 3 Month LIBOR + 2.50%), due 7/27/28 (b) | 7,439,160 | 7,290,377 |
Cornerstone Building Brands, Inc. | ||
Tranche Term Loan B | ||
3.804% (1 Month LIBOR + 3.25%), due 4/12/28 (b) | 8,545,325 | 8,000,560 |
Cushman & Wakefield U.S. Borrower LLC | ||
Replacement Term Loan | ||
3.514% (1 Month LIBOR + 2.75%), due 8/21/25 (b) | 9,833,063 | 9,716,296 |
SRS Distribution, Inc. (b) | ||
Term Loan | ||
4.00% (3 Month LIBOR + 3.50%), due 6/2/28 | 1,396,500 | 1,344,131 |
2021 Refinancing Term Loan | ||
4.019% (3 Month LIBOR + 3.50%), due 6/2/28 | 8,044,225 | 7,735,021 |
VC GB Holdings I Corp. | ||
First Lien Initial Term Loan | ||
4.506% (3 Month LIBOR + 3.50%), due 7/21/28 (b) | 4,239,375 | 3,975,296 |
Wilsonart LLC | ||
Tranche Term Loan E | ||
4.25% (3 Month LIBOR + 3.25%), due 12/31/26 (b) | 8,790,309 | 8,314,165 |
55,510,562 | ||
Cargo Transport 0.4% | ||
Genesee & Wyoming, Inc. | ||
Initial Term Loan | ||
3.006% (3 Month LIBOR + 2.00%), due 12/30/26 (b) | 9,914,709 | 9,823,186 |
Principal Amount | Value | |
Loan Assignments (continued) | ||
Chemicals 0.2% | ||
ASP Unifrax Holdings, Inc. | ||
First Lien USD Term Loan 4.733%-4.756% | ||
(3 Month LIBOR + 3.75%), due 12/12/25 (b) | $ 2,992,268 | $ 2,892,775 |
LSF11 A5 Holdco LLC | ||
Term Loan | ||
4.315% (1 Month LIBOR + 3.50%), due 10/15/28 (b) | 3,333,333 | 3,275,833 |
6,168,608 | ||
Chemicals, Plastics & Rubber 5.0% | ||
Alpha 3 BV | ||
Initial Dollar Term Loan | ||
3.264% (1 Month LIBOR + 2.50%), due 3/18/28 (b) | 4,065,280 | 4,026,806 |
Aruba Investments Holdings LLC | ||
First Lien Initial Dollar Term Loan | ||
4.50% (3 Month LIBOR + 3.75%), due 11/24/27 (b) | 1,304,765 | 1,287,368 |
Bakelite UK Intermediate Ltd. | ||
Term Loan | ||
TBD, due 2/2/29 | 6,200,000 | 6,076,000 |
Cabot Microelectronics Corp. | ||
Term Loan B1 | ||
2.813% (1 Month LIBOR + 2.00%), due 11/17/25 (b) | 1,814,848 | 1,804,262 |
Clydesdale Acquisition Holdings, Inc. | ||
First Lien Term Loan B | ||
4.783% (1 Month LIBOR + 4.25%), due 4/13/29 (b) | 17,000,000 | 16,768,188 |
Diamond (BC) BV | ||
Amendment No. 3 Refinancing Term Loan | ||
3.25% (1 Month LIBOR + 2.75%), due 9/29/28 (b) | 4,987,500 | 4,806,703 |
Entegris, Inc. | ||
Term Loan B | ||
TBD, due 3/2/29 | 10,600,000 | 10,600,000 |
Herens Holdco SARL | ||
USD Facility Term Loan B | ||
5.006% (3 Month LIBOR + 4.00%), due 7/3/28 (b) | 4,620,919 | 4,474,204 |
INEOS Styrolution Group GmbH | ||
2026 Tranche Dollar Term Loan B | ||
3.514% (1 Month LIBOR + 2.75%), due 1/29/26 (b) | 3,533,300 | 3,489,134 |
Principal Amount | Value | |
Chemicals, Plastics & Rubber (continued) | ||
Ineos U.S. Finance LLC (b) | ||
2024 New Dollar Term Loan | ||
2.764% (1 Month LIBOR + 2.00%), due 4/1/24 | $ 2,375,570 | $ 2,361,910 |
2028 Dollar Term Loan | ||
3.00% (1 Month LIBOR + 2.50%), due 11/8/28 | 1,866,667 | 1,848,000 |
Innophos Holdings, Inc. | ||
Initial Term Loan | ||
4.514% (1 Month LIBOR + 3.75%), due 2/5/27 (b) | 5,419,687 | 5,385,814 |
Jazz Pharmaceuticals plc | ||
Initial Dollar Term Loan | ||
4.264% (1 Month LIBOR + 3.50%), due 5/5/28 (b) | 11,428,712 | 11,404,906 |
Minerals Technologies, Inc. | ||
New Term Loan B1 | ||
3.00% (1 Month LIBOR + 2.25%), due 2/14/24 (b)(d) | 1,183,342 | 1,179,644 |
Nouryon Finance BV | ||
Initial Dollar Term Loan | ||
4.006% (3 Month LIBOR + 3.00%), due 10/1/25 (b) | 5,520,267 | 5,432,285 |
Olympus Water U.S. Holding Corp. | ||
Initial Dollar Term Loan | ||
4.813% (3 Month LIBOR + 3.75%), due 11/9/28 (b) | 6,733,125 | 6,603,270 |
Oxea Holding Vier GmbH | ||
Tranche Term Loan B2 | ||
3.75% (1 Month LIBOR + 3.25%), due 10/14/24 (b) | 4,990,291 | 4,946,626 |
PMHC II, Inc. | ||
Initial Term Loan | ||
5.287% (3 Month LIBOR + 4.25%), due 4/21/29 (b) | 12,000,000 | 11,250,000 |
SCIH Salt Holdings, Inc. | ||
First Lien Incremental Term Loan B1 | ||
4.75% (3 Month LIBOR + 4.00%), due 3/16/27 (b) | 9,890,660 | 9,556,851 |
Sparta U.S. Holdco LLC | ||
First Lien Initial Term Loan | ||
4.25% (1 Month LIBOR + 3.50%), due 8/2/28 (b) | 2,094,750 | 2,076,421 |
Tricorbraun Holdings, Inc. | ||
First Lien Closing Date Initial Term Loan | ||
4.014% (1 Month LIBOR + 3.25%), due 3/3/28 (b) | 7,925,675 | 7,739,422 |
18 | MainStay Floating Rate Fund |
Principal Amount | Value | |
Loan Assignments (continued) | ||
Chemicals, Plastics & Rubber (continued) | ||
Tronox Finance LLC (b) | ||
First Lien Refinancing Term Loan 3.014%-3.256% | ||
(1 Month LIBOR + 2.25%, 3 Month LIBOR + 2.25%), due 3/10/28 | $ 2,635,346 | $ 2,606,521 |
First Lien 2022 Incremental Term Loan | ||
3.925% (3 Month LIBOR + 3.25%), due 4/4/29 | 5,000,000 | 4,962,500 |
Venator Finance SARL | ||
Initial Term Loan | ||
3.764% (1 Month LIBOR + 3.00%), due 8/8/24 (b) | 1,391,992 | 1,301,513 |
W. R. Grace Holdings LLC | ||
Initial Term Loan | ||
4.813% (3 Month LIBOR + 3.75%), due 9/22/28 (b) | 3,491,250 | 3,458,083 |
135,446,431 | ||
Commercial Services 0.4% | ||
MHI Holdings LLC | ||
Initial Term Loan | ||
5.764% (1 Month LIBOR + 5.00%), due 9/21/26 (b) | 2,760,152 | 2,747,502 |
Prime Security Services Borrower LLC | ||
First Lien 2021 Refinancing Term Loan B1 | ||
3.50% (3 Month LIBOR + 2.75%), due 9/23/26 (b) | 8,799,064 | 8,686,331 |
11,433,833 | ||
Consumer Durables 0.2% | ||
SWF Holdings I Corp. | ||
First Lien Initial Term Loan | ||
4.75% (1 Month LIBOR + 4.00%), due 10/6/28 (b) | 6,900,000 | 6,369,563 |
Containers, Packaging & Glass 2.2% | ||
Alliance Laundry Systems LLC | ||
Initial Term Loan B 4.25%-4.521% | ||
(1 Month LIBOR + 3.50%, 3 Month LIBOR + 3.50%), due 10/8/27 (b) | 6,697,752 | 6,653,098 |
Altium Packaging LLC | ||
First Lien 2021 Term Loan | ||
3.25% (1 Month LIBOR + 2.75%), due 2/3/28 (b) | 3,054,255 | 2,931,132 |
Principal Amount | Value | |
Containers, Packaging & Glass (continued) | ||
Anchor Glass Container Corp. | ||
First Lien July 2017 Additional Term Loan 3.75%-3.756% | ||
(3 Month LIBOR + 2.75%), due 12/7/23 (b) | $ 2,639,341 | $ 2,266,123 |
Berlin Packaging LLC (b) | ||
Tranche Initial Term Loan B4 3.75%-4.26% | ||
(1 Month LIBOR + 3.25%, 3 Month LIBOR + 3.25%), due 3/11/28 | 3,960,075 | 3,895,724 |
Tranche Term Loan B5 4.25%-4.76% | ||
(1 Month LIBOR + 3.75%, 3 Month LIBOR + 3.75%), due 3/11/28 | 1,074,600 | 1,062,127 |
Berry Global, Inc. | ||
Term Loan Z | ||
2.238% (1 Month LIBOR + 1.75%), due 7/1/26 (b) | 3,300,749 | 3,248,238 |
Charter Next Generation, Inc. | ||
First Lien 2021 Initial Term Loan | ||
4.514% (1 Month LIBOR + 3.75%), due 12/1/27 (b) | 3,572,488 | 3,550,717 |
Clearwater Paper Corp. | ||
Initial Term Loan | ||
3.625% (3 Month LIBOR + 3.00%), due 7/26/26 (b) | 250,000 | 247,500 |
Graham Packaging Co., Inc. | ||
2021 Initial Term Loan | ||
3.764% (1 Month LIBOR + 3.00%), due 8/4/27 (b) | 7,495,894 | 7,327,236 |
Mauser Packaging Solutions Holding Co. | ||
Initial Term Loan | ||
3.705% (1 Month LIBOR + 3.25%), due 4/3/24 (b) | 7,735,208 | 7,578,090 |
Pactiv Evergreen, Inc. (b) | ||
Tranche U.S. Term Loan B2 | ||
4.014% (1 Month LIBOR + 3.25%), due 2/5/26 | 3,090,887 | 3,004,599 |
Tranche B3 U.S. Term Loan | ||
4.264% (1 Month LIBOR + 3.50%), due 9/24/28 | 995,000 | 968,881 |
Pretium PKG Holdings, Inc. (b) | ||
First Lien Initial Term Loan 4.50%-4.967% | ||
(1 Month LIBOR + 4.00%, 3 Month LIBOR + 4.00%), due 10/2/28 | 3,670,800 | 3,560,676 |
Principal Amount | Value | |
Loan Assignments (continued) | ||
Containers, Packaging & Glass (continued) | ||
Pretium PKG Holdings, Inc. (b) (continued) | ||
Second Lien Initial Term Loan 7.25%-7.717% | ||
(1 Month LIBOR + 6.75%, 3 Month LIBOR + 6.75%), due 10/1/29 | $ 1,750,000 | $ 1,680,000 |
Reynolds Consumer Products LLC | ||
Initial Term Loan | ||
2.514% (1 Month LIBOR + 1.75%), due 2/4/27 (b) | 2,146,970 | 2,111,746 |
RLG Holdings LLC | ||
First Lien Closing Date Initial Term Loan | ||
5.014% (1 Month LIBOR + 4.25%), due 7/7/28 (b) | 4,987,500 | 4,881,516 |
Trident TPI Holdings, Inc. (b) | ||
Tranche Delayed Draw Term Loan B3 4.00%-4.763% | ||
(1 Month LIBOR + 4.00%), due 9/15/28 (d) | 293,012 | 288,922 |
Tranche Term Loan B1 | ||
4.256% (3 Month LIBOR + 3.25%), due 10/17/24 | 1,991,152 | 1,977,877 |
Tranche Initial Term Loan B3 | ||
4.764% (1 Month LIBOR + 4.00%), due 9/15/28 | 3,286,413 | 3,240,542 |
60,474,744 | ||
Diversified/Conglomerate Manufacturing 2.3% | ||
Allied Universal Holdco LLC | ||
Initial U.S. Dollar Term Loan | ||
4.514% (1 Month LIBOR + 3.75%), due 5/12/28 (b) | 11,093,339 | 10,800,408 |
Bright Bidco BV | ||
2018 Refinancing Term Loan B | ||
4.774% (3 Month LIBOR + 3.50%), due 6/30/24 (b) | 2,840,707 | 1,319,508 |
EWT Holdings III Corp. | ||
Initial Term Loan | ||
3.313% (1 Month LIBOR + 2.50%), due 4/1/28 (b) | 4,689,563 | 4,656,346 |
Filtration Group Corp. (b) | ||
Initial Dollar Term Loan | ||
3.457% (1 Month LIBOR + 3.00%), due 3/31/25 | 5,828,511 | 5,745,129 |
2021 Incremental Term Loan | ||
4.00% (1 Month LIBOR + 3.50%), due 10/21/28 | 3,000,000 | 2,961,750 |
Principal Amount | Value | |
Diversified/Conglomerate Manufacturing (continued) | ||
Gardner Denver, Inc. | ||
2020 GDI Tranche Dollar Term Loan B2 | ||
2.207% (1 Month LIBOR + 1.75%), due 3/1/27 (b) | $ 3,360,229 | $ 3,312,826 |
GYP Holdings III Corp. | ||
First Lien 2021 Incremental Term Loan | ||
3.264% (1 Month LIBOR + 2.50%), due 6/1/25 (b) | 2,586,805 | 2,552,853 |
Ingersoll-Rand Services Co. | ||
2020 Spinco Tranche Dollar Term Loan B1 | ||
2.207% (1 Month LIBOR + 1.75%), due 3/1/27 (b) | 855,608 | 843,538 |
Iron Mountain Information Management LLC | ||
Incremental Term Loan B | ||
2.514% (1 Month LIBOR + 1.75%), due 1/2/26 (b) | 3,227,848 | 3,195,570 |
LTI Holdings, Inc. (b) | ||
First Lien Initial Term Loan | ||
3.957% (1 Month LIBOR + 3.50%), due 9/6/25 | 5,313,104 | 5,200,201 |
First Lien Second Amendment Delayed Draw Term Loan | ||
5.514% (1 Month LIBOR + 4.75%), due 7/24/26 | 468,750 | 463,769 |
First Lien Second Amendment Additional Term Loan | ||
5.514% (1 Month LIBOR + 4.75%), due 7/24/26 | 775,391 | 767,152 |
First Lien Third Amendment Additional Term Loan | ||
5.514% (1 Month LIBOR + 4.75%), due 7/24/26 (d) | 249,375 | 246,258 |
QUIKRETE Holdings, Inc. (b) | ||
First Lien Initial Term Loan | ||
3.082% (1 Month LIBOR + 2.625%), due 2/1/27 | 2,323,354 | 2,252,824 |
First Lien Fourth Amendment Term Loan B1 | ||
3.554% (1 Week LIBOR + 3.00%), due 6/11/28 | 5,500,000 | 5,351,043 |
Red Ventures LLC (b) | ||
First Lien Term Loan B2 | ||
3.264% (1 Month LIBOR + 2.50%), due 11/8/24 | 7,598,941 | 7,490,383 |
First Lien Term Loan B3 | ||
4.264% (1 Month LIBOR + 3.50%), due 11/8/24 | 1,975,000 | 1,957,719 |
WP CPP Holdings LLC | ||
First Lien Initial Term Loan | ||
4.75% (3 Month LIBOR + 3.75%), due 4/30/25 (b) | 2,982,840 | 2,805,734 |
61,923,011 | ||
20 | MainStay Floating Rate Fund |
Principal Amount | Value | |
Loan Assignments (continued) | ||
Diversified/Conglomerate Service 2.5% | ||
Applied Systems, Inc. (b) | ||
First Lien Closing Date Term Loan 4.00%-5.50% | ||
(3 Month LIBOR + 2.00%, 3 Month LIBOR + 3.00%), due 9/19/24 | $ 3,463,798 | $ 3,452,776 |
Second Lien 2021 Term Loan | ||
6.506% (3 Month LIBOR + 5.50%), due 9/19/25 | 1,969,310 | 1,962,540 |
Blackhawk Network Holdings, Inc. | ||
First Lien Term Loan | ||
3.764% (1 Month LIBOR + 3.00%), due 6/15/25 (b) | 5,864,763 | 5,784,122 |
Brightview Landscapes LLC | ||
2022 Initial Term Loan | ||
3.95% (1 Month LIBOR + 3.25%), due 4/20/29 (b) | 1,431,861 | 1,412,173 |
Change Healthcare Holdings, Inc. | ||
Closing Date Term Loan | ||
3.50% (1 Month LIBOR + 2.50%), due 3/1/24 (b) | 7,465,216 | 7,446,553 |
Genesys Cloud Services Holdings I LLC | ||
2020 Initial Dollar Term Loan | ||
4.764% (1 Month LIBOR + 4.00%), due 12/1/27 (b) | 8,381,223 | 8,347,178 |
IRI Holdings, Inc. | ||
First Lien Initial Term Loan | ||
5.014% (1 Month LIBOR + 4.25%), due 12/1/25 (b) | 8,071,281 | 8,055,139 |
MKS Instruments, Inc. | ||
Term Loan B | ||
TBD, due 4/11/29 | 13,390,000 | 13,331,419 |
Tranche Term Loan B6 | ||
2.207% (1 Month LIBOR + 1.75%), due 2/2/26 (b) | 1,263,823 | 1,250,237 |
TruGreen LP | ||
First Lien Second Refinancing Term Loan | ||
4.764% (1 Month LIBOR + 4.00%), due 11/2/27 (b) | 7,930,478 | 7,888,352 |
Verint Systems, Inc. | ||
Refinancing Term Loan | ||
2.455% (1 Month LIBOR + 2.00%), due 6/28/24 (b) | 705,882 | 700,588 |
Verscend Holding Corp. | ||
Term Loan B1 | ||
4.457% (1 Month LIBOR + 4.00%), due 8/27/25 (b) | 8,085,107 | 8,052,265 |
67,683,342 | ||
Principal Amount | Value | |
Ecological 0.4% | ||
GFL Environmental, Inc. | ||
2020 Refinancing Term Loan | ||
4.239% (3 Month LIBOR + 3.00%), due 5/30/25 (b) | $ 10,406,360 | $ 10,376,442 |
Electronics 7.4% | ||
Avast Software BV | ||
Initial Dollar Term Loan | ||
2.756% (3 Month LIBOR + 1.75%), due 3/22/28 (b) | 760,000 | 752,875 |
Barracuda Networks, Inc. | ||
First Lien 2020 Term Loan | ||
4.733% (3 Month LIBOR + 3.75%), due 2/12/25 (b) | 3,904,250 | 3,895,302 |
Camelot U.S. Acquisition 1 Co. (b) | ||
Initial Term Loan | ||
3.764% (1 Month LIBOR + 3.00%), due 10/30/26 | 3,218,033 | 3,181,830 |
Amendment No. 2 Incremental Term Loan | ||
4.00% (1 Month LIBOR + 3.00%), due 10/30/26 | 7,159,375 | 7,094,941 |
Castle U.S. Holding Corp. (b) | ||
Initial Dollar Term Loan | ||
4.514% (1 Month LIBOR + 3.75%), due 1/29/27 | 2,271,961 | 2,173,510 |
Dollar Term Loan B2 | ||
4.764% (1 Month LIBOR + 4.00%), due 1/29/27 | 4,958,333 | 4,743,474 |
Commscope, Inc. | ||
Initial Term Loan | ||
4.014% (1 Month LIBOR + 3.25%), due 4/6/26 (b) | 10,244,692 | 9,838,101 |
CoreLogic, Inc. | ||
First Lien Initial Term Loan | ||
4.313% (1 Month LIBOR + 3.50%), due 6/2/28 (b) | 10,530,417 | 9,872,266 |
DCert Buyer, Inc. | ||
First Lien Initial Term Loan | ||
4.764% (1 Month LIBOR + 4.00%), due 10/16/26 (b) | 5,430,956 | 5,406,066 |
Diebold Nixdorf, Inc. | ||
New Dollar Term Loan B | ||
3.25% (1 Month LIBOR + 2.75%), due 11/6/23 (b) | 935,805 | 889,015 |
ECi Macola/MAX Holding LLC | ||
First Lien Initial Term Loan | ||
4.756% (3 Month LIBOR + 3.75%), due 11/9/27 (b) | 3,456,250 | 3,440,410 |
Principal Amount | Value | |
Loan Assignments (continued) | ||
Electronics (continued) | ||
Epicor Software Corp. | ||
Term Loan C | ||
4.014% (1 Month LIBOR + 3.25%), due 7/30/27 (b) | $ 9,722,295 | $ 9,658,731 |
Flexera Software LLC | ||
First Lien Term Loan B1 | ||
4.50% (3 Month LIBOR + 3.75%), due 3/3/28 (b) | 5,258,976 | 5,209,205 |
Gainwell Acquisition Corp. | ||
First Lien Term Loan B | ||
5.006% (3 Month LIBOR + 4.00%), due 10/1/27 (b) | 8,618,132 | 8,582,220 |
Generation Bridge LLC (b) | ||
Term Loan B | ||
6.006% (3 Month LIBOR + 5.00%), due 12/1/28 | 3,420,000 | 3,424,275 |
Term Loan C | ||
6.006% (3 Month LIBOR + 5.00%), due 12/1/28 (d) | 71,429 | 71,518 |
Go Daddy Operating Co. LLC | ||
Tranche Term Loan B2 | ||
2.514% (1 Month LIBOR + 1.75%), due 2/15/24 (b) | 2,162,934 | 2,145,630 |
Helios Software Holdings, Inc. | ||
2021 Initial Dollar Term Loan | ||
4.623% (3 Month LIBOR + 3.75%), due 3/11/28 (b) | 2,239,121 | 2,220,088 |
Hyland Software, Inc. (b) | ||
First Lien 2018 Refinancing Term Loan | ||
4.264% (1 Month LIBOR + 3.50%), due 7/1/24 | 7,378,312 | 7,348,341 |
Second Lien 2021 Refinancing Term Loan | ||
7.014% (1 Month LIBOR + 6.25%), due 7/7/25 | 1,996,667 | 1,982,690 |
ION Trading Finance Ltd. | ||
2021 Initial Dollar Term Loan | ||
5.514% (1 Month LIBOR + 4.75%), due 4/1/28 (b) | 3,970,000 | 3,942,087 |
MA FinanceCo. LLC | ||
Tranche Term Loan B4 | ||
5.25% (3 Month LIBOR + 4.25%), due 6/5/25 (b)(d) | 2,446,021 | 2,429,205 |
MH Sub I LLC (b) | ||
First Lien Amendment No. 2 Initial Term Loan | ||
4.264% (1 Month LIBOR + 3.50%), due 9/13/24 | 4,057,732 | 4,028,748 |
Principal Amount | Value | |
Electronics (continued) | ||
MH Sub I LLC (b) (continued) | ||
First Lien 2020 June New Term Loan | ||
4.75% (1 Month LIBOR + 3.75%), due 9/13/24 | $ 8,314,698 | $ 8,261,576 |
Misys Ltd. (b) | ||
First Lien Dollar Term Loan | ||
4.739% (3 Month LIBOR + 3.50%), due 6/13/24 | 8,013,748 | 7,773,336 |
Second Lien Dollar Term Loan | ||
8.25% (3 Month LIBOR + 7.25%), due 6/13/25 | 1,450,000 | 1,393,812 |
Project Alpha Intermediate Holding, Inc. | ||
2021 Refinancing Term Loan | ||
4.77% (1 Month LIBOR + 4.00%), due 4/26/24 (b) | 7,238,206 | 7,220,110 |
Project Leopard Holdings, Inc. | ||
2018 Repricing Term Loan | ||
5.75% (3 Month LIBOR + 4.75%), due 7/5/24 (b) | 1,910,961 | 1,903,794 |
Proofpoint, Inc. | ||
First Lien Initial Term Loan | ||
3.758% (3 Month LIBOR + 3.25%), due 8/31/28 (b) | 9,576,000 | 9,415,066 |
Rocket Software, Inc. (b) | ||
First Lien Initial Term Loan | ||
5.014% (1 Month LIBOR + 4.25%), due 11/28/25 | 4,026,744 | 3,980,186 |
First Lien 2021 Dollar Term Loan | ||
5.014% (1 Month LIBOR + 4.25%), due 11/28/25 | 2,233,125 | 2,208,699 |
Seattle SpinCo, Inc. | ||
Initial Term Loan | ||
3.514% (1 Month LIBOR + 2.75%), due 6/21/24 (b) | 1,494,808 | 1,476,123 |
Sharp Midco LLC | ||
First Lien Initial Term Loan | ||
5.006% (3 Month LIBOR + 4.00%), due 12/31/28 (b) | 6,200,000 | 6,122,500 |
SS&C Technologies Holdings, Inc. (b) | ||
Term Loan B3 | ||
2.514% (1 Month LIBOR + 1.75%), due 4/16/25 | 3,375,498 | 3,323,056 |
Term Loan B4 | ||
2.514% (1 Month LIBOR + 1.75%), due 4/16/25 | 2,740,159 | 2,697,588 |
Term Loan B6 | ||
3.05% (1 Month LIBOR + 2.25%), due 3/22/29 | 3,186,274 | 3,159,988 |
22 | MainStay Floating Rate Fund |
Principal Amount | Value | |
Loan Assignments (continued) | ||
Electronics (continued) | ||
SS&C Technologies Holdings, Inc. (b) (continued) | ||
Term Loan B7 | ||
3.05% (1 Month LIBOR + 2.25%), due 3/22/29 | $ 4,254,902 | $ 4,219,799 |
Surf Holdings SARL | ||
First Lien Dollar Tranche Term Loan | ||
4.11% (3 Month LIBOR + 3.50%), due 3/5/27 (b) | 3,003,066 | 2,969,282 |
ThoughtWorks, Inc. | ||
Incremental Term Loan | ||
3.514% (1 Month LIBOR + 2.75%), due 3/24/28 (b) | 1,704,671 | 1,688,690 |
TIBCO Software, Inc. (b) | ||
Term Loan B3 | ||
4.52% (1 Month LIBOR + 3.75%), due 6/30/26 | 8,898,183 | 8,861,104 |
Second Lien Term Loan | ||
8.02% (1 Month LIBOR + 7.25%), due 3/3/28 | 600,000 | 597,750 |
Trader Corp. | ||
First Lien 2017 Refinancing Term Loan | ||
4.00% (1 Month LIBOR + 3.00%), due 9/28/23 (b) | 9,034,981 | 8,989,806 |
Vertiv Group Corp. | ||
Term Loan B | ||
3.202% (1 Month LIBOR + 2.75%), due 3/2/27 (b) | 7,897,731 | 7,674,904 |
VS Buyer LLC | ||
Initial Term Loan | ||
3.764% (1 Month LIBOR + 3.00%), due 2/28/27 (b) | 1,470,000 | 1,453,921 |
WEX, Inc. | ||
Term Loan B | ||
3.014% (1 Month LIBOR + 2.25%), due 3/31/28 (b) | 3,960,000 | 3,919,410 |
201,641,028 | ||
Energy (Electricity) 0.2% | ||
Covanta Holding Corp. (b) | ||
Initial Term Loan B | ||
3.264% (1 Month LIBOR + 2.50%), due 11/30/28 | 4,093,380 | 4,070,993 |
Initial Term Loan C | ||
3.264% (1 Month LIBOR + 2.50%), due 11/30/28 | 306,620 | 304,943 |
4,375,936 | ||
Principal Amount | Value | |
Entertainment 1.1% | ||
Alterra Mountain Co. | ||
Term Loan B2 | ||
4.264% (1 Month LIBOR + 3.50%), due 8/17/28 (b) | $ 4,815,423 | $ 4,785,327 |
Fertitta Entertainment LLC | ||
Initial Term Loan B | ||
4.70% (1 Month LIBOR + 4.00%), due 1/27/29 (b) | 13,250,000 | 13,177,721 |
Formula One Management Ltd. | ||
USD Facility Term Loan B3 | ||
3.50% (1 Month LIBOR + 2.50%), due 2/1/24 (b) | 3,650,036 | 3,628,935 |
J&J Ventures Gaming LLC | ||
Initial Term Loan | ||
4.764% (1 Month LIBOR + 4.00%), due 4/26/28 (b) | 7,462,500 | 7,331,906 |
28,923,889 | ||
Finance 6.3% | ||
AAdvantage Loyality IP Ltd. | ||
Initial Term Loan | ||
5.813% (3 Month LIBOR + 4.75%), due 4/20/28 (b) | 11,200,000 | 11,389,000 |
Acuity Specialty Products, Inc. | ||
First Lien Initial Term Loan | ||
5.00% (3 Month LIBOR + 4.00%), due 8/12/24 (b)(d)(e) | 2,178,257 | 1,960,432 |
Acuris Finance U.S., Inc. | ||
Initial Dollar Term Loan | ||
4.80% (1 Month LIBOR + 4.00%), due 2/16/28 (b) | 7,147,135 | 7,103,459 |
ADMI Corp. (b) | ||
Amendment No.4 Refinancing Term Loan | ||
4.139% (1 Month LIBOR + 3.375%), due 12/23/27 | 2,475,000 | 2,435,665 |
Amendment No. 5 Incremental Term Loan | ||
4.264% (1 Month LIBOR + 3.50%), due 12/23/27 | 3,731,250 | 3,687,718 |
AlixPartners LLP | ||
Initial Dollar Term Loan | ||
3.25% (1 Month LIBOR + 2.75%), due 2/4/28 (b) | 6,930,000 | 6,851,074 |
Blue Tree Holdings, Inc. | ||
Term Loan | ||
3.50% (3 Month LIBOR + 2.50%), due 3/4/28 (b) | 1,485,000 | 1,462,725 |
Principal Amount | Value | |
Loan Assignments (continued) | ||
Finance (continued) | ||
Boxer Parent Co., Inc. | ||
2021 Replacement Dollar Term Loan | ||
4.514% (1 Month LIBOR + 3.75%), due 10/2/25 (b) | $ 3,920,718 | $ 3,867,299 |
Brand Energy & Infrastructure Services, Inc. | ||
Initial Term Loan 5.25%-5.434% | ||
(3 Month LIBOR + 4.25%), due 6/21/24 (b) | 6,487,957 | 6,136,523 |
Colouroz Investment LLC (b)(d)(f) | ||
1 GMBH First Lien Initial Term Loan C | ||
5.25% (0.75% PIK) (2 Month LIBOR + 4.25%, 3 Month LIBOR + 4.25%), due 9/21/23 | 235,828 | 226,057 |
2 GMBH First Lien Initial Term Loan B2 | ||
5.25% (0.75% PIK) (2 Month LIBOR + 4.25%, 3 Month LIBOR + 4.25%), due 9/21/23 | 1,426,563 | 1,367,461 |
Covia Holdings LLC | ||
Initial Term Loan | ||
5.00% (3 Month LIBOR + 4.00%), due 7/31/26 (b) | 837,917 | 822,380 |
CPC Acquisition Corp. | ||
First Lien Initial Term Loan | ||
4.756% (3 Month LIBOR + 3.75%), due 12/29/27 (b) | 6,435,000 | 6,081,075 |
Deerfield Dakota Holding LLC | ||
First Lien Initial Dollar Term Loan | ||
4.75% (1 Month LIBOR + 3.75%), due 4/9/27 (b) | 8,918,423 | 8,886,575 |
Endurance International Group Holdings, Inc. | ||
Initial Term Loan | ||
4.25% (3 Month LIBOR + 3.50%), due 2/10/28 (b) | 7,713,943 | 7,360,389 |
Greenrock Finance, Inc. | ||
First Lien Initial USD Term Loan B | ||
4.506% (3 Month LIBOR + 3.50%), due 6/28/24 (b)(d) | 1,895,542 | 1,885,590 |
LBM Acquisition LLC | ||
First Lien Initial Term Loan | ||
4.50% (1 Month LIBOR + 3.75%), due 12/17/27 (b) | 6,554,671 | 6,171,223 |
LSF11 Skyscraper Holdco SARL | ||
USD Facility Term Loan B3 | ||
4.506% (3 Month LIBOR + 3.50%), due 9/29/27 (b) | 6,138,232 | 6,084,523 |
Principal Amount | Value | |
Finance (continued) | ||
Minimax Viking GmbH | ||
Facility Term Loan B1C | ||
3.264% (1 Month LIBOR + 2.50%), due 7/31/25 (b) | $ 4,106,951 | $ 4,083,849 |
ON Semiconductor Corp. | ||
2019 New Replacement Term Loan B4 | ||
2.764% (1 Month LIBOR + 2.00%), due 9/19/26 (b) | 482,613 | 480,501 |
Onex TSG Intermediate Corp. | ||
Initial Term Loan | ||
5.514% (1 Month LIBOR + 4.75%), due 2/28/28 (b) | 3,970,000 | 3,927,819 |
Park River Holdings, Inc. | ||
First Lien Initial Term Loan | ||
4.217% (3 Month LIBOR + 3.25%), due 12/28/27 (b) | 7,614,885 | 7,205,585 |
Peraton Corp. | ||
First Lien Term Loan B | ||
4.514% (1 Month LIBOR + 3.75%), due 2/1/28 (b) | 10,061,364 | 9,973,327 |
Pluto Acquisition I, Inc. | ||
First Lien 2021 Term Loan | ||
4.508% (3 Month LIBOR + 4.00%), due 6/22/26 (b) | 7,344,500 | 7,215,971 |
PODS LLC | ||
Initial Term Loan | ||
3.75% (3 Month LIBOR + 3.00%), due 3/31/28 (b) | 8,422,675 | 8,320,020 |
Potters Industries LLC | ||
Initial Term Loan | ||
5.006% (3 Month LIBOR + 4.00%), due 12/14/27 (b) | 1,188,000 | 1,177,605 |
RealPage, Inc. | ||
First Lien Initial Term Loan | ||
3.75% (1 Month LIBOR + 3.25%), due 4/24/28 (b) | 6,374,123 | 6,272,137 |
Spa Holdings 3 Oy | ||
USD Facility Term Loan B | ||
4.50% (3 Month LIBOR + 3.75%), due 2/4/28 (b) | 3,168,120 | 3,057,236 |
Triton Water Holdings, Inc. | ||
First Lien Initial Term Loan | ||
4.506% (3 Month LIBOR + 3.50%), due 3/31/28 (b) | 9,885,305 | 9,599,047 |
Truck Hero, Inc. | ||
Initial Term Loan | ||
4.014% (1 Month LIBOR + 3.25%), due 1/31/28 (b) | 5,974,762 | 5,560,263 |
24 | MainStay Floating Rate Fund |
Principal Amount | Value | |
Loan Assignments (continued) | ||
Finance (continued) | ||
WCG Purchaser Corp. | ||
First Lien Initial Term Loan | ||
5.006% (3 Month LIBOR + 4.00%), due 1/8/27 (b) | $ 7,524,988 | $ 7,496,769 |
WildBrain Ltd. | ||
Initial Term Loan | ||
5.014% (1 Month LIBOR + 4.25%), due 3/24/28 (b) | 7,563,600 | 7,464,328 |
WIN Waste Innovations Holdings, Inc. | ||
Initial Term Loan | ||
3.756% (3 Month LIBOR + 2.75%), due 3/24/28 (b) | 7,900,300 | 7,801,546 |
173,415,171 | ||
Healthcare 2.4% | ||
AHP Health Partners, Inc. | ||
Initial Term Loan | ||
4.264% (1 Month LIBOR + 3.50%), due 8/24/28 (b) | 1,990,000 | 1,976,319 |
Chariot Buyer LLC | ||
First Lien Initial Term Loan | ||
4.506% (3 Month LIBOR + 3.50%), due 11/3/28 (b) | 11,172,000 | 10,962,525 |
CHG Healthcare Services, Inc. | ||
First Lien Initial Term Loan 4.506%-5.00% | ||
(3 Month LIBOR + 3.50%), due 9/29/28 (b) | 6,176,481 | 6,132,474 |
ICU Medical, Inc. | ||
Tranche Term Loan B | ||
3.198% (3 Month LIBOR + 2.50%), due 1/8/29 (b) | 7,400,000 | 7,372,250 |
LSCS Holdings, Inc. | ||
First Lien Initial Term Loan | ||
5.264% (1 Month LIBOR + 4.50%), due 12/16/28 (b) | 4,788,000 | 4,748,102 |
Medical Solutions Holdings, Inc. | ||
First Lien Initial Term Loan | ||
4.00% (3 Month LIBOR + 3.50%), due 11/1/28 (b) | 1,728,000 | 1,712,520 |
Medline Borrower LP | ||
Initial Dollar Term Loan | ||
4.014% (1 Month LIBOR + 3.25%), due 10/23/28 (b) | 16,400,000 | 16,111,130 |
U.S. Anesthesia Partners, Inc. | ||
First Lien Initial Term Loan | ||
4.75% (1 Month LIBOR + 4.25%), due 10/1/28 (b) | 6,467,500 | 6,382,038 |
Principal Amount | Value | |
Healthcare (continued) | ||
WP CityMD Bidco LLC | ||
Second Amendment Refinancing Term Loan | ||
3.75% (3 Month LIBOR + 3.25%), due 12/22/28 (b) | $ 9,333,334 | $ 9,216,667 |
64,614,025 | ||
Healthcare & Pharmaceuticals 1.6% | ||
Bausch Health Cos., Inc. | ||
Term Loan B | ||
TBD, due 1/27/27 | 9,000,000 | 8,704,692 |
Initial Term Loan | ||
3.457% (1 Month LIBOR + 3.00%), due 6/2/25 (b) | 8,307,462 | 8,259,005 |
Embecta Corp. | ||
First Lien Initial Term Loan | ||
3.651% (3 Month LIBOR + 3.00%), due 3/30/29 (b) | 6,423,913 | 6,346,826 |
Owens & Minor, Inc. | ||
Term Loan B1 | ||
4.45% (1 Month LIBOR + 3.75%), due 3/29/29 (b) | 4,000,000 | 4,007,500 |
Pediatric Associates Holding Co. LLC (b) | ||
Amendment No. 1 Incremental Delayed Draw Term Loan 1.625%-4.924% | ||
(1 Year LIBOR + 3.25%), due 12/29/28 (d) | 386,842 | 382,248 |
Amendment No. 1 Incremental Term Loan | ||
5.076% (3 Month LIBOR + 3.25%), due 12/29/28 | 7,294,737 | 7,208,112 |
Physician Partners LLC | ||
Initial Term Loan | ||
4.70% (1 Month LIBOR + 4.00%), due 12/23/28 (b) | 5,625,000 | 5,564,064 |
Team Health Holdings, Inc. | ||
Extended Term Loan | ||
6.25% (1 Month LIBOR + 5.25%), due 3/2/27 (b) | 2,447,825 | 2,300,955 |
42,773,402 | ||
Healthcare, Education & Childcare 5.9% | ||
Agiliti Health, Inc. | ||
Initial Term Loan | ||
3.25% (1 Month LIBOR + 2.75%), due 1/4/26 (b) | 5,037,000 | 4,986,630 |
Akorn Operating Co. LLC | ||
Term Loan | ||
8.50% (3 Month LIBOR + 7.50%), due 10/1/25 (b) | 108,868 | 108,052 |
Principal Amount | Value | |
Loan Assignments (continued) | ||
Healthcare, Education & Childcare (continued) | ||
Alvogen Pharma U.S., Inc. | ||
January 2020 Term Loan | ||
6.26% (3 Month LIBOR + 5.25%), due 12/31/23 (b) | $ 908,054 | $ 845,399 |
Amneal Pharmaceuticals LLC | ||
Initial Term Loan | ||
4.313% (1 Month LIBOR + 3.50%), due 5/4/25 (b) | 11,018,978 | 10,872,977 |
athenahealth Group, Inc. | ||
Initial Term Loan | ||
4.009% (1 Month LIBOR + 3.50%), due 2/15/29 (b) | 14,963,768 | 14,784,203 |
Auris Luxembourg III SARL | ||
Facility Term Loan B2 4.755%-5.576% | ||
(2 Month LIBOR + 3.75%, 6 Month LIBOR + 3.75%), due 2/27/26 (b) | 1,369,889 | 1,337,011 |
Avantor Funding, Inc. | ||
Initial Dollar Term Loan B4 | ||
2.764% (1 Month LIBOR + 2.00%), due 11/21/24 (b) | 450,936 | 448,869 |
Carestream Dental Technology Parent Ltd. (b) | ||
First Lien Initial Term Loan | ||
4.256% (3 Month LIBOR + 3.25%), due 9/1/24 | 1,382,762 | 1,355,106 |
First Lien Tranche Term Loan B | ||
5.264% (1 Month LIBOR + 4.50%), due 9/1/24 | 1,834,678 | 1,807,158 |
Carestream Health, Inc. (b) | ||
First Lien 2023 Extended Term Loan | ||
7.756% (3 Month LIBOR + 6.75%), due 5/8/23 | 2,573,385 | 2,550,225 |
Second Lien 2023 Extended Term Loan | ||
13.506% (8.00% PIK) (3 Month LIBOR + 4.50%), due 8/8/23 (f) | 2,366,564 | 2,011,579 |
DaVita, Inc. | ||
Tranche Term Loan B1 | ||
2.514% (1 Month LIBOR + 1.75%), due 8/12/26 (b) | 1,607,250 | 1,583,296 |
Ecovyst Catalyst Technologies LLC | ||
Initial Term Loan | ||
3.739% (3 Month LIBOR + 2.50%), due 6/9/28 (b) | 5,548,075 | 5,490,863 |
Principal Amount | Value | |
Healthcare, Education & Childcare (continued) | ||
Elanco Animal Health, Inc. | ||
Term Loan | ||
2.205% (1 Month LIBOR + 1.75%), due 8/1/27 (b) | $ 2,739,122 | $ 2,682,628 |
Endo Luxembourg Finance Co. I SARL | ||
2021 Term Loan | ||
5.813% (1 Month LIBOR + 5.00%), due 3/27/28 (b) | 3,461,278 | 3,188,703 |
Envision Healthcare Corp. | ||
Initial Term Loan | ||
4.514% (1 Month LIBOR + 3.75%), due 10/10/25 (b)(g)(h) | 5,245,066 | 3,182,008 |
eResearchTechnology, Inc. | ||
First Lien Initial Term Loan | ||
5.50% (1 Month LIBOR + 4.50%), due 2/4/27 (b) | 7,926,347 | 7,896,623 |
FC Compassus LLC | ||
Term Loan B1 | ||
5.00% (1 Month LIBOR + 4.25%), due 12/31/26 (b)(d) | 6,376,164 | 6,262,592 |
Grifols Worldwide Operations Ltd. | ||
Dollar Tranche Term Loan B | ||
2.457% (1 Month LIBOR + 2.00%), due 11/15/27 (b) | 3,730,270 | 3,641,210 |
HCA, Inc. | ||
Tranche Term Loan B | ||
2.514% (1 Month LIBOR + 1.75%), due 6/30/28 (b) | 1,389,500 | 1,384,869 |
Horizon Therapeutics USA, Inc. | ||
Incremental Term Loan B2 | ||
2.438% (1 Month LIBOR + 1.75%), due 3/15/28 (b) | 2,640,000 | 2,601,501 |
Insulet Corp. | ||
Term Loan B | ||
4.014% (1 Month LIBOR + 3.25%), due 5/4/28 (b) | 7,558,000 | 7,548,552 |
Journey Personal Care Corp. | ||
Initial Term Loan | ||
5.256% (3 Month LIBOR + 4.25%), due 3/1/28 (b) | 4,962,500 | 4,639,937 |
LifePoint Health, Inc. | ||
First Lien Term Loan B | ||
4.499% (1 Month LIBOR + 3.75%), due 11/16/25 (b) | 4,642,116 | 4,582,348 |
Mallinckrodt International Finance SA | ||
2017 Term Loan B | ||
6.246% (3 Month LIBOR + 5.25%), due 9/24/24 (b)(g)(h) | 1,986,817 | 1,846,747 |
26 | MainStay Floating Rate Fund |
Principal Amount | Value | |
Loan Assignments (continued) | ||
Healthcare, Education & Childcare (continued) | ||
National Mentor Holdings, Inc. (b) | ||
First Lien Initial Term Loan 4.52%-4.76% | ||
(1 Month LIBOR + 3.75%, 3 Month LIBOR + 3.75%), due 3/2/28 | $ 8,064,079 | $ 7,731,435 |
First Lien Initial Term Loan C | ||
4.76% (3 Month LIBOR + 3.75%), due 3/2/28 | 245,454 | 235,329 |
Organon & Co. | ||
Dollar Term Loan | ||
3.563% (3 Month LIBOR + 3.00%), due 6/2/28 (b) | 8,436,458 | 8,386,363 |
Ortho-Clinical Diagnostics, Inc. | ||
Second Amendment New Term Loan | ||
3.452% (1 Month LIBOR + 3.00%), due 6/30/25 (b) | 5,606,177 | 5,589,532 |
Petco Health and Wellness Co., Inc. | ||
First Lien Initial Term Loan | ||
4.256% (3 Month LIBOR + 3.25%), due 3/3/28 (b) | 8,437,443 | 8,359,093 |
Raptor Acquisition Corp. | ||
First Lien Term Loan B | ||
4.934% (3 Month LIBOR + 4.00%), due 11/1/26 (b) | 4,250,000 | 4,225,210 |
Select Medical Corp. | ||
Tranche Term Loan B | ||
3.02% (1 Month LIBOR + 2.25%), due 3/6/25 (b) | 7,354,845 | 7,283,591 |
Sound Inpatient Physicians, Inc. | ||
First Lien Initial Term Loan | ||
3.514% (1 Month LIBOR + 2.75%), due 6/27/25 (b)(d) | 1,925,000 | 1,903,344 |
Sunshine Luxembourg VII SARL | ||
Facility Term Loan B3 | ||
4.756% (3 Month LIBOR + 3.75%), due 10/1/26 (b) | 18,745,843 | 18,574,000 |
159,926,983 | ||
High Tech Industries 1.5% | ||
Altar Bidco, Inc. | ||
First Lien Initial Term Loan | ||
3.85% (1 Month LIBOR + 3.35%), due 2/1/29 (b) | 5,625,000 | 5,537,109 |
AP Gaming I LLC | ||
Term Loan B | ||
4.801% (3 Month LIBOR + 4.00%), due 2/15/29 (b) | 5,833,333 | 5,760,417 |
Principal Amount | Value | |
High Tech Industries (continued) | ||
NAB Holdings LLC | ||
Initial Term Loan | ||
3.801% (3 Month LIBOR + 3.00%), due 11/23/28 (b) | $ 8,478,750 | $ 8,363,931 |
Scientific Games Holdings LP | ||
First Lien Initial Dollar Term Loan | ||
4.175% (3 Month LIBOR + 3.50%), due 4/4/29 (b) | 9,346,154 | 9,242,683 |
Trans Union LLC | ||
2021 Incremental Term Loan B6 | ||
3.014% (1 Month LIBOR + 2.25%), due 12/1/28 (b) | 11,633,213 | 11,499,698 |
40,403,838 | ||
Home and Office Furnishings, Housewares & Durable Consumer Products 0.1% | ||
Serta Simmons Bedding LLC | ||
First Lien Initial Term Loan 4.563%-4.714% | ||
(3 Month LIBOR + 3.50%), due 11/8/23 (b) | 4,308,927 | 1,852,839 |
Hotels, Motels, Inns & Gaming 3.8% | ||
Aimbridge Acquisition Co., Inc. | ||
First Lien 2019 Initial Term Loan | ||
4.514% (1 Month LIBOR + 3.75%), due 2/2/26 (b) | 8,153,115 | 7,772,633 |
Caesars Resort Collection LLC (b) | ||
Term Loan B | ||
3.514% (1 Month LIBOR + 2.75%), due 12/23/24 | 9,513,356 | 9,462,545 |
Term Loan B1 | ||
4.264% (1 Month LIBOR + 3.50%), due 7/21/25 | 6,920,750 | 6,899,123 |
Churchill Downs, Inc. | ||
Facility Term Loan B | ||
2.77% (1 Month LIBOR + 2.00%), due 12/27/24 (b) | 2,393,750 | 2,375,797 |
Entain plc | ||
USD Facility Term Loan B | ||
3.743% (6 Month LIBOR + 2.25%), due 3/29/27 (b) | 6,805,714 | 6,748,287 |
Everi Holdings, Inc. | ||
Term Loan B | ||
3.008% (3 Month LIBOR + 2.50%), due 8/3/28 (b) | 4,111,034 | 4,076,091 |
Principal Amount | Value | |
Loan Assignments (continued) | ||
Hotels, Motels, Inns & Gaming (continued) | ||
Four Seasons Holdings, Inc. | ||
First Lien 2013 Term Loan | ||
2.764% (1 Month LIBOR + 2.00%), due 11/30/23 (b) | $ 1,410,900 | $ 1,406,491 |
Golden Entertainment, Inc. | ||
First Lien Facility Term Loan B | ||
3.77% (1 Month LIBOR + 3.00%), due 10/21/24 (b) | 1,295,337 | 1,289,670 |
Hilton Worldwide Finance LLC | ||
Refinanced Term Loan B2 | ||
2.418% (1 Month LIBOR + 1.75%), due 6/22/26 (b) | 1,720,157 | 1,697,848 |
Oceankey U.S. II Corp. | ||
Initial Term Loan | ||
4.264% (1 Month LIBOR + 3.50%), due 12/15/28 (b) | 6,133,333 | 6,072,000 |
PCI Gaming Authority | ||
Facility Term Loan B | ||
3.264% (1 Month LIBOR + 2.50%), due 5/29/26 (b) | 3,370,300 | 3,346,074 |
Penn National Gaming, Inc. | ||
Term Loan B | ||
TBD, due 4/21/29 | 2,000,000 | 1,990,834 |
Facility Term Loan B1 | ||
3.014% (1 Month LIBOR + 2.25%), due 10/15/25 (b) | 2,386,363 | 2,379,311 |
Scientific Games International, Inc. | ||
Initial Term Loan B | ||
3.573% (1 Month LIBOR + 3.00%), due 4/14/29 (b) | 15,000,000 | 14,854,680 |
Station Casinos LLC | ||
Facility Term Loan B1 | ||
3.02% (1 Month LIBOR + 2.25%), due 2/8/27 (b) | 6,920,281 | 6,832,048 |
Travel + Leisure Co. | ||
Term Loan B | ||
3.014% (1 Month LIBOR + 2.25%), due 5/30/25 (b) | 3,860,000 | 3,777,975 |
UFC Holdings LLC | ||
First Lien Term Loan B3 | ||
3.50% (3 Month LIBOR + 2.75%), due 4/29/26 (b) | 9,713,071 | 9,562,169 |
Whatabrands LLC | ||
Initial Term Loan B | ||
4.014% (1 Month LIBOR + 3.25%), due 8/3/28 (b) | 9,975,000 | 9,856,547 |
Principal Amount | Value | |
Hotels, Motels, Inns & Gaming (continued) | ||
Wyndham Hotels & Resorts, Inc. | ||
Term Loan B | ||
2.514% (1 Month LIBOR + 1.75%), due 5/30/25 (b) | $ 2,502,500 | $ 2,479,907 |
102,880,030 | ||
Insurance 3.6% | ||
Acrisure LLC (b) | ||
First Lien 2020 Term Loan | ||
4.264% (1 Month LIBOR + 3.50%), due 2/15/27 | 6,867,456 | 6,757,288 |
First Lien 2021-2 Additional Term Loan | ||
5.014% (1 Month LIBOR + 4.25%), due 2/15/27 | 4,937,625 | 4,902,652 |
Alliant Holdings Intermediate LLC | ||
New Term Loan B4 | ||
4.051% (1 Month LIBOR + 3.50%), due 11/5/27 (b) | 3,980,000 | 3,950,647 |
AmWINS Group, Inc. | ||
Term Loan 3.00%-3.014% | ||
(1 Month LIBOR + 2.25%), due 2/19/28 (b) | 8,932,295 | 8,768,003 |
AssuredPartners Capital, Inc. | ||
2022 Term Loan | ||
4.70% (1 Month LIBOR + 3.50%), due 2/12/27 (b) | 3,000,000 | 2,951,250 |
AssuredPartners, Inc. | ||
2020 February Refinancing Term Loan | ||
4.264% (1 Month LIBOR + 3.50%), due 2/12/27 (b) | 4,959,925 | 4,885,526 |
Asurion LLC (b) | ||
New Term Loan B7 | ||
3.764% (1 Month LIBOR + 3.00%), due 11/3/24 | 793,910 | 785,773 |
Replacement Term Loan B6 | ||
3.889% (1 Month LIBOR + 3.125%), due 11/3/23 | 1,872,593 | 1,863,619 |
New Term Loan B8 | ||
4.014% (1 Month LIBOR + 3.25%), due 12/23/26 | 1,975,000 | 1,928,917 |
New Term Loan B9 | ||
4.014% (1 Month LIBOR + 3.25%), due 7/31/27 | 1,980,000 | 1,932,975 |
Second Lien New Term Loan B3 | ||
6.014% (1 Month LIBOR + 5.25%), due 1/31/28 | 8,200,000 | 7,960,831 |
28 | MainStay Floating Rate Fund |
Principal Amount | Value | |
Loan Assignments (continued) | ||
Insurance (continued) | ||
Asurion LLC (b) (continued) | ||
Second Lien New Term Loan B4 | ||
6.014% (1 Month LIBOR + 5.25%), due 1/20/29 | $ 10,500,000 | $ 10,168,599 |
Broadstreet Partners, Inc. (b) | ||
2020 Initial Term Loan | ||
3.764% (1 Month LIBOR + 3.00%), due 1/27/27 | 5,283,736 | 5,201,178 |
Tranche Term Loan B2 | ||
4.014% (1 Month LIBOR + 3.25%), due 1/27/27 | 1,160,833 | 1,147,290 |
Hub International Ltd. (b) | ||
Initial Term Loan 3.996%-4.214% | ||
(2 Month LIBOR + 3.00%, 3 Month LIBOR + 3.00%), due 4/25/25 | 1,577,015 | 1,558,682 |
Incremental Term Loan B3 4.18%-4.348% | ||
(2 Month LIBOR + 3.25%, 3 Month LIBOR + 3.25%), due 4/25/25 | 9,914,711 | 9,856,561 |
NFP Corp. | ||
Closing Date Term Loan | ||
4.014% (1 Month LIBOR + 3.25%), due 2/15/27 (b) | 3,363,906 | 3,300,832 |
Ryan Specialty Group LLC | ||
Initial Term Loan | ||
3.75% (1 Month LIBOR + 3.00%), due 9/1/27 (b) | 3,977,405 | 3,964,976 |
Sedgwick Claims Management Services, Inc. (b) | ||
Initial Term Loan | ||
4.014% (1 Month LIBOR + 3.25%), due 12/31/25 | 6,825,034 | 6,751,099 |
2019 Term Loan | ||
4.514% (1 Month LIBOR + 3.75%), due 9/3/26 | 2,961,929 | 2,945,730 |
USI, Inc. (b) | ||
2017 New Term Loan | ||
4.006% (3 Month LIBOR + 3.00%), due 5/16/24 | 7,279,923 | 7,207,124 |
2021 New Term Loan | ||
4.256% (3 Month LIBOR + 3.25%), due 12/2/26 | 977,520 | 967,745 |
99,757,297 | ||
Principal Amount | Value | |
Leisure, Amusement, Motion Pictures & Entertainment 0.7% | ||
Bombardier Recreational Products, Inc. | ||
2020 Replacement Term Loan | ||
2.488% (1 Month LIBOR + 2.00%), due 5/24/27 (b) | $ 4,241,660 | $ 4,162,129 |
Creative Artists Agency LLC | ||
Closing Date Term Loan | ||
4.514% (1 Month LIBOR + 3.75%), due 11/27/26 (b) | 2,443,750 | 2,431,913 |
Fitness International LLC (b) | ||
Term Loan A | ||
4.256% (3 Month LIBOR + 3.25%), due 1/8/25 | 1,530,938 | 1,416,117 |
Term Loan B | ||
4.256% (3 Month LIBOR + 3.25%), due 4/18/25 | 291,959 | 271,157 |
Lions Gate Capital Holdings LLC | ||
Term Loan B | ||
3.014% (1 Month LIBOR + 2.25%), due 3/24/25 (b) | 1,352,464 | 1,337,812 |
Marriott Ownership Resorts, Inc. | ||
2019 Refinancing Term Loan | ||
2.514% (1 Month LIBOR + 1.75%), due 8/29/25 (b) | 4,410,432 | 4,303,479 |
William Morris Endeavor Entertainment LLC | ||
First Lien Term Loan B1 | ||
3.52% (1 Month LIBOR + 2.75%), due 5/18/25 (b) | 4,497,422 | 4,413,096 |
18,335,703 | ||
Machinery (Non-Agriculture, Non-Construct & Non-Electronic) 1.0% | ||
Advanced Drainage Systems, Inc. | ||
Initial Term Loan | ||
2.75% (1 Month LIBOR + 2.25%), due 7/31/26 (b) | 463,393 | 462,379 |
Brown Group Holdings LLC | ||
Initial Term Loan | ||
3.506% (3 Month LIBOR + 2.50%), due 6/7/28 (b) | 6,949,872 | 6,842,150 |
Columbus McKinnon Corp. | ||
Initial Term Loan | ||
3.813% (3 Month LIBOR + 2.75%), due 5/14/28 (b) | 6,343,808 | 6,256,580 |
CPM Holdings, Inc. (b) | ||
First Lien Initial Term Loan | ||
3.955% (1 Month LIBOR + 3.50%), due 11/17/25 | 4,433,532 | 4,383,655 |
Principal Amount | Value | |
Loan Assignments (continued) | ||
Machinery (Non-Agriculture, Non-Construct & Non-Electronic) (continued) | ||
CPM Holdings, Inc. (b) (continued) | ||
Second Lien Initial Term Loan | ||
8.705% (1 Month LIBOR + 8.25%), due 11/16/26 (d)(e) | $ 797,980 | $ 790,000 |
Husky Injection Molding Systems Ltd. | ||
Initial Term Loan | ||
3.354% (3 Month LIBOR + 3.00%), due 3/28/25 (b) | 6,483,113 | 6,336,083 |
Welbilt, Inc. | ||
2018 Term Loan B | ||
3.264% (1 Month LIBOR + 2.50%), due 10/23/25 (b) | 1,994,060 | 1,982,428 |
27,053,275 | ||
Manufacturing 1.9% | ||
ASP Blade Holdings, Inc. | ||
Initial Term Loan | ||
4.764% (1 Month LIBOR + 4.00%), due 10/13/28 (b) | 5,992,941 | 5,880,574 |
Clark Equipment Co. | ||
Tranche Term Loan B | ||
TBD, due 4/20/29 | 500,000 | 498,215 |
CP Atlas Buyer, Inc. | ||
Term Loan B | ||
4.514% (1 Month LIBOR + 3.75%), due 11/23/27 (b) | 7,430,945 | 6,958,552 |
CPG International LLC | ||
Term Loan B | ||
TBD, due 4/20/29 | 3,750,000 | 3,707,812 |
Excelitas Technologies Corp. | ||
First Lien Initial USD Term Loan | ||
4.506% (3 Month LIBOR + 3.50%), due 12/2/24 (b) | 1,984,456 | 1,967,092 |
FCG Acquisitions, Inc. | ||
First Lien Initial Term Loan | ||
4.514% (1 Month LIBOR + 3.75%), due 3/31/28 (b) | 5,959,362 | 5,838,315 |
Idemia Group SAS | ||
USD Facility Term Loan B3 | ||
5.506% (3 Month LIBOR + 4.50%), due 1/10/26 (b) | 2,160,506 | 2,141,602 |
II-VI, Inc. | ||
Term Loan B | ||
TBD, due 12/8/28 | 9,416,667 | 9,367,229 |
Principal Amount | Value | |
Manufacturing (continued) | ||
Madison IAQ LLC | ||
Term Loan | ||
4.524% (3 Month LIBOR + 3.25%), due 6/21/28 (b) | $ 5,319,800 | $ 5,173,505 |
Pro Mach Group, Inc. | ||
First Lien Closing Date Initial Term Loan | ||
5.00% (1 Month LIBOR + 4.00%, 3 Month LIBOR + 4.00%), due 8/31/28 (b) | 5,979,689 | 5,944,809 |
Standard Industries, Inc. | ||
Initial Term Loan | ||
3.788% (3 Month LIBOR + 2.50%), due 9/22/28 (b) | 2,487,225 | 2,480,159 |
Weber-Stephen Products LLC | ||
Initial Term Loan B | ||
4.014% (1 Month LIBOR + 3.25%), due 10/30/27 (b) | 584,222 | 564,797 |
Zurn LLC | ||
First Lien Term Loan B | ||
3.014% (1 Month LIBOR + 2.25%), due 10/4/28 (b) | 2,144,625 | 2,136,583 |
52,659,244 | ||
Media 1.8% | ||
Cogeco Communications Finance (USA) LP | ||
Amendment No. 5 Incremental Term Loan B | ||
3.264% (1 Month LIBOR + 2.50%), due 9/1/28 (b) | 11,250,000 | 11,081,250 |
Diamond Sports Group LLC | ||
Second Lien Term Loan | ||
3.656% (1 Month LIBOR + 3.25%), due 8/24/26 (b) | 2,920,269 | 957,606 |
DIRECTV Financing LLC | ||
Closing Date Term Loan | ||
5.764% (1 Month LIBOR + 5.00%), due 8/2/27 (b) | 10,314,000 | 10,264,575 |
KKR Apple Bidco LLC | ||
First Lien Initial Term Loan | ||
3.764% (1 Month LIBOR + 3.00%), due 9/22/28 (b) | 7,511,175 | 7,428,019 |
Mission Broadcasting, Inc. | ||
Term Loan B4 | ||
2.955% (1 Month LIBOR + 2.50%), due 6/2/28 (b) | 1,389,500 | 1,376,597 |
Radiate Holdco LLC | ||
Amendment No. 6 Term Loan | ||
4.014% (1 Month LIBOR + 3.25%), due 9/25/26 (b) | 9,640,693 | 9,505,126 |
30 | MainStay Floating Rate Fund |
Principal Amount | Value | |
Loan Assignments (continued) | ||
Media (continued) | ||
Sinclair Television Group, Inc. (b) | ||
Term Loan B3 | ||
3.77% (1 Month LIBOR + 3.00%), due 4/1/28 | $ 2,977,500 | $ 2,860,880 |
Term Loan B4 | ||
4.421% (1 Month LIBOR + 3.75%), due 4/21/29 | 6,000,000 | 5,812,500 |
49,286,553 | ||
Mining, Steel, Iron & Non-Precious Metals 0.8% | ||
American Rock Salt Co. LLC | ||
First Lien Initial Term Loan | ||
4.76% (1 Month LIBOR + 4.00%), due 6/9/28 (b) | 5,482,509 | 5,429,970 |
Gates Global LLC | ||
Initial Dollar Term Loan B3 | ||
3.264% (1 Month LIBOR + 2.50%), due 3/31/27 (b) | 10,893,006 | 10,679,035 |
Graftech International Ltd. | ||
Initial Term Loan | ||
3.764% (1 Month LIBOR + 3.00%), due 2/12/25 (b) | 1,226,258 | 1,216,295 |
MRC Global (U.S.), Inc. | ||
2018 Refinancing Term Loan | ||
3.764% (1 Month LIBOR + 3.00%), due 9/20/24 (b) | 2,319,792 | 2,284,995 |
U.S. Silica Co. | ||
Term Loan | ||
5.00% (1 Month LIBOR + 4.00%), due 5/1/25 (b) | 3,415,181 | 3,370,356 |
22,980,651 | ||
Oil & Gas 1.9% | ||
AL GCX Holdings LLC | ||
Term Loan B | ||
TBD, due 1/1/28 | 1,500,000 | 1,494,375 |
Buckeye Partners LP | ||
2021 Tranche Term Loan B1 | ||
2.707% (1 Month LIBOR + 2.25%), due 11/1/26 (b) | 2,327,723 | 2,311,138 |
ChampionX Corp. | ||
Initial Term Loan | ||
3.313% (1 Month LIBOR + 2.50%), due 5/9/25 (b)(d) | 472,289 | 467,173 |
Principal Amount | Value | |
Oil & Gas (continued) | ||
DT Midstream, Inc. | ||
Initial Term Loan | ||
2.50% (3 Month LIBOR + 2.00%), due 6/26/28 (b) | $ 1,277,850 | $ 1,275,671 |
Fleet Midco I Ltd. | ||
Facility Term Loan B | ||
3.764% (1 Month LIBOR + 3.00%), due 10/7/26 (b) | 3,213,635 | 3,157,396 |
GIP III Stetson I LP | ||
Initial Term Loan | ||
5.014% (1 Month LIBOR + 4.25%), due 7/18/25 (b)(d) | 2,083,447 | 2,030,059 |
Keane Group Holdings LLC | ||
Initial Term Loan | ||
5.50% (1 Month LIBOR + 4.50%), due 5/25/25 (b) | 5,427,827 | 5,353,194 |
Lucid Energy Group II Borrower LLC | ||
2021 Initial Term Loan | ||
5.00% (1 Month LIBOR + 4.25%), due 11/24/28 (b) | 4,115,892 | 4,075,589 |
Medallion Midland Acquisition LLC | ||
Initial Term Loan | ||
4.514% (1 Month LIBOR + 3.75%), due 10/18/28 (b) | 4,821,195 | 4,806,129 |
Murphy Oil USA, Inc. | ||
Tranche Term Loan B | ||
2.25% (1 Month LIBOR + 1.75%), due 1/31/28 (b) | 792,000 | 790,020 |
NorthRiver Midstream Finance LP | ||
Initial Term Loan B | ||
4.217% (3 Month LIBOR + 3.25%), due 10/1/25 (b) | 5,702,000 | 5,663,985 |
Oryx Midstream Services Permian Basin LLC | ||
Initial Term Loan | ||
3.75% (3 Month LIBOR + 3.25%), due 10/5/28 (b) | 3,990,000 | 3,967,556 |
PES Holdings LLC | ||
Tranche Term Loan C | ||
TBD (3.00% PIK) (1 Month LIBOR + 4.50%), due 12/31/22 (b)(d)(f)(g)(h) | 1,911,382 | 57,341 |
Prairie ECI Acquiror LP | ||
Initial Term Loan | ||
5.514% (1 Month LIBOR + 4.75%), due 3/11/26 (b) | 5,250,723 | 5,129,956 |
Principal Amount | Value | |
Loan Assignments (continued) | ||
Oil & Gas (continued) | ||
TransMontaigne Operating Co. LP | ||
Tranche Term Loan B 4.00%-4.054% | ||
(1 Month LIBOR + 3.50%, 3 Month LIBOR + 3.50%), due 11/17/28 (b) | $ 4,987,500 | $ 4,960,483 |
Traverse Midstream Partners LLC | ||
Advance Term Loan 5.384%-5.95% | ||
(3 Month LIBOR + 4.25%, 6 Month LIBOR + 4.25%), due 9/27/24 (b) | 3,218,169 | 3,204,759 |
Veritas U.S., Inc. | ||
2021 Dollar Term Loan B | ||
6.00% (3 Month LIBOR + 5.00%), due 9/1/25 (b) | 2,778,894 | 2,542,688 |
51,287,512 | ||
Packaging 0.2% | ||
LABL, Inc. | ||
Initial Dollar Term Loan | ||
5.764% (1 Month LIBOR + 5.00%), due 10/29/28 (b) | 2,693,250 | 2,636,692 |
Plastipak Holdings, Inc. | ||
2021 Tranche Term Loan B | ||
3.313% (1 Month LIBOR + 2.50%), due 12/1/28 (b) | 1,995,000 | 1,956,347 |
4,593,039 | ||
Personal & Nondurable Consumer Products 1.8% | ||
ABG Intermediate Holdings 2 LLC | ||
First Lien Tranche Term Loan B1 | ||
4.00% (3 Month LIBOR + 3.50%), due 12/21/28 (b) | 11,120,000 | 11,022,700 |
Foundation Building Materials, Inc. | ||
First Lien Initial Term Loan 4.014%-4.489% | ||
(1 Month LIBOR + 3.25%, 3 Month LIBOR + 3.25%), due 1/31/28 (b) | 6,213,100 | 5,975,449 |
Hunter Douglas Holding BV | ||
Tranche Term Loan B1 | ||
4.00% (3 Month LIBOR + 3.50%), due 2/26/29 (b) | 15,000,000 | 14,240,625 |
Leslie's Poolmart, Inc. | ||
Initial Term Loan | ||
3.019% (3 Month LIBOR + 2.50%), due 3/9/28 (b) | 9,930,000 | 9,781,050 |
Principal Amount | Value | |
Personal & Nondurable Consumer Products (continued) | ||
Michaels Cos., Inc. (The) | ||
Term Loan B | ||
5.256% (3 Month LIBOR + 4.25%), due 4/15/28 (b) | $ 4,754,025 | $ 4,332,105 |
Perrigo Co. plc | ||
Initial Term Loan B | ||
3.14% (1 Month LIBOR + 2.50%), due 4/20/29 (b) | 3,181,818 | 3,165,909 |
Prestige Brands, Inc. | ||
Term Loan B5 | ||
2.50% (1 Month LIBOR + 2.00%), due 7/3/28 (b) | 1,680,000 | 1,675,333 |
Spectrum Brands, Inc. | ||
2021 Term Loan | ||
2.764% (1 Month LIBOR + 2.00%), due 3/3/28 (b) | 297,000 | 294,030 |
50,487,201 | ||
Personal & Nondurable Consumer Products (Manufacturing Only) 0.5% | ||
American Builders & Contractors Supply Co., Inc. | ||
Restatement Effective Date Term Loan | ||
2.764% (1 Month LIBOR + 2.00%), due 1/15/27 (b) | 2,681,250 | 2,641,031 |
Hercules Achievement, Inc. | ||
First Lien Initial Term Loan | ||
4.50% (1 Month LIBOR + 3.50%), due 12/16/24 (b) | 4,308,916 | 4,137,637 |
SRAM LLC | ||
Initial Term Loan 3.25%-3.258% | ||
(1 Month LIBOR + 2.75%, 3 Month LIBOR + 2.75%, 6 Month LIBOR + 2.75%), due 5/18/28 (b) | 6,109,091 | 6,040,364 |
12,819,032 | ||
Personal Transportation 0.6% | ||
First Student Bidco, Inc. (b) | ||
Initial Term Loan B | ||
3.983% (3 Month LIBOR + 3.00%), due 7/21/28 | 7,668,514 | 7,519,937 |
Initial Term Loan C | ||
3.983% (3 Month LIBOR + 3.00%), due 7/21/28 | 2,837,754 | 2,782,773 |
Uber Technologies, Inc. (b) | ||
2021 Incremental Term Loan | ||
4.264% (1 Month LIBOR + 3.50%), due 4/4/25 | 5,655,192 | 5,631,333 |
32 | MainStay Floating Rate Fund |
Principal Amount | Value | |
Loan Assignments (continued) | ||
Personal Transportation (continued) | ||
Uber Technologies, Inc. (b) (continued) | ||
2021 Refinancing Term Loan | ||
4.264% (1 Month LIBOR + 3.50%), due 2/25/27 | $ 1,979,058 | $ 1,969,516 |
17,903,559 | ||
Personal, Food & Miscellaneous Services 1.5% | ||
1011778 B.C. Unlimited Liability Co. | ||
Term Loan B4 | ||
2.514% (1 Month LIBOR + 1.75%), due 11/19/26 (b) | 5,068,981 | 4,965,487 |
Aramark Intermediate HoldCo Corp. (b) | ||
U.S. Term Loan B3 | ||
2.514% (1 Month LIBOR + 1.75%), due 3/11/25 | 1,480,650 | 1,452,426 |
U.S. Term Loan B4 | ||
2.514% (1 Month LIBOR + 1.75%), due 1/15/27 | 1,631,875 | 1,599,918 |
U.S. Term Loan B5 | ||
3.264% (1 Month LIBOR + 2.50%), due 4/6/28 | 7,611,889 | 7,511,031 |
Hayward Industries, Inc. | ||
First Lien Refinancing Term Loan | ||
3.264% (1 Month LIBOR + 2.50%), due 5/30/28 (b) | 5,657,250 | 5,593,606 |
Hillman Group, Inc. (The) (b) | ||
Initial Delayed Draw Term Loan 2.75%-3.381% | ||
(1 Month LIBOR + 2.75%), due 7/14/28 | 31,347 | 30,462 |
Initial Term Loan | ||
3.382% (1 Month LIBOR + 2.75%), due 7/14/28 | 1,635,942 | 1,589,727 |
IRB Holding Corp. (b) | ||
2022 Replacement Term Loan B | ||
3.75% (3 Month LIBOR + 3.00%), due 12/15/27 | 9,057,033 | 8,921,178 |
2020 Replacement Term Loan B | ||
3.756% (3 Month LIBOR + 2.75%), due 2/5/25 | 7,380,408 | 7,306,604 |
KFC Holding Co. | ||
2021 Term Loan B | ||
2.304% (1 Month LIBOR + 1.75%), due 3/15/28 (b) | 2,194,915 | 2,182,568 |
41,153,007 | ||
Principal Amount | Value | |
Pharmaceuticals 0.2% | ||
Padagis LLC | ||
Term Loan B | ||
5.719% (3 Month LIBOR + 4.75%), due 7/6/28 (b) | $ 5,011,765 | $ 4,999,235 |
Printing & Publishing 0.6% | ||
Getty Images, Inc. | ||
Initial Dollar Term Loan | ||
5.063% (3 Month LIBOR + 4.50%), due 2/19/26 (b) | 3,982,684 | 3,962,771 |
Severin Acquisition LLC | ||
First Lien Initial Term Loan | ||
3.668% (1 Month LIBOR + 3.00%), due 8/1/25 (b) | 4,386,043 | 4,338,068 |
Springer Nature Deutschland GmbH | ||
Initial Term Loan B18 | ||
3.75% (3 Month LIBOR + 3.00%), due 8/14/26 (b) | 6,992,564 | 6,945,945 |
15,246,784 | ||
Radio and TV Broadcasting 0.0% ‡ | ||
Nielsen Finance LLC | ||
Term Loan B4 | ||
2.488% (1 Month LIBOR + 2.00%), due 10/4/23 (b) | 722,413 | 721,239 |
Retail 0.6% | ||
Great Outdoors Group LLC | ||
Term Loan B2 | ||
4.514% (1 Month LIBOR + 3.75%), due 3/6/28 (b) | 16,727,120 | 16,538,940 |
Retail Store 1.4% | ||
BJ's Wholesale Club, Inc. | ||
First Lien Tranche Term Loan B | ||
2.525% (1 Month LIBOR + 2.00%), due 2/3/24 (b) | 2,909,968 | 2,908,350 |
EG Group Ltd. (b) | ||
USD Facility Term Loan B | ||
5.006% (3 Month LIBOR + 4.00%), due 2/7/25 | 1,222,351 | 1,193,575 |
USD Additional Facility Term Loan | ||
5.006% (3 Month LIBOR + 4.00%), due 2/7/25 | 1,430,382 | 1,396,708 |
USD Additional Facility Term Loan | ||
5.256% (3 Month LIBOR + 4.25%), due 3/31/26 | 5,980,150 | 5,850,081 |
Principal Amount | Value | |
Loan Assignments (continued) | ||
Retail Store (continued) | ||
Harbor Freight Tools USA, Inc. | ||
2021 Initial Term Loan | ||
3.514% (1 Month LIBOR + 2.75%), due 10/19/27 (b) | $ 6,945,852 | $ 6,702,747 |
PetSmart LLC | ||
Initial Term Loan | ||
4.50% (3 Month LIBOR + 3.75%), due 2/11/28 (b) | 9,031,750 | 8,936,917 |
Rising Tide Holdings, Inc. | ||
First Lien Initial Term Loan | ||
5.50% (1 Month LIBOR + 4.75%), due 6/1/28 (b) | 4,327,300 | 4,146,094 |
White Cap Supply Holdings LLC | ||
Initial Closing Date Term Loan | ||
4.45% (1 Month LIBOR + 3.75%), due 10/19/27 (b) | 6,908,822 | 6,725,310 |
37,859,782 | ||
Services: Business 4.7% | ||
Avis Budget Car Rental LLC | ||
Tranche Term Loan C | ||
4.30% (1 Month LIBOR + 3.50%), due 3/16/29 (b) | 5,000,000 | 4,985,415 |
ConnectWise LLC | ||
Initial Term Loan | ||
4.264% (1 Month LIBOR + 3.50%), due 9/29/28 (b) | 3,591,000 | 3,560,477 |
Dun & Bradstreet Corp. (The) (b) | ||
Initial Borrowing Term Loan | ||
3.918% (1 Month LIBOR + 3.25%), due 2/6/26 | 8,074,022 | 8,010,100 |
2022 Incremental Term Loan B2 | ||
3.919% (1 Month LIBOR + 3.25%), due 1/18/29 | 700,000 | 694,093 |
Electron Bidco, Inc. | ||
First Lien Initial Term Loan | ||
4.014% (1 Month LIBOR + 3.25%), due 11/1/28 (b) | 12,666,667 | 12,551,881 |
Element Materials Technology Group US Holdings, Inc. | ||
Term Loan B | ||
TBD, due 4/12/29 | 1,915,790 | 1,911,598 |
GIP II Blue Holding LP | ||
Initial Term Loan | ||
5.506% (3 Month LIBOR + 4.50%), due 9/29/28 (b) | $ 4,643,333 | 4,623,599 |
Principal Amount | Value | |
Services: Business (continued) | ||
Hunter Holdco 3 Ltd. | ||
First Lien Initial Dollar Term Loan | ||
5.256% (3 Month LIBOR + 4.25%), due 8/19/28 (b) | $ 9,077,000 | $ 9,054,307 |
Icon plc (b) | ||
Lux Term Loan | ||
3.313% (3 Month LIBOR + 2.25%), due 7/3/28 | 6,482,957 | 6,434,335 |
U.S. Term Loan | ||
3.313% (3 Month LIBOR + 2.25%), due 7/3/28 | 1,615,233 | 1,604,464 |
Indy U.S. Bidco LLC | ||
2021 Refinancing Dollar Term Loan 4.207%-4.513% | ||
(1 Month LIBOR + 3.75%), due 3/6/28 (b) | 8,430,150 | 8,380,977 |
Intrado Corp. | ||
Initial Term Loan B | ||
5.00% (1 Month LIBOR + 4.00%), due 10/10/24 (b) | 3,352,732 | 3,131,311 |
Mercury Borrower, Inc. | ||
First Lien Initial Term Loan | ||
4.563% (3 Month LIBOR + 3.50%), due 8/2/28 (b) | 11,176,000 | 10,999,050 |
Mitchell International, Inc. (b) | ||
First Lien Initial Term Loan | ||
4.25% (3 Month LIBOR + 3.75%), due 10/15/28 | 3,333,333 | 3,279,167 |
Second Lien Initial Term Loan | ||
7.00% (3 Month LIBOR + 6.50%), due 10/15/29 | 1,800,000 | 1,761,750 |
MPH Acquisition Holdings LLC | ||
Initial Term Loan | ||
4.758% (3 Month LIBOR + 4.25%), due 9/1/28 (b) | 4,975,000 | 4,772,448 |
Orbit Private Holdings I Ltd. | ||
First Lien Initial Dollar Term Loan | ||
5.203% (3 Month LIBOR + 4.50%), due 12/11/28 (b) | 3,662,500 | 3,646,477 |
PECF USS Intermediate Holding III Corp. | ||
Initial Term Loan | ||
4.758% (3 Month LIBOR + 4.25%), due 12/15/28 (b) | 10,990,000 | 10,818,281 |
Phoenix Newco, Inc. | ||
First Lien Initial Term Loan | ||
4.00% (1 Month LIBOR + 3.50%), due 11/15/28 (b) | 9,500,000 | 9,425,786 |
34 | MainStay Floating Rate Fund |
Principal Amount | Value | |
Loan Assignments (continued) | ||
Services: Business (continued) | ||
Polaris Newco LLC | ||
First Lien Dollar Term Loan | ||
4.50% (1 Month LIBOR + 4.00%), due 6/2/28 (b) | $ 11,012,867 | $ 10,922,628 |
Project Boost Purchaser LLC (b) | ||
2021 Tranche Term Loan 2 | ||
4.264% (1 Month LIBOR + 3.50%), due 5/30/26 | 4,714,375 | 4,634,820 |
First Lien Tranche 1 Term Loan | ||
4.264% (1 Month LIBOR + 3.50%), due 6/1/26 | 1,994,885 | 1,962,468 |
Vizient, Inc. | ||
Term Loan B | ||
TBD, due 1/1/28 | 2,250,000 | 2,227,500 |
129,392,932 | ||
Software 3.7% | ||
AppLovin Corp. | ||
Amendment No. 6 New Term Loan | ||
3.764% (1 Month LIBOR + 3.00%), due 10/25/28 (b) | 4,793,000 | 4,756,056 |
Cornerstone OnDemand, Inc. | ||
First Lien Initial Term Loan | ||
4.514% (1 Month LIBOR + 3.75%), due 10/16/28 (b) | 3,625,000 | 3,568,359 |
Informatica LLC | ||
Initial Term Loan | ||
3.563% (1 Month LIBOR + 2.75%), due 10/27/28 (b) | 11,840,000 | 11,647,600 |
Magenta Buyer LLC | ||
First Lien Initial Term Loan | ||
6.23% (3 Month LIBOR + 5.00%), due 7/27/28 (b) | 6,268,500 | 6,188,188 |
McAfee Corp. | ||
Tranche Term Loan B1 | ||
4.50% (1 Month LIBOR + 4.00%), due 3/1/29 (b) | 10,000,000 | 9,802,500 |
Mitnick Corp. Purchaser, Inc. | ||
Term Loan | ||
TBD, due 4/20/29 | 5,500,000 | 5,484,875 |
Nortonlifelock, Inc. | ||
Term Loan B | ||
TBD, due 1/28/29 | 16,800,000 | 16,527,000 |
Ping Identity Corp. | ||
Term Loan | ||
4.55% (1 Month LIBOR + 3.75%), due 11/23/28 (b) | 3,333,333 | 3,291,667 |
Principal Amount | Value | |
Software (continued) | ||
Quest Software U.S. Holdings, Inc. | ||
First Lien Initial Term Loan | ||
4.75% (3 Month LIBOR + 4.25%), due 2/1/29 (b) | $ 6,562,500 | $ 6,435,351 |
Sophia LP | ||
First Lien Term Loan B | ||
4.256% (3 Month LIBOR + 3.25%), due 10/7/27 (b) | 2,866,731 | 2,831,791 |
Sovos Compliance LLC | ||
First Lien Initial Term Loan | ||
5.264% (1 Month LIBOR + 4.50%), due 8/11/28 (b) | 3,827,735 | 3,821,756 |
UKG, Inc. (b) | ||
First Lien 2021-2 Incremental Term Loan | ||
4.212% (3 Month LIBOR + 3.25%), due 5/4/26 | 13,165,107 | 13,014,643 |
First Lien Initial Term Loan | ||
4.756% (3 Month LIBOR + 3.75%), due 5/4/26 | 4,950,000 | 4,927,903 |
Second Lien 2021 Incremental Term Loan | ||
6.212% (3 Month LIBOR + 5.25%), due 5/3/27 | 3,300,000 | 3,280,200 |
Vision Solutions, Inc. | ||
First Lien Third Incremental Term Loan | ||
5.184% (3 Month LIBOR + 4.00%), due 4/24/28 (b) | 6,802,907 | 6,692,360 |
102,270,249 | ||
Telecommunications 3.3% | ||
Avaya, Inc. | ||
Tranche Term Loan B2 | ||
4.554% (1 Month LIBOR + 4.00%), due 12/15/27 (b) | 3,947,115 | 3,881,001 |
Azalea TopCo, Inc. (b) | ||
First Lien Initial Term Loan 4.264%-4.739% | ||
(1 Month LIBOR + 3.50%, 3 Month LIBOR + 3.50%), due 7/24/26 | 2,437,500 | 2,400,501 |
First Lien 2021 Term Loan | ||
4.50% (3 Month LIBOR + 3.75%), due 7/24/26 | 1,985,000 | 1,958,947 |
First Lien 2022 Incremental Term Loan | ||
4.884% (3 Month LIBOR + 3.75%), due 7/24/26 | 3,000,000 | 2,956,875 |
Cablevision Lightpath LLC | ||
Initial Term Loan | ||
3.804% (1 Month LIBOR + 3.25%), due 11/30/27 (b) | 5,084,177 | 5,033,335 |
Principal Amount | Value | |
Loan Assignments (continued) | ||
Telecommunications (continued) | ||
Connect Finco SARL | ||
Amendement No.1 Refinancing Term Loan | ||
4.50% (1 Month LIBOR + 3.50%), due 12/11/26 (b) | $ 9,654,596 | $ 9,586,212 |
CSC Holdings LLC | ||
September 2019 Initial Term Loan | ||
3.054% (1 Month LIBOR + 2.50%), due 4/15/27 (b) | 9,544,228 | 9,349,364 |
Cyxtera DC Holdings, Inc. | ||
First Lien Initial Term Loan | ||
4.00% (3 Month LIBOR + 3.00%), due 5/1/24 (b)(d) | 1,428,750 | 1,406,723 |
Frontier Communications Holdings LLC | ||
Term Loan B | ||
4.813% (3 Month LIBOR + 3.75%), due 5/1/28 (b) | 5,801,450 | 5,712,009 |
Gogo Intermediate Holdings LLC | ||
Initial Term Loan | ||
4.989% (3 Month LIBOR + 3.75%), due 4/30/28 (b) | 9,443,700 | 9,342,180 |
Intelsat Jackson Holdings SA | ||
Term Loan B | ||
4.92% (3 Month LIBOR + 4.25%), due 2/1/29 (b) | 6,982,199 | 6,766,917 |
Level 3 Financing, Inc. | ||
Tranche 2027 Term Loan B | ||
2.514% (1 Month LIBOR + 1.75%), due 3/1/27 (b) | 2,500,000 | 2,413,125 |
Lumen Technologies, Inc. | ||
Term Loan B | ||
3.014% (1 Month LIBOR + 2.25%), due 3/15/27 (b) | 10,597,392 | 10,151,422 |
Redstone HoldCo 2 LP | ||
First Lien Initial Term Loan | ||
5.934% (3 Month LIBOR + 4.75%), due 4/27/28 (b) | 2,482,512 | 2,380,883 |
SBA Senior Finance II LLC | ||
Initial Term Loan | ||
2.52% (1 Month LIBOR + 1.75%), due 4/11/25 (b) | 6,282,701 | 6,172,754 |
Telesat Canada | ||
Term Loan B5 | ||
3.52% (1 Month LIBOR + 2.75%), due 12/7/26 (b) | 2,034,078 | 1,471,316 |
Principal Amount | Value | |
Telecommunications (continued) | ||
Zayo Group Holdings, Inc. | ||
Initial Dollar Term Loan | ||
3.764% (1 Month LIBOR + 3.00%), due 3/9/27 (b) | $ 9,075,110 | $ 8,594,882 |
89,578,446 | ||
Utilities 1.4% | ||
Astoria Energy LLC | ||
2020 Advance Term Loan B | ||
4.506% (3 Month LIBOR + 3.50%), due 12/10/27 (b) | 910,058 | 895,757 |
Brookfield WEC Holdings, Inc. | ||
First Lien 2021 Initial Term Loan | ||
3.514% (1 Month LIBOR + 2.75%), due 8/1/25 (b) | 10,319,375 | 10,134,091 |
Calpine Corp. | ||
2019 Term Loan | ||
2.77% (1 Month LIBOR + 2.00%), due 4/5/26 (b) | 2,042,250 | 2,013,532 |
Compass Power Generation LLC | ||
Tranche Term Loan B2 | ||
5.364% (3 Month LIBOR + 4.25%), due 4/14/29 (b) | 2,125,000 | 2,074,531 |
Constellation Renewables LLC | ||
Term Loan | ||
3.50% (3 Month LIBOR + 2.50%), due 12/15/27 (b) | 2,639,240 | 2,628,105 |
Edgewater Generation LLC | ||
Term Loan | ||
4.514% (1 Month LIBOR + 3.75%), due 12/13/25 (b) | 4,831,512 | 4,470,154 |
Granite Generation LLC | ||
Term Loan 4.75%-4.756% | ||
(1 Month LIBOR + 3.75%, 3 Month LIBOR + 3.75%), due 11/9/26 (b) | 6,428,404 | 6,295,375 |
Hamilton Projects Acquiror LLC | ||
Term Loan | ||
5.506% (3 Month LIBOR + 4.50%), due 6/17/27 (b) | 2,456,250 | 2,447,479 |
PG&E Corp. | ||
Term Loan | ||
3.813% (1 Month LIBOR + 3.00%), due 6/23/25 (b) | 3,193,125 | 3,146,560 |
36 | MainStay Floating Rate Fund |
Principal Amount | Value | |
Loan Assignments (continued) | ||
Utilities (continued) | ||
Vistra Operations Co. LLC | ||
2018 Incremental Term Loan 2.304%-2.514% | ||
(1 Month LIBOR + 1.75%), due 12/31/25 (b) | $ 4,917,596 | $ 4,848,862 |
38,954,446 | ||
Water 0.3% | ||
Osmosis Buyer Ltd. | ||
Term Loan | ||
TBD, due 7/31/28 | 4,074,074 | 4,006,171 |
2022 Refinanciang Term Loan B | ||
4.25% (1 Month LIBOR + 3.75%), due 7/31/28 (b) | 5,600,000 | 5,516,000 |
9,522,171 | ||
Total Loan Assignments (Cost $2,456,957,477) | 2,412,837,582 | |
Total Long-Term Bonds (Cost $2,583,544,707) | 2,533,310,360 | |
Shares | ||
Affiliated Investment Company 0.4% | ||
Fixed Income Fund 0.4% | ||
MainStay MacKay High Yield Corporate Bond Fund Class I | 2,399,065 | 12,475,619 |
Total Affiliated Investment Company (Cost $13,596,813) | 12,475,619 | |
Common Stocks 0.0% ‡ | ||
Communications Equipment 0.0% ‡ | ||
Energy Future Holdings Corp. (d)(e)(i)(j) | 175,418 | — |
Millennium Corporate Trust (d)(e)(i)(j) | 4,973 | — |
Millennium Lender Trust (d)(e)(i)(j) | 5,298 | — |
— | ||
Metals & Mining 0.0% ‡ | ||
Ameriforge Group, Inc. (d)(e)(i)(j) | 60,753 | 116,038 |
Total Common Stocks (Cost $2,091,921) | 116,038 | |
Exchange-Traded Funds 1.8% | ||
Invesco Senior Loan ETF (k) | 1,355,000 | 29,213,800 |
Shares | Value | |
SPDR Blackstone Senior Loan ETF (k) | 437,000 | $ 19,433,390 |
Total Exchange-Traded Funds (Cost $50,097,017) | 48,647,190 | |
Number of Rights | ||
Rights 0.0% ‡ | ||
Independent Power and Renewable Electricity Producers 0.0% ‡ | ||
Vistra Corp. | ||
Expires 12/31/46 (d)(e)(i)(j) | 107,130 | 98,559 |
Total Rights (Cost $87,847) | 98,559 | |
Number of Warrants | ||
Warrants 0.0% ‡ | ||
Health Care Equipment & Supplies 0.0% ‡ | ||
Carestream Health, Inc. | ||
Expires 8/5/23 (d)(e)(i)(j) | 72 | 1 |
Health Care Providers & Services 0.0% ‡ | ||
THAIHOT Investment Co. Ltd. | ||
Expires 10/13/27 (d)(e)(i)(j)(l) | 26 | 0 |
Total Warrants (Cost $0) | 1 | |
Shares | ||
Short-Term Investments 16.6% | ||
Unaffiliated Investment Companies 1.8% | ||
BlackRock Liquidity FedFund, 0.375% (m)(n) | 23,000,000 | 23,000,000 |
Invesco Government & Agency Portfolio, 0.419% (m)(n) | 26,691,840 | 26,691,840 |
Total Unaffiliated Investment Companies (Cost $49,691,840) | 49,691,840 | |
Principal Amount | ||
U.S. Treasury Debt 14.8% | ||
U.S. Treasury Bills (o) | ||
0.157%, due 5/3/22 | $ 132,833,000 | 132,832,668 |
0.183%, due 5/10/22 | 100,000,000 | 99,997,500 |
0.292%, due 5/17/22 | 115,500,000 | 115,490,977 |
Principal Amount | Value | |
U.S. Treasury Debt (continued) | ||
U.S. Treasury Bills (o) (continued) | ||
0.383%, due 5/24/22 | $ 31,000,000 | $ 30,994,553 |
0.384%, due 6/2/22 | 19,000,000 | 18,994,597 |
0.392%, due 6/7/22 | 4,000,000 | 3,998,337 |
Total U.S. Treasury Debt (Cost $402,296,582) | 402,308,632 | |
Total Short-Term Investments (Cost $451,988,422) | 452,000,472 | |
Total Investments (Cost $3,101,406,727) | 111.6% | 3,046,648,239 |
Other Assets, Less Liabilities | (11.6) | (316,846,070) |
Net Assets | 100.0% | $ 2,729,802,169 |
† | Percentages indicated are based on Fund net assets. |
‡ | Less than one-tenth of a percent. |
(a) | May be sold to institutional investors only under Rule 144A or securities offered pursuant to Section 4(a)(2) of the Securities Act of 1933, as amended. |
(b) | Floating rate—Rate shown was the rate in effect as of April 30, 2022. |
(c) | Delayed delivery security. |
(d) | Illiquid security—As of April 30, 2022, the total market value deemed illiquid under procedures approved by the Board of Trustees was $25,347,285, which represented 0.9% of the Fund’s net assets. |
(e) | Security in which significant unobservable inputs (Level 3) were used in determining fair value. |
(f) | PIK ("Payment-in-Kind")—issuer may pay interest or dividends with additional securities and/or in cash. |
(g) | Issue in default. |
(h) | Issue in non-accrual status. |
(i) | Fair valued security—Represents fair value as measured in good faith under procedures approved by the Board of Trustees. As of April 30, 2022, the total market value was $214,598, which represented less than one-tenth of a percent of the Fund’s net assets. |
(j) | Non-income producing security. |
(k) | All or a portion of this security was held on loan. As of April 30, 2022, the aggregate market value of securities on loan was $48,439,984. The Fund received cash collateral with a value of $49,691,840. (See Note 2(H)) |
(l) | Less than $1. |
(m) | Current yield as of April 30, 2022. |
(n) | Represents a security purchased with cash collateral received for securities on loan. |
(o) | Interest rate shown represents yield to maturity. |
38 | MainStay Floating Rate Fund |
Affiliated Investment Companies | Value, Beginning of Period | Purchases at Cost | Proceeds from Sales | Net Realized Gain/(Loss) on Sales | Change in Unrealized Appreciation/ (Depreciation) | Value, End of Period | Dividend Income | Other Distributions | Shares End of Period |
MainStay MacKay High Yield Corporate Bond Fund Class I | $ 13,501 | $ — | $ — | $ — | $ (1,025) | $ 12,476 | $ 337 | $ — | 2,399 |
Abbreviation(s): |
CLO—Collateralized Loan Obligation |
ETF—Exchange-Traded Fund |
LIBOR—London Interbank Offered Rate |
REIT—Real Estate Investment Trust |
SOFR—Secured Overnight Financing Rate |
SPDR—Standard & Poor’s Depositary Receipt |
TBD—To Be Determined |
USD—United States Dollar |
Description | Quoted Prices in Active Markets for Identical Assets (Level 1) | Significant Other Observable Inputs (Level 2) | Significant Unobservable Inputs (Level 3) | Total |
Asset Valuation Inputs | ||||
Investments in Securities (a) | ||||
Long-Term Bonds | ||||
Asset-Backed Securities | $ — | $ 63,375,493 | $ — | $ 63,375,493 |
Corporate Bonds | — | 57,097,285 | — | 57,097,285 |
Loan Assignments | — | 2,410,087,150 | 2,750,432 | 2,412,837,582 |
Total Long-Term Bonds | — | 2,530,559,928 | 2,750,432 | 2,533,310,360 |
Affiliated Investment Company | ||||
Fixed Income Fund | 12,475,619 | — | — | 12,475,619 |
Common Stocks | — | — | 116,038 | 116,038 |
Exchange-Traded Funds | 48,647,190 | — | — | 48,647,190 |
Rights | — | — | 98,559 | 98,559 |
Warrants | — | — | 1 | 1 |
Short-Term Investments | ||||
Unaffiliated Investment Companies | 49,691,840 | — | — | 49,691,840 |
U.S. Treasury Debt | — | 402,308,632 | — | 402,308,632 |
Total Short-Term Investments | 49,691,840 | 402,308,632 | — | 452,000,472 |
Total Investments in Securities | $ 110,814,649 | $ 2,932,868,560 | $ 2,965,030 | $ 3,046,648,239 |
(a) | For a complete listing of investments and their industries, see the Portfolio of Investments. |
Assets | |
Investment in unaffiliated securities, at value (identified cost $3,087,809,914) including securities on loan of $48,439,984 | $3,034,172,620 |
Investment in affiliated investment companies, at value (identified cost $13,596,813) | 12,475,619 |
Cash | 4,238,858 |
Receivables: | |
Fund shares sold | 25,768,643 |
Interest | 5,172,561 |
Investment securities sold | 3,449,413 |
Securities lending | 68,524 |
Other assets | 326,977 |
Total assets | 3,085,673,215 |
Liabilities | |
Cash collateral received for securities on loan | 49,691,840 |
Unrealized depreciation on unfunded commitments (See Note 5) | 53,373 |
Payables: | |
Investment securities purchased | 297,732,124 |
Fund shares redeemed | 5,468,477 |
Manager (See Note 3) | 1,283,414 |
Transfer agent (See Note 3) | 342,450 |
NYLIFE Distributors (See Note 3) | 163,720 |
Shareholder communication | 52,796 |
Professional fees | 24,627 |
Custodian | 18,434 |
Distributions payable | 1,039,791 |
Total liabilities | 355,871,046 |
Net assets | $2,729,802,169 |
Composition of Net Assets | |
Shares of beneficial interest outstanding (par value of $.001 per share) unlimited number of shares authorized | $304,537 |
Additional paid-in-capital | 2,875,484,749 |
2,875,789,286 | |
Total distributable earnings (loss) | (145,987,117) |
Net assets | $2,729,802,169 |
Class A | |
Net assets applicable to outstanding shares | $531,710,907 |
Shares of beneficial interest outstanding | 59,326,329 |
Net asset value per share outstanding | $8.96 |
Maximum sales charge (3.00% of offering price) | 0.28 |
Maximum offering price per share outstanding | $9.24 |
Investor Class | |
Net assets applicable to outstanding shares | $18,910,420 |
Shares of beneficial interest outstanding | 2,109,812 |
Net asset value per share outstanding | $8.96 |
Maximum sales charge (2.50% of offering price) | 0.23 |
Maximum offering price per share outstanding | $9.19 |
Class B | |
Net assets applicable to outstanding shares | $758,101 |
Shares of beneficial interest outstanding | 84,513 |
Net asset value and offering price per share outstanding | $8.97 |
Class C | |
Net assets applicable to outstanding shares | $66,005,122 |
Shares of beneficial interest outstanding | 7,362,147 |
Net asset value and offering price per share outstanding | $8.97 |
Class I | |
Net assets applicable to outstanding shares | $1,706,929,036 |
Shares of beneficial interest outstanding | 190,430,606 |
Net asset value and offering price per share outstanding | $8.96 |
Class R3 | |
Net assets applicable to outstanding shares | $755,508 |
Shares of beneficial interest outstanding | 84,280 |
Net asset value and offering price per share outstanding | $8.96 |
Class R6 | |
Net assets applicable to outstanding shares | $404,706,671 |
Shares of beneficial interest outstanding | 45,136,196 |
Net asset value and offering price per share outstanding | $8.97 |
SIMPLE Class | |
Net assets applicable to outstanding shares | $26,404 |
Shares of beneficial interest outstanding | 2,945 |
Net asset value and offering price per share outstanding | $8.97 |
40 | MainStay Floating Rate Fund |
Investment Income (Loss) | |
Income | |
Interest | $41,640,777 |
Dividends-unaffiliated | 913,662 |
Dividends-affiliated | 336,829 |
Securities lending | 174,924 |
Total income | 43,066,192 |
Expenses | |
Manager (See Note 3) | 6,743,577 |
Transfer agent (See Note 3) | 1,072,908 |
Distribution/Service—Class A (See Note 3) | 562,564 |
Distribution/Service—Investor Class (See Note 3) | 23,682 |
Distribution/Service—Class B (See Note 3) | 3,994 |
Distribution/Service—Class C (See Note 3) | 283,508 |
Distribution/Service—Class R3 (See Note 3) | 1,778 |
Distribution/Service—SIMPLE Class (See Note 3) | 65 |
Registration | 131,626 |
Professional fees | 94,708 |
Shareholder communication | 39,365 |
Custodian | 19,062 |
Trustees | 18,056 |
Shareholder service (See Note 3) | 356 |
Miscellaneous | 44,012 |
Total expenses | 9,039,261 |
Net investment income (loss) | 34,026,931 |
Realized and Unrealized Gain (Loss) | |
Net realized gain (loss) on unaffiliated investments | (921,387) |
Net change in unrealized appreciation (depreciation) on: | |
Unaffiliated investments | (43,713,685) |
Affiliated investments | (1,025,840) |
Unfunded commitments | (58,463) |
Net change in unrealized appreciation (depreciation) | (44,797,988) |
Net realized and unrealized gain (loss) | (45,719,375) |
Net increase (decrease) in net assets resulting from operations | $(11,692,444) |
for the six months ended April 30, 2022 (Unaudited) and the year ended October 31, 2021
2022 | 2021 | |
Increase (Decrease) in Net Assets | ||
Operations: | ||
Net investment income (loss) | $34,026,931 | $44,320,664 |
Net realized gain (loss) | (921,387) | (5,286,664) |
Net change in unrealized appreciation (depreciation) | (44,797,988) | 33,400,606 |
Net increase (decrease) in net assets resulting from operations | (11,692,444) | 72,434,606 |
Distributions to shareholders: | ||
Class A | (6,211,247) | (8,877,779) |
Investor Class | (252,362) | (513,155) |
Class B | (7,642) | (20,388) |
Class C | (539,448) | (969,119) |
Class I | (20,919,486) | (24,392,511) |
Class R3 | (8,575) | (13,109) |
Class R6 | (5,951,934) | (7,525,422) |
SIMPLE Class | (318) | (606) |
Total distributions to shareholders | (33,891,012) | (42,312,089) |
Capital share transactions: | ||
Net proceeds from sales of shares | 1,118,766,013 | 1,441,425,937 |
Net asset value of shares issued to shareholders in reinvestment of distributions | 28,973,063 | 37,317,100 |
Cost of shares redeemed | (395,974,397) | (408,186,068) |
Increase (decrease) in net assets derived from capital share transactions | 751,764,679 | 1,070,556,969 |
Net increase (decrease) in net assets | 706,181,223 | 1,100,679,486 |
Net Assets | ||
Beginning of period | 2,023,620,946 | 922,941,460 |
End of period | $2,729,802,169 | $2,023,620,946 |
42 | MainStay Floating Rate Fund |
Six months ended April 30, 2022* | Year Ended October 31, | |||||
Class A | 2021 | 2020 | 2019 | 2018 | 2017 | |
Net asset value at beginning of period | $9.13 | $8.84 | $9.02 | $9.28 | $9.35 | $9.29 |
Net investment income (loss) | 0.12(a) | 0.25(a) | 0.31(a) | 0.43(a) | 0.40 | 0.35 |
Net realized and unrealized gain (loss) | (0.17) | 0.28 | (0.18) | (0.26) | (0.07) | 0.06 |
Total from investment operations | (0.05) | 0.53 | 0.13 | 0.17 | 0.33 | 0.41 |
Less distributions: | ||||||
From net investment income | (0.12) | (0.24) | (0.31) | (0.43) | (0.40) | (0.35) |
Net asset value at end of period | $8.96 | $9.13 | $8.84 | $9.02 | $9.28 | $9.35 |
Total investment return (b) | (0.50)% | 6.05% | 1.55% | 1.94% | 3.54% | 4.50% |
Ratios (to average net assets)/Supplemental Data: | ||||||
Net investment income (loss) | 2.77%†† | 2.78% | 3.56% | 4.76% | 4.23% | 3.76% |
Net expenses (c) | 0.97%†† | 1.02% | 1.14% | 1.09% | 1.05% | 1.01% |
Portfolio turnover rate | 8% | 22% | 22% | 19% | 32% | 58% |
Net assets at end of period (in 000’s) | $531,711 | $397,101 | $279,188 | $338,392 | $383,590 | $371,186 |
* | Unaudited. |
†† | Annualized. |
(a) | Per share data based on average shares outstanding during the period. |
(b) | Total investment return is calculated exclusive of sales charges and assumes the reinvestment of dividends and distributions. For periods of less than one year, total return is not annualized. |
(c) | In addition to the fees and expenses which the Fund bears directly, it also indirectly bears a pro-rata share of the fees and expenses of the underlying funds in which it invests. Such indirect expenses are not included in the above expense ratios. |
Six months ended April 30, 2022* | Year Ended October 31, | |||||
Investor Class | 2021 | 2020 | 2019 | 2018 | 2017 | |
Net asset value at beginning of period | $9.13 | $8.84 | $9.02 | $9.28 | $9.35 | $9.29 |
Net investment income (loss) | 0.12(a) | 0.24(a) | 0.31(a) | 0.43(a) | 0.40 | 0.35 |
Net realized and unrealized gain (loss) | (0.17) | 0.28 | (0.18) | (0.26) | (0.07) | 0.06 |
Total from investment operations | (0.05) | 0.52 | 0.13 | 0.17 | 0.33 | 0.41 |
Less distributions: | ||||||
From net investment income | (0.12) | (0.23) | (0.31) | (0.43) | (0.40) | (0.35) |
Net asset value at end of period | $8.96 | $9.13 | $8.84 | $9.02 | $9.28 | $9.35 |
Total investment return (b) | (0.55)% | 5.96% | 1.55% | 1.95% | 3.54% | 4.44% |
Ratios (to average net assets)/Supplemental Data: | ||||||
Net investment income (loss) | 2.67%†† | 2.67% | 3.55% | 4.77% | 4.24% | 3.66% |
Net expenses (c) | 1.08%†† | 1.12% | 1.13% | 1.08% | 1.05% | 1.06% |
Portfolio turnover rate | 8% | 22% | 22% | 19% | 32% | 58% |
Net assets at end of period (in 000's) | $18,910 | $19,314 | $20,569 | $23,496 | $21,731 | $21,238 |
* | Unaudited. |
†† | Annualized. |
(a) | Per share data based on average shares outstanding during the period. |
(b) | Total investment return is calculated exclusive of sales charges and assumes the reinvestment of dividends and distributions. For periods of less than one year, total return is not annualized. |
(c) | In addition to the fees and expenses which the Fund bears directly, it also indirectly bears a pro-rata share of the fees and expenses of the underlying funds in which it invests. Such indirect expenses are not included in the above expense ratios. |
Six months ended April 30, 2022* | Year Ended October 31, | |||||
Class B | 2021 | 2020 | 2019 | 2018 | 2017 | |
Net asset value at beginning of period | $9.14 | $8.85 | $9.03 | $9.28 | $9.36 | $9.29 |
Net investment income (loss) | 0.09(a) | 0.17(a) | 0.25(a) | 0.37(a) | 0.33 | 0.28 |
Net realized and unrealized gain (loss) | (0.17) | 0.28 | (0.18) | (0.25) | (0.08) | 0.07 |
Total from investment operations | (0.08) | 0.45 | 0.07 | 0.12 | 0.25 | 0.35 |
Less distributions: | ||||||
From net investment income | (0.09) | (0.16) | (0.25) | (0.37) | (0.33) | (0.28) |
Net asset value at end of period | $8.97 | $9.14 | $8.85 | $9.03 | $9.28 | $9.36 |
Total investment return (b) | (0.92)% | 5.16% | 0.79% | 1.19% | 2.66%(c) | 3.78% |
Ratios (to average net assets)/Supplemental Data: | ||||||
Net investment income (loss) | 1.92%†† | 1.90% | 2.87% | 4.04% | 3.47% | 2.92% |
Net expenses (d) | 1.83%†† | 1.88% | 1.88% | 1.83% | 1.80% | 1.81% |
Portfolio turnover rate | 8% | 22% | 22% | 19% | 32% | 58% |
Net assets at end of period (in 000’s) | $758 | $897 | $1,584 | $3,119 | $5,259 | $6,536 |
* | Unaudited. |
†† | Annualized. |
(a) | Per share data based on average shares outstanding during the period. |
(b) | Total investment return is calculated exclusive of sales charges and assumes the reinvestment of dividends and distributions. For periods of less than one year, total return is not annualized. |
(c) | Total investment return may reflect adjustments to conform to generally accepted accounting principles. |
(d) | In addition to the fees and expenses which the Fund bears directly, it also indirectly bears a pro-rata share of the fees and expenses of the underlying funds in which it invests. Such indirect expenses are not included in the above expense ratios. |
Six months ended April 30, 2022* | Year Ended October 31, | |||||
Class C | 2021 | 2020 | 2019 | 2018 | 2017 | |
Net asset value at beginning of period | $9.13 | $8.84 | $9.03 | $9.28 | $9.36 | $9.29 |
Net investment income (loss) | 0.09(a) | 0.17(a) | 0.25(a) | 0.37(a) | 0.33 | 0.28 |
Net realized and unrealized gain (loss) | (0.16) | 0.28 | (0.19) | (0.25) | (0.08) | 0.07 |
Total from investment operations | (0.07) | 0.45 | 0.06 | 0.12 | 0.25 | 0.35 |
Less distributions: | ||||||
From net investment income | (0.09) | (0.16) | (0.25) | (0.37) | (0.33) | (0.28) |
Net asset value at end of period | $8.97 | $9.13 | $8.84 | $9.03 | $9.28 | $9.36 |
Total investment return (b) | (0.81)% | 5.17% | 0.68% | 1.30% | 2.66%(c) | 3.66% |
Ratios (to average net assets)/Supplemental Data: | ||||||
Net investment income (loss) | 1.91%†† | 1.91% | 2.85% | 4.03% | 3.48% | 2.94% |
Net expenses (d) | 1.83%†† | 1.88% | 1.88% | 1.83% | 1.80% | 1.81% |
Portfolio turnover rate | 8% | 22% | 22% | 19% | 32% | 58% |
Net assets at end of period (in 000’s) | $66,005 | $52,522 | $55,153 | $86,012 | $142,134 | $154,399 |
* | Unaudited. |
†† | Annualized. |
(a) | Per share data based on average shares outstanding during the period. |
(b) | Total investment return is calculated exclusive of sales charges and assumes the reinvestment of dividends and distributions. For periods of less than one year, total return is not annualized. |
(c) | Total investment return may reflect adjustments to conform to generally accepted accounting principles. |
(d) | In addition to the fees and expenses which the Fund bears directly, it also indirectly bears a pro-rata share of the fees and expenses of the underlying funds in which it invests. Such indirect expenses are not included in the above expense ratios. |
44 | MainStay Floating Rate Fund |
Six months ended April 30, 2022* | Year Ended October 31, | |||||
Class I | 2021 | 2020 | 2019 | 2018 | 2017 | |
Net asset value at beginning of period | $9.13 | $8.84 | $9.03 | $9.28 | $9.35 | $9.29 |
Net investment income (loss) | 0.14(a) | 0.28(a) | 0.33(a) | 0.46(a) | 0.42 | 0.38 |
Net realized and unrealized gain (loss) | (0.17) | 0.27 | (0.19) | (0.25) | (0.07) | 0.06 |
Total from investment operations | (0.03) | 0.55 | 0.14 | 0.21 | 0.35 | 0.44 |
Less distributions: | ||||||
From net investment income | (0.14) | (0.26) | (0.33) | (0.46) | (0.42) | (0.38) |
Net asset value at end of period | $8.96 | $9.13 | $8.84 | $9.03 | $9.28 | $9.35 |
Total investment return (b) | (0.39)% | 6.31% | 1.69% | 2.31% | 3.80% | 4.76% |
Ratios (to average net assets)/Supplemental Data: | ||||||
Net investment income (loss) | 3.02%†† | 3.04% | 3.85% | 5.02% | 4.49% | 4.01% |
Net expenses (c) | 0.72%†† | 0.77% | 0.89% | 0.84% | 0.80% | 0.76% |
Portfolio turnover rate | 8% | 22% | 22% | 19% | 32% | 58% |
Net assets at end of period (in 000’s) | $1,706,929 | $1,186,421 | $445,468 | $716,692 | $1,048,033 | $943,093 |
* | Unaudited. |
†† | Annualized. |
(a) | Per share data based on average shares outstanding during the period. |
(b) | Total investment return is calculated exclusive of sales charges and assumes the reinvestment of dividends and distributions. Class I shares are not subject to sales charges. For periods of less than one year, total return is not annualized. |
(c) | In addition to the fees and expenses which the Fund bears directly, it also indirectly bears a pro-rata share of the fees and expenses of the underlying funds in which it invests. Such indirect expenses are not included in the above expense ratios. |
Six months ended April 30, 2022* | Year Ended October 31, | |||||
Class R3 | 2021 | 2020 | 2019 | 2018 | 2017 | |
Net asset value at beginning of period | $9.13 | $8.84 | $9.03 | $9.28 | $9.35 | $9.29 |
Net investment income (loss) | 0.11(a) | 0.22(a) | 0.28(a) | 0.40(a) | 0.36 | 0.32 |
Net realized and unrealized gain (loss) | (0.17) | 0.28 | (0.19) | (0.25) | (0.07) | 0.06 |
Total from investment operations | (0.06) | 0.50 | 0.09 | 0.15 | 0.29 | 0.38 |
Less distributions: | ||||||
From net investment income | (0.11) | (0.21) | (0.28) | (0.40) | (0.36) | (0.32) |
Net asset value at end of period | $8.96 | $9.13 | $8.84 | $9.03 | $9.28 | $9.35 |
Total investment return (b) | (0.68)% | 5.68% | 1.08% | 1.69% | 3.18% | 4.14% |
Ratios (to average net assets)/Supplemental Data: | ||||||
Net investment income (loss) | 2.42%†† | 2.43% | 3.14% | 4.37% | 3.97% | 3.52% |
Net expenses (c) | 1.32%†† | 1.37% | 1.49% | 1.43% | 1.40% | 1.35% |
Portfolio turnover rate | 8% | 22% | 22% | 19% | 32% | 58% |
Net assets at end of period (in 000’s) | $756 | $620 | $523 | $436 | $379 | $62 |
* | Unaudited. |
†† | Annualized. |
(a) | Per share data based on average shares outstanding during the period. |
(b) | Total investment return is calculated exclusive of sales charges and assumes the reinvestment of dividends and distributions. Class R3 shares are not subject to sales charges. For periods of less than one year, total return is not annualized. |
(c) | In addition to the fees and expenses which the Fund bears directly, it also indirectly bears a pro-rata share of the fees and expenses of the underlying funds in which it invests. Such indirect expenses are not included in the above expense ratios. |
Six months ended April 30, 2022* | Year Ended October 31, | February 28, 2019^ through October 31, 2019 | ||
Class R6 | 2021 | 2020 | ||
Net asset value at beginning of period | $9.13 | $8.84 | $9.03 | $9.18 |
Net investment income (loss) (a) | 0.14 | 0.30 | 0.35 | 0.32 |
Net realized and unrealized gain (loss) | (0.16) | 0.27 | (0.19) | (0.15) |
Total from investment operations | (0.02) | 0.57 | 0.16 | 0.17 |
Less distributions: | ||||
From net investment income | (0.14) | (0.28) | (0.35) | (0.32) |
Net asset value at end of period | $8.97 | $9.13 | $8.84 | $9.03 |
Total investment return (b) | (0.22)% | 6.47% | 1.92% | 1.84% |
Ratios (to average net assets)/Supplemental Data: | ||||
Net investment income (loss) | 3.13%†† | 3.24% | 3.99% | 5.18%†† |
Net expenses (c) | 0.62%†† | 0.62% | 0.67% | 0.64%†† |
Portfolio turnover rate | 8% | 22% | 22% | 19% |
Net assets at end of period (in 000’s) | $404,707 | $366,720 | $120,432 | $71,077 |
* | Unaudited. |
^ | Inception date. |
†† | Annualized. |
(a) | Per share data based on average shares outstanding during the period. |
(b) | Total investment return is calculated exclusive of sales charges and assumes the reinvestment of dividends and distributions. Class R6 shares are not subject to sales charges. For periods of less than one year, total return is not annualized. |
(c) | In addition to the fees and expenses which the Fund bears directly, it also indirectly bears a pro-rata share of the fees and expenses of the underlying funds in which it invests. Such indirect expenses are not included in the above expense ratios. |
Six months ended April 30, 2022* | Year Ended October 31, | August 31, 2020^ through October 31, | |
SIMPLE Class | 2021 | 2020 | |
Net asset value at beginning of period | $9.13 | $8.84 | $8.83** |
Net investment income (loss) (a) | 0.11 | 0.22 | 0.04 |
Net realized and unrealized gain (loss) | (0.16) | 0.28 | 0.01 |
Total from investment operations | (0.05) | 0.50 | 0.05 |
Less distributions: | |||
From net investment income | (0.11) | (0.21) | (0.04) |
Net asset value at end of period | $8.97 | $9.13 | $8.84 |
Total investment return (b) | (0.68)% | 5.67% | 0.57% |
Ratios (to average net assets)/Supplemental Data: | |||
Net investment income (loss) | 2.43%†† | 2.42% | 2.72%†† |
Net expenses (c) | 1.33%†† | 1.38% | 1.37%†† |
Portfolio turnover rate | 8% | 22% | 22% |
Net assets at end of period (in 000’s) | $26 | $27 | $25 |
* | Unaudited. |
^ | Inception date. |
** | Based on the net asset value of Investor Class as of August 31, 2020. |
†† | Annualized. |
(a) | Per share data based on average shares outstanding during the period. |
(b) | Total investment return is calculated exclusive of sales charges and assumes the reinvestment of dividends and distributions. SIMPLE Class shares are not subject to sales charges. For periods of less than one year, total return is not annualized. |
(c) | In addition to the fees and expenses which the Fund bears directly, it also indirectly bears a pro-rata share of the fees and expenses of the underlying funds in which it invests. Such indirect expenses are not included in the above expense ratios. |
46 | MainStay Floating Rate Fund |
Class | Commenced Operations |
Class A | May 3, 2004 |
Investor Class | February 28, 2008 |
Class B | May 3, 2004 |
Class C | May 3, 2004 |
Class I | May 3, 2004 |
Class R3 | February 29, 2016 |
Class R6 | February 28, 2019 |
SIMPLE Class | August 31, 2020 |
• Benchmark yields | • Reported trades |
• Broker/dealer quotes | • Issuer spreads |
• Two-sided markets | • Benchmark securities |
• Bids/offers | • Reference data (corporate actions or material event notices) |
• Industry and economic events | • Comparable bonds |
• Monthly payment information |
48 | MainStay Floating Rate Fund |
50 | MainStay Floating Rate Fund |
52 | MainStay Floating Rate Fund |
Class R3 | $356 |
Class | Expense | Waived |
Class A | $240,455 | $— |
Investor Class | 20,226 | — |
Class B | 855 | — |
Class C | 60,236 | — |
Class I | 743,086 | — |
Class R3 | 382 | — |
Class R6 | 7,640 | — |
SIMPLE Class | 28 | — |
Class R6 | $27,491 | 0.0%‡ |
SIMPLE Class | 26,337 | 99.7 |
‡ | Less than one-tenth of a percent. |
Federal Tax Cost | Gross Unrealized Appreciation | Gross Unrealized (Depreciation) | Net Unrealized Appreciation/ (Depreciation) | |
Investments in Securities | $3,101,522,299 | $1,566,683 | $(56,440,743) | $(54,874,060) |
Capital Loss Available Through | Short-Term Capital Loss Amounts (000’s) | Long-Term Capital Loss Amounts (000’s) |
Unlimited | $13,791 | $78,531 |
2021 | |
Distributions paid from: | |
Ordinary Income | $42,312,089 |
Borrower | Unfunded Commitments | Unrealized Appreciation/ (Depreciation) |
athenahealth Group, Inc., Initial Delayed Draw Term Loan 1.75%, due 2/15/29 | $2,505,797 | $(21,739) |
Element Materials Technology Group US Holdings, Inc., Term Loan B TBD, due 4/30/29 | 882,276 | (1,935) |
Hillman Group, Inc. (The), Initial Delayed Draw Term Loan 2.75%-3.381% (1 Month LIBOR + 2.75%), due 7/14/28 | 352,071 | (10,235) |
LTI Holdings, Inc., First Lien Third Amendment Delayed Draw Term Loan 4.75%, due 7/24/26 | 245,937 | (2,812) |
Medical Solutions Holdings, Inc., First Lien Delayed Draw Term Loan 3.50%, due 11/1/28 | 326,194 | (1,303) |
Osmosis Buyer Ltd., Delayed Draw Term Loan TBD, due 7/31/28 | 910,494 | (8,488) |
Pediatric Associates Holding Co. LLC, Amendment No. 1 Incremental Delayed Draw Term Loan 1.625%-4.924% (1 Year LIBOR + 3.25%), due 12/29/28 | 709,890 | (5,538) |
Perrigo Co. plc, Delayed Draw Term Loan B TBD, due 4/20/29 | 1,809,091 | 4,546 |
Pro Mach Group, Inc., First Lien Delayed Draw Term Loan 4.00%, due 8/31/28 | 409,174 | (2,401) |
Sovos Compliance LLC, First Lien Delayed Draw Term Loan 4.50%, due 8/11/28 | 661,636 | (1,035) |
Trident TPI Holdings, Inc., Tranche Delayed Draw Term Loan B3 4.00%-4.763% (1 Month LIBOR + 4.00%), due 9/15/28 | 171,850 | (2,433) |
Total | $8,984,410 | $(53,373) |
54 | MainStay Floating Rate Fund |
Class A | Shares | Amount |
Six-month period ended April 30, 2022: | ||
Shares sold | 22,554,885 | $204,293,376 |
Shares issued to shareholders in reinvestment of distributions | 627,897 | 5,676,589 |
Shares redeemed | (7,666,933) | (69,395,240) |
Net increase (decrease) in shares outstanding before conversion | 15,515,849 | 140,574,725 |
Shares converted into Class A (See Note 1) | 329,133 | 2,983,145 |
Shares converted from Class A (See Note 1) | (19,432) | (175,656) |
Net increase (decrease) | 15,825,550 | $143,382,214 |
Year ended October 31, 2021: | ||
Shares sold | 19,130,520 | $174,474,811 |
Shares issued to shareholders in reinvestment of distributions | 887,554 | 8,087,241 |
Shares redeemed | (8,690,176) | (79,145,455) |
Net increase (decrease) in shares outstanding before conversion | 11,327,898 | 103,416,597 |
Shares converted into Class A (See Note 1) | 634,834 | 5,784,533 |
Shares converted from Class A (See Note 1) | (45,793) | (417,965) |
Net increase (decrease) | 11,916,939 | $108,783,165 |
Investor Class | Shares | Amount |
Six-month period ended April 30, 2022: | ||
Shares sold | 339,529 | $3,078,458 |
Shares issued to shareholders in reinvestment of distributions | 27,169 | 245,806 |
Shares redeemed | (146,903) | (1,330,116) |
Net increase (decrease) in shares outstanding before conversion | 219,795 | 1,994,148 |
Shares converted into Investor Class (See Note 1) | 29,857 | 268,679 |
Shares converted from Investor Class (See Note 1) | (255,490) | (2,317,858) |
Net increase (decrease) | (5,838) | $(55,031) |
Year ended October 31, 2021: | ||
Shares sold | 200,028 | $1,823,959 |
Shares issued to shareholders in reinvestment of distributions | 54,913 | 500,217 |
Shares redeemed | (307,461) | (2,798,762) |
Net increase (decrease) in shares outstanding before conversion | (52,520) | (474,586) |
Shares converted into Investor Class (See Note 1) | 137,170 | 1,250,762 |
Shares converted from Investor Class (See Note 1) | (295,804) | (2,693,975) |
Net increase (decrease) | (211,154) | $(1,917,799) |
Class B | Shares | Amount |
Six-month period ended April 30, 2022: | ||
Shares sold | 10,521 | $94,759 |
Shares issued to shareholders in reinvestment of distributions | 615 | 5,566 |
Shares redeemed | (13,462) | (121,973) |
Net increase (decrease) in shares outstanding before conversion | (2,326) | (21,648) |
Shares converted from Class B (See Note 1) | (11,314) | (102,017) |
Net increase (decrease) | (13,640) | $(123,665) |
Year ended October 31, 2021: | ||
Shares sold | 9,395 | $85,777 |
Shares issued to shareholders in reinvestment of distributions | 1,661 | 15,130 |
Shares redeemed | (58,224) | (529,413) |
Net increase (decrease) in shares outstanding before conversion | (47,168) | (428,506) |
Shares converted from Class B (See Note 1) | (33,720) | (307,007) |
Net increase (decrease) | (80,888) | $(735,513) |
Class C | Shares | Amount |
Six-month period ended April 30, 2022: | ||
Shares sold | 2,436,787 | $22,060,572 |
Shares issued to shareholders in reinvestment of distributions | 56,787 | 513,842 |
Shares redeemed | (803,505) | (7,264,427) |
Net increase (decrease) in shares outstanding before conversion | 1,690,069 | 15,309,987 |
Shares converted from Class C (See Note 1) | (79,623) | (718,335) |
Net increase (decrease) | 1,610,446 | $14,591,652 |
Year ended October 31, 2021: | ||
Shares sold | 2,111,531 | $19,264,168 |
Shares issued to shareholders in reinvestment of distributions | 102,737 | 936,012 |
Shares redeemed | (2,269,084) | (20,671,775) |
Net increase (decrease) in shares outstanding before conversion | (54,816) | (471,595) |
Shares converted from Class C (See Note 1) | (430,562) | (3,925,910) |
Net increase (decrease) | (485,378) | $(4,397,505) |
Class I | Shares | Amount |
Six-month period ended April 30, 2022: | ||
Shares sold | 88,934,600 | $805,967,290 |
Shares issued to shareholders in reinvestment of distributions | 1,833,097 | 16,574,064 |
Shares redeemed | (30,307,998) | (274,100,389) |
Net increase (decrease) in shares outstanding before conversion | 60,459,699 | 548,440,965 |
Shares converted into Class I (See Note 1) | 17,271 | 156,244 |
Net increase (decrease) | 60,476,970 | $548,597,209 |
Year ended October 31, 2021: | ||
Shares sold | 106,428,988 | $971,333,702 |
Shares issued to shareholders in reinvestment of distributions | 2,220,304 | 20,243,944 |
Shares redeemed | (29,129,683) | (265,438,036) |
Net increase (decrease) in shares outstanding before conversion | 79,519,609 | 726,139,610 |
Shares converted into Class I (See Note 1) | 45,818 | 418,205 |
Net increase (decrease) | 79,565,427 | $726,557,815 |
Class R3 | Shares | Amount |
Six-month period ended April 30, 2022: | ||
Shares sold | 22,489 | $203,962 |
Shares issued to shareholders in reinvestment of distributions | 548 | 4,957 |
Shares redeemed | (6,619) | (58,785) |
Net increase (decrease) | 16,418 | $150,134 |
Year ended October 31, 2021: | ||
Shares sold | 28,824 | $262,708 |
Shares issued to shareholders in reinvestment of distributions | 1,061 | 9,671 |
Shares redeemed | (21,196) | (193,454) |
Net increase (decrease) | 8,689 | $78,925 |
56 | MainStay Floating Rate Fund |
Class R6 | Shares | Amount |
Six-month period ended April 30, 2022: | ||
Shares sold | 9,159,773 | $83,067,596 |
Shares issued to shareholders in reinvestment of distributions | 657,618 | 5,951,921 |
Shares redeemed | (4,826,409) | (43,703,467) |
Net increase (decrease) in shares outstanding before conversion | 4,990,982 | 45,316,050 |
Shares converted from Class R6 (See Note 1) | (10,350) | (94,202) |
Net increase (decrease) | 4,980,632 | $45,221,848 |
Year ended October 31, 2021: | ||
Shares sold | 30,049,408 | $274,180,812 |
Shares issued to shareholders in reinvestment of distributions | 824,900 | 7,524,282 |
Shares redeemed | (4,323,892) | (39,409,173) |
Net increase (decrease) in shares outstanding before conversion | 26,550,416 | 242,295,921 |
Shares converted from Class R6 (See Note 1) | (11,900) | (108,643) |
Net increase (decrease) | 26,538,516 | $242,187,278 |
SIMPLE Class | Shares | Amount |
Six-month period ended April 30, 2022: | ||
Shares issued to shareholders in reinvestment of distributions | 35 | $318 |
Net increase (decrease) | 35 | $318 |
Year ended October 31, 2021: | ||
Shares issued to shareholders in reinvestment of distributions | 66 | $603 |
Net increase (decrease) | 66 | $603 |
58 | MainStay Floating Rate Fund |
60 | MainStay Floating Rate Fund |
62 | MainStay Floating Rate Fund |
For more information
Message from the President and Semiannual Report
please log in to newyorklifeinvestments.com/accounts.
Not FDIC/NCUA Insured | Not a Deposit | May Lose Value | No Bank Guarantee | Not Insured by Any Government Agency |


5 | |
9 | |
11 | |
35 | |
41 | |
50 | |
54 | |
55 | |
55 |
Investors should refer to the Fund’s Summary Prospectus and/or Prospectus and consider the Fund’s investment objectives, strategies, risks, charges and expenses carefully before investing. The Summary Prospectus and/or Prospectus contain this and other information about the Fund. You may obtain copies of the Fund’s Summary Prospectus, Prospectus and Statement of Additional Information, which includes information about MainStay Funds Trust's Trustees, free of charge, upon request, by calling toll-free 800-624-6782, by writing to NYLIFE Distributors LLC, Attn: MainStay Marketing Department, 30 Hudson Street, Jersey City, NJ 07302 or by sending an e-mail to MainStayShareholderServices@nylim.com. These documents are also available via the MainStay Funds’ website at newyorklifeinvestments.com. Please read the Fund’s Summary Prospectus and/or Prospectus carefully before investing.

Average Annual Total Returns for the Period-Ended April 30, 2022 | ||||||||
Class | Sales Charge | Inception Date | Six Months1 | One Year | Five Years | Since Inception | Gross Expense Ratio2 | |
Class A Shares | Maximum 4.5% Initial Sales Charge | With sales charges | 2/28/2013 | -14.29% | -14.09% | 0.84% | 2.22% | 0.75% |
Excluding sales charges | -10.25 | -10.04 | 1.78 | 2.74 | 0.75 | |||
Investor Class Shares3 | Maximum 4% Initial Sales Charge | With sales charges | 2/28/2013 | -13.85 | -13.65 | 0.82 | 2.17 | 0.77 |
Excluding sales charges | -10.26 | -10.06 | 1.75 | 2.68 | 0.77 | |||
Class C Shares | Maximum 1% CDSC | With sales charges | 2/28/2013 | -11.26 | -11.24 | 1.50 | 2.42 | 1.02 |
if Redeemed Within One Year of Purchase | Excluding sales charges | -10.37 | -10.36 | 1.50 | 2.42 | 1.02 | ||
Class C2 Shares | Maximum 1% CDSC | With sales charges | 8/31/2020 | -11.33 | -11.38 | N/A | -4.64 | 1.17 |
if Redeemed Within One Year of Purchase | Excluding sales charges | -10.44 | -10.50 | N/A | -4.64 | 1.17 | ||
Class I Shares | No Sales Charge | 2/28/2013 | -10.14 | -9.90 | 2.03 | 3.00 | 0.50 | |
Class R6 Shares | No Sales Charge | 11/1/2019 | -10.03 | -9.78 | N/A | -1.45 | 0.48 | |
1. | Not annualized. |
2. | The gross expense ratios presented reflect the Fund’s “Total Annual Fund Operating Expenses” from the most recent Prospectus, as supplemented, and may differ from other expense ratios disclosed in this report. |
3. | Prior to June 30, 2020, the maximum initial sales charge was 4.5%, which is reflected in the applicable average annual total return figures shown. |
Benchmark Performance* | Six Months1 | One Year | Five Years | Since Inception |
Bloomberg California Municipal Bond Index2 | -8.20% | -8.20% | 1.67% | 2.30% |
Morningstar Muni California Long Category Average3 | -9.21 | -8.87 | 1.58 | 2.24 |
* | Returns for indices reflect no deductions for fees, expenses or taxes, except for foreign withholding taxes where applicable. |
1. | Not annualized. |
2. | The Bloomberg California Municipal Bond Index is the Fund's primary broad-based securities market index for comparison purposes. The Bloomberg California Municipal Bond Index is a market value weighted index of California investment grade tax exempt fixed-rate municipal bonds with maturities of one year or more. Results assume reinvestment of all dividends and capital gains. An investment cannot be made directly in an index. |
3. | The Morningstar Muni California Long Category Average is representative of funds that invest at least 80% of assets in California municipal debt. These portfolios have durations of more than 7.0 years. Results are based on average total returns of similar funds with all dividends and capital gain distributions reinvested. |
6 | MainStay MacKay California Tax Free Opportunities Fund |
Share Class | Beginning Account Value 11/1/21 | Ending Account Value (Based on Actual Returns and Expenses) 4/30/22 | Expenses Paid During Period1 | Ending Account Value (Based on Hypothetical 5% Annualized Return and Actual Expenses) 4/30/22 | Expenses Paid During Period1 | Net Expense Ratio During Period2 |
Class A Shares | $1,000.00 | $897.50 | $3.53 | $1,021.08 | $3.76 | 0.75% |
Investor Class Shares | $1,000.00 | $897.40 | $3.62 | $1,020.98 | $3.86 | 0.77% |
Class C Shares | $1,000.00 | $896.30 | $4.80 | $1,019.74 | $5.11 | 1.02% |
Class C2 Shares | $1,000.00 | $895.60 | $5.50 | $1,018.99 | $5.86 | 1.17% |
Class I Shares | $1,000.00 | $898.60 | $2.35 | $1,022.32 | $2.51 | 0.50% |
Class R6 Shares | $1,000.00 | $899.70 | $2.21 | $1,022.46 | $2.36 | 0.47% |
1. | Expenses are equal to the Fund’s annualized expense ratio of each class multiplied by the average account value over the period, divided by 365 and multiplied by 181 (to reflect the six-month period). The table above represents the actual expenses incurred during the six-month period. In addition to the fees and expenses which the Fund bears directly, it also indirectly bears a pro rata share of the fees and expenses of the underlying funds in which it invests. Such indirect expenses are not included in the above-reported expense figures. |
2. | Expenses are equal to the Fund's annualized expense ratio to reflect the six-month period. |
Industry Composition as of April 30, 2022 (Unaudited)
General Obligation | 39.4% |
Other Revenue | 23.5 |
Transportation | 10.4 |
Water & Sewer | 7.6 |
Hospital | 5.6 |
Education | 5.5 |
Housing | 3.0 |
Utilities | 2.3% |
General | 1.5 |
Certificate of Participation/Lease | 0.8 |
Development | 0.2 |
Other Assets, Less Liabilities | 0.2 |
100.0% |
Top Ten Holdings and/or Issuers Held as of April 30, 2022 (excluding short-term investments) (Unaudited)
1. | California Municipal Finance Authority, 3.00%-5.30%, due 2/1/27–10/1/54 |
2. | California Health Facilities Financing Authority, 3.00%-5.00%, due 9/1/30–8/15/51 |
3. | State of California, 3.00%-5.00%, due 11/1/27–4/1/49 |
4. | City of Los Angeles CA, 3.00%-5.25%, due 5/15/25–5/15/51 |
5. | Long Beach Unified School District, 3.00%-5.00%, due 8/1/32–8/1/48 |
6. | Anaheim Public Financing Authority, 5.00%, due 9/1/26–9/1/35 |
7. | San Francisco City & County Airport Commission, 5.00%-5.25%, due 5/1/27–5/1/48 |
8. | California Statewide Communities Development Authority, 3.00%-6.375%, due 6/1/29–4/1/51 |
9. | Puerto Rico Sales Tax Financing Corp., 4.50%-5.00%, due 7/1/34–7/1/58 |
10. | CSCDA Community Improvement Authority, 2.65%-5.00%, due 12/1/46–5/1/57 |
8 | MainStay MacKay California Tax Free Opportunities Fund |
10 | MainStay MacKay California Tax Free Opportunities Fund |
Principal Amount | Value | |
Municipal Bonds 99.8% | ||
Long-Term Municipal Bonds 99.8% | ||
Certificate of Participation/Lease 0.8% | ||
City of Newark CA, 2019 Financing Project, Certificate of Participation | ||
3.00%, due 6/1/41 | $ 650,000 | $ 560,342 |
County of San Bernardino CA, Certificate of Participation | ||
Series A | ||
5.00%, due 10/1/24 | 5,000,000 | 5,301,899 |
Mesa Water District, Certificate of Participation | ||
4.00%, due 3/15/45 | 1,450,000 | 1,473,176 |
Oxnard School District, Property Acquisition and Improvement Project, Certificate of Participation | ||
Insured: BAM | ||
5.00%, due 8/1/45 (a) | 1,000,000 | 1,072,723 |
8,408,140 | ||
Development 0.2% | ||
City of Irvine CA, Reassessment District No. 19-1, Special Assessment | ||
5.00%, due 9/2/44 | 1,800,000 | 1,974,016 |
Education 5.5% | ||
California Educational Facilities Authority, Leland Stanford Junior University (The), Revenue Bonds | ||
Series V-2 | ||
2.25%, due 4/1/51 | 1,990,000 | 1,369,353 |
California Educational Facilities Authority, Loma Linda University, Revenue Bonds | ||
Series A | ||
5.00%, due 4/1/23 | 570,000 | 584,941 |
Series A | ||
5.00%, due 4/1/24 | 280,000 | 293,131 |
California Educational Facilities Authority, Loyola Marymount University, Green Bond, Revenue Bonds | ||
Series B | ||
5.00%, due 10/1/31 | 525,000 | 584,592 |
Series B | ||
5.00%, due 10/1/35 | 640,000 | 704,988 |
Principal Amount | Value | |
Education (continued) | ||
California Educational Facilities Authority, Mount St. Mary's University, Revenue Bonds | ||
Series A | ||
5.00%, due 10/1/38 | $ 620,000 | $ 677,233 |
California Enterprise Development Authority, Thacher School Project (The), Revenue Bonds | ||
4.00%, due 9/1/44 | 3,450,000 | 3,484,163 |
California Infrastructure and Economic Development Bank, Equitable School Revolving Fund LLC Obligated Group, Revenue Bonds | ||
Series B | ||
5.00%, due 11/1/39 | 300,000 | 323,587 |
Series B | ||
5.00%, due 11/1/44 | 350,000 | 374,948 |
Series B | ||
5.00%, due 11/1/49 | 500,000 | 532,250 |
California Infrastructure and Economic Development Bank, Equitable School Revolving Fund LLC Obligated Group, Green Bond, Revenue Bonds | ||
Series B | ||
4.00%, due 11/1/45 | 850,000 | 834,382 |
Series B | ||
4.00%, due 11/1/55 | 915,000 | 872,742 |
California Infrastructure and Economic Development Bank, WFCS Portfolio Projects, Revenue Bonds | ||
Series A-1 | ||
5.00%, due 1/1/56 (b) | 840,000 | 794,279 |
California Infrastructure and Economic Development Bank, Wonderful Foundations Charter School Portfolio Project, Revenue Bonds | ||
Series A | ||
5.00%, due 1/1/55 (b) | 2,645,000 | 2,506,520 |
California Municipal Finance Authority, California Baptist University, Revenue Bonds | ||
Series A | ||
5.00%, due 11/1/46 (b) | 1,000,000 | 1,052,527 |
California Municipal Finance Authority, California Lutheran University, Revenue Bonds | ||
5.00%, due 10/1/31 | 235,000 | 255,253 |
Principal Amount | Value | |
Long-Term Municipal Bonds (continued) | ||
Education (continued) | ||
California Municipal Finance Authority, California Lutheran University, Revenue Bonds (continued) | ||
5.00%, due 10/1/33 | $ 225,000 | $ 243,760 |
5.00%, due 10/1/35 | 225,000 | 242,976 |
5.00%, due 10/1/36 | 285,000 | 307,315 |
5.00%, due 10/1/37 | 310,000 | 333,889 |
California Municipal Finance Authority, Charter School, King Chavez Academy, Revenue Bonds (b) | ||
Series A | ||
5.00%, due 5/1/36 | 1,275,000 | 1,306,494 |
Series A | ||
5.00%, due 5/1/46 | 1,325,000 | 1,342,207 |
California Municipal Finance Authority, Charter School, Palmdale Aerospace Academy Projects (The), Revenue Bonds (b) | ||
Series A | ||
5.00%, due 7/1/36 | 1,300,000 | 1,332,766 |
Series A | ||
5.00%, due 7/1/46 | 795,000 | 807,170 |
California Municipal Finance Authority, Claremont Graduate University, Revenue Bonds | ||
Series B | ||
5.00%, due 10/1/54 (b) | 1,380,000 | 1,381,816 |
California Municipal Finance Authority, Creative Center Los Altos Project (The), Revenue Bonds (b) | ||
Series B | ||
4.00%, due 11/1/36 | 400,000 | 354,926 |
Series B | ||
4.50%, due 11/1/46 | 1,600,000 | 1,391,919 |
California Municipal Finance Authority, National University, Revenue Bonds | ||
Series A | ||
5.00%, due 4/1/31 | 1,000,000 | 1,119,218 |
California Municipal Finance Authority, Partnerships to Uplift Community Project, Revenue Bonds | ||
Series A | ||
5.30%, due 8/1/47 | 500,000 | 500,709 |
California Municipal Finance Authority, Pomona College, Revenue Bonds | ||
4.00%, due 1/1/43 | 10,000,000 | 10,781,451 |
Principal Amount | Value | |
Education (continued) | ||
California Municipal Finance Authority, Southern California Institute of Architecture Project, Revenue Bonds | ||
5.00%, due 12/1/38 | $ 845,000 | $ 895,703 |
California Municipal Finance Authority, Southwestern Law School, Revenue Bonds | ||
4.00%, due 11/1/31 | 175,000 | 179,735 |
4.00%, due 11/1/32 | 240,000 | 244,948 |
4.00%, due 11/1/33 | 250,000 | 254,226 |
4.00%, due 11/1/34 | 260,000 | 263,556 |
4.00%, due 11/1/35 | 275,000 | 277,722 |
4.00%, due 11/1/36 | 210,000 | 211,627 |
California Public Finance Authority, California University of Science & Medicine Obligated Group, Revenue Bonds | ||
Series A | ||
6.25%, due 7/1/54 (b) | 1,000,000 | 1,095,737 |
California School Facilities Financing Authority, Azusa Unified School District, Revenue Bonds | ||
Insured: AGM | ||
(zero coupon), due 8/1/49 | 7,905,000 | 1,893,865 |
California School Finance Authority, Aspire Public Schools Obligated Group, Revenue Bonds (b) | ||
5.00%, due 8/1/27 | 25,000 | 26,960 |
5.00%, due 8/1/27 | 475,000 | 497,300 |
5.00%, due 8/1/28 | 50,000 | 53,920 |
5.00%, due 8/1/28 | 650,000 | 678,607 |
5.00%, due 8/1/36 | 50,000 | 53,920 |
5.00%, due 8/1/36 | 550,000 | 563,905 |
5.00%, due 8/1/41 | 50,000 | 53,920 |
5.00%, due 8/1/41 | 700,000 | 715,199 |
5.00%, due 8/1/46 | 75,000 | 80,880 |
5.00%, due 8/1/46 | 900,000 | 915,520 |
California School Finance Authority, Classical Academies Project, Revenue Bonds | ||
Series A | ||
5.00%, due 10/1/37 (b) | 1,485,000 | 1,542,584 |
California School Finance Authority, Grimmway Schools Obligated Group, Revenue Bonds | ||
Series A | ||
5.00%, due 7/1/46 (b) | 750,000 | 760,347 |
12 | MainStay MacKay California Tax Free Opportunities Fund |
Principal Amount | Value | |
Long-Term Municipal Bonds (continued) | ||
Education (continued) | ||
California School Finance Authority, High Tech High Learning Project, Revenue Bonds (b) | ||
Series A | ||
5.00%, due 7/1/37 | $ 500,000 | $ 509,295 |
Series A | ||
5.00%, due 7/1/49 | 500,000 | 502,902 |
California School Finance Authority, Kipp Social Public Schools Project, Revenue Bonds | ||
Series A | ||
5.00%, due 7/1/34 | 600,000 | 612,269 |
California School Finance Authority, Vista Charter Public Schools, Revenue Bonds | ||
Series A | ||
4.00%, due 6/1/51 (b) | 1,790,000 | 1,476,678 |
California State University, Systemwide, Revenue Bonds | ||
Series A | ||
4.00%, due 11/1/37 | 2,375,000 | 2,409,092 |
California Statewide Communities Development Authority, Lancer Plaza Project, Revenue Bonds | ||
5.875%, due 11/1/43 | 1,000,000 | 1,029,868 |
Del Mar Union School District Community Facilities District No. 99-1, Special Tax | ||
Insured: BAM | ||
4.00%, due 9/1/44 | 1,450,000 | 1,459,747 |
Irvine Unified School District, Community Facilities District No. 9, Special Tax | ||
Series A | ||
5.00%, due 9/1/33 | 410,000 | 449,073 |
Series A | ||
5.00%, due 9/1/34 | 225,000 | 245,975 |
Series A | ||
5.00%, due 9/1/36 | 550,000 | 599,610 |
Rio Elementary School District Community Facilities District, Special Tax | ||
Insured: BAM | ||
5.00%, due 9/1/35 | 500,000 | 535,890 |
57,782,085 | ||
Principal Amount | Value | |
General 1.5% | ||
Cathedral City Redevelopment Agency Successor Agency, Merged Redevelopment Project Area, Tax Allocation | ||
Series A, Insured: AGM | ||
5.00%, due 8/1/26 | $ 1,000,000 | $ 1,050,511 |
Series A, Insured: AGM | ||
5.00%, due 8/1/34 | 1,000,000 | 1,051,020 |
City of Irvine CA, Community Facilities District No. 2013-3, Special Tax | ||
5.00%, due 9/1/49 | 1,385,000 | 1,429,505 |
City of Palm Desert CA, University Park, Special Tax | ||
3.00%, due 9/1/31 | 420,000 | 378,232 |
4.00%, due 9/1/41 | 450,000 | 425,364 |
City of Rocklin CA, Community Facilities District No. 10, Special Tax | ||
5.00%, due 9/1/39 | 1,150,000 | 1,195,247 |
City of South San Francisco CA, Community Facilities District No. 2021-01, Special Tax | ||
4.00%, due 9/1/44 | 500,000 | 464,682 |
Greenfield Redevelopment Agency, Tax Allocation | ||
Insured: BAM | ||
4.00%, due 2/1/26 | 285,000 | 298,927 |
Madera Redevelopment Agency Successor Agency, Tax Allocation | ||
Series A | ||
5.00%, due 9/1/37 | 1,180,000 | 1,310,681 |
Mountain View Shoreline Regional Park Community, Tax Allocation | ||
Series A, Insured: AGM | ||
5.00%, due 8/1/36 | 1,645,000 | 1,823,409 |
Riverside County Public Financing Authority, Desert Communities & Interstate 215 Corridor Projects, Tax Allocation | ||
Series A, Insured: BAM | ||
4.00%, due 10/1/40 | 1,000,000 | 1,013,918 |
Riverside County Public Financing Authority, Project Area No. 1 Desert Communities & Interstate 215 Corridor Project, Tax Allocation | ||
Series A, Insured: BAM | ||
4.00%, due 10/1/32 | 1,050,000 | 1,076,324 |
Principal Amount | Value | |
Long-Term Municipal Bonds (continued) | ||
General (continued) | ||
San Francisco City & County Redevelopment Agency, Mission Bay South Redevelopment Project, Tax Allocation | ||
Series C | ||
5.00%, due 8/1/36 | $ 1,250,000 | $ 1,362,059 |
South Orange County Public Financing Authority, Special Tax, Senior Lien | ||
Series A | ||
5.00%, due 8/15/32 | 775,000 | 806,972 |
Transbay Joint Powers Authority, Green Bond, Tax Allocation, Senior Lien | ||
Series A | ||
5.00%, due 10/1/45 | 1,000,000 | 1,083,228 |
Series A | ||
5.00%, due 10/1/49 | 1,200,000 | 1,296,081 |
16,066,160 | ||
General Obligation 39.4% | ||
Alta Loma School District, Unlimited General Obligation | ||
Series B | ||
5.00%, due 8/1/44 | 3,375,000 | 3,687,105 |
Alvord Unified School District, Election 2012, Unlimited General Obligation | ||
Series A, Insured: AGM | ||
5.25%, due 8/1/37 | 825,000 | 857,207 |
Banning Unified School District, Election 2016, Unlimited General Obligation | ||
Series A, Insured: AGM | ||
4.00%, due 8/1/46 | 500,000 | 498,333 |
Beverly Hills Unified School District, Election 2018, Unlimited General Obligation | ||
Series B | ||
4.00%, due 8/1/38 | 3,475,000 | 3,618,610 |
Brawley Union High School District, Election 2018, Unlimited General Obligation | ||
Series A, Insured: BAM | ||
5.00%, due 8/1/44 | 1,280,000 | 1,377,303 |
Principal Amount | Value | |
General Obligation (continued) | ||
Buena Park School District, Election 2014, Unlimited General Obligation | ||
Insured: BAM | ||
4.00%, due 8/1/48 | $ 1,675,000 | $ 1,682,932 |
Cabrillo Unified School District, Election 2018, Unlimited General Obligation | ||
Series A | ||
5.00%, due 8/1/45 | 4,245,000 | 4,562,446 |
Calexico Unified School District, Unlimited General Obligation | ||
Insured: BAM | ||
3.00%, due 8/1/52 | 1,000,000 | 785,409 |
Center Unified School District, Election 2008, Unlimited General Obligation | ||
Series B, Insured: BAM | ||
3.00%, due 8/1/46 | 1,650,000 | 1,363,226 |
Central Union High School District, Election 2016, Unlimited General Obligation | ||
5.25%, due 8/1/46 | 2,000,000 | 2,166,813 |
Ceres Unified School District, Unlimited General Obligation | ||
Insured: BAM | ||
(zero coupon), due 8/1/37 | 500,000 | 262,931 |
Chaffey Joint Union High School District, Unlimited General Obligation | ||
Series D | ||
4.00%, due 8/1/49 | 5,000,000 | 4,960,894 |
Chino Valley Unified School District, Election 2016, Limited General Obligation | ||
Series B, Insured: AGM-CR | ||
3.375%, due 8/1/50 | 9,050,000 | 8,031,260 |
Series B | ||
4.00%, due 8/1/45 | 1,000,000 | 990,556 |
Chowchilla Elementary School District, Madera County, Unlimited General Obligation | ||
Series B | ||
5.00%, due 8/1/43 | 960,000 | 1,034,167 |
City & County of San Francisco CA, Unlimited General Obligation | ||
Series R-1 | ||
4.00%, due 6/15/32 | 1,000,000 | 1,052,153 |
14 | MainStay MacKay California Tax Free Opportunities Fund |
Principal Amount | Value | |
Long-Term Municipal Bonds (continued) | ||
General Obligation (continued) | ||
City of Foster City CA, Levee Protection Planning & Improvements Project, Unlimited General Obligation | ||
3.00%, due 8/1/45 | $ 5,500,000 | $ 4,689,218 |
Coast Community College District, Election 2012, Unlimited General Obligation | ||
Series F | ||
(zero coupon), due 8/1/42 | 5,000,000 | 2,141,800 |
Commonwealth of Puerto Rico, Unlimited General Obligation | ||
Series A-1 | ||
(zero coupon), due 7/1/24 | 435,488 | 396,210 |
Series A-1 | ||
(zero coupon), due 7/1/33 | 1,089,492 | 623,259 |
Series A-1 | ||
4.00%, due 7/1/33 | 846,598 | 787,168 |
Series A-1 | ||
4.00%, due 7/1/35 | 715,978 | 663,837 |
Series A-1 | ||
4.00%, due 7/1/37 | 750,000 | 676,091 |
Series A-1 | ||
4.00%, due 7/1/41 | 1,000,000 | 901,608 |
Series A-1 | ||
4.00%, due 7/1/46 | 750,000 | 659,813 |
Series A-1 | ||
5.25%, due 7/1/23 | 890,525 | 901,557 |
Series A-1 | ||
5.375%, due 7/1/25 | 942,873 | 974,842 |
Series A-1 | ||
5.625%, due 7/1/27 | 934,333 | 991,118 |
Series A-1 | ||
5.625%, due 7/1/29 | 919,176 | 990,566 |
Series A-1 | ||
5.75%, due 7/1/31 | 2,870,787 | 3,142,089 |
Compton Unified School District, Unlimited General Obligation | ||
Series B, Insured: BAM | ||
3.00%, due 6/1/49 | 3,125,000 | 2,498,204 |
Corona-Norco Unified School District, Election 2014, Unlimited General Obligation | ||
Series C | ||
4.00%, due 8/1/49 | 935,000 | 924,641 |
Principal Amount | Value | |
General Obligation (continued) | ||
Cuyama Joint Unified School District, Election 2016, Unlimited General Obligation | ||
Series B, Insured: AGM | ||
5.25%, due 8/1/48 | $ 500,000 | $ 540,876 |
Davis Joint Unified School District, Unlimited General Obligation | ||
Insured: BAM | ||
3.00%, due 8/1/38 | 4,190,000 | 3,763,282 |
Insured: BAM | ||
3.00%, due 8/1/41 | 4,695,000 | 4,078,593 |
Denair Unified School District, Election 2007, Unlimited General Obligation | ||
Insured: AGM | ||
(zero coupon), due 8/1/41 | 4,260,000 | 1,813,762 |
Desert Sands Unified School District, Unlimited General Obligation | ||
2.00%, due 8/1/40 | 1,100,000 | 792,762 |
Dublin Unified School District, Green Bond, Unlimited General Obligation | ||
Series C | ||
3.00%, due 8/1/41 | 3,000,000 | 2,606,129 |
El Monte Union High School District, Unlimited General Obligation | ||
Series A | ||
4.00%, due 6/1/38 | 1,195,000 | 1,213,888 |
El Rancho Unified School District, Election 2016, Unlimited General Obligation | ||
Series A, Insured: BAM | ||
5.25%, due 8/1/46 | 2,745,000 | 3,023,457 |
El Segundo Unified School District, Election 2018, Unlimited General Obligation | ||
Series B | ||
2.00%, due 8/1/46 | 395,000 | 261,230 |
Series B | ||
2.00%, due 8/1/47 | 880,000 | 574,357 |
Series B | ||
2.00%, due 8/1/48 | 130,000 | 83,448 |
Enterprise Elementary School District, Election 2018, Unlimited General Obligation | ||
Series B, Insured: AGM | ||
5.00%, due 8/1/49 | 4,130,000 | 4,425,255 |
Principal Amount | Value | |
Long-Term Municipal Bonds (continued) | ||
General Obligation (continued) | ||
Etiwanda School District, Election 2016, Unlimited General Obligation | ||
Series A | ||
4.00%, due 8/1/49 | $ 2,000,000 | $ 1,974,593 |
Eureka City Schools, Election 2014, Unlimited General Obligation | ||
Insured: BAM | ||
4.00%, due 8/1/49 | 3,500,000 | 3,444,211 |
Folsom Cordova Unified School District School Facilities Improvement Dist No. 5, Election 2014, Unlimited General Obligation | ||
Series A | ||
5.25%, due 10/1/35 | 4,710,000 | 5,073,827 |
Fremont Union High School District, Election 2018, Unlimited General Obligation | ||
Series B | ||
3.00%, due 8/1/34 | 1,000,000 | 973,704 |
Series B | ||
3.00%, due 8/1/35 | 2,500,000 | 2,369,819 |
Fresno Unified School District, Election 2010, Unlimited General Obligation | ||
Series F | ||
4.00%, due 8/1/32 | 1,475,000 | 1,529,019 |
Hartnell Community College District, Unlimited General Obligation | ||
Series A | ||
(zero coupon), due 8/1/37 | 2,500,000 | 1,356,089 |
Series B | ||
3.00%, due 8/1/38 | 375,000 | 341,556 |
Series B | ||
3.00%, due 8/1/40 | 525,000 | 461,879 |
Hayward Unified School District, Unlimited General Obligation | ||
Insured: BAM | ||
4.00%, due 8/1/43 | 5,000,000 | 5,009,223 |
Holtville Unified School District, Unlimited General Obligation | ||
Series A, Insured: AGM | ||
5.00%, due 8/1/44 | 1,240,000 | 1,358,532 |
Huntington Beach City School District, Election 2016, Unlimited General Obligation | ||
Series B | ||
4.00%, due 8/1/44 | 1,525,000 | 1,527,345 |
Principal Amount | Value | |
General Obligation (continued) | ||
Huntington Beach City School District, Election 2016, Unlimited General Obligation (continued) | ||
Series B | ||
4.00%, due 8/1/48 | $ 1,500,000 | $ 1,495,631 |
Inglewood Unified School District, Election 2012, Unlimited General Obligation | ||
Series B, Insured: BAM | ||
5.00%, due 8/1/25 | 250,000 | 268,144 |
Series C, Insured: BAM | ||
5.00%, due 8/1/32 | 400,000 | 439,430 |
Series C, Insured: BAM | ||
5.00%, due 8/1/34 | 585,000 | 641,177 |
Series B, Insured: BAM | ||
5.00%, due 8/1/35 | 800,000 | 865,119 |
Inglewood Unified School District, Election 2020, Unlimited General Obligation | ||
Series A, Insured: AGM | ||
4.00%, due 8/1/46 | 3,550,000 | 3,505,643 |
Jefferson Union High School District, Unlimited General Obligation | ||
Series A | ||
4.00%, due 8/1/45 | 1,250,000 | 1,251,667 |
Jurupa Unified School District, Unlimited General Obligation | ||
Series B | ||
5.00%, due 8/1/33 | 1,555,000 | 1,704,324 |
Series B | ||
5.00%, due 8/1/37 | 1,000,000 | 1,096,029 |
Jurupa Unified School District, Election 2014, Unlimited General Obligation | ||
Series C | ||
4.00%, due 8/1/43 | 1,675,000 | 1,693,149 |
Series C | ||
5.25%, due 8/1/43 | 2,000,000 | 2,238,421 |
Kerman Unified School District, Election 2016, Unlimited General Obligation | ||
Insured: BAM | ||
5.25%, due 8/1/46 | 1,755,000 | 1,933,030 |
Kern Community College District, Election 2016, Unlimited General Obligation | ||
Series C, Insured: BAM | ||
3.00%, due 8/1/46 | 3,000,000 | 2,535,225 |
16 | MainStay MacKay California Tax Free Opportunities Fund |
Principal Amount | Value | |
Long-Term Municipal Bonds (continued) | ||
General Obligation (continued) | ||
Kern Community College District, Facilities Improvement District No. 1, Unlimited General Obligation | ||
(zero coupon), due 8/1/23 | $ 2,000,000 | $ 1,922,684 |
Kern Community College District, Safety Repair & Improvement, Unlimited General Obligation | ||
Series C | ||
5.75%, due 11/1/34 | 650,000 | 683,920 |
La Mesa-Spring Valley School District, Election 2020, Unlimited General Obligation | ||
Series A, Insured: BAM | ||
4.00%, due 8/1/46 | 1,775,000 | 1,766,359 |
Lemoore Union High School District, Election 2016, Unlimited General Obligation | ||
Series A | ||
5.50%, due 8/1/42 | 560,000 | 626,977 |
Lennox School District, Election 2016, Unlimited General Obligation | ||
Insured: AGM | ||
4.00%, due 8/1/47 | 3,000,000 | 2,971,249 |
Livermore Valley Joint Unified School District, Unlimited General Obligation | ||
3.00%, due 8/1/40 | 2,890,000 | 2,550,942 |
Lodi Unified School District, Election 2016, Unlimited General Obligation | ||
Series 2020 | ||
3.00%, due 8/1/43 | 6,975,000 | 5,998,810 |
Series 2020 | ||
4.00%, due 8/1/38 | 2,830,000 | 2,876,005 |
Series 2020 | ||
4.00%, due 8/1/39 | 1,300,000 | 1,319,611 |
Long Beach Community College District, Unlimited General Obligation | ||
Series C | ||
4.00%, due 8/1/49 | 3,000,000 | 2,976,536 |
Long Beach Community College District, Election 2008, Unlimited General Obligation | ||
Series B | ||
5.00%, due 8/1/29 | 85,000 | 85,767 |
Principal Amount | Value | |
General Obligation (continued) | ||
Long Beach Unified School District, Unlimited General Obligation | ||
Series A | ||
4.00%, due 8/1/43 | $ 6,500,000 | $ 6,528,560 |
Long Beach Unified School District, Election 2008, Unlimited General Obligation | ||
Series F | ||
3.00%, due 8/1/47 | 4,000,000 | 3,280,095 |
Long Beach Unified School District, Election 2016, Unlimited General Obligation | ||
Series B | ||
3.00%, due 8/1/48 | 7,500,000 | 6,107,360 |
Series A | ||
5.00%, due 8/1/32 | 3,985,000 | 4,317,655 |
Series A | ||
5.00%, due 8/1/33 | 2,825,000 | 3,054,952 |
Los Angeles Community College District, Unlimited General Obligation | ||
Series I | ||
4.00%, due 8/1/33 | 2,865,000 | 2,960,813 |
Series I | ||
4.00%, due 8/1/34 | 4,000,000 | 4,114,380 |
Los Angeles Unified School District, Unlimited General Obligation | ||
Series C | ||
4.00%, due 7/1/36 | 3,125,000 | 3,224,816 |
Series C | ||
4.00%, due 7/1/38 | 1,000,000 | 1,024,074 |
Series C | ||
4.00%, due 7/1/39 | 3,875,000 | 3,945,112 |
Series A | ||
5.00%, due 7/1/25 | 1,250,000 | 1,343,353 |
Los Angeles Unified School District, Election 2005, Unlimited General Obligation | ||
Series M-1 | ||
5.25%, due 7/1/42 | 2,990,000 | 3,299,753 |
Los Rios Community College District, Unlimited General Obligation | ||
Series D | ||
4.00%, due 8/1/35 | 250,000 | 256,770 |
Series D | ||
4.00%, due 8/1/39 | 1,000,000 | 1,015,085 |
Principal Amount | Value | |
Long-Term Municipal Bonds (continued) | ||
General Obligation (continued) | ||
Lucia Mar Unified School District, Unlimited General Obligation | ||
Series C | ||
4.00%, due 8/1/49 | $ 1,500,000 | $ 1,480,945 |
Lucia Mar Unified School District, Election 2016, Unlimited General Obligation | ||
Series C, Insured: BAM | ||
3.00%, due 8/1/47 | 7,000,000 | 5,873,517 |
Manteca Unified School District, Unlimited General Obligation | ||
Series C | ||
4.00%, due 8/1/45 | 2,000,000 | 1,972,223 |
Marysville Joint Unified School District, Election 2008, Unlimited General Obligation | ||
Insured: AGM | ||
(zero coupon), due 8/1/35 | 1,500,000 | 879,703 |
Insured: AGM | ||
(zero coupon), due 8/1/36 | 2,000,000 | 1,115,362 |
Insured: AGM | ||
(zero coupon), due 8/1/37 | 2,000,000 | 1,063,032 |
Mendocino Unified School District, Election 2020, Unlimited General Obligation | ||
Series B | ||
3.00%, due 8/1/51 | 1,500,000 | 1,204,018 |
Moraga Elementary School District, Election 2016, Unlimited General Obligation | ||
Series B | ||
3.00%, due 8/1/44 | 1,335,000 | 1,138,138 |
Moreno Valley Unified School District, Election 2014, Unlimited General Obligation | ||
Series B, Insured: AGM | ||
5.00%, due 8/1/47 | 3,250,000 | 3,580,379 |
Mount Diablo Unified School District, Unlimited General Obligation | ||
Series B | ||
4.00%, due 8/1/29 | 1,000,000 | 1,072,449 |
Mount San Jacinto Community College District, Election 2014, Unlimited General Obligation | ||
Series B | ||
4.00%, due 8/1/38 | 1,985,000 | 2,022,771 |
Principal Amount | Value | |
General Obligation (continued) | ||
Mountain View-Whisman School District, Election 2020, Unlimited General Obligation | ||
Series A | ||
3.00%, due 9/1/34 | $ 505,000 | $ 491,567 |
Series A | ||
3.00%, due 9/1/36 | 750,000 | 696,804 |
Series A | ||
3.00%, due 9/1/40 | 1,160,000 | 1,032,097 |
Napa Valley Unified School District, Election 2016, Unlimited General Obligation | ||
Series C, Insured: AGM | ||
4.00%, due 8/1/44 | 5,500,000 | 5,481,258 |
Needles Unified School District, Capital Appreciation, Election 2008, Unlimited General Obligation | ||
Series B, Insured: AGM | ||
(zero coupon), due 8/1/45 | 1,250,000 | 1,058,829 |
Newport Mesa Unified School District, Capital Appreciation, Election 2005, Unlimited General Obligation | ||
Series 2007, Insured: NATL-RE | ||
(zero coupon), due 8/1/30 | 4,000,000 | 3,081,826 |
North Orange County Community College District, Election 2014, Unlimited General Obligation | ||
Series B | ||
4.00%, due 8/1/32 | 450,000 | 475,719 |
Series B | ||
4.00%, due 8/1/33 | 300,000 | 315,575 |
Norwalk-La Mirada Unified School District, Election 2014, Unlimited General Obligation | ||
Series E | ||
3.00%, due 8/1/46 | 2,250,000 | 1,890,664 |
Oakland Unified School District, Election 2020, Unlimited General Obligation | ||
Series A, Insured: BAM | ||
4.00%, due 8/1/46 | 1,495,000 | 1,483,148 |
Oceanside Unified School District, Unlimited General Obligation | ||
Series C | ||
(zero coupon), due 8/1/51 | 25,000 | 3,978 |
18 | MainStay MacKay California Tax Free Opportunities Fund |
Principal Amount | Value | |
Long-Term Municipal Bonds (continued) | ||
General Obligation (continued) | ||
Oxnard Union High School District, Election 2018, Unlimited General Obligation | ||
Series A | ��� | |
4.00%, due 8/1/38 | $ 1,000,000 | $ 1,014,562 |
Series B | ||
4.00%, due 8/1/42 | 1,500,000 | 1,519,640 |
Palo Verde Community College District, Election 2014, Unlimited General Obligation | ||
Series A, Insured: AGM | ||
4.00%, due 8/1/45 | 500,000 | 498,261 |
Palomar Community College District, Election 2006, Unlimited General Obligation | ||
Series B | ||
(zero coupon), due 8/1/39 | 2,000,000 | 2,224,994 |
Peralta Community College District, Unlimited General Obligation | ||
Series A | ||
3.00%, due 2/1/50 | 2,255,000 | 1,797,118 |
Perris Union High School District, Election 2018, Unlimited General Obligation | ||
Series A, Insured: AGM | ||
4.00%, due 9/1/38 | 3,550,000 | 3,609,540 |
Ravenswood City School District, Election 2018, Unlimited General Obligation | ||
Insured: AGM | ||
5.25%, due 8/1/45 (c) | 3,500,000 | 3,885,982 |
Redwood City School District, Election 2015, Unlimited General Obligation | ||
Series C | ||
4.00%, due 8/1/44 | 1,800,000 | 1,811,971 |
5.25%, due 8/1/44 | 2,000,000 | 2,237,145 |
Rio Hondo Community College District, Election 2004, Unlimited General Obligation | ||
Series C | ||
(zero coupon), due 8/1/42 | 2,000,000 | 2,364,240 |
Riverside Unified School District, Election 2016, Unlimited General Obligation | ||
Series B | ||
4.00%, due 8/1/42 | 1,700,000 | 1,711,770 |
Principal Amount | Value | |
General Obligation (continued) | ||
Robla School District, Election 2018, Unlimited General Obligation | ||
Series A, Insured: AGM | ||
4.00%, due 8/1/35 | $ 435,000 | $ 446,781 |
Series A, Insured: AGM | ||
4.00%, due 8/1/36 | 500,000 | 510,734 |
Series A, Insured: AGM | ||
4.00%, due 8/1/37 | 500,000 | 508,721 |
Series A, Insured: AGM | ||
4.00%, due 8/1/40 | 2,070,000 | 2,097,965 |
Series A, Insured: AGM | ||
5.00%, due 8/1/44 | 1,720,000 | 1,879,058 |
San Bernardino City Unified School District, Election 2012, Unlimited General Obligation | ||
Series F, Insured: AGM | ||
3.00%, due 8/1/44 | 2,600,000 | 2,176,838 |
Series C, Insured: AGM | ||
5.00%, due 8/1/34 | 655,000 | 698,541 |
San Diego Unified School District, Election 2012, Unlimited General Obligation | ||
Series I | ||
4.00%, due 7/1/34 | 1,000,000 | 1,032,441 |
San Francisco Bay Area Rapid Transit District, Election 2004, Green Bond, Unlimited General Obligation | ||
Series F-1 | ||
3.00%, due 8/1/37 | 1,505,000 | 1,380,980 |
San Francisco Bay Area Rapid Transit District, Election 2016, Green Bond, Unlimited General Obligation | ||
Series B-1 | ||
4.00%, due 8/1/37 | 9,695,000 | 10,045,899 |
San Jose Evergreen Community College District, Election 2016, Unlimited General Obligation | ||
Series B | ||
3.00%, due 9/1/38 | 1,500,000 | 1,387,447 |
Series B | ||
3.00%, due 9/1/39 | 2,250,000 | 2,033,480 |
Series B | ||
3.00%, due 9/1/40 | 2,500,000 | 2,205,967 |
San Juan Unified School District, Election 2016, Unlimited General Obligation (c) | ||
5.00%, due 8/1/36 | 1,500,000 | 1,694,135 |
5.00%, due 8/1/38 | 1,800,000 | 2,022,062 |
Principal Amount | Value | |
Long-Term Municipal Bonds (continued) | ||
General Obligation (continued) | ||
San Leandro Unified School District, Election 2016, Unlimited General Obligation | ||
Series B, Insured: BAM | ||
5.00%, due 8/1/35 | $ 500,000 | $ 554,119 |
Series B, Insured: BAM | ||
5.00%, due 8/1/36 | 1,955,000 | 2,164,688 |
Series A, Insured: BAM | ||
5.25%, due 8/1/42 | 1,000,000 | 1,107,561 |
San Lorenzo Valley Unified School District, Election 2020, Unlimited General Obligation | ||
Series A | ||
4.00%, due 8/1/45 | 1,000,000 | 1,001,440 |
Series A | ||
5.00%, due 8/1/50 | 2,005,000 | 2,201,076 |
San Mateo Union High School District, Election 2020, Unlimited General Obligation | ||
Series A | ||
2.25%, due 9/1/42 | 2,000,000 | 1,476,313 |
San Rafael City Elementary School District, Election 2005, Unlimited General Obligation | ||
Series C | ||
4.00%, due 8/1/47 | 1,720,000 | 1,717,004 |
San Ysidro School District, Unlimited General Obligation | ||
Insured: AGM | ||
(zero coupon), due 8/1/47 | 3,000,000 | 820,985 |
San Ysidro School District, Election 2020, Unlimited General Obligation | ||
Series A, Insured: BAM | ||
4.00%, due 8/1/40 | 975,000 | 989,328 |
Series A, Insured: BAM | ||
4.00%, due 8/1/45 | 2,320,000 | 2,311,933 |
Sanger Unified School District, Election 2018, Unlimited General Obligation | ||
Series B, Insured: BAM | ||
3.00%, due 8/1/45 | 500,000 | 410,858 |
Sanger Unified School District, Election 2020, Unlimited General Obligation | ||
Series C, Insured: BAM | ||
3.00%, due 8/1/48 | 3,390,000 | 2,718,430 |
Principal Amount | Value | |
General Obligation (continued) | ||
Sanger Unified School District, Election 2020, Unlimited General Obligation (continued) | ||
Series A, Insured: BAM | ||
4.00%, due 8/1/55 | $ 1,435,000 | $ 1,403,873 |
Santa Barbara Unified School District, Election 2010, Unlimited General Obligation | ||
Series A | ||
(zero coupon), due 8/1/36 | 1,000,000 | 1,283,431 |
Santa Barbara Unified School District, Election 2016, Unlimited General Obligation | ||
Series B | ||
4.00%, due 8/1/42 | 2,750,000 | 2,786,007 |
Santa Monica Community College District, Election 2016, Unlimited General Obligation | ||
Series B | ||
4.00%, due 8/1/45 (c) | 3,750,000 | 3,748,218 |
Series A | ||
4.00%, due 8/1/47 | 1,250,000 | 1,239,973 |
Santa Monica-Malibu Unified School District, Election 2018, Unlimited General Obligation | ||
Series B | ||
3.00%, due 8/1/42 | 2,060,000 | 1,820,669 |
Series B | ||
3.00%, due 8/1/44 | 5,415,000 | 4,701,591 |
Santa Monica-Malibu Unified School District, School Facilities Improvement District No. 1, Unlimited General Obligation | ||
Series A | ||
4.00%, due 8/1/39 | 1,015,000 | 1,030,312 |
Santee School District, Unlimited General Obligation | ||
5.00%, due 8/1/48 | 2,205,000 | 2,397,768 |
Shasta Union High School District, Election 2016, Unlimited General Obligation | ||
4.00%, due 8/1/44 | 1,135,000 | 1,135,850 |
5.25%, due 8/1/43 | 1,000,000 | 1,106,027 |
Simi Valley Unified School District, Election 2016, Unlimited General Obligation | ||
Series B | ||
4.00%, due 8/1/33 | 175,000 | 181,780 |
20 | MainStay MacKay California Tax Free Opportunities Fund |
Principal Amount | Value | |
Long-Term Municipal Bonds (continued) | ||
General Obligation (continued) | ||
Simi Valley Unified School District, Election 2016, Unlimited General Obligation (continued) | ||
Series B | ||
4.00%, due 8/1/38 | $ 370,000 | $ 378,144 |
Series B | ||
4.00%, due 8/1/39 | 350,000 | 357,291 |
Series B | ||
4.00%, due 8/1/40 | 1,455,000 | 1,483,700 |
Series B | ||
5.00%, due 8/1/42 | 1,375,000 | 1,506,340 |
Series B | ||
5.00%, due 8/1/44 | 1,200,000 | 1,310,970 |
Solano County Community College District, Election 2012, Unlimited General Obligation | ||
Series E, Insured: AGM-CR | ||
3.50%, due 8/1/46 | 2,000,000 | 1,854,905 |
Southwestern Community College District, Unlimited General Obligation | ||
Series D | ||
3.00%, due 8/1/40 | 4,425,000 | 3,873,790 |
Series D | ||
3.00%, due 8/1/41 | 7,460,000 | 6,480,575 |
Series A | ||
4.00%, due 8/1/47 | 2,000,000 | 1,996,516 |
State of California, Unlimited General Obligation | ||
4.00%, due 9/1/34 | 3,500,000 | 3,608,834 |
4.00%, due 3/1/36 | 7,000,000 | 7,223,250 |
State of California, Various Purpose, Unlimited General Obligation | ||
3.00%, due 11/1/34 | 3,750,000 | 3,475,405 |
4.00%, due 10/1/41 | 3,500,000 | 3,556,651 |
4.00%, due 4/1/49 | 1,895,000 | 1,898,434 |
5.00%, due 11/1/27 | 2,380,000 | 2,665,974 |
5.00%, due 4/1/28 | 2,930,000 | 3,288,963 |
5.00%, due 4/1/29 | 1,000,000 | 1,135,667 |
5.00%, due 4/1/35 | 2,500,000 | 2,901,446 |
5.00%, due 8/1/37 | 2,900,000 | 3,201,695 |
Tahoe Forest Hospital District, California Hospital District, Unlimited General Obligation | ||
5.00%, due 8/1/29 | 1,815,000 | 1,985,595 |
Principal Amount | Value | |
General Obligation (continued) | ||
Temecula Valley Unified School District, Election 2012, Unlimited General Obligation | ||
Series D | ||
3.00%, due 8/1/44 | $ 1,500,000 | $ 1,285,811 |
Series C | ||
5.25%, due 8/1/44 | 1,000,000 | 1,076,494 |
Turlock Unified School District, School Facilities Improvement District No. 1, Unlimited General Obligation | ||
4.00%, due 8/1/33 | 480,000 | 496,052 |
4.00%, due 8/1/34 | 515,000 | 529,726 |
4.00%, due 8/1/35 | 545,000 | 557,790 |
Vacaville Unified School District, Election 2014, Unlimited General Obligation | ||
Series D | ||
4.00%, due 8/1/30 | 200,000 | 212,263 |
Series C | ||
4.00%, due 8/1/31 | 490,000 | 508,522 |
Series C | ||
4.00%, due 8/1/32 | 555,000 | 575,326 |
Series C | ||
4.00%, due 8/1/33 | 625,000 | 645,902 |
Series D | ||
4.00%, due 8/1/36 | 300,000 | 307,542 |
Series D | ||
4.00%, due 8/1/37 | 300,000 | 306,125 |
Series D | ||
4.00%, due 8/1/38 | 500,000 | 509,514 |
Series D | ||
4.00%, due 8/1/40 | 500,000 | 507,905 |
Series D | ||
4.00%, due 8/1/45 | 2,050,000 | 2,052,952 |
Series C | ||
5.00%, due 8/1/39 | 500,000 | 540,699 |
Series C | ||
5.00%, due 8/1/40 | 1,225,000 | 1,323,697 |
Series C | ||
5.00%, due 8/1/41 | 1,350,000 | 1,457,649 |
Series C | ||
5.00%, due 8/1/42 | 1,000,000 | 1,078,498 |
Val Verde Unified School District, Election 2012, Unlimited General Obligation | ||
Series F, Insured: AGM | ||
3.00%, due 8/1/47 | 3,000,000 | 2,423,059 |
Principal Amount | Value | |
Long-Term Municipal Bonds (continued) | ||
General Obligation (continued) | ||
Washington Township Health Care District, Unlimited General Obligation | ||
Series A | ||
4.00%, due 8/1/47 | $ 3,000,000 | $ 2,861,723 |
Series A | ||
4.00%, due 8/1/51 | 2,500,000 | 2,339,020 |
Washington Unified School District, Capital Appreciation, Election 2004, Unlimited General Obligation | ||
Series B, Insured: BAM NATL-RE | ||
(zero coupon), due 8/1/31 | 2,400,000 | 1,764,869 |
West Contra Costa Unified School District, Election 2010, Unlimited General Obligation | ||
Series E | ||
4.00%, due 8/1/38 | 1,500,000 | 1,528,542 |
West Contra Costa Unified School District, Election 2012, Unlimited General Obligation | ||
Series E, Insured: AGM | ||
3.00%, due 8/1/36 | 1,000,000 | 929,542 |
Series D | ||
4.00%, due 8/1/38 | 1,500,000 | 1,528,542 |
West Contra Costa Unified School District, Election 2020, Unlimited General Obligation | ||
Series E, Insured: AGM | ||
3.00%, due 8/1/35 | 855,000 | 810,478 |
Series E, Insured: AGM | ||
3.00%, due 8/1/37 | 750,000 | 683,053 |
Series E, Insured: AGM | ||
3.00%, due 8/1/38 | 675,000 | 600,656 |
Series E, Insured: AGM | ||
3.00%, due 8/1/40 | 650,000 | 569,031 |
Westminster School District, Election 2008, Unlimited General Obligation | ||
Series B, Insured: BAM | ||
(zero coupon), due 8/1/48 | 5,000,000 | 871,392 |
Whittier Union High School District, Election 2020, Unlimited General Obligation | ||
Series A | ||
3.00%, due 8/1/46 | 4,725,000 | 3,955,444 |
414,950,300 | ||
Principal Amount | Value | |
Hospital 5.6% | ||
California Health Facilities Financing Authority, Cedars Sinai Health System, Revenue Bonds | ||
Series A, Insured: BAM | ||
3.00%, due 8/15/51 | $ 8,390,000 | $ 6,992,652 |
California Health Facilities Financing Authority, Cedars-Sinai Medical Center, Revenue Bonds | ||
Series A | ||
5.00%, due 8/15/51 | 750,000 | 825,797 |
California Health Facilities Financing Authority, Children's Hospital Los Angeles Obligated Group, Revenue Bonds | ||
Series A | ||
5.00%, due 8/15/42 | 500,000 | 540,830 |
Series A | ||
5.00%, due 8/15/47 | 1,000,000 | 1,077,195 |
California Health Facilities Financing Authority, Children's Hospital of Orange County, Revenue Bonds | ||
Series A | ||
3.00%, due 11/1/39 | 2,750,000 | 2,529,068 |
Series A | ||
4.00%, due 11/1/36 | 310,000 | 314,991 |
Series A | ||
4.00%, due 11/1/37 | 500,000 | 506,441 |
Series A | ||
4.00%, due 11/1/38 | 250,000 | 252,655 |
California Health Facilities Financing Authority, City of Hope Obligated Group, Revenue Bonds | ||
5.00%, due 11/15/37 | 1,600,000 | 1,685,267 |
5.00%, due 11/15/49 | 2,500,000 | 2,676,408 |
California Health Facilities Financing Authority, CommonSpirit Health, Revenue Bonds | ||
Series A | ||
4.00%, due 4/1/36 | 3,000,000 | 3,011,875 |
California Health Facilities Financing Authority, El Camino Hospital, Revenue Bonds | ||
4.125%, due 2/1/47 | 750,000 | 739,001 |
5.00%, due 2/1/36 | 1,035,000 | 1,130,073 |
22 | MainStay MacKay California Tax Free Opportunities Fund |
Principal Amount | Value | |
Long-Term Municipal Bonds (continued) | ||
Hospital (continued) | ||
California Health Facilities Financing Authority, Lucile Salter Packard Children's Hospital at Stanford, Revenue Bonds | ||
Series A | ||
4.00%, due 5/15/46 (c) | $ 1,700,000 | $ 1,663,679 |
California Health Facilities Financing Authority, Stanford Health Care Obligated Group, Revenue Bonds | ||
Series A | ||
5.00%, due 11/15/36 | 3,000,000 | 3,302,194 |
California Health Facilities Financing Authority, Sutter Health Obligated Group, Revenue Bonds | ||
Series A | ||
5.00%, due 11/15/37 | 5,175,000 | 5,641,180 |
Series A | ||
5.00%, due 11/15/38 | 1,600,000 | 1,742,440 |
California Municipal Finance Authority, Community Medical Centers, Revenue Bonds | ||
Series A | ||
5.00%, due 2/1/27 | 1,100,000 | 1,216,457 |
Series A | ||
5.00%, due 2/1/37 | 1,000,000 | 1,093,250 |
California Municipal Finance Authority, Healthright 360, Revenue Bonds | ||
Series A | ||
5.00%, due 11/1/39 (b) | 1,000,000 | 1,018,125 |
California Public Finance Authority, Henry Mayo Newhall Hospital Obligated Group, Revenue Bonds | ||
5.00%, due 10/15/47 | 1,000,000 | 1,068,494 |
California Public Finance Authority, Hoag Memorial Hospital Presbyterian, Revenue Bonds | ||
Series A | ||
4.00%, due 7/15/38 | 4,520,000 | 4,582,036 |
California Statewide Communities Development Authority, Emanate Health, Revenue Bonds | ||
Series A | ||
4.00%, due 4/1/45 | 1,300,000 | 1,257,694 |
Series A | ||
5.00%, due 4/1/34 | 1,275,000 | 1,445,178 |
Principal Amount | Value | |
Hospital (continued) | ||
California Statewide Communities Development Authority, Methodist Hospital of Southern California, Revenue Bonds | ||
5.00%, due 1/1/38 | $ 1,500,000 | $ 1,620,526 |
5.00%, due 1/1/48 | 1,000,000 | 1,066,973 |
Regents of the University of California Medical Center Pooled, Revenue Bonds | ||
Series P | ||
4.00%, due 5/15/43 (c) | 8,625,000 | 8,581,902 |
Washington Township Health Care District, Revenue Bonds | ||
Series B | ||
4.00%, due 7/1/36 | 1,380,000 | 1,413,891 |
58,996,272 | ||
Housing 3.0% | ||
California Community College Financing Authority, Orange Coast College Project, Revenue Bonds | ||
5.00%, due 5/1/29 | 800,000 | 823,775 |
California Enterprise Development Authority, Provident Group-SDSU Properties LLC M@College Project, Revenue Bonds, First Tier | ||
Series A | ||
5.00%, due 8/1/40 | 650,000 | 678,966 |
Series A | ||
5.00%, due 8/1/45 | 700,000 | 724,325 |
Series A | ||
5.00%, due 8/1/55 | 1,000,000 | 1,022,296 |
California Municipal Finance Authority, CHF Davis I LLC, Revenue Bonds | ||
Insured: BAM | ||
5.00%, due 5/15/29 | 5,000,000 | 5,492,263 |
California Municipal Finance Authority, Mobile Home Park Caritas Project, Revenue Bonds, Senior Lien | ||
Series A | ||
4.00%, due 8/15/42 | 1,540,000 | 1,528,937 |
Series A | ||
5.00%, due 8/15/29 | 805,000 | 869,774 |
Series A | ||
5.00%, due 8/15/31 | 140,000 | 150,153 |
Principal Amount | Value | |
Long-Term Municipal Bonds (continued) | ||
Housing (continued) | ||
California Municipal Finance Authority, Orchard Park Student Housing Project, Revenue Bonds | ||
Insured: BAM | ||
4.00%, due 5/15/38 | $ 1,250,000 | $ 1,259,843 |
California Municipal Finance Authority, P3 Claremont Holdings LLC, Claremont Colleges Project, Revenue Bonds | ||
Series A-P3 | ||
5.00%, due 7/1/40 (b) | 1,000,000 | 1,012,533 |
California Municipal Finance Authority, Windsor Mobile Country Club, Revenue Bonds | ||
Series A | ||
4.00%, due 11/15/37 | 1,320,000 | 1,282,620 |
California School Finance Authority, Sonoma County Junior College District Project, Revenue Bonds | ||
Series A | ||
4.00%, due 11/1/41 | 2,000,000 | 1,834,027 |
California Statewide Communities Development Authority, CHF-Irvine LLC, Student Housing, Revenue Bonds | ||
5.00%, due 5/15/40 | 1,025,000 | 1,083,936 |
5.00%, due 5/15/47 | 3,500,000 | 3,680,896 |
California Statewide Communities Development Authority, Lancer Educational Student Housing Project, Revenue Bonds (b) | ||
Series A | ||
3.00%, due 6/1/29 | 750,000 | 681,584 |
Series A | ||
5.00%, due 6/1/34 | 375,000 | 392,024 |
California Statewide Communities Development Authority, Provident Group Pomona Properties LLC Project, Revenue Bonds | ||
Series A | ||
5.75%, due 1/15/45 (b) | 400,000 | 403,901 |
Hastings Campus Housing Finance Authority, Green Bond, Revenue Bonds, Senior Lien | ||
Series A | ||
5.00%, due 7/1/45 | 4,500,000 | 4,739,962 |
Principal Amount | Value | |
Housing (continued) | ||
Hastings Campus Housing Finance Authority, Green Bond, Revenue Bonds, Senior Lien (continued) | ||
Series A | ||
5.00%, due 7/1/61 | $ 4,000,000 | $ 4,143,402 |
31,805,217 | ||
Other Revenue 23.5% | ||
Anaheim Public Financing Authority, City of Anaheim, Revenue Bonds | ||
Series A, Insured: BAM | ||
5.00%, due 9/1/35 | 4,500,000 | 4,893,008 |
Anaheim Public Financing Authority, Public Improvement Project, Revenue Bonds | ||
Series A, Insured: AGM-CR | ||
5.00%, due 9/1/26 | 8,000,000 | 8,671,845 |
Series A, Insured: AGM-CR | ||
5.00%, due 9/1/27 | 5,000,000 | 5,488,038 |
Series A, Insured: AGM-CR | ||
5.00%, due 9/1/28 | 2,250,000 | 2,494,586 |
Burlingame California Financing Authority, Community Center Project, Revenue Bonds | ||
5.00%, due 7/1/47 | 1,515,000 | 1,675,895 |
California Community Choice Financing Authority, Revenue Bonds | ||
Series B-1 | ||
4.00%, due 2/1/30 | 1,400,000 | 1,456,569 |
Series B-1 | ||
4.00%, due 2/1/31 | 1,000,000 | 1,038,614 |
California Community Choice Financing Authority, Clean Energy Project, Green Bond, Revenue Bonds | ||
Series B-1 | ||
4.00%, due 8/1/27 | 400,000 | 415,397 |
Series B-1 | ||
4.00%, due 8/1/28 | 465,000 | 483,478 |
Series B-1 | ||
4.00%, due 2/1/29 | 650,000 | 676,238 |
Series B-1 | ||
4.00%, due 2/1/52 (d) | 5,250,000 | 5,330,911 |
24 | MainStay MacKay California Tax Free Opportunities Fund |
Principal Amount | Value | |
Long-Term Municipal Bonds (continued) | ||
Other Revenue (continued) | ||
California Community Housing Agency, Essential Housing, Revenue Bonds, Senior Lien | ||
Series A-1 | ||
4.00%, due 2/1/56 (b) | $ 3,785,000 | $ 3,367,865 |
California Community Housing Agency, Summit at Sausalito Apartments, Revenue Bonds | ||
Series A-1 | ||
3.00%, due 2/1/57 (b) | 500,000 | 351,165 |
California County Tobacco Securitization Agency, Golden Gate Tobacco Funding Corp., Asset-Backed, Revenue Bonds | ||
Series A | ||
5.00%, due 6/1/47 | 1,275,000 | 1,247,659 |
California County Tobacco Securitization Agency, Tobacco Settlement, Revenue Bonds, Senior Lien | ||
Series A | ||
4.00%, due 6/1/34 | 300,000 | 304,191 |
Series A | ||
4.00%, due 6/1/35 | 500,000 | 506,007 |
Series A | ||
4.00%, due 6/1/36 | 300,000 | 303,074 |
Series A | ||
4.00%, due 6/1/37 | 275,000 | 277,521 |
Series A | ||
4.00%, due 6/1/38 | 275,000 | 276,881 |
Series A | ||
4.00%, due 6/1/39 | 350,000 | 351,824 |
Series A | ||
4.00%, due 6/1/40 | 500,000 | 501,464 |
Series A | ||
4.00%, due 6/1/49 | 1,500,000 | 1,456,437 |
California Health Facilities Financing Authority, Lundquist Institute For Biomedical Innovation, Revenue Bonds | ||
5.00%, due 9/1/30 | 1,300,000 | 1,439,119 |
5.00%, due 9/1/31 | 1,365,000 | 1,507,531 |
5.00%, due 9/1/32 | 1,435,000 | 1,582,294 |
5.00%, due 9/1/34 | 1,590,000 | 1,748,536 |
Principal Amount | Value | |
Other Revenue (continued) | ||
California Infrastructure and Economic Development Bank, California State Teachers' Retirement System, Green Bond, Revenue Bonds | ||
5.00%, due 8/1/37 | $ 1,050,000 | $ 1,171,237 |
5.00%, due 8/1/38 | 1,200,000 | 1,336,523 |
California Infrastructure and Economic Development Bank, Salvation Army Western Territory (The), Revenue Bonds | ||
4.00%, due 9/1/33 | 1,225,000 | 1,266,133 |
4.00%, due 9/1/34 | 1,000,000 | 1,028,649 |
California Municipal Finance Authority, Asian Community Center of Sacramento Valley, Inc., Revenue Bonds | ||
Insured: California Mortgage Insurance | ||
5.00%, due 4/1/48 | 1,545,000 | 1,691,251 |
California Municipal Finance Authority, HumanGood California Obligated Group, Revenue Bonds | ||
3.00%, due 10/1/46 | 2,550,000 | 1,951,697 |
California Municipal Finance Authority, Orange County Civic Center Infrastructure Program, Revenue Bonds | ||
Series A | ||
5.00%, due 6/1/37 | 2,085,000 | 2,300,336 |
California Municipal Finance Authority, United Airlines, Inc. Project, Revenue Bonds | ||
4.00%, due 7/15/29 (e) | 5,000,000 | 4,835,477 |
California State Public Works Board, Various Capital Projects, Revenue Bonds | ||
Series B | ||
4.00%, due 5/1/39 | 1,500,000 | 1,528,391 |
Series B | ||
4.00%, due 5/1/40 | 1,000,000 | 1,014,874 |
Series B | ||
4.00%, due 5/1/41 | 1,500,000 | 1,519,935 |
Principal Amount | Value | |
Long-Term Municipal Bonds (continued) | ||
Other Revenue (continued) | ||
California Statewide Communities Development Authority, A Community of Seniors, Redwoods Project, Revenue Bonds | ||
Series A, Insured: California Mortgage Insurance | ||
5.375%, due 11/15/44 | $ 535,000 | $ 560,620 |
California Statewide Communities Development Authority, California Baptist University, Revenue Bonds | ||
Series A | ||
6.375%, due 11/1/43 | 500,000 | 521,793 |
California Statewide Communities Development Authority, Front Porch Communities & Services, Revenue Bonds | ||
Series A | ||
3.00%, due 4/1/46 | 2,775,000 | 2,282,398 |
Series A | ||
3.00%, due 4/1/51 | 6,225,000 | 4,943,037 |
California Statewide Financing Authority, Tobacco Settlement Asset-Backed, Revenue Bonds | ||
Series C | ||
(zero coupon), due 6/1/55 (b) | 20,000,000 | 1,230,394 |
Children's Trust Fund, Asset-Backed, Revenue Bonds | ||
Series A | ||
(zero coupon), due 5/15/50 | 1,500,000 | 250,501 |
City of Sacramento CA, Transient Occupancy Tax, Revenue Bonds | ||
Series C | ||
5.00%, due 6/1/48 | 4,860,000 | 5,250,972 |
City of Santa Ana CA, Gas Tax, Revenue Bonds | ||
4.00%, due 1/1/38 | 1,360,000 | 1,387,417 |
CMFA Special Finance Agency, Solana at Grand, Revenue Bonds, Senior Lien | ||
Series A-1 | ||
4.00%, due 8/1/56 (b) | 2,500,000 | 2,195,681 |
CMFA Special Finance Agency VIII, Huntington Beach, Revenue Bonds, Senior Lien | ||
Series A-1 | ||
3.00%, due 8/1/56 (b) | 10,000,000 | 7,174,259 |
Principal Amount | Value | |
Other Revenue (continued) | ||
CSCDA Community Improvement Authority, 1818 Platinum Triangle-Anaheim, Revenue Bonds, Senior Lien | ||
Series A-2 | ||
3.25%, due 4/1/57 (b) | $ 4,000,000 | $ 2,976,558 |
CSCDA Community Improvement Authority, City of Orange Portfolio, Revenue Bonds, Senior Lien | ||
Series A-2 | ||
3.00%, due 3/1/57 (b) | 1,000,000 | 712,725 |
CSCDA Community Improvement Authority, Oceanaire Long Beach, Revenue Bonds | ||
4.00%, due 9/1/56 (b) | 7,000,000 | 6,192,427 |
CSCDA Community Improvement Authority, Pasadena Portfolio, Revenue Bonds, Senior Lien (b) | ||
Series A-1 | ||
2.65%, due 12/1/46 | 1,250,000 | 1,008,845 |
Series A-2 | ||
3.00%, due 12/1/56 | 2,250,000 | 1,605,573 |
CSCDA Community Improvement Authority, Renaissance at City Center, Revenue Bonds | ||
Series A | ||
5.00%, due 7/1/51 (b) | 2,000,000 | 1,946,004 |
CSCDA Community Improvement Authority, Theo Pasadena, Revenue Bonds, Senior Lien | ||
Series A-2 | ||
3.25%, due 5/1/57 (b) | 4,500,000 | 3,280,996 |
Del Mar Race Track Authority, Revenue Bonds | ||
5.00%, due 10/1/30 | 1,000,000 | 975,832 |
FHLMC Multifamily VRD Certificates, VRD Certificates, Revenue Bonds | ||
Series M-057 | ||
2.40%, due 10/15/29 | 2,995,000 | 2,845,829 |
Golden State Tobacco Securitization Corp., Asset-Backed, Revenue Bonds | ||
Series B-2 | ||
(zero coupon), due 6/1/66 | 48,750,000 | 5,270,865 |
Series A-2 | ||
5.30%, due 6/1/37 (a) | 1,780,000 | 1,785,478 |
26 | MainStay MacKay California Tax Free Opportunities Fund |
Principal Amount | Value | |
Long-Term Municipal Bonds (continued) | ||
Other Revenue (continued) | ||
Guam Economic Development & Commerce Authority, Tobacco Settlement Asset-Backed, Revenue Bonds | ||
Series A | ||
5.625%, due 6/1/47 | $ 1,025,000 | $ 992,253 |
Guam Government Waterworks Authority, Water and Wastewater System, Revenue Bonds | ||
5.25%, due 7/1/33 | 1,100,000 | 1,137,603 |
5.50%, due 7/1/43 | 3,500,000 | 3,629,615 |
Imperial Irrigation District Electric System, Revenue Bonds | ||
Series C | ||
5.00%, due 11/1/37 | 1,000,000 | 1,075,891 |
Series B-2 | ||
5.00%, due 11/1/41 | 5,475,000 | 5,918,241 |
Livermore Valley Water Financing Authority, Alameda County Flood Control & Water Conservation District Zone No. 7, Revenue Bonds | ||
Series A | ||
5.00%, due 7/1/47 | 3,945,000 | 4,288,145 |
Lodi Public Financing Authority, Electric System, Revenue Bonds | ||
Insured: AGM | ||
5.00%, due 9/1/31 | 1,330,000 | 1,482,597 |
Insured: AGM | ||
5.00%, due 9/1/32 | 1,650,000 | 1,832,338 |
Los Angeles County Facilities, Inc., County of Los Angeles, Revenue Bonds | ||
Series A | ||
5.00%, due 12/1/38 | 1,910,000 | 2,144,258 |
Los Angeles County Metropolitan Transportation Authority, Revenue Bonds, Senior Lien | ||
Series A | ||
5.00%, due 7/1/40 | 1,625,000 | 1,862,112 |
Matching Fund Special Purpose Securitization Corp., Revenue Bonds | ||
Series A | ||
5.00%, due 10/1/30 | 3,140,000 | 3,276,943 |
Series A | ||
5.00%, due 10/1/32 | 3,140,000 | 3,282,531 |
Principal Amount | Value | |
Other Revenue (continued) | ||
Matching Fund Special Purpose Securitization Corp., Revenue Bonds (continued) | ||
Series A | ||
5.00%, due 10/1/39 | $ 9,415,000 | $ 9,644,821 |
Montclair Financing Authority, Public Facilities Project, Revenue Bonds | ||
Insured: AGM | ||
5.00%, due 10/1/32 | 1,000,000 | 1,057,726 |
Mountain House Public Financing Authority, Green Bond, Revenue Bonds | ||
Series B, Insured: BAM | ||
4.00%, due 12/1/40 | 1,380,000 | 1,408,819 |
Northern California Energy Authority, Revenue Bonds | ||
Series A | ||
4.00%, due 7/1/49 (d) | 2,900,000 | 2,950,565 |
Orange City Public Facilities Financing Authority, City of Orange, Revenue Bonds | ||
Series A | ||
4.00%, due 11/1/50 | 1,450,000 | 1,438,836 |
Orange County Local Transportation Authority, Sales Tax, Revenue Bonds | ||
4.00%, due 2/15/38 | 10,000,000 | 10,204,817 |
Peninsula Corridor Joint Powers Board, Green Bond, Revenue Bonds | ||
Series A | ||
5.00%, due 6/1/51 | 2,250,000 | 2,526,690 |
Pico Rivera Public Financing Authority, City of Pico Rivera, Revenue Bonds | ||
Insured: NATL-RE | ||
5.25%, due 9/1/34 | 1,560,000 | 1,704,763 |
Puerto Rico Sales Tax Financing Corp., Revenue Bonds | ||
Series A-1 | ||
4.50%, due 7/1/34 | 1,500,000 | 1,538,306 |
Series A-1 | ||
4.75%, due 7/1/53 | 1,000,000 | 1,014,151 |
Series A-1 | ||
5.00%, due 7/1/58 | 17,000,000 | 17,466,820 |
Principal Amount | Value | |
Long-Term Municipal Bonds (continued) | ||
Other Revenue (continued) | ||
Riverside County Transportation Commission, Sales Tax, Revenue Bonds | ||
Series B | ||
4.00%, due 6/1/36 | $ 5,000,000 | $ 5,114,432 |
San Bernardino County Financing Authority, Court House Facilities Project, Revenue Bonds | ||
Series C, Insured: NATL-RE | ||
5.50%, due 6/1/37 | 1,150,000 | 1,194,949 |
San Diego County Regional Transportation Commission, Green Bond, Revenue Bonds | ||
Series A | ||
5.00%, due 4/1/38 | 1,000,000 | 1,137,208 |
Series A | ||
5.00%, due 4/1/39 | 1,000,000 | 1,135,362 |
Series A | ||
5.00%, due 4/1/40 | 675,000 | 765,201 |
Series A | ||
5.00%, due 4/1/44 | 2,800,000 | 3,140,782 |
San Francisco Bay Area Rapid Transit District, Sales Tax, Revenue Bonds | ||
Series A | ||
4.00%, due 7/1/36 | 1,850,000 | 1,889,287 |
San Joaquin County Transportation Authority, Sales Tax Revenue, Revenue Bonds | ||
Series K | ||
5.00%, due 3/1/37 | 1,705,000 | 1,859,009 |
San Mateo Joint Powers Financing Authority, Capital Projects, Revenue Bonds | ||
Series A | ||
5.00%, due 7/15/43 | 3,000,000 | 3,316,380 |
South Bayside Waste Management Authority, Green Bond, Revenue Bonds | ||
Series B, Insured: AGM | ||
5.00%, due 9/1/25 (e) | 50,000 | 53,762 |
Series B, Insured: AGM | ||
5.00%, due 9/1/25 (e) | 1,465,000 | 1,568,944 |
Series B, Insured: AGM | ||
5.00%, due 9/1/27 (e) | 55,000 | 61,141 |
Series B, Insured: AGM | ||
5.00%, due 9/1/27 (e) | 1,615,000 | 1,767,640 |
Principal Amount | Value | |
Other Revenue (continued) | ||
South Bayside Waste Management Authority, Green Bond, Revenue Bonds (continued) | ||
Series B, Insured: AGM | ||
5.00%, due 9/1/29 (e) | $ 15,000 | $ 17,110 |
Series B, Insured: AGM | ||
5.00%, due 9/1/29 (e) | 405,000 | 451,200 |
Series B, Insured: AGM | ||
5.00%, due 9/1/30 (e) | 25,000 | 28,517 |
Series B, Insured: AGM | ||
5.00%, due 9/1/30 (e) | 690,000 | 768,031 |
Series B, Insured: AGM | ||
5.00%, due 9/1/31 (e) | 15,000 | 17,110 |
Series B, Insured: AGM | ||
5.00%, due 9/1/31 (e) | 395,000 | 439,045 |
Series 2019A, Insured: AGM | ||
5.00%, due 9/1/32 | 15,000 | 17,271 |
Series 2019A, Insured: AGM | ||
5.00%, due 9/1/32 | 485,000 | 546,165 |
Series 2019A, Insured: AGM | ||
5.00%, due 9/1/39 | 80,000 | 92,110 |
Series 2019A, Insured: AGM | ||
5.00%, due 9/1/39 | 2,450,000 | 2,730,828 |
Stockton Public Financing Authority, Water Revenue, Green Bonds, Revenue Bonds | ||
Series A, Insured: BAM | ||
4.00%, due 10/1/37 | 2,500,000 | 2,552,303 |
Series A, Insured: BAM | ||
5.00%, due 10/1/32 | 1,275,000 | 1,435,562 |
Series A, Insured: BAM | ||
5.00%, due 10/1/34 | 1,500,000 | 1,684,426 |
Territory of Guam, Business Privilege Tax, Revenue Bonds | ||
Series D | ||
5.00%, due 11/15/27 | 1,000,000 | 1,062,773 |
Tobacco Securitization Authority of Northern California, Sacramento County Tobacco Securitization Corp., Revenue Bonds, Senior Lien | ||
4.00%, due 6/1/49 | 1,000,000 | 961,542 |
Tobacco Securitization Authority of Southern California, San Diego County Tobacco Asset Securitization Corp., Asset-Backed, Revenue Bonds | ||
Series A | ||
5.00%, due 6/1/48 | 2,400,000 | 2,526,617 |
28 | MainStay MacKay California Tax Free Opportunities Fund |
Principal Amount | Value | |
Long-Term Municipal Bonds (continued) | ||
Other Revenue (continued) | ||
Virgin Islands Public Finance Authority, Gross Receipts Taxes Loan, Revenue Bonds | ||
Series A | ||
5.00%, due 10/1/29 | $ 1,500,000 | $ 1,487,514 |
Series A | ||
5.00%, due 10/1/32 | 1,250,000 | 1,223,910 |
West Hollywood Public Financing Authority, City of West Hollywood, Revenue Bonds | ||
Series A | ||
3.00%, due 4/1/42 | 3,300,000 | 2,845,216 |
247,659,042 | ||
Transportation 10.4% | ||
Alameda Corridor Transportation Authority, Revenue Bonds, Senior Lien | ||
Series A, Insured: AGM | ||
5.00%, due 10/1/29 | 1,000,000 | 1,035,336 |
Antonio B Won Pat International Airport Authority, Revenue Bonds (e) | ||
Series C, Insured: AGM | ||
6.00%, due 10/1/34 | 720,000 | 756,086 |
Series C, Insured: AGM | ||
6.00%, due 10/1/34 | 280,000 | 292,760 |
California Municipal Finance Authority, LINXS APM Project, Revenue Bonds, Senior Lien (e) | ||
Series A, Insured: AGM | ||
3.25%, due 12/31/32 | 1,000,000 | 921,094 |
Series A | ||
5.00%, due 6/30/31 | 3,100,000 | 3,297,043 |
City of Long Beach CA, Harbor, Revenue Bonds | ||
Series A | ||
5.00%, due 5/15/36 | 1,000,000 | 1,119,706 |
Series A | ||
5.00%, due 5/15/37 | 1,000,000 | 1,118,507 |
Series A | ||
5.00%, due 5/15/38 | 2,000,000 | 2,233,697 |
City of Los Angeles CA, Department of Airports, Revenue Bonds | ||
Series D | ||
3.00%, due 5/15/39 (e) | 2,500,000 | 2,140,286 |
Principal Amount | Value | |
Transportation (continued) | ||
City of Los Angeles CA, Department of Airports, Revenue Bonds (continued) | ||
Series D | ||
4.00%, due 5/15/51 (e) | $ 4,500,000 | $ 4,340,333 |
Series B | ||
5.00%, due 5/15/25 (e) | 710,000 | 750,436 |
Series D | ||
5.00%, due 5/15/26 (e) | 1,000,000 | 1,070,204 |
Series A | ||
5.00%, due 5/15/29 (e) | 3,125,000 | 3,441,247 |
Series A | ||
5.00%, due 5/15/31 (e) | 2,815,000 | 3,004,666 |
Series C | ||
5.00%, due 5/15/31 (e) | 1,000,000 | 1,113,088 |
Series E | ||
5.00%, due 5/15/37 (e) | 1,250,000 | 1,369,279 |
Series F | ||
5.00%, due 5/15/37 (e) | 875,000 | 945,944 |
Series A | ||
5.00%, due 5/15/40 | 6,175,000 | 6,838,301 |
Series A | ||
5.25%, due 5/15/48 (e) | 1,375,000 | 1,472,564 |
City of Palm Springs CA, Airport Passenger Facility Charge, Revenue Bonds (e) | ||
Insured: BAM | ||
5.00%, due 6/1/30 | 640,000 | 673,692 |
Insured: BAM | ||
5.00%, due 6/1/31 | 1,130,000 | 1,187,844 |
County of Sacramento CA, Airport System, Revenue Bonds | ||
Series C | ||
5.00%, due 7/1/38 (e) | 3,000,000 | 3,203,490 |
Foothill-Eastern Transportation Corridor Agency, Revenue Bonds, Junior Lien | ||
Series C | ||
4.00%, due 1/15/43 | 520,000 | 505,303 |
Foothill-Eastern Transportation Corridor Agency, Revenue Bonds, Senior Lien | ||
Series A | ||
4.00%, due 1/15/46 | 1,500,000 | 1,433,168 |
Principal Amount | Value | |
Long-Term Municipal Bonds (continued) | ||
Transportation (continued) | ||
Norman Y Mineta San Jose International Airport SJC, Revenue Bonds (e) | ||
Series A, Insured: BAM | ||
4.00%, due 3/1/42 | $ 4,755,000 | $ 4,702,180 |
Series A | ||
5.00%, due 3/1/41 | 2,500,000 | 2,619,374 |
Series A | ||
5.00%, due 3/1/47 | 4,390,000 | 4,566,930 |
Peninsula Corridor Joint Powers Board, Farebox, Revenue Bonds | ||
Series A | ||
5.00%, due 10/1/32 | 500,000 | 565,380 |
Series A | ||
5.00%, due 10/1/33 | 500,000 | 564,415 |
Series A | ||
5.00%, due 10/1/34 | 500,000 | 563,688 |
Series A | ||
5.00%, due 10/1/35 | 350,000 | 394,140 |
Series A | ||
5.00%, due 10/1/44 | 4,035,000 | 4,325,676 |
Port of Oakland, Revenue Bonds (e) | ||
Series D | ||
5.00%, due 11/1/28 | 2,250,000 | 2,454,572 |
Series D | ||
5.00%, due 11/1/29 | 1,850,000 | 2,015,840 |
Puerto Rico Highway & Transportation Authority, Revenue Bonds | ||
Series D, Insured: AGM | ||
5.00%, due 7/1/32 | 1,205,000 | 1,213,395 |
Series G, Insured: AGC-ICC | ||
5.00%, due 7/1/42 | 40,000 | 40,279 |
Insured: AMBAC | ||
5.50%, due 7/1/26 | 460,000 | 474,084 |
Riverside County Transportation Commission, Revenue Bonds, Second Lien | ||
Series C | ||
4.00%, due 6/1/47 | 5,750,000 | 5,435,425 |
Riverside County Transportation Commission, Revenue Bonds, Senior Lien | ||
Series B-1, Insured: BAM | ||
3.00%, due 6/1/49 | 5,000,000 | 3,802,056 |
Series B-1 | ||
4.00%, due 6/1/46 | 1,000,000 | 955,061 |
Principal Amount | Value | |
Transportation (continued) | ||
San Francisco City & County Airport Commission, International Airport, Revenue Bonds, Second Series | ||
Series D | ||
5.25%, due 5/1/48 (e) | $ 4,100,000 | $ 4,384,787 |
San Francisco City & County Airport Commission, San Francisco International Airport, Revenue Bonds, Second Series | ||
Series H | ||
5.00%, due 5/1/27 (e) | 7,000,000 | 7,548,559 |
Series D | ||
5.00%, due 5/1/30 | 2,595,000 | 2,908,869 |
Series D | ||
5.00%, due 5/1/31 | 2,200,000 | 2,457,240 |
Series E | ||
5.00%, due 5/1/45 (e) | 3,460,000 | 3,679,520 |
San Francisco Municipal Transportation Agency, Green Bond, Revenue Bonds | ||
Series C | ||
5.00%, due 3/1/51 | 1,170,000 | 1,310,456 |
San Joaquin Hills Transportation Corridor Agency, Revenue Bonds, Junior Lien | ||
Series B | ||
5.25%, due 1/15/44 | 4,000,000 | 4,179,375 |
Series B | ||
5.25%, due 1/15/49 | 500,000 | 521,053 |
San Joaquin Hills Transportation Corridor Agency, Revenue Bonds, Senior Lien | ||
Series A | ||
4.00%, due 1/15/44 | 3,449,000 | 3,345,021 |
Series A | ||
4.00%, due 1/15/50 | 499,000 | 472,110 |
109,763,559 | ||
Utilities 2.3% | ||
City of Riverside CA, Electric, Revenue Bonds | ||
Series A | ||
5.00%, due 10/1/31 | 750,000 | 848,594 |
Guam Power Authority, Revenue Bonds | ||
Series A | ||
5.00%, due 10/1/34 | 1,000,000 | 1,014,062 |
30 | MainStay MacKay California Tax Free Opportunities Fund |
Principal Amount | Value | |
Long-Term Municipal Bonds (continued) | ||
Utilities (continued) | ||
Guam Power Authority, Revenue Bonds (continued) | ||
Series A | ||
5.00%, due 10/1/40 | $ 1,000,000 | $ 1,044,075 |
Los Angeles Department of Water & Power System, Revenue Bonds | ||
Series C | ||
5.00%, due 7/1/37 | 2,860,000 | 3,200,450 |
Northern California Power Agency, Hydroelectric Project No.1, Revenue Bonds | ||
Series A | ||
5.00%, due 7/1/31 | 3,000,000 | 3,521,849 |
Puerto Rico Electric Power Authority, Revenue Bonds | ||
Series UU, Insured: AGC | ||
4.25%, due 7/1/27 | 460,000 | 464,929 |
Series SS, Insured: NATL-RE | ||
5.00%, due 7/1/22 | 640,000 | 653,289 |
Series UU, Insured: AGM | ||
5.00%, due 7/1/24 | 225,000 | 229,022 |
Series XX-RSA-1 | ||
5.25%, due 7/1/40 (f)(g) | 1,000,000 | 962,500 |
Sacramento Municipal Utility District, Electric Revenue, Green Bonds, Revenue Bonds | ||
Series H | ||
4.00%, due 8/15/45 | 7,500,000 | 7,540,235 |
Turlock Irrigation District, Revenue Bonds | ||
5.00%, due 1/1/38 | 600,000 | 676,506 |
5.00%, due 1/1/39 | 500,000 | 562,866 |
5.00%, due 1/1/44 | 3,165,000 | 3,516,741 |
24,235,118 | ||
Water & Sewer 7.6% | ||
Central Basin Municipal Water District, Revenue Bonds | ||
Series A, Insured: BAM | ||
3.00%, due 8/1/44 | 2,000,000 | 1,638,070 |
City of Clovis CA, Wastewater, Revenue Bonds | ||
Insured: AGM | ||
5.25%, due 8/1/29 | 500,000 | 540,635 |
Principal Amount | Value | |
Water & Sewer (continued) | ||
City of Culver City CA, Wastewater Facilities, Revenue Bonds | ||
Series A | ||
4.00%, due 9/1/44 | $ 1,690,000 | $ 1,706,735 |
City of Los Angeles CA, Revenue Bonds | ||
Series C | ||
5.00%, due 6/1/28 | 2,000,000 | 2,259,634 |
City of Oxnard CA, Wastewater, Revenue Bonds | ||
Insured: BAM | ||
4.00%, due 6/1/32 | 1,920,000 | 2,016,446 |
Insured: BAM | ||
4.00%, due 6/1/34 | 2,080,000 | 2,158,542 |
Insured: BAM | ||
5.00%, due 6/1/30 | 1,340,000 | 1,498,931 |
City of Oxnard CA, Water System, Revenue Bonds | ||
Insured: BAM | ||
5.00%, due 6/1/35 | 1,125,000 | 1,252,578 |
City of Pasadena CA, Water, Revenue Bonds | ||
Series A | ||
5.00%, due 6/1/38 | 1,480,000 | 1,686,851 |
City of San Francisco CA, Public Utilities Commission Water, Green Bond, Revenue Bonds | ||
Series A | ||
5.00%, due 11/1/45 | 4,240,000 | 4,745,885 |
City of Vernon CA, Water System, Revenue Bonds | ||
Series A, Insured: AGM | ||
3.375%, due 8/1/40 | 650,000 | 595,498 |
Series A, Insured: AGM | ||
3.50%, due 8/1/45 | 725,000 | 654,612 |
Series A, Insured: AGM | ||
5.00%, due 8/1/30 | 985,000 | 1,103,587 |
Series A, Insured: AGM | ||
5.00%, due 8/1/35 | 1,000,000 | 1,109,555 |
Colton Utility Authority, Revenue Bonds | ||
Insured: AGM | ||
4.00%, due 3/1/47 | 2,500,000 | 2,476,282 |
Contra Costa Water District, Revenue Bonds | ||
Series V | ||
5.00%, due 10/1/44 | 6,000,000 | 6,689,380 |
Principal Amount | Value | |
Long-Term Municipal Bonds (continued) | ||
Water & Sewer (continued) | ||
Eastern Municipal Water District, Water & Wastewater, Revenue Bonds | ||
Series A | ||
5.00%, due 7/1/45 | $ 2,850,000 | $ 3,058,592 |
Eastern Municipal Water District Financing Authority, Water & Wastewater, Revenue Bonds | ||
Series A | ||
4.00%, due 7/1/37 | 1,700,000 | 1,743,920 |
Series A | ||
4.00%, due 7/1/38 | 1,500,000 | 1,536,111 |
Guam Government Waterworks Authority, Water and Wastewater System, Revenue Bonds | ||
5.00%, due 1/1/46 | 6,290,000 | 6,651,784 |
Series A | ||
5.00%, due 1/1/50 | 2,500,000 | 2,703,997 |
Los Angeles County Sanitation Districts Financing Authority, Green Bond, Revenue Bonds | ||
Series A | ||
4.00%, due 10/1/33 | 1,000,000 | 1,034,537 |
Los Angeles Department of Water & Power System, Revenue Bonds | ||
Series A | ||
5.00%, due 7/1/35 | 1,500,000 | 1,628,346 |
Moulton-Niguel Water District, Revenue Bonds | ||
5.00%, due 9/1/39 | 3,685,000 | 4,151,328 |
Oxnard Financing Authority, Waste Water, Revenue Bonds | ||
Insured: AGM | ||
5.00%, due 6/1/34 | 1,000,000 | 1,044,454 |
Puerto Rico Commonwealth Aqueduct & Sewer Authority, Revenue Bonds (b) | ||
Series B | ||
5.00%, due 7/1/28 | 1,330,000 | 1,417,942 |
Series B | ||
5.00%, due 7/1/33 | 8,000,000 | 8,524,204 |
Puerto Rico Commonwealth Aqueduct & Sewer Authority, Revenue Bonds, Senior Lien (b) | ||
Series A | ||
5.00%, due 7/1/33 | 900,000 | 958,959 |
Principal Amount | Value | |
Water & Sewer (continued) | ||
Puerto Rico Commonwealth Aqueduct & Sewer Authority, Revenue Bonds, Senior Lien (b) (continued) | ||
Series A | ||
5.00%, due 7/1/37 | $ 450,000 | $ 475,960 |
Series A | ||
5.00%, due 7/1/37 (c) | 800,000 | 849,767 |
Rancho Water District Financing Authority, Revenue Bonds | ||
Series A | ||
4.00%, due 8/1/37 | 2,750,000 | 2,855,547 |
San Joaquin Area Flood Control Agency, California Smith Canal Area Assessment, Special Assessment | ||
Insured: AGM | ||
3.00%, due 10/1/32 | 660,000 | 631,901 |
Insured: AGM | ||
3.00%, due 10/1/34 | 700,000 | 662,713 |
Insured: AGM | ||
3.25%, due 10/1/40 | 2,000,000 | 1,833,634 |
Insured: AGM | ||
3.375%, due 10/1/45 | 1,250,000 | 1,141,069 |
Insured: AGM | ||
3.375%, due 10/1/50 | 1,000,000 | 873,981 |
Santa Margarita-Dana Point Authority, Water District Improvement, Revenue Bonds | ||
4.00%, due 8/1/36 | 2,025,000 | 2,068,474 |
Silicon Valley Clean Water, Revenue Bonds | ||
Series B | ||
0.50%, due 3/1/26 | 2,000,000 | 1,814,749 |
Watereuse Finance Authority, Vallejo Sanitation And Flood Control District Refunding Program, Revenue Bonds | ||
Series A | ||
5.50%, due 5/1/36 | 500,000 | 527,944 |
32 | MainStay MacKay California Tax Free Opportunities Fund |
Principal Amount | Value | |
Long-Term Municipal Bonds (continued) | ||
Water & Sewer (continued) | ||
West Sacramento Financing Authority, Water Capital Projects, Revenue Bonds | ||
Insured: BAM | ||
4.00%, due 10/1/39 | $ 300,000 | $ 304,073 |
80,627,207 | ||
Total Municipal Bonds (Cost $1,119,407,441) | 1,052,267,116 | |
Total Investments (Cost $1,119,407,441) | 99.8% | 1,052,267,116 |
Other Assets, Less Liabilities | 0.2 | 2,144,883 |
Net Assets | 100.0% | $ 1,054,411,999 |
† | Percentages indicated are based on Fund net assets. |
(a) | Step coupon—Rate shown was the rate in effect as of April 30, 2022. |
(b) | May be sold to institutional investors only under Rule 144A or securities offered pursuant to Section 4(a)(2) of the Securities Act of 1933, as amended. |
(c) | Delayed delivery security. |
(d) | Coupon rate may change based on changes of the underlying collateral or prepayments of principal. Rate shown was the rate in effect as of April 30, 2022. |
(e) | Interest on these securities was subject to alternative minimum tax. |
(f) | Issue in default. |
(g) | Issue in non-accrual status. |
Type | Number of Contracts | Expiration Date | Value at Trade Date | Current Notional Amount | Unrealized Appreciation (Depreciation)2 |
Short Contracts | |||||
U.S. Treasury 10 Year Notes | (325) | June 2022 | $ (39,908,237) | $ (38,725,781) | $ 1,182,456 |
U.S. Treasury Long Bonds | (800) | June 2022 | (118,317,468) | (112,550,000) | 5,767,468 |
Net Unrealized Appreciation | $ 6,949,924 |
1. | As of April 30, 2022, cash in the amount of $3,352,500 was on deposit with a broker or futures commission merchant for futures transactions. |
2. | Represents the difference between the value of the contracts at the time they were opened and the value as of April 30, 2022. |
Abbreviation(s): |
AGC—Assured Guaranty Corp. |
AGM—Assured Guaranty Municipal Corp. |
AMBAC—Ambac Assurance Corp. |
BAM—Build America Mutual Assurance Co. |
CHF—Collegiate Housing Foundation |
CR—Custodial Receipts |
FHLMC—Federal Home Loan Mortgage Corp. |
ICC—Insured Custody Certificates |
NATL-RE—National Public Finance Guarantee Corp. |
Description | Quoted Prices in Active Markets for Identical Assets (Level 1) | Significant Other Observable Inputs (Level 2) | Significant Unobservable Inputs (Level 3) | Total |
Asset Valuation Inputs | ||||
Investments in Securities (a) | ||||
Municipal Bonds | ||||
Long-Term Municipal Bonds | $ — | $ 1,052,267,116 | $ — | $ 1,052,267,116 |
Other Financial Instruments | ||||
Futures Contracts (b) | 6,949,924 | — | — | 6,949,924 |
Total Investments in Securities and Other Financial Instruments | $ 6,949,924 | $ 1,052,267,116 | $ — | $ 1,059,217,040 |
(a) | For a complete listing of investments and their industries, see the Portfolio of Investments. |
(b) | The value listed for these securities reflects unrealized appreciation (depreciation) as shown on the Portfolio of Investments. |
34 | MainStay MacKay California Tax Free Opportunities Fund |
Assets | |
Investment in securities, at value (identified cost $1,119,407,441) | $1,052,267,116 |
Cash | 11,538,468 |
Cash collateral on deposit at broker for futures contracts | 3,352,500 |
Receivables: | |
Investment securities sold | 25,369,450 |
Interest | 11,596,518 |
Fund shares sold | 4,317,084 |
Other assets | 25,758 |
Total assets | 1,108,466,894 |
Liabilities | |
Payables: | |
Investment securities purchased | 48,926,080 |
Fund shares redeemed | 2,734,392 |
Variation margin on futures contracts | 1,024,925 |
Manager (See Note 3) | 414,657 |
NYLIFE Distributors (See Note 3) | 96,276 |
Transfer agent (See Note 3) | 45,810 |
Professional fees | 24,195 |
Custodian | 19,307 |
Shareholder communication | 11,869 |
Trustees | 915 |
Distributions payable | 756,469 |
Total liabilities | 54,054,895 |
Net assets | $1,054,411,999 |
Composition of Net Assets | |
Shares of beneficial interest outstanding (par value of $.001 per share) unlimited number of shares authorized | $108,715 |
Additional paid-in-capital | 1,160,082,609 |
1,160,191,324 | |
Total distributable earnings (loss) | (105,779,325) |
Net assets | $1,054,411,999 |
Class A | |
Net assets applicable to outstanding shares | $360,001,049 |
Shares of beneficial interest outstanding | 37,121,430 |
Net asset value per share outstanding | $9.70 |
Maximum sales charge (4.50% of offering price) | 0.46 |
Maximum offering price per share outstanding | $10.16 |
Investor Class | |
Net assets applicable to outstanding shares | $508,532 |
Shares of beneficial interest outstanding | 52,431 |
Net asset value per share outstanding | $9.70 |
Maximum sales charge (4.00% of offering price) | 0.40 |
Maximum offering price per share outstanding | $10.10 |
Class C | |
Net assets applicable to outstanding shares | $43,930,054 |
Shares of beneficial interest outstanding | 4,529,048 |
Net asset value and offering price per share outstanding | $9.70 |
Class C2 | |
Net assets applicable to outstanding shares | $357,054 |
Shares of beneficial interest outstanding | 36,804 |
Net asset value and offering price per share outstanding | $9.70 |
Class I | |
Net assets applicable to outstanding shares | $644,740,595 |
Shares of beneficial interest outstanding | 66,472,833 |
Net asset value and offering price per share outstanding | $9.70 |
Class R6 | |
Net assets applicable to outstanding shares | $4,874,715 |
Shares of beneficial interest outstanding | 502,200 |
Net asset value and offering price per share outstanding | $9.71 |
Investment Income (Loss) | |
Income | |
Interest | $16,405,395 |
Expenses | |
Manager (See Note 3) | 2,761,691 |
Distribution/Service—Class A (See Note 3) | 527,992 |
Distribution/Service—Investor Class (See Note 3) | 682 |
Distribution/Service—Class C (See Note 3) | 132,073 |
Distribution/Service—Class C2 (See Note 3) | 1,073 |
Transfer agent (See Note 3) | 149,868 |
Professional fees | 57,070 |
Custodian | 41,255 |
Shareholder communication | 16,570 |
Trustees | 12,622 |
Registration | 10,960 |
Miscellaneous | 21,959 |
Total expenses | 3,733,815 |
Net investment income (loss) | 12,671,580 |
Realized and Unrealized Gain (Loss) | |
Net realized gain (loss) on: | |
Unaffiliated investment transactions | (17,598,779) |
Futures transactions | 1,805,819 |
Net realized gain (loss) | (15,792,960) |
Net change in unrealized appreciation (depreciation) on: | |
Unaffiliated investments | (132,033,066) |
Futures contracts | 6,710,174 |
Net change in unrealized appreciation (depreciation) | (125,322,892) |
Net realized and unrealized gain (loss) | (141,115,852) |
Net increase (decrease) in net assets resulting from operations | $(128,444,272) |
36 | MainStay MacKay California Tax Free Opportunities Fund |
for the six months ended April 30, 2022 (Unaudited) and the year ended October 31, 2021
2022 | 2021 | |
Increase (Decrease) in Net Assets | ||
Operations: | ||
Net investment income (loss) | $12,671,580 | $23,563,894 |
Net realized gain (loss) | (15,792,960) | 5,712,825 |
Net change in unrealized appreciation (depreciation) | (125,322,892) | 16,179,430 |
Net increase (decrease) in net assets resulting from operations | (128,444,272) | 45,456,149 |
Distributions to shareholders: | ||
Class A | (5,107,523) | (9,302,283) |
Investor Class | (6,558) | (14,682) |
Class C | (565,512) | (1,214,752) |
Class C2 | (3,336) | (3,396) |
Class I | (10,107,612) | (17,897,833) |
Class R6 | (61,774) | (56,750) |
Total distributions to shareholders | (15,852,315) | (28,489,696) |
Capital share transactions: | ||
Net proceeds from sales of shares | 203,299,813 | 418,185,878 |
Net asset value of shares issued to shareholders in reinvestment of distributions | 11,309,302 | 19,857,013 |
Cost of shares redeemed | (297,586,951) | (268,437,712) |
Increase (decrease) in net assets derived from capital share transactions | (82,977,836) | 169,605,179 |
Net increase (decrease) in net assets | (227,274,423) | 186,571,632 |
Net Assets | ||
Beginning of period | 1,281,686,422 | 1,095,114,790 |
End of period | $1,054,411,999 | $1,281,686,422 |
Six months ended April 30, 2022* | Year Ended October 31, | |||||
Class A | 2021 | 2020 | 2019 | 2018 | 2017 | |
Net asset value at beginning of period | $10.94 | $10.75 | $10.76 | $10.12 | $10.29 | $10.48 |
Net investment income (loss) | 0.10(a) | 0.20(a) | 0.23 | 0.28 | 0.31 | 0.32 |
Net realized and unrealized gain (loss) | (1.21) | 0.23 | 0.03 | 0.64 | (0.17) | (0.19) |
Total from investment operations | (1.11) | 0.43 | 0.26 | 0.92 | 0.14 | 0.13 |
Less distributions: | ||||||
From net investment income | (0.13) | (0.24) | (0.27) | (0.28) | (0.31) | (0.32) |
Net asset value at end of period | $9.70 | $10.94 | $10.75 | $10.76 | $10.12 | $10.29 |
Total investment return (b) | (10.25)% | 4.05% | 2.46% | 9.20% | 1.39% | 1.36% |
Ratios (to average net assets)/Supplemental Data: | ||||||
Net investment income (loss) | 1.90%†† | 1.80% | 1.97% | 2.65% | 3.04% | 3.17% |
Net expenses (c) | 0.75%†† | 0.74% | 0.75% | 0.75% | 0.75% | 0.75% |
Expenses (before waiver/reimbursement) (c) | 0.75%†† | 0.76% | 0.80% | 0.81% | 0.82% | 0.82% |
Portfolio turnover rate | 29%(d) | 17%(d) | 29%(d) | 47%(d) | 32% | 83% |
Net assets at end of period (in 000’s) | $360,001 | $444,628 | $373,966 | $292,589 | $145,668 | $107,278 |
* | Unaudited. |
†† | Annualized. |
(a) | Per share data based on average shares outstanding during the period. |
(b) | Total investment return is calculated exclusive of sales charges and assumes the reinvestment of dividends and distributions. For periods of less than one year, total return is not annualized. |
(c) | In addition to the fees and expenses which the Fund bears directly, it also indirectly bears a pro-rata share of the fees and expenses of the underlying funds in which it invests. Such indirect expenses are not included in the above expense ratios. |
(d) | The portfolio turnover rate includes variable rate demand notes. |
Six months ended April 30, 2022* | Year Ended October 31, | |||||
Investor Class | 2021 | 2020 | 2019 | 2018 | 2017 | |
Net asset value at beginning of period | $10.94 | $10.76 | $10.76 | $10.12 | $10.29 | $10.49 |
Net investment income (loss) | 0.10(a) | 0.18(a) | 0.23 | 0.28 | 0.31 | 0.32 |
Net realized and unrealized gain (loss) | (1.21) | 0.24 | 0.04 | 0.64 | (0.17) | (0.20) |
Total from investment operations | (1.11) | 0.42 | 0.27 | 0.92 | 0.14 | 0.12 |
Less distributions: | ||||||
From net investment income | (0.13) | (0.24) | (0.27) | (0.28) | 0.31 | (0.32) |
Net asset value at end of period | $9.70 | $10.94 | $10.76 | $10.76 | $10.12 | $10.29 |
Total investment return (b) | (10.26)% | 3.93% | 2.53% | 9.18% | 1.36% | 1.23% |
Ratios (to average net assets)/Supplemental Data: | ||||||
Net investment income (loss) | 1.89%†† | 1.61% | 1.95% | 2.65% | 3.03% | 3.15% |
Net expenses (c) | 0.77%†† | 0.76% | 0.77% | 0.77% | 0.78% | 0.79% |
Expenses (before waiver/reimbursement) (c) | 0.77%†† | 0.78% | 0.82% | 0.83% | 0.85% | 0.86% |
Portfolio turnover rate | 29%(d) | 17%(d) | 29%(d) | 47%(d) | 32% | 83% |
Net assets at end of period (in 000's) | $509 | $554 | $672 | $506 | $343 | $285 |
* | Unaudited. |
†† | Annualized. |
(a) | Per share data based on average shares outstanding during the period. |
(b) | Total investment return is calculated exclusive of sales charges and assumes the reinvestment of dividends and distributions. For periods of less than one year, total return is not annualized. |
(c) | In addition to the fees and expenses which the Fund bears directly, it also indirectly bears a pro-rata share of the fees and expenses of the underlying funds in which it invests. Such indirect expenses are not included in the above expense ratios. |
(d) | The portfolio turnover rate includes variable rate demand notes. |
38 | MainStay MacKay California Tax Free Opportunities Fund |
Six months ended April 30, 2022* | Year Ended October 31, | |||||
Class C | 2021 | 2020 | 2019 | 2018 | 2017 | |
Net asset value at beginning of period | $10.94 | $10.76 | $10.77 | $10.12 | $10.29 | $10.48 |
Net investment income (loss) | 0.09(a) | 0.17(a) | 0.19 | 0.25 | 0.28 | 0.30 |
Net realized and unrealized gain (loss) | (1.22) | 0.22 | 0.04 | 0.65 | (0.17) | (0.19) |
Total from investment operations | (1.13) | 0.39 | 0.23 | 0.90 | 0.11 | 0.11 |
Less distributions: | ||||||
From net investment income | (0.11) | (0.21) | (0.24) | (0.25) | (0.28) | (0.30) |
Net asset value at end of period | $9.70 | $10.94 | $10.76 | $10.77 | $10.12 | $10.29 |
Total investment return (b) | (10.37)% | 3.67% | 2.18% | 9.01% | 1.11% | 1.07% |
Ratios (to average net assets)/Supplemental Data: | ||||||
Net investment income (loss) | 1.63%†† | 1.54% | 1.70% | 2.38% | 2.76% | 2.89% |
Net expenses (c) | 1.02%†† | 1.01% | 1.02% | 1.02% | 1.03% | 1.04% |
Expenses (before waiver/reimbursement) (c) | 1.02%†† | 1.03% | 1.07% | 1.08% | 1.10% | 1.11% |
Portfolio turnover rate | 29%(d) | 17%(d) | 29%(d) | 47%(d) | 32% | 83% |
Net assets at end of period (in 000’s) | $43,930 | $58,263 | $61,662 | $52,964 | $29,450 | $26,623 |
* | Unaudited. |
†† | Annualized. |
(a) | Per share data based on average shares outstanding during the period. |
(b) | Total investment return is calculated exclusive of sales charges and assumes the reinvestment of dividends and distributions. For periods of less than one year, total return is not annualized. |
(c) | In addition to the fees and expenses which the Fund bears directly, it also indirectly bears a pro-rata share of the fees and expenses of the underlying funds in which it invests. Such indirect expenses are not included in the above expense ratios. |
(d) | The portfolio turnover rate includes variable rate demand notes. |
Six months ended April 30, 2022* | Year Ended October 31, | August 31, 2020^ through October 31, | |
Class C2 | 2021 | 2020 | |
Net asset value at beginning of period | $10.94 | $10.75 | $10.83 |
Net investment income (loss) | 0.08(a) | 0.28(a) | 0.03 |
Net realized and unrealized gain (loss) | (1.21) | 0.11 | (0.07) |
Total from investment operations | (1.13) | 0.39 | (0.04) |
Less distributions: | |||
From net investment income | (0.11) | (0.20) | (0.04) |
Net asset value at end of period | $9.70 | $10.94 | $10.75 |
Total investment return (b) | (10.44)% | 3.59% | (0.40)% |
Ratios (to average net assets)/Supplemental Data: | |||
Net investment income (loss) | 1.51%†† | 2.56% | 1.49%†† |
Net expenses (c) | 1.17%†† | 1.16% | 1.16%†† |
Expenses (before waiver/reimbursement) (c) | 1.17%†† | 1.18% | 1.22%†† |
Portfolio turnover rate (d) | 29% | 17% | 29% |
Net assets at end of period (in 000’s) | $357 | $275 | $25 |
* | Unaudited. |
^ | Inception date. |
†† | Annualized. |
(a) | Per share data based on average shares outstanding during the period. |
(b) | Total investment return is calculated exclusive of sales charges and assumes the reinvestment of dividends and distributions. For periods of less than one year, total return is not annualized. |
(c) | In addition to the fees and expenses which the Fund bears directly, it also indirectly bears a pro-rata share of the fees and expenses of the underlying funds in which it invests. Such indirect expenses are not included in the above expense ratios. |
(d) | The portfolio turnover rate includes variable rate demand notes. |
Six months ended April 30, 2022* | Year Ended October 31, | |||||
Class I | 2021 | 2020 | 2019 | 2018 | 2017 | |
Net asset value at beginning of period | $10.94 | $10.76 | $10.76 | $10.12 | $10.29 | $10.48 |
Net investment income (loss) | 0.11(a) | 0.23(a) | 0.28 | 0.31 | 0.34 | 0.35 |
Net realized and unrealized gain (loss) | (1.21) | 0.22 | 0.02 | 0.64 | (0.17) | (0.19) |
Total from investment operations | (1.10) | 0.45 | 0.30 | 0.95 | 0.17 | 0.16 |
Less distributions: | ||||||
From net investment income | (0.14) | (0.27) | (0.30) | (0.31) | (0.34) | (0.35) |
Net asset value at end of period | $9.70 | $10.94 | $10.76 | $10.76 | $10.12 | $10.29 |
Total investment return (b) | (10.14)% | 4.21% | 2.81% | 9.48% | 1.65% | 1.62% |
Ratios (to average net assets)/Supplemental Data: | ||||||
Net investment income (loss) | 2.15%†† | 2.05% | 2.20% | 2.91% | 3.29% | 3.42% |
Net expenses (c) | 0.50%†† | 0.49% | 0.50% | 0.50% | 0.50% | 0.50% |
Expenses (before waiver/reimbursement) (c) | 0.50%†† | 0.51% | 0.55% | 0.56% | 0.57% | 0.57% |
Portfolio turnover rate | 29%(d) | 17%(d) | 29%(d) | 47%(d) | 32% | 83% |
Net assets at end of period (in 000’s) | $644,741 | $776,207 | $655,579 | $429,106 | $228,220 | $148,819 |
* | Unaudited. |
†† | Annualized. |
(a) | Per share data based on average shares outstanding during the period. |
(b) | Total investment return is calculated exclusive of sales charges and assumes the reinvestment of dividends and distributions. Class I shares are not subject to sales charges. For periods of less than one year, total return is not annualized. |
(c) | In addition to the fees and expenses which the Fund bears directly, it also indirectly bears a pro-rata share of the fees and expenses of the underlying funds in which it invests. Such indirect expenses are not included in the above expense ratios. |
(d) | The portfolio turnover rate includes variable rate demand notes. |
Six months ended April 30, 2022* | Year Ended October 31, | November 1, 2019^ through October 31, | |
Class R6 | 2021 | 2020 | |
Net asset value at beginning of period | $10.94 | $10.76 | $10.77 |
Net investment income (loss) | 0.11(a) | 0.21(a) | 0.25 |
Net realized and unrealized gain (loss) | (1.20) | 0.24 | 0.04 |
Total from investment operations | (1.09) | 0.45 | 0.29 |
Less distributions: | |||
From net investment income | (0.14) | (0.27) | (0.30) |
Net asset value at end of period | $9.71 | $10.94 | $10.76 |
Total investment return (b) | (10.03)% | 4.23% | 2.83% |
Ratios (to average net assets)/Supplemental Data: | |||
Net investment income (loss) | 2.18%†† | 1.86% | 2.25% |
Net expenses (c) | 0.47%†† | 0.47% | 0.48% |
Expenses (before waiver/reimbursement) (c) | 0.47%†† | 0.49% | 0.53% |
Portfolio turnover rate (d) | 29% | 17% | 29% |
Net assets at end of period (in 000’s) | $4,875 | $1,759 | $3,211 |
* | Unaudited. |
^ | Inception date. |
†† | Annualized. |
(a) | Per share data based on average shares outstanding during the period. |
(b) | Total investment return is calculated exclusive of sales charges and assumes the reinvestment of dividends and distributions. Class R6 shares are not subject to sales charges. For periods of less than one year, total return is not annualized. |
(c) | In addition to the fees and expenses which the Fund bears directly, it also indirectly bears a pro-rata share of the fees and expenses of the underlying funds in which it invests. Such indirect expenses are not included in the above expense ratios. |
(d) | The portfolio turnover rate includes variable rate demand notes. |
40 | MainStay MacKay California Tax Free Opportunities Fund |
Class | Commenced Operations |
Class A | February 28, 2013 |
Investor Class | February 28, 2013 |
Class C | February 28, 2013 |
Class C2 | August 31, 2020 |
Class I | February 28, 2013 |
Class R6 | November 1, 2019 |
SIMPLE Class | N/A* |
* | SIMPLE Class shares were registered for sale effective as of August 31, 2020 but have not yet commenced operations. |
• Benchmark yields | • Reported trades |
• Broker/dealer quotes | • Issuer spreads |
• Two-sided markets | • Benchmark securities |
• Bids/offers | • Reference data (corporate actions or material event notices) |
• Industry and economic events | • Comparable bonds |
• Monthly payment information |
42 | MainStay MacKay California Tax Free Opportunities Fund |
44 | MainStay MacKay California Tax Free Opportunities Fund |
Asset Derivatives | Interest Rate Contracts Risk | Total |
Futures Contracts - Net Assets—Net unrealized appreciation on futures contracts (a) | $6,949,924 | $6,949,924 |
Total Fair Value | $6,949,924 | $6,949,924 |
(a) | Includes cumulative appreciation (depreciation) of futures contracts as reported in the Portfolio of Investments. Only current day’s variation margin is reported within the Statement of Assets and Liabilities. |
Net Realized Gain (Loss) from: | Interest Rate Contracts Risk | Total |
Futures Contracts | $1,805,819 | $1,805,819 |
Total Net Realized Gain (Loss) | $1,805,819 | $1,805,819 |
Net Change in Unrealized Appreciation (Depreciation) | Interest Rate Contracts Risk | Total |
Futures Contracts | $6,710,174 | $6,710,174 |
Total Net Change in Unrealized Appreciation (Depreciation) | $6,710,174 | $6,710,174 |
Average Notional Amount | Total |
Futures Contracts Short | $(85,641,016) |
Class | Expense | Waived |
Class A | $49,295 | $— |
Investor Class | 123 | — |
Class C | 11,864 | — |
Class C2 | 74 | — |
Class I | 88,421 | — |
Class R6 | 91 | — |
46 | MainStay MacKay California Tax Free Opportunities Fund |
Class C2 | $23,057 | 6.5% |
Class R6 | 24,017 | 0.5 |
Federal Tax Cost | Gross Unrealized Appreciation | Gross Unrealized (Depreciation) | Net Unrealized Appreciation/ (Depreciation) | |
Investments in Securities | $1,132,716,516 | $4,373,439 | $(84,822,839) | $(80,449,400) |
Capital Loss Available Through | Short-Term Capital Loss Amounts (000’s) | Long-Term Capital Loss Amounts (000’s) |
Unlimited | $12,350 | $733 |
2021 | |
Distributions paid from: | |
Ordinary Income | $768,763 |
Exempt Interest Dividends | 27,720,933 |
Total | $28,489,696 |
Class A | Shares | Amount |
Six-month period ended April 30, 2022: | ||
Shares sold | 3,621,920 | $38,611,097 |
Shares issued to shareholders in reinvestment of distributions | 400,023 | 4,195,267 |
Shares redeemed | (7,559,409) | (78,666,020) |
Net increase (decrease) in shares outstanding before conversion | (3,537,466) | (35,859,656) |
Shares converted into Class A (See Note 1) | 418 | 4,250 |
Net increase (decrease) | (3,537,048) | $(35,855,406) |
Year ended October 31, 2021: | ||
Shares sold | 12,129,617 | $133,832,552 |
Shares issued to shareholders in reinvestment of distributions | 689,377 | 7,594,800 |
Shares redeemed | (6,991,630) | (77,063,811) |
Net increase (decrease) in shares outstanding before conversion | 5,827,364 | 64,363,541 |
Shares converted into Class A (See Note 1) | 114,504 | 1,276,207 |
Shares converted from Class A (See Note 1) | (55,852) | (609,652) |
Net increase (decrease) | 5,886,016 | $65,030,096 |
Investor Class | Shares | Amount |
Six-month period ended April 30, 2022: | ||
Shares sold | 3,441 | $36,459 |
Shares issued to shareholders in reinvestment of distributions | 625 | 6,547 |
Shares redeemed | (2,370) | (24,660) |
Net increase (decrease) in shares outstanding before conversion | 1,696 | 18,346 |
Shares converted into Investor Class (See Note 1) | 38 | 393 |
Net increase (decrease) | 1,734 | $18,739 |
Year ended October 31, 2021: | ||
Shares sold | 14,817 | $163,273 |
Shares issued to shareholders in reinvestment of distributions | 1,305 | 14,374 |
Shares redeemed | (5,242) | (57,745) |
Net increase (decrease) in shares outstanding before conversion | 10,880 | 119,902 |
Shares converted into Investor Class (See Note 1) | 367 | 4,024 |
Shares converted from Investor Class (See Note 1) | (23,046) | (254,911) |
Net increase (decrease) | (11,799) | $(130,985) |
Class C | Shares | Amount |
Six-month period ended April 30, 2022: | ||
Shares sold | 135,264 | $1,413,662 |
Shares issued to shareholders in reinvestment of distributions | 42,164 | 442,581 |
Shares redeemed | (974,907) | (10,281,392) |
Net increase (decrease) in shares outstanding before conversion | (797,479) | (8,425,149) |
Shares converted from Class C (See Note 1) | (455) | (4,643) |
Net increase (decrease) | (797,934) | $(8,429,792) |
Year ended October 31, 2021: | ||
Shares sold | 832,531 | $9,166,279 |
Shares issued to shareholders in reinvestment of distributions | 84,200 | 927,733 |
Shares redeemed | (1,311,739) | (14,451,128) |
Net increase (decrease) in shares outstanding before conversion | (395,008) | (4,357,116) |
Shares converted from Class C (See Note 1) | (10,620) | (118,247) |
Net increase (decrease) | (405,628) | $(4,475,363) |
Class C2 | Shares | Amount |
Six-month period ended April 30, 2022: | ||
Shares sold | 11,543 | $124,987 |
Shares issued to shareholders in reinvestment of distributions | 320 | 3,336 |
Shares redeemed | (179) | (1,855) |
Net increase (decrease) | 11,684 | $126,468 |
Year ended October 31, 2021: | ||
Shares sold | 22,632 | $248,457 |
Shares issued to shareholders in reinvestment of distributions | 308 | 3,396 |
Shares redeemed | (136) | (1,496) |
Net increase (decrease) | 22,804 | $250,357 |
48 | MainStay MacKay California Tax Free Opportunities Fund |
Class I | Shares | Amount |
Six-month period ended April 30, 2022: | ||
Shares sold | 15,167,815 | $159,231,252 |
Shares issued to shareholders in reinvestment of distributions | 629,490 | 6,600,590 |
Shares redeemed | (20,277,047) | (208,202,340) |
Net increase (decrease) in shares outstanding before conversion | (4,479,742) | (42,370,498) |
Shares converted from Class I (See Note 1) | (20,024) | (206,845) |
Net increase (decrease) | (4,499,766) | $(42,577,343) |
Year ended October 31, 2021: | ||
Shares sold | 24,818,215 | $273,702,977 |
Shares issued to shareholders in reinvestment of distributions | 1,021,770 | 11,260,199 |
Shares redeemed | (15,876,495) | (175,130,908) |
Net increase (decrease) in shares outstanding before conversion | 9,963,490 | 109,832,268 |
Shares converted into Class I (See Note 1) | 56,613 | 618,065 |
Net increase (decrease) | 10,020,103 | $110,450,333 |
Class R6 | Shares | Amount |
Six-month period ended April 30, 2022: | ||
Shares sold | 354,759 | $3,882,356 |
Shares issued to shareholders in reinvestment of distributions | 5,846 | 60,981 |
Shares redeemed | (39,182) | (410,684) |
Net increase (decrease) in shares outstanding before conversion | 321,423 | 3,532,653 |
Shares converted into Class R6 (See Note 1) | 20,024 | 206,845 |
Net increase (decrease) | 341,447 | $3,739,498 |
Year ended October 31, 2021: | ||
Shares sold | 97,201 | $1,072,340 |
Shares issued to shareholders in reinvestment of distributions | 5,129 | 56,511 |
Shares redeemed | (158,095) | (1,732,624) |
Net increase (decrease) in shares outstanding before conversion | (55,765) | (603,773) |
Shares converted from Class R6 (See Note 1) | (81,959) | (915,486) |
Net increase (decrease) | (137,724) | $(1,519,259) |
50 | MainStay MacKay California Tax Free Opportunities Fund |
52 | MainStay MacKay California Tax Free Opportunities Fund |
54 | MainStay MacKay California Tax Free Opportunities Fund |
For more information
Message from the President and Semiannual Report
please log in to newyorklifeinvestments.com/accounts.
Not FDIC/NCUA Insured | Not a Deposit | May Lose Value | No Bank Guarantee | Not Insured by Any Government Agency |


5 | |
9 | |
11 | |
75 | |
83 | |
92 | |
96 | |
97 | |
97 |
Investors should refer to the Fund’s Summary Prospectus and/or Prospectus and consider the Fund’s investment objectives, strategies, risks, charges and expenses carefully before investing. The Summary Prospectus and/or Prospectus contain this and other information about the Fund. You may obtain copies of the Fund’s Summary Prospectus, Prospectus and Statement of Additional Information, which includes information about MainStay Funds Trust's Trustees, free of charge, upon request, by calling toll-free 800-624-6782, by writing to NYLIFE Distributors LLC, Attn: MainStay Marketing Department, 30 Hudson Street, Jersey City, NJ 07302 or by sending an e-mail to MainStayShareholderServices@nylim.com. These documents are also available via the MainStay Funds’ website at newyorklifeinvestments.com. Please read the Fund’s Summary Prospectus and/or Prospectus carefully before investing.

Average Annual Total Returns for the Period-Ended April 30, 2022 | ||||||||
Class | Sales Charge | Inception Date | Six Months1 | One Year | Five Years | Ten Years or Since Inception | Gross Expense Ratio2 | |
Class A Shares | Maximum 4.5% Initial Sales Charge | With sales charges | 3/31/2010 | -13.80% | -12.52% | 2.10% | 4.10% | 0.85% |
Excluding sales charges | -9.73 | -8.40 | 3.04 | 4.58 | 0.85 | |||
Investor Class Shares3 | Maximum 4% Initial Sales Charge | With sales charges | 3/31/2010 | -13.36 | -12.08 | 2.08 | 4.07 | 0.87 |
Excluding sales charges | -9.75 | -8.42 | 3.03 | 4.55 | 0.87 | |||
Class C Shares | Maximum 1% CDSC | With sales charges | 3/31/2010 | -10.99 | -9.94 | 2.26 | 3.77 | 1.62 |
if Redeemed Within One Year of Purchase | Excluding sales charges | -10.10 | -9.04 | 2.26 | 3.77 | 1.62 | ||
Class I Shares | No Sales Charge | 3/31/2010 | -9.63 | -8.17 | 3.30 | 4.83 | 0.60 | |
Class R6 Shares | No Sales Charge | 11/1/2019 | -9.67 | -8.13 | N/A | 0.21 | 0.55 | |
1. | Not annualized. |
2. | The gross expense ratios presented reflect the Fund’s “Total Annual Fund Operating Expenses” from the most recent Prospectus, as supplemented, and may differ from other expense ratios disclosed in this report. |
3. | Prior to June 30, 2020, the maximum initial sales charge was 4.5%, which is reflected in the applicable average annual total return figures shown. |
Benchmark Performance* | Six Months1 | One Year | Five Years | Ten Years |
Bloomberg Municipal Bond Index2 | -7.90% | -7.88% | 1.80% | 2.48% |
Bloomberg High Yield Municipal Bond Index3 | -8.43 | -6.23 | 4.35 | 4.83 |
High Yield Municipal Bond Composite Index4 | -8.21 | -6.89 | 3.34 | 3.90 |
Morningstar High Yield Muni Category Average5 | -8.97 | -7.69 | 2.56 | 3.52 |
* | Returns for indices reflect no deductions for fees, expenses or taxes, except for foreign withholding taxes where applicable. |
1. | Not annualized. |
2. | The Bloomberg Municipal Bond Index is the Fund's primary broadbased securities market index for comparison purposes. The Bloomberg Municipal Bond Index is considered representative of the broadbased market for investment-grade, tax-exempt bonds with a maturity of at least one year. Bonds subject to the alternative minimum tax or with floating or zero coupons are excluded. Results assume reinvestment of all dividends and capital gains. An investment cannot be made directly in an index. |
3. | The Fund has selected the Bloomberg High Yield Municipal Bond Index as an additional benchmark. The Bloomberg Municipal High Yield Bond Index is a flagship measure of the non-investment grade and non-rated U.S. dollar-denominated tax-exempt bond market. |
4. | The High Yield Municipal Bond Composite Index is the Fund’s secondary benchmark. The High Yield Municipal Bond Composite Index consists of the Bloomberg High Yield Municipal Bond Index and the Bloomberg Municipal Bond Index weighted 60%/40%, respectively. The Bloomberg High Yield Municipal Bond Index is made up of bonds that are non-investment grade, unrated, or rated below Ba1 by Moody’s Investors Service with a remaining maturity of at least one year. Results assume reinvestment of all dividends and capital gains. An investment cannot be made directly in an index. |
5. | The Morningstar High Yield Muni Category Average is representative of Funds that invest a substantial portion of assets in high-income municipal securities that are not rated or that are rated at the level of or below BBB by a major ratings agency such as Standard & Poor’s or Moody’s. Results are based on average total returns of similar funds with all dividends and capital gain distributions reinvested. |
6 | MainStay MacKay High Yield Municipal Bond Fund |
Share Class | Beginning Account Value 11/1/21 | Ending Account Value (Based on Actual Returns and Expenses) 4/30/22 | Expenses Paid During Period1 | Ending Account Value (Based on Hypothetical 5% Annualized Return and Actual Expenses) 4/30/22 | Expenses Paid During Period1 | Net Expense Ratio During Period2 |
Class A Shares | $1,000.00 | $902.70 | $3.96 | $1,020.63 | $4.21 | 0.84% |
Investor Class Shares | $1,000.00 | $902.50 | $4.01 | $1,020.58 | $4.26 | 0.85% |
Class C Shares | $1,000.00 | $899.00 | $7.58 | $1,016.81 | $8.05 | 1.61% |
Class I Shares | $1,000.00 | $903.70 | $2.78 | $1,021.87 | $2.96 | 0.59% |
Class R6 Shares | $1,000.00 | $903.30 | $2.55 | $1,022.12 | $2.71 | 0.54% |
1. | Expenses are equal to the Fund’s annualized expense ratio of each class multiplied by the average account value over the period, divided by 365 and multiplied by 181 (to reflect the six-month period). The table above represents the actual expenses incurred during the six-month period. In addition to the fees and expenses which the Fund bears directly, it also indirectly bears a pro rata share of the fees and expenses of the underlying funds in which it invests. Such indirect expenses are not included in the above-reported expense figures. |
2. | Expenses are equal to the Fund's annualized expense ratio to reflect the six-month period. |
Portfolio Composition as of April 30, 2022 (Unaudited)
Puerto Rico | 12.9% |
California | 10.7 |
Illinois | 10.0 |
New York | 8.8 |
New Jersey | 5.6 |
Texas | 5.0 |
Ohio | 4.7 |
Pennsylvania | 4.3 |
Florida | 3.3 |
Colorado | 2.6 |
Wisconsin | 2.4 |
U.S. Virgin Islands | 2.1 |
Michigan | 1.9 |
Georgia | 1.8 |
Virginia | 1.7 |
District of Columbia | 1.6 |
Arizona | 1.4 |
Massachusetts | 1.2 |
Minnesota | 1.2 |
Alabama | 1.1 |
Kentucky | 1.1 |
Maryland | 0.9 |
Missouri | 0.9 |
Iowa | 0.9 |
Utah | 0.9 |
Washington | 0.9 |
Guam | 0.8 |
Arkansas | 0.8 |
Tennessee | 0.7 |
Indiana | 0.7% |
Hawaii | 0.7 |
North Carolina | 0.7 |
South Carolina | 0.7 |
Connecticut | 0.5 |
North Dakota | 0.4 |
Delaware | 0.4 |
Louisiana | 0.3 |
West Virginia | 0.3 |
New Hampshire | 0.3 |
Multi–State | 0.2 |
Alaska | 0.2 |
Nevada | 0.2 |
Montana | 0.2 |
Rhode Island | 0.2 |
Kansas | 0.2 |
Oregon | 0.1 |
Maine | 0.1 |
New Mexico | 0.1 |
Oklahoma | 0.1 |
Vermont | 0.1 |
Idaho | 0.0‡ |
South Dakota | 0.0‡ |
Mississippi | 0.0‡ |
Other Assets, Less Liabilities | 1.1 |
100.0% |
‡ | Less than one–tenth of a percent. |
Top Ten Holdings and/or Issuers Held as of April 30, 2022 (excluding short-term investments) (Unaudited)
1. | Puerto Rico Sales Tax Financing Corp., (zero coupon)-5.00%, due 7/1/31–7/1/58 |
2. | Commonwealth of Puerto Rico, (zero coupon)-5.75%, due 7/1/23–7/1/46 |
3. | Puerto Rico Commonwealth Aqueduct & Sewer Authority, 3.75%-6.00%, due 7/1/22–7/1/47 |
4. | Metropolitan Pier & Exposition Authority, (zero coupon)-5.00%, due 12/15/31–6/15/57 |
5. | Chicago Board of Education, (zero coupon)-7.00%, due 12/1/26–12/1/47 |
6. | Metropolitan Transportation Authority, 0.35%-5.00%, due 9/1/22–11/15/54 |
7. | Tender Option Bond Trust Receipts/Certificates, 0.48%, due 6/15/31–11/15/53 |
8. | New York Transportation Development Corp., 4.375%-5.375%, due 8/1/31–1/1/50 |
9. | Puerto Rico Electric Power Authority, 1.168%-7.00%, due 7/1/19–7/1/43 |
10. | Golden State Tobacco Securitization Corp., (zero coupon)-5.30%, due 6/1/36–6/1/66 |
8 | MainStay MacKay High Yield Municipal Bond Fund |
10 | MainStay MacKay High Yield Municipal Bond Fund |
Principal Amount | Value | |
Municipal Bonds 97.7% | ||
Long-Term Municipal Bonds 90.8% | ||
Alabama 0.8% | ||
Alabama Special Care Facilities Financing Authority-Birmingham AL, Methodist Home for the Aging, Revenue Bonds | ||
5.75%, due 6/1/45 | $ 1,250,000 | $ 1,229,551 |
County of Jefferson AL, Sewer, Revenue Bonds, Senior Lien | ||
Series A, Insured: AGM | ||
5.50%, due 10/1/53 | 11,710,000 | 12,372,684 |
County of Jefferson AL, Sewer, Revenue Bonds, Sub. Lien | ||
Series D | ||
6.00%, due 10/1/42 | 2,500,000 | 2,742,254 |
Homewood Educational Building Authority, Samford University Project, Revenue Bonds | ||
Series A | ||
4.00%, due 12/1/33 | 400,000 | 406,582 |
Series A | ||
4.00%, due 12/1/35 | 1,000,000 | 1,008,727 |
Series A | ||
4.00%, due 12/1/36 | 615,000 | 618,861 |
Series A | ||
4.00%, due 12/1/37 | 650,000 | 653,754 |
Series A | ||
4.00%, due 12/1/39 | 1,760,000 | 1,764,512 |
Series A | ||
4.00%, due 12/1/41 | 2,750,000 | 2,748,460 |
Montgomery Educational Building Authority, Faulkner University, Revenue Bonds | ||
Series A | ||
5.00%, due 10/1/43 | 4,830,000 | 4,867,177 |
Prichard Water Works & Sewer Board, Revenue Bonds | ||
4.00%, due 11/1/49 | 6,000,000 | 4,573,496 |
Tuscaloosa County Industrial Development Authority, Hunt Refining Project, Revenue Bonds (a) | ||
Series A | ||
4.50%, due 5/1/32 | 7,529,545 | 7,247,667 |
Series A | ||
5.25%, due 5/1/44 | 43,390,000 | 42,887,999 |
83,121,724 | ||
Principal Amount | Value | |
Alaska 0.2% | ||
Alaska Industrial Development & Export Authority, Tanana Chiefs Conference Project, Revenue Bonds | ||
Series A | ||
4.00%, due 10/1/44 | $ 9,750,000 | $ 9,910,615 |
Series A | ||
4.00%, due 10/1/49 | 5,890,000 | 5,739,066 |
Alaska Industrial Development & Export Authority, Interior Gas Utility Project, Revenue Bonds | ||
Series A | ||
5.00%, due 6/1/40 | 1,795,000 | 1,814,763 |
Series A | ||
5.00%, due 6/1/50 | 3,485,000 | 3,471,431 |
Northern Tobacco Securitization Corp., Tobacco Settlement Asset-Backed, Revenue Bonds, Senior Lien | ||
Series A, Class 1 | ||
4.00%, due 6/1/50 | 2,255,000 | 2,093,170 |
Series B-1, Class 2 | ||
4.00%, due 6/1/50 | 1,500,000 | 1,365,474 |
24,394,519 | ||
Arizona 1.4% | ||
Arizona Industrial Development Authority, GreatHearts Arizona Project, Revenue Bonds | ||
Series A, Insured: SD CRED PROG | ||
3.00%, due 7/1/46 | 4,315,000 | 3,521,442 |
Series A, Insured: SD CRED PROG | ||
3.00%, due 7/1/52 | 9,625,000 | 7,562,263 |
Arizona Industrial Development Authority, Provident Group, NCCU Properties LLC, Central University Project, Revenue Bonds | ||
Series A, Insured: BAM | ||
4.00%, due 6/1/44 | 2,500,000 | 2,531,801 |
Series A, Insured: BAM | ||
5.00%, due 6/1/58 | 5,500,000 | 5,927,248 |
Principal Amount | Value | |
Long-Term Municipal Bonds (continued) | ||
Arizona (continued) | ||
Arizona Industrial Development Authority, Equitable School Revolving Fund LLC, Revenue Bonds | ||
Series A | ||
4.00%, due 11/1/46 | $ 1,000,000 | $ 969,385 |
Series A | ||
4.00%, due 11/1/51 | 12,410,000 | 11,865,246 |
Arizona Industrial Development Authority, University of Indianapolis, Health Pavilion Project, Revenue Bonds | ||
Series A | ||
4.00%, due 10/1/49 | 1,000,000 | 985,650 |
Series A | ||
5.00%, due 10/1/45 | 1,875,000 | 2,007,470 |
Arizona Industrial Development Authority, Equitable School Revolving Fund LLC Obligated Group, Revenue Bonds | ||
Series A | ||
4.00%, due 11/1/50 | 3,405,000 | 3,262,002 |
Arizona Industrial Development Authority, Macombs Facility Project, Revenue Bonds | ||
Series A | ||
4.00%, due 7/1/61 | 6,250,000 | 5,208,116 |
Arizona Industrial Development Authority, Jerome Facility Project, Revenue Bonds | ||
Series B | ||
4.00%, due 7/1/61 | 1,000,000 | 833,299 |
Arizona Industrial Development Authority, Idaho State Tax Commission, Linder Village Project, Revenue Bonds | ||
5.00%, due 6/1/31 (a) | 4,000,000 | 4,139,959 |
Arizona Industrial Development Authority, Arizona Agribusiness and Equine Center, Inc., Revenue Bonds (a) | ||
Series B | ||
5.00%, due 3/1/37 | 3,280,000 | 3,426,202 |
Series B | ||
5.00%, due 3/1/42 | 3,435,000 | 3,553,032 |
Principal Amount | Value | |
Arizona (continued) | ||
Arizona Industrial Development Authority, Mater Academy of Nevada, Bonanza Campus Project, Revenue Bonds | ||
Series A | ||
5.00%, due 12/15/50 (a) | $ 1,500,000 | $ 1,526,113 |
Arizona Industrial Development Authority, Provident Group, Eastern Michigan University Parking Project, Revenue Bonds | ||
5.00%, due 5/1/51 | 1,000,000 | 880,374 |
Arizona Industrial Development Authority, Basis Schools Project, Revenue Bonds | ||
Series A | ||
5.375%, due 7/1/50 (a) | 1,500,000 | 1,554,387 |
Arizona Industrial Development Authority, American Charter Schools Foundation, Revenue Bonds (a) | ||
6.00%, due 7/1/37 | 3,035,000 | 3,324,228 |
6.00%, due 7/1/47 | 6,685,000 | 7,238,891 |
City of Phoenix AZ, Basis Schools Project, Revenue Bonds (a) | ||
Series A | ||
5.00%, due 7/1/35 | 1,700,000 | 1,743,823 |
Series A | ||
5.00%, due 7/1/45 | 1,000,000 | 1,018,650 |
Series A | ||
5.00%, due 7/1/46 | 3,870,000 | 3,941,033 |
City of Phoenix AZ, Downtown Phoenix Student Housing LLC, Revenue Bonds | ||
Series A | ||
5.00%, due 7/1/37 | 1,000,000 | 1,068,715 |
Series A | ||
5.00%, due 7/1/59 | 2,200,000 | 2,304,982 |
City of Phoenix AZ, Villa Montessori, Inc. Project, Revenue Bonds | ||
5.00%, due 7/1/45 | 2,150,000 | 2,196,925 |
City of Phoenix AZ, Espiritu Community Development Corp., Revenue Bonds | ||
Series A | ||
6.25%, due 7/1/36 | 870,000 | 867,483 |
12 | MainStay MacKay High Yield Municipal Bond Fund |
Principal Amount | Value | |
Long-Term Municipal Bonds (continued) | ||
Arizona (continued) | ||
Florence Town, Inc. Industrial Development Authority, Legacy Traditional School Project, Revenue Bonds | ||
6.00%, due 7/1/43 | $ 2,450,000 | $ 2,555,550 |
Glendale Industrial Development Authority, Midwestern University Foundation, Revenue Bonds | ||
Series A | ||
2.125%, due 7/1/33 (b) | 2,000,000 | 1,598,994 |
Glendale Industrial Development Authority, People of Faith, Inc. Obligated Group, Revenue Bonds | ||
Series A | ||
5.00%, due 5/15/56 | 8,250,000 | 8,476,179 |
Industrial Development Authority of the County of Pima (The), American Leadership Academy, Inc., Revenue Bonds (a) | ||
4.00%, due 6/15/41 | 1,250,000 | 1,117,370 |
4.00%, due 6/15/51 | 8,250,000 | 6,926,962 |
4.00%, due 6/15/57 | 500,000 | 406,614 |
Industrial Development Authority of the County of Pima (The), Charter Schools Project, Revenue Bonds | ||
Series Q | ||
5.375%, due 7/1/31 | 1,165,000 | 1,169,133 |
Industrial Development Authority of the County of Pima (The), American Leadership AC, Revenue Bonds | ||
5.625%, due 6/15/45 (a) | 3,735,000 | 3,840,406 |
Maricopa County Industrial Development Authority, Commercial Metals Co., Revenue Bonds | ||
4.00%, due 10/15/47 (a)(b) | 3,000,000 | 2,740,025 |
Maricopa County Industrial Development Authority, Legacy Traditional School Project, Revenue Bonds | ||
Series A | ||
4.00%, due 7/1/51 (a) | 1,750,000 | 1,523,957 |
Principal Amount | Value | |
Arizona (continued) | ||
Maricopa County Industrial Development Authority, Horizon Community Learning Center, Revenue Bonds | ||
5.00%, due 7/1/35 | $ 3,000,000 | $ 3,054,091 |
Maricopa County Pollution Control Corp., El Paso Electric Co. Project, Revenue Bonds | ||
Series A | ||
3.60%, due 2/1/40 | 14,000,000 | 13,321,532 |
Series B | ||
3.60%, due 4/1/40 | 8,750,000 | 8,323,381 |
Pinal County Industrial Development Authority, WOF SW GGP 1 LLC, Revenue Bonds (b) | ||
5.50%, due 10/1/33 | 2,000,000 | 1,849,576 |
Series A | ||
5.50%, due 10/1/33 (a) | 7,673,000 | 7,095,898 |
147,458,387 | ||
Arkansas 0.8% | ||
Arkansas Development Finance Authority, Washington Regional Medical Center, Revenue Bonds | ||
4.00%, due 2/1/42 | 6,475,000 | 6,351,555 |
Series C | ||
5.00%, due 2/1/33 | 1,425,000 | 1,495,721 |
Series C | ||
5.00%, due 2/1/35 | 1,170,000 | 1,225,430 |
Arkansas Development Finance Authority, Baptist Health, Revenue Bonds | ||
4.00%, due 12/1/44 | 650,000 | 644,920 |
Arkansas Development Finance Authority, Big River Steel Project, Revenue Bonds | ||
4.50%, due 9/1/49 (a)(b) | 29,750,000 | 27,595,243 |
Arkansas Development Finance Authority, Big River Steel Project, Green Bond, Revenue Bonds | ||
Series A | ||
4.75%, due 9/1/49 (a)(b) | 45,400,000 | 43,534,110 |
80,846,979 | ||
Principal Amount | Value | |
Long-Term Municipal Bonds (continued) | ||
California 8.6% | ||
Alameda Corridor Transportation Authority, Revenue Bonds | ||
Series A, Insured: NATL-RE | ||
(zero coupon), due 10/1/35 | $ 3,440,000 | $ 2,034,993 |
Antelope Valley Healthcare District, Antelope Valley Healthcare District Obligated Group, Revenue Bonds | ||
Series A | ||
5.00%, due 3/1/46 | 1,095,000 | 1,125,563 |
Bassett Unified School District, Capital Appreciation, Election 2004, Unlimited General Obligation | ||
Series C, Insured: NATL-RE | ||
(zero coupon), due 8/1/41 | 2,050,000 | 922,269 |
Series C, Insured: NATL-RE | ||
(zero coupon), due 8/1/42 | 2,000,000 | 856,720 |
California Community Housing Agency, Fountains at Emerald, Revenue Bonds, Senior Lien | ||
Series A-1 | ||
3.00%, due 8/1/56 (a) | 2,500,000 | 1,773,254 |
California Community Housing Agency, Summit at Sausalito Apartments, Revenue Bonds | ||
Series A-1 | ||
3.00%, due 2/1/57 (a) | 5,000,000 | 3,511,650 |
California Community Housing Agency, Essential Housing, Revenue Bonds | ||
Series A | ||
4.00%, due 2/1/56 (a) | 2,000,000 | 1,651,800 |
California Community Housing Agency, Essential Housing, Revenue Bonds, Senior Lien (a) | ||
Series A1 | ||
4.00%, due 2/1/56 | 21,500,000 | 18,964,385 |
Series A-1 | ||
4.00%, due 2/1/56 | 1,500,000 | 1,334,689 |
California Community Housing Agency, Annadel Apartments, Revenue Bonds | ||
Series A | ||
5.00%, due 4/1/49 (a) | 9,650,000 | 8,414,317 |
Principal Amount | Value | |
California (continued) | ||
California Community Housing Agency, Verdant at Green Valley Apartments, Revenue Bonds | ||
Series A | ||
5.00%, due 8/1/49 (a) | $ 5,000,000 | $ 4,784,630 |
California Community Housing Agency, Essential Housing, Serenity at Larkspur Apartments, Revenue Bonds | ||
Series A | ||
5.00%, due 2/1/50 (a) | 11,045,000 | 10,442,801 |
California Community Housing Agency, Essential Housing Arbors Apartments, Revenue Bonds | ||
Series A | ||
5.00%, due 8/1/50 (a) | 9,750,000 | 9,282,173 |
California Health Facilities Financing Authority, CommonSpirit Health, Revenue Bonds | ||
Series A | ||
4.00%, due 4/1/44 | 7,965,000 | 7,745,840 |
California Infrastructure and Economic Development Bank, Equitable School Revolving Fund LLC, Revenue Bonds | ||
Series B | ||
4.00%, due 11/1/46 | 1,700,000 | 1,673,534 |
Series B | ||
4.00%, due 11/1/51 | 1,750,000 | 1,707,651 |
Series B | ||
4.00%, due 11/1/56 | 1,000,000 | 951,467 |
California Infrastructure and Economic Development Bank, Wonderful Foundations Charter School Portfolio Project, Revenue Bonds | ||
Series A | ||
5.00%, due 1/1/55 (a) | 3,325,000 | 3,150,919 |
California Municipal Finance Authority, HumanGood California Obligated Group, Revenue Bonds | ||
3.00%, due 10/1/46 | 4,750,000 | 3,635,514 |
3.00%, due 10/1/49 | 3,920,000 | 2,890,377 |
14 | MainStay MacKay High Yield Municipal Bond Fund |
Principal Amount | Value | |
Long-Term Municipal Bonds (continued) | ||
California (continued) | ||
California Municipal Finance Authority, Orchard Park Student Housing Project, Revenue Bonds | ||
Insured: BAM | ||
3.00%, due 5/15/54 | $ 4,400,000 | $ 3,285,775 |
California Municipal Finance Authority, LINXS APM Project, Revenue Bonds, Senior Lien | ||
Series A, Insured: AGM | ||
3.25%, due 12/31/32 (b) | 5,965,000 | 5,494,327 |
California Municipal Finance Authority, United Airlines, Inc. Project, Revenue Bonds | ||
4.00%, due 7/15/29 (b) | 20,775,000 | 20,091,407 |
California Municipal Finance Authority, HumanGood California, Revenue Bonds | ||
4.00%, due 10/1/46 | 2,000,000 | 1,962,813 |
California Municipal Finance Authority, William Jessup University, Revenue Bonds | ||
5.00%, due 8/1/28 | 1,000,000 | 1,022,516 |
5.00%, due 8/1/48 | 2,675,000 | 2,583,789 |
California Municipal Finance Authority, LINX APM Project, Revenue Bonds, Senior Lien (b) | ||
Series A | ||
5.00%, due 12/31/43 | 35,000,000 | 36,609,009 |
Series B | ||
5.00%, due 6/1/48 | 3,000,000 | 3,114,786 |
California Municipal Finance Authority, Charter School, Palmdale Aerospace Academy Projects (The), Revenue Bonds | ||
Series A | ||
5.00%, due 7/1/46 (a) | 2,665,000 | 2,705,798 |
California Municipal Finance Authority, Northbay Healthcare Group, Revenue Bonds | ||
Series A | ||
5.00%, due 11/1/47 | 5,265,000 | 5,550,309 |
Principal Amount | Value | |
California (continued) | ||
California Municipal Finance Authority, CHF-Davis I LLC, West Village Student Housing Project, Revenue Bonds | ||
5.00%, due 5/15/48 | $ 19,500,000 | $ 20,405,658 |
5.00%, due 5/15/51 | 19,500,000 | 20,382,976 |
California Municipal Finance Authority, Healthright 360, Revenue Bonds | ||
Series A | ||
5.00%, due 11/1/49 (a) | 2,000,000 | 2,016,488 |
California Municipal Finance Authority, Partnerships to Uplift Community Project, Revenue Bonds | ||
Series A | ||
5.30%, due 8/1/47 | 1,525,000 | 1,527,164 |
California Municipal Finance Authority, Baptist University, Revenue Bonds (a) | ||
Series A | ||
5.375%, due 11/1/40 | 3,000,000 | 3,186,549 |
Series A | ||
5.50%, due 11/1/45 | 5,750,000 | 6,094,088 |
California Public Finance Authority, Enso Village Project, Revenue Bonds (a) | ||
Series B-2 | ||
2.375%, due 11/15/28 | 1,500,000 | 1,412,278 |
Series A | ||
5.00%, due 11/15/46 | 700,000 | 701,039 |
California Public Finance Authority, California University of Science & Medicine Obligated Group, Revenue Bonds | ||
Series A | ||
6.25%, due 7/1/54 (a) | 5,515,000 | 6,042,990 |
California Public Finance Authority, California University of Science & Medicine, Revenue Bonds | ||
7.50%, due 7/1/36 (a) | 9,500,000 | 9,813,435 |
Principal Amount | Value | |
Long-Term Municipal Bonds (continued) | ||
California (continued) | ||
California School Finance Authority, Sonoma County Junior College District Project, Revenue Bonds | ||
Series A | ||
2.75%, due 11/1/60 | $ 9,700,000 | $ 5,851,249 |
California School Finance Authority, Granada Hills Charter High School Obligated Group, Revenue Bonds | ||
Series A | ||
4.00%, due 7/1/48 (a) | 675,000 | 597,956 |
California School Finance Authority, Vista Charter Public Schools, Revenue Bonds | ||
Series A | ||
4.00%, due 6/1/61 (a) | 4,750,000 | 3,755,078 |
California School Finance Authority, High Tech High Learning Project, Revenue Bonds | ||
Series A | ||
5.00%, due 7/1/49 (a) | 3,000,000 | 3,017,413 |
California School Finance Authority, Aspire Public Schools Obligated Group, Revenue Bonds | ||
Series A | ||
5.00%, due 8/1/50 (a) | 1,800,000 | 1,844,876 |
California School Finance Authority, Teach Public Schools Obligated Group, Revenue Bonds | ||
Series A | ||
5.00%, due 6/1/58 (a) | 2,000,000 | 2,001,079 |
California Statewide Communities Development Authority, Community Infrastructure Program, Special Assessment | ||
Series 2021 A | ||
4.00%, due 9/2/41 | 2,000,000 | 1,859,653 |
Principal Amount | Value | |
California (continued) | ||
California Statewide Communities Development Authority, Methodist Hospital of Southern California, Revenue Bonds | ||
4.375%, due 1/1/48 | $ 2,185,000 | $ 2,228,510 |
5.00%, due 1/1/43 | 7,250,000 | 7,782,411 |
California Statewide Communities Development Authority, Lancer Educational Student Housing Project, Revenue Bonds (a) | ||
Series A | ||
5.00%, due 6/1/36 | 2,250,000 | 2,326,113 |
Series A | ||
5.00%, due 6/1/46 | 2,000,000 | 2,042,782 |
California Statewide Communities Development Authority, Loma Linda University Medical Center, Revenue Bonds | ||
Series A | ||
5.00%, due 12/1/41 (a) | 1,700,000 | 1,765,663 |
Series A | ||
5.00%, due 12/1/46 (a) | 4,245,000 | 4,380,339 |
Series A | ||
5.25%, due 12/1/56 (a) | 19,500,000 | 20,214,878 |
Series A | ||
5.50%, due 12/1/54 | 3,800,000 | 3,925,921 |
Series A | ||
5.50%, due 12/1/58 (a) | 23,675,000 | 25,075,476 |
California Statewide Communities Development Authority, Redlands Community Hospital, Revenue Bonds | ||
5.00%, due 10/1/46 | 1,560,000 | 1,669,730 |
California Statewide Communities Development Authority, Irvine Campus Apartments, Revenue Bonds | ||
5.00%, due 5/15/50 | 2,000,000 | 2,100,568 |
California Statewide Communities Development Authority, Lancer Plaza Project, Revenue Bonds | ||
5.625%, due 11/1/33 | 680,000 | 700,101 |
5.875%, due 11/1/43 | 435,000 | 447,992 |
16 | MainStay MacKay High Yield Municipal Bond Fund |
Principal Amount | Value | |
Long-Term Municipal Bonds (continued) | ||
California (continued) | ||
California Statewide Communities Development Authority, California Baptist University, Revenue Bonds | ||
Series A | ||
6.375%, due 11/1/43 | $ 3,235,000 | $ 3,376,001 |
California Statewide Financing Authority, Tobacco Settlement Asset-Backed, Revenue Bonds | ||
Series C | ||
(zero coupon), due 6/1/55 (a) | 125,700,000 | 7,733,026 |
Cathedral City Public Financing Authority, Capital Appreciation, Tax Allocation | ||
Series A, Insured: NATL-RE | ||
(zero coupon), due 8/1/23 | 925,000 | 894,375 |
Series A, Insured: NATL-RE | ||
(zero coupon), due 8/1/26 | 1,085,000 | 944,480 |
City of Los Angeles CA, Department of Airports, Revenue Bonds, Senior Lien (b) | ||
Series C | ||
4.00%, due 5/15/50 | 2,845,000 | 2,771,995 |
Series C | ||
5.00%, due 5/15/45 | 14,500,000 | 15,618,921 |
City of Los Angeles CA, Department of Airports, Revenue Bonds (b) | ||
Series A | ||
5.00%, due 5/15/45 | 4,110,000 | 4,484,922 |
Series A | ||
5.00%, due 5/15/46 | 8,600,000 | 9,299,814 |
City of South San Francisco CA, Community Facilities District No. 2021-01, Special Tax | ||
5.00%, due 9/1/52 | 1,500,000 | 1,584,155 |
CMFA Special Finance Agency, Latitude33, Revenue Bonds | ||
Series A-1 | ||
3.00%, due 12/1/56 (a) | 4,500,000 | 3,093,568 |
CMFA Special Finance Agency, Solana at Grand, Revenue Bonds, Senior Lien | ||
Series A-1 | ||
4.00%, due 8/1/56 (a) | 2,000,000 | 1,756,545 |
Principal Amount | Value | |
California (continued) | ||
CSCDA Community Improvement Authority, Pasadena Portfolio, Revenue Bonds, Senior Lien | ||
Series A-2 | ||
3.00%, due 12/1/56 (a) | $ 1,500,000 | $ 1,070,382 |
CSCDA Community Improvement Authority, Jefferson Platinum Triangle Apartments, Revenue Bonds | ||
Series A-2 | ||
3.125%, due 8/1/56 (a) | 11,350,000 | 8,260,704 |
CSCDA Community Improvement Authority, The Link-Glendale, Revenue Bonds | ||
Series A-2 | ||
4.00%, due 7/1/56 (a) | 7,200,000 | 5,894,700 |
CSCDA Community Improvement Authority, Oceanaire Long Beach, Revenue Bonds | ||
4.00%, due 9/1/56 (a) | 16,200,000 | 14,331,045 |
CSCDA Community Improvement Authority, Acacia on Santa Rosa Creek, Revenue Bonds, Senior Lien | ||
Series A | ||
4.00%, due 10/1/56 (a) | 4,750,000 | 4,189,096 |
CSCDA Community Improvement Authority, Renaissance at City Center, Revenue Bonds | ||
Series A | ||
5.00%, due 7/1/51 (a) | 10,700,000 | 10,411,123 |
Del Mar Race Track Authority, Revenue Bonds | ||
5.00%, due 10/1/35 | 1,665,000 | 1,568,581 |
Fontana Unified School District, Unlimited General Obligation | ||
Series C | ||
(zero coupon), due 8/1/39 | 17,650,000 | 6,788,787 |
Series C | ||
(zero coupon), due 8/1/43 | 15,750,000 | 4,773,367 |
Series C | ||
(zero coupon), due 8/1/44 | 8,000,000 | 2,290,944 |
Foothill-Eastern Transportation Corridor Agency, Revenue Bonds | ||
Series B-2 | ||
3.50%, due 1/15/53 | 13,415,000 | 10,981,209 |
Principal Amount | Value | |
Long-Term Municipal Bonds (continued) | ||
California (continued) | ||
Foothill-Eastern Transportation Corridor Agency, Revenue Bonds, Junior Lien | ||
Series C | ||
4.00%, due 1/15/43 | $ 20,698,000 | $ 20,112,998 |
Foothill-Eastern Transportation Corridor Agency, Revenue Bonds, Senior Lien | ||
Series A | ||
4.00%, due 1/15/46 | 44,120,000 | 42,154,247 |
Golden State Tobacco Securitization Corp., Asset-Backed, Revenue Bonds | ||
Series B-2 | ||
(zero coupon), due 6/1/66 | 1,272,720,000 | 137,606,869 |
Series A-2 | ||
5.30%, due 6/1/37 (c) | 14,270,000 | 14,313,920 |
Golden State Tobacco Securitization Corp., Revenue Bonds | ||
Series A-1 | ||
3.50%, due 6/1/36 | 4,895,000 | 4,903,142 |
Series A-1 | ||
5.00%, due 6/1/47 | 19,885,000 | 19,941,593 |
Series A-2 | ||
5.00%, due 6/1/47 | 32,660,000 | 32,758,147 |
Series A-1 | ||
5.25%, due 6/1/47 | 3,750,000 | 3,761,397 |
Hastings Campus Housing Finance Authority, Green Bond, Revenue Bonds, Senior Lien | ||
Series A | ||
5.00%, due 7/1/61 | 57,100,000 | 59,147,064 |
Independent Cities Finance Authority, Sales Tax, Revenue Bonds | ||
Insured: AGM | ||
4.00%, due 6/1/51 (a) | 1,250,000 | 1,253,477 |
Inland Empire Tobacco Securitization Corp., Revenue Bonds | ||
Series D | ||
(zero coupon), due 6/1/57 | 268,950,000 | 14,456,869 |
Principal Amount | Value | |
California (continued) | ||
Riverside County Transportation Commission, Revenue Bonds, Second Lien | ||
Series C | ||
4.00%, due 6/1/47 | $ 8,185,000 | $ 7,737,210 |
Riverside County Transportation Commission, Revenue Bonds, Senior Lien | ||
Series A | ||
5.75%, due 6/1/48 | 1,480,000 | 1,537,210 |
Rohnerville School District, Election 2010, Unlimited General Obligation | ||
Series B, Insured: AGM | ||
(zero coupon), due 8/1/42 | 1,000,000 | 426,752 |
Series B, Insured: AGM | ||
(zero coupon), due 8/1/47 | 1,000,000 | 332,816 |
San Diego County Regional Airport Authority, Revenue Bonds (b) | ||
Series B, Insured: AGM-CR | ||
4.00%, due 7/1/51 | 25,645,000 | 24,732,294 |
Series B | ||
4.00%, due 7/1/56 | 1,605,000 | 1,500,033 |
San Francisco City & County Redevelopment Agency, Community Facilities District No. 6 Bay Public, Special Tax | ||
Series C | ||
(zero coupon), due 8/1/37 | 5,015,000 | 2,108,332 |
Series C | ||
(zero coupon), due 8/1/38 | 2,000,000 | 786,532 |
San Joaquin Hills Transportation Corridor Agency, Revenue Bonds, Senior Lien | ||
Series A | ||
4.00%, due 1/15/50 | 23,208,000 | 21,957,358 |
San Joaquin Hills Transportation Corridor Agency, Revenue Bonds, Junior Lien | ||
Series B | ||
5.25%, due 1/15/44 | 16,100,000 | 16,821,984 |
Series B | ||
5.25%, due 1/15/49 | 4,220,000 | 4,397,691 |
18 | MainStay MacKay High Yield Municipal Bond Fund |
Principal Amount | Value | |
Long-Term Municipal Bonds (continued) | ||
California (continued) | ||
Santa Ana Unified School District, Capital Appreciation, Election 2008, Unlimited General Obligation | ||
Series B, Insured: AGC | ||
(zero coupon), due 8/1/47 | $ 24,500,000 | $ 7,717,419 |
Sierra Kings Health Care District, Unlimited General Obligation | ||
5.00%, due 8/1/37 | 2,465,000 | 2,595,076 |
Stockton Unified School District, Capital Appreciation, Election 2008, Unlimited General Obligation | ||
Series D, Insured: AGM | ||
(zero coupon), due 8/1/42 | 8,780,000 | 3,768,465 |
Sutter Union High School District, Election 2008, Unlimited General Obligation | ||
Series B | ||
(zero coupon), due 6/1/50 | 16,260,000 | 2,455,151 |
Tobacco Securitization Authority of Southern California, San Diego County Tobacco Asset Securitization Corp., Asset-Backed, Revenue Bonds | ||
Series B-2 | ||
(zero coupon), due 6/1/54 | 18,700,000 | 3,255,720 |
West Contra Costa Healthcare District, Special Tax | ||
3.00%, due 7/1/42 | 5,670,000 | 4,783,580 |
Westminster School District, Election 2008, Unlimited General Obligation | ||
Series B, Insured: BAM | ||
(zero coupon), due 8/1/53 | 20,000,000 | 2,365,890 |
916,252,504 | ||
Colorado 2.6% | ||
3rd and Havana Metropolitan District, Tax Supported, Limited General Obligation | ||
Series A | ||
5.25%, due 12/1/49 | 2,250,000 | 2,168,277 |
Allison Valley Metropolitan District No. 2, Limited General Obligation | ||
4.70%, due 12/1/47 | 2,500,000 | 2,164,418 |
Principal Amount | Value | |
Colorado (continued) | ||
Arista Metropolitan District, Limited General Obligation | ||
Series A | ||
5.125%, due 12/1/48 | $ 3,500,000 | $ 3,520,652 |
Arkansas River Power Authority, Revenue Bonds | ||
Series A | ||
5.00%, due 10/1/43 | 14,275,000 | 15,186,413 |
Broadway Park North Metropolitan District No. 2, Limited General Obligation (a) | ||
5.00%, due 12/1/40 | 1,000,000 | 1,003,852 |
5.00%, due 12/1/49 | 1,000,000 | 986,698 |
Broadway Station Metropolitan District No. 2, Limited General Obligation | ||
Series A | ||
5.125%, due 12/1/48 | 3,000,000 | 3,007,179 |
Central Platte Valley Metropolitan District, Unlimited General Obligation | ||
Series A | ||
5.375%, due 12/1/33 | 1,500,000 | 1,539,319 |
Citadel on Colfax Business Improvement District, Revenue Bonds | ||
Series A | ||
5.35%, due 12/1/50 | 1,000,000 | 925,719 |
City & County of Denver CO, United Airlines, Inc., Project, Revenue Bonds | ||
5.00%, due 10/1/32 (b) | 6,800,000 | 6,949,875 |
City of Fruita CO, Canyons Hospital & Medical Center Project, Revenue Bonds | ||
Series A | ||
5.50%, due 1/1/48 (a) | 9,750,000 | 9,835,443 |
Colorado Educational & Cultural Facilities Authority, Northeast Campus Project, Revenue Bonds | ||
Insured: Moral Obligation State Intercept | ||
3.00%, due 8/1/51 | 3,420,000 | 2,706,636 |
Principal Amount | Value | |
Long-Term Municipal Bonds (continued) | ||
Colorado (continued) | ||
Colorado Educational & Cultural Facilities Authority, New Summit Academy, Revenue Bonds | ||
Series A | ||
4.00%, due 7/1/41 (a) | $ 1,850,000 | $ 1,591,442 |
Colorado Educational & Cultural Facilities Authority, New Vision Charter School, Revenue Bonds | ||
Series A, Insured: Moral Obligation | ||
4.00%, due 6/1/42 | 2,635,000 | 2,641,027 |
Series A, Insured: Moral Obligation | ||
4.00%, due 6/1/52 | 4,750,000 | 4,643,980 |
Series A, Insured: Moral Obligation | ||
4.00%, due 6/1/56 | 6,305,000 | 6,044,199 |
Colorado Health Facilities Authority, AdventHealth Obligated Group, Revenue Bonds | ||
Series A | ||
3.00%, due 11/15/51 | 18,850,000 | 14,803,322 |
Series A | ||
4.00%, due 11/15/50 | 8,000,000 | 7,727,871 |
Colorado Health Facilities Authority, CommonSpirit Health Obligated Group, Revenue Bonds | ||
Series A-2 | ||
3.25%, due 8/1/49 | 11,750,000 | 9,413,350 |
Series A-1 | ||
4.00%, due 8/1/44 | 20,695,000 | 19,773,369 |
Series A-2 | ||
4.00%, due 8/1/49 | 5,655,000 | 5,360,170 |
Series A-2 | ||
5.00%, due 8/1/44 | 11,700,000 | 12,617,314 |
Colorado Health Facilities Authority, Covenant Living Communities and Services Obligated Group, Revenue Bonds | ||
Series A | ||
5.00%, due 12/1/35 | 3,500,000 | 3,682,580 |
Principal Amount | Value | |
Colorado (continued) | ||
Colorado Health Facilities Authority, Covenant Living Communities and Services Obligated Group, Revenue Bonds (continued) | ||
Series A | ||
5.00%, due 12/1/48 | $ 7,250,000 | $ 7,627,864 |
Colorado Health Facilities Authority, Frasier Meadows Retirement Community Project, Revenue Bonds | ||
Series A | ||
5.25%, due 5/15/47 | 2,000,000 | 2,099,905 |
Colorado Health Facilities Authority, Mental Health Center of Denver Project, Revenue Bonds | ||
Series A | ||
5.75%, due 2/1/44 | 4,175,000 | 4,293,086 |
Copper Ridge Metropolitan District, Revenue Bonds | ||
5.00%, due 12/1/39 | 4,250,000 | 4,032,595 |
Denver Health & Hospital Authority, 550 Acoma, Inc., Certificate of Participation | ||
5.00%, due 12/1/48 | 1,755,000 | 1,880,962 |
Denver Health & Hospital Authority, Revenue Bonds | ||
Series A | ||
5.25%, due 12/1/45 | 4,250,000 | 4,380,062 |
Dominion Water & Sanitation District, Revenue Bonds | ||
5.75%, due 12/1/36 | 9,435,000 | 9,638,777 |
6.00%, due 12/1/46 | 967,000 | 987,844 |
E-470 Public Highway Authority, Revenue Bonds | ||
Series B, Insured: NATL-RE | ||
(zero coupon), due 9/1/22 | 4,750,000 | 4,726,352 |
Series B, Insured: NATL-RE | ||
(zero coupon), due 9/1/25 | 245,000 | 223,472 |
Series B, Insured: NATL-RE | ||
(zero coupon), due 9/1/26 | 4,540,000 | 4,011,676 |
Series B, Insured: NATL-RE | ||
(zero coupon), due 9/1/29 | 4,510,000 | 3,579,586 |
Series B, Insured: NATL-RE | ||
(zero coupon), due 9/1/30 | 500,000 | 381,885 |
Series B, Insured: NATL-RE | ||
(zero coupon), due 9/1/35 | 2,245,000 | 1,244,371 |
20 | MainStay MacKay High Yield Municipal Bond Fund |
Principal Amount | Value | |
Long-Term Municipal Bonds (continued) | ||
Colorado (continued) | ||
E-470 Public Highway Authority, Revenue Bonds (continued) | ||
Series B, Insured: NATL-RE | ||
(zero coupon), due 9/1/37 | $ 1,170,000 | $ 585,457 |
Series B, Insured: NATL-RE | ||
(zero coupon), due 9/1/39 | 515,000 | 232,257 |
Series A | ||
(zero coupon), due 9/1/40 | 5,250,000 | 2,571,180 |
Series A | ||
(zero coupon), due 9/1/41 | 3,925,000 | 1,831,114 |
Eagle County Airport Terminal Corp., Revenue Bonds | ||
Series B | ||
5.00%, due 5/1/33 (b) | 2,435,000 | 2,608,444 |
Evan's Place Metropolitan District, Limited General Obligation | ||
Series A(3) | ||
5.00%, due 12/1/50 | 1,500,000 | 1,424,140 |
Great Western Metropolitan District, Limited General Obligation | ||
4.75%, due 12/1/50 | 1,500,000 | 1,406,811 |
Green Valley Ranch East Metropolitan District No. 6, Limited General Obligation | ||
Series A | ||
5.875%, due 12/1/50 | 1,325,000 | 1,327,668 |
Jefferson Center Metropolitan District No. 1, Revenue Bonds | ||
Series B | ||
5.75%, due 12/15/50 | 4,615,000 | 4,622,282 |
Johnstown Plaza Metropolitan District, Limited General Obligation | ||
4.25%, due 12/1/46 | 7,500,000 | 6,484,819 |
Jones District Community Authority Board, Revenue Bonds | ||
(zero coupon), due 12/1/50 (c) | 5,050,000 | 4,213,442 |
Karl's Farm Metropolitan District No. 2, Limited General Obligation | ||
Series A | ||
5.625%, due 12/1/50 (a) | 1,485,000 | 1,456,035 |
Principal Amount | Value | |
Colorado (continued) | ||
Mayfield Metropolitan District, Limited General Obligation | ||
Series A | ||
5.75%, due 12/1/50 | $ 1,190,000 | $ 1,200,578 |
Mirabelle Metropolitan District No. 2, Limited General Obligation, Senior Lien | ||
Series A | ||
5.00%, due 12/1/49 | 1,250,000 | 1,173,581 |
Nine Mile Metropolitan District, Revenue Bonds | ||
5.125%, due 12/1/40 | 1,505,000 | 1,517,907 |
North Range Metropolitan District No. 3, Limited General Obligation | ||
Series 2020A-3 | ||
5.25%, due 12/1/50 | 2,000,000 | 1,956,470 |
Park Creek Metropolitan District, Revenue Bonds, Senior Lien | ||
Series A, Insured: AGM | ||
4.00%, due 12/1/39 | 3,805,000 | 3,966,613 |
Series A, Insured: AGM | ||
4.00%, due 12/1/46 | 20,950,000 | 21,569,230 |
Park Creek Metropolitan District, Senior Ltd., Property, Revenue Bonds, Senior Lien | ||
Series A | ||
5.00%, due 12/1/45 | 4,000,000 | 4,199,549 |
Raindance Metropolitan District No. 1 Non-Potable Water System, Revenue Bonds | ||
5.25%, due 12/1/50 | 1,500,000 | 1,413,317 |
Raindance Metropolitan District No. 2, Limited General Obligation | ||
Series A | ||
5.00%, due 12/1/49 | 2,500,000 | 2,395,316 |
Southglenn Metropolitan District, Special Revenue, Limited General Obligation | ||
5.00%, due 12/1/46 | 2,100,000 | 2,064,901 |
Sterling Ranch Community Authority Board, Colorado Limited Tax Supported and Special Revenue Senior Bonds, Revenue Bonds | ||
Series A | ||
4.25%, due 12/1/50 | 1,250,000 | 1,079,080 |
Principal Amount | Value | |
Long-Term Municipal Bonds (continued) | ||
Colorado (continued) | ||
Sterling Ranch Community Authority Board, Colorado Limited Tax Supported and Special Revenue Senior Bonds, Revenue Bonds (continued) | ||
Series A | ||
5.00%, due 12/1/47 | $ 3,500,000 | $ 3,553,936 |
Village Metropolitan District (The), Special Revenue and Limited Property Tax, Limited General Obligation | ||
5.00%, due 12/1/40 | 750,000 | 774,137 |
Village Metropolitan District (The), Limited General Obligation | ||
5.00%, due 12/1/49 | 1,000,000 | 1,023,585 |
Villages at Castle Rock Metropolitan District No. 6, Limited General Obligation | ||
Series A | ||
4.125%, due 12/1/51 (a) | 18,149,000 | 13,809,919 |
277,863,310 | ||
Connecticut 0.5% | ||
City of Hartford CT, Unlimited General Obligation | ||
Series B, Insured: State Guaranteed | ||
5.00%, due 4/1/26 | 60,000 | 61,540 |
Series B, Insured: State Guaranteed | ||
5.00%, due 4/1/27 | 500,000 | 512,511 |
Series B, Insured: State Guaranteed | ||
5.00%, due 4/1/30 | 640,000 | 655,136 |
Series B, Insured: State Guaranteed | ||
5.00%, due 4/1/33 | 100,000 | 102,328 |
City of New Haven CT, Unlimited General Obligation | ||
Series A | ||
4.00%, due 8/1/41 | 2,925,000 | 2,954,787 |
City of West Haven CT, Unlimited General Obligation | ||
4.00%, due 9/15/41 | 1,130,000 | 1,152,207 |
Principal Amount | Value | |
Connecticut (continued) | ||
Connecticut State Health & Educational Facilities Authority, McLean Issue, Revenue Bonds (a) | ||
Series B-1 | ||
3.25%, due 1/1/27 | $ 750,000 | $ 739,438 |
Series A | ||
5.00%, due 1/1/30 | 500,000 | 526,579 |
Connecticut State Health & Educational Facilities Authority, University of Hartford (The), Revenue Bonds | ||
Series N | ||
4.00%, due 7/1/39 | 5,600,000 | 5,318,828 |
Series N | ||
4.00%, due 7/1/49 | 7,500,000 | 6,722,894 |
Series N | ||
5.00%, due 7/1/31 | 575,000 | 610,078 |
Series N | ||
5.00%, due 7/1/32 | 575,000 | 608,651 |
Series N | ||
5.00%, due 7/1/33 | 475,000 | 501,897 |
Series N | ||
5.00%, due 7/1/34 | 700,000 | 738,259 |
Connecticut State Health & Educational Facilities Authority, Jerome Home, Revenue Bonds | ||
Series E | ||
4.00%, due 7/1/51 | 1,250,000 | 1,126,469 |
Connecticut State Health & Educational Facilities Authority, Mary Wade Home Obligated Group, Revenue Bonds (a) | ||
Series A-1 | ||
4.50%, due 10/1/34 | 2,350,000 | 2,379,955 |
Series A-1 | ||
5.00%, due 10/1/39 | 1,000,000 | 1,032,035 |
Connecticut State Health & Educational Facilities Authority, University of New Haven, Inc., Revenue Bonds | ||
Series K-3 | ||
5.00%, due 7/1/48 | 3,695,000 | 3,821,807 |
22 | MainStay MacKay High Yield Municipal Bond Fund |
Principal Amount | Value | |
Long-Term Municipal Bonds (continued) | ||
Connecticut (continued) | ||
Connecticut State Health & Educational Facilities Authority, Griffin Health Obligated Group, Revenue Bonds | ||
Series G-1 | ||
5.00%, due 7/1/50 (a) | $ 1,750,000 | $ 1,870,785 |
Connecticut State Health & Educational Facilities Authority, Church Home of Hartford Obligated Group, Revenue Bonds | ||
Series A | ||
5.00%, due 9/1/53 (a) | 2,235,000 | 2,252,133 |
Connecticut State Higher Education Supplement Loan Authority, Revenue Bonds | ||
Series B | ||
3.25%, due 11/15/35 (b) | 7,190,000 | 6,309,715 |
Hartford Stadium Authority, Stadium Authority Lease, Revenue Bonds | ||
Series A | ||
5.00%, due 2/1/36 | 1,475,000 | 1,490,145 |
State of Connecticut, Unlimited General Obligation | ||
Series C | ||
5.00%, due 6/15/28 | 4,750,000 | 5,329,715 |
Series E | ||
5.00%, due 9/15/37 | 2,250,000 | 2,485,508 |
Steel Point Infrastructure Improvement District, Steelpointe Harbor Project, Tax Allocation (a) | ||
4.00%, due 4/1/31 | 300,000 | 287,375 |
4.00%, due 4/1/36 | 485,000 | 451,070 |
4.00%, due 4/1/41 | 575,000 | 515,581 |
4.00%, due 4/1/51 | 1,250,000 | 1,061,606 |
51,619,032 | ||
Principal Amount | Value | |
Delaware 0.4% | ||
County of Kent DE, Student Housing & Dining Facility, CHF-Dover LLC, Delaware State University Project, Revenue Bonds | ||
Series A | ||
5.00%, due 7/1/40 | $ 1,050,000 | $ 1,062,310 |
Series A | ||
5.00%, due 7/1/48 | 2,735,000 | 2,738,822 |
Series A | ||
5.00%, due 7/1/53 | 4,090,000 | 4,076,904 |
Series A | ||
5.00%, due 7/1/58 | 6,700,000 | 6,622,167 |
Delaware State Economic Development Authority, Newark Charter School, Inc. Project, Revenue Bonds | ||
4.00%, due 9/1/41 | 1,600,000 | 1,486,804 |
Delaware State Health Facilities Authority, Beebe Medical Center, Revenue Bonds | ||
4.25%, due 6/1/38 | 2,235,000 | 2,267,544 |
4.375%, due 6/1/48 | 9,400,000 | 9,440,936 |
5.00%, due 6/1/37 | 1,000,000 | 1,094,137 |
5.00%, due 6/1/43 | 4,750,000 | 5,143,372 |
Delaware State Health Facilities Authority, Nanticoke Memorial Hospital Project, Revenue Bonds | ||
5.00%, due 7/1/32 | 3,555,000 | 3,670,555 |
Delaware State Health Facilities Authority, Christiana Health Care System Obligated Group, Revenue Bonds | ||
Series A | ||
5.00%, due 10/1/40 | 6,750,000 | 7,582,202 |
45,185,753 | ||
District of Columbia 1.5% | ||
District of Columbia, Tobacco Settlement Financing Corp., Asset Backed, Revenue Bonds | ||
Series A | ||
(zero coupon), due 6/15/46 | 83,000,000 | 17,418,090 |
District of Columbia, KIPP DC Project, Revenue Bonds | ||
4.00%, due 7/1/49 | 1,375,000 | 1,222,841 |
Principal Amount | Value | |
Long-Term Municipal Bonds (continued) | ||
District of Columbia (continued) | ||
District of Columbia, Provident Group-Howard Properties LLC, Revenue Bonds | ||
5.00%, due 10/1/30 | $ 1,500,000 | $ 1,510,808 |
5.00%, due 10/1/45 | 5,105,000 | 5,142,411 |
District of Columbia, Friendship Public Charter School, Revenue Bonds | ||
Series A | ||
5.00%, due 6/1/46 | 1,400,000 | 1,425,695 |
District of Columbia, District of Columbia International School Obligated Group, Revenue Bonds | ||
5.00%, due 7/1/49 | 1,670,000 | 1,694,243 |
5.00%, due 7/1/54 | 1,905,000 | 1,927,722 |
District of Columbia, Revenue Bonds | ||
5.00%, due 6/1/50 | 4,750,000 | 4,836,451 |
District of Columbia, Methodist Home, Revenue Bonds | ||
Series A | ||
5.25%, due 1/1/39 | 1,015,000 | 986,390 |
Metropolitan Washington Airports Authority Dulles Toll Road, Revenue Bonds, Senior Lien | ||
Series B | ||
(zero coupon), due 10/1/39 | 5,005,000 | 2,341,828 |
Metropolitan Washington Airports Authority Dulles Toll Road, Revenue Bonds, Sub. Lien | ||
Series B | ||
4.00%, due 10/1/44 | 23,180,000 | 23,322,865 |
Series B | ||
4.00%, due 10/1/49 | 10,185,000 | 10,155,512 |
Series B, Insured: AGM | ||
4.00%, due 10/1/53 | 17,100,000 | 16,858,124 |
Series B | ||
4.00%, due 10/1/53 | 66,680,000 | 65,853,275 |
154,696,255 | ||
Florida 2.9% | ||
Capital Trust Agency, Wonderful Foundations Charter School, Revenue Bonds | ||
Series B | ||
(zero coupon), due 1/1/60 | 16,000,000 | 1,203,261 |
Principal Amount | Value | |
Florida (continued) | ||
Capital Trust Agency, Wonderful Foundations Charter School, Revenue Bonds (continued) | ||
Series A | ||
5.00%, due 1/1/55 (a) | $ 10,480,000 | $ 9,703,347 |
Capital Trust Agency, Odyssey Charter School, Inc., Revenue Bonds | ||
Series A | ||
5.50%, due 7/1/47 (a) | 2,000,000 | 2,092,007 |
Celebration Community Development District, Assessment Area 1 Project, Special Assessment | ||
3.125%, due 5/1/41 | 590,000 | 467,093 |
4.00%, due 5/1/51 | 845,000 | 748,696 |
CFM Community Development District, Capital Improvement, Special Assessment | ||
3.35%, due 5/1/41 | 200,000 | 167,214 |
4.00%, due 5/1/51 | 290,000 | 255,120 |
Charlotte County Industrial Development Authority, Town & Country Utility Project, Revenue Bonds | ||
Series A | ||
4.00%, due 10/1/51 (a)(b) | 3,500,000 | 2,934,586 |
City of Atlantic Beach FL, Fleet Landing Project, Revenue Bonds | ||
Series A | ||
5.00%, due 11/15/48 | 3,000,000 | 3,151,581 |
Series B | ||
5.625%, due 11/15/43 | 1,500,000 | 1,536,328 |
City of Fort Myers FL, Utility System, Revenue Bonds | ||
Series A | ||
4.00%, due 10/1/49 | 10,250,000 | 10,308,898 |
City of Orlando FL, Tourist Development Tax, Revenue Bonds, Third Lien | ||
Series C, Insured: AGC | ||
5.50%, due 11/1/38 | 325,000 | 325,788 |
City of Pompano Beach FL, John Knox Village Projet, Revenue Bonds | ||
Series A | ||
4.00%, due 9/1/56 | 5,815,000 | 5,035,739 |
24 | MainStay MacKay High Yield Municipal Bond Fund |
Principal Amount | Value | |
Long-Term Municipal Bonds (continued) | ||
Florida (continued) | ||
City of Tallahassee FL, Memorial HealthCare, Inc., Revenue Bonds | ||
Series A | ||
5.00%, due 12/1/55 | $ 7,250,000 | $ 7,657,482 |
Collier County Educational Facilities Authority, Ave Maria University, Inc. Project, Revenue Bonds | ||
Series A | ||
5.25%, due 6/1/28 | 2,250,000 | 2,299,385 |
Series A | ||
6.125%, due 6/1/43 | 2,500,000 | 2,570,611 |
Collier County Health Facilities Authority, Moorings, Inc. Obligated Group (The), Revenue Bonds | ||
4.00%, due 5/1/52 | 8,000,000 | 7,795,009 |
Cordova Palms Community Development District, Special Assessment | ||
3.00%, due 5/1/41 (a) | 1,215,000 | 969,208 |
County of Osceola FL, Transportation, Revenue Bonds | ||
Series A-1 | ||
4.00%, due 10/1/54 | 4,345,000 | 4,151,225 |
Series A-1 | ||
5.00%, due 10/1/44 | 4,480,000 | 4,773,249 |
Series A-1 | ||
5.00%, due 10/1/49 | 6,650,000 | 7,041,757 |
Elevation Pointe Community Development District, Special Assessment | ||
Series A-1 | ||
4.60%, due 5/1/52 | 1,090,000 | 1,027,461 |
Epperson North Community Development District, Assessment Area 3, Special Assessment | ||
Series A | ||
3.40%, due 11/1/41 | 2,250,000 | 1,846,036 |
Epperson North Community Development District, Assessment Area 2, Special Assessment | ||
3.50%, due 5/1/41 | 905,000 | 757,418 |
Principal Amount | Value | |
Florida (continued) | ||
Escambia County Health Facilities Authority, Baptist Health Care Corp., Revenue Bonds | ||
Series A | ||
4.00%, due 8/15/45 | $ 1,240,000 | $ 1,162,479 |
Series A | ||
4.00%, due 8/15/50 | 9,250,000 | 8,519,547 |
Series A, Insured: AGM-CR | ||
4.00%, due 8/15/50 | 4,510,000 | 4,335,459 |
Florida Development Finance Corp., Mayflower Retirement Community Centre, Inc., Revenue Bonds | ||
Series B-1 | ||
2.375%, due 6/1/27 (a) | 835,000 | 773,190 |
Florida Development Finance Corp., River City Science Academy Project, Revenue Bonds | ||
Series A | ||
4.00%, due 7/1/45 | 600,000 | 531,548 |
Series A | ||
4.00%, due 7/1/55 | 600,000 | 499,071 |
Florida Development Finance Corp., UF Health Jacksonville Project, Revenue Bonds | ||
Series A, Insured: AGM-CR | ||
4.00%, due 2/1/52 | 9,750,000 | 9,182,940 |
Series A | ||
5.00%, due 2/1/39 | 2,750,000 | 2,960,725 |
Series A | ||
5.00%, due 2/1/52 | 6,400,000 | 6,774,003 |
Florida Development Finance Corp., Florida Charter Foundation, Inc. Project, Revenue Bonds | ||
Series A | ||
4.75%, due 7/15/36 (a) | 4,305,000 | 4,314,459 |
Florida Development Finance Corp., Mater Academy Project, Revenue Bonds | ||
Series A | ||
5.00%, due 6/15/50 | 10,000,000 | 10,200,230 |
Series A | ||
5.00%, due 6/15/55 | 1,100,000 | 1,117,290 |
Series A | ||
5.00%, due 6/15/56 | 3,000,000 | 3,045,791 |
Principal Amount | Value | |
Long-Term Municipal Bonds (continued) | ||
Florida (continued) | ||
Florida Higher Educational Facilities Financial Authority, Ringling College Project, Revenue Bonds | ||
4.00%, due 3/1/47 | $ 6,420,000 | $ 6,349,182 |
Florida Higher Educational Facilities Financial Authority, Saint Leo University Project, Revenue Bonds | ||
5.00%, due 3/1/44 | 1,370,000 | 1,380,939 |
5.00%, due 3/1/49 | 1,630,000 | 1,634,561 |
Hillsborough County Industrial Development Authority, Tampa General Hospital Project, Revenue Bonds | ||
Series A | ||
4.00%, due 8/1/50 | 97,600,000 | 93,514,923 |
Lakewood Ranch Stewardship District, Star Farms at Lakewood Ranch Project Phase 1 and 2, Special Assessment | ||
3.00%, due 5/1/41 | 430,000 | 347,265 |
4.00%, due 5/1/52 | 675,000 | 593,387 |
Lee County Industrial Development Authority, Preserve Project, Revenue Bonds | ||
Series A | ||
5.75%, due 12/1/52 (a) | 7,125,000 | 5,976,350 |
Martin County Health Facilities Authority, Martin Memorial Medical Center, Revenue Bonds | ||
Series FL | ||
5.00%, due 11/15/45 | 3,250,000 | 3,443,904 |
Miami Beach Health Facilities Authority, Mount Sinai Medical Center of Florida, Revenue Bonds | ||
Series B | ||
4.00%, due 11/15/46 | 7,000,000 | 6,621,199 |
Series B | ||
4.00%, due 11/15/51 | 3,190,000 | 2,968,748 |
5.00%, due 11/15/29 | 1,825,000 | 1,857,992 |
5.00%, due 11/15/39 | 2,230,000 | 2,320,276 |
Principal Amount | Value | |
Florida (continued) | ||
Mid-Bay Bridge Authority, Revenue Bonds | ||
Series A | ||
5.00%, due 10/1/35 | $ 1,500,000 | $ 1,571,558 |
Series C | ||
5.00%, due 10/1/40 | 1,000,000 | 1,036,945 |
Mirada II Community Development District, Capital Improvement, Special Assessment | ||
3.125%, due 5/1/31 | 500,000 | 450,812 |
3.50%, due 5/1/41 | 1,000,000 | 850,326 |
New Port Tampa Bay Community Development District, Special Assessment | ||
3.50%, due 5/1/31 | 310,000 | 281,902 |
3.875%, due 5/1/41 | 1,000,000 | 871,412 |
4.125%, due 5/1/52 | 365,000 | 319,674 |
North Powerline Road Community Development District, Special Assessment | ||
3.625%, due 5/1/40 | 500,000 | 440,493 |
4.00%, due 5/1/51 | 1,080,000 | 956,602 |
North Sumter County Utility Dependent District, Central Sumter Utility, Revenue Bonds, Senior Lien | ||
5.00%, due 10/1/49 | 2,750,000 | 3,013,886 |
5.00%, due 10/1/54 | 6,750,000 | 7,387,222 |
Osceola County Expressway Authority, Poinciana Parkway Project, Revenue Bonds, Senior Lien | ||
Series B-2 | ||
(zero coupon), due 10/1/36 (c) | 3,750,000 | 4,083,459 |
Palm Beach County Health Facilities Authority, Toby & Leon Cooperman Sinai residencies of Boca Raton, Revenue Bonds | ||
4.00%, due 6/1/36 | 4,000,000 | 3,784,980 |
Pinellas County Educational Facilities Authority, Pinellas Academy Math & Science Project, Revenue Bonds | ||
Series A | ||
5.00%, due 12/15/48 (a) | 3,280,000 | 3,328,200 |
26 | MainStay MacKay High Yield Municipal Bond Fund |
Principal Amount | Value | |
Long-Term Municipal Bonds (continued) | ||
Florida (continued) | ||
Polk County Industrial Development Authority, Carpenter's Home Estates, Inc. Project, Revenue Bonds | ||
Series A | ||
5.00%, due 1/1/49 | $ 1,750,000 | $ 1,800,420 |
Series A | ||
5.00%, due 1/1/55 | 800,000 | 818,542 |
Preston Cove Community Development District, Special Assessment | ||
4.00%, due 5/1/42 | 1,825,000 | 1,643,001 |
Sawyers Landing Community Development District, Special Assessment | ||
3.75%, due 5/1/31 | 1,550,000 | 1,464,784 |
4.125%, due 5/1/41 | 3,055,000 | 2,843,168 |
Shingle Creek at Bronson Community Development District, Special Assessment | ||
3.50%, due 6/15/41 | 1,000,000 | 851,599 |
Stillwater Community Development District, 2021 Project, Special Assessment (a) | ||
3.00%, due 6/15/31 | 410,000 | 369,849 |
3.50%, due 6/15/41 | 1,000,000 | 865,685 |
Tradition Community Development District No. 9, Special Assessment | ||
3.00%, due 5/1/41 | 1,800,000 | 1,462,671 |
Two Rivers North Community Development District, Special Assessment | ||
5.25%, due 5/1/52 (a)(d) | 1,500,000 | 1,497,707 |
V-Dana Community Development District, Special Assessment | ||
3.625%, due 5/1/41 | 1,040,000 | 897,961 |
V-Dana Community Development District, Assessment Area 1-2020 Project, Special Assessment | ||
4.00%, due 5/1/51 (a) | 1,200,000 | 1,065,147 |
Veranda Community Development District II, Special Assessment | ||
3.60%, due 5/1/41 (a) | 330,000 | 285,098 |
Principal Amount | Value | |
Florida (continued) | ||
Windward at Lakewood Ranch Community Development District, Phase 2 Project, Special Assessment | ||
4.00%, due 5/1/42 | $ 1,130,000 | $ 1,026,810 |
4.25%, due 5/1/52 | 1,360,000 | 1,229,728 |
305,743,598 | ||
Georgia 1.6% | ||
Atlanta Urban Redevelopment Agency, BeltLine Special Service District, Revenue Bonds | ||
3.625%, due 7/1/42 (a) | 5,605,000 | 4,818,653 |
Cedartown Polk County Hospital Authority, Polk Medical Center Project, Revenue Bonds | ||
5.00%, due 7/1/39 | 7,850,000 | 8,591,433 |
Development Authority of Cobb County (The), Kennesaw State University Real Estate Foundations Project, Revenue Bonds, Junior Lien | ||
Series C | ||
5.00%, due 7/15/38 | 2,390,000 | 2,462,430 |
Fulton County Residential Care Facilities for the Elderly Authority, Lenbrook Square Foundation, Inc., Revenue Bonds | ||
Series A | ||
5.00%, due 7/1/36 | 3,750,000 | 3,874,805 |
Gainesville & Hall County Development Authority, Riverside Military Academy, Inc., Revenue Bonds | ||
5.125%, due 3/1/52 | 1,500,000 | 1,131,705 |
George L Smith II Congress Center Authority, Convention Centre Hotel, Revenue Bonds, Second Tier (a) | ||
3.625%, due 1/1/31 | 1,750,000 | 1,609,202 |
5.00%, due 1/1/36 | 1,710,000 | 1,718,606 |
5.00%, due 1/1/54 | 4,000,000 | 3,828,258 |
Principal Amount | Value | |
Long-Term Municipal Bonds (continued) | ||
Georgia (continued) | ||
George L Smith II Congress Center Authority, Convention Centre Hotel, Revenue Bonds, First Tier | ||
4.00%, due 1/1/54 | $ 4,750,000 | $ 4,291,563 |
Main Street Natural Gas, Inc., Revenue Bonds | ||
Series A | ||
4.00%, due 5/15/39 | 6,550,000 | 6,525,783 |
Series A | ||
5.00%, due 5/15/38 | 3,500,000 | 3,860,666 |
Series A | ||
5.00%, due 5/15/49 | 18,250,000 | 20,158,256 |
Municipal Electric Authority of Georgia, Project One Subordinated Bonds, Revenue Bonds | ||
Series A | ||
4.00%, due 1/1/49 | 14,300,000 | 13,628,365 |
Municipal Electric Authority of Georgia, Plant Vogtle Units 3 & 4 Project, Revenue Bonds | ||
Series B | ||
4.00%, due 1/1/49 | 54,975,000 | 50,750,215 |
Series A | ||
5.00%, due 1/1/56 | 17,400,000 | 18,565,913 |
Series A, Insured: AGM | ||
5.00%, due 1/1/62 | 10,350,000 | 11,182,511 |
Series A | ||
5.00%, due 1/1/63 | 3,000,000 | 3,192,535 |
Series A | ||
5.00%, due 1/1/63 | 7,315,000 | 7,733,784 |
Private Colleges & Universities Authority, Mercer University Project, Revenue Bonds | ||
5.00%, due 10/1/45 | 5,750,000 | 6,022,462 |
173,947,145 | ||
Guam 0.8% | ||
Antonio B Won Pat International Airport Authority, Revenue Bonds (b) | ||
Series C | ||
6.375%, due 10/1/43 | 1,550,000 | 1,635,703 |
Series C | ||
6.375%, due 10/1/43 | 1,450,000 | 1,510,614 |
Principal Amount | Value | |
Guam (continued) | ||
Guam Department of Education, John F. Kennedy High School Refunding & Energy Efficiency Project, Certificate of Participation | ||
Series A | ||
4.25%, due 2/1/30 | $ 1,190,000 | $ 1,182,063 |
Series A | ||
5.00%, due 2/1/40 | 4,875,000 | 4,989,921 |
Guam Government Waterworks Authority, Water and Wastewater System, Revenue Bonds | ||
5.00%, due 7/1/40 | 8,770,000 | 9,393,040 |
5.00%, due 1/1/46 | 3,950,000 | 4,177,193 |
5.50%, due 7/1/43 | 13,315,000 | 13,808,092 |
Port Authority of Guam, Revenue Bonds | ||
Series A | ||
5.00%, due 7/1/48 | 4,950,000 | 5,262,757 |
Territory of Guam, Revenue Bonds | ||
Series F | ||
4.00%, due 1/1/36 | 5,920,000 | 5,552,669 |
Series F | ||
4.00%, due 1/1/42 | 4,310,000 | 3,945,125 |
Series D | ||
5.00%, due 11/15/29 | 1,455,000 | 1,539,841 |
Series D | ||
5.00%, due 11/15/39 | 25,650,000 | 26,926,619 |
79,923,637 | ||
Hawaii 0.7% | ||
Kauai County Community Facilities District, Kukui'ula Development Project, Special Tax | ||
4.375%, due 5/15/42 | 2,300,000 | 2,169,400 |
5.00%, due 5/15/51 | 5,635,000 | 5,796,164 |
Kauai County Community Facilities District, Community Facilities District No. 2008-1, Special Tax | ||
5.00%, due 5/15/44 | 1,775,000 | 1,845,022 |
5.00%, due 5/15/49 | 2,750,000 | 2,842,345 |
28 | MainStay MacKay High Yield Municipal Bond Fund |
Principal Amount | Value | |
Long-Term Municipal Bonds (continued) | ||
Hawaii (continued) | ||
State of Hawaii Airports System, Revenue Bonds (b) | ||
Series A | ||
4.00%, due 7/1/40 | $ 10,125,000 | $ 10,004,521 |
Series A | ||
5.00%, due 7/1/51 | 19,500,000 | 21,007,861 |
State of Hawaii Department of Budget & Finance, Hawaiian Electric Co., Inc., Revenue Bonds | ||
3.50%, due 10/1/49 | 25,275,000 | 23,113,528 |
Series B | ||
4.00%, due 3/1/37 (b) | 3,950,000 | 3,987,713 |
State of Hawaii Department of Budget & Finance, Chaminade University of Honolulu, Revenue Bonds | ||
Series A | ||
5.00%, due 1/1/45 (a) | 1,500,000 | 1,415,951 |
State of Hawaii Department of Budget & Finance, Hawaii Pacific University, Revenue Bonds | ||
Series A | ||
6.625%, due 7/1/33 | 2,085,000 | 2,143,714 |
Series A | ||
6.875%, due 7/1/43 | 4,340,000 | 4,455,482 |
78,781,701 | ||
Idaho 0.0% ‡ | ||
Idaho Health Facilities Authority, Madison Memorial Hospital, Revenue Bonds | ||
5.00%, due 9/1/37 | 1,000,000 | 1,058,026 |
Idaho Housing & Finance Association, Gem Prep: Meridian Project, Revenue Bonds | ||
Series A, Insured: School Bond Guaranty | ||
4.00%, due 5/1/57 | 4,365,000 | 3,897,587 |
4,955,613 | ||
Principal Amount | Value | |
Illinois 10.0% | ||
Bridgeview Finance Corp., Sales Tax, Revenue Bonds | ||
Series A | ||
5.00%, due 12/1/37 | $ 1,260,000 | $ 1,089,524 |
Series A | ||
5.00%, due 12/1/42 | 7,250,000 | 5,989,424 |
Chicago Board of Education, Capital Appreciation, School Reform, Unlimited General Obligation | ||
Series A, Insured: NATL-RE | ||
(zero coupon), due 12/1/27 | 5,175,000 | 4,221,805 |
Series B-1, Insured: NATL-RE | ||
(zero coupon), due 12/1/30 | 13,050,000 | 9,302,909 |
Series A, Insured: NATL-RE | ||
(zero coupon), due 12/1/31 | 170,000 | 115,330 |
Series B-1, Insured: NATL-RE | ||
(zero coupon), due 12/1/31 | 1,095,000 | 742,858 |
Chicago Board of Education, Unlimited General Obligation | ||
Series B | ||
4.00%, due 12/1/40 | 3,335,000 | 3,047,631 |
Series B | ||
4.00%, due 12/1/41 | 5,265,000 | 4,785,752 |
Series A | ||
4.00%, due 12/1/47 | 56,385,000 | 49,355,499 |
Series A | ||
5.00%, due 12/1/29 | 8,000,000 | 8,543,101 |
Series B | ||
5.00%, due 12/1/30 | 700,000 | 749,140 |
Series B | ||
5.00%, due 12/1/31 | 1,750,000 | 1,857,677 |
Series A | ||
5.00%, due 12/1/32 | 1,125,000 | 1,190,421 |
Series B | ||
5.00%, due 12/1/32 | 1,250,000 | 1,322,672 |
Series B | ||
5.00%, due 12/1/33 | 2,050,000 | 2,073,498 |
Series B | ||
5.00%, due 12/1/33 | 1,400,000 | 1,479,430 |
Series A | ||
5.00%, due 12/1/34 | 7,950,000 | 8,368,892 |
Series G | ||
5.00%, due 12/1/34 | 4,700,000 | 4,935,616 |
Series A | ||
5.00%, due 12/1/36 | 9,650,000 | 10,134,637 |
Series H | ||
5.00%, due 12/1/36 | 4,430,000 | 4,643,736 |
Principal Amount | Value | |
Long-Term Municipal Bonds (continued) | ||
Illinois (continued) | ||
Chicago Board of Education, Unlimited General Obligation (continued) | ||
Series A | ||
5.00%, due 12/1/37 | $ 1,000,000 | $ 1,049,677 |
Series A | ||
5.00%, due 12/1/40 | 7,350,000 | 7,676,162 |
Series A | ||
5.00%, due 12/1/41 | 15,540,000 | 16,205,020 |
Series A | ||
5.00%, due 12/1/42 | 20,565,000 | 20,796,000 |
Series A | ||
5.00%, due 12/1/43 | 1,515,000 | 1,578,151 |
Series D | ||
5.00%, due 12/1/46 | 6,200,000 | 6,425,921 |
Series H | ||
5.00%, due 12/1/46 | 6,700,000 | 6,937,736 |
Series C | ||
5.25%, due 12/1/39 | 1,405,000 | 1,455,006 |
Series B | ||
6.50%, due 12/1/46 | 1,900,000 | 2,101,330 |
Series A | ||
7.00%, due 12/1/44 | 11,075,000 | 12,206,784 |
Chicago Board of Education, Revenue Bonds | ||
5.00%, due 4/1/46 | 4,700,000 | 4,863,127 |
6.00%, due 4/1/46 | 34,200,000 | 37,228,403 |
Chicago Board of Education, Dedicated Capital Improvement, Unlimited General Obligation | ||
Series C | ||
5.00%, due 12/1/34 | 2,270,000 | 2,383,798 |
Series B | ||
7.00%, due 12/1/42 (a) | 9,700,000 | 11,151,724 |
Series A | ||
7.00%, due 12/1/46 (a) | 3,700,000 | 4,232,082 |
Chicago Board of Education, Dedicated Capital Improvement, Revenue Bonds | ||
5.00%, due 4/1/35 | 1,615,000 | 1,695,350 |
5.00%, due 4/1/36 | 1,270,000 | 1,332,037 |
5.00%, due 4/1/37 | 435,000 | 455,802 |
5.00%, due 4/1/42 | 3,500,000 | 3,642,646 |
Principal Amount | Value | |
Illinois (continued) | ||
Chicago Board of Education, School Reform Board, Unlimited General Obligation | ||
Series A, Insured: AGC-ICC FGIC | ||
5.50%, due 12/1/26 | $ 18,900,000 | $ 20,578,651 |
Chicago O'Hare International Airport, TRIPS Obligated Group, Revenue Bonds | ||
5.00%, due 7/1/38 (b) | 1,500,000 | 1,585,680 |
Chicago O'Hare International Airport, Trips Obligated Group, Revenue Bonds | ||
5.00%, due 7/1/48 (b) | 4,750,000 | 4,941,648 |
Chicago Transit Authority, Sales Tax Receipts, Revenue Bonds, Second Lien | ||
5.00%, due 12/1/46 | 8,750,000 | 9,375,881 |
City of Chicago IL, City Colleges Capital Improvement Project, Unlimited General Obligation | ||
Insured: NATL-RE | ||
(zero coupon), due 1/1/34 | 300,000 | 186,250 |
City of Chicago IL, Unlimited General Obligation | ||
Series A | ||
4.00%, due 1/1/35 | 2,325,000 | 2,204,437 |
Series A | ||
5.00%, due 1/1/33 | 7,500,000 | 8,021,386 |
Series C | ||
5.00%, due 1/1/38 | 2,410,000 | 2,517,750 |
Series A | ||
5.00%, due 1/1/39 | 5,750,000 | 6,074,575 |
Series A | ||
5.00%, due 1/1/40 | 3,950,000 | 4,167,886 |
Series A | ||
5.00%, due 1/1/44 | 11,250,000 | 11,801,888 |
Series A | ||
5.50%, due 1/1/49 | 18,150,000 | 19,512,764 |
Series A | ||
6.00%, due 1/1/38 | 39,020,000 | 42,728,632 |
City of Chicago IL, Waterworks, Revenue Bonds, Second Lien | ||
4.00%, due 11/1/37 | 14,800,000 | 14,879,201 |
30 | MainStay MacKay High Yield Municipal Bond Fund |
Principal Amount | Value | |
Long-Term Municipal Bonds (continued) | ||
Illinois (continued) | ||
City of Chicago IL, Taxable Project, Unlimited General Obligation | ||
Series A | ||
5.00%, due 1/1/35 | $ 12,770,000 | $ 13,138,432 |
Series A | ||
5.00%, due 1/1/36 | 3,250,000 | 3,343,767 |
Series B | ||
5.50%, due 1/1/31 | 2,360,000 | 2,493,593 |
Series D | ||
5.50%, due 1/1/37 | 3,500,000 | 3,692,512 |
Series D | ||
5.50%, due 1/1/40 | 1,245,000 | 1,312,269 |
Series A | ||
5.75%, due 1/1/34 | 3,600,000 | 3,899,445 |
City of Chicago IL, Wastewater Transmission Project, Revenue Bonds, Second Lien | ||
5.00%, due 1/1/39 | 240,000 | 246,479 |
City of Galesburg IL, Knox College Project, Revenue Bonds | ||
Series A | ||
4.00%, due 10/1/46 | 5,750,000 | 5,439,613 |
Illinois Finance Authority, Midwestern University Foundation, Revenue Bonds | ||
Series A | ||
2.25%, due 7/1/33 (b) | 500,000 | 400,053 |
Illinois Finance Authority, Bradley University, Revenue Bonds | ||
Series A | ||
4.00%, due 8/1/46 | 1,500,000 | 1,373,052 |
Series A | ||
4.00%, due 8/1/51 | 2,500,000 | 2,244,130 |
Illinois Finance Authority, University of Illinois Health Services, Revenue Bonds | ||
4.00%, due 10/1/50 | 16,895,000 | 16,079,000 |
4.00%, due 10/1/55 | 2,785,000 | 2,609,326 |
Illinois Finance Authority, Learn Charter School Project, Revenue Bonds | ||
4.00%, due 11/1/51 | 1,000,000 | 891,404 |
4.00%, due 11/1/56 | 750,000 | 652,729 |
Principal Amount | Value | |
Illinois (continued) | ||
Illinois Finance Authority, Rosalind Franklin University of Medicine & Science, Revenue Bonds | ||
Series C | ||
4.25%, due 8/1/42 | $ 2,900,000 | $ 2,921,285 |
Illinois Finance Authority, Noble Network Charter Schools, Revenue Bonds | ||
5.00%, due 9/1/32 | 1,830,000 | 1,882,718 |
6.25%, due 9/1/39 | 150,000 | 154,843 |
Illinois Finance Authority, Friendship Village Schaumburg, Revenue Bonds (e)(f) | ||
5.00%, due 2/15/37 | 7,375,000 | 4,853,482 |
5.125%, due 2/15/45 | 5,715,000 | 3,631,393 |
Illinois Finance Authority, Columbia College Chicago, Revenue Bonds | ||
Series A | ||
5.00%, due 12/1/37 | 9,750,000 | 10,197,176 |
Illinois Finance Authority, Christian Homes, Inc., Revenue Bonds | ||
5.00%, due 5/15/40 | 1,265,000 | 1,328,011 |
Illinois Finance Authority, Student Housing & Academic Facility, CHF-Chicago LLC, University of Illinois at Chicago Project, Revenue Bonds | ||
Series A | ||
5.00%, due 2/15/47 | 6,250,000 | 6,318,896 |
Series A | ||
5.00%, due 2/15/50 | 1,835,000 | 1,852,668 |
Illinois Finance Authority, Franciscan Communities, Inc., Revenue Bonds | ||
Series A | ||
5.00%, due 5/15/47 | 1,155,000 | 1,188,592 |
Illinois Finance Authority, Chicago International School Project, Revenue Bonds | ||
Series A | ||
5.00%, due 12/1/47 | 3,000,000 | 3,074,540 |
Principal Amount | Value | |
Long-Term Municipal Bonds (continued) | ||
Illinois (continued) | ||
Illinois Finance Authority, Rosalind Franklin University of Medicine and Science, Revenue Bonds | ||
5.00%, due 8/1/49 | $ 1,300,000 | $ 1,357,913 |
Illinois Finance Authority, Roosevelt University Project, Revenue Bonds | ||
5.50%, due 4/1/32 | 2,000,000 | 2,000,618 |
Series A | ||
6.125%, due 4/1/58 (a) | 6,200,000 | 6,529,050 |
Metropolitan Pier & Exposition Authority, McCormick Place Expansion Project, Revenue Bonds | ||
Series A, Insured: NATL-RE | ||
(zero coupon), due 12/15/31 | 5,000,000 | 3,351,430 |
Series A, Insured: NATL-RE | ||
(zero coupon), due 12/15/32 | 18,445,000 | 11,773,220 |
Series A, Insured: NATL-RE | ||
(zero coupon), due 6/15/33 | 25,720,000 | 16,013,077 |
Series A, Insured: NATL-RE | ||
(zero coupon), due 12/15/33 | 12,350,000 | 7,500,710 |
Series A, Insured: NATL-RE | ||
(zero coupon), due 6/15/34 | 45,815,000 | 27,136,463 |
Series A, Insured: NATL-RE | ||
(zero coupon), due 12/15/36 | 34,195,000 | 17,807,836 |
Series A, Insured: NATL-RE | ||
(zero coupon), due 6/15/37 | 15,600,000 | 7,913,159 |
Series A, Insured: NATL-RE | ||
(zero coupon), due 12/15/37 | 64,100,000 | 31,696,187 |
Series B | ||
(zero coupon), due 12/15/50 | 35,130,000 | 7,613,015 |
Series B, Insured: AGM-CR | ||
(zero coupon), due 12/15/50 | 10,000,000 | 2,598,100 |
Series B | ||
(zero coupon), due 12/15/51 | 55,300,000 | 11,304,520 |
Series B | ||
(zero coupon), due 12/15/54 | 57,160,000 | 9,800,871 |
(zero coupon), due 12/15/56 | 29,650,000 | 4,532,225 |
Series B, Insured: AGM | ||
(zero coupon), due 12/15/56 | 35,995,000 | 6,874,671 |
Series A | ||
4.00%, due 6/15/50 | 22,300,000 | 20,530,691 |
Series A, Insured: BAM | ||
4.00%, due 6/15/50 | 2,500,000 | 2,421,871 |
4.00%, due 6/15/52 | 28,860,000 | 26,314,256 |
Principal Amount | Value | |
Illinois (continued) | ||
Metropolitan Pier & Exposition Authority, McCormick Place Expansion Project, Revenue Bonds (continued) | ||
Series B, Insured: State Appropriations | ||
4.25%, due 6/15/42 | $ 1,660,000 | $ 1,665,231 |
5.00%, due 6/15/42 | 1,000,000 | 1,050,348 |
Series A | ||
5.00%, due 6/15/42 | 6,900,000 | 6,927,735 |
Series A, Insured: BAM | ||
5.00%, due 6/15/42 | 395,000 | 396,588 |
Series A | ||
5.00%, due 12/15/45 | 1,430,000 | 1,493,285 |
5.00%, due 6/15/50 | 17,600,000 | 18,281,264 |
Series A | ||
5.00%, due 6/15/57 | 2,000,000 | 2,064,907 |
Metropolitan Pier & Exposition Authority, Mccormick Place Expansion Project, Revenue Bonds | ||
Series A | ||
(zero coupon), due 12/15/38 | 3,750,000 | 1,630,498 |
Series A | ||
(zero coupon), due 6/15/39 | 3,600,000 | 1,515,237 |
Series A | ||
(zero coupon), due 6/15/40 | 3,500,000 | 1,389,914 |
Metropolitan Pier & Exposition Authority, McCormick Place Expansion Project, Capital Appreciation, Revenue Bonds | ||
Series B-1, Insured: AGM | ||
(zero coupon), due 6/15/44 | 78,420,000 | 28,415,746 |
Insured: AGM | ||
(zero coupon), due 6/15/45 | 8,000,000 | 2,750,172 |
Northern Illinois University, Auxiliary Facilities System, Revenue Bonds | ||
Series B, Insured: BAM | ||
4.00%, due 4/1/37 | 1,300,000 | 1,307,787 |
Series B, Insured: BAM | ||
4.00%, due 4/1/39 | 1,300,000 | 1,293,618 |
Series B, Insured: BAM | ||
4.00%, due 4/1/41 | 1,350,000 | 1,329,877 |
32 | MainStay MacKay High Yield Municipal Bond Fund |
Principal Amount | Value | |
Long-Term Municipal Bonds (continued) | ||
Illinois (continued) | ||
Sangamon County Water Reclamation District, Alternative Revenue Source, Unlimited General Obligation | ||
Series A, Insured: BAM | ||
4.00%, due 1/1/44 | $ 4,750,000 | $ 4,871,944 |
Series A | ||
4.00%, due 1/1/49 | 13,750,000 | 13,815,486 |
State of Illinois, Unlimited General Obligation | ||
Series D | ||
3.25%, due 11/1/26 | 5,290,000 | 5,266,977 |
Series B | ||
4.00%, due 12/1/39 | 9,460,000 | 8,869,635 |
Insured: BAM | ||
4.00%, due 6/1/41 | 25,355,000 | 25,120,426 |
Series C | ||
4.00%, due 10/1/41 | 7,650,000 | 7,179,601 |
Series C | ||
4.00%, due 10/1/42 | 8,750,000 | 8,162,950 |
Series C | ||
4.25%, due 10/1/45 | 23,500,000 | 22,332,513 |
Series A | ||
4.50%, due 12/1/41 | 6,525,000 | 6,532,061 |
Series A | ||
5.00%, due 12/1/25 | 3,270,000 | 3,473,095 |
Series D | ||
5.00%, due 11/1/26 | 3,995,000 | 4,283,427 |
Series D | ||
5.00%, due 11/1/27 | 10,700,000 | 11,551,424 |
Series A | ||
5.00%, due 12/1/27 | 2,315,000 | 2,500,469 |
Series B | ||
5.00%, due 12/1/27 | 9,115,000 | 9,845,260 |
5.00%, due 2/1/28 | 2,700,000 | 2,886,976 |
Series C | ||
5.00%, due 11/1/29 | 14,335,000 | 15,313,017 |
Series A | ||
5.00%, due 1/1/31 | 7,860,000 | 7,879,928 |
Series A | ||
5.00%, due 12/1/31 | 2,985,000 | 3,158,547 |
Series A | ||
5.00%, due 12/1/39 | 2,400,000 | 2,496,501 |
Series A | ||
5.00%, due 5/1/40 | 2,000,000 | 2,083,253 |
5.50%, due 7/1/38 | 3,000,000 | 3,086,293 |
5.75%, due 5/1/45 | 17,020,000 | 18,675,554 |
Principal Amount | Value | |
Illinois (continued) | ||
State of Illinois, Rebuild Illinois Program, Unlimited General Obligation | ||
Series C | ||
4.00%, due 11/1/41 | $ 19,500,000 | $ 18,298,287 |
University of Illinois, Facilities System, Revenue Bonds | ||
Series A, Insured: BAM | ||
3.00%, due 4/1/37 | 3,710,000 | 3,403,453 |
Series A, Insured: BAM | ||
3.00%, due 4/1/38 | 3,825,000 | 3,466,765 |
Series A, Insured: BAM | ||
3.00%, due 4/1/39 | 2,435,000 | 2,186,522 |
Series A, Insured: BAM | ||
3.00%, due 4/1/40 | 3,805,000 | 3,379,769 |
Upper Illinois River Valley Development Authority, Morris Hospital Obligated Group, Revenue Bonds | ||
5.00%, due 12/1/48 | 14,905,000 | 15,603,043 |
Village of Bridgeview IL, Unlimited General Obligation | ||
Series A | ||
5.125%, due 12/1/44 | 100,000 | 90,359 |
Series A | ||
5.50%, due 12/1/43 | 1,545,000 | 1,474,487 |
Series A | ||
5.50%, due 12/1/43 | 1,260,000 | 1,202,495 |
Series A | ||
5.625%, due 12/1/41 | 3,940,000 | 3,853,434 |
Series A | ||
5.75%, due 12/1/35 | 2,705,000 | 2,709,554 |
Village of Oak Lawn IL, Corporate Purpose, Unlimited General Obligation | ||
Insured: NATL-RE | ||
4.40%, due 12/1/26 | 400,000 | 400,567 |
Insured: NATL-RE | ||
4.45%, due 12/1/28 | 430,000 | 430,590 |
Insured: NATL-RE | ||
4.50%, due 12/1/30 | 475,000 | 475,560 |
Insured: NATL-RE | ||
4.50%, due 12/1/32 | 520,000 | 520,597 |
Insured: NATL-RE | ||
4.50%, due 12/1/34 | 575,000 | 575,568 |
Village of Riverdale IL, Unlimited General Obligation | ||
8.00%, due 10/1/36 | 1,705,000 | 1,707,893 |
Principal Amount | Value | |
Long-Term Municipal Bonds (continued) | ||
Illinois (continued) | ||
Village of Romeoville IL, Lewis University, Revenue Bonds | ||
Series B | ||
4.125%, due 10/1/41 | $ 1,000,000 | $ 1,004,904 |
Series B | ||
4.125%, due 10/1/46 | 2,100,000 | 2,103,001 |
Series B | ||
5.00%, due 10/1/36 | 1,000,000 | 1,038,615 |
Series B | ||
5.00%, due 10/1/39 | 1,275,000 | 1,321,371 |
1,062,376,606 | ||
Indiana 0.3% | ||
City of Valparaiso IN, Pratt Paper LLC Project, Revenue Bonds | ||
7.00%, due 1/1/44 (b) | 5,200,000 | 5,457,338 |
Gary Chicago International Airport Authority, Revenue Bonds | ||
5.00%, due 2/1/29 | 1,170,000 | 1,207,890 |
5.25%, due 2/1/34 | 750,000 | 773,245 |
Indiana Finance Authority, Greencroft Goshen Obligated Group, Revenue Bonds | ||
Series A | ||
4.00%, due 11/15/43 | 1,500,000 | 1,383,599 |
Indiana Finance Authority, United States Steel Corp., Revenue Bonds | ||
4.125%, due 12/1/26 | 3,000,000 | 3,035,504 |
Series A | ||
6.75%, due 5/1/39 (b) | 1,250,000 | 1,471,846 |
Indiana Finance Authority, University of Indianapolis Education Facilities Project, Revenue Bonds | ||
5.00%, due 10/1/43 | 2,000,000 | 2,116,136 |
Indiana Finance Authority, BHI Senior Living, Inc., Revenue Bonds | ||
Series A | ||
5.00%, due 11/15/48 | 4,750,000 | 4,877,661 |
Series A | ||
5.00%, due 11/15/53 | 4,150,000 | 4,249,744 |
Principal Amount | Value | |
Indiana (continued) | ||
Town of Upland IN, Taylor University Project, Revenue Bonds | ||
4.00%, due 9/1/33 | $ 1,595,000 | $ 1,640,920 |
4.00%, due 9/1/39 | 2,030,000 | 2,069,534 |
4.00%, due 9/1/46 | 3,000,000 | 3,013,496 |
31,296,913 | ||
Iowa 0.9% | ||
City of Coralville IA, Annual Appropriation, Revenue Bonds | ||
Series B | ||
4.25%, due 5/1/37 | 7,115,000 | 7,126,501 |
City of Coralville IA, Annual Appropriation, Tax Allocation | ||
Series C | ||
4.50%, due 5/1/47 | 2,930,000 | 2,795,030 |
City of Coralville IA, Revenue Bonds | ||
Series C | ||
5.00%, due 5/1/42 (d) | 7,000,000 | 6,911,170 |
Iowa Finance Authority, Iowa Fertilizer Co. LLC, Revenue Bonds (d) | ||
(zero coupon), due 12/1/50 | 2,500,000 | 2,568,003 |
5.00%, due 12/1/50 | 22,500,000 | 22,831,123 |
Iowa Finance Authority, Lifespace Communities, Inc., Revenue Bonds | ||
Series A-1 | ||
4.00%, due 5/15/55 | 3,500,000 | 2,798,553 |
Iowa Finance Authority, Northcrest, Inc. Project, Revenue Bonds | ||
Series A | ||
5.00%, due 3/1/48 | 1,500,000 | 1,521,725 |
Iowa Finance Authority, Iowa Fertilizer Company Project, Revenue Bonds | ||
5.25%, due 12/1/25 | 7,250,000 | 7,652,404 |
Iowa Higher Education Loan Authority, Des Moines University Project, Revenue Bonds | ||
4.00%, due 10/1/45 | 3,000,000 | 2,927,288 |
4.00%, due 10/1/50 | 10,750,000 | 10,367,670 |
34 | MainStay MacKay High Yield Municipal Bond Fund |
Principal Amount | Value | |
Long-Term Municipal Bonds (continued) | ||
Iowa (continued) | ||
Iowa Tobacco Settlement Authority, Capital Appreciation, Revenue Bonds | ||
Series B-2 | ||
(zero coupon), due 6/1/65 | $ 73,330,000 | $ 8,448,159 |
Iowa Tobacco Settlement Authority, Revenue Bonds | ||
Series B-1 | ||
4.00%, due 6/1/49 | 4,750,000 | 4,505,290 |
State of Iowa Board of Regents, University of Iowa Hospitals & Clinics, Revenue Bonds | ||
Series B | ||
3.00%, due 9/1/61 | 8,750,000 | 6,676,110 |
Xenia Rural Water District, Capital Loan Notes, Revenue Bonds | ||
5.00%, due 12/1/36 | 3,000,000 | 3,193,559 |
5.00%, due 12/1/41 | 3,000,000 | 3,171,313 |
93,493,898 | ||
Kansas 0.2% | ||
City of Manhattan KS, Meadowlark Hills Retirement Community, Revenue Bonds | ||
Series A | ||
4.00%, due 6/1/46 | 1,000,000 | 887,803 |
Wyandotte County-Kansas City Unified Government, Vacation Village Project Area 4 - Major Multi-Sport Athletic Complex Project, Revenue Bonds | ||
(zero coupon), due 9/1/34 (a) | 55,575,000 | 16,045,836 |
16,933,639 | ||
Kentucky 1.0% | ||
City of Campbellsville KY, Campbellsville University Project, Revenue Bonds | ||
5.00%, due 3/1/39 | 4,480,000 | 4,102,311 |
City of Columbia KY, Lindsey Wilson College Project, Revenue Bonds | ||
5.00%, due 12/1/33 | 3,605,000 | 3,890,336 |
Principal Amount | Value | |
Kentucky (continued) | ||
City of Henderson KY, Pratt Paper LLC Project, Revenue Bonds (a)(b) | ||
Series A | ||
4.45%, due 1/1/42 | $ 8,000,000 | $ 7,744,725 |
Series B | ||
4.45%, due 1/1/42 | 7,000,000 | 6,776,634 |
Series A | ||
4.70%, due 1/1/52 | 15,000,000 | 14,419,125 |
Kentucky Economic Development Finance Authority, Next Generation Kentucky Information Highway Project, Revenue Bonds, Senior Lien | ||
Series A | ||
5.00%, due 7/1/32 | 6,200,000 | 6,540,026 |
Kentucky Economic Development Finance Authority, Owensboro Health, Revenue Bonds | ||
Series A | ||
5.00%, due 6/1/41 | 4,175,000 | 4,455,116 |
Series A | ||
5.00%, due 6/1/45 | 9,475,000 | 10,034,412 |
Kentucky Economic Development Finance Authority, CommonSpirit Health Obligated Group, Revenue Bonds | ||
Series A-1 | ||
5.00%, due 8/1/44 | 4,750,000 | 5,122,414 |
Series A-2 | ||
5.00%, due 8/1/44 | 5,750,000 | 6,200,817 |
Series A-2 | ||
5.00%, due 8/1/49 | 6,050,000 | 6,482,954 |
Kentucky Municipal Power Agency, Prairie State Project, Revenue Bonds | ||
Series A | ||
4.00%, due 9/1/45 | 20,945,000 | 20,872,116 |
Louisville/Jefferson County Metropolitan Government, Norton Healthcare, Inc., Revenue Bonds | ||
Series A | ||
4.00%, due 10/1/34 | 5,325,000 | 5,383,881 |
102,024,867 | ||
Principal Amount | Value | |
Long-Term Municipal Bonds (continued) | ||
Louisiana 0.2% | ||
Calcasieu Parish Memorial Hospital Service District, Lake Charles Memorial Hospital Project, Revenue Bonds | ||
5.00%, due 12/1/39 | $ 2,225,000 | $ 2,330,589 |
City of New Orleans LA, Water System, Revenue Bonds | ||
5.00%, due 12/1/44 | 5,250,000 | 5,594,747 |
Louisiana Local Government Environmental Facilities & Community Development Authority, Peoples of Bastrop LLC Project, Revenue Bonds | ||
5.625%, due 6/15/51 (a) | 2,500,000 | 2,336,823 |
Louisiana Public Facilities Authority, Ochsner Clinic Foundation Obligated Group, Revenue Bonds | ||
5.00%, due 5/15/47 | 4,750,000 | 5,009,232 |
New Orleans Aviation Board, North Terminal Project, Revenue Bonds | ||
Series B | ||
5.00%, due 1/1/40 (b) | 6,750,000 | 6,947,118 |
22,218,509 | ||
Maine 0.1% | ||
City of Portland ME, General Airport, Green Bond, Revenue Bonds | ||
4.00%, due 1/1/40 | 1,400,000 | 1,401,484 |
Maine Health & Higher Educational Facilities Authority, Northern Light Health Obligated Group, Revenue Bonds | ||
5.00%, due 7/1/33 | 3,575,000 | 3,691,205 |
5.00%, due 7/1/43 | 2,590,000 | 2,674,187 |
7,766,876 | ||
Maryland 0.9% | ||
County of Baltimore MD, Oak Crest Village, Inc. Facility, Revenue Bonds | ||
4.00%, due 1/1/45 | 1,750,000 | 1,802,016 |
4.00%, due 1/1/50 | 2,500,000 | 2,558,635 |
Principal Amount | Value | |
Maryland (continued) | ||
County of Frederick MD, Oakdale Lake Linganore Project, Tax Allocation | ||
3.75%, due 7/1/39 | $ 1,410,000 | $ 1,271,883 |
County of Frederick MD, Urbana Community Development Authority, Special Tax | ||
Series C | ||
4.00%, due 7/1/50 | 1,000,000 | 940,916 |
County of Frederick MD, Mount St Mary's University, Inc., Revenue Bonds (a) | ||
Series A | ||
5.00%, due 9/1/37 | 3,000,000 | 3,070,172 |
Series A | ||
5.00%, due 9/1/45 | 500,000 | 504,619 |
Maryland Economic Development Corp., Port Convington Project, Tax Allocation | ||
3.25%, due 9/1/30 | 1,250,000 | 1,166,921 |
4.00%, due 9/1/50 | 4,000,000 | 3,527,957 |
Maryland Economic Development Corp., SSA Baltimore Project, Revenue Bonds | ||
3.997%, due 4/1/34 | 11,665,000 | 10,573,977 |
Maryland Economic Development Corp., Purple Line Light Project, Green Bond, Revenue Bonds | ||
Series B | ||
5.25%, due 6/30/52 (b) | 35,000,000 | 36,624,546 |
Maryland Health & Higher Educational Facilities Authority, Adventist Healthcare, Revenue Bonds | ||
Series B | ||
4.00%, due 1/1/51 | 20,310,000 | 18,735,285 |
Maryland Health & Higher Educational Facilities Authority, Stevenson University, Inc. Project, Revenue Bonds | ||
Series A | ||
4.00%, due 6/1/51 | 1,000,000 | 929,609 |
4.00%, due 6/1/55 | 1,000,000 | 917,554 |
36 | MainStay MacKay High Yield Municipal Bond Fund |
Principal Amount | Value | |
Long-Term Municipal Bonds (continued) | ||
Maryland (continued) | ||
Maryland Health & Higher Educational Facilities Authority, Broadmead Issue, Revenue Bonds | ||
Series A | ||
5.00%, due 7/1/38 | $ 1,000,000 | $ 1,079,455 |
Series A | ||
5.00%, due 7/1/48 | 3,000,000 | 3,209,873 |
Maryland Health & Higher Educational Facilities Authority, Meritus Medical Center Issue, Revenue Bonds | ||
5.00%, due 7/1/45 | 4,000,000 | 4,215,548 |
Maryland Health & Higher Educational Facilities Authority, Green Street Academy Inc., Revenue Bonds (a) | ||
Series A | ||
5.125%, due 7/1/37 | 1,260,000 | 1,270,991 |
Series A | ||
5.375%, due 7/1/52 | 1,530,000 | 1,534,321 |
Maryland Health & Higher Educational Facilities Authority, Edenwald Issue, Revenue Bonds | ||
5.25%, due 1/1/37 | 1,000,000 | 1,046,398 |
94,980,676 | ||
Massachusetts 1.0% | ||
Massachusetts Development Finance Agency, Seven Hills Foundation Obligated Group, Revenue Bonds | ||
4.00%, due 9/1/34 | 1,000,000 | 1,017,117 |
Massachusetts Development Finance Agency, Wellforce Obligated Group, Revenue Bonds | ||
Series A | ||
4.00%, due 7/1/44 | 17,350,000 | 17,215,636 |
Massachusetts Development Finance Agency, Equitable School Revolving Fund LLC, Revenue Bonds | ||
Series C | ||
4.00%, due 11/1/51 | 1,355,000 | 1,322,210 |
Principal Amount | Value | |
Massachusetts (continued) | ||
Massachusetts Development Finance Agency, Linden Ponds, Inc., Revenue Bonds (a) | ||
5.00%, due 11/15/33 | $ 3,000,000 | $ 3,222,698 |
5.125%, due 11/15/46 | 5,700,000 | 6,018,437 |
Massachusetts Development Finance Agency, Milford Regional Medical Center, Revenue Bonds (a) | ||
Series G | ||
5.00%, due 7/15/35 | 270,000 | 280,472 |
Series G | ||
5.00%, due 7/15/36 | 235,000 | 243,848 |
Series G | ||
5.00%, due 7/15/37 | 245,000 | 253,973 |
Series G | ||
5.00%, due 7/15/46 | 1,100,000 | 1,122,066 |
Massachusetts Development Finance Agency, Western New England University, Revenue Bonds | ||
5.00%, due 9/1/40 | 1,325,000 | 1,388,849 |
5.00%, due 9/1/45 | 1,175,000 | 1,225,993 |
Massachusetts Development Finance Agency, Dexter Southfield, Revenue Bonds | ||
5.00%, due 5/1/41 | 2,750,000 | 2,905,261 |
Massachusetts Development Finance Agency, Ascentria Care Alliance Project, Revenue Bonds (a) | ||
5.00%, due 7/1/41 | 4,925,000 | 4,713,916 |
5.00%, due 7/1/56 | 3,000,000 | 2,668,964 |
Massachusetts Development Finance Agency, UMass Dartmouth Student Housing Project, Revenue Bonds | ||
5.00%, due 10/1/43 | 2,000,000 | 2,017,371 |
5.00%, due 10/1/48 | 7,750,000 | 7,774,943 |
5.00%, due 10/1/54 | 15,600,000 | 15,574,422 |
Massachusetts Development Finance Agency, Boston Medical Center, Green Bond, Revenue Bonds | ||
5.00%, due 7/1/44 | 1,000,000 | 1,042,859 |
Principal Amount | Value | |
Long-Term Municipal Bonds (continued) | ||
Massachusetts (continued) | ||
Massachusetts Development Finance Agency, UMass Memorial Health Care Obligated Group, Revenue Bonds | ||
Series L | ||
5.00%, due 7/1/44 | $ 8,205,000 | $ 8,767,972 |
Series I | ||
5.00%, due 7/1/46 | 2,000,000 | 2,111,860 |
Massachusetts Development Finance Agency, UMass Boston Student Housing Project, Revenue Bonds | ||
5.00%, due 10/1/48 | 10,165,000 | 10,357,680 |
Massachusetts Development Finance Agency, CareGroup Obligated Group, Revenue Bonds | ||
Series J2 | ||
5.00%, due 7/1/53 | 6,535,000 | 7,006,301 |
Massachusetts Development Finance Agency, North Hill Communities Inc., Revenue Bonds | ||
Series A | ||
6.50%, due 11/15/43 (a) | 2,000,000 | 2,128,270 |
Massachusetts Educational Financing Authority, Educational Loan, Revenue Bonds (b) | ||
Series B | ||
2.00%, due 7/1/37 | 3,600,000 | 3,154,633 |
Series C | ||
3.00%, due 7/1/51 | 4,000,000 | 2,884,541 |
Massachusetts Educational Financing Authority, Revenue Bonds, Senior Lien | ||
Series B | ||
3.00%, due 7/1/35 (b) | 4,740,000 | 4,765,329 |
111,185,621 | ||
Michigan 1.9% | ||
Calhoun County Hospital Finance Authority, Oaklawn Hospital, Revenue Bonds | ||
5.00%, due 2/15/41 | 3,260,000 | 3,446,405 |
5.00%, due 2/15/47 | 3,000,000 | 3,149,143 |
Principal Amount | Value | |
Michigan (continued) | ||
Chandler Park Academy, Revenue Bonds | ||
5.125%, due 11/1/30 | $ 1,050,000 | $ 1,050,036 |
5.125%, due 11/1/35 | 605,000 | 604,982 |
City of Detroit MI, Unlimited General Obligation | ||
Insured: AMBAC | ||
4.60%, due 4/1/24 | 20,150 | 19,720 |
5.00%, due 4/1/27 | 850,000 | 906,608 |
5.00%, due 4/1/31 | 1,000,000 | 1,061,780 |
5.00%, due 4/1/33 | 1,200,000 | 1,266,897 |
5.00%, due 4/1/35 | 1,000,000 | 1,050,803 |
5.00%, due 4/1/37 | 1,100,000 | 1,153,769 |
5.00%, due 4/1/38 | 850,000 | 890,421 |
Insured: AMBAC | ||
5.25%, due 4/1/24 | 45,725 | 45,281 |
5.50%, due 4/1/45 | 1,100,000 | 1,197,464 |
5.50%, due 4/1/50 | 2,070,000 | 2,241,387 |
City of Detroit MI, Water Supply System, Revenue Bonds, Second Lien | ||
Series B, Insured: NATL-RE | ||
5.00%, due 7/1/34 | 10,000 | 10,029 |
Detroit Service Learning Academy, Revenue Bonds | ||
4.00%, due 7/1/31 | 3,805,000 | 3,716,320 |
4.00%, due 7/1/41 | 2,150,000 | 1,832,264 |
Michigan Finance Authority, Tobacco Settlement Asset-Backed, Capital Appreciation, Revenue Bonds, Senior Lien | ||
Series B | ||
(zero coupon), due 6/1/45 | 48,800,000 | 13,212,239 |
Michigan Finance Authority, Tobacco Settlement Asset-Backed, Revenue Bonds, Senior Lien | ||
Series B-2, Class 2 | ||
(zero coupon), due 6/1/65 | 118,650,000 | 12,255,786 |
Series A, Class 1 | ||
4.00%, due 6/1/49 | 6,750,000 | 6,438,090 |
Michigan Finance Authority, Calvin University Obligated Group, Revenue Bonds | ||
4.00%, due 9/1/46 | 4,720,000 | 4,472,407 |
38 | MainStay MacKay High Yield Municipal Bond Fund |
Principal Amount | Value | |
Long-Term Municipal Bonds (continued) | ||
Michigan (continued) | ||
Michigan Finance Authority, Wayne County Criminal Justice Center Project, Revenue Bonds, Senior Lien | ||
4.00%, due 11/1/48 | $ 6,750,000 | $ 6,812,415 |
Michigan Finance Authority, Great Lakes Water Authority Sewage Disposal System, Revenue Bonds | ||
Series C | ||
5.00%, due 7/1/34 | 1,000,000 | 1,064,332 |
Series C | ||
5.00%, due 7/1/35 | 2,000,000 | 2,128,040 |
Michigan Finance Authority, Local Government Loan Program, Revenue Bonds | ||
Series D-4 | ||
5.00%, due 7/1/34 | 1,000,000 | 1,040,056 |
Michigan Finance Authority, College for Creative Studies, Revenue Bonds | ||
5.00%, due 12/1/36 | 1,000,000 | 1,013,052 |
5.00%, due 12/1/40 | 1,700,000 | 1,717,596 |
5.00%, due 12/1/45 | 4,450,000 | 4,483,565 |
Michigan Finance Authority, Lawrence Technological University, Revenue Bonds | ||
5.00%, due 2/1/37 | 1,550,000 | 1,605,383 |
5.25%, due 2/1/32 | 3,600,000 | 3,783,414 |
Michigan Finance Authority, Local Government Loan Program, Public Lightning Local Project, Revenue Bonds | ||
Series B | ||
5.00%, due 7/1/44 | 4,000,000 | 4,061,675 |
Michigan Finance Authority, Landmark Academy, Revenue Bonds | ||
5.00%, due 6/1/45 | 2,920,000 | 2,719,485 |
Michigan Finance Authority, Presbyterian Villages of Michigan Obligated Group, Revenue Bonds | ||
5.50%, due 11/15/45 | 1,025,000 | 1,032,488 |
Principal Amount | Value | |
Michigan (continued) | ||
Michigan Finance Authority, Universal Learning Academy, Revenue Bonds | ||
5.75%, due 11/1/40 | $ 2,630,000 | $ 2,735,278 |
Michigan Finance Authority, Public School Academy-Voyageur, Revenue Bonds | ||
5.90%, due 7/15/46 (a) | 1,960,000 | 1,608,256 |
Michigan Municipal Bond Authority, Local Government Loan Program, Revenue Bonds | ||
Series A, Insured: AMBAC | ||
4.50%, due 5/1/31 | 305,000 | 298,597 |
Michigan Strategic Fund, Holland Home Obligated Group, Revenue Bonds | ||
5.00%, due 11/15/42 | 6,015,000 | 6,251,932 |
Michigan Strategic Fund, I-75 Improvement Project, Revenue Bonds (b) | ||
5.00%, due 12/31/43 | 1,500,000 | 1,538,716 |
5.00%, due 6/30/48 | 17,600,000 | 17,980,915 |
Michigan Tobacco Settlement Finance Authority, Tobacco Settlement Asset-Backed, Capital Appreciation, Revenue Bonds | ||
Series B | ||
(zero coupon), due 6/1/46 | 284,930,000 | 32,127,909 |
Series B | ||
(zero coupon), due 6/1/52 | 23,420,000 | 2,591,983 |
Series C | ||
(zero coupon), due 6/1/58 | 955,750,000 | 44,423,164 |
Richfield Public School Academy, Revenue Bonds | ||
4.00%, due 9/1/30 | 750,000 | 695,395 |
Summit Academy North, Michigan Public School Academy, Revenue Bonds | ||
4.00%, due 11/1/41 | 2,875,000 | 2,559,087 |
204,294,564 | ||
Principal Amount | Value | |
Long-Term Municipal Bonds (continued) | ||
Minnesota 1.2% | ||
City of Blaine MN, Crest View Senior Communities Project, Revenue Bonds | ||
Series A | ||
6.125%, due 7/1/45 | $ 535,000 | $ 417,857 |
City of Crookston MN, Riverview Healthcare Project, Revenue Bonds | ||
5.00%, due 5/1/51 | 4,000,000 | 3,663,163 |
City of Forest Lake MN, Lakes International Language Academy Project, Revenue Bonds | ||
Series A | ||
5.375%, due 8/1/50 | 1,250,000 | 1,288,817 |
City of Ham Lake MN, Parnassus Preparatory School Project, Revenue Bonds | ||
Series A | ||
5.00%, due 11/1/47 | 3,500,000 | 3,542,087 |
City of Independence MN, Global Academy Project, Revenue Bonds | ||
Series A | ||
4.00%, due 7/1/51 | 1,400,000 | 1,167,490 |
Series A | ||
4.00%, due 7/1/56 | 1,080,000 | 881,230 |
City of Minneapolis MN, Twin Cities International School Project, Revenue Bonds | ||
Series A | ||
5.00%, due 12/1/47 (a) | 3,835,000 | 3,851,511 |
City of Rochester MN, Samaritan Bethany, Inc. Project, Revenue Bonds | ||
Series A | ||
5.00%, due 8/1/48 | 2,000,000 | 1,909,862 |
City of St Paul MN, Healtheast Care System Project, Revenue Bonds | ||
Series A | ||
5.00%, due 11/15/29 | 1,745,000 | 1,891,029 |
Series A | ||
5.00%, due 11/15/40 | 1,775,000 | 1,923,539 |
Principal Amount | Value | |
Minnesota (continued) | ||
Duluth Economic Development Authority, Essentia Health Obligated Group, Revenue Bonds | ||
Series A | ||
5.00%, due 2/15/48 | $ 8,300,000 | $ 8,978,926 |
Series A | ||
5.00%, due 2/15/53 | 25,550,000 | 27,553,212 |
Series A | ||
5.25%, due 2/15/58 | 49,405,000 | 54,354,768 |
Duluth Economic Development Authority, St. Luke's Hospital of Duluth, Revenue Bonds | ||
Series B | ||
5.25%, due 6/15/42 | 4,000,000 | 4,243,720 |
Series B | ||
5.25%, due 6/15/47 | 3,000,000 | 3,160,680 |
Series B | ||
5.25%, due 6/15/52 | 5,000,000 | 5,243,300 |
Duluth Economic Development Authority, Cambia Hills of Bethel Project, Revenue Bonds | ||
5.625%, due 12/1/55 (e)(f)(g) | 6,000,000 | 1,440,000 |
Minnesota Higher Education Facilities Authority, Augsburg College, Revenue Bonds | ||
Series A | ||
5.00%, due 5/1/46 | 325,000 | 325,815 |
125,837,006 | ||
Mississippi 0.0% ‡ | ||
Mississippi Business Finance Corp., System Energy Resources, Inc. Project, Revenue Bonds | ||
2.375%, due 6/1/44 | 7,750,000 | 5,536,142 |
Missouri 0.4% | ||
Branson Industrial Development Authority, Tax Increment, Branson Landing-Retail Project, Tax Allocation | ||
5.50%, due 6/1/29 | 3,225,000 | 3,028,498 |
Cape Girardeau County Industrial Development Authority, Southeast Health, Revenue Bonds | ||
4.00%, due 3/1/41 | 2,225,000 | 2,171,930 |
40 | MainStay MacKay High Yield Municipal Bond Fund |
Principal Amount | Value | |
Long-Term Municipal Bonds (continued) | ||
Missouri (continued) | ||
City of Lees Summit MO, Department of Airports, Summit Fair Project, Tax Allocation | ||
4.875%, due 11/1/37 (a) | $ 3,045,000 | $ 2,595,467 |
Health & Educational Facilities Authority of the State of Missouri, Maryville University of St. Louis, Revenue Bonds | ||
Series A | ||
4.00%, due 6/15/41 | 3,300,000 | 3,308,269 |
Series A | ||
5.00%, due 6/15/45 | 3,520,000 | 3,720,021 |
Health & Educational Facilities Authority of the State of Missouri, Lutheran Senior Services Project, Revenue Bonds | ||
4.00%, due 2/1/42 | 3,750,000 | 3,581,869 |
Health & Educational Facilities Authority of the State of Missouri, AT Still University of Health Sciences, Revenue Bonds | ||
Series A | ||
4.00%, due 10/1/43 | 1,125,000 | 1,137,961 |
Health & Educational Facilities Authority of the State of Missouri, Lake Regional Health System, Revenue Bonds | ||
4.00%, due 2/15/51 | 2,125,000 | 2,012,517 |
Health & Educational Facilities Authority of the State of Missouri, Capital Region Medical Center, Revenue Bonds | ||
5.00%, due 11/1/40 | 2,000,000 | 2,201,331 |
Kansas City Land Clearance Redevelopment Authority, Convention Center Hotel Project, Tax Allocation | ||
Series B | ||
5.00%, due 2/1/50 (a) | 4,700,000 | 3,860,400 |
Principal Amount | Value | |
Missouri (continued) | ||
Lees Summit Industrial Development Authority, Fair Community Improvement District, Special Assessment | ||
5.00%, due 5/1/35 | $ 1,010,000 | $ 946,597 |
6.00%, due 5/1/42 | 2,800,000 | 2,614,928 |
Maryland Heights Industrial Development Authority, St. Louis Community Ice Center Project, Revenue Bonds | ||
Series A | ||
5.00%, due 3/15/49 | 7,500,000 | 6,354,947 |
St. Louis County Industrial Development Authority, Nazareth Living Center Project, Revenue Bonds | ||
Series A | ||
5.125%, due 8/15/45 | 1,900,000 | 1,871,624 |
St. Louis Land Clearance for Redevelopment Authority, Scottrade Center Project, Revenue Bonds | ||
Series A | ||
5.00%, due 4/1/48 | 3,250,000 | 3,483,110 |
42,889,469 | ||
Montana 0.2% | ||
County of Gallatin MT, Bozeman Fiber Project, Revenue Bonds (a) | ||
Series A | ||
4.00%, due 10/15/46 | 3,000,000 | 2,468,410 |
Series A | ||
4.00%, due 10/15/51 | 4,000,000 | 3,177,361 |
Montana Facility Finance Authority, Montana Children's Home and Hospital, Revenue Bonds | ||
Series A | ||
4.00%, due 7/1/50 | 9,750,000 | 9,250,536 |
Montana Facility Finance Authority, Kalispell Regional Medical Center, Revenue Bonds | ||
Series B | ||
5.00%, due 7/1/48 | 5,515,000 | 5,838,628 |
20,734,935 | ||
Principal Amount | Value | |
Long-Term Municipal Bonds (continued) | ||
Nevada 0.2% | ||
City of Reno NV, Sales Tax, Transportation Rail Access Corridor Project, Revenue Bonds | ||
Series C | ||
(zero coupon), due 7/1/58 (a) | $ 17,000,000 | $ 1,916,718 |
City of Reno NV, Sales Tax, Transportation Rail Access Corridor Project, Revenue Bonds, First Lien | ||
Series A | ||
4.00%, due 6/1/43 | 2,500,000 | 2,442,272 |
City of Reno NV, Sales Tax, Revenue Bonds | ||
Series D | ||
(zero coupon), due 7/1/58 (a) | 9,000,000 | 854,147 |
Las Vegas Convention & Visitors Authority, Revenue Bonds | ||
Series B | ||
4.00%, due 7/1/39 | 4,460,000 | 4,592,061 |
Series B | ||
4.00%, due 7/1/40 | 4,390,000 | 4,526,292 |
Las Vegas Redevelopment Agency, Tax Allocation | ||
5.00%, due 6/15/45 | 2,750,000 | 2,865,730 |
State of Nevada Department of Business & Industry, Somerset Academy of Las Vegas, Revenue Bonds (a) | ||
Series A | ||
5.00%, due 12/15/38 | 1,000,000 | 1,031,279 |
Series A | ||
5.00%, due 12/15/48 | 3,465,000 | 3,530,168 |
Tahoe-Douglas Visitors Authority, Revenue Bonds | ||
5.00%, due 7/1/34 | 2,000,000 | 2,088,350 |
5.00%, due 7/1/40 | 2,500,000 | 2,585,624 |
26,432,641 | ||
New Hampshire 0.3% | ||
Manchester Housing and Redevelopment Authority, Inc., Revenue Bonds | ||
Series B, Insured: ACA | ||
(zero coupon), due 1/1/26 | 1,995,000 | 1,718,306 |
Principal Amount | Value | |
New Hampshire (continued) | ||
Manchester Housing and Redevelopment Authority, Inc., Meals & Rooms Tax, Revenue Bonds | ||
Series B, Insured: ACA | ||
(zero coupon), due 1/1/27 | $ 2,380,000 | $ 1,959,027 |
New Hampshire Business Finance Authority, St. Luke's University Health Network, Revenue Bonds | ||
Series B, Insured: AGM | ||
3.00%, due 8/15/51 | 10,350,000 | 7,851,391 |
New Hampshire Business Finance Authority, Springpoint Senior Living Project, Revenue Bonds | ||
4.00%, due 1/1/41 | 3,175,000 | 3,053,479 |
4.00%, due 1/1/51 | 4,600,000 | 4,196,874 |
New Hampshire Business Finance Authority, Ascentria Care Alliance Project, Revenue Bonds | ||
5.00%, due 7/1/51 (a) | 2,000,000 | 1,801,927 |
New Hampshire Business Finance Authority, The Vista Project, Revenue Bonds | ||
Series A | ||
5.75%, due 7/1/54 (a) | 1,500,000 | 1,459,185 |
New Hampshire Health and Education Facilities Authority Act, Catholic Medical Center, Revenue Bonds | ||
5.00%, due 7/1/44 | 3,000,000 | 3,189,825 |
New Hampshire Health and Education Facilities Authority Act, Kendal at Hanover, Revenue Bonds | ||
5.00%, due 10/1/46 | 1,800,000 | 1,880,210 |
27,110,224 | ||
New Jersey 4.2% | ||
Camden County Improvement Authority (The), Camden School Prep Project, Revenue Bonds | ||
5.00%, due 7/15/52 (a) | 2,000,000 | 2,023,989 |
42 | MainStay MacKay High Yield Municipal Bond Fund |
Principal Amount | Value | |
Long-Term Municipal Bonds (continued) | ||
New Jersey (continued) | ||
City of Atlantic City NJ, Unlimited General Obligation | ||
Insured: AGM | ||
4.00%, due 11/1/26 | $ 805,000 | $ 811,735 |
Essex County Improvement Authority, New Jersey Institute of Technology, NIJIT Student Housing Project, Revenue Bonds | ||
Series A, Insured: BAM | ||
4.00%, due 8/1/51 | 1,500,000 | 1,461,302 |
Series A, Insured: BAM | ||
4.00%, due 8/1/56 | 2,600,000 | 2,524,225 |
Series A, Insured: BAM | ||
4.00%, due 8/1/60 | 2,250,000 | 2,172,857 |
Essex County Improvement Authority, North Star Academy Charter School of New York Inc. Project, Revenue Bonds (a) | ||
4.00%, due 7/15/60 | 11,955,000 | 10,140,039 |
Series A | ||
4.00%, due 8/1/60 | 3,755,000 | 3,184,692 |
New Jersey Economic Development Authority, Motor Vehicle Surcharge, Revenue Bonds | ||
Series A | ||
4.00%, due 7/1/34 | 1,000,000 | 991,024 |
New Jersey Economic Development Authority, New Jersey Transit Transportation Project, Revenue Bonds | ||
Series A | ||
4.00%, due 11/1/39 | 2,000,000 | 1,945,921 |
Series A | ||
4.00%, due 11/1/44 | 11,250,000 | 10,728,720 |
Series A | ||
5.00%, due 11/1/35 | 9,750,000 | 10,481,604 |
Series A | ||
5.00%, due 11/1/36 | 3,500,000 | 3,753,794 |
New Jersey Economic Development Authority, School Facilities Construction, Revenue Bonds | ||
Series QQQ | ||
4.00%, due 6/15/50 | 7,715,000 | 7,188,085 |
Principal Amount | Value | |
New Jersey (continued) | ||
New Jersey Economic Development Authority, School Facilities Construction, Revenue Bonds (continued) | ||
Series LLL | ||
5.00%, due 6/15/44 | $ 1,000,000 | $ 1,050,368 |
Series LLL | ||
5.00%, due 6/15/49 | 6,840,000 | 7,161,574 |
New Jersey Economic Development Authority, Revenue Bonds | ||
Series A | ||
5.00%, due 7/1/33 | 1,765,000 | 1,883,776 |
New Jersey Economic Development Authority, Provident Group-Kean Properties LLC, Revenue Bonds | ||
Series A | ||
5.00%, due 7/1/37 | 500,000 | 505,765 |
Series A | ||
5.00%, due 1/1/50 | 3,100,000 | 3,090,573 |
New Jersey Economic Development Authority, State Government Buildings Project, Revenue Bonds | ||
Series C | ||
5.00%, due 6/15/42 | 8,960,000 | 9,455,672 |
New Jersey Economic Development Authority, Port Newark Container Terminal LLC, Revenue Bonds | ||
5.00%, due 10/1/47 (b) | 9,750,000 | 10,181,252 |
New Jersey Economic Development Authority, Provident Group-Rowan Properties LLC, Revenue Bonds | ||
Series A | ||
5.00%, due 1/1/48 | 12,110,000 | 11,734,123 |
New Jersey Economic Development Authority, The Goethals Bridge Replacement Project, Revenue Bonds (b) | ||
5.125%, due 1/1/34 | 3,000,000 | 3,083,692 |
Insured: AGM | ||
5.125%, due 7/1/42 | 1,705,000 | 1,753,704 |
5.375%, due 1/1/43 | 2,000,000 | 2,056,283 |
Principal Amount | Value | |
Long-Term Municipal Bonds (continued) | ||
New Jersey (continued) | ||
New Jersey Economic Development Authority, UMM Energy Partners LLC, Revenue Bonds | ||
Series A | ||
5.125%, due 6/15/43 (b) | $ 2,000,000 | $ 2,004,221 |
New Jersey Economic Development Authority, United Airlines, Inc., Revenue Bonds | ||
5.25%, due 9/15/29 | 10,170,000 | 10,319,131 |
New Jersey Economic Development Authority, Continental Airlines, Inc. Project, Revenue Bonds | ||
Series B | ||
5.625%, due 11/15/30 (b) | 14,685,000 | 15,384,968 |
New Jersey Economic Development Authority, Team Academy Charter School Project, Revenue Bonds | ||
6.00%, due 10/1/43 | 2,055,000 | 2,117,737 |
New Jersey Educational Facilities Authority, St Elizabeth University, Revenue Bonds | ||
Series D | ||
5.00%, due 7/1/46 | 2,190,000 | 2,198,009 |
New Jersey Health Care Facilities Financing Authority, University Hospital, Revenue Bonds | ||
Series A, Insured: AGM | ||
5.00%, due 7/1/46 | 3,750,000 | 3,910,761 |
New Jersey Health Care Facilities Financing Authority, St. Peter's University Hospital, Revenue Bonds | ||
5.75%, due 7/1/37 | 2,520,000 | 2,524,988 |
6.25%, due 7/1/35 | 2,725,000 | 2,730,250 |
New Jersey Transportation Trust Fund Authority, Transportation System, Revenue Bonds | ||
Series 2020AA | ||
4.00%, due 6/15/36 | 2,750,000 | 2,707,749 |
Series 2020AA | ||
4.00%, due 6/15/39 | 11,500,000 | 11,193,233 |
Series AA | ||
4.00%, due 6/15/45 | 31,755,000 | 30,168,647 |
Principal Amount | Value | |
New Jersey (continued) | ||
New Jersey Transportation Trust Fund Authority, Transportation System, Revenue Bonds (continued) | ||
Series 2020AA | ||
4.00%, due 6/15/50 | $ 29,135,000 | $ 27,145,129 |
New Jersey Transportation Trust Fund Authority, Transportation Program, Revenue Bonds | ||
Series BB | ||
4.00%, due 6/15/39 | 3,150,000 | 3,065,972 |
Series BB | ||
4.00%, due 6/15/40 | 11,700,000 | 11,342,670 |
Series BB | ||
4.00%, due 6/15/41 | 11,800,000 | 11,394,855 |
Series BB | ||
4.00%, due 6/15/42 | 12,450,000 | 11,978,482 |
Series BB | ||
4.00%, due 6/15/50 | 7,245,000 | 6,750,179 |
New Jersey Transportation Trust Fund Authority, Revenue Bonds | ||
Series BB | ||
4.00%, due 6/15/46 | 28,810,000 | 27,217,452 |
Series BB | ||
4.00%, due 6/15/50 | 4,855,000 | 4,523,412 |
Series AA | ||
5.00%, due 6/15/45 | 5,790,000 | 6,128,683 |
Series AA | ||
5.00%, due 6/15/50 | 4,415,000 | 4,656,874 |
New Jersey Turnpike Authority, Revenue Bonds | ||
Series E | ||
5.00%, due 1/1/45 | 8,580,000 | 8,967,326 |
South Jersey Port Corp., Marine Terminal, Revenue Bonds (b) | ||
Series B | ||
5.00%, due 1/1/42 | 16,150,000 | 16,705,033 |
Series B | ||
5.00%, due 1/1/48 | 10,460,000 | 10,738,582 |
South Jersey Port Corp., Revenue Bonds | ||
Series A | ||
5.00%, due 1/1/49 | 12,155,000 | 12,627,511 |
South Jersey Transportation Authority, Revenue Bonds | ||
Series A | ||
4.00%, due 11/1/50 | 24,400,000 | 23,808,554 |
44 | MainStay MacKay High Yield Municipal Bond Fund |
Principal Amount | Value | |
Long-Term Municipal Bonds (continued) | ||
New Jersey (continued) | ||
South Jersey Transportation Authority, Revenue Bonds (continued) | ||
Series A | ||
5.00%, due 11/1/39 | $ 500,000 | $ 517,643 |
Series A | ||
5.00%, due 11/1/45 | 10,250,000 | 11,033,392 |
Tobacco Settlement Financing Corp., Revenue Bonds | ||
Series A | ||
5.00%, due 6/1/46 | 9,965,000 | 10,473,769 |
Series B | ||
5.00%, due 6/1/46 | 37,800,000 | 39,467,865 |
443,167,846 | ||
New Mexico 0.1% | ||
City of Santa Fe NM, El Castillo Retirement Residences Project, Revenue Bonds | ||
Series B-1 | ||
2.625%, due 5/15/25 | 1,000,000 | 984,919 |
New Mexico Hospital Equipment Loan Council, Improvement and Refunding, Gerald Champion, Revenue Bonds | ||
Series 2012A | ||
5.50%, due 7/1/42 | 7,000,000 | 7,034,774 |
8,019,693 | ||
New York 7.9% | ||
Brooklyn Arena Local Development Corp., Barclays Center Project, Revenue Bonds | ||
Series A, Insured: AGM | ||
3.00%, due 7/15/43 | 2,135,000 | 1,794,855 |
Build NYC Resource Corp., Pratt Paper, Inc. Project, Revenue Bonds | ||
5.00%, due 1/1/35 (a)(b) | 1,500,000 | 1,541,246 |
Build NYC Resource Corp., Metropolitan Lighthouse Charter School Project, Revenue Bonds | ||
Series A | ||
5.00%, due 6/1/47 (a) | 1,225,000 | 1,249,698 |
Principal Amount | Value | |
New York (continued) | ||
Build NYC Resource Corp., Hellenic Classical Charter Schools, Revenue Bonds | ||
Series A | ||
5.00%, due 12/1/51 (a) | $ 2,125,000 | $ 2,143,547 |
City of New Rochelle NY, Iona College Project, Revenue Bonds | ||
Series A | ||
5.00%, due 7/1/40 | 3,455,000 | 3,625,219 |
City of Newburgh NY, Limited General Obligation | ||
Series A | ||
5.00%, due 6/15/26 | 960,000 | 964,259 |
Series A | ||
5.50%, due 6/15/31 | 750,000 | 753,763 |
Dutchess County Local Development Corp., Bard College Project, Revenue Bonds | ||
Series A | ||
5.00%, due 7/1/51 (a) | 6,700,000 | 6,954,125 |
Erie Tobacco Asset Securitization Corp., Tobacco Settlement, Asset-Backed, Revenue Bonds | ||
Series B | ||
(zero coupon), due 6/1/47 | 38,000,000 | 7,834,487 |
Huntington Local Development Corp., Fountaingate Gardens Project, Revenue Bonds | ||
Series B | ||
4.00%, due 7/1/27 | 5,750,000 | 5,549,250 |
Series A | ||
5.25%, due 7/1/56 | 3,160,000 | 3,067,031 |
Jefferson County Civic Facility Development Corp., Samaritan Medical Center Project, Revenue Bonds | ||
Series A | ||
4.00%, due 11/1/42 | 3,605,000 | 3,387,470 |
Metropolitan Transportation Authority, Revenue Bonds | ||
Series A-2 | ||
4.00%, due 11/15/43 | 13,750,000 | 13,351,441 |
Series D-1 | ||
5.00%, due 9/1/22 | 4,750,000 | 4,799,180 |
Series F | ||
5.00%, due 11/15/22 | 16,900,000 | 17,159,540 |
Principal Amount | Value | |
Long-Term Municipal Bonds (continued) | ||
New York (continued) | ||
Metropolitan Transportation Authority, Revenue Bonds (continued) | ||
Series A-1 | ||
5.00%, due 2/1/23 | $ 9,750,000 | $ 9,923,864 |
Series D | ||
5.00%, due 11/15/27 | 2,055,000 | 2,207,717 |
Series F | ||
5.00%, due 11/15/30 | 10,010,000 | 10,150,703 |
Series B | ||
5.00%, due 11/15/40 | 14,750,000 | 15,261,877 |
Metropolitan Transportation Authority, Green Bond, Revenue Bonds | ||
Series E | ||
4.00%, due 11/15/45 | 21,925,000 | 21,167,831 |
Series A-1 | ||
4.00%, due 11/15/46 | 21,445,000 | 20,622,820 |
Series A-1 | ||
4.00%, due 11/15/47 | 9,600,000 | 9,195,132 |
Series D-2 | ||
4.00%, due 11/15/47 | 7,000,000 | 6,704,783 |
Series A-1 | ||
4.00%, due 11/15/48 | 10,400,000 | 9,924,535 |
Series D | ||
4.00%, due 11/15/48 | 12,000,000 | 11,451,386 |
Series A-1 | ||
4.00%, due 11/15/49 | 7,010,000 | 6,672,690 |
Series B, Insured: AGM | ||
4.00%, due 11/15/49 | 8,550,000 | 8,378,612 |
Series D-3 | ||
4.00%, due 11/15/49 | 14,750,000 | 14,040,254 |
Series A-1 | ||
4.00%, due 11/15/50 | 27,800,000 | 26,400,415 |
Series A-1, Insured: AGM | ||
4.00%, due 11/15/54 | 20,285,000 | 19,744,238 |
Series A-2 | ||
5.00%, due 11/15/27 | 3,150,000 | 3,384,611 |
Series B | ||
5.00%, due 11/15/28 | 1,190,000 | 1,292,560 |
Series C | ||
5.00%, due 11/15/42 | 5,120,000 | 5,394,963 |
Series D | ||
5.00%, due 11/15/45 | 25,400,000 | 26,634,636 |
Principal Amount | Value | |
New York (continued) | ||
Monroe County Industrial Development Corp., St. Ann's Community Project, Revenue Bonds | ||
5.00%, due 1/1/40 | $ 3,000,000 | $ 2,749,130 |
MTA Hudson Rail Yards Trust Obligations, Election 2016, Revenue Bonds | ||
Series A | ||
5.00%, due 11/15/56 | 7,150,000 | 7,331,857 |
Nassau County Tobacco Settlement Corp., Tobacco Settlement, Asset-Backed, Revenue Bonds | ||
Series A-3 | ||
5.00%, due 6/1/35 | 2,075,000 | 2,101,078 |
Series A-3 | ||
5.125%, due 6/1/46 | 12,855,000 | 13,051,529 |
New York City Educational Construction Fund, Revenue Bonds | ||
Series B, Insured: State Intercept | ||
5.00%, due 4/1/52 | 5,035,000 | 5,468,067 |
New York City Industrial Development Agency, Queens Baseball Stadium Project, Revenue Bonds | ||
Series A, Insured: AGM | ||
3.00%, due 1/1/46 | 4,555,000 | 3,697,837 |
New York City Industrial Development Agency, Yankee Stadium Project, Revenue Bonds | ||
Series A | ||
3.00%, due 3/1/49 | 12,800,000 | 9,846,902 |
Series A, Insured: AGM | ||
3.00%, due 3/1/49 | 9,810,000 | 7,741,522 |
Series A, Insured: AGM-CR | ||
3.00%, due 3/1/49 | 5,000,000 | 3,945,730 |
New York Convention Center Development Corp., Hotel Unit Fee, Revenue Bonds, Senior Lien | ||
Series A | ||
(zero coupon), due 11/15/47 | 10,000,000 | 2,695,649 |
46 | MainStay MacKay High Yield Municipal Bond Fund |
Principal Amount | Value | |
Long-Term Municipal Bonds (continued) | ||
New York (continued) | ||
New York Counties Tobacco Trust V, Pass Through, Capital Appreciation, Revenue Bonds | ||
Series S | ||
(zero coupon), due 6/1/38 | $ 2,500,000 | $ 966,687 |
New York Liberty Development Corp., 1 World Trade Center, Revenue Bonds | ||
Insured: BAM | ||
2.75%, due 2/15/44 | 14,750,000 | 11,534,186 |
New York Liberty Development Corp., Green Bond, Revenue Bonds | ||
Series A, Insured: BAM | ||
3.00%, due 11/15/51 | 9,250,000 | 7,249,752 |
New York Liberty Development Corp., 3 World Trade Center LLC, Revenue Bonds (a) | ||
Class 1 | ||
5.00%, due 11/15/44 | 2,000,000 | 2,021,272 |
Class 2 | ||
5.15%, due 11/15/34 | 4,150,000 | 4,249,761 |
Class 2 | ||
5.375%, due 11/15/40 | 6,200,000 | 6,352,276 |
Class 3 | ||
7.25%, due 11/15/44 | 10,200,000 | 10,437,637 |
New York State Dormitory Authority, State Personal Income Tax, Revenue Bonds | ||
Series A | ||
3.00%, due 3/15/49 | 9,750,000 | 8,016,041 |
Series A | ||
4.00%, due 3/15/48 | 7,250,000 | 7,206,035 |
New York State Dormitory Authority, Montefiore Obligated Group, Revenue Bonds | ||
Series A | ||
4.00%, due 8/1/37 | 3,250,000 | 3,120,231 |
Series A | ||
4.00%, due 8/1/38 | 1,750,000 | 1,672,088 |
Series A | ||
5.00%, due 8/1/32 | 3,935,000 | 4,125,448 |
Series A | ||
5.00%, due 8/1/35 | 2,350,000 | 2,454,737 |
Principal Amount | Value | |
New York (continued) | ||
New York State Dormitory Authority, NYU Langone Hospitals Obligated Group, Revenue Bonds | ||
Series A | ||
4.00%, due 7/1/50 | $ 8,550,000 | $ 8,274,596 |
New York State Dormitory Authority, Orange Regional Medical Center Obligated Group, Revenue Bonds (a) | ||
5.00%, due 12/1/29 | 1,000,000 | 1,097,373 |
5.00%, due 12/1/30 | 1,200,000 | 1,313,713 |
New York State Dormitory Authority, Touro College and University System Obligated Group, Revenue Bonds | ||
5.00%, due 1/1/47 | 8,750,000 | 8,874,260 |
New York State Thruway Authority, State of New York Personal Income Tax, Revenue Bonds | ||
Series A-1 | ||
3.00%, due 3/15/48 | 8,600,000 | 6,999,526 |
Series A-1 | ||
3.00%, due 3/15/51 | 9,000,000 | 7,212,232 |
New York State Thruway Authority, Personal Income Tax, Revenue Bonds | ||
Series A-1 | ||
4.00%, due 3/15/54 | 15,075,000 | 14,780,962 |
New York State Thruway Authority, State Personal Income Tax, Revenue Bonds | ||
Series A-1 | ||
4.00%, due 3/15/57 | 59,635,000 | 57,776,726 |
New York State Urban Development Corp., Personal Income Tax, Revenue Bonds | ||
Series E | ||
3.00%, due 3/15/47 | 4,750,000 | 3,908,159 |
New York Transportation Development Corp., Delta Air Lines, Inc. - LaGuardia Airport Terminals C&D Redevelopment Project, Revenue Bonds (b) | ||
4.375%, due 10/1/45 | 48,160,000 | 46,260,290 |
5.00%, due 10/1/35 | 10,750,000 | 11,388,956 |
Principal Amount | Value | |
Long-Term Municipal Bonds (continued) | ||
New York (continued) | ||
New York Transportation Development Corp., Delta Air Lines, Inc. - LaGuardia Airport Terminals C&D Redevelopment Project, Revenue Bonds (b) (continued) | ||
5.00%, due 10/1/40 | $ 41,740,000 | $ 43,782,405 |
New York Transportation Development Corp., Terminal 4 JFK International Airport Project, Revenue Bonds (b) | ||
5.00%, due 12/1/35 | 18,500,000 | 19,501,126 |
5.00%, due 12/1/36 | 10,000,000 | 10,517,369 |
5.00%, due 12/1/38 | 15,500,000 | 16,245,052 |
5.00%, due 12/1/40 | 13,500,000 | 14,116,901 |
5.00%, due 12/1/41 | 10,000,000 | 10,456,270 |
New York Transportation Development Corp., American Airlines, Inc. John F. Kennedy International Airport Project, Revenue Bonds (b) | ||
5.25%, due 8/1/31 | 4,475,000 | 4,732,078 |
5.375%, due 8/1/36 | 6,220,000 | 6,835,618 |
New York Transportation Development Corp., LaGuardia Airport Terminal B Redevelopment Project, Revenue Bonds | ||
Series A | ||
5.25%, due 1/1/50 (b) | 34,360,000 | 35,363,979 |
Oneida County Local Development Corp., Mohawk Valley Health System Project, Revenue Bonds | ||
Series A, Insured: AGM | ||
3.00%, due 12/1/40 | 3,755,000 | 3,296,580 |
Series A, Insured: AGM | ||
3.00%, due 12/1/44 | 6,500,000 | 5,633,223 |
Orange County Funding Corp., Mount St. Mary College, Revenue Bonds | ||
Series A | ||
5.00%, due 7/1/42 | 1,430,000 | 1,432,227 |
Port Authority of New York & New Jersey, Revenue Bonds | ||
Series 223 | ||
4.00%, due 7/15/51 (b) | 18,475,000 | 17,667,225 |
Principal Amount | Value | |
New York (continued) | ||
Riverhead Industrial Development Agency, Riverhead Charter School, Revenue Bonds | ||
Series A | ||
7.00%, due 8/1/43 | $ 1,500,000 | $ 1,555,912 |
Rockland Tobacco Asset Securitization Corp., Tobacco Settlement, Asset-Backed, Revenue Bonds | ||
Series B | ||
(zero coupon), due 8/15/50 (a) | 13,000,000 | 2,058,013 |
Southold Local Development Corp., Peconic Landing, Inc. Project, Revenue Bonds | ||
4.00%, due 12/1/45 | 815,000 | 781,304 |
Suffolk Tobacco Asset Securitization Corp., Tobacco Settlement, Asset Backed, Revenue Bonds | ||
Series B-2 | ||
(zero coupon), due 6/1/66 | 55,140,000 | 6,253,146 |
Tompkins County Development Corp., Kendal at Ithaca Project, Revenue Bonds | ||
Series 2014A | ||
5.00%, due 7/1/44 | 915,000 | 945,215 |
Triborough Bridge & Tunnel Authority, Payroll Mobility Tax, Revenue Bonds, Senior Lien | ||
Series C-3 | ||
3.00%, due 5/15/51 | 43,645,000 | 35,309,870 |
Westchester County Local Development Corp., Pace University, Revenue Bonds | ||
Series A | ||
5.50%, due 5/1/42 | 5,955,000 | 6,159,032 |
841,293,528 | ||
North Carolina 0.7% | ||
North Carolina Department of Transportation, I-77 Hot Lanes Project, Revenue Bonds | ||
5.00%, due 6/30/54 (b) | 9,750,000 | 9,877,101 |
North Carolina Medical Care Commission, The Forest at Duke Project, Revenue Bonds | ||
4.00%, due 9/1/41 | 1,320,000 | 1,302,438 |
4.00%, due 9/1/46 | 2,085,000 | 2,015,560 |
48 | MainStay MacKay High Yield Municipal Bond Fund |
Principal Amount | Value | |
Long-Term Municipal Bonds (continued) | ||
North Carolina (continued) | ||
North Carolina Medical Care Commission, Lutheran Services for the Aging, Revenue Bonds | ||
Series A | ||
4.00%, due 3/1/51 | $ 1,750,000 | $ 1,353,699 |
North Carolina Medical Care Commission, Plantation Village, Inc., Revenue Bonds | ||
Series A | ||
4.00%, due 1/1/52 | 3,500,000 | 3,280,175 |
North Carolina Medical Care Commission, United Methodist Retirement Homes, Revenue Bonds | ||
Series A | ||
5.00%, due 10/1/47 | 3,850,000 | 4,103,827 |
North Carolina Medical Care Commission, Pines at Davidson Project (The), Revenue Bonds | ||
Series A | ||
5.00%, due 1/1/49 | 4,250,000 | 4,469,772 |
North Carolina Medical Care Commission, Sharon Towers, Revenue Bonds | ||
Series A | ||
5.00%, due 7/1/49 | 1,500,000 | 1,516,996 |
North Carolina Turnpike Authority, Triangle Expressway System, Revenue Bonds, Senior Lien | ||
Insured: AGM | ||
3.00%, due 1/1/42 | 2,800,000 | 2,339,278 |
5.00%, due 1/1/49 | 24,400,000 | 25,982,948 |
Insured: AGM | ||
5.00%, due 1/1/49 | 4,750,000 | 5,225,847 |
North Carolina Turnpike Authority, Monroe Expressway Toll, Revenue Bonds | ||
Series A | ||
5.00%, due 7/1/54 | 9,750,000 | 10,169,153 |
71,636,794 | ||
Principal Amount | Value | |
North Dakota 0.4% | ||
City of Grand Forks ND, Altru Health System Obligated Group, Revenue Bonds | ||
Insured: AGM | ||
3.00%, due 12/1/51 | $ 5,250,000 | $ 4,033,211 |
4.00%, due 12/1/46 | 3,955,000 | 3,775,173 |
County of Cass ND, Essentia Health Obligated Group, Revenue Bonds | ||
Series B | ||
5.25%, due 2/15/53 | 9,250,000 | 10,192,076 |
County of Ward ND, Trinity Health Obligated Group, Revenue Bonds | ||
Series C | ||
5.00%, due 6/1/48 | 27,940,000 | 29,575,960 |
47,576,420 | ||
Ohio 4.7% | ||
Akron Bath Copley Joint Township Hospital District, Summa Health System Obligated Group, Revenue Bonds | ||
5.25%, due 11/15/46 | 20,225,000 | 21,434,906 |
Buckeye Tobacco Settlement Financing Authority, Revenue Bonds, Senior Lien | ||
Series A-2, Class 1 | ||
4.00%, due 6/1/48 | 1,500,000 | 1,405,212 |
Series B-2, Class 2 | ||
5.00%, due 6/1/55 | 207,990,000 | 202,592,576 |
Cleveland-Cuyahoga County Port Authority, Euclid Avenue Development Corp. Project, Revenue Bonds | ||
4.00%, due 8/1/44 | 12,420,000 | 12,463,641 |
Cleveland-Cuyahoga County Port Authority, Centers for Dialysis Care Project, Revenue Bonds | ||
Series A | ||
5.00%, due 12/1/42 | 4,955,000 | 5,085,196 |
Series A | ||
5.00%, due 12/1/47 | 1,435,000 | 1,459,323 |
Principal Amount | Value | |
Long-Term Municipal Bonds (continued) | ||
Ohio (continued) | ||
Cleveland-Cuyahoga County Port Authority, Starwood Wasserman University Heights Holding LLC, Revenue Bonds (e)(f)(g) | ||
Series A | ||
7.00%, due 12/1/18 | $ 710,000 | $ 184,600 |
Series A | ||
7.35%, due 12/1/31 | 6,000,000 | 1,560,000 |
County of Cuyahoga OH, MetroHealth System (The), Revenue Bonds | ||
4.75%, due 2/15/47 | 1,440,000 | 1,468,862 |
5.00%, due 2/15/37 | 5,100,000 | 5,422,241 |
5.00%, due 2/15/52 | 6,750,000 | 7,067,725 |
5.00%, due 2/15/57 | 8,360,000 | 8,753,509 |
5.50%, due 2/15/57 | 32,930,000 | 35,639,652 |
County of Cuyahoga OH, MetroHealth System, Revenue Bonds | ||
5.50%, due 2/15/52 | 1,550,000 | 1,677,542 |
County of Hamilton OH, Life Enriching Communities Project, Revenue Bonds | ||
5.00%, due 1/1/42 | 1,080,000 | 1,086,076 |
5.00%, due 1/1/46 | 2,090,000 | 2,129,024 |
County of Hamilton OH, Christ Hospital Project, Revenue Bonds | ||
5.50%, due 6/1/42 | 2,500,000 | 2,508,360 |
County of Lucas OH, Promedica Healthcare Obligated Group, Revenue Bonds | ||
Series A | ||
5.25%, due 11/15/48 | 52,100,000 | 56,346,796 |
County of Montgomery OH, Kettering Health Network Obligated Group, Revenue Bonds | ||
4.00%, due 8/1/51 | 3,265,000 | 3,122,129 |
Franklin County Convention Facilities Authority, Greater Columbus Convention Center Hotel Expansion Project, Revenue Bonds | ||
5.00%, due 12/1/51 | 4,250,000 | 4,283,724 |
Principal Amount | Value | |
Ohio (continued) | ||
Ohio Air Quality Development Authority, Ohio Valley Electric Corp., Revenue Bonds | ||
Series A | ||
3.25%, due 9/1/29 | $ 1,500,000 | $ 1,396,631 |
Ohio Air Quality Development Authority, Pratt Paper LLC Project, Revenue Bonds | ||
4.50%, due 1/15/48 (a)(b) | 10,310,000 | 10,170,186 |
Ohio Higher Educational Facility Commission, Tiffin University Project, Revenue Bonds | ||
4.00%, due 11/1/49 | 4,750,000 | 3,880,757 |
5.00%, due 11/1/44 | 750,000 | 733,843 |
Ohio Higher Educational Facility Commission, University of Findlay (The), Revenue Bonds | ||
5.00%, due 3/1/39 | 1,675,000 | 1,721,678 |
5.00%, due 3/1/44 | 9,360,000 | 9,549,174 |
Ohio Higher Educational Facility Commission, Menorah Park Obligated Group, Revenue Bonds | ||
5.25%, due 1/1/48 | 4,045,000 | 3,360,577 |
Ohio Higher Educational Facility Commission, Cleveland Institute of Art (The), Revenue Bonds | ||
5.25%, due 12/1/48 | 1,000,000 | 1,014,385 |
5.50%, due 12/1/53 | 1,215,000 | 1,245,908 |
State of Ohio, University Hospitals Health System, Inc., Revenue Bonds | ||
Series A | ||
4.00%, due 1/15/46 | 46,710,000 | 45,855,562 |
State of Ohio, University Hospitals Health System, Revenue Bonds | ||
Series A | ||
4.00%, due 1/15/50 | 23,460,000 | 22,823,298 |
Toledo-Lucas County Port Authority, University of Toledo Parking Project, Revenue Bonds | ||
4.00%, due 1/1/57 | 6,250,000 | 5,485,533 |
50 | MainStay MacKay High Yield Municipal Bond Fund |
Principal Amount | Value | |
Long-Term Municipal Bonds (continued) | ||
Ohio (continued) | ||
Toledo-Lucas County Port Authority, University of Toledo Project, Revenue Bonds | ||
Series A | ||
5.00%, due 7/1/34 | $ 1,400,000 | $ 1,430,654 |
Series A | ||
5.00%, due 7/1/39 | 2,000,000 | 2,032,920 |
Series A | ||
5.00%, due 7/1/46 | 9,540,000 | 9,656,377 |
496,048,577 | ||
Oklahoma 0.1% | ||
Norman Regional Hospital Authority, Norman Regional Hospital Authority Obligated Group, Revenue Bonds | ||
4.00%, due 9/1/37 | 2,215,000 | 2,217,449 |
5.00%, due 9/1/37 | 3,500,000 | 3,698,771 |
Oklahoma Development Finance Authority, Provident Oklahoma Education Resources, Inc. Cross Village Student Housing Project, Revenue Bonds (e)(f) | ||
Series A | ||
5.00%, due 8/1/47 | 6,525,171 | 6,525 |
Series A | ||
5.25%, due 8/1/57 | 8,192,966 | 8,193 |
Tulsa County Industrial Authority, Montereau, Inc., Project, Revenue Bonds | ||
5.25%, due 11/15/45 | 1,250,000 | 1,311,669 |
7,242,607 | ||
Oregon 0.1% | ||
Astoria Hospital Facilities Authority, Columbia Memorial Hospital Obligated Group, Revenue Bonds | ||
3.50%, due 8/1/42 | 845,000 | 769,278 |
County of Yamhill OR, George Fox University Project, Revenue Bonds | ||
4.00%, due 12/1/51 | 3,200,000 | 3,069,645 |
Principal Amount | Value | |
Oregon (continued) | ||
Medford Hospital Facilities Authority, Rogue Valley Manor, Revenue Bonds | ||
Series 2013A | ||
5.00%, due 10/1/42 | $ 4,355,000 | $ 4,443,325 |
Oregon State Facilities Authority, Samaritan Health, Revenue Bonds | ||
Series A | ||
5.00%, due 10/1/46 | 190,000 | 208,437 |
Series A | ||
5.00%, due 10/1/46 | 2,810,000 | 2,930,434 |
Oregon State Facilities Authority, College Housing Northwest Project, Revenue Bonds | ||
Series A | ||
5.00%, due 10/1/48 (a) | 1,560,000 | 1,506,703 |
12,927,822 | ||
Pennsylvania 4.1% | ||
Allegheny County Airport Authority, Revenue Bonds (b) | ||
Series A, Insured: AGM | ||
4.00%, due 1/1/46 | 6,525,000 | 6,319,416 |
Series A, Insured: AGM-CR | ||
4.00%, due 1/1/56 | 34,650,000 | 32,689,919 |
Series A | ||
5.00%, due 1/1/51 | 10,250,000 | 10,883,355 |
Allegheny County Hospital Development Authority, Allegheny Health Network Obligated Group, Revenue Bonds | ||
Series A | ||
4.00%, due 4/1/44 | 16,100,000 | 15,976,424 |
Allegheny County Industrial Development Authority, Urban Academy of Greater Pittsburgh Charter School, Revenue Bonds | ||
Series A | ||
4.00%, due 6/15/41 (a) | 1,895,000 | 1,652,767 |
Allegheny County Industrial Development Authority, Propel Charter School - Sunrise, Revenue Bonds | ||
6.00%, due 7/15/38 | 3,100,000 | 3,186,419 |
Principal Amount | Value | |
Long-Term Municipal Bonds (continued) | ||
Pennsylvania (continued) | ||
Allentown Neighborhood Improvement Zone Development Authority, City Center Project, Revenue Bonds (a) | ||
5.00%, due 5/1/42 | $ 12,950,000 | $ 13,588,298 |
5.00%, due 5/1/42 | 14,675,000 | 15,299,656 |
5.125%, due 5/1/32 | 4,300,000 | 4,577,543 |
5.375%, due 5/1/42 | 4,225,000 | 4,495,786 |
Allentown Neighborhood Improvement Zone Development Authority, Revenue Bonds | ||
5.00%, due 5/1/42 | 3,500,000 | 3,773,467 |
6.00%, due 5/1/42 (a) | 4,600,000 | 5,009,891 |
Bucks County Industrial Development Authority, Grand View Hospital Project, Revenue Bonds | ||
4.00%, due 7/1/51 | 10,200,000 | 9,035,988 |
5.00%, due 7/1/40 | 3,155,000 | 3,300,362 |
Cambria County General Financing Authority, St. Francis University, Revenue Bonds | ||
Series TT5 | ||
4.00%, due 4/1/46 | 2,035,000 | 1,817,837 |
Chambersburg Area Municipal Authority, Wilson College, Revenue Bonds | ||
5.50%, due 10/1/33 | 1,230,000 | 1,283,178 |
5.75%, due 10/1/38 | 3,450,000 | 3,605,903 |
5.75%, due 10/1/43 | 2,290,000 | 2,382,220 |
Chester County Industrial Development Authority, Woodlands at Greystone Project, Special Assessment | ||
5.125%, due 3/1/48 (a) | 944,000 | 970,480 |
City of Erie Higher Education Building Authority, Mercyhurst University Project, Revenue Bonds | ||
5.00%, due 9/15/27 | 820,000 | 842,589 |
5.00%, due 9/15/28 | 860,000 | 881,970 |
5.00%, due 9/15/29 | 175,000 | 178,996 |
5.00%, due 9/15/37 | 4,340,000 | 4,349,858 |
Principal Amount | Value | |
Pennsylvania (continued) | ||
City of Harrisburg PA, Capital Appreciation, Unlimited General Obligation | ||
Series F, Insured: AMBAC | ||
(zero coupon), due 9/15/22 | $ 545,000 | $ 534,240 |
Commonwealth Financing Authority, Tobacco Master Settlement Payment, Revenue Bonds | ||
Insured: AGM | ||
4.00%, due 6/1/39 | 13,700,000 | 13,839,619 |
Cumberland County Municipal Authority, Revenue Bonds | ||
Series A | ||
5.00%, due 1/1/39 | 195,000 | 220,874 |
Series A | ||
5.00%, due 1/1/39 | 1,805,000 | 1,930,226 |
Dauphin County General Authority, Harrisburg University Science Technology Project (The), Revenue Bonds (a) | ||
5.00%, due 10/15/34 | 5,850,000 | 5,970,003 |
5.125%, due 10/15/41 | 4,700,000 | 4,790,412 |
5.875%, due 10/15/40 | 3,700,000 | 4,001,327 |
6.25%, due 10/15/53 | 9,250,000 | 10,087,627 |
Delaware County Authority, Cabrini University, Revenue Bonds | ||
5.00%, due 7/1/42 | 1,405,000 | 1,404,564 |
Franklin County Industrial Development Authority, Menno-Haven, Inc. Project, Revenue Bonds | ||
5.00%, due 12/1/39 | 375,000 | 374,116 |
5.00%, due 12/1/49 | 1,020,000 | 987,348 |
General Authority of Southcentral Pennsylvania, York Academy Regional Charter School Project, Revenue Bonds (a) | ||
Series A | ||
6.00%, due 7/15/38 | 3,000,000 | 3,180,936 |
Series A | ||
6.50%, due 7/15/48 | 4,200,000 | 4,497,285 |
Huntingdon County General Authority, AICUP Financing Program, Revenue Bonds | ||
Series 2 | ||
5.00%, due 5/1/46 | 4,005,000 | 4,160,286 |
52 | MainStay MacKay High Yield Municipal Bond Fund |
Principal Amount | Value | |
Long-Term Municipal Bonds (continued) | ||
Pennsylvania (continued) | ||
Lancaster County Hospital Authority, St. Anne's Retirement Community, Inc. Project, Revenue Bonds | ||
5.00%, due 3/1/45 | $ 500,000 | $ 487,343 |
5.00%, due 3/1/50 | 750,000 | 720,556 |
Lancaster Higher Education Authority, Elizabethtown College Project, Revenue Bonds | ||
Series A | ||
5.00%, due 10/1/51 | 3,000,000 | 3,035,161 |
Lancaster Industrial Development Authority, Willow Valley Communities Project, Revenue Bonds | ||
4.00%, due 12/1/44 | 1,550,000 | 1,589,373 |
4.00%, due 12/1/49 | 1,900,000 | 1,935,485 |
5.00%, due 12/1/44 | 1,675,000 | 1,799,423 |
5.00%, due 12/1/49 | 2,365,000 | 2,531,181 |
Lancaster Industrial Development Authority, Landis Homes Retirement Community, Revenue Bonds | ||
4.00%, due 7/1/56 | 2,780,000 | 2,350,738 |
Montgomery County Higher Education and Health Authority, Thomas Jefferson University Project, Revenue Bonds | ||
4.00%, due 9/1/44 | 3,000,000 | 2,959,289 |
4.00%, due 9/1/49 | 16,910,000 | 16,423,264 |
Series A | ||
4.00%, due 9/1/49 | 1,660,000 | 1,612,219 |
4.00%, due 9/1/51 | 4,000,000 | 3,870,298 |
Montgomery County Higher Education and Health Authority, Philadelphia Presbyterian Homes Project, Revenue Bonds | ||
4.00%, due 12/1/48 | 3,995,000 | 3,800,057 |
Montgomery County Higher Education and Health Authority, Thomas Jefferson University, Revenue Bonds | ||
Series B | ||
5.00%, due 5/1/57 | 9,750,000 | 10,538,295 |
Principal Amount | Value | |
Pennsylvania (continued) | ||
Montgomery County Industrial Development Authority, ACTS Retirement-Life Communities, Inc. Obligated Group, Revenue Bonds | ||
5.00%, due 11/15/36 | $ 4,750,000 | $ 5,091,502 |
Montgomery County Industrial Development Authority, Albert Einstein Healthcare Network, Revenue Bonds | ||
Series 2015A | ||
5.25%, due 1/15/45 | 6,050,000 | 6,454,627 |
Series 2015A | ||
5.25%, due 1/15/46 | 1,000,000 | 1,066,881 |
New Wilmington Municipal Authority, Westminster College Project, Revenue Bonds | ||
Series PP1 | ||
5.25%, due 5/1/46 | 3,700,000 | 3,814,543 |
Northeastern Pennsylvania Hospital and Education Authority, King's College Project, Revenue Bonds | ||
5.00%, due 5/1/44 | 1,000,000 | 1,022,910 |
5.00%, due 5/1/49 | 1,350,000 | 1,372,506 |
Pennsylvania Economic Development Financing Authority, Rapid Bridge Replacement Project, Revenue Bonds | ||
4.125%, due 12/31/38 | 4,000,000 | 4,017,952 |
Pennsylvania Higher Educational Facilities Authority, University of Pennsylvania Health System, Revenue Bonds | ||
4.00%, due 8/15/49 | 10,085,000 | 9,810,951 |
Pennsylvania Higher Educational Facilities Authority, Shippensburg University Student Services, Inc., Revenue Bonds | ||
5.00%, due 10/1/44 | 1,000,000 | 1,014,270 |
Pennsylvania Higher Educational Facilities Authority, Widener University, Revenue Bonds | ||
Series A | ||
5.50%, due 7/15/38 | 2,500,000 | 2,598,667 |
5.50%, due 7/15/43 | 2,400,000 | 2,494,720 |
Principal Amount | Value | |
Long-Term Municipal Bonds (continued) | ||
Pennsylvania (continued) | ||
Pennsylvania Higher Educational Facilities Authority, Holy Family University, Revenue Bonds | ||
Series A | ||
6.25%, due 9/1/33 | $ 1,560,000 | $ 1,613,798 |
Series A | ||
6.50%, due 9/1/38 | 1,000,000 | 1,034,339 |
Pennsylvania Turnpike Commission, Revenue Bonds | ||
Series B | ||
4.00%, due 12/1/46 | 6,770,000 | 6,462,179 |
Series A | ||
4.00%, due 12/1/50 | 46,765,000 | 44,058,999 |
Series A | ||
4.00%, due 12/1/51 | 8,940,000 | 8,813,200 |
Series B | ||
4.00%, due 12/1/51 | 335,000 | 314,901 |
Series C | ||
4.00%, due 12/1/51 | 13,935,000 | 13,737,353 |
Series C | ||
5.00%, due 12/1/44 | 16,135,000 | 16,856,444 |
Philadelphia Authority for Industrial Development, Russell Byers Charter School, Revenue Bonds | ||
Series A | ||
5.00%, due 5/1/40 | 1,105,000 | 1,131,294 |
Series A | ||
5.00%, due 5/1/50 | 3,130,000 | 3,174,732 |
Philadelphia Authority for Industrial Development, MaST Charter School Project, Revenue Bonds | ||
Series A | ||
5.00%, due 8/1/40 | 600,000 | 619,049 |
Series A | ||
5.00%, due 8/1/50 | 1,050,000 | 1,067,963 |
Philadelphia Authority for Industrial Development, University of the Arts (The), Revenue Bonds | ||
5.00%, due 3/15/45 (a) | 5,250,000 | 5,116,906 |
Principal Amount | Value | |
Pennsylvania (continued) | ||
Philadelphia Authority for Industrial Development, Philadelphia Performing Arts Charter School, Revenue Bonds | ||
Series A | ||
5.00%, due 6/15/50 (a) | $ 1,700,000 | $ 1,700,057 |
Philadelphia Authority for Industrial Development, International Education & Community Initiatives Project, Revenue Bonds (a) | ||
Series A | ||
5.125%, due 6/1/38 | 2,000,000 | 2,021,232 |
Series A | ||
5.25%, due 6/1/48 | 3,085,000 | 3,091,221 |
Philadelphia Authority for Industrial Development, Greater Philadelphia Health Action, Inc., Revenue Bonds | ||
Series A | ||
6.50%, due 6/1/45 | 2,200,000 | 2,231,902 |
Philadelphia Authority for Industrial Development, New Foundation Charter School Project, Revenue Bonds | ||
6.625%, due 12/15/41 | 1,000,000 | 1,029,937 |
Philadelphia Authority for Industrial Development, First Philadelphia Preparatory Charter School, Revenue Bonds | ||
Series A | ||
7.25%, due 6/15/43 | 4,200,000 | 4,504,183 |
Philadelphia Authority for Industrial Development, Tacony Academy Charter School, Revenue Bonds | ||
7.375%, due 6/15/43 | 1,500,000 | 1,562,860 |
Philadelphia Authority for Industrial Development, Esperanza Academy Charter School Project, Revenue Bonds | ||
8.20%, due 12/1/43 | 1,800,000 | 1,873,479 |
54 | MainStay MacKay High Yield Municipal Bond Fund |
Principal Amount | Value | |
Long-Term Municipal Bonds (continued) | ||
Pennsylvania (continued) | ||
Scranton Redevelopment Authority, Revenue Bonds | ||
Series A, Insured: MUN GOVT GTD | ||
5.00%, due 11/15/28 | $ 8,750,000 | $ 8,350,734 |
Scranton-Lackawanna Health and Welfare Authority, Marywood University Project, Revenue Bonds | ||
5.00%, due 6/1/36 | 1,000,000 | 1,010,238 |
5.00%, due 6/1/46 | 2,625,000 | 2,613,970 |
Susquehanna Area Regional Airport Authority, Revenue Bonds | ||
Series B, Insured: BAM | ||
4.00%, due 1/1/33 | 3,000,000 | 3,011,847 |
Wilkes-Barre Finance Authority, Wilkes University Project, Revenue Bonds | ||
4.00%, due 3/1/42 | 2,500,000 | 2,181,406 |
433,677,619 | ||
Puerto Rico 12.8% | ||
Children's Trust Fund, Asset-Backed, Revenue Bonds | ||
Series A | ||
(zero coupon), due 5/15/50 | 44,000,000 | 7,348,035 |
Series B | ||
(zero coupon), due 5/15/57 | 98,000,000 | 4,679,206 |
5.375%, due 5/15/33 | 1,430,000 | 1,463,928 |
5.50%, due 5/15/39 | 1,475,000 | 1,509,746 |
5.625%, due 5/15/43 | 36,990,000 | 37,611,143 |
Commonwealth of Puerto Rico, Unlimited General Obligation | ||
Series A-1 | ||
(zero coupon), due 7/1/24 | 10,641,393 | 9,681,610 |
Series A-1 | ||
(zero coupon), due 7/1/33 | 26,622,270 | 15,229,642 |
Series A-1 | ||
4.00%, due 7/1/33 | 25,445,206 | 23,658,975 |
Series A-1 | ||
4.00%, due 7/1/35 | 25,497,633 | 23,640,788 |
Series A-1 | ||
4.00%, due 7/1/37 | 19,398,310 | 17,486,704 |
Series A-1 | ||
4.00%, due 7/1/41 | 27,921,604 | 25,174,339 |
Principal Amount | Value | |
Puerto Rico (continued) | ||
Commonwealth of Puerto Rico, Unlimited General Obligation (continued) | ||
Series A-1 | ||
4.00%, due 7/1/46 | $ 15,341,254 | $ 13,496,468 |
Series A-1 | ||
5.25%, due 7/1/23 | 21,889,416 | 22,160,580 |
Series A-1 | ||
5.375%, due 7/1/25 | 23,039,625 | 23,820,807 |
Series A-1 | ||
5.625%, due 7/1/27 | 22,830,951 | 24,218,534 |
Series A-1 | ||
5.625%, due 7/1/29 | 22,460,559 | 24,205,014 |
Series A-1 | ||
5.75%, due 7/1/31 | 21,553,851 | 23,590,785 |
Commonwealth of Puerto Rico | ||
(zero coupon), due 11/1/43 | 104,247,000 | 54,338,749 |
GDB Debt Recovery Authority of Puerto Rico, Revenue Bonds | ||
7.50%, due 8/20/40 | 136,535,415 | 126,124,590 |
PR CCDA Trust | ||
Class TR | ||
5.00%, due 7/1/31 | 5,871,098 | 5,846,478 |
Puerto Rico Commonwealth Aqueduct & Sewer Authority, Revenue Bonds, Senior Lien | ||
Series C | ||
3.75%, due 7/1/27 (a) | 14,800,000 | 14,417,901 |
Series A | ||
5.00%, due 7/1/22 | 5,205,000 | 5,233,974 |
Series A | ||
5.00%, due 7/1/22 (a) | 320,000 | 321,308 |
Series A | ||
5.00%, due 7/1/24 (a)(d) | 3,430,000 | 3,531,840 |
Series 2020A | ||
5.00%, due 7/1/25 (a) | 9,750,000 | 10,166,967 |
Series A | ||
5.00%, due 7/1/25 (a)(d) | 4,350,000 | 4,529,652 |
Series A | ||
5.00%, due 7/1/27 (a) | 345,000 | 366,272 |
Series A | ||
5.00%, due 7/1/28 (a)(d) | 4,500,000 | 4,792,669 |
Series A | ||
5.00%, due 7/1/29 (a)(d) | 6,535,000 | 6,992,226 |
Series 2020A | ||
5.00%, due 7/1/30 (a) | 22,500,000 | 24,207,626 |
Series 2020A | ||
5.00%, due 7/1/35 (a) | 37,100,000 | 39,171,464 |
Principal Amount | Value | |
Long-Term Municipal Bonds (continued) | ||
Puerto Rico (continued) | ||
Puerto Rico Commonwealth Aqueduct & Sewer Authority, Revenue Bonds, Senior Lien (continued) | ||
Series 2020A | ||
5.00%, due 7/1/47 (a) | $ 92,835,000 | $ 96,588,319 |
Series A | ||
5.50%, due 7/1/28 | 4,000,000 | 4,025,464 |
Series A | ||
5.75%, due 7/1/37 | 3,040,000 | 3,060,568 |
Series A | ||
6.00%, due 7/1/47 | 8,674,000 | 8,736,011 |
Puerto Rico Commonwealth Aqueduct & Sewer Authority, Revenue Bonds (a) | ||
Series B | ||
4.00%, due 7/1/47 | 17,465,000 | 15,960,200 |
Series B | ||
5.00%, due 7/1/25 | 265,000 | 276,333 |
Series B | ||
5.00%, due 7/1/28 | 8,170,000 | 8,710,213 |
Series B | ||
5.00%, due 7/1/33 | 17,285,000 | 18,417,608 |
Series B | ||
5.00%, due 7/1/37 | 23,660,000 | 25,024,910 |
Puerto Rico Electric Power Authority, Revenue Bonds | ||
Series DDD-RSA-1 | ||
3.30%, due 7/1/19 (e)(f) | 1,015,000 | 919,844 |
Series ZZ-RSA-1 | ||
4.25%, due 7/1/20 (e)(f) | 1,355,000 | 1,278,781 |
Series CCC | ||
4.25%, due 7/1/23 (e)(f) | 1,150,000 | 1,096,812 |
Series CCC-RSA-1 | ||
4.375%, due 7/1/22 (e)(f) | 115,000 | 109,681 |
Series CCC-RSA-1 | ||
4.60%, due 7/1/24 (e)(f) | 200,000 | 190,750 |
Series CCC-RSA-1 | ||
4.625%, due 7/1/25 (e)(f) | 1,085,000 | 1,034,819 |
Series XX-RSA-1 | ||
4.75%, due 7/1/26 (e)(f) | 320,000 | 305,200 |
Series ZZ-RSA-1 | ||
4.75%, due 7/1/27 (e)(f) | 405,000 | 386,269 |
Series A-RSA-1 | ||
4.80%, due 7/1/29 (e)(f) | 690,000 | 658,088 |
Series DDD-RSA-1 | ||
5.00%, due 7/1/20 | 3,250,000 | 3,103,750 |
Principal Amount | Value | |
Puerto Rico (continued) | ||
Puerto Rico Electric Power Authority, Revenue Bonds (continued) | ||
Series TT-RSA-1 | ||
5.00%, due 7/1/20 (e)(f) | $ 2,195,000 | $ 2,096,225 |
Series CCC | ||
5.00%, due 7/1/21 (e)(f) | 470,000 | 448,850 |
Series DDD-RSA-1 | ||
5.00%, due 7/1/21 (e)(f) | 275,000 | 262,625 |
Series TT-RSA-1 | ||
5.00%, due 7/1/21 (e)(f) | 1,215,000 | 1,160,325 |
Series PP, Insured: NATL-RE | ||
5.00%, due 7/1/22 | 200,000 | 204,153 |
Series SS, Insured: NATL-RE | ||
5.00%, due 7/1/22 | 1,140,000 | 1,163,671 |
Series RR, Insured: NATL-RE | ||
5.00%, due 7/1/23 | 4,330,000 | 4,419,907 |
Series TT-RSA-1 | ||
5.00%, due 7/1/23 | 365,000 | 349,488 |
Series CCC | ||
5.00%, due 7/1/24 (e)(f) | 1,845,000 | 1,766,587 |
Series RR, Insured: NATL-RE | ||
5.00%, due 7/1/24 | 115,000 | 117,388 |
Series TT-RSA-1 | ||
5.00%, due 7/1/24 (e)(f) | 295,000 | 282,463 |
Series CCC-RSA-1 | ||
5.00%, due 7/1/25 (e)(f) | 575,000 | 550,563 |
Series SS, Insured: NATL-RE | ||
5.00%, due 7/1/25 | 770,000 | 785,988 |
Series TT-RSA-1 | ||
5.00%, due 7/1/25 (e)(f) | 1,030,000 | 986,225 |
Series TT-RSA-1 | ||
5.00%, due 7/1/26 (e)(f) | 1,050,000 | 1,005,375 |
Series TT, Insured: AGM-CR | ||
5.00%, due 7/1/27 | 150,000 | 152,681 |
Series TT-RSA-1 | ||
5.00%, due 7/1/27 (e)(f) | 1,250,000 | 1,196,875 |
Series WW | ||
5.00%, due 7/1/28 (e)(f) | 380,000 | 363,850 |
Series TT-RSA-1 | ||
5.00%, due 7/1/32 (e)(f) | 9,320,000 | 8,923,900 |
Series A-RSA-1 | ||
5.00%, due 7/1/42 (e)(f) | 8,755,000 | 8,382,912 |
Series A-RSA-1 | ||
5.05%, due 7/1/42 (e)(f) | 825,000 | 789,938 |
Series ZZ-RSA-1 | ||
5.25%, due 7/1/20 (e)(f) | 225,000 | 216,000 |
56 | MainStay MacKay High Yield Municipal Bond Fund |
Principal Amount | Value | |
Long-Term Municipal Bonds (continued) | ||
Puerto Rico (continued) | ||
Puerto Rico Electric Power Authority, Revenue Bonds (continued) | ||
Series ZZ-RSA-1 | ||
5.25%, due 7/1/23 (e)(f) | $ 620,000 | $ 596,750 |
Series AAA-RSA-1 | ||
5.25%, due 7/1/24 (e)(f) | 3,000,000 | 2,887,500 |
Series WW | ||
5.25%, due 7/1/25 (e)(f) | 1,605,000 | 1,544,812 |
Series AAA-RSA-1 | ||
5.25%, due 7/1/26 (e)(f) | 110,000 | 105,875 |
Series ZZ-RSA-1 | ||
5.25%, due 7/1/26 (e)(f) | 3,520,000 | 3,388,000 |
Series VV, Insured: NATL-RE | ||
5.25%, due 7/1/29 | 630,000 | 650,164 |
Series AAA-RSA-1 | ||
5.25%, due 7/1/30 (e)(f) | 985,000 | 948,062 |
Series VV, Insured: NATL-RE | ||
5.25%, due 7/1/30 | 3,850,000 | 3,935,067 |
Series VV, Insured: NATL-RE | ||
5.25%, due 7/1/32 | 345,000 | 356,001 |
Series WW | ||
5.25%, due 7/1/33 (e)(f) | 8,310,000 | 7,998,375 |
Series XX-RSA-1 | ||
5.25%, due 7/1/35 (e)(f) | 2,265,000 | 2,180,062 |
Series XX-RSA-1 | ||
5.25%, due 7/1/40 (e)(f) | 18,255,000 | 17,570,437 |
Series BBB | ||
5.40%, due 7/1/28 (e)(f) | 4,245,000 | 3,900,094 |
Series BBB | ||
5.40%, due 7/1/28 (e)(f) | 5,370,000 | 4,698,749 |
Series WW | ||
5.50%, due 7/1/38 (e)(f) | 11,595,000 | 11,203,669 |
Series XX | ||
5.75%, due 7/1/36 (e)(f) | 4,055,000 | 3,933,350 |
Series 2013A-RSA-1 | ||
6.75%, due 7/1/36 (e)(f) | 11,550,000 | 11,492,247 |
Series 2013A-RSA-1 | ||
7.00%, due 7/1/33 (e)(f) | 1,500,000 | 1,496,249 |
Series 2013A-RSA-1 | ||
7.00%, due 7/1/43 (e)(f) | 4,750,000 | 4,738,123 |
Puerto Rico Electric Power Authority, Build America Bonds, Revenue Bonds (e)(f) | ||
Series EEE | ||
5.95%, due 7/1/30 | 9,975,000 | 8,827,936 |
Principal Amount | Value | |
Puerto Rico (continued) | ||
Puerto Rico Electric Power Authority, Build America Bonds, Revenue Bonds (e)(f) (continued) | ||
Series EEE-RSA-1 | ||
5.95%, due 7/1/30 | $ 15,910,000 | $ 14,696,862 |
Series EEE | ||
6.05%, due 7/1/32 | 1,225,000 | 1,088,721 |
Series EEE-RSA-1 | ||
6.05%, due 7/1/32 | 11,040,000 | 10,225,800 |
Series YY | ||
6.125%, due 7/1/40 | 20,975,000 | 19,454,312 |
Series YY | ||
6.125%, due 7/1/40 | 24,475,000 | 21,752,156 |
Series EEE | ||
6.25%, due 7/1/40 | 1,730,000 | 1,600,250 |
Series EEE | ||
6.25%, due 7/1/40 | 8,435,000 | 7,496,630 |
Puerto Rico Highway & Transportation Authority, Revenue Bonds | ||
Insured: AMBAC | ||
(zero coupon), due 7/1/27 | 200,000 | 158,667 |
Series A, Insured: NATL-RE | ||
4.75%, due 7/1/38 | 1,070,000 | 1,100,564 |
Series A, Insured: AGM-CR | ||
4.75%, due 7/1/38 | 650,000 | 653,016 |
Insured: NATL-RE | ||
5.00%, due 7/1/22 | 345,000 | 346,974 |
Insured: AGC-ICC | ||
5.00%, due 7/1/23 | 2,870,000 | 2,889,994 |
Insured: NATL-RE | ||
5.00%, due 7/1/28 | 460,000 | 462,631 |
Series N, Insured: AMBAC | ||
5.25%, due 7/1/30 | 3,680,000 | 3,733,296 |
Series N, Insured: AMBAC | ||
5.25%, due 7/1/31 | 9,045,000 | 9,161,361 |
Series N, Insured: NATL-RE | ||
5.25%, due 7/1/33 | 7,240,000 | 7,462,607 |
Series L, Insured: AMBAC | ||
5.25%, due 7/1/38 | 1,035,000 | 1,045,263 |
Series CC, Insured: NATL-RE | ||
5.50%, due 7/1/28 | 6,750,000 | 7,065,999 |
Series CC, Insured: NATL-RE | ||
5.50%, due 7/1/29 | 4,760,000 | 4,983,948 |
Principal Amount | Value | |
Long-Term Municipal Bonds (continued) | ||
Puerto Rico (continued) | ||
Puerto Rico Municipal Finance Agency, Revenue Bonds | ||
Series A, Insured: AGM | ||
5.00%, due 8/1/27 | $ 2,530,000 | $ 2,564,748 |
Puerto Rico Sales Tax Financing Corp., Revenue Bonds | ||
Series A-1 | ||
(zero coupon), due 7/1/31 | 879,000 | 653,419 |
Series A-1 | ||
(zero coupon), due 7/1/33 | 990,000 | 684,589 |
(zero coupon), due 8/1/54 | 516,302 | 125,563 |
Series A-2 | ||
4.329%, due 7/1/40 | 14,750,000 | 14,619,203 |
Series A-1 | ||
4.50%, due 7/1/34 | 725,000 | 743,515 |
Series A-1 | ||
4.75%, due 7/1/53 | 57,092,000 | 57,899,897 |
Series A-2 | ||
4.784%, due 7/1/58 | 24,965,000 | 25,362,862 |
Series A-1 | ||
5.00%, due 7/1/58 | 217,677,000 | 223,654,410 |
1,358,666,408 | ||
Rhode Island 0.2% | ||
Providence Redevelopment Agency, Port Providence Lease, Certificate of Participation | ||
Series A, Insured: AGC | ||
(zero coupon), due 9/1/24 | 1,735,000 | 1,615,462 |
Series A, Insured: AGC | ||
(zero coupon), due 9/1/26 | 685,000 | 594,548 |
Series A, Insured: AGC | ||
(zero coupon), due 9/1/29 | 1,835,000 | 1,419,139 |
Series A, Insured: AGC | ||
(zero coupon), due 9/1/30 | 1,835,000 | 1,358,588 |
Series A, Insured: AGC | ||
(zero coupon), due 9/1/32 | 1,500,000 | 1,020,472 |
Series A, Insured: AGC | ||
(zero coupon), due 9/1/34 | 1,000,000 | 623,911 |
Series A, Insured: AGC | ||
(zero coupon), due 9/1/35 | 360,000 | 214,256 |
Series A, Insured: AGC | ||
(zero coupon), due 9/1/36 | 470,000 | 268,412 |
Principal Amount | Value | |
Rhode Island (continued) | ||
Rhode Island Health and Educational Building Corp., Lifespan Obligated Group, Revenue Bonds | ||
5.00%, due 5/15/39 | $ 750,000 | $ 791,963 |
Rhode Island Turnpike & Bridge Authority, Motor Fuel Tax, Revenue Bonds | ||
Series A | ||
4.00%, due 10/1/44 | 1,500,000 | 1,537,411 |
Tobacco Settlement Financing Corp., Revenue Bonds | ||
Series A | ||
(zero coupon), due 6/1/52 | 95,620,000 | 14,892,213 |
24,336,375 | ||
South Carolina 0.7% | ||
South Carolina Jobs-Economic Development Authority, Bon Secours Mercy Health, Inc., Revenue Bonds | ||
Series A | ||
4.00%, due 12/1/44 | 8,270,000 | 8,193,278 |
South Carolina Jobs-Economic Development Authority, Bishop Gadsden Episcopal Retirement Community, Revenue Bonds | ||
Series A | ||
4.00%, due 4/1/54 | 1,160,000 | 1,058,564 |
Series A | ||
5.00%, due 4/1/54 | 3,000,000 | 3,118,621 |
South Carolina Jobs-Economic Development Authority, Green Charter School Project, Revenue Bonds | ||
Series A | ||
4.00%, due 6/1/56 (a) | 3,530,000 | 2,911,316 |
South Carolina Jobs-Economic Development Authority, Woodlands at Furman Project, Revenue Bonds | ||
Series A | ||
5.00%, due 11/15/54 | 1,000,000 | 946,301 |
5.25%, due 11/15/47 | 5,125,000 | 5,141,962 |
5.25%, due 11/15/52 | 1,625,000 | 1,626,510 |
58 | MainStay MacKay High Yield Municipal Bond Fund |
Principal Amount | Value | |
Long-Term Municipal Bonds (continued) | ||
South Carolina (continued) | ||
South Carolina Public Service Authority, Santee Cooper Project, Revenue Bonds | ||
Series B | ||
4.00%, due 12/1/46 | $ 5,960,000 | $ 5,821,722 |
Series B | ||
4.00%, due 12/1/48 | 21,089,000 | 20,457,182 |
Series B | ||
4.00%, due 12/1/50 | 4,805,000 | 4,649,119 |
Series B | ||
4.00%, due 12/1/54 | 5,182,000 | 4,945,584 |
Series B | ||
4.00%, due 12/1/55 | 14,796,000 | 14,111,524 |
South Carolina Public Service Authority, Revenue Bonds | ||
Series B | ||
5.00%, due 12/1/56 | 5,805,000 | 6,127,425 |
79,109,108 | ||
South Dakota 0.0% ‡ | ||
South Dakota Health & Educational Facilities Authority, Sanford Obligated Group, Revenue Bonds | ||
Series E | ||
5.00%, due 11/1/42 | 3,150,000 | 3,203,609 |
Tennessee 0.7% | ||
Chattanooga-Hamilton County Hospital Authority, Revenue Bonds | ||
Series A | ||
5.00%, due 10/1/44 | 6,250,000 | 6,576,797 |
Metropolitan Government Nashville & Davidson County Health & Educational Facilities Board, Trevecca Nazarene University Project, Revenue Bonds | ||
Series B | ||
4.00%, due 10/1/41 | 2,265,000 | 2,060,733 |
Series B | ||
4.00%, due 10/1/51 | 2,830,000 | 2,430,209 |
Principal Amount | Value | |
Tennessee (continued) | ||
Metropolitan Government Nashville & Davidson County Health & Educational Facilities Board, Belmont University, Revenue Bonds | ||
4.00%, due 5/1/46 | $ 3,000,000 | $ 2,900,430 |
4.00%, due 5/1/51 | 13,600,000 | 12,964,612 |
Metropolitan Government Nashville & Davidson County Health & Educational Facilities Board, Lipscomb University Project, Revenue Bonds | ||
Series A | ||
5.00%, due 10/1/45 | 11,610,000 | 12,054,453 |
Series A | ||
5.25%, due 10/1/58 | 8,750,000 | 9,232,582 |
Metropolitan Government Nashville & Davidson County Health & Educational Facilities Board, Revenue Bonds | ||
5.00%, due 10/1/48 | 2,800,000 | 2,854,090 |
Metropolitan Nashville Airport Authority (The), Revenue Bonds | ||
Series B | ||
5.00%, due 7/1/54 (b) | 18,550,000 | 19,499,778 |
70,573,684 | ||
Texas 4.5% | ||
Bexar County Health Facilities Development Corp., Army Retirement Residence Foundation Project, Revenue Bonds | ||
5.00%, due 7/15/41 | 3,300,000 | 3,348,411 |
Calhoun County Navigation Industrial Development Authority, Max Midstream Texas LLC Project, Revenue Bonds, Senior Lien (a) | ||
Series A | ||
3.625%, due 7/1/26 (b) | 15,055,000 | 14,665,334 |
Series B | ||
6.50%, due 7/1/26 | 13,950,000 | 13,411,017 |
Principal Amount | Value | |
Long-Term Municipal Bonds (continued) | ||
Texas (continued) | ||
Central Texas Regional Mobility Authority, Manor Expressway Project, Revenue Bonds, Senior Lien | ||
(zero coupon), due 1/1/23 | $ 1,000,000 | $ 985,776 |
Central Texas Regional Mobility Authority, Capital Appreciation, Revenue Bonds | ||
(zero coupon), due 1/1/33 | 315,000 | 201,074 |
(zero coupon), due 1/1/34 | 3,275,000 | 1,994,140 |
(zero coupon), due 1/1/35 | 3,700,000 | 2,145,707 |
(zero coupon), due 1/1/36 | 2,000,000 | 1,104,046 |
(zero coupon), due 1/1/39 | 3,500,000 | 1,656,635 |
Central Texas Regional Mobility Authority, Revenue Bonds | ||
4.00%, due 1/1/41 | 6,000,000 | 6,031,442 |
Central Texas Regional Mobility Authority, Revenue Bonds, Sub. Lien | ||
5.00%, due 1/1/33 | 1,225,000 | 1,250,791 |
5.00%, due 1/1/42 | 2,500,000 | 2,552,635 |
Central Texas Turnpike System, Revenue Bonds | ||
Series C | ||
5.00%, due 8/15/42 | 11,700,000 | 12,041,893 |
City of Arlington TX, Tax Increment Reinvestment Zone No. 5, Tax Allocation | ||
4.00%, due 8/15/50 | 2,355,000 | 2,208,462 |
City of Houston TX, Airport System, United Airlines Inc. Project, Revenue Bonds (b) | ||
5.00%, due 7/1/29 | 11,100,000 | 11,410,550 |
Series B-1 | ||
5.00%, due 7/15/30 | 2,000,000 | 2,077,214 |
City of Lago Vista TX, Tessera on Lake Travis Public Improvement District Project, Special Assessment | ||
Series B | ||
4.875%, due 9/1/50 (a) | 1,250,000 | 1,119,486 |
Clifton Higher Education Finance Corp., IDEA Public Schools, Revenue Bonds | ||
Series A | ||
4.00%, due 8/15/47 | 4,030,000 | 3,850,079 |
6.00%, due 8/15/43 | 3,500,000 | 3,610,194 |
Principal Amount | Value | |
Texas (continued) | ||
Clifton Higher Education Finance Corp., Uplift Education, Revenue Bonds | ||
Series A | ||
5.00%, due 12/1/45 | $ 2,500,000 | $ 2,552,548 |
Danbury Higher Education Authority, Inc., Golden Rule School, Inc., Revenue Bonds | ||
Series A | ||
4.00%, due 8/15/49 | 3,750,000 | 3,205,975 |
Decatur Hospital Authority, Wise Regional Health System, Revenue Bonds | ||
Series A | ||
5.25%, due 9/1/44 | 3,250,000 | 3,403,899 |
Grand Parkway Transportation Corp., Revenue Bonds, First Tier | ||
Series C | ||
4.00%, due 10/1/49 | 73,390,000 | 72,336,853 |
Series A | ||
5.50%, due 4/1/53 | 600,000 | 626,702 |
Harris County Cultural Education Facilities Finance Corp., YMCA Greater Houston Area, Revenue Bonds | ||
Series A | ||
5.00%, due 6/1/33 | 900,000 | 900,430 |
Series A | ||
5.00%, due 6/1/38 | 1,960,000 | 1,911,305 |
Harris County Cultural Education Facilities Finance Corp., Brazos Presbyterian Homes, Revenue Bonds | ||
Series B | ||
7.00%, due 1/1/43 | 1,500,000 | 1,549,981 |
Harris County-Houston Sports Authority, Revenue Bonds, Junior Lien | ||
Series H, Insured: NATL-RE | ||
(zero coupon), due 11/15/24 | 175,000 | 163,617 |
Series H, Insured: NATL-RE | ||
(zero coupon), due 11/15/24 | 795,000 | 724,207 |
Series H, Insured: NATL-RE | ||
(zero coupon), due 11/15/26 | 65,000 | 57,204 |
Series H, Insured: NATL-RE | ||
(zero coupon), due 11/15/26 | 535,000 | 448,056 |
60 | MainStay MacKay High Yield Municipal Bond Fund |
Principal Amount | Value | |
Long-Term Municipal Bonds (continued) | ||
Texas (continued) | ||
Harris County-Houston Sports Authority, Revenue Bonds, Junior Lien (continued) | ||
Series H, Insured: NATL-RE | ||
(zero coupon), due 11/15/29 | $ 10,000 | $ 7,951 |
Series H, Insured: NATL-RE | ||
(zero coupon), due 11/15/29 | 725,000 | 528,148 |
Series H, Insured: NATL-RE | ||
(zero coupon), due 11/15/32 | 250,000 | 153,384 |
Series H, Insured: NATL-RE | ||
(zero coupon), due 11/15/33 | 185,000 | 106,472 |
Series H, Insured: NATL-RE | ||
(zero coupon), due 11/15/38 | 1,395,000 | 584,452 |
Series H, Insured: NATL-RE | ||
(zero coupon), due 11/15/39 | 1,525,000 | 599,388 |
Series H, Insured: NATL-RE | ||
(zero coupon), due 11/15/40 | 1,855,000 | 683,308 |
Series H, Insured: NATL-RE | ||
(zero coupon), due 11/15/41 | 700,000 | 241,664 |
Harris County-Houston Sports Authority, Revenue Bonds, Third Lien | ||
Series A-3, Insured: NATL-RE | ||
(zero coupon), due 11/15/32 | 1,670,000 | 939,353 |
Series A-3, Insured: NATL-RE | ||
(zero coupon), due 11/15/33 | 890,000 | 471,596 |
Series A-3, Insured: NATL-RE | ||
(zero coupon), due 11/15/34 | 220,000 | 114,551 |
Series A-3, Insured: NATL-RE | ||
(zero coupon), due 11/15/34 | 2,320,000 | 1,157,850 |
Harris County-Houston Sports Authority, Revenue Bonds, Senior Lien | ||
Series A, Insured: AGM NATL-RE | ||
(zero coupon), due 11/15/34 | 2,035,000 | 1,119,260 |
Series A, Insured: AGM NATL-RE | ||
(zero coupon), due 11/15/38 | 36,015,000 | 15,392,278 |
Series A, Insured: AGM NATL-RE | ||
(zero coupon), due 11/15/40 | 1,310,000 | 493,100 |
Hemphill County Hospital District, Limited General Obligation | ||
4.625%, due 2/1/39 | 2,765,000 | 2,666,337 |
Principal Amount | Value | |
Texas (continued) | ||
Love Field Airport Modernization Corp., Revenue Bonds (b) | ||
Insured: AGM | ||
4.00%, due 11/1/38 | $ 5,225,000 | $ 5,159,346 |
Insured: AGM | ||
4.00%, due 11/1/39 | 6,545,000 | 6,431,638 |
Montgomery County Toll Road Authority, Revenue Bonds, Senior Lien | ||
5.00%, due 9/15/48 | 2,500,000 | 2,578,872 |
New Hope Cultural Education Facilities Finance Corp., Jubilee Academic Center, Inc., Revenue Bonds (a) | ||
4.00%, due 8/15/36 | 1,000,000 | 934,641 |
4.00%, due 8/15/51 | 9,270,000 | 7,911,615 |
4.00%, due 8/15/56 | 5,000,000 | 4,151,330 |
New Hope Cultural Education Facilities Finance Corp., CHF-Collegiate Housing Denton LLC, Revenue Bonds | ||
Series B-1, Insured: AGM | ||
4.00%, due 7/1/48 | 1,000,000 | 1,002,839 |
New Hope Cultural Education Facilities Finance Corp., Westminster Project, Revenue Bonds | ||
4.00%, due 11/1/49 | 1,600,000 | 1,496,077 |
New Hope Cultural Education Facilities Finance Corp., Quality Senior Housing Foundation of East Texas, Inc., Revenue Bonds | ||
Series A-1 | ||
4.00%, due 12/1/54 | 530,000 | 387,988 |
Series A-1 | ||
5.00%, due 12/1/54 | 2,770,000 | 2,641,613 |
New Hope Cultural Education Facilities Finance Corp., Cumberland Academy, Inc., Revenue Bonds | ||
Series A | ||
5.00%, due 8/15/40 (a) | 4,750,000 | 4,809,849 |
Principal Amount | Value | |
Long-Term Municipal Bonds (continued) | ||
Texas (continued) | ||
New Hope Cultural Education Facilities Finance Corp., Southwest Preparatory School, Revenue Bonds | ||
Series A | ||
5.00%, due 8/15/50 (a) | $ 3,930,000 | $ 3,982,554 |
New Hope Cultural Education Facilities Finance Corp., Wesleyan Homes, Inc., Project, Revenue Bonds | ||
5.00%, due 1/1/55 | 1,500,000 | 1,249,070 |
New Hope Cultural Education Facilities Finance Corp., Legacy at Midtown Park Project, Revenue Bonds | ||
Series A | ||
5.50%, due 7/1/54 | 2,500,000 | 2,234,906 |
New Hope Cultural Education Facilities Finance Corp., CHF-Stephenville LLC, Revenue Bonds | ||
Series A | ||
6.00%, due 4/1/45 | 3,550,000 | 3,674,592 |
North East Texas Regional Mobility Authority, Revenue Bonds, Senior Lien | ||
Series B | ||
5.00%, due 1/1/41 | 5,750,000 | 5,972,716 |
Series B | ||
5.00%, due 1/1/46 | 3,535,000 | 3,651,500 |
North Texas Tollway Authority, North Texas Tollway System, Revenue Bonds, Second Tier | ||
Series B | ||
3.00%, due 1/1/46 | 18,000,000 | 15,044,902 |
5.00%, due 1/1/50 | 1,750,000 | 1,867,387 |
Port Beaumont Navigation District, Jefferson Gulf Coast Energy Project, Revenue Bonds (a)(b) | ||
Series A | ||
2.875%, due 1/1/41 | 2,400,000 | 1,780,960 |
Series A | ||
3.00%, due 1/1/50 | 9,460,000 | 6,520,802 |
Principal Amount | Value | |
Texas (continued) | ||
Port Freeport, Revenue Bonds, Senior Lien | ||
Series A | �� | |
4.00%, due 6/1/38 (b) | $ 1,650,000 | $ 1,678,931 |
Series A | ||
4.00%, due 6/1/39 (b) | 1,620,000 | 1,645,930 |
4.00%, due 6/1/51 | 2,535,000 | 2,440,830 |
Port of Port Arthur Navigation District, Port Improvement, Unlimited General Obligation | ||
4.00%, due 3/1/47 | 4,200,000 | 4,259,423 |
Red River Education Finance Corp., Houston Baptist University Project, Revenue Bonds | ||
5.50%, due 10/1/46 | 6,000,000 | 6,430,252 |
San Antonio Education Facilities Corp., University of the Incarnate Word, Revenue Bonds | ||
Series A | ||
4.00%, due 4/1/51 | 4,000,000 | 3,756,453 |
San Antonio Municipal Facilities Corp., City Tower Renovation Project, Revenue Bonds | ||
4.00%, due 8/1/48 | 11,995,000 | 12,352,016 |
Tarrant County Cultural Education Facilities Finance Corp., Barton Creek Senior Living Center Project, Revenue Bonds | ||
5.00%, due 11/15/40 | 1,500,000 | 1,540,488 |
Tarrant County Cultural Education Facilities Finance Corp., Buckner Retirement Services, Revenue Bonds | ||
Series B | ||
5.00%, due 11/15/40 | 1,250,000 | 1,324,021 |
Tarrant County Cultural Education Facilities Finance Corp., Buckner Retirement Services, Inc. Project, Revenue Bonds | ||
5.00%, due 11/15/46 | 3,025,000 | 3,209,019 |
62 | MainStay MacKay High Yield Municipal Bond Fund |
Principal Amount | Value | |
Long-Term Municipal Bonds (continued) | ||
Texas (continued) | ||
Texas Private Activity Bond Surface Transportation Corp., North Tarrant Express Managed Lanes Project, Revenue Bonds, Senior Lien | ||
Series A | ||
4.00%, due 12/31/38 | $ 5,885,000 | $ 5,905,741 |
Series A | ||
4.00%, due 12/31/39 | 4,750,000 | 4,765,331 |
Texas Private Activity Bond Surface Transportation Corp., Blueridge Transportation Group LLC, Revenue Bonds, Senior Lien (b) | ||
5.00%, due 12/31/50 | 4,985,000 | 5,196,806 |
5.00%, due 12/31/55 | 10,140,000 | 10,548,162 |
Texas Private Activity Bond Surface Transportation Corp., NTE Mobility Partners Segments 3 LLC, Revenue Bonds, Senior Lien (b) | ||
5.00%, due 6/30/58 | 97,655,000 | 100,911,023 |
6.75%, due 6/30/43 | 11,400,000 | 12,029,120 |
Texas Transportation Commission, Revenue Bonds, First Tier | ||
(zero coupon), due 8/1/43 | 3,750,000 | 1,392,615 |
(zero coupon), due 8/1/44 | 4,200,000 | 1,473,762 |
(zero coupon), due 8/1/46 | 1,000,000 | 315,103 |
(zero coupon), due 8/1/47 | 2,000,000 | 597,663 |
(zero coupon), due 8/1/48 | 1,000,000 | 283,644 |
(zero coupon), due 8/1/50 | 1,500,000 | 381,113 |
Texas Transportation Commission, State Highway 249, Revenue Bonds, First Tier | ||
Series A | ||
5.00%, due 8/1/57 | 9,750,000 | 10,185,834 |
474,913,232 | ||
U.S. Virgin Islands 2.1% | ||
Matching Fund Special Purpose Securitization Corp., Revenue Bonds | ||
Series A | ||
5.00%, due 10/1/30 | 25,565,000 | 26,679,951 |
Series A | ||
5.00%, due 10/1/32 | 38,430,000 | 40,174,422 |
Principal Amount | Value | |
U.S. Virgin Islands (continued) | ||
Matching Fund Special Purpose Securitization Corp., Revenue Bonds (continued) | ||
Series A | ||
5.00%, due 10/1/39 | $ 113,075,000 | $ 115,835,172 |
Virgin Islands Public Finance Authority, Gross Receipts Taxes Loan, Revenue Bonds | ||
Series C | ||
5.00%, due 10/1/30 | 16,870,000 | 16,645,088 |
Series A | ||
5.00%, due 10/1/32 | 15,200,000 | 14,882,747 |
Series A | ||
5.00%, due 10/1/34 | 2,600,000 | 2,528,699 |
Series C | ||
5.00%, due 10/1/39 | 9,610,000 | 9,190,426 |
225,936,505 | ||
Utah 0.9% | ||
Black Desert Public Infrastructure District, Limited General Obligation | ||
Series A | ||
4.00%, due 3/1/51 (a) | 3,125,000 | 2,534,742 |
City of Salt Lake City UT, Airport, Revenue Bonds | ||
Series A | ||
5.00%, due 7/1/51 (b) | 6,250,000 | 6,698,915 |
Medical School Campus Public Infrastructure District, Limited General Obligation (a) | ||
Series A | ||
5.25%, due 2/1/40 | 1,430,000 | 1,260,203 |
Series A | ||
5.50%, due 2/1/50 | 2,915,000 | 2,534,296 |
Mida Golf and Equestrian Center Public Infrastructure District, Limited General Obligation | ||
4.50%, due 6/1/51 (a) | 10,700,000 | 8,506,228 |
Mida Mountain Village Public Infrastructure District, Assessment Area No. 2, Special Assessment | ||
4.00%, due 8/1/50 (a) | 2,000,000 | 1,572,058 |
Principal Amount | Value | |
Long-Term Municipal Bonds (continued) | ||
Utah (continued) | ||
Mida Mountain Village Public Infrastructure District, Special Assessment | ||
Series A | ||
4.50%, due 8/1/40 | $ 1,500,000 | $ 1,487,205 |
Series A | ||
5.00%, due 8/1/50 | 5,000,000 | 4,987,665 |
Military Installation Development Authority, Revenue Bonds | ||
Series A-1 | ||
4.00%, due 6/1/36 | 4,000,000 | 3,506,650 |
Series A-1 | ||
4.00%, due 6/1/41 | 2,430,000 | 2,025,543 |
Series A-1 | ||
4.00%, due 6/1/52 | 13,600,000 | 10,486,670 |
Series A-2 | ||
4.00%, due 6/1/52 | 1,000,000 | 756,852 |
UIPA Crossroads Public Infrastructure District, Tax Allocation | ||
4.375%, due 6/1/52 (a) | 5,500,000 | 4,478,821 |
Utah Charter School Finance Authority, Spectrum Academy Project, Revenue Bonds | ||
Insured: UT CSCE | ||
4.00%, due 4/15/45 | 2,975,000 | 2,964,829 |
Insured: UT CSCE | ||
4.00%, due 4/15/50 | 3,395,000 | 3,335,572 |
Utah Charter School Finance Authority, North Star Academy Project, Revenue Bonds | ||
Insured: UT CSCE | ||
4.00%, due 4/15/45 | 2,020,000 | 2,065,174 |
Utah Charter School Finance Authority, Vista School, Revenue Bonds | ||
Series 2020A, Insured: UT CSCE | ||
4.00%, due 10/15/45 | 1,870,000 | 1,914,069 |
Series 2020A, Insured: UT CSCE | ||
4.00%, due 10/15/54 | 4,750,000 | 4,794,023 |
Utah Charter School Finance Authority, Providence Hall Project, Revenue Bonds | ||
Series A, Insured: UT CSCE | ||
4.00%, due 10/15/46 | 1,000,000 | 1,027,639 |
Principal Amount | Value | |
Utah (continued) | ||
Utah Charter School Finance Authority, Providence Hall Project, Revenue Bonds (continued) | ||
Series A, Insured: UT CSCE | ||
4.00%, due 10/15/51 | $ 2,000,000 | $ 2,045,385 |
Utah Infrastructure Agency, Revenue Bonds | ||
3.00%, due 10/15/45 | 4,425,000 | 3,034,344 |
5.00%, due 10/15/46 | 3,450,000 | 3,401,355 |
Utah Infrastructure Agency, Telecommunication, Revenue Bonds | ||
4.00%, due 10/15/39 | 2,175,000 | 1,896,058 |
4.00%, due 10/15/42 | 1,970,000 | 1,678,460 |
Series A | ||
5.00%, due 10/15/32 | 1,615,000 | 1,648,235 |
Series A | ||
5.00%, due 10/15/34 | 3,135,000 | 3,178,780 |
Series A | ||
5.00%, due 10/15/37 | 1,100,000 | 1,106,701 |
Series A | ||
5.00%, due 10/15/40 | 3,880,000 | 3,890,320 |
Series A | ||
5.375%, due 10/15/40 | 6,010,000 | 6,175,816 |
94,992,608 | ||
Vermont 0.1% | ||
Vermont Economic Development Authority, Wake Robin Corp. Project, Revenue Bonds | ||
Series A | ||
4.00%, due 5/1/45 | 2,350,000 | 1,985,424 |
Vermont Educational & Health Buildings Financing Agency, Developmental & Mental Health Services, Revenue Bonds | ||
Series A, Insured: AGC | ||
4.75%, due 8/15/36 | 500,000 | 509,204 |
Vermont Student Assistance Corp., Education Loan, Revenue Bonds | ||
Series B | ||
4.50%, due 6/15/45 (b) | 3,500,000 | 3,140,854 |
5,635,482 | ||
64 | MainStay MacKay High Yield Municipal Bond Fund |
Principal Amount | Value | |
Long-Term Municipal Bonds (continued) | ||
Virginia 1.7% | ||
Farmville Industrial Development Authority, Longwood University Student Project, Revenue Bonds | ||
Series A | ||
5.00%, due 1/1/48 | $ 6,750,000 | $ 6,953,739 |
Series A | ||
5.00%, due 1/1/55 | 16,300,000 | 16,725,865 |
Farmville Industrial Development Authority, Longwood University Student Housing Project, Revenue Bonds | ||
Series A | ||
5.00%, due 1/1/59 | 7,355,000 | 7,557,890 |
Henrico County Economic Development Authority, LifeSpire of Virginia, Residential Care Facility, Revenue Bonds | ||
Series C | ||
5.00%, due 12/1/47 | 2,200,000 | 2,230,894 |
James City County Economic Development Authority, Williamsburg Landing, Inc., Revenue Bonds | ||
Series A | ||
4.00%, due 12/1/50 | 3,235,000 | 2,673,034 |
Lynchburg Economic Development Authority, Randolph College Project, Revenue Bonds | ||
5.00%, due 9/1/48 | 3,455,000 | 3,611,341 |
Newport News Economic Development Authority, LifeSpire of Virginia Obligated Group, Revenue Bonds | ||
5.00%, due 12/1/38 | 2,575,000 | 2,621,275 |
Norfolk Redevelopment & Housing Authority, Norfolk Retirement Community, Harbors Edge Project, Revenue Bonds | ||
Series B | ||
4.00%, due 1/1/25 | 1,200,000 | 1,198,148 |
Principal Amount | Value | |
Virginia (continued) | ||
Roanoke Economic Development Authority, Lynchburg College, Revenue Bonds | ||
Series A | ||
4.00%, due 9/1/48 | $ 4,640,000 | $ 4,523,317 |
Salem Economic Development Authority, Educational Facilities, Roanoke College, Revenue Bonds | ||
4.00%, due 4/1/45 | 1,000,000 | 987,719 |
5.00%, due 4/1/49 | 1,000,000 | 1,068,795 |
Tobacco Settlement Financing Corp., Tobacco Settlement Asset-Backed, Revenue Bonds, Senior Lien | ||
Series B2 | ||
5.20%, due 6/1/46 | 2,000,000 | 2,000,168 |
Tobacco Settlement Financing Corp., Tobacco Settlement Asset-Backed, Revenue Bonds | ||
Series 2007A-1 | ||
6.706%, due 6/1/46 | 32,910,000 | 32,921,133 |
Virginia College Building Authority, Regent University Project, Revenue Bonds | ||
3.00%, due 6/1/41 | 2,250,000 | 1,802,420 |
4.00%, due 6/1/36 | 1,300,000 | 1,280,187 |
Virginia College Building Authority, Marymount University Project, Green Bond, Revenue Bonds | ||
Series B | ||
5.00%, due 7/1/45 (a) | 1,945,000 | 1,951,633 |
Virginia Small Business Financing Authority, 95 Express Lanes LLC, Revenue Bonds, Senior Lien (b) | ||
4.00%, due 7/1/39 | 4,500,000 | 4,347,673 |
4.00%, due 1/1/48 | 3,500,000 | 3,276,713 |
5.00%, due 1/1/37 | 4,750,000 | 5,111,187 |
Virginia Small Business Financing Authority, National Senior Campuses Inc. Obligated Group, Revenue Bonds | ||
4.00%, due 1/1/51 | 14,600,000 | 14,132,187 |
Principal Amount | Value | |
Long-Term Municipal Bonds (continued) | ||
Virginia (continued) | ||
Virginia Small Business Financing Authority, Capital Beltway Express LLC, Revenue Bonds, Senior Lien (b) | ||
5.00%, due 12/31/47 | $ 15,000,000 | $ 16,034,289 |
5.00%, due 12/31/57 | 4,000,000 | 4,244,200 |
Virginia Small Business Financing Authority, Transform 66 P3 Project, Revenue Bonds, Senior Lien (b) | ||
5.00%, due 12/31/52 | 11,860,000 | 12,202,161 |
5.00%, due 12/31/56 | 16,640,000 | 17,092,991 |
Virginia Small Business Financing Authority, Elizabeth River Crossing, Revenue Bonds, Senior Lien | ||
5.50%, due 1/1/42 | 17,845,000 | 17,955,664 |
184,504,623 | ||
Washington 0.9% | ||
Pend Oreille County Public Utility District No. 1 Box Canyon, Revenue Bonds | ||
4.00%, due 1/1/41 | 3,000,000 | 3,004,404 |
Pend Oreille County Public Utility District No. 1 Box Canyon, Green Bond, Revenue Bonds | ||
5.00%, due 1/1/48 | 5,180,000 | 5,421,718 |
Port of Seattle Industrial Development Corp., Delta Air Lines, Inc., Revenue Bonds | ||
5.00%, due 4/1/30 (b) | 1,825,000 | 1,849,335 |
Washington Economic Development Finance Authority, North Pacific Paper Co. Recycling Project, Green Bond, Revenue Bonds | ||
Series A | ||
5.625%, due 12/1/40 (a)(b) | 4,000,000 | 4,158,336 |
Washington Higher Education Facilities Authority, Whitworth University Project, Revenue Bonds | ||
4.00%, due 10/1/38 | 1,665,000 | 1,659,870 |
Series A | ||
5.00%, due 10/1/40 | 3,000,000 | 3,184,492 |
Principal Amount | Value | |
Washington (continued) | ||
Washington Higher Education Facilities Authority, Seattle Pacific University Project, Revenue Bonds | ||
Series A | ||
5.00%, due 10/1/45 | $ 3,550,000 | $ 3,858,111 |
Washington State Convention Center Public Facilities District, Lodging Tax, Revenue Bonds | ||
Series B | ||
3.00%, due 7/1/48 | 8,250,000 | 5,783,073 |
Series B | ||
3.00%, due 7/1/58 | 22,990,000 | 15,769,547 |
Series B | ||
3.00%, due 7/1/58 | 4,000,000 | 2,619,291 |
Series B | ||
4.00%, due 7/1/58 | 5,155,000 | 4,426,491 |
Series B | ||
4.00%, due 7/1/58 | 1,750,000 | 1,585,659 |
Series A | ||
5.00%, due 7/1/58 | 5,715,000 | 6,023,763 |
Washington State Convention Center Public Facilities District, Revenue Bonds | ||
4.00%, due 7/1/58 | 8,910,000 | 7,650,831 |
Washington State Housing Finance Commission, Eliseo Project, Revenue Bonds (a) | ||
Series A | ||
4.00%, due 1/1/41 | 5,620,000 | 4,713,387 |
Series A | ||
4.00%, due 1/1/57 | 8,785,000 | 6,558,989 |
Washington State Housing Finance Commission, Riverview Retirement Community, Revenue Bonds | ||
5.00%, due 1/1/48 | 3,000,000 | 3,011,231 |
Whidbey Island Public Hospital District, Whidbey General Hospital, Limited General Obligation | ||
3.75%, due 12/1/32 | 100,000 | 89,533 |
4.00%, due 12/1/37 | 290,000 | 255,657 |
66 | MainStay MacKay High Yield Municipal Bond Fund |
Principal Amount | Value | |
Long-Term Municipal Bonds (continued) | ||
Washington (continued) | ||
Whidbey Island Public Hospital District, Unlimited General Obligation | ||
5.375%, due 12/1/39 | $ 9,670,000 | $ 8,685,574 |
5.50%, due 12/1/33 | 2,070,000 | 1,943,217 |
92,252,509 | ||
West Virginia 0.3% | ||
County of Ohio WV, Special District Excise Tax, The Highlands Project, Revenue Bonds | ||
Series B | ||
4.25%, due 3/1/35 | 4,000,000 | 3,875,312 |
Glenville State College, Board of Governors, Revenue Bonds | ||
5.25%, due 6/1/47 | 4,000,000 | 3,566,306 |
Monongalia County Commission Excise Tax District, University Town Centre, Revenue Bonds | ||
Series A | ||
4.125%, due 6/1/43 (a) | 1,000,000 | 950,550 |
Monongalia County Commission Excise Tax District, University Town Center, Revenue Bonds | ||
Series A | ||
5.50%, due 6/1/37 (a) | 4,000,000 | 4,192,564 |
West Virginia Hospital Finance Authority, Cabell Huntington Hospital Obligated Group, Revenue Bonds | ||
Series A | ||
4.00%, due 1/1/37 | 4,875,000 | 4,883,046 |
Series A | ||
4.00%, due 1/1/38 | 2,500,000 | 2,500,530 |
Series A | ||
4.125%, due 1/1/47 | 13,350,000 | 13,034,598 |
33,002,906 | ||
Wisconsin 2.0% | ||
Public Finance Authority, Wonderful Foundations Charter School, Revenue Bonds (a) | ||
Series B | ||
(zero coupon), due 1/1/60 | 71,700,000 | 5,392,112 |
Principal Amount | Value | |
Wisconsin (continued) | ||
Public Finance Authority, Wonderful Foundations Charter School, Revenue Bonds (a) (continued) | ||
Series A-1 | ||
5.00%, due 1/1/55 | $ 5,545,000 | $ 5,134,071 |
Public Finance Authority, Methodist University, Inc. (The), Revenue Bonds | ||
4.00%, due 3/1/26 | 755,000 | 751,787 |
4.00%, due 3/1/30 | 950,000 | 909,218 |
Public Finance Authority, North Carolina Leadership Charter Academy, Inc., Revenue Bonds | ||
Series A | ||
4.00%, due 6/15/29 (a) | 300,000 | 302,212 |
Public Finance Authority, National Gypsum Co., Revenue Bonds | ||
4.00%, due 8/1/35 (b) | 4,000,000 | 3,637,432 |
Public Finance Authority, Roseman University of Health Sciences, Revenue Bonds | ||
4.00%, due 4/1/42 (a) | 1,000,000 | 895,390 |
4.00%, due 4/1/52 (a) | 3,000,000 | 2,539,737 |
5.00%, due 4/1/30 (a) | 700,000 | 739,353 |
5.00%, due 4/1/40 (a) | 300,000 | 310,688 |
5.00%, due 4/1/50 (a) | 1,000,000 | 1,023,570 |
5.875%, due 4/1/45 | 6,350,000 | 6,745,648 |
Public Finance Authority, Fellowship Senior Living Project, Revenue Bonds | ||
Series A | ||
4.00%, due 1/1/46 | 2,955,000 | 2,786,299 |
Series A | ||
4.00%, due 1/1/52 | 11,785,000 | 10,824,797 |
Public Finance Authority, The Franklin School Of Innovation, Inc., Revenue Bonds | ||
Series A | ||
4.00%, due 2/1/46 | 5,505,000 | 5,291,160 |
5.00%, due 1/1/57 (a) | 3,200,000 | 2,930,194 |
Public Finance Authority, WakeMed Obligated Group, Revenue Bonds | ||
Series A | ||
4.00%, due 10/1/49 | 6,750,000 | 6,577,028 |
Principal Amount | Value | |
Long-Term Municipal Bonds (continued) | ||
Wisconsin (continued) | ||
Public Finance Authority, Appalachian State University Project, Revenue Bonds | ||
Series A, Insured: AGM | ||
4.00%, due 7/1/50 | $ 1,000,000 | $ 990,647 |
Series A, Insured: AGM | ||
4.00%, due 7/1/55 | 1,250,000 | 1,234,070 |
Series A, Insured: AGM | ||
4.00%, due 7/1/59 | 1,600,000 | 1,578,531 |
Public Finance Authority, College Achieve Paterson Charter School Project, Revenue Bonds | ||
Series A | ||
4.00%, due 6/15/52 (a) | 1,565,000 | 1,274,609 |
Public Finance Authority, Fargo Moorhead Met Area Flood, Green Bond, Revenue Bonds | ||
4.00%, due 3/31/56 (b) | 20,490,000 | 18,849,134 |
Public Finance Authority, Appalachian Regional Healthcare System Obligated Group, Revenue Bonds | ||
4.00%, due 7/1/56 | 2,250,000 | 1,997,231 |
Public Finance Authority, Givens Estates, Revenue Bonds | ||
4.00%, due 12/1/56 | 4,750,000 | 4,679,677 |
Public Finance Authority, Ultimate Medical Academy Project, Revenue Bonds (a) | ||
Series A | ||
5.00%, due 10/1/22 | 2,245,000 | 2,261,360 |
Series A | ||
5.00%, due 10/1/24 | 2,200,000 | 2,267,372 |
Series A | ||
5.00%, due 10/1/29 | 3,000,000 | 3,172,916 |
Series A | ||
5.00%, due 10/1/34 | 1,090,000 | 1,140,761 |
Series A | ||
5.00%, due 10/1/39 | 16,500,000 | 17,172,616 |
Public Finance Authority, Bancroft NeuroHealth Project, Revenue Bonds | ||
Series A | ||
5.00%, due 6/1/36 (a) | 750,000 | 765,482 |
Principal Amount | Value | |
Wisconsin (continued) | ||
Public Finance Authority, Carmelite System, Inc. Obligated Group (The), Revenue Bonds | ||
5.00%, due 1/1/40 | $ 4,085,000 | $ 4,359,510 |
5.00%, due 1/1/45 | 3,060,000 | 3,234,626 |
Public Finance Authority, TRIPS Obligated Group, Revenue Bonds | ||
Series B | ||
5.00%, due 7/1/42 (b) | 9,750,000 | 9,768,972 |
Public Finance Authority, NC A&T Real Estate Foundation LLC Project, Revenue Bonds | ||
Series A | ||
5.00%, due 6/1/44 | 1,350,000 | 1,425,643 |
Series A | ||
5.00%, due 6/1/49 | 6,875,000 | 7,221,401 |
Series B | ||
5.00%, due 6/1/49 | 2,720,000 | 2,857,049 |
Public Finance Authority, Guilford College, Revenue Bonds | ||
Series A | ||
5.00%, due 1/1/48 | 2,000,000 | 1,987,903 |
5.50%, due 1/1/47 | 5,910,000 | 6,043,831 |
Public Finance Authority, Coral Academy of Science Las Vegas, Revenue Bonds | ||
Series A | ||
5.00%, due 7/1/48 | 2,000,000 | 2,050,166 |
Public Finance Authority, Wilson Preparatory Academy, Revenue Bonds | ||
Series A | ||
5.00%, due 6/15/49 (a) | 1,100,000 | 1,122,476 |
Public Finance Authority, College Achieve Central Charter School, Revenue Bonds | ||
Series A | ||
5.00%, due 6/15/51 (a) | 2,145,000 | 2,068,420 |
Public Finance Authority, Grand Hyatt San Antonio Hotel Acquisition Project, Revenue Bonds, Senior Lien | ||
Series A | ||
5.00%, due 2/1/52 | 4,000,000 | 4,073,827 |
68 | MainStay MacKay High Yield Municipal Bond Fund |
Principal Amount | Value | |
Long-Term Municipal Bonds (continued) | ||
Wisconsin (continued) | ||
Public Finance Authority, Nevada State College, Revenue Bonds | ||
5.00%, due 5/1/55 (a) | $ 8,350,000 | $ 7,932,500 |
Public Finance Authority, Wingate University, Revenue Bonds | ||
Series A | ||
5.25%, due 10/1/38 | 3,250,000 | 3,409,099 |
Public Finance Authority, CHF-Cullowhee, LLC - Western Carolina University Project, Revenue Bonds | ||
Series A | ||
5.25%, due 7/1/47 | 2,000,000 | 2,056,075 |
Public Finance Authority, Wisconsin Airport Facilities, AFCO Investors II Portfolio, Revenue Bonds | ||
5.75%, due 10/1/31 (a) | 1,670,000 | 1,697,896 |
Public Finance Authority, Rose Villa Project, Revenue Bonds | ||
Series A | ||
5.75%, due 11/15/44 (a) | 1,400,000 | 1,429,335 |
Public Finance Authority, Lake Erie College Project, Revenue Bonds | ||
Series A | ||
5.875%, due 10/1/54 (a) | 2,000,000 | 1,763,651 |
Public Finance Authority, Affinity Living Group NC-12 Obligated Group, Revenue Bonds | ||
6.75%, due 11/1/24 (a) | 9,700,000 | 8,570,613 |
Public Finance Authority, Irving Convention Center Hotel Project, Revenue Bonds | ||
Series A-2 | ||
7.00%, due 1/1/50 (a) | 13,690,000 | 14,138,323 |
Wisconsin Health & Educational Facilities Authority, St. Camillus Health System, Inc., Revenue Bonds | ||
Series B-3 | ||
2.25%, due 11/1/26 | 3,000,000 | 3,007,164 |
Series B-2 | ||
2.55%, due 11/1/27 | 3,000,000 | 3,005,795 |
Principal Amount | Value | |
Wisconsin (continued) | ||
Wisconsin Health & Educational Facilities Authority, HOPE Christian Schools, Revenue Bonds | ||
3.00%, due 12/1/31 | $ 615,000 | $ 539,888 |
Wisconsin Health & Educational Facilities Authority, Rogers Memorial Hospital Inc. Obligated Group, Revenue Bonds | ||
Series A | ||
5.00%, due 7/1/49 | 2,400,000 | 2,565,979 |
Wisconsin Health & Educational Facilities Authority, Sauk-Prairie Memorial Hospital Inc. Obligated Group, Revenue Bonds | ||
Series A | ||
5.375%, due 2/1/48 | 4,400,000 | 4,436,877 |
214,942,121 | ||
Total Long-Term Municipal Bonds (Cost $10,178,713,266) | 9,643,562,819 | |
Short-Term Municipal Notes 6.9% | ||
Alabama 0.3% | ||
Black Belt Energy Gas District, Gas Project No.7, Revenue Bonds | ||
Series C-2 | ||
0.79%, due 10/1/52 (h) | 28,020,000 | 27,340,571 |
Hoover Industrial Development Board, United States Steel Corp., Green Bond, Revenue Bonds | ||
6.375%, due 11/1/50 (b)(h) | 4,000,000 | 4,579,286 |
31,919,857 | ||
California 1.7% | ||
California Infrastructure and Economic Development Bank, Brightline West Passenger Rail Project, Revenue Bonds | ||
Series A | ||
0.85%, due 1/1/50 (a)(b)(h) | 97,700,000 | 96,823,758 |
Principal Amount | Value | |
Short-Term Municipal Notes (continued) | ||
California (continued) | ||
Northern California Gas Authority No. 1, Gas Project, Revenue Bonds | ||
Series B | ||
1.368%, due 7/1/27 (h) | $ 30,150,000 | $ 29,760,013 |
Nuveen California AMT-Free Quality Municipal Income Fund | ||
Series A | ||
0.64%, due 10/1/47 (a)(h) | 3,000,000 | 3,000,000 |
Tender Option Bond Trust Receipts/Certificates, Revenue Bonds (a)(h) | ||
0.48%, due 8/1/45 | 11,680,000 | 11,680,000 |
Series 2017-XG0125 | ||
0.48%, due 8/15/47 | 19,955,000 | 19,955,000 |
Series 2020-XL0155 | ||
0.48%, due 4/1/49 | 4,255,000 | 4,255,000 |
Series 2020-XF2904 | ||
0.48%, due 7/1/50 | 11,325,000 | 11,325,000 |
176,798,771 | ||
Florida 0.4% | ||
City of Gainesville FL, Revenue Bonds | ||
Series B | ||
0.32%, due 10/1/42 (h) | 410,000 | 410,000 |
Florida Development Finance Corp., Brightline Trains Florida LLC, Revenue Bonds | ||
Series A | ||
0.30%, due 12/1/56 (b)(h) | 10,465,000 | 10,437,891 |
Lee Memorial Health System, Lee Memorial Health System Obligated Group, Revenue Bonds | ||
Series B | ||
0.69%, due 4/1/49 (h) | 13,700,000 | 13,700,000 |
Tender Option Bond Trust Receipts/Certificates, Revenue Bonds | ||
Series 2020-XF2920 | ||
0.48%, due 12/1/48 (a)(h) | 21,170,000 | 21,170,000 |
45,717,891 | ||
Principal Amount | Value | |
Georgia 0.2% | ||
Development Authority of Burke County (The), Georgia Power Company Plant Vogtle Project, Revenue Bonds | ||
0.60%, due 11/1/48 (h) | $ 18,135,000 | $ 18,135,000 |
Illinois 0.0% ‡ | ||
Tender Option Bond Trust Receipts/Certificates, Unlimited General Obligation | ||
Series 2015-XF1010, Insured: AGM-CR | ||
0.48%, due 2/1/39 (a)(h) | 3,600,000 | 3,600,000 |
Indiana 0.4% | ||
Indiana Finance Authority, Fulcrum Centerpoint LLC, Revenue Bonds | ||
0.28%, due 12/15/45 (b)(h) | 43,900,000 | 43,313,689 |
Kentucky 0.1% | ||
County of Meade KY, Nucor Corp., Green Bond, Revenue Bonds | ||
Series A-1 | ||
0.59%, due 7/1/60 (b)(h) | 7,860,000 | 7,860,000 |
Tender Option Bond Trust Receipts/Certificates, Revenue Bonds | ||
Series 2017-XG0123 | ||
0.48%, due 6/1/45 (a)(h) | 5,195,000 | 5,195,000 |
13,055,000 | ||
Louisiana 0.1% | ||
Parish of St. John the Baptist LA, Marathon Oil Corp. Project, Revenue Bonds | ||
Series B-2 | ||
2.375%, due 6/1/37 (h) | 12,200,000 | 11,545,404 |
Massachusetts 0.1% | ||
Massachusetts Development Finance Agency, Boston University, Revenue Bonds | ||
Series U6C | ||
0.30%, due 10/1/42 (h) | 8,700,000 | 8,700,000 |
70 | MainStay MacKay High Yield Municipal Bond Fund |
Principal Amount | Value | |
Short-Term Municipal Notes (continued) | ||
Missouri 0.5% | ||
Rib Floater Trust Various States, Revenue Bonds | ||
Series 2019-016 | ||
0.48%, due 6/1/45 (a)(h) | $ 52,260,000 | $ 52,260,000 |
Nevada 0.0% ‡ | ||
Tender Option Bond Trust Receipts/Certificates, Revenue Bonds | ||
Series 2019-XF2806 | �� | |
0.48%, due 7/1/49 (a)(h) | 3,500,000 | 3,500,000 |
New Jersey 1.3% | ||
New Jersey Turnpike Authority, Revenue Bonds | ||
Series D-1 | ||
1.019%, due 1/1/24 (h) | 64,900,000 | 65,196,314 |
Tender Option Bond Trust Receipts/Certificates, Revenue Bonds (a)(h) | ||
Series 2020-XX1140 | ||
0.48%, due 6/15/31 | 1,400,000 | 1,400,000 |
Series 2020-YX1160 | ||
0.48%, due 6/15/37 | 8,220,000 | 8,220,000 |
Series 2016-XF2393 | ||
0.48%, due 6/15/41 | 7,900,000 | 7,900,000 |
Series 2017-XL0052 | ||
0.48%, due 6/15/42 | 6,500,000 | 6,500,000 |
Series 2020-XF2865 | ||
0.48%, due 11/1/44 | 4,500,000 | 4,500,000 |
Series 2020-YX1162 | ||
0.48%, due 6/15/45 | 10,080,000 | 10,080,000 |
Series 2021-XL0163 | ||
0.48%, due 6/15/46 | 5,885,000 | 5,885,000 |
Series 2018-XF2525 | ||
0.48%, due 6/15/47 | 3,900,000 | 3,900,000 |
Series 2018-XG0205 | ||
0.48%, due 6/15/50 | 13,100,000 | 13,100,000 |
Series 2019-XG0258 | ||
0.48%, due 6/15/50 | 10,365,000 | 10,365,000 |
137,046,314 | ||
Principal Amount | Value | |
New York 0.6% | ||
City of New York NY, Limited General Obligation (h) | ||
Series 3 | ||
0.63%, due 4/1/42 | $ 10,750,000 | $ 10,750,000 |
Series 2 | ||
0.64%, due 4/1/42 | 9,650,000 | 9,650,000 |
Metropolitan Transportation Authority, Revenue Bonds | ||
Series E-1 | ||
0.35%, due 11/15/50 (h) | 1,110,000 | 1,110,000 |
Tender Option Bond Trust Receipts/Certificates, Revenue Bonds (a)(h) | ||
Series 2020-XL0153 | ||
0.48%, due 7/1/45 | 2,500,000 | 2,500,000 |
Series 2020-XG0290 | ||
0.48%, due 11/15/52 | 29,165,000 | 29,165,000 |
Series 2020-XX1156 | ||
0.48%, due 11/15/53 | 8,865,000 | 8,865,000 |
62,040,000 | ||
North Carolina 0.0% ‡ | ||
Charlotte-Mecklenburg Hospital Authority (The), Atrium Health Obligated Group, Revenue Bonds | ||
Series B | ||
0.33%, due 1/15/38 (h) | 2,000,000 | 2,000,000 |
Pennsylvania 0.2% | ||
Pennsylvania Economic Development Financing Authority, Republic Services, Inc., Revenue Bonds | ||
Series B-2 | ||
0.30%, due 4/1/49 (b)(h) | 5,750,000 | 5,731,389 |
Tender Option Bond Trust Receipts/Certificates, Revenue Bonds (a)(h) | ||
Series 2017-XX1044 | ||
0.48%, due 12/1/42 | 6,365,000 | 6,365,000 |
Series 2018-XX1094 | ||
0.48%, due 4/1/47 | 5,260,000 | 5,260,000 |
Series 2017-XX1048 | ||
0.48%, due 10/1/52 | 6,320,000 | 6,320,000 |
23,676,389 | ||
Principal Amount | Value | |
Short-Term Municipal Notes (continued) | ||
Puerto Rico 0.1% | ||
Puerto Rico Electric Power Authority, Revenue Bonds | ||
Series UU, Insured: AGM | ||
1.168%, due 7/1/29 (h) | $ 4,690,000 | $ 4,732,324 |
Tennessee 0.0% ‡ | ||
Tender Option Bond Trust Receipts/Certificates, Revenue Bonds | ||
Series 2018-XF2576 | ||
0.48%, due 7/1/40 (a)(h) | 2,000,000 | 2,000,000 |
Texas 0.5% | ||
Texas Municipal Gas Acquisition & Supply Corp. II, Revenue Bonds | ||
Series C | ||
1.235%, due 9/15/27 (h) | 48,800,000 | 47,902,573 |
Virginia 0.0% ‡ | ||
Virginia Small Business Financing Authority, University Real Estate Foundation, Revenue Bonds | ||
0.32%, due 7/1/30 (h) | 60,000 | 60,000 |
West Virginia 0.0% ‡ | ||
West Virginia Economic Development Authority, Arch Resources, Inc. Project, Revenue Bonds | ||
4.125%, due 7/1/45 (b)(h) | 2,400,000 | 2,412,817 |
Wisconsin 0.4% | ||
Nuveen Quality Municipal Income Fund | ||
Series D | ||
0.64%, due 3/1/29 (h) | 35,000,000 | 35,000,000 |
Principal Amount | Value | |
Wisconsin (continued) | ||
Tender Option Bond Trust Receipts/Certificates, Revenue Bonds | ||
Series 2020-XL0147, Insured: AGM | ||
0.48%, due 6/1/45 (a)(h) | $ 10,385,000 | $ 10,385,000 |
45,385,000 | ||
Total Short-Term Municipal Notes (Cost $738,615,103) | 735,801,029 | |
Total Municipal Bonds (Cost $10,917,328,369) | 10,379,363,848 | |
Long-Term Bonds 0.1% | ||
Corporate Bonds 0.1% | ||
Commercial Services 0.1% | ||
Howard University | ||
Series 21A | ||
4.756%, due 10/1/51 | 5,250,000 | 4,910,379 |
Wildflower Improvement Association | ||
6.625%, due 3/1/31 (a) | 4,606,555 | 4,549,111 |
Total Long-Term Bonds (Cost $9,780,644) | 9,459,490 | |
Shares | Value | |
Closed-End Funds 1.1% | ||
California 0.4% | ||
BlackRock MuniHoldings California Quality Fund, Inc. | 620,785 | 7,443,212 |
Nuveen California Quality Municipal Income Fund, 0.64%, due 10/1/47 (a)(i) | 37,100,000 | 37,100,000 |
44,543,212 | ||
Massachusetts 0.1% | ||
BlackRock Municipal Income Fund, Inc. | 263,968 | 3,236,248 |
DWS Municipal Income Trust | 131,002 | 1,266,789 |
Pioneer Municipal High Income Advantage Fund, Inc. | 268,191 | 2,400,309 |
Pioneer Municipal High Income Fund Trust | 325,717 | 3,117,112 |
10,020,458 | ||
72 | MainStay MacKay High Yield Municipal Bond Fund |
Shares | Value | |
Closed-End Funds (continued) | ||
Michigan 0.0% ‡ | ||
BlackRock MuniYield Michigan Quality Fund, Inc. | 277,877 | $ 3,512,365 |
Multi-State 0.2% | ||
BlackRock Municipal 2030 Target Term Trust | 427,334 | 9,491,088 |
BlackRock Municipal Income Quality Trust | 21,958 | 268,327 |
BlackRock MuniHoldings Fund, Inc. | 146,484 | 1,885,249 |
BlackRock MuniYield Quality Fund II, Inc. | 588,091 | 6,516,048 |
BlackRock MuniYield Quality Fund, Inc. | 287,227 | 3,676,506 |
21,837,218 | ||
New Jersey 0.1% | ||
BlackRock MuniHoldings New Jersey Quality Fund, Inc. | 370,721 | 4,656,256 |
New York 0.3% | ||
BlackRock MuniHoldings New York Quality Fund, Inc. | 525,108 | 6,007,236 |
BlackRock MuniYield New York Quality Fund, Inc. | 543,595 | 5,881,698 |
BlackRock New York Municipal Income Trust | 26,795 | 299,032 |
Nuveen New York Quality Municipal Income Fund, 0.64%, due 5/1/47 (a)(b) | 19,500,000 | 19,500,000 |
31,687,966 | ||
Shares | Value | |
Pennsylvania 0.0% ‡ | ||
Invesco Pennsylvania Value Municipal Income Trust | 68,544 | $ 746,444 |
Total Closed-End Funds (Cost $127,399,158) | 117,003,919 | |
Total Investments (Cost $11,054,508,171) | 98.9% | 10,505,827,257 |
Other Assets, Less Liabilities | 1.1 | 120,656,771 |
Net Assets | 100.0% | $ 10,626,484,028 |
† | Percentages indicated are based on Fund net assets. |
‡ | Less than one-tenth of a percent. |
(a) | May be sold to institutional investors only under Rule 144A or securities offered pursuant to Section 4(a)(2) of the Securities Act of 1933, as amended. |
(b) | Interest on these securities was subject to alternative minimum tax. |
(c) | Step coupon—Rate shown was the rate in effect as of April 30, 2022. |
(d) | Delayed delivery security. |
(e) | Issue in default. |
(f) | Issue in non-accrual status. |
(g) | Illiquid security—As of April 30, 2022, the total market value deemed illiquid under procedures approved by the Board of Trustees was $3,184,600, which represented less than one-tenth of a percent of the Fund’s net assets. |
(h) | Variable-rate demand notes (VRDNs)—Provide the right to sell the security at face value on either that day or within the rate-reset period. VRDNs will normally trade as if the maturity is the earlier put date, even though stated maturity is longer. The interest rate is reset on the put date at a stipulated daily, weekly, monthly, quarterly, or other specified time interval to reflect current market conditions. These securities do not indicate a reference rate and spread in their description. The maturity date shown is the final maturity. |
(i) | Floating rate—Rate shown was the rate in effect as of April 30, 2022. |
Type | Number of Contracts | Expiration Date | Value at Trade Date | Current Notional Amount | Unrealized Appreciation (Depreciation)2 |
Short Contracts | |||||
U.S. Treasury Long Bonds | (250) | June 2022 | $ (38,517,597) | $ (35,171,875) | $ 3,345,722 |
1. | As of April 30, 2022, cash in the amount of $875,000 was on deposit with a broker or futures commission merchant for futures transactions. |
2. | Represents the difference between the value of the contracts at the time they were opened and the value as of April 30, 2022. |
Abbreviation(s): |
ACA—ACA Financial Guaranty Corp. |
AGC—Assured Guaranty Corp. |
AGM—Assured Guaranty Municipal Corp. |
AMBAC—Ambac Assurance Corp. |
BAM—Build America Mutual Assurance Co. |
CHF—Collegiate Housing Foundation |
CR—Custodial Receipts |
FGIC—Financial Guaranty Insurance Company |
GGP—Guernsey Pound |
ICC—Insured Custody Certificates |
MUN GOVT GTD—Municipal Government Guaranteed |
NATL-RE—National Public Finance Guarantee Corp. |
SD CRED PROG—School District Credit Enhancement Program |
UT CSCE—Utah Charter School Credit Enhancement Program |
Description | Quoted Prices in Active Markets for Identical Assets (Level 1) | Significant Other Observable Inputs (Level 2) | Significant Unobservable Inputs (Level 3) | Total |
Asset Valuation Inputs | ||||
Investments in Securities (a) | ||||
Municipal Bonds | ||||
Long-Term Municipal Bonds | $ — | $ 9,643,562,819 | $ — | $ 9,643,562,819 |
Short-Term Municipal Notes | — | 735,801,029 | — | 735,801,029 |
Total Municipal Bonds | — | 10,379,363,848 | — | 10,379,363,848 |
Long-Term Bonds | ||||
Corporate Bonds | — | 9,459,490 | — | 9,459,490 |
Total Corporate Bonds | — | 9,459,490 | — | 9,459,490 |
Closed-End Funds | 60,403,919 | 56,600,000 | — | 117,003,919 |
Total Investments in Securities | 60,403,919 | 10,445,423,338 | — | 10,505,827,257 |
Other Financial Instruments | ||||
Futures Contracts (b) | 3,345,722 | — | — | 3,345,722 |
Total Investments in Securities and Other Financial Instruments | $ 63,749,641 | $ 10,445,423,338 | $ — | $ 10,509,172,979 |
(a) | For a complete listing of investments and their industries, see the Portfolio of Investments. |
(b) | The value listed for these securities reflects unrealized appreciation (depreciation) as shown on the Portfolio of Investments. |
74 | MainStay MacKay High Yield Municipal Bond Fund |
Assets | |
Investment in securities, at value (identified cost $11,054,508,171) | $10,505,827,257 |
Cash | 15,039,548 |
Cash collateral on deposit at broker for futures contracts | 875,000 |
Receivables: | |
Investment securities sold | 240,016,463 |
Dividends and interest | 124,534,806 |
Fund shares sold | 52,350,227 |
Variation margin on futures contracts | 132,814 |
Other assets | 458,646 |
Total assets | 10,939,234,761 |
Liabilities | |
Payables: | |
Investment securities purchased | 251,262,473 |
Fund shares redeemed | 45,255,998 |
Manager (See Note 3) | 4,752,633 |
Transfer agent (See Note 3) | 845,646 |
NYLIFE Distributors (See Note 3) | 723,005 |
Shareholder communication | 113,057 |
Custodian | 50,729 |
Professional fees | 31,353 |
Distributions payable | 9,715,839 |
Total liabilities | 312,750,733 |
Net assets | $10,626,484,028 |
Composition of Net Assets | |
Shares of beneficial interest outstanding (par value of $.001 per share) unlimited number of shares authorized | $885,054 |
Additional paid-in-capital | 11,213,198,526 |
11,214,083,580 | |
Total distributable earnings (loss) | (587,599,552) |
Net assets | $10,626,484,028 |
Class A | |
Net assets applicable to outstanding shares | $2,275,610,869 |
Shares of beneficial interest outstanding | 189,542,294 |
Net asset value per share outstanding | $12.01 |
Maximum sales charge (4.50% of offering price) | 0.57 |
Maximum offering price per share outstanding | $12.58 |
Investor Class | |
Net assets applicable to outstanding shares | $4,296,294 |
Shares of beneficial interest outstanding | 358,266 |
Net asset value per share outstanding | $11.99 |
Maximum sales charge (4.00% of offering price) | 0.50 |
Maximum offering price per share outstanding | $12.49 |
Class C | |
Net assets applicable to outstanding shares | $275,468,320 |
Shares of beneficial interest outstanding | 23,001,267 |
Net asset value and offering price per share outstanding | $11.98 |
Class I | |
Net assets applicable to outstanding shares | $6,594,355,348 |
Shares of beneficial interest outstanding | 549,138,030 |
Net asset value and offering price per share outstanding | $12.01 |
Class R6 | |
Net assets applicable to outstanding shares | $1,476,753,197 |
Shares of beneficial interest outstanding | 123,013,800 |
Net asset value and offering price per share outstanding | $12.00 |
Investment Income (Loss) | |
Income | |
Interest | $194,659,861 |
Dividends | 1,579,746 |
Other | 56 |
Total income | 196,239,663 |
Expenses | |
Manager (See Note 3) | 31,416,808 |
Distribution/Service—Class A (See Note 3) | 3,368,691 |
Distribution/Service—Investor Class (See Note 3) | 6,166 |
Distribution/Service—Class C (See Note 3) | 1,597,876 |
Transfer agent (See Note 3) | 2,774,861 |
Professional fees | 302,023 |
Registration | 192,559 |
Shareholder communication | 155,225 |
Custodian | 138,110 |
Trustees | 117,997 |
Miscellaneous | 172,998 |
Total expenses | 40,243,314 |
Net investment income (loss) | 155,996,349 |
Realized and Unrealized Gain (Loss) | |
Net realized gain (loss) on: | |
Unaffiliated investment transactions | 25,004,413 |
In-kind Transactions | 17,358,637 |
Futures transactions | 2,063,566 |
Net realized gain (loss) | 44,426,616 |
Net change in unrealized appreciation (depreciation) on: | |
Unaffiliated investments | (1,401,186,227) |
Futures contracts | 2,984,981 |
Net change in unrealized appreciation (depreciation) | (1,398,201,246) |
Net realized and unrealized gain (loss) | (1,353,774,630) |
Net increase (decrease) in net assets resulting from operations | $(1,197,778,281) |
76 | MainStay MacKay High Yield Municipal Bond Fund |
for the six months ended April 30, 2022 (Unaudited) and the year ended October 31, 2021
2022 | 2021 | |
Increase (Decrease) in Net Assets | ||
Operations: | ||
Net investment income (loss) | $155,996,349 | $304,470,388 |
Net realized gain (loss) | 44,426,616 | 21,128,424 |
Net change in unrealized appreciation (depreciation) | (1,398,201,246) | 518,344,344 |
Net increase (decrease) in net assets resulting from operations | (1,197,778,281) | 843,943,156 |
Distributions to shareholders: | ||
Class A | (36,773,658) | (71,248,699) |
Investor Class | (67,311) | (155,076) |
Class C | (3,163,157) | (7,721,003) |
Class I | (115,897,915) | (217,243,784) |
Class R6 | (19,744,406) | (32,089,827) |
Total distributions to shareholders | (175,646,447) | (328,458,389) |
Capital share transactions: | ||
Net proceeds from sales of shares | 2,500,664,897 | 4,914,449,892 |
Net asset value of shares issued to shareholders in reinvestment of distributions | 120,240,975 | 220,954,069 |
Cost of shares redeemed | (2,503,197,247) | (1,977,955,717) |
Redemptions in-kind | (294,446,031) | — |
Increase (decrease) in net assets derived from capital share transactions | (176,737,406) | 3,157,448,244 |
Net increase (decrease) in net assets | (1,550,162,134) | 3,672,933,011 |
Net Assets | ||
Beginning of period | 12,176,646,162 | 8,503,713,151 |
End of period | $10,626,484,028 | $12,176,646,162 |
Six months ended April 30, 2022* | Year Ended October 31, | |||||
Class A | 2021 | 2020 | 2019 | 2018 | 2017 | |
Net asset value at beginning of period | $13.49 | $12.75 | $12.98 | $12.33 | $12.32 | $12.52 |
Net investment income (loss) | 0.16(a) | 0.36(a) | 0.40 | 0.47 | 0.48 | 0.49 |
Net realized and unrealized gain (loss) | (1.46) | 0.77 | (0.20) | 0.66 | 0.01 | (0.19) |
Total from investment operations | (1.30) | 1.13 | 0.20 | 1.13 | 0.49 | 0.30 |
Less distributions: | ||||||
From net investment income | (0.18) | (0.39) | (0.43) | (0.47) | (0.48) | (0.49) |
From net realized gain on investments | — | — | (0.00)‡ | (0.01) | — | (0.01) |
Total distributions | (0.18) | (0.39) | (0.43) | (0.48) | (0.48) | (0.50) |
Net asset value at end of period | $12.01 | $13.49 | $12.75 | $12.98 | $12.33 | $12.32 |
Total investment return (b) | (9.73)% | 8.93% | 1.60% | 9.28% | 4.03% | 2.48% |
Ratios (to average net assets)/Supplemental Data: | ||||||
Net investment income (loss) | 2.40%†† | 2.66% | 3.15% | 3.69% | 3.84% | 3.99% |
Net expenses (c) | 0.84%†† | 0.84% | 0.86% | 0.87% | 0.87% | 0.87% |
Portfolio turnover rate | 30% (d)(e) | 14%(d) | 37%(d) | 27%(d) | 32% | 34% |
Net assets at end of period (in 000’s) | $2,275,611 | $2,696,103 | $2,073,226 | $2,210,862 | $1,616,061 | $882,736 |
* | Unaudited. |
‡ | Less than one cent per share. |
†† | Annualized. |
(a) | Per share data based on average shares outstanding during the period. |
(b) | Total investment return is calculated exclusive of sales charges and assumes the reinvestment of dividends and distributions. For periods of less than one year, total return is not annualized. |
(c) | In addition to the fees and expenses which the Fund bears directly, it also indirectly bears a pro-rata share of the fees and expenses of the underlying funds in which it invests. Such indirect expenses are not included in the above expense ratios. |
(d) | The portfolio turnover rate includes variable rate demand notes. |
(e) | The portfolio turnover rate excludes in-kind transactions. |
78 | MainStay MacKay High Yield Municipal Bond Fund |
Six months ended April 30, 2022* | Year Ended October 31, | |||||
Investor Class | 2021 | 2020 | 2019 | 2018 | 2017 | |
Net asset value at beginning of period | $13.47 | $12.73 | $12.96 | $12.32 | $12.30 | $12.50 |
Net investment income (loss) | 0.16(a) | 0.36(a) | 0.40 | 0.47 | 0.48 | 0.49 |
Net realized and unrealized gain (loss) | (1.46) | 0.77 | (0.20) | 0.65 | 0.02 | (0.19) |
Total from investment operations | (1.30) | 1.13 | 0.20 | 1.12 | 0.50 | 0.30 |
Less distributions: | ||||||
From net investment income | (0.18) | (0.39) | (0.43) | (0.47) | (0.48) | (0.49) |
From net realized gain on investments | — | — | (0.00)‡ | (0.01) | — | (0.01) |
Total distributions | (0.18) | (0.39) | (0.43) | (0.48) | (0.48) | (0.50) |
Net asset value at end of period | $11.99 | $13.47 | $12.73 | $12.96 | $12.32 | $12.30 |
Total investment return (b) | (9.75)% | 8.92% | 1.59% | 9.19% | 4.10% | 2.45% |
Ratios (to average net assets)/Supplemental Data: | ||||||
Net investment income (loss) | 2.40%†† | 2.69% | 3.15% | 3.69% | 3.85% | 3.98% |
Net expenses (c) | 0.85%†† | 0.86% | 0.87% | 0.88% | 0.89% | 0.90% |
Portfolio turnover rate | 30% (d)(e) | 14%(d) | 37%(d) | 27%(d) | 32% | 34% |
Net assets at end of period (in 000's) | $4,296 | $5,107 | $5,211 | $5,449 | $4,383 | $3,483 |
* | Unaudited. |
‡ | Less than one cent per share. |
†† | Annualized. |
(a) | Per share data based on average shares outstanding during the period. |
(b) | Total investment return is calculated exclusive of sales charges and assumes the reinvestment of dividends and distributions. For periods of less than one year, total return is not annualized. |
(c) | In addition to the fees and expenses which the Fund bears directly, it also indirectly bears a pro-rata share of the fees and expenses of the underlying funds in which it invests. Such indirect expenses are not included in the above expense ratios. |
(d) | The portfolio turnover rate includes variable rate demand notes. |
(e) | The portfolio turnover rate excludes in-kind transactions. |
Six months ended April 30, 2022* | Year Ended October 31, | |||||
Class C | 2021 | 2020 | 2019 | 2018 | 2017 | |
Net asset value at beginning of period | $13.46 | $12.71 | $12.95 | $12.30 | $12.29 | $12.49 |
Net investment income (loss) | 0.11(a) | 0.26(a) | 0.29 | 0.37 | 0.39 | 0.39 |
Net realized and unrealized gain (loss) | (1.46) | 0.78 | (0.20) | 0.66 | 0.01 | (0.19) |
Total from investment operations | (1.35) | 1.04 | 0.09 | 1.03 | 0.40 | 0.20 |
Less distributions: | ||||||
From net investment income | (0.13) | (0.29) | (0.33) | (0.37) | (0.39) | (0.39) |
From net realized gain on investments | — | — | (0.00)‡ | (0.01) | — | (0.01) |
Total distributions | (0.13) | (0.29) | (0.33) | (0.38) | (0.39) | (0.40) |
Net asset value at end of period | $11.98 | $13.46 | $12.71 | $12.95 | $12.30 | $12.29 |
Total investment return (b) | (10.10)% | 8.20% | 0.75% | 8.47% | 3.24% | 1.69% |
Ratios (to average net assets)/Supplemental Data: | ||||||
Net investment income (loss) | 1.65%†† | 1.95% | 2.41% | 2.94% | 3.11% | 3.22% |
Net expenses (c) | 1.61%†† | 1.61% | 1.62% | 1.63% | 1.63% | 1.65% |
Portfolio turnover rate | 30% (d)(e) | 14%(d) | 37%(d) | 27%(d) | 32% | 34% |
Net assets at end of period (in 000’s) | $275,468 | $340,700 | $355,498 | $433,318 | $396,092 | $395,042 |
* | Unaudited. |
‡ | Less than one cent per share. |
†† | Annualized. |
(a) | Per share data based on average shares outstanding during the period. |
(b) | Total investment return is calculated exclusive of sales charges and assumes the reinvestment of dividends and distributions. For periods of less than one year, total return is not annualized. |
(c) | In addition to the fees and expenses which the Fund bears directly, it also indirectly bears a pro-rata share of the fees and expenses of the underlying funds in which it invests. Such indirect expenses are not included in the above expense ratios. |
(d) | The portfolio turnover rate includes variable rate demand notes. |
(e) | The portfolio turnover rate excludes in-kind transactions. |
80 | MainStay MacKay High Yield Municipal Bond Fund |
Six months ended April 30, 2022* | Year Ended October 31, | |||||
Class I | 2021 | 2020 | 2019 | 2018 | 2017 | |
Net asset value at beginning of period | $13.49 | $12.75 | $12.98 | $12.34 | $12.32 | $12.52 |
Net investment income (loss) | 0.17(a) | 0.39(a) | 0.45 | 0.50 | 0.51 | 0.52 |
Net realized and unrealized gain (loss) | (1.45) | 0.77 | (0.22) | 0.65 | 0.02 | (0.19) |
Total from investment operations | (1.28) | 1.16 | 0.23 | 1.15 | 0.53 | 0.33 |
Less distributions: | ||||||
From net investment income | (0.20) | (0.42) | (0.46) | (0.50) | (0.51) | (0.52) |
From net realized gain on investments | — | — | (0.00)‡ | (0.01) | — | (0.01) |
Total distributions | (0.20) | (0.42) | (0.46) | (0.51) | (0.51) | (0.53) |
Net asset value at end of period | $12.01 | $13.49 | $12.75 | $12.98 | $12.34 | $12.32 |
Total investment return (b) | (9.63)% | 9.20% | 1.86% | 9.46% | 4.38% | 2.74% |
Ratios (to average net assets)/Supplemental Data: | ||||||
Net investment income (loss) | 2.66%†† | 2.90% | 3.38% | 3.93% | 4.09% | 4.21% |
Net expenses (c) | 0.59%†† | 0.59% | 0.61% | 0.62% | 0.62% | 0.62% |
Portfolio turnover rate | 30% (d)(e) | 14%(d) | 37%(d) | 27%(d) | 32% | 34% |
Net assets at end of period (in 000’s) | $6,594,355 | $7,894,324 | $6,063,243 | $4,415,639 | $3,024,665 | $2,094,251 |
* | Unaudited. |
‡ | Less than one cent per share. |
†† | Annualized. |
(a) | Per share data based on average shares outstanding during the period. |
(b) | Total investment return is calculated exclusive of sales charges and assumes the reinvestment of dividends and distributions. Class I shares are not subject to sales charges. For periods of less than one year, total return is not annualized. |
(c) | In addition to the fees and expenses which the Fund bears directly, it also indirectly bears a pro-rata share of the fees and expenses of the underlying funds in which it invests. Such indirect expenses are not included in the above expense ratios. |
(d) | The portfolio turnover rate includes variable rate demand notes. |
(e) | The portfolio turnover rate excludes in-kind transactions. |
Six months ended April 30, 2022* | Year Ended October 31, | November 1, 2019^ through October 31, | |
Class R6 | 2021 | 2020 | |
Net asset value at beginning of period | $13.49 | $12.74 | $12.98 |
Net investment income (loss) (a) | 0.18 | 0.39 | 0.43 |
Net realized and unrealized gain (loss) | (1.47) | 0.79 | (0.21) |
Total from investment operations | (1.29) | 1.18 | 0.22 |
Less distributions: | |||
From net investment income | (0.20) | (0.43) | (0.46) |
From net realized gain on investments | — | — | (0.00)‡ |
Total distributions | (0.20) | (0.43) | (0.46) |
Net asset value at end of period | $12.00 | $13.49 | $12.74 |
Total investment return (b) | (9.67)% | 9.34% | 1.80% |
Ratios (to average net assets)/Supplemental Data: | |||
Net investment income (loss) | 2.73%†† | 2.91% | 3.40% |
Net expenses (c) | 0.54%†† | 0.54% | 0.56% |
Portfolio turnover rate (d) | 30%(e) | 14% | 37% |
Net assets at end of period (in 000’s) | $1,476,753 | $1,240,412 | $6,535 |
* | Unaudited. |
^ | Inception date. |
‡ | Less than one cent per share. |
†† | Annualized. |
(a) | Per share data based on average shares outstanding during the period. |
(b) | Total investment return is calculated exclusive of sales charges and assumes the reinvestment of dividends and distributions. Class R6 shares are not subject to sales charges. For periods of less than one year, total return is not annualized. |
(c) | In addition to the fees and expenses which the Fund bears directly, it also indirectly bears a pro-rata share of the fees and expenses of the underlying funds in which it invests. Such indirect expenses are not included in the above expense ratios. |
(d) | The portfolio turnover rate includes variable rate demand notes. |
(e) | The portfolio turnover rate excludes in-kind transactions. |
82 | MainStay MacKay High Yield Municipal Bond Fund |
Class | Commenced Operations |
Class A | March 31, 2010 |
Investor Class | March 31, 2010 |
Class C | March 31, 2010 |
Class I | March 31, 2010 |
Class R6 | November 1, 2019 |
SIMPLE Class | N/A* |
* | SIMPLE Class shares were registered for sale effective as of August 31, 2020 but have not yet commenced operations. |
• Benchmark yields | • Reported trades |
• Broker/dealer quotes | • Issuer spreads |
• Two-sided markets | • Benchmark securities |
• Bids/offers | • Reference data (corporate actions or material event notices) |
• Industry and economic events | • Comparable bonds |
• Monthly payment information |
84 | MainStay MacKay High Yield Municipal Bond Fund |
86 | MainStay MacKay High Yield Municipal Bond Fund |
Asset Derivatives | Interest Rate Contracts Risk | Total |
Futures Contracts - Net Assets—Net unrealized appreciation on futures contracts (a) | $3,345,722 | $3,345,722 |
Total Fair Value | $3,345,722 | $3,345,722 |
(a) | Includes cumulative appreciation (depreciation) of futures contracts as reported in the Portfolio of Investments. Only current day’s variation margin is reported within the Statement of Assets and Liabilities. |
Net Realized Gain (Loss) from: | Interest Rate Contracts Risk | Total |
Futures Contracts | $2,063,566 | $2,063,566 |
Total Net Realized Gain (Loss) | $2,063,566 | $2,063,566 |
Net Change in Unrealized Appreciation (Depreciation) | Interest Rate Contracts Risk | Total |
Futures Contracts | $2,984,981 | $2,984,981 |
Total Net Change in Unrealized Appreciation (Depreciation) | $2,984,981 | $2,984,981 |
Average Notional Amount | Total |
Futures Contracts Short | $(38,567,708) |
88 | MainStay MacKay High Yield Municipal Bond Fund |
Class | Expense | Waived |
Class A | $680,911 | $— |
Investor Class | 1,607 | — |
Class C | 104,041 | — |
Class I | 1,962,508 | — |
Class R6 | 25,794 | — |
Class R6 | $25,061 | 0.0%‡ |
‡ | Less than one-tenth of a percent. |
Federal Tax Cost | Gross Unrealized Appreciation | Gross Unrealized (Depreciation) | Net Unrealized Appreciation/ (Depreciation) | |
Investments in Securities | $11,115,867,980 | $135,029,104 | $(745,069,827) | $(610,040,723) |
Capital Loss Available Through | Short-Term Capital Loss Amounts (000’s) | Long-Term Capital Loss Amounts (000’s) |
Unlimited | $6,190 | $— |
2021 | |
Distributions paid from: | |
Ordinary Income | $37,325,613 |
Exempt Interest Dividends | 291,132,776 |
Total | $328,458,389 |
Class A | Shares | Amount |
Six-month period ended April 30, 2022: | ||
Shares sold | 54,321,527 | $713,575,104 |
Shares issued to shareholders in reinvestment of distributions | 2,460,798 | 31,943,863 |
Shares redeemed | (46,019,462) | (588,205,641) |
Shares redeemed in connection with in-kind transactions | (22,519,084) | (294,446,031) |
Net increase (decrease) in shares outstanding before conversion | (11,756,221) | (137,132,705) |
Shares converted into Class A (See Note 1) | 1,647,766 | 21,617,804 |
Shares converted from Class A (See Note 1) | (222,046) | (2,774,243) |
Net increase (decrease) | (10,330,501) | $(118,289,144) |
Year ended October 31, 2021: | ||
Shares sold | 63,834,874 | $857,681,513 |
Shares issued to shareholders in reinvestment of distributions | 4,486,821 | 60,352,813 |
Shares redeemed | (32,301,553) | (434,713,985) |
Net increase (decrease) in shares outstanding before conversion | 36,020,142 | 483,320,341 |
Shares converted into Class A (See Note 1) | 1,356,462 | 18,372,583 |
Shares converted from Class A (See Note 1) | (166,586) | (2,213,344) |
Net increase (decrease) | 37,210,018 | $499,479,580 |
Investor Class | Shares | Amount |
Six-month period ended April 30, 2022: | ||
Shares sold | 58,100 | $771,042 |
Shares issued to shareholders in reinvestment of distributions | 5,036 | 65,260 |
Shares redeemed | (44,133) | (573,684) |
Net increase (decrease) in shares outstanding before conversion | 19,003 | 262,618 |
Shares converted into Investor Class (See Note 1) | 3,951 | 51,946 |
Shares converted from Investor Class (See Note 1) | (43,735) | (571,371) |
Net increase (decrease) | (20,781) | $(256,807) |
Year ended October 31, 2021: | ||
Shares sold | 101,103 | $1,362,027 |
Shares issued to shareholders in reinvestment of distributions | 11,231 | 150,674 |
Shares redeemed | (48,062) | (647,173) |
Net increase (decrease) in shares outstanding before conversion | 64,272 | 865,528 |
Shares converted into Investor Class (See Note 1) | 25,002 | 334,099 |
Shares converted from Investor Class (See Note 1) | (119,553) | (1,606,920) |
Net increase (decrease) | (30,279) | $(407,293) |
90 | MainStay MacKay High Yield Municipal Bond Fund |
Class C | Shares | Amount |
Six-month period ended April 30, 2022: | ||
Shares sold | 1,172,321 | $15,479,050 |
Shares issued to shareholders in reinvestment of distributions | 207,606 | 2,681,733 |
Shares redeemed | (3,669,785) | (47,585,031) |
Net increase (decrease) in shares outstanding before conversion | (2,289,858) | (29,424,248) |
Shares converted into Class C (See Note 1) | 782 | 10,609 |
Shares converted from Class C (See Note 1) | (28,948) | (373,781) |
Net increase (decrease) | (2,318,024) | $(29,787,420) |
Year ended October 31, 2021: | ||
Shares sold | 4,227,102 | $56,654,941 |
Shares issued to shareholders in reinvestment of distributions | 474,352 | 6,351,408 |
Shares redeemed | (7,069,067) | (94,605,893) |
Net increase (decrease) in shares outstanding before conversion | (2,367,613) | (31,599,544) |
Shares converted from Class C (See Note 1) | (272,471) | (3,638,702) |
Net increase (decrease) | (2,640,084) | $(35,238,246) |
Class I | Shares | Amount |
Six-month period ended April 30, 2022: | ||
Shares sold | 119,038,237 | $1,564,376,533 |
Shares issued to shareholders in reinvestment of distributions | 6,550,908 | 84,957,380 |
Shares redeemed | (128,969,487) | (1,662,945,235) |
Net increase (decrease) in shares outstanding before conversion | (3,380,342) | (13,611,322) |
Shares converted into Class I (See Note 1) | 903,969 | 11,864,150 |
Shares converted from Class I (See Note 1) | (33,492,860) | (419,011,688) |
Net increase (decrease) | (35,969,233) | $(420,758,860) |
Year ended October 31, 2021: | ||
Shares sold | 249,788,253 | $3,351,468,000 |
Shares issued to shareholders in reinvestment of distributions | 11,408,132 | 153,585,870 |
Shares redeemed | (93,681,080) | (1,260,597,272) |
Net increase (decrease) in shares outstanding before conversion | 167,515,305 | 2,244,456,598 |
Shares converted into Class I (See Note 1) | 729,158 | 9,898,899 |
Shares converted from Class I (See Note 1) | (58,709,452) | (761,381,503) |
Net increase (decrease) | 109,535,011 | $1,492,973,994 |
Class R6 | Shares | Amount |
Six-month period ended April 30, 2022: | ||
Shares sold | 15,768,012 | $206,463,168 |
Shares issued to shareholders in reinvestment of distributions | 46,292 | 592,739 |
Shares redeemed | (15,998,693) | (203,887,656) |
Net increase (decrease) in shares outstanding before conversion | (184,389) | 3,168,251 |
Shares converted into Class R6 (See Note 1) | 33,492,872 | 419,011,688 |
Shares converted from Class R6 (See Note 1) | (2,262,335) | (29,825,114) |
Net increase (decrease) | 31,046,148 | $392,354,825 |
Year ended October 31, 2021: | ||
Shares sold | 48,176,592 | $647,283,411 |
Shares issued to shareholders in reinvestment of distributions | 38,049 | 513,304 |
Shares redeemed | (13,961,483) | (187,391,394) |
Net increase (decrease) in shares outstanding before conversion | 34,253,158 | 460,405,321 |
Shares converted into Class R6 (See Note 1) | 58,770,374 | 761,592,585 |
Shares converted from Class R6 (See Note 1) | (1,568,897) | (21,357,697) |
Net increase (decrease) | 91,454,635 | $1,200,640,209 |
92 | MainStay MacKay High Yield Municipal Bond Fund |
94 | MainStay MacKay High Yield Municipal Bond Fund |
96 | MainStay MacKay High Yield Municipal Bond Fund |
For more information
Message from the President and Semiannual Report
please log in to newyorklifeinvestments.com/accounts.
Not FDIC/NCUA Insured | Not a Deposit | May Lose Value | No Bank Guarantee | Not Insured by Any Government Agency |


5 | |
9 | |
11 | |
31 | |
37 | |
46 | |
50 | |
51 | |
51 |
Investors should refer to the Fund’s Summary Prospectus and/or Prospectus and consider the Fund’s investment objectives, strategies, risks, charges and expenses carefully before investing. The Summary Prospectus and/or Prospectus contain this and other information about the Fund. You may obtain copies of the Fund’s Summary Prospectus, Prospectus and Statement of Additional Information, which includes information about MainStay Funds Trust's Trustees, free of charge, upon request, by calling toll-free 800-624-6782, by writing to NYLIFE Distributors LLC, Attn: MainStay Marketing Department, 30 Hudson Street, Jersey City, NJ 07302 or by sending an e-mail to MainStayShareholderServices@nylim.com. These documents are also available via the MainStay Funds’ website at newyorklifeinvestments.com. Please read the Fund’s Summary Prospectus and/or Prospectus carefully before investing.
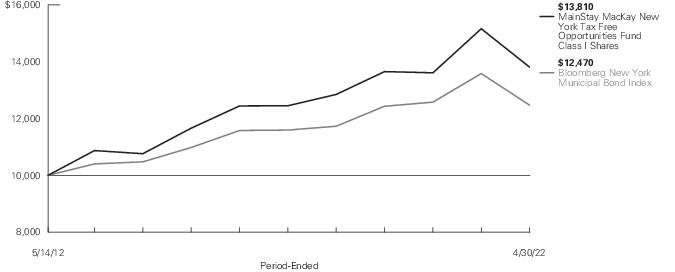
Average Annual Total Returns for the Period-Ended April 30, 2022 | ||||||||
Class | Sales Charge | Inception Date | Six Months1 | One Year | Five Years | Since Inception | Gross Expense Ratio2 | |
Class A Shares | Maximum 4.5% Initial Sales Charge | With sales charges | 5/14/2012 | -14.04% | -13.31% | 0.89% | 2.54% | 0.75% |
Excluding sales charges | -9.99 | -9.23 | 1.82 | 3.02 | 0.75 | |||
Investor Class Shares3 | Maximum 4% Initial Sales Charge | With sales charges | 5/14/2012 | -13.60 | -12.87 | 0.85 | 2.49 | 0.77 |
Excluding sales charges | -10.00 | -9.24 | 1.78 | 2.96 | 0.77 | |||
Class C Shares | Maximum 1% CDSC | With sales charges | 5/14/2012 | -11.00 | -10.35 | 1.55 | 2.70 | 1.02 |
if Redeemed Within One Year of Purchase | Excluding sales charges | -10.11 | -9.46 | 1.55 | 2.70 | 1.02 | ||
Class C2 Shares | Maximum 1% CDSC | With sales charges | 8/31/2020 | -11.07 | -10.41 | N/A | -3.81 | 1.17 |
if Redeemed Within One Year of Purchase | Excluding sales charges | -10.18 | -9.52 | N/A | -3.81 | 1.17 | ||
Class I Shares | No Sales Charge | 5/14/2012 | -9.79 | -8.91 | 2.10 | 3.29 | 0.50 | |
Class R6 Shares | No Sales Charge | 11/1/2019 | -9.77 | -8.88 | N/A | -0.90 | 0.48 | |
1. | Not annualized. |
2. | The gross expense ratios presented reflect the Fund’s “Total Annual Fund Operating Expenses” from the most recent Prospectus, as supplemented, and may differ from other expense ratios disclosed in this report. |
3. | Prior to June 30, 2020, the maximum initial sales charge was 4.5%, which is reflected in the applicable average annual total return figures shown. |
Benchmark Performance* | Six Months1 | One Year | Five Years | Since Inception |
Bloomberg New York Municipal Bond Index2 | -8.21% | -8.19% | 1.47% | 2.24% |
Morningstar Muni New York Long Category Average3 | -9.19 | -8.72 | 1.47 | 2.13 |
* | Returns for indices reflect no deductions for fees, expenses or taxes, except for foreign withholding taxes where applicable. |
1. | Not annualized. |
2. | The Bloomberg New York Municipal Bond Index is the Fund's primary broad-based securities market index for comparison purposes. The Bloomberg New York Municipal Bond Index is a market valueweighted index of New York investment grade tax exempt fixed-rate municipal bonds with maturities of one year or more. Results assume reinvestment of all dividends and capital gains. An investment cannot be made directly in an index. |
3. | The Morningstar Muni New York Long Category Average is representative of funds that invest at least 80% of assets in New York municipal debt. These portfolios have durations of more than 7.0 years. Results are based on average total returns of similar funds with all dividends and capital gain distributions reinvested. |
6 | MainStay MacKay New York Tax Free Opportunities Fund |
Share Class | Beginning Account Value 11/1/21 | Ending Account Value (Based on Actual Returns and Expenses) 4/30/22 | Expenses Paid During Period1 | Ending Account Value (Based on Hypothetical 5% Annualized Return and Actual Expenses) 4/30/22 | Expenses Paid During Period1 | Net Expense Ratio During Period2 |
Class A Shares | $1,000.00 | $900.10 | $3.53 | $1,021.08 | $3.76 | 0.75% |
Investor Class Shares | $1,000.00 | $900.00 | $3.58 | $1,021.03 | $3.81 | 0.76% |
Class C Shares | $1,000.00 | $898.90 | $4.76 | $1,019.79 | $5.06 | 1.01% |
Class C2 Shares | $1,000.00 | $898.20 | $5.46 | $1,019.04 | $5.81 | 1.16% |
Class I Shares | $1,000.00 | $902.10 | $2.36 | $1,022.32 | $2.51 | 0.50% |
Class R6 Shares | $1,000.00 | $902.30 | $2.22 | $1,022.46 | $2.36 | 0.47% |
1. | Expenses are equal to the Fund’s annualized expense ratio of each class multiplied by the average account value over the period, divided by 365 and multiplied by 181 (to reflect the six-month period). The table above represents the actual expenses incurred during the six-month period. In addition to the fees and expenses which the Fund bears directly, it also indirectly bears a pro rata share of the fees and expenses of the underlying funds in which it invests. Such indirect expenses are not included in the above-reported expense figures. |
2. | Expenses are equal to the Fund's annualized expense ratio to reflect the six-month period. |
Industry Composition as of April 30, 2022 (Unaudited)
Other Revenue | 35.2% |
Education | 16.2 |
Transportation | 11.3 |
Hospital | 10.3 |
General Obligation | 7.5 |
Water & Sewer | 5.6 |
Utilities | 3.4 |
Housing | 1.7 |
Prerefunded | 0.8% |
Certificate of Participation/Lease | 0.1 |
Closed–End Funds | 0.2 |
Short–Term Investment | 4.2 |
Other Assets, Less Liabilities | 3.5 |
100.0% |
Top Ten Holdings and/or Issuers Held as of April 30, 2022 (excluding short-term investments) (Unaudited)
1. | New York State Dormitory Authority, 3.00%-5.00%, due 3/15/31–7/1/53 |
2. | Metropolitan Transportation Authority, 4.00%-5.25%, due 5/15/22–11/15/54 |
3. | New York City Industrial Development Agency, (zero coupon)-5.00%, due 7/1/28–3/1/49 |
4. | New York Transportation Development Corp., 4.00%-5.25%, due 8/1/31–4/30/53 |
5. | Build NYC Resource Corp., 4.00%-5.50%, due 7/1/30–6/15/56 |
6. | Monroe County Industrial Development Corp., 4.00%-5.00%, due 6/1/24–7/1/50 |
7. | New York Liberty Development Corp., 2.45%-5.50%, due 10/1/37–9/15/69 |
8. | Brookhaven Local Development Corp., 3.375%-5.25%, due 10/1/33–11/1/55 |
9. | Oneida County Local Development Corp., 3.00%-5.00%, due 12/1/32–12/1/49 |
10. | New York State Thruway Authority, 4.00%, due 1/1/36–1/1/50 |
8 | MainStay MacKay New York Tax Free Opportunities Fund |
10 | MainStay MacKay New York Tax Free Opportunities Fund |
Principal Amount | Value | |
Municipal Bonds 92.1% | ||
Long-Term Municipal Bonds 91.4% | ||
Certificate of Participation/Lease 0.1% | ||
Rensselaer City School District, Certificate of Participation | ||
Insured: AGM State Aid Withholding | ||
4.00%, due 6/1/34 | $ 650,000 | $ 663,338 |
Insured: AGM State Aid Withholding | ||
4.00%, due 6/1/35 | 850,000 | 866,145 |
1,529,483 | ||
Education 16.2% | ||
Albany Capital Resource Corp., Albany College of Pharmacy and Health Sciences, Revenue Bonds | ||
Series A | ||
5.00%, due 12/1/33 | 150,000 | 155,878 |
Albany Capital Resource Corp., Albany Leadership Charter High School For Girls Project, Revenue Bonds | ||
5.00%, due 6/1/49 | 2,380,000 | 2,381,138 |
Albany Capital Resource Corp., Brighter Choice Elementary Charter Schools, Revenue Bonds | ||
Series A | ||
4.00%, due 4/1/37 | 2,065,000 | 1,871,959 |
Albany Capital Resource Corp., Equitable School Revolving Fund LLC, Revenue Bonds | ||
Series D | ||
4.00%, due 11/1/46 | 3,000,000 | 2,953,294 |
Amherst Development Corp., Daemen College Project, Revenue Bonds | ||
4.00%, due 10/1/37 | 1,000,000 | 909,464 |
5.00%, due 10/1/43 | 2,000,000 | 2,022,833 |
5.00%, due 10/1/48 | 2,000,000 | 2,012,946 |
Buffalo & Erie County Industrial Land Development Corp., D'Youville College Project, Revenue Bonds | ||
Series A | ||
4.00%, due 11/1/40 | 1,000,000 | 998,292 |
Series A | ||
4.00%, due 11/1/50 | 5,000,000 | 4,805,992 |
Buffalo & Erie County Industrial Land Development Corp., Tapestry Charter School Project, Revenue Bonds | ||
Series A | ||
5.00%, due 8/1/47 | 500,000 | 507,329 |
Principal Amount | Value | |
Education (continued) | ||
Buffalo & Erie County Industrial Land Development Corp., Tapestry Charter School Project, Revenue Bonds (continued) | ||
Series A | ||
5.00%, due 8/1/52 | $ 3,995,000 | $ 4,044,292 |
Build NYC Resource Corp., Brilla College Preparatory Charter Schools, Revenue Bonds | ||
Series A | ||
4.00%, due 11/1/41 (a) | 2,000,000 | 1,759,556 |
Build NYC Resource Corp., Children's Aid Society Project, Revenue Bonds | ||
5.00%, due 7/1/45 | 1,120,000 | 1,189,368 |
Build NYC Resource Corp., Inwood Academy Leadership Charter School Project, Revenue Bonds (a) | ||
Series A | ||
5.125%, due 5/1/38 | 800,000 | 831,122 |
Series A | ||
5.50%, due 5/1/48 | 1,500,000 | 1,566,831 |
Build NYC Resource Corp., Manhattan College Project, Revenue Bonds | ||
4.00%, due 8/1/42 | 1,500,000 | 1,477,005 |
5.00%, due 8/1/47 | 240,000 | 255,670 |
Build NYC Resource Corp., Metropolitan College of New York, Revenue Bonds | ||
5.50%, due 11/1/44 | 2,500,000 | 2,596,007 |
Build NYC Resource Corp., Metropolitan Lighthouse Charter School Project, Revenue Bonds (a) | ||
Series A | ||
5.00%, due 6/1/32 | 1,000,000 | 1,044,109 |
Series A | ||
5.00%, due 6/1/37 | 1,500,000 | 1,553,619 |
Series A | ||
5.00%, due 6/1/47 | 3,100,000 | 3,162,502 |
Series A | ||
5.00%, due 6/1/52 | 1,500,000 | 1,526,840 |
Build NYC Resource Corp., New World Preparatory Charter School Project, Revenue Bonds | ||
Series A | ||
4.00%, due 6/15/51 | 1,855,000 | 1,592,296 |
Series A | ||
4.00%, due 6/15/56 | 985,000 | 827,312 |
Principal Amount | Value | |
Long-Term Municipal Bonds (continued) | ||
Education (continued) | ||
Build NYC Resource Corp., New York Law School Project, Revenue Bonds | ||
5.00%, due 7/1/30 | $ 3,865,000 | $ 4,141,524 |
5.00%, due 7/1/33 | 1,520,000 | 1,625,185 |
5.00%, due 7/1/41 | 1,050,000 | 1,115,361 |
Build NYC Resource Corp., Shefa School Project, Revenue Bonds | ||
Series A | ||
5.00%, due 6/15/51 (a) | 2,500,000 | 2,549,390 |
County of Cattaraugus NY, St. Bonaventure University Project, Revenue Bonds | ||
Series A | ||
5.00%, due 5/1/44 | 1,200,000 | 1,230,354 |
Dutchess County Local Development Corp., Bard College Project, Revenue Bonds (a) | ||
Series A | ||
5.00%, due 7/1/40 | 1,100,000 | 1,157,881 |
Series A | ||
5.00%, due 7/1/51 | 1,000,000 | 1,037,929 |
Dutchess County Local Development Corp., Culinary Institute of America Project (The), Revenue Bonds | ||
Series A-1 | ||
5.00%, due 7/1/31 | 375,000 | 395,094 |
Series A-1 | ||
5.00%, due 7/1/33 | 700,000 | 735,610 |
Dutchess County Local Development Corp., Marist College Project, Revenue Bonds | ||
Series A | ||
5.00%, due 7/1/39 | 1,000,000 | 1,028,633 |
5.00%, due 7/1/43 | 2,000,000 | 2,168,862 |
5.00%, due 7/1/48 | 4,000,000 | 4,318,769 |
Hempstead Town Local Development Corp., Molloy College Project, Revenue Bonds | ||
5.00%, due 7/1/38 | 870,000 | 935,451 |
5.00%, due 7/1/43 | 1,020,000 | 1,086,306 |
5.00%, due 7/1/48 | 1,100,000 | 1,165,167 |
Principal Amount | Value | |
Education (continued) | ||
Monroe County Industrial Development Corp., Nazareth College of Rochester, Revenue Bonds | ||
Series A | ||
4.00%, due 10/1/47 | $ 1,695,000 | $ 1,700,626 |
Monroe County Industrial Development Corp., St. John Fisher College, Revenue Bonds | ||
Series A | ||
5.00%, due 6/1/24 | 330,000 | 330,561 |
Monroe County Industrial Development Corp., University of Rochester Project, Revenue Bonds | ||
Series C | ||
4.00%, due 7/1/43 | 3,000,000 | 3,018,595 |
Series D | ||
4.00%, due 7/1/43 | 2,470,000 | 2,485,310 |
Series A | ||
4.00%, due 7/1/50 | 9,000,000 | 8,886,025 |
New York City Educational Construction Fund, Revenue Bonds | ||
Series B, Insured: State Intercept | ||
5.00%, due 4/1/38 | 3,380,000 | 3,733,660 |
Series B, Insured: State Intercept | ||
5.00%, due 4/1/52 | 5,000,000 | 5,430,057 |
New York State Dormitory Authority, Brooklyn Law School, Revenue Bonds | ||
Series A | ||
5.00%, due 7/1/33 | 1,650,000 | 1,806,672 |
New York State Dormitory Authority, Fordham University, Revenue Bonds | ||
4.00%, due 7/1/50 | 13,330,000 | 12,986,685 |
Series A | ||
5.00%, due 7/1/41 | 1,075,000 | 1,142,714 |
New York State Dormitory Authority, Friends of The Bay Shore-Brightwaters Public Library, Inc., Revenue Bonds | ||
Insured: AMBAC | ||
4.625%, due 7/1/36 | 200,000 | 175,037 |
New York State Dormitory Authority, Iona College, Revenue Bonds | ||
Series A | ||
5.00%, due 7/1/46 | 550,000 | 591,316 |
12 | MainStay MacKay New York Tax Free Opportunities Fund |
Principal Amount | Value | |
Long-Term Municipal Bonds (continued) | ||
Education (continued) | ||
New York State Dormitory Authority, Iona College, Revenue Bonds (continued) | ||
Series A | ||
5.00%, due 7/1/51 | $ 1,300,000 | $ 1,393,374 |
New York State Dormitory Authority, New School (The), Revenue Bonds | ||
Series A | ||
5.00%, due 7/1/35 | 195,000 | 206,192 |
New York State Dormitory Authority, New York University, Revenue Bonds | ||
Series A | ||
4.00%, due 7/1/43 | 2,950,000 | 3,016,869 |
Series A | ||
4.00%, due 7/1/45 | 9,675,000 | 9,627,047 |
Series A | ||
4.00%, due 7/1/46 | 4,000,000 | 3,962,288 |
New York State Dormitory Authority, Pace University, Revenue Bonds | ||
Series A | ||
4.00%, due 5/1/33 | 400,000 | 400,751 |
Series A | ||
4.25%, due 5/1/42 | 450,000 | 451,077 |
New York State Dormitory Authority, Rockefeller University (The), Revenue Bonds | ||
Series C | ||
4.00%, due 7/1/49 | 7,055,000 | 7,130,376 |
New York State Dormitory Authority, St. John's University, Revenue Bonds | ||
Series A | ||
4.00%, due 7/1/48 | 5,250,000 | 5,159,587 |
New York State Dormitory Authority, St. Joseph's College, Revenue Bonds | ||
4.00%, due 7/1/40 | 200,000 | 196,864 |
5.00%, due 7/1/51 | 1,475,000 | 1,558,570 |
New York State Dormitory Authority, St. Lawrence-Lewis Board of Cooperative Educational Services, Revenue Bonds | ||
Series A | ||
4.00%, due 8/15/42 | 5,500,000 | 5,625,003 |
Series B, Insured: BAM | ||
4.00%, due 8/15/45 | 4,320,000 | 4,354,978 |
Principal Amount | Value | |
Education (continued) | ||
New York State Dormitory Authority, St. Lawrence-Lewis Board of Cooperative Educational Services, Revenue Bonds (continued) | ||
Series B, Insured: BAM | ||
4.00%, due 8/15/50 | $ 1,340,000 | $ 1,344,687 |
New York State Dormitory Authority, Touro College and University System Obligated Group, Revenue Bonds | ||
5.00%, due 1/1/42 | 5,000,000 | 5,105,876 |
Oneida County Local Development Corp., Utica College Project, Revenue Bonds | ||
5.00%, due 7/1/49 | 3,250,000 | 3,352,895 |
Onondaga County Trust for Cultural Resources, Syracuse University Project, Revenue Bonds | ||
4.00%, due 12/1/41 | 5,165,000 | 5,166,888 |
4.00%, due 12/1/49 | 2,000,000 | 1,977,741 |
Orange County Funding Corp., Mount St. Mary College, Revenue Bonds | ||
Series A | ||
5.00%, due 7/1/42 | 1,010,000 | 1,011,573 |
Riverhead Industrial Development Agency, Riverhead Charter School, Revenue Bonds | ||
Series A | ||
7.00%, due 8/1/43 | 925,000 | 959,479 |
Series 2013A | ||
7.00%, due 8/1/48 | 730,000 | 756,468 |
St. Lawrence County Industrial Development Agency, Clarkson University Project, Revenue Bonds | ||
5.00%, due 9/1/47 | 2,975,000 | 3,165,962 |
St. Lawrence County Industrial Development Agency, St. Lawrence University, Revenue Bonds | ||
Series A | ||
4.00%, due 7/1/43 | 3,000,000 | 2,951,241 |
Syracuse Industrial Development Agency, Syracuse City School District Project, Revenue Bonds | ||
Series A, Insured: State Aid Withholding | ||
3.25%, due 5/1/34 | 1,000,000 | 1,001,226 |
Principal Amount | Value | |
Long-Term Municipal Bonds (continued) | ||
Education (continued) | ||
Syracuse Industrial Development Agency, Syracuse City School District Project, Revenue Bonds (continued) | ||
Series 2020A, Insured: State Aid Withholding | ||
4.00%, due 5/1/36 | $ 1,500,000 | $ 1,553,199 |
Troy Capital Resource Corp., Rensselaer Polytechnic Institute, Revenue Bonds | ||
5.00%, due 8/1/32 | 1,000,000 | 1,060,742 |
Yonkers Economic Development Corp., Charter School of Educational Excellence Project, Revenue Bonds | ||
Series A | ||
4.00%, due 10/15/29 | 200,000 | 195,956 |
Series A | ||
5.00%, due 10/15/39 | 840,000 | 856,193 |
Series A | ||
5.00%, due 10/15/49 | 640,000 | 642,748 |
5.00%, due 10/15/50 | 1,350,000 | 1,349,963 |
Yonkers Industrial Development Agency, New Community School Project, Revenue Bonds | ||
Insured: State Aid Withholding | ||
4.00%, due 5/1/41 | 2,280,000 | 2,366,606 |
Insured: State Aid Withholding | ||
4.00%, due 5/1/46 | 2,655,000 | 2,719,281 |
Insured: State Aid Withholding | ||
4.00%, due 5/1/51 | 3,000,000 | 3,060,745 |
192,706,873 | ||
General Obligation 7.5% | ||
City of Buffalo NY, Limited General Obligation | ||
Series A | ||
5.00%, due 4/1/27 | 500,000 | 545,364 |
Series A | ||
5.00%, due 4/1/28 | 400,000 | 435,513 |
City of Glens Falls NY, Public Improvement, Limited General Obligation | ||
Insured: AGM | ||
4.00%, due 1/15/31 | 500,000 | 519,886 |
Insured: AGM | ||
4.00%, due 1/15/32 | 315,000 | 326,854 |
Principal Amount | Value | |
General Obligation (continued) | ||
City of Glens Falls NY, Public Improvement, Limited General Obligation (continued) | ||
Insured: AGM | ||
4.00%, due 1/15/33 | $ 250,000 | $ 258,786 |
City of New York NY, Unlimited General Obligation | ||
Series A-1, Insured: BAM | ||
4.00%, due 8/1/44 | 4,930,000 | 4,950,412 |
Series D-1, Insured: BAM | ||
4.00%, due 3/1/50 | 5,440,000 | 5,452,191 |
City of Newburgh NY, Limited General Obligation | ||
Series A, Insured: AGM | ||
3.50%, due 7/15/36 | 725,000 | 681,776 |
Series A | ||
5.50%, due 6/15/31 | 500,000 | 502,508 |
City of Ogdensburg NY, Public Improvement, Limited General Obligation | ||
5.50%, due 4/15/23 | 40,000 | 40,472 |
5.50%, due 4/15/24 | 45,000 | 45,684 |
5.50%, due 4/15/26 | 50,000 | 50,737 |
5.50%, due 4/15/28 | 55,000 | 55,316 |
City of Plattsburgh NY, Public Improvement, Limited General Obligation | ||
Series B, Insured: AGM | ||
5.00%, due 9/15/22 | 455,000 | 460,328 |
Series B, Insured: AGM | ||
5.00%, due 9/15/24 | 510,000 | 536,061 |
Series B, Insured: AGM | ||
5.00%, due 9/15/25 | 470,000 | 502,444 |
Series B, Insured: AGM | ||
5.00%, due 9/15/26 | 395,000 | 429,091 |
City of Poughkeepsie NY, Public Improvement, Limited General Obligation | ||
5.00%, due 6/1/31 | 600,000 | 636,762 |
City of Yonkers NY, Limited General Obligation | ||
Series B, Insured: AGM State Aid Withholding | ||
3.00%, due 2/15/39 | 600,000 | 546,791 |
Series A, Insured: BAM | ||
4.00%, due 9/1/31 | 1,500,000 | 1,560,320 |
Series A, Insured: BAM | ||
4.00%, due 5/1/35 | 1,550,000 | 1,590,756 |
14 | MainStay MacKay New York Tax Free Opportunities Fund |
Principal Amount | Value | |
Long-Term Municipal Bonds (continued) | ||
General Obligation (continued) | ||
City of Yonkers NY, Limited General Obligation (continued) | ||
Series A, Insured: AGM | ||
4.00%, due 2/15/36 | $ 700,000 | $ 718,826 |
Series B, Insured: AGM State Aid Withholding | ||
4.00%, due 2/15/36 | 740,000 | 759,901 |
Series A, Insured: BAM | ||
4.00%, due 5/1/36 | 1,700,000 | 1,740,703 |
Series A, Insured: BAM | ||
4.00%, due 5/1/37 | 2,000,000 | 2,042,792 |
Series B, Insured: AGM State Aid Withholding | ||
4.00%, due 2/15/38 | 1,300,000 | 1,328,413 |
Series A, Insured: AGM | ||
5.00%, due 2/15/32 | 850,000 | 960,861 |
Series B, Insured: AGM State Aid Withholding | ||
5.00%, due 2/15/32 | 855,000 | 966,513 |
Series A, Insured: AGM | ||
5.00%, due 2/15/34 | 600,000 | 674,633 |
Series B, Insured: AGM State Aid Withholding | ||
5.00%, due 2/15/34 | 750,000 | 843,291 |
City of Yonkers NY, Unlimited General Obligation | ||
Series B, Insured: BAM State Aid Withholding | ||
4.00%, due 5/1/39 | 2,000,000 | 2,036,316 |
Commonwealth of Puerto Rico, Unlimited General Obligation | ||
Series A-1 | ||
(zero coupon), due 7/1/24 | 540,338 | 491,603 |
Series A-1 | ||
(zero coupon), due 7/1/33 | 1,351,801 | 773,317 |
Series A-1 | ||
4.00%, due 7/1/33 | 1,050,426 | 976,687 |
Series A-1 | ||
4.00%, due 7/1/35 | 884,193 | 819,802 |
Series A-1 | ||
4.00%, due 7/1/37 | 810,367 | 730,509 |
Series A-1 | ||
4.00%, due 7/1/41 | 1,101,791 | 993,383 |
Series A-1 | ||
4.00%, due 7/1/46 | 1,000,000 | 879,750 |
Series A-1 | ||
5.25%, due 7/1/23 | 713,173 | 722,008 |
Principal Amount | Value | |
General Obligation (continued) | ||
Commonwealth of Puerto Rico, Unlimited General Obligation (continued) | ||
Series A-1 | ||
5.375%, due 7/1/25 | $ 1,169,884 | $ 1,209,550 |
Series A-1 | ||
5.625%, due 7/1/27 | 1,159,287 | 1,229,744 |
Series A-1 | ||
5.625%, due 7/1/29 | 1,140,480 | 1,229,058 |
Series A-1 | ||
5.75%, due 7/1/31 | 1,107,737 | 1,212,423 |
County of Clinton NY, Limited General Obligation | ||
Insured: AGM | ||
4.00%, due 6/1/38 (b) | 1,500,000 | 1,525,065 |
County of Nassau NY, Limited General Obligation | ||
Series B, Insured: AGM | ||
5.00%, due 4/1/49 | 10,000,000 | 11,044,918 |
County of Onondaga NY, Limited General Obligation | ||
3.00%, due 6/1/39 | 2,150,000 | 2,008,777 |
3.25%, due 4/15/34 | 1,250,000 | 1,256,773 |
County of Rockland NY, Limited General Obligation | ||
Insured: BAM | ||
5.00%, due 6/1/24 | 500,000 | 525,956 |
Insured: BAM | ||
5.00%, due 6/1/25 | 560,000 | 600,829 |
Insured: BAM | ||
5.00%, due 6/1/26 | 550,000 | 601,070 |
County of Rockland NY, Various Purpose, Limited General Obligation | ||
Insured: AGM | ||
4.00%, due 5/1/44 | 915,000 | 942,554 |
Insured: AGM | ||
4.00%, due 5/1/45 | 950,000 | 977,889 |
Insured: AGM | ||
4.00%, due 5/1/46 | 985,000 | 1,013,171 |
Insured: AGM | ||
4.00%, due 5/1/48 | 1,065,000 | 1,094,654 |
County of Suffolk NY, Public Improvement, Limited General Obligation | ||
Series B, Insured: AGM | ||
3.00%, due 10/15/32 | 5,480,000 | 5,160,004 |
Principal Amount | Value | |
Long-Term Municipal Bonds (continued) | ||
General Obligation (continued) | ||
County of Suffolk NY, Public Improvement, Limited General Obligation (continued) | ||
Series B, Insured: AGM | ||
3.00%, due 10/15/33 | $ 2,400,000 | $ 2,215,391 |
Series A, Insured: AGM | ||
3.25%, due 6/1/36 | 715,000 | 661,034 |
Series A, Insured: AGM | ||
3.25%, due 6/1/37 | 725,000 | 667,530 |
Series A, Insured: BAM | ||
4.00%, due 4/1/33 | 2,190,000 | 2,285,084 |
Genesee Valley Central School District, Unlimited General Obligation | ||
Insured: AGM State Aid Withholding | ||
4.00%, due 6/15/30 | 665,000 | 667,179 |
Harrison Central School District, Unlimited General Obligation | ||
Insured: State Aid Withholding | ||
3.50%, due 3/15/44 | 1,015,000 | 1,016,684 |
Insured: State Aid Withholding | ||
3.50%, due 3/15/45 | 1,055,000 | 1,054,501 |
Insured: State Aid Withholding | ||
3.55%, due 3/15/47 | 1,130,000 | 1,130,747 |
Lackawanna City School District, Unlimited General Obligation | ||
Insured: BAM State Aid Withholding | ||
4.00%, due 6/15/32 | 745,000 | 769,591 |
Niagara Falls City School District, Unlimited General Obligation | ||
Insured: BAM State Aid Withholding | ||
5.00%, due 6/15/27 | 960,000 | 1,067,453 |
Poughkeepsie School District, New York School District Refunding, Unlimited General Obligation | ||
Insured: AGM State Aid Withholding | ||
3.00%, due 5/1/33 | 400,000 | 377,435 |
Town of Oyster Bay NY, Limited General Obligation | ||
Insured: AGM | ||
4.00%, due 8/1/30 | 365,000 | 367,353 |
Town of Oyster Bay NY, Public Improvement, Limited General Obligation | ||
4.00%, due 2/15/26 | 3,440,000 | 3,600,674 |
Series A, Insured: BAM | ||
5.00%, due 1/15/28 | 500,000 | 521,033 |
Principal Amount | Value | |
General Obligation (continued) | ||
Village of Valley Stream NY, Various Purpose, Limited General Obligation | ||
Insured: BAM | ||
4.00%, due 4/1/33 | $ 490,000 | $ 495,340 |
Insured: BAM | ||
4.00%, due 4/1/34 | 510,000 | 514,817 |
Insured: BAM | ||
4.00%, due 4/1/35 | 530,000 | 534,814 |
Insured: BAM | ||
4.00%, due 4/1/36 | 550,000 | 554,198 |
Insured: BAM | ||
4.00%, due 4/1/37 | 570,000 | 573,114 |
89,293,767 | ||
Hospital 10.3% | ||
Brookhaven Local Development Corp., Long Island Community Hospital Health Care Services Foundation, Revenue Bonds | ||
Series A, Insured: AGM-CR | ||
3.375%, due 10/1/40 | 7,990,000 | 7,549,995 |
Brookhaven Local Development Corp., Long Island Community Hospital Project, Revenue Bonds | ||
Series A | ||
4.00%, due 10/1/45 | 3,500,000 | 3,116,827 |
Series A | ||
5.00%, due 10/1/33 | 1,000,000 | 1,079,347 |
Series A | ||
5.00%, due 10/1/35 | 1,000,000 | 1,076,487 |
Series A | ||
5.00%, due 10/1/50 | 6,250,000 | 6,580,282 |
Broome County Local Development Corp., United Health Services Hospitals Obligated Group, Revenue Bonds | ||
Insured: AGM | ||
3.00%, due 4/1/50 | 6,835,000 | 5,151,895 |
Insured: AGM | ||
4.00%, due 4/1/39 | 700,000 | 704,701 |
Insured: AGM | ||
4.00%, due 4/1/50 | 4,265,000 | 4,176,458 |
Build NYC Resource Corp., Children's Aid Society Project (The), Revenue Bonds | ||
4.00%, due 7/1/44 | 600,000 | 607,701 |
4.00%, due 7/1/49 | 1,300,000 | 1,309,023 |
16 | MainStay MacKay New York Tax Free Opportunities Fund |
Principal Amount | Value | |
Long-Term Municipal Bonds (continued) | ||
Hospital (continued) | ||
Dutchess County Local Development Corp., Health Quest Systems, Inc., Revenue Bonds | ||
Series B | ||
5.00%, due 7/1/46 | $ 6,000,000 | $ 6,335,581 |
Jefferson County Civic Facility Development Corp., Samaritan Medical Center Project, Revenue Bonds | ||
Series A | ||
4.00%, due 11/1/31 | 2,705,000 | 2,698,637 |
Series A | ||
4.00%, due 11/1/47 | 880,000 | 802,361 |
Monroe County Industrial Development Corp., Highland Hospital, Revenue Bonds | ||
4.00%, due 7/1/40 | 3,100,000 | 3,103,475 |
Monroe County Industrial Development Corp., Rochester General Hospital (The), Revenue Bonds | ||
4.00%, due 12/1/37 | 1,000,000 | 1,024,328 |
Series A | ||
5.00%, due 12/1/32 | 540,000 | 547,927 |
Series A | ||
5.00%, due 12/1/42 | 1,000,000 | 1,011,221 |
Monroe County Industrial Development Corp., Rochester Regional Health Project, Revenue Bonds | ||
Series A | ||
4.00%, due 12/1/46 | 750,000 | 705,048 |
Nassau County Local Economic Assistance Corp., Catholic Health Services of Long Island Obligated Group, Revenue Bonds | ||
5.00%, due 7/1/34 | 250,000 | 260,974 |
New York State Dormitory Authority, Catholic Health System Obligated Group, Revenue Bonds | ||
Series A | ||
4.00%, due 7/1/45 | 3,490,000 | 2,925,179 |
Series B | ||
5.00%, due 7/1/32 | 390,000 | 391,277 |
Principal Amount | Value | |
Hospital (continued) | ||
New York State Dormitory Authority, Garnet Health Medical Center Obligated Group, Revenue Bonds (a) | ||
5.00%, due 12/1/32 | $ 800,000 | $ 872,355 |
5.00%, due 12/1/34 | 3,500,000 | 3,808,685 |
New York State Dormitory Authority, Maimonides Medical Center, Revenue Bonds | ||
Insured: FHA 241 | ||
3.00%, due 2/1/50 | 14,000,000 | 11,211,507 |
New York State Dormitory Authority, Memorial Sloan-Kettering Cancer Center, Revenue Bonds | ||
Series 1 | ||
4.00%, due 7/1/38 | 6,000,000 | 6,061,011 |
New York State Dormitory Authority, Montefiore Obligated Group, Revenue Bonds | ||
Series A | ||
4.00%, due 8/1/36 | 3,750,000 | 3,628,233 |
Series A | ||
4.00%, due 8/1/37 | 1,750,000 | 1,680,125 |
New York State Dormitory Authority, North Shore Long Island Jewish Obligated Group, Revenue Bonds | ||
Series B | ||
5.00%, due 5/1/39 | 1,500,000 | 1,502,380 |
New York State Dormitory Authority, Northwell Health Obligated Group, Revenue Bonds | ||
Series B-3 | ||
5.00%, due 5/1/48 (c) | 5,000,000 | 5,386,241 |
New York State Dormitory Authority, NYU Langone Hospitals Obligated Group, Revenue Bonds | ||
Series A | ||
3.00%, due 7/1/48 | 750,000 | 580,359 |
Series A | ||
4.00%, due 7/1/40 | 1,000,000 | 1,000,597 |
Series A | ||
4.00%, due 7/1/53 | 11,455,000 | 11,000,399 |
New York State Dormitory Authority, Orange Regional Medical Center Obligated Group, Revenue Bonds | ||
5.00%, due 12/1/35 (a) | 100,000 | 106,395 |
Principal Amount | Value | |
Long-Term Municipal Bonds (continued) | ||
Hospital (continued) | ||
Oneida County Local Development Corp., Mohawk Valley Health System Project, Revenue Bonds | ||
Series A, Insured: AGM | ||
3.00%, due 12/1/44 | $ 4,150,000 | $ 3,596,596 |
Series A, Insured: AGM | ||
4.00%, due 12/1/32 | 1,000,000 | 1,045,028 |
Series A, Insured: AGM | ||
4.00%, due 12/1/33 | 1,255,000 | 1,309,326 |
Series A, Insured: AGM | ||
4.00%, due 12/1/34 | 1,585,000 | 1,651,423 |
Series A, Insured: AGM | ||
4.00%, due 12/1/36 | 1,650,000 | 1,715,263 |
Series A, Insured: AGM | ||
4.00%, due 12/1/37 | 1,155,000 | 1,200,080 |
Series A, Insured: AGM | ||
4.00%, due 12/1/37 | 1,270,000 | 1,290,118 |
Series A, Insured: AGM | ||
4.00%, due 12/1/38 | 1,000,000 | 1,037,353 |
Series A, Insured: AGM | ||
4.00%, due 12/1/46 | 4,000,000 | 3,907,196 |
Series A, Insured: AGM | ||
4.00%, due 12/1/49 | 4,000,000 | 4,081,931 |
Suffolk County Economic Development Corp., Catholic Health Services of Long Island Obligated Group, Revenue Bonds | ||
Series C | ||
5.00%, due 7/1/33 | 250,000 | 260,974 |
Westchester County Local Development Corp., Westchester Medical Center, Revenue Bonds | ||
5.00%, due 11/1/46 | 2,500,000 | 2,657,756 |
121,750,055 | ||
Housing 1.7% | ||
Albany Capital Resource Corp., Empire Commons Student Housing, Inc., Revenue Bonds | ||
Series A | ||
5.00%, due 5/1/29 | 600,000 | 647,907 |
Series A | ||
5.00%, due 5/1/30 | 350,000 | 376,439 |
Series A | ||
5.00%, due 5/1/31 | 200,000 | 214,718 |
Principal Amount | Value | |
Housing (continued) | ||
Amherst Development Corp., UBF Faculty-Student Housing Corp., Revenue Bonds | ||
Insured: BAM | ||
4.00%, due 10/1/42 | $ 4,945,000 | $ 4,967,258 |
Series A, Insured: AGM | ||
5.00%, due 10/1/45 | 2,000,000 | 2,157,942 |
New York City Housing Development Corp., College of Staten Island Residences, Revenue Bonds | ||
Series A, Insured: AGM | ||
3.25%, due 7/1/27 | 2,950,000 | 2,951,537 |
New York State Dormitory Authority, University Facilities, Revenue Bonds | ||
Series 2019A | ||
4.00%, due 7/1/49 | 3,050,000 | 3,099,803 |
Series A | ||
5.00%, due 7/1/43 | 1,500,000 | 1,659,953 |
Onondaga Civic Development Corp., Onondaga Community College Housing Development Corp., Revenue Bonds | ||
Series A | ||
5.00%, due 10/1/22 | 325,000 | 326,610 |
Series A | ||
5.00%, due 10/1/24 | 400,000 | 408,262 |
Series A | ||
5.00%, due 10/1/25 | 250,000 | 255,966 |
Westchester County Local Development Corp., Purchase Housing Corp. II Project, Revenue Bonds | ||
5.00%, due 6/1/29 | 185,000 | 196,563 |
5.00%, due 6/1/30 | 330,000 | 349,058 |
5.00%, due 6/1/31 | 320,000 | 337,421 |
5.00%, due 6/1/37 | 1,000,000 | 1,041,778 |
5.00%, due 6/1/42 | 1,000,000 | 1,032,054 |
20,023,269 | ||
Other Revenue 35.1% | ||
Battery Park City Authority, Green Bond, Revenue Bonds, Senior Lien | ||
Series A | ||
4.00%, due 11/1/44 | 4,355,000 | 4,421,855 |
18 | MainStay MacKay New York Tax Free Opportunities Fund |
Principal Amount | Value | |
Long-Term Municipal Bonds (continued) | ||
Other Revenue (continued) | ||
Brookhaven Local Development Corp., Jefferson's Ferry Project, Revenue Bonds | ||
Series A | ||
4.00%, due 11/1/55 | $ 3,565,000 | $ 3,621,277 |
5.25%, due 11/1/36 | 1,130,000 | 1,224,779 |
Broome County Local Development Corp., Good Shepherd Village at Endwell, Revenue Bonds | ||
4.00%, due 7/1/31 | 1,565,000 | 1,575,695 |
4.00%, due 7/1/36 | 1,600,000 | 1,593,080 |
4.00%, due 7/1/41 | 1,530,000 | 1,491,896 |
Build NYC Resource Corp., Bronx Charter School for Excellence Project, Revenue Bonds | ||
Series A | ||
5.50%, due 4/1/43 | 1,160,000 | 1,173,757 |
Build NYC Resource Corp., Pratt Paper, Inc. Project, Revenue Bonds | ||
5.00%, due 1/1/35 (a)(b) | 4,305,000 | 4,423,377 |
Build NYC Resource Corp., Royal Charter Properties, Inc., Revenue Bonds | ||
Insured: AGM | ||
4.75%, due 12/15/32 | 2,000,000 | 2,018,190 |
Chautauqua Tobacco Asset Securitization Corp., Revenue Bonds | ||
5.00%, due 6/1/34 | 750,000 | 765,046 |
Children's Trust Fund, Asset-Backed, Revenue Bonds | ||
Series A | ||
(zero coupon), due 5/15/50 | 2,500,000 | 417,502 |
5.625%, due 5/15/43 | 2,300,000 | 2,338,622 |
City of New York NY, Alvin Ailey Dance Foundation, Inc., Revenue Bonds | ||
Series A | ||
4.00%, due 7/1/46 | 1,515,000 | 1,536,988 |
City of New York NY, Museum of Modern Art (The), Revenue Bonds | ||
Series 2016-ONE-E | ||
4.00%, due 4/1/30 | 1,200,000 | 1,267,833 |
Development Authority of the North Country, Solid Waste Management System, Revenue Bonds | ||
Insured: AGM | ||
3.25%, due 9/1/39 | 550,000 | 516,263 |
Principal Amount | Value | |
Other Revenue (continued) | ||
Development Authority of the North Country, Solid Waste Management System, Revenue Bonds (continued) | ||
Insured: AGM | ||
3.25%, due 9/1/40 | $ 570,000 | $ 530,141 |
Insured: AGM | ||
3.25%, due 9/1/42 | 610,000 | 560,124 |
Insured: AGM | ||
3.25%, due 9/1/43 | 630,000 | 583,030 |
Insured: AGM | ||
3.25%, due 9/1/44 | 650,000 | 598,487 |
Insured: AGM | ||
3.375%, due 9/1/38 | 535,000 | 525,045 |
Insured: AGM | ||
3.50%, due 9/1/37 | 515,000 | 517,953 |
Dobbs Ferry Local Development Corp., Mercy College Project, Revenue Bonds | ||
5.00%, due 7/1/39 | 1,000,000 | 1,043,857 |
Dutchess County Resource Recovery Agency, Solid Waste System, Revenue Bonds (b) | ||
5.00%, due 1/1/25 | 1,000,000 | 1,059,574 |
5.00%, due 1/1/26 | 1,000,000 | 1,079,017 |
Erie Tobacco Asset Securitization Corp., Tobacco Settlement, Asset-Backed, Revenue Bonds | ||
Series B | ||
(zero coupon), due 6/1/47 | 18,000,000 | 3,711,073 |
GDB Debt Recovery Authority of Puerto Rico, Revenue Bonds | ||
7.50%, due 8/20/40 | 2,476,245 | 2,287,431 |
Hudson Yards Infrastructure Corp., Revenue Bonds | ||
Series A | ||
4.00%, due 2/15/44 | 4,000,000 | 4,088,202 |
Series A | ||
5.00%, due 2/15/42 | 7,500,000 | 8,147,950 |
Huntington Local Development Corp., Fountaingate Gardens Project, Revenue Bonds | ||
Series A | ||
5.00%, due 7/1/36 | 900,000 | 888,262 |
Series A | ||
5.25%, due 7/1/56 | 2,500,000 | 2,426,449 |
Principal Amount | Value | |
Long-Term Municipal Bonds (continued) | ||
Other Revenue (continued) | ||
Long Island Power Authority, Electric System, Revenue Bonds | ||
Series A | ||
4.00%, due 9/1/38 | $ 2,000,000 | $ 2,015,994 |
Series A | ||
4.00%, due 9/1/39 | 4,750,000 | 4,776,533 |
Series A | ||
4.00%, due 9/1/40 | 550,000 | 551,789 |
5.00%, due 9/1/37 | 2,000,000 | 2,225,142 |
5.00%, due 9/1/38 | 1,000,000 | 1,109,849 |
5.00%, due 9/1/39 | 1,000,000 | 1,108,362 |
5.00%, due 9/1/42 | 2,000,000 | 2,181,835 |
Series A | ||
5.00%, due 9/1/44 | 2,000,000 | 2,099,318 |
Series B | ||
5.00%, due 9/1/45 | 1,000,000 | 1,057,877 |
Series B | ||
5.00%, due 9/1/46 | 245,000 | 262,996 |
Matching Fund Special Purpose Securitization Corp., Revenue Bonds | ||
Series A | ||
5.00%, due 10/1/30 | 3,140,000 | 3,276,943 |
Series A | ||
5.00%, due 10/1/32 | 3,140,000 | 3,282,532 |
Series A | ||
5.00%, due 10/1/39 | 9,415,000 | 9,644,821 |
Metropolitan Transportation Authority, Dedicated Tax Fund, Revenue Bonds | ||
Series A | ||
5.00%, due 11/15/49 | 4,000,000 | 4,390,274 |
Metropolitan Transportation Authority, Green Bond, Revenue Bonds | ||
Series B-2 | ||
5.25%, due 11/15/33 | 5,000,000 | 5,511,453 |
Monroe County Industrial Development Corp., St. Ann's Community Project, Revenue Bonds | ||
5.00%, due 1/1/40 | 2,500,000 | 2,290,942 |
5.00%, due 1/1/50 | 2,400,000 | 2,198,483 |
Nassau County Tobacco Settlement Corp., Tobacco Settlement, Asset-Backed, Revenue Bonds | ||
Series A-3 | ||
5.00%, due 6/1/35 | 750,000 | 759,426 |
Principal Amount | Value | |
Other Revenue (continued) | ||
Nassau County Tobacco Settlement Corp., Tobacco Settlement, Asset-Backed, Revenue Bonds (continued) | ||
Series A-3 | ||
5.125%, due 6/1/46 | $ 4,015,000 | $ 4,076,382 |
New York City Housing Development Corp., Capital Fund Grant Program, Revenue Bonds | ||
Series A | ||
5.00%, due 7/1/23 | 1,300,000 | 1,343,016 |
New York City Housing Development Corp., Multi-Family Housing, Sustainable Neighborhood, Revenue Bonds | ||
Series E-1-A | ||
3.40%, due 11/1/47 | 3,000,000 | 2,575,688 |
Series G | ||
3.85%, due 11/1/45 | 595,000 | 570,718 |
Series L-2-A | ||
4.00%, due 5/1/44 | 5,000,000 | 4,968,870 |
Series I-1-A | ||
4.05%, due 11/1/41 | 1,000,000 | 1,003,104 |
Series I-1-A | ||
4.15%, due 11/1/46 | 3,250,000 | 3,200,174 |
New York City Housing Development Corp., Multi-Family Housing, Sustainable Neighborhood, Green Bond, Revenue Bonds | ||
Series G-1 | ||
3.70%, due 11/1/47 | 1,000,000 | 897,505 |
New York City Industrial Development Agency, Queens Baseball Stadium Project, Revenue Bonds | ||
Insured: AGM | ||
3.00%, due 1/1/37 | 2,500,000 | 2,169,672 |
Insured: AGM | ||
3.00%, due 1/1/40 | 8,750,000 | 7,545,366 |
Series A, Insured: AGM | ||
3.00%, due 1/1/46 | 20,115,000 | 16,329,748 |
New York City Industrial Development Agency, TRIPS Obligated Group, Revenue Bonds | ||
Series A | ||
5.00%, due 7/1/28 | 1,500,000 | 1,504,306 |
20 | MainStay MacKay New York Tax Free Opportunities Fund |
Principal Amount | Value | |
Long-Term Municipal Bonds (continued) | ||
Other Revenue (continued) | ||
New York City Industrial Development Agency, Yankee Stadium Project, Revenue Bonds | ||
Series A, Insured: AGC | ||
(zero coupon), due 3/1/40 | $ 380,000 | $ 175,422 |
Series A, Insured: AGC | ||
(zero coupon), due 3/1/44 | 1,065,000 | 396,942 |
Series A, Insured: AGC | ||
(zero coupon), due 3/1/45 | 200,000 | 70,775 |
Series A, Insured: AGC | ||
(zero coupon), due 3/1/46 | 4,080,000 | 1,370,449 |
Series A, Insured: AGC | ||
(zero coupon), due 3/1/47 | 1,115,000 | 356,081 |
Series A | ||
3.00%, due 3/1/49 | 10,980,000 | 8,446,795 |
Series A, Insured: AGM | ||
3.00%, due 3/1/49 | 1,080,000 | 852,278 |
Series A, Insured: AGM | ||
4.00%, due 3/1/45 | 6,500,000 | 6,665,212 |
Series A, Insured: AGM | ||
5.00%, due 3/1/29 | 2,000,000 | 2,220,367 |
New York City Transitional Finance Authority, Building Aid, Revenue Bonds | ||
Series S-1A, Insured: State Aid Withholding | ||
4.00%, due 7/15/36 | 2,865,000 | 2,952,583 |
New York City Transitional Finance Authority, Future Tax Secured, Revenue Bonds | ||
Series A-1 | ||
4.00%, due 11/1/35 | 4,500,000 | 4,616,550 |
Series C-1 | ||
4.00%, due 11/1/42 | 7,000,000 | 6,978,698 |
Series C-1 | ||
5.00%, due 2/1/51 | 7,175,000 | 7,917,752 |
New York City Transitional Finance Authority Building Aid, Revenue Bonds | ||
Series S-1, Insured: State Aid Withholding | ||
3.00%, due 7/15/38 | 8,000,000 | 7,022,567 |
Series S-1, Insured: State Aid Withholding | ||
4.00%, due 7/15/36 | 1,500,000 | 1,560,466 |
Principal Amount | Value | |
Other Revenue (continued) | ||
New York City Transitional Finance Authority Building Aid, Revenue Bonds (continued) | ||
Series S-1, Insured: State Aid Withholding | ||
4.00%, due 7/15/40 | $ 2,265,000 | $ 2,281,714 |
Series S-3, Insured: State Aid Withholding | ||
4.00%, due 7/15/46 | 2,905,000 | 2,890,880 |
Series S-3, Insured: State Aid Withholding | ||
5.00%, due 7/15/43 | 2,500,000 | 2,679,104 |
New York Convention Center Development Corp., Hotel Unit Fee, Revenue Bonds, Senior Lien | ||
Series A | ||
(zero coupon), due 11/15/47 | 6,500,000 | 1,752,172 |
New York Convention Center Development Corp., Hotel Unit Fee Secured, Revenue Bonds | ||
5.00%, due 11/15/40 | 1,620,000 | 1,718,806 |
New York Convention Center Development Corp., Hotel Unit Fee Secured, Revenue Bonds, Sub. Lien | ||
Series B, Insured: BAM | ||
(zero coupon), due 11/15/41 | 2,320,000 | 939,115 |
New York Convention Center Development Corp., New York City Hotel Unit Fee, Revenue Bonds, Sub. Lien | ||
Series B, Insured: BAM | ||
(zero coupon), due 11/15/43 | 4,800,000 | 1,730,097 |
New York Counties Tobacco Trust IV, Settlement Pass Through, Revenue Bonds | ||
Series A | ||
5.00%, due 6/1/42 | 1,000,000 | 1,000,000 |
Series A | ||
5.00%, due 6/1/45 | 245,000 | 244,545 |
Series A | ||
6.25%, due 6/1/41 (a) | 4,900,000 | 4,997,961 |
New York Counties Tobacco Trust V, Pass Through, Capital Appreciation, Revenue Bonds | ||
Series S | ||
(zero coupon), due 6/1/38 | 1,600,000 | 618,680 |
Principal Amount | Value | |
Long-Term Municipal Bonds (continued) | ||
Other Revenue (continued) | ||
New York Counties Tobacco Trust VI, Tobacco Settlement Pass Through, Revenue Bonds | ||
Series B | ||
5.00%, due 6/1/30 | $ 135,000 | $ 142,525 |
New York Liberty Development Corp., 1 World Trade Center, Revenue Bonds | ||
Insured: BAM | ||
2.75%, due 2/15/44 | 8,000,000 | 6,255,830 |
New York Liberty Development Corp., 3 World Trade Center LLC, Revenue Bonds | ||
Class 2 | ||
5.375%, due 11/15/40 (a) | 1,500,000 | 1,536,841 |
New York Liberty Development Corp., 7 World Trade Center Project, Revenue Bonds | ||
3.25%, due 9/15/52 | 3,000,000 | 2,586,127 |
3.50%, due 9/15/52 | 1,225,000 | 1,040,037 |
New York Liberty Development Corp., Bank of America Tower at One Bryant Park Project, Revenue Bonds | ||
2.45%, due 9/15/69 | 4,085,000 | 3,836,418 |
New York Liberty Development Corp., Goldman Sachs Headquarters LLC, Revenue Bonds | ||
5.50%, due 10/1/37 | 700,000 | 820,706 |
New York Liberty Development Corp., Green Bond, Revenue Bonds | ||
Series A, Insured: BAM | ||
3.00%, due 11/15/51 | 13,810,000 | 10,823,684 |
New York State Dormitory Authority, Oceanside Library, Revenue Bonds | ||
4.00%, due 7/1/52 | 10,000,000 | 9,878,380 |
New York State Dormitory Authority, State Personal Income Tax, Revenue Bonds | ||
Series A | ||
4.00%, due 3/15/39 | 3,000,000 | 3,019,929 |
Series D | ||
4.00%, due 2/15/47 | 8,000,000 | 7,948,898 |
Series A | ||
4.00%, due 3/15/48 | 7,500,000 | 7,454,519 |
Series C | ||
5.00%, due 3/15/31 | 3,620,000 | 3,767,232 |
Principal Amount | Value | |
Other Revenue (continued) | ||
New York State Housing Finance Agency, Revenue Bonds | ||
Series C, Insured: FHA 542(C) | ||
4.20%, due 11/1/54 | $ 12,795,000 | $ 12,311,694 |
New York State Urban Development Corp., Personal Income Tax, Revenue Bonds | ||
Series A | ||
4.00%, due 3/15/38 | 3,000,000 | 3,024,203 |
New York State Urban Development Corp., State of New York Sales Tax, Revenue Bonds | ||
Series A | ||
4.00%, due 3/15/42 | 9,500,000 | 9,497,144 |
New York Transportation Development Corp., American Airlines, Inc. John F. Kennedy International Airport Project, Revenue Bonds | ||
5.25%, due 8/1/31 (b) | 1,540,000 | 1,628,469 |
New York Transportation Development Corp., Delta Air Lines, Inc. - LaGuardia Airport Terminals C&D Redevelopment Project, Revenue Bonds (b) | ||
4.375%, due 10/1/45 | 4,000,000 | 3,842,217 |
5.00%, due 10/1/35 | 3,000,000 | 3,178,313 |
5.00%, due 10/1/40 | 3,000,000 | 3,146,795 |
New York Transportation Development Corp., New York State Thruway Serive Areas Project, Revenue Bonds (b) | ||
4.00%, due 10/31/41 | 3,880,000 | 3,887,918 |
4.00%, due 4/30/53 | 11,320,000 | 10,834,717 |
New York Transportation Development Corp., Terminal 4 John F. Kennedy International Airport Project, Revenue Bonds | ||
4.00%, due 12/1/38 (b) | 1,275,000 | 1,216,025 |
Series A | ||
4.00%, due 12/1/42 (b) | 1,350,000 | 1,261,384 |
Series C | ||
4.00%, due 12/1/42 | 7,090,000 | 6,780,768 |
Series A | ||
5.00%, due 12/1/32 (b) | 1,000,000 | 1,053,214 |
Series A | ||
5.00%, due 12/1/36 (b) | 1,600,000 | 1,669,884 |
22 | MainStay MacKay New York Tax Free Opportunities Fund |
Principal Amount | Value | |
Long-Term Municipal Bonds (continued) | ||
Other Revenue (continued) | ||
Niagara Tobacco Asset Securitization Corp., Tobacco Settlement, Asset-Backed, Revenue Bonds | ||
5.25%, due 5/15/40 | $ 500,000 | $ 517,025 |
Puerto Rico Municipal Finance Agency, Revenue Bonds | ||
Series A, Insured: AGM | ||
4.75%, due 8/1/22 | 1,420,000 | 1,426,588 |
Series C, Insured: AGC | ||
5.25%, due 8/1/23 | 100,000 | 102,863 |
Puerto Rico Sales Tax Financing Corp., Revenue Bonds | ||
Series A-1 | ||
5.00%, due 7/1/58 | 19,900,000 | 20,446,454 |
Rockland Tobacco Asset Securitization Corp., Tobacco Settlement, Asset-Backed, Revenue Bonds | ||
Series B | ||
(zero coupon), due 8/15/50 (a) | 13,000,000 | 2,058,013 |
Schenectady Metroplex Development Authority, General Resolution Bonds, Revenue Bonds | ||
Series A, Insured: AGM | ||
5.50%, due 8/1/33 | 1,000,000 | 1,040,708 |
Southold Local Development Corp., Peconic Landing, Inc. Project, Revenue Bonds | ||
5.00%, due 12/1/45 | 1,625,000 | 1,664,376 |
State of New York Mortgage Agency, Homeowner Mortgage, Revenue Bonds | ||
Series 208 | ||
4.00%, due 10/1/48 | 1,855,000 | 1,886,325 |
Series 213 | ||
4.25%, due 10/1/47 | 670,000 | 686,988 |
Suffolk County Economic Development Corp., Peconic Landing at Southold, Inc., Revenue Bonds | ||
Series A | ||
5.00%, due 12/1/29 | 175,000 | 191,184 |
Series A | ||
5.00%, due 12/1/34 | 165,000 | 178,436 |
Series A | ||
5.00%, due 12/1/40 | 175,000 | 187,891 |
Principal Amount | Value | |
Other Revenue (continued) | ||
Suffolk Tobacco Asset Securitization Corp., Tobacco Settlement, Asset Backed, Revenue Bonds | ||
Series A-1 | ||
0.57%, due 6/1/22 | $ 1,500,000 | $ 1,497,606 |
Series A-1 | ||
0.67%, due 6/1/23 | 1,585,000 | 1,554,413 |
Series A-1 | ||
1.015%, due 6/1/24 | 1,000,000 | 960,087 |
Series A-2 | ||
4.00%, due 6/1/37 | 1,250,000 | 1,263,598 |
Series A-2 | ||
4.00%, due 6/1/38 | 1,000,000 | 1,008,354 |
Series A-2 | ||
4.00%, due 6/1/39 | 1,250,000 | 1,258,252 |
Series A-2 | ||
4.00%, due 6/1/40 | 1,250,000 | 1,255,142 |
Series B-1 | ||
4.00%, due 6/1/50 | 4,250,000 | 3,964,366 |
Territory of Guam, Business Privilege Tax, Revenue Bonds | ||
Series D | ||
4.00%, due 11/15/39 | 880,000 | 878,877 |
Series D | ||
5.00%, due 11/15/27 | 1,825,000 | 1,939,560 |
Series D | ||
5.00%, due 11/15/28 | 200,000 | 212,036 |
Territory of Guam, Section 30, Revenue Bonds | ||
Series A | ||
5.00%, due 12/1/36 | 1,020,000 | 1,084,921 |
Tompkins County Development Corp., Kendal at Ithaca Project, Revenue Bonds | ||
4.25%, due 7/1/32 | 230,000 | 231,042 |
4.50%, due 7/1/42 | 230,000 | 231,134 |
Series 2014A | ||
5.00%, due 7/1/44 | 690,000 | 712,785 |
TSASC, Inc., Tobacco Settlement Bonds, Revenue Bonds | ||
Series B | ||
5.00%, due 6/1/22 | 500,000 | 500,747 |
Series A | ||
5.00%, due 6/1/41 | 2,000,000 | 2,092,754 |
Series B | ||
5.00%, due 6/1/48 | 9,890,000 | 9,973,385 |
Principal Amount | Value | |
Long-Term Municipal Bonds (continued) | ||
Other Revenue (continued) | ||
Virgin Islands Public Finance Authority, Gross Receipts Taxes Loan, Revenue Bonds | ||
Series A | ||
5.00%, due 10/1/29 | $ 1,000,000 | $ 991,676 |
Series A | ||
5.00%, due 10/1/32 | 1,000,000 | 979,128 |
Series A, Insured: AGM-CR | ||
5.00%, due 10/1/32 | 1,200,000 | 1,209,744 |
Westchester County Local Development Corp., Kendal on Hudson Project, Revenue Bonds | ||
Series B | ||
5.00%, due 1/1/51 | 2,500,000 | 2,584,925 |
Westchester County Local Development Corp., Miriam Osborn Memorial Home Association Project, Revenue Bonds | ||
5.00%, due 7/1/27 | 270,000 | 292,236 |
5.00%, due 7/1/28 | 270,000 | 291,539 |
5.00%, due 7/1/29 | 100,000 | 107,949 |
5.00%, due 7/1/34 | 200,000 | 214,875 |
Westchester County Local Development Corp., Pace University, Revenue Bonds | ||
Series A | ||
5.50%, due 5/1/42 | 3,265,000 | 3,376,866 |
Westchester Tobacco Asset Securitization Corp., Tobacco Settlement, Asset-Backed, Revenue Bonds, Senior Lien | ||
Series B | ||
5.00%, due 6/1/41 | 250,000 | 263,711 |
417,580,314 | ||
Prerefunded 0.8% | ||
Antonio B Won Pat International Airport Authority, Revenue Bonds | ||
Series C, Insured: AGM | ||
6.00%, due 10/1/34 (b) | 720,000 | 756,086 |
Build NYC Resource Corp., YMCA of Greater New York, Revenue Bonds | ||
5.00%, due 8/1/32 | 1,000,000 | 1,008,874 |
5.00%, due 8/1/42 | 1,000,000 | 1,008,874 |
Principal Amount | Value | |
Prerefunded (continued) | ||
Dutchess County Local Development Corp., Health Quest Systems, Inc., Revenue Bonds | ||
Series A | ||
5.00%, due 7/1/34 | $ 500,000 | $ 526,898 |
Guam Government Waterworks Authority, Water and Wastewater System, Revenue Bonds | ||
5.25%, due 7/1/33 | 1,230,000 | 1,272,047 |
5.50%, due 7/1/43 | 1,725,000 | 1,788,882 |
Madison County Capital Resource Corp., Colgate University Project, Revenue Bonds | ||
Series A | ||
5.00%, due 7/1/29 | 1,000,000 | 1,006,060 |
Metropolitan Transportation Authority, Revenue Bonds | ||
Series E | ||
5.00%, due 11/15/42 | 685,000 | 697,568 |
New York State Dormitory Authority, New School (The), Revenue Bonds | ||
Series A | ||
5.00%, due 7/1/35 | 15,000 | 16,135 |
Rensselaer Housing Authority, Van Rensselaer & Renwyck Apartments, Revenue Bonds | ||
Series 2012A | ||
5.00%, due 12/1/47 | 175,000 | 178,243 |
Suffolk Tobacco Asset Securitization Corp., Tobacco Settlement, Asset-Backed, Revenue Bonds | ||
Series B | ||
5.25%, due 6/1/37 | 840,000 | 842,613 |
9,102,280 | ||
Transportation 11.3% | ||
Albany County Airport Authority, Revenue Bonds | ||
4.00%, due 12/15/44 | 835,000 | 823,587 |
Series A | ||
5.00%, due 12/15/43 | 1,750,000 | 1,886,046 |
Series A | ||
5.00%, due 12/15/48 | 2,585,000 | 2,766,783 |
Antonio B Won Pat International Airport Authority, Revenue Bonds | ||
Series C, Insured: AGM | ||
6.00%, due 10/1/34 (b) | 280,000 | 292,760 |
24 | MainStay MacKay New York Tax Free Opportunities Fund |
Principal Amount | Value | |
Long-Term Municipal Bonds (continued) | ||
Transportation (continued) | ||
Buffalo & Fort Erie Public Bridge Authority, Toll Bridge System, Revenue Bonds | ||
5.00%, due 1/1/42 | $ 1,500,000 | $ 1,629,027 |
Metropolitan Transportation Authority, Revenue Bonds | ||
Series D | ||
4.00%, due 11/15/42 | 1,230,000 | 1,196,096 |
Series B-1 | ||
5.00%, due 5/15/22 | 5,350,000 | 5,356,082 |
Series D | ||
5.00%, due 11/15/29 | 550,000 | 591,672 |
Series B | ||
5.00%, due 11/15/40 | 2,500,000 | 2,586,759 |
Series B, Insured: BAM | ||
5.00%, due 11/15/52 | 9,000,000 | 9,609,436 |
Metropolitan Transportation Authority, Climate Certified Green Bond, Revenue Bonds | ||
Series C, Insured: AGM | ||
4.00%, due 11/15/47 | 10,500,000 | 10,341,773 |
Metropolitan Transportation Authority, Green Bond, Revenue Bonds | ||
Series E | ||
4.00%, due 11/15/45 | 2,000,000 | 1,930,931 |
Series C, Insured: AGM | ||
4.00%, due 11/15/48 | 1,240,000 | 1,217,560 |
Series A-1, Insured: AGM | ||
4.00%, due 11/15/50 | 2,500,000 | 2,445,392 |
Series A-1 | ||
4.00%, due 11/15/52 | 1,460,000 | 1,380,560 |
Series A-1, Insured: AGM | ||
4.00%, due 11/15/54 | 3,500,000 | 3,406,696 |
Series A-2 | ||
5.00%, due 11/15/27 | 590,000 | 633,943 |
Series C | ||
5.00%, due 11/15/42 | 2,325,000 | 2,449,861 |
Series D | ||
5.00%, due 11/15/45 | 2,000,000 | 2,097,215 |
MTA Hudson Rail Yards Trust Obligations, Election 2016, Revenue Bonds | ||
Series A | ||
5.00%, due 11/15/56 | 7,205,000 | 7,388,256 |
Principal Amount | Value | |
Transportation (continued) | ||
New York State Bridge Authority, Revenue Bonds | ||
Series A | ||
4.00%, due 1/1/38 | $ 200,000 | $ 208,998 |
Series A | ||
4.00%, due 1/1/39 | 275,000 | 286,647 |
Series A | ||
4.00%, due 1/1/40 | 325,000 | 338,195 |
Series A | ||
4.00%, due 1/1/41 | 200,000 | 207,349 |
Series A | ||
4.00%, due 1/1/46 | 1,000,000 | 1,022,665 |
New York State Thruway Authority, Revenue Bonds | ||
Series L | ||
4.00%, due 1/1/36 | 4,000,000 | 4,042,893 |
Series N | ||
4.00%, due 1/1/47 | 5,500,000 | 5,473,508 |
New York State Thruway Authority, General Revenue Junior Indebtedness Obligation, Revenue Bonds | ||
Series B, Insured: AGM | ||
4.00%, due 1/1/50 | 13,500,000 | 13,220,887 |
New York Transportation Development Corp., LaGuardia Airport Terminal B Redevelopment Project, Revenue Bonds (b) | ||
Series A | ||
5.00%, due 7/1/41 | 1,000,000 | 1,031,041 |
Series A | ||
5.25%, due 1/1/50 | 2,000,000 | 2,058,439 |
Niagara Frontier Transportation Authority, Buffalo Niagara International Airport, Revenue Bonds (b) | ||
Series A | ||
5.00%, due 4/1/23 | 225,000 | 230,177 |
Series A | ||
5.00%, due 4/1/24 | 490,000 | 509,528 |
Series A | ||
5.00%, due 4/1/27 | 610,000 | 631,546 |
Series A | ||
5.00%, due 4/1/29 | 325,000 | 335,051 |
Series A | ||
5.00%, due 4/1/29 | 600,000 | 654,233 |
Series A | ||
5.00%, due 4/1/30 | 375,000 | 408,753 |
Principal Amount | Value | |
Long-Term Municipal Bonds (continued) | ||
Transportation (continued) | ||
Niagara Frontier Transportation Authority, Buffalo Niagara International Airport, Revenue Bonds (b) (continued) | ||
Series A | ||
5.00%, due 4/1/31 | $ 350,000 | $ 379,249 |
Series A | ||
5.00%, due 4/1/32 | 400,000 | 430,134 |
Series A | ||
5.00%, due 4/1/34 | 450,000 | 480,978 |
Series A | ||
5.00%, due 4/1/35 | 400,000 | 427,043 |
Series A | ||
5.00%, due 4/1/36 | 600,000 | 639,969 |
Series A | ||
5.00%, due 4/1/38 | 375,000 | 398,935 |
Ogdensburg Bridge and Port Authority, Revenue Bonds | ||
5.75%, due 7/1/47 (a) | 2,190,000 | 2,054,272 |
Port Authority of Guam, Revenue Bonds | ||
Series B | ||
5.00%, due 7/1/36 (b) | 625,000 | 666,696 |
Series B | ||
5.00%, due 7/1/37 (b) | 200,000 | 213,054 |
Series A | ||
5.00%, due 7/1/48 | 1,235,000 | 1,313,031 |
Port Authority of New York & New Jersey, Revenue Bonds | ||
4.00%, due 11/1/41 (b) | 2,030,000 | 1,980,556 |
Port Authority of New York & New Jersey, Consolidated 178th, Revenue Bonds | ||
Series 178 | ||
5.00%, due 12/1/38 (b) | 1,500,000 | 1,552,728 |
Port Authority of New York & New Jersey, Consolidated 1st, Revenue Bonds | ||
Series 207 | ||
5.00%, due 9/15/48 (b) | 2,500,000 | 2,649,882 |
Port Authority of New York & New Jersey, Consolidated 214th, Revenue Bonds (b) | ||
Series 214 | ||
4.00%, due 9/1/37 | 2,955,000 | 2,917,899 |
Series 214 | ||
4.00%, due 9/1/39 | 4,350,000 | 4,253,886 |
Principal Amount | Value | |
Transportation (continued) | ||
Port Authority of New York & New Jersey, Consolidated 218th, Revenue Bonds | ||
Series 218 | ||
4.00%, due 11/1/47 (b) | $ 5,500,000 | $ 5,286,593 |
Puerto Rico Highway & Transportation Authority, Revenue Bonds | ||
Insured: AGC-ICC | ||
5.00%, due 7/1/23 | 340,000 | 342,369 |
Syracuse Regional Airport Authority, Revenue Bonds (b) | ||
4.00%, due 7/1/35 | 350,000 | 342,990 |
4.00%, due 7/1/36 | 435,000 | 425,979 |
5.00%, due 7/1/31 | 1,000,000 | 1,093,629 |
5.00%, due 7/1/32 | 1,000,000 | 1,087,258 |
5.00%, due 7/1/33 | 750,000 | 810,644 |
Triborough Bridge & Tunnel Authority, Revenue Bonds | ||
Series A | ||
4.00%, due 11/15/56 | 5,000,000 | 4,889,810 |
Series B | ||
5.00%, due 11/15/45 | 2,000,000 | 2,135,095 |
Triborough Bridge & Tunnel Authority, MTA Bridges & Tunnels, Revenue Bonds | ||
Series A | ||
4.00%, due 11/15/44 | 1,105,000 | 1,106,130 |
Series A | ||
5.00%, due 11/15/49 | 5,000,000 | 5,387,242 |
133,956,396 | ||
Utilities 3.0% | ||
Guam Power Authority, Revenue Bonds | ||
Series A | ||
5.00%, due 10/1/33 | 1,055,000 | 1,109,267 |
Series A | ||
5.00%, due 10/1/34 | 2,000,000 | 2,028,124 |
Series A | ||
5.00%, due 10/1/38 | 2,700,000 | 2,825,350 |
Series A | ||
5.00%, due 10/1/40 | 1,250,000 | 1,305,094 |
Long Island Power Authority, Electric System, Revenue Bonds | ||
Series A, Insured: AGM | ||
(zero coupon), due 12/1/26 | 1,500,000 | 1,309,274 |
26 | MainStay MacKay New York Tax Free Opportunities Fund |
Principal Amount | Value | |
Long-Term Municipal Bonds (continued) | ||
Utilities (continued) | ||
New York Power Authority, Green Bond, Revenue Bonds | ||
Series A | ||
4.00%, due 11/15/50 | $ 9,500,000 | $ 9,394,963 |
Series A | ||
4.00%, due 11/15/55 | 2,035,000 | 2,001,670 |
Series A | ||
4.00%, due 11/15/60 | 10,000,000 | 9,787,813 |
Puerto Rico Electric Power Authority, Revenue Bonds | ||
Series TT, Insured: NATL-RE | ||
5.00%, due 7/1/23 | 265,000 | 270,502 |
Series TT, Insured: NATL-RE | ||
5.00%, due 7/1/26 | 215,000 | 219,464 |
Series XX-RSA-1 | ||
5.25%, due 7/1/40 (d)(e) | 5,630,000 | 5,418,875 |
35,670,396 | ||
Water & Sewer 5.4% | ||
Albany Municipal Water Finance Authority, Revenue Bonds | ||
Series A | ||
4.00%, due 12/1/45 | 3,000,000 | 3,164,241 |
Buffalo Municipal Water Finance Authority, Revenue Bonds | ||
Series A, Insured: AGM | ||
4.00%, due 7/1/51 | 2,000,000 | 2,035,740 |
Great Neck North Water Authority, Revenue Bonds | ||
Series A | ||
4.00%, due 1/1/32 | 250,000 | 261,189 |
Series A | ||
4.00%, due 1/1/33 | 425,000 | 443,567 |
Series A | ||
4.00%, due 1/1/34 | 250,000 | 260,302 |
Guam Government Waterworks Authority, Water and Wastewater System, Revenue Bonds | ||
Series A | ||
5.00%, due 7/1/35 | 4,000,000 | 4,145,695 |
5.00%, due 1/1/46 | 3,365,000 | 3,558,546 |
Series A | ||
5.00%, due 1/1/50 | 9,975,000 | 10,788,947 |
Monroe County Water Authority, Water System, Revenue Bonds | ||
3.50%, due 3/1/45 | 2,000,000 | 1,999,045 |
5.00%, due 8/1/37 | 750,000 | 756,506 |
Principal Amount | Value | |
Water & Sewer (continued) | ||
New York City Municipal Water Finance Authority, Revenue Bonds | ||
Series FF-1 | ||
4.00%, due 6/15/49 | $ 3,000,000 | $ 2,957,183 |
New York City Municipal Water Finance Authority, New York City Water & Sewer System, Revenue Bonds | ||
Series FF | ||
4.00%, due 6/15/41 | 4,500,000 | 4,514,107 |
5.00%, due 6/15/50 | 1,000,000 | 1,102,441 |
New York City Municipal Water Finance Authority, Second General Resolution, Revenue Bonds | ||
Series DD | ||
5.00%, due 6/15/34 | 1,000,000 | 1,029,629 |
Series AA-1 | ||
5.00%, due 6/15/50 | 755,000 | 832,343 |
Niagara Falls Public Water Authority, Water & Sewer System, Revenue Bonds | ||
Series A | ||
5.00%, due 7/15/34 | 770,000 | 836,897 |
Onondaga County Water Authority, Revenue Bonds | ||
Series A | ||
4.00%, due 9/15/34 | 845,000 | 905,979 |
Series A | ||
4.00%, due 9/15/35 | 600,000 | 642,556 |
Series A | ||
4.00%, due 9/15/36 | 1,375,000 | 1,467,186 |
Series A | ||
4.00%, due 9/15/37 | 1,945,000 | 2,071,211 |
Series A | ||
4.00%, due 9/15/39 | 700,000 | 743,553 |
Puerto Rico Commonwealth Aqueduct & Sewer Authority, Revenue Bonds (a) | ||
Series B | ||
5.00%, due 7/1/24 | 2,850,000 | 2,939,189 |
Series B | ||
5.00%, due 7/1/29 | 870,000 | 931,724 |
Series B | ||
5.00%, due 7/1/33 | 6,000,000 | 6,393,153 |
Principal Amount | Value | |
Long-Term Municipal Bonds (continued) | ||
Water & Sewer (continued) | ||
Puerto Rico Commonwealth Aqueduct & Sewer Authority, Revenue Bonds, Senior Lien | ||
Series A | ||
4.00%, due 7/1/42 (a) | $ 1,250,000 | $ 1,177,172 |
Saratoga County Water Authority, Revenue Bonds | ||
4.00%, due 9/1/48 | 4,600,000 | 4,721,371 |
Suffolk County Water Authority, Revenue Bonds | ||
Series A | ||
3.25%, due 6/1/43 | 1,000,000 | 943,568 |
Upper Mohawk Valley Regional Water Finance Authority, Green Bond, Revenue Bonds | ||
Series A, Insured: AGM | ||
4.00%, due 4/1/46 | 2,675,000 | 2,762,676 |
64,385,716 | ||
Total Long-Term Municipal Bonds (Cost $1,150,929,971) | 1,085,998,549 | |
Short-Term Municipal Notes 0.7% | ||
Other Revenue 0.1% | ||
New York State Housing Finance Agency, Variable Housing, 160 Madison Avenue, Revenue Bonds | ||
Series A | ||
0.32%, due 11/1/46 (f) | 1,200,000 | 1,200,000 |
Utility 0.4% | ||
Puerto Rico Electric Power Authority, Revenue Bonds | ||
Series UU, Insured: AGM | ||
1.168%, due 7/1/29 (f) | 5,000,000 | 5,045,121 |
Principal Amount | Value | |
Water & Sewer 0.2% | ||
New York City Municipal Water Finance Authority, Revenue Bonds | ||
Series A-1 | ||
0.35%, due 6/15/44 (f) | $ 2,000,000 | $ 2,000,000 |
Total Short-Term Municipal Notes (Cost $7,947,199) | 8,245,121 | |
Total Municipal Bonds (Cost $1,158,877,170) | 1,094,243,670 | |
Shares | ||
Closed-End Funds 0.2% | ||
New York 0.2% | ||
BlackRock New York Municipal Income Trust | 12,602 | 140,638 |
Eaton Vance New York Municipal Bond Fund | 13,241 | 127,113 |
Nuveen New York AMT-Free Quality Municipal Income Fund | 205,883 | 2,281,184 |
Total Closed-End Funds (Cost $3,194,013) | 2,548,935 | |
Short-Term Investment 4.2% | ||
Unaffiliated Investment Company 4.2% | ||
BlackRock Liquidity Funds MuniCash, 0.245% (g) | 50,113,209 | 50,111,468 |
Total Short-Term Investment (Cost $50,111,468) | 50,111,468 | |
Total Investments (Cost $1,212,182,651) | 96.5% | 1,146,904,073 |
Other Assets, Less Liabilities | 3.5 | 41,423,673 |
Net Assets | 100.0% | $ 1,188,327,746 |
† | Percentages indicated are based on Fund net assets. |
(a) | May be sold to institutional investors only under Rule 144A or securities offered pursuant to Section 4(a)(2) of the Securities Act of 1933, as amended. |
(b) | Interest on these securities was subject to alternative minimum tax. |
(c) | Coupon rate may change based on changes of the underlying collateral or prepayments of principal. Rate shown was the rate in effect as of April 30, 2022. |
(d) | Issue in default. |
(e) | Issue in non-accrual status. |
28 | MainStay MacKay New York Tax Free Opportunities Fund |
(f) | Variable-rate demand notes (VRDNs)—Provide the right to sell the security at face value on either that day or within the rate-reset period. VRDNs will normally trade as if the maturity is the earlier put date, even though stated maturity is longer. The interest rate is reset on the put date at a stipulated daily, weekly, monthly, quarterly, or other specified time interval to reflect current market conditions. These securities do not indicate a reference rate and spread in their description. The maturity date shown is the final maturity. |
(g) | Current yield as of April 30, 2022. |
Type | Number of Contracts | Expiration Date | Value at Trade Date | Current Notional Amount | Unrealized Appreciation (Depreciation)2 |
Short Contracts | |||||
U.S. Treasury Long Bonds | (14) | June 2022 | $ (2,156,985) | $ (1,969,625) | $ 187,360 |
1. | As of April 30, 2022, cash in the amount of $49,000 was on deposit with a broker or futures commission merchant for futures transactions. |
2. | Represents the difference between the value of the contracts at the time they were opened and the value as of April 30, 2022. |
Abbreviation(s): |
AGC—Assured Guaranty Corp. |
AGM—Assured Guaranty Municipal Corp. |
AMBAC—Ambac Assurance Corp. |
BAM—Build America Mutual Assurance Co. |
CR—Custodial Receipts |
FHA—Federal Housing Administration |
ICC—Insured Custody Certificates |
NATL-RE—National Public Finance Guarantee Corp. |
Description | Quoted Prices in Active Markets for Identical Assets (Level 1) | Significant Other Observable Inputs (Level 2) | Significant Unobservable Inputs (Level 3) | Total |
Asset Valuation Inputs | ||||
Investments in Securities (a) | ||||
Municipal Bonds | ||||
Long-Term Municipal Bonds | $ — | $ 1,085,998,549 | $ — | $ 1,085,998,549 |
Short-Term Municipal Notes | — | 8,245,121 | — | 8,245,121 |
Total Municipal Bonds | — | 1,094,243,670 | — | 1,094,243,670 |
Closed-End Funds | 2,548,935 | — | — | 2,548,935 |
Short-Term Investment | ||||
Unaffiliated Investment Company | 50,111,468 | — | — | 50,111,468 |
Total Investments in Securities | 52,660,403 | 1,094,243,670 | — | 1,146,904,073 |
Other Financial Instruments | ||||
Futures Contracts (b) | 187,360 | — | — | 187,360 |
Total Investments in Securities and Other Financial Instruments | $ 52,847,763 | $ 1,094,243,670 | $ — | $ 1,147,091,433 |
(a) | For a complete listing of investments and their industries, see the Portfolio of Investments. |
(b) | The value listed for these securities reflects unrealized appreciation (depreciation) as shown on the Portfolio of Investments. |
30 | MainStay MacKay New York Tax Free Opportunities Fund |
Assets | |
Investment in securities, at value (identified cost $1,212,182,651) | $1,146,904,073 |
Cash | 29,999,967 |
Cash collateral on deposit at broker for futures contracts | 49,000 |
Receivables: | |
Fund shares sold | 15,227,548 |
Dividends and interest | 14,364,106 |
Investment securities sold | 13,878,460 |
Variation margin on futures contracts | 7,437 |
Other assets | 37,382 |
Total assets | 1,220,467,973 |
Liabilities | |
Payables: | |
Investment securities purchased | 23,562,415 |
Fund shares redeemed | 7,281,603 |
Manager (See Note 3) | 437,724 |
NYLIFE Distributors (See Note 3) | 197,461 |
Transfer agent (See Note 3) | 60,725 |
Professional fees | 21,328 |
Custodian | 17,502 |
Shareholder communication | 8,201 |
Trustees | 150 |
Distributions payable | 553,118 |
Total liabilities | 32,140,227 |
Net assets | $1,188,327,746 |
Composition of Net Assets | |
Shares of beneficial interest outstanding (par value of $.001 per share) unlimited number of shares authorized | $122,215 |
Additional paid-in-capital | 1,300,942,837 |
1,301,065,052 | |
Total distributable earnings (loss) | (112,737,306) |
Net assets | $1,188,327,746 |
Class A | |
Net assets applicable to outstanding shares | $775,625,250 |
Shares of beneficial interest outstanding | 79,776,586 |
Net asset value per share outstanding | $9.72 |
Maximum sales charge (4.50% of offering price) | 0.46 |
Maximum offering price per share outstanding | $10.18 |
Investor Class | |
Net assets applicable to outstanding shares | $305,205 |
Shares of beneficial interest outstanding | 31,387 |
Net asset value per share outstanding | $9.72 |
Maximum sales charge (4.00% of offering price) | 0.41 |
Maximum offering price per share outstanding | $10.13 |
Class C | |
Net assets applicable to outstanding shares | $91,959,863 |
Shares of beneficial interest outstanding | 9,457,264 |
Net asset value and offering price per share outstanding | $9.72 |
Class C2 | |
Net assets applicable to outstanding shares | $1,905,169 |
Shares of beneficial interest outstanding | 196,013 |
Net asset value and offering price per share outstanding | $9.72 |
Class I | |
Net assets applicable to outstanding shares | $317,805,752 |
Shares of beneficial interest outstanding | 32,678,587 |
Net asset value and offering price per share outstanding | $9.73 |
Class R6 | |
Net assets applicable to outstanding shares | $726,507 |
Shares of beneficial interest outstanding | 74,695 |
Net asset value and offering price per share outstanding | $9.73 |
Investment Income (Loss) | |
Income | |
Interest | $19,113,883 |
Dividends | 66,203 |
Total income | 19,180,086 |
Expenses | |
Manager (See Note 3) | 2,979,465 |
Distribution/Service—Class A (See Note 3) | 1,099,105 |
Distribution/Service—Investor Class (See Note 3) | 452 |
Distribution/Service—Class C (See Note 3) | 262,478 |
Distribution/Service—Class C2 (See Note 3) | 6,743 |
Transfer agent (See Note 3) | 225,289 |
Professional fees | 58,515 |
Custodian | 36,434 |
Registration | 16,144 |
Shareholder communication | 14,526 |
Trustees | 13,324 |
Miscellaneous | 23,350 |
Total expenses before waiver/reimbursement | 4,735,825 |
Expense waiver/reimbursement from Manager (See Note 3) | (529) |
Net expenses | 4,735,296 |
Net investment income (loss) | 14,444,790 |
Realized and Unrealized Gain (Loss) | |
Net realized gain (loss) on: | |
Unaffiliated investment transactions | (15,657,803) |
Futures transactions | 115,560 |
Net realized gain (loss) | (15,542,243) |
Net change in unrealized appreciation (depreciation) on: | |
Unaffiliated investments | (133,692,243) |
Futures contracts | 167,159 |
Net change in unrealized appreciation (depreciation) | (133,525,084) |
Net realized and unrealized gain (loss) | (149,067,327) |
Net increase (decrease) in net assets resulting from operations | $(134,622,537) |
32 | MainStay MacKay New York Tax Free Opportunities Fund |
for the six months ended April 30, 2022 (Unaudited) and the year ended October 31, 2021
2022 | 2021 | |
Increase (Decrease) in Net Assets | ||
Operations: | ||
Net investment income (loss) | $14,444,790 | $25,909,535 |
Net realized gain (loss) | (15,542,243) | 538,926 |
Net change in unrealized appreciation (depreciation) | (133,525,084) | 32,703,974 |
Net increase (decrease) in net assets resulting from operations | (134,622,537) | 59,152,435 |
Distributions to shareholders: | ||
Class A | (11,254,474) | (19,009,606) |
Investor Class | (4,621) | (9,566) |
Class C | (1,213,013) | (2,288,913) |
Class C2 | (22,423) | (24,498) |
Class I | (4,969,800) | (8,089,706) |
Class R6 | (11,191) | (27,918) |
Total distributions to shareholders | (17,475,522) | (29,450,207) |
Capital share transactions: | ||
Net proceeds from sales of shares | 399,787,705 | 497,461,170 |
Net asset value of shares issued to shareholders in reinvestment of distributions | 14,141,903 | 23,618,819 |
Cost of shares redeemed | (449,842,928) | (234,382,554) |
Increase (decrease) in net assets derived from capital share transactions | (35,913,320) | 286,697,435 |
Net increase (decrease) in net assets | (188,011,379) | 316,399,663 |
Net Assets | ||
Beginning of period | 1,376,339,125 | 1,059,939,462 |
End of period | $1,188,327,746 | $1,376,339,125 |
Six months ended April 30, 2022* | Year Ended October 31, | |||||
Class A | 2021 | 2020 | 2019 | 2018 | 2017 | |
Net asset value at beginning of period | $10.94 | $10.63 | $10.68 | $10.12 | $10.34 | $10.58 |
Net investment income (loss) | 0.11(a) | 0.22(a) | 0.29 | 0.32 | 0.34 | 0.36 |
Net realized and unrealized gain (loss) | (1.19) | 0.34 | (0.04) | 0.56 | (0.22) | (0.24) |
Total from investment operations | (1.08) | 0.56 | 0.25 | 0.88 | 0.12 | 0.12 |
Less distributions: | ||||||
From net investment income | (0.14) | (0.25) | (0.30) | (0.32) | (0.34) | (0.36) |
Net asset value at end of period | $9.72 | $10.94 | $10.63 | $10.68 | $10.12 | $10.34 |
Total investment return (b) | (9.99)% | 5.32% | 2.35% | 8.84% | 1.17% | 1.23% |
Ratios (to average net assets)/Supplemental Data: | ||||||
Net investment income (loss) | 2.11%†† | 2.02% | 2.38% | 3.00% | 3.31% | 3.50% |
Net expenses (c) | 0.75%†† | 0.75% | 0.75% | 0.75% | 0.75% | 0.75% |
Expenses (before waiver/reimbursement) (c) | 0.75%†† | 0.76% | 0.80% | 0.82% | 0.82% | 0.83% |
Portfolio turnover rate | 26%(d) | 10%(d) | 29%(d) | 28%(d) | 33% | 30% |
Net assets at end of period (in 000’s) | $775,625 | $907,662 | $688,870 | $462,499 | $186,579 | $148,823 |
* | Unaudited. |
†† | Annualized. |
(a) | Per share data based on average shares outstanding during the period. |
(b) | Total investment return is calculated exclusive of sales charges and assumes the reinvestment of dividends and distributions. For periods of less than one year, total return is not annualized. |
(c) | In addition to the fees and expenses which the Fund bears directly, it also indirectly bears a pro-rata share of the fees and expenses of the underlying funds in which it invests. Such indirect expenses are not included in the above expense ratios. |
(d) | The portfolio turnover rate includes variable rate demand notes. |
Six months ended April 30, 2022* | Year Ended October 31, | |||||
Investor Class | 2021 | 2020 | 2019 | 2018 | 2017 | |
Net asset value at beginning of period | $10.94 | $10.63 | $10.68 | $10.13 | $10.34 | $10.59 |
Net investment income (loss) | 0.11(a) | 0.22(a) | 0.25 | 0.32 | 0.34 | 0.36 |
Net realized and unrealized gain (loss) | (1.19) | 0.34 | 0.00‡ | 0.55 | (0.21) | (0.25) |
Total from investment operations | (1.08) | 0.56 | 0.25 | 0.87 | 0.13 | 0.11 |
Less distributions: | ||||||
From net investment income | (0.14) | (0.25) | (0.30) | (0.32) | (0.34) | (0.36) |
Net asset value at end of period | $9.72 | $10.94 | $10.63 | $10.68 | $10.13 | $10.34 |
Total investment return (b) | (10.00)% | 5.32% | 2.33% | 8.72% | 1.25% | 1.10% |
Ratios (to average net assets)/Supplemental Data: | ||||||
Net investment income (loss) | 2.10%†† | 2.03% | 2.39% | 3.06% | 3.29% | 3.48% |
Net expenses (c) | 0.76%†† | 0.76% | 0.77% | 0.77% | 0.78% | 0.79% |
Expenses (before waiver/reimbursement) (c) | 0.76%††(d) | 0.77% | 0.82% | 0.84% | 0.85% | 0.87% |
Portfolio turnover rate | 26%(e) | 10%(e) | 29%(e) | 28%(e) | 33% | 30% |
Net assets at end of period (in 000's) | $305 | $375 | $414 | $463 | $385 | $356 |
* | Unaudited. |
‡ | Less than one cent per share. |
†† | Annualized. |
(a) | Per share data based on average shares outstanding during the period. |
(b) | Total investment return is calculated exclusive of sales charges and assumes the reinvestment of dividends and distributions. For periods of less than one year, total return is not annualized. |
(c) | In addition to the fees and expenses which the Fund bears directly, it also indirectly bears a pro-rata share of the fees and expenses of the underlying funds in which it invests. Such indirect expenses are not included in the above expense ratios. |
(d) | Expense waiver/reimbursement less than 0.01%. |
(e) | The portfolio turnover rate includes variable rate demand notes. |
34 | MainStay MacKay New York Tax Free Opportunities Fund |
Six months ended April 30, 2022* | Year Ended October 31, | |||||
Class C | 2021 | 2020 | 2019 | 2018 | 2017 | |
Net asset value at beginning of period | $10.94 | $10.63 | $10.68 | $10.12 | $10.34 | $10.59 |
Net investment income (loss) | 0.10(a) | 0.19(a) | 0.24 | 0.30 | 0.31 | 0.33 |
Net realized and unrealized gain (loss) | (1.20) | 0.35 | (0.02) | 0.56 | (0.22) | (0.25) |
Total from investment operations | (1.10) | 0.54 | 0.22 | 0.86 | 0.09 | 0.08 |
Less distributions: | ||||||
From net investment income | (0.12) | (0.23) | (0.27) | (0.30) | (0.31) | (0.33) |
Net asset value at end of period | $9.72 | $10.94 | $10.63 | $10.68 | $10.12 | $10.34 |
Total investment return (b) | (10.11)% | 5.05% | 2.08% | 8.55% | 0.90% | 0.85% |
Ratios (to average net assets)/Supplemental Data: | ||||||
Net investment income (loss) | 1.86%†† | 1.77% | 2.13% | 2.77% | 3.04% | 3.23% |
Net expenses (c) | 1.01%†† | 1.01% | 1.02% | 1.02% | 1.03% | 1.03% |
Expenses (before waiver/reimbursement) (c) | 1.01%††(d) | 1.02% | 1.07% | 1.09% | 1.10% | 1.11% |
Portfolio turnover rate | 26%(e) | 10%(e) | 29%(e) | 28%(e) | 33% | 30% |
Net assets at end of period (in 000’s) | $91,960 | $111,681 | $107,117 | $90,553 | $54,258 | $45,547 |
* | Unaudited. |
†† | Annualized. |
(a) | Per share data based on average shares outstanding during the period. |
(b) | Total investment return is calculated exclusive of sales charges and assumes the reinvestment of dividends and distributions. For periods of less than one year, total return is not annualized. |
(c) | In addition to the fees and expenses which the Fund bears directly, it also indirectly bears a pro-rata share of the fees and expenses of the underlying funds in which it invests. Such indirect expenses are not included in the above expense ratios. |
(d) | Expense waiver/reimbursement less than 0.01%. |
(e) | The portfolio turnover rate includes variable rate demand notes. |
Six months ended April 30, 2022* | Year Ended October 31, | August 31, 2020^ through October 31, | |
Class C2 | 2021 | 2020 | |
Net asset value at beginning of period | $10.94 | $10.63 | $10.72 |
Net investment income (loss) | 0.09(a) | 0.17(a) | 0.04 |
Net realized and unrealized gain (loss) | (1.20) | 0.35 | (0.09) |
Total from investment operations | (1.11) | 0.52 | (0.05) |
Less distributions: | |||
From net investment income | (0.11) | (0.21) | (0.04) |
Net asset value at end of period | $9.72 | $10.94 | $10.63 |
Total investment return (b) | (10.18)% | 4.89% | (0.50)% |
Ratios (to average net assets)/Supplemental Data: | |||
Net investment income (loss) | 1.70%†† | 1.55% | 1.32%†† |
Net expenses (c) | 1.16%†† | 1.15% | 1.17%†† |
Expenses (before waiver/reimbursement) (c) | 1.16%††(d) | 1.16% | 1.22%†† |
Portfolio turnover rate (e) | 26% | 10% | 29% |
Net assets at end of period (in 000’s) | $1,905 | $1,861 | $315 |
* | Unaudited. |
^ | Inception date. |
†† | Annualized. |
(a) | Per share data based on average shares outstanding during the period. |
(b) | Total investment return is calculated exclusive of sales charges and assumes the reinvestment of dividends and distributions. For periods of less than one year, total return is not annualized. |
(c) | In addition to the fees and expenses which the Fund bears directly, it also indirectly bears a pro-rata share of the fees and expenses of the underlying funds in which it invests. Such indirect expenses are not included in the above expense ratios. |
(d) | Expense waiver/reimbursement less than 0.01%. |
(e) | The portfolio turnover rate includes variable rate demand notes. |
Six months ended April 30, 2022* | Year Ended October 31, | |||||
Class I | 2021 | 2020 | 2019 | 2018 | 2017 | |
Net asset value at beginning of period | $10.94 | $10.63 | $10.68 | $10.13 | $10.34 | $10.59 |
Net investment income (loss) | 0.13(a) | 0.25(a) | 0.32 | 0.35 | 0.37 | 0.39 |
Net realized and unrealized gain (loss) | (1.19) | 0.34 | (0.05) | 0.55 | (0.21) | (0.25) |
Total from investment operations | (1.06) | 0.59 | 0.27 | 0.90 | 0.16 | 0.14 |
Less distributions: | ||||||
From net investment income | (0.15) | (0.28) | (0.32) | (0.35) | (0.37) | (0.39) |
Net asset value at end of period | $9.73 | $10.94 | $10.63 | $10.68 | $10.13 | $10.34 |
Total investment return (b) | (9.79)% | 5.59% | 2.61% | 9.01% | 1.53% | 1.39% |
Ratios (to average net assets)/Supplemental Data: | ||||||
Net investment income (loss) | 2.37%†† | 2.27% | 2.64% | 3.37% | 3.54% | 3.76% |
Net expenses (c) | 0.50%†† | 0.50% | 0.50% | 0.50% | 0.50% | 0.50% |
Expenses (before waiver/reimbursement) (c) | 0.50%†† | 0.51% | 0.55% | 0.57% | 0.57% | 0.58% |
Portfolio turnover rate | 26%(d) | 10%(d) | 29%(d) | 28%(d) | 33% | 30% |
Net assets at end of period (in 000’s) | $317,806 | $353,955 | $261,819 | $161,203 | $181,059 | $62,078 |
* | Unaudited. |
†† | Annualized. |
(a) | Per share data based on average shares outstanding during the period. |
(b) | Total investment return is calculated exclusive of sales charges and assumes the reinvestment of dividends and distributions. Class I shares are not subject to sales charges. For periods of less than one year, total return is not annualized. |
(c) | In addition to the fees and expenses which the Fund bears directly, it also indirectly bears a pro-rata share of the fees and expenses of the underlying funds in which it invests. Such indirect expenses are not included in the above expense ratios. |
(d) | The portfolio turnover rate includes variable rate demand notes. |
Six months ended April 30, 2022* | Year Ended October 31, | November 1, 2019^ through October 31, | |
Class R6 | 2021 | 2020 | |
Net asset value at beginning of period | $10.94 | $10.63 | $10.69 |
Net investment income (loss) | 0.13(a) | 0.26(a) | 0.29 |
Net realized and unrealized gain (loss) | (1.19) | 0.33 | (0.03) |
Total from investment operations | (1.06) | 0.59 | 0.26 |
Less distributions: | |||
From net investment income | (0.15) | (0.28) | (0.32) |
Net asset value at end of period | $9.73 | $10.94 | $10.63 |
Total investment return (b) | (9.77)% | 5.61% | 2.60% |
Ratios (to average net assets)/Supplemental Data: | |||
Net investment income (loss) | 2.40%†† | 2.34% | 2.39% |
Net expenses (c) | 0.47%†† | 0.47% | 0.48% |
Expenses (before waiver/reimbursement) (c) | 0.47%†† | 0.49% | 0.54% |
Portfolio turnover rate (d) | 26% | 10% | 29% |
Net assets at end of period (in 000’s) | $727 | $806 | $1,404 |
* | Unaudited. |
^ | Inception date. |
†† | Annualized. |
(a) | Per share data based on average shares outstanding during the period. |
(b) | Total investment return is calculated exclusive of sales charges and assumes the reinvestment of dividends and distributions. Class R6 shares are not subject to sales charges. For periods of less than one year, total return is not annualized. |
(c) | In addition to the fees and expenses which the Fund bears directly, it also indirectly bears a pro-rata share of the fees and expenses of the underlying funds in which it invests. Such indirect expenses are not included in the above expense ratios. |
(d) | The portfolio turnover rate includes variable rate demand notes. |
36 | MainStay MacKay New York Tax Free Opportunities Fund |
Class | Commenced Operations |
Class A | May 14, 2012 |
Investor Class | May 14, 2012 |
Class C | May 14, 2012 |
Class C2 | August 31, 2020 |
Class I | May 14, 2012 |
Class R6 | November 1, 2019 |
SIMPLE Class | N/A* |
* | SIMPLE Class shares were registered for sale effective as of August 31, 2020 but have not yet commenced operations. |
• Benchmark yields | • Reported trades |
• Broker/dealer quotes | • Issuer spreads |
• Two-sided markets | • Benchmark securities |
• Bids/offers | • Reference data (corporate actions or material event notices) |
• Industry and economic events | • Comparable bonds |
• Monthly payment information |
38 | MainStay MacKay New York Tax Free Opportunities Fund |
40 | MainStay MacKay New York Tax Free Opportunities Fund |
Asset Derivatives | Interest Rate Contracts Risk | Total |
Futures Contracts - Net Assets—Net unrealized appreciation on futures contracts (a) | $187,360 | $187,360 |
Total Fair Value | $187,360 | $187,360 |
(a) | Includes cumulative appreciation (depreciation) of futures contracts as reported in the Portfolio of Investments. Only current day’s variation margin is reported within the Statement of Assets and Liabilities. |
Net Realized Gain (Loss) from: | Interest Rate Contracts Risk | Total |
Futures Contracts | $115,560 | $115,560 |
Total Net Realized Gain (Loss) | $115,560 | $115,560 |
Net Change in Unrealized Appreciation (Depreciation) | Interest Rate Contracts Risk | Total |
Futures Contracts | $167,159 | $167,159 |
Total Net Change in Unrealized Appreciation (Depreciation) | $167,159 | $167,159 |
Average Notional Amount | Total |
Futures Contracts Short | $(2,159,792) |
42 | MainStay MacKay New York Tax Free Opportunities Fund |
Class | Expense | Waived |
Class A | $144,119 | $— |
Investor Class | 79 | — |
Class C | 22,891 | — |
Class C2 | 452 | — |
Class I | 57,732 | — |
Class R6 | 16 | — |
Class C2 | $23,385 | 1.2% |
Class R6 | 24,354 | 3.4 |
Federal Tax Cost | Gross Unrealized Appreciation | Gross Unrealized (Depreciation) | Net Unrealized Appreciation/ (Depreciation) | |
Investments in Securities | $1,223,122,628 | $10,102,908 | $(86,321,463) | $(76,218,555) |
Capital Loss Available Through | Short-Term Capital Loss Amounts (000’s) | Long-Term Capital Loss Amounts (000’s) |
Unlimited | $12,557 | $5,370 |
2021 | |
Distributions paid from: | |
Ordinary Income | $828,027 |
Exempt Interest Dividends | 28,622,180 |
Total | $29,450,207 |
Class A | Shares | Amount |
Six-month period ended April 30, 2022: | ||
Shares sold | 31,072,756 | $319,277,701 |
Shares issued to shareholders in reinvestment of distributions | 923,783 | 9,718,010 |
Shares redeemed | (35,179,069) | (361,891,488) |
Net increase (decrease) in shares outstanding before conversion | (3,182,530) | (32,895,777) |
Shares converted into Class A (See Note 1) | 2,817 | 30,552 |
Shares converted from Class A (See Note 1) | (7,371) | (74,414) |
Net increase (decrease) | (3,187,084) | $(32,939,639) |
Year ended October 31, 2021: | ||
Shares sold | 30,707,409 | $336,841,389 |
Shares issued to shareholders in reinvestment of distributions | 1,485,376 | 16,302,415 |
Shares redeemed | (14,026,396) | (153,419,189) |
Net increase (decrease) in shares outstanding before conversion | 18,166,389 | 199,724,615 |
Shares converted into Class A (See Note 1) | 33,907 | 372,896 |
Shares converted from Class A (See Note 1) | (41,200) | (449,580) |
Net increase (decrease) | 18,159,096 | $199,647,931 |
Investor Class | Shares | Amount |
Six-month period ended April 30, 2022: | ||
Shares sold | 7,689 | $83,823 |
Shares issued to shareholders in reinvestment of distributions | 414 | 4,360 |
Shares redeemed | (9,898) | (104,874) |
Net increase (decrease) in shares outstanding before conversion | (1,795) | (16,691) |
Shares converted into Investor Class (See Note 1) | 353 | 3,710 |
Shares converted from Investor Class (See Note 1) | (1,410) | (15,598) |
Net increase (decrease) | (2,852) | $(28,579) |
Year ended October 31, 2021: | ||
Shares sold | 8,730 | $96,126 |
Shares issued to shareholders in reinvestment of distributions | 834 | 9,151 |
Shares redeemed | (9,876) | (109,165) |
Net increase (decrease) in shares outstanding before conversion | (312) | (3,888) |
Shares converted into Investor Class (See Note 1) | 369 | 4,087 |
Shares converted from Investor Class (See Note 1) | (4,762) | (52,231) |
Net increase (decrease) | (4,705) | $(52,032) |
Class C | Shares | Amount |
Six-month period ended April 30, 2022: | ||
Shares sold | 457,831 | $4,864,997 |
Shares issued to shareholders in reinvestment of distributions | 83,907 | 881,690 |
Shares redeemed | (1,289,832) | (13,604,351) |
Net increase (decrease) in shares outstanding before conversion | (748,094) | (7,857,664) |
Shares converted from Class C (See Note 1) | (1,407) | (14,954) |
Net increase (decrease) | (749,501) | $(7,872,618) |
Year ended October 31, 2021: | ||
Shares sold | 1,889,563 | $20,739,205 |
Shares issued to shareholders in reinvestment of distributions | 146,546 | 1,607,772 |
Shares redeemed | (1,858,247) | (20,372,010) |
Net increase (decrease) in shares outstanding before conversion | 177,862 | 1,974,967 |
Shares converted from Class C (See Note 1) | (46,574) | (511,252) |
Net increase (decrease) | 131,288 | $1,463,715 |
44 | MainStay MacKay New York Tax Free Opportunities Fund |
Class C2 | Shares | Amount |
Six-month period ended April 30, 2022: | ||
Shares sold | 34,376 | $377,585 |
Shares issued to shareholders in reinvestment of distributions | 2,138 | 22,423 |
Shares redeemed | (10,623) | (112,972) |
Net increase (decrease) | 25,891 | $287,036 |
Year ended October 31, 2021: | ||
Shares sold | 159,307 | $1,741,853 |
Shares issued to shareholders in reinvestment of distributions | 2,230 | 24,498 |
Shares redeemed | (21,068) | (234,045) |
Net increase (decrease) | 140,469 | $1,532,306 |
Class I | Shares | Amount |
Six-month period ended April 30, 2022: | ||
Shares sold | 7,152,693 | $75,183,599 |
Shares issued to shareholders in reinvestment of distributions | 333,503 | 3,504,229 |
Shares redeemed | (7,158,429) | (74,129,043) |
Net increase (decrease) in shares outstanding before conversion | 327,767 | 4,558,785 |
Shares converted into Class I (See Note 1) | 7,019 | 70,704 |
Net increase (decrease) | 334,786 | $4,629,489 |
Year ended October 31, 2021: | ||
Shares sold | 12,579,814 | $138,042,597 |
Shares issued to shareholders in reinvestment of distributions | 514,497 | 5,647,065 |
Shares redeemed | (5,432,002) | (59,576,804) |
Net increase (decrease) in shares outstanding before conversion | 7,662,309 | 84,112,858 |
Shares converted into Class I (See Note 1) | 58,252 | 636,080 |
Net increase (decrease) | 7,720,561 | $84,748,938 |
Class R6 | Shares | Amount |
Six-month period ended April 30, 2022: | ||
Shares issued to shareholders in reinvestment of distributions | 1,065 | $11,191 |
Shares redeemed | (18) | (200) |
Net increase (decrease) | 1,047 | $10,991 |
Year ended October 31, 2021: | ||
Shares issued to shareholders in reinvestment of distributions | 2,546 | $27,918 |
Shares redeemed | (60,941) | (671,341) |
Net increase (decrease) | (58,395) | $(643,423) |
46 | MainStay MacKay New York Tax Free Opportunities Fund |
48 | MainStay MacKay New York Tax Free Opportunities Fund |
50 | MainStay MacKay New York Tax Free Opportunities Fund |
For more information
Message from the President and Semiannual Report
please log in to newyorklifeinvestments.com/accounts.
Not FDIC/NCUA Insured | Not a Deposit | May Lose Value | No Bank Guarantee | Not Insured by Any Government Agency |


5 | |
9 | |
10 | |
19 | |
25 | |
34 | |
38 | |
39 | |
39 |
Investors should refer to the Fund’s Summary Prospectus and/or Prospectus and consider the Fund’s investment objectives, strategies, risks, charges and expenses carefully before investing. The Summary Prospectus and/or Prospectus contain this and other information about the Fund. You may obtain copies of the Fund’s Summary Prospectus, Prospectus and Statement of Additional Information, which includes information about MainStay Funds Trust's Trustees, free of charge, upon request, by calling toll-free 800-624-6782, by writing to NYLIFE Distributors LLC, Attn: MainStay Marketing Department, 30 Hudson Street, Jersey City, NJ 07302 or by sending an e-mail to MainStayShareholderServices@nylim.com. These documents are also available via the MainStay Funds’ website at newyorklifeinvestments.com. Please read the Fund’s Summary Prospectus and/or Prospectus carefully before investing.

Average Annual Total Returns for the Period-Ended April 30, 2022 | ||||||||
Class | Sales Charge | Inception Date | Six Months1 | One Year | Five Years | Ten Years or Since Inception | Gross Expense Ratio2 | |
Class A Shares3 | Maximum 1.5% Initial Sales Charge | With sales charges | 1/2/2004 | -11.22% | -1.77% | 12.41% | 12.71% | 0.50% |
Excluding sales charges | -9.87 | -0.27 | 13.10 | 13.05 | 0.50 | |||
Investor Class Shares3, 4 | Maximum 1% Initial Sales Charge | With sales charges | 2/28/2008 | -10.84 | -1.46 | 12.22 | 12.56 | 0.82 |
Excluding sales charges | -9.94 | -0.46 | 12.91 | 12.90 | 0.82 | |||
Class I Shares | No Sales Charge | 1/2/1991 | -9.75 | -0.01 | 13.38 | 13.34 | 0.25 | |
SIMPLE Class Shares | No Sales Charge | 8/31/2020 | -10.04 | -0.72 | N/A | 11.04 | 1.07 | |
1. | Not annualized. |
2. | The gross expense ratios presented reflect the Fund’s “Total Annual Fund Operating Expenses” from the most recent Prospectus, as supplemented, and may differ from other expense ratios disclosed in this report. |
3. | Prior to March 19, 2020, the maximum initial sales charge for Class A Shares and Investor Class Shares was 3%, which is reflected in the applicable average annual total return figures shown. |
4. | Prior to June 30, 2020, the maximum initial sales charge was 1.5%, which is reflected in the applicable average annual total return figures shown. |
Benchmark Performance* | Six Months1 | One Year | Five Years | Ten Years |
S&P 500® Index2 | -9.65% | 0.21% | 13.66% | 13.67% |
Morningstar Large Blend Category Average3 | -9.90 | -1.94 | 11.46 | 11.54 |
* | Returns for indices reflect no deductions for fees, expenses or taxes, except for foreign withholding taxes where applicable. |
1. | Not annualized. |
2. | The S&P 500® Index is the Fund's primary broad-based securities market index for comparison purposes. Information Regarding Standard & Poor's® "Standard & Poor's®," "S&P®," "S&P 500®," "Standard & Poor's 500," and "500" are trademarks of The McGraw-Hill Companies, Inc. The MainStay S&P 500 Index Fund is not sponsored, endorsed, sold or promoted by Standard & Poor's, and Standard & Poor's makes no representation regarding the advisability of investing in the Fund. Results assume reinvestment of all dividends and capital gains. An investment cannot be made directly in an index. |
3. | The Morningstar Large Blend Category Average is representative of funds that represent the overall U.S. stock market in size, growth rates and price. Stocks in the top 70% of the capitalization of the U.S. equity market are defined as large cap. The blend style is assigned to portfolios where neither growth nor value characteristics predominate. These portfolios tend to invest across the spectrum of U.S. industries, and owing to their broad exposure, the portfolios' returns are often similar to those of the S&P 500® Index. Results are based on average total returns of similar funds with all dividends and capital gain distributions reinvested. |
6 | MainStay S&P 500 Index Fund |
Share Class | Beginning Account Value 11/1/21 | Ending Account Value (Based on Actual Returns and Expenses) 4/30/22 | Expenses Paid During Period1 | Ending Account Value (Based on Hypothetical 5% Annualized Return and Actual Expenses) 4/30/22 | Expenses Paid During Period1 | Net Expense Ratio During Period2 |
Class A Shares | $1,000.00 | $901.30 | $2.36 | $1,022.32 | $2.51 | 0.50% |
Investor Class Shares | $1,000.00 | $900.60 | $3.30 | $1,021.32 | $3.51 | 0.70% |
Class I Shares | $1,000.00 | $902.50 | $1.18 | $1,023.56 | $1.25 | 0.25% |
SIMPLE Class Shares | $1,000.00 | $899.60 | $4.47 | $1,020.08 | $4.76 | 0.95% |
1. | Expenses are equal to the Fund’s annualized expense ratio of each class multiplied by the average account value over the period, divided by 365 and multiplied by 181 (to reflect the six-month period). The table above represents the actual expenses incurred during the six-month period. In addition to the fees and expenses which the Fund bears directly, it also indirectly bears a pro rata share of the fees and expenses of the underlying funds in which it invests. Such indirect expenses are not included in the above-reported expense figures. |
2. | Expenses are equal to the Fund's annualized expense ratio to reflect the six-month period. |
Industry Composition as of April 30, 2022 (Unaudited)
Software | 8.6% |
Technology Hardware, Storage & Peripherals | 7.2 |
Semiconductors & Semiconductor Equipment | 5.3 |
Interactive Media & Services | 5.2 |
IT Services | 4.4 |
Pharmaceuticals | 4.2 |
Oil, Gas & Consumable Fuels | 3.8 |
Banks | 3.7 |
Internet & Direct Marketing Retail | 3.2 |
Health Care Providers & Services | 3.2 |
Equity Real Estate Investment Trusts | 2.8 |
Capital Markets | 2.8 |
Health Care Equipment & Supplies | 2.8 |
Automobiles | 2.4 |
Insurance | 2.1 |
Specialty Retail | 2.1 |
Biotechnology | 2.0 |
Hotels, Restaurants & Leisure | 1.9 |
Chemicals | 1.8 |
Electric Utilities | 1.8 |
Life Sciences Tools & Services | 1.8 |
Diversified Financial Services | 1.7 |
Beverages | 1.6 |
Food & Staples Retailing | 1.6 |
Aerospace & Defense | 1.6 |
Machinery | 1.6 |
Household Products | 1.5 |
Entertainment | 1.3 |
Food Products | 1.1 |
Industrial Conglomerates | 1.0 |
Diversified Telecommunication Services | 1.0 |
Road & Rail | 0.9 |
Multi–Utilities | 0.9 |
Media | 0.9 |
Communications Equipment | 0.8% |
Tobacco | 0.7 |
Electronic Equipment, Instruments & Components | 0.6 |
Consumer Finance | 0.6 |
Air Freight & Logistics | 0.6 |
Multiline Retail | 0.6 |
Textiles, Apparel & Luxury Goods | 0.6 |
Electrical Equipment | 0.5 |
Metals & Mining | 0.5 |
Commercial Services & Supplies | 0.4 |
Building Products | 0.4 |
Containers & Packaging | 0.3 |
Energy Equipment & Services | 0.3 |
Household Durables | 0.3 |
Professional Services | 0.3 |
Airlines | 0.3 |
Trading Companies & Distributors | 0.2 |
Wireless Telecommunication Services | 0.2 |
Personal Products | 0.2 |
Distributors | 0.1 |
Construction Materials | 0.1 |
Auto Components | 0.1 |
Water Utilities | 0.1 |
Real Estate Management & Development | 0.1 |
Health Care Technology | 0.1 |
Construction & Engineering | 0.0‡ |
Gas Utilities | 0.0‡ |
Independent Power and Renewable Electricity Producers | 0.0‡ |
Leisure Products | 0.0‡ |
Short–Term Investments | 1.3 |
Other Assets, Less Liabilities | –0.1 |
100.0% |
Top Ten Holdings and/or Issuers Held as of April 30, 2022 (excluding short-term investments) (Unaudited)
1. | Apple, Inc. |
2. | Microsoft Corp. |
3. | Alphabet, Inc. |
4. | Amazon.com, Inc. |
5. | Tesla, Inc. |
6. | Berkshire Hathaway, Inc., Class B |
7. | UnitedHealth Group, Inc. |
8. | Johnson & Johnson |
9. | NVIDIA Corp. |
10. | Meta Platforms, Inc., Class A |
8 | MainStay S&P 500 Index Fund |
Shares | Value | |
Common Stocks 98.8% | ||
Aerospace & Defense 1.6% | ||
Boeing Co. (The) (a) | 18,269 | $ 2,719,158 |
General Dynamics Corp. | 7,684 | 1,817,496 |
Howmet Aerospace, Inc. | 12,652 | 431,686 |
Huntington Ingalls Industries, Inc. | 1,335 | 284,008 |
L3Harris Technologies, Inc. | 6,541 | 1,519,213 |
Lockheed Martin Corp. | 8,080 | 3,491,530 |
Northrop Grumman Corp. | 4,892 | 2,149,545 |
Raytheon Technologies Corp. | 49,748 | 4,721,583 |
Textron, Inc. | 7,348 | 508,849 |
TransDigm Group, Inc. (a) | 1,756 | 1,044,486 |
18,687,554 | ||
Air Freight & Logistics 0.6% | ||
CH Robinson Worldwide, Inc. | 4,333 | 459,948 |
Expeditors International of Washington, Inc. | 5,647 | 559,448 |
FedEx Corp. | 8,126 | 1,614,961 |
United Parcel Service, Inc., Class B | 24,307 | 4,374,774 |
7,009,131 | ||
Airlines 0.3% | ||
Alaska Air Group, Inc. (a) | 4,197 | 228,275 |
American Airlines Group, Inc. (a) | 21,593 | 405,301 |
Delta Air Lines, Inc. (a) | 21,335 | 918,045 |
Southwest Airlines Co. (a) | 19,746 | 922,533 |
United Airlines Holdings, Inc. (a) | 10,794 | 545,097 |
3,019,251 | ||
Auto Components 0.1% | ||
Aptiv plc (a) | 9,018 | 959,515 |
BorgWarner, Inc. | 7,993 | 294,382 |
1,253,897 | ||
Automobiles 2.4% | ||
Ford Motor Co. | 131,123 | 1,856,702 |
General Motors Co. (a) | 48,438 | 1,836,285 |
Tesla, Inc. (a) | 27,907 | 24,300,299 |
27,993,286 | ||
Banks 3.7% | ||
Bank of America Corp. | 236,966 | 8,454,947 |
Citigroup, Inc. | 66,152 | 3,189,188 |
Citizens Financial Group, Inc. | 17,170 | 676,498 |
Comerica, Inc. | 4,357 | 356,838 |
Fifth Third Bancorp | 22,794 | 855,459 |
First Republic Bank | 5,976 | 891,739 |
Huntington Bancshares, Inc. | 47,928 | 630,253 |
JPMorgan Chase & Co. | 98,516 | 11,758,870 |
Shares | Value | |
Banks (continued) | ||
KeyCorp | 30,964 | $ 597,915 |
M&T Bank Corp. | 5,974 | 995,507 |
PNC Financial Services Group, Inc. (The) | 14,001 | 2,325,566 |
Regions Financial Corp. | 31,402 | 650,649 |
Signature Bank | 2,091 | 506,545 |
SVB Financial Group (a) | 1,958 | 954,799 |
Truist Financial Corp. | 44,500 | 2,151,575 |
U.S. Bancorp | 45,018 | 2,186,074 |
Wells Fargo & Co. | 129,536 | 5,651,656 |
Zions Bancorp NA | 5,055 | 285,658 |
43,119,736 | ||
Beverages 1.6% | ||
Brown-Forman Corp., Class B | 6,092 | 410,845 |
Coca-Cola Co. (The) | 129,592 | 8,372,939 |
Constellation Brands, Inc., Class A | 5,478 | 1,348,081 |
Molson Coors Beverage Co., Class B | 6,281 | 340,053 |
Monster Beverage Corp. (a) | 12,524 | 1,073,056 |
PepsiCo, Inc. | 46,118 | 7,918,922 |
19,463,896 | ||
Biotechnology 2.0% | ||
AbbVie, Inc. | 58,934 | 8,656,226 |
Amgen, Inc. | 18,777 | 4,378,609 |
Biogen, Inc. (a) | 4,897 | 1,015,834 |
Gilead Sciences, Inc. | 41,816 | 2,481,361 |
Incyte Corp. (a) | 6,271 | 470,074 |
Moderna, Inc. (a) | 11,759 | 1,580,527 |
Regeneron Pharmaceuticals, Inc. (a) | 3,557 | 2,344,454 |
Vertex Pharmaceuticals, Inc. (a) | 8,487 | 2,318,818 |
23,245,903 | ||
Building Products 0.4% | ||
Allegion plc | 2,990 | 341,577 |
AO Smith Corp. | 4,381 | 255,982 |
Carrier Global Corp. | 28,519 | 1,091,422 |
Fortune Brands Home & Security, Inc. | 4,525 | 322,406 |
Johnson Controls International plc | 23,423 | 1,402,335 |
Masco Corp. | 7,998 | 421,415 |
Trane Technologies plc | 7,785 | 1,089,044 |
4,924,181 | ||
Capital Markets 2.8% | ||
Ameriprise Financial, Inc. | 3,697 | 981,517 |
Bank of New York Mellon Corp. (The) | 24,662 | 1,037,284 |
BlackRock, Inc. | 4,753 | 2,969,104 |
Cboe Global Markets, Inc. | 3,555 | 401,644 |
Charles Schwab Corp. (The) | 50,117 | 3,324,261 |
10 | MainStay S&P 500 Index Fund |
Shares | Value | |
Common Stocks (continued) | ||
Capital Markets (continued) | ||
CME Group, Inc. | 11,981 | $ 2,627,913 |
FactSet Research Systems, Inc. | 1,260 | 508,397 |
Franklin Resources, Inc. | 9,374 | 230,507 |
Goldman Sachs Group, Inc. (The) | 11,316 | 3,456,925 |
Intercontinental Exchange, Inc. | 18,730 | 2,169,121 |
Invesco Ltd. | 11,377 | 209,109 |
MarketAxess Holdings, Inc. | 1,268 | 334,257 |
Moody's Corp. | 5,392 | 1,706,460 |
Morgan Stanley | 47,257 | 3,808,442 |
MSCI, Inc. | 2,709 | 1,141,166 |
Nasdaq, Inc. | 3,902 | 614,058 |
Northern Trust Corp. | 6,926 | 713,724 |
Raymond James Financial, Inc. | 6,229 | 607,078 |
S&P Global, Inc. | 11,807 | 4,445,335 |
State Street Corp. | 12,200 | 817,034 |
T. Rowe Price Group, Inc. | 7,641 | 940,149 |
33,043,485 | ||
Chemicals 1.8% | ||
Air Products and Chemicals, Inc. | 7,391 | 1,730,011 |
Albemarle Corp. | 3,899 | 751,844 |
Celanese Corp. | 3,601 | 529,131 |
CF Industries Holdings, Inc. | 7,150 | 692,334 |
Corteva, Inc. | 24,236 | 1,398,175 |
Dow, Inc. | 24,527 | 1,631,045 |
DuPont de Nemours, Inc. | 17,098 | 1,127,271 |
Eastman Chemical Co. | 4,300 | 441,481 |
Ecolab, Inc. | 8,311 | 1,407,385 |
FMC Corp. | 4,225 | 559,982 |
International Flavors & Fragrances, Inc. | 8,486 | 1,029,352 |
Linde plc | 17,086 | 5,330,149 |
LyondellBasell Industries NV, Class A | 8,764 | 929,247 |
Mosaic Co. (The) | 12,348 | 770,762 |
PPG Industries, Inc. | 7,914 | 1,012,913 |
Sherwin-Williams Co. (The) | 8,041 | 2,210,953 |
21,552,035 | ||
Commercial Services & Supplies 0.4% | ||
Cintas Corp. | 2,939 | 1,167,547 |
Copart, Inc. (a) | 7,116 | 808,733 |
Republic Services, Inc. | 6,962 | 934,788 |
Rollins, Inc. | 7,545 | 253,059 |
Waste Management, Inc. | 12,829 | 2,109,601 |
5,273,728 | ||
Communications Equipment 0.8% | ||
Arista Networks, Inc. (a) | 7,478 | 864,232 |
Cisco Systems, Inc. | 140,597 | 6,886,441 |
Shares | Value | |
Communications Equipment (continued) | ||
F5, Inc. (a) | 2,025 | $ 339,005 |
Juniper Networks, Inc. | 10,840 | 341,677 |
Motorola Solutions, Inc. | 5,630 | 1,203,075 |
9,634,430 | ||
Construction & Engineering 0.0% ‡ | ||
Quanta Services, Inc. | 4,750 | 550,905 |
Construction Materials 0.1% | ||
Martin Marietta Materials, Inc. | 2,080 | 736,778 |
Vulcan Materials Co. | 4,424 | 762,211 |
1,498,989 | ||
Consumer Finance 0.6% | ||
American Express Co. | 20,504 | 3,582,254 |
Capital One Financial Corp. | 13,798 | 1,719,507 |
Discover Financial Services | 9,601 | 1,079,728 |
Synchrony Financial | 17,377 | 639,647 |
7,021,136 | ||
Containers & Packaging 0.3% | ||
Amcor plc | 50,461 | 598,468 |
Avery Dennison Corp. | 2,760 | 498,456 |
Ball Corp. | 10,797 | 876,285 |
International Paper Co. | 12,910 | 597,475 |
Packaging Corp. of America | 3,167 | 510,425 |
Sealed Air Corp. | 4,939 | 317,133 |
Westrock Co. | 8,774 | 434,576 |
3,832,818 | ||
Distributors 0.1% | ||
Genuine Parts Co. | 4,748 | 617,478 |
LKQ Corp. | 8,940 | 443,692 |
Pool Corp. | 1,336 | 541,374 |
1,602,544 | ||
Diversified Financial Services 1.7% | ||
Berkshire Hathaway, Inc., Class B (a) | 61,050 | 19,708,772 |
Diversified Telecommunication Services 1.0% | ||
AT&T, Inc. | 238,051 | 4,489,642 |
Lumen Technologies, Inc. | 30,719 | 309,033 |
Verizon Communications, Inc. | 139,944 | 6,479,407 |
11,278,082 | ||
Electric Utilities 1.8% | ||
Alliant Energy Corp. | 8,346 | 490,828 |
American Electric Power Co., Inc. | 16,790 | 1,664,057 |
Constellation Energy Corp. | 10,884 | 644,442 |
Shares | Value | |
Common Stocks (continued) | ||
Electric Utilities (continued) | ||
Duke Energy Corp. | 25,643 | $ 2,824,833 |
Edison International | 12,665 | 871,225 |
Entergy Corp. | 6,700 | 796,295 |
Evergy, Inc. | 7,644 | 518,645 |
Eversource Energy | 11,461 | 1,001,691 |
Exelon Corp. | 32,652 | 1,527,461 |
FirstEnergy Corp. | 19,008 | 823,237 |
NextEra Energy, Inc. | 65,409 | 4,645,347 |
NRG Energy, Inc. | 8,162 | 293,016 |
Pinnacle West Capital Corp. | 3,761 | 267,783 |
PPL Corp. | 25,026 | 708,486 |
Southern Co. (The) | 35,329 | 2,592,795 |
Xcel Energy, Inc. | 17,957 | 1,315,530 |
20,985,671 | ||
Electrical Equipment 0.5% | ||
AMETEK, Inc. | 7,711 | 973,591 |
Eaton Corp. plc | 13,288 | 1,927,026 |
Emerson Electric Co. | 19,801 | 1,785,654 |
Generac Holdings, Inc. (a) | 2,103 | 461,356 |
Rockwell Automation, Inc. | 3,873 | 978,591 |
6,126,218 | ||
Electronic Equipment, Instruments & Components 0.6% | ||
Amphenol Corp., Class A | 19,966 | 1,427,569 |
CDW Corp. | 4,524 | 738,226 |
Corning, Inc. | 24,902 | 876,301 |
IPG Photonics Corp. (a) | 1,191 | 112,526 |
Keysight Technologies, Inc. (a) | 6,102 | 855,928 |
TE Connectivity Ltd. | 10,853 | 1,354,237 |
Teledyne Technologies, Inc. (a) | 1,555 | 671,060 |
Trimble, Inc. (a) | 8,368 | 558,146 |
Zebra Technologies Corp., Class A (a) | 1,769 | 653,929 |
7,247,922 | ||
Energy Equipment & Services 0.3% | ||
Baker Hughes Co. | 30,191 | 936,525 |
Halliburton Co. | 29,955 | 1,066,997 |
Schlumberger NV | 46,783 | 1,825,005 |
3,828,527 | ||
Entertainment 1.3% | ||
Activision Blizzard, Inc. | 25,970 | 1,963,332 |
Electronic Arts, Inc. | 9,375 | 1,106,719 |
Live Nation Entertainment, Inc. (a) | 4,503 | 472,274 |
Netflix, Inc. (a) | 14,800 | 2,817,328 |
Take-Two Interactive Software, Inc. (a) | 3,847 | 459,755 |
Walt Disney Co. (The) (a) | 60,692 | 6,775,048 |
Shares | Value | |
Entertainment (continued) | ||
Warner Bros Discovery, Inc. (a) | 73,719 | $ 1,338,000 |
14,932,456 | ||
Equity Real Estate Investment Trusts 2.8% | ||
Alexandria Real Estate Equities, Inc. | 4,852 | 883,840 |
American Tower Corp. | 15,182 | 3,659,166 |
AvalonBay Communities, Inc. | 4,659 | 1,059,829 |
Boston Properties, Inc. | 4,739 | 557,306 |
Camden Property Trust | 3,407 | 534,524 |
Crown Castle International Corp. | 14,408 | 2,668,506 |
Digital Realty Trust, Inc. | 9,460 | 1,382,295 |
Duke Realty Corp. | 12,696 | 695,106 |
Equinix, Inc. | 3,002 | 2,158,678 |
Equity Residential | 11,392 | 928,448 |
Essex Property Trust, Inc. | 2,175 | 716,162 |
Extra Space Storage, Inc. | 4,463 | 847,970 |
Federal Realty Investment Trust | 2,359 | 276,144 |
Healthpeak Properties, Inc. | 17,978 | 589,858 |
Host Hotels & Resorts, Inc. | 23,803 | 484,391 |
Iron Mountain, Inc. | 9,652 | 518,602 |
Kimco Realty Corp. | 20,557 | 520,709 |
Mid-America Apartment Communities, Inc. | 3,845 | 756,235 |
Prologis, Inc. | 24,668 | 3,954,034 |
Public Storage | 5,086 | 1,889,449 |
Realty Income Corp. | 18,860 | 1,308,130 |
Regency Centers Corp. | 5,137 | 353,580 |
SBA Communications Corp. | 3,626 | 1,258,621 |
Simon Property Group, Inc. | 10,955 | 1,292,690 |
UDR, Inc. | 9,969 | 530,450 |
Ventas, Inc. | 13,307 | 739,204 |
Vornado Realty Trust (b) | 5,300 | 205,163 |
Welltower, Inc. | 14,510 | 1,317,653 |
Weyerhaeuser Co. | 24,912 | 1,026,873 |
33,113,616 | ||
Food & Staples Retailing 1.6% | ||
Costco Wholesale Corp. | 14,782 | 7,859,885 |
Kroger Co. (The) | 22,304 | 1,203,524 |
Sysco Corp. | 16,916 | 1,445,980 |
Walgreens Boots Alliance, Inc. | 23,886 | 1,012,766 |
Walmart, Inc. | 47,159 | 7,214,855 |
18,737,010 | ||
Food Products 1.1% | ||
Archer-Daniels-Midland Co. | 18,653 | 1,670,563 |
Campbell Soup Co. | 6,739 | 318,216 |
Conagra Brands, Inc. | 15,991 | 558,566 |
General Mills, Inc. | 20,108 | 1,422,239 |
12 | MainStay S&P 500 Index Fund |
Shares | Value | |
Common Stocks (continued) | ||
Food Products (continued) | ||
Hershey Co. (The) | 4,847 | $ 1,094,307 |
Hormel Foods Corp. | 9,405 | 492,728 |
J M Smucker Co. (The) | 3,612 | 494,591 |
Kellogg Co. | 8,529 | 584,236 |
Kraft Heinz Co. (The) | 23,667 | 1,008,924 |
Lamb Weston Holdings, Inc. | 4,840 | 319,924 |
McCormick & Co., Inc. (Non-Voting) | 8,325 | 837,245 |
Mondelez International, Inc., Class A | 46,281 | 2,984,199 |
Tyson Foods, Inc., Class A | 9,749 | 908,217 |
12,693,955 | ||
Gas Utilities 0.0% ‡ | ||
Atmos Energy Corp. | 4,515 | 512,001 |
Health Care Equipment & Supplies 2.8% | ||
Abbott Laboratories | 58,947 | 6,690,484 |
ABIOMED, Inc. (a) | 1,517 | 434,742 |
Align Technology, Inc. (a) | 2,445 | 708,830 |
Baxter International, Inc. | 16,691 | 1,186,062 |
Becton Dickinson and Co. | 9,493 | 2,346,575 |
Boston Scientific Corp. (a) | 47,503 | 2,000,351 |
Cooper Cos., Inc. (The) | 1,643 | 593,189 |
Dentsply Sirona, Inc. | 7,287 | 291,407 |
DexCom, Inc. (a) | 3,231 | 1,320,122 |
Edwards Lifesciences Corp. (a) | 20,813 | 2,201,599 |
Hologic, Inc. (a) | 8,333 | 599,893 |
IDEXX Laboratories, Inc. (a) | 2,827 | 1,216,967 |
Intuitive Surgical, Inc. (a) | 11,926 | 2,853,892 |
Medtronic plc | 44,822 | 4,677,624 |
ResMed, Inc. | 4,875 | 974,854 |
STERIS plc | 3,338 | 747,879 |
Stryker Corp. | 11,192 | 2,700,182 |
Teleflex, Inc. | 1,562 | 446,138 |
Zimmer Biomet Holdings, Inc. | 6,964 | 840,903 |
32,831,693 | ||
Health Care Providers & Services 3.2% | ||
AmerisourceBergen Corp. | 5,020 | 759,476 |
Anthem, Inc. | 8,091 | 4,061,116 |
Cardinal Health, Inc. | 9,236 | 536,150 |
Centene Corp. (a) | 19,452 | 1,566,859 |
Cigna Corp. | 10,766 | 2,656,834 |
CVS Health Corp. | 43,754 | 4,206,072 |
DaVita, Inc. (a) | 2,055 | 222,700 |
HCA Healthcare, Inc. | 7,984 | 1,712,967 |
Henry Schein, Inc. (a) | 4,623 | 374,925 |
Humana, Inc. | 4,285 | 1,904,940 |
Shares | Value | |
Health Care Providers & Services (continued) | ||
Laboratory Corp. of America Holdings (a) | 3,104 | $ 745,829 |
McKesson Corp. | 4,994 | 1,546,192 |
Molina Healthcare, Inc. (a) | 1,947 | 610,287 |
Quest Diagnostics, Inc. | 3,967 | 530,943 |
UnitedHealth Group, Inc. | 31,397 | 15,966,944 |
Universal Health Services, Inc., Class B | 2,438 | 298,728 |
37,700,962 | ||
Health Care Technology 0.1% | ||
Cerner Corp. | 9,808 | 918,421 |
Hotels, Restaurants & Leisure 1.9% | ||
Booking Holdings, Inc. (a) | 1,369 | 3,025,914 |
Caesars Entertainment, Inc. (a) | 7,126 | 472,311 |
Carnival Corp. (a)(b) | 26,963 | 466,460 |
Chipotle Mexican Grill, Inc. (a) | 938 | 1,365,362 |
Darden Restaurants, Inc. | 4,258 | 560,906 |
Domino's Pizza, Inc. | 1,213 | 409,994 |
Expedia Group, Inc. (a) | 5,008 | 875,148 |
Hilton Worldwide Holdings, Inc. (a) | 9,291 | 1,442,799 |
Las Vegas Sands Corp. (a) | 11,461 | 406,063 |
Marriott International, Inc., Class A (a) | 9,120 | 1,618,983 |
McDonald's Corp. | 24,910 | 6,206,576 |
MGM Resorts International | 12,556 | 515,298 |
Norwegian Cruise Line Holdings Ltd. (a)(b) | 13,897 | 278,357 |
Penn National Gaming, Inc. (a) | 5,538 | 202,525 |
Royal Caribbean Cruises Ltd. (a) | 7,475 | 581,032 |
Starbucks Corp. | 38,346 | 2,862,146 |
Wynn Resorts Ltd. (a) | 3,509 | 247,314 |
Yum! Brands, Inc. | 9,634 | 1,127,274 |
22,664,462 | ||
Household Durables 0.3% | ||
DR Horton, Inc. | 10,750 | 748,092 |
Garmin Ltd. | 5,065 | 555,833 |
Lennar Corp., Class A | 8,713 | 666,457 |
Mohawk Industries, Inc. (a) | 1,829 | 257,999 |
Newell Brands, Inc. | 12,621 | 292,176 |
NVR, Inc. (a) | 109 | 477,007 |
PulteGroup, Inc. | 8,289 | 346,149 |
Whirlpool Corp. | 1,967 | 357,050 |
3,700,763 | ||
Household Products 1.5% | ||
Church & Dwight Co., Inc. | 8,067 | 787,017 |
Clorox Co. (The) | 4,102 | 588,514 |
Colgate-Palmolive Co. | 28,097 | 2,164,874 |
Shares | Value | |
Common Stocks (continued) | ||
Household Products (continued) | ||
Kimberly-Clark Corp. | 11,228 | $ 1,558,783 |
Procter & Gamble Co. (The) | 79,908 | 12,829,229 |
17,928,417 | ||
Independent Power and Renewable Electricity Producers 0.0% ‡ | ||
AES Corp. (The) | 22,225 | 453,835 |
Industrial Conglomerates 1.0% | ||
3M Co. | 19,038 | 2,745,660 |
General Electric Co. | 36,647 | 2,732,034 |
Honeywell International, Inc. | 22,862 | 4,424,026 |
Roper Technologies, Inc. | 3,516 | 1,652,239 |
11,553,959 | ||
Insurance 2.1% | ||
Aflac, Inc. | 20,000 | 1,145,600 |
Allstate Corp. (The) | 9,354 | 1,183,655 |
American International Group, Inc. | 27,679 | 1,619,498 |
Aon plc, Class A | 7,161 | 2,062,296 |
Arthur J. Gallagher & Co. | 6,949 | 1,170,837 |
Assurant, Inc. | 1,899 | 345,390 |
Brown & Brown, Inc. | 7,816 | 484,436 |
Chubb Ltd. | 14,359 | 2,964,416 |
Cincinnati Financial Corp. | 4,996 | 612,809 |
Everest Re Group Ltd. | 1,312 | 360,420 |
Globe Life, Inc. | 3,097 | 303,754 |
Hartford Financial Services Group, Inc. (The) | 11,164 | 780,699 |
Lincoln National Corp. | 5,553 | 334,013 |
Loews Corp. | 6,536 | 410,722 |
Marsh & McLennan Cos., Inc. | 16,831 | 2,721,573 |
MetLife, Inc. | 23,391 | 1,536,321 |
Principal Financial Group, Inc. | 8,099 | 551,866 |
Progressive Corp. (The) | 19,481 | 2,091,480 |
Prudential Financial, Inc. | 12,601 | 1,367,334 |
Travelers Cos., Inc. (The) | 8,041 | 1,375,493 |
W R Berkley Corp. | 6,983 | 464,300 |
Willis Towers Watson plc | 4,069 | 874,265 |
24,761,177 | ||
Interactive Media & Services 5.2% | ||
Alphabet, Inc. (a) | ||
Class A | 10,026 | 22,881,237 |
Class C | 9,259 | 21,289,496 |
Match Group, Inc. (a) | 9,437 | 746,939 |
Meta Platforms, Inc., Class A (a) | 76,975 | 15,431,178 |
Shares | Value | |
Interactive Media & Services (continued) | ||
Twitter, Inc. (a) | 26,656 | $ 1,306,677 |
61,655,527 | ||
Internet & Direct Marketing Retail 3.2% | ||
Amazon.com, Inc. (a) | 14,588 | 36,260,370 |
eBay, Inc. | 20,868 | 1,083,467 |
Etsy, Inc. (a) | 4,226 | 393,821 |
37,737,658 | ||
IT Services 4.4% | ||
Accenture plc, Class A | 21,068 | 6,327,985 |
Akamai Technologies, Inc. (a) | 5,416 | 608,108 |
Automatic Data Processing, Inc. | 14,003 | 3,055,175 |
Broadridge Financial Solutions, Inc. | 3,893 | 561,098 |
Cognizant Technology Solutions Corp., Class A | 17,510 | 1,416,559 |
DXC Technology Co. (a) | 8,150 | 233,905 |
EPAM Systems, Inc. (a) | 1,891 | 501,096 |
Fidelity National Information Services, Inc. | 20,299 | 2,012,646 |
Fiserv, Inc. (a) | 19,808 | 1,939,599 |
FleetCor Technologies, Inc. (a) | 2,707 | 675,451 |
Gartner, Inc. (a) | 2,742 | 796,688 |
Global Payments, Inc. | 9,492 | 1,300,214 |
International Business Machines Corp. | 29,896 | 3,952,550 |
Jack Henry & Associates, Inc. | 2,428 | 460,300 |
Mastercard, Inc., Class A | 28,771 | 10,454,806 |
Paychex, Inc. | 10,703 | 1,356,391 |
PayPal Holdings, Inc. (a) | 38,836 | 3,414,850 |
VeriSign, Inc. (a) | 3,222 | 575,739 |
Visa, Inc., Class A | 55,285 | 11,782,892 |
51,426,052 | ||
Leisure Products 0.0% ‡ | ||
Hasbro, Inc. | 4,323 | 380,683 |
Life Sciences Tools & Services 1.8% | ||
Agilent Technologies, Inc. | 10,013 | 1,194,251 |
Bio-Rad Laboratories, Inc., Class A (a) | 720 | 368,683 |
Bio-Techne Corp. | 1,310 | 497,394 |
Charles River Laboratories International, Inc. (a) | 1,682 | 406,220 |
Danaher Corp. | 21,213 | 5,327,221 |
Illumina, Inc. (a) | 5,210 | 1,545,546 |
IQVIA Holdings, Inc. (a) | 6,368 | 1,388,160 |
Mettler-Toledo International, Inc. (a) | 766 | 978,588 |
PerkinElmer, Inc. | 4,207 | 616,788 |
Thermo Fisher Scientific, Inc. | 13,136 | 7,263,157 |
Waters Corp. (a) | 2,035 | 616,646 |
14 | MainStay S&P 500 Index Fund |
Shares | Value | |
Common Stocks (continued) | ||
Life Sciences Tools & Services (continued) | ||
West Pharmaceutical Services, Inc. | 2,470 | $ 778,198 |
20,980,852 | ||
Machinery 1.6% | ||
Caterpillar, Inc. | 18,033 | 3,796,668 |
Cummins, Inc. | 4,748 | 898,274 |
Deere & Co. | 9,349 | 3,529,715 |
Dover Corp. | 4,800 | 639,840 |
Fortive Corp. | 11,953 | 687,297 |
IDEX Corp. | 2,535 | 481,194 |
Illinois Tool Works, Inc. | 9,522 | 1,876,881 |
Ingersoll Rand, Inc. | 13,587 | 597,285 |
Nordson Corp. | 1,804 | 389,105 |
Otis Worldwide Corp. | 14,166 | 1,031,851 |
PACCAR, Inc. | 11,578 | 961,553 |
Parker-Hannifin Corp. | 4,283 | 1,159,922 |
Pentair plc | 5,516 | 279,937 |
Snap-on, Inc. | 1,781 | 378,445 |
Stanley Black & Decker, Inc. | 5,435 | 653,015 |
Westinghouse Air Brake Technologies Corp. | 6,228 | 559,959 |
Xylem, Inc. | 6,011 | 483,886 |
18,404,827 | ||
Media 0.9% | ||
Charter Communications, Inc., Class A (a) | 3,973 | 1,702,391 |
Comcast Corp., Class A | 150,804 | 5,995,967 |
DISH Network Corp., Class A (a) | 8,324 | 237,317 |
Fox Corp. | ||
Class A | 10,528 | 377,323 |
Class B | 4,860 | 161,546 |
Interpublic Group of Cos., Inc. (The) | 13,122 | 428,040 |
News Corp. | ||
Class A | 13,030 | 258,776 |
Class B | 4,036 | 80,357 |
Omnicom Group, Inc. | 6,967 | 530,398 |
Paramount Global, Class B (b) | 20,225 | 588,952 |
10,361,067 | ||
Metals & Mining 0.5% | ||
Freeport-McMoRan, Inc. | 48,939 | 1,984,476 |
Newmont Corp. | 26,583 | 1,936,572 |
Nucor Corp. | 9,067 | 1,403,390 |
5,324,438 | ||
Multiline Retail 0.6% | ||
Dollar General Corp. | 7,724 | 1,834,682 |
Shares | Value | |
Multiline Retail (continued) | ||
Dollar Tree, Inc. (a) | 7,499 | $ 1,218,212 |
Target Corp. | 15,972 | 3,651,998 |
6,704,892 | ||
Multi-Utilities 0.9% | ||
Ameren Corp. | 8,588 | 797,825 |
CenterPoint Energy, Inc. | 20,964 | 641,708 |
CMS Energy Corp. | 9,659 | 663,477 |
Consolidated Edison, Inc. | 11,793 | 1,093,683 |
Dominion Energy, Inc. | 27,002 | 2,204,443 |
DTE Energy Co. | 6,459 | 846,387 |
NiSource, Inc. | 13,091 | 381,210 |
Public Service Enterprise Group, Inc. | 16,857 | 1,174,259 |
Sempra Energy | 10,645 | 1,717,677 |
WEC Energy Group, Inc. | 10,515 | 1,052,026 |
10,572,695 | ||
Oil, Gas & Consumable Fuels 3.8% | ||
APA Corp. | 12,110 | 495,662 |
Chevron Corp. | 64,261 | 10,067,771 |
ConocoPhillips | 43,411 | 4,146,619 |
Coterra Energy, Inc. | 27,121 | 780,814 |
Devon Energy Corp. | 20,989 | 1,220,930 |
Diamondback Energy, Inc. | 5,677 | 716,608 |
EOG Resources, Inc. | 19,504 | 2,277,287 |
Exxon Mobil Corp. | 141,129 | 12,031,247 |
Hess Corp. | 9,189 | 947,110 |
Kinder Morgan, Inc. | 65,006 | 1,179,859 |
Marathon Oil Corp. | 25,953 | 646,749 |
Marathon Petroleum Corp. | 19,301 | 1,684,205 |
Occidental Petroleum Corp. | 29,578 | 1,629,452 |
ONEOK, Inc. | 14,866 | 941,464 |
Phillips 66 | 15,596 | 1,353,109 |
Pioneer Natural Resources Co. | 7,569 | 1,759,565 |
Valero Energy Corp. | 13,629 | 1,519,361 |
Williams Cos., Inc. (The) | 40,504 | 1,388,882 |
44,786,694 | ||
Personal Products 0.2% | ||
Estee Lauder Cos., Inc. (The), Class A | 7,748 | 2,045,937 |
Pharmaceuticals 4.2% | ||
Bristol-Myers Squibb Co. | 72,662 | 5,469,269 |
Catalent, Inc. (a) | 5,971 | 540,734 |
Eli Lilly and Co. | 26,468 | 7,732,097 |
Johnson & Johnson | 87,760 | 15,837,169 |
Merck & Co., Inc. | 84,204 | 7,468,053 |
Organon & Co. | 8,452 | 273,253 |
Pfizer, Inc. | 187,109 | 9,181,439 |
Shares | Value | |
Common Stocks (continued) | ||
Pharmaceuticals (continued) | ||
Viatris, Inc. | 40,316 | $ 416,464 |
Zoetis, Inc. | 15,772 | 2,795,587 |
49,714,065 | ||
Professional Services 0.3% | ||
Equifax, Inc. | 4,067 | 827,716 |
Jacobs Engineering Group, Inc. | 4,308 | 596,873 |
Leidos Holdings, Inc. | 4,678 | 484,220 |
Nielsen Holdings plc | 11,961 | 320,674 |
Robert Half International, Inc. | 3,650 | 358,832 |
Verisk Analytics, Inc. | 5,372 | 1,096,157 |
3,684,472 | ||
Real Estate Management & Development 0.1% | ||
CBRE Group, Inc., Class A (a) | 11,156 | 926,394 |
Road & Rail 0.9% | ||
CSX Corp. | 73,938 | 2,539,031 |
JB Hunt Transport Services, Inc. | 2,801 | 478,551 |
Norfolk Southern Corp. | 7,993 | 2,061,235 |
Old Dominion Freight Line, Inc. | 3,106 | 870,053 |
Union Pacific Corp. | 21,232 | 4,974,445 |
10,923,315 | ||
Semiconductors & Semiconductor Equipment 5.3% | ||
Advanced Micro Devices, Inc. (a) | 54,498 | 4,660,669 |
Analog Devices, Inc. | 17,512 | 2,703,502 |
Applied Materials, Inc. | 29,602 | 3,266,581 |
Broadcom, Inc. | 13,763 | 7,630,070 |
Enphase Energy, Inc. (a) | 4,465 | 720,651 |
Intel Corp. | 135,743 | 5,917,037 |
KLA Corp. | 5,024 | 1,603,962 |
Lam Research Corp. | 4,650 | 2,165,784 |
Microchip Technology, Inc. | 18,534 | 1,208,417 |
Micron Technology, Inc. | 37,329 | 2,545,464 |
Monolithic Power Systems, Inc. | 1,444 | 566,394 |
NVIDIA Corp. | 83,340 | 15,457,070 |
NXP Semiconductors NV | 8,865 | 1,515,028 |
Qorvo, Inc. (a) | 3,615 | 411,315 |
QUALCOMM, Inc. | 37,569 | 5,248,014 |
Skyworks Solutions, Inc. | 5,467 | 619,411 |
SolarEdge Technologies, Inc. (a) | 1,751 | 438,468 |
Teradyne, Inc. | 5,434 | 573,070 |
Texas Instruments, Inc. | 30,787 | 5,241,487 |
62,492,394 | ||
Shares | Value | |
Software 8.6% | ||
Adobe, Inc. (a) | 15,724 | $ 6,225,918 |
ANSYS, Inc. (a) | 2,909 | 801,982 |
Autodesk, Inc. (a) | 7,333 | 1,387,990 |
Cadence Design Systems, Inc. (a) | 9,239 | 1,393,703 |
Ceridian HCM Holding, Inc. (a) | 4,560 | 255,953 |
Citrix Systems, Inc. | 4,158 | 416,216 |
Fortinet, Inc. (a) | 4,524 | 1,307,481 |
Intuit, Inc. | 9,440 | 3,953,000 |
Microsoft Corp. | 249,914 | 69,356,133 |
NortonLifeLock, Inc. | 19,397 | 485,701 |
Oracle Corp. | 52,523 | 3,855,188 |
Paycom Software, Inc. (a) | 1,605 | 451,759 |
PTC, Inc. (a) | 3,509 | 400,763 |
salesforce.com, Inc. (a) | 32,836 | 5,777,166 |
ServiceNow, Inc. (a) | 6,667 | 3,187,493 |
Synopsys, Inc. (a) | 5,115 | 1,466,931 |
Tyler Technologies, Inc. (a) | 1,366 | 539,174 |
101,262,551 | ||
Specialty Retail 2.1% | ||
Advance Auto Parts, Inc. | 2,079 | 415,031 |
AutoZone, Inc. (a) | 688 | 1,345,363 |
Bath & Body Works, Inc. | 8,591 | 454,378 |
Best Buy Co., Inc. | 7,217 | 649,025 |
CarMax, Inc. (a) | 5,390 | 462,354 |
Home Depot, Inc. (The) | 34,811 | 10,457,225 |
Lowe's Cos., Inc. | 22,460 | 4,441,016 |
O'Reilly Automotive, Inc. (a) | 2,246 | 1,362,311 |
Ross Stores, Inc. | 11,779 | 1,175,191 |
TJX Cos., Inc. (The) | 39,766 | 2,436,861 |
Tractor Supply Co. | 3,794 | 764,301 |
Ulta Beauty, Inc. (a) | 1,804 | 715,827 |
24,678,883 | ||
Technology Hardware, Storage & Peripherals 7.2% | ||
Apple, Inc. (c) | 516,821 | 81,476,831 |
Hewlett Packard Enterprise Co. | 43,118 | 664,448 |
HP, Inc. | 36,093 | 1,322,087 |
NetApp, Inc. | 7,410 | 542,782 |
Seagate Technology Holdings plc | 6,713 | 550,735 |
Western Digital Corp. (a) | 10,431 | 553,573 |
85,110,456 | ||
Textiles, Apparel & Luxury Goods 0.6% | ||
NIKE, Inc., Class B | 42,546 | 5,305,486 |
PVH Corp. | 2,333 | 169,796 |
Ralph Lauren Corp. | 1,543 | 160,997 |
Tapestry, Inc. | 8,800 | 289,696 |
16 | MainStay S&P 500 Index Fund |
Shares | Value | |
Common Stocks (continued) | ||
Textiles, Apparel & Luxury Goods (continued) | ||
Under Armour, Inc. (a) | ||
Class A | 6,289 | $ 96,599 |
Class C | 7,169 | 101,728 |
VF Corp. | 10,760 | 559,520 |
6,683,822 | ||
Tobacco 0.7% | ||
Altria Group, Inc. | 60,777 | 3,377,378 |
Philip Morris International, Inc. | 51,665 | 5,166,500 |
8,543,878 | ||
Trading Companies & Distributors 0.2% | ||
Fastenal Co. | 19,186 | 1,061,178 |
United Rentals, Inc. (a) | 2,414 | 764,079 |
WW Grainger, Inc. | 1,443 | 721,543 |
2,546,800 | ||
Water Utilities 0.1% | ||
American Water Works Co., Inc. | 6,052 | 932,492 |
Wireless Telecommunication Services 0.2% | ||
T-Mobile US, Inc. (a) | 19,572 | 2,410,096 |
Total Common Stocks (d) (Cost $251,129,083) | 1,164,695,764 | |
Short-Term Investments 1.3% | ||
Affiliated Investment Company 0.0% ‡ | ||
MainStay U.S. Government Liquidity Fund, 0.397% (e) | 154,279 | 154,279 |
Unaffiliated Investment Company 0.1% | ||
Invesco Government & Agency Portfolio, 0.419% (e)(f) | 1,262,459 | 1,262,459 |
Principal Amount | Value | |
U.S. Treasury Debt 1.2% | ||
U.S. Treasury Bills | ||
0.45%, due 6/16/22 (c)(g) | $ 14,300,000 | $ 14,292,057 |
Total Short-Term Investments (Cost $15,708,534) | 15,708,795 | |
Total Investments (Cost $266,837,617) | 100.1% | 1,180,404,559 |
Other Assets, Less Liabilities | (0.1) | (1,320,050) |
Net Assets | 100.0% | $ 1,179,084,509 |
† | Percentages indicated are based on Fund net assets. |
‡ | Less than one-tenth of a percent. |
(a) | Non-income producing security. |
(b) | All or a portion of this security was held on loan. As of April 30, 2022, the aggregate market value of securities on loan was $1,211,906. The Fund received cash collateral with a value of $1,262,459. (See Note 2(H)) |
(c) | Represents a security, or portion thereof, which was maintained at the broker as collateral for futures contracts. |
(d) | The combined market value of common stocks and notional value of Standard & Poor’s 500 Index futures contracts represents 99.9% of the Fund’s net assets. |
(e) | Current yield as of April 30, 2022. |
(f) | Represents a security purchased with cash collateral received for securities on loan. |
(g) | Interest rate shown represents yield to maturity. |
Affiliated Investment Companies | Value, Beginning of Period | Purchases at Cost | Proceeds from Sales | Net Realized Gain/(Loss) on Sales | Change in Unrealized Appreciation/ (Depreciation) | Value, End of Period | Dividend Income | Other Distributions | Shares End of Period |
MainStay U.S. Government Liquidity Fund | $ 106 | $ 4,637 | $ (4,589) | $ — | $ — | $ 154 | $ —(a) | $ — | 154 |
(a) | Less than $500. |
Type | Number of Contracts | Expiration Date | Value at Trade Date | Current Notional Amount | Unrealized Appreciation (Depreciation)1 |
Long Contracts | |||||
S&P 500 E-Mini Index | 66 | June 2022 | $ 14,545,412 | $ 13,620,750 | $ (924,662) |
1. | Represents the difference between the value of the contracts at the time they were opened and the value as of April 30, 2022. |
Description | Quoted Prices in Active Markets for Identical Assets (Level 1) | Significant Other Observable Inputs (Level 2) | Significant Unobservable Inputs (Level 3) | Total |
Asset Valuation Inputs | ||||
Investments in Securities (a) | ||||
Common Stocks | $ 1,164,695,764 | $ — | $ — | $ 1,164,695,764 |
Short-Term Investments | ||||
Affiliated Investment Company | 154,279 | — | — | 154,279 |
Unaffiliated Investment Company | 1,262,459 | — | — | 1,262,459 |
U.S. Treasury Debt | — | 14,292,057 | — | 14,292,057 |
Total Short-Term Investments | 1,416,738 | 14,292,057 | — | 15,708,795 |
Total Investments in Securities | $ 1,166,112,502 | $ 14,292,057 | $ — | $ 1,180,404,559 |
Liability Valuation Inputs | ||||
Other Financial Instruments | ||||
Futures Contracts (b) | $ (924,662) | $ — | $ — | $ (924,662) |
(a) | For a complete listing of investments and their industries, see the Portfolio of Investments. |
(b) | The value listed for these securities reflects unrealized appreciation (depreciation) as shown on the Portfolio of Investments. |
18 | MainStay S&P 500 Index Fund |
Assets | |
Investment in unaffiliated securities, at value (identified cost $266,683,338) including securities on loan of $1,211,906 | $1,180,250,280 |
Investment in affiliated investment companies, at value (identified cost $154,279) | 154,279 |
Receivables: | |
Dividends | 826,152 |
Fund shares sold | 657,706 |
Securities lending | 95 |
Other assets | 87,076 |
Total assets | 1,181,975,588 |
Liabilities | |
Cash collateral received for securities on loan | 1,262,459 |
Due to custodian | 1,415 |
Payables: | |
Variation margin on futures contracts | 511,151 |
Fund shares redeemed | 464,294 |
Transfer agent (See Note 3) | 211,892 |
NYLIFE Distributors (See Note 3) | 191,534 |
Manager (See Note 3) | 163,339 |
Shareholder communication | 43,809 |
Custodian | 21,171 |
Professional fees | 18,020 |
Trustees | 1,433 |
Accrued expenses | 562 |
Total liabilities | 2,891,079 |
Net assets | $1,179,084,509 |
Composition of Net Assets | |
Shares of beneficial interest outstanding (par value of $.001 per share) unlimited number of shares authorized | $22,782 |
Additional paid-in-capital | 186,166,797 |
186,189,579 | |
Total distributable earnings (loss) | 992,894,930 |
Net assets | $1,179,084,509 |
Class A | |
Net assets applicable to outstanding shares | $823,533,976 |
Shares of beneficial interest outstanding | 15,992,818 |
Net asset value per share outstanding | $51.49 |
Maximum sales charge (1.50% of offering price) | 0.78 |
Maximum offering price per share outstanding | $52.27 |
Investor Class | |
Net assets applicable to outstanding shares | $48,377,408 |
Shares of beneficial interest outstanding | 941,633 |
Net asset value per share outstanding | $51.38 |
Maximum sales charge (1.00% of offering price) | 0.52 |
Maximum offering price per share outstanding | $51.90 |
Class I | |
Net assets applicable to outstanding shares | $307,017,896 |
Shares of beneficial interest outstanding | 5,844,681 |
Net asset value and offering price per share outstanding | $52.53 |
SIMPLE Class | |
Net assets applicable to outstanding shares | $155,229 |
Shares of beneficial interest outstanding | 3,015 |
Net asset value and offering price per share outstanding | $51.49 |
Investment Income (Loss) | |
Income | |
Dividends-unaffiliated (net of foreign tax withholding of $1,951) | $9,539,968 |
Interest | 7,485 |
Securities lending | 1,301 |
Dividends-affiliated | 26 |
Total income | 9,548,780 |
Expenses | |
Distribution/Service—Class A (See Note 3) | 1,105,714 |
Distribution/Service—Investor Class (See Note 3) | 67,872 |
Distribution/Service—SIMPLE Class (See Note 3) | 267 |
Manager (See Note 3) | 1,068,643 |
Transfer agent (See Note 3) | 475,596 |
Professional fees | 57,812 |
Registration | 41,007 |
Shareholder communication | 24,495 |
Custodian | 23,245 |
Trustees | 13,890 |
Miscellaneous | 75,376 |
Total expenses before waiver/reimbursement | 2,953,917 |
Expense waiver/reimbursement from Manager (See Note 3) | (27,234) |
Net expenses | 2,926,683 |
Net investment income (loss) | 6,622,097 |
Realized and Unrealized Gain (Loss) | |
Net realized gain (loss) on: | |
Unaffiliated investment transactions | 79,981,025 |
Futures transactions | (782,148) |
Net realized gain (loss) | 79,198,877 |
Net change in unrealized appreciation (depreciation) on: | |
Unaffiliated investments | (213,409,076) |
Futures contracts | (1,068,965) |
Net change in unrealized appreciation (depreciation) | (214,478,041) |
Net realized and unrealized gain (loss) | (135,279,164) |
Net increase (decrease) in net assets resulting from operations | $(128,657,067) |
20 | MainStay S&P 500 Index Fund |
for the six months ended April 30, 2022 (Unaudited) and the year ended October 31, 2021
2022 | 2021 | |
Increase (Decrease) in Net Assets | ||
Operations: | ||
Net investment income (loss) | $6,622,097 | $13,729,351 |
Net realized gain (loss) | 79,198,877 | 52,080,324 |
Net change in unrealized appreciation (depreciation) | (214,478,041) | 391,282,536 |
Net increase (decrease) in net assets resulting from operations | (128,657,067) | 457,092,211 |
Distributions to shareholders: | ||
Class A | (39,573,293) | (56,038,250) |
Investor Class | (2,447,120) | (5,128,675) |
Class I | (21,892,265) | (41,144,122) |
SIMPLE Class | (2,833) | (1,984) |
Total distributions to shareholders | (63,915,511) | (102,313,031) |
Capital share transactions: | ||
Net proceeds from sales of shares | 87,923,915 | 218,385,665 |
Net asset value of shares issued to shareholders in reinvestment of distributions | 62,992,101 | 101,126,869 |
Cost of shares redeemed | (215,428,810) | (332,173,529) |
Increase (decrease) in net assets derived from capital share transactions | (64,512,794) | (12,660,995) |
Net increase (decrease) in net assets | (257,085,372) | 342,118,185 |
Net Assets | ||
Beginning of period | 1,436,169,881 | 1,094,051,696 |
End of period | $1,179,084,509 | $1,436,169,881 |
Six months ended April 30, 2022* | Year Ended October 31, | |||||
Class A | 2021 | 2020 | 2019 | 2018 | 2017 | |
Net asset value at beginning of period | $59.77 | $45.82 | $49.60 | $49.27 | $53.27 | $47.57 |
Net investment income (loss) (a) | 0.26 | 0.49 | 0.58 | 0.67 | 0.69 | 0.65 |
Net realized and unrealized gain (loss) | (5.91) | 17.71 | 3.44 | 5.52 | 2.61 | 9.47 |
Total from investment operations | (5.65) | 18.20 | 4.02 | 6.19 | 3.30 | 10.12 |
Less distributions: | ||||||
From net investment income | (0.53) | (0.55) | (0.91) | (0.77) | (0.79) | (1.07) |
From net realized gain on investments | (2.10) | (3.70) | (6.89) | (5.09) | (6.51) | (3.35) |
Total distributions | (2.63) | (4.25) | (7.80) | (5.86) | (7.30) | (4.42) |
Net asset value at end of period | $51.49 | $59.77 | $45.82 | $49.60 | $49.27 | $53.27 |
Total investment return (b) | (9.87)% | 42.19% | 9.21% | 13.80% | 6.77% | 22.93% |
Ratios (to average net assets)/Supplemental Data: | ||||||
Net investment income (loss) | 0.92%†† | 0.92% | 1.32% | 1.44% | 1.39% | 1.33% |
Net expenses (c) | 0.50%†† | 0.50% | 0.54% | 0.54% | 0.54% | 0.60% |
Expenses (before waiver/reimbursement) (c) | 0.50%†† | 0.50% | 0.54% | 0.54% | 0.54% | 0.64% |
Portfolio turnover rate | 1% | 5% | 15% | 3% | 3% | 3% |
Net assets at end of period (in 000’s) | $823,534 | $894,565 | $602,036 | $559,780 | $511,043 | $527,768 |
* | Unaudited. |
†† | Annualized. |
(a) | Per share data based on average shares outstanding during the period. |
(b) | Total investment return is calculated exclusive of sales charges and assumes the reinvestment of dividends and distributions. For periods of less than one year, total return is not annualized. |
(c) | In addition to the fees and expenses which the Fund bears directly, it also indirectly bears a pro-rata share of the fees and expenses of the underlying funds in which it invests. Such indirect expenses are not included in the above expense ratios. |
Six months ended April 30, 2022* | Year Ended October 31, | |||||
Investor Class | 2021 | 2020 | 2019 | 2018 | 2017 | |
Net asset value at beginning of period | $59.55 | $45.68 | $49.50 | $49.18 | $53.18 | $47.51 |
Net investment income (loss) (a) | 0.21 | 0.40 | 0.51 | 0.59 | 0.62 | 0.63 |
Net realized and unrealized gain (loss) | (5.89) | 17.63 | 3.43 | 5.52 | 2.58 | 9.43 |
Total from investment operations | (5.68) | 18.03 | 3.94 | 6.11 | 3.20 | 10.06 |
Less distributions: | ||||||
From net investment income | (0.39) | (0.46) | (0.87) | (0.70) | (0.69) | (1.04) |
From net realized gain on investments | (2.10) | (3.70) | (6.89) | (5.09) | (6.51) | (3.35) |
Total distributions | (2.49) | (4.16) | (7.76) | (5.79) | (7.20) | (4.39) |
Net asset value at end of period | $51.38 | $59.55 | $45.68 | $49.50 | $49.18 | $53.18 |
Total investment return (b) | (9.94)% | 41.89% | 9.03% | 13.62% | 6.58% | 22.81% |
Ratios (to average net assets)/Supplemental Data: | ||||||
Net investment income (loss) | 0.73%†† | 0.75% | 1.16% | 1.26% | 1.23% | 1.29% |
Net expenses (c) | 0.70%†† | 0.70% | 0.70% | 0.70% | 0.70% | 0.70% |
Expenses (before waiver/reimbursement) (c) | 0.80%†† | 0.82% | 0.88% | 0.89% | 0.87% | 0.82% |
Portfolio turnover rate | 1% | 5% | 15% | 3% | 3% | 3% |
Net assets at end of period (in 000's) | $48,377 | $58,363 | $55,546 | $54,505 | $41,907 | $38,052 |
* | Unaudited. |
†† | Annualized. |
(a) | Per share data based on average shares outstanding during the period. |
(b) | Total investment return is calculated exclusive of sales charges and assumes the reinvestment of dividends and distributions. For periods of less than one year, total return is not annualized. |
(c) | In addition to the fees and expenses which the Fund bears directly, it also indirectly bears a pro-rata share of the fees and expenses of the underlying funds in which it invests. Such indirect expenses are not included in the above expense ratios. |
22 | MainStay S&P 500 Index Fund |
Six months ended April 30, 2022* | Year Ended October 31, | |||||
Class I | 2021 | 2020 | 2019 | 2018 | 2017 | |
Net asset value at beginning of period | $60.97 | $46.66 | $50.38 | $49.97 | $53.93 | $48.12 |
Net investment income (loss) (a) | 0.34 | 0.64 | 0.70 | 0.81 | 0.83 | 0.78 |
Net realized and unrealized gain (loss) | (6.02) | 18.03 | 3.50 | 5.59 | 2.64 | 9.56 |
Total from investment operations | (5.68) | 18.67 | 4.20 | 6.40 | 3.47 | 10.34 |
Less distributions: | ||||||
From net investment income | (0.66) | (0.66) | (1.03) | (0.90) | (0.92) | (1.18) |
From net realized gain on investments | (2.10) | (3.70) | (6.89) | (5.09) | (6.51) | (3.35) |
Total distributions | (2.76) | (4.36) | (7.92) | (5.99) | (7.43) | (4.53) |
Net asset value at end of period | $52.53 | $60.97 | $46.66 | $50.38 | $49.97 | $53.93 |
Total investment return (b) | (9.75)% | 42.56% | 9.47% | 14.08% | 7.05% | 23.20% |
Ratios (to average net assets)/Supplemental Data: | ||||||
Net investment income (loss) | 1.19%†† | 1.19% | 1.56% | 1.74% | 1.64% | 1.58% |
Net expenses (c) | 0.25%†† | 0.25% | 0.29% | 0.29% | 0.29% | 0.35% |
Expenses (before waiver/reimbursement) (c) | 0.25%†† | 0.25% | 0.29% | 0.29% | 0.29% | 0.39% |
Portfolio turnover rate | 1% | 5% | 15% | 3% | 3% | 3% |
Net assets at end of period (in 000’s) | $307,018 | $483,174 | $436,446 | $399,842 | $592,457 | $717,528 |
* | Unaudited. |
†† | Annualized. |
(a) | Per share data based on average shares outstanding during the period. |
(b) | Total investment return is calculated exclusive of sales charges and assumes the reinvestment of dividends and distributions. Class I shares are not subject to sales charges. For periods of less than one year, total return is not annualized. |
(c) | In addition to the fees and expenses which the Fund bears directly, it also indirectly bears a pro-rata share of the fees and expenses of the underlying funds in which it invests. Such indirect expenses are not included in the above expense ratios. |
Six months ended April 30, 2022* | Year Ended October 31, | August 31, 2020^ through October 31, | |
SIMPLE Class | 2021 | 2020 | |
Net asset value at beginning of period | $59.73 | $45.65 | $48.83** |
Net investment income (loss) (a) | 0.12 | 0.21 | 0.02 |
Net realized and unrealized gain (loss) | (5.88) | 17.74 | (3.20) |
Total from investment operations | (5.76) | 17.95 | (3.18) |
Less distributions: | |||
From net investment income | (0.38) | (0.17) | — |
From net realized gain on investments | (2.10) | (3.70) | — |
Total distributions | (2.48) | (3.87) | — |
Net asset value at end of period | $51.49 | $59.73 | $45.65 |
Total investment return (b) | (10.04)% | 41.54% | (6.51)% |
Ratios (to average net assets)/Supplemental Data: | |||
Net investment income (loss) | 0.43%†† | 0.39% | 0.30%†† |
Net expenses (c) | 0.95%†† | 0.95% | 0.95%†† |
Expenses (before waiver/reimbursement) (c) | 1.05%†† | 1.06% | 1.15%†† |
Portfolio turnover rate | 1% | 5% | 15% |
Net assets at end of period (in 000’s) | $155 | $68 | $23 |
* | Unaudited. |
^ | Inception date. |
** | Based on the net asset value of Investor Class as of August 31, 2020. |
†† | Annualized. |
(a) | Per share data based on average shares outstanding during the period. |
(b) | Total investment return is calculated exclusive of sales charges and assumes the reinvestment of dividends and distributions. SIMPLE Class shares are not subject to sales charges. For periods of less than one year, total return is not annualized. |
(c) | In addition to the fees and expenses which the Fund bears directly, it also indirectly bears a pro-rata share of the fees and expenses of the underlying funds in which it invests. Such indirect expenses are not included in the above expense ratios. |
24 | MainStay S&P 500 Index Fund |
Class | Commenced Operations |
Class A | January 2, 2004 |
Investor Class | February 28, 2008 |
Class I | January 2, 1991 |
SIMPLE Class | August 31, 2020 |
Class R6 | N/A* |
* | Class R6 shares were registered for sale effective as of February 28, 2017 but have not yet commenced operations. |
• Broker/dealer quotes | • Benchmark securities |
• Two-sided markets | • Reference data (corporate actions or material event notices) |
• Bids/offers | • Monthly payment information |
• Industry and economic events | • Reported trades |
26 | MainStay S&P 500 Index Fund |
Liability Derivatives | Equity Contracts Risk | Total |
Futures Contracts - Net Assets—Net unrealized depreciation on futures contracts (a) | $(924,662) | $(924,662) |
Total Fair Value | $(924,662) | $(924,662) |
(a) | Includes cumulative appreciation (depreciation) of futures contracts as reported in the Portfolio of Investments. Only current day’s variation margin is reported within the Statement of Assets and Liabilities. |
28 | MainStay S&P 500 Index Fund |
Net Realized Gain (Loss) from: | Equity Contracts Risk | Total |
Futures Contracts | $(782,148) | $(782,148) |
Total Net Realized Gain (Loss) | $(782,148) | $(782,148) |
Net Change in Unrealized Appreciation (Depreciation) | Equity Contracts Risk | Total |
Futures Contracts | $(1,068,965) | $(1,068,965) |
Total Net Change in Unrealized Appreciation (Depreciation) | $(1,068,965) | $(1,068,965) |
Average Notional Amount | Total |
Futures Contracts Long | $11,220,454 |
Class | Expense | Waived |
Class A | $261,775 | $— |
Investor Class | 96,319 | — |
Class I | 117,312 | — |
SIMPLE Class | 190 | — |
Class I | $8,914,666 | 2.9% |
SIMPLE Class | 29,758 | 19.2 |
Federal Tax Cost | Gross Unrealized Appreciation | Gross Unrealized (Depreciation) | Net Unrealized Appreciation/ (Depreciation) | |
Investments in Securities | $269,633,782 | $920,264,930 | $(9,494,153) | $910,770,777 |
2021 | |
Distributions paid from: | |
Ordinary Income | $19,032,979 |
Long-Term Capital Gains | 83,280,052 |
Total | $102,313,031 |
30 | MainStay S&P 500 Index Fund |
Class A | Shares | Amount |
Six-month period ended April 30, 2022: | ||
Shares sold | 1,158,278 | $65,774,299 |
Shares issued to shareholders in reinvestment of distributions | 681,396 | 38,730,567 |
Shares redeemed | (923,910) | (52,173,526) |
Net increase (decrease) in shares outstanding before conversion | 915,764 | 52,331,340 |
Shares converted into Class A (See Note 1) | 116,144 | 6,772,513 |
Shares converted from Class A (See Note 1) | (6,099) | (332,911) |
Net increase (decrease) | 1,025,809 | $58,770,942 |
Year ended October 31, 2021: | ||
Shares sold | 2,338,699 | $124,181,704 |
Shares issued to shareholders in reinvestment of distributions | 1,163,866 | 54,969,414 |
Shares redeemed | (2,112,025) | (111,330,020) |
Net increase (decrease) in shares outstanding before conversion | 1,390,540 | 67,821,098 |
Shares converted into Class A (See Note 1) | 438,333 | 22,796,174 |
Shares converted from Class A (See Note 1) | (654) | (33,352) |
Net increase (decrease) | 1,828,219 | $90,583,920 |
Investor Class | Shares | Amount |
Six-month period ended April 30, 2022: | ||
Shares sold | 92,299 | $5,182,137 |
Shares issued to shareholders in reinvestment of distributions | 43,080 | 2,445,230 |
Shares redeemed | (58,699) | (3,315,915) |
Net increase (decrease) in shares outstanding before conversion | 76,680 | 4,311,452 |
Shares converted into Investor Class (See Note 1) | 1,267 | 69,330 |
Shares converted from Investor Class (See Note 1) | (116,360) | (6,772,513) |
Net increase (decrease) | (38,413) | $(2,391,731) |
Year ended October 31, 2021: | ||
Shares sold | 215,863 | $11,330,614 |
Shares issued to shareholders in reinvestment of distributions | 108,660 | 5,122,224 |
Shares redeemed | (121,766) | (6,383,419) |
Net increase (decrease) in shares outstanding before conversion | 202,757 | 10,069,419 |
Shares converted into Investor Class (See Note 1) | 655 | 33,352 |
Shares converted from Investor Class (See Note 1) | (439,434) | (22,796,174) |
Net increase (decrease) | (236,022) | $(12,693,403) |
Class I | Shares | Amount |
Six-month period ended April 30, 2022: | ||
Shares sold | 289,460 | $16,867,436 |
Shares issued to shareholders in reinvestment of distributions | 376,549 | 21,813,472 |
Shares redeemed | (2,750,221) | (159,939,349) |
Net increase (decrease) in shares outstanding before conversion | (2,084,212) | (121,258,441) |
Shares converted into Class I (See Note 1) | 4,742 | 263,581 |
Net increase (decrease) | (2,079,470) | $(120,994,860) |
Year ended October 31, 2021: | ||
Shares sold | 1,578,904 | $82,841,231 |
Shares issued to shareholders in reinvestment of distributions | 853,614 | 41,033,248 |
Shares redeemed | (3,861,408) | (214,460,090) |
Net increase (decrease) | (1,428,890) | $(90,585,611) |
SIMPLE Class | Shares | Amount |
Six-month period ended April 30, 2022: | ||
Shares sold | 1,832 | $100,043 |
Shares issued to shareholders in reinvestment of distributions | 50 | 2,832 |
Shares redeemed | —(a) | (20) |
Net increase (decrease) | 1,882 | $102,855 |
Year ended October 31, 2021: | ||
Shares sold | 579 | $32,116 |
Shares issued to shareholders in reinvestment of distributions | 42 | 1,983 |
Net increase (decrease) | 621 | $34,099 |
(a) | Share amount is less than 0.05. |
32 | MainStay S&P 500 Index Fund |
Fund | Proceeds | Cost Basis |
MainStay S&P 500 Index Fund* | $1,025,100 | $907,116 |
* | Inclusive of payments received into MainStay Equity Index Fund prior to its acquisition by the Fund. |
34 | MainStay S&P 500 Index Fund |
36 | MainStay S&P 500 Index Fund |
38 | MainStay S&P 500 Index Fund |
For more information
Message from the President and Semiannual Report
please log in to newyorklifeinvestments.com/accounts.
Not FDIC/NCUA Insured | Not a Deposit | May Lose Value | No Bank Guarantee | Not Insured by Any Government Agency |


5 | |
9 | |
11 | |
22 | |
31 | |
41 | |
46 | |
47 | |
47 |
Investors should refer to the Fund’s Summary Prospectus and/or Prospectus and consider the Fund’s investment objectives, strategies, risks, charges and expenses carefully before investing. The Summary Prospectus and/or Prospectus contain this and other information about the Fund. You may obtain copies of the Fund’s Summary Prospectus, Prospectus and Statement of Additional Information, which includes information about MainStay Funds Trust's Trustees, free of charge, upon request, by calling toll-free 800-624-6782, by writing to NYLIFE Distributors LLC, Attn: MainStay Marketing Department, 30 Hudson Street, Jersey City, NJ 07302 or by sending an e-mail to MainStayShareholderServices@nylim.com. These documents are also available via the MainStay Funds’ website at newyorklifeinvestments.com. Please read the Fund’s Summary Prospectus and/or Prospectus carefully before investing.
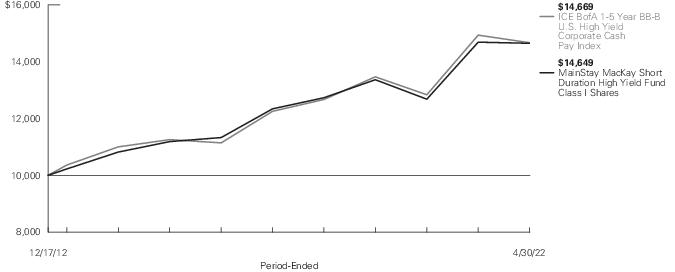
Average Annual Total Returns for the Period-Ended April 30, 2022 | ||||||||
Class | Sales Charge | Inception Date | Six Months1 | One Year | Five Years | Since Inception | Gross Expense Ratio2 | |
Class A Shares | Maximum 3% Initial Sales Charge | With sales charges | 12/17/2012 | -5.03% | -3.50% | 2.60% | 3.57% | 1.01% |
Excluding sales charges | -2.09 | -0.52 | 3.23 | 3.91 | 1.01 | |||
Investor Class Shares3 | Maximum 2.5% Initial Sales Charge | With sales charges | 12/17/2012 | -4.58 | -3.09 | 2.55 | 3.46 | 1.10 |
Excluding sales charges | -2.13 | -0.61 | 3.17 | 3.80 | 1.10 | |||
Class C Shares | Maximum 1% CDSC | With sales charges | 12/17/2012 | -3.46 | -2.21 | 2.40 | 3.04 | 1.85 |
if Redeemed Within 18 months of Purchase | Excluding sales charges | -2.50 | -1.25 | 2.40 | 3.04 | 1.85 | ||
Class I Shares | No Sales Charge | 12/17/2012 | -2.07 | -0.27 | 3.49 | 4.16 | 0.76 | |
Class R2 Shares | No Sales Charge | 12/17/2012 | -2.14 | -0.52 | 3.15 | 3.80 | 1.11 | |
Class R3 Shares | No Sales Charge | 2/29/2016 | -2.26 | -0.86 | 2.87 | 4.47 | 1.36 | |
1. | Not annualized. |
2. | The gross expense ratios presented reflect the Fund’s “Total Annual Fund Operating Expenses” from the most recent Prospectus, as supplemented, and may differ from other expense ratios disclosed in this report. |
3. | Prior to June 30, 2020, the maximum initial sales charge was 3%, which is reflected in the applicable average annual total return figures shown. |
Benchmark Performance* | Six Months1 | One Year | Five Years | Since Inception |
ICE BofA 1-5 Year BB-B U.S. High Yield Corporate Cash Pay Index2 | -3.51% | -1.79% | 3.66% | 4.18% |
Morningstar High Yield Bond Category Average3 | -6.57 | -4.79 | 2.78 | 3.65 |
* | Returns for indices reflect no deductions for fees, expenses or taxes, except for foreign withholding taxes where applicable. |
1. | Not annualized. |
2. | ICE BofA 1-5 Year BB-B U.S. High Yield Corporate Cash Pay Index is the Fund's primary broad-based securities market index for comparison purposes. The ICE BofA 1-5 Year BB-B U.S. High Yield Corporate Cash Pay Index generally tracks the performance of BB-B rated U.S. dollar-denominated corporate bonds publicly issued in the U.S. domestic market with maturities of 1 to 5 years. Results assume reinvestment of all dividends and capital gains. An investment cannot be made directly in an index. |
3. | The Morningstar High Yield Bond Category Average is representative of funds that concentrate on lower-quality bonds, which are riskier than those of higher-quality companies. These portfolios primarily invest in U.S. high-income debt securities where at least 65% or more of bond assets are not rated or are rated by a major agency such as Standard & Poor’s or Moody’s at the level of BB and below. Results are based on average total returns of similar funds with all dividends and capital gain distributions reinvested. |
6 | MainStay MacKay Short Duration High Yield Fund |
Share Class | Beginning Account Value 11/1/21 | Ending Account Value (Based on Actual Returns and Expenses) 4/30/22 | Expenses Paid During Period1 | Ending Account Value (Based on Hypothetical 5% Annualized Return and Actual Expenses) 4/30/22 | Expenses Paid During Period1 | Net Expense Ratio During Period2 |
Class A Shares | $1,000.00 | $979.10 | $4.96 | $1,019.79 | $5.06 | 1.01% |
Investor Class Shares | $1,000.00 | $978.70 | $5.40 | $1,019.34 | $5.51 | 1.10% |
Class C Shares | $1,000.00 | $975.00 | $9.06 | $1,015.62 | $9.25 | 1.85% |
Class I Shares | $1,000.00 | $979.30 | $3.73 | $1,021.03 | $3.81 | 0.76% |
Class R2 Shares | $1,000.00 | $978.60 | $5.45 | $1,019.29 | $5.56 | 1.11% |
Class R3 Shares | $1,000.00 | $977.40 | $6.67 | $1,018.05 | $6.81 | 1.36% |
1. | Expenses are equal to the Fund’s annualized expense ratio of each class multiplied by the average account value over the period, divided by 365 and multiplied by 181 (to reflect the six-month period). The table above represents the actual expenses incurred during the six-month period. In addition to the fees and expenses which the Fund bears directly, it also indirectly bears a pro rata share of the fees and expenses of the underlying funds in which it invests. Such indirect expenses are not included in the above-reported expense figures. |
2. | Expenses are equal to the Fund's annualized expense ratio to reflect the six-month period. |
Portfolio Composition as of April 30, 2022 (Unaudited)

Top Ten Holdings and/or Issuers Held as of April 30, 2022 (excluding short-term investments) (Unaudited)
1. | HCA, Inc., 5.375%-8.36%, due 5/1/23–2/15/26 |
2. | T-Mobile US, Inc., 2.25%-5.375%, due 2/15/26–2/1/28 |
3. | VICI Properties LP, 1.625%-5.625%, due 5/1/24–6/15/25 |
4. | Carnival Corp., 5.75%-10.50%, due 2/1/26–3/1/27 |
5. | Sprint Corp., 7.875%, due 9/15/23 |
6. | Ford Motor Credit Co. LLC, 2.30%-5.584%, due 8/3/22–8/10/26 |
7. | TransDigm, Inc., 3.014%-8.00%, due 12/9/25–3/15/26 |
8. | FS Energy and Power Fund, 7.50%, due 8/15/23 |
9. | Churchill Downs, Inc., 2.77%-5.50%, due 12/27/24–4/1/27 |
10. | DISH Network Corp., 2.375%-3.375%, due 3/15/24–8/15/26 |
8 | MainStay MacKay Short Duration High Yield Fund |
10 | MainStay MacKay Short Duration High Yield Fund |
Principal Amount | Value | |
Long-Term Bonds 92.9% | ||
Convertible Bonds 1.9% | ||
Investment Companies 0.3% | ||
Ares Capital Corp. | ||
4.625%, due 3/1/24 | $ 4,500,000 | $ 4,978,350 |
Media 1.5% | ||
DISH Network Corp. | ||
2.375%, due 3/15/24 | 21,650,000 | 20,204,862 |
3.375%, due 8/15/26 | 2,300,000 | 1,978,000 |
22,182,862 | ||
Oil & Gas 0.1% | ||
Gulfport Energy Operating Corp. | ||
10.00% (10.00% Cash or 15.00% PIK), due 12/29/49 (a)(b) | 260,000 | 1,795,300 |
Total Convertible Bonds (Cost $27,364,757) | 28,956,512 | |
Corporate Bonds 74.7% | ||
Advertising 0.3% | ||
Outfront Media Capital LLC | ||
6.25%, due 6/15/25 (c) | 4,000,000 | 4,050,000 |
Aerospace & Defense 1.6% | ||
F-Brasile SpA | ||
Series XR | ||
7.375%, due 8/15/26 (c) | 3,600,000 | 3,177,000 |
TransDigm UK Holdings plc | ||
6.875%, due 5/15/26 | 3,100,000 | 3,084,500 |
TransDigm, Inc. (c) | ||
6.25%, due 3/15/26 | 7,900,000 | 7,860,500 |
8.00%, due 12/15/25 | 9,005,000 | 9,372,584 |
23,494,584 | ||
Airlines 0.9% | ||
American Airlines, Inc. | ||
5.50%, due 4/20/26 (c) | 2,200,000 | 2,180,750 |
Delta Air Lines, Inc. | ||
4.50%, due 10/20/25 (c) | 2,000,000 | 1,986,465 |
7.00%, due 5/1/25 (c) | 4,375,000 | 4,683,027 |
7.375%, due 1/15/26 | 1,500,000 | 1,597,500 |
Spirit Loyalty Cayman Ltd. | ||
8.00%, due 9/20/25 (c) | 541,669 | 572,008 |
United Airlines, Inc. | ||
4.375%, due 4/15/26 (c) | 3,500,000 | 3,379,250 |
14,399,000 | ||
Principal Amount | Value | |
Auto Manufacturers 2.9% | ||
Ford Motor Credit Co. LLC | ||
2.30%, due 2/10/25 | $ 5,000,000 | $ 4,643,500 |
2.70%, due 8/10/26 | 4,000,000 | 3,565,920 |
2.979%, due 8/3/22 | 1,797,000 | 1,797,000 |
3.087%, due 1/9/23 | 2,400,000 | 2,402,112 |
3.096%, due 5/4/23 | 1,065,000 | 1,052,651 |
3.37%, due 11/17/23 | 4,000,000 | 3,930,000 |
3.375%, due 11/13/25 | 7,000,000 | 6,721,260 |
3.664%, due 9/8/24 | 1,150,000 | 1,112,625 |
4.14%, due 2/15/23 | 1,100,000 | 1,099,197 |
5.125%, due 6/16/25 | 3,000,000 | 2,992,500 |
5.584%, due 3/18/24 | 840,000 | 849,442 |
JB Poindexter & Co., Inc. | ||
7.125%, due 4/15/26 (c) | 14,003,000 | 14,027,785 |
44,193,992 | ||
Auto Parts & Equipment 1.5% | ||
Adient Global Holdings Ltd. | ||
4.875%, due 8/15/26 (c) | 6,000,000 | 5,350,380 |
IHO Verwaltungs GmbH (b)(c) | ||
4.75% (4.75% Cash or 5.50% PIK), due 9/15/26 | 6,760,000 | 6,354,400 |
6.00% (6.00% Cash or 6.75% PIK), due 5/15/27 | 10,565,000 | 9,792,065 |
Meritor, Inc. | ||
6.25%, due 6/1/25 (c) | 1,660,000 | 1,718,930 |
23,215,775 | ||
Building Materials 0.5% | ||
Koppers, Inc. | ||
6.00%, due 2/15/25 (c) | 5,475,000 | 5,297,063 |
Summit Materials LLC | ||
6.50%, due 3/15/27 (c) | 2,850,000 | 2,839,170 |
8,136,233 | ||
Chemicals 1.0% | ||
GPD Cos., Inc. | ||
10.125%, due 4/1/26 (c) | 7,385,000 | 7,698,862 |
Iris Holdings, Inc. | ||
8.75% (8.75% Cash or 9.50% PIK), due 2/15/26 (b)(c) | 3,000,000 | 2,877,300 |
NOVA Chemicals Corp. | ||
4.875%, due 6/1/24 (c) | 2,150,000 | 2,120,438 |
SCIL IV LLC | ||
5.375%, due 11/1/26 (c) | 3,325,000 | 3,034,062 |
15,730,662 | ||
Principal Amount | Value | |
Corporate Bonds (continued) | ||
Coal 0.3% | ||
Coronado Finance Pty. Ltd. | ||
10.75%, due 5/15/26 (c) | $ 2,800,000 | $ 3,003,000 |
Natural Resource Partners LP | ||
9.125%, due 6/30/25 (c) | 2,000,000 | 2,035,000 |
5,038,000 | ||
Commercial Services 1.9% | ||
Alta Equipment Group, Inc. | ||
5.625%, due 4/15/26 (c) | 5,000,000 | 4,648,450 |
Graham Holdings Co. | ||
5.75%, due 6/1/26 (c) | 8,100,000 | 8,160,750 |
Herc Holdings, Inc. | ||
5.50%, due 7/15/27 (c) | 2,000,000 | 1,959,400 |
Legends Hospitality Holding Co. LLC | ||
5.00%, due 2/1/26 (c) | 2,000,000 | 1,876,900 |
Ritchie Bros Auctioneers, Inc. | ||
5.375%, due 1/15/25 (c) | 7,785,000 | 7,805,630 |
Service Corp. International | ||
7.50%, due 4/1/27 | 3,150,000 | 3,425,625 |
United Rentals North America, Inc. | ||
5.50%, due 5/15/27 | 1,165,000 | 1,185,388 |
29,062,143 | ||
Distribution & Wholesale 0.8% | ||
Avient Corp. | ||
5.25%, due 3/15/23 | 1,750,000 | 1,754,375 |
5.75%, due 5/15/25 (c) | 6,845,000 | 6,912,834 |
G-III Apparel Group Ltd. | ||
7.875%, due 8/15/25 (c) | 3,500,000 | 3,640,000 |
12,307,209 | ||
Diversified Financial Services 1.3% | ||
Credit Acceptance Corp. | ||
5.125%, due 12/31/24 (c) | 10,090,000 | 9,969,021 |
Enact Holdings, Inc. | ||
6.50%, due 8/15/25 (c) | 3,260,000 | 3,243,309 |
Oxford Finance LLC | ||
6.375%, due 2/1/27 (c) | 1,500,000 | 1,518,450 |
PRA Group, Inc. | ||
7.375%, due 9/1/25 (c) | 2,650,000 | 2,741,955 |
StoneX Group, Inc. | ||
8.625%, due 6/15/25 (c) | 1,920,000 | 2,007,897 |
19,480,632 | ||
Electric 1.3% | ||
DPL, Inc. | ||
4.125%, due 7/1/25 | 3,650,000 | 3,504,000 |
Principal Amount | Value | |
Electric (continued) | ||
NextEra Energy Operating Partners LP (c) | ||
3.875%, due 10/15/26 | $ 3,500,000 | $ 3,303,125 |
4.25%, due 7/15/24 | 4,030,000 | 4,000,541 |
NRG Energy, Inc. | ||
6.625%, due 1/15/27 | 1,500,000 | 1,518,750 |
Pacific Gas and Electric Co. | ||
1.75%, due 6/16/22 | 2,000,000 | 1,998,643 |
Vistra Corp. (c)(d)(e) | ||
7.00% (5 Year Treasury Constant Maturity Rate + 5.74%), due 12/15/26 | 1,500,000 | 1,458,750 |
8.00% (5 Year Treasury Constant Maturity Rate + 6.93%), due 10/15/26 | 4,100,000 | 4,125,625 |
19,909,434 | ||
Electrical Components & Equipment 0.5% | ||
WESCO Distribution, Inc. | ||
7.125%, due 6/15/25 (c) | 7,650,000 | 7,946,438 |
Energy-Alternate Sources 0.2% | ||
TerraForm Power Operating LLC | ||
4.25%, due 1/31/23 (c) | 2,520,000 | 2,523,150 |
Engineering & Construction 0.2% | ||
Artera Services LLC | ||
9.033%, due 12/4/25 (c) | 2,500,000 | 2,366,113 |
Entertainment 3.6% | ||
Churchill Downs, Inc. | ||
5.50%, due 4/1/27 (c) | 19,375,000 | 19,024,506 |
International Game Technology plc (c) | ||
4.125%, due 4/15/26 | 9,950,000 | 9,383,044 |
6.25%, due 1/15/27 | 1,630,000 | 1,655,053 |
6.50%, due 2/15/25 | 4,300,000 | 4,375,250 |
Live Nation Entertainment, Inc. | ||
6.50%, due 5/15/27 (c) | 6,420,000 | 6,659,466 |
Powdr Corp. | ||
6.00%, due 8/1/25 (c) | 2,682,000 | 2,715,525 |
Vail Resorts, Inc. | ||
6.25%, due 5/15/25 (c) | 10,582,000 | 10,820,095 |
54,632,939 | ||
Food 0.3% | ||
B&G Foods, Inc. | ||
5.25%, due 4/1/25 | 4,300,000 | 4,094,473 |
12 | MainStay MacKay Short Duration High Yield Fund |
Principal Amount | Value | |
Corporate Bonds (continued) | ||
Food (continued) | ||
Post Holdings, Inc. | ||
5.75%, due 3/1/27 (c) | $ 350,000 | $ 345,187 |
4,439,660 | ||
Food Service 0.8% | ||
Aramark Services, Inc. | ||
6.375%, due 5/1/25 (c) | 12,185,000 | 12,408,838 |
Forest Products & Paper 0.2% | ||
Mercer International, Inc. | ||
5.50%, due 1/15/26 | 1,000,000 | 991,360 |
Smurfit Kappa Treasury Funding DAC | ||
7.50%, due 11/20/25 | 1,631,000 | 1,846,821 |
2,838,181 | ||
Gas 1.0% | ||
AmeriGas Partners LP | ||
5.625%, due 5/20/24 | 7,500,000 | 7,489,875 |
Rockpoint Gas Storage Canada Ltd. | ||
7.00%, due 3/31/23 (c) | 7,200,000 | 7,128,000 |
14,617,875 | ||
Healthcare-Services 4.9% | ||
Catalent Pharma Solutions, Inc. | ||
5.00%, due 7/15/27 (c) | 5,216,000 | 5,053,000 |
Encompass Health Corp. | ||
5.75%, due 9/15/25 | 4,335,000 | 4,410,863 |
HCA, Inc. | ||
5.375%, due 2/1/25 | 13,100,000 | 13,476,625 |
5.875%, due 5/1/23 | 9,255,000 | 9,546,532 |
5.875%, due 2/15/26 | 2,000,000 | 2,071,000 |
7.50%, due 12/15/23 | 11,610,000 | 12,088,912 |
7.58%, due 9/15/25 | 5,623,000 | 6,051,754 |
8.36%, due 4/15/24 | 10,000,000 | 10,675,000 |
IQVIA, Inc. | ||
5.00%, due 10/15/26 (c) | 5,515,000 | 5,487,428 |
ModivCare, Inc. | ||
5.875%, due 11/15/25 (c) | 6,000,000 | 5,880,000 |
74,741,114 | ||
Holding Companies-Diversified 0.8% | ||
Stena International SA | ||
6.125%, due 2/1/25 (c) | 12,220,000 | 12,115,470 |
Home Builders 1.7% | ||
Adams Homes, Inc. | ||
7.50%, due 2/15/25 (c) | 6,815,000 | 6,639,785 |
Principal Amount | Value | |
Home Builders (continued) | ||
Century Communities, Inc. | ||
6.75%, due 6/1/27 | $ 3,000,000 | $ 3,033,030 |
Installed Building Products, Inc. | ||
5.75%, due 2/1/28 (c) | 4,000,000 | 3,789,647 |
Meritage Homes Corp. | ||
5.125%, due 6/6/27 | 1,000,000 | 977,500 |
Picasso Finance Sub, Inc. | ||
6.125%, due 6/15/25 (c) | 6,869,000 | 6,996,764 |
STL Holding Co. LLC | ||
7.50%, due 2/15/26 (c) | 1,645,000 | 1,554,525 |
Winnebago Industries, Inc. | ||
6.25%, due 7/15/28 (c) | 2,300,000 | 2,282,750 |
25,274,001 | ||
Household Products & Wares 0.1% | ||
Spectrum Brands, Inc. | ||
5.75%, due 7/15/25 | 1,000,000 | 1,010,000 |
Housewares 0.3% | ||
Newell Brands, Inc. | ||
4.10%, due 4/1/23 (f) | 2,250,000 | 2,251,407 |
4.875%, due 6/1/25 | 1,750,000 | 1,772,706 |
4,024,113 | ||
Insurance 0.7% | ||
MGIC Investment Corp. | ||
5.75%, due 8/15/23 | 4,000,000 | 4,050,000 |
NMI Holdings, Inc. | ||
7.375%, due 6/1/25 (c) | 6,485,000 | 6,760,612 |
10,810,612 | ||
Internet 1.4% | ||
Netflix, Inc. | ||
3.625%, due 6/15/25 (c) | 1,000,000 | 977,500 |
5.75%, due 3/1/24 | 4,980,000 | 5,166,750 |
5.875%, due 2/15/25 | 665,000 | 689,937 |
NortonLifeLock, Inc. | ||
5.00%, due 4/15/25 (c) | 7,175,000 | 7,166,462 |
Uber Technologies, Inc. | ||
7.50%, due 5/15/25 (c) | 6,345,000 | 6,551,276 |
20,551,925 | ||
Investment Companies 2.4% | ||
Ares Capital Corp. | ||
3.875%, due 1/15/26 | 1,000,000 | 960,031 |
FS Energy and Power Fund | ||
7.50%, due 8/15/23 (c) | 22,844,000 | 23,215,215 |
Principal Amount | Value | |
Corporate Bonds (continued) | ||
Investment Companies (continued) | ||
Icahn Enterprises LP | ||
4.75%, due 9/15/24 | $ 12,500,000 | $ 12,187,500 |
36,362,746 | ||
Iron & Steel 0.9% | ||
Allegheny Ludlum LLC | ||
6.95%, due 12/15/25 | 2,430,000 | 2,548,462 |
Mineral Resources Ltd. (c) | ||
8.00%, due 11/1/27 | 2,505,000 | 2,495,606 |
8.125%, due 5/1/27 | 8,625,000 | 8,756,359 |
13,800,427 | ||
Leisure Time 2.4% | ||
Carnival Corp. (c) | ||
5.75%, due 3/1/27 | 8,300,000 | 7,515,775 |
7.625%, due 3/1/26 | 9,660,000 | 9,454,725 |
10.50%, due 2/1/26 | 14,000,000 | 15,400,000 |
CWT Travel Group, Inc. | ||
8.50%, due 11/19/26 (c) | 1,608,846 | 1,588,735 |
Lindblad Expeditions LLC | ||
6.75%, due 2/15/27 (c) | 1,825,000 | 1,790,781 |
35,750,016 | ||
Lodging 2.0% | ||
Boyd Gaming Corp. | ||
8.625%, due 6/1/25 (c) | 11,957,000 | 12,465,053 |
Genting New York LLC | ||
3.30%, due 2/15/26 (c) | 1,500,000 | 1,370,947 |
Hilton Domestic Operating Co., Inc. | ||
5.375%, due 5/1/25 (c) | 5,590,000 | 5,703,533 |
Hilton Worldwide Finance LLC | ||
4.875%, due 4/1/27 | 1,315,000 | 1,301,850 |
Hyatt Hotels Corp. | ||
5.625%, due 4/23/25 (f) | 5,070,000 | 5,220,911 |
Marriott International, Inc. | ||
3.75%, due 10/1/25 | 1,000,000 | 993,116 |
Series Z | ||
4.15%, due 12/1/23 | 1,500,000 | 1,518,193 |
Series EE | ||
5.75%, due 5/1/25 | 932,000 | 976,813 |
29,550,416 | ||
Machinery-Diversified 0.5% | ||
Briggs & Stratton Corp. Escrow Claim Shares | ||
6.875%, due 12/15/20 (g)(h) | 3,425,000 | 34,250 |
Stevens Holding Co., Inc. | ||
6.125%, due 10/1/26 (c) | 3,500,000 | 3,508,750 |
Principal Amount | Value | |
Machinery-Diversified (continued) | ||
TK Elevator U.S. Newco, Inc. | ||
5.25%, due 7/15/27 (c) | $ 3,613,000 | $ 3,384,731 |
6,927,731 | ||
Media 3.0% | ||
CCO Holdings LLC (c) | ||
5.00%, due 2/1/28 | 2,900,000 | 2,762,250 |
5.125%, due 5/1/27 | 1,500,000 | 1,462,170 |
5.50%, due 5/1/26 | 12,650,000 | 12,681,625 |
CSC Holdings LLC | ||
5.25%, due 6/1/24 | 9,250,000 | 9,040,765 |
5.875%, due 9/15/22 | 3,250,000 | 3,267,388 |
DIRECTV Financing LLC | ||
5.875%, due 8/15/27 (c) | 4,500,000 | 4,235,625 |
DISH DBS Corp. | ||
5.875%, due 7/15/22 | 3,550,000 | 3,554,224 |
LCPR Senior Secured Financing DAC | ||
6.75%, due 10/15/27 (c) | 5,000,000 | 4,968,875 |
Sterling Entertainment Enterprises LLC | ||
10.25%, due 1/15/25 (a)(h)(i)(j) | 3,000,000 | 3,000,000 |
Townsquare Media, Inc. | ||
6.875%, due 2/1/26 (c) | 485,000 | 482,866 |
45,455,788 | ||
Metal Fabricate & Hardware 0.1% | ||
Advanced Drainage Systems, Inc. | ||
5.00%, due 9/30/27 (c) | 1,000,000 | 966,250 |
Mining 1.9% | ||
Arconic Corp. | ||
6.00%, due 5/15/25 (c) | 3,000,000 | 3,010,230 |
Century Aluminum Co. | ||
7.50%, due 4/1/28 (c) | 2,500,000 | 2,509,375 |
Compass Minerals International, Inc. (c) | ||
4.875%, due 7/15/24 | 12,860,000 | 12,731,400 |
6.75%, due 12/1/27 | 1,500,000 | 1,518,555 |
First Quantum Minerals Ltd. (c) | ||
7.25%, due 4/1/23 | 1,251,000 | 1,250,712 |
7.50%, due 4/1/25 | 2,500,000 | 2,530,714 |
Novelis Corp. | ||
3.25%, due 11/15/26 (c) | 5,665,000 | 5,169,029 |
28,720,015 | ||
Miscellaneous—Manufacturing 1.0% | ||
Amsted Industries, Inc. | ||
5.625%, due 7/1/27 (c) | 3,000,000 | 2,977,500 |
14 | MainStay MacKay Short Duration High Yield Fund |
Principal Amount | Value | |
Corporate Bonds (continued) | ||
Miscellaneous—Manufacturing (continued) | ||
EnPro Industries, Inc. | ||
5.75%, due 10/15/26 | $ 1,000,000 | $ 1,000,000 |
FXI Holdings, Inc. (c) | ||
7.875%, due 11/1/24 | 1,965,000 | 1,936,861 |
12.25%, due 11/15/26 | 439,000 | 467,535 |
Hillenbrand, Inc. | ||
5.00%, due 9/15/26 (f) | 6,080,000 | 5,988,800 |
5.75%, due 6/15/25 | 3,515,000 | 3,541,363 |
15,912,059 | ||
Oil & Gas 7.3% | ||
Ascent Resources Utica Holdings LLC (c) | ||
7.00%, due 11/1/26 | 3,900,000 | 3,930,576 |
9.00%, due 11/1/27 | 1,556,000 | 2,164,936 |
California Resources Corp. | ||
7.125%, due 2/1/26 (c) | 4,520,000 | 4,597,518 |
Callon Petroleum Co. | ||
9.00%, due 4/1/25 (c) | 8,095,000 | 8,580,700 |
Centennial Resource Production LLC | ||
5.375%, due 1/15/26 (c) | 6,100,000 | 5,947,500 |
Chevron USA, Inc. | ||
3.90%, due 11/15/24 | 4,550,000 | 4,612,992 |
Civitas Resources, Inc. | ||
5.00%, due 10/15/26 (c) | 1,045,000 | 992,750 |
Colgate Energy Partners III LLC | ||
7.75%, due 2/15/26 (c) | 3,000,000 | 3,142,530 |
Earthstone Energy Holdings LLC | ||
8.00%, due 4/15/27 (c) | 2,000,000 | 1,992,890 |
Encino Acquisition Partners Holdings LLC | ||
8.50%, due 5/1/28 (c) | 4,515,000 | 4,526,287 |
Endeavor Energy Resources LP | ||
6.625%, due 7/15/25 (c) | 900,000 | 924,750 |
EQT Corp. | ||
6.625%, due 2/1/25 (f) | 7,850,000 | 8,170,201 |
Gulfport Energy Operating Corp. | ||
8.00%, due 5/17/26 | 88,094 | 90,611 |
8.00%, due 5/17/26 (c) | 4,510,560 | 4,639,427 |
Gulfport Energy Operating Corp. Escrow Claim Shares (g)(i)(j) | ||
6.00%, due 10/15/24 | 2,245,000 | — |
6.625%, due 5/1/23 | 4,452,000 | — |
Hess Corp. | ||
3.50%, due 7/15/24 | 910,000 | 904,089 |
Matador Resources Co. | ||
5.875%, due 9/15/26 | 7,220,000 | 7,088,163 |
Principal Amount | Value | |
Oil & Gas (continued) | ||
Oasis Petroleum, Inc. | ||
6.375%, due 6/1/26 (c) | $ 2,780,000 | $ 2,793,511 |
Occidental Petroleum Corp. | ||
5.50%, due 12/1/25 | 2,000,000 | 2,035,000 |
5.55%, due 3/15/26 | 1,000,000 | 1,025,000 |
5.875%, due 9/1/25 | 3,160,000 | 3,245,541 |
8.00%, due 7/15/25 | 5,000,000 | 5,387,500 |
Parkland Corp. | ||
5.875%, due 7/15/27 (c) | 2,070,000 | 2,007,279 |
PBF Holding Co. LLC | ||
9.25%, due 5/15/25 (c) | 3,100,000 | 3,213,739 |
PDC Energy, Inc. | ||
5.75%, due 5/15/26 | 2,775,000 | 2,700,519 |
6.125%, due 9/15/24 | 2,450,000 | 2,455,562 |
Range Resources Corp. | ||
4.875%, due 5/15/25 | 1,550,000 | 1,534,500 |
Southwestern Energy Co. | ||
5.95%, due 1/23/25 (f) | 2,199,000 | 2,230,622 |
Talos Production, Inc. | ||
12.00%, due 1/15/26 | 11,410,000 | 12,268,374 |
Transocean Guardian Ltd. | ||
5.875%, due 1/15/24 (c) | 1,030,874 | 986,712 |
Transocean Pontus Ltd. | ||
6.125%, due 8/1/25 (c) | 4,052,850 | 3,981,722 |
Transocean Poseidon Ltd. | ||
6.875%, due 2/1/27 (c) | 2,568,750 | 2,471,703 |
110,643,204 | ||
Oil & Gas Services 1.2% | ||
Bristow Group, Inc. | ||
6.875%, due 3/1/28 (c) | 1,500,000 | 1,470,002 |
Nine Energy Service, Inc. | ||
8.75%, due 11/1/23 (c) | 3,775,000 | 2,378,250 |
TechnipFMC plc | ||
6.50%, due 2/1/26 (c) | 10,672,000 | 11,045,520 |
Weatherford International Ltd. | ||
11.00%, due 12/1/24 (c) | 2,800,000 | 2,884,000 |
17,777,772 | ||
Packaging & Containers 0.3% | ||
Cascades, Inc. | ||
5.125%, due 1/15/26 (c) | 4,831,000 | 4,698,148 |
Pharmaceuticals 0.9% | ||
Bausch Health Americas, Inc. | ||
9.25%, due 4/1/26 (c) | 1,250,000 | 1,240,875 |
Bausch Health Cos., Inc. | ||
6.125%, due 4/15/25 (c) | 7,776,000 | 7,798,861 |
Principal Amount | Value | |
Corporate Bonds (continued) | ||
Pharmaceuticals (continued) | ||
Endo DAC | ||
5.875%, due 10/15/24 (c) | $ 4,150,000 | $ ��� 3,828,375 |
PRA Health Sciences, Inc. | ||
2.875%, due 7/15/26 (c) | 1,500,000 | 1,389,810 |
14,257,921 | ||
Pipelines 5.0% | ||
Antero Midstream Partners LP | ||
5.75%, due 3/1/27 (c) | 5,835,000 | 5,681,715 |
EQM Midstream Partners LP | ||
4.125%, due 12/1/26 | 675,000 | 626,906 |
6.00%, due 7/1/25 (c) | 5,980,000 | 5,926,479 |
Genesis Energy LP | ||
5.625%, due 6/15/24 | 2,050,000 | 2,003,875 |
6.25%, due 5/15/26 | 2,190,000 | 2,042,175 |
6.50%, due 10/1/25 | 3,640,000 | 3,458,000 |
Hess Midstream Operations LP | ||
5.625%, due 2/15/26 (c) | 6,349,000 | 6,349,000 |
Holly Energy Partners LP | ||
6.375%, due 4/15/27 (c) | 1,000,000 | 1,020,000 |
NGL Energy Operating LLC | ||
7.50%, due 2/1/26 (c) | 2,200,000 | 2,072,587 |
NuStar Logistics LP | ||
5.75%, due 10/1/25 | 1,500,000 | 1,492,500 |
PBF Logistics LP | ||
6.875%, due 5/15/23 | 4,000,000 | 3,990,200 |
Plains All American Pipeline LP | ||
Series B | ||
6.125%, due 11/15/22 (e)(k) | 18,663,000 | 15,536,947 |
Rockies Express Pipeline LLC | ||
3.60%, due 5/15/25 (c) | 2,905,000 | 2,758,908 |
Ruby Pipeline LLC | ||
(zero coupon), due 4/1/22 (c)(f)(g)(l) | 8,179,788 | 7,259,562 |
Summit Midstream Holdings LLC | ||
8.50%, due 10/15/26 (c) | 6,880,000 | 6,423,374 |
TransMontaigne Partners LP | ||
6.125%, due 2/15/26 | 4,600,000 | 4,502,250 |
Western Midstream Operating LP | ||
4.65%, due 7/1/26 | 4,315,000 | 4,255,669 |
75,400,147 | ||
Real Estate 0.8% | ||
Newmark Group, Inc. | ||
6.125%, due 11/15/23 | 12,225,000 | 12,459,720 |
Principal Amount | Value | |
Real Estate Investment Trusts 2.8% | ||
GLP Capital LP | ||
5.25%, due 6/1/25 | $ 2,500,000 | $ 2,544,500 |
5.375%, due 11/1/23 | 3,110,000 | 3,154,660 |
5.375%, due 4/15/26 | 700,000 | 714,103 |
MPT Operating Partnership LP | ||
5.25%, due 8/1/26 | 2,500,000 | 2,503,775 |
VICI Properties LP (c) | ||
1.625%, due 6/15/25 | 2,985,000 | 2,970,075 |
3.50%, due 2/15/25 | 10,640,000 | 10,214,613 |
5.625%, due 5/1/24 | 19,681,000 | 19,902,411 |
42,004,137 | ||
Retail 2.3% | ||
CEC Entertainment LLC | ||
6.75%, due 5/1/26 (c) | 1,745,000 | 1,640,300 |
Dave & Buster's, Inc. | ||
7.625%, due 11/1/25 (c) | 2,160,000 | 2,241,000 |
KFC Holding Co. | ||
4.75%, due 6/1/27 (c) | 8,457,000 | 8,435,857 |
NMG Holding Co., Inc. | ||
7.125%, due 4/1/26 (c) | 15,883,000 | 15,767,531 |
Patrick Industries, Inc. | ||
7.50%, due 10/15/27 (c) | 2,500,000 | 2,525,000 |
Penske Automotive Group, Inc. | ||
3.50%, due 9/1/25 | 3,075,000 | 2,967,375 |
Ultra Resources, Inc. Escrow Claim Shares | ||
6.875%, due 4/15/22 (a)(g)(i)(j) | 4,455,000 | — |
Yum! Brands, Inc. | ||
3.875%, due 11/1/23 | 1,000,000 | 1,008,400 |
34,585,463 | ||
Software 1.9% | ||
Camelot Finance SA | ||
4.50%, due 11/1/26 (c) | 9,225,000 | 8,671,500 |
CDK Global, Inc. | ||
5.00%, due 10/15/24 (f) | 3,150,000 | 3,240,563 |
Change Healthcare Holdings LLC | ||
5.75%, due 3/1/25 (c) | 1,500,000 | 1,496,250 |
PTC, Inc. | ||
3.625%, due 2/15/25 (c) | 10,320,000 | 9,997,500 |
SS&C Technologies, Inc. | ||
5.50%, due 9/30/27 (c) | 2,675,000 | 2,621,607 |
Veritas US, Inc. | ||
7.50%, due 9/1/25 (c) | 3,525,000 | 3,106,406 |
29,133,826 | ||
16 | MainStay MacKay Short Duration High Yield Fund |
Principal Amount | Value | |
Corporate Bonds (continued) | ||
Telecommunications 5.9% | ||
Connect Finco SARL | ||
6.75%, due 10/1/26 (c) | $ 3,750,000 | $ 3,646,875 |
Hughes Satellite Systems Corp. | ||
6.625%, due 8/1/26 | 2,000,000 | 1,990,000 |
Level 3 Financing, Inc. | ||
5.375%, due 5/1/25 | 6,000,000 | 5,947,800 |
Lumen Technologies, Inc. | ||
Series W | ||
6.75%, due 12/1/23 | 6,000,000 | 6,097,500 |
Quebecor Media, Inc. | ||
5.75%, due 1/15/23 | 6,920,000 | 6,996,674 |
Sprint Corp. | ||
7.875%, due 9/15/23 | 29,145,000 | 30,602,250 |
T-Mobile US, Inc. | ||
2.25%, due 2/15/26 | 29,000,000 | 26,680,000 |
4.75%, due 2/1/28 | 7,555,000 | 7,454,103 |
5.375%, due 4/15/27 | 570,000 | 581,400 |
89,996,602 | ||
Toys, Games & Hobbies 0.7% | ||
Mattel, Inc. | ||
3.15%, due 3/15/23 | 3,760,000 | 3,741,200 |
3.375%, due 4/1/26 (c) | 2,269,000 | 2,206,602 |
5.875%, due 12/15/27 (c) | 3,890,000 | 3,979,470 |
9,927,272 | ||
Transportation 0.4% | ||
Watco Cos. LLC | ||
6.50%, due 6/15/27 (c) | 6,740,000 | 6,504,100 |
Total Corporate Bonds (Cost $1,164,861,462) | 1,130,151,853 | |
Loan Assignments 16.3% | ||
Aerospace & Defense 0.9% | ||
SkyMiles IP Ltd. | ||
Initial Term Loan | ||
4.75% (3 Month LIBOR + 3.75%), due 10/20/27 (d) | 4,500,000 | 4,644,374 |
TransDigm, Inc. | ||
Tranche Refinancing Term Loan F | ||
3.014% (1 Month LIBOR + 2.25%), due 12/9/25 (d) | 9,775,000 | 9,579,500 |
14,223,874 | ||
Principal Amount | Value | |
Automobile 0.7% | ||
Dealer Tire LLC | ||
Term Loan B1 | ||
5.014% (1 Month LIBOR + 4.25%), due 1/1/38 (d) | $ 4,105,500 | $ 4,091,816 |
Neenah Foundry Co. | ||
Term Loan | ||
9.00% (1 Month LIBOR + 8.00%), due 10/1/26 (a)(d)(i)(j) | 2,349,750 | 2,326,253 |
Tenneco, Inc. | ||
Tranche Term Loan B | ||
3.764% (1 Month LIBOR + 3.00%), due 10/1/25 (d) | 2,924,433 | 2,884,222 |
Wheel Pros, Inc. | ||
First Lien Initial Term Loan | ||
5.25% (1 Month LIBOR + 4.50%), due 5/11/28 (d) | 1,049,000 | 977,668 |
10,279,959 | ||
Banking 0.2% | ||
Jane Street Group LLC | ||
Dollar Term Loan | ||
3.514% (1 Month LIBOR + 2.75%), due 1/26/28 (d) | 2,487,406 | 2,456,935 |
Beverage, Food & Tobacco 0.5% | ||
B&G Foods, Inc. | ||
Tranche Term Loan B4 | ||
2.957% (1 Month LIBOR + 2.50%), due 10/10/26 (d) | 3,303,333 | 3,227,631 |
United Natural Foods, Inc. | ||
Initial Term Loan | ||
4.014% (1 Month LIBOR + 3.25%), due 10/22/25 (d) | 4,378,361 | 4,348,943 |
7,576,574 | ||
Chemicals 0.1% | ||
ASP Unifrax Holdings, Inc. | ||
First Lien USD Term Loan 4.733%-4.756% | ||
(3 Month LIBOR + 3.75%), due 12/12/25 (d) | 1,992,948 | 1,926,683 |
Chemicals, Plastics & Rubber 1.2% | ||
Innophos Holdings, Inc. | ||
Initial Term Loan | ||
4.514% (1 Month LIBOR + 3.75%), due 2/5/27 (d) | 4,214,000 | 4,187,663 |
Principal Amount | Value | |
Loan Assignments (continued) | ||
Chemicals, Plastics & Rubber (continued) | ||
Jazz Pharmaceuticals plc | ||
Initial Dollar Term Loan | ||
4.264% (1 Month LIBOR + 3.50%), due 5/5/28 (d) | $ 7,954,962 | $ 7,938,392 |
SCIH Salt Holdings, Inc. | ||
First Lien Incremental Term Loan B1 | ||
4.75% (3 Month LIBOR + 4.00%), due 3/16/27 (d) | 6,045,108 | 5,841,085 |
17,967,140 | ||
Construction & Buildings 0.1% | ||
Installed Building Products, Inc. | ||
Initial Term Loan | ||
3.014% (1 Month LIBOR + 2.25%), due 12/14/28 (d) | 1,396,500 | 1,391,961 |
Consumer Durables 0.3% | ||
Griffon Corp. | ||
Term Loan B | ||
3.267% (3 Month LIBOR + 2.75%), due 1/24/29 (d) | 4,000,000 | 3,960,000 |
Diversified/Conglomerate Service 0.3% | ||
Change Healthcare Holdings, Inc. | ||
Closing Date Term Loan | ||
3.50% (1 Month LIBOR + 2.50%), due 3/1/24 (d) | 4,510,854 | 4,499,577 |
Electronics 1.2% | ||
Camelot U.S. Acquisition 1 Co. (d) | ||
Initial Term Loan | ||
3.764% (1 Month LIBOR + 3.00%), due 10/30/26 | 9,147,239 | 9,044,332 |
Amendment No. 2 Incremental Term Loan | ||
4.00% (1 Month LIBOR + 3.00%), due 10/30/26 | 2,962,500 | 2,935,838 |
WEX, Inc. | ||
Term Loan B | ||
3.014% (1 Month LIBOR + 2.25%), due 3/31/28 (d) | 6,534,000 | 6,467,026 |
18,447,196 | ||
Principal Amount | Value | |
Entertainment 0.2% | ||
NAI Entertainment Holdings LLC | ||
Tranche Term Loan B | ||
3.50% (1 Month LIBOR + 2.50%), due 5/8/25 (d) | $ 3,261,667 | $ 3,200,510 |
Finance 1.2% | ||
AAdvantage Loyality IP Ltd. | ||
Initial Term Loan | ||
5.813% (3 Month LIBOR + 4.75%), due 4/20/28 (d) | 1,750,000 | 1,779,531 |
Cimpress plc | ||
Tranche Term Loan B1 | ||
4.264% (1 Month LIBOR + 3.50%), due 5/17/28 (d) | 4,962,500 | 4,904,603 |
Mileage Plus Holdings LLC | ||
Initial Term Loan | ||
6.25% (3 Month LIBOR + 5.25%), due 6/21/27 (d) | 2,500,000 | 2,590,313 |
Schweitzer-Mauduit International, Inc. | ||
Term Loan B | ||
4.563% (1 Month LIBOR + 3.75%), due 4/20/28 (d) | 3,324,875 | 3,258,377 |
Truck Hero, Inc. | ||
Initial Term Loan | ||
4.014% (1 Month LIBOR + 3.25%), due 1/31/28 (d) | 6,242,707 | 5,809,619 |
18,342,443 | ||
Healthcare & Pharmaceuticals 0.2% | ||
Owens & Minor, Inc. | ||
Term Loan B1 | ||
4.45% (1 Month LIBOR + 3.75%), due 3/29/29 (d) | 3,700,000 | 3,706,938 |
Healthcare, Education & Childcare 1.4% | ||
Catalent Pharma Solutions, Inc. | ||
2021 Incremental Dollar Term loan | ||
2.688% (1 Month LIBOR + 2.00%), due 2/22/28 (d) | 2,490,171 | 2,477,720 |
LifePoint Health, Inc. | ||
First Lien Term Loan B | ||
4.499% (1 Month LIBOR + 3.75%), due 11/16/25 (d) | 10,413,139 | 10,279,070 |
18 | MainStay MacKay Short Duration High Yield Fund |
Principal Amount | Value | |
Loan Assignments (continued) | ||
Healthcare, Education & Childcare (continued) | ||
Organon & Co. | ||
Dollar Term Loan | ||
3.563% (3 Month LIBOR + 3.00%), due 6/2/28 (d) | $ 8,677,500 | $ 8,625,973 |
21,382,763 | ||
Hotels, Motels, Inns & Gaming 0.8% | ||
Churchill Downs, Inc. (d) | ||
Facility Term Loan B | ||
2.77% (1 Month LIBOR + 2.00%), due 12/27/24 | 3,830,000 | 3,801,275 |
2021 Incremental Term Loan B | ||
2.77% (1 Month LIBOR + 2.00%), due 3/17/28 | 2,475,000 | 2,453,344 |
Four Seasons Holdings, Inc. | ||
First Lien 2013 Term Loan | ||
2.764% (1 Month LIBOR + 2.00%), due 11/30/23 (d) | 5,335,020 | 5,318,347 |
11,572,966 | ||
Insurance 0.6% | ||
USI, Inc. | ||
2017 New Term Loan | ||
4.006% (3 Month LIBOR + 3.00%), due 5/16/24 (d) | 9,853,373 | 9,754,839 |
Leisure, Amusement, Motion Pictures & Entertainment 0.1% | ||
NASCAR Holdings LLC | ||
Initial Term Loan | ||
3.264% (1 Month LIBOR + 2.50%), due 10/19/26 (d) | 2,102,404 | 2,090,936 |
Manufacturing 0.8% | ||
Adient U.S. LLC | ||
Term Loan B1 | ||
4.014% (1 Month LIBOR + 3.25%), due 4/10/28 (d) | 9,428,750 | 9,365,889 |
II-VI, Inc. | ||
Term Loan B | ||
TBD, due 12/8/28 | 3,200,000 | 3,183,200 |
12,549,089 | ||
Media 1.6% | ||
Block Communications, Inc. | ||
Term Loan | ||
3.256% (3 Month LIBOR + 2.25%), due 2/25/27 (d) | 11,515,000 | 11,303,896 |
Principal Amount | Value | |
Media (continued) | ||
DIRECTV Financing LLC | ||
Closing Date Term Loan | ||
5.764% (1 Month LIBOR + 5.00%), due 8/2/27 (d) | $ 7,449,000 | $ 7,413,304 |
Lamar Media Corp. | ||
Term Loan B | ||
2.054% (1 Month LIBOR + 1.50%), due 2/5/27 (d) | 5,000,000 | 4,967,190 |
23,684,390 | ||
Oil & Gas 0.7% | ||
Ascent Resources Utica Holdings LLC | ||
Second Lien Term Loan | ||
10.021% (3 Month LIBOR + 9.00%), due 11/1/25 (d) | 3,240,000 | 3,458,700 |
PetroQuest Energy LLC (a)(i) | ||
Term Loan | ||
TBD, due 1/1/28 | 300,000 | 300,000 |
Term Loan | ||
8.50% (8.50% PIK) (1 Month LIBOR + 7.50%), due 11/8/23 (b)(d)(j) | 3,546,500 | 2,837,200 |
2020 Term Loan | ||
8.50% (8.50% PIK), due 9/19/26 (b) | 229,079 | 229,079 |
TransMontaigne Operating Co. LP | ||
Tranche Term Loan B 4.00%-4.054% | ||
(1 Month LIBOR + 3.50%, 3 Month LIBOR + 3.50%), due 11/17/28 (d) | 2,992,500 | 2,976,290 |
9,801,269 | ||
Personal & Nondurable Consumer Products 0.2% | ||
Prestige Brands, Inc. | ||
Term Loan B5 | ||
2.50% (1 Month LIBOR + 2.00%), due 7/3/28 (d) | 3,200,000 | 3,191,110 |
Personal, Food & Miscellaneous Services 0.4% | ||
KFC Holding Co. | ||
2021 Term Loan B | ||
2.304% (1 Month LIBOR + 1.75%), due 3/15/28 (d) | 2,611,809 | 2,597,118 |
WW International, Inc. | ||
Initial Term Loan | ||
4.264% (1 Month LIBOR + 3.50%), due 4/13/28 (d) | 3,393,625 | 3,035,879 |
5,632,997 | ||
Principal Amount | Value | |
Loan Assignments (continued) | ||
Pharmaceuticals 0.1% | ||
Bausch Health Cos., Inc. | ||
First Incremental Term Loan | ||
3.207% (1 Month LIBOR + 2.75%), due 11/27/25 (d) | $ 2,200,000 | $ 2,186,250 |
Retail 1.1% | ||
Great Outdoors Group LLC | ||
Term Loan B2 | ||
4.514% (1 Month LIBOR + 3.75%), due 3/6/28 (d) | 16,301,813 | 16,118,417 |
Telecommunications 0.6% | ||
Connect Finco SARL | ||
Amendement No.1 Refinancing Term Loan | ||
4.50% (1 Month LIBOR + 3.50%), due 12/11/26 (d) | 8,722,000 | 8,660,222 |
Utilities 0.8% | ||
Constellation Renewables LLC | ||
Term Loan | ||
3.50% (3 Month LIBOR + 2.50%), due 12/15/27 (d) | 2,932,489 | 2,920,117 |
PG&E Corp. | ||
Term Loan | ||
3.813% (1 Month LIBOR + 3.00%), due 6/23/25 (d) | 9,299,015 | 9,163,407 |
12,083,524 | ||
Total Loan Assignments (Cost $248,502,801) | 246,688,562 | |
Total Long-Term Bonds (Cost $1,440,729,020) | 1,405,796,927 | |
Shares | ||
Common Stocks 1.4% | ||
Electrical Equipment 0.1% | ||
Energy Technologies, Inc. (a)(i)(j)(m) | 2,021 | 2,273,625 |
Hotels, Restaurants & Leisure 0.6% | ||
Carlson Travel, Inc. (a)(h)(m) | 300,593 | 8,379,030 |
Carlson Travel, Inc. (h)(i)(j)(m) | 3,199 | — |
8,379,030 | ||
Shares | Value | |
Independent Power and Renewable Electricity Producers 0.1% | ||
GenOn Energy, Inc. (h)(i) | 20,915 | $ 2,196,075 |
Oil, Gas & Consumable Fuels 0.6% | ||
Gulfport Energy Corp. (m) | 77,718 | 7,303,937 |
PetroQuest Energy, Inc. (a)(i)(j)(m) | 1,186,631 | — |
Talos Energy, Inc. (m) | 91,517 | 1,662,864 |
8,966,801 | ||
Total Common Stocks (Cost $19,838,261) | 21,815,531 | |
Preferred Stocks 0.3% | ||
Electrical Equipment 0.3% | ||
Energy Technologies Ltd. (a)(i)(j)(m) | 4,501 | 3,735,830 |
Oil, Gas & Consumable Fuels 0.0% ‡ | ||
Gulfport Energy Operating Corp., 10.00%(10.00% Cash or 15.00% PIK) (a)(b)(h)(i)(j) | 9 | 55,931 |
Total Preferred Stocks (Cost $4,304,472) | 3,791,761 | |
Total Investments (Cost $1,464,871,753) | 94.6% | 1,431,404,219 |
Other Assets, Less Liabilities | 5.4 | 82,424,734 |
Net Assets | 100.0% | $ 1,513,828,953 |
† | Percentages indicated are based on Fund net assets. |
‡ | Less than one-tenth of a percent. |
(a) | Illiquid security—As of April 30, 2022, the total market value deemed illiquid under procedures approved by the Board of Trustees was $24,932,248, which represented 1.6% of the Fund’s net assets. |
(b) | PIK ("Payment-in-Kind")—issuer may pay interest or dividends with additional securities and/or in cash. |
(c) | May be sold to institutional investors only under Rule 144A or securities offered pursuant to Section 4(a)(2) of the Securities Act of 1933, as amended. |
(d) | Floating rate—Rate shown was the rate in effect as of April 30, 2022. |
(e) | Security is perpetual and, thus, does not have a predetermined maturity date. The date shown, if applicable, reflects the next call date. |
(f) | Step coupon—Rate shown was the rate in effect as of April 30, 2022. |
(g) | Issue in non-accrual status. |
(h) | Restricted security. (See Note 5) |
20 | MainStay MacKay Short Duration High Yield Fund |
(i) | Fair valued security—Represents fair value as measured in good faith under procedures approved by the Board of Trustees. As of April 30, 2022, the total market value was $16,953,993, which represented 1.1% of the Fund’s net assets. |
(j) | Security in which significant unobservable inputs (Level 3) were used in determining fair value. |
(k) | Fixed to floating rate—Rate shown was the rate in effect as of April 30, 2022. |
(l) | Issue in default. |
(m) | Non-income producing security. |
Abbreviation(s): |
LIBOR—London Interbank Offered Rate |
TBD—To Be Determined |
USD—United States Dollar |
Description | Quoted Prices in Active Markets for Identical Assets (Level 1) | Significant Other Observable Inputs (Level 2) | Significant Unobservable Inputs (Level 3) | Total |
Asset Valuation Inputs | ||||
Investments in Securities (a) | ||||
Long-Term Bonds | ||||
Convertible Bonds | $ — | $ 28,956,512 | $ — | $ 28,956,512 |
Corporate Bonds | — | 1,127,151,853 | 3,000,000 | 1,130,151,853 |
Loan Assignments | — | 241,525,109 | 5,163,453 | 246,688,562 |
Total Long-Term Bonds | — | 1,397,633,474 | 8,163,453 | 1,405,796,927 |
Common Stocks | 8,966,801 | 10,575,105 | 2,273,625 | 21,815,531 |
Preferred Stocks | — | — | 3,791,761 | 3,791,761 |
Total Investments in Securities | $ 8,966,801 | $ 1,408,208,579 | $ 14,228,839 | $ 1,431,404,219 |
(a) | For a complete listing of investments and their industries, see the Portfolio of Investments. |
Assets | |
Investment in securities, at value (identified cost $1,464,871,753) | $1,431,404,219 |
Cash | 68,294,991 |
Receivables: | |
Interest | 19,391,426 |
Fund shares sold | 8,056,406 |
Investment securities sold | 1,043,550 |
Other assets | 80,550 |
Total assets | 1,528,271,142 |
Liabilities | |
Payables: | |
Investment securities purchased | 10,592,578 |
Fund shares redeemed | 2,173,085 |
Manager (See Note 3) | 808,415 |
Transfer agent (See Note 3) | 186,999 |
NYLIFE Distributors (See Note 3) | 88,896 |
Shareholder communication | 45,820 |
Professional fees | 24,192 |
Custodian | 16,086 |
Trustees | 3,861 |
Distributions payable | 502,257 |
Total liabilities | 14,442,189 |
Net assets | $1,513,828,953 |
Composition of Net Assets | |
Shares of beneficial interest outstanding (par value of $.001 per share) unlimited number of shares authorized | $160,130 |
Additional paid-in-capital | 1,601,378,542 |
1,601,538,672 | |
Total distributable earnings (loss) | (87,709,719) |
Net assets | $1,513,828,953 |
Class A | |
Net assets applicable to outstanding shares | $303,528,237 |
Shares of beneficial interest outstanding | 32,112,610 |
Net asset value per share outstanding | $9.45 |
Maximum sales charge (3.00% of offering price) | 0.29 |
Maximum offering price per share outstanding | $9.74 |
Investor Class | |
Net assets applicable to outstanding shares | $5,559,065 |
Shares of beneficial interest outstanding | 588,064 |
Net asset value per share outstanding | $9.45 |
Maximum sales charge (2.50% of offering price) | 0.24 |
Maximum offering price per share outstanding | $9.69 |
Class C | |
Net assets applicable to outstanding shares | $29,698,638 |
Shares of beneficial interest outstanding | 3,142,678 |
Net asset value and offering price per share outstanding | $9.45 |
Class I | |
Net assets applicable to outstanding shares | $1,174,398,717 |
Shares of beneficial interest outstanding | 124,218,662 |
Net asset value and offering price per share outstanding | $9.45 |
Class R2 | |
Net assets applicable to outstanding shares | $490,057 |
Shares of beneficial interest outstanding | 51,855 |
Net asset value and offering price per share outstanding | $9.45 |
Class R3 | |
Net assets applicable to outstanding shares | $154,239 |
Shares of beneficial interest outstanding | 16,317 |
Net asset value and offering price per share outstanding | $9.45 |
22 | MainStay MacKay Short Duration High Yield Fund |
Investment Income (Loss) | |
Income | |
Interest | $34,329,468 |
Other | 46,459 |
Total income | 34,375,927 |
Expenses | |
Manager (See Note 3) | 4,875,174 |
Transfer agent (See Note 3) | 606,791 |
Distribution/Service—Class A (See Note 3) | 379,046 |
Distribution/Service—Investor Class (See Note 3) | 7,151 |
Distribution/Service—Class C (See Note 3) | 163,279 |
Distribution/Service—Class R2 (See Note 3) | 622 |
Distribution/Service—Class R3 (See Note 3) | 388 |
Registration | 65,854 |
Professional fees | 64,188 |
Shareholder communication | 39,656 |
Custodian | 22,859 |
Trustees | 16,622 |
Shareholder service (See Note 3) | 326 |
Miscellaneous | 28,266 |
Total expenses | 6,270,222 |
Net investment income (loss) | 28,105,705 |
Realized and Unrealized Gain (Loss) | |
Net realized gain (loss) on investments | 4,610,176 |
Net change in unrealized appreciation (depreciation) on investments | (64,435,939) |
Net realized and unrealized gain (loss) | (59,825,763) |
Net increase (decrease) in net assets resulting from operations | $(31,720,058) |
for the six months ended April 30, 2022 (Unaudited) and the year ended October 31, 2021
2022 | 2021 | |
Increase (Decrease) in Net Assets | ||
Operations: | ||
Net investment income (loss) | $28,105,705 | $60,401,260 |
Net realized gain (loss) | 4,610,176 | 1,838,672 |
Net change in unrealized appreciation (depreciation) | (64,435,939) | 60,074,865 |
Net increase (decrease) in net assets resulting from operations | (31,720,058) | 122,314,797 |
Distributions to shareholders: | ||
Class A | (5,585,158) | (11,650,467) |
Investor Class | (102,601) | (245,169) |
Class C | (456,302) | (1,236,855) |
Class I | (22,589,838) | (51,314,390) |
Class R2 | (8,898) | (20,875) |
Class R3 | (2,584) | (5,564) |
(28,745,381) | (64,473,320) | |
Distributions to shareholders from return of capital: | ||
Class A | — | (98,233) |
Investor Class | — | (2,067) |
Class C | — | (10,429) |
Class I | — | (432,668) |
Class R2 | — | (176) |
Class R3 | — | (47) |
— | (543,620) | |
Total distributions to shareholders | (28,745,381) | (65,016,940) |
Capital share transactions: | ||
Net proceeds from sales of shares | 406,825,802 | 606,008,870 |
Net asset value of shares issued to shareholders in reinvestment of distributions | 25,525,629 | 58,664,287 |
Cost of shares redeemed | (351,071,984) | (630,696,309) |
Increase (decrease) in net assets derived from capital share transactions | 81,279,447 | 33,976,848 |
Net increase (decrease) in net assets | 20,814,008 | 91,274,705 |
Net Assets | ||
Beginning of period | 1,493,014,945 | 1,401,740,240 |
End of period | $1,513,828,953 | $1,493,014,945 |
24 | MainStay MacKay Short Duration High Yield Fund |
Six months ended April 30, 2022* | Year Ended October 31, | |||||
Class A | 2021 | 2020 | 2019 | 2018 | 2017 | |
Net asset value at beginning of period | $9.83 | $9.45 | $9.84 | $9.76 | $9.96 | $9.90 |
Net investment income (loss) | 0.17(a) | 0.37(a) | 0.42 | 0.44 | 0.42 | 0.42 |
Net realized and unrealized gain (loss) | (0.37) | 0.42 | (0.37) | 0.08 | (0.21) | 0.06 |
Total from investment operations | (0.20) | 0.79 | 0.05 | 0.52 | 0.21 | 0.48 |
Less distributions: | ||||||
From net investment income | (0.18) | (0.41) | (0.44) | (0.44) | (0.41) | (0.42) |
Return of capital | — | (0.00)‡ | — | — | — | — |
Total distributions | (0.18) | (0.41) | (0.44) | (0.44) | (0.41) | (0.42) |
Net asset value at end of period | $9.45 | $9.83 | $9.45 | $9.84 | $9.76 | $9.96 |
Total investment return (b) | (2.09)% | 8.40% | 0.65% | 5.40% | 2.09% | 4.90% |
Ratios (to average net assets)/Supplemental Data: | ||||||
Net investment income (loss) | 3.57%†† | 3.78% | 4.46% | 4.48% | 4.06% | 4.18% |
Net expenses (c) | 1.01%†† | 1.01% | 1.02% | 1.04% | 1.05% | 1.04% |
Expenses (before waiver/reimbursement) (c) | 1.01%†† | 1.01% | 1.02% | 1.04% | 1.07% | 1.04% |
Portfolio turnover rate | 15% | 47% | 64% | 32% | 62% | 57% |
Net assets at end of period (in 000’s) | $303,528 | $303,646 | $252,753 | $237,475 | $180,140 | $341,056 |
* | Unaudited. |
‡ | Less than one cent per share. |
†† | Annualized. |
(a) | Per share data based on average shares outstanding during the period. |
(b) | Total investment return is calculated exclusive of sales charges and assumes the reinvestment of dividends and distributions. For periods of less than one year, total return is not annualized. |
(c) | In addition to the fees and expenses which the Fund bears directly, it also indirectly bears a pro-rata share of the fees and expenses of the underlying funds in which it invests. Such indirect expenses are not included in the above expense ratios. |
Six months ended April 30, 2022* | Year Ended October 31, | |||||
Investor Class | 2021 | 2020 | 2019 | 2018 | 2017 | |
Net asset value at beginning of period | $9.83 | $9.46 | $9.84 | $9.76 | $9.96 | $9.90 |
Net investment income (loss) | 0.17(a) | 0.37(a) | 0.42 | 0.43 | 0.40 | 0.41 |
Net realized and unrealized gain (loss) | (0.38) | 0.40 | (0.36) | 0.08 | (0.20) | 0.06 |
Total from investment operations | (0.21) | 0.77 | 0.06 | 0.51 | 0.20 | 0.47 |
Less distributions: | ||||||
From net investment income | (0.17) | (0.40) | (0.44) | (0.43) | (0.40) | (0.41) |
Return of capital | — | (0.00)‡ | — | — | — | — |
Total distributions | (0.17) | (0.40) | (0.44) | (0.43) | (0.40) | (0.41) |
Net asset value at end of period | $9.45 | $9.83 | $9.46 | $9.84 | $9.76 | $9.96 |
Total investment return (b) | (2.13)% | 8.18% | 0.67% | 5.33% | 2.05% | 4.82% |
Ratios (to average net assets)/Supplemental Data: | ||||||
Net investment income (loss) | 3.46%†† | 3.72% | 4.38% | 4.40% | 4.03% | 4.16% |
Net expenses (c) | 1.10%†† | 1.10% | 1.11% | 1.11% | 1.09% | 1.11% |
Expenses (before waiver/reimbursement) (c) | 1.10%†† | 1.10% | 1.11% | 1.11% | 1.11% | 1.11% |
Portfolio turnover rate | 15% | 47% | 64% | 32% | 62% | 57% |
Net assets at end of period (in 000's) | $5,559 | $5,780 | $6,278 | $7,156 | $6,193 | $5,564 |
* | Unaudited. |
‡ | Less than one cent per share. |
†† | Annualized. |
(a) | Per share data based on average shares outstanding during the period. |
(b) | Total investment return is calculated exclusive of sales charges and assumes the reinvestment of dividends and distributions. For periods of less than one year, total return is not annualized. |
(c) | In addition to the fees and expenses which the Fund bears directly, it also indirectly bears a pro-rata share of the fees and expenses of the underlying funds in which it invests. Such indirect expenses are not included in the above expense ratios. |
26 | MainStay MacKay Short Duration High Yield Fund |
Six months ended April 30, 2022* | Year Ended October 31, | |||||
Class C | 2021 | 2020 | 2019 | 2018 | 2017 | |
Net asset value at beginning of period | $9.83 | $9.45 | $9.84 | $9.76 | $9.96 | $9.90 |
Net investment income (loss) | 0.13(a) | 0.29(a) | 0.34 | 0.36 | 0.32 | 0.34 |
Net realized and unrealized gain (loss) | (0.37) | 0.41 | (0.37) | 0.08 | (0.19) | 0.05 |
Total from investment operations | (0.24) | 0.70 | (0.03) | 0.44 | 0.13 | 0.39 |
Less distributions: | ||||||
From net investment income | (0.14) | (0.32) | (0.36) | (0.36) | (0.33) | (0.33) |
Return of capital | — | (0.00)‡ | — | — | — | — |
Total distributions | (0.14) | (0.32) | (0.36) | (0.36) | (0.33) | (0.33) |
Net asset value at end of period | $9.45 | $9.83 | $9.45 | $9.84 | $9.76 | $9.96 |
Total investment return (b) | (2.50)% | 7.48% | (0.19)% | 4.54% | 1.29% | 4.04% |
Ratios (to average net assets)/Supplemental Data: | ||||||
Net investment income (loss) | 2.73%†† | 2.98% | 3.64% | 3.65% | 3.28% | 3.42% |
Net expenses (c) | 1.85%†† | 1.85% | 1.86% | 1.86% | 1.84% | 1.86% |
Expenses (before waiver/reimbursement) (c) | 1.85%†† | 1.85% | 1.86% | 1.86% | 1.86% | 1.86% |
Portfolio turnover rate | 15% | 47% | 64% | 32% | 62% | 57% |
Net assets at end of period (in 000’s) | $29,699 | $35,636 | $40,948 | $48,550 | $48,415 | $51,738 |
* | Unaudited. |
‡ | Less than one cent per share. |
†† | Annualized. |
(a) | Per share data based on average shares outstanding during the period. |
(b) | Total investment return is calculated exclusive of sales charges and assumes the reinvestment of dividends and distributions. For periods of less than one year, total return is not annualized. |
(c) | In addition to the fees and expenses which the Fund bears directly, it also indirectly bears a pro-rata share of the fees and expenses of the underlying funds in which it invests. Such indirect expenses are not included in the above expense ratios. |
Six months ended April 30, 2022* | Year Ended October 31, | |||||
Class I | 2021 | 2020 | 2019 | 2018 | 2017 | |
Net asset value at beginning of period | $9.84 | $9.46 | $9.84 | $9.76 | $9.97 | $9.90 |
Net investment income (loss) | 0.18(a) | 0.40(a) | 0.45 | 0.46 | 0.43 | 0.44 |
Net realized and unrealized gain (loss) | (0.38) | 0.41 | (0.36) | 0.08 | (0.21) | 0.07 |
Total from investment operations | (0.20) | 0.81 | 0.09 | 0.54 | 0.22 | 0.51 |
Less distributions: | ||||||
From net investment income | (0.19) | (0.43) | (0.47) | (0.46) | (0.43) | (0.44) |
Return of capital | — | (0.00)‡ | — | — | — | — |
Total distributions | (0.19) | (0.43) | (0.47) | (0.46) | (0.43) | (0.44) |
Net asset value at end of period | $9.45 | $9.84 | $9.46 | $9.84 | $9.76 | $9.97 |
Total investment return (b) | (2.07)% | 8.66% | 1.01% | 5.67% | 2.26% | 5.27% |
Ratios (to average net assets)/Supplemental Data: | ||||||
Net investment income (loss) | 3.82%†† | 4.05% | 4.72% | 4.73% | 4.31% | 4.46% |
Net expenses (c) | 0.76%†† | 0.76% | 0.77% | 0.79% | 0.80% | 0.79% |
Expenses (before waiver/reimbursement) (c) | 0.76%†† | 0.76% | 0.77% | 0.79% | 0.82% | 0.79% |
Portfolio turnover rate | 15% | 47% | 64% | 32% | 62% | 57% |
Net assets at end of period (in 000’s) | $1,174,399 | $1,147,287 | $1,101,084 | $1,268,856 | $771,533 | $626,617 |
* | Unaudited. |
‡ | Less than one cent per share. |
†† | Annualized. |
(a) | Per share data based on average shares outstanding during the period. |
(b) | Total investment return is calculated exclusive of sales charges and assumes the reinvestment of dividends and distributions. Class I shares are not subject to sales charges. For periods of less than one year, total return is not annualized. |
(c) | In addition to the fees and expenses which the Fund bears directly, it also indirectly bears a pro-rata share of the fees and expenses of the underlying funds in which it invests. Such indirect expenses are not included in the above expense ratios. |
28 | MainStay MacKay Short Duration High Yield Fund |
Six months ended April 30, 2022* | Year Ended October 31, | |||||
Class R2 | 2021 | 2020 | 2019 | 2018 | 2017 | |
Net asset value at beginning of period | $9.83 | $9.45 | $9.84 | $9.76 | $9.96 | $9.90 |
Net investment income (loss) | 0.17(a) | 0.36(a) | 0.41 | 0.40 | 0.39 | 0.41 |
Net realized and unrealized gain (loss) | (0.38) | 0.41 | (0.37) | 0.11 | (0.20) | 0.06 |
Total from investment operations | (0.21) | 0.77 | 0.04 | 0.51 | 0.19 | 0.47 |
Less distributions: | ||||||
From net investment income | (0.17) | (0.39) | (0.43) | (0.43) | (0.39) | (0.41) |
Return of capital | — | (0.00)‡ | — | — | — | — |
Total distributions | (0.17) | (0.39) | (0.43) | (0.43) | (0.39) | (0.41) |
Net asset value at end of period | $9.45 | $9.83 | $9.45 | $9.84 | $9.76 | $9.96 |
Total investment return (b) | (2.14)% | 8.29% | 0.55% | 5.31% | 1.99% | 4.80% |
Ratios (to average net assets)/Supplemental Data: | ||||||
Net investment income (loss) | 3.47%†† | 3.71% | 4.36% | 4.34% | 3.97% | 4.14% |
Net expenses (c) | 1.11%†† | 1.11% | 1.12% | 1.14% | 1.15% | 1.14% |
Expenses (before waiver/reimbursement) (c) | 1.11%†† | 1.11% | 1.12% | 1.14% | 1.17% | 1.14% |
Portfolio turnover rate | 15% | 47% | 64% | 32% | 62% | 57% |
Net assets at end of period (in 000’s) | $490 | $508 | $523 | $538 | $63 | $119 |
* | Unaudited. |
‡ | Less than one cent per share. |
†† | Annualized. |
(a) | Per share data based on average shares outstanding during the period. |
(b) | Total investment return is calculated exclusive of sales charges and assumes the reinvestment of dividends and distributions. Class R2 shares are not subject to sales charges. For periods of less than one year, total return is not annualized. |
(c) | In addition to the fees and expenses which the Fund bears directly, it also indirectly bears a pro-rata share of the fees and expenses of the underlying funds in which it invests. Such indirect expenses are not included in the above expense ratios. |
Six months ended April 30, 2022* | Year Ended October 31, | |||||
Class R3 | 2021 | 2020 | 2019 | 2018 | 2017 | |
Net asset value at beginning of period | $9.83 | $9.46 | $9.84 | $9.76 | $9.97 | $9.91 |
Net investment income (loss) | 0.15(a) | 0.34(a) | 0.40 | 0.39 | 0.37 | 0.38 |
Net realized and unrealized gain (loss) | (0.37) | 0.40 | (0.37) | 0.09 | (0.21) | 0.06 |
Total from investment operations | (0.22) | 0.74 | 0.03 | 0.48 | 0.16 | 0.44 |
Less distributions: | ||||||
From net investment income | (0.16) | (0.37) | (0.41) | (0.40) | (0.37) | (0.38) |
Return of capital | — | (0.00)‡ | — | — | — | — |
Total distributions | (0.16) | (0.37) | (0.41) | (0.40) | (0.37) | (0.38) |
Net asset value at end of period | $9.45 | $9.83 | $9.46 | $9.84 | $9.76 | $9.97 |
Total investment return (b) | (2.26)% | 7.89% | 0.41% | 5.05% | 1.61% | 4.54% |
Ratios (to average net assets)/Supplemental Data: | ||||||
Net investment income (loss) | 3.22%†† | 3.45% | 4.13% | 4.12% | 3.72% | 3.86% |
Net expenses (c) | 1.36%†† | 1.36% | 1.36% | 1.39% | 1.40% | 1.39% |
Expenses (before waiver/reimbursement) (c) | 1.36%†† | 1.36% | 1.36% | 1.39% | 1.42% | 1.39% |
Portfolio turnover rate | 15% | 47% | 64% | 32% | 62% | 57% |
Net assets at end of period (in 000’s) | $154 | $158 | $154 | $201 | $58 | $55 |
* | Unaudited. |
‡ | Less than one cent per share. |
†† | Annualized. |
(a) | Per share data based on average shares outstanding during the period. |
(b) | Total investment return is calculated exclusive of sales charges and assumes the reinvestment of dividends and distributions. Class R3 shares are not subject to sales charges. For periods of less than one year, total return is not annualized. |
(c) | In addition to the fees and expenses which the Fund bears directly, it also indirectly bears a pro-rata share of the fees and expenses of the underlying funds in which it invests. Such indirect expenses are not included in the above expense ratios. |
30 | MainStay MacKay Short Duration High Yield Fund |
Class | Commenced Operations |
Class A | December 17, 2012 |
Investor Class | December 17, 2012 |
Class C | December 17, 2012 |
Class I | December 17, 2012 |
Class R2 | December 17, 2012 |
Class R3 | February 29, 2016 |
Class R6 | N/A* |
SIMPLE Class | N/A* |
* | Class R6 shares were registered for sale effective as of February 28, 2017 and SIMPLE Class shares were registered for sale effective as of August 31, 2020 but have not yet commenced operations. |
• Benchmark yields | • Reported trades |
• Broker/dealer quotes | • Issuer spreads |
• Two-sided markets | • Benchmark securities |
• Bids/offers | • Reference data (corporate actions or material event notices) |
• Industry and economic events | • Comparable bonds |
• Monthly payment information |
32 | MainStay MacKay Short Duration High Yield Fund |
34 | MainStay MacKay Short Duration High Yield Fund |
Class R2 | $249 |
Class R3 | 77 |
Class | Expense | Waived |
Class A | $119,270 | $— |
Investor Class | 4,751 | — |
Class C | 27,106 | — |
Class I | 455,407 | — |
Class R2 | 196 | — |
Class R3 | 61 | — |
36 | MainStay MacKay Short Duration High Yield Fund |
Class A | $5,739,560 | 1.9% |
Class I | 6,592,347 | 0.6 |
Class R2 | 35,368 | 7.2 |
Class R3 | 32,654 | 21.2 |
Federal Tax Cost | Gross Unrealized Appreciation | Gross Unrealized (Depreciation) | Net Unrealized Appreciation/ (Depreciation) | |
Investments in Securities | $1,465,572,411 | $16,241,507 | $(50,409,699) | $(34,168,192) |
Capital Loss Available Through | Short-Term Capital Loss Amounts (000’s) | Long-Term Capital Loss Amounts (000’s) |
Unlimited | $20,864 | $35,468 |
2021 | |
Distributions paid from: | |
Ordinary Income | $64,473,320 |
Return of Capital | 543,620 |
Total | $65,016,940 |
Security | Date(s) of Acquisition | Principal Amount/ Shares | Cost | 4/30/22 Value | Percent of Net Assets |
Briggs & Stratton Corp. Escrow Claim Shares | |||||
Corporate Bond 6.875%, due 12/15/20 | 2/26/21 | $ 3,425,000 | $ 3,724,482 | $ 34,250 | 0.0%‡ |
Carlson Travel, Inc. | |||||
Common Stock | 9/4/20-11/17/2021 | 303,792 | 7,618,700 | 8,379,030 | 0.6 |
GenOn Energy, Inc. | |||||
Common Stock | 12/14/2018 | 20,915 | 2,342,005 | 2,196,075 | 0.1 |
Gulfport Energy Operating Corp. | |||||
Preferred Stock | 8/2/21 | 9 | 9,000 | 55,931 | 0.0‡ |
Sterling Entertainment Enterprises LLC | |||||
Corporate Bond 10.25%, due 1/15/25 | 12/28/17 | $3,000,000 | 2,978,791 | 3,000,000 | 0.2 |
Total | $16,672,978 | $ 13,665,286 | 0.9% | ||
‡ | Less than one-tenth of a percent. |
Class A | Shares | Amount |
Six-month period ended April 30, 2022: | ||
Shares sold | 5,581,445 | $54,225,064 |
Shares issued to shareholders in reinvestment of distributions | 525,495 | 5,065,343 |
Shares redeemed | (4,950,404) | (48,070,809) |
Net increase (decrease) in shares outstanding before conversion | 1,156,536 | 11,219,598 |
Shares converted into Class A (See Note 1) | 108,759 | 1,056,163 |
Shares converted from Class A (See Note 1) | (31,835) | (304,102) |
Net increase (decrease) | 1,233,460 | $11,971,659 |
Year ended October 31, 2021: | ||
Shares sold | 11,422,448 | $112,383,723 |
Shares issued to shareholders in reinvestment of distributions | 1,081,072 | 10,611,900 |
Shares redeemed | (8,609,366) | (84,625,893) |
Net increase (decrease) in shares outstanding before conversion | 3,894,154 | 38,369,730 |
Shares converted into Class A (See Note 1) | 256,440 | 2,523,351 |
Shares converted from Class A (See Note 1) | (6,174) | (60,255) |
Net increase (decrease) | 4,144,420 | $40,832,826 |
38 | MainStay MacKay Short Duration High Yield Fund |
Investor Class | Shares | Amount |
Six-month period ended April 30, 2022: | ||
Shares sold | 83,449 | $812,514 |
Shares issued to shareholders in reinvestment of distributions | 10,349 | 99,774 |
Shares redeemed | (41,748) | (404,232) |
Net increase (decrease) in shares outstanding before conversion | 52,050 | 508,056 |
Shares converted into Investor Class (See Note 1) | 11,968 | 115,140 |
Shares converted from Investor Class (See Note 1) | (63,662) | (619,272) |
Net increase (decrease) | 356 | $3,924 |
Year ended October 31, 2021: | ||
Shares sold | 125,366 | $1,231,649 |
Shares issued to shareholders in reinvestment of distributions | 24,316 | 238,519 |
Shares redeemed | (109,279) | (1,072,920) |
Net increase (decrease) in shares outstanding before conversion | 40,403 | 397,248 |
Shares converted into Investor Class (See Note 1) | 26,156 | 256,882 |
Shares converted from Investor Class (See Note 1) | (142,642) | (1,401,817) |
Net increase (decrease) | (76,083) | $(747,687) |
Class C | Shares | Amount |
Six-month period ended April 30, 2022: | ||
Shares sold | 144,903 | $1,407,859 |
Shares issued to shareholders in reinvestment of distributions | 39,579 | 381,757 |
Shares redeemed | (608,719) | (5,895,809) |
Net increase (decrease) in shares outstanding before conversion | (424,237) | (4,106,193) |
Shares converted from Class C (See Note 1) | (57,929) | (560,118) |
Net increase (decrease) | (482,166) | $(4,666,311) |
Year ended October 31, 2021: | ||
Shares sold | 731,242 | $7,190,890 |
Shares issued to shareholders in reinvestment of distributions | 110,728 | 1,085,653 |
Shares redeemed | (1,411,601) | (13,863,092) |
Net increase (decrease) in shares outstanding before conversion | (569,631) | (5,586,549) |
Shares converted from Class C (See Note 1) | (137,877) | (1,357,747) |
Net increase (decrease) | (707,508) | $(6,944,296) |
Class I | Shares | Amount |
Six-month period ended April 30, 2022: | ||
Shares sold | 36,133,504 | $350,379,827 |
Shares issued to shareholders in reinvestment of distributions | 2,071,817 | 19,967,273 |
Shares redeemed | (30,663,194) | (296,693,084) |
Net increase (decrease) in shares outstanding before conversion | 7,542,127 | 73,654,016 |
Shares converted into Class I (See Note 1) | 32,657 | 312,189 |
Net increase (decrease) | 7,574,784 | $73,966,205 |
Year ended October 31, 2021: | ||
Shares sold | 49,369,096 | $485,164,928 |
Shares issued to shareholders in reinvestment of distributions | 4,758,187 | 46,701,553 |
Shares redeemed | (53,916,155) | (531,045,127) |
Net increase (decrease) in shares outstanding before conversion | 211,128 | 821,354 |
Shares converted into Class I (See Note 1) | 5,350 | 52,504 |
Net increase (decrease) | 216,478 | $873,858 |
Class R2 | Shares | Amount |
Six-month period ended April 30, 2022: | ||
Shares sold | 55 | $538 |
Shares issued to shareholders in reinvestment of distributions | 923 | 8,898 |
Shares redeemed | (835) | (8,050) |
Net increase (decrease) | 143 | $1,386 |
Year ended October 31, 2021: | ||
Shares sold | 558 | $5,450 |
Shares issued to shareholders in reinvestment of distributions | 2,146 | 21,051 |
Shares redeemed | (4,981) | (49,010) |
Net increase (decrease) in shares outstanding before conversion | (2,277) | (22,509) |
Shares converted from Class R2 (See Note 1) | (1,315) | (12,918) |
Net increase (decrease) | (3,592) | $(35,427) |
Class R3 | Shares | Amount |
Six-month period ended April 30, 2022: | ||
Shares issued to shareholders in reinvestment of distributions | 268 | $2,584 |
Net increase (decrease) | 268 | $2,584 |
Year ended October 31, 2021: | ||
Shares sold | 3,265 | $32,230 |
Shares issued to shareholders in reinvestment of distributions | 572 | 5,611 |
Shares redeemed | (4,088) | (40,267) |
Net increase (decrease) | (251) | $(2,426) |
40 | MainStay MacKay Short Duration High Yield Fund |
42 | MainStay MacKay Short Duration High Yield Fund |
44 | MainStay MacKay Short Duration High Yield Fund |
46 | MainStay MacKay Short Duration High Yield Fund |
For more information
Message from the President and Semiannual Report
please log in to newyorklifeinvestments.com/accounts.
Not FDIC/NCUA Insured | Not a Deposit | May Lose Value | No Bank Guarantee | Not Insured by Any Government Agency |


5 | |
9 | |
11 | |
24 | |
38 | |
50 | |
54 | |
55 | |
55 |
Investors should refer to the Fund’s Summary Prospectus and/or Prospectus and consider the Fund’s investment objectives, strategies, risks, charges and expenses carefully before investing. The Summary Prospectus and/or Prospectus contain this and other information about the Fund. You may obtain copies of the Fund’s Summary Prospectus, Prospectus and Statement of Additional Information, which includes information about MainStay Funds Trust's Trustees, free of charge, upon request, by calling toll-free 800-624-6782, by writing to NYLIFE Distributors LLC, Attn: MainStay Marketing Department, 30 Hudson Street, Jersey City, NJ 07302 or by sending an e-mail to MainStayShareholderServices@nylim.com. These documents are also available via the MainStay Funds’ website at newyorklifeinvestments.com. Please read the Fund’s Summary Prospectus and/or Prospectus carefully before investing.
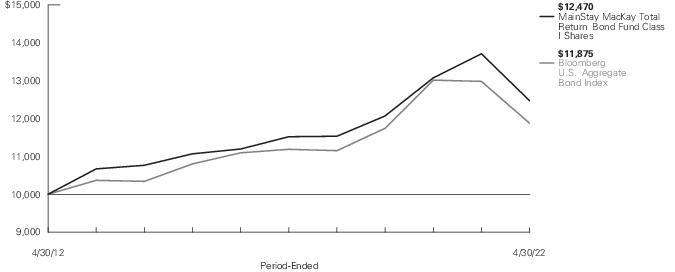
Average Annual Total Returns for the Period-Ended April 30, 2022 | ||||||||
Class | Sales Charge | Inception Date | Six Months1 | One Year | Five Years | Ten Years or Since Inception | Gross Expense Ratio2 | |
Class A Shares | Maximum 4.5% Initial Sales Charge | With sales charges | 1/2/2004 | -14.63% | -13.35% | 0.37% | 1.44% | 0.79% |
Excluding sales charges | -10.61 | -9.27 | 1.30 | 1.91 | 0.79 | |||
Investor Class Shares3 | Maximum 4% Initial Sales Charge | With sales charges | 2/28/2008 | -14.23 | -13.07 | 0.21 | 1.34 | 1.00 |
Excluding sales charges | -10.66 | -9.44 | 1.14 | 1.81 | 1.00 | |||
Class B Shares4 | Maximum 5% CDSC | With sales charges | 1/2/2004 | -15.31 | -14.45 | 0.02 | 1.05 | 1.75 |
if Redeemed Within the First Six Years of Purchase | Excluding sales charges | -11.04 | -10.16 | 0.38 | 1.05 | 1.75 | ||
Class C Shares | Maximum 1% CDSC | With sales charges | 1/2/2004 | -11.88 | -11.01 | 0.38 | 1.05 | 1.75 |
if Redeemed Within One Year of Purchase | Excluding sales charges | -11.03 | -10.15 | 0.38 | 1.05 | 1.75 | ||
Class I Shares | No Sales Charge | 1/2/1991 | -10.49 | -9.03 | 1.60 | 2.23 | 0.54 | |
Class R1 Shares | No Sales Charge | 6/29/2012 | -10.54 | -9.13 | 1.48 | 2.06 | 0.64 | |
Class R2 Shares | No Sales Charge | 6/29/2012 | -10.65 | -9.35 | 1.24 | 1.80 | 0.89 | |
Class R3 Shares | No Sales Charge | 2/29/2016 | -10.75 | -9.57 | 0.97 | 1.60 | 1.14 | |
Class R6 Shares | No Sales Charge | 12/29/2014 | -10.48 | -9.01 | 1.64 | 1.88 | 0.49 | |
SIMPLE Class Shares | No Sales Charge | 8/31/2020 | -10.76 | -9.66 | N/A | -6.22 | 1.25 | |
1. | Not annualized. |
2. | The gross expense ratios presented reflect the Fund’s “Total Annual Fund Operating Expenses” from the most recent Prospectus, as supplemented, and may differ from other expense ratios disclosed in this report. |
3. | Prior to June 30, 2020, the maximum initial sales charge was 4.5%, which is reflected in the applicable average annual total return figures shown. |
4. | Class B shares are closed to all new purchases as well as additional investments by existing Class B shareholders. |
Benchmark Performance* | Six Months1 | One Year | Five Years | Ten Years |
Bloomberg U.S. Aggregate Bond Index2 | -9.47% | -8.51% | 1.20% | 1.73% |
Morningstar Intermediate Core-Plus Bond Category Average3 | -9.12 | -8.17 | 1.52 | 2.21 |
* | Returns for indices reflect no deductions for fees, expenses or taxes, except for foreign withholding taxes where applicable. |
1. | Not annualized. |
2. | The Bloomberg U.S. Aggregate Bond Index is a broad-based benchmark that measures performance of the investment-grade, U.S. dollar denominated, fixed-rate taxable bond market, including Treasurys, government-related and corporate securities, mortgage-backed securities (agency fixed-rate and hybrid adjustable-rate mortgage pass-throughs), asset-backed securities and commercial mortgage-backed securities. Results assume reinvestment of all dividends and capital gains. An investment cannot be made directly in an index. |
3. | The Morningstar Intermediate Core-Plus Bond Category Average is representative of funds that invest primarily in investment-grade U.S. fixed-income issues including government, corporate, and securitized debt, but generally have greater flexibility than core offerings to hold non-core sectors such as corporate high yield, bank loan, emerging-markets debt, and non-U.S. currency exposures. Their durations (a measure of interest-rate sensitivity) typically range between 75% and 125% of the three-year average of the effective duration of the Morningstar Core Bond Index. Results are based on average total returns of similar funds with all dividends and capital gain distributions reinvested. |
6 | MainStay MacKay Total Return Bond Fund |
Share Class | Beginning Account Value 11/1/21 | Ending Account Value (Based on Actual Returns and Expenses) 4/30/22 | Expenses Paid During Period1 | Ending Account Value (Based on Hypothetical 5% Annualized Return and Actual Expenses) 4/30/22 | Expenses Paid During Period1 | Net Expense Ratio During Period2 |
Class A Shares | $1,000.00 | $893.90 | $3.90 | $1,020.68 | $4.16 | 0.83% |
Investor Class Shares | $1,000.00 | $893.40 | $4.98 | $1,019.54 | $5.31 | 1.06% |
Class B Shares | $1,000.00 | $889.60 | $8.48 | $1,015.82 | $9.05 | 1.81% |
Class C Shares | $1,000.00 | $889.70 | $8.48 | $1,015.82 | $9.05 | 1.81% |
Class I Shares | $1,000.00 | $895.10 | $2.68 | $1,021.97 | $2.86 | 0.57% |
Class R1 Shares | $1,000.00 | $894.60 | $3.15 | $1,021.47 | $3.36 | 0.67% |
Class R2 Shares | $1,000.00 | $893.50 | $4.32 | $1,020.23 | $4.61 | 0.92% |
Class R3 Shares | $1,000.00 | $892.50 | $5.44 | $1,019.04 | $5.81 | 1.16% |
Class R6 Shares | $1,000.00 | $895.20 | $2.58 | $1,022.07 | $2.76 | 0.55% |
SIMPLE Class Shares | $1,000.00 | $892.40 | $6.15 | $1,018.30 | $6.56 | 1.31% |
1. | Expenses are equal to the Fund’s annualized expense ratio of each class multiplied by the average account value over the period, divided by 365 and multiplied by 181 (to reflect the six-month period). The table above represents the actual expenses incurred during the six-month period. In addition to the fees and expenses which the Fund bears directly, it also indirectly bears a pro rata share of the fees and expenses of the underlying funds in which it invests. Such indirect expenses are not included in the above-reported expense figures. |
2. | Expenses are equal to the Fund's annualized expense ratio to reflect the six-month period. |
Portfolio Composition as of April 30, 2022 (Unaudited)

Top Ten Holdings and/or Issuers Held as of April 30, 2022 (excluding short-term investments) (Unaudited)
1. | U.S. Treasury Bonds, 2.25%-2.375%, due 2/15/42–2/15/52 |
2. | UMBS, 30 Year, 2.50%-6.50%, due 7/1/39–4/1/52 |
3. | GNMA, 1.00%-3.00%, due 8/20/50–12/20/51 |
4. | Bank of America Corp., 2.087%-4.571%, due 1/28/25–4/27/33 |
5. | FNMA, 2.261%-3.50%, due 7/25/43–2/25/52 |
6. | JPMorgan Chase & Co., 1.383%-4.60%, due 2/1/25–5/13/31 |
7. | CF Hippolyta LLC, 1.53%-1.98%, due 7/15/60–3/15/61 |
8. | U.S. Treasury Notes, 1.875%, due 2/15/32 |
9. | Dell International LLC, 3.375%-8.10%, due 10/1/26–12/15/41 |
10. | Morgan Stanley, 2.484%-5.297%, due 11/24/25–4/20/37 |
8 | MainStay MacKay Total Return Bond Fund |
10 | MainStay MacKay Total Return Bond Fund |
Principal Amount | Value | |
Long-Term Bonds 97.8% | ||
Asset-Backed Securities 12.1% | ||
Automobile Asset-Backed Securities 4.7% | ||
American Credit Acceptance Receivables Trust | ||
Series 2022-1, Class D | ||
2.46%, due 3/13/28 (a) | $ 1,885,000 | $ 1,760,552 |
Avis Budget Rental Car Funding AESOP LLC (a) | ||
Series 2020-2A, Class A | ||
2.02%, due 2/20/27 | 1,435,000 | 1,342,100 |
Series 2020-1A, Class A | ||
2.33%, due 8/20/26 | 1,540,000 | 1,469,505 |
Drive Auto Receivables Trust | ||
Series 2021-2, Class D | ||
1.39%, due 3/15/29 | 1,990,000 | 1,874,026 |
Flagship Credit Auto Trust (a) | ||
Series 2021-2, Class C | ||
1.27%, due 6/15/27 | 2,000,000 | 1,869,145 |
Series 2020-1, Class E | ||
3.52%, due 6/15/27 | 1,950,000 | 1,862,473 |
Series 2019-2, Class E | ||
4.52%, due 12/15/26 | 1,910,000 | 1,886,939 |
GLS Auto Receivables Issuer Trust (a) | ||
Series 2021-3A, Class C | ||
1.11%, due 9/15/26 | 2,700,000 | 2,529,584 |
Series 2021-4A, Class C | ||
1.94%, due 10/15/27 | 1,310,000 | 1,238,466 |
GLS Auto Receivables Trust (a) | ||
Series 2021-2A, Class C | ||
1.08%, due 6/15/26 | 2,055,000 | 1,967,932 |
Series 2021-2A, Class D | ||
1.42%, due 4/15/27 | 1,000,000 | 922,441 |
Hertz Vehicle Financing III LP (a) | ||
Series 2021-2A, Class B | ||
2.12%, due 12/27/27 | 860,000 | 776,738 |
Series 2021-2A, Class D | ||
4.34%, due 12/27/27 | 2,910,000 | 2,576,097 |
Hertz Vehicle Financing LLC (a) | ||
Series 2021-1A, Class B | ||
1.56%, due 12/26/25 | 1,995,000 | 1,874,847 |
Series 2021-1A, Class C | ||
2.05%, due 12/26/25 | 890,000 | 836,861 |
J.P. Morgan Chase Bank NA | ||
Series 2020-1, Class B | ||
0.991%, due 1/25/28 (a) | 277,711 | 274,853 |
25,062,559 | ||
Principal Amount | Value | |
Other Asset-Backed Securities 7.4% | ||
American Airlines Pass-Through Trust | ||
Series 2019-1, Class AA | ||
3.15%, due 2/15/32 | $ 1,203,623 | $ 1,083,561 |
Series 2016-2, Class A | ||
3.65%, due 6/15/28 | 1,529,000 | 1,330,450 |
Series 2019-1, Class B | ||
3.85%, due 2/15/28 | 1,032,554 | 934,394 |
Series 2013-2, Class A | ||
4.95%, due 1/15/23 | 1,765,597 | 1,753,810 |
AMSR Trust | ||
Series 2020-SFR4, Class A | ||
1.355%, due 11/17/37 (a) | 2,130,000 | 1,956,321 |
British Airways Pass-Through Trust | ||
Series 2021-1, Class A | ||
2.90%, due 3/15/35 (a) | 1,863,758 | 1,665,036 |
CF Hippolyta LLC (a) | ||
Series 2021-1A, Class A1 | ||
1.53%, due 3/15/61 | 3,192,513 | 2,907,471 |
Series 2020-1, Class A1 | ||
1.69%, due 7/15/60 | 2,216,572 | 2,056,038 |
Series 2021-1A, Class B1 | ||
1.98%, due 3/15/61 | 1,962,768 | 1,802,009 |
CVS Pass-Through Trust | ||
5.789%, due 1/10/26 (a) | 29,249 | 30,211 |
DB Master Finance LLC | ||
Series 2021-1A, Class A23 | ||
2.791%, due 11/20/51 (a) | 2,832,900 | 2,442,963 |
FirstKey Homes Trust (a) | ||
Series 2020-SFR1, Class A | ||
1.339%, due 8/17/37 | 2,322,537 | 2,141,287 |
Series 2021-SFR1, Class B | ||
1.788%, due 8/17/38 | 3,205,000 | 2,888,303 |
JetBlue Pass-Through Trust | ||
Series 2019-1, Class AA | ||
2.75%, due 5/15/32 | 2,382,663 | 2,142,241 |
Navient Private Education Refi Loan Trust | ||
Series 2020-HA, Class B | ||
2.78%, due 1/15/69 (a) | 2,580,000 | 2,398,742 |
New Economy Assets Phase 1 Sponsor LLC (a) | ||
Series 2021-1, Class A1 | ||
1.91%, due 10/20/61 | 2,500,000 | 2,243,148 |
Series 2021-1, Class B1 | ||
2.41%, due 10/20/61 | 2,410,000 | 2,180,880 |
Progress Residential (a) | ||
Series 2021-SFR1, Class B | ||
1.303%, due 4/17/38 | 1,750,000 | 1,566,569 |
Series 2021-SFR4, Class B | ||
1.808%, due 5/17/38 | 2,970,000 | 2,668,306 |
Principal Amount | Value | |
Asset-Backed Securities (continued) | ||
Other Asset-Backed Securities (continued) | ||
Taco Bell Funding LLC | ||
Series 2021-1A, Class A23 | ||
2.542%, due 8/25/51 (a) | $ 2,354,100 | $ 1,976,672 |
United Airlines Pass-Through Trust | ||
Series 2020-1, Class A | ||
5.875%, due 10/15/27 | 1,687,756 | 1,722,845 |
39,891,257 | ||
Total Asset-Backed Securities (Cost $70,257,489) | 64,953,816 | |
Corporate Bonds 44.5% | ||
Aerospace & Defense 0.3% | ||
Boeing Co. (The) | ||
3.75%, due 2/1/50 | 770,000 | 589,328 |
Howmet Aerospace, Inc. | ||
3.00%, due 1/15/29 | 890,000 | 776,659 |
1,365,987 | ||
Agriculture 0.7% | ||
Altria Group, Inc. | ||
2.45%, due 2/4/32 | 1,850,000 | 1,480,430 |
4.80%, due 2/14/29 | 285,000 | 282,276 |
BAT Capital Corp. | ||
3.734%, due 9/25/40 | 1,800,000 | 1,345,055 |
BAT International Finance plc | ||
4.448%, due 3/16/28 | 945,000 | 909,849 |
4,017,610 | ||
Airlines 1.3% | ||
American Airlines, Inc. (a) | ||
5.50%, due 4/20/26 | 1,445,000 | 1,432,356 |
5.75%, due 4/20/29 | 860,000 | 828,675 |
Delta Air Lines, Inc. (a) | ||
4.50%, due 10/20/25 | 1,115,000 | 1,107,454 |
4.75%, due 10/20/28 | 1,855,000 | 1,833,365 |
Mileage Plus Holdings LLC | ||
6.50%, due 6/20/27 (a) | 1,800,000 | 1,835,964 |
7,037,814 | ||
Auto Manufacturers 1.7% | ||
Ford Motor Credit Co. LLC | ||
4.063%, due 11/1/24 | 1,450,000 | 1,418,336 |
4.125%, due 8/17/27 | 1,445,000 | 1,339,587 |
General Motors Co. | ||
6.125%, due 10/1/25 | 650,000 | 686,144 |
Principal Amount | Value | |
Auto Manufacturers (continued) | ||
General Motors Financial Co., Inc. | ||
2.70%, due 6/10/31 | $ 1,600,000 | $ 1,317,078 |
4.30%, due 4/6/29 | 940,000 | 896,539 |
Nissan Motor Acceptance Co. LLC (a) | ||
1.125%, due 9/16/24 | 1,015,000 | 943,267 |
1.85%, due 9/16/26 | 2,915,000 | 2,526,655 |
9,127,606 | ||
Banks 13.5% | ||
Bank of America Corp. | ||
2.087%, due 6/14/29 (b) | 1,110,000 | 963,861 |
2.496%, due 2/13/31 (b) | 2,315,000 | 1,985,400 |
3.248%, due 10/21/27 | 900,000 | 856,358 |
3.384%, due 4/2/26 (b) | 950,000 | 929,360 |
3.419%, due 12/20/28 (b) | 283,000 | 267,772 |
3.593%, due 7/21/28 (b) | 1,385,000 | 1,331,006 |
3.705%, due 4/24/28 (b) | 1,275,000 | 1,229,760 |
4.25%, due 10/22/26 | 1,550,000 | 1,546,585 |
Series MM | ||
4.30%, due 1/28/25 (b)(c) | 1,595,000 | 1,441,960 |
4.571%, due 4/27/33 (b) | 765,000 | 761,598 |
Barclays plc | ||
4.375% (5 Year Treasury Constant Maturity Rate + 3.41%), due 3/15/28 (c)(d) | 2,245,000 | 1,871,769 |
BNP Paribas SA | ||
4.625% (5 Year Treasury Constant Maturity Rate + 3.34%), due 2/25/31 (a)(c)(d) | 2,135,000 | 1,798,631 |
Citigroup, Inc. | ||
3.887%, due 1/10/28 (b) | 2,099,000 | 2,048,808 |
Series Y | ||
4.15% (5 Year Treasury Constant Maturity Rate + 3.00%), due 11/15/26 (c)(d) | 1,470,000 | 1,300,362 |
5.30%, due 5/6/44 | 1,474,000 | 1,495,502 |
Credit Agricole SA | ||
4.75% (5 Year Treasury Constant Maturity Rate + 3.237%), due 3/23/29 (a)(c)(d) | 1,890,000 | 1,627,762 |
Credit Suisse Group AG (a)(b) | ||
2.593%, due 9/11/25 | 2,135,000 | 2,036,291 |
3.091%, due 5/14/32 | 2,070,000 | 1,731,156 |
Deutsche Bank AG | ||
1.405% (SOFR + 1.219%), due 11/16/27 (d) | 2,035,000 | 1,966,358 |
3.035%, due 5/28/32 (b) | 890,000 | 742,496 |
12 | MainStay MacKay Total Return Bond Fund |
Principal Amount | Value | |
Corporate Bonds (continued) | ||
Banks (continued) | ||
First Horizon Bank | ||
5.75%, due 5/1/30 | $ 1,606,000 | $ 1,723,049 |
First Horizon Corp. | ||
4.00%, due 5/26/25 | 2,320,000 | 2,314,789 |
Goldman Sachs Group, Inc. (The) | ||
1.948%, due 10/21/27 (b) | 1,305,000 | 1,171,980 |
1.992%, due 1/27/32 (b) | 1,460,000 | 1,179,456 |
2.615%, due 4/22/32 (b) | 1,010,000 | 854,289 |
6.75%, due 10/1/37 | 1,385,000 | 1,598,345 |
HSBC Holdings plc | ||
3.973%, due 5/22/30 (b) | 1,265,000 | 1,192,842 |
JPMorgan Chase & Co. | ||
1.383% (SOFR + 1.18%), due 2/24/28 (d) | 1,590,000 | 1,571,397 |
2.182%, due 6/1/28 (b) | 1,030,000 | 926,820 |
2.956%, due 5/13/31 (b) | 880,000 | 773,504 |
3.782%, due 2/1/28 (b) | 1,565,000 | 1,518,541 |
4.005%, due 4/23/29 (b) | 2,405,000 | 2,345,830 |
4.323%, due 4/26/28 (b) | 1,835,000 | 1,826,801 |
Series HH | ||
4.60%, due 2/1/25 (b)(c) | 857,000 | 792,125 |
Lloyds Banking Group plc | ||
4.582%, due 12/10/25 | 2,643,000 | 2,652,535 |
Macquarie Group Ltd. | ||
2.871%, due 1/14/33 (a)(b) | 1,770,000 | 1,471,153 |
Mizuho Financial Group, Inc. | ||
3.261% (1 Year Treasury Constant Maturity Rate + 1.25%), due 5/22/30 (d) | 1,030,000 | 950,601 |
Morgan Stanley | ||
2.484%, due 9/16/36 (b) | 1,535,000 | 1,228,088 |
3.591%, due 7/22/28 (b) | 1,750,000 | 1,676,189 |
5.00%, due 11/24/25 | 1,940,000 | 1,991,488 |
5.297%, due 4/20/37 (b) | 545,000 | 545,101 |
NatWest Group plc | ||
3.073% (1 Year Treasury Constant Maturity Rate + 2.55%), due 5/22/28 (d) | 1,985,000 | 1,839,501 |
Societe Generale SA (a)(d) | ||
3.337% (1 Year Treasury Constant Maturity Rate + 1.60%), due 1/21/33 | 1,440,000 | 1,219,319 |
4.75% (5 Year Treasury Constant Maturity Rate + 3.931%), due 5/26/26 (c) | 1,585,000 | 1,405,316 |
Principal Amount | Value | |
Banks (continued) | ||
Societe Generale SA (a)(d) (continued) | ||
5.375% (5 Year Treasury Constant Maturity Rate + 4.514%), due 11/18/30 (c) | $ 1,390,000 | $ 1,220,420 |
Standard Chartered plc | ||
1.822% (1 Year Treasury Constant Maturity Rate + 0.95%), due 11/23/25 (a)(d) | 1,345,000 | 1,258,328 |
SVB Financial Group | ||
Series C | ||
4.00% (5 Year Treasury Constant Maturity Rate + 3.202%), due 5/15/26 (c)(d)(e) | 1,285,000 | 1,117,565 |
UBS Group AG | ||
4.375% (5 Year Treasury Constant Maturity Rate + 3.313%), due 2/10/31 (a)(c)(d) | 1,520,000 | 1,268,744 |
Wachovia Corp. | ||
5.50%, due 8/1/35 | 735,000 | 768,875 |
Wells Fargo & Co. | ||
3.526%, due 3/24/28 (b) | 1,430,000 | 1,372,614 |
Wells Fargo Bank NA | ||
5.85%, due 2/1/37 | 335,000 | 371,319 |
Westpac Banking Corp. | ||
3.02% (5 Year Treasury Constant Maturity Rate + 1.53%), due 11/18/36 (d) | 3,108,000 | 2,575,511 |
72,655,230 | ||
Beverages 0.1% | ||
Anheuser-Busch InBev Worldwide, Inc. | ||
4.75%, due 1/23/29 | 460,000 | 473,397 |
Building Materials 0.1% | ||
Cemex SAB de CV | ||
7.375%, due 6/5/27 (a) | 650,000 | 684,255 |
Chemicals 0.6% | ||
Braskem Netherlands Finance BV | ||
4.50%, due 1/10/28 (a) | 1,135,000 | 1,068,954 |
Huntsman International LLC | ||
4.50%, due 5/1/29 | 1,964,000 | 1,934,553 |
3,003,507 | ||
Commercial Services 1.0% | ||
Allied Universal Holdco LLC | ||
6.625%, due 7/15/26 (a) | 1,545,000 | 1,493,150 |
Principal Amount | Value | |
Corporate Bonds (continued) | ||
Commercial Services (continued) | ||
Ashtead Capital, Inc. | ||
4.00%, due 5/1/28 (a) | $ 865,000 | $ 823,599 |
California Institute of Technology | ||
3.65%, due 9/1/19 | 1,429,000 | 1,101,411 |
S&P Global, Inc. | ||
4.25%, due 5/1/29 (a) | 2,235,000 | 2,245,013 |
5,663,173 | ||
Computers 1.5% | ||
Dell International LLC | ||
3.375%, due 12/15/41 (a) | 1,450,000 | 1,088,486 |
4.90%, due 10/1/26 | 3,247,000 | 3,314,230 |
5.30%, due 10/1/29 | 765,000 | 788,359 |
8.10%, due 7/15/36 | 570,000 | 697,305 |
NCR Corp. (a) | ||
5.00%, due 10/1/28 | 1,403,000 | 1,339,865 |
6.125%, due 9/1/29 | 925,000 | 885,687 |
8,113,932 | ||
Diversified Financial Services 3.2% | ||
AerCap Ireland Capital DAC | ||
2.45%, due 10/29/26 | 2,300,000 | 2,045,396 |
Air Lease Corp. | ||
4.25%, due 9/15/24 | 2,800,000 | 2,810,236 |
Aircastle Ltd. | ||
5.25% (5 Year Treasury Constant Maturity Rate + 4.41%), due 6/15/26 (a)(c)(d) | 2,665,000 | 2,372,226 |
Ally Financial, Inc. | ||
Series C | ||
4.70% (7 Year Treasury Constant Maturity Rate + 3.481%), due 5/15/28 (c)(d)(e) | 900,000 | 774,729 |
8.00%, due 11/1/31 | 1,205,000 | 1,433,486 |
Aviation Capital Group LLC | ||
1.95%, due 1/30/26 (a) | 1,330,000 | 1,188,119 |
Avolon Holdings Funding Ltd. (a) | ||
2.125%, due 2/21/26 | 1,385,000 | 1,240,276 |
3.25%, due 2/15/27 | 1,740,000 | 1,577,669 |
Banco BTG Pactual SA | ||
2.75%, due 1/11/26 (a) | 2,305,000 | 2,100,431 |
OneMain Finance Corp. | ||
3.50%, due 1/15/27 | 1,145,000 | 1,005,905 |
3.875%, due 9/15/28 | 1,005,000 | 851,737 |
17,400,210 | ||
Principal Amount | Value | |
Electric 2.8% | ||
Alabama Power Co. | ||
3.00%, due 3/15/52 | $ 1,915,000 | $ 1,472,332 |
Arizona Public Service Co. | ||
2.20%, due 12/15/31 | 1,765,000 | 1,459,125 |
3.35%, due 5/15/50 | 1,625,000 | 1,264,588 |
Calpine Corp. | ||
5.125%, due 3/15/28 (a) | 1,125,000 | 1,021,922 |
Connecticut Light and Power Co. (The) | ||
4.00%, due 4/1/48 | 1,085,000 | 1,017,784 |
Duquesne Light Holdings, Inc. | ||
3.616%, due 8/1/27 (a) | 990,000 | 950,131 |
Edison International | ||
Series B | ||
5.00% (5 Year Treasury Constant Maturity Rate + 3.901%), due 12/15/26 (c)(d) | 2,440,000 | 2,208,501 |
Ohio Power Co. | ||
Series R | ||
2.90%, due 10/1/51 | 900,000 | 662,171 |
Pacific Gas and Electric Co. | ||
3.50%, due 8/1/50 | 2,235,000 | 1,558,067 |
Southern California Edison Co. | ||
4.00%, due 4/1/47 | 1,235,000 | 1,056,228 |
Southwestern Electric Power Co. | ||
3.25%, due 11/1/51 | 2,120,000 | 1,617,937 |
Virginia Electric and Power Co. | ||
2.95%, due 11/15/51 | 1,360,000 | 1,055,308 |
15,344,094 | ||
Entertainment 0.2% | ||
Magallanes, Inc. | ||
4.279%, due 3/15/32 (a) | 1,045,000 | 970,695 |
Environmental Control 0.4% | ||
Waste Connections, Inc. | ||
2.20%, due 1/15/32 | 985,000 | 832,901 |
3.50%, due 5/1/29 (e) | 1,130,000 | 1,088,183 |
1,921,084 | ||
Food 0.7% | ||
Kraft Heinz Foods Co. | ||
5.00%, due 7/15/35 | 731,000 | 727,008 |
MARB BondCo plc | ||
3.95%, due 1/29/31 (a) | 1,520,000 | 1,262,633 |
Smithfield Foods, Inc. (a) | ||
4.25%, due 2/1/27 | 1,190,000 | 1,161,503 |
5.20%, due 4/1/29 | 580,000 | 582,096 |
3,733,240 | ||
14 | MainStay MacKay Total Return Bond Fund |
Principal Amount | Value | |
Corporate Bonds (continued) | ||
Gas 0.3% | ||
National Fuel Gas Co. | ||
2.95%, due 3/1/31 | $ 1,820,000 | $ 1,555,679 |
Healthcare-Services 0.2% | ||
NYU Langone Hospitals | ||
Series 2020 | ||
3.38%, due 7/1/55 | 1,385,000 | 1,074,073 |
Home Builders 0.5% | ||
Lennar Corp. | ||
4.75%, due 11/29/27 | 331,000 | 331,679 |
Thor Industries, Inc. | ||
4.00%, due 10/15/29 (a) | 375,000 | 316,916 |
Toll Brothers Finance Corp. | ||
3.80%, due 11/1/29 | 1,343,000 | 1,218,956 |
4.35%, due 2/15/28 (e) | 819,000 | 781,051 |
2,648,602 | ||
Insurance 1.9% | ||
Athene Global Funding | ||
2.50%, due 3/24/28 (a) | 2,770,000 | 2,455,305 |
Equitable Holdings, Inc. | ||
4.35%, due 4/20/28 | 1,275,000 | 1,268,255 |
Liberty Mutual Group, Inc. | ||
3.951%, due 10/15/50 (a) | 2,210,000 | 1,862,516 |
Nippon Life Insurance Co. | ||
3.40% (5 Year Treasury Constant Maturity Rate + 2.612%), due 1/23/50 (a)(d) | 1,095,000 | 997,819 |
Peachtree Corners Funding Trust | ||
3.976%, due 2/15/25 (a) | 1,070,000 | 1,070,020 |
Reliance Standard Life Global Funding II | ||
2.50%, due 10/30/24 (a) | 1,325,000 | 1,289,763 |
Willis North America, Inc. | ||
2.95%, due 9/15/29 | 1,690,000 | 1,508,791 |
10,452,469 | ||
Internet 0.3% | ||
Amazon.com, Inc. | ||
3.60%, due 4/13/32 | 430,000 | 421,598 |
Expedia Group, Inc. | ||
3.25%, due 2/15/30 | 1,310,000 | 1,168,562 |
1,590,160 | ||
Lodging 0.5% | ||
Hilton Domestic Operating Co., Inc. | ||
4.875%, due 1/15/30 (e) | 1,590,000 | 1,533,873 |
Principal Amount | Value | |
Lodging (continued) | ||
Las Vegas Sands Corp. | ||
3.20%, due 8/8/24 | $ 1,325,000 | $ 1,272,477 |
2,806,350 | ||
Media 0.7% | ||
Comcast Corp. | ||
2.937%, due 11/1/56 (a) | 595,000 | 425,618 |
DISH DBS Corp. | ||
5.75%, due 12/1/28 (a) | 1,870,000 | 1,672,677 |
Grupo Televisa SAB | ||
5.25%, due 5/24/49 | 610,000 | 616,771 |
Sirius XM Radio, Inc. | ||
4.125%, due 7/1/30 (a) | 1,030,000 | 904,433 |
3,619,499 | ||
Miscellaneous—Manufacturing 0.4% | ||
Textron Financial Corp. | ||
2.241% (3 Month LIBOR + 1.735%), due 2/15/42 (a)(d) | 2,315,000 | 1,935,826 |
Oil & Gas 1.5% | ||
Gazprom PJSC Via Gaz Capital SA | ||
4.95%, due 2/6/28 (a)(f) | 1,521,000 | 365,040 |
Marathon Petroleum Corp. | ||
6.50%, due 3/1/41 | 1,605,000 | 1,808,573 |
Occidental Petroleum Corp. | ||
4.30%, due 8/15/39 | 841,000 | 714,303 |
Petrobras Global Finance BV | ||
5.50%, due 6/10/51 (e) | 1,265,000 | 1,038,084 |
Southwestern Energy Co. | ||
4.75%, due 2/1/32 (e) | 1,220,000 | 1,153,669 |
Valero Energy Corp. | ||
3.65%, due 12/1/51 | 1,545,000 | 1,204,824 |
6.625%, due 6/15/37 | 1,620,000 | 1,844,517 |
8,129,010 | ||
Packaging & Containers 0.3% | ||
Berry Global, Inc. | ||
4.875%, due 7/15/26 (a) | 2,000 | 1,988 |
Owens-Brockway Glass Container, Inc. | ||
6.625%, due 5/13/27 (a)(e) | 1,456,000 | 1,434,160 |
1,436,148 | ||
Pharmaceuticals 0.9% | ||
Becton Dickinson and Co. | ||
4.669%, due 6/6/47 | 995,000 | 966,193 |
CVS Health Corp. | ||
4.78%, due 3/25/38 | 450,000 | 445,021 |
Principal Amount | Value | |
Corporate Bonds (continued) | ||
Pharmaceuticals (continued) | ||
Teva Pharmaceutical Finance Netherlands III BV | ||
3.15%, due 10/1/26 | $ 2,823,000 | $ 2,420,779 |
4.75%, due 5/9/27 | 1,150,000 | 1,052,250 |
4,884,243 | ||
Pipelines 3.2% | ||
Cheniere Corpus Christi Holdings LLC | ||
2.742%, due 12/31/39 | 1,385,000 | 1,127,221 |
DT Midstream, Inc. | ||
4.30%, due 4/15/32 (a) | 1,125,000 | 1,067,490 |
Energy Transfer LP | ||
4.95%, due 6/15/28 | 582,000 | 587,218 |
5.35%, due 5/15/45 | 940,000 | 860,898 |
Enterprise Products Operating LLC | ||
3.95%, due 1/31/60 | 1,325,000 | 1,073,686 |
4.20%, due 1/31/50 | 380,000 | 333,073 |
Flex Intermediate Holdco LLC | ||
3.363%, due 6/30/31 (a) | 2,120,000 | 1,861,585 |
Hess Midstream Operations LP (a) | ||
4.25%, due 2/15/30 | 565,000 | 518,269 |
5.50%, due 10/15/30 | 440,000 | 433,528 |
5.625%, due 2/15/26 | 726,000 | 726,000 |
Holly Energy Partners LP | ||
6.375%, due 4/15/27 (a) | 640,000 | 652,800 |
MPLX LP | ||
4.875%, due 6/1/25 | 2,400,000 | 2,447,896 |
Sabine Pass Liquefaction LLC | ||
5.875%, due 6/30/26 | 2,061,000 | 2,165,267 |
Targa Resources Corp. | ||
4.20%, due 2/1/33 | 640,000 | 606,570 |
Western Midstream Operating LP | ||
5.75%, due 2/1/50 (g) | 1,495,000 | 1,317,334 |
Williams Cos., Inc. (The) | ||
3.50%, due 10/15/51 | 1,685,000 | 1,291,681 |
17,070,516 | ||
Real Estate 0.2% | ||
Realogy Group LLC | ||
5.25%, due 4/15/30 (a) | 1,145,000 | 927,667 |
Real Estate Investment Trusts 1.8% | ||
Alexandria Real Estate Equities, Inc. | ||
3.375%, due 8/15/31 | 1,255,000 | 1,161,678 |
American Tower Corp. | ||
3.375%, due 5/15/24 (e) | 2,405,000 | 2,398,083 |
Principal Amount | Value | |
Real Estate Investment Trusts (continued) | ||
Equinix, Inc. | ||
1.80%, due 7/15/27 | $ 5,000 | $ 4,402 |
Invitation Homes Operating Partnership LP | ||
2.00%, due 8/15/31 | 1,490,000 | 1,192,929 |
Iron Mountain, Inc. (a) | ||
4.875%, due 9/15/29 (e) | 290,000 | 265,653 |
5.25%, due 7/15/30 | 1,635,000 | 1,498,543 |
Office Properties Income Trust | ||
2.40%, due 2/1/27 | 2,025,000 | 1,750,568 |
Starwood Property Trust, Inc. | ||
3.75%, due 12/31/24 (a) | 1,480,000 | 1,424,219 |
9,696,075 | ||
Retail 1.4% | ||
AutoNation, Inc. | ||
4.75%, due 6/1/30 | 1,880,000 | 1,851,497 |
Nordstrom, Inc. | ||
4.00%, due 3/15/27 (e) | 733,000 | 679,302 |
4.25%, due 8/1/31 | 1,365,000 | 1,156,955 |
QVC, Inc. | ||
4.375%, due 9/1/28 | 2,415,000 | 2,052,050 |
Starbucks Corp. | ||
4.45%, due 8/15/49 | 595,000 | 549,540 |
Victoria's Secret & Co. | ||
4.625%, due 7/15/29 (a) | 1,415,000 | 1,160,810 |
7,450,154 | ||
Software 0.4% | ||
MSCI, Inc. | ||
3.25%, due 8/15/33 (a) | 2,185,000 | 1,846,325 |
Oracle Corp. | ||
3.65%, due 3/25/41 | 595,000 | 460,810 |
2,307,135 | ||
Telecommunications 1.9% | ||
Altice France SA | ||
5.125%, due 7/15/29 (a) | 1,340,000 | 1,134,390 |
AT&T, Inc. | ||
3.85%, due 6/1/60 | 1,262,000 | 997,179 |
Level 3 Financing, Inc. | ||
3.40%, due 3/1/27 (a) | 1,755,000 | 1,579,500 |
Sprint Spectrum Co. LLC | ||
4.738%, due 3/20/25 (a) | 2,816,250 | 2,837,619 |
T-Mobile US, Inc. | ||
2.625%, due 2/15/29 | 1,020,000 | 881,749 |
3.50%, due 4/15/31 (a) | 685,000 | 607,136 |
VEON Holdings BV | ||
4.95%, due 6/16/24 (a) | 1,065,000 | 713,550 |
16 | MainStay MacKay Total Return Bond Fund |
Principal Amount | Value | |
Corporate Bonds (continued) | ||
Telecommunications (continued) | ||
Verizon Communications, Inc. | ||
4.016%, due 12/3/29 | $ 1,780,000 | $ 1,741,412 |
10,492,535 | ||
Total Corporate Bonds (Cost $265,249,434) | 239,587,975 | |
Foreign Government Bonds 3.0% | ||
Brazil 0.4% | ||
Brazil Government Bond | ||
3.75%, due 9/12/31 (e) | 1,380,000 | 1,190,940 |
Federative Republic of Brazil | ||
4.625%, due 1/13/28 | 914,000 | 889,971 |
2,080,911 | ||
Chile 0.6% | ||
Chile Government Bond | ||
2.55%, due 7/27/33 | 1,990,000 | 1,658,784 |
Empresa Nacional del Petroleo | ||
3.45%, due 9/16/31 (a) | 2,115,000 | 1,787,175 |
3,445,959 | ||
Colombia 0.3% | ||
Colombia Government Bond | ||
3.25%, due 4/22/32 | 1,810,000 | 1,382,605 |
4.50%, due 1/28/26 | 450,000 | 430,924 |
1,813,529 | ||
Mexico 1.7% | ||
Comision Federal de Electricidad | ||
3.875%, due 7/26/33 (a) | 2,725,000 | 2,187,669 |
Mexico Government Bond | ||
2.659%, due 5/24/31 | 343,000 | 287,407 |
3.75%, due 4/19/71 | 2,130,000 | 1,463,310 |
Petroleos Mexicanos | ||
6.50%, due 3/13/27 (e) | 3,005,000 | 2,870,646 |
6.75%, due 9/21/47 | 3,090,000 | 2,232,834 |
9,041,866 | ||
Total Foreign Government Bonds (Cost $20,069,077) | 16,382,265 | |
Principal Amount | Value | |
Loan Assignments 2.1% | ||
Containers, Packaging & Glass 0.5% | ||
Mauser Packaging Solutions Holding Co. | ||
Initial Term Loan | ||
3.705% (1 Month LIBOR + 3.25%), due 4/3/24 (d) | $ 2,903,378 | $ 2,844,405 |
Diversified/Conglomerate Service 0.4% | ||
TruGreen LP | ||
First Lien Second Refinancing Term Loan | ||
4.764% (1 Month LIBOR + 4.00%), due 11/2/27 (d) | 2,330,500 | 2,318,120 |
Finance 0.6% | ||
Alliant Holdings Intermediate LLC | ||
2018 Initial Term Loan | ||
4.014% (1 Month LIBOR + 3.25%), due 5/9/25 (d) | 2,894,911 | 2,865,600 |
Hotel, Gaming & Leisure 0.6% | ||
IRB Holding Corp. | ||
2022 Replacement Term Loan B | ||
3.75% (3 Month LIBOR + 3.00%), due 12/15/27 (d) | 3,321,258 | 3,271,440 |
Total Loan Assignments (Cost $11,384,033) | 11,299,565 | |
Mortgage-Backed Securities 20.9% | ||
Agency (Collateralized Mortgage Obligations) 6.0% | ||
FHLMC | ||
REMIC, Series 5038, Class KA | ||
1.50%, due 11/25/50 | 1,967,826 | 1,624,657 |
REMIC, Series 4913, Class UA | ||
3.00%, due 3/15/49 | 1,491,153 | 1,419,176 |
REMIC, Series 5011, Class MI | ||
3.00%, due 9/25/50 (h) | 1,623,502 | 266,930 |
REMIC, Series 5094, Class IP | ||
3.00%, due 4/25/51 (h) | 1,259,267 | 192,074 |
REMIC, Series 5160, Class IO | ||
3.00%, due 10/25/51 (h) | 1,034,406 | 119,940 |
FHLMC, Strips | ||
Series 358, Class PO | ||
(zero coupon), due 10/15/47 | 5,942,425 | 5,063,181 |
Series 377, Class C4 | ||
2.00%, due 1/25/51 (h) | 1,062,680 | 136,253 |
Principal Amount | Value | |
Mortgage-Backed Securities (continued) | ||
Agency (Collateralized Mortgage Obligations) (continued) | ||
FNMA | ||
REMIC, Series 2022-3, Class YS | ||
2.261% (SOFR 30A + 2.55%), due 2/25/52 (d)(h) | $ 8,850,000 | $ 323,787 |
REMIC, Series 2021-33, Class AI | ||
2.50%, due 5/25/47 (h) | 10,326,206 | 1,339,585 |
REMIC, Series 2021-34, Class MI | ||
2.50%, due 3/25/51 (h) | 6,853,926 | 910,414 |
REMIC, Series 2013-77, Class CY | ||
3.00%, due 7/25/43 | 2,301,857 | 2,206,659 |
REMIC, Series 2021-53, Class GI | ||
3.00%, due 7/25/48 (h) | 8,348,518 | 1,365,301 |
REMIC, Series 2019-13, Class PE | ||
3.00%, due 3/25/49 | 1,390,781 | 1,346,818 |
REMIC, Series 2021-85, Class BI | ||
3.00%, due 12/25/51 (h) | 3,410,293 | 513,349 |
REMIC, Series 2021-12, Class GC | ||
3.50%, due 7/25/50 | 2,840,192 | 2,782,161 |
GNMA | ||
Series 2020-115, Class YA | ||
1.00%, due 8/20/50 | 1,518,153 | 1,265,582 |
Series 2020-129, Class AG | ||
1.00%, due 9/20/50 | 2,105,173 | 1,777,837 |
Series 2020-166, Class CA | ||
1.00%, due 11/20/50 | 2,815,418 | 2,247,394 |
Series 2021-214, Class SA | ||
1.41% (SOFR 30A + 1.70%), due 12/20/51 (d)(h) | 14,283,673 | 166,930 |
Series 2021-213, Class ES | ||
1.41% (SOFR 30A + 1.70%), due 12/20/51 (d)(h) | 14,192,309 | 144,320 |
Series 2020-166, Class IC | ||
2.00%, due 11/20/50 (h) | 1,407,709 | 167,189 |
Series 2021-25, Class LI | ||
2.50%, due 2/20/51 (h) | 9,017,516 | 1,187,399 |
Series 2021-30, Class WI | ||
2.50%, due 2/20/51 (h) | 10,961,711 | 1,643,698 |
Series 2021-44, Class IQ | ||
3.00%, due 3/20/51 (h) | 9,120,016 | 1,526,237 |
Series 2021-98, Class KI | ||
3.00%, due 6/20/51 (h) | 6,758,446 | 1,002,088 |
Series 2021-136, Class TI | ||
3.00%, due 8/20/51 (h) | 2,831,621 | 468,901 |
Series 2021-139, Class IA | ||
3.00%, due 8/20/51 (h) | 8,446,166 | 1,397,515 |
32,605,375 | ||
Principal Amount | Value | |
Commercial Mortgage Loans (Collateralized Mortgage Obligations) 8.8% | ||
BAMLL Commercial Mortgage Securities Trust (a)(d) | ||
Series 2022-DKLX, Class D | ||
3.509% (1 Month SOFR + 3.00%), due 1/15/39 | $ 400,000 | $ 389,710 |
Series 2022-DKLX, Class F | ||
5.466% (1 Month SOFR + 4.957%), due 1/15/39 | 800,000 | 773,030 |
Bayview Commercial Asset Trust | ||
Series 2006-4A, Class A1 | ||
1.013% (1 Month LIBOR + 0.345%), due 12/25/36 (a)(d) | 26,537 | 25,264 |
BX Commercial Mortgage Trust (a) | ||
Series 2021-VOLT, Class C | ||
1.654% (1 Month LIBOR + 1.10%), due 9/15/36 (d) | 1,485,000 | 1,434,315 |
Series 2021-ACNT, Class D | ||
2.405% (1 Month LIBOR + 1.85%), due 11/15/38 (d) | 2,285,000 | 2,228,881 |
Series 2021-VOLT, Class E | ||
2.554% (1 Month LIBOR + 2.00%), due 9/15/36 (d) | 2,400,000 | 2,308,597 |
Series 2020-VIV2, Class C | ||
3.66%, due 3/9/44 (i) | 3,267,000 | 2,893,966 |
Series 2020-VIVA, Class D | ||
3.667%, due 3/11/44 (i) | 1,975,000 | 1,704,768 |
BX Trust (a) | ||
Series 2019-OC11, Class C | ||
3.856%, due 12/9/41 | 2,209,000 | 2,016,572 |
Series 2019-OC11, Class E | ||
4.075%, due 12/9/41 (i) | 3,009,000 | 2,569,970 |
BXHPP Trust | ||
Series 2021-FILM, Class B | ||
1.454% (1 Month LIBOR + 0.90%), due 8/15/36 (a)(d) | 1,000,000 | 958,809 |
Commercial Mortgage Trust | ||
Series 2013-CR8, Class A4 | ||
3.334%, due 6/10/46 | 416,522 | 415,828 |
Series 2013-CR9, Class B | ||
4.436%, due 7/10/45 (a)(i) | 2,380,000 | 2,309,085 |
CSMC WEST Trust | ||
Series 2020-WEST, Class A | ||
3.04%, due 2/15/35 (a) | 2,060,000 | 1,857,146 |
Extended Stay America Trust (a)(d) | ||
Series 2021-ESH, Class B | ||
1.935% (1 Month LIBOR + 1.38%), due 7/15/38 | 119,266 | 117,630 |
18 | MainStay MacKay Total Return Bond Fund |
Principal Amount | Value | |
Mortgage-Backed Securities (continued) | ||
Commercial Mortgage Loans (Collateralized Mortgage Obligations) (continued) | ||
Extended Stay America Trust (a)(d) (continued) | ||
Series 2021-ESH, Class C | ||
2.255% (1 Month LIBOR + 1.70%), due 7/15/38 | $ 2,256,115 | $ 2,220,946 |
FREMF Mortgage Trust (a)(i) | ||
Series 2017-K69, Class B | ||
3.854%, due 10/25/49 | 370,000 | 354,224 |
Series 2019-K98, Class C | ||
3.862%, due 10/25/52 | 1,200,000 | 1,127,405 |
Series 2017-K63, Class C | ||
4.008%, due 2/25/50 | 1,725,000 | 1,663,419 |
Series 2019-K94, Class C | ||
4.101%, due 7/25/52 | 970,000 | 922,554 |
Series 2019-K94, Class B | ||
4.101%, due 7/25/52 | 920,000 | 892,498 |
Series 2016-K54, Class B | ||
4.19%, due 4/25/48 | 630,000 | 620,751 |
Series 2018-K77, Class C | ||
4.303%, due 5/25/51 | 1,375,000 | 1,324,919 |
Series 2018-K76, Class C | ||
4.35%, due 6/25/51 | 2,508,000 | 2,418,383 |
Series 2018-K86, Class C | ||
4.437%, due 11/25/51 | 1,105,000 | 1,080,379 |
J.P. Morgan Chase Commercial Mortgage Securities Trust | ||
Series 2021-410T, Class A | ||
2.287%, due 3/5/42 (a) | 2,685,000 | 2,427,065 |
SMRT | ||
Series 2022-MINI, Class D | ||
2.472% (1 Month SOFR + 1.95%), due 1/15/39 (a)(d) | 1,050,000 | 1,024,975 |
UBS-Barclays Commercial Mortgage Trust | ||
Series 2013-C6, Class B | ||
3.875%, due 4/10/46 (a)(j) | 2,730,000 | 2,683,673 |
Wells Fargo Commercial Mortgage Trust | ||
Series 2018-AUS, Class A | ||
4.194%, due 8/17/36 (a)(i) | 2,125,000 | 2,097,046 |
WFRBS Commercial Mortgage Trust | ||
Series 2014-C21, Class AS | ||
3.891%, due 8/15/47 | 1,580,000 | 1,563,216 |
Series 2012-C7, Class AS | ||
4.09%, due 6/15/45 (j) | 2,989,505 | 2,984,027 |
47,409,051 | ||
Principal Amount | Value | |
Whole Loan (Collateralized Mortgage Obligations) 6.1% | ||
Connecticut Avenue Securities Trust (a)(d) | ||
Series 2020-R02, Class 2M2 | ||
2.668% (1 Month LIBOR + 2.00%), due 1/25/40 | $ 217,606 | $ 217,383 |
Series 2022-R04, Class 1M2 | ||
3.389% (SOFR 30A + 3.10%), due 3/25/42 | 900,000 | 904,512 |
FHLMC STACR REMIC Trust (a)(d) | ||
Series 2022-DNA1, Class M1B | ||
2.139% (SOFR 30A + 1.85%), due 1/25/42 | 950,000 | 907,343 |
Series 2022-DNA3, Class M1B | ||
3.151% (SOFR 30A + 2.90%), due 4/25/42 | 1,000,000 | 1,000,633 |
Series 2021-HQA3, Class B1 | ||
3.639% (SOFR 30A + 3.35%), due 9/25/41 | 2,980,000 | 2,694,359 |
FHLMC STACR Trust (a)(d) | ||
Series 2018-DNA2, Class M2 | ||
2.818% (1 Month LIBOR + 2.15%), due 12/25/30 | 848,440 | 854,796 |
Series 2018-DNA2, Class B1 | ||
4.368% (1 Month LIBOR + 3.70%), due 12/25/30 | 3,346,414 | 3,274,473 |
Series 2019-DNA2, Class B1 | ||
5.018% (1 Month LIBOR + 4.35%), due 3/25/49 | 2,925,000 | 2,952,878 |
FHLMC Structured Agency Credit Risk Debt Notes | ||
Series 2018-HQA1, Class M2 | ||
2.968% (1 Month LIBOR + 2.30%), due 9/25/30 (d) | 950,586 | 956,473 |
GS Mortgage-Backed Securities Corp. Trust | ||
Series 2021-PJ5, Class A8 | ||
2.50%, due 10/25/51 (a)(j) | 1,050,201 | 973,776 |
J.P. Morgan Mortgage Trust (a)(j) | ||
Series 2021-8, Class A3 | ||
2.50%, due 12/25/51 | 2,920,955 | 2,581,427 |
Series 2021-LTV2, Class A1 | ||
2.519%, due 5/25/52 | 1,593,323 | 1,412,644 |
Series 2022-INV3, Class A3B | ||
3.00%, due 9/25/52 | 1,145,142 | 1,042,303 |
Mello Warehouse Securitization Trust | ||
Series 2020-2, Class A | ||
1.468% (1 Month LIBOR + 0.80%), due 11/25/53 (a)(d) | 522,000 | 519,612 |
New Residential Mortgage Loan Trust (a) | ||
Series 2019-5A, Class B7 | ||
4.403%, due 8/25/59 (i) | 5,014,524 | 3,560,082 |
Principal Amount | Value | |
Mortgage-Backed Securities (continued) | ||
Whole Loan (Collateralized Mortgage Obligations) (continued) | ||
New Residential Mortgage Loan Trust (a) (continued) | ||
Series 2019-4A, Class B6 | ||
4.705%, due 12/25/58 (j) | $ 4,459,703 | $ 3,165,850 |
Series 2019-2A, Class B6 | ||
4.929%, due 12/25/57 (j) | 1,678,231 | 1,229,783 |
STACR Trust (a)(d) | ||
Series 2018-HRP2, Class M3 | ||
3.068% (1 Month LIBOR + 2.40%), due 2/25/47 | 2,185,000 | 2,176,837 |
Series 2018-HRP2, Class B1 | ||
4.868% (1 Month LIBOR + 4.20%), due 2/25/47 | 2,290,000 | 2,275,873 |
32,701,037 | ||
Total Mortgage-Backed Securities (Cost $118,966,117) | 112,715,463 | |
Municipal Bond 0.4% | ||
California 0.4% | ||
Regents of the University of California Medical Center, Pooled Revenue Bonds | ||
Series N | ||
3.006%, due 5/15/50 | 2,655,000 | 2,096,501 |
Total Municipal Bond (Cost $2,655,000) | 2,096,501 | |
U.S. Government & Federal Agencies 14.8% | ||
Federal Home Loan Mortgage Corporation (Mortgage Pass-Through Securities) 2.5% | ||
FHLMC | ||
1.55%, due 11/20/31 | 1,720,000 | 1,486,693 |
FHLMC Gold Pools, 30 Year | ||
3.50%, due 1/1/44 | 973,026 | 962,712 |
3.50%, due 11/1/45 | 931,516 | 921,625 |
3.50%, due 3/1/46 | 1,762,062 | 1,743,372 |
4.00%, due 10/1/48 | 761,607 | 771,101 |
6.50%, due 4/1/37 | 34,140 | 37,664 |
FHLMC Gold Pools, Other | ||
4.00%, due 6/1/42 | 1,103,256 | 1,121,311 |
UMBS, 30 Year | ||
2.50%, due 3/1/52 | 1,685,253 | 1,539,778 |
3.00%, due 3/1/52 | 1,577,217 | 1,494,226 |
3.00%, due 4/1/52 | 3,395,993 | 3,213,902 |
13,292,384 | ||
Principal Amount | Value | |
Federal National Mortgage Association (Mortgage Pass-Through Securities) 2.1% | ||
FNMA, Other | ||
4.00%, due 3/1/42 | $ 587,517 | $ 600,900 |
4.00%, due 1/1/43 | 1,180,906 | 1,201,852 |
6.00%, due 4/1/37 | 5,621 | 5,879 |
UMBS, 20 Year | ||
2.50%, due 4/1/42 | 847,577 | 785,801 |
UMBS, 30 Year | ||
2.50%, due 8/1/50 | 443,777 | 406,372 |
2.50%, due 1/1/51 | 1,087,730 | 995,429 |
3.00%, due 12/1/47 | 191,791 | 183,962 |
3.00%, due 2/1/52 | 1,733,282 | 1,638,474 |
3.00%, due 3/1/52 | 1,288,009 | 1,218,935 |
3.00%, due 3/1/52 | 1,612,202 | 1,525,742 |
3.50%, due 12/1/44 | 798,633 | 789,482 |
5.50%, due 7/1/41 | 1,382,797 | 1,470,888 |
6.00%, due 7/1/39 | 283,037 | 312,790 |
6.50%, due 10/1/39 | 280,156 | 302,619 |
11,439,125 | ||
Government National Mortgage Association (Mortgage Pass-Through Securities) 0.3% | ||
GNMA II, Other | ||
2.50%, due 1/20/50 | 533,512 | 491,898 |
2.50%, due 5/20/50 | 1,335,659 | 1,220,005 |
1,711,903 | ||
United States Treasury Bonds 8.2% | ||
U.S. Treasury Bonds | ||
2.25%, due 2/15/52 | 29,820,000 | 25,603,266 |
2.375%, due 2/15/42 | 20,935,000 | 18,498,036 |
44,101,302 | ||
United States Treasury Inflation - Indexed Notes 0.6% | ||
U.S. Treasury Inflation Linked Notes (k) | ||
0.125%, due 1/15/30 | 424,555 | 430,894 |
0.875%, due 1/15/29 | 2,601,180 | 2,784,245 |
3,215,139 | ||
United States Treasury Note 1.1% | ||
U.S. Treasury Notes | ||
1.875%, due 2/15/32 (e) | 6,835,000 | 6,241,210 |
Total U.S. Government & Federal Agencies (Cost $86,795,343) | 80,001,063 | |
Total Long-Term Bonds (Cost $575,376,493) | 527,036,648 | |
20 | MainStay MacKay Total Return Bond Fund |
Shares | Value | |
Common Stocks 0.0% ‡ | ||
Commercial Services & Supplies 0.0% ‡ | ||
Quad/Graphics, Inc. (l) | 1 | $ 7 |
Total Common Stocks (Cost $0) | 7 | |
Short-Term Investments 2.6% | ||
Affiliated Investment Company 1.2% | ||
MainStay U.S. Government Liquidity Fund, 0.397% (m) | 6,725,577 | 6,725,577 |
Unaffiliated Investment Company 1.4% | ||
Invesco Government & Agency Portfolio, 0.419% (m)(n) | 7,327,412 | 7,327,412 |
Total Short-Term Investments (Cost $14,052,989) | 14,052,989 | |
Total Investments (Cost $589,429,482) | 100.4% | 541,089,644 |
Other Assets, Less Liabilities | (0.4) | (2,247,389) |
Net Assets | 100.0% | $ 538,842,255 |
† | Percentages indicated are based on Fund net assets. |
‡ | Less than one-tenth of a percent. |
(a) | May be sold to institutional investors only under Rule 144A or securities offered pursuant to Section 4(a)(2) of the Securities Act of 1933, as amended. |
(b) | Fixed to floating rate—Rate shown was the rate in effect as of April 30, 2022. |
(c) | Security is perpetual and, thus, does not have a predetermined maturity date. The date shown, if applicable, reflects the next call date. |
(d) | Floating rate—Rate shown was the rate in effect as of April 30, 2022. |
(e) | All or a portion of this security was held on loan. As of April 30, 2022, the aggregate market value of securities on loan was $7,076,994. The Fund received cash collateral with a value of $7,327,412. (See Note 2(J)) |
(f) | Illiquid security—As of April 30, 2022, the total market value deemed illiquid under procedures approved by the Board of Trustees was $365,040, which represented less than one-tenth of a percent of the Fund’s net assets. |
(g) | Step coupon—Rate shown was the rate in effect as of April 30, 2022. |
(h) | Collateralized Mortgage Obligation Interest Only Strip—Pays a fixed or variable rate of interest based on mortgage loans or mortgage pass-through securities. The principal amount of the underlying pool represents the notional amount on which the current interest was calculated. The value of these stripped securities may be particularly sensitive to changes in prevailing interest rates and are typically more sensitive to changes in prepayment rates than traditional mortgage-backed securities. |
(i) | Collateral strip rate—A bond whose interest was based on the weighted net interest rate of the collateral. The coupon rate adjusts periodically based on a predetermined schedule. Rate shown was the rate in effect as of April 30, 2022. |
(j) | Coupon rate may change based on changes of the underlying collateral or prepayments of principal. Rate shown was the rate in effect as of April 30, 2022. |
(k) | Treasury Inflation Protected Security—Pays a fixed rate of interest on a principal amount that is continuously adjusted for inflation based on the Consumer Price Index-Urban Consumers. |
(l) | Non-income producing security. |
(m) | Current yield as of April 30, 2022. |
(n) | Represents a security purchased with cash collateral received for securities on loan. |
Affiliated Investment Companies | Value, Beginning of Period | Purchases at Cost | Proceeds from Sales | Net Realized Gain/(Loss) on Sales | Change in Unrealized Appreciation/ (Depreciation) | Value, End of Period | Dividend Income | Other Distributions | Shares End of Period |
MainStay U.S. Government Liquidity Fund | $ 23,661 | $ 772,794 | $ (789,729) | $ — | $ — | $ 6,726 | $ 2 | $ — | 6,726 |
Type | Number of Contracts | Expiration Date | Value at Trade Date | Current Notional Amount | Unrealized Appreciation (Depreciation)2 |
Long Contracts | |||||
U.S. Treasury 2 Year Notes | 313 | June 2022 | $ 66,950,876 | $ 65,984,312 | $ (966,564) |
Type | Number of Contracts | Expiration Date | Value at Trade Date | Current Notional Amount | Unrealized Appreciation (Depreciation)2 |
U.S. Treasury 5 Year Notes | 169 | June 2022 | $ 19,329,270 | $ 19,041,547 | $ (287,723) |
U.S. Treasury 10 Year Notes | 478 | June 2022 | 58,119,194 | 56,956,688 | (1,162,506) |
U.S. Treasury Long Bonds | 154 | June 2022 | 22,857,174 | 21,665,875 | (1,191,299) |
Total Long Contracts | (3,608,092) | ||||
Short Contracts | |||||
U.S. Treasury 10 Year Ultra Bonds | (204) | June 2022 | (26,934,234) | (26,316,000) | 618,234 |
U.S. Treasury Ultra Bonds | (110) | June 2022 | (18,939,439) | (17,648,125) | 1,291,314 |
Total Short Contracts | 1,909,548 | ||||
Net Unrealized Depreciation | $ (1,698,544) |
1. | As of April 30, 2022, cash in the amount of $1,026,590 was on deposit with a broker or futures commission merchant for futures transactions. |
2. | Represents the difference between the value of the contracts at the time they were opened and the value as of April 30, 2022. |
Abbreviation(s): |
FHLMC—Federal Home Loan Mortgage Corp. |
FNMA—Federal National Mortgage Association |
FREMF—Freddie Mac Multifamily |
GNMA—Government National Mortgage Association |
LIBOR—London Interbank Offered Rate |
REMIC—Real Estate Mortgage Investment Conduit |
SOFR—Secured Overnight Financing Rate |
UMBS—Uniform Mortgage Backed Securities |
22 | MainStay MacKay Total Return Bond Fund |
Description | Quoted Prices in Active Markets for Identical Assets (Level 1) | Significant Other Observable Inputs (Level 2) | Significant Unobservable Inputs (Level 3) | Total |
Asset Valuation Inputs | ||||
Investments in Securities (a) | ||||
Long-Term Bonds | ||||
Asset-Backed Securities | $ — | $ 64,953,816 | $ — | $ 64,953,816 |
Corporate Bonds | — | 239,587,975 | — | 239,587,975 |
Foreign Government Bonds | — | 16,382,265 | — | 16,382,265 |
Loan Assignments | — | 11,299,565 | — | 11,299,565 |
Mortgage-Backed Securities | — | 112,715,463 | — | 112,715,463 |
Municipal Bond | — | 2,096,501 | — | 2,096,501 |
U.S. Government & Federal Agencies | — | 80,001,063 | — | 80,001,063 |
Total Long-Term Bonds | — | 527,036,648 | — | 527,036,648 |
Common Stocks | 7 | — | — | 7 |
Short-Term Investments | ||||
Affiliated Investment Company | 6,725,577 | — | — | 6,725,577 |
Unaffiliated Investment Company | 7,327,412 | — | — | 7,327,412 |
Total Short-Term Investments | 14,052,989 | — | — | 14,052,989 |
Total Investments in Securities | 14,052,996 | 527,036,648 | — | 541,089,644 |
Other Financial Instruments | ||||
Futures Contracts (b) | 1,909,548 | — | — | 1,909,548 |
Total Investments in Securities and Other Financial Instruments | $ 15,962,544 | $ 527,036,648 | $ — | $ 542,999,192 |
Liability Valuation Inputs | ||||
Other Financial Instruments | ||||
Futures Contracts (b) | $ (3,608,092) | $ — | $ — | $ (3,608,092) |
(a) | For a complete listing of investments and their industries, see the Portfolio of Investments. |
(b) | The value listed for these securities reflects unrealized appreciation (depreciation) as shown on the Portfolio of Investments. |
Assets | |
Investment in unaffiliated securities, at value (identified cost $582,703,905) including securities on loan of $7,076,994 | $534,364,067 |
Investment in affiliated investment companies, at value (identified cost $6,725,577) | 6,725,577 |
Cash denominated in foreign currencies (identified cost $157) | 139 |
Cash collateral on deposit at broker for futures contracts | 1,026,590 |
Receivables: | |
Interest | 3,777,154 |
Investment securities sold | 1,458,280 |
Fund shares sold | 11,304 |
Securities lending | 1,441 |
Other assets | 71,470 |
Total assets | 547,436,022 |
Liabilities | |
Cash collateral due to broker for TBA | 37,533 |
Cash collateral received for securities on loan | 7,327,412 |
Due to custodian | 53,809 |
Payables: | |
Fund shares redeemed | 457,061 |
Manager (See Note 3) | 199,944 |
Variation margin on futures contracts | 184,110 |
Transfer agent (See Note 3) | 153,613 |
Shareholder communication | 54,304 |
Professional fees | 47,917 |
NYLIFE Distributors (See Note 3) | 22,029 |
Custodian | 21,320 |
Trustees | 10,677 |
Accrued expenses | 9,190 |
Distributions payable | 14,848 |
Total liabilities | 8,593,767 |
Net assets | $538,842,255 |
Composition of Net Assets | |
Shares of beneficial interest outstanding (par value of $.001 per share) unlimited number of shares authorized | $56,335 |
Additional paid-in-capital | 589,463,996 |
589,520,331 | |
Total distributable earnings (loss) | (50,678,076) |
Net assets | $538,842,255 |
Class A | |
Net assets applicable to outstanding shares | $66,256,948 |
Shares of beneficial interest outstanding | 6,927,692 |
Net asset value per share outstanding | $9.56 |
Maximum sales charge (4.50% of offering price) | 0.45 |
Maximum offering price per share outstanding | $10.01 |
Investor Class | |
Net assets applicable to outstanding shares | $5,418,838 |
Shares of beneficial interest outstanding | 563,217 |
Net asset value per share outstanding | $9.62 |
Maximum sales charge (4.00% of offering price) | 0.40 |
Maximum offering price per share outstanding | $10.02 |
Class B | |
Net assets applicable to outstanding shares | $807,872 |
Shares of beneficial interest outstanding | 84,337 |
Net asset value and offering price per share outstanding | $9.58 |
Class C | |
Net assets applicable to outstanding shares | $6,595,497 |
Shares of beneficial interest outstanding | 687,571 |
Net asset value and offering price per share outstanding | $9.59 |
Class I | |
Net assets applicable to outstanding shares | $113,223,531 |
Shares of beneficial interest outstanding | 11,833,161 |
Net asset value and offering price per share outstanding | $9.57 |
Class R1 | |
Net assets applicable to outstanding shares | $26,276 |
Shares of beneficial interest outstanding | 2,748 |
Net asset value and offering price per share outstanding | $9.56 |
Class R2 | |
Net assets applicable to outstanding shares | $29,802 |
Shares of beneficial interest outstanding | 3,117 |
Net asset value and offering price per share outstanding | $9.56 |
Class R3 | |
Net assets applicable to outstanding shares | $441,350 |
Shares of beneficial interest outstanding | 46,149 |
Net asset value and offering price per share outstanding | $9.56 |
Class R6 | |
Net assets applicable to outstanding shares | $346,019,681 |
Shares of beneficial interest outstanding | 36,184,584 |
Net asset value and offering price per share outstanding | $9.56 |
24 | MainStay MacKay Total Return Bond Fund |
SIMPLE Class | |
Net assets applicable to outstanding shares | $22,460 |
Shares of beneficial interest outstanding | 2,336 |
Net asset value and offering price per share outstanding | $9.61 |
Investment Income (Loss) | |
Income | |
Interest | $12,210,958 |
Securities lending | 27,963 |
Dividends-affiliated | 2,215 |
Total income | 12,241,136 |
Expenses | |
Manager (See Note 3) | 1,824,676 |
Distribution/Service—Class A (See Note 3) | 100,191 |
Distribution/Service—Investor Class (See Note 3) | 7,780 |
Distribution/Service—Class B (See Note 3) | 4,758 |
Distribution/Service—Class C (See Note 3) | 43,774 |
Distribution/Service—Class R2 (See Note 3) | 40 |
Distribution/Service—Class R3 (See Note 3) | 1,194 |
Distribution/Service—SIMPLE Class (See Note 3) | 60 |
Transfer agent (See Note 3) | 126,944 |
Registration | 68,909 |
Professional fees | 56,593 |
Custodian | 34,185 |
Trustees | 15,067 |
Shareholder communication | 10,324 |
Shareholder service (See Note 3) | 269 |
Miscellaneous | 27,482 |
Total expenses before waiver/reimbursement | 2,322,246 |
Expense waiver/reimbursement from Manager (See Note 3) | (52,392) |
Net expenses | 2,269,854 |
Net investment income (loss) | 9,971,282 |
Realized and Unrealized Gain (Loss) | |
Net realized gain (loss) on: | |
Unaffiliated investment transactions | 2,801,150 |
Futures transactions | 2,252,720 |
Net realized gain (loss) | 5,053,870 |
Net change in unrealized appreciation (depreciation) on: | |
Unaffiliated investments | (85,824,962) |
Futures contracts | (2,587,655) |
Translation of other assets and liabilities in foreign currencies | (14) |
Net change in unrealized appreciation (depreciation) | (88,412,631) |
Net realized and unrealized gain (loss) | (83,358,761) |
Net increase (decrease) in net assets resulting from operations | $(73,387,479) |
26 | MainStay MacKay Total Return Bond Fund |
for the six months ended April 30, 2022 (Unaudited) and the year ended October 31, 2021
2022 | 2021 | |
Increase (Decrease) in Net Assets | ||
Operations: | ||
Net investment income (loss) | $9,971,282 | $34,878,905 |
Net realized gain (loss) | 5,053,870 | 24,110,893 |
Net change in unrealized appreciation (depreciation) | (88,412,631) | (27,632,885) |
Net increase (decrease) in net assets resulting from operations | (73,387,479) | 31,356,913 |
Distributions to shareholders: | ||
Class A | (3,740,557) | (3,167,863) |
Investor Class | (278,550) | (232,732) |
Class B | (39,176) | (35,371) |
Class C | (371,332) | (378,150) |
Class I | (6,411,967) | (25,753,664) |
Class R1 | (1,292) | (1,022) |
Class R2 | (1,427) | (1,173) |
Class R3 | (21,092) | (10,661) |
Class R6 | (23,087,982) | (23,894,507) |
SIMPLE Class | (1,024) | (723) |
Total distributions to shareholders | (33,954,399) | (53,475,866) |
Capital share transactions: | ||
Net proceeds from sales of shares | 29,373,885 | 246,839,503 |
Net asset value of shares issued to shareholders in reinvestment of distributions | 33,709,494 | 53,266,148 |
Cost of shares redeemed | (786,303,156) | (433,410,211) |
Increase (decrease) in net assets derived from capital share transactions | (723,219,777) | (133,304,560) |
Net increase (decrease) in net assets | (830,561,655) | (155,423,513) |
Net Assets | ||
Beginning of period | 1,369,403,910 | 1,524,827,423 |
End of period | $538,842,255 | $1,369,403,910 |
Six months ended April 30, 2022* | Year Ended October 31, | |||||
Class A | 2021 | 2020 | 2019 | 2018 | 2017 | |
Net asset value at beginning of period | $11.18 | $11.35 | $10.91 | $10.10 | $10.64 | $10.66 |
Net investment income (loss) | 0.13(a) | 0.24(a) | 0.24 | 0.27 | 0.25(a) | 0.29 |
Net realized and unrealized gain (loss) | (1.28) | (0.03) | 0.47 | 0.82 | (0.54) | (0.06) |
Total from investment operations | (1.15) | 0.21 | 0.71 | 1.09 | (0.29) | 0.23 |
Less distributions: | ||||||
From net investment income | (0.14) | (0.25) | (0.27) | (0.28) | (0.25) | (0.25) |
From net realized gain on investments | (0.33) | (0.13) | — | — | — | — |
Return of capital | — | — | — | — | (0.00)‡ | (0.00)‡ |
Total distributions | (0.47) | (0.38) | (0.27) | (0.28) | (0.25) | (0.25) |
Net asset value at end of period | $9.56 | $11.18 | $11.35 | $10.91 | $10.10 | $10.64 |
Total investment return (b) | (10.61)% | 1.86% | 6.55% | 10.88% | (2.78)% | 2.23% |
Ratios (to average net assets)/Supplemental Data: | ||||||
Net investment income (loss) | 2.47%†† | 2.14% | 2.30% | 2.63% | 2.40% | 2.44% |
Net expenses (c) | 0.83%†† | 0.83% | 0.85% | 0.88% | 0.90% | 0.91% |
Expenses (before waiver/reimbursement) (c) | 0.86%†† | 0.83% | 0.85% | 0.89% | 0.90% | 0.94% |
Portfolio turnover rate | 45%(d) | 111%(d) | 123% | 100%(d) | 95%(d) | 56%(d) |
Net assets at end of period (in 000’s) | $66,257 | $87,764 | $92,997 | $56,473 | $44,527 | $55,474 |
* | Unaudited. |
‡ | Less than one cent per share. |
†† | Annualized. |
(a) | Per share data based on average shares outstanding during the period. |
(b) | Total investment return is calculated exclusive of sales charges and assumes the reinvestment of dividends and distributions. For periods of less than one year, total return is not annualized. |
(c) | In addition to the fees and expenses which the Fund bears directly, it also indirectly bears a pro-rata share of the fees and expenses of the underlying funds in which it invests. Such indirect expenses are not included in the above expense ratios. |
(d) | The portfolio turnover rates not including mortgage dollar rolls were 43%, 108%, 96%, 63% and 42% for the six-month period ended April 30, 2022 and for the years ended October 31, 2021, 2019, 2018 and 2017, respectively. |
28 | MainStay MacKay Total Return Bond Fund |
Six months ended April 30, 2022* | Year Ended October 31, | |||||
Investor Class | 2021 | 2020 | 2019 | 2018 | 2017 | |
Net asset value at beginning of period | $11.24 | $11.42 | $10.97 | $10.15 | $10.70 | $10.71 |
Net investment income (loss) | 0.12(a) | 0.22(a) | 0.24 | 0.26 | 0.24(a) | 0.24 |
Net realized and unrealized gain (loss) | (1.28) | (0.04) | 0.46 | 0.82 | (0.56) | (0.01) |
Total from investment operations | (1.16) | 0.18 | 0.70 | 1.08 | (0.32) | 0.23 |
Less distributions: | ||||||
From net investment income | (0.13) | (0.23) | (0.25) | (0.26) | (0.23) | (0.24) |
From net realized gain on investments | (0.33) | (0.13) | — | — | — | — |
Return of capital | — | — | — | — | (0.00)‡ | (0.00)‡ |
Total distributions | (0.46) | (0.36) | (0.25) | (0.26) | (0.23) | (0.24) |
Net asset value at end of period | $9.62 | $11.24 | $11.42 | $10.97 | $10.15 | $10.70 |
Total investment return (b) | (10.66)% | 1.54% | 6.40% | 10.74% | (2.99)% | 2.11% |
Ratios (to average net assets)/Supplemental Data: | ||||||
Net investment income (loss) | 2.24%†† | 1.93% | 2.11% | 2.46% | 2.27% | 2.28% |
Net expenses (c) | 1.06%†† | 1.04% | 1.05% | 1.05% | 1.04% | 1.00% |
Expenses (before waiver/reimbursement) (c) | 1.09%†† | 1.04% | 1.05% | 1.06% | 1.05% | 1.03% |
Portfolio turnover rate | 45%(d) | 111%(d) | 123% | 100%(d) | 95%(d) | 56%(d) |
Net assets at end of period (in 000's) | $5,419 | $6,894 | $7,558 | $6,557 | $5,514 | $6,265 |
* | Unaudited. |
‡ | Less than one cent per share. |
†† | Annualized. |
(a) | Per share data based on average shares outstanding during the period. |
(b) | Total investment return is calculated exclusive of sales charges and assumes the reinvestment of dividends and distributions. For periods of less than one year, total return is not annualized. |
(c) | In addition to the fees and expenses which the Fund bears directly, it also indirectly bears a pro-rata share of the fees and expenses of the underlying funds in which it invests. Such indirect expenses are not included in the above expense ratios. |
(d) | The portfolio turnover rates not including mortgage dollar rolls were 43%, 108%, 96%, 63% and 42% for the six-month period ended April 30, 2022 and for the years ended October 31, 2021, 2019, 2018 and 2017, respectively. |
Six months ended April 30, 2022* | Year Ended October 31, | |||||
Class B | 2021 | 2020 | 2019 | 2018 | 2017 | |
Net asset value at beginning of period | $11.20 | $11.37 | $10.92 | $10.11 | $10.65 | $10.67 |
Net investment income (loss) | 0.08(a) | 0.13(a) | 0.18 | 0.20 | 0.16(a) | 0.17 |
Net realized and unrealized gain (loss) | (1.28) | (0.03) | 0.43 | 0.79 | (0.55) | (0.03) |
Total from investment operations | (1.20) | 0.10 | 0.61 | 0.99 | (0.39) | 0.14 |
Less distributions: | ||||||
From net investment income | (0.09) | (0.14) | (0.16) | (0.18) | (0.15) | (0.16) |
From net realized gain on investments | (0.33) | (0.13) | — | — | — | — |
Return of capital | — | — | — | — | (0.00)‡ | (0.00)‡ |
Total distributions | (0.42) | (0.27) | (0.16) | (0.18) | (0.15) | (0.16) |
Net asset value at end of period | $9.58 | $11.20 | $11.37 | $10.92 | $10.11 | $10.65 |
Total investment return (b) | (11.04)% | 0.85% | 5.64% | 9.85% | (3.64)% | 1.36% |
Ratios (to average net assets)/Supplemental Data: | ||||||
Net investment income (loss) | 1.49%†† | 1.17% | 1.36% | 1.73% | 1.51% | 1.53% |
Net expenses (c) | 1.81%†† | 1.79% | 1.80% | 1.80% | 1.79% | 1.75% |
Expenses (before waiver/reimbursement) (c) | 1.84%†† | 1.79% | 1.80% | 1.81% | 1.80% | 1.78% |
Portfolio turnover rate | 45%(d) | 111%(d) | 123% | 100%(d) | 95%(d) | 56%(d) |
Net assets at end of period (in 000’s) | $808 | $1,087 | $1,838 | $2,515 | $2,987 | $4,913 |
* | Unaudited. |
‡ | Less than one cent per share. |
†† | Annualized. |
(a) | Per share data based on average shares outstanding during the period. |
(b) | Total investment return is calculated exclusive of sales charges and assumes the reinvestment of dividends and distributions. For periods of less than one year, total return is not annualized. |
(c) | In addition to the fees and expenses which the Fund bears directly, it also indirectly bears a pro-rata share of the fees and expenses of the underlying funds in which it invests. Such indirect expenses are not included in the above expense ratios. |
(d) | The portfolio turnover rates not including mortgage dollar rolls were 43%, 108%, 96%, 63% and 42% for the six-month period ended April 30, 2022 and for the years ended October 31, 2021, 2019, 2018 and 2017, respectively. |
30 | MainStay MacKay Total Return Bond Fund |
Six months ended April 30, 2022* | Year Ended October 31, | |||||
Class C | 2021 | 2020 | 2019 | 2018 | 2017 | |
Net asset value at beginning of period | $11.21 | $11.38 | $10.93 | $10.12 | $10.66 | $10.68 |
Net investment income (loss) | 0.08(a) | 0.13(a) | 0.14 | 0.20 | 0.16(a) | 0.17 |
Net realized and unrealized gain (loss) | (1.28) | (0.03) | 0.47 | 0.79 | (0.55) | (0.03) |
Total from investment operations | (1.20) | 0.10 | 0.61 | 0.99 | (0.39) | 0.14 |
Less distributions: | ||||||
From net investment income | (0.09) | (0.14) | (0.16) | (0.18) | (0.15) | (0.16) |
From net realized gain on investments | (0.33) | (0.13) | — | — | — | — |
Return of capital | — | — | — | — | (0.00)‡ | (0.00)‡ |
Total distributions | (0.42) | (0.27) | (0.16) | (0.18) | (0.15) | (0.16) |
Net asset value at end of period | $9.59 | $11.21 | $11.38 | $10.93 | $10.12 | $10.66 |
Total investment return (b) | (11.03)% | 0.85% | 5.64% | 9.84% | (3.64)% | 1.36% |
Ratios (to average net assets)/Supplemental Data: | ||||||
Net investment income (loss) | 1.47%†† | 1.17% | 1.35% | 1.74% | 1.51% | 1.53% |
Net expenses (c) | 1.81%†† | 1.79% | 1.80% | 1.80% | 1.79% | 1.75% |
Expenses (before waiver/reimbursement) (c) | 1.84%†† | 1.79% | 1.80% | 1.81% | 1.80% | 1.78% |
Portfolio turnover rate | 45%(d) | 111%(d) | 123% | 100%(d) | 95%(d) | 56%(d) |
Net assets at end of period (in 000’s) | $6,595 | $10,449 | $18,434 | $11,916 | $14,837 | $20,215 |
* | Unaudited. |
‡ | Less than one cent per share. |
†† | Annualized. |
(a) | Per share data based on average shares outstanding during the period. |
(b) | Total investment return is calculated exclusive of sales charges and assumes the reinvestment of dividends and distributions. For periods of less than one year, total return is not annualized. |
(c) | In addition to the fees and expenses which the Fund bears directly, it also indirectly bears a pro-rata share of the fees and expenses of the underlying funds in which it invests. Such indirect expenses are not included in the above expense ratios. |
(d) | The portfolio turnover rates not including mortgage dollar rolls were 43%, 108%, 96%, 63% and 42% for the six-month period ended April 30, 2022 and for the years ended October 31, 2021, 2019, 2018 and 2017, respectively. |
Six months ended April 30, 2022* | Year Ended October 31, | |||||
Class I | 2021 | 2020 | 2019 | 2018 | 2017 | |
Net asset value at beginning of period | $11.18 | $11.36 | $10.91 | $10.10 | $10.64 | $10.66 |
Net investment income (loss) | 0.14(a) | 0.27(a) | 0.29 | 0.31 | 0.28(a) | 0.28 |
Net realized and unrealized gain (loss) | (1.26) | (0.04) | 0.45 | 0.81 | (0.54) | (0.01) |
Total from investment operations | (1.12) | 0.23 | 0.74 | 1.12 | (0.26) | 0.27 |
Less distributions: | ||||||
From net investment income | (0.16) | (0.28) | (0.29) | (0.31) | (0.28) | (0.29) |
From net realized gain on investments | (0.33) | (0.13) | — | — | — | — |
Return of capital | — | — | — | — | (0.00)‡ | (0.00)‡ |
Total distributions | (0.49) | (0.41) | (0.29) | (0.31) | (0.28) | (0.29) |
Net asset value at end of period | $9.57 | $11.18 | $11.36 | $10.91 | $10.10 | $10.64 |
Total investment return (b) | (10.49)% | 2.11% | 6.91% | 11.20% | (2.49)% | 2.56% |
Ratios (to average net assets)/Supplemental Data: | ||||||
Net investment income (loss) | 2.60%†† | 2.39% | 2.56% | 2.93% | 2.70% | 2.66% |
Net expenses (c) | 0.57%†† | 0.58% | 0.60% | 0.60% | 0.60% | 0.60% |
Expenses (before waiver/reimbursement) (c) | 0.61%†† | 0.58% | 0.60% | 0.64% | 0.65% | 0.67% |
Portfolio turnover rate | 45%(d) | 111%(d) | 123% | 100%(d) | 95%(d) | 56%(d) |
Net assets at end of period (in 000’s) | $113,224 | $720,466 | $686,829 | $1,056,594 | $1,016,022 | $1,173,384 |
* | Unaudited. |
‡ | Less than one cent per share. |
†† | Annualized. |
(a) | Per share data based on average shares outstanding during the period. |
(b) | Total investment return is calculated exclusive of sales charges and assumes the reinvestment of dividends and distributions. Class I shares are not subject to sales charges. For periods of less than one year, total return is not annualized. |
(c) | In addition to the fees and expenses which the Fund bears directly, it also indirectly bears a pro-rata share of the fees and expenses of the underlying funds in which it invests. Such indirect expenses are not included in the above expense ratios. |
(d) | The portfolio turnover rates not including mortgage dollar rolls were 43%, 108%, 96%, 63% and 42% for the six-month period ended April 30, 2022 and for the years ended October 31, 2021, 2019, 2018 and 2017, respectively. |
32 | MainStay MacKay Total Return Bond Fund |
Six months ended April 30, 2022* | Year Ended October 31, | |||||
Class R1 | 2021 | 2020 | 2019 | 2018 | 2017 | |
Net asset value at beginning of period | $11.18 | $11.35 | $10.90 | $10.10 | $10.64 | $10.66 |
Net investment income (loss) | 0.14(a) | 0.26(a) | 0.26 | 0.29 | 0.27(a) | 0.27 |
Net realized and unrealized gain (loss) | (1.28) | (0.03) | 0.47 | 0.80 | (0.54) | (0.01) |
Total from investment operations | (1.14) | 0.23 | 0.73 | 1.09 | (0.27) | 0.26 |
Less distributions: | ||||||
From net investment income | (0.15) | (0.27) | (0.28) | (0.29) | (0.27) | (0.28) |
From net realized gain on investments | (0.33) | (0.13) | — | — | — | — |
Return of capital | — | — | — | — | (0.00)‡ | (0.00)‡ |
Total distributions | (0.48) | (0.40) | (0.28) | (0.29) | (0.27) | (0.28) |
Net asset value at end of period | $9.56 | $11.18 | $11.35 | $10.90 | $10.10 | $10.64 |
Total investment return (b) | (10.54)% | 2.01% | 6.81% | 10.98% | (2.59)% | 2.46% |
Ratios (to average net assets)/Supplemental Data: | ||||||
Net investment income (loss) | 2.64%†† | 2.29% | 2.47% | 2.97% | 2.61% | 2.58% |
Net expenses (c) | 0.67%†† | 0.68% | 0.70% | 0.70% | 0.70% | 0.70% |
Expenses (before waiver/reimbursement) (c) | 0.71%†† | 0.68% | 0.70% | 0.74% | 0.75% | 0.77% |
Portfolio turnover rate | 45%(d) | 111%(d) | 123% | 100%(d) | 95%(d) | 56%(d) |
Net assets at end of period (in 000’s) | $26 | $29 | $29 | $27 | $4,148 | $3,627 |
* | Unaudited. |
‡ | Less than one cent per share. |
†† | Annualized. |
(a) | Per share data based on average shares outstanding during the period. |
(b) | Total investment return is calculated exclusive of sales charges and assumes the reinvestment of dividends and distributions. Class R1 shares are not subject to sales charges. For periods of less than one year, total return is not annualized. |
(c) | In addition to the fees and expenses which the Fund bears directly, it also indirectly bears a pro-rata share of the fees and expenses of the underlying funds in which it invests. Such indirect expenses are not included in the above expense ratios. |
(d) | The portfolio turnover rates not including mortgage dollar rolls were 43%, 108%, 96%, 63% and 42% for the six-month period ended April 30, 2022 and for the years ended October 31, 2021, 2019, 2018 and 2017, respectively. |
Six months ended April 30, 2022* | Year Ended October 31, | |||||
Class R2 | 2021 | 2020 | 2019 | 2018 | 2017 | |
Net asset value at beginning of period | $11.18 | $11.35 | $10.90 | $10.09 | $10.63 | $10.65 |
Net investment income (loss) | 0.12(a) | 0.23(a) | 0.25 | 0.27 | 0.24(a) | 0.24 |
Net realized and unrealized gain (loss) | (1.27) | (0.03) | 0.46 | 0.81 | (0.54) | (0.01) |
Total from investment operations | (1.15) | 0.20 | 0.71 | 1.08 | (0.30) | 0.23 |
Less distributions: | ||||||
From net investment income | (0.14) | (0.24) | (0.26) | (0.27) | (0.24) | (0.25) |
From net realized gain on investments | (0.33) | (0.13) | — | — | — | — |
Return of capital | — | — | — | — | (0.00)‡ | (0.00)‡ |
Total distributions | (0.47) | (0.37) | (0.26) | (0.27) | (0.24) | (0.25) |
Net asset value at end of period | $9.56 | $11.18 | $11.35 | $10.90 | $10.09 | $10.63 |
Total investment return (b) | (10.65)% | 1.75% | 6.54% | 10.82% | (2.83)% | 2.18% |
Ratios (to average net assets)/Supplemental Data: | ||||||
Net investment income (loss) | 2.39%†† | 2.02% | 2.21% | 2.57% | 2.35% | 2.32% |
Net expenses (c) | 0.92%†† | 0.93% | 0.95% | 0.95% | 0.95% | 0.95% |
Expenses (before waiver/reimbursement) (c) | 0.96%†† | 0.93% | 0.95% | 0.99% | 1.00% | 1.02% |
Portfolio turnover rate | 45%(d) | 111%(d) | 123% | 100%(d) | 95%(d) | 56%(d) |
Net assets at end of period (in 000’s) | $30 | $33 | $87 | $81 | $73 | $127 |
* | Unaudited. |
‡ | Less than one cent per share. |
†† | Annualized. |
(a) | Per share data based on average shares outstanding during the period. |
(b) | Total investment return is calculated exclusive of sales charges and assumes the reinvestment of dividends and distributions. Class R2 shares are not subject to sales charges. For periods of less than one year, total return is not annualized. |
(c) | In addition to the fees and expenses which the Fund bears directly, it also indirectly bears a pro-rata share of the fees and expenses of the underlying funds in which it invests. Such indirect expenses are not included in the above expense ratios. |
(d) | The portfolio turnover rates not including mortgage dollar rolls were 43%, 108%, 96%, 63% and 42% for the six-month period ended April 30, 2022 and for the years ended October 31, 2021, 2019, 2018 and 2017, respectively. |
34 | MainStay MacKay Total Return Bond Fund |
Six months ended April 30, 2022* | Year Ended October 31, | |||||
Class R3 | 2021 | 2020 | 2019 | 2018 | 2017 | |
Net asset value at beginning of period | $11.18 | $11.35 | $10.90 | $10.10 | $10.64 | $10.66 |
Net investment income (loss) | 0.11(a) | 0.20(a) | 0.22 | 0.24 | 0.22(a) | 0.21 |
Net realized and unrealized gain (loss) | (1.27) | (0.03) | 0.46 | 0.80 | (0.54) | (0.01) |
Total from investment operations | (1.16) | 0.17 | 0.68 | 1.04 | (0.32) | 0.20 |
Less distributions: | ||||||
From net investment income | (0.13) | (0.21) | (0.23) | (0.24) | (0.22) | (0.22) |
From net realized gain on investments | (0.33) | (0.13) | — | — | — | — |
Return of capital | — | — | — | — | (0.00)‡ | (0.00)‡ |
Total distributions | (0.46) | (0.34) | (0.23) | (0.24) | (0.22) | (0.22) |
Net asset value at end of period | $9.56 | $11.18 | $11.35 | $10.90 | $10.10 | $10.64 |
Total investment return (b) | (10.75)% | 1.50% | 6.28% | 10.44% | (3.08)% | 1.93% |
Ratios (to average net assets)/Supplemental Data: | ||||||
Net investment income (loss) | 2.15%†† | 1.79% | 1.96% | 2.30% | 2.15% | 2.07% |
Net expenses (c) | 1.16%†† | 1.18% | 1.20% | 1.20% | 1.20% | 1.20% |
Expenses (before waiver/reimbursement) (c) | 1.21%†† | 1.18% | 1.20% | 1.24% | 1.24% | 1.27% |
Portfolio turnover rate | 45%(d) | 111%(d) | 123% | 100%(d) | 95%(d) | 56%(d) |
Net assets at end of period (in 000’s) | $441 | $509 | $329 | $251 | $173 | $93 |
* | Unaudited. |
‡ | Less than one cent per share. |
†† | Annualized. |
(a) | Per share data based on average shares outstanding during the period. |
(b) | Total investment return is calculated exclusive of sales charges and assumes the reinvestment of dividends and distributions. Class R3 shares are not subject to sales charges. For periods of less than one year, total return is not annualized. |
(c) | In addition to the fees and expenses which the Fund bears directly, it also indirectly bears a pro-rata share of the fees and expenses of the underlying funds in which it invests. Such indirect expenses are not included in the above expense ratios. |
(d) | The portfolio turnover rates not including mortgage dollar rolls were 43%, 108%, 96%, 63% and 42% for the six-month period ended April 30, 2022 and for the years ended October 31, 2021, 2019, 2018 and 2017, respectively. |
Six months ended April 30, 2022* | Year Ended October 31, | |||||
Class R6 | 2021 | 2020 | 2019 | 2018 | 2017 | |
Net asset value at beginning of period | $11.18 | $11.35 | $10.91 | $10.10 | $10.64 | $10.66 |
Net investment income (loss) | 0.14(a) | 0.27(a) | 0.28 | 0.30 | 0.29(a) | 0.29 |
Net realized and unrealized gain (loss) | (1.27) | (0.02) | 0.46 | 0.82 | (0.54) | (0.02) |
Total from investment operations | (1.13) | 0.25 | 0.74 | 1.12 | (0.25) | 0.27 |
Less distributions: | ||||||
From net investment income | (0.16) | (0.29) | (0.30) | (0.31) | (0.29) | (0.29) |
From net realized gain on investments | (0.33) | (0.13) | — | — | — | — |
Return of capital | — | — | — | — | (0.00)‡ | (0.00)‡ |
Total distributions | (0.49) | (0.42) | (0.30) | (0.31) | (0.29) | (0.29) |
Net asset value at end of period | $9.56 | $11.18 | $11.35 | $10.91 | $10.10 | $10.64 |
Total investment return (b) | (10.48)% | 2.16% | 6.89% | 11.27% | (2.42)% | 2.62% |
Ratios (to average net assets)/Supplemental Data: | ||||||
Net investment income (loss) | 2.73%†† | 2.43% | 2.61% | 2.98% | 2.81% | 2.74% |
Net expenses (c) | 0.55%†† | 0.53% | 0.53% | 0.53% | 0.53% | 0.54% |
Portfolio turnover rate | 45%(d) | 111%(d) | 123% | 100%(d) | 95%(d) | 56%(d) |
Net assets at end of period (in 000’s) | $346,020 | $542,147 | $716,703 | $185,733 | $119,963 | $27 |
* | Unaudited. |
‡ | Less than one cent per share. |
†† | Annualized. |
(a) | Per share data based on average shares outstanding during the period. |
(b) | Total investment return is calculated exclusive of sales charges and assumes the reinvestment of dividends and distributions. Class R6 shares are not subject to sales charges. For periods of less than one year, total return is not annualized. |
(c) | In addition to the fees and expenses which the Fund bears directly, it also indirectly bears a pro-rata share of the fees and expenses of the underlying funds in which it invests. Such indirect expenses are not included in the above expense ratios. |
(d) | The portfolio turnover rates not including mortgage dollar rolls were 43%, 108%, 96%, 63% and 42% for the six-month period ended April 30, 2022 and for the years ended October 31, 2021, 2019, 2018 and 2017, respectively. |
36 | MainStay MacKay Total Return Bond Fund |
Six months ended April 30, 2022* | Year Ended October 31, | August 31, 2020^ through October 31, | |
SIMPLE Class | 2021 | 2020 | |
Net asset value at beginning of period | $11.24 | $11.41 | $11.52** |
Net investment income (loss) | 0.10(a) | 0.19(a) | 0.03 |
Net realized and unrealized gain (loss) | (1.28) | (0.03) | (0.11) |
Total from investment operations | (1.18) | 0.16 | (0.08) |
Less distributions: | |||
From net investment income | (0.12) | (0.20) | (0.03) |
From net realized gain on investments | (0.33) | (0.13) | — |
Total distributions | (0.45) | (0.33) | (0.03) |
Net asset value at end of period | $9.61 | $11.24 | $11.41 |
Total investment return (b) | (10.76)% | 1.39% | (0.66)% |
Ratios (to average net assets)/Supplemental Data: | |||
Net investment income (loss) | 2.00%†† | 1.69% | 1.80%†† |
Net expenses (c) | 1.31%†† | 1.29% | 1.26%†† |
Expenses (before waiver/reimbursement) (c) | 1.34%†† | 1.29% | 1.26%†† |
Portfolio turnover rate | 45%(d) | 111%(d) | 123% |
Net assets at end of period (in 000’s) | $22 | $25 | $25 |
* | Unaudited. |
^ | Inception date. |
** | Based on the net asset value of Investor Class as of August 31, 2020. |
†† | Annualized. |
(a) | Per share data based on average shares outstanding during the period. |
(b) | Total investment return is calculated exclusive of sales charges and assumes the reinvestment of dividends and distributions. SIMPLE Class shares are not subject to sales charges. For periods of less than one year, total return is not annualized. |
(c) | In addition to the fees and expenses which the Fund bears directly, it also indirectly bears a pro-rata share of the fees and expenses of the underlying funds in which it invests. Such indirect expenses are not included in the above expense ratios. |
(d) | The portfolio turnover rates not including mortgage dollar rolls were 43% and 108% for the six-month period ended April 30, 2022 and for the year ended October 31, 2021 respectively. |
Class | Commenced Operations |
Class A | January 2, 2004 |
Investor Class | February 28, 2008 |
Class B | January 2, 2004 |
Class C | January 2, 2004 |
Class I | January 2, 1991 |
Class R1 | June 29, 2012 |
Class R2 | June 29, 2012 |
Class R3 | February 29, 2016 |
Class R6 | December 29, 2014 |
SIMPLE Class | August 31, 2020 |
38 | MainStay MacKay Total Return Bond Fund |
• Benchmark yields | • Reported trades |
• Broker/dealer quotes | • Issuer spreads |
• Two-sided markets | • Benchmark securities |
• Bids/offers | • Reference data (corporate actions or material event notices) |
• Industry and economic events | • Comparable bonds |
• Monthly payment information |
40 | MainStay MacKay Total Return Bond Fund |
42 | MainStay MacKay Total Return Bond Fund |
Asset Derivatives | Interest Rate Contracts Risk | Total |
Futures Contracts - Net Assets—Net unrealized appreciation on futures contracts (a) | $1,909,548 | $1,909,548 |
Total Fair Value | $1,909,548 | $1,909,548 |
(a) | Includes cumulative appreciation (depreciation) of futures contracts as reported in the Portfolio of Investments. Only current day’s variation margin is reported within the Statement of Assets and Liabilities. |
Liability Derivatives | Interest Rate Contracts Risk | Total |
Futures Contracts - Net Assets—Net unrealized depreciation on futures contracts (a) | $(3,608,092) | $(3,608,092) |
Total Fair Value | $(3,608,092) | $(3,608,092) |
(a) | Includes cumulative appreciation (depreciation) of futures contracts as reported in the Portfolio of Investments. Only current day’s variation margin is reported within the Statement of Assets and Liabilities. |
Net Realized Gain (Loss) from: | Interest Rate Contracts Risk | Total |
Futures Contracts | $2,252,720 | $2,252,720 |
Total Net Realized Gain (Loss) | $2,252,720 | $2,252,720 |
Net Change in Unrealized Appreciation (Depreciation) | Interest Rate Contracts Risk | Total |
Futures Contracts | $(2,587,655) | $(2,587,655) |
Total Net Change in Unrealized Appreciation (Depreciation) | $(2,587,655) | $(2,587,655) |
Average Notional Amount | Total |
Futures Contracts Long | $165,071,506 |
Futures Contracts Short | $(65,796,747) |
44 | MainStay MacKay Total Return Bond Fund |
Class R1 | $14 |
Class R2 | 16 |
Class R3 | 239 |
Class | Expense | Waived |
Class A | $27,116 | $— |
Investor Class | 9,362 | — |
Class B | 1,432 | — |
Class C | 13,178 | — |
Class I | 66,332 | — |
Class R1 | 9 | — |
Class R2 | 11 | — |
Class R3 | 160 | — |
Class R6 | 9,308 | — |
SIMPLE Class | 36 | — |
Class I | $392,125 | 0.3% |
Class R1 | 26,190 | 99.7 |
Class R2 | 29,716 | 99.7 |
Class R3 | 27,500 | 6.2 |
Class R6 | 28,578 | 0.0 |
SIMPLE Class | 22,419 | 99.8 |
Federal Tax Cost | Gross Unrealized Appreciation | Gross Unrealized (Depreciation) | Net Unrealized Appreciation/ (Depreciation) | |
Investments in Securities | $593,972,660 | $2,339,841 | $(55,222,857) | $(52,883,016) |
2021 | |
Distributions paid from: | |
Ordinary Income | $53,475,866 |
46 | MainStay MacKay Total Return Bond Fund |
Class A | Shares | Amount |
Six-month period ended April 30, 2022: | ||
Shares sold | 531,731 | $5,713,893 |
Shares issued to shareholders in reinvestment of distributions | 330,490 | 3,523,492 |
Shares redeemed | (1,810,627) | (18,702,276) |
Net increase (decrease) in shares outstanding before conversion | (948,406) | (9,464,891) |
Shares converted into Class A (See Note 1) | 26,779 | 281,729 |
Net increase (decrease) | (921,627) | $(9,183,162) |
Year ended October 31, 2021: | ||
Shares sold | 2,260,020 | $25,590,021 |
Shares issued to shareholders in reinvestment of distributions | 263,448 | 2,981,303 |
Shares redeemed | (3,060,427) | (34,411,605) |
Net increase (decrease) in shares outstanding before conversion | (536,959) | (5,840,281) |
Shares converted into Class A (See Note 1) | 194,947 | 2,182,908 |
Net increase (decrease) | (342,012) | $(3,657,373) |
Investor Class | Shares | Amount |
Six-month period ended April 30, 2022: | ||
Shares sold | 12,942 | $136,531 |
Shares issued to shareholders in reinvestment of distributions | 25,716 | 275,965 |
Shares redeemed | (76,367) | (801,314) |
Net increase (decrease) in shares outstanding before conversion | (37,709) | (388,818) |
Shares converted into Investor Class (See Note 1) | 7,049 | 74,062 |
Shares converted from Investor Class (See Note 1) | (19,233) | (205,138) |
Net increase (decrease) | (49,893) | $(519,894) |
Year ended October 31, 2021: | ||
Shares sold | 75,590 | $859,257 |
Shares issued to shareholders in reinvestment of distributions | 19,814 | 225,480 |
Shares redeemed | (108,873) | (1,235,375) |
Net increase (decrease) in shares outstanding before conversion | (13,469) | (150,638) |
Shares converted into Investor Class (See Note 1) | 61,170 | 687,297 |
Shares converted from Investor Class (See Note 1) | (96,625) | (1,096,170) |
Net increase (decrease) | (48,924) | $(559,511) |
Class B | Shares | Amount |
Six-month period ended April 30, 2022: | ||
Shares sold | 190 | $2,046 |
Shares issued to shareholders in reinvestment of distributions | 3,455 | 37,002 |
Shares redeemed | (11,766) | (123,302) |
Net increase (decrease) in shares outstanding before conversion | (8,121) | (84,254) |
Shares converted from Class B (See Note 1) | (4,609) | (48,944) |
Net increase (decrease) | (12,730) | $(133,198) |
Year ended October 31, 2021: | ||
Shares sold | 11,728 | $132,191 |
Shares issued to shareholders in reinvestment of distributions | 2,964 | 33,697 |
Shares redeemed | (55,906) | (630,652) |
Net increase (decrease) in shares outstanding before conversion | (41,214) | (464,764) |
Shares converted from Class B (See Note 1) | (23,433) | (266,870) |
Net increase (decrease) | (64,647) | $(731,634) |
Class C | Shares | Amount |
Six-month period ended April 30, 2022: | ||
Shares sold | 31,825 | $329,413 |
Shares issued to shareholders in reinvestment of distributions | 34,524 | 370,778 |
Shares redeemed | (300,906) | (3,132,397) |
Net increase (decrease) in shares outstanding before conversion | (234,557) | (2,432,206) |
Shares converted from Class C (See Note 1) | (9,892) | (101,709) |
Net increase (decrease) | (244,449) | $(2,533,915) |
Year ended October 31, 2021: | ||
Shares sold | 148,429 | $1,693,193 |
Shares issued to shareholders in reinvestment of distributions | 33,112 | 377,071 |
Shares redeemed | (738,618) | (8,285,459) |
Net increase (decrease) in shares outstanding before conversion | (557,077) | (6,215,195) |
Shares converted from Class C (See Note 1) | (130,752) | (1,452,114) |
Net increase (decrease) | (687,829) | $(7,667,309) |
Class I | Shares | Amount |
Six-month period ended April 30, 2022: | ||
Shares sold | 1,252,130 | $13,534,642 |
Shares issued to shareholders in reinvestment of distributions | 600,876 | 6,406,005 |
Shares redeemed | (54,433,633) | (605,354,939) |
Net increase (decrease) | (52,580,627) | $(585,414,292) |
Year ended October 31, 2021: | ||
Shares sold | 12,093,691 | $136,796,966 |
Shares issued to shareholders in reinvestment of distributions | 2,275,535 | 25,746,253 |
Shares redeemed | (10,428,368) | (118,152,762) |
Net increase (decrease) | 3,940,858 | $44,390,457 |
Class R1 | Shares | Amount |
Six-month period ended April 30, 2022: | ||
Shares issued to shareholders in reinvestment of distributions | 122 | $1,291 |
Net increase (decrease) | 122 | $1,291 |
Year ended October 31, 2021: | ||
Shares issued to shareholders in reinvestment of distributions | 90 | $1,021 |
Net increase (decrease) | 90 | $1,021 |
Class R2 | Shares | Amount |
Six-month period ended April 30, 2022: | ||
Shares issued to shareholders in reinvestment of distributions | 134 | $1,426 |
Net increase (decrease) | 134 | $1,426 |
Year ended October 31, 2021: | ||
Shares issued to shareholders in reinvestment of distributions | 104 | $1,173 |
Net increase (decrease) in shares outstanding before conversion | 104 | 1,173 |
Shares converted from Class R2 (See Note 1) | (4,762) | (55,051) |
Net increase (decrease) | (4,658) | $(53,878) |
Class R3 | Shares | Amount |
Six-month period ended April 30, 2022: | ||
Shares sold | 2,141 | $21,727 |
Shares issued to shareholders in reinvestment of distributions | 425 | 4,530 |
Shares redeemed | (1,973) | (20,309) |
Net increase (decrease) | 593 | $5,948 |
Year ended October 31, 2021: | ||
Shares sold | 24,213 | $274,076 |
Shares issued to shareholders in reinvestment of distributions | 434 | 4,920 |
Shares redeemed | (8,055) | (90,866) |
Net increase (decrease) | 16,592 | $188,130 |
48 | MainStay MacKay Total Return Bond Fund |
Class R6 | Shares | Amount |
Six-month period ended April 30, 2022: | ||
Shares sold | 931,967 | $9,635,633 |
Shares issued to shareholders in reinvestment of distributions | 2,163,529 | 23,087,981 |
Shares redeemed | (15,403,591) | (158,168,619) |
Net increase (decrease) | (12,308,095) | $(125,445,005) |
Year ended October 31, 2021: | ||
Shares sold | 7,210,759 | $81,493,799 |
Shares issued to shareholders in reinvestment of distributions | 2,110,987 | 23,894,507 |
Shares redeemed | (23,956,446) | (270,603,492) |
Net increase (decrease) | (14,634,700) | $(165,215,186) |
SIMPLE Class | Shares | Amount |
Six-month period ended April 30, 2022: | ||
Shares issued to shareholders in reinvestment of distributions | 96 | $1,024 |
Net increase (decrease) | 96 | $1,024 |
Year ended October 31, 2021: | ||
Shares issued to shareholders in reinvestment of distributions | 63 | $723 |
Net increase (decrease) | 63 | $723 |
50 | MainStay MacKay Total Return Bond Fund |
52 | MainStay MacKay Total Return Bond Fund |
54 | MainStay MacKay Total Return Bond Fund |
For more information
Message from the President and Semiannual Report
please log in to newyorklifeinvestments.com/accounts.
Not FDIC/NCUA Insured | Not a Deposit | May Lose Value | No Bank Guarantee | Not Insured by Any Government Agency |


5 | |
9 | |
11 | |
17 | |
24 | |
33 | |
37 | |
38 | |
38 |
Investors should refer to the Fund’s Summary Prospectus and/or Prospectus and consider the Fund’s investment objectives, strategies, risks, charges and expenses carefully before investing. The Summary Prospectus and/or Prospectus contain this and other information about the Fund. You may obtain copies of the Fund’s Summary Prospectus, Prospectus and Statement of Additional Information, which includes information about MainStay Funds Trust's Trustees, free of charge, upon request, by calling toll-free 800-624-6782, by writing to NYLIFE Distributors LLC, Attn: MainStay Marketing Department, 30 Hudson Street, Jersey City, NJ 07302 or by sending an e-mail to MainStayShareholderServices@nylim.com. These documents are also available via the MainStay Funds’ website at newyorklifeinvestments.com. Please read the Fund’s Summary Prospectus and/or Prospectus carefully before investing.

Average Annual Total Returns for the Period-Ended April 30, 2022 | ||||||||
Class | Sales Charge | Inception Date | Six Months1 | One Year | Five Years | Ten Years or Since Inception | Gross Expense Ratio2 | |
Class A Shares3 | Maximum 1% Initial Sales Charge | With sales charges | 1/2/2004 | -4.76% | -5.10% | 0.89% | 1.20% | 0.77% |
Excluding sales charges | -3.79 | -4.14 | 1.51 | 1.51 | 0.77 | |||
Investor Class Shares3, 4 | Maximum 0.5% Initial Sales Charge | With sales charges | 2/28/2008 | -4.42 | -4.85 | 0.63 | 1.00 | 1.29 |
Excluding sales charges | -3.94 | -4.38 | 1.25 | 1.30 | 1.29 | |||
Class I Shares | No Sales Charge | 1/2/1991 | -3.62 | -3.81 | 1.79 | 1.83 | 0.52 | |
SIMPLE Class Shares | No Sales Charge | 8/31/2020 | -4.04 | -4.60 | N/A | -2.44 | 1.54 | |
1. | Not annualized. |
2. | The gross expense ratios presented reflect the Fund’s “Total Annual Fund Operating Expenses” from the most recent Prospectus, as supplemented, and may differ from other expense ratios disclosed in this report. |
3. | Prior to February 28, 2020, the maximum initial sales charge applicable was 3%, which is reflected in the applicable average annual total return figures shown. |
4. | Prior to June 30, 2020, the maximum initial sales charge was 1%, which is reflected in the applicable average annual total return figures shown. |
Benchmark Performance* | Six Months1 | One Year | Five Years | Ten Years |
Bloomberg 1-3 Year U.S. Government/Credit Bond Index2 | -3.24% | -3.50% | 1.11% | 1.02% |
Morningstar U.S. Fund Short-Term Bond Category Average3 | -4.15 | -4.15 | 1.15 | 1.24 |
* | Returns for indices reflect no deductions for fees, expenses or taxes, except for foreign withholding taxes where applicable. |
1. | Not annualized. |
2. | The Bloomberg 1-3 Year U.S. Government/Credit Bond Index is the Fund's primary broad-based securities market index for comparison purposes. The Bloomberg 1-3 Year U.S. Government/Credit Bond Index is an unmanaged index comprised of investment grade, U.S. dollar denominated, fixed-rate Treasurys, government-related and corporate securities, with maturities of one to three years. Results assume reinvestment of all income. |
3. | The Morningstar U.S. Fund Short-Term Bond Category Average is representative of funds that invest primarily in corporate and other investment-grade U.S. fixed-income issues and typically have durations of 1.0 to 3.5 years. These portfolios are attractive to fairly conservative investors, because they are less sensitive to interest rates than portfolios with longer durations. Morningstar calculates monthly breakpoints using the effective duration of the Morningstar Core Bond Index in determining duration assignment. Short-term is defined as 25% to 75% of the three-year average effective duration of the MCBI. Results are based on average total returns of similar funds with all dividends and capital gain distributions reinvested. |
6 | MainStay Short Term Bond Fund |
Share Class | Beginning Account Value 11/1/21 | Ending Account Value (Based on Actual Returns and Expenses) 4/30/22 | Expenses Paid During Period1 | Ending Account Value (Based on Hypothetical 5% Annualized Return and Actual Expenses) 4/30/22 | Expenses Paid During Period1 | Net Expense Ratio During Period2 |
Class A Shares | $1,000.00 | $962.10 | $3.60 | $1,021.13 | $3.71 | 0.74% |
Investor Class Shares | $1,000.00 | $960.60 | $4.47 | $1,020.23 | $4.61 | 0.92% |
Class I Shares | $1,000.00 | $963.80 | $1.95 | $1,022.81 | $2.01 | 0.40% |
SIMPLE Class Shares | $1,000.00 | $959.60 | $5.68 | $1,018.99 | $5.86 | 1.17% |
1. | Expenses are equal to the Fund’s annualized expense ratio of each class multiplied by the average account value over the period, divided by 365 and multiplied by 181 (to reflect the six-month period). The table above represents the actual expenses incurred during the six-month period. In addition to the fees and expenses which the Fund bears directly, it also indirectly bears a pro rata share of the fees and expenses of the underlying funds in which it invests. Such indirect expenses are not included in the above-reported expense figures. |
2. | Expenses are equal to the Fund's annualized expense ratio to reflect the six-month period. |
Portfolio Composition as of April 30, 2022 (Unaudited)

Top Ten Holdings and/or Issuers Held as of April 30, 2022 (excluding short-term investments) (Unaudited)
1. | U.S. Treasury Notes, 1.875%-2.625%, due 4/15/25–2/15/32 |
2. | FHLB, 2.50%-4.00%, due 4/20/26–5/26/27 |
3. | FHLMC, Multifamily Structured Pass-Through Certificates, 0.831%-1.81%, due 3/25/30–7/25/31 |
4. | American Express Co., 3.375%, due 5/3/24 |
5. | Commercial Mortgage Trust, 3.086%, due 4/12/35 |
6. | Mizuho Financial Group, Inc., 1.653%, due 9/13/23 |
7. | HSBC Holdings plc, 4.25%, due 8/18/25 |
8. | AerCap Ireland Capital DAC, 1.65%, due 10/29/24 |
9. | NextEra Energy Capital Holdings, Inc., 0.567%, due 11/3/23 |
10. | Voya CLO Ltd., 2.213%-2.594%, due 4/15/31–10/20/34 |
8 | MainStay Short Term Bond Fund |
10 | MainStay Short Term Bond Fund |
Principal Amount | Value | |
Long-Term Bonds 91.9% | ||
Asset-Backed Securities 17.3% | ||
Other Asset-Backed Securities 17.3% | ||
Aligned Data Centers Issuer LLC | ||
Series 2021-1A, Class A2 | ||
1.937%, due 8/15/46 (a) | $ 500,000 | $ 451,600 |
Apidos CLO XXX | ||
Series XXXA, Class A2 | ||
2.644% (3 Month LIBOR + 1.60%), due 10/18/31 (a)(b) | 500,000 | 493,811 |
Apidos CLO XXXII | ||
Series 2019-32A, Class A1 | ||
2.383% (3 Month LIBOR + 1.32%), due 1/20/33 (a)(b) | 500,000 | 499,055 |
Aqua Finance Trust (a) | ||
Series 2021-A, Class A | ||
1.54%, due 7/17/46 | 530,758 | 500,448 |
Series 2020-AA, Class A | ||
1.90%, due 7/17/46 | 357,834 | 346,086 |
ARES XXXIV CLO Ltd. | ||
Series 2015-2A, Class AR2 | ||
2.294% (3 Month LIBOR + 1.25%), due 4/17/33 (a)(b) | 500,000 | 497,118 |
ARES XXXVIII CLO Ltd. | ||
Series 2015-38A, Class BR | ||
2.463% (3 Month LIBOR + 1.40%), due 4/20/30 (a)(b) | 500,000 | 491,203 |
Battalion CLO 17 Ltd. | ||
Series 2021-17A, Class A1 | ||
2.323% (3 Month LIBOR + 1.26%), due 3/9/34 (a)(b) | 250,000 | 248,669 |
CAL Funding IV Ltd. | ||
Series 2020-1A, Class A | ||
2.22%, due 9/25/45 (a) | 649,062 | 596,113 |
Carlyle US CLO Ltd. | ||
Series 2021-5A, Class B | ||
2.663% (3 Month LIBOR + 1.60%), due 7/20/34 (a)(b) | 500,000 | 491,299 |
Cedar Funding XII CLO Ltd. | ||
Series 2020-12A, Class A1R | ||
2.314% (3 Month LIBOR + 1.13%), due 10/25/34 (a)(b) | 500,000 | 492,097 |
College Avenue Student Loans LLC (a) | ||
Series 2021-A, Class A2 | ||
1.60%, due 7/25/51 | 362,478 | 328,438 |
Series 2021-B, Class A2 | ||
1.76%, due 6/25/52 | 293,154 | 270,751 |
Principal Amount | Value | |
Other Asset-Backed Securities (continued) | ||
Cook Park CLO Ltd. | ||
Series 2018-1A, Class B | ||
2.444% (3 Month LIBOR + 1.40%), due 4/17/30 (a)(b) | $ 500,000 | $ 493,138 |
Dewolf Park CLO Ltd. | ||
Series 2017-1A, Class BR | ||
2.494% (3 Month LIBOR + 1.45%), due 10/15/30 (a)(b) | 500,000 | 496,099 |
EDvestinU Private Education Loan Issue No. 3 LLC | ||
Series 2021-A, Class A | ||
1.80%, due 11/25/45 (a) | 384,864 | 349,581 |
ELFI Graduate Loan Program LLC | ||
Series 2021-A, Class A | ||
1.53%, due 12/26/46 (a) | 348,138 | 320,118 |
Global SC Finance VII SRL | ||
Series 2021-2A, Class A | ||
1.95%, due 8/17/41 (a) | 371,427 | 338,422 |
MVW Owner Trust | ||
Series 2017-1A, Class A | ||
2.42%, due 12/20/34 (a) | 33,928 | 33,622 |
Neuberger Berman CLO XIV Ltd. | ||
Series 2013-14A, Class BR2 | ||
2.738% (3 Month LIBOR + 1.50%), due 1/28/30 (a)(b) | 500,000 | 494,635 |
Neuberger Berman Loan Advisers CLO 33 Ltd. | ||
Series 2019-33A, Class BR | ||
2.644% (3 Month LIBOR + 1.60%), due 10/16/33 (a)(b) | 500,000 | 494,181 |
Oak Street Investment Grade Net Lease Fund | ||
Series 2020-1A, Class A1 | ||
1.85%, due 11/20/50 (a) | 311,119 | 288,177 |
Oaktree CLO Ltd. | ||
Series 2015-1A, Class A2BR | ||
2.413% (3 Month LIBOR + 1.35%), due 10/20/27 (a)(b) | 500,000 | 499,336 |
Palmer Square CLO Ltd. | ||
Series 2015-2A, Class A2R2 | ||
2.613% (3 Month LIBOR + 1.55%), due 7/20/30 (a)(b) | 500,000 | 496,229 |
Romark CLO IV Ltd. | ||
Series 2021-4A, Class A1 | ||
2.159% (3 Month LIBOR + 1.17%), due 7/10/34 (a)(b) | 500,000 | 490,524 |
Sixth Street CLO XVII Ltd. | ||
Series 2021-17A, Class A | ||
2.303% (3 Month LIBOR + 1.24%), due 1/20/34 (a)(b) | 300,000 | 298,257 |
Principal Amount | Value | |
Asset-Backed Securities (continued) | ||
Other Asset-Backed Securities (continued) | ||
Vantage Data Centers Issuer LLC | ||
Series 2020-1A, Class A2 | ||
1.645%, due 9/15/45 (a) | $ 350,000 | $ 320,605 |
Vibrant CLO X Ltd. | ||
Series 2018-10A, Class A1 | ||
2.263% (3 Month LIBOR + 1.20%), due 10/20/31 (a)(b) | 500,000 | 494,800 |
Voya CLO Ltd. (a)(b) | ||
Series 2021-2A, Class A | ||
2.213% (3 Month LIBOR + 1.15%), due 10/20/34 | 500,000 | 492,371 |
Series 2019-1A, Class BR | ||
2.594% (3 Month LIBOR + 1.55%), due 4/15/31 | 500,000 | 491,207 |
Total Asset-Backed Securities (Cost $13,031,111) | 12,597,990 | |
Corporate Bonds 54.9% | ||
Auto Manufacturers 6.3% | ||
American Honda Finance Corp. | ||
0.55%, due 7/12/24 | 700,000 | 660,945 |
Daimler Trucks Finance North America LLC | ||
1.625%, due 12/13/24 (a) | 825,000 | 783,430 |
Ford Motor Credit Co. LLC | ||
3.087%, due 1/9/23 | 275,000 | 275,242 |
3.664%, due 9/8/24 | 600,000 | 580,500 |
General Motors Financial Co., Inc. | ||
1.05%, due 3/8/24 | 750,000 | 715,920 |
Hyundai Capital America | ||
1.30%, due 1/8/26 (a) | 750,000 | 673,765 |
Nissan Motor Acceptance Co. LLC | ||
1.125%, due 9/16/24 (a) | 750,000 | 696,995 |
Volkswagen Group of America Finance LLC | ||
1.25%, due 11/24/25 (a) | 200,000 | 182,174 |
4,568,971 | ||
Auto Parts & Equipment 0.4% | ||
Aptiv plc | ||
2.396%, due 2/18/25 | 300,000 | 288,475 |
Banks 14.2% | ||
Banco Santander SA | ||
2.746%, due 5/28/25 | 200,000 | 191,177 |
Bank of America Corp. | ||
4.20%, due 8/26/24 | 700,000 | 706,428 |
Principal Amount | Value | |
Banks (continued) | ||
BNP Paribas SA | ||
4.25%, due 10/15/24 | $ 850,000 | $ 858,399 |
Citigroup, Inc. | ||
1.462%, due 6/9/27 (c) | 600,000 | 534,048 |
Credit Suisse Group AG | ||
1.305%, due 2/2/27 (a)(c) | 500,000 | 438,016 |
Goldman Sachs Group, Inc. (The) | ||
1.757%, due 1/24/25 (c) | 500,000 | 482,786 |
HSBC Holdings plc | ||
4.25%, due 8/18/25 | 1,075,000 | 1,075,959 |
ING Bank NV | ||
5.80%, due 9/25/23 (a) | 750,000 | 769,973 |
JPMorgan Chase & Co. | ||
1.561%, due 12/10/25 (c) | 600,000 | 564,785 |
Lloyds Banking Group plc | ||
0.695% (1 Year Treasury Constant Maturity Rate + 0.55%), due 5/11/24 (b) | 550,000 | 533,762 |
Mizuho Financial Group, Inc. | ||
1.653% (3 Month LIBOR + 0.85%), due 9/13/23 (b) | 1,075,000 | 1,076,553 |
Morgan Stanley | ||
0.79%, due 5/30/25 (c) | 600,000 | 561,152 |
Standard Chartered plc | ||
0.991% (1 Year Treasury Constant Maturity Rate + 0.78%), due 1/12/25 (a)(b) | 450,000 | 427,203 |
Sumitomo Mitsui Financial Group, Inc. | ||
2.696%, due 7/16/24 | 950,000 | 931,050 |
Sumitomo Mitsui Trust Bank Ltd. | ||
0.80%, due 9/16/24 (a) | 750,000 | 701,844 |
UBS Group AG | ||
1.364% (1 Year Treasury Constant Maturity Rate + 1.08%), due 1/30/27 (a)(b) | 525,000 | 471,045 |
10,324,180 | ||
Beverages 1.1% | ||
Coca-Cola Europacific Partners plc | ||
0.80%, due 5/3/24 (a) | 850,000 | 803,612 |
Chemicals 0.7% | ||
Dow Chemical Co. (The) | ||
3.625%, due 5/15/26 | 500,000 | 496,771 |
Commercial Services 0.9% | ||
Global Payments, Inc. | ||
1.50%, due 11/15/24 | 675,000 | 637,593 |
12 | MainStay Short Term Bond Fund |
Principal Amount | Value | |
Corporate Bonds (continued) | ||
Diversified Financial Services 7.2% | ||
AerCap Ireland Capital DAC | ||
1.65%, due 10/29/24 | $ 1,100,000 | $ 1,025,433 |
Air Lease Corp. | ||
0.80%, due 8/18/24 | 650,000 | 604,237 |
Aircastle Ltd. | ||
2.85%, due 1/26/28 (a) | 400,000 | 349,135 |
American Express Co. | ||
3.375%, due 5/3/24 | 1,150,000 | 1,149,082 |
Antares Holdings LP | ||
3.95%, due 7/15/26 (a) | 250,000 | 229,409 |
Ares Finance Co. LLC | ||
4.00%, due 10/8/24 (a) | 525,000 | 523,546 |
BOC Aviation USA Corp. | ||
1.625%, due 4/29/24 (a) | 450,000 | 431,230 |
LSEGA Financing plc | ||
0.65%, due 4/6/24 (a) | 1,000,000 | 946,980 |
5,259,052 | ||
Electric 5.4% | ||
Eversource Energy | ||
Series T | ||
0.431% (SOFR + 0.25%), due 8/15/23 (b) | 750,000 | 748,054 |
NextEra Energy Capital Holdings, Inc. | ||
0.567% (SOFR + 0.40%), due 11/3/23 (b) | 1,000,000 | 994,526 |
OGE Energy Corp. | ||
0.703%, due 5/26/23 | 1,000,000 | 972,975 |
Pacific Gas and Electric Co. | ||
1.75%, due 6/16/22 | 425,000 | 424,712 |
Southern California Edison Co. | ||
1.10%, due 4/1/24 | 625,000 | 599,679 |
Series 20C | ||
1.20%, due 2/1/26 | 175,000 | 157,191 |
3,897,137 | ||
Electronics 0.5% | ||
Flex Ltd. | ||
3.75%, due 2/1/26 | 350,000 | 341,556 |
Entertainment 0.4% | ||
Magallanes, Inc. | ||
3.638%, due 3/15/25 (a) | 325,000 | 319,651 |
Food 0.6% | ||
Mondelez International, Inc. | ||
2.125%, due 3/17/24 | 450,000 | 441,851 |
Principal Amount | Value | |
Gas 0.5% | ||
CenterPoint Energy Resources Corp. | ||
0.70%, due 3/2/23 | $ 375,000 | $ 367,120 |
Healthcare-Products 0.9% | ||
Baxter International, Inc. | ||
1.322%, due 11/29/24 (a) | 675,000 | 636,770 |
Healthcare-Services 0.9% | ||
Laboratory Corp. of America Holdings | ||
3.25%, due 9/1/24 | 650,000 | 645,847 |
Housewares 0.3% | ||
Newell Brands, Inc. | ||
4.10%, due 4/1/23 (d) | 205,000 | 205,128 |
Insurance 0.3% | ||
Corebridge Financial, Inc. | ||
3.50%, due 4/4/25 (a) | 200,000 | 197,972 |
Iron & Steel 0.2% | ||
Steel Dynamics, Inc. | ||
2.40%, due 6/15/25 | 125,000 | 119,289 |
Machinery-Diversified 1.3% | ||
CNH Industrial NV | ||
4.50%, due 8/15/23 | 935,000 | 948,006 |
Media 1.8% | ||
Charter Communications Operating LLC | ||
Series USD | ||
4.50%, due 2/1/24 | 700,000 | 708,625 |
Discovery Communications LLC | ||
3.80%, due 3/13/24 | 600,000 | 599,996 |
1,308,621 | ||
Oil & Gas Services 1.0% | ||
Schlumberger Holdings Corp. | ||
3.75%, due 5/1/24 (a) | 750,000 | 754,555 |
Pharmaceuticals 1.5% | ||
AbbVie, Inc. | ||
3.80%, due 3/15/25 | 180,000 | 180,160 |
Bayer US Finance II LLC | ||
3.875%, due 12/15/23 (a) | 930,000 | 937,370 |
1,117,530 | ||
Principal Amount | Value | |
Corporate Bonds (continued) | ||
Pipelines 1.8% | ||
Kinder Morgan Energy Partners LP | ||
4.15%, due 2/1/24 | $ 750,000 | $ 757,992 |
Plains All American Pipeline LP | ||
3.85%, due 10/15/23 | 525,000 | 526,268 |
1,284,260 | ||
Real Estate Investment Trusts 3.3% | ||
American Campus Communities Operating Partnership LP | ||
3.30%, due 7/15/26 | 775,000 | 763,994 |
National Retail Properties, Inc. | ||
3.90%, due 6/15/24 | 950,000 | 955,677 |
Regency Centers LP | ||
3.90%, due 11/1/25 | 700,000 | 701,255 |
2,420,926 | ||
Retail 0.9% | ||
7-Eleven, Inc. | ||
0.80%, due 2/10/24 (a) | 700,000 | 666,885 |
Semiconductors 1.2% | ||
Skyworks Solutions, Inc. | ||
0.90%, due 6/1/23 | 900,000 | 877,463 |
Software 1.1% | ||
VMware, Inc. | ||
1.00%, due 8/15/24 | 850,000 | 799,401 |
Telecommunications 0.2% | ||
T-Mobile US, Inc. | ||
2.05%, due 2/15/28 | 150,000 | 132,155 |
Total Corporate Bonds (Cost $41,635,965) | 39,860,777 | |
Foreign Government Bond 0.5% | ||
Supranational 0.5% | ||
International Bank for Reconstruction & Development | ||
0.85%, due 2/10/27 | 375,000 | 334,589 |
Total Foreign Government Bond (Cost $375,000) | 334,589 | |
Principal Amount | Value | |
Mortgage-Backed Securities 8.7% | ||
Commercial Mortgage Loans (Collateralized Mortgage Obligations) 8.1% | ||
BFLD Trust | ||
Series 2021-FPM, Class A | ||
2.155% (1 Month LIBOR + 1.60%), due 6/15/38 (a)(b) | $ 700,000 | $ 690,340 |
Commercial Mortgage Trust | ||
Series 2013-SFS, Class A2 | ||
3.086%, due 4/12/35 (a)(e) | 1,100,000 | 1,091,462 |
FHLMC, Multifamily Structured Pass-Through Certificates (e)(f) | ||
Series K131, Class X1 | ||
0.831%, due 7/25/31 | 7,996,103 | 440,225 |
Series K122, Class X1 | ||
0.973%, due 11/25/30 | 4,091,874 | 245,133 |
Series K120, Class X1 | ||
1.133%, due 10/25/30 | 9,224,810 | 636,744 |
Series K112, Class X1 | ||
1.536%, due 5/25/30 | 3,623,331 | 339,588 |
Series K108, Class X1 | ||
1.81%, due 3/25/30 | 5,797,689 | 629,502 |
GS Mortgage Securities Corp. II | ||
Series 2012-BWTR, Class A | ||
2.954%, due 11/5/34 (a) | 500,000 | 497,995 |
Houston Galleria Mall Trust | ||
Series 2015-HGLR, Class A1A1 | ||
3.087%, due 3/5/37 (a) | 500,000 | 484,651 |
Queens Center Mortgage Trust | ||
Series 2013-QCA, Class A | ||
3.275%, due 1/11/37 (a) | 500,000 | 486,834 |
WFLD Mortgage Trust | ||
Series 2014-MONT, Class A | ||
3.88%, due 8/10/31 (a)(e) | 300,000 | 294,436 |
5,836,910 | ||
Whole Loan (Collateralized Mortgage Obligation) 0.6% | ||
COLT Mortgage Loan Trust | ||
Series 2021-5, Class A1 | ||
1.726%, due 11/26/66 (a)(g) | 472,903 | 448,157 |
Total Mortgage-Backed Securities (Cost $6,585,216) | 6,285,067 | |
U.S. Government & Federal Agencies 10.5% | ||
Federal Home Loan Mortgage Corporation (Mortgage Pass-Through Securities) 4.7% | ||
FHLB | ||
2.50%, due 3/22/27 | 650,000 | 630,593 |
3.00%, due 4/20/26 | 550,000 | 548,005 |
14 | MainStay Short Term Bond Fund |
Principal Amount | Value | |
U.S. Government & Federal Agencies (continued) | ||
Federal Home Loan Mortgage Corporation (Mortgage Pass-Through Securities) (continued) | ||
FHLB (continued) | ||
3.00%, due 3/25/27 | $ 650,000 | $ 638,944 |
3.00%, due 3/25/27 | 650,000 | 641,839 |
4.00%, due 5/26/27 | 650,000 | 649,817 |
FHLMC | ||
4.00%, due 5/27/27 (h) | 350,000 | 349,542 |
3,458,740 | ||
United States Treasury Notes 5.8% | ||
U.S. Treasury Notes | ||
1.875%, due 2/15/32 | 3,025,000 | 2,762,203 |
2.375%, due 3/31/29 | 450,000 | 433,828 |
2.625%, due 4/15/25 | 1,000,000 | 992,813 |
4,188,844 | ||
Total U.S. Government & Federal Agencies (Cost $7,938,181) | 7,647,584 | |
Total Long-Term Bonds (Cost $69,565,473) | 66,726,007 | |
Shares | ||
Short-Term Investment 3.9% | ||
Unaffiliated Investment Company 3.9% | ||
JPMorgan U.S. Government Money Market Fund, IM Class, 0.351% (g)(i) | 2,828,080 | 2,828,080 |
Total Short-Term Investment (Cost $2,828,080) | 2,828,080 | |
Total Investments (Cost $72,393,553) | 95.8% | 69,554,087 |
Other Assets, Less Liabilities | 4.2 | 3,035,401 |
Net Assets | 100.0% | $ 72,589,488 |
† | Percentages indicated are based on Fund net assets. |
(a) | May be sold to institutional investors only under Rule 144A or securities offered pursuant to Section 4(a)(2) of the Securities Act of 1933, as amended. |
(b) | Floating rate—Rate shown was the rate in effect as of April 30, 2022. |
(c) | Fixed to floating rate—Rate shown was the rate in effect as of April 30, 2022. |
(d) | Step coupon—Rate shown was the rate in effect as of April 30, 2022. |
(e) | Collateral strip rate—A bond whose interest was based on the weighted net interest rate of the collateral. The coupon rate adjusts periodically based on a predetermined schedule. Rate shown was the rate in effect as of April 30, 2022. |
(f) | Collateralized Mortgage Obligation Interest Only Strip—Pays a fixed or variable rate of interest based on mortgage loans or mortgage pass-through securities. The principal amount of the underlying pool represents the notional amount on which the current interest was calculated. The value of these stripped securities may be particularly sensitive to changes in prevailing interest rates and are typically more sensitive to changes in prepayment rates than traditional mortgage-backed securities. |
(g) | Coupon rate may change based on changes of the underlying collateral or prepayments of principal. Rate shown was the rate in effect as of April 30, 2022. |
(h) | Delayed delivery security. |
(i) | Current yield as of April 30, 2022. |
Type | Number of Contracts | Expiration Date | Value at Trade Date | Current Notional Amount | Unrealized Appreciation (Depreciation)2 |
Long Contracts | |||||
U.S. Treasury 2 Year Notes | 27 | June 2022 | $ 5,712,010 | $ 5,691,938 | $ (20,072) |
Short Contracts | |||||
U.S. Treasury 5 Year Notes | (50) | June 2022 | (5,826,731) | (5,633,594) | 193,137 |
U.S. Treasury 10 Year Notes | (14) | June 2022 | (1,718,247) | (1,668,188) | 50,059 |
Type | Number of Contracts | Expiration Date | Value at Trade Date | Current Notional Amount | Unrealized Appreciation (Depreciation)2 |
U.S. Treasury 10 Year Ultra Bonds | (5) | June 2022 | $ (661,192) | $ (645,000) | $ 16,192 |
Total Short Contracts | 259,388 | ||||
Net Unrealized Appreciation | $ 239,316 |
1. | As of April 30, 2022, cash in the amount of $97,475 was on deposit with a broker or futures commission merchant for futures transactions. |
2. | Represents the difference between the value of the contracts at the time they were opened and the value as of April 30, 2022. |
Abbreviation(s): |
CLO—Collateralized Loan Obligation |
CNH—Chinese Offshore Yuan |
FHLB—Federal Home Loan Bank |
FHLMC—Federal Home Loan Mortgage Corp. |
LIBOR—London Interbank Offered Rate |
SOFR—Secured Overnight Financing Rate |
USD—United States Dollar |
Description | Quoted Prices in Active Markets for Identical Assets (Level 1) | Significant Other Observable Inputs (Level 2) | Significant Unobservable Inputs (Level 3) | Total |
Asset Valuation Inputs | ||||
Investments in Securities (a) | ||||
Long-Term Bonds | ||||
Asset-Backed Securities | $ — | $ 12,597,990 | $ — | $ 12,597,990 |
Corporate Bonds | — | 39,860,777 | — | 39,860,777 |
Foreign Government Bond | — | 334,589 | — | 334,589 |
Mortgage-Backed Securities | — | 6,285,067 | — | 6,285,067 |
U.S. Government & Federal Agencies | — | 7,647,584 | — | 7,647,584 |
Total Long-Term Bonds | — | 66,726,007 | — | 66,726,007 |
Short-Term Investment | ||||
Unaffiliated Investment Company | 2,828,080 | — | — | 2,828,080 |
Total Investments in Securities | 2,828,080 | 66,726,007 | — | 69,554,087 |
Other Financial Instruments | ||||
Futures Contracts (b) | 259,388 | — | — | 259,388 |
Total Investments in Securities and Other Financial Instruments | $ 3,087,468 | $ 66,726,007 | $ — | $ 69,813,475 |
Liability Valuation Inputs | ||||
Other Financial Instruments | ||||
Futures Contracts (b) | $ (20,072) | $ — | $ — | $ (20,072) |
(a) | For a complete listing of investments and their industries, see the Portfolio of Investments. |
(b) | The value listed for these securities reflects unrealized appreciation (depreciation) as shown on the Portfolio of Investments. |
16 | MainStay Short Term Bond Fund |
Assets | |
Investment in securities, at value (identified cost $72,393,553) | $69,554,087 |
Cash | 3,015,734 |
Cash collateral on deposit at broker for futures contracts | 97,475 |
Receivables: | |
Fund shares sold | 1,055,889 |
Investment securities sold | 1,025,127 |
Interest | 299,157 |
Variation margin on futures contracts | 7,413 |
Other assets | 48,796 |
Total assets | 75,103,678 |
Liabilities | |
Payables: | |
Investment securities purchased | 2,149,885 |
Fund shares redeemed | 277,771 |
Professional fees | 23,805 |
Shareholder communication | 14,724 |
Custodian | 13,040 |
Transfer agent (See Note 3) | 12,609 |
NYLIFE Distributors (See Note 3) | 11,954 |
Manager (See Note 3) | 2,565 |
Trustees | 517 |
Accrued expenses | 6,067 |
Distributions payable | 1,253 |
Total liabilities | 2,514,190 |
Net assets | $72,589,488 |
Composition of Net Assets | |
Shares of beneficial interest outstanding (par value of $.001 per share) unlimited number of shares authorized | $7,763 |
Additional paid-in-capital | 75,936,931 |
75,944,694 | |
Total distributable earnings (loss) | (3,355,206) |
Net assets | $72,589,488 |
Class A | |
Net assets applicable to outstanding shares | $56,691,634 |
Shares of beneficial interest outstanding | 6,065,121 |
Net asset value per share outstanding | $9.35 |
Maximum sales charge (1.00% of offering price) | 0.09 |
Maximum offering price per share outstanding | $9.44 |
Investor Class | |
Net assets applicable to outstanding shares | $2,598,867 |
Shares of beneficial interest outstanding | 276,200 |
Net asset value per share outstanding | $9.41 |
Maximum sales charge (0.50% of offering price) | 0.05 |
Maximum offering price per share outstanding | $9.46 |
Class I | |
Net assets applicable to outstanding shares | $13,272,380 |
Shares of beneficial interest outstanding | 1,418,745 |
Net asset value and offering price per share outstanding | $9.36 |
SIMPLE Class | |
Net assets applicable to outstanding shares | $26,607 |
Shares of beneficial interest outstanding | 2,828 |
Net asset value and offering price per share outstanding | $9.41 |
Investment Income (Loss) | |
Income | |
Interest | $591,954 |
Dividends | 3,743 |
Other | 1,343 |
Total income | 597,040 |
Expenses | |
Manager (See Note 3) | 104,032 |
Distribution/Service—Class A (See Note 3) | 73,255 |
Distribution/Service—Investor Class (See Note 3) | 3,461 |
Distribution/Service—SIMPLE Class (See Note 3) | 63 |
Transfer agent (See Note 3) | 40,323 |
Registration | 38,080 |
Professional fees | 33,613 |
Custodian | 21,061 |
Shareholder communication | 9,490 |
Trustees | 1,198 |
Miscellaneous | 5,675 |
Total expenses before waiver/reimbursement | 330,251 |
Expense waiver/reimbursement from Manager (See Note 3) | (55,451) |
Net expenses | 274,800 |
Net investment income (loss) | 322,240 |
Realized and Unrealized Gain (Loss) | |
Net realized gain (loss) on: | |
Investment transactions | (988,507) |
Futures transactions | 400,671 |
Net realized gain (loss) | (587,836) |
Net change in unrealized appreciation (depreciation) on: | |
Investments | (2,903,277) |
Futures contracts | 122,320 |
Net change in unrealized appreciation (depreciation) | (2,780,957) |
Net realized and unrealized gain (loss) | (3,368,793) |
Net increase (decrease) in net assets resulting from operations | $(3,046,553) |
18 | MainStay Short Term Bond Fund |
for the six months ended April 30, 2022 (Unaudited) and the year ended October 31, 2021
2022 | 2021 | |
Increase (Decrease) in Net Assets | ||
Operations: | ||
Net investment income (loss) | $322,240 | $813,697 |
Net realized gain (loss) | (587,836) | 226,851 |
Net change in unrealized appreciation (depreciation) | (2,780,957) | (623,886) |
Net increase (decrease) in net assets resulting from operations | (3,046,553) | 416,662 |
Distributions to shareholders: | ||
Class A | (371,906) | (4,530,754) |
Investor Class | (15,434) | (306,970) |
Class I | (246,260) | (2,904,018) |
SIMPLE Class | (113) | (2,239) |
Total distributions to shareholders | (633,713) | (7,743,981) |
Capital share transactions: | ||
Net proceeds from sales of shares | 22,767,816 | 102,736,580 |
Net asset value of shares issued to shareholders in reinvestment of distributions | 516,396 | 7,660,736 |
Cost of shares redeemed | (55,897,318) | (74,370,352) |
Increase (decrease) in net assets derived from capital share transactions | (32,613,106) | 36,026,964 |
Net increase (decrease) in net assets | (36,293,372) | 28,699,645 |
Net Assets | ||
Beginning of period | 108,882,860 | 80,183,215 |
End of period | $72,589,488 | $108,882,860 |
Six months ended April 30, 2022* | Year Ended October 31, | |||||
Class A | 2021 | 2020 | 2019 | 2018 | 2017 | |
Net asset value at beginning of period | $9.78 | $10.72 | $10.91 | $10.09 | $10.66 | $11.01 |
Net investment income (loss) | 0.04(a) | 0.07(a) | 0.15 | 0.27 | 0.24 | 0.23 |
Net realized and unrealized gain (loss) | (0.41) | (0.01) | 0.05 | 0.82 | (0.54) | (0.22) |
Total from investment operations | (0.37) | 0.06 | 0.20 | 1.09 | (0.30) | 0.01 |
Less distributions: | ||||||
From net investment income | (0.04) | (0.08) | (0.17) | (0.27) | (0.24) | (0.23) |
From net realized gain on investments | (0.02) | (0.92) | (0.22) | — | (0.03) | (0.13) |
Total distributions | (0.06) | (1.00) | (0.39) | (0.27) | (0.27) | (0.36) |
Net asset value at end of period | $9.35 | $9.78 | $10.72 | $10.91 | $10.09 | $10.66 |
Total investment return (b) | (3.79)% | 0.59% | 2.00% | 10.77% | (2.82)% | 0.23% |
Ratios (to average net assets)/Supplemental Data: | ||||||
Net investment income (loss) | 0.74%†† | 0.70% | 1.32% | 2.50% | 2.26% | 2.13% |
Net expenses (c) | 0.74%†† | 0.72% | 0.72% | 0.60% | 0.63% | 0.71% |
Expenses (before waiver/reimbursement) (c) | 0.84%†† | 0.77% | 0.75% | 0.60% | 0.63% | 0.71% |
Portfolio turnover rate | 69% | 236% | 299%(d) | 75%(d) | 103%(d) | 89%(d) |
Net assets at end of period (in 000’s) | $56,692 | $60,444 | $43,452 | $23,771 | $17,506 | $22,258 |
* | Unaudited. |
†† | Annualized. |
(a) | Per share data based on average shares outstanding during the period. |
(b) | Total investment return is calculated exclusive of sales charges and assumes the reinvestment of dividends and distributions. For periods of less than one year, total return is not annualized. |
(c) | In addition to the fees and expenses which the Fund bears directly, it also indirectly bears a pro-rata share of the fees and expenses of the underlying funds in which it invests. Such indirect expenses are not included in the above expense ratios. |
(d) | The portfolio turnover rates not including mortgage dollar rolls were 298%, 72%, 72% and 82% for the years ended October 31, 2020, 2019, 2018 and 2017, respectively. |
20 | MainStay Short Term Bond Fund |
Six months ended April 30, 2022* | Year Ended October 31, | |||||
Investor Class | 2021 | 2020 | 2019 | 2018 | 2017 | |
Net asset value at beginning of period | $9.85 | $10.79 | $10.97 | $10.15 | $10.71 | $11.06 |
Net investment income (loss) | 0.03(a) | 0.05(a) | 0.13 | 0.23 | 0.21 | 0.22 |
Net realized and unrealized gain (loss) | (0.42) | — | 0.06 | 0.82 | (0.53) | (0.23) |
Total from investment operations | (0.39) | 0.05 | 0.19 | 1.05 | (0.32) | (0.01) |
Less distributions: | ||||||
From net investment income | (0.03) | (0.07) | (0.15) | (0.23) | (0.21) | (0.21) |
From net realized gain on investments | (0.02) | (0.92) | (0.22) | — | (0.03) | (0.13) |
Total distributions | (0.05) | (0.99) | (0.37) | (0.23) | (0.24) | (0.34) |
Net asset value at end of period | $9.41 | $9.85 | $10.79 | $10.97 | $10.15 | $10.71 |
Total investment return (b) | (3.94)% | 0.44% | 1.76% | 10.46% | (2.99)% | (0.01)% |
Ratios (to average net assets)/Supplemental Data: | ||||||
Net investment income (loss) | 0.56%†† | 0.51% | 1.18% | 2.18% | 1.98% | 1.92% |
Net expenses (c) | 0.92%†† | 0.92% | 0.92% | 0.92% | 0.92% | 0.92% |
Expenses (before waiver/reimbursement) (c) | 1.37%†† | 1.29% | 1.22% | 1.12% | 1.13% | 0.98% |
Portfolio turnover rate | 69% | 236% | 299%(d) | 75%(d) | 103%(d) | 89%(d) |
Net assets at end of period (in 000's) | $2,599 | $3,124 | $3,376 | $3,433 | $2,850 | $3,094 |
* | Unaudited. |
†† | Annualized. |
(a) | Per share data based on average shares outstanding during the period. |
(b) | Total investment return is calculated exclusive of sales charges and assumes the reinvestment of dividends and distributions. For periods of less than one year, total return is not annualized. |
(c) | In addition to the fees and expenses which the Fund bears directly, it also indirectly bears a pro-rata share of the fees and expenses of the underlying funds in which it invests. Such indirect expenses are not included in the above expense ratios. |
(d) | The portfolio turnover rates not including mortgage dollar rolls were 298%, 72%, 72% and 82% for the years ended October 31, 2020, 2019, 2018 and 2017, respectively. |
Six months ended April 30, 2022* | Year Ended October 31, | |||||
Class I | 2021 | 2020 | 2019 | 2018 | 2017 | |
Net asset value at beginning of period | $9.79 | $10.74 | $10.92 | $10.10 | $10.67 | $11.02 |
Net investment income (loss) | 0.04(a) | 0.10(a) | 0.25 | 0.29 | 0.25 | 0.28 |
Net realized and unrealized gain (loss) | (0.40) | (0.01) | (0.01) | 0.82 | (0.52) | (0.23) |
Total from investment operations | (0.36) | 0.09 | 0.24 | 1.11 | (0.27) | 0.05 |
Less distributions: | ||||||
From net investment income | (0.05) | (0.12) | (0.20) | (0.29) | (0.27) | (0.27) |
From net realized gain on investments | (0.02) | (0.92) | (0.22) | — | (0.03) | (0.13) |
Total distributions | (0.07) | (1.04) | (0.42) | (0.29) | (0.30) | (0.40) |
Net asset value at end of period | $9.36 | $9.79 | $10.74 | $10.92 | $10.10 | $10.67 |
Total investment return (b) | (3.62)% | 0.87% | 2.29% | 11.14% | (2.57)% | 0.53% |
Ratios (to average net assets)/Supplemental Data: | ||||||
Net investment income (loss) | 0.91%†† | 1.02% | 1.78% | 2.77% | 2.58% | 2.44% |
Net expenses (c) | 0.40%†† | 0.40% | 0.40% | 0.35% | 0.37% | 0.40% |
Expenses (before waiver/reimbursement) (c) | 0.57%†† | 0.52% | 0.48% | 0.35% | 0.37% | 0.46% |
Portfolio turnover rate | 69% | 236% | 299%(d) | 75%(d) | 103%(d) | 89%(d) |
Net assets at end of period (in 000’s) | $13,272 | $45,291 | $33,330 | $290,411 | $285,216 | $109,750 |
* | Unaudited. |
†† | Annualized. |
(a) | Per share data based on average shares outstanding during the period. |
(b) | Total investment return is calculated exclusive of sales charges and assumes the reinvestment of dividends and distributions. Class I shares are not subject to sales charges. For periods of less than one year, total return is not annualized. |
(c) | In addition to the fees and expenses which the Fund bears directly, it also indirectly bears a pro-rata share of the fees and expenses of the underlying funds in which it invests. Such indirect expenses are not included in the above expense ratios. |
(d) | The portfolio turnover rates not including mortgage dollar rolls were 298%, 72%, 72% and 82% for the years ended October 31, 2020, 2019, 2018 and 2017, respectively. |
22 | MainStay Short Term Bond Fund |
Six months ended April 30, 2022* | Year Ended October 31, | August 31, 2020^ through October 31, | |
SIMPLE Class | 2021 | 2020 | |
Net asset value at beginning of period | $9.85 | $10.79 | $10.82** |
Net investment income (loss) | 0.02(a) | 0.03(a) | 0.01 |
Net realized and unrealized gain (loss) | (0.42) | (0.01) | (0.03) |
Total from investment operations | (0.40) | 0.02 | (0.02) |
Less distributions: | |||
From net investment income | (0.02) | (0.04) | (0.01) |
From net realized gain on investments | (0.02) | (0.92) | — |
Total distributions | (0.04) | (0.96) | (0.01) |
Net asset value at end of period | $9.41 | $9.85 | $10.79 |
Total investment return (b) | (4.04)% | 0.18% | (0.17)% |
Ratios (to average net assets)/Supplemental Data: | |||
Net investment income (loss) | 0.33%†† | 0.27% | 0.38%†† |
Net expenses (c) | 1.17%†† | 1.17% | 1.17%†† |
Expenses (before waiver/reimbursement) (c) | 1.62%†† | 1.54% | 1.55%†† |
Portfolio turnover rate | 69% | 236% | 299%(d) |
Net assets at end of period (in 000’s) | $27 | $25 | $25 |
* | Unaudited. |
^ | Inception date. |
** | Based on the net asset value of Investor Class as of August 31, 2020. |
†† | Annualized. |
(a) | Per share data based on average shares outstanding during the period. |
(b) | Total investment return is calculated exclusive of sales charges and assumes the reinvestment of dividends and distributions. SIMPLE Class shares are not subject to sales charges. For periods of less than one year, total return is not annualized. |
(c) | In addition to the fees and expenses which the Fund bears directly, it also indirectly bears a pro-rata share of the fees and expenses of the underlying funds in which it invests. Such indirect expenses are not included in the above expense ratios. |
(d) | The portfolio turnover rate not including mortgage dollar rolls was 298% for the year ended October 31, 2020. |
Class | Commenced Operations |
Class A | January 2, 2004 |
Investor Class | February 28, 2008 |
Class I | January 2, 1991 |
SIMPLE Class | August 31, 2020 |
Class R6 | N/A* |
* | Class R6 shares were registered for sale effective as of February 28, 2017 but have not yet commenced operations. |
24 | MainStay Short Term Bond Fund |
• Benchmark yields | • Reported trades |
• Broker/dealer quotes | • Issuer spreads |
• Two-sided markets | • Benchmark securities |
• Bids/offers | • Reference data (corporate actions or material event notices) |
• Industry and economic events | • Comparable bonds |
• Monthly payment information |
26 | MainStay Short Term Bond Fund |
28 | MainStay Short Term Bond Fund |
Asset Derivatives | Interest Rate Contracts Risk | Total |
Futures Contracts - Net Assets—Net unrealized appreciation on futures contracts (a) | $259,388 | $259,388 |
Total Fair Value | $259,388 | $259,388 |
(a) | Includes cumulative appreciation (depreciation) of futures contracts as reported in the Portfolio of Investments. Only current day’s variation margin is reported within the Statement of Assets and Liabilities. |
Liability Derivatives | Interest Rate Contracts Risk | Total |
Futures Contracts - Net Assets—Net unrealized depreciation on futures contracts (a) | $(20,072) | $(20,072) |
Total Fair Value | $(20,072) | $(20,072) |
(a) | Includes cumulative appreciation (depreciation) of futures contracts as reported in the Portfolio of Investments. Only current day’s variation margin is reported within the Statement of Assets and Liabilities. |
Net Realized Gain (Loss) from: | Interest Rate Contracts Risk | Total |
Futures Contracts | $400,671 | $400,671 |
Total Net Realized Gain (Loss) | $400,671 | $400,671 |
Net Change in Unrealized Appreciation (Depreciation) | Interest Rate Contracts Risk | Total |
Futures Contracts | $122,320 | $122,320 |
Total Net Change in Unrealized Appreciation (Depreciation) | $122,320 | $122,320 |
Average Notional Amount | Total |
Futures Contracts Long | $18,340,313 |
Futures Contracts Short | $(16,110,535) |
Class | Expense | Waived |
Class A | $23,484 | $— |
Investor Class | 8,392 | — |
Class I | 8,370 | — |
SIMPLE Class | 77 | — |
SIMPLE Class | $23,981 | 90.1% |
Federal Tax Cost | Gross Unrealized Appreciation | Gross Unrealized (Depreciation) | Net Unrealized Appreciation/ (Depreciation) | |
Investments in Securities | $72,425,570 | $902 | $(2,872,385) | $(2,871,483) |
2021 | |
Distributions paid from: | |
Ordinary Income | $3,910,597 |
Long-Term Capital Gains | 3,833,384 |
Total | $7,743,981 |
30 | MainStay Short Term Bond Fund |
Class A | Shares | Amount |
Six-month period ended April 30, 2022: | ||
Shares sold | 2,216,946 | $21,297,943 |
Shares issued to shareholders in reinvestment of distributions | 38,395 | 368,907 |
Shares redeemed | (2,378,339) | (22,848,274) |
Net increase (decrease) in shares outstanding before conversion | (122,998) | (1,181,424) |
Shares converted into Class A (See Note 1) | 8,562 | 80,764 |
Net increase (decrease) | (114,436) | $(1,100,660) |
Year ended October 31, 2021: | ||
Shares sold | 6,267,414 | $62,326,081 |
Shares issued to shareholders in reinvestment of distributions | 456,726 | 4,505,179 |
Shares redeemed | (4,664,488) | (46,192,645) |
Net increase (decrease) in shares outstanding before conversion | 2,059,652 | 20,638,615 |
Shares converted into Class A (See Note 1) | 68,485 | 675,884 |
Shares converted from Class A (See Note 1) | (356) | (3,504) |
Net increase (decrease) | 2,127,781 | $21,310,995 |
Investor Class | Shares | Amount |
Six-month period ended April 30, 2022: | ||
Shares sold | 23,739 | $229,231 |
Shares issued to shareholders in reinvestment of distributions | 1,563 | 15,131 |
Shares redeemed | (57,810) | (563,354) |
Net increase (decrease) in shares outstanding before conversion | (32,508) | (318,992) |
Shares converted from Investor Class (See Note 1) | (8,507) | (80,764) |
Net increase (decrease) | (41,015) | $(399,756) |
Year ended October 31, 2021: | ||
Shares sold | 115,111 | $1,149,157 |
Shares issued to shareholders in reinvestment of distributions | 30,321 | 301,216 |
Shares redeemed | (73,332) | (736,599) |
Net increase (decrease) in shares outstanding before conversion | 72,100 | 713,774 |
Shares converted into Investor Class (See Note 1) | 354 | 3,504 |
Shares converted from Investor Class (See Note 1) | (68,020) | (675,884) |
Net increase (decrease) | 4,434 | $41,394 |
Class I | Shares | Amount |
Six-month period ended April 30, 2022: | ||
Shares sold | 127,914 | $1,237,972 |
Shares issued to shareholders in reinvestment of distributions | 13,732 | 132,245 |
Shares redeemed | (3,349,359) | (32,485,690) |
Net increase (decrease) | (3,207,713) | $(31,115,473) |
Year ended October 31, 2021: | ||
Shares sold | 3,953,859 | $39,261,342 |
Shares issued to shareholders in reinvestment of distributions | 288,798 | 2,852,102 |
Shares redeemed | (2,720,084) | (27,441,108) |
Net increase (decrease) | 1,522,573 | $14,672,336 |
SIMPLE Class | Shares | Amount |
Six-month period ended April 30, 2022: | ||
Shares sold | 278 | $2,670 |
Shares issued to shareholders in reinvestment of distributions | 12 | 113 |
Net increase (decrease) | 290 | $2,783 |
Year ended October 31, 2021:(a) | ||
Shares issued to shareholders in reinvestment of distributions | 225 | $2,239 |
Net increase (decrease) | 225 | $2,239 |
(a) | The inception date of the class was August 31, 2020. |
32 | MainStay Short Term Bond Fund |
34 | MainStay Short Term Bond Fund |
36 | MainStay Short Term Bond Fund |
38 | MainStay Short Term Bond Fund |
For more information
Semiannual Report
please log in to newyorklifeinvestments.com/accounts.
Not FDIC/NCUA Insured | Not a Deposit | May Lose Value | No Bank Guarantee | Not Insured by Any Government Agency |

Investors should refer to the Fund’s Summary Prospectus and/or Prospectus and consider the Fund’s investment objectives, strategies, risks, charges and expenses carefully before investing. The Summary Prospectus and/or Prospectus contain this and other information about the Fund. You may obtain copies of the Fund’s Summary Prospectus, Prospectus and Statement of Additional Information, which includes information about MainStay Funds Trust's Trustees, free of charge, upon request, by calling toll-free 800-624-6782, by writing to NYLIFE Distributors LLC, Attn: MainStay Marketing Department, 30 Hudson Street, Jersey City, NJ 07302 or by sending an e-mail to MainStayShareholderServices@nylim.com. These documents are also available via the MainStay Funds’ website at newyorklifeinvestments.com. Please read the Fund’s Summary Prospectus and/or Prospectus carefully before investing.
Share Class | Beginning Account Value 11/1/21 | Ending Account Value (Based on Actual Returns and Expenses) 4/30/22 | Expenses Paid During Period1 | Ending Account Value (Based on Hypothetical 5% Annualized Return and Actual Expenses) 4/30/22 | Expenses Paid During Period1 | Net Expense Ratio During Period2 |
Class I Shares | $1,000.00 | $1,000.20 | $0.35 | $1,024.45 | $0.35 | 0.07% |
1. | Expenses are equal to the Fund’s annualized expense ratio of each class multiplied by the average account value over the period, divided by 365 and multiplied by 181 (to reflect the six-month period). The table above represents the actual expenses incurred during the six-month period. In addition to the fees and expenses which the Fund bears directly, it also indirectly bears a pro rata share of the fees and expenses of the underlying funds in which it invests. Such indirect expenses are not included in the above-reported expense figures. |
2. | Expenses are equal to the Fund's annualized expense ratio to reflect the six-month period. |
4 | MainStay U.S. Government Liquidity Fund |
Portfolio Composition as of April 30, 2022 (Unaudited)
U.S. Treasury Debt | 100.0% |
Other Assets, Less Liabilities | -0.0‡ |
Principal Amount | Value | |
Short-Term Investments 100.0% | ||
U.S. Treasury Debt 100.0% | ||
U.S. Treasury Bills (a) | ||
0.212%, due 5/3/22 | $ 53,986,000 | $ 53,985,364 |
0.253%, due 5/17/22 | 181,713,000 | 181,692,569 |
0.476%, due 6/14/22 | 308,000,000 | 307,820,940 |
0.543%, due 6/21/22 | 313,494,000 | 313,253,263 |
0.562%, due 6/23/22 | 83,621,000 | 83,551,936 |
0.702%, due 7/14/22 | 152,724,000 | 152,504,090 |
0.802%, due 7/21/22 | 223,150,000 | 222,748,330 |
Total Short-Term Investments (Cost $1,315,556,492) | 100.0% | 1,315,556,492 |
Other Assets, Less Liabilities | (0.0)‡ | (106,564) |
Net Assets | 100.0% | $ 1,315,449,928 |
† | Percentages indicated are based on Fund net assets. |
‡ | Less than one-tenth of a percent. |
(a) | Interest rate shown represents yield to maturity. |
Description | Quoted Prices in Active Markets for Identical Assets (Level 1) | Significant Other Observable Inputs (Level 2) | Significant Unobservable Inputs (Level 3) | Total |
Asset Valuation Inputs | ||||
Investments in Securities (a) | ||||
Short-Term Investments | ||||
U.S. Treasury Debt | $ — | $ 1,315,556,492 | $ — | $ 1,315,556,492 |
(a) | For a complete listing of investments and their industries, see the Portfolio of Investments. |
6 | MainStay U.S. Government Liquidity Fund |
Assets | |
Investment in securities, at value (amortized cost $1,315,556,492) | $1,315,556,492 |
Cash | 6,219 |
Other assets | 78,856 |
Total assets | 1,315,641,567 |
Liabilities | |
Payables: | |
Manager (See Note 3) | 135,470 |
Professional fees | 33,184 |
Custodian | 11,621 |
Shareholder communication | 11,362 |
Dividends payable | 2 |
Total liabilities | 191,639 |
Net assets | $1,315,449,928 |
Composition of Net Assets | |
Shares of beneficial interest outstanding (par value of $.001 per share) unlimited number of shares authorized | $1,315,300 |
Additional paid-in-capital | 1,314,084,944 |
1,315,400,244 | |
Total distributable earnings (loss) | 49,684 |
Net assets | $1,315,449,928 |
Class I | |
Net assets applicable to outstanding shares | $1,315,449,928 |
Shares of beneficial interest outstanding | 1,315,299,744 |
Net asset value per share outstanding | $1.00 |
Investment Income (Loss) | |
Income | |
Interest | $712,294 |
Expenses | |
Manager (See Note 3) | 823,426 |
Professional fees | 60,773 |
Registration | 22,948 |
Custodian | 15,615 |
Trustees | 14,899 |
Shareholder communication | 2,690 |
Miscellaneous | 13,714 |
Total expenses before waiver/reimbursement | 954,065 |
Expense waiver/reimbursement from Manager (See Note 3) | (457,894) |
Net expenses | 496,171 |
Net investment income (loss) | 216,123 |
Realized Gain (Loss) | |
Net realized gain (loss) on investments | (3,299) |
Net increase (decrease) in net assets resulting from operations | $212,824 |
8 | MainStay U.S. Government Liquidity Fund |
for the six months ended April 30, 2022 (Unaudited) and the year ended October 31, 2021
2022 | 2021 | |
Increase (Decrease) in Net Assets | ||
Operations: | ||
Net investment income (loss) | $216,123 | $129,779 |
Net realized gain (loss) | (3,299) | 5,063 |
Net increase (decrease) in net assets resulting from operations | 212,824 | 134,842 |
Distributions to shareholders | (216,123) | (129,740) |
Capital share transactions: | ||
Net proceeds from sales of shares | 7,519,213,601 | 16,007,977,798 |
Net asset value of shares issued to shareholders in reinvestment of distributions | 212,862 | 124,927 |
Cost of shares redeemed | (8,724,031,889) | (14,127,149,875) |
Increase (decrease) in net assets derived from capital share transactions | (1,204,605,426) | 1,880,952,850 |
Net increase (decrease) in net assets | (1,204,608,725) | 1,880,957,952 |
Net Assets | ||
Beginning of period | 2,520,058,653 | 639,100,701 |
End of period | $1,315,449,928 | $2,520,058,653 |
Six months ended April 30, 2022* | Year Ended October 31, | July 2, 2018^ through October 31, 2018 | |||
Class I | 2021 | 2020 | 2019 | ||
Net asset value at beginning of period | $1.00 | $1.00 | $1.00 | $1.00 | $1.00 |
Net investment income (loss) | 0.00‡ | 0.00‡ | 0.01 | 0.02 | 0.01 |
Total from investment operations | 0.00‡ | 0.00‡ | 0.01 | 0.02 | 0.01 |
Less distributions: | |||||
From net investment income | (0.00)‡ | (0.00)‡ | (0.01) | (0.02) | (0.01) |
Net asset value at end of period | $1.00 | $1.00 | $1.00 | $1.00 | $1.00 |
Total investment return (a) | 0.02% | 0.01% | 0.55% | 2.14% | 0.61% |
Ratios (to average net assets)/Supplemental Data: | |||||
Net investment income (loss) | 0.03%†† | 0.01% | 0.62% | 2.11% | 1.82%†† |
Net expenses | 0.07%†† | 0.03% | 0.13% | 0.15% | 0.15%†† |
Expenses (before waiver/reimbursement) | 0.14%†† | 0.14% | 0.13% | 0.15% | 0.16%†† |
Net assets at end of period (in 000’s) | $1,315,450 | $2,520,059 | $639,101 | $914,477 | $868,444 |
* | Unaudited. |
^ | Inception date. |
‡ | Less than one cent per share. |
†† | Annualized. |
(a) | Total investment return is calculated exclusive of sales charges and assumes the reinvestment of distributions. For periods of less than one year, total return is not annualized. |
10 | MainStay U.S. Government Liquidity Fund |
Class | Commenced Operations |
Class I | July 2, 2018 |
• Benchmark yields | • Reported trades |
• Broker/dealer quotes | • Issuer spreads |
• Two-sided markets | • Benchmark securities |
• Bids/offers | • Reference data (corporate actions or material event notices) |
• Industry and economic events | • Comparable bonds |
• Monthly payment information |
12 | MainStay U.S. Government Liquidity Fund |
2021 | |
Distributions paid from: | |
Ordinary Income | $129,740 |
Class I (at $1 per share) | Shares |
Six-month period ended April 30, 2022: | |
Shares sold | 7,519,213,601 |
Shares issued to shareholders in reinvestment of distributions | 212,862 |
Shares redeemed | (8,724,031,889) |
Net increase (decrease) | (1,204,605,426) |
Year ended October 31, 2021: | |
Shares sold | 16,007,977,798 |
Shares issued to shareholders in reinvestment of distributions | 124,927 |
Shares redeemed | (14,127,149,875) |
Net increase (decrease) | 1,880,952,850 |
14 | MainStay U.S. Government Liquidity Fund |
16 | MainStay U.S. Government Liquidity Fund |
18 | MainStay U.S. Government Liquidity Fund |
20 | MainStay U.S. Government Liquidity Fund |
For more information
Message from the President and Semiannual Report
please log in to newyorklifeinvestments.com/accounts.
Not FDIC/NCUA Insured | Not a Deposit | May Lose Value | No Bank Guarantee | Not Insured by Any Government Agency |


5 | |
9 | |
11 | |
14 | |
21 | |
29 | |
33 | |
34 | |
34 |
Investors should refer to the Fund’s Summary Prospectus and/or Prospectus and consider the Fund’s investment objectives, strategies, risks, charges and expenses carefully before investing. The Summary Prospectus and/or Prospectus contain this and other information about the Fund. You may obtain copies of the Fund’s Summary Prospectus, Prospectus and Statement of Additional Information, which includes information about MainStay Funds Trust's Trustees, free of charge, upon request, by calling toll-free 800-624-6782, by writing to NYLIFE Distributors LLC, Attn: MainStay Marketing Department, 30 Hudson Street, Jersey City, NJ 07302 or by sending an e-mail to MainStayShareholderServices@nylim.com. These documents are also available via the MainStay Funds’ website at newyorklifeinvestments.com. Please read the Fund’s Summary Prospectus and/or Prospectus carefully before investing.

Average Annual Total Returns for the Period-Ended April 30, 2022 | ||||||||
Class | Sales Charge | Inception Date1 | Six Months2 | One Year | Five Years | Ten Years or Since Inception | Gross Expense Ratio3 | |
Class A Shares | Maximum 5.5% Initial Sales Charge | With sales charges | 8/7/2006 | -28.06% | -20.74% | 10.59% | 9.45% | 1.02% |
Excluding sales charges | -23.87 | -16.12 | 11.85 | 10.07 | 1.02 | |||
Investor Class Shares4 | Maximum 5% Initial Sales Charge | With sales charges | 1/18/2013 | -27.78 | -20.56 | 10.28 | 9.72 | 1.40 |
Excluding sales charges | -23.98 | -16.38 | 11.54 | 10.39 | 1.40 | |||
Class B Shares5 | Maximum 5% CDSC | With sales charges | 1/18/2013 | -27.16 | -20.18 | 10.44 | 9.57 | 2.15 |
if Redeemed Within First Six Years of Purchase | Excluding sales charges | -24.27 | -17.01 | 10.71 | 9.57 | 2.15 | ||
Class C Shares | Maximum 1% CDSC | With sales charges | 1/18/2013 | -24.86 | -17.66 | 10.69 | 9.56 | 2.15 |
if Redeemed Within One Year of Purchase | Excluding sales charges | -24.28 | -17.02 | 10.69 | 9.56 | 2.15 | ||
Class I Shares | No Sales Charge | 11/2/2009 | -23.77 | -15.90 | 12.14 | 10.34 | 0.77 | |
Class R2 Shares | No Sales Charge | 1/18/2013 | -23.91 | -16.21 | 11.74 | 10.53 | 1.12 | |
Class R6 Shares | No Sales Charge | 4/26/2021 | -23.77 | -15.87 | N/A | -16.69 | 0.72 | |
1. | Effective March 5, 2021, the Fund replaced its subadvisor and modified its principal investment strategies. The past performance in the graph and table prior to that date reflects the Fund's prior subadvisor and principal investment strategies. |
2. | Not annualized. |
3. | The gross expense ratios presented reflect the Fund’s “Total Annual Fund Operating Expenses” from the most recent Prospectus, as supplemented, and may differ from other expense ratios disclosed in this report. |
4. | Prior to June 30, 2020, the maximum initial sales charge was 5.5%, which is reflected in the applicable average annual total return figures shown. |
5. | Class B shares are closed to all new purchases as well as additional investments by existing Class B shareholders. |
Benchmark Performance* | Six Months1 | One Year | Five Years | Ten Years |
Russell 1000® Growth Index2 | -17.84% | -5.35% | 17.28% | 15.56% |
Morningstar Large Growth Category Average3 | -21.58 | -12.66 | 13.61 | 12.75 |
* | Returns for indices reflect no deductions for fees, expenses or taxes, except for foreign withholding taxes where applicable. |
1. | Not annualized. |
2. | The Russell 1000® Growth Index is the Fund's primary benchmark. The Russell 1000® Growth Index is a broad-based benchmark that measures the performance of the large-cap growth segment of the U.S. equity universe. It includes those Russell 1000® Index companies with higher price-to-book ratios and higher forecasted growth values. Results assume reinvestment of all dividends and capital gains. An investment cannot be made directly in an index. |
3. | The Morningstar Large Growth Category Average is representative of funds that invest primarily in big U.S. companies that are projected to grow faster than other large-cap stocks. Stocks in the top 70% of the capitalization of the U.S. equity market are defined as large cap. Growth is defined based on fast growth and high valuations. Most of these funds focus on companies in rapidly expanding industries. Results are based on average total returns of similar funds with all dividends and capital gain distributions reinvested. |
6 | MainStay WMC Growth Fund |
Share Class | Beginning Account Value 11/1/21 | Ending Account Value (Based on Actual Returns and Expenses) 4/30/22 | Expenses Paid During Period1 | Ending Account Value (Based on Hypothetical 5% Annualized Return and Actual Expenses) 4/30/22 | Expenses Paid During Period1 | Net Expense Ratio During Period2 |
Class A Shares | $1,000.00 | $761.30 | $4.50 | $1,019.69 | $5.16 | 1.03% |
Investor Class Shares | $1,000.00 | $760.20 | $5.72 | $1,018.30 | $6.56 | 1.31% |
Class B Shares | $1,000.00 | $757.30 | $8.98 | $1,014.58 | $10.29 | 2.06% |
Class C Shares | $1,000.00 | $757.20 | $8.98 | $1,014.58 | $10.29 | 2.06% |
Class I Shares | $1,000.00 | $762.30 | $3.28 | $1,021.08 | $3.76 | 0.75% |
Class R2 Shares | $1,000.00 | $760.90 | $4.93 | $1,019.19 | $5.66 | 1.13% |
Class R6 Shares | $1,000.00 | $762.30 | $3.15 | $1,021.22 | $3.61 | 0.72% |
1. | Expenses are equal to the Fund’s annualized expense ratio of each class multiplied by the average account value over the period, divided by 365 and multiplied by 181 (to reflect the six-month period). The table above represents the actual expenses incurred during the six-month period. In addition to the fees and expenses which the Fund bears directly, it also indirectly bears a pro rata share of the fees and expenses of the underlying funds in which it invests. Such indirect expenses are not included in the above-reported expense figures. |
2. | Expenses are equal to the Fund's annualized expense ratio to reflect the six-month period. |
Industry Composition as of April 30, 2022 (Unaudited)
Software | 19.6% |
IT Services | 14.9 |
Interactive Media & Services | 9.8 |
Technology Hardware, Storage & Peripherals | 8.8 |
Semiconductors & Semiconductor Equipment | 6.8 |
Internet & Direct Marketing Retail | 4.9 |
Health Care Equipment & Supplies | 4.2 |
Capital Markets | 3.9 |
Hotels, Restaurants & Leisure | 2.8 |
Life Sciences Tools & Services | 2.6 |
Professional Services | 2.5 |
Health Care Providers & Services | 2.4 |
Beverages | 1.9 |
Aerospace & Defense | 1.9 |
Automobiles | 1.8 |
Insurance | 1.5% |
Consumer Finance | 1.5 |
Textiles, Apparel & Luxury Goods | 1.5 |
Pharmaceuticals | 0.9 |
Road & Rail | 0.8 |
Energy Equipment & Services | 0.6 |
Equity Real Estate Investment Trusts | 0.5 |
Biotechnology | 0.3 |
Commercial Services & Supplies | 0.3 |
Specialty Retail | 0.3 |
Machinery | 0.3 |
Short–Term Investments | 2.6 |
Other Assets, Less Liabilities | 0.1 |
100.0% |
Top Ten Holdings and/or Issuers Held as of April 30, 2022 (excluding short-term investments) (Unaudited)
1. | Microsoft Corp. |
2. | Apple, Inc. |
3. | Alphabet, Inc., Class C |
4. | Mastercard, Inc., Class A |
5. | Amazon.com, Inc. |
6. | UnitedHealth Group, Inc. |
7. | S&P Global, Inc. |
8. | Advanced Micro Devices, Inc. |
9. | NVIDIA Corp. |
10. | Global Payments, Inc. |
8 | MainStay WMC Growth Fund |
10 | MainStay WMC Growth Fund |
Shares | Value | |
Common Stocks 97.3% | ||
Aerospace & Defense 1.9% | ||
Airbus SE, ADR | 159,024 | $ 4,336,982 |
General Dynamics Corp. | 17,780 | 4,205,503 |
Northrop Grumman Corp. | 13,317 | 5,851,490 |
14,393,975 | ||
Automobiles 1.8% | ||
Tesla, Inc. (a) | 16,187 | 14,094,992 |
Beverages 1.9% | ||
Constellation Brands, Inc., Class A | 59,001 | 14,519,556 |
Biotechnology 0.3% | ||
Seagen, Inc. (a) | 20,414 | 2,674,438 |
Capital Markets 3.9% | ||
Blackstone, Inc. | 78,675 | 7,991,020 |
Charles Schwab Corp. (The) | 53,510 | 3,549,318 |
Coinbase Global, Inc., Class A (a) | 18,380 | 2,071,610 |
MarketAxess Holdings, Inc. | 594 | 156,584 |
S&P Global, Inc. | 44,213 | 16,646,195 |
30,414,727 | ||
Commercial Services & Supplies 0.3% | ||
Copart, Inc. (a) | 20,665 | 2,348,577 |
Consumer Finance 1.5% | ||
American Express Co. | 65,205 | 11,391,965 |
Energy Equipment & Services 0.6% | ||
Schlumberger NV | 115,455 | 4,503,900 |
Equity Real Estate Investment Trusts 0.5% | ||
Equinix, Inc. | 5,360 | 3,854,269 |
Health Care Equipment & Supplies 4.2% | ||
ABIOMED, Inc. (a) | 37,991 | 10,887,461 |
Align Technology, Inc. (a) | 16,795 | 4,869,038 |
Boston Scientific Corp. (a) | 296,053 | 12,466,792 |
Stryker Corp. | 17,187 | 4,146,536 |
32,369,827 | ||
Health Care Providers & Services 2.4% | ||
UnitedHealth Group, Inc. | 37,056 | 18,844,829 |
Shares | Value | |
Hotels, Restaurants & Leisure 2.8% | ||
Airbnb, Inc., Class A (a) | 90,166 | $ 13,814,333 |
Hilton Worldwide Holdings, Inc. (a) | 50,338 | 7,816,988 |
21,631,321 | ||
Insurance 1.5% | ||
Marsh & McLennan Cos., Inc. | 43,455 | 7,026,673 |
Progressive Corp. (The) | 41,707 | 4,477,664 |
11,504,337 | ||
Interactive Media & Services 9.8% | ||
Alphabet, Inc., Class C (a) | 20,078 | 46,165,948 |
Match Group, Inc. (a) | 54,516 | 4,314,941 |
Meta Platforms, Inc., Class A (a) | 60,501 | 12,128,635 |
Snap, Inc., Class A (a) | 40,313 | 1,147,308 |
ZoomInfo Technologies, Inc., Class A (a) | 249,979 | 11,849,005 |
75,605,837 | ||
Internet & Direct Marketing Retail 4.9% | ||
Amazon.com, Inc. (a) | 13,377 | 33,250,272 |
Etsy, Inc. (a) | 46,878 | 4,368,561 |
37,618,833 | ||
IT Services 14.9% | ||
Block, Inc., Class A (a) | 103,166 | 10,269,143 |
Fidelity National Information Services, Inc. | 147,865 | 14,660,815 |
FleetCor Technologies, Inc. (a) | 62,095 | 15,493,944 |
Global Payments, Inc. | 117,908 | 16,151,038 |
Mastercard, Inc., Class A | 108,007 | 39,247,584 |
Okta, Inc. (a) | 20,611 | 2,459,098 |
PayPal Holdings, Inc. (a) | 30,548 | 2,686,086 |
Snowflake, Inc., Class A (a) | 13,981 | 2,396,903 |
Visa, Inc., Class A | 52,037 | 11,090,646 |
114,455,257 | ||
Life Sciences Tools & Services 2.6% | ||
Agilent Technologies, Inc. | 53,781 | 6,414,460 |
Illumina, Inc. (a) | 31,107 | 9,227,892 |
Mettler-Toledo International, Inc. (a) | 3,246 | 4,146,862 |
19,789,214 | ||
Machinery 0.3% | ||
IDEX Corp. | 10,292 | 1,953,627 |
Pharmaceuticals 0.9% | ||
Zoetis, Inc. | 37,765 | 6,693,846 |
Professional Services 2.5% | ||
Equifax, Inc. | 26,419 | 5,376,795 |
Shares | Value | |
Common Stocks (continued) | ||
Professional Services (continued) | ||
TransUnion | 161,369 | $ 14,123,015 |
19,499,810 | ||
Road & Rail 0.8% | ||
Uber Technologies, Inc. (a) | 207,796 | 6,541,418 |
Semiconductors & Semiconductor Equipment 6.8% | ||
Advanced Micro Devices, Inc. (a) | 191,866 | 16,408,380 |
Marvell Technology, Inc. | 142,067 | 8,251,251 |
Microchip Technology, Inc. | 123,707 | 8,065,697 |
Monolithic Power Systems, Inc. | 7,740 | 3,035,938 |
NVIDIA Corp. | 87,753 | 16,275,549 |
52,036,815 | ||
Software 19.6% | ||
Adobe, Inc. (a) | 18,370 | 7,273,601 |
Autodesk, Inc. (a) | 52,145 | 9,870,006 |
Avalara, Inc. (a) | 85,565 | 6,508,929 |
Ceridian HCM Holding, Inc. (a) | 98,088 | 5,505,679 |
HashiCorp, Inc., Class A (a)(b) | 6,416 | 302,065 |
Intuit, Inc. | 17,157 | 7,184,494 |
Microsoft Corp. | 273,186 | 75,814,579 |
nCino, Inc. (a) | 117,822 | 4,417,147 |
Qualtrics International, Inc., Class A (a) | 13,745 | 254,832 |
RingCentral, Inc., Class A (a) | 42,943 | 3,643,714 |
salesforce.com, Inc. (a) | 85,057 | 14,964,929 |
SentinelOne, Inc., Class A (a)(b) | 38,311 | 1,274,607 |
ServiceNow, Inc. (a) | 4,712 | 2,252,807 |
UiPath, Inc., Class A (a) | 58,709 | 1,046,781 |
Workday, Inc., Class A (a) | 52,588 | 10,869,940 |
151,184,110 | ||
Specialty Retail 0.3% | ||
Burlington Stores, Inc. (a) | 10,646 | 2,167,100 |
Technology Hardware, Storage & Peripherals 8.8% | ||
Apple, Inc. | 431,745 | 68,064,599 |
Shares | Value | |
Textiles, Apparel & Luxury Goods 1.5% | ||
Lululemon Athletica, Inc. (a) | 31,608 | $ 11,209,145 |
Total Common Stocks (Cost $643,058,105) | 749,366,324 | |
Short-Term Investments 2.6% | ||
Affiliated Investment Company 2.6% | ||
MainStay U.S. Government Liquidity Fund, 0.397% (c) | 20,042,749 | 20,042,749 |
Unaffiliated Investment Company 0.0% ‡ | ||
Invesco Government & Agency Portfolio, 0.419% (c)(d) | 328,545 | 328,545 |
Total Short-Term Investments (Cost $20,371,294) | 20,371,294 | |
Total Investments (Cost $663,429,399) | 99.9% | 769,737,618 |
Other Assets, Less Liabilities | 0.1 | 482,738 |
Net Assets | 100.0% | $ 770,220,356 |
† | Percentages indicated are based on Fund net assets. |
‡ | Less than one-tenth of a percent. |
(a) | Non-income producing security. |
(b) | All or a portion of this security was held on loan. As of April 30, 2022, the aggregate market value of securities on loan was $1,449,135; the total market value of collateral held by the Fund was $1,686,450. The market value of the collateral held included non-cash collateral in the form of U.S. Treasury securities with a value of $1,357,905. The Fund received cash collateral with a value of $328,545. (See Note 2(G)) |
(c) | Current yield as of April 30, 2022. |
(d) | Represents a security purchased with cash collateral received for securities on loan. |
Affiliated Investment Companies | Value, Beginning of Period | Purchases at Cost | Proceeds from Sales | Net Realized Gain/(Loss) on Sales | Change in Unrealized Appreciation/ (Depreciation) | Value, End of Period | Dividend Income | Other Distributions | Shares End of Period |
MainStay U.S. Government Liquidity Fund | $ 4,342 | $ 133,471 | $ (117,770) | $ — | $ — | $ 20,043 | $ 3 | $ — | 20,043 |
12 | MainStay WMC Growth Fund |
Abbreviation(s): |
ADR—American Depositary Receipt |
Description | Quoted Prices in Active Markets for Identical Assets (Level 1) | Significant Other Observable Inputs (Level 2) | Significant Unobservable Inputs (Level 3) | Total |
Asset Valuation Inputs | ||||
Investments in Securities (a) | ||||
Common Stocks | $ 749,366,324 | $ — | $ — | $ 749,366,324 |
Short-Term Investments | ||||
Affiliated Investment Company | 20,042,749 | — | — | 20,042,749 |
Unaffiliated Investment Company | 328,545 | — | — | 328,545 |
Total Short-Term Investments | 20,371,294 | — | — | 20,371,294 |
Total Investments in Securities | $ 769,737,618 | $ — | $ — | $ 769,737,618 |
(a) | For a complete listing of investments and their industries, see the Portfolio of Investments. |
Assets | |
Investment in unaffiliated securities, at value (identified cost $643,386,650) including securities on loan of $1,449,135 | $749,694,869 |
Investment in affiliated investment companies, at value (identified cost $20,042,749) | 20,042,749 |
Receivables: | |
Investment securities sold | 1,498,530 |
Dividends | 285,904 |
Fund shares sold | 161,317 |
Securities lending | 457 |
Other assets | 87,998 |
Total assets | 771,771,824 |
Liabilities | |
Cash collateral received for securities on loan | 328,545 |
Due to custodian | 401 |
Payables: | |
Manager (See Note 3) | 469,277 |
Fund shares redeemed | 324,186 |
Transfer agent (See Note 3) | 215,882 |
NYLIFE Distributors (See Note 3) | 145,820 |
Shareholder communication | 35,591 |
Professional fees | 16,560 |
Custodian | 13,541 |
Trustees | 194 |
Accrued expenses | 1,471 |
Total liabilities | 1,551,468 |
Net assets | $770,220,356 |
Composition of Net Assets | |
Shares of beneficial interest outstanding (par value of $.001 per share) unlimited number of shares authorized | $22,678 |
Additional paid-in-capital | 655,916,181 |
655,938,859 | |
Total distributable earnings (loss) | 114,281,497 |
Net assets | $770,220,356 |
Class A | |
Net assets applicable to outstanding shares | $533,564,278 |
Shares of beneficial interest outstanding | 15,763,279 |
Net asset value per share outstanding | $33.85 |
Maximum sales charge (5.50% of offering price) | 1.97 |
Maximum offering price per share outstanding | $35.82 |
Investor Class | |
Net assets applicable to outstanding shares | $68,851,506 |
Shares of beneficial interest outstanding | 2,088,279 |
Net asset value per share outstanding | $32.97 |
Maximum sales charge (5.00% of offering price) | 1.74 |
Maximum offering price per share outstanding | $34.71 |
Class B | |
Net assets applicable to outstanding shares | $9,832,706 |
Shares of beneficial interest outstanding | 333,286 |
Net asset value and offering price per share outstanding | $29.50 |
Class C | |
Net assets applicable to outstanding shares | $1,889,101 |
Shares of beneficial interest outstanding | 64,071 |
Net asset value and offering price per share outstanding | $29.48 |
Class I | |
Net assets applicable to outstanding shares | $10,194,659 |
Shares of beneficial interest outstanding | 289,292 |
Net asset value and offering price per share outstanding | $35.24 |
Class R2 | |
Net assets applicable to outstanding shares | $104,443 |
Shares of beneficial interest outstanding | 3,122 |
Net asset value and offering price per share outstanding | $33.45 |
Class R6 | |
Net assets applicable to outstanding shares | $145,783,663 |
Shares of beneficial interest outstanding | 4,136,862 |
Net asset value and offering price per share outstanding | $35.24 |
14 | MainStay WMC Growth Fund |
Investment Income (Loss) | |
Income | |
Dividends-unaffiliated (net of foreign tax withholding of $9,698) | $1,851,545 |
Securities lending | 8,687 |
Dividends-affiliated | 2,720 |
Total income | 1,862,952 |
Expenses | |
Manager (See Note 3) | 3,063,960 |
Distribution/Service—Class A (See Note 3) | 800,346 |
Distribution/Service—Investor Class (See Note 3) | 103,184 |
Distribution/Service—Class B (See Note 3) | 64,650 |
Distribution/Service—Class C (See Note 3) | 12,013 |
Distribution/Service—Class R2 (See Note 3) | 159 |
Transfer agent (See Note 3) | 397,375 |
Registration | 59,443 |
Professional fees | 47,183 |
Shareholder communication | 30,508 |
Custodian | 16,066 |
Trustees | 9,183 |
Shareholder service (See Note 3) | 64 |
Miscellaneous | 16,109 |
Total expenses before waiver/reimbursement | 4,620,243 |
Expense waiver/reimbursement from Manager (See Note 3) | (34,028) |
Net expenses | 4,586,215 |
Net investment income (loss) | (2,723,263) |
Realized and Unrealized Gain (Loss) | |
Net realized gain (loss) on unaffiliated investments | 11,780,303 |
Net change in unrealized appreciation (depreciation) on unaffiliated investments | (250,066,980) |
Net realized and unrealized gain (loss) | (238,286,677) |
Net increase (decrease) in net assets resulting from operations | $(241,009,940) |
for the six months ended April 30, 2022 (Unaudited) and the year ended October 31, 2021
2022 | 2021 | |
Increase (Decrease) in Net Assets | ||
Operations: | ||
Net investment income (loss) | $(2,723,263) | $(4,194,902) |
Net realized gain (loss) | 11,780,303 | 232,956,473 |
Net change in unrealized appreciation (depreciation) | (250,066,980) | 45,378,743 |
Net increase (decrease) in net assets resulting from operations | (241,009,940) | 274,140,314 |
Distributions to shareholders: | ||
Class A | (148,560,740) | (21,717,936) |
Investor Class | (19,548,022) | (4,060,646) |
Class B | (3,546,291) | (733,259) |
Class C | (629,845) | (136,353) |
Class I | (2,803,527) | (3,507,825) |
Class R2 | (29,799) | (4,524) |
Class R6 | (30,350,578) | — |
Total distributions to shareholders | (205,468,802) | (30,160,543) |
Capital share transactions: | ||
Net proceeds from sales of shares | 49,261,826 | 98,162,403 |
Net asset value of shares issued to shareholders in reinvestment of distributions | 204,074,882 | 29,968,024 |
Cost of shares redeemed | (40,391,005) | (119,629,555) |
Increase (decrease) in net assets derived from capital share transactions | 212,945,703 | 8,500,872 |
Net increase (decrease) in net assets | (233,533,039) | 252,480,643 |
Net Assets | ||
Beginning of period | 1,003,753,395 | 751,272,752 |
End of period | $770,220,356 | $1,003,753,395 |
16 | MainStay WMC Growth Fund |
Six months ended April 30, 2022* | Year Ended October 31, | |||||
Class A | 2021 | 2020 | 2019 | 2018 | 2017 | |
Net asset value at beginning of period | $56.51 | $42.56 | $36.07 | $36.41 | $34.18 | $29.07 |
Net investment income (loss) (a) | (0.13) | (0.23) | (0.00)‡ | 0.10 | 0.09 | 0.12 |
Net realized and unrealized gain (loss) | (10.90) | 15.93 | 7.78 | 2.87 | 3.47 | 7.39 |
Total from investment operations | (11.03) | 15.70 | 7.78 | 2.97 | 3.56 | 7.51 |
Less distributions: | ||||||
From net investment income | — | — | (0.16) | (0.06) | (0.02) | — |
From net realized gain on investments | (11.63) | (1.75) | (1.13) | (3.25) | (1.31) | (2.40) |
Total distributions | (11.63) | (1.75) | (1.29) | (3.31) | (1.33) | (2.40) |
Net asset value at end of period | $33.85 | $56.51 | $42.56 | $36.07 | $36.41 | $34.18 |
Total investment return (b) | (23.87)% | 37.87% | 22.21% | 8.90% | 10.74% | 27.88% |
Ratios (to average net assets)/Supplemental Data: | ||||||
Net investment income (loss) | (0.61)%†† | (0.46)% | 0.01% | 0.30% | 0.23% | 0.39% |
Net expenses (c) | 1.03%†† | 1.02% | 1.04% | 1.06% | 1.06% | 1.09% |
Portfolio turnover rate | 21% | 53% | 150% | 153% | 116% | 139% |
Net assets at end of period (in 000’s) | $533,564 | $725,468 | $531,715 | $436,508 | $431,854 | $391,245 |
* | Unaudited. |
‡ | Less than one cent per share. |
†† | Annualized. |
(a) | Per share data based on average shares outstanding during the period. |
(b) | Total investment return is calculated exclusive of sales charges and assumes the reinvestment of dividends and distributions. For periods of less than one year, total return is not annualized. |
(c) | In addition to the fees and expenses which the Fund bears directly, it also indirectly bears a pro-rata share of the fees and expenses of the underlying funds in which it invests. Such indirect expenses are not included in the above expense ratios. |
Six months ended April 30, 2022* | Year Ended October 31, | |||||
Investor Class | 2021 | 2020 | 2019 | 2018 | 2017 | |
Net asset value at beginning of period | $55.42 | $41.89 | $35.53 | $35.94 | $33.82 | $28.86 |
Net investment income (loss) (a) | (0.18) | (0.35) | (0.10) | 0.01 | 0.00‡ | 0.06 |
Net realized and unrealized gain (loss) | (10.64) | 15.63 | 7.65 | 2.83 | 3.43 | 7.30 |
Total from investment operations | (10.82) | 15.28 | 7.55 | 2.84 | 3.43 | 7.36 |
Less distributions: | ||||||
From net investment income | — | — | (0.06) | — | — | — |
From net realized gain on investments | (11.63) | (1.75) | (1.13) | (3.25) | (1.31) | (2.40) |
Total distributions | (11.63) | (1.75) | (1.19) | (3.25) | (1.31) | (2.40) |
Net asset value at end of period | $32.97 | $55.42 | $41.89 | $35.53 | $35.94 | $33.82 |
Total investment return (b) | (23.98)% | 37.46% | 21.84% | 8.61% | 10.47% | 27.54% |
Ratios (to average net assets)/Supplemental Data: | ||||||
Net investment income (loss) | (0.90)%†† | (0.71)% | (0.26)% | 0.03% | 0.01% | 0.21% |
Net expenses (c) | 1.31%†† | 1.32% | 1.34% | 1.33% | 1.31% | 1.35% |
Expenses (before waiver/reimbursement) (c) | 1.38%†† | 1.40% | 1.41% | 1.42% | 1.37% | 1.35% |
Portfolio turnover rate | 21% | 53% | 150% | 153% | 116% | 139% |
Net assets at end of period (in 000's) | $68,852 | $93,624 | $97,709 | $110,762 | $108,043 | $134,867 |
* | Unaudited. |
‡ | Less than one cent per share. |
†† | Annualized. |
(a) | Per share data based on average shares outstanding during the period. |
(b) | Total investment return is calculated exclusive of sales charges and assumes the reinvestment of dividends and distributions. For periods of less than one year, total return is not annualized. |
(c) | In addition to the fees and expenses which the Fund bears directly, it also indirectly bears a pro-rata share of the fees and expenses of the underlying funds in which it invests. Such indirect expenses are not included in the above expense ratios. |
Six months ended April 30, 2022* | Year Ended October 31, | |||||
Class B | 2021 | 2020 | 2019 | 2018 | 2017 | |
Net asset value at beginning of period | $51.01 | $38.96 | $33.31 | $34.13 | $32.42 | $27.95 |
Net investment income (loss) (a) | (0.30) | (0.67) | (0.36) | (0.22) | (0.26) | (0.16) |
Net realized and unrealized gain (loss) | (9.58) | 14.47 | 7.14 | 2.65 | 3.28 | 7.03 |
Total from investment operations | (9.88) | 13.80 | 6.78 | 2.43 | 3.02 | 6.87 |
Less distributions: | ||||||
From net realized gain on investments | (11.63) | (1.75) | (1.13) | (3.25) | (1.31) | (2.40) |
Net asset value at end of period | $29.50 | $51.01 | $38.96 | $33.31 | $34.13 | $32.42 |
Total investment return (b) | (24.27)% | 36.44% | 20.93% | 7.79% | 9.63% | 26.61% |
Ratios (to average net assets)/Supplemental Data: | ||||||
Net investment income (loss) | (1.65)%†† | (1.46)% | (1.01)% | (0.69)% | (0.74)% | (0.56)% |
Net expenses (c) | 2.06%†† | 2.07% | 2.08% | 2.08% | 2.06% | 2.10% |
Expenses (before waiver/reimbursement) (c) | 2.13%†† | 2.15% | 2.15% | 2.18% | 2.12% | 2.10% |
Portfolio turnover rate | 21% | 53% | 150% | 153% | 116% | 139% |
Net assets at end of period (in 000’s) | $9,833 | $15,574 | $16,382 | $18,749 | $23,554 | $30,064 |
* | Unaudited. |
†† | Annualized. |
(a) | Per share data based on average shares outstanding during the period. |
(b) | Total investment return is calculated exclusive of sales charges and assumes the reinvestment of dividends and distributions. For periods of less than one year, total return is not annualized. |
(c) | In addition to the fees and expenses which the Fund bears directly, it also indirectly bears a pro-rata share of the fees and expenses of the underlying funds in which it invests. Such indirect expenses are not included in the above expense ratios. |
Six months ended April 30, 2022* | Year Ended October 31, | |||||
Class C | 2021 | 2020 | 2019 | 2018 | 2017 | |
Net asset value at beginning of period | $50.99 | $38.95 | $33.30 | $34.12 | $32.41 | $27.94 |
Net investment income (loss) (a) | (0.30) | (0.67) | (0.36) | (0.21) | (0.27) | (0.17) |
Net realized and unrealized gain (loss) | (9.58) | 14.46 | 7.14 | 2.64 | 3.29 | 7.04 |
Total from investment operations | (9.88) | 13.79 | 6.78 | 2.43 | 3.02 | 6.87 |
Less distributions: | ||||||
From net realized gain on investments | (11.63) | (1.75) | (1.13) | (3.25) | (1.31) | (2.40) |
Net asset value at end of period | $29.48 | $50.99 | $38.95 | $33.30 | $34.12 | $32.41 |
Total investment return (b) | (24.28)% | 36.42% | 20.94% | 7.80% | 9.63% | 26.62% |
Ratios (to average net assets)/Supplemental Data: | ||||||
Net investment income (loss) | (1.65)%†† | (1.46)% | (1.02)% | (0.67)% | (0.77)% | (0.58)% |
Net expenses (c) | 2.06%†† | 2.07% | 2.08% | 2.08% | 2.06% | 2.10% |
Expenses (before waiver/reimbursement) (c) | 2.13%†† | 2.15% | 2.15% | 2.18% | 2.12% | 2.10% |
Portfolio turnover rate | 21% | 53% | 150% | 153% | 116% | 139% |
Net assets at end of period (in 000’s) | $1,889 | $2,880 | $3,068 | $3,144 | $5,331 | $4,884 |
* | Unaudited. |
†† | Annualized. |
(a) | Per share data based on average shares outstanding during the period. |
(b) | Total investment return is calculated exclusive of sales charges and assumes the reinvestment of dividends and distributions. For periods of less than one year, total return is not annualized. |
(c) | In addition to the fees and expenses which the Fund bears directly, it also indirectly bears a pro-rata share of the fees and expenses of the underlying funds in which it invests. Such indirect expenses are not included in the above expense ratios. |
18 | MainStay WMC Growth Fund |
Six months ended April 30, 2022* | Year Ended October 31, | |||||
Class I | 2021 | 2020 | 2019 | 2018 | 2017 | |
Net asset value at beginning of period | $58.27 | $43.72 | $37.01 | $37.28 | $34.96 | $29.62 |
Net investment income (loss) (a) | (0.07) | 0.02 | 0.11 | 0.19 | 0.18 | 0.20 |
Net realized and unrealized gain (loss) | (11.33) | 16.28 | 7.97 | 2.95 | 3.55 | 7.54 |
Total from investment operations | (11.40) | 16.30 | 8.08 | 3.14 | 3.73 | 7.74 |
Less distributions: | ||||||
From net investment income | — | — | (0.24) | (0.16) | (0.10) | — |
From net realized gain on investments | (11.63) | (1.75) | (1.13) | (3.25) | (1.31) | (2.40) |
Total distributions | (11.63) | (1.75) | (1.37) | (3.41) | (1.41) | (2.40) |
Net asset value at end of period | $35.24 | $58.27 | $43.72 | $37.01 | $37.28 | $34.96 |
Total investment return (b) | (23.77)% | 38.25% | 22.53% | 9.18% | 11.03% | 28.16% |
Ratios (to average net assets)/Supplemental Data: | ||||||
Net investment income (loss) | (0.34)%†† | 0.04% | 0.28% | 0.53% | 0.49% | 0.62% |
Net expenses (c) | 0.75%†† | 0.77% | 0.79% | 0.81% | 0.81% | 0.83% |
Expenses (before waiver/reimbursement) (c) | 0.78%†† | 0.78% | 0.79% | 0.81% | 0.81% | 0.83% |
Portfolio turnover rate | 21% | 53% | 150% | 153% | 116% | 139% |
Net assets at end of period (in 000’s) | $10,195 | $14,025 | $102,290 | $139,588 | $87,866 | $87,115 |
* | Unaudited. |
†† | Annualized. |
(a) | Per share data based on average shares outstanding during the period. |
(b) | Total investment return is calculated exclusive of sales charges and assumes the reinvestment of dividends and distributions. Class I shares are not subject to sales charges. For periods of less than one year, total return is not annualized. |
(c) | In addition to the fees and expenses which the Fund bears directly, it also indirectly bears a pro-rata share of the fees and expenses of the underlying funds in which it invests. Such indirect expenses are not included in the above expense ratios. |
Six months ended April 30, 2022* | Year Ended October 31, | |||||
Class R2 | 2021 | 2020 | 2019 | 2018 | 2017 | |
Net asset value at beginning of period | $56.01 | $42.24 | $35.81 | $36.16 | $33.97 | $28.94 |
Net investment income (loss) (a) | (0.15) | (0.28) | (0.04) | 0.07 | 0.05 | 0.09 |
Net realized and unrealized gain (loss) | (10.78) | 15.80 | 7.72 | 2.86 | 3.45 | 7.34 |
Total from investment operations | (10.93) | 15.52 | 7.68 | 2.93 | 3.50 | 7.43 |
Less distributions: | ||||||
From net investment income | — | — | (0.12) | (0.03) | — | — |
From net realized gain on investments | (11.63) | (1.75) | (1.13) | (3.25) | (1.31) | (2.40) |
Total distributions | (11.63) | (1.75) | (1.25) | (3.28) | (1.31) | (2.40) |
Net asset value at end of period | $33.45 | $56.01 | $42.24 | $35.81 | $36.16 | $33.97 |
Total investment return (b) | (23.91)% | 37.72% | 22.08% | 8.81% | 10.64% | 27.72% |
Ratios (to average net assets)/Supplemental Data: | ||||||
Net investment income (loss) | (0.71)%†† | (0.55)% | (0.11)% | 0.21% | 0.13% | 0.31% |
Net expenses (c) | 1.13%†† | 1.12% | 1.14% | 1.16% | 1.16% | 1.19% |
Portfolio turnover rate | 21% | 53% | 150% | 153% | 116% | 139% |
Net assets at end of period (in 000’s) | $104 | $143 | $109 | $59 | $58 | $52 |
* | Unaudited. |
†† | Annualized. |
(a) | Per share data based on average shares outstanding during the period. |
(b) | Total investment return is calculated exclusive of sales charges and assumes the reinvestment of dividends and distributions. Class R2 shares are not subject to sales charges. For periods of less than one year, total return is not annualized. |
(c) | In addition to the fees and expenses which the Fund bears directly, it also indirectly bears a pro-rata share of the fees and expenses of the underlying funds in which it invests. Such indirect expenses are not included in the above expense ratios. |
Six months ended April 30, 2022* | April 26, 2021^ through October 31, | |
Class R6 | 2021 | |
Net asset value at beginning of period | $58.27 | $53.43 |
Net investment income (loss) (a) | (0.07) | (0.19) |
Net realized and unrealized gain (loss) | (11.33) | 5.03 |
Total from investment operations | (11.40) | 4.84 |
Less distributions: | ||
From net realized gain on investments | (11.63) | — |
Net asset value at end of period | $35.24 | $58.27 |
Total investment return (b) | (23.77)% | 9.06% |
Ratios (to average net assets)/Supplemental Data: | ||
Net investment income (loss)†† | (0.31)% | (0.37)% |
Net expenses††(c) | 0.72% | 0.71% |
Expenses (before waiver/reimbursement)††(c) | 0.72% | 0.72% |
Portfolio turnover rate | 21% | 53% |
Net assets at end of period (in 000’s) | $145,784 | $152,039 |
* | Unaudited. |
^ | Inception date. |
†† | Annualized. |
(a) | Per share data based on average shares outstanding during the period. |
(b) | Total investment return is calculated exclusive of sales charges and assumes the reinvestment of dividends and distributions. Class R6 shares are not subject to sales charges. For periods of less than one year, total return is not annualized. |
(c) | In addition to the fees and expenses which the Fund bears directly, it also indirectly bears a pro-rata share of the fees and expenses of the underlying funds in which it invests. Such indirect expenses are not included in the above expense ratios. |
20 | MainStay WMC Growth Fund |
Class | Commenced Operations |
Class A | August 7, 2006 |
Investor Class | January 18, 2013 |
Class B | January 18, 2013 |
Class C | January 18, 2013 |
Class I | November 2, 2009 |
Class R2 | January 18, 2013 |
Class R6 | April 26, 2021 |
SIMPLE Class | N/A* |
* | SIMPLE Class shares were registered for sale effective as of August 31, 2020 but have not yet commenced operations. |
• Broker/dealer quotes | • Benchmark securities |
• Two-sided markets | • Reference data (corporate actions or material event notices) |
• Bids/offers | • Monthly payment information |
• Industry and economic events | • Reported trades |
22 | MainStay WMC Growth Fund |
24 | MainStay WMC Growth Fund |
Class R2 | $64 |
Class | Expense | Waived |
Class A | $188,994 | $— |
Investor Class | 169,952 | (27,265) |
Class B | 26,761 | (4,395) |
Class C | 4,963 | (809) |
Class I | 3,581 | — |
Class R2 | 38 | — |
Class R6 | 3,086 | — |
Class R2 | $63,367 | 60.7% |
Class R6 | 20,785 | 0.0‡ |
‡ | Less than one-tenth of a percent. |
Federal Tax Cost | Gross Unrealized Appreciation | Gross Unrealized (Depreciation) | Net Unrealized Appreciation/ (Depreciation) | |
Investments in Securities | $664,417,304 | $193,746,672 | $(88,426,358) | $105,320,314 |
2021 | |
Distributions paid from: | |
Ordinary Income | $990 |
Long-Term Capital Gains | 30,159,553 |
Total | $30,160,543 |
Class A | Shares | Amount |
Six-month period ended April 30, 2022: | ||
Shares sold | 243,016 | $10,314,588 |
Shares issued to shareholders in reinvestment of distributions | 3,431,285 | 147,305,077 |
Shares redeemed | (815,468) | (33,655,400) |
Net increase (decrease) in shares outstanding before conversion | 2,858,833 | 123,964,265 |
Shares converted into Class A (See Note 1) | 66,987 | 2,774,858 |
Net increase (decrease) | 2,925,820 | $126,739,123 |
Year ended October 31, 2021: | ||
Shares sold | 382,539 | $19,473,241 |
Shares issued to shareholders in reinvestment of distributions | 472,038 | 21,548,548 |
Shares redeemed | (1,215,428) | (61,668,171) |
Net increase (decrease) in shares outstanding before conversion | (360,851) | (20,646,382) |
Shares converted into Class A (See Note 1) | 709,356 | 35,772,789 |
Shares converted from Class A (See Note 1) | (3,534) | (172,666) |
Net increase (decrease) | 344,971 | $14,953,741 |
26 | MainStay WMC Growth Fund |
Investor Class | Shares | Amount |
Six-month period ended April 30, 2022: | ||
Shares sold | 17,456 | $701,383 |
Shares issued to shareholders in reinvestment of distributions | 465,396 | 19,486,146 |
Shares redeemed | (65,597) | (2,679,083) |
Net increase (decrease) in shares outstanding before conversion | 417,255 | 17,508,446 |
Shares converted into Investor Class (See Note 1) | 6,204 | 237,940 |
Shares converted from Investor Class (See Note 1) | (24,458) | (1,013,182) |
Net increase (decrease) | 399,001 | $16,733,204 |
Year ended October 31, 2021: | ||
Shares sold | 43,568 | $2,153,613 |
Shares issued to shareholders in reinvestment of distributions | 90,206 | 4,049,334 |
Shares redeemed | (148,204) | (7,294,895) |
Net increase (decrease) in shares outstanding before conversion | (14,430) | (1,091,948) |
Shares converted into Investor Class (See Note 1) | 17,786 | 866,719 |
Shares converted from Investor Class (See Note 1) | (646,596) | (32,054,024) |
Net increase (decrease) | (643,240) | $(32,279,253) |
Class B | Shares | Amount |
Six-month period ended April 30, 2022: | ||
Shares sold | 2,556 | $103,558 |
Shares issued to shareholders in reinvestment of distributions | 94,215 | 3,540,609 |
Shares redeemed | (14,739) | (519,636) |
Net increase (decrease) in shares outstanding before conversion | 82,032 | 3,124,531 |
Shares converted from Class B (See Note 1) | (54,039) | (1,919,498) |
Net increase (decrease) | 27,993 | $1,205,033 |
Year ended October 31, 2021: | ||
Shares sold | 2,096 | $95,091 |
Shares issued to shareholders in reinvestment of distributions | 17,551 | 730,276 |
Shares redeemed | (40,468) | (1,851,073) |
Net increase (decrease) in shares outstanding before conversion | (20,821) | (1,025,706) |
Shares converted from Class B (See Note 1) | (94,321) | (4,281,257) |
Net increase (decrease) | (115,142) | $(5,306,963) |
Class C | Shares | Amount |
Six-month period ended April 30, 2022: | ||
Shares sold | 3,917 | $142,999 |
Shares issued to shareholders in reinvestment of distributions | 16,769 | 629,845 |
Shares redeemed | (10,841) | (410,132) |
Net increase (decrease) in shares outstanding before conversion | 9,845 | 362,712 |
Shares converted from Class C (See Note 1) | (2,252) | (80,118) |
Net increase (decrease) | 7,593 | $282,594 |
Year ended October 31, 2021: | ||
Shares sold | 6,203 | $287,892 |
Shares issued to shareholders in reinvestment of distributions | 3,278 | 136,353 |
Shares redeemed | (25,498) | (1,169,393) |
Net increase (decrease) in shares outstanding before conversion | (16,017) | (745,148) |
Shares converted from Class C (See Note 1) | (6,281) | (282,428) |
Net increase (decrease) | (22,298) | $(1,027,576) |
Class I | Shares | Amount |
Six-month period ended April 30, 2022: | ||
Shares sold | 32,294 | $1,431,051 |
Shares issued to shareholders in reinvestment of distributions | 61,206 | 2,732,828 |
Shares redeemed | (44,886) | (1,970,572) |
Net increase (decrease) | 48,614 | $2,193,307 |
Year ended October 31, 2021: | ||
Shares sold | 296,664 | $15,059,733 |
Shares issued to shareholders in reinvestment of distributions | 74,526 | 3,498,989 |
Shares redeemed | (977,008) | (47,135,526) |
Net increase (decrease) in shares outstanding before conversion | (605,818) | (28,576,804) |
Shares converted into Class I (See Note 1) | 3,000 | 150,867 |
Shares converted from Class I (See Note 1) | (1,496,360) | (79,950,534) |
Net increase (decrease) | (2,099,178) | $(108,376,471) |
Class R2 | Shares | Amount |
Six-month period ended April 30, 2022: | ||
Shares sold | 527 | $19,881 |
Shares issued to shareholders in reinvestment of distributions | 702 | 29,799 |
Shares redeemed | (663) | (24,728) |
Net increase (decrease) | 566 | $24,952 |
Year ended October 31, 2021: | ||
Shares sold | 113 | $5,628 |
Shares issued to shareholders in reinvestment of distributions | 100 | 4,524 |
Shares redeemed | (232) | (11,228) |
Net increase (decrease) | (19) | $(1,076) |
Class R6 | Shares | Amount |
Six-month period ended April 30, 2022: | ||
Shares sold | 876,944 | $36,548,366 |
Shares issued to shareholders in reinvestment of distributions | 679,897 | 30,350,578 |
Shares redeemed | (29,381) | (1,131,454) |
Net increase (decrease) | 1,527,460 | $65,767,490 |
Year ended October 31, 2021:(a) | ||
Shares sold | 1,121,606 | $61,087,205 |
Shares redeemed | (8,564) | (499,269) |
Net increase (decrease) in shares outstanding before conversion | 1,113,042 | 60,587,936 |
Shares converted into Class R6 (See Note 1) | 1,496,360 | 79,950,534 |
Net increase (decrease) | 2,609,402 | $140,538,470 |
(a) | The inception of the class was April 26, 2021. |
28 | MainStay WMC Growth Fund |
30 | MainStay WMC Growth Fund |
32 | MainStay WMC Growth Fund |
34 | MainStay WMC Growth Fund |
For more information
Message from the President and Semiannual Report
please log in to newyorklifeinvestments.com/accounts.
Not FDIC/NCUA Insured | Not a Deposit | May Lose Value | No Bank Guarantee | Not Insured by Any Government Agency |


5 | |
9 | |
11 | |
20 | |
27 | |
36 | |
40 | |
41 | |
41 |
Investors should refer to the Fund’s Summary Prospectus and/or Prospectus and consider the Fund’s investment objectives, strategies, risks, charges and expenses carefully before investing. The Summary Prospectus and/or Prospectus contain this and other information about the Fund. You may obtain copies of the Fund’s Summary Prospectus, Prospectus and Statement of Additional Information, which includes information about MainStay Funds Trust's Trustees, free of charge, upon request, by calling toll-free 800-624-6782, by writing to NYLIFE Distributors LLC, Attn: MainStay Marketing Department, 30 Hudson Street, Jersey City, NJ 07302 or by sending an e-mail to MainStayShareholderServices@nylim.com. These documents are also available via the MainStay Funds’ website at newyorklifeinvestments.com. Please read the Fund’s Summary Prospectus and/or Prospectus carefully before investing.

Average Annual Total Returns for the Period-Ended April 30, 2022 | ||||||||
Class | Sales Charge | Inception Date1 | Six Months2 | One Year | Five Years | Ten Years | Gross Expense Ratio3 | |
Class A Shares | Maximum 5.5% Initial Sales Charge | With sales charges | 9/28/2007 | -19.99% | -17.67% | -1.91% | 3.37% | 1.20% |
Excluding sales charges | -15.34 | -12.88 | -0.79 | 3.96 | 1.20 | |||
Investor Class Shares4 | Maximum 5% Initial Sales Charge | With sales charges | 2/28/2008 | -19.72 | -17.48 | -2.12 | 3.19 | 1.49 |
Excluding sales charges | -15.49 | -13.14 | -1.01 | 3.77 | 1.49 | |||
Class C Shares | Maximum 1% CDSC | With sales charges | 9/28/2007 | -16.67 | -14.72 | -1.76 | 3.00 | 2.24 |
If Redeemed Within One Year of Purchase | Excluding sales charges | -15.84 | -13.87 | -1.76 | 3.00 | 2.24 | ||
Class I Shares | No Sales Charge | 9/28/2007 | -15.24 | -12.69 | -0.57 | 4.21 | 0.95 | |
1. | Effective March 5, 2021, the Fund replaced its subadvisor and modified its principal investment strategies. The past performance in the graph and table prior to that date reflects the Fund's prior subadvisor and principal investment strategies. |
2. | Not annualized. |
3. | The gross expense ratios presented reflect the Fund’s “Total Annual Fund Operating Expenses” from the most recent Prospectus, as supplemented, and may differ from other expense ratios disclosed in this report. |
4. | Prior to June 30, 2020, the maximum initial sales charge was 5.5%, which is reflected in the applicable average annual total return figures shown. |
Benchmark Performance* | Six Months1 | One Year | Five Years | Ten Years |
MSCI ACWI® ex USA Index (Net)2 | -11.87% | -10.31% | 4.94% | 5.04% |
MSCI EAFE® Index (Net)3 | -11.80 | -8.15 | 4.77 | 5.77 |
Morningstar Foreign Large Blend Category Average4 | -12.93 | -10.30 | 4.16 | 5.00 |
* | Returns for indices reflect no deductions for fees, expenses or taxes, except for foreign withholding taxes where applicable. |
1. | Not annualized. |
2. | The Fund has selected the MSCI ACWI® (All Country World Index) ex USA Index (Net) as its primary benchmark. The MSCI ACWI® ex USA Index (Net) is a free float-adjusted market capitalization weighted index that is designed to measure the equity market performance of developed and emerging markets, excluding the U.S. Results assume reinvestment of all income and capital gains. An investment cannot be made directly in an index. |
3. | The MSCI EAFE® Index (Net) is the Fund's secondary benchmark. The MSCI EAFE® Index (Net) consists of international stocks representing the developed world outside of North America. Results assume reinvestment of all dividends and capital gains. An investment cannot be made directly in an index. |
4. | The Morningstar Foreign Large Blend Category Average is representative of funds that invest in a variety of big international stocks. Most of these portfolios divide their assets among a dozen or more developed markets, including Japan, Britain, France, and Germany. These portfolios primarily invest in stocks that have market caps in the top 70% of each economically integrated market (such as Europe or Asia ex-Japan). The blend style is assigned to portfolios where neither growth nor value characteristics predominate. These portfolios typically will have less than 20% of assets invested in U.S. stocks. Results are based on average total returns of similar funds with all dividends and capital gain distributions reinvested. |
6 | MainStay WMC International Research Equity Fund |
Share Class | Beginning Account Value 11/1/21 | Ending Account Value (Based on Actual Returns and Expenses) 4/30/22 | Expenses Paid During Period1 | Ending Account Value (Based on Hypothetical 5% Annualized Return and Actual Expenses) 4/30/22 | Expenses Paid During Period1 | Net Expense Ratio During Period2, 3 |
Class A Shares | $1,000.00 | $846.60 | $5.22 | $1,019.14 | $5.71 | 1.14% |
Investor Class Shares | $1,000.00 | $845.10 | $6.63 | $1,017.60 | $7.25 | 1.45% |
Class C Shares | $1,000.00 | $841.60 | $10.05 | $1,013.89 | $10.99 | 2.20% |
Class I Shares | $1,000.00 | $847.60 | $3.94 | $1,020.53 | $4.31 | 0.86% |
1. | Expenses are equal to the Fund’s annualized expense ratio of each class multiplied by the average account value over the period, divided by 365 and multiplied by 181 (to reflect the six-month period). The table above represents the actual expenses incurred during the six-month period. In addition to the fees and expenses which the Fund bears directly, it also indirectly bears a pro rata share of the fees and expenses of the underlying funds in which it invests. Such indirect expenses are not included in the above-reported expense figures. |
2. | Expenses are equal to the Fund's annualized expense ratio to reflect the six-month period. |
3. | Expenses are inclusive of dividends and interest on investments sold short. |
Country Composition as of April 30, 2022 (Unaudited)
Japan | 17.6% |
United Kingdom | 13.0 |
France | 10.5 |
Canada | 7.2 |
Netherlands | 7.0 |
United States | 6.4 |
Australia | 4.3 |
Switzerland | 4.1 |
Taiwan | 3.2 |
China | 3.2 |
Germany | 2.6 |
Italy | 2.5 |
Hong Kong | 2.4 |
Republic of Korea | 2.1 |
Brazil | 2.0 |
Spain | 1.7 |
Sweden | 1.7 |
India | 1.5 |
Singapore | 1.2 |
Ireland | 1.1% |
Denmark | 0.9 |
South Africa | 0.9 |
Thailand | 0.8 |
Belgium | 0.7 |
Indonesia | 0.7 |
Philippines | 0.5 |
Austria | 0.4 |
United Arab Emirates | 0.3 |
Luxembourg | 0.3 |
Macao | 0.2 |
Finland | 0.2 |
Greece | 0.2 |
Norway | 0.1 |
Russia | 0.0‡ |
Other Assets, Less Liabilities | –1.5 |
Investments Sold Short | –0.0‡ |
100.0% |
‡ | Less than one–tenth of a percent. |
Top Ten Holdings and/or Issuers Held as of April 30, 2022 (excluding short-term investments) (Unaudited)
1. | Shell plc |
2. | Royal Bank of Canada |
3. | Diageo plc |
4. | iShares MSCI ACWI ex US ETF |
5. | Taiwan Semiconductor Manufacturing Co. Ltd., Sponsored ADR |
6. | Pernod Ricard SA |
7. | ASML Holding NV |
8. | Samsung Electronics Co. Ltd. |
9. | British American Tobacco plc |
10. | AstraZeneca plc |
8 | MainStay WMC International Research Equity Fund |
10 | MainStay WMC International Research Equity Fund |
Shares | Value | |
Common Stocks 94.0% | ||
Australia 4.3% | ||
Australia & New Zealand Banking Group Ltd. (Banks) | 97,305 | $ 1,846,937 |
BHP Group Ltd. (Metals & Mining) | 62,262 | 2,093,348 |
Brambles Ltd. (Commercial Services & Supplies) | 24,108 | 178,025 |
Glencore plc (Metals & Mining) | 135,155 | 833,116 |
Goodman Group (Equity Real Estate Investment Trusts) | 60,156 | 1,000,580 |
Newcrest Mining Ltd. (Metals & Mining) | 26,875 | 503,823 |
Orora Ltd. (Containers & Packaging) | 79,591 | 221,887 |
Rio Tinto plc (Metals & Mining) | 19,586 | 1,389,271 |
8,066,987 | ||
Austria 0.4% | ||
BAWAG Group AG (Banks) (a) | 12,201 | 578,672 |
Erste Group Bank AG (Banks) | 5,929 | 183,156 |
761,828 | ||
Belgium 0.7% | ||
KBC Group NV (Banks) | 6,025 | 410,370 |
UCB SA (Pharmaceuticals) | 7,979 | 908,013 |
1,318,383 | ||
Brazil 1.5% | ||
Cia de Saneamento Basico do Estado de Sao Paulo (Water Utilities) | 76,900 | 692,636 |
Petroleo Brasileiro SA (Oil, Gas & Consumable Fuels) | 61,400 | 415,298 |
Rumo SA (Road & Rail) | 108,100 | 357,932 |
Vale SA (Metals & Mining) | 64,900 | 1,093,361 |
XP, Inc., Class A (Capital Markets) (b) | 12,435 | 306,025 |
2,865,252 | ||
Canada 7.2% | ||
Agnico Eagle Mines Ltd. (Metals & Mining) | 7,398 | 430,641 |
Barrick Gold Corp. (Metals & Mining) | 33,234 | 741,178 |
Boat Rocker Media, Inc. (Entertainment) (b) | 61,639 | 182,808 |
Brookfield Asset Management, Inc., Class A (Capital Markets) | 9,053 | 451,383 |
Canadian Natural Resources Ltd. (Oil, Gas & Consumable Fuels) | 21,153 | 1,309,209 |
Canadian Pacific Railway Ltd. (Road & Rail) | 6,079 | 444,669 |
Colliers International Group, Inc. (Real Estate Management & Development) | 2,348 | 259,264 |
Constellation Software, Inc. (Software) | 608 | 956,912 |
Intact Financial Corp. (Insurance) | 7,518 | 1,051,753 |
Lightspeed Commerce, Inc. (Software) (b) | 34,211 | 764,577 |
Methanex Corp. (Chemicals) | 13,658 | 684,574 |
Shares | Value | |
Canada (continued) | ||
Nuvei Corp. (IT Services) (b) | 11,707 | $ 654,538 |
Royal Bank of Canada (Banks) | 51,031 | 5,154,145 |
Shopify, Inc., Class A (IT Services) (b) | 1,331 | 569,265 |
13,654,916 | ||
China 3.2% | ||
Airtac International Group (Machinery) | 12,557 | 341,132 |
Anhui Conch Cement Co. Ltd., Class H (Construction Materials) | 72,500 | 392,594 |
China Longyuan Power Group Corp. Ltd., Class H (Independent Power and Renewable Electricity Producers) | 974,420 | 1,890,202 |
China Merchants Bank Co. Ltd., Class H (Banks) | 126,500 | 761,473 |
China Pacific Insurance Group Co. Ltd., Class H (Insurance) | 164,759 | 363,966 |
China Yangtze Power Co. Ltd., Class A (Independent Power and Renewable Electricity Producers) | 148,800 | 510,224 |
ENN Energy Holdings Ltd. (Gas Utilities) | 35,400 | 470,625 |
Minth Group Ltd. (Auto Components) | 162,000 | 382,007 |
Niu Technologies, Sponsored ADR (Automobiles) (b) | 29,853 | 285,096 |
Ping An Insurance Group Co. of China Ltd., Class H (Insurance) | 95,890 | 616,660 |
Precision Tsugami China Corp. Ltd. (Machinery) | 25,114 | 28,251 |
6,042,230 | ||
Denmark 0.9% | ||
Ascendis Pharma A/S, ADR (Biotechnology) (b) | 4,448 | 405,969 |
Carlsberg A/S, Class B (Beverages) | 3,037 | 384,409 |
Genmab A/S (Biotechnology) (b) | 2,830 | 998,291 |
1,788,669 | ||
Finland 0.2% | ||
Cargotec Oyj, Class B (Machinery) | 9,743 | 337,663 |
France 10.5% | ||
Airbus SE (Aerospace & Defense) | 7,754 | 843,228 |
ALD SA (Road & Rail) (a)(c) | 30,099 | 409,453 |
Arkema SA (Chemicals) | 5,117 | 577,507 |
AXA SA (Insurance) | 67,164 | 1,778,212 |
Bureau Veritas SA (Professional Services) | 36,576 | 1,048,120 |
Capgemini SE (IT Services) | 3,704 | 753,493 |
Dassault Aviation SA (Aerospace & Defense) | 1,972 | 333,490 |
Edenred (IT Services) | 15,107 | 757,236 |
Shares | Value | |
Common Stocks (continued) | ||
France (continued) | ||
Engie SA (Multi-Utilities) | 90,647 | $ 1,064,813 |
JCDecaux SA (Media) (b) | 23,177 | 487,903 |
Kering SA (Textiles, Apparel & Luxury Goods) | 1,958 | 1,039,998 |
Klepierre SA (Equity Real Estate Investment Trusts) (b) | 15,540 | 369,032 |
LVMH Moet Hennessy Louis Vuitton SE (Textiles, Apparel & Luxury Goods) | 3,471 | 2,221,078 |
Pernod Ricard SA (Beverages) | 17,695 | 3,645,786 |
Rothschild & Co. (Capital Markets) | 9,722 | 379,667 |
Safran SA (Aerospace & Defense) | 4,574 | 486,799 |
SOITEC (Semiconductors & Semiconductor Equipment) (b) | 3,252 | 582,308 |
TotalEnergies SE (Oil, Gas & Consumable Fuels) | 41,407 | 2,040,189 |
Valeo (Auto Components) | 12,289 | 221,604 |
Vinci SA (Construction & Engineering) | 7,235 | 698,063 |
Worldline SA (IT Services) (a)(b) | 5,088 | 199,427 |
19,937,406 | ||
Germany 2.3% | ||
Brenntag SE (Trading Companies & Distributors) | 11,081 | 864,725 |
Commerzbank AG (Banks) (b) | 58,262 | 385,983 |
Daimler Truck Holding AG (Machinery) (b) | 2,356 | 63,659 |
Mercedes-Benz Group AG (Automobiles) (b) | 909 | 64,325 |
RWE AG (Multi-Utilities) | 22,006 | 919,352 |
Siemens AG (Registered) (Industrial Conglomerates) | 9,762 | 1,214,246 |
Siemens Healthineers AG (Health Care Equipment & Supplies) (a) | 6,324 | 341,799 |
Talanx AG (Insurance) | 13,007 | 548,448 |
4,402,537 | ||
Greece 0.2% | ||
Hellenic Telecommunications Organization SA (Diversified Telecommunication Services) | 16,355 | 310,567 |
Hong Kong 2.4% | ||
AIA Group Ltd. (Insurance) | 217,308 | 2,123,081 |
CK Asset Holdings Ltd. (Real Estate Management & Development) | 188,500 | 1,276,117 |
Hong Kong Exchanges & Clearing Ltd. (Capital Markets) | 9,998 | 424,017 |
Shares | Value | |
Hong Kong (continued) | ||
Techtronic Industries Co. Ltd. (Machinery) | 57,500 | $ 767,660 |
4,590,875 | ||
India 1.5% | ||
Axis Bank Ltd. (Banks) (b) | 106,040 | 996,019 |
Bharti Airtel Ltd. (Wireless Telecommunication Services) (b) | 112,335 | 1,054,814 |
Kotak Mahindra Bank Ltd. (Banks) | 35,226 | 818,304 |
2,869,137 | ||
Indonesia 0.7% | ||
Bank Rakyat Indonesia Persero Tbk. PT (Banks) (d) | 3,718,200 | 1,235,881 |
Ireland 1.1% | ||
AerCap Holdings NV (Trading Companies & Distributors) (b) | 13,941 | 651,184 |
AIB Group plc (Banks) | 223,075 | 480,893 |
Ryanair Holdings plc, Sponsored ADR (Airlines) (b) | 4,267 | 372,595 |
Smurfit Kappa Group plc (Containers & Packaging) | 15,638 | 661,141 |
2,165,813 | ||
Italy 2.5% | ||
Amplifon SpA (Health Care Providers & Services) | 10,183 | 405,190 |
Coca-Cola HBC AG (Beverages) | 28,159 | 579,815 |
Davide Campari-Milano NV (Beverages) | 138,053 | 1,553,662 |
DiaSorin SpA (Health Care Equipment & Supplies) | 3,237 | 423,139 |
Ferrari NV (Automobiles) | 5,425 | 1,144,300 |
Stevanato Group SpA (Life Sciences Tools & Services) (b) | 27,265 | 436,240 |
UniCredit SpA (Banks) | 12,462 | 113,656 |
4,656,002 | ||
Japan 17.6% | ||
Asahi Intecc Co. Ltd. (Health Care Equipment & Supplies) | 17,900 | 348,977 |
Astellas Pharma, Inc. (Pharmaceuticals) | 61,000 | 928,747 |
Chugai Pharmaceutical Co. Ltd. (Pharmaceuticals) | 28,900 | 867,314 |
Daiichi Sankyo Co. Ltd. (Pharmaceuticals) | 56,600 | 1,422,451 |
Daikin Industries Ltd. (Building Products) | 6,100 | 937,939 |
Eisai Co. Ltd. (Pharmaceuticals) | 8,900 | 387,645 |
GMO Payment Gateway, Inc. (IT Services) (c) | 6,800 | 574,174 |
12 | MainStay WMC International Research Equity Fund |
Shares | Value | |
Common Stocks (continued) | ||
Japan (continued) | ||
Hoya Corp. (Health Care Equipment & Supplies) | 12,900 | $ 1,285,218 |
Ibiden Co. Ltd. (Electronic Equipment, Instruments & Components) | 32,600 | 1,235,087 |
Isuzu Motors Ltd. (Automobiles) | 76,600 | 892,049 |
ITOCHU Corp. (Trading Companies & Distributors) | 18,000 | 544,522 |
KDDI Corp. (Wireless Telecommunication Services) | 29,986 | 994,200 |
Keyence Corp. (Electronic Equipment, Instruments & Components) | 2,300 | 927,950 |
Kose Corp. (Personal Products) | 1,800 | 186,412 |
Kyowa Kirin Co. Ltd. (Pharmaceuticals) | 16,200 | 340,192 |
Makita Corp. (Machinery) | 18,600 | 552,619 |
Mitsubishi Corp. (Trading Companies & Distributors) | 19,400 | 650,994 |
Mitsubishi Electric Corp. (Electrical Equipment) | 33,800 | 355,270 |
Mitsubishi UFJ Financial Group, Inc. (Banks) | 214,200 | 1,244,900 |
Mitsui & Co. Ltd. (Trading Companies & Distributors) | 22,900 | 554,978 |
Musashi Seimitsu Industry Co. Ltd. (Auto Components) (c) | 21,800 | 222,279 |
Nippon Telegraph & Telephone Corp. (Diversified Telecommunication Services) | 40,120 | 1,185,190 |
Ono Pharmaceutical Co. Ltd. (Pharmaceuticals) | 26,700 | 685,044 |
Oriental Land Co. Ltd. (Hotels, Restaurants & Leisure) | 6,400 | 963,295 |
Resona Holdings, Inc. (Banks) | 260,100 | 1,128,702 |
Shinko Electric Industries Co. Ltd. (Semiconductors & Semiconductor Equipment) | 45,300 | 1,967,710 |
Shiseido Co. Ltd. (Personal Products) | 35,200 | 1,658,825 |
SMC Corp. (Machinery) | 1,700 | 821,689 |
SoftBank Corp. (Wireless Telecommunication Services) | 32,570 | 378,490 |
Sony Group Corp. (Household Durables) | 18,577 | 1,596,720 |
Subaru Corp. (Automobiles) | 54,900 | 825,949 |
T&D Holdings, Inc. (Insurance) | 64,900 | 832,941 |
Taiyo Yuden Co. Ltd. (Electronic Equipment, Instruments & Components) | 22,100 | 872,221 |
Tokio Marine Holdings, Inc. (Insurance) | 19,300 | 1,041,520 |
Tokyo Electron Ltd. (Semiconductors & Semiconductor Equipment) | 5,800 | 2,460,441 |
Shares | Value | |
Japan (continued) | ||
Yamaha Motor Co. Ltd. (Automobiles) | 39,000 | $ 805,116 |
Yamato Holdings Co. Ltd. (Air Freight & Logistics) | 36,200 | 678,974 |
33,356,744 | ||
Luxembourg 0.3% | ||
ArcelorMittal SA (Metals & Mining) | 10,537 | 307,590 |
Arrival SA (Automobiles) (b)(c) | 120,747 | 233,042 |
540,632 | ||
Macao 0.2% | ||
Sands China Ltd. (Hotels, Restaurants & Leisure) (b) | 171,600 | 376,740 |
Netherlands 7.0% | ||
Adyen NV (IT Services) (a)(b) | 320 | 535,186 |
Akzo Nobel NV (Chemicals) | 5,457 | 470,829 |
Argenx SE (Biotechnology) (b) | 1,355 | 389,570 |
ASML Holding NV (Semiconductors & Semiconductor Equipment) | 6,236 | 3,528,134 |
IMCD NV (Trading Companies & Distributors) | 2,838 | 450,854 |
Koninklijke DSM NV (Chemicals) | 1,346 | 225,442 |
Koninklijke KPN NV (Diversified Telecommunication Services) | 285,489 | 987,417 |
Koninklijke Philips NV (Health Care Equipment & Supplies) | 23,201 | 608,654 |
Shell plc (Oil, Gas & Consumable Fuels) | 196,579 | 5,320,630 |
Wolters Kluwer NV (Professional Services) | 7,608 | 769,551 |
13,286,267 | ||
Norway 0.1% | ||
Norsk Hydro ASA (Metals & Mining) | 17,786 | 149,936 |
Philippines 0.5% | ||
BDO Unibank, Inc. (Banks) | 404,850 | 999,332 |
Republic of Korea 0.5% | ||
LG Chem Ltd. (Chemicals) | 1,033 | 414,935 |
Samsung SDI Co. Ltd. (Electronic Equipment, Instruments & Components) | 1,204 | 573,387 |
988,322 | ||
Russia 0.0% ‡ | ||
LUKOIL PJSC, Sponsored ADR (Oil, Gas & Consumable Fuels) (d)(e)(f) | 11,171 | 27,760 |
Shares | Value | |
Common Stocks (continued) | ||
Russia (continued) ‡ | ||
Mobile TeleSystems PJSC, ADR (Wireless Telecommunication Services) (d)(e)(f) | 40,264 | $ 11,072 |
38,832 | ||
Singapore 1.2% | ||
Best World International Ltd. (Personal Products) (b)(c)(d)(e)(f) | 353,862 | 347,990 |
Capitaland Investment Ltd. (Real Estate Management & Development) (b) | 217,000 | 659,022 |
Singapore Telecommunications Ltd. (Diversified Telecommunication Services) | 194,100 | 385,801 |
United Overseas Bank Ltd. (Banks) | 37,500 | 803,668 |
2,196,481 | ||
South Africa 0.9% | ||
Anglo American plc (Metals & Mining) | 26,147 | 1,160,286 |
Old Mutual Ltd. (Insurance) | 597,600 | 476,129 |
1,636,415 | ||
Spain 1.7% | ||
CaixaBank SA (Banks) | 133,577 | 426,274 |
Cellnex Telecom SA (Diversified Telecommunication Services) | 28,579 | 1,335,855 |
Grifols SA (Biotechnology) | 28,888 | 480,648 |
Iberdrola SA (Electric Utilities) | 88,872 | 1,015,427 |
3,258,204 | ||
Sweden 1.7% | ||
Alfa Laval AB (Machinery) (c) | 10,411 | 288,963 |
Assa Abloy AB, Class B (Building Products) (c) | 33,048 | 833,735 |
Fastighets AB Balder, Class B (Real Estate Management & Development) (b) | 12,720 | 630,676 |
Volvo AB, Class B (Machinery) | 86,139 | 1,367,057 |
3,120,431 | ||
Switzerland 4.1% | ||
Alcon, Inc. (Health Care Equipment & Supplies) | 13,250 | 940,085 |
Cie Financiere Richemont SA (Registered) (Textiles, Apparel & Luxury Goods) | 13,819 | 1,606,361 |
Lonza Group AG (Registered) (Life Sciences Tools & Services) | 1,267 | 743,851 |
Novartis AG (Registered) (Pharmaceuticals) | 25,457 | 2,252,115 |
PSP Swiss Property AG (Registered) (Real Estate Management & Development) | 2,956 | 372,911 |
Roche Holding AG (Pharmaceuticals) | 2,409 | 892,213 |
Shares | Value | |
Switzerland (continued) | ||
Tecan Group AG (Registered) (Life Sciences Tools & Services) | 1,765 | $ 530,414 |
Wizz Air Holdings plc (Airlines) (a)(b) | 11,125 | 428,436 |
7,766,386 | ||
Taiwan 3.2% | ||
ASPEED Technology, Inc. (Semiconductors & Semiconductor Equipment) | 9,000 | 794,315 |
MediaTek, Inc. (Semiconductors & Semiconductor Equipment) | 39,000 | 1,068,633 |
Sea Ltd., ADR (Entertainment) (b) | 3,029 | 250,680 |
Taiwan Semiconductor Manufacturing Co. Ltd., Sponsored ADR (Semiconductors & Semiconductor Equipment) | 42,977 | 3,993,853 |
6,107,481 | ||
Thailand 0.8% | ||
Kasikornbank PCL | ||
(Banks) | 37,900 | 165,504 |
NVDR (Banks) | 268,520 | 1,189,419 |
PTT Global Chemical PCL (Chemicals) | 45,700 | 66,330 |
1,421,253 | ||
United Arab Emirates 0.3% | ||
Network International Holdings plc (IT Services) (a)(b) | 170,408 | 553,626 |
United Kingdom 13.0% | ||
Abcam plc (Biotechnology) (b) | 32,471 | 506,763 |
Allfunds Group plc (Capital Markets) | 48,869 | 416,992 |
AstraZeneca plc (Pharmaceuticals) | 18,648 | 2,477,234 |
BAE Systems plc (Aerospace & Defense) | 39,592 | 368,781 |
Beazley plc (Insurance) | 146,146 | 780,459 |
BP plc (Oil, Gas & Consumable Fuels) | 180,840 | 882,969 |
British American Tobacco plc (Tobacco) | 62,438 | 2,631,329 |
BT Group plc (Diversified Telecommunication Services) | 450,369 | 996,665 |
CNH Industrial NV (Machinery) | 10,638 | 151,855 |
Coca-Cola Europacific Partners plc (Beverages) | 40,152 | 2,005,592 |
Compass Group plc (Hotels, Restaurants & Leisure) | 33,189 | 699,079 |
ConvaTec Group plc (Health Care Equipment & Supplies) (a) | 182,929 | 483,234 |
Croda International plc (Chemicals) | 6,782 | 657,118 |
Diageo plc (Beverages) | 96,545 | 4,784,296 |
Experian plc (Professional Services) | 12,651 | 438,503 |
Genus plc (Biotechnology) | 5,529 | 173,358 |
HSBC Holdings plc (Banks) | 190,041 | 1,186,201 |
14 | MainStay WMC International Research Equity Fund |
Shares | Value | |
Common Stocks (continued) | ||
United Kingdom (continued) | ||
Hyve Group plc (Media) (b) | 102,687 | $ 95,209 |
Intermediate Capital Group plc (Capital Markets) | 15,895 | 304,905 |
Lloyds Banking Group plc (Banks) | 947,144 | 533,986 |
London Stock Exchange Group plc (Capital Markets) | 7,922 | 786,075 |
National Express Group plc (Road & Rail) (b) | 29,908 | 92,924 |
Prudential plc (Insurance) | 49,004 | 609,142 |
Rotork plc (Machinery) | 87,474 | 316,919 |
Smith & Nephew plc (Health Care Equipment & Supplies) | 33,535 | 542,548 |
Standard Chartered plc (Banks) | 162,362 | 1,112,284 |
WPP plc (Media) | 49,839 | 618,166 |
24,652,586 | ||
United States 1.3% | ||
Atlassian Corp. plc, Class A (Software) (b) | 2,552 | 573,766 |
QIAGEN NV (Life Sciences Tools & Services) (b) | 8,850 | 409,135 |
Schneider Electric SE (Electrical Equipment) | 10,320 | 1,469,816 |
2,452,717 | ||
Total Common Stocks (Cost $191,777,711) | 177,906,531 | |
Preferred Stocks 2.4% | ||
Brazil 0.5% | ||
Banco Bradesco SA (Banks) | 246,900 | 897,918 |
Germany 0.3% | ||
Volkswagen AG (Automobiles) 2.91% | 4,061 | 637,088 |
Republic of Korea 1.6% | ||
Samsung Electronics Co. Ltd. (Technology Hardware, Storage & Peripherals) 1.88% | 66,180 | 3,090,508 |
Total Preferred Stocks (Cost $6,034,980) | 4,625,514 | |
Shares | Value | |
Exchange-Traded Fund 2.2% | ||
United States 2.2% | ||
iShares MSCI ACWI ex US ETF (c) | 84,942 | $ 4,142,621 |
Total Exchange-Traded Fund (Cost $4,670,856) | 4,142,621 | |
Short-Term Investments 2.9% | ||
Affiliated Investment Company 0.2% | ||
United States 0.2% | ||
MainStay U.S. Government Liquidity Fund, 0.397% (g) | 391,072 | 391,072 |
Unaffiliated Investment Companies 2.7% | ||
United States 2.7% | ||
BlackRock Liquidity FedFund, 0.375% (g)(h) | 304,485 | 304,485 |
Invesco Government & Agency Portfolio, 0.419% (g)(h) | 4,876,343 | 4,876,343 |
Total Unaffiliated Investment Companies (Cost $5,180,828) | 5,180,828 | |
Total Short-Term Investments (Cost $5,571,900) | 5,571,900 | |
Total Investments, Before Investments Sold Short (Cost $208,055,447) | 101.5% | 192,246,566 |
Investments Sold Short (0.0)% ‡ | ||
Common Stock Sold Short (0.0)% ‡ | ||
Australia (0.0)% ‡ | ||
Virgin Australia Airlines Holdings Pty. Ltd. (Airlines) (b)(d)(e)(f) | (444,108) | (31) |
Total Common Stock Sold Short (Proceeds $0) | (31) | |
Number of Rights | ||
Right Sold Short (0.0)% ‡ | ||
United States (0.0)% ‡ | ||
Intercell (Biotechnology) Expires 12/31/49 (b)(d)(e)(f) | (19,159) | (2) |
Total Right Sold Short (Proceeds $0) | (2) | |
Number of Warrants | Value | |
Warrant Sold Short (0.0)% ‡ | ||
Singapore (0.0)% ‡ | ||
Ezion Holdings Ltd. (Energy Equipment & Services) | ||
Expires 4/16/23 (b)(d)(e)(f) | (2,005,620) | $ — |
Total Warrant Sold Short (Proceeds $0) | — | |
Total Investments Sold Short (Proceeds $0) | (33) | |
Total Investments, Net of Investments Sold Short (Cost $208,055,447) | 101.5% | 192,246,533 |
Other Assets, Less Liabilities | (1.5) | (2,918,559) |
Net Assets | 100.0% | $ 189,327,974 |
† | Percentages indicated are based on Fund net assets. |
‡ | Less than one-tenth of a percent. |
(a) | May be sold to institutional investors only under Rule 144A or securities offered pursuant to Section 4(a)(2) of the Securities Act of 1933, as amended. |
(b) | Non-income producing security. |
(c) | All or a portion of this security was held on loan. As of April 30, 2022, the aggregate market value of securities on loan was $5,421,775; the total market value of collateral held by the Fund was $5,659,483. The market value of the collateral held included non-cash collateral in the form of U.S. Treasury securities with a value of $478,655. The Fund received cash collateral with a value of $5,180,828. (See Note 2(J)) |
(d) | Illiquid security—As of April 30, 2022, the total market value deemed illiquid under procedures approved by the Board of Trustees was $1,622,670, which represented 0.9% of the Fund’s net assets. |
(e) | Fair valued security—Represents fair value as measured in good faith under procedures approved by the Board of Trustees. As of April 30, 2022, the total market value was $386,789, which represented 0.2% of the Fund’s net assets. |
(f) | Security in which significant unobservable inputs (Level 3) were used in determining fair value. |
(g) | Current yield as of April 30, 2022. |
(h) | Represents a security purchased with cash collateral received for securities on loan. |
16 | MainStay WMC International Research Equity Fund |
Affiliated Investment Companies | Value, Beginning of Period | Purchases at Cost | Proceeds from Sales | Net Realized Gain/(Loss) on Sales | Change in Unrealized Appreciation/ (Depreciation) | Value, End of Period | Dividend Income | Other Distributions | Shares End of Period |
MainStay U.S. Government Liquidity Fund | $ 2,105 | $ 19,160 | $ (20,874) | $ — | $ — | $ 391 | $ —(a) | $ — | 391 |
(a) | Less than $500. |
Abbreviation(s): |
ADR—American Depositary Receipt |
ETF—Exchange-Traded Fund |
MSCI—Morgan Stanley Capital International |
NVDR—Non-Voting Depositary Receipt |
PCL—Provision for Credit Losses |
Description | Quoted Prices in Active Markets for Identical Assets (Level 1) | Significant Other Observable Inputs (Level 2) | Significant Unobservable Inputs (Level 3) | Total |
Asset Valuation Inputs | ||||
Investments in Securities (a) | ||||
Common Stocks | ||||
Australia | $ — | $ 8,066,987 | $ — | $ 8,066,987 |
Austria | — | 761,828 | — | 761,828 |
Belgium | — | 1,318,383 | — | 1,318,383 |
China | 285,096 | 5,757,134 | — | 6,042,230 |
Denmark | 405,969 | 1,382,700 | — | 1,788,669 |
Finland | — | 337,663 | — | 337,663 |
France | — | 19,937,406 | — | 19,937,406 |
Germany | — | 4,402,537 | — | 4,402,537 |
Greece | — | 310,567 | — | 310,567 |
Hong Kong | — | 4,590,875 | — | 4,590,875 |
India | — | 2,869,137 | — | 2,869,137 |
Indonesia | — | 1,235,881 | — | 1,235,881 |
Ireland | 1,023,779 | 1,142,034 | — | 2,165,813 |
Italy | 1,016,055 | 3,639,947 | — | 4,656,002 |
Japan | — | 33,356,744 | — | 33,356,744 |
Luxembourg | 233,042 | 307,590 | — | 540,632 |
Macao | — | 376,740 | — | 376,740 |
Netherlands | — | 13,286,267 | — | 13,286,267 |
Norway | — | 149,936 | — | 149,936 |
Philippines | — | 999,332 | — | 999,332 |
Republic of Korea | — | 988,322 | — | 988,322 |
Singapore | — | 1,848,491 | 347,990 | 2,196,481 |
South Africa | — | 1,636,415 | — | 1,636,415 |
Spain | — | 3,258,204 | — | 3,258,204 |
Sweden | — | 3,120,431 | — | 3,120,431 |
Switzerland | — | 7,766,386 | — | 7,766,386 |
Taiwan | 4,244,533 | 1,862,948 | — | 6,107,481 |
Thailand | — | 1,421,253 | — | 1,421,253 |
United Arab Emirates | — | 553,626 | — | 553,626 |
United Kingdom | 2,005,592 | 22,646,994 | — | 24,652,586 |
United States | 573,766 | 1,878,951 | — | 2,452,717 |
All Other Countries | 16,520,168 | — | 38,832 | 16,559,000 |
Total Common Stocks | 26,308,000 | 151,211,709 | 386,822 | 177,906,531 |
Preferred Stocks | 897,918 | 3,727,596 | — | 4,625,514 |
Exchange-Traded Fund | 4,142,621 | — | — | 4,142,621 |
Short-Term Investments | ||||
Affiliated Investment Company | 391,072 | — | — | 391,072 |
Unaffiliated Investment Companies | 5,180,828 | — | — | 5,180,828 |
Total Short-Term Investments | 5,571,900 | — | — | 5,571,900 |
Total Investments in Securities | $ 36,920,439 | $ 154,939,305 | $ 386,822 | $ 192,246,566 |
Liability Valuation Inputs | ||||
Common Stock Sold Short | $ — | $ — | $ (31) | $ (31) |
Right Sold Short | — | — | (2) | (2) |
Warrant Sold Short | — | — | — | — |
Total Investments in Securities Sold Short | $ — | $ — | $ (33) | $ (33) |
(a) | For a complete listing of investments and their industries, see the Portfolio of Investments. |
18 | MainStay WMC International Research Equity Fund |
Value | Percent † | |
Aerospace & Defense | $2,032,298 | 1.1% |
Air Freight & Logistics | 678,974 | 0.4 |
Airlines | 801,031 | 0.4 |
Auto Components | 825,890 | 0.4 |
Automobiles | 4,886,965 | 2.5 |
Banks | 22,653,677 | 12.0 |
Beverages | 12,953,560 | 6.8 |
Biotechnology | 2,954,599 | 1.6 |
Building Products | 1,771,674 | 1.0 |
Capital Markets | 3,069,064 | 1.5 |
Chemicals | 3,096,735 | 1.7 |
Commercial Services & Supplies | 178,025 | 0.1 |
Construction & Engineering | 698,063 | 0.4 |
Construction Materials | 392,594 | 0.2 |
Containers & Packaging | 883,028 | 0.4 |
Diversified Telecommunication Services | 5,201,495 | 2.7 |
Electric Utilities | 1,015,427 | 0.5 |
Electrical Equipment | 1,825,086 | 1.0 |
Electronic Equipment, Instruments & Components | 3,608,645 | 2.0 |
Entertainment | 433,488 | 0.2 |
Equity Real Estate Investment Trusts | 1,369,612 | 0.7 |
Exchange-Traded Fund | 4,142,621 | 2.2 |
Gas Utilities | 470,625 | 0.2 |
Health Care Equipment & Supplies | 4,973,654 | 2.7 |
Health Care Providers & Services | 405,190 | 0.2 |
Hotels, Restaurants & Leisure | 2,039,114 | 1.1 |
Household Durables | 1,596,720 | 0.8 |
Independent Power and Renewable Electricity Producers | 2,400,426 | 1.3 |
Industrial Conglomerates | 1,214,246 | 0.6 |
Insurance | 10,222,311 | 5.3 |
IT Services | 4,596,945 | 2.5 |
Life Sciences Tools & Services | 2,119,640 | 1.2 |
Machinery | 5,037,467 | 2.7 |
Media | 1,201,278 | 0.6 |
Metals & Mining | 8,702,550 | 4.7 |
Multi-Utilities | 1,984,165 | 1.1 |
Oil, Gas & Consumable Fuels | 9,996,055 | 5.3 |
Personal Products | 2,193,227 | 1.2 |
Pharmaceuticals | 11,160,968 | 6.0 |
Professional Services | 2,256,174 | 1.1 |
Real Estate Management & Development | 3,197,990 | 1.7 |
Road & Rail | 1,304,978 | 0.6 |
Semiconductors & Semiconductor Equipment | 14,395,394 | 7.6 |
Value | Percent † | |
Software | $2,295,255 | 1.2% |
Technology Hardware, Storage & Peripherals | 3,090,508 | 1.6 |
Textiles, Apparel & Luxury Goods | 4,867,437 | 2.5 |
Tobacco | 2,631,329 | 1.4 |
Trading Companies & Distributors | 3,717,257 | 1.9 |
Water Utilities | 692,636 | 0.4 |
Wireless Telecommunication Services | 2,438,576 | 1.3 |
186,674,666 | 98.6 | |
Short-Term Investments | 5,571,900 | 2.9 |
Other Assets, Less Liabilities* | (2,918,592) | (1.5) |
Net Assets | $189,327,974 | 100.0% |
† | Percentages indicated are based on Fund net assets. |
* | Includes Investments sold short (details are shown below). |
Value | Percent† | |
Airlines | $(31) | (0.0)%‡ |
Biotechnology | (2) | (0.0)‡ |
Energy Equipment & Services | — | (0.0)‡ |
$(33) | (0.0)%‡ |
† | Percentages indicated are based on Fund net assets. |
‡ | Less than one-tenth of a percent. |
Assets | |
Investment in unaffiliated securities before investments sold short, at value (identified cost $207,664,375) including securities on loan of $5,421,775 | $191,855,494 |
Investment in affiliated investment companies, at value (identified cost $391,072) | 391,072 |
Cash | 250,261 |
Cash denominated in foreign currencies (identified cost $259,476) | 254,461 |
Receivables: | |
Dividends | 1,940,286 |
Investment securities sold | 707,671 |
Fund shares sold | 47,057 |
Securities lending | 9,380 |
Other assets | 33,248 |
Total assets | 195,488,930 |
Liabilities | |
Investments sold short (proceeds $0) | 33 |
Cash collateral received for securities on loan | 5,180,828 |
Payables: | |
Investment securities purchased | 670,300 |
Manager (See Note 3) | 117,571 |
Custodian | 50,527 |
Professional fees | 31,820 |
Fund shares redeemed | 27,808 |
Shareholder communication | 27,198 |
Transfer agent (See Note 3) | 21,566 |
Broker fees and charges on short sales | 16,000 |
NYLIFE Distributors (See Note 3) | 6,479 |
Trustees | 1,221 |
Accrued expenses | 9,605 |
Total liabilities | 6,160,956 |
Net assets | $189,327,974 |
Composition of Net Assets | |
Shares of beneficial interest outstanding (par value of $.001 per share) unlimited number of shares authorized | $27,941 |
Additional paid-in-capital | 299,708,622 |
299,736,563 | |
Total distributable earnings (loss) | (110,408,589) |
Net assets | $189,327,974 |
Class A | |
Net assets applicable to outstanding shares | $12,909,068 |
Shares of beneficial interest outstanding | 1,915,502 |
Net asset value per share outstanding | $6.74 |
Maximum sales charge (5.50% of offering price) | 0.39 |
Maximum offering price per share outstanding | $7.13 |
Investor Class | |
Net assets applicable to outstanding shares | $1,979,576 |
Shares of beneficial interest outstanding | 294,997 |
Net asset value per share outstanding | $6.71 |
Maximum sales charge (5.00% of offering price) | 0.35 |
Maximum offering price per share outstanding | $7.06 |
Class C | |
Net assets applicable to outstanding shares | $3,672,847 |
Shares of beneficial interest outstanding | 561,240 |
Net asset value and offering price per share outstanding | $6.54 |
Class I | |
Net assets applicable to outstanding shares | $170,766,483 |
Shares of beneficial interest outstanding | 25,169,747 |
Net asset value and offering price per share outstanding | $6.78 |
20 | MainStay WMC International Research Equity Fund |
Investment Income (Loss) | |
Income | |
Dividends-unaffiliated (net of foreign tax withholding of $217,132) | $2,535,653 |
Securities lending | 42,094 |
Dividends-affiliated | 104 |
Total income | 2,577,851 |
Expenses | |
Manager (See Note 3) | 801,133 |
Custodian | 54,898 |
Transfer agent (See Note 3) | 47,106 |
Distribution/Service—Class A (See Note 3) | 18,060 |
Distribution/Service—Investor Class (See Note 3) | 2,845 |
Distribution/Service—Class C (See Note 3) | 22,927 |
Professional fees | 39,483 |
Registration | 32,807 |
Shareholder communication | 8,464 |
Trustees | 2,672 |
Miscellaneous | 11,661 |
Total expenses before waiver/reimbursement | 1,042,056 |
Expense waiver/reimbursement from Manager (See Note 3) | (65,586) |
Net expenses | 976,470 |
Net investment income (loss) | 1,601,381 |
Realized and Unrealized Gain (Loss) | |
Net realized gain (loss) on: | |
Unaffiliated investment transactions | (4,033,826) |
Foreign currency transactions | (46,722) |
Net realized gain (loss) | (4,080,548) |
Net change in unrealized appreciation (depreciation) on: | |
Unaffiliated investments | (31,445,643) |
Investments sold short | 3 |
Translation of other assets and liabilities in foreign currencies | (121,527) |
Net change in unrealized appreciation (depreciation) | (31,567,167) |
Net realized and unrealized gain (loss) | (35,647,715) |
Net increase (decrease) in net assets resulting from operations | $(34,046,334) |
for the six months ended April 30, 2022 (Unaudited) and the year ended October 31, 2021
2022 | 2021 | |
Increase (Decrease) in Net Assets | ||
Operations: | ||
Net investment income (loss) | $1,601,381 | $2,955,405 |
Net realized gain (loss) | (4,080,548) | 53,813,718 |
Net change in unrealized appreciation (depreciation) | (31,567,167) | 11,255,870 |
Net increase (decrease) in net assets resulting from operations | (34,046,334) | 68,024,993 |
Distributions to shareholders: | ||
Class A | (367,003) | (251,503) |
Investor Class | (50,882) | (51,029) |
Class C | (64,267) | (47,871) |
Class I | (5,440,803) | (5,460,954) |
Total distributions to shareholders | (5,922,955) | (5,811,357) |
Capital share transactions: | ||
Net proceeds from sales of shares | 7,626,499 | 13,488,394 |
Net asset value of shares issued to shareholders in reinvestment of distributions | 5,906,186 | 5,762,226 |
Cost of shares redeemed | (14,906,848) | (102,225,447) |
Increase (decrease) in net assets derived from capital share transactions | (1,374,163) | (82,974,827) |
Net increase (decrease) in net assets | (41,343,452) | (20,761,191) |
Net Assets | ||
Beginning of period | 230,671,426 | 251,432,617 |
End of period | $189,327,974 | $230,671,426 |
22 | MainStay WMC International Research Equity Fund |
Six months ended April 30, 2022* | Year Ended October 31, | |||||
Class A | 2021 | 2020 | 2019 | 2018 | 2017 | |
Net asset value at beginning of period | $8.16 | $6.40 | $7.77 | $7.93 | $9.58 | $8.06 |
Net investment income (loss) | 0.05(a) | 0.09(a) | 0.06(a) | 0.15(a) | 0.13 | 0.02 |
Net realized and unrealized gain (loss) | (1.27) | 1.81 | (0.70) | 0.10 | (1.63) | 1.73 |
Total from investment operations | (1.22) | 1.90 | (0.64) | 0.25 | (1.50) | 1.75 |
Less distributions: | ||||||
From net investment income | (0.20) | (0.14) | (0.73) | (0.41) | (0.15) | (0.23) |
Net asset value at end of period | $6.74 | $8.16 | $6.40 | $7.77 | $7.93 | $9.58 |
Total investment return (b) | (15.34)% | 29.93% | (9.21)% | 3.83% | (15.94)%(c) | 22.36% |
Ratios (to average net assets)/Supplemental Data: | ||||||
Net investment income (loss) | 1.28%†† | 1.09% | 0.89% | 2.04% | 1.37% | 0.24% |
Net expenses (d) | 1.14%†† | 1.31%(e) | 1.63%(e) | 1.75%(e) | 1.78%(e) | 3.22%(e) |
Expenses (before waiver/reimbursement) (d) | 1.17%†† | 1.31%(e) | 1.63%(e) | 1.75%(e) | 1.78%(e) | 3.22%(e) |
Portfolio turnover rate | 32% | 117% | 136% | 182% | 223% | 179% |
Net assets at end of period (in 000’s) | $12,909 | $15,492 | $12,373 | $19,557 | $31,870 | $55,580 |
* | Unaudited. |
†† | Annualized. |
(a) | Per share data based on average shares outstanding during the period. |
(b) | Total investment return is calculated exclusive of sales charges and assumes the reinvestment of dividends and distributions. For periods of less than one year, total return is not annualized. |
(c) | Total investment return may reflect adjustments to conform to generally accepted accounting principles. |
(d) | In addition to the fees and expenses which the Fund bears directly, it also indirectly bears a pro-rata share of the fees and expenses of the underlying funds in which it invests. Such indirect expenses are not included in the above expense ratios. |
(e) | The expense ratios presented below show the impact of short sales expense: |
Six-month Period Ended | Net Expenses (excluding short sale expenses) | Short Sales Expenses |
October 31, 2021 | 1.30% | 0.01% |
October 31, 2020 | 1.60% | 0.03% |
October 31, 2019 | 1.64% | 0.11% |
October 31, 2018 | 1.65% | 0.13% |
October 31, 2017 | 1.56% | 1.66% |
Six months ended April 30, 2022* | Year Ended October 31, | |||||
Investor Class | 2021 | 2020 | 2019 | 2018 | 2017 | |
Net asset value at beginning of period | $8.11 | $6.36 | $7.73 | $7.90 | $9.54 | $8.02 |
Net investment income (loss) | 0.04(a) | 0.05(a) | 0.04(a) | 0.15(a) | 0.12 | 0.04 |
Net realized and unrealized gain (loss) | (1.27) | 1.82 | (0.70) | 0.08 | (1.62) | 1.70 |
Total from investment operations | (1.23) | 1.87 | (0.66) | 0.23 | (1.50) | 1.74 |
Less distributions: | ||||||
From net investment income | (0.17) | (0.12) | (0.71) | (0.40) | (0.14) | (0.22) |
Net asset value at end of period | $6.71 | $8.11 | $6.36 | $7.73 | $7.90 | $9.54 |
Total investment return (b) | (15.49)% | 29.66% | (9.47)% | 3.54% | (15.97)%(c) | 22.29% |
Ratios (to average net assets)/Supplemental Data: | ||||||
Net investment income (loss) | 0.95%†† | 0.64% | 0.66% | 2.00% | 1.29% | 0.43% |
Net expenses (d) | 1.45%†† | 1.63%(e) | 1.89%(e) | 1.93%(e) | 1.88%(e) | 3.34%(e) |
Expenses (before waiver/reimbursement) (d) | 1.48%†† | 1.63%(e) | 1.89%(e) | 1.93%(e) | 1.88%(e) | 3.34%(e) |
Portfolio turnover rate | 32% | 117% | 136% | 182% | 223% | 179% |
Net assets at end of period (in 000's) | $1,980 | $2,487 | $2,731 | $3,690 | $3,407 | $4,294 |
* | Unaudited. |
†† | Annualized. |
(a) | Per share data based on average shares outstanding during the period. |
(b) | Total investment return is calculated exclusive of sales charges and assumes the reinvestment of dividends and distributions. For periods of less than one year, total return is not annualized. |
(c) | Total investment return may reflect adjustments to conform to generally accepted accounting principles. |
(d) | In addition to the fees and expenses which the Fund bears directly, it also indirectly bears a pro-rata share of the fees and expenses of the underlying funds in which it invests. Such indirect expenses are not included in the above expense ratios. |
(e) | The expense ratios presented below show the impact of short sales expense: |
Six-month Period Ended | Net Expenses (excluding short sale expenses) | Short Sales Expenses |
October 31, 2021 | 1.62% | 0.01% |
October 31, 2020 | 1.86% | 0.03% |
October 31, 2019 | 1.81% | 0.12% |
October 31, 2018 | 1.75% | 0.13% |
October 31, 2017 | 1.65% | 1.66% |
24 | MainStay WMC International Research Equity Fund |
Six months ended April 30, 2022* | Year Ended October 31, | |||||
Class C | 2021 | 2020 | 2019 | 2018 | 2017 | |
Net asset value at beginning of period | $7.87 | $6.16 | $7.49 | $7.63 | $9.23 | $7.75 |
Net investment income (loss) | 0.01(a) | 0.00‡(a) | (0.01)(a) | 0.08(a) | 0.05 | (0.01) |
Net realized and unrealized gain (loss) | (1.24) | 1.76 | (0.68) | 0.10 | (1.57) | 1.64 |
Total from investment operations | (1.23) | 1.76 | (0.69) | 0.18 | (1.52) | 1.63 |
Less distributions: | ||||||
From net investment income | (0.10) | (0.05) | (0.64) | (0.32) | (0.08) | (0.15) |
Net asset value at end of period | $6.54 | $7.87 | $6.16 | $7.49 | $7.63 | $9.23 |
Total investment return (b) | (15.84)% | 28.66% | (10.16)% | 2.81% | (16.61)% | 21.38% |
Ratios (to average net assets)/Supplemental Data: | ||||||
Net investment income (loss) | 0.16%†† | 0.01% | (0.22)% | 1.14% | 0.52% | (0.17)% |
Net expenses (c) | 2.20%†† | 2.38%(d) | 2.64%(d) | 2.66%(d) | 2.62%(d) | 4.06%(d) |
Expenses (before waiver/reimbursement) (c) | 2.23%†† | 2.38%(d) | 2.64%(d) | 2.66%(d) | 2.62%(d) | 4.06%(d) |
Portfolio turnover rate | 32% | 117% | 136% | 182% | 223% | 179% |
Net assets at end of period (in 000’s) | $3,673 | $5,340 | $6,229 | $14,203 | $27,699 | $42,231 |
* | Unaudited. |
‡ | Less than one cent per share. |
†† | Annualized. |
(a) | Per share data based on average shares outstanding during the period. |
(b) | Total investment return is calculated exclusive of sales charges and assumes the reinvestment of dividends and distributions. For periods of less than one year, total return is not annualized. |
(c) | In addition to the fees and expenses which the Fund bears directly, it also indirectly bears a pro-rata share of the fees and expenses of the underlying funds in which it invests. Such indirect expenses are not included in the above expense ratios. |
(d) | The expense ratios presented below show the impact of short sales expense: |
Six-month Period Ended | Net Expenses (excluding short sale expenses) | Short Sales Expenses |
October 31, 2021 | 2.37% | 0.01% |
October 31, 2020 | 2.61% | 0.03% |
October 31, 2019 | 2.55% | 0.11% |
October 31, 2018 | 2.49% | 0.13% |
October 31, 2017 | 2.39% | 1.64% |
Six months ended April 30, 2022* | Year Ended October 31, | |||||
Class I | 2021 | 2020 | 2019 | 2018 | 2017 | |
Net asset value at beginning of period | $8.22 | $6.45 | $7.83 | $8.00 | $9.66 | $8.12 |
Net investment income (loss) | 0.06(a) | 0.10(a) | 0.08(a) | 0.17(a) | 0.15 | 0.09 |
Net realized and unrealized gain (loss) | (1.28) | 1.83 | (0.71) | 0.10 | (1.64) | 1.70 |
Total from investment operations | (1.22) | 1.93 | (0.63) | 0.27 | (1.49) | 1.79 |
Less distributions: | ||||||
From net investment income | (0.22) | (0.16) | (0.75) | (0.44) | (0.17) | (0.25) |
Net asset value at end of period | $6.78 | $8.22 | $6.45 | $7.83 | $8.00 | $9.66 |
Total investment return (b) | (15.24)% | 30.21% | (8.98)% | 4.08% | (15.72)%(c) | 22.78% |
Ratios (to average net assets)/Supplemental Data: | ||||||
Net investment income (loss) | 1.55%†† | 1.26% | 1.19% | 2.20% | 1.63% | 0.96% |
Net expenses (d) | 0.86%†† | 1.06%(e) | 1.38%(e) | 1.50%(e) | 1.53%(e) | 2.93%(e) |
Expenses (before waiver/reimbursement) (d) | 0.92%†† | 1.08%(e) | 1.38%(e) | 1.50%(e) | 1.53%(e) | 2.93%(e) |
Portfolio turnover rate | 32% | 117% | 136% | 182% | 223% | 179% |
Net assets at end of period (in 000’s) | $170,766 | $207,352 | $230,100 | $281,279 | $521,050 | $653,051 |
* | Unaudited. |
†† | Annualized. |
(a) | Per share data based on average shares outstanding during the period. |
(b) | Total investment return is calculated exclusive of sales charges and assumes the reinvestment of dividends and distributions. Class I shares are not subject to sales charges. For periods of less than one year, total return is not annualized. |
(c) | Total investment return may reflect adjustments to conform to generally accepted accounting principles. |
(d) | In addition to the fees and expenses which the Fund bears directly, it also indirectly bears a pro-rata share of the fees and expenses of the underlying funds in which it invests. Such indirect expenses are not included in the above expense ratios. |
(e) | The expense ratios presented below show the impact of short sales expense: |
Six-month Period Ended | Net Expenses (excluding short sale expenses) | Short Sales Expenses |
October 31, 2021 | 1.05% | 0.01% |
October 31, 2020 | 1.35% | 0.03% |
October 31, 2019 | 1.40% | 0.10% |
October 31, 2018 | 1.40% | 0.13% |
October 31, 2017 | 1.29% | 1.63% |
26 | MainStay WMC International Research Equity Fund |
Class | Commenced Operations |
Class A | 9/28/2007 |
Investor Class | 2/28/2008 |
Class C | 9/28/2007 |
Class I | 9/28/2007 |
Class R6 | N/A* |
SIMPLE Class | N/A* |
* | Class R6 shares were registered for sale effective as of February 28, 2017 and SIMPLE Class shares were registered for sale effective as of August 31, 2020 but have not yet commenced operations. |
• Broker/dealer quotes | • Benchmark securities |
• Two-sided markets | • Reference data (corporate actions or material event notices) |
• Bids/offers | • Monthly payment information |
• Industry and economic events | • Reported trades |
28 | MainStay WMC International Research Equity Fund |
30 | MainStay WMC International Research Equity Fund |
Class | Expense | Waived |
Class A | $2,486 | $— |
Investor Class | 3,838 | (5) |
Class C | 7,720 | (10) |
Class I | 33,062 | — |
32 | MainStay WMC International Research Equity Fund |
Federal Tax Cost | Gross Unrealized Appreciation | Gross Unrealized (Depreciation) | Net Unrealized Appreciation/ (Depreciation) | |
Investments in Securities | $208,929,896 | $10,453,464 | $(27,136,827) | $(16,683,363) |
Capital Loss Available Through | Short-Term Capital Loss Amounts (000’s) | Long-Term Capital Loss Amounts (000’s) |
Unlimited | $90,660 | $— |
2021 | |
Distributions paid from: | |
Ordinary Income | $5,811,357 |
Class A | Shares | Amount |
Six-month period ended April 30, 2022: | ||
Shares sold | 261,700 | $1,999,378 |
Shares issued to shareholders in reinvestment of distributions | 45,770 | 357,008 |
Shares redeemed | (297,623) | (2,243,411) |
Net increase (decrease) in shares outstanding before conversion | 9,847 | 112,975 |
Shares converted into Class A (See Note 1) | 6,626 | 49,432 |
Net increase (decrease) | 16,473 | $162,407 |
Year ended October 31, 2021: | ||
Shares sold | 406,996 | $3,199,938 |
Shares issued to shareholders in reinvestment of distributions | 33,548 | 240,873 |
Shares redeemed | (534,661) | (4,069,351) |
Net increase (decrease) in shares outstanding before conversion | (94,117) | (628,540) |
Shares converted into Class A (See Note 1) | 59,430 | 466,438 |
Net increase (decrease) | (34,687) | $(162,102) |
Investor Class | Shares | Amount |
Six-month period ended April 30, 2022: | ||
Shares sold | 5,324 | $39,597 |
Shares issued to shareholders in reinvestment of distributions | 6,470 | 50,334 |
Shares redeemed | (18,780) | (138,235) |
Net increase (decrease) in shares outstanding before conversion | (6,986) | (48,304) |
Shares converted into Investor Class (See Note 1) | 800 | 5,777 |
Shares converted from Investor Class (See Note 1) | (5,665) | (42,244) |
Net increase (decrease) | (11,851) | $(84,771) |
Year ended October 31, 2021: | ||
Shares sold | 31,303 | $242,991 |
Shares issued to shareholders in reinvestment of distributions | 7,076 | 50,598 |
Shares redeemed | (106,038) | (809,982) |
Net increase (decrease) in shares outstanding before conversion | (67,659) | (516,393) |
Shares converted into Investor Class (See Note 1) | 3,025 | 23,291 |
Shares converted from Investor Class (See Note 1) | (57,649) | (450,154) |
Net increase (decrease) | (122,283) | $(943,256) |
Class C | Shares | Amount |
Six-month period ended April 30, 2022: | ||
Shares sold | 6,139 | $45,934 |
Shares issued to shareholders in reinvestment of distributions | 8,412 | 64,017 |
Shares redeemed | (130,220) | (954,494) |
Net increase (decrease) in shares outstanding before conversion | (115,669) | (844,543) |
Shares converted from Class C (See Note 1) | (1,827) | (12,965) |
Net increase (decrease) | (117,496) | $(857,508) |
Year ended October 31, 2021: | ||
Shares sold | 6,639 | $49,558 |
Shares issued to shareholders in reinvestment of distributions | 6,756 | 47,223 |
Shares redeemed | (340,250) | (2,543,000) |
Net increase (decrease) in shares outstanding before conversion | (326,855) | (2,446,219) |
Shares converted from Class C (See Note 1) | (5,247) | (39,575) |
Net increase (decrease) | (332,102) | $(2,485,794) |
Class I | Shares | Amount |
Six-month period ended April 30, 2022: | ||
Shares sold | 772,821 | $5,541,590 |
Shares issued to shareholders in reinvestment of distributions | 693,218 | 5,434,827 |
Shares redeemed | (1,516,573) | (11,570,708) |
Net increase (decrease) | (50,534) | $(594,291) |
Year ended October 31, 2021: | ||
Shares sold | 1,286,350 | $9,995,907 |
Shares issued to shareholders in reinvestment of distributions | 751,182 | 5,423,532 |
Shares redeemed | (12,502,063) | (94,803,114) |
Net increase (decrease) | (10,464,531) | $(79,383,675) |
34 | MainStay WMC International Research Equity Fund |
36 | MainStay WMC International Research Equity Fund |
38 | MainStay WMC International Research Equity Fund |
40 | MainStay WMC International Research Equity Fund |
For more information
Message from the President and Semiannual Report
please log in to newyorklifeinvestments.com/accounts.
Not FDIC/NCUA Insured | Not a Deposit | May Lose Value | No Bank Guarantee | Not Insured by Any Government Agency |


5 | |
9 | |
11 | |
14 | |
21 | |
29 | |
33 | |
34 | |
34 |
Investors should refer to the Fund’s Summary Prospectus and/or Prospectus and consider the Fund’s investment objectives, strategies, risks, charges and expenses carefully before investing. The Summary Prospectus and/or Prospectus contain this and other information about the Fund. You may obtain copies of the Fund’s Summary Prospectus, Prospectus and Statement of Additional Information, which includes information about MainStay Funds Trust's Trustees, free of charge, upon request, by calling toll-free 800-624-6782, by writing to NYLIFE Distributors LLC, Attn: MainStay Marketing Department, 30 Hudson Street, Jersey City, NJ 07302 or by sending an e-mail to MainStayShareholderServices@nylim.com. These documents are also available via the MainStay Funds’ website at newyorklifeinvestments.com. Please read the Fund’s Summary Prospectus and/or Prospectus carefully before investing.

Average Annual Total Returns for the Period-Ended April 30, 20221 | ||||||||
Class | Sales Charge | Inception Date2 | Six Months3 | One Year | Five Years | Ten Years or Since Inception | Gross Expense Ratio4 | |
Class A Shares | Maximum 5.5% Initial Sales Charge | With sales charges | 1/2/2004 | -14.29% | -14.68% | 3.10% | 7.23% | 1.22% |
Excluding sales charges | -9.30 | -9.71 | 4.27 | 7.84 | 1.22 | |||
Investor Class Shares5 | Maximum 5% Initial Sales Charge | With sales charges | 2/28/2008 | -13.95 | -14.46 | 2.82 | 6.94 | 1.66 |
Excluding sales charges | -9.42 | -9.96 | 3.99 | 7.54 | 1.66 | |||
Class B Shares6 | Maximum 5% CDSC | With sales charges | 1/2/2004 | -13.00 | -13.82 | 2.98 | 6.73 | 2.41 |
if Redeemed Within the First Six Years of Purchase | Excluding sales charges | -9.79 | -10.65 | 3.20 | 6.73 | 2.41 | ||
Class C Shares | Maximum 1% CDSC | With sales charges | 12/30/2002 | -10.36 | -11.21 | 3.22 | 6.74 | 2.41 |
if Redeemed Within One Year of Purchase | Excluding sales charges | -9.71 | -10.57 | 3.22 | 6.74 | 2.41 | ||
Class I Shares | No Sales Charge | 1/12/1987 | -9.17 | -9.47 | 4.54 | 8.11 | 0.97 | |
Class R1 Shares | No Sales Charge | 7/31/2012 | -9.23 | -9.55 | 4.43 | 8.97 | 1.07 | |
Class R2 Shares | No Sales Charge | 7/31/2012 | -9.33 | -9.78 | 4.17 | 8.69 | 1.32 | |
Class R3 Shares | No Sales Charge | 2/29/2016 | -9.44 | -10.00 | 3.91 | 7.37 | 1.57 | |
1. | The Fund replaced its subadvisor, changed its investment objective and modified its principal investment strategies as of April 1, 2019. Therefore, the performance information shown in this report prior to April 1, 2019 reflects that of the Fund’s prior subadvisor, investment objective and principal investment strategies. |
2. | Effective March 5, 2021, the Fund replaced its subadvisor and modified its principal investment strategies. The past performance in the graph and table prior to that date reflects the Fund's prior subadvisor and principal investment strategies. |
3. | Not annualized. |
4. | The gross expense ratios presented reflect the Fund’s “Total Annual Fund Operating Expenses” from the most recent Prospectus, as supplemented, and may differ from other expense ratios disclosed in this report. |
5. | Prior to June 30, 2020, the maximum initial sales charge was 5.5%, which is reflected in the applicable average annual total return figures shown. |
6. | Class B shares are closed to all new purchases as well as additional investments by existing Class B shareholders. |
Benchmark Performance* | Six Months1 | One Year | Five Years | Ten Years |
Russell 2000® Index2 | -18.38% | -16.87% | 7.24% | 10.06% |
Morningstar Small Blend Category Average3 | -12.68 | -9.83 | 6.90 | 9.30 |
* | Returns for indices reflect no deductions for fees, expenses or taxes, except for foreign withholding taxes where applicable. |
1. | Not annualized. |
2. | The Fund has selected the Russell 2000® Index as its primary benchmark. The Russell 2000® Index measures the performance of the small-cap segment of the U.S. equity universe. It is a subset of the Russell 3000® Index and includes approximately 2,000 of the smallest securities based on a combination of their market cap and current index membership. |
3. | The Morningstar Small Blend Category Average is representative of funds that favor U.S. firms at the smaller end of the market-capitalization range. Some aim to own an array of value and growth stocks while others employ a discipline that leads to holdings with valuations and growth rates close to the small-cap averages. Stocks in the bottom 10% of the capitalization of the U.S. equity market are defined as small cap. The blend style is assigned to portfolios where neither growth nor value characteristics predominate. Results are based on average total returns of similar funds with all dividends and capital gain distributions reinvested. |
6 | MainStay WMC Small Companies Fund |
Share Class | Beginning Account Value 11/1/21 | Ending Account Value (Based on Actual Returns and Expenses) 4/30/22 | Expenses Paid During Period1 | Ending Account Value (Based on Hypothetical 5% Annualized Return and Actual Expenses) 4/30/22 | Expenses Paid During Period1 | Net Expense Ratio During Period2 |
Class A Shares | $1,000.00 | $907.00 | $5.67 | $1,018.84 | $6.01 | 1.20% |
Investor Class Shares | $1,000.00 | $905.80 | $6.95 | $1,017.51 | $7.35 | 1.47% |
Class B Shares | $1,000.00 | $902.10 | $10.47 | $1,013.79 | $11.08 | 2.22% |
Class C Shares | $1,000.00 | $902.90 | $10.47 | $1,013.79 | $11.08 | 2.22% |
Class I Shares | $1,000.00 | $908.30 | $4.49 | $1,020.08 | $4.76 | 0.95% |
Class R1 Shares | $1,000.00 | $907.70 | $4.97 | $1,019.59 | $5.26 | 1.05% |
Class R2 Shares | $1,000.00 | $906.70 | $6.15 | $1,018.35 | $6.51 | 1.30% |
Class R3 Shares | $1,000.00 | $905.60 | $7.32 | $1,017.11 | $7.75 | 1.55% |
1. | Expenses are equal to the Fund’s annualized expense ratio of each class multiplied by the average account value over the period, divided by 365 and multiplied by 181 (to reflect the six-month period). The table above represents the actual expenses incurred during the six-month period. In addition to the fees and expenses which the Fund bears directly, it also indirectly bears a pro rata share of the fees and expenses of the underlying funds in which it invests. Such indirect expenses are not included in the above-reported expense figures. |
2. | Expenses are equal to the Fund's annualized expense ratio to reflect the six-month period. |
Industry Composition as of April 30, 2022 (Unaudited)
Banks | 7.4% |
Equity Real Estate Investment Trusts | 6.8 |
Health Care Equipment & Supplies | 5.5 |
Trading Companies & Distributors | 5.1 |
Biotechnology | 5.0 |
Software | 4.7 |
Thrifts & Mortgage Finance | 4.4 |
Energy Equipment & Services | 4.3 |
Exchange–Traded Fund | 4.1 |
Metals & Mining | 3.9 |
Professional Services | 3.8 |
Consumer Finance | 3.6 |
Building Products | 3.3 |
Chemicals | 3.2 |
Semiconductors & Semiconductor Equipment | 2.9 |
Electronic Equipment, Instruments & Components | 2.8 |
Pharmaceuticals | 2.3 |
Capital Markets | 2.2 |
Marine | 2.0 |
Gas Utilities | 2.0% |
Hotels, Restaurants & Leisure | 1.9 |
Health Care Providers & Services | 1.8 |
Real Estate Management & Development | 1.8 |
IT Services | 1.7 |
Commercial Services & Supplies | 1.5 |
Food Products | 1.5 |
Airlines | 1.5 |
Life Sciences Tools & Services | 1.5 |
Construction & Engineering | 1.4 |
Household Durables | 1.3 |
Specialty Retail | 1.3 |
Technology Hardware, Storage & Peripherals | 1.3 |
Auto Components | 1.1 |
Media | 0.8 |
Short–Term Investments | 5.7 |
Other Assets, Less Liabilities | –5.4 |
100.0% |
Top Ten Holdings and/or Issuers Held as of April 30, 2022 (excluding short-term investments) (Unaudited)
1. | iShares Russell 2000 ETF |
2. | Tower Semiconductor Ltd. |
3. | MRC Global, Inc. |
4. | Boise Cascade Co. |
5. | Box, Inc., Class A |
6. | Lantheus Holdings, Inc. |
7. | Nabors Industries Ltd. |
8. | Carpenter Technology Corp. |
9. | Kirby Corp. |
10. | New Jersey Resources Corp. |
8 | MainStay WMC Small Companies Fund |
10 | MainStay WMC Small Companies Fund |
Shares | Value | |
Common Stocks 95.4% | ||
Airlines 1.5% | ||
Sun Country Airlines Holdings, Inc. (a) | 188,721 | $ 5,191,715 |
Auto Components 1.1% | ||
Dana, Inc. | 240,922 | 3,568,055 |
Banks 7.4% | ||
Allegiance Bancshares, Inc. | 128,381 | 5,245,648 |
First Foundation, Inc. | 128,811 | 2,862,180 |
OFG Bancorp | 150,440 | 3,998,695 |
Old National Bancorp | 290,057 | 4,397,264 |
United Community Banks, Inc. | 135,293 | 4,077,731 |
Veritex Holdings, Inc. | 139,348 | 4,577,582 |
25,159,100 | ||
Biotechnology 5.0% | ||
Amicus Therapeutics, Inc. (a) | 374,264 | 2,649,789 |
Celldex Therapeutics, Inc. (a) | 128,803 | 3,934,932 |
Iovance Biotherapeutics, Inc. (a) | 231,500 | 3,507,225 |
Kymera Therapeutics, Inc. (a) | 47,116 | 1,477,086 |
Myovant Sciences Ltd. (a)(b) | 306,902 | 2,857,258 |
Sage Therapeutics, Inc. (a) | 86,287 | 2,719,766 |
17,146,056 | ||
Building Products 3.3% | ||
Apogee Enterprises, Inc. | 95,967 | 4,222,548 |
Insteel Industries, Inc. | 98,230 | 4,166,916 |
PGT Innovations, Inc. (a) | 163,866 | 2,911,899 |
11,301,363 | ||
Capital Markets 2.2% | ||
Hamilton Lane, Inc., Class A | 57,850 | 3,967,353 |
Moelis & Co., Class A | 80,803 | 3,576,341 |
7,543,694 | ||
Chemicals 3.2% | ||
Livent Corp. (a)(b) | 291,679 | 6,230,264 |
Minerals Technologies, Inc. | 71,792 | 4,566,689 |
10,796,953 | ||
Commercial Services & Supplies 1.5% | ||
Interface, Inc. | 414,836 | 5,264,269 |
Construction & Engineering 1.4% | ||
Badger Infrastructure Solutions Ltd. | 205,958 | 4,769,587 |
Consumer Finance 3.6% | ||
Enova International, Inc. (a) | 176,600 | 6,604,840 |
Shares | Value | |
Consumer Finance (continued) | ||
PRA Group, Inc. (a) | 133,224 | $ 5,599,405 |
12,204,245 | ||
Electronic Equipment, Instruments & Components 2.8% | ||
FARO Technologies, Inc. (a) | 124,307 | 4,262,487 |
Knowles Corp. (a) | 274,670 | 5,086,888 |
9,349,375 | ||
Energy Equipment & Services 4.1% | ||
Liberty Oilfield Services, Inc., Class A (a) | 406,446 | 6,560,038 |
Nabors Industries Ltd. (a) | 46,758 | 7,229,722 |
13,789,760 | ||
Equity Real Estate Investment Trusts 6.8% | ||
Acadia Realty Trust | 315,116 | 6,592,227 |
Piedmont Office Realty Trust, Inc., Class A | 321,157 | 5,170,628 |
Uniti Group, Inc. | 500,763 | 6,204,453 |
Veris Residential, Inc. (a) | 311,425 | 4,985,914 |
22,953,222 | ||
Food Products 1.5% | ||
Calavo Growers, Inc. | 144,473 | 5,235,702 |
Gas Utilities 2.0% | ||
New Jersey Resources Corp. | 155,383 | 6,706,330 |
Health Care Equipment & Supplies 5.5% | ||
Lantheus Holdings, Inc. (a) | 122,397 | 8,128,385 |
Orthofix Medical, Inc. (a) | 167,501 | 5,192,531 |
SI-BONE, Inc. (a) | 263,339 | 5,261,513 |
18,582,429 | ||
Health Care Providers & Services 1.8% | ||
AMN Healthcare Services, Inc. (a) | 62,476 | 6,107,029 |
Hotels, Restaurants & Leisure 1.9% | ||
Hilton Grand Vacations, Inc. (a) | 140,322 | 6,571,279 |
Household Durables 1.3% | ||
Skyline Champion Corp. (a) | 89,814 | 4,584,107 |
IT Services 1.7% | ||
I3 Verticals, Inc., Class A (a) | 210,503 | 5,778,307 |
Life Sciences Tools & Services 1.5% | ||
Codexis, Inc. (a) | 422,877 | 5,087,210 |
Shares | Value | |
Common Stocks (continued) | ||
Marine 2.0% | ||
Kirby Corp. (a) | 104,974 | $ 6,844,305 |
Media 0.8% | ||
Cardlytics, Inc. (a) | 81,882 | 2,794,633 |
Metals & Mining 3.9% | ||
Carpenter Technology Corp. | 188,383 | 7,192,463 |
MP Materials Corp. (a)(b) | 161,545 | 6,145,172 |
13,337,635 | ||
Pharmaceuticals 2.3% | ||
Arvinas, Inc. (a) | 60,868 | 3,345,914 |
Pacira BioSciences, Inc. (a) | 58,088 | 4,331,622 |
7,677,536 | ||
Professional Services 3.8% | ||
ICF International, Inc. | 66,077 | 6,529,069 |
Insperity, Inc. | 58,927 | 6,249,208 |
12,778,277 | ||
Real Estate Management & Development 1.8% | ||
Marcus & Millichap, Inc. | 132,966 | 5,955,547 |
Semiconductors & Semiconductor Equipment 2.9% | ||
Tower Semiconductor Ltd. (a) | 205,354 | 9,918,599 |
Software 4.7% | ||
Agilysys, Inc. (a)(b) | 147,059 | 5,413,242 |
Box, Inc., Class A (a) | 275,702 | 8,441,995 |
Marathon Digital Holdings, Inc. (a)(b) | 145,422 | 2,268,583 |
16,123,820 | ||
Specialty Retail 1.3% | ||
LL Flooring Holdings, Inc. (a) | 327,938 | 4,528,824 |
Technology Hardware, Storage & Peripherals 1.3% | ||
Stratasys Ltd. (a) | 227,190 | 4,405,214 |
Thrifts & Mortgage Finance 4.4% | ||
Federal Agricultural Mortgage Corp., Class C | 38,387 | 3,931,980 |
MGIC Investment Corp. | 397,247 | 5,188,046 |
NMI Holdings, Inc., Class A (a) | 154,957 | 2,848,110 |
WSFS Financial Corp. | 76,194 | 3,053,094 |
15,021,230 | ||
Shares | Value | |
Trading Companies & Distributors 5.1% | ||
Boise Cascade Co. | 114,240 | $ 8,634,259 |
MRC Global, Inc. (a) | 723,139 | 8,670,437 |
17,304,696 | ||
Total Common Stocks (Cost $345,619,119) | 324,380,103 | |
Exchange-Traded Fund 4.1% | ||
iShares Russell 2000 ETF (b) | 75,389 | 13,943,195 |
Total Exchange-Traded Fund (Cost $14,657,445) | 13,943,195 | |
Number of Warrants | ||
Warrants 0.2% | ||
Energy Equipment & Services 0.2% | ||
Nabors Industries Ltd. | ||
Expires 6/11/26 (a) | 20,184 | 633,780 |
Total Warrants (Cost $0) | 633,780 | |
Shares | ||
Short-Term Investments 5.7% | ||
Affiliated Investment Company 0.9% | ||
MainStay U.S. Government Liquidity Fund, 0.397% (c) | 3,016,740 | 3,016,740 |
Unaffiliated Investment Companies 4.8% | ||
BlackRock Liquidity FedFund, 0.375% (c)(d) | 2,000,000 | 2,000,000 |
Invesco Government & Agency Portfolio, 0.419% (c)(d) | 14,168,737 | 14,168,737 |
Total Unaffiliated Investment Companies (Cost $16,168,737) | 16,168,737 | |
Total Short-Term Investments (Cost $19,185,477) | 19,185,477 | |
Total Investments (Cost $379,462,041) | 105.4% | 358,142,555 |
Other Assets, Less Liabilities | (5.4) | (18,201,673) |
Net Assets | 100.0% | $ 339,940,882 |
12 | MainStay WMC Small Companies Fund |
† | Percentages indicated are based on Fund net assets. |
(a) | Non-income producing security. |
(b) | All or a portion of this security was held on loan. As of April 30, 2022, the aggregate market value of securities on loan was $16,547,015; the total market value of collateral held by the Fund was $17,510,474. The market value of the collateral held included non-cash collateral in the form of U.S. Treasury securities with a value of $1,341,737. The Fund received cash collateral with a value of $16,168,737. (See Note 2(G)) |
(c) | Current yield as of April 30, 2022. |
(d) | Represents a security purchased with cash collateral received for securities on loan. |
Affiliated Investment Companies | Value, Beginning of Period | Purchases at Cost | Proceeds from Sales | Net Realized Gain/(Loss) on Sales | Change in Unrealized Appreciation/ (Depreciation) | Value, End of Period | Dividend Income | Other Distributions | Shares End of Period |
MainStay U.S. Government Liquidity Fund | $ 15,834 | $ 55,916 | $ (68,733) | $ — | $ — | $ 3,017 | $ 1 | $ — | 3,017 |
Abbreviation(s): |
ETF—Exchange-Traded Fund |
Description | Quoted Prices in Active Markets for Identical Assets (Level 1) | Significant Other Observable Inputs (Level 2) | Significant Unobservable Inputs (Level 3) | Total |
Asset Valuation Inputs | ||||
Investments in Securities (a) | ||||
Common Stocks | $ 324,380,103 | $ — | $ — | $ 324,380,103 |
Exchange-Traded Fund | 13,943,195 | — | — | 13,943,195 |
Warrants | 633,780 | — | — | 633,780 |
Short-Term Investments | ||||
Affiliated Investment Company | 3,016,740 | — | — | 3,016,740 |
Unaffiliated Investment Companies | 16,168,737 | — | — | 16,168,737 |
Total Short-Term Investments | 19,185,477 | — | — | 19,185,477 |
Total Investments in Securities | $ 358,142,555 | $ — | $ — | $ 358,142,555 |
(a) | For a complete listing of investments and their industries, see the Portfolio of Investments. |
Assets | |
Investment in unaffiliated securities, at value (identified cost $376,445,301) including securities on loan of $16,547,015 | $355,125,815 |
Investment in affiliated investment companies, at value (identified cost $3,016,740) | 3,016,740 |
Receivables: | |
Investment securities sold | 338,518 |
Fund shares sold | 43,999 |
Securities lending | 10,584 |
Dividends | 1,204 |
Other assets | 144,614 |
Total assets | 358,681,474 |
Liabilities | |
Cash collateral received for securities on loan | 16,168,737 |
Payables: | |
Investment securities purchased | 1,688,976 |
Fund shares redeemed | 363,462 |
Manager (See Note 3) | 237,924 |
Transfer agent (See Note 3) | 114,573 |
Shareholder communication | 75,790 |
NYLIFE Distributors (See Note 3) | 47,475 |
Custodian | 24,226 |
Professional fees | 14,454 |
Trustees | 609 |
Accrued expenses | 4,366 |
Total liabilities | 18,740,592 |
Net assets | $339,940,882 |
Composition of Net Assets | |
Shares of beneficial interest outstanding (par value of $.001 per share) unlimited number of shares authorized | $14,966 |
Additional paid-in-capital | 364,426,905 |
364,441,871 | |
Total distributable earnings (loss) | (24,500,989) |
Net assets | $339,940,882 |
Class A | |
Net assets applicable to outstanding shares | $152,501,498 |
Shares of beneficial interest outstanding | 6,789,477 |
Net asset value per share outstanding | $22.46 |
Maximum sales charge (5.50% of offering price) | 1.31 |
Maximum offering price per share outstanding | $23.77 |
Investor Class | |
Net assets applicable to outstanding shares | $39,029,900 |
Shares of beneficial interest outstanding | 1,796,282 |
Net asset value per share outstanding | $21.73 |
Maximum sales charge (5.00% of offering price) | 1.14 |
Maximum offering price per share outstanding | $22.87 |
Class B | |
Net assets applicable to outstanding shares | $2,777,440 |
Shares of beneficial interest outstanding | 159,305 |
Net asset value and offering price per share outstanding | $17.43 |
Class C | |
Net assets applicable to outstanding shares | $3,171,541 |
Shares of beneficial interest outstanding | 181,997 |
Net asset value and offering price per share outstanding | $17.43 |
Class I | |
Net assets applicable to outstanding shares | $141,814,564 |
Shares of beneficial interest outstanding | 6,009,978 |
Net asset value and offering price per share outstanding | $23.60 |
Class R1 | |
Net assets applicable to outstanding shares | $57,758 |
Shares of beneficial interest outstanding | 2,465 |
Net asset value and offering price per share outstanding | $23.43 |
Class R2 | |
Net assets applicable to outstanding shares | $115,580 |
Shares of beneficial interest outstanding | 5,191 |
Net asset value and offering price per share outstanding | $22.27 |
Class R3 | |
Net assets applicable to outstanding shares | $472,601 |
Shares of beneficial interest outstanding | 21,504 |
Net asset value and offering price per share outstanding | $21.98 |
14 | MainStay WMC Small Companies Fund |
Investment Income (Loss) | |
Income | |
Dividends-unaffiliated (net of foreign tax withholding of $425,674) | $8,293,067 |
Securities lending | 35,598 |
Dividends-affiliated | 511 |
Total income | 8,329,176 |
Expenses | |
Manager (See Note 3) | 1,505,056 |
Distribution/Service—Class A (See Note 3) | 211,337 |
Distribution/Service—Investor Class (See Note 3) | 53,950 |
Distribution/Service—Class B (See Note 3) | 17,301 |
Distribution/Service—Class C (See Note 3) | 18,432 |
Distribution/Service—Class R2 (See Note 3) | 155 |
Distribution/Service—Class R3 (See Note 3) | 1,223 |
Transfer agent (See Note 3) | 243,859 |
Registration | 56,833 |
Professional fees | 31,268 |
Shareholder communication | 13,294 |
Custodian | 9,793 |
Trustees | 4,158 |
Shareholder service (See Note 3) | 338 |
Miscellaneous | 21,744 |
Total expenses before waiver/reimbursement | 2,188,741 |
Expense waiver/reimbursement from Manager (See Note 3) | (29,383) |
Net expenses | 2,159,358 |
Net investment income (loss) | 6,169,818 |
Realized and Unrealized Gain (Loss) | |
Net realized gain (loss) on: | |
Unaffiliated investment transactions | (8,571,514) |
Foreign currency transactions | 7,334 |
Net realized gain (loss) | (8,564,180) |
Net change in unrealized appreciation (depreciation) on: | |
Unaffiliated investments | (32,450,529) |
Translation of other assets and liabilities in foreign currencies | (46) |
Net change in unrealized appreciation (depreciation) | (32,450,575) |
Net realized and unrealized gain (loss) | (41,014,755) |
Net increase (decrease) in net assets resulting from operations | $(34,844,937) |
for the six months ended April 30, 2022 (Unaudited) and the year ended October 31, 2021
2022 | 2021 | |
Increase (Decrease) in Net Assets | ||
Operations: | ||
Net investment income (loss) | $6,169,818 | $(1,007,002) |
Net realized gain (loss) | (8,564,180) | 134,212,588 |
Net change in unrealized appreciation (depreciation) | (32,450,575) | (7,251,538) |
Net increase (decrease) in net assets resulting from operations | (34,844,937) | 125,954,048 |
Distributions to shareholders: | ||
Class A | (42,316,695) | — |
Investor Class | (11,028,249) | — |
Class B | (1,147,348) | — |
Class C | (1,159,625) | — |
Class I | (37,368,289) | — |
Class R1 | (14,689) | — |
Class R2 | (30,236) | — |
Class R3 | (118,773) | — |
Total distributions to shareholders | (93,183,904) | — |
Capital share transactions: | ||
Net proceeds from sales of shares | 22,989,861 | 67,294,645 |
Net asset value of shares issued to shareholders in reinvestment of distributions | 91,620,671 | — |
Cost of shares redeemed | (48,581,657) | (83,496,240) |
Increase (decrease) in net assets derived from capital share transactions | 66,028,875 | (16,201,595) |
Net increase (decrease) in net assets | (61,999,966) | 109,752,453 |
Net Assets | ||
Beginning of period | 401,940,848 | 292,188,395 |
End of period | $339,940,882 | $401,940,848 |
16 | MainStay WMC Small Companies Fund |
Six months ended April 30, 2022* | Year Ended October 31, | |||||
Class A | 2021 | 2020 | 2019 | 2018 | 2017 | |
Net asset value at beginning of period | $32.63 | $22.62 | $24.59 | $28.34 | $31.91 | $26.45 |
Net investment income (loss) (a) | 0.41 | (0.10) | (0.07) | 0.07 | 0.06 | 0.03 |
Net realized and unrealized gain (loss) | (2.81) | 10.11 | (1.83) | 0.24 | (0.98) | 5.54 |
Total from investment operations | (2.40) | 10.01 | (1.90) | 0.31 | (0.92) | 5.57 |
Less distributions: | ||||||
From net investment income | — | — | (0.05) | (0.05) | — | (0.11) |
From net realized gain on investments | (7.77) | — | — | (4.01) | (2.65) | — |
Return of capital | — | — | (0.02) | — | — | — |
Total distributions | (7.77) | — | (0.07) | (4.06) | (2.65) | (0.11) |
Net asset value at end of period | $22.46 | $32.63 | $22.62 | $24.59 | $28.34 | $31.91 |
Total investment return (b) | (9.30)% | 44.25% | (7.76)% | 1.41% | (3.48)% | 21.09% |
Ratios (to average net assets)/Supplemental Data: | ||||||
Net investment income (loss) | 3.23%†† | (0.32)% | (0.30)% | 0.27% | 0.19% | 0.10% |
Net expenses (c) | 1.20%†† | 1.21% | 1.25% | 1.25% | 1.23% | 1.24% |
Expenses (before waiver/reimbursement) | 1.20%††(c) | 1.22%(c) | 1.25% | 1.25% | 1.23% | 1.24% |
Portfolio turnover rate | 40% | 108% | 208% | 205% | 92% | 60% |
Net assets at end of period (in 000’s) | $152,501 | $178,454 | $115,403 | $141,548 | $155,636 | $163,350 |
* | Unaudited. |
†† | Annualized. |
(a) | Per share data based on average shares outstanding during the period. |
(b) | Total investment return is calculated exclusive of sales charges and assumes the reinvestment of dividends and distributions. For periods of less than one year, total return is not annualized. |
(c) | In addition to the fees and expenses which the Fund bears directly, it also indirectly bears a pro-rata share of the fees and expenses of the underlying funds in which it invests. Such indirect expenses are not included in the above expense ratios. |
Six months ended April 30, 2022* | Year Ended October 31, | |||||
Investor Class | 2021 | 2020 | 2019 | 2018 | 2017 | |
Net asset value at beginning of period | $31.86 | $22.14 | $24.07 | $27.85 | $31.48 | $26.09 |
Net investment income (loss) (a) | 0.37 | (0.17) | (0.13) | (0.01) | (0.02) | (0.05) |
Net realized and unrealized gain (loss) | (2.73) | 9.89 | (1.80) | 0.24 | (0.96) | 5.48 |
Total from investment operations | (2.36) | 9.72 | (1.93) | 0.23 | (0.98) | 5.43 |
Less distributions: | ||||||
From net investment income | — | — | (0.00)‡ | — | — | (0.04) |
From net realized gain on investments | (7.77) | — | — | (4.01) | (2.65) | — |
Return of capital | — | — | (0.00)‡ | — | — | — |
Total distributions | (7.77) | — | (0.00)‡ | (4.01) | (2.65) | (0.04) |
Net asset value at end of period | $21.73 | $31.86 | $22.14 | $24.07 | $27.85 | $31.48 |
Total investment return (b) | (9.42)% | 43.90% | (8.02)% | 1.09% | (3.74)% | 20.82% |
Ratios (to average net assets)/Supplemental Data: | ||||||
Net investment income (loss) | 3.00%†† | (0.57)% | (0.57)% | (0.05)% | (0.06)% | (0.16)% |
Net expenses (c) | 1.47%†† | 1.49% | 1.52% | 1.55% | 1.49% | 1.50% |
Expenses (before waiver/reimbursement) (c) | 1.59%†† | 1.66% | 1.70% | 1.64% | 1.56% | 1.50% |
Portfolio turnover rate | 40% | 108% | 208% | 205% | 92% | 60% |
Net assets at end of period (in 000's) | $39,030 | $45,382 | $41,547 | $49,342 | $48,569 | $57,488 |
* | Unaudited. |
‡ | Less than one cent per share. |
†† | Annualized. |
(a) | Per share data based on average shares outstanding during the period. |
(b) | Total investment return is calculated exclusive of sales charges and assumes the reinvestment of dividends and distributions. For periods of less than one year, total return is not annualized. |
(c) | In addition to the fees and expenses which the Fund bears directly, it also indirectly bears a pro-rata share of the fees and expenses of the underlying funds in which it invests. Such indirect expenses are not included in the above expense ratios. |
Six months ended April 30, 2022* | Year Ended October 31, | |||||
Class B | 2021 | 2020 | 2019 | 2018 | 2017 | |
Net asset value at beginning of period | $27.20 | $19.04 | $20.86 | $24.83 | $28.54 | $23.80 |
Net investment income (loss) (a) | 0.23 | (0.34) | (0.25) | (0.16) | (0.22) | (0.23) |
Net realized and unrealized gain (loss) | (2.23) | 8.50 | (1.57) | 0.20 | (0.84) | 4.97 |
Total from investment operations | (2.00) | 8.16 | (1.82) | 0.04 | (1.06) | 4.74 |
Less distributions: | ||||||
From net realized gain on investments | (7.77) | — | — | (4.01) | (2.65) | — |
Net asset value at end of period | $17.43 | $27.20 | $19.04 | $20.86 | $24.83 | $28.54 |
Total investment return (b) | (9.79)% | 42.86% | (8.72)% | 0.35% | (4.46)% | 19.92% |
Ratios (to average net assets)/Supplemental Data: | ||||||
Net investment income (loss) | 2.25%†† | (1.31)% | (1.30)% | (0.74)% | (0.80)% | (0.86)% |
Net expenses (c) | 2.22%†† | 2.24% | 2.27% | 2.30% | 2.24% | 2.25% |
Expenses (before waiver/reimbursement) (c) | 2.34%†† | 2.41% | 2.45% | 2.39% | 2.31% | 2.25% |
Portfolio turnover rate | 40% | 108% | 208% | 205% | 92% | 60% |
Net assets at end of period (in 000’s) | $2,777 | $4,021 | $4,447 | $7,442 | $10,698 | $15,188 |
* | Unaudited. |
†† | Annualized. |
(a) | Per share data based on average shares outstanding during the period. |
(b) | Total investment return is calculated exclusive of sales charges and assumes the reinvestment of dividends and distributions. For periods of less than one year, total return is not annualized. |
(c) | In addition to the fees and expenses which the Fund bears directly, it also indirectly bears a pro-rata share of the fees and expenses of the underlying funds in which it invests. Such indirect expenses are not included in the above expense ratios. |
Six months ended April 30, 2022* | Year Ended October 31, | |||||
Class C | 2021 | 2020 | 2019 | 2018 | 2017 | |
Net asset value at beginning of period | $27.19 | $19.03 | $20.84 | $24.81 | $28.52 | $23.79 |
Net investment income (loss) (a) | 0.23 | (0.34) | (0.25) | (0.13) | (0.22) | (0.24) |
Net realized and unrealized gain (loss) | (2.22) | 8.50 | (1.56) | 0.17 | (0.84) | 4.97 |
Total from investment operations | (1.99) | 8.16 | (1.81) | 0.04 | (1.06) | 4.73 |
Less distributions: | ||||||
From net realized gain on investments | (7.77) | — | — | (4.01) | (2.65) | — |
Net asset value at end of period | $17.43 | $27.19 | $19.03 | $20.84 | $24.81 | $28.52 |
Total investment return (b) | (9.71)% | 42.88%(c) | (8.69)% | 0.35% | (4.47)% | 19.88% |
Ratios (to average net assets)/Supplemental Data: | ||||||
Net investment income (loss) | 2.30%†† | (1.32)% | (1.30)% | (0.60)% | (0.81)% | (0.88)% |
Net expenses (d) | 2.22%†† | 2.24% | 2.27% | 2.30% | 2.24% | 2.25% |
Expenses (before waiver/reimbursement) (d) | 2.34%†† | 2.41% | 2.45% | 2.39% | 2.31% | 2.25% |
Portfolio turnover rate | 40% | 108% | 208% | 205% | 92% | 60% |
Net assets at end of period (in 000’s) | $3,172 | $4,129 | $3,201 | $5,469 | $14,156 | $17,770 |
* | Unaudited. |
†† | Annualized. |
(a) | Per share data based on average shares outstanding during the period. |
(b) | Total investment return is calculated exclusive of sales charges and assumes the reinvestment of dividends and distributions. For periods of less than one year, total return is not annualized. |
(c) | Total investment return may reflect adjustments to conform to generally accepted accounting principles. |
(d) | In addition to the fees and expenses which the Fund bears directly, it also indirectly bears a pro-rata share of the fees and expenses of the underlying funds in which it invests. Such indirect expenses are not included in the above expense ratios. |
18 | MainStay WMC Small Companies Fund |
Six months ended April 30, 2022* | Year Ended October 31, | |||||
Class I | 2021 | 2020 | 2019 | 2018 | 2017 | |
Net asset value at beginning of period | $33.85 | $23.40 | $25.44 | $29.19 | $32.72 | $27.11 |
Net investment income (loss) (a) | 0.46 | (0.02) | (0.01) | 0.17 | 0.14 | 0.11 |
Net realized and unrealized gain (loss) | (2.94) | 10.47 | (1.90) | 0.22 | (1.02) | 5.68 |
Total from investment operations | (2.48) | 10.45 | (1.91) | 0.39 | (0.88) | 5.79 |
Less distributions: | ||||||
From net investment income | — | — | (0.09) | (0.13) | — | (0.18) |
From net realized gain on investments | (7.77) | — | — | (4.01) | (2.65) | — |
Return of capital | — | — | (0.04) | — | — | — |
Total distributions | (7.77) | — | (0.13) | (4.14) | (2.65) | (0.18) |
Net asset value at end of period | $23.60 | $33.85 | $23.40 | $25.44 | $29.19 | $32.72 |
Total investment return (b) | (9.17)% | 44.66% | (7.55)% | 1.67% | (3.26)% | 21.40% |
Ratios (to average net assets)/Supplemental Data: | ||||||
Net investment income (loss) | 3.46%†† | (0.05)% | (0.06)% | 0.66% | 0.45% | 0.36% |
Net expenses (c) | 0.95%†† | 0.96% | 1.00% | 1.00% | 0.98% | 0.99% |
Expenses (before waiver/reimbursement) | 0.95%††(c) | 0.97%(c) | 1.00% | 1.00% | 0.98% | 0.99% |
Portfolio turnover rate | 40% | 108% | 208% | 205% | 92% | 60% |
Net assets at end of period (in 000’s) | $141,815 | $169,281 | $127,115 | $146,525 | $306,746 | $332,900 |
* | Unaudited. |
†† | Annualized. |
(a) | Per share data based on average shares outstanding during the period. |
(b) | Total investment return is calculated exclusive of sales charges and assumes the reinvestment of dividends and distributions. Class I shares are not subject to sales charges. For periods of less than one year, total return is not annualized. |
(c) | In addition to the fees and expenses which the Fund bears directly, it also indirectly bears a pro-rata share of the fees and expenses of the underlying funds in which it invests. Such indirect expenses are not included in the above expense ratios. |
Six months ended April 30, 2022* | Year Ended October 31, | |||||
Class R1 | 2021 | 2020 | 2019 | 2018 | 2017 | |
Net asset value at beginning of period | $33.69 | $23.31 | $25.34 | $29.09 | $32.65 | $27.05 |
Net investment income (loss) (a) | 0.44 | (0.05) | (0.04) | 0.10 | 0.12 | 0.08 |
Net realized and unrealized gain (loss) | (2.93) | 10.43 | (1.88) | 0.26 | (1.03) | 5.68 |
Total from investment operations | (2.49) | 10.38 | (1.92) | 0.36 | (0.91) | 5.76 |
Less distributions: | ||||||
From net investment income | — | — | (0.08) | (0.10) | — | (0.16) |
From net realized gain on investments | (7.77) | — | — | (4.01) | (2.65) | — |
Return of capital | — | — | (0.03) | — | — | — |
Total distributions | (7.77) | — | (0.11) | (4.11) | (2.65) | (0.16) |
Net asset value at end of period | $23.43 | $33.69 | $23.31 | $25.34 | $29.09 | $32.65 |
Total investment return (b) | (9.23)% | 44.53%(c) | (7.62)% | 1.57% | (3.36)% | 21.34% |
Ratios (to average net assets)/Supplemental Data: | ||||||
Net investment income (loss) | 3.35%†† | (0.16)% | (0.18)% | 0.41% | 0.38% | 0.25% |
Net expenses (d) | 1.05%†† | 1.06% | 1.10% | 1.10% | 1.08% | 1.09% |
Expenses (before waiver/reimbursement) | 1.05%††(d) | 1.07%(d) | 1.10% | 1.10% | 1.08% | 1.09% |
Portfolio turnover rate | 40% | 108% | 208% | 205% | 92% | 60% |
Net assets at end of period (in 000’s) | $58 | $64 | $44 | $65 | $63 | $97 |
* | Unaudited. |
†† | Annualized. |
(a) | Per share data based on average shares outstanding during the period. |
(b) | Total investment return is calculated exclusive of sales charges and assumes the reinvestment of dividends and distributions. Class R1 shares are not subject to sales charges. For periods of less than one year, total return is not annualized. |
(c) | Total investment return may reflect adjustments to conform to generally accepted accounting principles. |
(d) | In addition to the fees and expenses which the Fund bears directly, it also indirectly bears a pro-rata share of the fees and expenses of the underlying funds in which it invests. Such indirect expenses are not included in the above expense ratios. |
Six months ended April 30, 2022* | Year Ended October 31, | |||||
Class R2 | 2021 | 2020 | 2019 | 2018 | 2017 | |
Net asset value at beginning of period | $32.43 | $22.50 | $24.47 | $28.21 | $31.81 | $26.37 |
Net investment income (loss) (a) | 0.39 | (0.13) | (0.09) | 0.04 | 0.03 | (0.01) |
Net realized and unrealized gain (loss) | (2.78) | 10.06 | (1.83) | 0.25 | (0.98) | 5.54 |
Total from investment operations | (2.39) | 9.93 | (1.92) | 0.29 | (0.95) | 5.53 |
Less distributions: | ||||||
From net investment income | — | — | (0.04) | (0.02) | — | (0.09) |
From net realized gain on investments | (7.77) | — | — | (4.01) | (2.65) | — |
Return of capital | — | — | (0.01) | — | — | — |
Total distributions | (7.77) | — | (0.05) | (4.03) | (2.65) | (0.09) |
Net asset value at end of period | $22.27 | $32.43 | $22.50 | $24.47 | $28.21 | $31.81 |
Total investment return (b) | (9.33)% | 44.13% | (7.84)% | 1.30% | (3.59)% | 21.00% |
Ratios (to average net assets)/Supplemental Data: | ||||||
Net investment income (loss) | 3.09%†† | (0.41)% | (0.40)% | 0.18% | 0.09% | (0.03)% |
Net expenses (c) | 1.30%†† | 1.31% | 1.35% | 1.35% | 1.33% | 1.34% |
Expenses (before waiver/reimbursement) | 1.30%††(c) | 1.32%(c) | 1.35% | 1.35% | 1.33% | 1.34% |
Portfolio turnover rate | 40% | 108% | 208% | 205% | 92% | 60% |
Net assets at end of period (in 000’s) | $116 | $126 | $88 | $111 | $137 | $137 |
* | Unaudited. |
†† | Annualized. |
(a) | Per share data based on average shares outstanding during the period. |
(b) | Total investment return is calculated exclusive of sales charges and assumes the reinvestment of dividends and distributions. Class R2 shares are not subject to sales charges. For periods of less than one year, total return is not annualized. |
(c) | In addition to the fees and expenses which the Fund bears directly, it also indirectly bears a pro-rata share of the fees and expenses of the underlying funds in which it invests. Such indirect expenses are not included in the above expense ratios. |
Six months ended April 30, 2022* | Year Ended October 31, | |||||
Class R3 | 2021 | 2020 | 2019 | 2018 | 2017 | |
Net asset value at beginning of period | $32.14 | $22.35 | $24.32 | $28.11 | $31.78 | $26.39 |
Net investment income (loss) (a) | 0.35 | (0.20) | (0.15) | (0.04) | (0.05) | (0.10) |
Net realized and unrealized gain (loss) | (2.74) | 9.99 | (1.82) | 0.26 | (0.97) | 5.55 |
Total from investment operations | (2.39) | 9.79 | (1.97) | 0.22 | (1.02) | 5.45 |
Less distributions: | ||||||
From net investment income | — | — | — | — | — | (0.06) |
From net realized gain on investments | (7.77) | — | — | (4.01) | (2.65) | — |
Total distributions | (7.77) | — | — | (4.01) | (2.65) | (0.06) |
Net asset value at end of period | $21.98 | $32.14 | $22.35 | $24.32 | $28.11 | $31.78 |
Total investment return (b) | (9.44)% | 43.80% | (8.10)% | 1.04% | (3.83)% | 20.68% |
Ratios (to average net assets)/Supplemental Data: | ||||||
Net investment income (loss) | 2.80%†† | (0.66)% | (0.67)% | (0.15)% | (0.15)% | (0.32)% |
Net expenses (c) | 1.55%†† | 1.56% | 1.60% | 1.60% | 1.58% | 1.59% |
Expenses (before waiver/reimbursement) | 1.55%††(c) | 1.57%(c) | 1.60% | 1.60% | 1.58% | 1.59% |
Portfolio turnover rate | 40% | 108% | 208% | 205% | 92% | 60% |
Net assets at end of period (in 000’s) | $473 | $484 | $343 | $342 | $204 | $181 |
* | Unaudited. |
†† | Annualized. |
(a) | Per share data based on average shares outstanding during the period. |
(b) | Total investment return is calculated exclusive of sales charges and assumes the reinvestment of dividends and distributions. Class R3 shares are not subject to sales charges. For periods of less than one year, total return is not annualized. |
(c) | In addition to the fees and expenses which the Fund bears directly, it also indirectly bears a pro-rata share of the fees and expenses of the underlying funds in which it invests. Such indirect expenses are not included in the above expense ratios. |
20 | MainStay WMC Small Companies Fund |
Class | Commenced Operations |
Class A | January 2, 2004 |
Investor Class | February 28, 2008 |
Class B | January 2, 2004 |
Class C | December 30, 2002 |
Class I | January 12, 1987 |
Class R1 | July 31, 2012 |
Class R2 | July 31, 2012 |
Class R3 | February 29, 2016 |
Class R6 | N/A* |
SIMPLE Class | N/A* |
* | Class R6 shares were registered for sale effective as of February 28, 2017 and SIMPLE Class shares were registered for sale effective as of August 31, 2020 but have not yet commenced operations. |
• Broker/dealer quotes | • Benchmark securities |
• Two-sided markets | • Reference data (corporate actions or material event notices) |
• Bids/offers | • Monthly payment information |
• Industry and economic events | • Reported trades |
22 | MainStay WMC Small Companies Fund |
24 | MainStay WMC Small Companies Fund |
Class R1 | $31 |
Class R2 | 62 |
Class R3 | 245 |
Class | Expense | Waived |
Class A | $65,574 | $— |
Investor Class | 100,655 | (25,126) |
Class B | 8,130 | (2,075) |
Class C | 8,634 | (2,182) |
Class I | 60,604 | — |
Class R1 | 24 | — |
Class R2 | 48 | — |
Class R3 | 190 | — |
Class R1 | $57,758 | 100.0% |
Class R2 | 56,369 | 48.8 |
Class R3 | 38,772 | 8.2 |
Federal Tax Cost | Gross Unrealized Appreciation | Gross Unrealized (Depreciation) | Net Unrealized Appreciation/ (Depreciation) | |
Investments in Securities | $380,260,648 | $32,175,409 | $(54,293,502) | $(22,118,093) |
Class A | Shares | Amount |
Six-month period ended April 30, 2022: | ||
Shares sold | 216,113 | $5,649,612 |
Shares issued to shareholders in reinvestment of distributions | 1,699,562 | 41,588,286 |
Shares redeemed | (669,375) | (16,804,300) |
Net increase (decrease) in shares outstanding before conversion | 1,246,300 | 30,433,598 |
Shares converted into Class A (See Note 1) | 75,390 | 1,887,024 |
Shares converted from Class A (See Note 1) | (458) | (11,247) |
Net increase (decrease) | 1,321,232 | $32,309,375 |
Year ended October 31, 2021: | ||
Shares sold | 730,189 | $23,097,708 |
Shares redeemed | (813,539) | (25,189,750) |
Net increase (decrease) in shares outstanding before conversion | (83,350) | (2,092,042) |
Shares converted into Class A (See Note 1) | 448,765 | 13,503,930 |
Net increase (decrease) | 365,415 | $11,411,888 |
26 | MainStay WMC Small Companies Fund |
Investor Class | Shares | Amount |
Six-month period ended April 30, 2022: | ||
Shares sold | 26,585 | $658,913 |
Shares issued to shareholders in reinvestment of distributions | 464,342 | 11,004,918 |
Shares redeemed | (72,141) | (1,764,144) |
Net increase (decrease) in shares outstanding before conversion | 418,786 | 9,899,687 |
Shares converted into Investor Class (See Note 1) | 12,943 | 302,064 |
Shares converted from Investor Class (See Note 1) | (59,894) | (1,460,709) |
Net increase (decrease) | 371,835 | $8,741,042 |
Year ended October 31, 2021: | ||
Shares sold | 84,193 | $2,560,266 |
Shares redeemed | (138,670) | (4,154,362) |
Net increase (decrease) in shares outstanding before conversion | (54,477) | (1,594,096) |
Shares converted into Investor Class (See Note 1) | 24,690 | 770,932 |
Shares converted from Investor Class (See Note 1) | (422,445) | (12,397,422) |
Net increase (decrease) | (452,232) | $(13,220,586) |
Class B | Shares | Amount |
Six-month period ended April 30, 2022: | ||
Shares sold | 3,381 | $68,421 |
Shares issued to shareholders in reinvestment of distributions | 58,503 | 1,115,648 |
Shares redeemed | (19,094) | (365,274) |
Net increase (decrease) in shares outstanding before conversion | 42,790 | 818,795 |
Shares converted from Class B (See Note 1) | (31,335) | (594,655) |
Net increase (decrease) | 11,455 | $224,140 |
Year ended October 31, 2021: | ||
Shares sold | 2,966 | $78,338 |
Shares redeemed | (38,233) | (988,697) |
Net increase (decrease) in shares outstanding before conversion | (35,267) | (910,359) |
Shares converted from Class B (See Note 1) | (50,437) | (1,310,156) |
Net increase (decrease) | (85,704) | $(2,220,515) |
Class C | Shares | Amount |
Six-month period ended April 30, 2022: | ||
Shares sold | 3,948 | $81,962 |
Shares issued to shareholders in reinvestment of distributions | 60,841 | 1,159,625 |
Shares redeemed | (27,582) | (554,341) |
Net increase (decrease) in shares outstanding before conversion | 37,207 | 687,246 |
Shares converted from Class C (See Note 1) | (7,106) | (133,724) |
Net increase (decrease) | 30,101 | $553,522 |
Year ended October 31, 2021: | ||
Shares sold | 56,965 | $1,519,582 |
Shares redeemed | (52,522) | (1,363,627) |
Net increase (decrease) in shares outstanding before conversion | 4,443 | 155,955 |
Shares converted from Class C (See Note 1) | (20,761) | (567,284) |
Net increase (decrease) | (16,318) | $(411,329) |
Class I | Shares | Amount |
Six-month period ended April 30, 2022: | ||
Shares sold | 637,248 | $16,477,343 |
Shares issued to shareholders in reinvestment of distributions | 1,424,883 | 36,590,999 |
Shares redeemed | (1,053,105) | (29,081,394) |
Net increase (decrease) in shares outstanding before conversion | 1,009,026 | 23,986,948 |
Shares converted into Class I (See Note 1) | 436 | 11,247 |
Net increase (decrease) | 1,009,462 | $23,998,195 |
Year ended October 31, 2021: | ||
Shares sold | 1,202,922 | $39,955,155 |
Shares redeemed | (1,634,487) | (51,701,876) |
Net increase (decrease) | (431,565) | $(11,746,721) |
Class R1(a) | Shares | Amount |
Six-month period ended April 30, 2022: | ||
Shares issued to shareholders in reinvestment of distributions | 576 | $14,689 |
Net increase (decrease) | 576 | $14,689 |
Class R2 | Shares | Amount |
Six-month period ended April 30, 2022: | ||
Shares sold | 63 | $1,568 |
Shares issued to shareholders in reinvestment of distributions | 1,246 | 30,236 |
Shares redeemed | (1) | (31) |
Net increase (decrease) | 1,308 | $31,773 |
Year ended October 31, 2021: | ||
Shares sold | 91 | $2,791 |
Shares redeemed | (98) | (3,048) |
Net increase (decrease) | (7) | $(257) |
Class R3 | Shares | Amount |
Six-month period ended April 30, 2022: | ||
Shares sold | 2,126 | $52,042 |
Shares issued to shareholders in reinvestment of distributions | 4,849 | 116,270 |
Shares redeemed | (521) | (12,173) |
Net increase (decrease) | 6,454 | $156,139 |
Year ended October 31, 2021: | ||
Shares sold | 2,677 | $80,805 |
Shares redeemed | (2,977) | (94,880) |
Net increase (decrease) | (300) | $(14,075) |
(a) | No activity during the period ended October 31, 2021. |
28 | MainStay WMC Small Companies Fund |
30 | MainStay WMC Small Companies Fund |
32 | MainStay WMC Small Companies Fund |
34 | MainStay WMC Small Companies Fund |
For more information
| Item 2. | Code of Ethics. |
Not applicable.
| Item 3. | Audit Committee Financial Expert. |
Not applicable.
| Item 4. | Principal Accountant Fees and Services. |
Not applicable.
| Item 5. | Audit Committee of Listed Registrants. |
Not applicable.
| Item 6. | Investments. |
The Schedule of Investments is included as part of Item 1 of this report.
| Item 7. | Disclosure of Proxy Voting Policies and Procedures for Closed-End Management Investment Companies. |
Not applicable.
| Item 8. | Portfolio Managers of Closed-End Management Investment Companies. |
Not applicable.
| Item 9. | Purchases of Equity Securities by Closed-End Management Investment Company and Affiliated Purchasers. |
Not applicable.
| Item 10. | Submission of Matters to a Vote of Security Holders. |
Since the Registrant’s last response to this Item, there have been no material changes to the procedures by which shareholders may recommend nominees to the Registrant’s Board of Trustees.
| Item 11. | Controls and Procedures. |
(a) Based on an evaluation of the Registrant’s Disclosure Controls and Procedures (as defined in Rule 30a-3(c) under the Investment Company Act of 1940) (the “Disclosure Controls”), as of a date within 90 days prior to the filing date (the “Filing Date”) of this Form N-CSR (the “Report”), the Registrant’s principal executive officer and principal financial officer have concluded that the Disclosure Controls are reasonably designed to ensure that information required to be disclosed by the Registrant in the Report is recorded, processed, summarized and reported by the Filing Date, including ensuring that information required to be disclosed in the Report is accumulated and communicated to the Registrant’s management, including the Registrant’s principal executive officer and principal financial officer, as appropriate to allow timely decisions regarding required disclosure.
(b) There were no changes in the Registrant’s internal control over financial reporting (as defined in Rule 30a-3(d)) under the Investment Company Act of 1940 that occurred during the period covered by this report that has materially affected, or is reasonably likely to materially affect, the Registrant’s internal control over financial reporting.
| Item 12. | Disclosure of Securities Lending Activities for Closed-End Management Investment Companies. |
Not applicable.
| Item 13. | Exhibits. |
| (a) |
| (b) |
SIGNATURES
Pursuant to the requirements of the Securities Exchange Act of 1934 and the Investment Company Act of 1940, the Registrant has duly caused this Report to be signed on its behalf by the undersigned, thereunto duly authorized.
MAINSTAY FUNDS TRUST
| By: | /s/ Kirk C. Lehneis | |
| Kirk C. Lehneis | ||
| President and Principal Executive Officer | ||
| Date: | July 6, 2022 | |
Pursuant to the requirements of the Securities Exchange Act of 1934 and the Investment Company Act of 1940, this Report has been signed below by the following persons on behalf of the Registrant and in the capacities and on the dates indicated.
| By: | /s/ Kirk C. Lehneis | |
| Kirk C. Lehneis | ||
| President and Principal Executive Officer | ||
| Date: | July 6, 2022 | |
| By: | /s/ Jack Benintende | |
| Jack R. Benintende | ||
| Treasurer and Principal Financial and Accounting Officer | ||
| Date: | July 6, 2022 | |