UNITED STATES
SECURITIES AND EXCHANGE COMMISSION
Washington, D.C. 20549
Form N-CSR
CERTIFIED SHAREHOLDER REPORT OF REGISTERED MANAGEMENT
INVESTMENT COMPANIES
Investment Company Act File Number 811-22321
MAINSTAY FUNDS TRUST
(Exact name of Registrant as specified in charter)
51 Madison Avenue, New York, NY 10010
(Address of principal executive offices) (Zip code)
J. Kevin Gao, Esq.
30 Hudson Street
Jersey City, New Jersey 07302
(Name and address of agent for service)
Registrant’s telephone number, including area code: (212) 576-7000
Date of fiscal year end: October 31
Date of reporting period: April 30, 2021
| Item 1. | Reports to Stockholders. |
MainStay Balanced Fund
Message from the President and Semiannual Report
Unaudited | April 30, 2021
Sign up for e-delivery of your shareholder reports. For full details on e-delivery, including who can participate and what you can receive via e-delivery,
please log in to newyorklifeinvestments.com/accounts.
| Not FDIC/NCUA Insured | Not a Deposit | May Lose Value | No Bank Guarantee | Not Insured by Any Government Agency |
This page intentionally left blank
Message from the President
With the approval of COVID-19 vaccines and the passage of relief packages by the U.S. Congress, economic prospects improved during the reporting period, and investor risk appetite increased, benefiting both equities and fixed-income markets. Despite some volatility stemming from a sell-off in longer-dated Treasury securities, the stock market and higher-risk segments of the fixed-income market posted gains for the six months ended April 30, 2021.
By the beginning of the reporting period, the economy had made tremendous progress from the second quarter of 2020, when economic activity plunged. But uncertainty about when vaccines would be available and how quickly they could be administered left investors unsure about the economic outlook.
With the approval of several vaccines in November, the outlook brightened and investors became less risk-averse. Anticipating the likely end of the pandemic and a continuation of the economic recovery, they began to see opportunities in investment-grade and high-yield bonds and more cyclical segments of the stock market. The $900 billion relief and stimulus package passed in December provided further assurance.
In January, the Federal Reserve opted to leave interest rates unchanged, pointing to some uncertainty about the pace of the global recovery. Officials also noted that inflation remained low, citing oil prices in particular.
In March, President Biden signed the $1.9 billion American Rescue Plan, which, among other provisions, called for payments of $1,400 for those earning less than $75,000 per year, plus $1,400 per dependent. This, combined with the Federal Reserve’s new tolerance for inflation and an anticipated $2 trillion infrastructure spending bill, added to growing concerns about higher prices. Supply shortages in some markets caused some prices to soar, heightening concerns further.
In fixed-income markets, an improving economic outlook and rising inflation expectations led to a sell-off in longer-term Treasuries, with the result that the yield on the 10-year note rose sharply, particularly in February and March. Investment grade corporate bonds were also affected. Early in the reporting period, they performed well as investors shifted out of Treasuries, but as the reporting period progressed, they faltered. Longer-dated securities issued in recent years at historically low interest rates became especially unattractive.
High-yield bonds remained steady, supported by more favorable yields and an improved economic outlook, which reduced their perceived risk. Municipal bonds produced modest gains, and
although the sell-off in Treasuries produced some volatility early in 2021, stronger-than-expected tax revenues, $350 billion in financial support from the federal government, and the possibility of an increase in federal income tax rates appeared to buoy the market late in the reporting period.
Inflation concerns and volatility in the Treasury market led to a shift in equities markets. Although the S&P 500® Index, a widely followed measure of U.S. equities, posted double-digit gains and hit a record high, the rise of Treasury yields disrupted valuations, especially those of growth stocks. Technology companies that saw their valuations soar amid the work-from-home trend in 2020 suffered large declines.
But the fiscal stimulus and continued accommodation from the Federal Reserve gave investors confidence the economic recovery would continue. Combined with the sky-high valuations in technology and growth stocks, this increased the appeal of more cyclical and value-oriented shares. As a result, value stocks outperformed growth stocks during the reporting period.
Reflecting the shift in investor sentiment, the performance of S&P 500® Index sectors varied widely. While the information technology sector kept up with the broader market, it lagged cyclical sectors such as energy and financials, which led the way. The shift was further reflected in the performance of small-cap stocks, which outperformed large caps. While developed markets kept pace with the U.S. market, lagging economic and pandemic recoveries appeared to weigh on emerging markets late in the reporting period.
With the lockdown restrictions lifting in the U.S. and the pandemic easing in many regions, we at New York Life Investments are looking forward to a return to a more normal economy. We anticipate that over the next several years, a variety of trends will likely offer long-term investors many attractive opportunities. With this in mind, we continue to develop products and services to help you to take advantage of these trends, manage your risks, and ultimately meet your investment goals.
Sincerely,
Kirk C. Lehneis
President
The opinions expressed are as of the date of this report and are subject to change. There is no guarantee that any forecast made will come to pass. This material does not constitute investment advice and is not intended as an endorsement of any specific investment. Past performance is no guarantee of future results.
Not part of the Semiannual Report
Investors should refer to the Fund’s Summary Prospectus and/or Prospectus and consider the Fund’s investment objectives, strategies, risks, charges and expenses carefully before investing. The Summary Prospectus and/or Prospectus contain this and other information about the Fund. You may obtain copies of the Fund’s Summary Prospectus, Prospectus and Statement of Additional Information free of charge, upon request, by calling toll-free 800-624-6782, by writing to NYLIFE Distributors LLC, Attn: MainStay Marketing Department, 30 Hudson Street, Jersey City, NJ 07302 or by sending an e-mail to MainStayShareholderServices@nylim.com. These documents are also available via the MainStay Funds’ website at newyorklifeinvestments.com. Please read the Fund’s Summary Prospectus and/or Prospectus carefully before investing.
Investment and Performance Comparison (Unaudited)
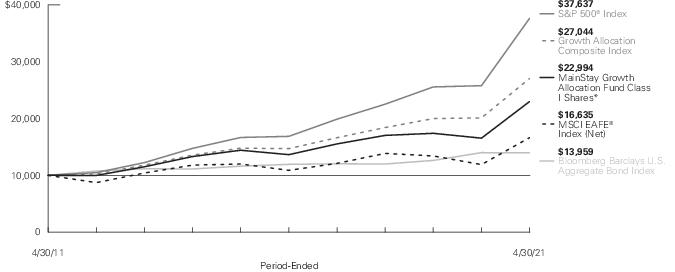
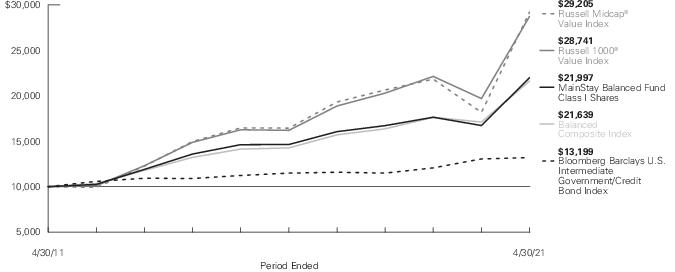
Performance data quoted represents past performance. Past performance is no guarantee of future results. Because of market volatility and other factors, current performance may be lower or higher than the figures shown. Investment return and principal value will fluctuate, and as a result, when shares are redeemed, they may be worth more or less than their original cost. The graph below depicts the historical performance of Class I shares of the Fund. Performance will vary from class to class based on differences in class-specific expenses and sales charges. For performance information current to the most recent month-end, please call 800-624-6782 or visit newyorklifeinvestments.com.
The performance table and graph do not reflect the deduction of taxes that a shareholder would pay on distributions or Fund share redemptions. Total returns reflect maximum applicable sales charges as indicated in the table below, if any, changes in share price, and reinvestment of dividend and capital gain distributions. The graph assumes the initial investment amount shown below and reflects the deduction of all sales charges that would have applied for the period of investment. Performance figures may reflect certain fee waivers and/or expense limitations, without which total returns may have been lower. For more information on share classes and current fee waivers and/or expense limitations (if any), please refer to the Notes to Financial Statements.
| Average Annual Total Returns for the Period-Ended April 30, 20211 |
| Class | Sales Charge | | Inception
Date | Six
Months | One
Year | Five
Years | Ten
Years | Gross
Expense
Ratio2 |
| Class A Shares3 | Maximum 3% Initial Sales Charge | With sales charges | 1/2/2004 | 18.98% | 27.21% | 6.99% | 7.32% | 1.09% |
| | | Excluding sales charges | | 22.66 | 31.14 | 8.21 | 7.93 | 1.09 |
| Investor Class Shares3, 4 | Maximum 2.5% Initial Sales Charge | With sales charges | 2/28/2008 | 19.43 | 26.86 | 6.78 | 7.12 | 1.36 |
| | | Excluding sales charges | | 22.49 | 30.79 | 8.00 | 7.73 | 1.36 |
| Class B Shares5 | Maximum 5% CDSC | With sales charges | 1/2/2004 | 17.07 | 24.85 | 6.88 | 6.92 | 2.11 |
| | if Redeemed Within the First Six Years of Purchase | Excluding sales charges | | 22.07 | 29.85 | 7.19 | 6.92 | 2.11 |
| Class C Shares | Maximum 1% CDSC | With sales charges | 12/30/2002 | 21.05 | 28.82 | 7.19 | 6.92 | 2.11 |
| | if Redeemed Within One Year of Purchase | Excluding sales charges | | 22.05 | 29.82 | 7.19 | 6.92 | 2.11 |
| Class I Shares | No Sales Charge | | 5/1/1989 | 22.82 | 31.49 | 8.48 | 8.20 | 0.84 |
| Class R1 Shares | No Sales Charge | | 1/2/2004 | 22.73 | 31.30 | 8.38 | 8.09 | 0.94 |
| Class R2 Shares | No Sales Charge | | 1/2/2004 | 22.59 | 30.99 | 8.13 | 7.84 | 1.19 |
| Class R3 Shares | No Sales Charge | | 4/28/2006 | 22.44 | 30.69 | 7.83 | 7.55 | 1.44 |
| Class R6 Shares | No Sales Charge | | 12/15/2017 | 22.88 | 31.62 | 8.03 | N/A | 0.74 |
| 1. | Effective March 5, 2021, the Fund replaced the subadvisor to the equity portion of the Fund and modified its principal investment strategies. The past performance in the graph and table prior to that date reflects the Fund’s prior subadvisor and principal investment strategies for the equity portion of the Fund. |
| 2. | The gross expense ratios presented reflect the Fund’s “Total Annual Fund Operating Expenses” from the most recent Prospectus, as supplemented, and may differ from other expense ratios disclosed in this report. |
| 3. | Prior to November 4, 2019, the maximum initial sales charge was 5.5%, which is reflected in the average annual total return figures shown. |
| 4. | Prior to June 30, 2020, the maximum initial sales charge was 3.0%, which is reflected in the average annual total return figures shown. |
| 5. | Class B shares are closed to all new purchases as well as additional investments by existing Class B shareholders. |
The footnotes on the next page are an integral part of the table and graph and should be carefully read in conjunction with them.
| Benchmark Performance | Six
Months | One
Year | Five
Years | Ten
Years |
| Russell 1000® Value Index1 | 36.30% | 45.92% | 12.15% | 11.13% |
| Bloomberg Barclays U.S. Intermediate Government/Credit Bond Index2 | -0.68 | 1.09 | 2.80 | 2.81 |
| Balanced Composite Index3 | 20.46 | 26.45 | 8.69 | 8.02 |
| Russell Midcap® Value Index4 | 41.41 | 60.70 | 12.18 | 11.31 |
| Morningstar Allocation - 50% to 70% Equity Category Average5 | 20.03 | 30.67 | 9.84 | 7.46 |
| 1. | The Fund has selected the Russell 1000® Value Index as its primary benchmark. The Russell 1000® Value Index measures the performance of the large-cap value segment of the U.S. equity universe. It includes those Russell 1000® Index companies with lower price-to-book ratios and lower expected growth values. Results assume reinvestment of all dividends and capital gains. An investment cannot be made directly in an index. |
| 2. | The Fund has selected the Bloomberg Barclays U.S. Intermediate Government/Credit Bond Index as a secondary benchmark. The Bloomberg Barclays U.S. Intermediate Government/Credit Bond Index measures the performance of U.S. dollar denominated U.S. treasuries, government related and investment grade U.S. corporate securities that have a remaining maturity of greater than one year and less than ten years. Results assume reinvestment of all dividends and capital gains. An investment cannot be made directly in an index. |
| 3. | The Fund has selected the Balanced Composite Index as an additional benchmark. The Balanced Composite Index consists of the Russell Midcap® Value Index and the Bloomberg Barclays U.S. Intermediate Government/Credit Bond Index weighted 60% and 40%, respectively. Results assume reinvestment of all dividends and capital gains. An investment cannot be made directly in an index. |
| 4. | The Russell Midcap® Value Index, the Fund's prior primary benchmark, measures the performance of the mid-cap value segment of the U.S. equity universe. It includes those Russell Midcap® Index companies with lower price-to-book ratios and lower forecasted growth values. Results assume reinvestment of all dividends and capital gains. An investment cannot be made directly in an index. |
| 5. | The Morningstar Allocation – 50% to 70% Equity Category Average is representative of funds that seek to provide both income and capital appreciation by investing in multiple asset classes, including stocks, bonds, and cash. These portfolios are dominated by domestic holdings and have equity exposures between 50% and 70%. Results are based on average total returns of similar funds with all dividends and capital gain distributions reinvested. |
The footnotes on the preceding page are an integral part of the table and graph and should be carefully read in conjunction with them.
Cost in Dollars of a $1,000 Investment in MainStay Balanced Fund (Unaudited)
The example below is intended to describe the fees and expenses borne by shareholders during the six-month period from November 1, 2020, to April 30, 2021, and the impact of those costs on your investment.
Example
As a shareholder of the Fund you incur two types of costs: (1) transaction costs, including exchange fees and sales charges (loads) on purchases (as applicable), and (2) ongoing costs, including management fees, distribution and/or service (12b-1) fees, and other Fund expenses (as applicable). This example is intended to help you understand your ongoing costs (in dollars) of investing in the Fund and to compare these costs with the ongoing costs of investing in other mutual funds. The example is based on an investment of $1,000 made at the beginning of the six-month period and held for the entire period from November 1, 2020, to April 30, 2021.
This example illustrates your Fund’s ongoing costs in two ways:
Actual Expenses
The second and third data columns in the table below provide information about actual account values and actual expenses. You may use the information in these columns, together with the amount you invested, to estimate the expenses that you paid during the six months ended April 30, 2021. Simply divide your account value by $1,000 (for example, an
$8,600 account value divided by $1,000 = 8.6), then multiply the result by the number under the heading entitled “Expenses Paid During Period” to estimate the expenses you paid on your account during this period.
Hypothetical Example for Comparison Purposes
The fourth and fifth data columns in the table below provide information about hypothetical account values and hypothetical expenses based on the Fund’s actual expense ratio and an assumed rate of return of 5% per year before expenses, which is not the Fund’s actual return. The hypothetical account values and expenses may not be used to estimate the actual ending account balances or expenses you paid for the six-month period shown. You may use this information to compare the ongoing costs of investing in the Fund with the ongoing costs of investing in other mutual funds. To do so, compare this 5% hypothetical example with the 5% hypothetical examples that appear in the shareholder reports of the other mutual funds.
Please note that the expenses shown in the table are meant to highlight your ongoing costs only and do not reflect any transactional costs, such as exchange fees or sales charges (loads). Therefore, the fourth and fifth data columns of the table are useful in comparing ongoing costs only and will not help you determine the relative total costs of owning different funds. In addition, if these transactional costs were included, your costs would have been higher.
| Share Class | Beginning
Account
Value
11/1/20 | Ending Account
Value (Based
on Actual
Returns and
Expenses)
4/30/21 | Expenses
Paid
During
Period1 | Ending Account
Value (Based
on Hypothetical
5% Annualized
Return and
Actual Expenses)
4/30/21 | Expenses
Paid
During
Period1 | Net Expense
Ratio
During
Period2 |
| Class A Shares | $1,000.00 | $1,226.60 | $ 6.07 | $1,019.34 | $ 5.51 | 1.10% |
| Investor Class Shares | $1,000.00 | $1,224.90 | $ 7.56 | $1,018.00 | $ 6.85 | 1.37% |
| Class B Shares | $1,000.00 | $1,220.70 | $11.67 | $1,014.28 | $10.59 | 2.12% |
| Class C Shares | $1,000.00 | $1,220.50 | $11.67 | $1,014.28 | $10.59 | 2.12% |
| Class I Shares | $1,000.00 | $1,228.20 | $ 4.75 | $1,020.53 | $ 4.31 | 0.86% |
| Class R1 Shares | $1,000.00 | $1,227.30 | $ 5.25 | $1,020.08 | $ 4.76 | 0.95% |
| Class R2 Shares | $1,000.00 | $1,225.90 | $ 6.62 | $1,018.84 | $ 6.01 | 1.20% |
| Class R3 Shares | $1,000.00 | $1,224.40 | $ 8.05 | $1,017.56 | $ 7.30 | 1.46% |
| Class R6 Shares | $1,000.00 | $1,228.80 | $ 4.20 | $1,021.03 | $ 3.81 | 0.76% |
| 1. | Expenses are equal to the Fund’s annualized expense ratio of each class multiplied by the average account value over the period, divided by 365 and multiplied by 181 (to reflect the six-month period). The table above represents the actual expenses incurred during the six-month period. In addition to the fees and expenses which the Fund bears directly, it also indirectly bears a pro rata share of the fees and expenses of the underlying funds in which it invests. Such indirect expenses are not included in the above-reported expense figures. |
| 2. | Expenses are equal to the Fund's annualized expense ratio to reflect the six-month period. |
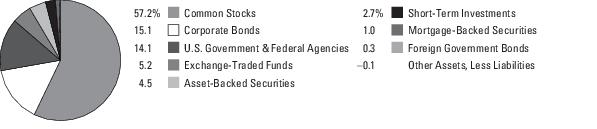
Portfolio Composition as of April 30, 2021 (Unaudited)
See Portfolio of Investments beginning on page 13 for specific holdings within these categories. The Fund's holdings are subject to change.
Top Ten Holdings or Issuers Held as of April 30, 2021 (excluding short-term investments) (Unaudited)
| 1. | U.S. Treasury Notes, 0.125%-1.25%, due 4/30/23–2/15/31 |
| 2. | iShares Russell 1000 Value ETF |
| 3. | iShares Intermediate Government/Credit Bond ETF |
| 4. | JPMorgan Chase & Co. |
| 5. | FFCB, 0.68%-2.09%, due 1/13/27–4/14/31 |
| 6. | Bank of America Corp. |
| 7. | Alphabet, Inc., Class C |
| 8. | Comcast Corp., Class A |
| 9. | Cisco Systems, Inc. |
| 10. | Pfizer, Inc. |
Portfolio Management Discussion and Analysis (Unaudited)
Questions answered by portfolio managers Jae S. Yoon, CFA, and Jonathan Swaney of New York Life Investment Management LLC, the Fund’s Manager; Kenneth Sommer and AJ Rzad, CFA, of NYL Investors LLC, the Fund’s fixed-income Subadvisor; Migene Kim, CFA, and Mona Patni of MacKay Shields LLC, (“MacKay Shields”), the Fund’s former equity Subadvisor; and portfolio manager Adam H. Illfelder of Wellington Management Company LLP (“Wellington”), the Fund’s current equity Subadvisor.
How did MainStay Balanced Fund perform relative to its benchmarks and peer group during the six months ended April 30, 2021?
For the six months ended April 30, 2021, Class I shares of MainStay Balanced Fund returned 22.82%, underperforming the 36.30% return of the Fund’s primary benchmark, the Russell 1000® Value Index. Over the same period, Class I shares outperformed the −0.68% return of the Bloomberg Barclays U.S. Intermediate Government/Credit Bond Index, which is the Fund’s secondary benchmark, and the 20.46% return of the Balanced Composite Index, which is an additional benchmark of the Fund. During the reporting period, the Fund underperformed the 41.41% return of the Russell Midcap® Value Index, which was the Fund's former primary benchmark. For the six months ended April 30, 2021, Class I shares of the Fund outperformed the 20.03% return of the Morningstar Allocation –50% to 70% Equity Category Average.1
Were there any changes to the Fund during the reporting period?
At meetings held on January 21, January 25, and February 3, 2021, the Board of Trustees of MainStay Funds Trust considered and approved, among other related proposals: (i) appointing Wellington Management Company LLP as subadvisor to the equity portion of the Fund, and the related subadvisory agreement; (ii) modifying the Fund’s principal investment strategies, investment process and primary benchmark; and (iii) reducing the Fund’s contractual management fee. These changes, in addition to the Russell 1000® Value Index becoming the Fund’s primary benchmark, became effective on March 5, 2021. For more information on these and other changes, refer to the supplement dated February 5, 2021.
What factors affected relative performance in the equity portion of the Fund during the reporting period?
MacKay Shields
During the time MacKay Shields managed the equity portion of the Fund, benchmark-relative performance was undermined primarily by the equity portion of the Fund’s allocation to large-cap value stocks. The combination of signals used by our quantitative stock selection model supported the relative performance of the equity portion of the Fund’s mid-cap stock allocation, which benefited from the strong return of the market’s valuation premium.
Wellington
During the time Wellington managed the equity portion of the
Fund, performance relative to the Russell 1000® Value Index benefited primarily from security selection. Strong selection in the communication services and consumer discretionary sectors was partially offset by weaker selection in health care. Sector allocation, a result of our bottom-up stock selection process, also bolstered relative results due to underweight exposure to the energy and communication services sectors.
During the reporting period, which sectors were the strongest positive contributors to the relative performance of the equity portion of the Fund and which sectors were particularly weak?
MacKay Shields
During the time MacKay Shields managed the equity portion of the Fund, the strongest contributions to benchmark-relative performance came from positions in the utilities, financials and industrials sectors. (Contributions take weightings and total returns into account.) During the same period, the weakest contributors to benchmark-relative performance were the real estate, health care and communication services sectors.
Wellington
During the time Wellington managed the equity portion of the Fund, the communication services, energy and consumer discretionary sectors provided the strongest positive contributions to relative performance. Over the same period, the health care sector detracted most significantly from relative performance.
During the reporting period, which individual stocks made the strongest positive contributions to absolute performance in the equity portion of the Fund and which stocks detracted the most?
MacKay Shields
During the time MacKay Shields managed the equity portion of the Fund, the individual stocks that made the strongest positive contributions to the Fund’s absolute performance included regional banking firm Signature Bank, internet & direct marketing retailer Qurate Retail and copper miner Freeport-McMoRan. The stocks that detracted most significantly from absolute performance in the equity portion of the Fund included diversified utilities WEC Energy Group and Consolidated Edison, and gold miner Newmont.
Wellington
During the time Wellington managed the equity portion of the Fund, the top contributors to absolute performance included home improvement retailer The Home Depot and internet search provider Alphabet. Shares of The Home Depot rose over the
| 1. | See page 5 for other share class returns, which may be higher or lower than Class I share returns. See page 6 for more information on benchmark and peer group returns. |
reporting period on the tailwinds of strong fourth quarter 2020 earnings, reported in late February 2021. Positive U.S. housing trends supported builders and home improvement names. Shares of Alphabet rose to record highs after the company reported first-quarter 2021 results that widely exceeded most analysts’ revenue estimates. Top-line growth was driven by a surge in advertising sales related to travel and retail as businesses boosted digital advertising spending in the hopes of capitalizing on consumers eager to resume travel following the pandemic. Both positions were still held in the Fund as of the end of the reporting period.
During the same period, the most significant detractors from absolute performance were Eli Lilly, a U.S.-based pharmaceutical company, and Phillips 66, a diversified energy company. Shares of Eli Lilly came under pressure amid underwhelming Phase 2 data from an Alzheimer’s study that had produced positive headlines earlier in the year. The equity portion of the Fund maintained the position as of the end of the reporting period. Shares of Phillips 66 traded lower after the company released guidance for the first quarter of 2021 that was considerably worse than consensus due to winter storm impacts. The release pointed to the company’s midstream, chemicals and refining segments as seeing large disruptions from lower utilization and higher costs. The equity portion of the Fund reduced exposure to Phillips 66 during the reporting period.
What were some of the largest purchases and sales in the equity portion of the Fund during the reporting period?
MacKay Shields
During the time MacKay Shields managed the equity portion of the Fund, its largest initial purchase was in shares of real estate services and investment company CBRE Group, while the largest increased position size was in shares of automobile manufacturer Ford Motor Company. During the same period, the largest full sale by the equity portion of the Fund was its position in home improvement and building products company Masco, while the most significantly decreased position size was in semiconductor maker Skyworks Solutions.
Wellington
During the time Wellington managed the equity portion of the Fund, its largest initial purchase was in shares of Rio Tinto, a metals and mining corporation, while the largest increase in position size was in the cloud-based networking platform, F5 Networks. Rio Tinto is the second largest metals and mining company in the world and the largest producer of iron ore. In our view, the stock appeared undervalued with minimal balance sheet and execution risk, and significant exposure to a cyclical recovery. F5 has often been viewed by the investment community as “legacy tech” with a focus on hardware, but we believed its business model transition towards software and subscriptions was underappreciated and revenue had begun to reaccelerate.
During the same period, the largest full sale was its holding of Zimmer Biomet, a medical device company, and the largest decrease in position size was Lennar, the biggest homebuilder in the United States. Zimmer Biomet had outperformed, and we saw better risk-adjusted upside in the health care sector in large pharmaceutical names. Lennar was a beneficiary of the robust strength in the U.S. housing market during the pandemic, and the company’s valuation no longer appeared compelling in our process.
How did sector weightings change in the equity portion of the Fund during the reporting period?
MacKay Shields
The largest increases in benchmark-relative sector exposure during the time MacKay Shields managed the equity portion of the Fund occurred in industrials and utilities. Conversely, the most significant decreases in benchmark-relative sector exposure were in the materials and information technology sectors.
Wellington
During the time Wellington managed the equity portion of the Fund, the largest increases in active weight were in the materials, communication services and energy sectors, while the largest decreases were in the health care, consumer discretionary and information technology sectors.
How was the equity portion of the Fund positioned at the end of the reporting period?
MacKay Shields
At the end of the period when MacKay Shields managed the equity portion of the Fund, the most overweight positions in the equity portion of the Fund relative to the benchmark were in the health care and consumer staples sectors, while the most underweight benchmark-relative positions were in real estate and materials.
Wellington
As of April 30, 2021, the most overweight positions in the equity portion of the Fund relative to the Russell 1000® Value Index were in the health care, information technology and financials sectors. As of the same date, the equity portion of the Fund held its most significantly underweight positions in the consumer staples, communication services and energy sectors.
What factors affected the relative performance of the fixed-income portion of the Fund during the reporting period?
Relative to the Bloomberg Barclays U.S. Intermediate Government/Credit Bond Index, the fixed-income portion of the Fund held overweight positions in U.S. government agencies, corporates, asset-backed securities and commercial mortgage-backed securities throughout the reporting period. To facilitate these overweight positions, the Fund maintained
underweight exposure to the Treasury sector. Option-adjusted spreads2 on the designated benchmark tightened 11 basis points during the reporting period. (A basis point is one one-hundredth of a percentage point.) The corporate sector was the best performing sector, led by the financials and industrials sectors. Overweight exposure to asset-backed securities was also accretive to performance, driven by both the floating-rate and fixed-rate subcomponents. Positioning in commercial mortgage-backed securities, particularly the non-agency subcomponent, also added to relative performance, as did overweight exposure to U.S. government agencies. Rates positioning in the intermediate part of the yield curve3 detracted from performance during the reporting period.
During the reporting period, how was the performance of the fixed-income portion of the Fund materially affected by investments in derivatives?
During the reporting period, the use of derivatives was limited to interest-rate derivatives designed to keep the duration4 of the fixed-income portion of the Fund in line with our target duration. Generally, interest-rate derivatives had a negative impact on performance.
What was the duration strategy of the fixed-income portion of the Fund during the reporting period?
During the reporting period, the fixed-income portion of the Fund generally maintained a duration close to that of the Bloomberg Barclays U.S. Intermediate Government/Credit Bond Index. The fixed-income portion of the Fund adopted a significantly longer duration than the benchmark on one occasion in the beginning of the reporting period; this strategy positively impacted the Fund’s performance. Throughout the second half of the reporting period, the Fund was positioned with a shorter duration than the designated benchmark in the front end of the interest rate curve (0-1 year) and a longer duration than the designated benchmark in the intermediate part of the curve (2+ years). This curve positioning detracted from performance as interest rates moved higher and steeper during the reporting period. As of April 30, 2021, the effective duration of the fixed-income portion of the Fund was 4.12 years compared to a duration of 4.13 years for the benchmark.
During the reporting period, which sectors were the strongest positive contributors to the relative performance of the fixed-income portion of the Fund and which sectors were particularly weak?
During the reporting period, the fixed-income portion of the Fund maintained overweight exposure compared to the Bloomberg Barclays U.S. Intermediate Government/Credit Bond Index in the industrials and financials sectors, both of which were accretive to the Fund’s relative performance. Among industrials, performance in the consumer cyclical and capital goods subsectors were particularly strong, with bonds issued by Ford Motor Credit, Nissan Motor, Boeing and Owens Corning among the fixed-income portion of the Fund’s strongest performers. Among financials, overweight exposure to the REIT (real estate investment trust) and finance company subsectors had the most positive impact on relative performance, particularly holdings in Vereit Operating Partnership, Highwoods Realty, and GE Capital Funding. Within securitized products, asset backed securities was the best performing sector, particularly AAA-rated5 collateralized loan obligations. In the CMBS (commercial mortgage-backed securities) sector, the fixed-income portion of the Fund’s overweight position relative to the benchmark in the non-agency subcomponent was also accretive to performance. Conversely, relatively underweight exposure to the sovereign, supranational and foreign agency subsectors detracted slightly from performance. The fixed-income portion of the Fund’s positioning in the energy, technology and transportation sectors also detracted from relative performance during the reporting period.
What were some of the largest purchases and sales in the fixed-income portion of the Fund during the reporting period?
The largest additions to the fixed-income portion of the Fund during the reporting period included bonds from Crown Castle International, Charles Schwab, Air Lease, Brighthouse Financial Global Funding and Truist Financial. These additions were based on attractive relative value opportunities, primarily on the new issue calendar. These additions increased the diversity of the fixed-income portion of the Fund while improving the yield profile.
The largest reductions during the reporting period included positions in Kinder Morgan, Becton Dickinson and Company, Cigna, Credit Suisse AG and Huntington Bancshares. These
| 2. | An option-adjusted spread is the measurement of the spread of a fixed-income security rate and the risk-free rate of return, which is then adjusted to take into account an embedded option. |
| 3. | The yield curve is a line that plots the yields of various securities of similar quality—typically U.S. Treasury issues—across a range of maturities. The U.S. Treasury yield curve serves as a benchmark for other debt and is used in economic forecasting. |
| 4. | Duration is a measure of the price sensitivity of a fixed-income investment to changes in interest rates. Duration is expressed as a number of years and is considered a more accurate sensitivity gauge than average maturity. |
| 5. | An obligation rated ‘AAA’ has the highest rating assigned by Standard & Poor’s (“S&P”), and in the opinion of S&P, the obligor’s capacity to meet its financial commitment on the obligation is extremely strong. When applied to portfolio holdings, ratings are based solely on the creditworthiness of the bonds in the portfolio and are not meant to represent the security or safety of the portfolio. |
names were reduced due to lower yield profiles than opportunities in the new issue market.
How did the sector weightings of the fixed-income portion of the Fund change during the reporting period?
During the reporting period, the fixed-income portion of the Fund held overweight exposure to the industrials and financials sectors within the corporate sector. The corporate credit allocation increased during the first quarter of 2021 as the new issue calendar presented numerous opportunities to invest in intermediate corporate credit. The financials sector came under pressure as supply put upward pressure on credit spreads,6 resulting in modestly more attractive valuations.
Toward the end of the reporting period, we reduced the Fund’s weighting in the U.S. government callable agency sector. As the economy continued to heal from the pandemic and volatility fell sharply, option-adjusted spreads among U.S. government callable agencies tightened dramatically. The spread compression prompted us to reduce this sector’s weighting for the fixed-income portion of the Fund.
In the securitized products sector, the fixed-income portion of the Fund exited exposure to non-agency residential mortgage-backed securities entirely as we felt the sector had reached terminal value given the dollar prices and convexity7 associated with the securities.
How was the fixed-income portion of the Fund positioned at the end of the reporting period?
As of April 30, 2021, the fixed-income portion of the Fund held its most significantly overweight exposure relative to the Bloomberg Barclays U.S. Intermediate Government/Credit Bond Index in asset-backed securities. In the corporate sector, the fixed-income portion of the Fund held overweight exposure to financials, industrials and utilities. The fixed-income portion of the Fund also held overweight positions in commercial mortgage-backed securities and U.S. government agencies. As of the same date, the fixed-income portion of the Fund held relatively underweight positions in the sovereign, supranational, foreign agency and foreign local government sectors, as well as in U.S. Treasury securities.
| 6. | The terms “spread” and “yield spread” may refer to the difference in yield between a security or type of security and comparable U.S. Treasury issues. The terms may also refer to the difference in yield between two specific securities or types of securities at a given time. |
| 7. | Convexity is a mathematical measure of the sensitivity of an interest-bearing bond to changes in interest rates. |
The opinions expressed are those of the portfolio managers as of the date of this report and are subject to change. There is no guarantee that any forecasts will come to pass. This material does not constitute investment advice and is not intended as an endorsement of any specific investment.
Portfolio of Investments April 30, 2021† (Unaudited)
| | Principal
Amount | Value |
| Long-Term Bonds 35.0% |
| Asset-Backed Securities 4.5% |
| Automobile Asset-Backed Securities 0.3% |
| Ford Credit Floorplan Master Owner Trust | |
| Series 2018-4, Class A | | |
| 4.06%, due 11/15/30 | $ 1,000,000 | $ 1,136,746 |
| Toyota Auto Loan Extended Note Trust | |
| Series 2020-1A, Class A | | |
| 1.35%, due 5/25/33 (a) | 750,000 | 764,059 |
| | | 1,900,805 |
| Other Asset-Backed Securities 4.2% |
| 522 Funding CLO Ltd. | |
| Series 2021-7A, Class A | | |
| 1.27% (3 Month LIBOR + 1.07%), due 4/23/34 (a)(b) | 600,000 | 600,472 |
| Apidos CLO XXV | |
| Series 2016-25A, Class A1R | | |
| 1.358% (3 Month LIBOR + 1.17%), due 10/20/31 (a)(b) | 650,000 | 650,258 |
| Apidos CLO XXX | |
| Series XXXA, Class A2 | | |
| 1.79% (3 Month LIBOR + 1.60%), due 10/18/31 (a)(b) | 600,000 | 595,264 |
| Apidos CLO XXXII | |
| Series 2019-32A, Class A1 | | |
| 1.508% (3 Month LIBOR + 1.32%), due 1/20/33 (a)(b) | 600,000 | 600,701 |
| ARES XXXVIII CLO Ltd. | |
| Series 2015-38A, Class BR | | |
| 1.588% (3 Month LIBOR + 1.40%), due 4/20/30 (a)(b) | 600,000 | 593,117 |
| Benefit Street Partners CLO XVIII Ltd. | |
| Series 2019-18A, Class A | | |
| 1.524% (3 Month LIBOR + 1.34%), due 10/15/32 (a)(b) | 350,000 | 350,308 |
| Benefit Street Partners CLO XXIII Ltd. | |
| Series 2021-23A, Class A1 | | |
| 2.297% (3 Month LIBOR + 1.08%), due 4/25/34 (a)(b) | 1,000,000 | 1,000,396 |
| CAL Funding IV Ltd. | |
| Series 2020-1A, Class A | | |
| 2.22%, due 9/25/45 (a) | 1,188,021 | 1,195,393 |
| Cedar Funding IV CLO Ltd. | |
| Series 2014-4A, Class AR | | |
| 1.403% (3 Month LIBOR + 1.23%), due 7/23/30 (a)(b) | 1,500,000 | 1,501,255 |
| | Principal
Amount | Value |
| |
| Other Asset-Backed Securities (continued) |
| Cedar Funding XII CLO Ltd. | |
| Series 2020-12A, Class A | ��� | |
| 1.446% (3 Month LIBOR + 1.27%), due 10/25/32 (a)(b) | $ 800,000 | $ 800,432 |
| Dryden 76 CLO Ltd. | |
| Series 2019-76A, Class A1 | | |
| 1.518% (3 Month LIBOR + 1.33%), due 10/20/32 (a)(b) | 500,000 | 501,124 |
| HPS Loan Management Ltd. (a)(b) | |
| Series 11A-17, Class AR | | |
| 1.213% (3 Month LIBOR + 1.02%), due 5/6/30 | 1,050,000 | 1,046,913 |
| Series 10A-16, Class A1R | | |
| 1.328% (3 Month LIBOR + 1.14%), due 1/20/28 | 248,173 | 248,121 |
| Magnetite XVIII Ltd. | |
| Series 2016-18A, Class AR | | |
| 1.274% (3 Month LIBOR + 1.08%), due 11/15/28 (a)(b) | 600,000 | 599,999 |
| Magnetite XXIII Ltd. | |
| Series 2019-23A, Class A | | |
| 1.476% (3 Month LIBOR + 1.30%), due 10/25/32 (a)(b) | 350,000 | 350,758 |
| Magnetite XXVIII Ltd. | |
| Series 2020-28A, Class A | | |
| 1.446% (3 Month LIBOR + 1.27%), due 10/25/31 (a)(b) | 500,000 | 500,590 |
| Neuberger Berman Loan Advisers CLO 24 Ltd. | |
| Series 2017-24A, Class AR | | |
| 1.21% (3 Month LIBOR + 1.02%), due 4/19/30 (a)(b) | 350,000 | 349,464 |
| Neuberger Berman Loan Advisers CLO 35 Ltd. | |
| Series 2019-35A, Class A1 | | |
| 1.53% (3 Month LIBOR + 1.34%), due 1/19/33 (a)(b) | 900,000 | 901,774 |
| Oaktree CLO Ltd. | |
| Series 2020-1A, Class B | | |
| 2.774% (3 Month LIBOR + 2.59%), due 7/15/29 (a)(b) | 500,000 | 500,648 |
| Octagon Investment Partners 29 Ltd. | |
| Series 2016-1A, Class AR | | |
| 1.356% (3 Month LIBOR + 1.18%), due 1/24/33 (a)(b) | 500,000 | 499,015 |
| OHA Credit Funding 6 Ltd. | |
| Series 2020-6A, Class A1 | | |
| 1.838% (3 Month LIBOR + 1.65%), due 7/20/31 (a)(b) | 400,000 | 400,484 |
The notes to the financial statements are an integral part of, and should be read in conjunction with, the financial statements.
13
Portfolio of Investments April 30, 2021† (Unaudited) (continued)
| | Principal
Amount | Value |
| Asset-Backed Securities (continued) |
| Other Asset-Backed Securities (continued) |
| Palmer Square CLO Ltd. (a)(b) | |
| Series 2014-1A, Class A1R2 | | |
| 1.32% (3 Month LIBOR + 1.13%), due 1/17/31 | $ 250,000 | $ 250,050 |
| Series 2015-2A, Class A2R2 | | |
| 1.738% (3 Month LIBOR + 1.55%), due 7/20/30 | 250,000 | 250,039 |
| Progress Residential | |
| Series 2021-SFR3, Class A | | |
| 1.637%, due 5/17/26 (a) | 600,000 | 601,337 |
| Regatta XIV Funding Ltd. | |
| Series 2018-3A, Class A | | |
| 1.366% (3 Month LIBOR + 1.19%), due 10/25/31 (a)(b) | 400,000 | 400,048 |
| SMB Private Education Loan Trust (a) | |
| Series 2020-B, Class A1A | | |
| 1.29%, due 7/15/53 | 632,551 | 634,763 |
| Series 2020-PTB, Class A2A | | |
| 1.60%, due 9/15/54 | 800,000 | 809,976 |
| THL Credit Wind River CLO Ltd. | |
| Series 2017-4A, Class A | | |
| 1.332% (3 Month LIBOR + 1.15%), due 11/20/30 (a)(b) | 507,000 | 507,089 |
| Tiaa CLO III Ltd. | |
| Series 2017-2A, Class A | | |
| 1.334% (3 Month LIBOR + 1.15%), due 1/16/31 (a)(b) | 500,000 | 497,262 |
| TICP CLO X Ltd. | |
| Series 2018-10A, Class A | | |
| 1.188% (3 Month LIBOR + 1.00%), due 4/20/31 (a)(b) | 400,000 | 399,324 |
| TICP CLO XIII Ltd. | |
| Series 2019-13A, Class A | | |
| 1.484% (3 Month LIBOR + 1.30%), due 7/15/32 (a)(b) | 500,000 | 500,125 |
| TIF Funding II LLC | |
| Series 2021-1A, Class A | | |
| 1.65%, due 2/20/46 (a) | 882,563 | 865,739 |
| Triton Container Finance VIII LLC | |
| Series 2020-1A, Class A | | |
| 2.11%, due 9/20/45 (a) | 950,414 | 957,633 |
| Vantage Data Centers LLC | |
| Series 2020-1A, Class A2 | | |
| 1.645%, due 9/15/45 (a) | 1,400,000 | 1,394,697 |
| | Principal
Amount | Value |
| |
| Other Asset-Backed Securities (continued) |
| Voya CLO Ltd. | |
| Series 2019-1A, Class AR | | |
| 1.244% (3 Month LIBOR + 1.06%), due 4/15/31 (a)(b) | $ 400,000 | $ 400,218 |
| Westcott Park CLO Ltd. | |
| Series 2016-1A, Class AR | | |
| 1.398% (3 Month LIBOR + 1.21%), due 7/20/28 (a)(b) | 600,000 | 600,416 |
| | | 22,855,202 |
Total Asset-Backed Securities
(Cost $24,757,228) | | 24,756,007 |
| Corporate Bonds 15.1% |
| Aerospace & Defense 0.2% |
| Boeing Co. (The) | | |
| 3.10%, due 5/1/26 | 335,000 | 352,187 |
| 3.25%, due 2/1/28 | 450,000 | 470,376 |
| 3.625%, due 2/1/31 | 500,000 | 525,743 |
| | | 1,348,306 |
| Apparel 0.0% ‡ |
| Ralph Lauren Corp. | | |
| 1.70%, due 6/15/22 | 225,000 | 228,682 |
| Auto Manufacturers 1.3% |
| American Honda Finance Corp. | | |
| 0.55%, due 7/12/24 | 425,000 | 424,397 |
| Daimler Finance North America LLC (a) | | |
| 1.094% (3 Month LIBOR + 0.90%), due 2/15/22 (b) | 850,000 | 854,889 |
| 2.45%, due 3/2/31 | 350,000 | 350,518 |
| Ford Motor Credit Co. LLC | | |
| 3.087%, due 1/9/23 | 575,000 | 585,793 |
| 3.664%, due 9/8/24 | 1,275,000 | 1,327,466 |
| General Motors Financial Co., Inc. | | |
| 1.05%, due 3/8/24 | 275,000 | 275,580 |
| 1.25%, due 1/8/26 | 800,000 | 789,959 |
| 4.35%, due 4/9/25 | 980,000 | 1,086,192 |
| Hyundai Capital America (a) | | |
| 1.80%, due 1/10/28 | 275,000 | 266,881 |
| 2.375%, due 10/15/27 | 475,000 | 479,217 |
| Nissan Motor Co. Ltd. | | |
| 4.81%, due 9/17/30 (a) | 425,000 | 471,895 |
| Volkswagen Group of America Finance LLC | | |
| 1.25%, due 11/24/25 (a) | 450,000 | 448,875 |
| | | 7,361,662 |
The notes to the financial statements are an integral part of, and should be read in conjunction with, the financial statements.
| | Principal
Amount | Value |
| Corporate Bonds (continued) |
| Banks 3.2% |
| Banco Santander SA | | |
| 1.849%, due 3/25/26 | $ 1,200,000 | $ 1,210,064 |
| Bank of America Corp. | | |
| 1.734%, due 7/22/27 (c) | 3,345,000 | 3,376,060 |
| BNP Paribas SA | | |
| 2.588% (5 Year Treasury Constant Maturity Rate + 2.05%), due 8/12/35 (a)(b) | 675,000 | 646,037 |
| Citigroup, Inc. | | |
| 2.561%, due 5/1/32 (c) | 775,000 | 774,156 |
| 4.60%, due 3/9/26 | 1,250,000 | 1,428,678 |
| Goldman Sachs Group, Inc. (The) | | |
| 1.431%, due 3/9/27 (c) | 775,000 | 771,974 |
| JPMorgan Chase & Co. (c) | | |
| 1.578%, due 4/22/27 | 2,400,000 | 2,410,536 |
| 2.956%, due 5/13/31 | 750,000 | 770,447 |
| Lloyds Banking Group plc | | |
| 0.695% (1 Year Treasury Constant Maturity Rate + 0.55%), due 5/11/24 (b) | 650,000 | 650,797 |
| Mizuho Financial Group, Inc. | | |
| 0.817% (3 Month LIBOR + 0.63%), due 5/25/24 (b) | 1,150,000 | 1,155,005 |
| Morgan Stanley | | |
| 3.625%, due 1/20/27 | 220,000 | 243,944 |
| 4.35%, due 9/8/26 | 1,370,000 | 1,550,267 |
| Societe Generale SA | | |
| 1.488% (1 Year Treasury Constant Maturity Rate + 1.10%), due 12/14/26 (a)(b) | 975,000 | 964,591 |
| Standard Chartered plc | | |
| 0.991% (1 Year Treasury Constant Maturity Rate + 0.78%), due 1/12/25 (a)(b) | 300,000 | 298,792 |
| Truist Financial Corp. | | |
| 1.267%, due 3/2/27 (c) | 775,000 | 771,484 |
| UBS Group AG | | |
| 1.364% (1 Year Treasury Constant Maturity Rate + 1.08%), due 1/30/27 (a)(b) | 675,000 | 668,355 |
| | | 17,691,187 |
| Beverages 0.3% |
| Anheuser-Busch InBev Worldwide, Inc. | | |
| 4.75%, due 1/23/29 | 1,125,000 | 1,320,253 |
| | Principal
Amount | Value |
| |
| Beverages (continued) |
| Diageo Capital plc | | |
| 2.125%, due 4/29/32 | $ 475,000 | $ 463,616 |
| | | 1,783,869 |
| Building Materials 0.2% |
| Owens Corning | | |
| 3.95%, due 8/15/29 | 875,000 | 971,963 |
| Chemicals 0.5% |
| EI du Pont de Nemours and Co. | | |
| 1.70%, due 7/15/25 | 225,000 | 231,293 |
| LYB International Finance III LLC | | |
| 1.25%, due 10/1/25 | 225,000 | 224,874 |
| NewMarket Corp. | | |
| 4.10%, due 12/15/22 | 1,245,000 | 1,309,298 |
| Nutrien Ltd. | | |
| 3.625%, due 3/15/24 | 250,000 | 268,919 |
| Nutrition & Biosciences, Inc. | | |
| 1.832%, due 10/15/27 (a) | 475,000 | 469,269 |
| | | 2,503,653 |
| Diversified Financial Services 1.6% |
| Air Lease Corp. | | |
| 0.70%, due 2/15/24 | 1,650,000 | 1,637,060 |
| Aircastle Ltd. | | |
| 2.85%, due 1/26/28 (a) | 750,000 | 736,144 |
| Antares Holdings LP | | |
| 3.95%, due 7/15/26 (a) | 250,000 | 256,695 |
| Aviation Capital Group LLC | | |
| 1.95%, due 1/30/26 (a) | 650,000 | 637,210 |
| BOC Aviation USA Corp. | | |
| 1.625%, due 4/29/24 (a) | 225,000 | 225,917 |
| Charles Schwab Corp. (The) | | |
| 0.75%, due 3/18/24 | 2,150,000 | 2,164,107 |
| GE Capital Funding LLC | | |
| 4.05%, due 5/15/27 (a) | 1,850,000 | 2,069,607 |
| LSEGA Financing plc | | |
| 2.00%, due 4/6/28 (a) | 550,000 | 548,826 |
| Thirax 1 LLC | | |
| 0.968%, due 1/14/33 | 350,000 | 349,003 |
| | | 8,624,569 |
| Electric 1.3% |
| Berkshire Hathaway Energy Co. | | |
| 1.65%, due 5/15/31 | 675,000 | 637,237 |
| Commonwealth Edison Co | | |
| 3.10%, due 11/1/24 | 340,000 | 364,260 |
| DTE Electric Co. | | |
| 2.65%, due 6/15/22 | 625,000 | 637,128 |
The notes to the financial statements are an integral part of, and should be read in conjunction with, the financial statements.
15
Portfolio of Investments April 30, 2021† (Unaudited) (continued)
| | Principal
Amount | Value |
| Corporate Bonds (continued) |
| Electric (continued) |
| DTE Energy Co. | | |
| Series F | | |
| 1.05%, due 6/1/25 | $ 375,000 | $ 373,610 |
| Entergy Arkansas LLC | | |
| 3.70%, due 6/1/24 | 740,000 | 802,169 |
| Entergy Corp. | | |
| 4.00%, due 7/15/22 | 1,395,000 | 1,446,351 |
| FirstEnergy Transmission LLC | | |
| 4.35%, due 1/15/25 (a) | 1,410,000 | 1,537,682 |
| Pinnacle West Capital Corp. | | |
| 1.30%, due 6/15/25 | 775,000 | 778,882 |
| Southern California Edison Co. | | |
| Series 20C | | |
| 1.20%, due 2/1/26 | 550,000 | 545,442 |
| Tampa Electric Co. | | |
| 2.40%, due 3/15/31 | 275,000 | 276,512 |
| | | 7,399,273 |
| Electrical Components & Equipment 0.1% |
| Emerson Electric Co. | | |
| 1.80%, due 10/15/27 | 500,000 | 508,100 |
| Electronics 0.1% |
| Flex Ltd. | | |
| 3.75%, due 2/1/26 | 400,000 | 434,568 |
| Food 0.1% |
| Conagra Brands, Inc. | | |
| 4.85%, due 11/1/28 | 690,000 | 812,517 |
| Forest Products & Paper 0.1% |
| Georgia-Pacific LLC | | |
| 0.95%, due 5/15/26 (a) | 300,000 | 293,109 |
| Healthcare-Services 0.2% |
| Fresenius Medical Care U.S. Finance III, Inc. | | |
| 2.375%, due 2/16/31 (a) | 1,215,000 | 1,170,600 |
| Insurance 0.4% |
| Brighthouse Financial Global Funding | | |
| 1.00%, due 4/12/24 (a) | 1,475,000 | 1,477,390 |
| Guardian Life Global Funding | | |
| 1.25%, due 11/19/27 (a) | 775,000 | 754,177 |
| | | 2,231,567 |
| | Principal
Amount | Value |
| |
| Investment Companies 0.1% |
| Blackstone Secured Lending Fund | | |
| 2.75%, due 9/16/26 (a) | $ 375,000 | $ 377,442 |
| Iron & Steel 0.1% |
| Nucor Corp. | | |
| 2.00%, due 6/1/25 | 400,000 | 413,897 |
| Steel Dynamics, Inc. | | |
| 2.40%, due 6/15/25 | 275,000 | 287,696 |
| | | 701,593 |
| Machinery-Diversified 0.1% |
| Deere & Co. | | |
| 3.10%, due 4/15/30 | 625,000 | 676,274 |
| Media 0.1% |
| Discovery Communications LLC | | |
| 3.625%, due 5/15/30 | 200,000 | 214,034 |
| Thomson Reuters Corp. | | |
| 3.85%, due 9/29/24 | 450,000 | 489,004 |
| | | 703,038 |
| Mining 0.2% |
| Anglo American Capital plc (a) | | |
| 2.25%, due 3/17/28 | 700,000 | 696,073 |
| 5.625%, due 4/1/30 | 550,000 | 660,970 |
| | | 1,357,043 |
| Miscellaneous—Manufacturing 0.1% |
| Siemens Financieringsmaatschappij NV | | |
| 1.70%, due 3/11/28 (a) | 625,000 | 620,449 |
| Oil & Gas 0.2% |
| Valero Energy Corp. | | |
| 2.85%, due 4/15/25 | 925,000 | 976,355 |
| Oil & Gas Services 0.3% |
| Schlumberger Holdings Corp. | | |
| 3.75%, due 5/1/24 (a) | 1,395,000 | 1,503,584 |
| Packaging & Containers 0.3% |
| WRKCo, Inc. | | |
| 3.75%, due 3/15/25 | 1,295,000 | 1,417,233 |
| Pharmaceuticals 0.7% |
| AbbVie, Inc. | | |
| 2.95%, due 11/21/26 | 1,300,000 | 1,392,224 |
The notes to the financial statements are an integral part of, and should be read in conjunction with, the financial statements.
| | Principal
Amount | Value |
| Corporate Bonds (continued) |
| Pharmaceuticals (continued) |
| Bayer US Finance II LLC | | |
| 4.375%, due 12/15/28 (a) | $ 1,085,000 | $ 1,227,747 |
| Cigna Corp. | | |
| 2.375%, due 3/15/31 | 325,000 | 320,932 |
| CVS Health Corp. | | |
| 1.875%, due 2/28/31 | 705,000 | 666,927 |
| | | 3,607,830 |
| Pipelines 0.4% |
| Energy Transfer Partners LP | | |
| 5.875%, due 3/1/22 | 1,735,000 | 1,786,962 |
| Texas Eastern Transmission LP | | |
| 2.80%, due 10/15/22 (a) | 615,000 | 630,313 |
| | | 2,417,275 |
| Private Equity 0.1% |
| Apollo Management Holdings LP | | |
| 2.65%, due 6/5/30 (a) | 500,000 | 498,767 |
| Real Estate Investment Trusts 1.8% |
| American Campus Communities Operating Partnership LP | | |
| 3.30%, due 7/15/26 | 1,155,000 | 1,245,977 |
| Corporate Office Properties LP | | |
| 2.75%, due 4/15/31 | 370,000 | 365,193 |
| Crown Castle International Corp. | | |
| 1.05%, due 7/15/26 | 2,435,000 | 2,374,315 |
| Federal Realty Investment Trust | | |
| 1.25%, due 2/15/26 | 200,000 | 199,285 |
| Highwoods Realty LP | | |
| 3.875%, due 3/1/27 | 2,050,000 | 2,229,081 |
| Kimco Realty Corp. | | |
| 1.90%, due 3/1/28 | 290,000 | 286,437 |
| 2.80%, due 10/1/26 | 640,000 | 678,449 |
| Simon Property Group LP | | |
| 1.75%, due 2/1/28 | 475,000 | 466,463 |
| Spirit Realty LP | | |
| 2.70%, due 2/15/32 | 250,000 | 242,451 |
| 3.20%, due 2/15/31 | 225,000 | 230,805 |
| VEREIT Operating Partnership LP | | |
| 3.95%, due 8/15/27 | 1,195,000 | 1,331,217 |
| | | 9,649,673 |
| Retail 0.1% |
| Advance Auto Parts, Inc. | | |
| 1.75%, due 10/1/27 | 200,000 | 198,062 |
| | Principal
Amount | Value |
| |
| Retail (continued) |
| CK Hutchison International 21 Ltd. | | |
| 1.50%, due 4/15/26 (a) | $ 325,000 | $ 325,089 |
| | | 523,151 |
| Telecommunications 0.9% |
| AT&T, Inc. | | |
| 4.35%, due 3/1/29 | 1,080,000 | 1,225,843 |
| NTT Finance Corp. | | |
| 1.162%, due 4/3/26 (a) | 600,000 | 594,721 |
| T-Mobile US, Inc. | | |
| 2.55%, due 2/15/31 (a) | 1,100,000 | 1,082,103 |
| Verizon Communications, Inc. | | |
| 2.10%, due 3/22/28 | 450,000 | 454,085 |
| 3.376%, due 2/15/25 | 8,000 | 8,727 |
| 4.016%, due 12/3/29 | 1,156,000 | 1,307,274 |
| | | 4,672,753 |
Total Corporate Bonds
(Cost $80,910,717) | | 83,066,085 |
| Foreign Government Bonds 0.3% |
| Colombia 0.1% |
| Colombia Government Bond | | |
| 3.875%, due 4/25/27 | 350,000 | 373,814 |
| Mexico 0.1% |
| Mexico Government Bond | | |
| 3.75%, due 1/11/28 | 350,000 | 379,012 |
| Norway 0.0% ‡ |
| Equinor ASA | | |
| 1.75%, due 1/22/26 | 300,000 | 308,924 |
| Philippines 0.1% |
| Philippine Government Bond | | |
| 3.00%, due 2/1/28 | 325,000 | 347,645 |
| Poland 0.0% ‡ |
| Poland Government Bond | | |
| 5.00%, due 3/23/22 | 150,000 | 156,195 |
Total Foreign Government Bonds
(Cost $1,449,011) | | 1,565,590 |
The notes to the financial statements are an integral part of, and should be read in conjunction with, the financial statements.
17
Portfolio of Investments April 30, 2021† (Unaudited) (continued)
| | Principal
Amount | Value |
| Mortgage-Backed Securities 1.0% |
| Commercial Mortgage Loans (Collateralized Mortgage Obligations) 1.0% |
| Benchmark Mortgage Trust | |
| Series 2018-B1, Class A2 | | |
| 3.571%, due 1/15/51 | $ 300,000 | $ 310,851 |
| Series 2018-B2, Class A2 | | |
| 3.662%, due 2/15/51 | 250,000 | 259,683 |
| Citigroup Commercial Mortgage Trust | |
| Series 2020-GC46, Class A5 | | |
| 2.717%, due 2/15/53 | 1,000,000 | 1,043,124 |
| CLNY Trust | |
| Series 2019-IKPR, Class B | | |
| 1.593% (1 Month LIBOR + 1.478%), due 11/15/38 (a)(b) | 2,000,000 | 1,997,580 |
| CSMC WEST Trust | |
| Series 2020-WEST, Class A | | |
| 3.04%, due 2/15/35 (a) | 1,250,000 | 1,286,169 |
| UBS Commercial Mortgage Trust | |
| Series 2018-C8, Class A2 | | |
| 3.713%, due 2/15/51 | 800,000 | 833,056 |
Total Mortgage-Backed Securities
(Cost $5,656,129) | | 5,730,463 |
| U.S. Government & Federal Agencies 14.1% |
| Federal Home Loan Mortgage Corporation (Mortgage Pass-Through Securities) 4.8% |
| FFCB | | |
| 0.68%, due 1/13/27 | 950,000 | 931,089 |
| 0.90%, due 8/19/27 | 1,125,000 | 1,105,303 |
| 1.14%, due 8/20/29 | 1,300,000 | 1,255,586 |
| 1.23%, due 9/10/29 | 1,500,000 | 1,446,316 |
| 1.23%, due 7/29/30 | 1,125,000 | 1,081,503 |
| 1.25%, due 6/24/30 | 1,400,000 | 1,342,876 |
| 1.62%, due 4/6/28 | 600,000 | 597,059 |
| 1.67%, due 3/3/31 | 950,000 | 939,607 |
| 2.03%, due 1/21/28 | 1,200,000 | 1,265,732 |
| 2.04%, due 4/14/31 | 685,000 | 680,265 |
| 2.09%, due 4/1/31 | 875,000 | 868,884 |
| FHLB | | |
| 0.375%, due 9/4/25 | 1,060,000 | 1,045,085 |
| 0.90%, due 2/26/27 | 950,000 | 938,061 |
| 1.00%, due 7/28/28 | 950,000 | 923,463 |
| 2.50%, due 12/10/27 | 1,350,000 | 1,452,323 |
| 3.00%, due 3/10/28 | 500,000 | 553,802 |
| 3.125%, due 9/12/25 | 800,000 | 879,781 |
| 3.25%, due 6/9/28 | 1,200,000 | 1,355,167 |
| FHLMC | | |
| 0.375%, due 7/21/25 | 45,000 | 44,419 |
| | Principal
Amount | Value |
| |
| Federal Home Loan Mortgage Corporation (Mortgage Pass-Through Securities) (continued) |
| FHLMC (continued) | | |
| 0.375%, due 9/23/25 | $ 250,000 | $ 246,124 |
| 0.625%, due 12/17/25 | 1,125,000 | 1,120,365 |
| 0.85%, due 12/30/27 | 525,000 | 508,228 |
| 0.90%, due 11/23/27 | 900,000 | 877,428 |
| 1.42%, due 12/30/30 | 1,125,000 | 1,086,391 |
| FNMA | | |
| 0.50%, due 6/17/25 | 950,000 | 943,892 |
| 0.75%, due 10/8/27 | 1,000,000 | 968,386 |
| 0.875%, due 8/5/30 | 1,900,000 | 1,774,915 |
| | | 26,232,050 |
| United States Treasury Notes 9.3% |
| U.S. Treasury Notes | | |
| 0.125%, due 4/30/23 | 21,975,000 | 21,959,549 |
| 0.375%, due 4/15/24 | 20,090,000 | 20,115,113 |
| 0.75%, due 3/31/26 | 1,875,000 | 1,867,676 |
| 0.75%, due 4/30/26 | 2,890,000 | 2,876,453 |
| 1.125%, due 2/15/31 | 2,650,000 | 2,530,750 |
| 1.25%, due 4/30/28 | 1,530,000 | 1,524,023 |
| | | 50,873,564 |
Total U.S. Government & Federal Agencies
(Cost $77,150,902) | | 77,105,614 |
Total Long-Term Bonds
(Cost $189,923,987) | | 192,223,759 |
| |
| | Shares | |
| Common Stocks 57.2% |
| Aerospace & Defense 3.1% |
| General Dynamics Corp. | 21,069 | 4,007,956 |
| L3Harris Technologies, Inc. | 19,700 | 4,121,831 |
| Lockheed Martin Corp. | 9,581 | 3,646,145 |
| Raytheon Technologies Corp. | 61,213 | 5,095,370 |
| | | 16,871,302 |
| Auto Components 0.6% |
| Gentex Corp. | 101,699 | 3,577,771 |
| Banks 6.7% |
| Bank of America Corp. | 226,741 | 9,189,813 |
| JPMorgan Chase & Co. | 80,466 | 12,376,476 |
| M&T Bank Corp. | 26,723 | 4,213,950 |
| PNC Financial Services Group, Inc. (The) | 29,210 | 5,460,809 |
The notes to the financial statements are an integral part of, and should be read in conjunction with, the financial statements.
| | Shares | Value |
| Common Stocks (continued) |
| Banks (continued) |
| Truist Financial Corp. | 89,326 | $ 5,297,925 |
| | | 36,538,973 |
| Beverages 0.8% |
| Keurig Dr Pepper, Inc. | 127,702 | 4,578,117 |
| Biotechnology 0.3% |
| Biogen, Inc. (d) | 5,541 | 1,481,276 |
| Building Products 1.4% |
| Fortune Brands Home & Security, Inc. | 32,960 | 3,460,141 |
| Johnson Controls International plc | 65,969 | 4,112,507 |
| | | 7,572,648 |
| Capital Markets 2.6% |
| BlackRock, Inc. | 6,576 | 5,387,717 |
| Blackstone Group, Inc. (The) | 48,999 | 4,335,921 |
| LPL Financial Holdings, Inc. | 28,283 | 4,431,946 |
| | | 14,155,584 |
| Chemicals 1.5% |
| Celanese Corp. | 28,770 | 4,506,820 |
| FMC Corp. | 31,103 | 3,677,619 |
| | | 8,184,439 |
| Communications Equipment 2.2% |
| Cisco Systems, Inc. | 164,596 | 8,379,582 |
| F5 Networks, Inc. (d) | 19,337 | 3,611,378 |
| | | 11,990,960 |
| Containers & Packaging 0.8% |
| Sealed Air Corp. | 87,794 | 4,337,024 |
| Electric Utilities 1.4% |
| Entergy Corp. | 33,238 | 3,632,581 |
| Exelon Corp. | 94,218 | 4,234,157 |
| | | 7,866,738 |
| Electrical Equipment 0.8% |
| nVent Electric plc | 136,861 | 4,167,417 |
| Electronic Equipment, Instruments & Components 0.9% |
| Corning, Inc. | 114,350 | 5,055,413 |
| Equity Real Estate Investment Trusts 2.1% |
| Crown Castle International Corp. | 17,255 | 3,262,230 |
| | Shares | Value |
| |
| Equity Real Estate Investment Trusts (continued) |
| Gaming and Leisure Properties, Inc. | 104,176 | $ 4,843,141 |
| Host Hotels & Resorts, Inc. | 189,049 | 3,433,130 |
| | | 11,538,501 |
| Food Products 0.8% |
| Mondelez International, Inc., Class A | 73,212 | 4,452,022 |
| Health Care Equipment & Supplies 2.8% |
| Becton Dickinson and Co. | 18,737 | 4,661,953 |
| Boston Scientific Corp. (d) | 99,625 | 4,343,650 |
| Medtronic plc | 48,681 | 6,373,316 |
| | | 15,378,919 |
| Health Care Providers & Services 2.8% |
| Anthem, Inc. | 18,171 | 6,893,896 |
| Centene Corp. (d) | 53,141 | 3,280,925 |
| UnitedHealth Group, Inc. | 13,707 | 5,466,352 |
| | | 15,641,173 |
| Hotels, Restaurants & Leisure 0.6% |
| Booking Holdings, Inc. (d) | 1,283 | 3,163,981 |
| Household Durables 0.8% |
| Lennar Corp., Class A | 40,939 | 4,241,280 |
| Insurance 3.8% |
| Assurant, Inc. | 28,572 | 4,445,803 |
| Chubb Ltd. | 34,387 | 5,900,466 |
| MetLife, Inc. | 105,494 | 6,712,583 |
| Progressive Corp. (The) | 38,234 | 3,851,693 |
| | | 20,910,545 |
| Interactive Media & Services 1.6% |
| Alphabet, Inc., Class C (d) | 3,583 | 8,635,460 |
| IT Services 1.6% |
| Amdocs Ltd. | 56,742 | 4,354,381 |
| Global Payments, Inc. | 20,296 | 4,356,131 |
| | | 8,710,512 |
| Machinery 0.7% |
| Middleby Corp. (The) (d) | 21,872 | 3,965,831 |
| Media 1.5% |
| Comcast Corp., Class A | 150,943 | 8,475,449 |
The notes to the financial statements are an integral part of, and should be read in conjunction with, the financial statements.
19
Portfolio of Investments April 30, 2021† (Unaudited) (continued)
| | Shares | Value |
| Common Stocks (continued) |
| Metals & Mining 0.6% |
| Rio Tinto plc, Sponsored ADR (e) | 40,937 | $ 3,482,101 |
| Multi-Utilities 1.5% |
| Dominion Energy, Inc. | 56,800 | 4,538,320 |
| Sempra Energy | 28,668 | 3,943,857 |
| | | 8,482,177 |
| Oil, Gas & Consumable Fuels 1.5% |
| Phillips 66 | 48,661 | 3,937,161 |
| Pioneer Natural Resources Co. | 26,390 | 4,059,574 |
| | | 7,996,735 |
| Pharmaceuticals 4.2% |
| AstraZeneca plc, Sponsored (e) | 73,054 | 3,876,976 |
| Eli Lilly and Co. | 26,800 | 4,898,236 |
| Merck & Co., Inc. | 34,920 | 2,601,540 |
| Pfizer, Inc. | 211,080 | 8,158,242 |
| Roche Holding AG | 10,094 | 3,289,324 |
| | | 22,824,318 |
| Real Estate Management & Development 0.7% |
| CBRE Group, Inc., Class A (d) | 44,328 | 3,776,746 |
| Road & Rail 1.5% |
| Knight-Swift Transportation Holdings, Inc. | 89,710 | 4,227,135 |
| Union Pacific Corp. | 18,527 | 4,114,662 |
| | | 8,341,797 |
| Semiconductors & Semiconductor Equipment 2.6% |
| Analog Devices, Inc. | 22,805 | 3,492,814 |
| KLA Corp. | 9,193 | 2,899,013 |
| Micron Technology, Inc. (d) | 50,318 | 4,330,870 |
| Qorvo, Inc. (d) | 20,177 | 3,796,706 |
| | | 14,519,403 |
| Software 0.6% |
| VMware, Inc., Class A (d)(e) | 20,084 | 3,230,110 |
| Specialty Retail 1.8% |
| Home Depot, Inc. (The) | 18,031 | 5,836,094 |
| TJX Cos., Inc. (The) | 56,993 | 4,046,503 |
| | | 9,882,597 |
Total Common Stocks
(Cost $269,609,546) | | 314,027,319 |
| | Shares | | Value |
| Exchange-Traded Funds 5.2% |
| iShares iBoxx $ Investment Grade Corporate Bond ETF | 9,969 | | $ 1,307,434 |
| iShares Intermediate Government/Credit Bond ETF | 108,365 | | 12,506,524 |
| iShares Russell 1000 Value ETF | 92,220 | | 14,529,261 |
Total Exchange-Traded Funds
(Cost $26,801,324) | | | 28,343,219 |
| Short-Term Investments 2.7% |
| Affiliated Investment Company 0.8% |
| MainStay U.S. Government Liquidity Fund, 0.01% (f) | 4,391,582 | | 4,391,582 |
| Unaffiliated Investment Company 1.9% |
| BlackRock Liquidity FedFund, 0.05% (f)(g) | 10,458,688 | | 10,458,688 |
Total Short-Term Investments
(Cost $14,850,270) | | | 14,850,270 |
Total Investments
(Cost $501,185,127) | 100.1% | | 549,444,567 |
| Other Assets, Less Liabilities | (0.1) | | (690,888) |
| Net Assets | 100.0% | | $ 548,753,679 |
| † | Percentages indicated are based on Fund net assets. |
| ‡ | Less than one-tenth of a percent. |
| (a) | May be sold to institutional investors only under Rule 144A or securities offered pursuant to Section 4(a)(2) of the Securities Act of 1933, as amended. |
| (b) | Floating rate—Rate shown was the rate in effect as of April 30, 2021. |
| (c) | Fixed to floating rate—Rate shown was the rate in effect as of April 30, 2021. |
| (d) | Non-income producing security. |
| (e) | All or a portion of this security was held on loan. As of April 30, 2021, the aggregate market value of securities on loan was $10,589,187; the total market value of collateral held by the Fund was $10,830,457. The market value of the collateral held included non-cash collateral in the form of U.S. Treasury securities with a value of $371,769. The Fund received cash collateral with a value of $10,458,688. (See Note 2(I)) |
| (f) | Current yield as of April 30, 2021. |
| (g) | Represents a security purchased with cash collateral received for securities on loan. |
The notes to the financial statements are an integral part of, and should be read in conjunction with, the financial statements.
Futures Contracts
As of April 30, 2021, the Fund held the following futures contracts1:
| Type | Number of
Contracts | Expiration
Date | Value at
Trade Date | Current
Notional
Amount | Unrealized
Appreciation
(Depreciation)2 |
| Long Contracts | | | | | |
| U.S. Treasury 2 Year Notes | 96 | June 2021 | $ 21,199,782 | $ 21,192,750 | $ (7,032) |
| U.S. Treasury 5 Year Notes | 13 | June 2021 | 1,622,132 | 1,611,188 | (10,944) |
| U.S. Treasury 10 Year Notes | 21 | June 2021 | 2,773,678 | 2,772,656 | (1,022) |
| Total Long Contracts | | | | | (18,998) |
| Short Contracts | | | | | |
| U.S. Treasury 10 Year Ultra Bonds | (28) | June 2021 | (4,142,327) | (4,075,313) | 67,014 |
| U.S. Treasury Long Bonds | (6) | June 2021 | (966,786) | (943,500) | 23,286 |
| Total Short Contracts | | | | | 90,300 |
| Net Unrealized Appreciation | | | | | $ 71,302 |
| 1. | As of April 30, 2021, cash in the amount of $65,810 was on deposit with a broker or futures commission merchant for futures transactions. |
| 2. | Represents the difference between the value of the contracts at the time they were opened and the value as of April 30, 2021. |
| Abbreviation(s): |
| ADR—American Depositary Receipt |
| CLO—Collateralized Loan Obligation |
| ETF—Exchange-Traded Fund |
| FFCB—Federal Farm Credit Bank |
| FHLB—Federal Home Loan Bank |
| FHLMC—Federal Home Loan Mortgage Corp. |
| FNMA—Federal National Mortgage Association |
| LIBOR—London Interbank Offered Rate |
The notes to the financial statements are an integral part of, and should be read in conjunction with, the financial statements.
21
Portfolio of Investments April 30, 2021† (Unaudited) (continued)
The following is a summary of the fair valuations according to the inputs used as of April 30, 2021, for valuing the Fund’s assets and liabilities:
| Description | Quoted
Prices in
Active
Markets for
Identical
Assets
(Level 1) | | Significant
Other
Observable
Inputs
(Level 2) | | Significant
Unobservable
Inputs
(Level 3) | | Total |
| Asset Valuation Inputs | | | | | | | |
| Investments in Securities (a) | | | | | | | |
| Long-Term Bonds | | | | | | | |
| Asset-Backed Securities | $ — | | $ 24,756,007 | | $ — | | $ 24,756,007 |
| Corporate Bonds | — | | 83,066,085 | | — | | 83,066,085 |
| Foreign Government Bonds | — | | 1,565,590 | | — | | 1,565,590 |
| Mortgage-Backed Securities | — | | 5,730,463 | | — | | 5,730,463 |
| U.S. Government & Federal Agencies | — | | 77,105,614 | | — | | 77,105,614 |
| Total Long-Term Bonds | — | | 192,223,759 | | — | | 192,223,759 |
| Common Stocks | 314,027,319 | | — | | — | | 314,027,319 |
| Exchange-Traded Funds | 28,343,219 | | — | | — | | 28,343,219 |
| Short-Term Investments | | | | | | | |
| Affiliated Investment Company | 4,391,582 | | — | | — | | 4,391,582 |
| Unaffiliated Investment Company | 10,458,688 | | — | | — | | 10,458,688 |
| Total Short-Term Investments | 14,850,270 | | — | | — | | 14,850,270 |
| Total Investments in Securities | 357,220,808 | | 192,223,759 | | — | | 549,444,567 |
| Other Financial Instruments | | | | | | | |
| Futures Contracts (b) | 90,300 | | — | | — | | 90,300 |
| Total Investments in Securities and Other Financial Instruments | $ 357,311,108 | | $ 192,223,759 | | $ — | | $ 549,534,867 |
| Liability Valuation Inputs | | | | | | | |
| Other Financial Instruments | | | | | | | |
| Futures Contracts (b) | $ (18,998) | | $ — | | $ — | | $ (18,998) |
| (a) | For a complete listing of investments and their industries, see the Portfolio of Investments. |
| (b) | The value listed for these securities reflects unrealized appreciation (depreciation) as shown on the Portfolio of Investments. |
The notes to the financial statements are an integral part of, and should be read in conjunction with, the financial statements.
Statement of Assets and Liabilities as of April 30, 2021 (Unaudited)
| Assets |
Investment in unaffiliated securities, at value
(identified cost $496,793,545) including securities on loan of $10,589,187 | $545,052,985 |
Investment in affiliated investment companies, at value
(identified cost $4,391,582) | 4,391,582 |
| Cash collateral on deposit at broker for futures contracts | 65,810 |
| Cash | 9,730,742 |
| Receivables: | |
| Investment securities sold | 3,033,240 |
| Dividends and interest | 810,356 |
| Fund shares sold | 306,757 |
| Variation margin on futures contracts | 6,058 |
| Securities lending | 2,754 |
| Other assets | 61,451 |
| Total assets | 563,461,735 |
| Liabilities |
| Cash collateral received for securities on loan | 10,458,688 |
| Payables: | |
| Investment securities purchased | 3,360,646 |
| Manager (See Note 3) | 289,438 |
| Fund shares redeemed | 255,341 |
| Transfer agent (See Note 3) | 152,865 |
| NYLIFE Distributors (See Note 3) | 108,630 |
| Shareholder communication | 44,944 |
| Custodian | 17,079 |
| Professional fees | 16,590 |
| Accrued expenses | 3,835 |
| Total liabilities | 14,708,056 |
| Net assets | $548,753,679 |
| Composition of Net Assets |
| Shares of beneficial interest outstanding (par value of $.001 per share) unlimited number of shares authorized | $ 15,271 |
| Additional paid-in-capital | 407,369,899 |
| | 407,385,170 |
| Total distributable earnings (loss) | 141,368,509 |
| Net assets | $548,753,679 |
| Class A | |
| Net assets applicable to outstanding shares | $315,841,789 |
| Shares of beneficial interest outstanding | 8,790,228 |
| Net asset value per share outstanding | $ 35.93 |
| Maximum sales charge (3.00% of offering price) | 1.11 |
| Maximum offering price per share outstanding | $ 37.04 |
| Investor Class | |
| Net assets applicable to outstanding shares | $ 49,266,142 |
| Shares of beneficial interest outstanding | 1,370,639 |
| Net asset value per share outstanding | $ 35.94 |
| Maximum sales charge (2.50% of offering price) | 0.92 |
| Maximum offering price per share outstanding | $ 36.86 |
| Class B | |
| Net assets applicable to outstanding shares | $ 10,914,781 |
| Shares of beneficial interest outstanding | 306,200 |
| Net asset value and offering price per share outstanding | $ 35.65 |
| Class C | |
| Net assets applicable to outstanding shares | $ 29,415,929 |
| Shares of beneficial interest outstanding | 825,497 |
| Net asset value and offering price per share outstanding | $ 35.63 |
| Class I | |
| Net assets applicable to outstanding shares | $138,834,110 |
| Shares of beneficial interest outstanding | 3,853,315 |
| Net asset value and offering price per share outstanding | $ 36.03 |
| Class R1 | |
| Net assets applicable to outstanding shares | $ 98,835 |
| Shares of beneficial interest outstanding | 2,747 |
| Net asset value and offering price per share outstanding | $ 35.98 |
| Class R2 | |
| Net assets applicable to outstanding shares | $ 1,981,559 |
| Shares of beneficial interest outstanding | 55,070 |
| Net asset value and offering price per share outstanding | $ 35.98 |
| Class R3 | |
| Net assets applicable to outstanding shares | $ 2,341,362 |
| Shares of beneficial interest outstanding | 65,266 |
| Net asset value and offering price per share outstanding | $ 35.87 |
| Class R6 | |
| Net assets applicable to outstanding shares | $ 59,172 |
| Shares of beneficial interest outstanding | 1,640 |
| Net asset value and offering price per share outstanding | $ 36.08 |
The notes to the financial statements are an integral part of, and should be read in conjunction with, the financial statements.
23
Statement of Operations for the six months ended April 30, 2021 (Unaudited)
| Investment Income (Loss) |
| Income | |
| Dividends-unaffiliated (net of foreign tax withholding of $16,254) | $ 3,702,170 |
| Interest | 1,731,699 |
| Securities lending | 45,241 |
| Dividends-affiliated | 35 |
| Total income | 5,479,145 |
| Expenses | |
| Manager (See Note 3) | 1,831,815 |
| Distribution/Service—Class A (See Note 3) | 356,076 |
| Distribution/Service—Investor Class (See Note 3) | 61,616 |
| Distribution/Service—Class B (See Note 3) | 55,138 |
| Distribution/Service—Class C (See Note 3) | 157,878 |
| Distribution/Service—Class R2 (See Note 3) | 2,334 |
| Distribution/Service—Class R3 (See Note 3) | 5,515 |
| Transfer agent (See Note 3) | 398,337 |
| Registration | 58,515 |
| Professional fees | 45,295 |
| Shareholder communication | 35,635 |
| Custodian | 26,348 |
| Trustees | 5,611 |
| Insurance | 2,641 |
| Shareholder service (See Note 3) | 2,081 |
| Miscellaneous | 13,573 |
| Total expenses before waiver/reimbursement | 3,058,408 |
| Expense waiver/reimbursement from Manager (See Note 3) | (8,391) |
| Net expenses | 3,050,017 |
| Net investment income (loss) | 2,429,128 |
| Realized and Unrealized Gain (Loss) |
| Net realized gain (loss) on: | |
| Unaffiliated investment transactions | 98,168,053 |
| Futures transactions | (145,203) |
| Foreign currency transactions | 10,614 |
| Net realized gain (loss) | 98,033,464 |
| Net change in unrealized appreciation (depreciation) on: | |
| Unaffiliated investments | 8,182,983 |
| Futures contracts | 172,445 |
| Translation of other assets and liabilities in foreign currencies | 228 |
| Net change in unrealized appreciation (depreciation) | 8,355,656 |
| Net realized and unrealized gain (loss) | 106,389,120 |
| Net increase (decrease) in net assets resulting from operations | $108,818,248 |
The notes to the financial statements are an integral part of, and should be read in conjunction with, the financial statements.
Statements of Changes in Net Assets
for the six months ended April 30, 2021 (Unaudited) and the year ended October 31, 2020
| | 2021 | 2020 |
| Increase (Decrease) in Net Assets |
| Operations: | | |
| Net investment income (loss) | $ 2,429,128 | $ 6,188,734 |
| Net realized gain (loss) | 98,033,464 | 6,208,727 |
| Net change in unrealized appreciation (depreciation) | 8,355,656 | (17,630,508) |
| Net increase (decrease) in net assets resulting from operations | 108,818,248 | (5,233,047) |
| Distributions to shareholders: | | |
| Class A | (4,124,590) | (9,628,061) |
| Investor Class | (699,593) | (1,699,180) |
| Class B | (135,897) | (379,813) |
| Class C | (390,180) | (1,139,534) |
| Class I | (2,433,799) | (6,310,208) |
| Class R1 | (1,329) | (32,148) |
| Class R2 | (26,704) | (85,858) |
| Class R3 | (31,824) | (67,625) |
| Class R6 | (877) | (1,844) |
| Total distributions to shareholders | (7,844,793) | (19,344,271) |
| Capital share transactions: | | |
| Net proceeds from sales of shares | 33,492,435 | 54,812,354 |
| Net asset value of shares issued to shareholder in reinvestment of distributions | 7,704,727 | 18,977,236 |
| Cost of shares redeemed | (90,896,729) | (143,847,332) |
| Increase (decrease) in net assets derived from capital share transactions | (49,699,567) | (70,057,742) |
| Net increase (decrease) in net assets | 51,273,888 | (94,635,060) |
| Net Assets |
| Beginning of period | 497,479,791 | 592,114,851 |
| End of period | $548,753,679 | $ 497,479,791 |
The notes to the financial statements are an integral part of, and should be read in conjunction with, the financial statements.
25
Financial Highlights selected per share data and ratios
| | Six months ended
April 30,
2021* | | Year Ended October 31, |
| Class A | 2020 | | 2019 | | 2018 | | 2017 | | 2016 |
| Net asset value at beginning of period | $ 29.72 | | $ 30.98 | | $ 31.49 | | $ 33.63 | | $ 31.27 | | $ 32.13 |
| Net investment income (loss) (a) | 0.15 | | 0.36 | | 0.44 | | 0.44 | | 0.39 | | 0.40 |
| Net realized and unrealized gain (loss) on investments | 6.54 | | (0.54) | | 1.58 | | (0.23) | | 2.80 | | 0.79 |
| Net realized and unrealized gain (loss) on foreign currency transactions | 0.00‡ | | — | | — | | — | | — | | — |
| Total from investment operations | 6.69 | | (0.18) | | 2.02 | | 0.21 | | 3.19 | | 1.19 |
| Less distributions: | | | | | | | | | | | |
| From net investment income | (0.16) | | (0.41) | | (0.46) | | (0.48) | | (0.39) | | (0.40) |
| From net realized gain on investments | (0.32) | | (0.67) | | (2.07) | | (1.87) | | (0.44) | | (1.65) |
| Total distributions | (0.48) | | (1.08) | | (2.53) | | (2.35) | | (0.83) | | (2.05) |
| Net asset value at end of period | $ 35.93 | | $ 29.72 | | $ 30.98 | | $ 31.49 | | $ 33.63 | | $ 31.27 |
| Total investment return (b) | 22.66% | | (0.53)% | | 7.07% | | 0.48% (c) | | 10.32% | | 3.95% |
| Ratios (to average net assets)/Supplemental Data: | | | | | | | | | | | |
| Net investment income (loss) | 0.92%†† | | 1.21% | | 1.47% | | 1.35% | | 1.19% | | 1.30% (d) |
| Net expenses (e) | 1.10%†† | | 1.13% | | 1.12% | | 1.10% | | 1.10% | | 1.11% (f) |
| Portfolio turnover rate | 84% | | 217% | | 194% | | 200% | | 191% | | 271% |
| Net assets at end of period (in 000’s) | $ 315,842 | | $ 252,574 | | $ 279,636 | | $ 265,314 | | $ 281,174 | | $ 240,565 |
| * | Unaudited. |
| ‡ | Less than one cent per share. |
| †† | Annualized. |
| (a) | Per share data based on average shares outstanding during the period. |
| (b) | Total investment return is calculated exclusive of sales charges and assumes the reinvestment of dividends and distributions. For periods of less than one year, total return is not annualized. |
| (c) | Total investment return may reflect adjustments to conform to generally accepted accounting principles. |
| (d) | Without the custody fee reimbursement, net investment income (loss) would have been 1.29%. |
| (e) | In addition to the fees and expenses which the Fund bears directly, it also indirectly bears a pro-rata share of the fees and expenses of the underlying funds in which it invests. Such indirect expenses are not included in the above expense ratios. |
| (f) | Without the custody fee reimbursement, net expenses would have been 1.12%. |
The notes to the financial statements are an integral part of, and should be read in conjunction with, the financial statements.
Financial Highlights selected per share data and ratios
| | Six months ended
April 30,
2021* | | Year Ended October 31, |
| Investor Class | 2020 | | 2019 | | 2018 | | 2017 | | 2016 |
| Net asset value at beginning of period | $ 29.75 | | $ 31.01 | | $ 31.51 | | $ 33.65 | | $ 31.29 | | $ 32.14 |
| Net investment income (loss) (a) | 0.12 | | 0.29 | | 0.38 | | 0.38 | | 0.34 | | 0.35 |
| Net realized and unrealized gain (loss) on investments | 6.53 | | (0.55) | | 1.58 | | (0.23) | | 2.79 | | 0.80 |
| Net realized and unrealized gain (loss) on foreign currency transactions | 0.00‡ | | — | | — | | — | | — | | — |
| Total from investment operations | 6.65 | | (0.26) | | 1.96 | | 0.15 | | 3.13 | | 1.15 |
| Less distributions: | | | | | | | | | | | |
| From net investment income | (0.14) | | (0.33) | | (0.39) | | (0.42) | | (0.33) | | (0.35) |
| From net realized gain on investments | (0.32) | | (0.67) | | (2.07) | | (1.87) | | (0.44) | | (1.65) |
| Total distributions | (0.46) | | (1.00) | | (2.46) | | (2.29) | | (0.77) | | (2.00) |
| Net asset value at end of period | $ 35.94 | | $ 29.75 | | $ 31.01 | | $ 31.51 | | $ 33.65 | | $ 31.29 |
| Total investment return (b) | 22.49% | | (0.75)% | | 6.79% | | 0.29% | | 10.13% | | 3.82% |
| Ratios (to average net assets)/Supplemental Data: | | | | | | | | | | | |
| Net investment income (loss) | 0.75%†† | | 0.97% | | 1.26% | | 1.18% | | 1.05% | | 1.14% (c) |
| Net expenses (d) | 1.37%†† | | 1.38% | | 1.33% | | 1.28% | | 1.26% | | 1.26% (e) |
| Expenses (before waiver/reimbursement) (d) | 1.39%†† | | 1.40% | | 1.35% | | 1.30% | | 1.26% | | 1.26% (e) |
| Portfolio turnover rate | 84% | | 217% | | 194% | | 200% | | 191% | | 271% |
| Net assets at end of period (in 000’s) | $ 49,266 | | $ 47,358 | | $ 53,006 | | $ 51,128 | | $ 55,541 | | $ 81,762 |
| * | Unaudited. |
| ‡ | Less than one cent per share. |
| †† | Annualized. |
| (a) | Per share data based on average shares outstanding during the period. |
| (b) | Total investment return is calculated exclusive of sales charges and assumes the reinvestment of dividends and distributions. For periods of less than one year, total return is not annualized. |
| (c) | Without the custody fee reimbursement, net investment income (loss) would have been 1.13%. |
| (d) | In addition to the fees and expenses which the Fund bears directly, it also indirectly bears a pro-rata share of the fees and expenses of the underlying funds in which it invests. Such indirect expenses are not included in the above expense ratios. |
| (e) | Without the custody fee reimbursement, net expenses would have been 1.27%. |
The notes to the financial statements are an integral part of, and should be read in conjunction with, the financial statements.
27
Financial Highlights selected per share data and ratios
| | Six months ended
April 30,
2021* | | Year Ended October 31, |
| Class B | 2020 | | 2019 | | 2018 | | 2017 | | 2016 |
| Net asset value at beginning of period | $ 29.56 | | $ 30.82 | | $ 31.35 | | $ 33.48 | | $ 31.15 | | $ 32.01 |
| Net investment income (loss) (a) | (0.00)‡ | | 0.07 | | 0.16 | | 0.14 | | 0.09 | | 0.12 |
| Net realized and unrealized gain (loss) on investments | 6.49 | | (0.54) | | 1.54 | | (0.23) | | 2.78 | | 0.79 |
| Net realized and unrealized gain (loss) on foreign currency transactions | 0.00‡ | | — | | — | | — | | — | | — |
| Total from investment operations | 6.49 | | (0.47) | | 1.70 | | (0.09) | | 2.87 | | 0.91 |
| Less distributions: | | | | | | | | | | | |
| From net investment income | (0.08) | | (0.12) | | (0.16) | | (0.17) | | (0.10) | | (0.12) |
| From net realized gain on investments | (0.32) | | (0.67) | | (2.07) | | (1.87) | | (0.44) | | (1.65) |
| Total distributions | (0.40) | | (0.79) | | (2.23) | | (2.04) | | (0.54) | | (1.77) |
| Net asset value at end of period | $ 35.65 | | $ 29.56 | | $ 30.82 | | $ 31.35 | | $ 33.48 | | $ 31.15 |
| Total investment return (b) | 22.07% | | (1.51)% | | 6.00% | | (0.45)% (c) | | 9.31% | | 3.03% |
| Ratios (to average net assets)/Supplemental Data: | | | | | | | | | | | |
| Net investment income (loss) | (0.00)%†† | | 0.23% | | 0.54% | | 0.43% | | 0.29% | | 0.40% (d) |
| Net expenses (e) | 2.12%†† | | 2.13% | | 2.08% | | 2.03% | | 2.02% | | 2.01% (f) |
| Expenses (before waiver/reimbursement) (e) | 2.14%†† | | 2.15% | | 2.10% | | 2.05% | | 2.02% | | 2.01% (f) |
| Portfolio turnover rate | 84% | | 217% | | 194% | | 200% | | 191% | | 271% |
| Net assets at end of period (in 000’s) | $ 10,915 | | $ 10,671 | | $ 15,049 | | $ 18,795 | | $ 24,551 | | $ 27,999 |
| * | Unaudited. |
| ‡ | Less than one cent per share. |
| †† | Annualized. |
| (a) | Per share data based on average shares outstanding during the period. |
| (b) | Total investment return is calculated exclusive of sales charges and assumes the reinvestment of dividends and distributions. For periods of less than one year, total return is not annualized. |
| (c) | Total investment return may reflect adjustments to conform to generally accepted accounting principles. |
| (d) | Without the custody fee reimbursement, net investment income (loss) would have been 0.39%. |
| (e) | In addition to the fees and expenses which the Fund bears directly, it also indirectly bears a pro-rata share of the fees and expenses of the underlying funds in which it invests. Such indirect expenses are not included in the above expense ratios. |
| (f) | Without the custody fee reimbursement, net expenses would have been 2.02%. |
The notes to the financial statements are an integral part of, and should be read in conjunction with, the financial statements.
Financial Highlights selected per share data and ratios
| | Six months ended
April 30,
2021* | | Year Ended October 31, |
| Class C | 2020 | | 2019 | | 2018 | | 2017 | | 2016 |
| Net asset value at beginning of period | $ 29.55 | | $ 30.81 | | $ 31.33 | | $ 33.46 | | $ 31.13 | | $ 32.00 |
| Net investment income (loss) (a) | (0.01) | | 0.07 | | 0.18 | | 0.14 | | 0.09 | | 0.12 |
| Net realized and unrealized gain (loss) on investments | 6.49 | | (0.54) | | 1.53 | | (0.23) | | 2.78 | | 0.78 |
| Net realized and unrealized gain (loss) on foreign currency transactions | 0.00‡ | | — | | — | | — | | — | | — |
| Total from investment operations | 6.48 | | (0.47) | | 1.71 | | (0.09) | | 2.87 | | 0.90 |
| Less distributions: | | | | | | | | | | | |
| From net investment income | (0.08) | | (0.12) | | (0.16) | | (0.17) | | (0.10) | | (0.12) |
| From net realized gain on investments | (0.32) | | (0.67) | | (2.07) | | (1.87) | | (0.44) | | (1.65) |
| Total distributions | (0.40) | | (0.79) | | (2.23) | | (2.04) | | (0.54) | | (1.77) |
| Net asset value at end of period | $ 35.63 | | $ 29.55 | | $ 30.81 | | $ 31.33 | | $ 33.46 | | $ 31.13 |
| Total investment return (b) | 22.05% | | (1.51)% | | 6.03% | | (0.45)% (c) | | 9.32% | | 3.00% |
| Ratios (to average net assets)/Supplemental Data: | | | | | | | | | | | |
| Net investment income (loss) | (0.05)%†† | | 0.23% | | 0.59% | | 0.43% | | 0.29% | | 0.40% (d) |
| Net expenses (e) | 2.12%†† | | 2.13% | | 2.08% | | 2.03% | | 2.02% | | 2.01% (f) |
| Expenses (before waiver/reimbursement) (e) | 2.14%†† | | 2.15% | | 2.10% | | 2.05% | | 2.02% | | 2.01% (f) |
| Portfolio turnover rate | 84% | | 217% | | 194% | | 200% | | 191% | | 271% |
| Net assets at end of period (in 000’s) | $ 29,416 | | $ 30,769 | | $ 45,437 | | $ 76,233 | | $ 94,447 | | $ 102,410 |
| * | Unaudited. |
| ‡ | Less than one cent per share. |
| †† | Annualized. |
| (a) | Per share data based on average shares outstanding during the period. |
| (b) | Total investment return is calculated exclusive of sales charges and assumes the reinvestment of dividends and distributions. For periods of less than one year, total return is not annualized. |
| (c) | Total investment return may reflect adjustments to conform to generally accepted accounting principles. |
| (d) | Without the custody fee reimbursement, net investment income (loss) would have been 0.39%. |
| (e) | In addition to the fees and expenses which the Fund bears directly, it also indirectly bears a pro-rata share of the fees and expenses of the underlying funds in which it invests. Such indirect expenses are not included in the above expense ratios. |
| (f) | Without the custody fee reimbursement, net expenses would have been 2.02%. |
The notes to the financial statements are an integral part of, and should be read in conjunction with, the financial statements.
29
Financial Highlights selected per share data and ratios
| | Six months ended
April 30,
2021* | | Year Ended October 31, |
| Class I | 2020 | | 2019 | | 2018 | | 2017 | | 2016 |
| Net asset value at beginning of period | $ 29.80 | | $ 31.06 | | $ 31.56 | | $ 33.71 | | $ 31.35 | | $ 32.20 |
| Net investment income (loss) (a) | 0.20 | | 0.44 | | 0.53 | | 0.52 | | 0.47 | | 0.48 |
| Net realized and unrealized gain (loss) on investments | 6.55 | | (0.55) | | 1.57 | | (0.24) | | 2.80 | | 0.79 |
| Net realized and unrealized gain (loss) on foreign currency transactions | 0.00‡ | | — | | — | | — | | — | | — |
| Total from investment operations | 6.75 | | (0.11) | | 2.10 | | 0.28 | | 3.27 | | 1.27 |
| Less distributions: | | | | | | | | | | | |
| From net investment income | (0.20) | | (0.48) | | (0.53) | | (0.56) | | (0.47) | | (0.47) |
| From net realized gain on investments | (0.32) | | (0.67) | | (2.07) | | (1.87) | | (0.44) | | (1.65) |
| Total distributions | (0.52) | | (1.15) | | (2.60) | | (2.43) | | (0.91) | | (2.12) |
| Net asset value at end of period | $ 36.03 | | $ 29.80 | | $ 31.06 | | $ 31.56 | | $ 33.71 | | $ 31.35 |
| Total investment return (b) | 22.82% | | (0.27)% | | 7.32% | | 0.70% | | 10.57% | | 4.23% |
| Ratios (to average net assets)/Supplemental Data: | | | | | | | | | | | |
| Net investment income (loss) | 1.20%†† | | 1.47% | | 1.75% | | 1.61% | | 1.45% | | 1.55% (c) |
| Net expenses (d) | 0.86%†† | | 0.88% | | 0.87% | | 0.85% | | 0.85% | | 0.86% (e) |
| Portfolio turnover rate | 84% | | 217% | | 194% | | 200% | | 191% | | 271% |
| Net assets at end of period (in 000’s) | $ 138,834 | | $ 152,036 | | $ 177,076 | | $ 217,380 | | $ 291,941 | | $ 296,970 |
| * | Unaudited. |
| ‡ | Less than one cent per share. |
| †† | Annualized. |
| (a) | Per share data based on average shares outstanding during the period. |
| (b) | Total investment return is calculated exclusive of sales charges and assumes the reinvestment of dividends and distributions. Class I shares are not subject to sales charges. For periods of less than one year, total return is not annualized. |
| (c) | Without the custody fee reimbursement, net investment income (loss) would have been 1.54%. |
| (d) | In addition to the fees and expenses which the Fund bears directly, it also indirectly bears a pro-rata share of the fees and expenses of the underlying funds in which it invests. Such indirect expenses are not included in the above expense ratios. |
| (e) | Without the custody fee reimbursement, net expenses would have been 0.87%. |
The notes to the financial statements are an integral part of, and should be read in conjunction with, the financial statements.
Financial Highlights selected per share data and ratios
| | Six months ended
April 30,
2021* | | Year Ended October 31, |
| Class R1 | 2020 | | 2019 | | 2018 | | 2017 | | 2016 |
| Net asset value at beginning of period | $ 29.76 | | $ 31.02 | | $ 31.52 | | $ 33.66 | | $ 31.30 | | $ 32.16 |
| Net investment income (loss) (a) | 0.18 | | 0.49 | | 0.50 | | 0.49 | | 0.44 | | 0.44 |
| Net realized and unrealized gain (loss) on investments | 6.54 | | (0.63) | | 1.57 | | (0.24) | | 2.79 | | 0.79 |
| Net realized and unrealized gain (loss) on foreign currency transactions | 0.00‡ | | — | | — | | — | | — | | — |
| Total from investment operations | 6.72 | | (0.14) | | 2.07 | | 0.25 | | 3.23 | | 1.23 |
| Less distributions: | | | | | | | | | | | |
| From net investment income | (0.18) | | (0.45) | | (0.50) | | (0.52) | | (0.43) | | (0.44) |
| From net realized gain on investments | (0.32) | | (0.67) | | (2.07) | | (1.87) | | (0.44) | | (1.65) |
| Total distributions | (0.50) | | (1.12) | | (2.57) | | (2.39) | | (0.87) | | (2.09) |
| Net asset value at end of period | $ 35.98 | | $ 29.76 | | $ 31.02 | | $ 31.52 | | $ 33.66 | | $ 31.30 |
| Total investment return (b) | 22.73% | | (0.38)% | | 7.22% | | 0.62% | | 10.47% | | 4.10% |
| Ratios (to average net assets)/Supplemental Data: | | | | | | | | | | | |
| Net investment income (loss) | 1.11%†† | | 1.60% | | 1.67% | | 1.50% | | 1.35% | | 1.44% (c) |
| Net expenses (d) | 0.95%†† | | 0.98% | | 0.97% | | 0.95% | | 0.95% | | 0.96% (e) |
| Portfolio turnover rate | 84% | | 217% | | 194% | | 200% | | 191% | | 271% |
| Net assets at end of period (in 000’s) | $ 99 | | $ 78 | | $ 1,286 | | $ 1,805 | | $ 2,016 | | $ 2,130 |
| * | Unaudited. |
| ‡ | Less than one cent per share. |
| †† | Annualized. |
| (a) | Per share data based on average shares outstanding during the period. |
| (b) | Total investment return is calculated exclusive of sales charges and assumes the reinvestment of dividends and distributions. Class R1 shares are not subject to sales charges. For periods of less than one year, total return is not annualized. |
| (c) | Without the custody fee reimbursement, net investment income (loss) would have been 1.43%. |
| (d) | In addition to the fees and expenses which the Fund bears directly, it also indirectly bears a pro-rata share of the fees and expenses of the underlying funds in which it invests. Such indirect expenses are not included in the above expense ratios. |
| (e) | Without the custody fee reimbursement, net expenses would have been 0.97%. |
The notes to the financial statements are an integral part of, and should be read in conjunction with, the financial statements.
31
Financial Highlights selected per share data and ratios
| | Six months ended
April 30,
2021* | | Year Ended October 31, |
| Class R2 | 2020 | | 2019 | | 2018 | | 2017 | | 2016 |
| Net asset value at beginning of period | $ 29.77 | | $ 31.02 | | $ 31.53 | | $ 33.67 | | $ 31.26 | | $ 32.12 |
| Net investment income (loss) (a) | 0.15 | | 0.34 | | 0.42 | | 0.41 | | 0.39 | | 0.37 |
| Net realized and unrealized gain (loss) on investments | 6.54 | | (0.55) | | 1.56 | | (0.24) | | 2.81 | | 0.78 |
| Net realized and unrealized gain (loss) on foreign currency transactions | 0.00‡ | | — | | — | | — | | — | | — |
| Total from investment operations | 6.69 | | (0.21) | | 1.98 | | 0.17 | | 3.20 | | 1.15 |
| Less distributions: | | | | | | | | | | | |
| From net investment income | (0.16) | | (0.37) | | (0.42) | | (0.44) | | (0.35) | | (0.36) |
| From net realized gain on investments | (0.32) | | (0.67) | | (2.07) | | (1.87) | | (0.44) | | (1.65) |
| Total distributions | (0.48) | | (1.04) | | (2.49) | | (2.31) | | (0.79) | | (2.01) |
| Net asset value at end of period | $ 35.98 | | $ 29.77 | | $ 31.02 | | $ 31.53 | | $ 33.67 | | $ 31.26 |
| Total investment return (b) | 22.59% | | (0.60)% | | 6.95% | | 0.37% (c) | | 10.37% | | 3.85% |
| Ratios (to average net assets)/Supplemental Data: | | | | | | | | | | | |
| Net investment income (loss) | 0.89%†† | | 1.14% | | 1.40% | | 1.26% | | 1.19% | | 1.21% (d) |
| Net expenses (e) | 1.20%†† | | 1.23% | | 1.22% | | 1.20% | | 1.21% | | 1.21% (f) |
| Portfolio turnover rate | 84% | | 217% | | 194% | | 200% | | 191% | | 271% |
| Net assets at end of period (in 000’s) | $ 1,982 | | $ 1,693 | | $ 2,882 | | $ 3,496 | | $ 5,234 | | $ 38,233 |
| * | Unaudited. |
| ‡ | Less than one cent per share. |
| †† | Annualized. |
| (a) | Per share data based on average shares outstanding during the period. |
| (b) | Total investment return is calculated exclusive of sales charges and assumes the reinvestment of dividends and distributions. Class R2 shares are not subject to sales charges. For periods of less than one year, total return is not annualized. |
| (c) | Total investment return may reflect adjustments to conform to generally accepted accounting principles. |
| (d) | Without the custody fee reimbursement, net investment income (loss) would have been 1.20%. |
| (e) | In addition to the fees and expenses which the Fund bears directly, it also indirectly bears a pro-rata share of the fees and expenses of the underlying funds in which it invests. Such indirect expenses are not included in the above expense ratios. |
| (f) | Without the custody fee reimbursement, net expenses would have been 1.22%. |
The notes to the financial statements are an integral part of, and should be read in conjunction with, the financial statements.
Financial Highlights selected per share data and ratios
| | Six months ended
April 30,
2021* | | Year Ended October 31, |
| Class R3 | 2020 | | 2019 | | 2018 | | 2017 | | 2016 |
| Net asset value at beginning of period | $ 29.70 | | $ 30.95 | | $ 31.45 | | $ 33.59 | | $ 31.25 | | $ 32.10 |
| Net investment income (loss) (a) | 0.10 | | 0.26 | | 0.35 | | 0.33 | | 0.27 | | 0.29 |
| Net realized and unrealized gain (loss) on investments | 6.53 | | (0.55) | | 1.56 | | (0.24) | | 2.78 | | 0.80 |
| Net realized and unrealized gain (loss) on foreign currency transactions | 0.00‡ | | — | | — | | — | | — | | — |
| Total from investment operations | 6.63 | | (0.29) | | 1.91 | | 0.09 | | 3.05 | | 1.09 |
| Less distributions: | | | | | | | | | | | |
| From net investment income | (0.14) | | (0.29) | | (0.34) | | (0.36) | | (0.27) | | (0.29) |
| From net realized gain on investments | (0.32) | | (0.67) | | (2.07) | | (1.87) | | (0.44) | | (1.65) |
| Total distributions | (0.46) | | (0.96) | | (2.41) | | (2.23) | | (0.71) | | (1.94) |
| Net asset value at end of period | $ 35.87 | | $ 29.70 | | $ 30.95 | | $ 31.45 | | $ 33.59 | | $ 31.25 |
| Total investment return (b) | 22.44% | | (0.88)% | | 6.68% | | 0.12% | | 9.88% | | 3.63% |
| Ratios (to average net assets)/Supplemental Data: | | | | | | | | | | | |
| Net investment income (loss) | 0.61%†† | | 0.86% | | 1.15% | | 1.00% | | 0.82% | | 0.94% (c) |
| Net expenses (d) | 1.46%†† | | 1.48% | | 1.47% | | 1.45% | | 1.45% | | 1.46% (e) |
| Portfolio turnover rate | 84% | | 217% | | 194% | | 200% | | 191% | | 271% |
| Net assets at end of period (in 000’s) | $ 2,341 | | $ 2,252 | | $ 3,048 | | $ 3,880 | | $ 5,490 | | $ 3,548 |
| * | Unaudited. |
| ‡ | Less than one cent per share. |
| †† | Annualized. |
| (a) | Per share data based on average shares outstanding during the period. |
| (b) | Total investment return is calculated exclusive of sales charges and assumes the reinvestment of dividends and distributions. Class R3 shares are not subject to sales charges. For periods of less than one year, total return is not annualized. |
| (c) | Without the custody fee reimbursement, net investment income (loss) would have been 0.93%. |
| (d) | In addition to the fees and expenses which the Fund bears directly, it also indirectly bears a pro-rata share of the fees and expenses of the underlying funds in which it invests. Such indirect expenses are not included in the above expense ratios. |
| (e) | Without the custody fee reimbursement, net expenses would have been 1.47%. |
The notes to the financial statements are an integral part of, and should be read in conjunction with, the financial statements.
33
Financial Highlights selected per share data and ratios
| | Six months ended
April 30,
2021* | | Year Ended October 31, | | December 15, 2017^ through
October 31,
2018 |
| Class R6 | 2020 | | 2019 | |
| Net asset value at beginning of period | $ 29.83 | | $ 31.06 | | $ 31.57 | | $ 32.52 |
| Net investment income (loss) (a) | 0.21 | | 0.61 | | 0.53 | | 0.48 |
| Net realized and unrealized gain (loss) on investments | 6.58 | | (0.69) | | 1.59 | | (0.95) |
| Net realized and unrealized gain (loss) on foreign currency transactions | 0.00‡ | | — | | — | | — |
| Total from investment operations | 6.79 | | (0.08) | | 2.12 | | (0.47) |
| Less distributions: | | | | | | | |
| From net investment income | (0.22) | | (0.48) | | (0.56) | | (0.48) |
| From net realized gain on investments | (0.32) | | (0.67) | | (2.07) | | — |
| Total distributions | (0.54) | | (1.15) | | (2.63) | | (0.48) |
| Net asset value at end of period | $ 36.08 | | $ 29.83 | | $ 31.06 | | $ 31.57 |
| Total investment return (b) | 22.88% | | (0.17)% | | 7.40% | | (1.48)% |
| Ratios (to average net assets)/Supplemental Data: | | | | | | | |
| Net investment income (loss) | 1.29%†† | | 1.94% | | 1.75% | | 1.65%†† |
| Net expenses (c) | 0.76%†† | | 0.78% | | 0.77% | | 0.76%†† |
| Portfolio turnover rate | 84% | | 217% | | 194% | | 200% |
| Net assets at end of period (in 000’s) | $ 59 | | $ 49 | | $ 14,697 | | $ 48 |
| * | Unaudited. |
| ^ | Inception date. |
| ‡ | Less than one cent per share. |
| †† | Annualized. |
| (a) | Per share data based on average shares outstanding during the period. |
| (b) | Total investment return is calculated exclusive of sales charges and assumes the reinvestment of dividends and distributions. Class R6 shares are not subject to sales charges. For periods of less than one year, total return is not annualized. |
| (c) | In addition to the fees and expenses which the Fund bears directly, it also indirectly bears a pro-rata share of the fees and expenses of the underlying funds in which it invests. Such indirect expenses are not included in the above expense ratios. |
The notes to the financial statements are an integral part of, and should be read in conjunction with, the financial statements.
Notes to Financial Statements (Unaudited)
Note 1-Organization and Business
MainStay Funds Trust (the “Trust”) was organized as a Delaware statutory trust on April 28, 2009. The Trust is registered under the Investment Company Act of 1940, as amended (the “1940 Act”), as an open-end management investment company, and is comprised of thirty-two funds (collectively referred to as the “Funds”). These financial statements and notes relate to the MainStay Balanced Fund (the "Fund"), a “diversified” fund, as that term is defined in the 1940 Act, as interpreted or modified by regulatory authorities having jurisdiction, from time to time.
The following table lists the Fund's share classes that have been registered and commenced operations:
| Class | Commenced Operations |
| Class A | January 2, 2004 |
| Investor Class | February 28, 2008 |
| Class B | January 2, 2004 |
| Class C | December 30, 2002 |
| Class I | May 1, 1989 |
| Class R1 | January 2, 2004 |
| Class R2 | January 2, 2004 |
| Class R3 | April 28, 2006 |
| Class R6 | December 15, 2017 |
| SIMPLE Class | N/A* |
| • | SIMPLE Class shares were registered for sale effective as of August 31, 2020 but have not yet commenced operations. |
Class B shares of the MainStay Group of Funds are closed to all new purchases as well as additional investments by existing Class B shareholders. Existing Class B shareholders may continue to reinvest dividends and capital gains distributions, as well as exchange their Class B shares for Class B shares of other funds in the MainStay Group of Funds as permitted by the current exchange privileges. Class B shareholders continue to be subject to any applicable contingent deferred sales charge ("CDSC") at the time of redemption. All other features of the Class B shares, including but not limited to the fees and expenses applicable to Class B shares, remain unchanged. Unless redeemed, Class B shareholders will remain in Class B shares of their respective fund until the Class B shares are converted to Class A or Investor Class shares pursuant to the applicable conversion schedule.
Class A and Investor Class shares are offered at net asset value (“NAV”) per share plus an initial sales charge. No initial sales charge applies to investments of $250,000 or more (and certain other qualified purchases) in Class A and Investor Class shares. However, a CDSC of 1.00% may be imposed on certain redemptions made within 18 months of the date of purchase on shares that were purchased without an initial sales charge. Class C shares are offered at NAV without an initial sales charge, although a 1.00% CDSC may be imposed on certain redemptions of such shares made within one year of the date of purchase of Class C shares. When Class B shares were offered, they were offered at NAV without an initial sales charge, although a CDSC that declines depending on the number of years a shareholder held its Class B shares may be imposed
on certain redemptions of such shares made within six years of the date of purchase of such shares. Class I, Class R1, Class R2, Class R3 and Class R6 shares are offered at NAV without a sales charge. SIMPLE Class shares are currently expected to be offered at NAV without a sales charge. Depending upon eligibility, Class B shares convert to either Class A or Investor Class shares at the end of the calendar quarter eight years after the date they were purchased. In addition, depending upon eligibility, Class C shares convert to either Class A or Investor Class shares at the end of the calendar quarter ten years after the date they were purchased. Additionally, Investor Class shares may convert automatically to Class A shares. Under certain circumstances and as may be permitted by the Trust’s multiple class plan pursuant to Rule 18f-3 under the 1940 Act, specified share classes of the Fund may be converted to one or more other share classes of the Fund as disclosed in the capital share transactions within these Notes. The classes of shares have the same voting (except for issues that relate solely to one class), dividend, liquidation and other rights, and the same terms and conditions, except that under distribution plans pursuant to Rule 12b-1 under the 1940 Act, Class B and Class C shares are subject to higher distribution and/or service fees than Class A, Investor Class, Class R2, Class R3 and SIMPLE Class shares. Class I, Class R1 and Class R6 shares are not subject to a distribution and/or service fees. Class R1, Class R2 and Class R3 shares are subject to a shareholder service fee, which is in addition to any fees paid under the distribution plans for Class R2 and Class R3 shares.
The Fund's investment objective is to seek total return.
Note 2–Significant Accounting Policies
The Fund is an investment company and accordingly follows the investment company accounting and reporting guidance of the Financial Accounting Standards Board (“FASB”) Accounting Standard Codification Topic 946 Financial Services—Investment Companies. The Fund prepares its financial statements in accordance with generally accepted accounting principles (“GAAP”) in the United States of America and follows the significant accounting policies described below.
(A) Securities Valuation. Investments are usually valued as of the close of regular trading on the New York Stock Exchange (the "Exchange") (usually 4:00 p.m. Eastern time) on each day the Fund is open for business ("valuation date").
The Board of Trustees of the Trust (the "Board") adopted procedures establishing methodologies for the valuation of the Fund's securities and other assets and delegated the responsibility for valuation determinations under those procedures to the Valuation Committee of the Trust (the “Valuation Committee”). The procedures state that, subject to the oversight of the Board and unless otherwise noted, the responsibility for the day-to-day valuation of portfolio assets (including fair value measurements for the Fund's assets and liabilities) rests with New York Life Investment Management LLC (“New York Life Investments” or the "Manager"), aided to whatever extent necessary by the Subadvisors (as defined in Note 3(A)). To assess the appropriateness of security
Notes to Financial Statements (Unaudited) (continued)
valuations, the Manager, the Subadvisors or the Fund's third-party service provider, who is subject to oversight by the Manager, regularly compares prior day prices, prices on comparable securities and the sale prices to the prior and current day prices and challenges prices with changes exceeding certain tolerance levels with third-party pricing services or broker sources.
The Board authorized the Valuation Committee to appoint a Valuation Subcommittee (the “Subcommittee”) to establish the prices of securities for which market quotations are not readily available or the prices of which are not otherwise readily determinable under the procedures. The Subcommittee meets (in person, via electronic mail or via teleconference) on an as-needed basis. The Valuation Committee meets to ensure that actions taken by the Subcommittee were appropriate.
For those securities valued through either a standardized fair valuation methodology or a fair valuation measurement, the Subcommittee deals with such valuation and the Valuation Committee reviews and affirms, if appropriate, the reasonableness of the valuation based on such methodologies and measurements on a regular basis after considering information that is reasonably available and deemed relevant by the Valuation Committee. Any action taken by the Subcommittee with respect to the valuation of a portfolio security or other asset is submitted for review and ratification (if appropriate) to the Valuation Committee and the Board at the next regularly scheduled meeting.
"Fair value" is defined as the price the Fund would reasonably expect to receive upon selling an asset or liability in an orderly transaction to an independent buyer in the principal or most advantageous market for the asset or liability. Fair value measurements are determined within a framework that establishes a three-tier hierarchy that maximizes the use of observable market data and minimizes the use of unobservable inputs to establish a classification of fair value measurements for disclosure purposes. "Inputs" refer broadly to the assumptions that market participants would use in pricing the asset or liability, including assumptions about risk, such as the risk inherent in a particular valuation technique used to measure fair value using a pricing model and/or the risk inherent in the inputs for the valuation technique. Inputs may be observable or unobservable. Observable inputs reflect the assumptions market participants would use in pricing the asset or liability based on market data obtained from sources independent of the Fund. Unobservable inputs reflect the Fund’s own assumptions about the assumptions market participants would use in pricing the asset or liability based on the information available. The inputs or methodology used for valuing assets or liabilities may not be an indication of the risks associated with investing in those assets or liabilities. The three-tier hierarchy of inputs is summarized below.
| • | Level 1—quoted prices in active markets for an identical asset or liability |
| • | Level 2—other significant observable inputs (including quoted prices for a similar asset or liability in active markets, interest rates and yield curves, prepayment speeds, credit risk, etc.) |
| • | Level 3—significant unobservable inputs (including the Fund's own assumptions about the assumptions that market participants would use in measuring fair value of an asset or liability) |
The level of an asset or liability within the fair value hierarchy is based on the lowest level of an input, both individually and in the aggregate, that is significant to the fair value measurement. The aggregate value by input level of the Fund’s assets and liabilities as of April 30, 2021, is included at the end of the Portfolio of Investments.
The Fund may use third-party vendor evaluations, whose prices may be derived from one or more of the following standard inputs, among others:
| • Benchmark yields | • Reported trades |
| • Broker/dealer quotes | • Issuer spreads |
| • Two-sided markets | • Benchmark securities |
| • Bids/offers | • Reference data (corporate actions or material event notices) |
| • Industry and economic events | • Comparable bonds |
| • Monthly payment information | |
An asset or liability for which market values cannot be measured using the methodologies described above is valued by methods deemed reasonable in good faith by the Valuation Committee, following the procedures established by the Board, to represent fair value. Under these procedures, the Fund generally uses a market-based approach which may use related or comparable assets or liabilities, recent transactions, market multiples, book values and other relevant information. The Fund may also use an income-based valuation approach in which the anticipated future cash flows of the asset or liability are discounted to calculate fair value. Discounts may also be applied due to the nature and/or duration of any restrictions on the disposition of the asset or liability. Fair value represents a good faith approximation of the value of a security. Fair value determinations involve the consideration of a number of subjective factors, an analysis of applicable facts and circumstances and the exercise of judgment. As a result, it is possible that the fair value for a security determined in good faith in accordance with the Fund's valuation procedures may differ from valuations for the same security determined by other funds using their own valuation procedures. Although the Fund's valuation procedures are designed to value a security at the price the Fund may reasonably expect to receive upon the security's sale in an orderly transaction, there can be no assurance that any fair value determination thereunder would, in fact, approximate the amount that the Fund would actually realize upon the sale of the security or the price at which the security would trade if a reliable market price were readily available. During the six-month period ended April 30, 2021, there were no material changes to the fair value methodologies.
Securities which may be valued in this manner include, but are not limited to: (i) a security for which trading has been halted or suspended; (ii) a debt security that has recently gone into default and for which there is not a current market quotation; (iii) a security of an issuer that has entered into a restructuring; (iv) a security that has been delisted from a national exchange; (v) a security for which the market price is not readily available
from a third-party pricing source or, if so provided, does not, in the opinion of the Manager or the Subadvisors, reflect the security's market value; (vi) a security subject to trading collars for which no or limited trading takes place; and (vii) a security whose principal market has been temporarily closed at a time when, under normal conditions, it would be open. Securities valued in this manner are generally categorized as Level 3 in the hierarchy. No securities held by the Fund as of April 30, 2021 were fair valued in such a manner.
Certain securities held by the Fund may principally trade in foreign markets. Events may occur between the time the foreign markets close and the time at which the Fund's NAVs are calculated. These events may include, but are not limited to, situations relating to a single issuer in a market sector, significant fluctuations in U.S. or foreign markets, natural disasters, armed conflicts, governmental actions or other developments not tied directly to the securities markets. Should the Manager or the Subadvisors conclude that such events may have affected the accuracy of the last price of such securities reported on the local foreign market, the Subcommittee may, pursuant to procedures adopted by the Board, adjust the value of the local price to reflect the estimated impact on the price of such securities as a result of such events. In this instance, securities are generally categorized as Level 3 in the hierarchy. Additionally, certain foreign equity securities are also fair valued whenever the movement of a particular index exceeds certain thresholds. In such cases, the securities are fair valued by applying factors provided by a third-party vendor in accordance with valuation procedures adopted by the Board and are generally categorized as Level 2 in the hierarchy. No foreign equity securities held by the Fund as of April 30, 2021 were fair valued in such a manner.
Equity securities are valued at the last quoted sales prices as of the close of regular trading on the relevant exchange on each valuation date. Securities that are not traded on the valuation date are valued at the mean of the last quoted bid and ask prices. Prices are normally taken from the principal market in which each security trades. These securities are generally categorized as Level 1 in the hierarchy.
Exchange-traded funds (“ETFs”) are valued at the last quoted sales prices as of the close of regular trading on the relevant exchange on each valuation date. Securities that are not traded on the valuation date are valued at the mean of the last quoted bid and ask prices. Prices are normally taken from the principal market in which each security trades. These securities are generally categorized as Level 1 in the hierarchy.
Investments in mutual funds, including money market funds, are valued at their respective NAVs at the close of business each day on the valuation date. These securities are generally categorized as Level 1 in the hierarchy.
Futures contracts are valued at the last posted settlement price on the market where such futures are primarily traded. These securities are generally categorized as Level 1 in the hierarchy.
Debt securities (other than convertible and municipal bonds) are valued at the evaluated bid prices (evaluated mean prices in the case of convertible
and municipal bonds) supplied by a pricing agent or broker selected by the Manager, in consultation with the Subadvisors. The evaluations are market-based measurements processed through a pricing application and represents the pricing agent’s good faith determination as to what a holder may receive in an orderly transaction under market conditions. The rules based logic utilizes valuation techniques that reflect participants’ assumptions and vary by asset class and per methodology, maximizing the use of relevant observable data including quoted prices for similar assets, benchmark yield curves and market corroborated inputs. The evaluated bid or mean prices are deemed by the Manager, in consultation with the Subadvisors, to be representative of market values at the regular close of trading of the Exchange on each valuation date. Debt securities purchased on a delayed delivery basis are marked to market daily until settlement at the forward settlement date. Debt securities, including corporate bonds, U.S. government and federal agency bonds, municipal bonds, foreign bonds, convertible bonds, asset-backed securities and mortgage-backed securities are generally categorized as Level 2 in the hierarchy.
Temporary cash investments acquired in excess of 60 days to maturity at the time of purchase are valued using the latest bid prices or using valuations based on a matrix system (which considers such factors as security prices, yields, maturities and ratings), both as furnished by independent pricing services. Temporary cash investments that mature in 60 days or less at the time of purchase ("Short-Term Investments") are valued using the amortized cost method of valuation, unless the use of such method would be inappropriate. The amortized cost method involves valuing a security at its cost on the date of purchase and thereafter assuming a constant amortization to maturity of the difference between such cost and the value on maturity date. Amortized cost approximates the current fair value of a security. Securities valued using the amortized cost method are not valued using quoted prices in an active market and are generally categorized as Level 2 in the hierarchy.
The information above is not intended to reflect an exhaustive list of the methodologies that may be used to value portfolio investments. The valuation procedures permit the use of a variety of valuation methodologies in connection with valuing portfolio investments. The methodology used for a specific type of investment may vary based on the market data available or other considerations. The methodologies summarized above may not represent the specific means by which portfolio investments are valued on any particular business day.
(B) Income Taxes. The Fund's policy is to comply with the requirements of the Internal Revenue Code of 1986, as amended (the “Internal Revenue Code”), applicable to regulated investment companies and to distribute all of its taxable income to the shareholders of the Fund within the allowable time limits.
The Manager evaluates the Fund’s tax positions to determine if the tax positions taken meet the minimum recognition threshold in connection with accounting for uncertainties in income tax positions taken or expected to be taken for the purposes of measuring and recognizing tax liabilities in the financial statements. Recognition of tax benefits of an
Notes to Financial Statements (Unaudited) (continued)
uncertain tax position is permitted only to the extent the position is “more likely than not” to be sustained assuming examination by taxing authorities. The Manager analyzed the Fund's tax positions taken on federal, state and local income tax returns for all open tax years (for up to three tax years) and has concluded that no provisions for federal, state and local income tax are required in the Fund's financial statements. The Fund's federal, state and local income tax and federal excise tax returns for tax years for which the applicable statutes of limitations have not expired are subject to examination by the Internal Revenue Service and state and local departments of revenue.
(C) Foreign Taxes. The Fund may be subject to foreign taxes on income and other transaction-based taxes imposed by certain countries in which it invests. A portion of the taxes on gains on investments or currency purchases/repatriation may be reclaimable. The Fund will accrue such taxes and reclaims as applicable, based upon its current interpretation of tax rules and regulations that exist in the markets in which it invests.
The Fund may be subject to taxation on realized capital gains, repatriation proceeds and other transaction-based taxes imposed by certain countries in which it invests. The Fund will accrue such taxes as applicable based upon its current interpretation of tax rules and regulations that exist in the market in which it invests. Capital gains taxes relating to positions still held are reflected as a liability in the Statement of Assets and Liabilities, as well as an adjustment to the Fund's net unrealized appreciation (depreciation). Taxes related to capital gains realized, if any, are reflected as part of net realized gain (loss) in the Statement of Operations. Changes in tax liabilities related to capital gains taxes on unrealized investment gains, if any, are reflected as part of the change in net unrealized appreciation (depreciation) on investments in the Statement of Operations. Transaction-based charges are generally assessed as a percentage of the transaction amount.
(D) Dividends and Distributions to Shareholders. Dividends and distributions are recorded on the ex-dividend date. The Fund intends to declare and pay dividends from net investment income, if any, at least quarterly and distributions from net realized capital and currency gains, if any, at least annually. Unless a shareholder elects otherwise, all dividends and distributions are reinvested at NAV in the same class of shares of the Fund. Dividends and distributions to shareholders are determined in accordance with federal income tax regulations and may differ from determinations using GAAP.
(E) Security Transactions and Investment Income. The Fund records security transactions on the trade date. Realized gains and losses on security transactions are determined using the identified cost method. Dividend income is recognized on the ex-dividend date, net of any foreign tax withheld at the source, and interest income is accrued as earned using the effective interest rate method. Distributions received from real estate investment trusts may be classified as dividends, capital gains and/or return of capital. Discounts and premiums on securities purchased for the Fund are accreted and amortized, respectively, on the effective interest rate method.
Investment income and realized and unrealized gains and losses on investments of the Fund are allocated pro rata to the separate classes of shares based upon their relative net assets on the date the income is earned or realized and unrealized gains and losses are incurred.
The Fund may place a debt security on non-accrual status and reduce related interest income by ceasing current accruals and writing off all or a portion of any interest receivables when the collection of all or a portion of such interest has become doubtful. A debt security is removed from non-accrual status when the issuer resumes interest payments or when collectability of interest is reasonably assured.
(F) Expenses. Expenses of the Trust are allocated to the individual Funds in proportion to the net assets of the respective Funds when the expenses are incurred, except where direct allocations of expenses can be made. Expenses (other than transfer agent expenses and fees incurred under the shareholder services plans and/or the distribution plans further discussed in Note 3(B)) are allocated to separate classes of shares pro rata based upon their relative net assets on the date the expenses are incurred. The expenses borne by the Fund, including those of related parties to the Fund, are shown in the Statement of Operations.
Additionally, the Fund may invest in ETFs and mutual funds, which are subject to management fees and other fees that may cause the costs of investing in ETFs and mutual funds to be greater than the costs of owning the underlying securities directly. These indirect expenses of ETFs and mutual funds are not included in the amounts shown as expenses in the Statement of Operations or in the expense ratios included in the Financial Highlights.
(G) Use of Estimates. In preparing financial statements in conformity with GAAP, the Manager makes estimates and assumptions that affect the reported amounts and disclosures in the financial statements. Actual results could differ from those estimates and assumptions.
(H) Futures Contracts. ��A futures contract is an agreement to purchase or sell a specified quantity of an underlying instrument at a specified future date and price, or to make or receive a cash payment based on the value of a financial instrument (e.g., foreign currency, interest rate, security or securities index). The Fund is subject to risks such as market price risk and/or interest rate risk in the normal course of investing in these contracts. Upon entering into a futures contract, the Fund is required to pledge to the broker or futures commission merchant an amount of cash and/or U.S. government securities equal to a certain percentage of the collateral amount, known as the “initial margin.” During the period the futures contract is open, changes in the value of the contract are recognized as unrealized appreciation or depreciation by marking to market such contract on a daily basis to reflect the market value of the contract at the end of each day’s trading. The Fund agrees to receive from or pay to the broker or futures commission merchant an amount of cash equal to the daily fluctuation in the value of the contract. Such receipts or payments are known as “variation margin.” When the futures contract is closed, the Fund records a realized gain or loss equal
to the difference between the proceeds from (or cost of) the closing transaction and the Fund's basis in the contract.
The use of futures contracts involves, to varying degrees, elements of market risk in excess of the amount recognized in the Statement of Assets and Liabilities. The contract or notional amounts and variation margin reflect the extent of the Fund's involvement in open futures positions. There are several risks associated with the use of futures contracts as hedging techniques. There can be no assurance that a liquid market will exist at the time when the Fund seeks to close out a futures contract. If no liquid market exists, the Fund would remain obligated to meet margin requirements until the position is closed. Futures contracts may involve a small initial investment relative to the risk assumed, which could result in losses greater than if the Fund did not invest in futures contracts. Futures contracts may be more volatile than direct investments in the instrument underlying the futures and may not correlate to the underlying instrument, causing a given hedge not to achieve its objectives. The Fund's activities in futures contracts have minimal counterparty risk as they are conducted through regulated exchanges that guarantee the futures against default by the counterparty. In the event of a bankruptcy or insolvency of a futures commission merchant that holds margin on behalf of the Fund, the Fund may not be entitled to the return of the entire margin owed to the Fund, potentially resulting in a loss. The Fund may invest in futures contracts to seek enhanced returns or to reduce the risk of loss by hedging certain of its holdings. The Fund's investment in futures contracts and other derivatives may increase the volatility of the Fund's NAVs and may result in a loss to the Fund. Open futures contracts as of April 30, 2021 are shown in the Portfolio of Investments.
(I) Securities Lending. In order to realize additional income, the Fund may engage in securities lending, subject to the limitations set forth in the 1940 Act and relevant guidance by the staff of the Securities and Exchange Commission (“SEC”). If the Fund engages in securities lending, the Fund will lend through its custodian, JPMorgan Chase Bank, N.A., ("JPMorgan"), acting as securities lending agent on behalf of the Fund. Under the current arrangement, JPMorgan will manage the Fund's collateral in accordance with the securities lending agency agreement between the Fund and JPMorgan, and indemnify the Fund against counterparty risk. The loans will be collateralized by cash (which may be invested in a money market fund) and/or non-cash collateral (which may include U.S. Treasury securities and/or U.S. government agency securities issued or guaranteed by the United States government or its agencies or instrumentalities) at least equal at all times to the market value of the securities loaned. The Fund bears the risk of delay in recovery of, or loss of rights in, the securities loaned. The Fund may also record a realized gain or loss on securities deemed sold due to a borrower’s inability to return securities on loan. The Fund bears the risk of any loss on investment of cash collateral. The Fund will receive compensation for lending its securities in the form of fees or it will retain a portion of interest earned on the investment of any cash collateral. The Fund will also continue to receive interest and dividends on the securities loaned and any gain or loss in the market price of the securities loaned that may
occur during the term of the loan will be for the account of the Fund. Income earned from securities lending activities, if any, is reflected in the Statement of Operations. Securities on loan as of April 30, 2021, are shown in the Portfolio of Investments.
Prior to November 23, 2020, these services were provided by State Street Bank and Trust Company (“State Street”).
(J) Debt Securities Risk. The ability of issuers of debt securities held by the Fund to meet their obligations may be affected by, among other things, economic or political developments in a specific country, industry or region. Debt securities are also subject to the risks associated with changes in interest rates.
Investments in the Fund are not guaranteed, even though some of the Fund’s underlying investments are guaranteed by the U.S. government or its agencies or instrumentalities. The principal risk of mortgage-related and asset-backed securities is that the underlying debt may be prepaid ahead of schedule, if interest rates fall, thereby reducing the value of the Fund’s investment. If interest rates rise, less of the debt may be prepaid and the Fund may lose money because the Fund may be unable to invest in higher yielding assets. The Fund is subject to interest-rate risk and can lose principal value when interest rates rise. Bonds are also subject to credit risk, in which the bond issuer may fail to pay interest and principal in a timely manner.
The Fund may invest in foreign securities, which carry certain risks that are in addition to the usual risks inherent in domestic instruments. These risks include those resulting from currency fluctuations, future adverse political or economic developments and possible imposition of currency exchange blockages or other foreign governmental laws or restrictions. These risks are likely to be greater in emerging markets than in developed markets.
(K) LIBOR Replacement Risk. The Fund may invest in certain debt securities, derivatives or other financial instruments that utilize the London Interbank Offered Rate ("LIBOR"), as a “benchmark” or “reference rate” for various interest rate calculations. The United Kingdom Financial Conduct Authority, which regulates LIBOR, announced that after 2021 it will cease its active encouragement of banks to provide the quotations needed to sustain LIBOR. However, it is possible that certain LIBOR tenors may continue beyond 2021 and the most widely used LIBOR tenors may continue until mid-2023. As a result, it is anticipated that LIBOR will be discontinued or will no longer be sufficiently robust to be representative of its underlying market around that time. Although financial regulators and industry working groups have suggested alternative reference rates, such as European Interbank Offer Rate (“EURIBOR”), Sterling Overnight Interbank Average Rate (“SONIA”) and Secured Overnight Financing Rate (“SOFR”), there are challenges to converting certain contracts and transactions to a new benchmark and neither the full effects of the transition process nor its ultimate outcome is known. New York Life Investments is currently working to assess exposure and will modify contracts as necessary.
Notes to Financial Statements (Unaudited) (continued)
The elimination of LIBOR or changes to other reference rates or any other changes or reforms to the determination or supervision of reference rates could have an adverse impact on the market for, or value of, any securities or payments linked to those reference rates, which may adversely affect the Fund's performance and/or net asset value. Uncertainty and risk also remain regarding the willingness and ability of issuers and lenders to include revised provisions in new and existing contracts or instruments. Consequently, the transition away from LIBOR to other reference rates may lead to increased volatility and illiquidity in markets that are tied to LIBOR, fluctuations in values of LIBOR-related investments or investments in issuers that utilize LIBOR, increased difficulty in borrowing or refinancing and diminished effectiveness of hedging strategies, adversely affecting the Fund's performance. Furthermore, the risks associated with the expected discontinuation of LIBOR and transition may be exacerbated if the work necessary to effect an orderly transition to an alternative reference rate is not completed in a timely manner. Because the usefulness of LIBOR as a benchmark could deteriorate during the transition period, these effects could occur prior to the end of 2021 with respect to certain LIBOR tenors or mid-2023 for the remaining LIBOR tenors.
(L) Indemnifications. Under the Trust’s organizational documents, its officers and trustees are indemnified against certain liabilities that may arise out of performance of their duties to the Trust. Additionally, in the normal course of business, the Fund enters into contracts with third-party service providers that contain a variety of representations and warranties and that may provide general indemnifications. The Fund's maximum exposure under these arrangements is unknown, as this would involve future claims that may be made against the Fund that have not yet occurred. The Manager believes that the risk of loss in connection with these potential indemnification obligations is remote. However, there can be no assurance that material liabilities related to such obligations will not arise in the future, which could adversely impact the Fund.
(M) Quantitative Disclosure of Derivative Holdings. The following tables show additional disclosures related to the Fund's derivative and hedging activities, including how such activities are accounted for and their effect on the Fund's financial positions, performance and cash flows.
The Fund entered into futures contracts to hedge against anticipated changes in interest rates that might otherwise have an adverse effect upon the value of the Fund’s securities as well as to help manage the duration and yield curve positioning of the portfolio.
Fair value of derivative instruments as of April 30, 2021:
| Asset Derivatives | Interest
Rate
Contracts
Risk | Total |
| Futures Contracts - Net Assets—Net unrealized appreciation on futures contracts (a) | $90,300 | $90,300 |
| Total Fair Value | $90,300 | $90,300 |
| (a) | Includes cumulative appreciation (depreciation) of futures contracts as reported in the Portfolio of Investments. Only current day’s variation margin is reported within the Statement of Assets and Liabilities. |
| Liability Derivatives | Interest
Rate
Contracts
Risk | Total |
| Futures Contracts - Net Assets—Net unrealized depreciation on futures contracts (a) | $(18,998) | $(18,998) |
| Total Fair Value | $(18,998) | $(18,998) |
| (a) | Includes cumulative appreciation (depreciation) of futures contracts as reported in the Portfolio of Investments. Only current day’s variation margin is reported within the Statement of Assets and Liabilities. |
The effect of derivative instruments on the Statement of Operations for the six-month period ended April 30, 2021:
| Net Realized Gain (Loss) from: | Interest
Rate
Contracts
Risk | Total |
| Futures Contracts | $(145,203) | $(145,203) |
| Total Net Realized Gain (Loss) | $(145,203) | $(145,203) |
| Net Change in Unrealized Appreciation (Depreciation) | Interest
Rate
Contracts
Risk | Total |
| Futures Contracts | $172,445 | $172,445 |
| Total Net Change in Unrealized Appreciation (Depreciation) | $172,445 | $172,445 |
| Average Notional Amount | Total |
| Futures Contracts Long | $26,308,573 |
| Futures Contracts Short | $ (4,707,826) |
Note 3–Fees and Related Party Transactions
(A) Manager and Subadvisors. New York Life Investments, a registered investment adviser and an indirect, wholly-owned subsidiary of New York Life Insurance Company (“New York Life”), serves as the Fund’s Manager, pursuant to an Amended and Restated Management Agreement (“Management Agreement”). The Manager provides offices, conducts clerical, recordkeeping and bookkeeping services and keeps most of the financial and accounting records required to be maintained by the Fund.
Except for the portion of salaries and expenses that are the responsibility of the Fund, the Manager pays the salaries and expenses of all personnel affiliated with the Fund and certain operational expenses of the Fund. The Fund reimburses New York Life Investments in an amount equal to the portion of the compensation of the Chief Compliance Officer attributable to the Fund. The Fund’s subadvisor changed effective March 5, 2021 due to the removal of MacKay Shields LLC ("MacKay") as a subadvisor to the equity portion of the Fund and the appointment of Wellington Management Company LLP (“Wellington” or the “Subadvisor”) as a subadvisor to the equity portion of the Fund. Wellington, a registered investment adviser, is responsible for the day-to-day portfolio management of the equity portion of the Fund, pursuant to the terms of a Subadvisory Agreement (a “Subadvisory Agreement”) between New York Life Investments and Wellington, and NYL Investors LLC (“NYL Investors” or the “Subadvisor,” and, together with Wellington, the “Subadvisors”), a registered investment adviser and a direct, wholly-owned subsidiary of New York Life, serves as a Subadvisor to the Fund and is responsible for the day-to-day portfolio management of the fixed-income portion of the Fund, pursuant to the terms of a Subadvisory Agreement between New York Life Investments and NYL Investors. New York Life Investments pays for the services of the Subadvisors.
Effective March 5, 2021, under the Management Agreement, the Fund pays the Manager a monthly fee for the services performed and the facilities furnished at an annual rate of the Fund’s average daily net assets as follows: 0.65% on assets up to $1 billion; 0.625% on assets from $1 billion to $2 billion; and 0.60% on assets over $2 billion. During the six-month period ended April 30, 2021, the effective management fee rate was 0.68%.
Prior to March 5, 2021, the Fund paid the Manager a monthly fee for the services performed and the facilities furnished at an annual rate of the Fund’s average daily net assets as follows: 0.70% up to $1 billion; 0.65% from $1 billion to $2 billion; and 0.60% in excess of $2 billion.
During the six-month period ended April 30, 2021, New York Life Investments earned fees from the Fund in the amount of $1,831,815 and waived fees and/or reimbursed expenses, including the voluntary waiver/reimbursement of certain class specific expenses in the amount of $8,391 and paid MacKay, Wellington and NYL Investors $370,652, $138,342 and $331,780, respectively.
JPMorgan provides sub-administration and sub-accounting services to the Fund pursuant to an agreement with New York Life Investments. These services include calculating the daily NAVs of the Fund, maintaining the general ledger and sub-ledger accounts for the calculation of the Fund's NAVs, and assisting New York Life Investments in conducting various aspects of the Fund's administrative operations. For providing these services to the Fund, JPMorgan is compensated by New York Life Investments.
Prior to November 23, 2020, these services were provided by State Street.
Pursuant to an agreement between the Trust and New York Life Investments, New York Life Investments is responsible for providing or procuring certain regulatory reporting services for the Fund. The Fund will reimburse New York Life Investments for the actual costs incurred by New York Life Investments in connection with providing or procuring these services for the Fund.
(B) Distribution and Service Fees. The Trust, on behalf of the Fund, has entered into a distribution agreement with NYLIFE Distributors LLC (the “Distributor”), an affiliate of New York Life Investments. The Fund has adopted distribution plans (the “Plans”) in accordance with the provisions of Rule 12b-1 under the 1940 Act.
Pursuant to the Class A, Investor Class and Class R2 Plans, the Distributor receives a monthly distribution fee from the Class A, Investor Class and Class R2 shares at an annual rate of 0.25% of the average daily net assets of the Class A, Investor Class and Class R2 shares for distribution and/or service activities as designated by the Distributor. Pursuant to the Class B and Class C Plans, Class B and Class C shares pay the Distributor a monthly distribution fee at an annual rate of 0.75% of the average daily net assets of the Class B and Class C shares, along with a service fee at an annual rate of 0.25% of the average daily net assets of the Class B and Class C shares, for a total 12b-1 fee of 1.00%. Pursuant to the Class R3 Plan, Class R3 shares pay the Distributor a monthly fee at an annual rate of 0.25% of the average daily net assets of the Class R3 shares, along with a service fee at an annual rate of 0.25% of the average daily net assets of the Class R3 shares, for a total 12b-1 fee of 0.50%. Class I, Class R1 and Class R6 shares are not subject to a distribution and/or service fee.
The Plans provide that the distribution and service fees are payable to the Distributor regardless of the amounts actually expended by the Distributor for distribution of the Fund's shares and service activities.
In accordance with the Shareholder Services Plans for the Class R1, Class R2 and Class R3 shares, the Manager has agreed to provide, through its affiliates or independent third parties, various shareholder and administrative support services to shareholders of the Class R1, Class R2 and Class R3 shares. For its services, the Manager, its affiliates or independent third-party service providers are entitled to a shareholder service fee accrued daily and paid monthly at an annual rate of 0.10% of the average daily net assets of the Class R1, Class R2 and Class R3 shares. This is in addition to any fees paid under the Class R2 and Class R3 Plans.
During the six-month period ended April 30, 2021, shareholder service fees incurred by the Fund were as follows:
| |
| Class R1 | $ 44 |
| Class R2 | 934 |
| Class R3 | 1,103 |
Notes to Financial Statements (Unaudited) (continued)
(C) Sales Charges. The Fund was advised by the Distributor that the amount of initial sales charges retained on sales of Class A and Investor Class shares during the six-month period ended April 30, 2021, were $9,460 and $3,072, respectively.
The Fund was also advised that the Distributor retained CDSCs on redemptions of Class A, Class B and Class C shares during the six-month period ended April 30, 2021, of $3,653, $1,238 and $288, respectively.
(D) Transfer, Dividend Disbursing and Shareholder Servicing Agent. NYLIM Service Company LLC, an affiliate of New York Life Investments, is the Fund's transfer, dividend disbursing and shareholder servicing agent pursuant to an agreement between NYLIM Service Company LLC and the Trust. NYLIM Service Company LLC has entered into an agreement with DST Asset Manager Solutions, Inc. ("DST"), pursuant to which DST performs certain transfer agent services on behalf of NYLIM Service Company LLC. New York Life Investments has contractually agreed to limit the transfer agency expenses charged to the Fund’s share classes to a maximum of 0.35% of that share class’s average daily net assets on an annual basis after deducting any applicable Fund or class-level expense reimbursement or small account fees. This agreement will remain in effect until February 28, 2022, and shall renew automatically for one-year terms unless New York Life Investments provides written notice of termination prior to the start of the next term or upon approval of the Board. During the six-month period ended April 30, 2021, transfer agent expenses incurred by the Fund and
any reimbursements, pursuant to the aforementioned Transfer Agency expense limitation agreement, were as follows:
| Class | Expense | Waived |
| Class A | $143,509 | $ — |
| Investor Class | 93,859 | (4,527) |
| Class B | 20,997 | (1,008) |
| Class C | 60,119 | (2,856) |
| Class I | 77,754 | — |
| Class R1 | 45 | — |
| Class R2 | 941 | — |
| Class R3 | 1,111 | — |
| Class R6 | 2 | — |
(E) Small Account Fee. Shareholders with small accounts adversely impact the cost of providing transfer agency services. In an effort to reduce total transfer agency expenses, the Fund has implemented a small account fee on certain types of accounts. As described in the Fund's prospectus, certain shareholders with an account balance of less than $1,000 ($5,000 for Class A share accounts) are charged an annual per account fee of $20 (assessed semi-annually), the proceeds from which offset transfer agent fees as reflected in the Statement of Operations. This small account fee will not apply to certain types of accounts as described further in the Fund’s prospectus.
(F) Investments in Affiliates (in 000’s). During the six-month period ended April 30, 2021, purchases and sales transactions, income earned from investments and shares held of investment companies managed by New York Life Investments or its affiliates were as follows:
| Affiliated Investment Companies | Value,
Beginning
of Period | Purchases
at Cost | Proceeds
from
Sales | Net
Realized
Gain/(Loss)
on Sales | Change in
Unrealized
Appreciation/
(Depreciation) | Value,
End of
Period | Dividend
Income | Other
Distributions | Shares
End of
Period |
| MainStay U.S. Government Liquidity Fund | $ — | $ 7,489 | $ (3,097) | $ — | $ — | $ 4,392 | $ —(a) | $ — | 4,392 |
(G) Capital. As of April 30, 2021, New York Life and its affiliates beneficially held shares of the Fund with the values and percentages of net assets as follows:
Note 4-Federal Income Tax
As of April 30, 2021, the cost and unrealized appreciation (depreciation) of the Fund’s investment portfolio, including applicable derivative contracts and other financial instruments, as determined on a federal income tax basis, were as follows:
| | Federal Tax
Cost | Gross
Unrealized
Appreciation | Gross
Unrealized
(Depreciation) | Net
Unrealized
Appreciation/
(Depreciation) |
| Investments | $1,442,321,983 | $197,159,378 | $(13,448,477) | $183,710,901 |
During the year ended October 31, 2020, the tax character of distributions paid as reflected in the Statements of Changes in Net Assets was as follows:
| | 2020 |
| Distributions paid from: | |
| Ordinary Income | $ 6,953,382 |
| Long-Term Capital Gains | 12,390,889 |
| Total | $19,344,271 |
Note 5–Custodian
JPMorgan is the custodian of cash and securities held by the Fund. Custodial fees are charged to the Fund based on the Fund's net assets and/or the market value of securities held by the Fund and the number of certain transactions incurred by the Fund.
Prior to November 23, 2020, these services were provided by State Street. The services provided by State Street were a direct expense of the Fund and are included in the Statement of Operations as Custodian fees which totaled $2,911 for the period November 1, 2020 through November 22, 2020.
Note 6–Line of Credit
The Fund and certain other funds managed by New York Life Investments maintain a line of credit with a syndicate of banks in order to secure a source of funds for temporary purposes to meet unanticipated or excessive redemption requests.
Effective July 28, 2020, under the credit agreement (the “Credit Agreement”), the aggregate commitment amount is $600,000,000 with an additional uncommitted amount of $100,000,000. The commitment fee is an annual rate of 0.15% of the average commitment amount payable quarterly, regardless of usage, to JPMorgan, who serves as the agent to the syndicate. The commitment fee is allocated among the Fund and certain other funds managed by New York Life Investments based upon their respective net assets and other factors. Interest on any revolving credit loan is charged based upon the Federal Funds Rate or the one-month LIBOR, whichever is higher. The Credit Agreement expires on July 27, 2021, although the Fund, certain other funds managed by New York Life Investments and the syndicate of banks may renew the Credit Agreement for an additional year on the same or different terms or enter into a credit agreement with a different syndicate of banks. Prior to July 28, 2020, the aggregate commitment amount and the commitment fee were the same as those under the current Credit Agreement, but State Street served as agent to the syndicate. During the six-month period ended April 30, 2021, there were no borrowings made or outstanding with respect to the Fund under the Credit Agreement or the credit agreement for which State Street served as agent.
Note 7–Interfund Lending Program
Pursuant to an exemptive order issued by the SEC, the Fund, along with certain other funds managed by New York Life Investments, may participate in an interfund lending program. The interfund lending program provides an alternative credit facility that permits the Fund and certain other funds managed by New York Life Investments to lend or borrow money for temporary purposes directly to or from one another, subject to the conditions of the exemptive order. During the six-month period ended April 30, 2021, there were no interfund loans made or outstanding with respect to the Fund.
Note 8–Purchases and Sales of Securities (in 000’s)
During the six-month period ended April 30, 2021, purchases and sales of U.S. government securities were $228,384 and $254,512, respectively. Purchases and sales of securities, other than U.S. government securities and short-term securities, were $210,009 and $246,088 respectively.
Note 9–Capital Share Transactions
Transactions in capital shares for the six-month period ended April 30, 2021 and the year ended October 31, 2020, were as follows:
| Class A | Shares | Amount |
| Period ended April 30, 2021: | | |
| Shares sold | 552,775 | $ 18,778,848 |
| Shares issued to shareholders in reinvestment of distributions | 121,239 | 4,021,085 |
| Shares redeemed | (684,752) | (22,887,296) |
| Net increase (decrease) in shares outstanding before conversion | (10,738) | (87,363) |
| Shares converted into Class A (See Note 1) | 303,201 | 10,223,685 |
| Shares converted from Class A (See Note 1) | (102) | (3,390) |
| Net increase (decrease) | 292,361 | $ 10,132,932 |
| Year ended October 31, 2020: | | |
| Shares sold | 850,841 | $ 25,176,801 |
| Shares issued to shareholders in reinvestment of distributions | 318,603 | 9,414,225 |
| Shares redeemed | (1,914,739) | (55,913,883) |
| Net increase (decrease) in shares outstanding before conversion | (745,295) | (21,322,857) |
| Shares converted into Class A (See Note 1) | 230,256 | 6,838,268 |
| Shares converted from Class A (See Note 1) | (14,231) | (412,912) |
| Net increase (decrease) | (529,270) | $(14,897,501) |
| |
Notes to Financial Statements (Unaudited) (continued)
| Investor Class | Shares | Amount |
| Period ended April 30, 2021: | | |
| Shares sold | 57,743 | $ 1,944,055 |
| Shares issued to shareholders in reinvestment of distributions | 21,160 | 698,242 |
| Shares redeemed | (74,150) | (2,474,964) |
| Net increase (decrease) in shares outstanding before conversion | 4,753 | 167,333 |
| Shares converted into Investor Class (See Note 1) | 23,840 | 817,953 |
| Shares converted from Investor Class (See Note 1) | (249,738) | (8,382,093) |
| Net increase (decrease) | (221,145) | $ (7,396,807) |
| Year ended October 31, 2020: | | |
| Shares sold | 169,264 | $ 4,992,474 |
| Shares issued to shareholders in reinvestment of distributions | 57,089 | 1,693,568 |
| Shares redeemed | (204,180) | (6,015,316) |
| Net increase (decrease) in shares outstanding before conversion | 22,173 | 670,726 |
| Shares converted into Investor Class (See Note 1) | 41,213 | 1,195,346 |
| Shares converted from Investor Class (See Note 1) | (181,180) | (5,414,267) |
| Net increase (decrease) | (117,794) | $ (3,548,195) |
| |
| Class B | Shares | Amount |
| Period ended April 30, 2021: | | |
| Shares sold | 3,054 | $ 104,567 |
| Shares issued to shareholders in reinvestment of distributions | 3,830 | 124,552 |
| Shares redeemed | (33,596) | (1,119,852) |
| Net increase (decrease) in shares outstanding before conversion | (26,712) | (890,733) |
| Shares converted from Class B (See Note 1) | (28,046) | (942,460) |
| Net increase (decrease) | (54,758) | $ (1,833,193) |
| Year ended October 31, 2020: | | |
| Shares sold | 9,706 | $ 270,707 |
| Shares issued to shareholders in reinvestment of distributions | 11,771 | 351,184 |
| Shares redeemed | (86,866) | (2,512,784) |
| Net increase (decrease) in shares outstanding before conversion | (65,389) | (1,890,893) |
| Shares converted from Class B (See Note 1) | (61,927) | (1,801,660) |
| Net increase (decrease) | (127,316) | $ (3,692,553) |
| |
| Class C | Shares | Amount |
| Period ended April 30, 2021: | | |
| Shares sold | 19,684 | $ 665,487 |
| Shares issued to shareholders in reinvestment of distributions | 11,959 | 388,510 |
| Shares redeemed | (197,143) | (6,629,208) |
| Net increase (decrease) in shares outstanding before conversion | (165,500) | (5,575,211) |
| Shares converted from Class C (See Note 1) | (50,122) | (1,725,251) |
| Net increase (decrease) | (215,622) | $ (7,300,462) |
| Year ended October 31, 2020: | | |
| Shares sold | 60,810 | $ 1,774,728 |
| Shares issued to shareholders in reinvestment of distributions | 36,587 | 1,091,023 |
| Shares redeemed | (509,823) | (14,860,399) |
| Net increase (decrease) in shares outstanding before conversion | (412,426) | (11,994,648) |
| Shares converted from Class C (See Note 1) | (21,179) | (611,819) |
| Net increase (decrease) | (433,605) | $(12,606,467) |
| |
| Class I | Shares | Amount |
| Period ended April 30, 2021: | | |
| Shares sold | 347,378 | $ 11,698,548 |
| Shares issued to shareholders in reinvestment of distributions | 73,029 | 2,416,995 |
| Shares redeemed | (1,669,099) | (57,036,637) |
| Net increase (decrease) in shares outstanding before conversion | (1,248,692) | (42,921,094) |
| Shares converted into Class I (See Note 1) | 344 | 11,556 |
| Net increase (decrease) | (1,248,348) | $(42,909,538) |
| Year ended October 31, 2020: | | |
| Shares sold | 725,840 | $ 21,787,238 |
| Shares issued to shareholders in reinvestment of distributions | 211,303 | 6,251,124 |
| Shares redeemed | (1,543,342) | (45,968,711) |
| Net increase (decrease) in shares outstanding before conversion | (606,199) | (17,930,349) |
| Shares converted into Class I (See Note 1) | 6,641 | 207,044 |
| Net increase (decrease) | (599,558) | $(17,723,305) |
| |
| Class R1 | Shares | Amount |
| Period ended April 30, 2021: | | |
| Shares sold | 225 | $ 7,544 |
| Shares issued to shareholders in reinvestment of distributions | 40 | 1,329 |
| Shares redeemed | (135) | (4,436) |
| Net increase (decrease) | 130 | $ 4,437 |
| Year ended October 31, 2020: | | |
| Shares sold | 1,183 | $ 35,401 |
| Shares issued to shareholders in reinvestment of distributions | 1,049 | 32,148 |
| Shares redeemed | (41,076) | (1,086,376) |
| Net increase (decrease) | (38,844) | $ (1,018,827) |
| |
| Class R2 | Shares | Amount |
| Period ended April 30, 2021: | | |
| Shares sold | 2,835 | $ 95,262 |
| Shares issued to shareholders in reinvestment of distributions | 682 | 22,608 |
| Shares redeemed | (5,325) | (179,751) |
| Net increase (decrease) | (1,808) | $ (61,881) |
| Year ended October 31, 2020: | | |
| Shares sold | 11,249 | $ 333,907 |
| Shares issued to shareholders in reinvestment of distributions | 2,601 | 77,126 |
| Shares redeemed | (49,856) | (1,445,105) |
| Net increase (decrease) | (36,006) | $ (1,034,072) |
| |
| Class R3 | Shares | Amount |
| Period ended April 30, 2021: | | |
| Shares sold | 5,849 | $ 198,124 |
| Shares issued to shareholders in reinvestment of distributions | 928 | 30,529 |
| Shares redeemed | (17,339) | (564,186) |
| Net increase (decrease) | (10,562) | $ (335,533) |
| Year ended October 31, 2020: | | |
| Shares sold | 13,974 | $ 408,019 |
| Shares issued to shareholders in reinvestment of distributions | 2,198 | 64,994 |
| Shares redeemed | (38,825) | (1,193,537) |
| Net increase (decrease) | (22,653) | $ (720,524) |
| |
| Class R6 | Shares | Amount |
| Period ended April 30, 2021: | | |
| Shares issued to shareholders in reinvestment of distributions | 26 | $ 877 |
| Shares redeemed | (12) | (399) |
| Net increase (decrease) | 14 | $ 478 |
| Year ended October 31, 2020: | | |
| Shares sold | 1,055 | $ 33,079 |
| Shares issued to shareholders in reinvestment of distributions | 62 | 1,844 |
| Shares redeemed | (472,636) | (14,851,221) |
| Net increase (decrease) | (471,519) | $(14,816,298) |
Note 10–Recent Accounting Pronouncement
In March 2020, the Financial Accounting Standards Board issued Accounting Standards Update 2020-04 (“ASU 2020-04”), which provides optional guidance to ease the potential accounting burden associated with transitioning away from LIBOR and other reference rates that are expected to be discontinued. ASU 2020-04 was effective immediately upon release of the update on March 12, 2020 and remains effective through December 31, 2022. At this time, the Manager is evaluating the implications of certain other provisions of ASU 2020-04 related to new disclosure requirements and any impact on the financial statement disclosures has not yet been determined.
Note 11–Other Matters
An outbreak of COVID-19, first detected in December 2019, has developed into a global pandemic and has resulted in travel restrictions, closure of international borders, certain businesses and securities markets, restrictions on securities trading activities, prolonged quarantines, supply chain disruptions, and lower consumer demand, as well as general concern and uncertainty. The continued impact of COVID-19 is uncertain and could further adversely affect the global economy, national economies, individual issuers and capital markets in unforeseeable ways and result in a substantial and extended economic downturn. Developments that disrupt global economies and financial markets, such as COVID-19, may magnify factors that affect the Fund's performance.
Note 12–Subsequent Events
In connection with the preparation of the financial statements of the Fund as of and for the six-month period ended April 30, 2021, events and transactions subsequent to April 30, 2021, through the date the financial statements were issued have been evaluated by the Manager for possible adjustment and/or disclosure. No subsequent events requiring financial statement adjustment or disclosure have been identified.
Board Consideration and Approval of Management Agreement and Subadvisory Agreements (Unaudited)
The continuation of the Management Agreement with respect to the MainStay Balanced Fund (“Fund”) and New York Life Investment Management LLC (“New York Life Investments”) and the Subadvisory Agreements between New York Life Investments and each of MacKay Shields LLC (“MacKay”) and NYL Investors LLC (“NYL Investors”) with respect to the Fund (collectively, “Advisory Agreements”), following an initial term of up to two years, is subject to annual review and approval by the Board of Trustees of MainStay Funds Trust (“Board” of the “Trust”) in accordance with Section 15 of the Investment Company Act of 1940, as amended (“1940 Act”). At its December 9–10, 2020 meeting, the Board, including the Trustees who are not an “interested person” (as such term is defined in the 1940 Act) of the Trust (“Independent Trustees”) voting separately, unanimously approved the continuation of each of the Advisory Agreements for a one-year period.
In reaching the decision to approve the continuation of each of the Advisory Agreements, the Board considered information furnished by New York Life Investments, MacKay and NYL Investors in connection with an annual contract review process undertaken by the Board that took place at meetings of the Board and its Contracts Committee during September 2020 through December 2020, as well as other information furnished to the Board and its Committees throughout the year, as deemed relevant by the Trustees. Information requested by and furnished to the Board for consideration in connection with the contract review process included, among other items, reports on the Fund and “peer funds” prepared by Strategic Insight Mutual Fund Research and Consulting, LLC (“Strategic Insight”), an independent third-party service provider engaged by the Board to report objectively on the Fund’s investment performance, management fee and total expenses. The Board also considered information on the fees charged to other investment advisory clients of New York Life Investments, MacKay and/or NYL Investors that follow investment strategies similar to those of the Fund, if any, and, when applicable, the rationale for any differences in the Fund’s management and subadvisory fees and the fees charged to those other investment advisory clients. In addition, the Board considered information furnished by New York Life Investments, MacKay and NYL Investors in response to requests prepared on behalf of the Board, and in consultation with the Independent Trustees, by independent legal counsel to the Independent Trustees, which encompassed a variety of topics, including those summarized below.
The Board took into account information provided in connection with its meetings throughout the year, including, among other items, information regarding the legal standards and fiduciary obligations applicable to its consideration of the continuation of each of the Advisory Agreements and investment performance reports on the Fund as well as presentations from New York Life Investments, MacKay and NYL Investors personnel. The Board also took into account other information received from New York Life Investments throughout the year, including, among other items, periodic reports on legal and compliance matters, risk management, portfolio turnover, brokerage commissions and non-advisory services provided to the Fund by New York Life Investments. The contract review process, including the structure and format for materials provided to the
Board, has been developed in consultation with the Board. The Independent Trustees also met in executive sessions with their independent legal counsel and, for a portion thereof, with senior management of New York Life Investments.
In addition to information provided to the Board throughout the year, the Board received information in connection with its June 2020 meeting provided specifically in response to requests prepared on behalf of the Board, and in consultation with the Independent Trustees, by independent legal counsel regarding the Fund’s distribution arrangements. In addition, the Board received information regarding the Fund’s asset levels, share purchase and redemption activity and the payment of Rule 12b-1 and/or other fees by applicable share classes of the Fund, among other information.
In considering the continuation of each of the Advisory Agreements, the Trustees reviewed and evaluated the information and factors they believed to reasonably be necessary and appropriate in light of legal advice furnished to them by independent legal counsel and through the exercise of their own business judgment. Although individual Trustees may have weighed certain factors or information differently, the factors considered by the Board are described in greater detail below and include, among other factors: (i) the nature, extent and quality of the services provided to the Fund by New York Life Investments, MacKay and NYL Investors; (ii) the qualifications of the portfolio managers of the Fund and the historical investment performance of the Fund, New York Life Investments, MacKay and NYL Investors; (iii) the costs of the services provided, and profits realized, by New York Life Investments, MacKay and NYL Investors from their relationships with the Fund; (iv) the extent to which economies of scale have been realized or may be realized as the Fund grows and the extent to which economies of scale have benefited or may benefit the Fund’s shareholders; and (v) the reasonableness of the Fund’s management and subadvisory fees and total ordinary operating expenses. Although the Board recognized that comparisons between the Fund’s fees and expenses and those of other funds are imprecise given different terms of agreements, variations in fund strategies and other factors, the Board considered the reasonableness of the Fund’s management fee and total ordinary operating expenses as compared to the peer funds identified by Strategic Insight. Throughout their considerations, the Trustees acknowledged the commitment of New York Life Investments and its affiliates to serve the MainStay Group of Funds, as well as their capacity, experience, resources, financial stability and reputations. The Trustees also acknowledged the entrepreneurial and other risks assumed by New York Life Investments in sponsoring and managing the Fund.
The Trustees noted that, throughout the year, the Trustees are afforded an opportunity to ask questions of, and request additional information or materials from, New York Life Investments, MacKay and NYL Investors. The Board’s decision with respect to each of the Advisory Agreements may have also been based, in part, on the Board’s knowledge of New York Life Investments, MacKay and NYL Investors resulting from, among other things, the Board’s consideration of each of the Advisory Agreements in prior years, the advisory agreements for other funds in the MainStay
Group of Funds, the Board’s review throughout the year of the performance and operations of other funds in the MainStay Group of Funds and each Trustee’s business judgment and industry experience. In addition to considering the above-referenced factors, the Board observed that in the marketplace there are a range of investment options available to the Fund’s shareholders and such shareholders, having had the opportunity to consider other investment options, have chosen to invest in the Fund.
The factors that figured prominently in the Board’s decision to approve the continuation of each of the Advisory Agreements during its December 9–10, 2020 meeting are summarized in more detail below, and the Board did not consider any factor or information controlling in reaching such decision.
Nature, Extent and Quality of Services Provided by New York Life Investments, MacKay and NYL Investors
The Board examined the nature, extent and quality of the services that New York Life Investments provides to the Fund. The Board evaluated New York Life Investments’ experience and capabilities in serving as manager of the Fund and considered that the Fund operates in a “manager-of-managers” structure. The Board also considered New York Life Investments’ responsibilities and services provided pursuant to this structure, including evaluating the performance of MacKay and NYL Investors, making recommendations to the Board as to whether the Subadvisory Agreements should be renewed, modified or terminated and periodically reporting to the Board regarding the results of New York Life Investments’ evaluation and monitoring functions. The Board noted that New York Life Investments manages other mutual funds, serves a variety of other investment advisory clients, including other pooled investment vehicles, and has experience overseeing mutual fund service providers, including subadvisors. The Board considered the experience of senior personnel at New York Life Investments providing management and administrative and other non-advisory services to the Fund as well as New York Life Investments’ reputation and financial condition. The Board observed that New York Life Investments devotes significant resources and time to providing management and non-advisory services to the Fund, including New York Life Investments’ supervision and due diligence reviews of MacKay and NYL Investors and ongoing analysis of, and interactions with, MacKay and NYL Investors with respect to, among other things, the Fund’s investment performance and risks as well as MacKay’s and NYL Investors’ investment capabilities and subadvisory services with respect to the Fund.
The Board also considered the range of services that New York Life Investments provides to the Fund under the terms of the Management Agreement, including: (i) fund accounting and ongoing supervisory services provided by New York Life Investments’ Fund Administration and Accounting Group; (ii) investment supervisory and analytical services provided by New York Life Investments’ Investment Consulting Group; (iii) compliance services provided by the Trust’s Chief Compliance Officer as well as New York Life Investments’ compliance department, including supervision and implementation of the Fund’s compliance program; (iv)
legal services provided by New York Life Investments’ Office of the General Counsel; and (v) risk management monitoring and analysis by compliance and investment personnel. The Board noted that New York Life Investments provides certain other non-advisory services to the Fund. In addition, the Board considered New York Life Investments’ willingness to invest in personnel, infrastructure, technology, operational enhancements, cyber security, information security, shareholder privacy resources and business continuity planning designed to benefit the Fund and noted that New York Life Investments is responsible for compensating the Trust’s officers, except for a portion of the salary of the Trust’s Chief Compliance Officer. The Board recognized that New York Life Investments has provided an increasingly broad array of non-advisory services to the MainStay Group of Funds as a result of regulatory and other developments, including in connection with the designation of New York Life Investments as the administrator of the MainStay Group of Funds’ liquidity risk management program adopted under the 1940 Act. The Board considered benefits to shareholders from being part of the MainStay Group of Funds, including the privilege of exchanging investments between the same class of shares of funds in the MainStay Group of Funds, including without the imposition of a sales charge (if any).
The Board also examined the nature, extent and quality of the investment advisory services that MacKay and NYL Investors provide to the Fund and considered the terms of each of the Advisory Agreements. The Board evaluated MacKay’s and NYL Investors’ experience in serving as subadvisor to the Fund and advising other portfolios and MacKay’s and NYL Investors’ track records and experience in providing investment advisory services, the experience of investment advisory, senior management and administrative personnel at MacKay and NYL Investors and New York Life Investments’, MacKay’s and NYL Investors’ overall resources, legal and compliance environment, capabilities and history. In addition to information provided in connection with quarterly meetings with the Trust’s Chief Compliance Officer, the Board considered information regarding the compliance policies and procedures of New York Life Investments, MacKay and NYL Investors and acknowledged their commitment to further developing and strengthening compliance programs relating to the Fund. The Board reviewed MacKay’s and NYL Investors’ ability to attract and retain qualified investment professionals and willingness to invest in personnel to service and support the Fund. In this regard, the Board considered the experience of the Fund’s portfolio managers, the number of accounts managed by the portfolio managers and the method for compensating the portfolio managers.
In addition, the Board considered discussions with New York Life Investments regarding the implementation of its business continuity plans and recognized steps taken by New York Life Investments, MacKay and NYL Investors to continue to provide the same nature, extent and quality of services to the Fund during the COVID-19 pandemic.
Based on these considerations, the Board concluded that the Fund would likely continue to benefit from the nature, extent and quality of these services.
Board Consideration and Approval of Management Agreement and Subadvisory Agreements (Unaudited) (continued)
Investment Performance
In evaluating the Fund’s investment performance, the Board considered investment performance results over various periods in light of the Fund’s investment objective, strategies and risks. The Board considered investment reports on, and analysis of, the Fund’s performance provided to the Board throughout the year. These reports include, among other items, information on the Fund’s gross and net returns, the Fund’s investment performance compared to relevant investment categories and the Fund’s benchmarks, the Fund’s risk-adjusted investment performance and the Fund’s investment performance as compared to peer funds, as appropriate, as well as portfolio attribution information and commentary on the effect of market conditions. The Board also considered information provided by Strategic Insight showing the investment performance of the Fund as compared to peer funds.
The Board also gave weight to its discussions with senior management at New York Life Investments concerning the Fund’s investment performance attributable to MacKay and NYL Investors as well as discussions between the Fund’s portfolio managers and the members of the Board’s Investment Committee, which generally occur on an annual basis. In addition, the Board considered any specific actions that New York Life Investments, MacKay or NYL Investors had taken, or had agreed to take, to seek to enhance Fund investment performance and the results of those actions. In considering the investment performance of the Fund, the Board noted that the Fund underperformed its peer funds for the one-, three-, five- and ten-year periods ended July 31, 2020. The Board considered its discussions with representatives from New York Life Investments, MacKay and NYL Investors regarding the Fund’s investment performance.
Based on these considerations, the Board concluded that its review of the Fund’s investment performance and related information supported a determination to approve the continuation of each of the Advisory Agreements.
Costs of the Services Provided, and Profits Realized, by New York Life Investments, MacKay and NYL Investors
The Board considered the costs of the services provided under each of the Advisory Agreements. The Board also considered the profits realized by New York Life Investments and its affiliates, including MacKay and NYL Investors, due to their relationships with the Fund. Because MacKay and NYL Investors are affiliates of New York Life Investments whose subadvisory fees are paid by New York Life Investments, not the Fund, the Board considered cost and profitability information for New York Life Investments, MacKay and NYL Investors in the aggregate.
In addition, the Board acknowledged the difficulty in obtaining reliable comparative data about mutual fund managers’ profitability because such information generally is not publicly available and may be impacted by numerous factors, including the structure of a fund manager’s organization, the types of funds it manages, the methodology used to allocate certain fixed costs to specific funds and the manager’s capital structure and costs of capital.
In evaluating the costs of the services provided by New York Life Investments, MacKay and NYL Investors and profits realized by New York Life Investments and its affiliates, including MacKay and NYL Investors, the Board considered, among other factors, each party’s continuing investments in, or willingness to invest in, personnel, systems, equipment and other resources and infrastructure to support and further enhance the management of the Fund, and that New York Life Investments is responsible for paying the subadvisory fees for the Fund. The Board also considered the financial resources of New York Life Investments, MacKay and NYL Investors and acknowledged that New York Life Investments, MacKay and NYL Investors must be in a position to attract and retain experienced professional personnel and to maintain a strong financial position for New York Life Investments, MacKay and NYL Investors to continue to provide high-quality services to the Fund. The Board recognized that the Fund benefits from the allocation of certain fixed costs among the funds in the MainStay Group of Funds, among other expected benefits resulting from its relationship with New York Life Investments.
The Board considered information regarding New York Life Investments’ methodology for calculating profitability and allocating costs provided by New York Life Investments in connection with the fund profitability analysis presented to the Board. The Board previously engaged an independent consultant to review the methods used to allocate costs among the funds in the MainStay Group of Funds. The Board noted that the independent consultant had concluded that New York Life Investments’ methods for allocating costs and procedures for estimating overall profitability of the relationship with the funds in the MainStay Group of Funds are reasonable and that New York Life Investments continued to use the same method of calculating profit and allocating costs since the independent consultant’s review. The Board recognized the difficulty in calculating and evaluating a manager’s profitability with respect to the Fund and noted that other profitability methodologies may also be reasonable.
The Board also considered certain fall-out benefits that may be realized by New York Life Investments and its affiliates due to their relationships with the Fund, including reputational and other indirect benefits. The Board recognized, for example, the benefits to MacKay from legally permitted “soft-dollar” arrangements by which brokers provide research and other services to MacKay in exchange for commissions paid by the Fund with respect to trades on the Fund’s portfolio securities. In addition, the Board considered its review of a money market fund advised by New York Life Investments and an affiliated subadvisor that serves as an investment option for the Fund, including the potential rationale for and costs associated with investments in this money market fund by the Fund, if any, and considered information from New York Life Investments that the nature and type of specific investment advisory services provided to this money market fund are distinct from, or in addition to, the investment advisory services provided to the Fund.
The Board observed that, in addition to fees earned by New York Life Investments for managing the Fund, New York Life Investments’ affiliates also earn revenues from serving the Fund in various other capacities,
including as the Fund’s transfer agent and distributor. The Board considered information about these other revenues and their impact on the profitability of the relationship with the Fund to New York Life Investments and its affiliates. The Board noted that, although it assessed the overall profitability of the Fund to New York Life Investments and its affiliates as part of the contract review process, when considering the reasonableness of the fee paid to New York Life Investments and its affiliates under each of the Advisory Agreements, the Board considered the profitability of New York Life Investments’ relationship with the Fund on a pre-tax basis and without regard to distribution expenses incurred by New York Life Investments from its own resources.
After evaluating the information deemed relevant by the Trustees, the Board concluded that any profits realized by New York Life Investments and its affiliates, including MacKay and NYL Investors, due to their relationships with the Fund were not excessive.
Management and Subadvisory Fees and Total Ordinary Operating Expenses
The Board evaluated the reasonableness of the fee paid under each of the Advisory Agreements and the Fund’s total ordinary operating expenses. The Board primarily considered the reasonableness of the management fee paid by the Fund to New York Life Investments, because the subadvisory fees paid to MacKay and NYL Investors are paid by New York Life Investments, not the Fund. The Board also considered the reasonableness of the subadvisory fees paid by New York Life Investments and the amount of the management fee retained by New York Life Investments.
In assessing the reasonableness of the Fund’s fees and expenses, the Board primarily considered comparative data provided by Strategic Insight on the fees and expenses charged by similar mutual funds managed by other investment advisers. In addition, the Board considered information provided by New York Life Investments, MacKay and NYL Investors on fees charged to other investment advisory clients, including institutional separate accounts and/or other funds that follow investment strategies similar to those of the Fund, if any. The Board considered the similarities and differences in the contractual management fee schedules of the Fund and these similarly-managed accounts and/or funds, taking into account the rationale for any differences in fee schedules. The Board also took into account explanations provided by New York Life Investments about the more extensive scope of services provided to registered investment companies, such as the Fund, as compared with other investment advisory clients. Additionally, the Board considered the impact of contractual breakpoints, voluntary waivers and expense limitation arrangements on the Fund’s net management fee and expenses. The Board also considered that in proposing fees for the Fund, New York Life Investments considers the competitive marketplace for mutual funds.
The Board noted that, outside of the Fund’s management fee and the fees charged under a share class’s Rule 12b-1 and/or shareholder services plans, a share class’s most significant “other expenses” are transfer agent fees. Transfer agent fees are charged to the Fund based on the
number of shareholder accounts (a “per-account” fee). The Board took into account information from New York Life Investments regarding the reasonableness of the Fund’s transfer agent fee schedule, including industry data demonstrating that the per-account fees that NYLIM Service Company LLC, an affiliate of New York Life Investments and the Fund’s transfer agent, charges the Fund are within the range of per-account fees charged by transfer agents to other mutual funds. In addition, the Board considered NYLIM Service Company LLC’s profitability in connection with the transfer agent services it provides to the Fund. The Board also took into account information received from NYLIM Service Company LLC regarding the sub-transfer agency payments it made to intermediaries in connection with the provision of sub-transfer agency services to the Fund.
The Board considered that, because the Fund’s transfer agent fees are billed on a per-account basis, the impact of transfer agent fees on a share class’s expense ratio may be more significant in cases where the share class has a high number of small accounts. The Board considered the extent to which transfer agent fees comprised total expenses of the Fund. The Board acknowledged the role that the MainStay Group of Funds historically has played in serving the investment needs of New York Life Insurance Company customers, who often maintain smaller account balances than other shareholders of funds, and the impact of small accounts on the expense ratios of Fund share classes. The Board also recognized measures that it and New York Life Investments have taken to mitigate the effect of small accounts on the expense ratios of Fund share classes, including through the imposition of an expense limitation on net transfer agency expenses. The Board noted that, for purposes of allocating transfer agency fees and expenses, each retail fund in the MainStay Group of Funds combines the shareholder accounts of its Class A, A2, I, R1, R2 and R3 shares (as applicable) into one group and the shareholder accounts of its Investor Class, SIMPLE Class and Class B, C and C2 shares (as applicable) into another group. The Board also noted that the per-account fees attributable to each group of share classes is then allocated among the constituent share classes based on relative net assets and that a MainStay Fund’s Class R6 shares, if any, are not combined with any other share class for this purpose. The Board considered New York Life Investments’ rationale with respect to these groupings and previously received a report from an independent consultant engaged to conduct comparative analysis of these groupings. The Board also considered that NYLIM Service Company LLC had waived its contractual cost of living adjustments during the past seven years.
Based on the factors outlined above, the Board concluded that the Fund’s management fee and total ordinary operating expenses were within a range that is competitive and support a conclusion that these fees and expenses are reasonable.
Economies of Scale
The Board considered information regarding economies of scale, including whether the Fund’s expense structure permits economies of scale to be appropriately shared with the Fund’s shareholders. The Board also considered a report from New York Life Investments, previously
Board Consideration and Approval of Management Agreement and Subadvisory Agreements (Unaudited) (continued)
prepared at the request of the Board, that addressed economies of scale, including with respect to the mutual fund business generally and the various ways in which the benefits of economies of scale may be shared with the funds in the MainStay Group of Funds. Although the Board recognized the difficulty of determining economies of scale with precision, the Board acknowledged that economies of scale may be shared with the Fund in a number of ways, including, for example, through the imposition of management fee breakpoints, initially setting management fee rates at scale or making additional investments to enhance services. The Board reviewed information from New York Life Investments showing how the Fund’s management fee schedule compared to fee schedules of other funds and accounts managed by New York Life Investments. The Board also reviewed information from Strategic Insight showing how the Fund’s management fee schedule compared with fees paid for similar services by peer funds at varying asset levels.
Based on this information, the Board concluded that economies of scale are appropriately reflected for the benefit of the Fund’s shareholders through the Fund’s expense structure and other methods to share benefits from economies of scale.
Conclusion
On the basis of the information and factors summarized above, among other information and factors deemed relevant by the Trustees, and the evaluation thereof, the Board, including the Independent Trustees voting separately, unanimously voted to approve the continuation of each of the Advisory Agreements.
Board consideration and Approval of Subadvisory Agreement with Wellington Management Company LLP (Unaudited)
The Subadvisory Agreement between New York Life Investment Management LLC (“New York Life Investments”) and Wellington Management Company LLP (“Wellington”) with respect to the MainStay Balanced Fund (“Fund”) (“New Subadvisory Agreement”), must be approved initially and, following an initial term of up to two years, is subject to annual review and approval by the Board of Trustees of MainStay Funds Trust (“Board” of the “Trust”) in accordance with Section 15 of the Investment Company Act of 1940, as amended (“1940 Act”). At its February 3, 2021 meeting, the Board, including the Trustees who are not an “interested person” (as such term is defined in the 1940 Act) of the Trust (“Independent Trustees”) voting separately, unanimously approved the New Subadvisory Agreement for an initial two-year period.
At meetings held on January 21, January 25 and February 3, 2021, the Board considered and approved New York Life Investments’ recommendations to appoint Wellington as a subadvisor to the Fund, to approve the New Subadvisory Agreement, to approve the related changes to the Fund’s principal investment strategies and investment process and to approve a reduction of the contractual management fee for the Fund (the “Repositioning”), all effective on or about March 5, 2021. The Board noted that the material terms of the New Subadvisory Agreement are substantially identical to the terms of the then-current subadvisory agreement with MacKay Shields LLC (“MacKay”) with respect to the Fund, but that the subadvisory fee schedule under the New Subadvisory Agreement with Wellington includes fees that are lower at every level of assets than the subadvisory fees paid to MacKay under the then-current subadvisory agreement.
In reaching the decisions to approve the Repositioning and New Subadvisory Agreement, the Board considered information furnished by New York Life Investments and Wellington in connection with meetings of the Board and its Contracts, Investment and Risk and Compliance Oversight Committees held on January 21, January 25 and February 3, 2021, as well as other information furnished to the Board and its Committees throughout the year, as deemed relevant by the Trustees. The Board also considered information on the fees charged to other investment advisory clients of Wellington that follow investment strategies similar to those proposed for the Fund, as repositioned, and, when applicable, the rationale for any differences in the Fund’s proposed subadvisory fee and the fees charged to those other investment advisory clients. In addition, the Board considered information previously provided to the Board in connection with its review of the subadvisory agreements for other funds in the MainStay Group of Funds, as deemed relevant to each Trustee. The Board also considered information furnished by Wellington in response to requests prepared on behalf of the Board, and in consultation with the Independent Trustees, by independent legal counsel to the Independent Trustees, which encompassed a variety of topics, including those summarized below.
The Board took into account information provided in connection with its meetings throughout the year, including, among other items, information regarding the legal standards and fiduciary obligations applicable to its consideration of the New Subadvisory Agreement and investment performance reports on the Fund as well as presentations from New York
Life Investments and Wellington personnel. The contract review process, including the structure and format for materials provided to the Board, has been developed in consultation with the Board. The Independent Trustees also met in executive sessions with their independent legal counsel and, for a portion thereof, with senior management of New York Life Investments.
In considering the Repositioning and the New Subadvisory Agreement, the Trustees reviewed and evaluated the information and factors they believed to reasonably be necessary and appropriate in light of legal advice furnished to them by independent legal counsel and through the exercise of their own business judgment. Although individual Trustees may have weighed certain factors or information differently, the factors considered by the Board are described in greater detail below and include, among other factors: (i) the nature, extent and quality of the services to be provided to the Fund by Wellington; (ii) the investment performance of the Fund, the qualifications of the proposed portfolio managers of the Fund and the historical investment performance of products managed by such portfolio managers with investment strategies similar to those of the Fund, as repositioned; (iii) the anticipated costs of the services to be provided, and profits expected to be realized, by Wellington from its relationship with the Fund; (iv) the extent to which economies of scale may be realized if the Fund grows and the extent to which economies of scale may benefit the Fund’s shareholders; and (v) the reasonableness of the Fund’s proposed subadvisory fee to be paid by New York Life Investments to Wellington and estimated total ordinary operating expenses. Although the Board recognized that comparisons between the Fund’s proposed fees and estimated expenses and those of other funds are imprecise given different terms of agreements, variations in fund strategies and other factors, the Board considered the reasonableness of the Fund’s proposed fees and estimated total ordinary operating expenses as compared to the peer funds identified by New York Life Investments.
Although individual Trustees may have weighed certain factors or information differently, the Board’s decisions to approve the Repositioning and the New Subadvisory Agreement were based on a consideration of the information provided to the Trustees throughout the year, such as presentations from Wellington personnel, as well as information furnished specifically in connection with the contract review process for the Fund, in each case as deemed relevant to each Trustee. The Trustees noted that, throughout the year, the Trustees would be afforded an opportunity to ask questions of, and request additional information or materials from, New York Life Investments and Wellington with respect to the Fund. The Board took note of New York Life Investments’ belief that Wellington, with its resources and historical investment performance track record for strategies similar to those of the Fund, as repositioned, is well qualified to serve as a subadvisor to the Fund. In addition to considering the above-referenced factors, the Board observed that in the marketplace there are a range of investment options available to the Fund’s shareholders and such shareholders, having had the opportunity to consider other investment options, have chosen to invest in the Fund.
Board consideration and Approval of Subadvisory Agreement with Wellington Management Company LLP (Unaudited) (continued)
The factors that figured prominently in the Board’s decisions to approve the Repositioning and the New Subadvisory Agreement are summarized in more detail below, and the Board did not consider any factor or information controlling in reaching such decisions.
Nature, Extent and Quality of Services to be Provided by Wellington.
In considering the Repositioning and the New Subadvisory Agreement, the Board considered New York Life Investments’ responsibilities as manager of the Fund, noting that New York Life Investments is responsible for supervising the Fund’s subadvisors. The Board examined the nature, extent and quality of the investment advisory services that Wellington proposed to provide to the Fund. Further, the Board evaluated and/or examined the following with regard to Wellington:
| • | experience in providing investment advisory services; |
| • | experience in serving as advisor or subadvisor to other funds with similar strategies as those of the Fund, as repositioned, and the performance track record of those funds; |
| • | experience of investment advisory, senior management and administrative personnel; |
| • | overall legal and compliance environment, resources and history and policies and procedures in place with respect to matters that may involve conflicts of interest between the Fund’s investments and those of other accounts managed by Wellington; |
| • | New York Life Investments’ and Wellington’s belief that their respective compliance policies, procedures and systems are reasonably designed to prevent violation of the federal securities laws and their commitment to further developing and strengthening compliance programs relating to the MainStay Group of Funds generally and the Fund specifically; |
| • | ability to attract and retain qualified investment professionals and willingness to invest in personnel to service and support the Fund; |
| • | portfolio construction and risk management processes; |
| • | experience of the Fund’s proposed portfolio managers, including with respect to investment strategies similar to those of the Fund, the number of accounts managed by the portfolio managers and the method for compensating the portfolio managers; and |
| • | overall reputation, financial condition and assets under management. |
Based on these considerations, the Board concluded that the Fund would likely benefit from the nature, extent and quality of the proposed investment advisory services to be provided by Wellington.
Investment Performance
In evaluating the Fund’s investment performance, the Board considered investment performance results over various periods in light of the Fund’s investment objective, strategies and risks. The Board considered investment reports on, and analysis of, the Fund’s performance provided
to the Board throughout the year. These reports include, among other items, information on the Fund’s gross and net returns, the Fund’s investment performance compared to relevant investment categories and the Fund’s benchmarks, the Fund’s risk-adjusted investment performance and the Fund’s investment performance as compared to peer funds, as appropriate, as well as portfolio attribution information and commentary on the effect of market conditions.
The Board also gave weight to its discussions with senior management at New York Life Investments concerning the Fund’s investment performance and remediation efforts undertaken by New York Life Investments, and other alternatives to the Repositioning, and the New Subadvisory Agreement considered by New York Life Investments. In addition, the Board considered steps taken to seek to improve the Fund’s investment performance and discussions between the Fund’s current portfolio management team and the Investment Committee of the Board. The Board further considered that shareholders may benefit from Wellington’s investment process, including its portfolio construction and risk management processes. The Board noted that the Repositioning had not yet been implemented so an investment performance track record for the Fund, as repositioned, was not available.
The Board evaluated the Fund’s proposed portfolio management team, investment process, strategies and risks. The Board noted that Wellington currently manages one or more portfolios with investment strategies similar to those of the Fund, as repositioned. Additionally, the Board considered the historical performance of such portfolio or portfolios and other portfolios managed by the proposed portfolio managers for the Fund. Based on these considerations, the Board concluded that the Fund was likely to be managed responsibly and capably by Wellington.
Based on these considerations, the Board concluded that the selection of Wellington as a subadvisor to the Fund is likely to benefit the Fund’s long-term investment performance.
Costs of the Services to be Provided, and Profits to be Realized, by Wellington
The Board considered the anticipated costs of the services to be provided by Wellington under the New Subadvisory Agreement and the profits expected to be realized by Wellington due to its relationship with the Fund. The Board considered that Wellington’s subadvisory fee had been negotiated at arm’s-length by New York Life Investments and that these fees would be paid by New York Life Investments, not the Fund.
In evaluating the anticipated costs of the services to be provided by Wellington and profits expected to be realized by Wellington, the Board considered, among other factors, Wellington’s investments in, or willingness to invest in, personnel, systems, equipment and other resources and infrastructure to support and further enhance the services proposed to be provided to the Fund, and that New York Life Investments would be responsible for paying the subadvisory fee to Wellington. The Board also considered the financial resources of Wellington and acknowledged that Wellington must be in a position to attract and retain experienced professional personnel and to maintain a strong financial
position for Wellington to be able to provide high-quality services to the Fund. The Board also considered that New York Life Investments proposed to reduce the contractual management fee for the Fund.
In considering anticipated costs and profitability, the Board also considered certain fall-out benefits that may be realized by Wellington due to its relationship with the Fund, including reputational and other indirect benefits. The Board recognized, for example, the potential benefits to Wellington from legally permitted “soft-dollar” arrangements by which brokers would provide research and other services to Wellington in exchange for commissions paid by the Fund with respect to trades in the Fund’s portfolio securities. In addition, the Board also requested and received information from New York Life Investments concerning other material business relationships between Wellington and its affiliates and New York Life Investments and its affiliates, and considered the existence of a strategic partnership between New York Life Investments and Wellington that relates to certain current and future products that represented a conflict of interest associated with New York Life Investments’ recommendation to approve the Repositioning and the New Subadvisory Agreement.
The Board took into account the fact that the Fund would undergo changes to its principal investment strategies in connection with the Repositioning. The Board noted estimates from New York Life Investments and Wellington that a significant portion of the holdings of the Fund would be sold to align the Fund’s holdings with the strategies that would be pursued by Wellington. Additionally, the Board considered New York Life Investments’ representation that New York Life Investments would work closely with Wellington to seek to execute the optimal transition strategy and that New York Life Investments would make every effort to minimize potential direct and indirect costs associated with the Repositioning.
The Board considered that any profits realized by Wellington due to its relationship with the Fund would be the result of arm’s-length negotiations between New York Life Investments and Wellington, acknowledging that any such profits would be based on fees paid to Wellington by New York Life Investments, not the Fund.
Subadvisory Fee and Estimated Total Ordinary Operating Expenses.
The Board evaluated the reasonableness of the fee to be paid under the New Subadvisory Agreement and the Fund’s estimated total ordinary operating expenses. The Board primarily considered the reasonableness of the management fee to be paid by the Fund to New York Life Investments because the subadvisory fee to be paid to Wellington would be paid by New York Life Investments, not the Fund. The Board also considered the reasonableness of the subadvisory fee to be paid by New York Life Investments and the amount of the management fee expected to be retained by New York Life Investments.
In assessing the reasonableness of the Fund’s proposed fees and estimated expenses, the Board considered information provided by New York Life Investments on fees and expenses of peer funds, and the Board considered information provided by Wellington on fees charged to other
investment advisory clients, including institutional separate accounts and/or other funds that follow investment strategies similar to those of the Fund, as repositioned. The Board considered the similarities and differences in the contractual fee schedules of the Fund and these similarly-managed accounts and/or funds, taking into account the rationale for any differences in fee schedules and noted that New York Life Investments proposed to reduce the Fund’s contractual management fee. The Board also considered that in proposing fees for the Fund, New York Life Investments considers the competitive marketplace for mutual funds.
Based on the factors outlined above, the Board concluded that the Fund’s management fee and total ordinary operating expenses were within a range that is competitive and support a conclusion that these fees and expenses are reasonable.
Economies of Scale
The Board considered information regarding economies of scale, including whether the Fund’s proposed expense structure would permit economies of scale to be appropriately shared with the Fund’s shareholders. The Board also considered a report from New York Life Investments, previously prepared at the request of the Board, that addressed economies of scale, including with respect to the mutual fund business generally and the various ways in which the benefits of economies of scale may be shared with the funds in the MainStay Group of Funds. Although the Board recognized the difficulty of determining economies of scale with precision, the Board acknowledged that economies of scale may be shared with the Fund in a number of ways, including, for example, through the imposition of fee breakpoints, initially setting management fee rates at scale or making additional investments to enhance services.
Based on this information, the Board concluded that economies of scale are appropriately reflected for the benefit of the Fund’s shareholders through the Fund’s proposed expense structure and other methods to share benefits from economies of scale.
Conclusion
On the basis of the information and factors summarized above, among other information and factors deemed relevant by the Trustees, and the evaluation thereof, the Board, including the Independent Trustees voting separately, unanimously voted to approve the Repositioning and the New Subadvisory Agreement.
Discussion of the Operation and Effectiveness of the Fund's Liquidity Risk Management Program (Unaudited)
In compliance with Rule 22e-4 under the Investment Company Act of 1940, as amended (the “Liquidity Rule”), the Fund has adopted and implemented a liquidity risk management program (the “Program”), which New York Life Investment Management LLC believes is reasonably designed to assess and manage the Fund's liquidity risk (the risk that the Fund could not meet requests to redeem shares issued by the Fund without significant dilution of remaining investors’ interests in the Fund). The Board of Trustees of MainStay Funds Trust (the "Board") designated New York Life Investment Management LLC as administrator of the Program (the “Administrator”). The Administrator has established a Liquidity Risk Management Committee to assist the Administrator in the implementation and day-to-day administration of the Program and to otherwise support the Administrator in fulfilling its responsibilities under the Program.
At a meeting of the Board held on March 8, 2021, the Administrator provided the Board with a written report addressing the Program’s operation and assessing its adequacy and effectiveness of implementation for the period from January 1, 2020 through December 31, 2020 (the "Review Period"), as required under the Liquidity Rule. The report noted that the Administrator concluded that (i) the Program operated effectively to assess and manage the Fund's liquidity risk, (ii) the Program has been adequately and effectively implemented to monitor and, as applicable, respond to the Fund's liquidity developments and (iii) the Fund's investment strategy continues to be appropriate for an open-end fund. In addition, the report discussed notable events that impacted liquidity risk during the Review Period, including the COVID-19 pandemic and the resulting economic shutdown.
In accordance with the Program, the Fund's liquidity risk is assessed no less frequently than annually taking into consideration certain factors, as applicable, such as (i) investment strategy and liquidity of portfolio investments, (ii) short-term and long-term cash flow projections and (iii) holdings of cash and cash equivalents, as well as borrowing arrangements and other funding sources. Certain factors are considered under both normal and reasonably foreseeable stressed conditions.
Each Fund portfolio investment is classified into one of four liquidity categories. The classification is based on a determination of the number of days it is reasonably expected to take to convert the investment into cash, or sell or dispose of the investment, in current market conditions without significantly changing the market value of the investment. The Administrator has delegated liquidity classification determinations to the Fund’s subadvisors, subject to appropriate oversight by the Administrator, and classification determinations are made by taking into account the Fund's reasonably anticipated trade size, various market, trading and investment-specific considerations, as well as market depth, and, in certain cases, third-party vendor data.
The Liquidity Rule requires funds that do not primarily hold assets that are highly liquid investments to adopt a minimum amount of net assets that must be invested in highly liquid investments that are assets (an “HLIM”). In addition, the Liquidity Rule limits a fund's investments in illiquid investments. Specifically, the Liquidity Rule prohibits acquisition of illiquid investments if doing so would result in a fund holding more than 15% of its net assets in illiquid investments that are assets. The Program includes provisions reasonably designed to determine, periodically review and comply with the HLIM requirement, as applicable, and to comply with the 15% limit on illiquid investments.
There can be no assurance that the Program will achieve its objectives under all circumstances in the future. Please refer to the Fund's prospectus for more information regarding the Fund's exposure to liquidity risk and other risks to which it may be subject.
Proxy Voting Record
The Fund is required to file with the Securities and Exchange Commissions's ("SEC") its proxy voting records for the 12-month period ending June 30 on Form N-PX. The most recent Form N-PX or proxy voting record is available free of charge upon request by calling 800-624-6782; visiting the MainStay Funds’ website at newyorklifeinvestments.com; or visiting the SEC’s website at www.sec.gov.
Shareholder Reports and Quarterly Portfolio Disclosure
The Fund is required to file its complete schedule of portfolio holdings with the SEC 60 days after its first and third fiscal quarter on Form N-PORT. The Fund's holdings report is available free of charge upon request by calling New York Life Investments at 800-624-6782.
This page intentionally left blank.
This page intentionally left blank.
This page intentionally left blank.
Equity
U.S. Equity
MainStay Epoch U.S. Equity Yield Fund
MainStay MacKay S&P 500 Index Fund
MainStay Winslow Large Cap Growth Fund
MainStay WMC Enduring Capital Fund
MainStay WMC Growth Fund
MainStay WMC Small Companies Fund
MainStay WMC Value Fund
International Equity
MainStay Epoch International Choice Fund
MainStay MacKay International Equity Fund
MainStay WMC International Research Equity Fund
Emerging Markets Equity
MainStay Candriam Emerging Markets Equity Fund
Global Equity
MainStay Epoch Capital Growth Fund
MainStay Epoch Global Equity Yield Fund
Fixed Income
Taxable Income
MainStay Candriam Emerging Markets Debt Fund
MainStay Floating Rate Fund
MainStay MacKay High Yield Corporate Bond Fund
MainStay MacKay Short Duration High Yield Fund
MainStay MacKay Strategic Bond Fund
MainStay MacKay Total Return Bond Fund
MainStay MacKay U.S. Infrastructure Bond Fund
MainStay Short Term Bond Fund
Tax-Exempt Income
MainStay MacKay California Tax Free Opportunities Fund1
MainStay MacKay High Yield Municipal Bond Fund
MainStay MacKay Intermediate Tax Free Bond Fund
MainStay MacKay New York Tax Free Opportunities Fund2
MainStay MacKay Short Term Municipal Fund
MainStay MacKay Tax Free Bond Fund
Money Market
MainStay Money Market Fund
Mixed Asset
MainStay Balanced Fund
MainStay Income Builder Fund
MainStay MacKay Convertible Fund
Speciality
MainStay CBRE Global Infrastructure Fund
MainStay CBRE Real Estate Fund
MainStay Cushing MLP Premier Fund
Asset Allocation
MainStay Conservative Allocation Fund
MainStay Conservative ETF Allocation Fund
MainStay Defensive ETF Allocation Fund
MainStay Equity Allocation Fund
MainStay Equity ETF Allocation Fund
MainStay Growth Allocation Fund
MainStay Growth ETF Allocation Fund
MainStay Moderate Allocation Fund
MainStay Moderate ETF Allocation Fund
Manager
New York Life Investment Management LLC
New York, New York
Subadvisors
Candriam Belgium S.A.3
Brussels, Belgium
Candriam Luxembourg S.C.A.3
Strassen, Luxembourg
CBRE Clarion Securities LLC
Radnor, Pennsylvania
Cushing Asset Management, LP
Dallas, Texas
Epoch Investment Partners, Inc.
New York, New York
MacKay Shields LLC3
New York, New York
NYL Investors LLC3
New York, New York
Wellington Management Company LLP
Boston, Massachusetts
Winslow Capital Management, LLC
Minneapolis, Minnesota
Legal Counsel
Dechert LLP
Washington, District of Columbia
Independent Registered Public Accounting Firm
KPMG LLP
Philadelphia, Pennsylvania
Distributor
NYLIFE Distributors LLC3
Jersey City, New Jersey
Custodian
JPMorgan Chase Bank, N.A.
New York, New York
1.
This Fund is registered for sale in AZ, CA, NV, OR, TX, UT, WA and MI (Class A and I shares only), and CO, FL, GA, HI, ID, MA, MD, NH, NJ and NY (Class I shares only).
| 2. | This Fund is registered for sale in CA, CT, DE, FL, MA, NJ, NY and VT. |
| 3. | An affiliate of New York Life Investment Management LLC. |
Not part of the Semiannual Report
For more information
800-624-6782
newyorklifeinvestments.com
“New York Life Investments” is both a service mark, and the common trade name, of certain investment advisors affiliated with New York Life Insurance Company. The MainStay Funds® are managed by New York Life Investment Management LLC and distributed by NYLIFE Distributors LLC, 30 Hudson Street, Jersey City, NJ 07302, a wholly owned subsidiary of New York Life Insurance Company. NYLIFE Distributors LLC is a Member FINRA/SIPC.
©2021 NYLIFE Distributors LLC. All rights reserved.
| 1737577MS071-21 | MSBL10-06/21 |
(NYLIM) NL231
MainStay Candriam Emerging Markets Equity Fund
Message from the President and Semiannual Report
Unaudited | April 30, 2021
Sign up for e-delivery of your shareholder reports. For full details on e-delivery, including who can participate and what you can receive via e-delivery,
please log in to newyorklifeinvestments.com/accounts.
| Not FDIC/NCUA Insured | Not a Deposit | May Lose Value | No Bank Guarantee | Not Insured by Any Government Agency |
This page intentionally left blank
Message from the President
With the approval of COVID-19 vaccines and the passage of relief packages by the U.S. Congress, economic prospects improved during the reporting period, and investor risk appetite increased, benefiting both equities and fixed-income markets. Despite some volatility stemming from a sell-off in longer-dated Treasury securities, the stock market and higher-risk segments of the fixed-income market posted gains for the six months ended April 30, 2021.
By the beginning of the reporting period, the economy had made tremendous progress from the second quarter of 2020, when economic activity plunged. But uncertainty about when vaccines would be available and how quickly they could be administered left investors unsure about the economic outlook.
With the approval of several vaccines in November, the outlook brightened and investors became less risk-averse. Anticipating the likely end of the pandemic and a continuation of the economic recovery, they began to see opportunities in investment-grade and high-yield bonds and more cyclical segments of the stock market. The $900 billion relief and stimulus package passed in December provided further assurance.
In January, the Federal Reserve opted to leave interest rates unchanged, pointing to some uncertainty about the pace of the global recovery. Officials also noted that inflation remained low, citing oil prices in particular.
In March, President Biden signed the $1.9 billion American Rescue Plan, which, among other provisions, called for payments of $1,400 for those earning less than $75,000 per year, plus $1,400 per dependent. This, combined with the Federal Reserve’s new tolerance for inflation and an anticipated $2 trillion infrastructure spending bill, added to growing concerns about higher prices. Supply shortages in some markets caused some prices to soar, heightening concerns further.
In fixed-income markets, an improving economic outlook and rising inflation expectations led to a sell-off in longer-term Treasuries, with the result that the yield on the 10-year note rose sharply, particularly in February and March. Investment grade corporate bonds were also affected. Early in the reporting period, they performed well as investors shifted out of Treasuries, but as the reporting period progressed, they faltered. Longer-dated securities issued in recent years at historically low interest rates became especially unattractive.
High-yield bonds remained steady, supported by more favorable yields and an improved economic outlook, which reduced their perceived risk. Municipal bonds produced modest gains, and
although the sell-off in Treasuries produced some volatility early in 2021, stronger-than-expected tax revenues, $350 billion in financial support from the federal government, and the possibility of an increase in federal income tax rates appeared to buoy the market late in the reporting period.
Inflation concerns and volatility in the Treasury market led to a shift in equities markets. Although the S&P 500® Index, a widely followed measure of U.S. equities, posted double-digit gains and hit a record high, the rise of Treasury yields disrupted valuations, especially those of growth stocks. Technology companies that saw their valuations soar amid the work-from-home trend in 2020 suffered large declines.
But the fiscal stimulus and continued accommodation from the Federal Reserve gave investors confidence the economic recovery would continue. Combined with the sky-high valuations in technology and growth stocks, this increased the appeal of more cyclical and value-oriented shares. As a result, value stocks outperformed growth stocks during the reporting period.
Reflecting the shift in investor sentiment, the performance of S&P 500® Index sectors varied widely. While the information technology sector kept up with the broader market, it lagged cyclical sectors such as energy and financials, which led the way. The shift was further reflected in the performance of small-cap stocks, which outperformed large caps. While developed markets kept pace with the U.S. market, lagging economic and pandemic recoveries appeared to weigh on emerging markets late in the reporting period.
With the lockdown restrictions lifting in the U.S. and the pandemic easing in many regions, we at New York Life Investments are looking forward to a return to a more normal economy. We anticipate that over the next several years, a variety of trends will likely offer long-term investors many attractive opportunities. With this in mind, we continue to develop products and services to help you to take advantage of these trends, manage your risks, and ultimately meet your investment goals.
Sincerely,
Kirk C. Lehneis
President
The opinions expressed are as of the date of this report and are subject to change. There is no guarantee that any forecast made will come to pass. This material does not constitute investment advice and is not intended as an endorsement of any specific investment. Past performance is no guarantee of future results.
Not part of the Semiannual Report
Investors should refer to the Fund’s Summary Prospectus and/or Prospectus and consider the Fund’s investment objectives, strategies, risks, charges and expenses carefully before investing. The Summary Prospectus and/or Prospectus contain this and other information about the Fund. You may obtain copies of the Fund’s Summary Prospectus, Prospectus and Statement of Additional Information free of charge, upon request, by calling toll-free 800-624-6782, by writing to NYLIFE Distributors LLC, Attn: MainStay Marketing Department, 30 Hudson Street, Jersey City, NJ 07302 or by sending an e-mail to MainStayShareholderServices@nylim.com. These documents are also available via the MainStay Funds’ website at newyorklifeinvestments.com. Please read the Fund’s Summary Prospectus and/or Prospectus carefully before investing.
Investment and Performance Comparison (Unaudited)
Performance data quoted represents past performance. Past performance is no guarantee of future results. Because of market volatility and other factors, current performance may be lower or higher than the figures shown. Investment return and principal value will fluctuate, and as a result, when shares are redeemed, they may be worth more or less than their original cost. The graph below depicts the historical performance of Class I shares of the Fund. Performance will vary from class to class based on differences in class-specific expenses and sales charges. For performance information current to the most recent month-end, please call 800-624-6782 or visit newyorklifeinvestments.com.
The performance table and graph do not reflect the deduction of taxes that a shareholder would pay on distributions or Fund share redemptions. Total returns reflect maximum applicable sales charges as indicated in the table below, if any, changes in share price, and reinvestment of dividend and capital gain distributions. The graph assumes the initial investment amount shown below and reflects the deduction of all sales charges that would have applied for the period of investment. Performance figures may reflect certain fee waivers and/or expense limitations, without which total returns may have been lower. For more information on share classes and current fee waivers and/or expense limitations (if any), please refer to the Notes to Financial Statements.
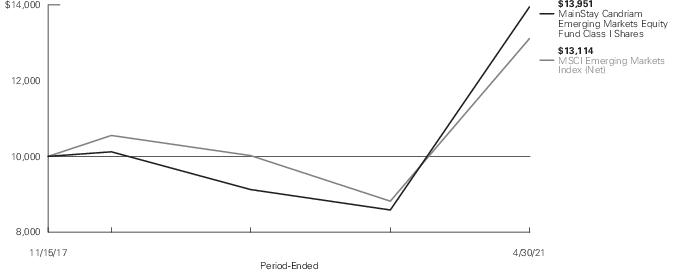
| Average Annual Total Returns for the Period-Ended April 30, 2021 |
| Class | Sales Charge | | Inception
Date | Six
Months | One
Year | Since
Inception | Gross
Expense
Ratio1 |
| Class A Shares | Maximum 5.5% Initial Sales Charge | With sales charges | 11/15/2017 | 19.31% | 53.05% | 7.95% | 2.00% |
| | | Excluding sales charges | | 26.26 | 61.96 | 9.73 | 2.00 |
| Investor Class Shares2 | Maximum 5% Initial Sales Charge | With sales charges | 11/15/2017 | 19.95 | 52.92 | 7.84 | 2.03 |
| | | Excluding sales charges | | 26.26 | 61.82 | 9.61 | 2.03 |
| Class C Shares | Maximum 1% CDSC | With sales charges | 11/15/2017 | 24.88 | 59.75 | 8.82 | 2.78 |
| | if Redeemed Within One Year of Purchase | Excluding sales charges | | 25.88 | 60.75 | 8.82 | 2.78 |
| Class I Shares | No Sales Charge | | 11/15/2017 | 26.59 | 62.50 | 10.11 | 1.79 |
| Class R6 Shares | No Sales Charge | | 11/15/2017 | 26.53 | 62.48 | 10.14 | 1.53 |
| 1. | The gross expense ratios presented reflect the Fund’s “Total Annual Fund Operating Expenses” from the most recent Prospectus, as supplemented, and may differ from other expense ratios disclosed in this report. |
| 2. | Prior to June 30, 2020, the maximum initial sales charge was 5.5%, which is reflected in the average annual total return figures shown. |
The footnotes on the next page are an integral part of the table and graph and should be carefully read in conjunction with them.
| Benchmark Performance | Six
Months | One
Year | Since
Inception |
| MSCI Emerging Markets Index (Net)1 | 22.95% | 48.71% | 8.16% |
| Morningstar Diversified Emerging Markets Category Average2 | 24.61 | 51.20 | 7.77 |
| 1. | The MSCI Emerging Markets Index (Net) is the Fund’s primary broad-based securities market index for comparison purposes. The MSCI Emerging Markets Index (Net) is a free float-adjusted market capitalization index that is designed to measure equity market performance in the global emerging markets. Results assume reinvestment of all dividends and capital gains. An investment cannot be made directly in an index. |
| 2. | The Morningstar Diversified Emerging Markets Category Average is representative of funds that tend to divide their assets among 20 or more nations, although they tend to focus on the emerging markets of Asia and Latin America rather than on those of the Middle East, Africa, or Europe. These portfolios invest predominantly in emerging market equities, but some funds also invest in both equities and fixed income investments from emerging markets. Results are based on average total returns of similar funds with all dividends and capital gain distributions reinvested. |
The footnotes on the preceding page are an integral part of the table and graph and should be carefully read in conjunction with them.
| 6 | MainStay Candriam Emerging Markets Equity Fund |
Cost in Dollars of a $1,000 Investment in MainStay Candriam Emerging Markets Equity Fund (Unaudited)
The example below is intended to describe the fees and expenses borne by shareholders during the six-month period from November 1, 2020, to April 30, 2021, and the impact of those costs on your investment.
Example
As a shareholder of the Fund you incur two types of costs: (1) transaction costs, including exchange fees and sales charges (loads) on purchases (as applicable), and (2) ongoing costs, including management fees, distribution and/or service (12b-1) fees, and other Fund expenses (as applicable). This example is intended to help you understand your ongoing costs (in dollars) of investing in the Fund and to compare these costs with the ongoing costs of investing in other mutual funds. The example is based on an investment of $1,000 made at the beginning of the six-month period and held for the entire period from November 1, 2020, to April 30, 2021.
This example illustrates your Fund’s ongoing costs in two ways:
Actual Expenses
The second and third data columns in the table below provide information about actual account values and actual expenses. You may use the information in these columns, together with the amount you invested, to estimate the expenses that you paid during the six months ended April 30, 2021. Simply divide your account value by $1,000 (for example, an
$8,600 account value divided by $1,000 = 8.6), then multiply the result by the number under the heading entitled “Expenses Paid During Period” to estimate the expenses you paid on your account during this period.
Hypothetical Example for Comparison Purposes
The fourth and fifth data columns in the table below provide information about hypothetical account values and hypothetical expenses based on the Fund’s actual expense ratio and an assumed rate of return of 5% per year before expenses, which is not the Fund’s actual return. The hypothetical account values and expenses may not be used to estimate the actual ending account balances or expenses you paid for the six-month period shown. You may use this information to compare the ongoing costs of investing in the Fund with the ongoing costs of investing in other mutual funds. To do so, compare this 5% hypothetical example with the 5% hypothetical examples that appear in the shareholder reports of the other mutual funds.
Please note that the expenses shown in the table are meant to highlight your ongoing costs only and do not reflect any transactional costs, such as exchange fees or sales charges (loads). Therefore, the fourth and fifth data columns of the table are useful in comparing ongoing costs only and will not help you determine the relative total costs of owning different funds. In addition, if these transactional costs were included, your costs would have been higher.
| Share Class | Beginning
Account
Value
11/1/20 | Ending Account
Value (Based
on Actual
Returns and
Expenses)
4/30/21 | Expenses
Paid
During
Period1 | Ending Account
Value (Based
on Hypothetical
5% Annualized
Return and
Actual Expenses)
4/30/21 | Expenses
Paid
During
Period1 | Net Expense
Ratio
During
Period2 |
| Class A Shares | $1,000.00 | $1,262.60 | $ 8.42 | $1,017.36 | $ 7.50 | 1.50% |
| Investor Class Shares | $1,000.00 | $1,262.60 | $ 8.70 | $1,017.11 | $ 7.75 | 1.55% |
| Class C Shares | $1,000.00 | $1,258.80 | $12.88 | $1,013.39 | $11.48 | 2.30% |
| Class I Shares | $1,000.00 | $1,265.90 | $ 6.24 | $1,019.29 | $ 5.56 | 1.11% |
| Class R6 Shares | $1,000.00 | $1,265.30 | $ 6.35 | $1,019.19 | $ 5.66 | 1.13% |
| 1. | Expenses are equal to the Fund’s annualized expense ratio of each class multiplied by the average account value over the period, divided by 365 and multiplied by 181 (to reflect the six-month period). The table above represents the actual expenses incurred during the six-month period. In addition to the fees and expenses which the Fund bears directly, it also indirectly bears a pro rata share of the fees and expenses of the underlying funds in which it invests. Such indirect expenses are not included in the above-reported expense figures. |
| 2. | Expenses are equal to the Fund's annualized expense ratio to reflect the six-month period. |
Country Composition as of April 30, 2021 (Unaudited)
| China | 39.1% |
| Republic of Korea | 14.0 |
| India | 11.9 |
| Taiwan | 11.4 |
| Brazil | 5.9 |
| South Africa | 3.5 |
| Russia | 2.5 |
| Mexico | 2.0 |
| Hong Kong | 1.8 |
| Thailand | 1.3 |
| Peru | 1.0% |
| Poland | 0.9 |
| Indonesia | 0.8 |
| Chile | 0.7 |
| Argentina | 0.4 |
| Canada | 0.3 |
| Turkey | 0.2 |
| Other Assets, Less Liabilities | 2.3 |
| | 100.0% |
See Portfolio of Investments beginning on page 11 for specific holdings within these categories. The Fund's holdings are subject to change.
Top Ten Holdings as of April 30, 2021 (excluding short-term investments) (Unaudited)
| 1. | Taiwan Semiconductor Manufacturing Co. Ltd. |
| 2. | Samsung Electronics Co. Ltd. |
| 3. | Tencent Holdings Ltd. |
| 4. | MediaTek, Inc. |
| 5. | Alibaba Group Holding Ltd., Sponsored ADR |
| 6. | Alibaba Group Holding Ltd. |
| 7. | Naspers Ltd., Class N |
| 8. | KB Financial Group, Inc. |
| 9. | China Construction Bank Corp., Class H |
| 10. | Meituan |
| 8 | MainStay Candriam Emerging Markets Equity Fund |
Portfolio Management Discussion and Analysis (Unaudited)
Questions answered by Jan Boudewijns, Philip Screve and Lamine Saidi of Candriam Belgium S.A., the Fund’s Subadvisor.1
How did MainStay Candriam Emerging Markets Equity Fund perform relative to its benchmark and peer group during the six months ended April 30, 2021?
For the six months ended April 30, 2021, Class I shares of MainStay Candriam Emerging Markets Equity Fund returned 26.59%, outperforming the 22.95% return of the Fund’s primary benchmark, the MSCI Emerging Markets Index (Net). Over the same period, Class I shares also outperformed the 24.61% return of the Morningstar Diversified Emerging Markets Category Average.2
What factors affected the Fund’s relative performance during the reporting period?
The reporting period proved volatile for global equities and even more so for emerging markets. With positive announcements on vaccines coinciding with fiscal and monetary stimulus, growth expectations started picking up, especially in the United States. This development quickly drove U.S. Treasury yields from near 1% to 1.70% levels toward the end of the reporting period. The rapid increase in yields was reflected in valuation pressures and volatility for longer duration equities. Rising yields and a strengthening U.S. dollar also muted the comparative performance of emerging market equities versus developed markets.
Sectors benefiting the most during the reporting period included materials, information technology and financials.
The Fund’s outperformance relative to the MSCI Emerging Markets Index (Net) during the reporting period was due almost entirely to favorable stock selection. Relative returns were bolstered by the Fund’s strategy of investing in higher quality, sustained growth companies in emerging markets, an approach that provided stability to returns. Actively adding exposure to companies positioned to benefit from reflation and post-pandemic economic reopenings further enhanced relative return. Allocation effects detracted slightly.
During the reporting period, which sectors and/or countries were the strongest positive contributors to the Fund’s relative performance and which sectors and/or countries were particularly weak?
At the sector level, the strongest positive contributors to performance relative to the MSCI Emerging Markets Index (Net) were consumer discretionary, financials and communication services. (Contributions take weightings and total returns into account.) In all three sectors, positive stock selection was the
main driver of the Fund’s relative outperformance. Underperforming stock selections in the energy sector detracted from relative returns.
At the country level, China provided the strongest positive contributions to relative returns, followed by India and Taiwan. The most significant detractors at the country level included Poland due to stock selection and Saudi Arabia, where we did not have any exposure and which performed strongly in response to rising energy prices.
During the reporting period, which individual stocks made the strongest positive contributions to the Fund’s absolute performance and which stocks detracted the most?
One of the strongest positive contributors to the Fund’s absolute performance was its position in Indian steel manufacturer JSW Steel Limited, which gained ground in response to a rally in steel prices. Another top performer, Russian financial services group TCS Group, benefited from expectations of a rising yield curve.3 Also worth mentioning is the strong performance of shares in Taiwanese semiconductor manufacturer MediaTek, which rose on strong demand from the 5G telecommunications roll out.
The most notable detractor from the Fund’s absolute performance was its position in Chinese e-commerce giant Alibaba, which came under pressure from anti-trust regulators in China and further suffered in an environment of rising yields resulting in valuation pressure. Another detractor during the reporting period was holdings in Chinese examination training company Offcn Education Technology due to regulatory challenges facing the company.
What were some of the Fund’s largest purchases and sales during the reporting period?
During the reporting period, the Fund added exposure in companies we deemed to be of high quality in the financials and materials sectors. In financials, notable purchases included shares in Mexican financial group Grupo Financiero Banorte, Brazilian bank Banco Santander and State Bank of India. In materials, added names included Mexican steel manufacturer Ternium, Chinese developer of semiconductor devices Will Semiconductor and Indian cement company Grasim Industries.
Some of these purchases were financed by partially reducing the Fund’s exposure to some long-duration equities and equities that had performed well in the past. Notable examples include Chinese e-commerce company JD.com, Chinese food delivery business
| 1. | Jan Boudewijns will serve as a portfolio manager for the Fund until on or about April 1, 2022. Effective May 24, 2021, Paulo Salazar was added as a portfolio manager for the Fund. |
| 2. | See page 5 for other share class returns, which may be higher or lower than Class I share returns. See page 6 for more information on benchmark and peer group returns. |
| 3. | The yield curve is a line that plots the yields of various securities of similar quality—typically U.S. Treasury issues—across a range of maturities. The U.S. Treasury yield curve serves as a benchmark for other debt and is used in economic forecasting. |
Meituan, Taiwanese semiconductor foundry TSMC and South Korean electronics and memory giant Samsung Electronics. The Fund sold its entire position in Chinese smartphone manufacturer Xiaomi as the company was put on the list of restricted investment entities by the U.S. Department of Defense.
How did the Fund’s sector and/or country weightings change during the reporting period?
During the reporting period, the Fund increased its overweight position in the financials sector and maintained overweight exposure to materials, both of which we expected to benefit from economies reopening and as part of the reflation trade. At the same time we reduced the Fund’s overweight exposure to information technology, consumer discretionary and industrials.
From a country perspective, the Fund saw a few changes. With economies re-opening, we selectively reduced the Fund’s underweight in countries like Mexico, Thailand, Indonesia and Turkey. In India, the Fund maintained its overweight position. After the strong performance of the South Korean market in 2020, the Fund reduced its overweight exposure.
How was the Fund positioned at the end of the reporting period?
As of April 30, 2021, the Fund continued to maintain overweight exposure relative to the MSCI Emerging Markets Index (Net) in the financials and materials sectors. Key overweight positions in financials included Korean bank KB Financial Group, Chinese commercial bank China Merchants Bank, Russian financial services company TCS Group Holding and Taiwanese diversified financial company Chailease Holding. Among materials, the most notably overweight position was in Indian steel manufacturer JSW Steel Limited. Other overweight positions included Taiwanese semiconductor manufacturer MediaTek and Brazilian sugar and ethanol producer Cosan.
As of the same date, the Fund held underweight positions in several names that had recorded strong gains in the prior period, including Chinese gaming company NetEase, South Korean social media company Naver and Chinese electric vehicle manufacturer Nio. As mentioned earlier, Chinese smartphone manufacturer Xiaomi Corp was excluded due to its inclusion on the U.S. sanction list. The Fund also held underweight positions in some of the benchmark’s largest names—such as TSMC, Chinese e-commerce giant Alibaba and Chinese social media and gaming giant Tencent—as individual holdings are capped at 5% due to risk diversification considerations.
The opinions expressed are those of the portfolio managers as of the date of this report and are subject to change. There is no guarantee that any forecasts will come to pass. This material does not constitute investment advice and is not intended as an endorsement of any specific investment.
| 10 | MainStay Candriam Emerging Markets Equity Fund |
Portfolio of Investments April 30, 2021† (Unaudited)
| | Shares | Value |
| Common Stocks 96.5% |
| Argentina 0.4% |
| MercadoLibre, Inc. (Internet & Direct Marketing Retail) (a) | 240 | $ 377,035 |
| Brazil 5.4% |
| Banco BTG Pactual SA (Capital Markets) | 29,000 | 575,243 |
| Banco Inter SA (Banks) | 16,000 | 682,468 |
| Banco Santander Brasil SA (Banks) | 154,000 | 1,092,335 |
| Cosan SA (Oil, Gas & Consumable Fuels) | 66,000 | 1,094,239 |
| Localiza Rent a Car SA (Road & Rail) | 32,000 | 378,789 |
| Notre Dame Intermedica Participacoes SA (Health Care Providers & Services) | 24,000 | 359,069 |
| Pagseguro Digital Ltd., Class A (IT Services) (a) | 5,600 | 256,144 |
| WEG SA (Electrical Equipment) | 54,000 | 348,034 |
| | | 4,786,321 |
| Canada 0.3% |
| Pan American Silver Corp. (Metals & Mining) | 7,400 | 235,468 |
| China 39.1% |
| Aier Eye Hospital Group Co. Ltd., Class A (Health Care Providers & Services) | 28,000 | 322,250 |
| Air China Ltd., Class H (Airlines) | 440,000 | 348,930 |
| Airtac International Group (Machinery) | 15,600 | 664,432 |
| Alibaba Group Holding Ltd. (Internet & Direct Marketing Retail) (a) | 57,000 | 1,651,057 |
| Alibaba Group Holding Ltd., Sponsored ADR ADR (Internet & Direct Marketing Retail) (a) | 7,200 | 1,662,840 |
| Alibaba Health Information Technology Ltd. (Health Care Technology) (a) | 100,000 | 305,108 |
| Baidu, Inc. Sponsored ADR (Interactive Media & Services) (a) | 3,900 | 820,287 |
| Bank of Ningbo Co. Ltd., Class A (Banks) | 100,000 | 652,554 |
| Bilibili, Inc. Sponsored ADR (Entertainment) (a) | 3,500 | 388,010 |
| CanSino Biologics, Inc., Class H (Pharmaceuticals) (a)(b)(c) | 8,000 | 400,631 |
| China Construction Bank Corp., Class H (Banks) | 1,880,000 | 1,488,462 |
| China Feihe Ltd. (Food Products) (b) | 138,000 | 393,512 |
| China Mengniu Dairy Co. Ltd. (Food Products) | 67,000 | 358,817 |
| China Merchants Bank Co. Ltd., Class H (Banks) | 168,000 | 1,354,987 |
| | Shares | Value |
| |
| China (continued) |
| China Molybdenum Co. Ltd., Class H (Metals & Mining) | 440,000 | $ 298,516 |
| China Petroleum & Chemical Corp., Class H (Oil, Gas & Consumable Fuels) | 1,200,000 | 597,857 |
| China Tourism Group Duty Free Corp. Ltd., Class A (Specialty Retail) | 9,600 | 462,814 |
| Chongqing Zhifei Biological Products Co. Ltd., Class A (Biotechnology) | 13,996 | 487,584 |
| CIFI Holdings Group Co. Ltd. (Real Estate Management & Development) | 522,000 | 467,046 |
| Contemporary Amperex Technology Co. Ltd., Class A (Electrical Equipment) | 9,000 | 539,833 |
| Country Garden Services Holdings Co. Ltd. (Commercial Services & Supplies) | 62,000 | 650,510 |
| East Money Information Co. Ltd., Class A (Capital Markets) | 63,099 | 314,349 |
| ENN Energy Holdings Ltd. (Gas Utilities) (c) | 31,000 | 528,390 |
| Focus Media Information Technology Co. Ltd., Class A (Media) | 200,997 | 334,814 |
| Geely Automobile Holdings Ltd. (Automobiles) | 142,000 | 368,356 |
| Haidilao International Holding Ltd. (Hotels, Restaurants & Leisure) (b)(c) | 42,000 | 272,241 |
| Hengli Petrochemical Co. Ltd., Class A (Chemicals) | 84,000 | 384,857 |
| JD.com, Inc. ADR (Internet & Direct Marketing Retail) (a) | 8,500 | 657,560 |
| Lenovo Group Ltd. (Technology Hardware, Storage & Peripherals) | 460,000 | 632,461 |
| Li Ning Co. Ltd. (Textiles, Apparel & Luxury Goods) | 73,000 | 595,823 |
| Longfor Group Holdings Ltd. (Real Estate Management & Development) | 102,000 | 636,207 |
| LONGi Green Energy Technology Co. Ltd., Class A (Semiconductors & Semiconductor Equipment) | 12,000 | 184,316 |
| Meituan (Internet & Direct Marketing Retail) (a) | 36,800 | 1,411,786 |
| MMG Ltd. (Metals & Mining) (a) | 540,000 | 351,762 |
| New Oriental Education & Technology Group, Inc., Sponsored ADR (Diversified Consumer Services) (a) | 16,000 | 244,160 |
| NIO, Inc. ADR (Automobiles) (a) | 8,000 | 318,720 |
| Offcn Education Technology Co. Ltd., Class A (Diversified Consumer Services) | 20,000 | 78,807 |
| Pinduoduo, Inc. ADR (Internet & Direct Marketing Retail) (a) | 4,400 | 589,292 |
| Ping An Bank Co. Ltd., Class A (Banks) | 121,965 | 438,935 |
The notes to the financial statements are an integral part of, and should be read in conjunction with, the financial statements.
11
Portfolio of Investments April 30, 2021† (Unaudited) (continued)
| | Shares | Value |
| Common Stocks (continued) |
| China (continued) |
| Ping An Insurance Group Co. of China Ltd., Class H (Insurance) | 120,000 | $ 1,312,349 |
| Sany Heavy Industry Co. Ltd., Class A (Machinery) | 96,000 | 458,082 |
| Shandong Linglong Tyre Co. Ltd., Class A (Auto Components) | 72,000 | 618,255 |
| Shandong Pharmaceutical Glass Co. Ltd., Class A (Health Care Equipment & Supplies) | 46,000 | 291,147 |
| Shandong Sinocera Functional Material Co. Ltd., Class A (Chemicals) | 41,000 | 313,606 |
| Shenzhen Inovance Technology Co. Ltd., Class A (Machinery) | 23,958 | 331,151 |
| Shenzhen Mindray Bio-Medical Electronics Co. Ltd., Class A (Health Care Equipment & Supplies) | 4,400 | 317,073 |
| Silergy Corp. (Semiconductors & Semiconductor Equipment) | 4,900 | 519,151 |
| Sunny Optical Technology Group Co. Ltd. (Electronic Equipment, Instruments & Components) | 19,000 | 463,274 |
| Tencent Holdings Ltd. (Interactive Media & Services) | 45,600 | 3,657,275 |
| TravelSky Technology Ltd., Class H (IT Services) | 110,000 | 241,589 |
| Vipshop Holdings Ltd. ADR (Internet & Direct Marketing Retail) (a) | 16,000 | 492,320 |
| Will Semiconductor Co. Ltd. Shanghai, Class A (Semiconductors & Semiconductor Equipment) | 12,000 | 560,940 |
| Wuxi Biologics Cayman, Inc. (Life Sciences Tools & Services) (a)(b) | 56,000 | 789,418 |
| Wuxi Lead Intelligent Equipment Co. Ltd., Class A (Electronic Equipment, Instruments & Components) | 24,998 | 341,470 |
| Xinyi Solar Holdings Ltd. (Semiconductors & Semiconductor Equipment) | 220,000 | 368,189 |
| Yantai Jereh Oilfield Services Group Co. Ltd., Class A (Energy Equipment & Services) | 68,998 | 351,947 |
| Yunnan Energy New Material Co. Ltd. (Containers & Packaging) | 14,000 | 291,076 |
| | | 34,377,185 |
| Hong Kong 1.8% |
| AIA Group Ltd. (Insurance) | 30,000 | 381,964 |
| | Shares | Value |
| |
| Hong Kong (continued) |
| Hong Kong Exchanges & Clearing Ltd. (Capital Markets) | 5,000 | $ 302,533 |
| Nine Dragons Paper Holdings Ltd. (Paper & Forest Products) | 296,000 | 406,975 |
| Xinyi Glass Holdings Ltd. (Building Products) | 146,000 | 517,820 |
| | | 1,609,292 |
| India 11.9% |
| Adani Ports & Special Economic Zone Ltd. (Transportation Infrastructure) (a) | 26,500 | 261,181 |
| Asian Paints Ltd. (Chemicals) | 8,400 | 287,634 |
| Bajaj Finance Ltd. (Consumer Finance) | 9,200 | 677,140 |
| Divi's Laboratories Ltd. (Life Sciences Tools & Services) (a) | 7,600 | 416,806 |
| Eicher Motors Ltd. (Automobiles) (a) | 700 | 22,885 |
| GAIL India Ltd. (Gas Utilities) | 220,000 | 407,493 |
| Graphite India Ltd. (Electrical Equipment) (a) | 44,000 | 435,055 |
| Grasim Industries Ltd. (Construction Materials) | 28,000 | 529,873 |
| HDFC Bank Ltd. (Banks) (a) | 39,000 | 743,592 |
| ICICI Bank Ltd. (Banks) | 128,000 | 1,037,686 |
| ICICI Lombard General Insurance Co. Ltd. (Insurance) (b) | 10,000 | 190,894 |
| Info Edge India Ltd. (Interactive Media & Services) | 6,800 | 451,179 |
| Infosys Ltd. (IT Services) | 56,000 | 1,023,910 |
| JSW Steel Ltd. (Metals & Mining) | 144,000 | 1,395,530 |
| Jubilant Foodworks Ltd. (Hotels, Restaurants & Leisure) (a) | 7,000 | 273,271 |
| Motherson Sumi Systems Ltd. (Auto Components) (a) | 82,000 | 237,678 |
| Reliance Industries Ltd. (Oil, Gas & Consumable Fuels) | 33,000 | 888,569 |
| State Bank of India (Banks) | 140,000 | 668,129 |
| Tata Consumer Products Ltd. (Food Products) | 54,000 | 488,076 |
| | | 10,436,581 |
| Indonesia 0.8% |
| Bank Central Asia Tbk PT (Banks) | 300,000 | 665,109 |
| Mexico 2.0% |
| Alsea SAB de CV (Hotels, Restaurants & Leisure) (a) | 200,000 | 325,320 |
| Grupo Financiero Banorte SAB de CV, Class O (Banks) | 120,000 | 682,727 |
The notes to the financial statements are an integral part of, and should be read in conjunction with, the financial statements.
| 12 | MainStay Candriam Emerging Markets Equity Fund |
| | Shares | Value |
| Common Stocks (continued) |
| Mexico (continued) |
| Ternium SA, Sponsored ADR (Metals & Mining) | 19,000 | $ 742,710 |
| | | 1,750,757 |
| Peru 1.0% |
| Southern Copper Corp. (Metals & Mining) | 12,400 | 860,684 |
| Poland 0.9% |
| Dino Polska SA (Food & Staples Retailing) (a)(b) | 6,200 | 402,521 |
| Powszechny Zaklad Ubezpieczen SA (Insurance) | 41,000 | 353,217 |
| | | 755,738 |
| Republic of Korea 14.0% |
| Hyundai Mobis Co. Ltd. (Auto Components) | 2,200 | 534,005 |
| Kakao Corp. (Interactive Media & Services) | 6,700 | 683,643 |
| KB Financial Group, Inc. (Banks) | 31,800 | 1,563,770 |
| Kia Motors Corp. (Automobiles) | 14,000 | 969,119 |
| KIWOOM Securities Co. Ltd. (Capital Markets) | 3,000 | 357,351 |
| LG Chem Ltd. (Chemicals) | 880 | 737,322 |
| NAVER Corp. (Interactive Media & Services) | 500 | 161,595 |
| NCSoft Corp. (Entertainment) | 320 | 238,774 |
| Samsung C&T Corp. (Industrial Conglomerates) | 2,700 | 330,112 |
| Samsung Electro-Mechanics Co. Ltd. (Electronic Equipment, Instruments & Components) | 3,000 | 482,762 |
| Samsung Electronics Co. Ltd. (Technology Hardware, Storage & Peripherals) | 53,000 | 3,883,219 |
| Samsung SDI Co. Ltd. (Electronic Equipment, Instruments & Components) | 1,060 | 623,221 |
| SK Hynix, Inc. (Semiconductors & Semiconductor Equipment) | 10,000 | 1,150,717 |
| S-Oil Corp. (Oil, Gas & Consumable Fuels) | 7,000 | 548,119 |
| | | 12,263,729 |
| Russia 2.5% |
| HeadHunter Group plc ADR (Professional Services) (a) | 2,400 | 98,616 |
| Polymetal International plc (Metals & Mining) | 20,000 | 413,072 |
| Tatneft PJSC (Oil, Gas & Consumable Fuels) | 32,000 | 215,808 |
| TCS Group Holding plc GDR (Banks) | 17,600 | 1,017,280 |
| Yandex NV, Class A (Interactive Media & Services) (a) | 7,400 | 485,070 |
| | | 2,229,846 |
| | Shares | Value |
| |
| South Africa 3.5% |
| Capitec Bank Holdings Ltd. (Banks) | 1,800 | $ 184,487 |
| Impala Platinum Holdings Ltd. (Metals & Mining) | 42,000 | 786,365 |
| Kumba Iron Ore Ltd. (Metals & Mining) | 11,000 | 499,337 |
| Naspers Ltd., Class N (Internet & Direct Marketing Retail) | 7,200 | 1,643,506 |
| | | 3,113,695 |
| Taiwan 11.4% |
| Accton Technology Corp. (Communications Equipment) | 44,000 | 500,258 |
| Alchip Technologies Ltd. (Semiconductors & Semiconductor Equipment) | 14,000 | 247,543 |
| ASPEED Technology, Inc. (Semiconductors & Semiconductor Equipment) | 5,000 | 376,344 |
| Chailease Holding Co. Ltd. (Diversified Financial Services) | 164,000 | 1,183,620 |
| Delta Electronics, Inc. (Electronic Equipment, Instruments & Components) | 68,000 | 742,407 |
| Globalwafers Co. Ltd. (Semiconductors & Semiconductor Equipment) | 16,000 | 500,199 |
| MediaTek, Inc. (Semiconductors & Semiconductor Equipment) | 39,000 | 1,672,891 |
| Realtek Semiconductor Corp. (Semiconductors & Semiconductor Equipment) | 32,000 | 614,961 |
| Taiwan Semiconductor Manufacturing Co. Ltd. (Semiconductors & Semiconductor Equipment) | 194,500 | 4,214,778 |
| | | 10,053,001 |
| Thailand 1.3% |
| Carabao Group PCL NVDR (Beverages) | 54,000 | 195,103 |
| Energy Absolute PCL NVDR (Independent Power and Renewable Electricity Producers) | 156,000 | 305,612 |
| Srisawad Corp. PCL NVDR (Consumer Finance) | 240,000 | 641,670 |
| | | 1,142,385 |
| Turkey 0.2% |
| Ford Otomotiv Sanayi A/S (Automobiles) | 9,000 | 191,116 |
Total Common Stocks
(Cost $62,677,108) | | 84,847,942 |
The notes to the financial statements are an integral part of, and should be read in conjunction with, the financial statements.
13
Portfolio of Investments April 30, 2021† (Unaudited) (continued)
| | Shares | | Value |
| Preferred Stocks 1.2% |
| Brazil 0.5% |
| Petroleo Brasileiro SA (Oil, Gas & Consumable Fuels) | 100,000 | | $ 434,827 |
| Chile 0.7% |
| Sociedad Quimica y Minera de Chile SA, Sponsored ADR (Chemicals) | 11,864 | | 625,707 |
Total Preferred Stocks
(Cost $1,095,383) | | | 1,060,534 |
Total Investments
(Cost $63,772,491) | 97.7% | | 85,908,476 |
| Other Assets, Less Liabilities | 2.3 | | 2,037,024 |
| Net Assets | 100.0% | | $ 87,945,500 |
| † | Percentages indicated are based on Fund net assets. |
| (a) | Non-income producing security. |
| (b) | May be sold to institutional investors only under Rule 144A or securities offered pursuant to Section 4(a)(2) of the Securities Act of 1933, as amended. |
| (c) | All or a portion of this security was held on loan. As of April 30, 2021, the aggregate market value of securities on loan was $887,250. The market value of the collateral held included non-cash collateral in the form of U.S. Treasury securities with a value of $947,582.. (See Note 2(J)) |
| Abbreviation(s): |
| ADR—American Depositary Receipt |
| GDR—Global Depositary Receipt |
| NVDR—Non-Voting Depositary Receipt |
| PCL—Provision for Credit Losses |
The following is a summary of the fair valuations according to the inputs used as of April 30, 2021, for valuing the Fund’s assets:
| Description | Quoted
Prices in
Active
Markets for
Identical
Assets
(Level 1) | | Significant
Other
Observable
Inputs
(Level 2) | | Significant
Unobservable
Inputs
(Level 3) | | Total |
| Asset Valuation Inputs | | | | | | | |
| Investments in Securities (a) | | | | | | | |
| Common Stocks | $ 73,611,358 | | $ 11,236,584 | | $ — | | $ 84,847,942 |
| Preferred Stocks | 1,060,534 | | — | | — | | 1,060,534 |
| Total Investments in Securities | $ 74,671,892 | | $ 11,236,584 | | $ — | | $ 85,908,476 |
| (a) | For a complete listing of investments and their industries, see the Portfolio of Investments. |
The notes to the financial statements are an integral part of, and should be read in conjunction with, the financial statements.
| 14 | MainStay Candriam Emerging Markets Equity Fund |
The table below sets forth the diversification of the Fund’s investments by industry.
Industry Diversification
| | Value | Percent |
| Airlines | $ 348,930 | 0.4% |
| Auto Components | 1,389,938 | 1.6 |
| Automobiles | 1,870,196 | 2.1 |
| Banks | 12,272,521 | 14.0 |
| Beverages | 195,103 | 0.2 |
| Biotechnology | 487,584 | 0.6 |
| Building Products | 517,820 | 0.6 |
| Capital Markets | 1,549,476 | 1.8 |
| Chemicals | 2,349,126 | 2.6 |
| Commercial Services & Supplies | 650,510 | 0.7 |
| Communications Equipment | 500,258 | 0.6 |
| Construction Materials | 529,873 | 0.6 |
| Consumer Finance | 1,318,810 | 1.5 |
| Containers & Packaging | 291,076 | 0.3 |
| Diversified Consumer Services | 322,967 | 0.4 |
| Diversified Financial Services | 1,183,620 | 1.3 |
| Electrical Equipment | 1,322,922 | 1.5 |
| Electronic Equipment, Instruments & Components | 2,653,134 | 3.0 |
| Energy Equipment & Services | 351,947 | 0.4 |
| Entertainment | 626,784 | 0.7 |
| Food & Staples Retailing | 402,521 | 0.5 |
| Food Products | 1,240,405 | 1.3 |
| Gas Utilities | 935,883 | 1.1 |
| Health Care Equipment & Supplies | 608,220 | 0.7 |
| Health Care Providers & Services | 681,319 | 0.8 |
| Health Care Technology | 305,108 | 0.3 |
| Hotels, Restaurants & Leisure | 870,832 | 1.0 |
| Independent Power and Renewable Electricity Producers | 305,612 | 0.4 |
| Industrial Conglomerates | 330,112 | 0.4 |
| Insurance | 2,238,424 | 2.5 |
| Interactive Media & Services | 6,259,049 | 7.1 |
| Internet & Direct Marketing Retail | 8,485,396 | 9.7 |
| IT Services | 1,521,643 | 1.8 |
| Life Sciences Tools & Services | 1,206,224 | 1.4 |
| Machinery | 1,453,665 | 1.7 |
| Media | 334,814 | 0.4 |
| Metals & Mining | 5,583,444 | 6.3 |
| Oil, Gas & Consumable Fuels | 3,779,419 | 4.2 |
| Paper & Forest Products | 406,975 | 0.5 |
| Pharmaceuticals | 400,631 | 0.5 |
| Professional Services | 98,616 | 0.1 |
| Real Estate Management & Development | 1,103,253 | 1.2 |
| Road & Rail | 378,789 | 0.4 |
| | Value | | Percent |
| Semiconductors & Semiconductor Equipment | $10,410,029 | | 11.8% |
| Specialty Retail | 462,814 | | 0.6 |
| Technology Hardware, Storage & Peripherals | 4,515,680 | | 5.1 |
| Textiles, Apparel & Luxury Goods | 595,823 | | 0.7 |
| Transportation Infrastructure | 261,181 | | 0.3 |
| | 85,908,476 | | 97.7 |
| Other Assets, Less Liabilities | 2,037,024 | | 2.3 |
| Net Assets | $87,945,500 | | 100.0% |
| † | Percentages indicated are based on Fund net assets. |
The notes to the financial statements are an integral part of, and should be read in conjunction with, the financial statements.
15
Statement of Assets and Liabilities as of April 30, 2021 (Unaudited)
| Assets |
Investment in securities, at value
(identified cost $63,772,491) including securities on loan of $887,250 | $85,908,476 |
Cash denominated in foreign currencies
(identified cost $410,203) | 410,674 |
| Cash | 2,342,230 |
| Receivables: | |
| Dividends and interest | 63,252 |
| Fund shares sold | 57,211 |
| Investment securities sold | 56,694 |
| Securities lending | 285 |
| Other assets | 35,758 |
| Total assets | 88,874,580 |
| Liabilities |
| Payables: | |
| Foreign capital gains tax (See Note 2) | 439,427 |
| Investment securities purchased | 309,194 |
| Manager (See Note 3) | 62,629 |
| Custodian | 45,176 |
| Professional fees | 31,628 |
| Offering costs | 7,894 |
| Shareholder communication | 7,850 |
| Transfer agent (See Note 3) | 1,791 |
| NYLIFE Distributors (See Note 3) | 913 |
| Accrued expenses | 22,578 |
| Total liabilities | 929,080 |
| Net assets | $87,945,500 |
| Composition of Net Assets |
| Shares of beneficial interest outstanding (par value of $.001 per share) unlimited number of shares authorized | $ 6,525 |
| Additional paid-in-capital | 68,017,194 |
| | 68,023,719 |
| Total distributable earnings (loss) | 19,921,781 |
| Net assets | $87,945,500 |
| Class A | |
| Net assets applicable to outstanding shares | $ 3,138,821 |
| Shares of beneficial interest outstanding | 233,670 |
| Net asset value per share outstanding | $ 13.43 |
| Maximum sales charge (5.50% of offering price) | 0.78 |
| Maximum offering price per share outstanding | $ 14.21 |
| Investor Class | |
| Net assets applicable to outstanding shares | $ 518,665 |
| Shares of beneficial interest outstanding | 38,654 |
| Net asset value per share outstanding | $ 13.42 |
| Maximum sales charge (5.00% of offering price) | 0.71 |
| Maximum offering price per share outstanding | $ 14.13 |
| Class C | |
| Net assets applicable to outstanding shares | $ 235,805 |
| Shares of beneficial interest outstanding | 17,822 |
| Net asset value and offering price per share outstanding | $ 13.23 |
| Class I | |
| Net assets applicable to outstanding shares | $ 494,412 |
| Shares of beneficial interest outstanding | 36,488 |
| Net asset value and offering price per share outstanding | $ 13.55 |
| Class R6 | |
| Net assets applicable to outstanding shares | $83,557,797 |
| Shares of beneficial interest outstanding | 6,198,696 |
| Net asset value and offering price per share outstanding | $ 13.48 |
The notes to the financial statements are an integral part of, and should be read in conjunction with, the financial statements.
| 16 | MainStay Candriam Emerging Markets Equity Fund |
Statement of Operations for the six months ended April 30, 2021 (Unaudited)
| Investment Income (Loss) |
| Income | |
| Dividends-unaffiliated (net of foreign tax withholding of $78,485) | $ 479,285 |
| Securities lending | 4,509 |
| Dividends-affiliated | 6 |
| Other | 6 |
| Total income | 483,806 |
| Expenses | |
| Manager (See Note 3) | 441,783 |
| Custodian | 60,016 |
| Professional fees | 43,511 |
| Registration | 36,545 |
| Transfer agent (See Note 3) | 5,130 |
| Distribution/Service—Class A (See Note 3) | 2,804 |
| Distribution/Service—Investor Class (See Note 3) | 581 |
| Distribution/Service—Class C (See Note 3) | 1,205 |
| Shareholder communication | 4,172 |
| Trustees | 918 |
| Insurance | 396 |
| Miscellaneous | 5,153 |
| Total expenses before waiver/reimbursement | 602,214 |
| Expense waiver/reimbursement from Manager (See Note 3) | (94,885) |
| Net expenses | 507,329 |
| Net investment income (loss) | (23,523) |
| Realized and Unrealized Gain (Loss) |
| Net realized gain (loss) on: | |
| Unaffiliated investment transactions(a) | 14,788,368 |
| Foreign currency transactions | (54,332) |
| Foreign currency forward transactions | 303 |
| Net realized gain (loss) | 14,734,339 |
| Net change in unrealized appreciation (depreciation) on: | |
| Unaffiliated investments(b) | 6,992,037 |
| Translation of other assets and liabilities in foreign currencies | 8,982 |
| Net change in unrealized appreciation (depreciation) | 7,001,019 |
| Net realized and unrealized gain (loss) | 21,735,358 |
| Net increase (decrease) in net assets resulting from operations | $21,711,835 |
| (a) | Realized gain (loss) on security transactions recorded net of foreign capital gains tax in the amount of $(37,457). |
| (b) | Net change in unrealized appreciation (depreciation) on investments recorded net of foreign capital gains tax in the amount of $(466,781). |
The notes to the financial statements are an integral part of, and should be read in conjunction with, the financial statements.
17
Statements of Changes in Net Assets
for the six months ended April 30, 2021 (Unaudited) and the year ended October 31, 2020
| | 2021 | 2020 |
| Increase (Decrease) in Net Assets |
| Operations: | | |
| Net investment income (loss) | $ (23,523) | $ 355,502 |
| Net realized gain (loss) | 14,734,339 | (1,698,214) |
| Net change in unrealized appreciation (depreciation) | 7,001,019 | 12,097,837 |
| Net increase (decrease) in net assets resulting from operations | 21,711,835 | 10,755,125 |
| Distributions to shareholders: | | |
| Class A | (3,773) | (1,543) |
| Investor Class | (842) | (2,383) |
| Class C | — | (915) |
| Class I | (210) | (627) |
| Class R6 | (446,085) | (1,023,064) |
| Total distributions to shareholders | (450,910) | (1,028,532) |
| Capital share transactions: | | |
| Net proceeds from sales of shares | 8,160,299 | 46,869,950 |
| Net asset value of shares issued to shareholder in reinvestment of distributions | 450,676 | 1,028,532 |
| Cost of shares redeemed | (26,873,985) | (22,082,103) |
| Increase (decrease) in net assets derived from capital share transactions | (18,263,010) | 25,816,379 |
| Net increase (decrease) in net assets | 2,997,915 | 35,542,972 |
| Net Assets |
| Beginning of period | 84,947,585 | 49,404,613 |
| End of period | $ 87,945,500 | $ 84,947,585 |
The notes to the financial statements are an integral part of, and should be read in conjunction with, the financial statements.
| 18 | MainStay Candriam Emerging Markets Equity Fund |
Financial Highlights selected per share data and ratios
| | Six months ended
April 30,
2021* | | Year Ended October 31, | | November 15, 2017 through
October 31,
2018^ |
| Class A | 2020 | | 2019 | |
| Net asset value at beginning of period | $ 10.66 | | $ 8.97 | | $ 7.98 | | $ 10.00 |
| Net investment income (loss) (a) | (0.02) | | 0.02 | | 0.10 | | 0.05 |
| Net realized and unrealized gain (loss) on investments | 2.83 | | 1.88 | | 0.94 | | (2.04) |
| Net realized and unrealized gain (loss) on foreign currency transactions | (0.01) | | (0.03) | | (0.01) | | (0.03) |
| Total from investment operations | 2.80 | | 1.87 | | 1.03 | | (2.02) |
| Less distributions: | | | | | | | |
| From net investment income | (0.03) | | (0.18) | | (0.04) | | — |
| Net asset value at end of period | $ 13.43 | | $ 10.66 | | $ 8.97 | | $ 7.98 |
| Total investment return (b) | 26.26% | | 21.14% | | 12.96% | | (20.20)% |
| Ratios (to average net assets)/Supplemental Data: | | | | | | | |
| Net investment income (loss) | (0.38)%†† | | 0.22% | | 1.18% | | 0.51%†† |
| Net expenses (c) | 1.50%†† | | 1.50% | | 1.50% | | 1.50%†† |
| Expenses (before waiver/reimbursement) (c) | 1.78%†† | | 2.00% | | 1.77% | | 1.89%†† |
| Portfolio turnover rate | 34% | | 122% | | 107% | | 80% |
| Net assets at end of period (in 000’s) | $ 3,139 | | $ 1,111 | | $ 77 | | $ 35 |
| * | Unaudited. |
| ^ | Inception date. |
| †† | Annualized. |
| (a) | Per share data based on average shares outstanding during the period. |
| (b) | Total investment return is calculated exclusive of sales charges and assumes the reinvestment of dividends and distributions. For periods of less than one year, total return is not annualized. |
| (c) | In addition to the fees and expenses which the Fund bears directly, it also indirectly bears a pro-rata share of the fees and expenses of the underlying funds in which it invests. Such indirect expenses are not included in the above expense ratios. |
| | Six months ended
April 30,
2021* | | Year Ended October 31, | | November 15, 2017 through
October 31,
2018^ |
| Investor Class | 2020 | | 2019 | |
| Net asset value at beginning of period | $ 10.65 | | $ 8.95 | | $ 7.97 | | $ 10.00 |
| Net investment income (loss) (a) | (0.03) | | 0.02 | | 0.07 | | 0.05 |
| Net realized and unrealized gain (loss) on investments | 2.83 | | 1.87 | | 0.95 | | (2.05) |
| Net realized and unrealized gain (loss) on foreign currency transactions | (0.01) | | (0.03) | | (0.01) | | (0.03) |
| Total from investment operations | 2.79 | | 1.86 | | 1.01 | | (2.03) |
| Less distributions: | | | | | | | |
| From net investment income | (0.02) | | (0.16) | | (0.03) | | — |
| Net asset value at end of period | $ 13.42 | | $ 10.65 | | $ 8.95 | | $ 7.97 |
| Total investment return (b)(c) | 26.26% | | 21.11% | | 12.71% | | (20.30)% |
| Ratios (to average net assets)/Supplemental Data: | | | | | | | |
| Net investment income (loss) | (0.46)%†† | | 0.17% | | 0.76% | | 0.53%†† |
| Net expenses (d) | 1.55%†† | | 1.52% | | 1.66% | | 1.68%†† |
| Expenses (before waiver/reimbursement) (d) | 1.85%†† | | 2.03% | | 1.92% | | 2.03%†† |
| Portfolio turnover rate | 34% | | 122% | | 107% | | 80% |
| Net assets at end of period (in 000’s) | $ 519 | | $ 360 | | $ 121 | | $ 108 |
| * | Unaudited. |
| ^ | Inception date. |
| †† | Annualized. |
| (a) | Per share data based on average shares outstanding during the period. |
| (b) | Total investment return is calculated exclusive of sales charges and assumes the reinvestment of dividends and distributions. For periods of less than one year, total return is not annualized. |
| (c) | Total investment return may reflect adjustments to conform to generally accepted accounting principles. |
| (d) | In addition to the fees and expenses which the Fund bears directly, it also indirectly bears a pro-rata share of the fees and expenses of the underlying funds in which it invests. Such indirect expenses are not included in the above expense ratios. |
The notes to the financial statements are an integral part of, and should be read in conjunction with, the financial statements.
19
Financial Highlights selected per share data and ratios
| | Six months ended
April 30,
2021* | | Year Ended October 31, | | November 15, 2017 through
October 31,
2018^ |
| Class C | 2020 | | 2019 | |
| Net asset value at beginning of period | $ 10.52 | | $ 8.85 | | $ 7.91 | | $ 10.00 |
| Net investment income (loss) (a) | (0.08) | | (0.05) | | (0.01) | | 0.00‡ |
| Net realized and unrealized gain (loss) on investments | 2.80 | | 1.86 | | 0.96 | | (2.06) |
| Net realized and unrealized gain (loss) on foreign currency transactions | (0.01) | | (0.03) | | (0.01) | | (0.03) |
| Total from investment operations | 2.71 | | 1.78 | | 0.94 | | (2.09) |
| Less distributions: | | | | | | | |
| From net investment income | — | | (0.11) | | — | | — |
| Net asset value at end of period | $ 13.23 | | $ 10.52 | | $ 8.85 | | $ 7.91 |
| Total investment return (b) | 25.88% | | 20.23% | | 11.88% | | (20.90)% |
| Ratios (to average net assets)/Supplemental Data: | | | | | | | |
| Net investment income (loss) | (1.21)%†† | | (0.52)% | | (0.13)% | | 0.04%†† |
| Net expenses (c) | 2.30%†† | | 2.27% | | 2.40% | | 2.44%†† |
| Expenses (before waiver/reimbursement) (c) | 2.61%†† | | 2.78% | | 2.67% | | 2.73%†† |
| Portfolio turnover rate | 34% | | 122% | | 107% | | 80% |
| Net assets at end of period (in 000’s) | $ 236 | | $ 217 | | $ 56 | | $ 93 |
| * | Unaudited. |
| ^ | Inception date. |
| ‡ | Less than one cent per share. |
| †† | Annualized. |
| (a) | Per share data based on average shares outstanding during the period. |
| (b) | Total investment return is calculated exclusive of sales charges and assumes the reinvestment of dividends and distributions. For periods of less than one year, total return is not annualized. |
| (c) | In addition to the fees and expenses which the Fund bears directly, it also indirectly bears a pro-rata share of the fees and expenses of the underlying funds in which it invests. Such indirect expenses are not included in the above expense ratios. |
| | Six months ended
April 30,
2021* | | Year Ended October 31, | | November 15, 2017 through
October 31,
2018^ |
| Class I | 2020 | | 2019 | |
| Net asset value at beginning of period | $ 10.77 | | $ 8.99 | | $ 8.00 | | $ 10.00 |
| Net investment income (loss) (a) | 0.01 | | 0.05 | | (0.02) | | 0.03 |
| Net realized and unrealized gain (loss) on investments | 2.86 | | 1.90 | | 1.08 | | (2.01) |
| Net realized and unrealized gain (loss) on foreign currency transactions | (0.01) | | (0.03) | | (0.01) | | (0.02) |
| Total from investment operations | 2.86 | | 1.92 | | 1.05 | | (2.00) |
| Less distributions: | | | | | | | |
| From net investment income | (0.08) | | (0.14) | | (0.06) | | (0.00) |
| Net asset value at end of period | $ 13.55 | | $ 10.77 | | $ 8.99 | | $ 8.00 |
| Total investment return (b) | 26.59% | | 21.60% | | 13.28% | | (19.99)% |
| Ratios (to average net assets)/Supplemental Data: | | | | | | | |
| Net investment income (loss) | 0.17%†† | | 0.55% | | (0.26)% | | 0.34%†† |
| Net expenses (c) | 1.11%†† | | 1.15% | | 1.15% | | 1.19%†† |
| Expenses (before waiver/reimbursement) (c) | 1.44%†† | | 1.79% | | 1.52% | | 1.79%†† |
| Portfolio turnover rate | 34% | | 122% | | 107% | | 80% |
| Net assets at end of period (in 000’s) | $ 494 | | $ 30 | | $ 40 | | $ 7,934 |
| * | Unaudited. |
| ^ | Inception date. |
| †† | Annualized. |
| (a) | Per share data based on average shares outstanding during the period. |
| (b) | Total investment return is calculated exclusive of sales charges and assumes the reinvestment of dividends and distributions. Class I shares are not subject to sales charges. For periods of less than one year, total return is not annualized. |
| (c) | In addition to the fees and expenses which the Fund bears directly, it also indirectly bears a pro-rata share of the fees and expenses of the underlying funds in which it invests. Such indirect expenses are not included in the above expense ratios. |
The notes to the financial statements are an integral part of, and should be read in conjunction with, the financial statements.
| 20 | MainStay Candriam Emerging Markets Equity Fund |
Financial Highlights selected per share data and ratios
| | Six months ended
April 30,
2021* | | Year Ended October 31, | | November 15, 2017 through
October 31,
2018^ |
| Class R6 | 2020 | | 2019 | |
| Net asset value at beginning of period | $ 10.71 | | $ 9.00 | | $ 8.01 | | $ 10.00 |
| Net investment income (loss) (a) | (0.00)‡ | | 0.05 | | 0.10 | | 0.14 |
| Net realized and unrealized gain (loss) on investments | 2.84 | | 1.89 | | 0.96 | | (2.10) |
| Net realized and unrealized gain (loss) on foreign currency transactions | (0.01) | | (0.03) | | (0.01) | | (0.03) |
| Total from investment operations | 2.83 | | 1.91 | | 1.05 | | (1.99) |
| Less distributions: | | | | | | | |
| From net investment income | (0.06) | | (0.20) | | (0.06) | | (0.00) |
| Net asset value at end of period | $ 13.48 | | $ 10.71 | | $ 9.00 | | $ 8.01 |
| Total investment return (b) | 26.53% | | 21.61% | | 13.29% | | (19.89)% |
| Ratios (to average net assets)/Supplemental Data: | | | | | | | |
| Net investment income (loss) | (0.04)%†† | | 0.51% | | 1.11% | | 1.54%†† |
| Net expenses (c) | 1.13%†† | | 1.15% | | 1.15% | | 1.15%†† |
| Expenses (before waiver/reimbursement) (c) | 1.35%†† | | 1.53% | | 1.42% | | 1.43%†† |
| Portfolio turnover rate | 34% | | 122% | | 107% | | 80% |
| Net assets at end of period (in 000’s) | $ 83,558 | | $ 83,230 | | $ 49,111 | | $ 62,635 |
| * | Unaudited. |
| ^ | Inception date. |
| ‡ | Less than one cent per share. |
| †† | Annualized. |
| (a) | Per share data based on average shares outstanding during the period. |
| (b) | Total investment return is calculated exclusive of sales charges and assumes the reinvestment of dividends and distributions. Class R6 shares are not subject to sales charges. For periods of less than one year, total return is not annualized. |
| (c) | In addition to the fees and expenses which the Fund bears directly, it also indirectly bears a pro-rata share of the fees and expenses of the underlying funds in which it invests. Such indirect expenses are not included in the above expense ratios. |
The notes to the financial statements are an integral part of, and should be read in conjunction with, the financial statements.
21
Notes to Financial Statements (Unaudited)
Note 1-Organization and Business
MainStay Funds Trust (the “Trust”) was organized as a Delaware statutory trust on April 28, 2009. The Trust is registered under the Investment Company Act of 1940, as amended (the “1940 Act”), as an open-end management investment company, and is comprised of thirty-two funds (collectively referred to as the “Funds”). These financial statements and notes relate to the MainStay Candriam Emerging Markets Equity Fund (the "Fund"), a “diversified” fund, as that term is defined in the 1940 Act, as interpreted or modified by regulatory authorities having jurisdiction, from time to time.
The following table lists the Fund's share classes that have been registered and commenced operations:
| Class | Commenced Operations |
| Class A | November 15, 2017 |
| Investor Class | November 15, 2017 |
| Class C | November 15, 2017 |
| Class I | November 15, 2017 |
| Class R6 | November 15, 2017 |
| SIMPLE Class | N/A* |
| • | SIMPLE Class shares were registered for sale effective as of August 31, 2020 but have not yet commenced operations. |
Class A and Investor Class shares are offered at net asset value (“NAV”) per share plus an initial sales charge. No initial sales charge applies to investments of $1 million or more (and certain other qualified purchases) in Class A and Investor Class shares. A contingent deferred sales charge (“CDSC”) of 1.00% may be imposed on certain redemptions of Class A and Investor Class shares made within 18 months of the date of purchase on shares that were purchased without an initial sales charge. Class C shares are offered at NAV without an initial sales charge, although a 1.00% CDSC may be imposed on certain redemptions of such shares made within one year of the date of purchase of Class C shares. Class I and Class R6 shares are offered at NAV without a sales charge. SIMPLE Class shares are currently expected to be offered at NAV without a sales charge. Depending upon eligibility, Class C shares convert to either Class A or Investor Class shares at the end of the calendar quarter ten years after the date they were purchased. Additionally, Investor Class shares may convert automatically to Class A shares. Under certain circumstances and as may be permitted by the Trust’s multiple class plan pursuant to Rule 18f-3 under the 1940 Act, specified share classes of the Fund may be converted to one or more other share classes of the Fund as disclosed in the capital share transactions within these Notes. The classes of shares have the same voting (except for issues that relate solely to one class), dividend, liquidation and other rights, and the same terms and conditions, except that under distribution plans pursuant to Rule 12b-1 under the 1940 Act, Class C shares are subject to higher distribution and/or service fees than Class A, Investor Class and SIMPLE Class shares. Class I and Class R6 shares are not subject to a distribution and/or service fee.
The Fund's investment objective is to seek long-term capital appreciation.
Note 2–Significant Accounting Policies
The Fund is an investment company and accordingly follows the investment company accounting and reporting guidance of the Financial Accounting Standards Board (“FASB”) Accounting Standard Codification Topic 946 Financial Services—Investment Companies. The Fund prepares its financial statements in accordance with generally accepted accounting principles (“GAAP”) in the United States of America and follows the significant accounting policies described below.
(A) Securities Valuation. Investments are usually valued as of the close of regular trading on the New York Stock Exchange (the "Exchange") (usually 4:00 p.m. Eastern time) on each day the Fund is open for business ("valuation date").
The Board of Trustees of the Trust (the "Board") adopted procedures establishing methodologies for the valuation of the Fund's securities and other assets and delegated the responsibility for valuation determinations under those procedures to the Valuation Committee of the Trust (the “Valuation Committee”). The procedures state that, subject to the oversight of the Board and unless otherwise noted, the responsibility for the day-to-day valuation of portfolio assets (including fair value measurements for the Fund's assets and liabilities) rests with New York Life Investment Management LLC (“New York Life Investments” or the "Manager"), aided to whatever extent necessary by the Subadvisor (as defined in Note 3(A)). To assess the appropriateness of security valuations, the Manager, the Subadvisor or the Fund's third-party service provider, who is subject to oversight by the Manager, regularly compares prior day prices, prices on comparable securities and the sale prices to the prior and current day prices and challenges prices with changes exceeding certain tolerance levels with third-party pricing services or broker sources.
The Board authorized the Valuation Committee to appoint a Valuation Subcommittee (the “Subcommittee”) to establish the prices of securities for which market quotations are not readily available or the prices of which are not otherwise readily determinable under the procedures. The Subcommittee meets (in person, via electronic mail or via teleconference) on an as-needed basis. The Valuation Committee meets to ensure that actions taken by the Subcommittee were appropriate.
For those securities valued through either a standardized fair valuation methodology or a fair valuation measurement, the Subcommittee deals with such valuation and the Valuation Committee reviews and affirms, if appropriate, the reasonableness of the valuation based on such methodologies and measurements on a regular basis after considering information that is reasonably available and deemed relevant by the Valuation Committee. Any action taken by the Subcommittee with respect to the valuation of a portfolio security or other asset is submitted for review and ratification (if appropriate) to the Valuation Committee and the Board at the next regularly scheduled meeting.
"Fair value" is defined as the price the Fund would reasonably expect to receive upon selling an asset or liability in an orderly transaction to an independent buyer in the principal or most advantageous market for the
| 22 | MainStay Candriam Emerging Markets Equity Fund |
asset or liability. Fair value measurements are determined within a framework that establishes a three-tier hierarchy that maximizes the use of observable market data and minimizes the use of unobservable inputs to establish a classification of fair value measurements for disclosure purposes. "Inputs" refer broadly to the assumptions that market participants would use in pricing the asset or liability, including assumptions about risk, such as the risk inherent in a particular valuation technique used to measure fair value using a pricing model and/or the risk inherent in the inputs for the valuation technique. Inputs may be observable or unobservable. Observable inputs reflect the assumptions market participants would use in pricing the asset or liability based on market data obtained from sources independent of the Fund. Unobservable inputs reflect the Fund’s own assumptions about the assumptions market participants would use in pricing the asset or liability based on the information available. The inputs or methodology used for valuing assets or liabilities may not be an indication of the risks associated with investing in those assets or liabilities. The three-tier hierarchy of inputs is summarized below.
| • | Level 1—quoted prices in active markets for an identical asset or liability |
| • | Level 2—other significant observable inputs (including quoted prices for a similar asset or liability in active markets, interest rates and yield curves, prepayment speeds, credit risk, etc.) |
| • | Level 3—significant unobservable inputs (including the Fund's own assumptions about the assumptions that market participants would use in measuring fair value of an asset or liability) |
The level of an asset or liability within the fair value hierarchy is based on the lowest level of an input, both individually and in the aggregate, that is significant to the fair value measurement. The aggregate value by input level of the Fund’s assets and liabilities as of April 30, 2021, is included at the end of the Portfolio of Investments.
The Fund may use third-party vendor evaluations, whose prices may be derived from one or more of the following standard inputs, among others:
| • Broker/dealer quotes | • Benchmark securities |
| • Two-sided markets | • Reference data (corporate actions or material event notices) |
| • Bids/offers | • Monthly payment information |
| • Industry and economic events | • Reported trades |
An asset or liability for which market values cannot be measured using the methodologies described above is valued by methods deemed reasonable in good faith by the Valuation Committee, following the procedures established by the Board, to represent fair value. Under these procedures, the Fund generally uses a market-based approach which may use related or comparable assets or liabilities, recent transactions, market multiples, book values and other relevant information. The Fund may also use an income-based valuation approach in which the anticipated future cash flows of the asset or liability are discounted to calculate fair value. Discounts may also be applied due to the nature
and/or duration of any restrictions on the disposition of the asset or liability. Fair value represents a good faith approximation of the value of a security. Fair value determinations involve the consideration of a number of subjective factors, an analysis of applicable facts and circumstances and the exercise of judgment. As a result, it is possible that the fair value for a security determined in good faith in accordance with the Fund's valuation procedures may differ from valuations for the same security determined by other funds using their own valuation procedures. Although the Fund's valuation procedures are designed to value a security at the price the Fund may reasonably expect to receive upon the security's sale in an orderly transaction, there can be no assurance that any fair value determination thereunder would, in fact, approximate the amount that the Fund would actually realize upon the sale of the security or the price at which the security would trade if a reliable market price were readily available. During the six-month period ended April 30, 2021, there were no material changes to the fair value methodologies.
Securities which may be valued in this manner include, but are not limited to: (i) a security for which trading has been halted or suspended; (ii) a debt security that has recently gone into default and for which there is not a current market quotation; (iii) a security of an issuer that has entered into a restructuring; (iv) a security that has been delisted from a national exchange; (v) a security for which the market price is not readily available from a third-party pricing source or, if so provided, does not, in the opinion of the Manager or the Subadvisor, reflect the security's market value; (vi) a security subject to trading collars for which no or limited trading takes place; and (vii) a security whose principal market has been temporarily closed at a time when, under normal conditions, it would be open. Securities valued in this manner are generally categorized as Level 3 in the hierarchy. No securities held by the Fund as of April 30, 2021 were fair valued in such a manner.
Certain securities held by the Fund may principally trade in foreign markets. Events may occur between the time the foreign markets close and the time at which the Fund's NAVs are calculated. These events may include, but are not limited to, situations relating to a single issuer in a market sector, significant fluctuations in U.S. or foreign markets, natural disasters, armed conflicts, governmental actions or other developments not tied directly to the securities markets. Should the Manager or the Subadvisor conclude that such events may have affected the accuracy of the last price of such securities reported on the local foreign market, the Subcommittee may, pursuant to procedures adopted by the Board, adjust the value of the local price to reflect the estimated impact on the price of such securities as a result of such events. In this instance, securities are generally categorized as Level 3 in the hierarchy. Additionally, certain foreign equity securities are also fair valued whenever the movement of a particular index exceeds certain thresholds. In such cases, the securities are fair valued by applying factors provided by a third-party vendor in accordance with valuation procedures adopted by the Board and are generally categorized as Level 2 in the hierarchy. Securities that were fair valued in such a manner as of April 30, 2021, are shown in the Portfolio of Investments.
Notes to Financial Statements (Unaudited) (continued)
Equity securities are valued at the last quoted sales prices as of the close of regular trading on the relevant exchange on each valuation date. Securities that are not traded on the valuation date are valued at the mean of the last quoted bid and ask prices. Prices are normally taken from the principal market in which each security trades. These securities are generally categorized as Level 1 in the hierarchy.
Temporary cash investments acquired in excess of 60 days to maturity at the time of purchase are valued using the latest bid prices or using valuations based on a matrix system (which considers such factors as security prices, yields, maturities and ratings), both as furnished by independent pricing services. Temporary cash investments that mature in 60 days or less at the time of purchase ("Short-Term Investments") are valued using the amortized cost method of valuation, unless the use of such method would be inappropriate. The amortized cost method involves valuing a security at its cost on the date of purchase and thereafter assuming a constant amortization to maturity of the difference between such cost and the value on maturity date. Amortized cost approximates the current fair value of a security. Securities valued using the amortized cost method are not valued using quoted prices in an active market and are generally categorized as Level 2 in the hierarchy.
The information above is not intended to reflect an exhaustive list of the methodologies that may be used to value portfolio investments. The valuation procedures permit the use of a variety of valuation methodologies in connection with valuing portfolio investments. The methodology used for a specific type of investment may vary based on the market data available or other considerations. The methodologies summarized above may not represent the specific means by which portfolio investments are valued on any particular business day.
(B) Income Taxes. The Fund's policy is to comply with the requirements of the Internal Revenue Code of 1986, as amended (the “Internal Revenue Code”), applicable to regulated investment companies and to distribute all of its taxable income to the shareholders of the Fund within the allowable time limits.
The Manager evaluates the Fund’s tax positions to determine if the tax positions taken meet the minimum recognition threshold in connection with accounting for uncertainties in income tax positions taken or expected to be taken for the purposes of measuring and recognizing tax liabilities in the financial statements. Recognition of tax benefits of an uncertain tax position is permitted only to the extent the position is “more likely than not” to be sustained assuming examination by taxing authorities. The Manager analyzed the Fund's tax positions taken on federal, state and local income tax returns for all open tax years (for up to three tax years) and has concluded that no provisions for federal, state and local income tax are required in the Fund's financial statements. The Fund's federal, state and local income tax and federal excise tax returns for tax years for which the applicable statutes of limitations have not expired are subject to examination by the Internal Revenue Service and state and local departments of revenue.
(C) Foreign Taxes. The Fund may be subject to foreign taxes on income and other transaction-based taxes imposed by certain countries in which it invests. A portion of the taxes on gains on investments or currency purchases/repatriation may be reclaimable. The Fund will accrue such taxes and reclaims as applicable, based upon its current interpretation of tax rules and regulations that exist in the markets in which it invests.
The Fund may be subject to taxation on realized capital gains, repatriation proceeds and other transaction-based taxes imposed by certain countries in which it invests. The Fund will accrue such taxes as applicable based upon its current interpretation of tax rules and regulations that exist in the market in which it invests. Capital gains taxes relating to positions still held are reflected as a liability in the Statement of Assets and Liabilities, as well as an adjustment to the Fund's net unrealized appreciation (depreciation). Taxes related to capital gains realized, if any, are reflected as part of net realized gain (loss) in the Statement of Operations. Changes in tax liabilities related to capital gains taxes on unrealized investment gains, if any, are reflected as part of the change in net unrealized appreciation (depreciation) on investments in the Statement of Operations. Transaction-based charges are generally assessed as a percentage of the transaction amount.
(D) Dividends and Distributions to Shareholders. Dividends and distributions are recorded on the ex-dividend date. The Fund intends to declare and pay dividends from net investment income and distributions from net realized capital and currency gains, if any, at least annually. Unless a shareholder elects otherwise, all dividends and distributions are reinvested at NAV in the same class of shares of the Fund. Dividends and distributions to shareholders are determined in accordance with federal income tax regulations and may differ from determinations using GAAP.
(E) Security Transactions and Investment Income. The Fund records security transactions on the trade date. Realized gains and losses on security transactions are determined using the identified cost method. Dividend income is recognized on the ex-dividend date, net of any foreign tax withheld at the source, and interest income is accrued as earned using the effective interest rate method. Distributions received from real estate investment trusts may be classified as dividends, capital gains and/or return of capital.
Investment income and realized and unrealized gains and losses on investments of the Fund are allocated pro rata to the separate classes of shares based upon their relative net assets on the date the income is earned or realized and unrealized gains and losses are incurred.
(F) Expenses. Expenses of the Trust are allocated to the individual Funds in proportion to the net assets of the respective Funds when the expenses are incurred, except where direct allocations of expenses can be made. Expenses (other than transfer agent expenses and fees incurred under the shareholder services plans and/or the distribution plans further discussed in Note 3(B)) are allocated to separate classes of shares pro rata based upon their relative net assets on the date the expenses are
| 24 | MainStay Candriam Emerging Markets Equity Fund |
incurred. The expenses borne by the Fund, including those of related parties to the Fund, are shown in the Statement of Operations.
(G) Use of Estimates. In preparing financial statements in conformity with GAAP, the Manager makes estimates and assumptions that affect the reported amounts and disclosures in the financial statements. Actual results could differ from those estimates and assumptions.
(H) Foreign Currency Forward Contracts. The Fund may enter into foreign currency forward contracts, which are agreements to buy or sell foreign currencies on a specified future date at a specified rate. The Fund is subject to foreign currency exchange rate risk in the normal course of investing in these transactions. During the period the forward contract is open, changes in the value of the contract are recognized as unrealized appreciation or depreciation by marking to market such contract on a daily basis to reflect the market value of the contract at the end of each day’s trading. Cash movement occurs on the settlement date. When the forward contract is closed, the Fund records a realized gain or loss equal to the difference between the proceeds from (or cost of) the closing transaction and the Fund's basis in the contract. The Fund may purchase and sell foreign currency forward contracts for purposes of seeking to enhance portfolio returns and manage portfolio risk more efficiently. Foreign currency forward contracts may also be used to gain exposure to a particular currency or to hedge against the risk of loss due to changing currency exchange rates. Foreign currency forward contracts to purchase or sell a foreign currency may also be used in anticipation of future purchases or sales of securities denominated in foreign currency, even if the specific investments have not yet been selected.
The use of foreign currency forward contracts involves, to varying degrees, elements of risk in excess of the amount recognized in the Statement of Assets and Liabilities, including counterparty risk, market risk and illiquidity risk. Counterparty risk is heightened for these instruments because foreign currency forward contracts are not exchange-traded and therefore no clearinghouse or exchange stands ready to meet the obligations under such contracts. Thus, the Fund faces the risk that its counterparties under such contracts may not perform their obligations. Market risk is the risk that the value of a foreign currency forward contract will depreciate due to unfavorable changes in exchange rates. Illiquidity risk arises because the secondary market for foreign currency forward contracts may have less liquidity relative to markets for other securities and financial instruments. Risks also arise from the possible movements in the foreign exchange rates underlying these instruments. While the Fund may enter into forward contracts to reduce currency exchange risks, changes in currency exchange rates may result in poorer overall performance for the Fund than if it had not engaged in such transactions. Exchange rate movements can be large, depending on the currency, and can last for extended periods of time, affecting the value of the Fund's assets. Moreover, there may be an imperfect correlation between the Fund's holdings of securities denominated in a particular currency and forward contracts entered into by the Fund. Such imperfect correlation may prevent the Fund from achieving the intended hedge or expose the Fund to the risk of currency
exchange loss. The unrealized appreciation (depreciation) on forward contracts also reflects the Fund's exposure at the valuation date to credit loss in the event of a counterparty’s failure to perform its obligations. As of April 30, 2021, the Fund did not hold any foreign currency forward contracts.
(I) Foreign Currency Transactions. The Fund's books and records are maintained in U.S. dollars. Prices of securities denominated in foreign currency amounts are translated into U.S. dollars at the mean between the buying and selling rates last quoted by any major U.S. bank at the following dates:
(i) market value of investment securities, other assets and liabilities— at the valuation date; and
(ii) purchases and sales of investment securities, income and expenses—at the date of such transactions.
The assets and liabilities that are denominated in foreign currency amounts are presented at the exchange rates and market values at the close of the period. The realized and unrealized changes in net assets arising from fluctuations in exchange rates and market prices of securities are not separately presented.
Net realized gain (loss) on foreign currency transactions represents net currency gains or losses realized as a result of differences between the amounts of securities sale proceeds or purchase cost, dividends, interest and withholding taxes as recorded on the Fund's books, and the U.S. dollar equivalent amount actually received or paid. Net currency gains or losses from valuing such foreign currency denominated assets and liabilities, other than investments at valuation date exchange rates, are reflected in unrealized foreign exchange gains or losses.
(J) Securities Lending. In order to realize additional income, the Fund may engage in securities lending, subject to the limitations set forth in the 1940 Act and relevant guidance by the staff of the Securities and Exchange Commission (“SEC”). If the Fund engages in securities lending, the Fund will lend through its custodian, JPMorgan Chase Bank, N.A., ("JPMorgan"), acting as securities lending agent on behalf of the Fund. Under the current arrangement, JPMorgan will manage the Fund's collateral in accordance with the securities lending agency agreement between the Fund and JPMorgan, and indemnify the Fund against counterparty risk. The loans will be collateralized by cash (which may be invested in a money market fund) and/or non-cash collateral (which may include U.S. Treasury securities and/or U.S. government agency securities issued or guaranteed by the United States government or its agencies or instrumentalities) at least equal at all times to the market value of the securities loaned. The Fund bears the risk of delay in recovery of, or loss of rights in, the securities loaned. The Fund may also record a realized gain or loss on securities deemed sold due to a borrower’s inability to return securities on loan. The Fund bears the risk of any loss on investment of cash collateral. The Fund will receive compensation for lending its securities in the form of fees or it will retain a portion of interest earned on the investment of any cash collateral. The Fund will also continue to receive interest and dividends on the securities loaned
Notes to Financial Statements (Unaudited) (continued)
and any gain or loss in the market price of the securities loaned that may occur during the term of the loan will be for the account of the Fund. Income earned from securities lending activities, if any, is reflected in the Statement of Operations. Securities on loan as of April 30, 2021, are shown in the Portfolio of Investments.
Prior to November 23, 2020, these services were provided by State Street Bank and Trust Company (“State Street”).
(K) Foreign Securities Risk. The Fund may invest in foreign securities, which carry certain risks that are in addition to the usual risks inherent in domestic securities. These risks include those resulting from currency fluctuations, future adverse political or economic developments and possible imposition of currency exchange blockages or other foreign governmental laws or restrictions. These risks are likely to be greater in emerging markets than in developed markets. The ability of issuers of debt securities held by the Fund to meet their obligations may be affected by, among other things, economic or political developments in a specific country, industry or region. For example, the Fund's portfolio has significant investments in the Asia-Pacific region. The development and stability of the Asia-Pacific region can be adversely affected by, among other regional and global developments, trade barriers, exchange controls and other measures imposed or negotiated by the countries with which they trade. Some Asia-Pacific countries can be characterized as emerging markets or newly industrialized and may experience more volatile economic cycles and less liquid markets than developed countries.
(L) Indemnifications. Under the Trust’s organizational documents, its officers and trustees are indemnified against certain liabilities that may arise out of performance of their duties to the Trust. Additionally, in the normal course of business, the Fund enters into contracts with third-party service providers that contain a variety of representations and warranties and that may provide general indemnifications. The Fund's maximum exposure under these arrangements is unknown, as this would involve future claims that may be made against the Fund that have not yet occurred. The Manager believes that the risk of loss in connection with these potential indemnification obligations is remote. However, there can be no assurance that material liabilities related to such obligations will not arise in the future, which could adversely impact the Fund.
(M) Quantitative Disclosure of Derivative Holdings. The following tables show additional disclosures related to the Fund's derivative and hedging activities, including how such activities are accounted for and their effect on the Fund's financial positions, performance and cash flows. These derivatives are not accounted for as hedging instruments.
The effect of derivative instruments on the Statement of Operations for the six-month period ended April 30, 2021:
| Net Realized Gain (Loss) from: | Foreign
Exchange
Contracts
Risk | Total |
| Forward Contracts | $303 | $303 |
| Total Net Realized Gain (Loss) | $303 | $303 |
Note 3–Fees and Related Party Transactions
(A) Manager and Subadvisor. New York Life Investments, a registered investment adviser and an indirect, wholly-owned subsidiary of New York Life Insurance Company (“New York Life”), serves as the Fund’s Manager, pursuant to an Amended and Restated Management Agreement (“Management Agreement”). The Manager provides offices, conducts clerical, recordkeeping and bookkeeping services and keeps most of the financial and accounting records required to be maintained by the Fund. Except for the portion of salaries and expenses that are the responsibility of the Fund, the Manager pays the salaries and expenses of all personnel affiliated with the Fund and certain operational expenses of the Fund. The Fund reimburses New York Life Investments in an amount equal to the portion of the compensation of the Chief Compliance Officer attributable to the Fund. Candriam Belgium S.A. (“Candriam Belgium” or the “Subadvisor”), a registered investment adviser and an indirect, wholly-owned subsidiary of New York Life, serves as Subadvisor to the Fund and is responsible for the day-to-day portfolio management of the Fund. Pursuant to the terms of a Subadvisory Agreement (“Subadvisory Agreement”) between New York Life Investments and Candriam Belgium, New York Life Investments pays for the services of the Subadvisor.
Pursuant to the Management Agreement, the Fund pays the Manager a monthly fee for the services performed and the facilities furnished at an annual rate of the Fund’s average daily net assets as follows: 1.00% up to $1 billion and 0.975% in excess of $1 billion. During the six-month period ended April 30, 2021, the effective management fee rate was 1.00% of the Fund’s average daily net assets, exclusive of any applicable waivers/reimbursements.
New York Life Investments has contractually agreed to waive fees and/or reimburse expenses so that Total Annual Fund Operating Expenses (excluding taxes, interest, litigation, extraordinary expenses, brokerage and other transaction expenses relating to the purchase or sale of portfolio investments and acquired (underlying) fund fees and expenses) do not exceed the following percentages of daily net assets: Class A, 1.50%; and Class I, 1.10%. New York Life Investments will apply an equivalent waiver or reimbursement, in an equal number of basis points of the Class A shares waiver/reimbursement, to Investor Class and Class C. In addition, New York Life Investments has also contractually agreed to waive fees and/or reimburse expenses so that Total Annual Fund Operating Expenses (excluding taxes, interest, litigation, extraordinary expenses, brokerage and other transaction expenses relating to the purchase or sale of portfolio investments, and acquired
| 26 | MainStay Candriam Emerging Markets Equity Fund |
(underlying) fund fees and expenses) for Class R6 shares do not exceed those of Class I. These agreements will remain in effect until February 28, 2022, and shall renew automatically for one-year terms unless New York Life Investments provides written notice of termination prior to the start of the next term or upon approval of the Board.
Prior to February 28, 2021, New York Life Investments has contractually agreed to waive fees and/or reimburse expenses so that Total Annual Fund Operating Expenses (excluding taxes, interest, litigation, extraordinary expenses, brokerage and other transaction expenses relating to the purchase or sale of portfolio investments and acquired (underlying) fund fees and expenses) did not exceed the following percentages of average daily net assets: Class A, 1.50% and Class I, 1.15%. New York Life Investments applied an equivalent waiver or reimbursement, in an equal number of basis points of the Class A shares waiver/reimbursement to the Investor Class and Class C shares.
During the six-month period ended April 30, 2021, New York Life Investments earned fees from the Fund in the amount of $441,783 and waived fees and/or reimbursed expenses in the amount of $94,885 and paid the Subadvisor fees in the amount of $173,605.
JPMorgan provides sub-administration and sub-accounting services to the Fund pursuant to an agreement with New York Life Investments. These services include calculating the daily NAVs of the Fund, maintaining the general ledger and sub-ledger accounts for the calculation of the Fund's NAVs, and assisting New York Life Investments in conducting various aspects of the Fund's administrative operations. For providing these services to the Fund, JPMorgan is compensated by New York Life Investments.
Prior to November 23, 2020, these services were provided by State Street.
Pursuant to an agreement between the Trust and New York Life Investments, New York Life Investments is responsible for providing or procuring certain regulatory reporting services for the Fund. The Fund will reimburse New York Life Investments for the actual costs incurred by New York Life Investments in connection with providing or procuring these services for the Fund.
(B) Distribution and Service Fees. The Trust, on behalf of the Fund, has entered into a distribution agreement with NYLIFE Distributors LLC (the “Distributor”), an affiliate of New York Life Investments. The Fund has adopted distribution plans (the “Plans”) in accordance with the provisions of Rule 12b-1 under the 1940 Act.
Pursuant to the Class A and Investor Class Plans, the Distributor receives a monthly distribution fee from the Class A and Investor Class shares at an annual rate of 0.25% of the average daily net assets of the Class A and Investor Class shares for distribution and/or service activities as designated by the Distributor. Pursuant to the Class C Plan, Class C shares pay the Distributor a monthly distribution fee at an annual rate of 0.75% of the average daily net assets of the Class C shares, along with a service fee at an annual rate of 0.25% of the average daily net assets of
the Class C shares, for a total 12b-1 fee of 1.00%. Class I and Class R6 shares are not subject to a distribution and/or service fee.
The Plans provide that the distribution and service fees are payable to the Distributor regardless of the amounts actually expended by the Distributor for distribution of the Fund's shares and service activities.
(C) Sales Charges. The Fund was advised by the Distributor that the amount of initial sales charges retained on sales of Class A and Investor Class shares during the six-month period ended April 30, 2021, were $569 and $132, respectively.
The Fund was also advised that the Distributor retained CDSCs on redemptions of Class A shares during the six-month period ended April 30, 2021, of $3.
(D) Transfer, Dividend Disbursing and Shareholder Servicing Agent. NYLIM Service Company LLC, an affiliate of New York Life Investments, is the Fund's transfer, dividend disbursing and shareholder servicing agent pursuant to an agreement between NYLIM Service Company LLC and the Trust. NYLIM Service Company LLC has entered into an agreement with DST Asset Manager Solutions, Inc. ("DST"), pursuant to which DST performs certain transfer agent services on behalf of NYLIM Service Company LLC. New York Life Investments has contractually agreed to limit the transfer agency expenses charged to the Fund’s share classes to a maximum of 0.35% of that share class’s average daily net assets on an annual basis after deducting any applicable Fund or class-level expense reimbursement or small account fees. This agreement will remain in effect until February 28, 2022, and shall renew automatically for one-year terms unless New York Life Investments provides written notice of termination prior to the start of the next term or upon approval of the Board. During the six-month period ended April 30, 2021, transfer agent expenses incurred by the Fund and any reimbursements, pursuant to the aforementioned Transfer Agency expense limitation agreement, were as follows:
| Class | Expense | Waived |
| Class A | $2,300 | $— |
| Investor Class | 616 | — |
| Class C | 321 | — |
| Class I | 189 | — |
| Class R6 | 1,704 | — |
(E) Small Account Fee. Shareholders with small accounts adversely impact the cost of providing transfer agency services. In an effort to reduce total transfer agency expenses, the Fund has implemented a small account fee on certain types of accounts. As described in the Fund's prospectus, certain shareholders with an account balance of less than $1,000 ($5,000 for Class A share accounts) are charged an annual per account fee of $20 (assessed semi-annually), the proceeds from which offset transfer agent fees as reflected in the Statement of Operations. This small account fee will not apply to certain types of accounts as described further in the Fund’s prospectus.
Notes to Financial Statements (Unaudited) (continued)
(F) Investments in Affiliates (in 000’s). During the six-month period ended April 30, 2021, purchases and sales transactions, income earned from investments and shares held of investment companies managed by New York Life Investments or its affiliates were as follows:
| Affiliated Investment Companies | Value,
Beginning
of Period | Purchases
at Cost | Proceeds
from
Sales | Net
Realized
Gain/(Loss)
on Sales | Change in
Unrealized
Appreciation/
(Depreciation) | Value,
End of
Period | Dividend
Income | Other
Distributions | Shares
End of
Period |
| MainStay U.S. Government Liquidity Fund | $ 1,530 | $ 2,973 | $ (4,503) | $ — | $ — | $ — | $ —(a) | $ — | — |
(G) Capital. As of April 30, 2021, New York Life and its affiliates beneficially held shares of the Fund with the values and percentages of net assets as follows:
| Class I | $38,186 | 7.7% |
| Class R6 | 38,170 | 0.0‡ |
| ‡ | Less than one-tenth of a percent. |
Note 4-Federal Income Tax
As of April 30, 2021, the cost and unrealized appreciation (depreciation) of the Fund’s investment portfolio, including applicable derivative contracts and other financial instruments, as determined on a federal income tax basis, were as follows:
| | Federal Tax
Cost | Gross
Unrealized
Appreciation | Gross
Unrealized
(Depreciation) | Net
Unrealized
Appreciation/
(Depreciation) |
| Investments | $63,772,491 | $23,533,928 | $(1,397,943) | $22,135,985 |
As of October 31, 2020, for federal income tax purposes, capital loss carryforwards of $15,298,976 were available as shown in the table below, to the extent provided by the regulations to offset future realized gains of the Fund through the years indicated. To the extent that these capital loss carryforwards are used to offset future capital gains, it is probable that the capital gains so offset will not be distributed to shareholders. No capital gain distributions shall be made until any capital loss carryforwards have been fully utilized.
Capital Loss
Available Through | Short-Term
Capital Loss
Amounts (000’s) | Long-Term
Capital Loss
Amounts (000’s) |
| Unlimited | $11,842 | $3,457 |
During the year ended October 31, 2020, the tax character of distributions paid as reflected in the Statements of Changes in Net Assets was as follows:
| | 2020 |
| Distributions paid from: | |
| Ordinary Income | $1,028,532 |
Note 5–Custodian
JPMorgan is the custodian of cash and securities held by the Fund. Custodial fees are charged to the Fund based on the Fund's net assets and/or the market value of securities held by the Fund and the number of certain transactions incurred by the Fund.
Prior to November 23, 2020, these services were provided by State Street. The services provided by State Street were a direct expense of the Fund and are included in the Statement of Operations as Custodian fees which totaled $9,233 for the period November 1, 2020 through November 22, 2020.
Note 6–Line of Credit
The Fund and certain other funds managed by New York Life Investments maintain a line of credit with a syndicate of banks in order to secure a source of funds for temporary purposes to meet unanticipated or excessive redemption requests.
Effective July 28, 2020, under the credit agreement (the “Credit Agreement”), the aggregate commitment amount is $600,000,000 with an additional uncommitted amount of $100,000,000. The commitment fee is an annual rate of 0.15% of the average commitment amount payable quarterly, regardless of usage, to JPMorgan, who serves as the agent to the syndicate. The commitment fee is allocated among the Fund and certain other funds managed by New York Life Investments based upon their respective net assets and other factors. Interest on any revolving credit loan is charged based upon the Federal Funds Rate or the one-month London Interbank Offered Rate (“LIBOR”), whichever is higher. The Credit Agreement expires on July 27, 2021, although the Fund, certain other funds managed by New York Life Investments and the syndicate of banks may renew the Credit Agreement for an additional year on the same or different terms or enter into a credit agreement with a different syndicate of banks. Prior to July 28, 2020, the aggregate commitment amount and the commitment fee were the same as those under the current Credit Agreement, but State Street served as agent to the syndicate. During the six-month period ended April 30, 2021, there were no borrowings made or outstanding with respect to the Fund under the Credit Agreement or the credit agreement for which State Street served as agent.
| 28 | MainStay Candriam Emerging Markets Equity Fund |
Note 7–Interfund Lending Program
Pursuant to an exemptive order issued by the SEC, the Fund, along with certain other funds managed by New York Life Investments, may participate in an interfund lending program. The interfund lending program provides an alternative credit facility that permits the Fund and certain other funds managed by New York Life Investments to lend or borrow money for temporary purposes directly to or from one another, subject to the conditions of the exemptive order. During the six-month period ended April 30, 2021, there were no interfund loans made or outstanding with respect to the Fund.
Note 8–Purchases and Sales of Securities (in 000’s)
During the six-month period ended April 30, 2021, purchases and sales of securities, other than short-term securities, were $28,581 and $47,534, respectively.
Note 9–Capital Share Transactions
Transactions in capital shares for the six-month period ended April 30, 2021 and the year ended October 31, 2020, were as follows:
| Class A | Shares | Amount |
| Period ended April 30, 2021: | | |
| Shares sold | 149,022 | $ 1,965,061 |
| Shares issued to shareholders in reinvestment of distributions | 294 | 3,539 |
| Shares redeemed | (31,701) | (409,488) |
| Net increase (decrease) in shares outstanding before conversion | 117,615 | 1,559,112 |
| Shares converted into Class A (See Note 1) | 11,809 | 146,030 |
| Net increase (decrease) | 129,424 | $ 1,705,142 |
| Year ended October 31, 2020: | | |
| Shares sold | 85,514 | $ 819,852 |
| Shares issued to shareholders in reinvestment of distributions | 168 | 1,543 |
| Shares redeemed | (16,986) | (159,051) |
| Net increase (decrease) in shares outstanding before conversion | 68,696 | 662,344 |
| Shares converted into Class A (See Note 1) | 26,972 | 229,361 |
| Net increase (decrease) | 95,668 | $ 891,705 |
| |
| Investor Class | Shares | Amount |
| Period ended April 30, 2021: | | |
| Shares sold | 20,464 | $ 270,597 |
| Shares issued to shareholders in reinvestment of distributions | 70 | 842 |
| Shares redeemed | (5,091) | (65,794) |
| Net increase (decrease) in shares outstanding before conversion | 15,443 | 205,645 |
| Shares converted into Investor Class (See Note 1) | 1,121 | 14,928 |
| Shares converted from Investor Class (See Note 1) | (11,710) | (144,674) |
| Net increase (decrease) | 4,854 | $ 75,899 |
| Year ended October 31, 2020: | | |
| Shares sold | 69,626 | $ 655,868 |
| Shares issued to shareholders in reinvestment of distributions | 251 | 2,383 |
| Shares redeemed | (22,576) | (216,494) |
| Net increase (decrease) in shares outstanding before conversion | 47,301 | 441,757 |
| Shares converted from Investor Class (See Note 1) | (26,981) | (229,361) |
| Net increase (decrease) | 20,320 | $ 212,396 |
| |
| Class C | Shares | Amount |
| Period ended April 30, 2021: | | |
| Shares sold | 3,453 | $ 44,739 |
| Shares redeemed | (5,043) | (64,006) |
| Net increase (decrease) in shares outstanding before conversion | (1,590) | (19,267) |
| Shares converted from Class C (See Note 1) | (1,240) | (16,284) |
| Net increase (decrease) | (2,830) | $ (35,551) |
| Year ended October 31, 2020: | | |
| Shares sold | 17,452 | $ 162,687 |
| Shares issued to shareholders in reinvestment of distributions | 100 | 915 |
| Shares redeemed | (3,170) | (33,663) |
| Net increase (decrease) | 14,382 | $ 129,939 |
| |
| Class I | Shares | Amount |
| Period ended April 30, 2021: | | |
| Shares sold | 311,720 | $ 4,083,662 |
| Shares issued to shareholders in reinvestment of distributions | 17 | 210 |
| Shares redeemed | (278,050) | (3,564,679) |
| Net increase (decrease) | 33,687 | $ 519,193 |
| Year ended October 31, 2020: | | |
| Shares issued to shareholders in reinvestment of distributions | 68 | $ 627 |
| Shares redeemed | (1,760) | (18,830) |
| Net increase (decrease) | (1,692) | $ (18,203) |
| |
Notes to Financial Statements (Unaudited) (continued)
| Class R6 | Shares | Amount |
| Period ended April 30, 2021: | | |
| Shares sold | 134,492 | $ 1,796,240 |
| Shares issued to shareholders in reinvestment of distributions | 37,020 | 446,085 |
| Shares redeemed | (1,744,769) | (22,770,018) |
| Net increase (decrease) | (1,573,257) | $(20,527,693) |
| Year ended October 31, 2020: | | |
| Shares sold | 4,713,936 | $ 45,231,543 |
| Shares issued to shareholders in reinvestment of distributions | 110,841 | 1,023,064 |
| Shares redeemed | (2,510,116) | (21,654,065) |
| Net increase (decrease) | 2,314,661 | $ 24,600,542 |
Note 10–Recent Accounting Pronouncement
In March 2020, the Financial Accounting Standards Board issued Accounting Standards Update 2020-04 (“ASU 2020-04”), which provides optional guidance to ease the potential accounting burden associated with transitioning away from LIBOR and other reference rates that are expected to be discontinued. ASU 2020-04 was effective immediately upon release of the update on March 12, 2020 and remains effective through December 31, 2022. At this time, the Manager is evaluating the implications of certain other provisions of ASU 2020-04 related to new disclosure requirements and any impact on the financial statement disclosures has not yet been determined.
Note 11–Other Matters
An outbreak of COVID-19, first detected in December 2019, has developed into a global pandemic and has resulted in travel restrictions, closure of international borders, certain businesses and securities markets, restrictions on securities trading activities, prolonged quarantines, supply chain disruptions, and lower consumer demand, as well as general concern and uncertainty. The continued impact of COVID-19 is uncertain and could further adversely affect the global economy, national economies, individual issuers and capital markets in unforeseeable ways and result in a substantial and extended economic downturn. Developments that disrupt global economies and financial markets, such as COVID-19, may magnify factors that affect the Fund's performance.
Note 12–Subsequent Events
In connection with the preparation of the financial statements of the Fund as of and for the six-month period ended April 30, 2021, events and transactions subsequent to April 30, 2021, through the date the financial statements were issued have been evaluated by the Manager for possible adjustment and/or disclosure. No subsequent events requiring financial statement adjustment or disclosure have been identified.
| 30 | MainStay Candriam Emerging Markets Equity Fund |
Board Consideration and Approval of Management Agreement and Subadvisory Agreement (Unaudited)
The continuation of the Management Agreement with respect to the MainStay Candriam Emerging Markets Equity Fund (“Fund”) and New York Life Investment Management LLC (“New York Life Investments”) and the Subadvisory Agreement between New York Life Investments and Candriam Belgium S.A. (“Candriam Belgium”) with respect to the Fund (together, “Advisory Agreements”), following an initial term of up to two years, is subject to annual review and approval by the Board of Trustees of MainStay Funds Trust (“Board” of the “Trust”) in accordance with Section 15 of the Investment Company Act of 1940, as amended (“1940 Act”). At its December 9–10, 2020 meeting, the Board, including the Trustees who are not an “interested person” (as such term is defined in the 1940 Act) of the Trust (“Independent Trustees”) voting separately, unanimously approved the continuation of each of the Advisory Agreements for a one-year period.
In reaching the decision to approve the continuation of each of the Advisory Agreements, the Board considered information furnished by New York Life Investments and Candriam Belgium in connection with an annual contract review process undertaken by the Board that took place at meetings of the Board and its Contracts Committee during September 2020 through December 2020, as well as other information furnished to the Board and its Committees throughout the year, as deemed relevant by the Trustees. Information requested by and furnished to the Board for consideration in connection with the contract review process included, among other items, reports on the Fund and “peer funds” prepared by Strategic Insight Mutual Fund Research and Consulting, LLC (“Strategic Insight”), an independent third-party service provider engaged by the Board to report objectively on the Fund’s investment performance, management fee and total expenses. The Board also considered information on the fees charged to other investment advisory clients of New York Life Investments and/or Candriam Belgium that follow investment strategies similar to those of the Fund, if any, and, when applicable, the rationale for any differences in the Fund’s management and subadvisory fees and the fees charged to those other investment advisory clients. In addition, the Board considered information furnished by New York Life Investments and Candriam Belgium in response to requests prepared on behalf of the Board, and in consultation with the Independent Trustees, by independent legal counsel to the Independent Trustees, which encompassed a variety of topics, including those summarized below.
The Board took into account information provided in connection with its meetings throughout the year, including, among other items, information regarding the legal standards and fiduciary obligations applicable to its consideration of the continuation of each of the Advisory Agreements and investment performance reports on the Fund as well as presentations from New York Life Investments and Candriam Belgium personnel. The Board also took into account other information received from New York Life Investments throughout the year, including, among other items, periodic reports on legal and compliance matters, risk management, portfolio turnover, brokerage commissions and non-advisory services provided to the Fund by New York Life Investments. The contract review process, including the structure and format for materials provided to the
Board, has been developed in consultation with the Board. The Independent Trustees also met in executive sessions with their independent legal counsel and, for a portion thereof, with senior management of New York Life Investments.
In addition to information provided to the Board throughout the year, the Board received information in connection with its June 2020 meeting provided specifically in response to requests prepared on behalf of the Board, and in consultation with the Independent Trustees, by independent legal counsel regarding the Fund’s distribution arrangements. In addition, the Board received information regarding the Fund’s asset levels, share purchase and redemption activity and the payment of Rule 12b-1 and/or other fees by applicable share classes of the Fund, among other information.
In considering the continuation of each of the Advisory Agreements, the Trustees reviewed and evaluated the information and factors they believed to reasonably be necessary and appropriate in light of legal advice furnished to them by independent legal counsel and through the exercise of their own business judgment. Although individual Trustees may have weighed certain factors or information differently, the factors considered by the Board are described in greater detail below and include, among other factors: (i) the nature, extent and quality of the services provided to the Fund by New York Life Investments and Candriam Belgium; (ii) the qualifications of the portfolio managers of the Fund and the historical investment performance of the Fund, New York Life Investments and Candriam Belgium; (iii) the costs of the services provided, and profits realized, by New York Life Investments and Candriam Belgium from their relationships with the Fund; (iv) the extent to which economies of scale have been realized or may be realized as the Fund grows and the extent to which economies of scale have benefited or may benefit the Fund’s shareholders; and (v) the reasonableness of the Fund’s management and subadvisory fees and total ordinary operating expenses. Although the Board recognized that comparisons between the Fund’s fees and expenses and those of other funds are imprecise given different terms of agreements, variations in fund strategies and other factors, the Board considered the reasonableness of the Fund’s management fee and total ordinary operating expenses as compared to the peer funds identified by Strategic Insight. Throughout their considerations, the Trustees acknowledged the commitment of New York Life Investments and its affiliates to serve the MainStay Group of Funds, as well as their capacity, experience, resources, financial stability and reputations. The Trustees also acknowledged the entrepreneurial and other risks assumed by New York Life Investments in sponsoring and managing the Fund.
The Trustees noted that, throughout the year, the Trustees are afforded an opportunity to ask questions of, and request additional information or materials from, New York Life Investments and Candriam Belgium. The Board’s decision with respect to each of the Advisory Agreements may have also been based, in part, on the Board’s knowledge of New York Life Investments and Candriam Belgium resulting from, among other things, the Board’s consideration of each of the Advisory Agreements in prior years, the advisory agreements for other funds in the MainStay Group of
Board Consideration and Approval of Management Agreement and Subadvisory Agreement (Unaudited) (continued)
Funds, the Board’s review throughout the year of the performance and operations of other funds in the MainStay Group of Funds and each Trustee’s business judgment and industry experience. In addition to considering the above-referenced factors, the Board observed that in the marketplace there are a range of investment options available to the Fund’s shareholders and such shareholders, having had the opportunity to consider other investment options, have chosen to invest in the Fund.
The factors that figured prominently in the Board’s decision to approve the continuation of each of the Advisory Agreements during its December 9–10, 2020 meeting are summarized in more detail below, and the Board did not consider any factor or information controlling in reaching such decision.
Nature, Extent and Quality of Services Provided by New York Life Investments and Candriam Belgium
The Board examined the nature, extent and quality of the services that New York Life Investments provides to the Fund. The Board evaluated New York Life Investments’ experience and capabilities in serving as manager of the Fund and considered that the Fund operates in a “manager-of-managers” structure. The Board also considered New York Life Investments’ responsibilities and services provided pursuant to this structure, including evaluating the performance of Candriam Belgium, making recommendations to the Board as to whether the Subadvisory Agreement should be renewed, modified or terminated and periodically reporting to the Board regarding the results of New York Life Investments’ evaluation and monitoring functions. The Board noted that New York Life Investments manages other mutual funds, serves a variety of other investment advisory clients, including other pooled investment vehicles, and has experience overseeing mutual fund service providers, including subadvisors. The Board considered the experience of senior personnel at New York Life Investments providing management and administrative and other non-advisory services to the Fund as well as New York Life Investments’ reputation and financial condition. The Board observed that New York Life Investments devotes significant resources and time to providing management and non-advisory services to the Fund, including New York Life Investments’ supervision and due diligence reviews of Candriam Belgium and ongoing analysis of, and interactions with, Candriam Belgium with respect to, among other things, the Fund’s investment performance and risks as well as Candriam Belgium’s investment capabilities and subadvisory services with respect to the Fund.
The Board also considered the range of services that New York Life Investments provides to the Fund under the terms of the Management Agreement, including: (i) fund accounting and ongoing supervisory services provided by New York Life Investments’ Fund Administration and Accounting Group; (ii) investment supervisory and analytical services provided by New York Life Investments’ Investment Consulting Group; (iii) compliance services provided by the Trust’s Chief Compliance Officer as well as New York Life Investments’ compliance department, including supervision and implementation of the Fund’s compliance program; (iv) legal services provided by New York Life Investments’ Office of the
General Counsel; and (v) risk management monitoring and analysis by compliance and investment personnel. The Board noted that New York Life Investments provides certain other non-advisory services to the Fund. In addition, the Board considered New York Life Investments’ willingness to invest in personnel, infrastructure, technology, operational enhancements, cyber security, information security, shareholder privacy resources and business continuity planning designed to benefit the Fund and noted that New York Life Investments is responsible for compensating the Trust’s officers, except for a portion of the salary of the Trust’s Chief Compliance Officer. The Board recognized that New York Life Investments has provided an increasingly broad array of non-advisory services to the MainStay Group of Funds as a result of regulatory and other developments, including in connection with the designation of New York Life Investments as the administrator of the MainStay Group of Funds’ liquidity risk management program adopted under the 1940 Act. The Board considered benefits to shareholders from being part of the MainStay Group of Funds, including the privilege of exchanging investments between the same class of shares of funds in the MainStay Group of Funds, including without the imposition of a sales charge (if any).
The Board also examined the nature, extent and quality of the investment advisory services that Candriam Belgium provides to the Fund and considered the terms of each of the Advisory Agreements. The Board evaluated Candriam Belgium’s experience in serving as subadvisor to the Fund and advising other portfolios and Candriam Belgium’s track record and experience in providing investment advisory services, the experience of investment advisory, senior management and administrative personnel at Candriam Belgium and New York Life Investments’ and Candriam Belgium’s overall resources, legal and compliance environment, capabilities and history. In addition to information provided in connection with quarterly meetings with the Trust’s Chief Compliance Officer, the Board considered information regarding the compliance policies and procedures of New York Life Investments and Candriam Belgium and acknowledged their commitment to further developing and strengthening compliance programs relating to the Fund. The Board reviewed Candriam Belgium’s ability to attract and retain qualified investment professionals and willingness to invest in personnel to service and support the Fund. In this regard, the Board considered the experience of the Fund’s portfolio managers, the number of accounts managed by the portfolio managers and the method for compensating the portfolio managers.
In addition, the Board considered discussions with New York Life Investments regarding the implementation of its business continuity plans and recognized steps taken by New York Life Investments and Candriam Belgium to continue to provide the same nature, extent and quality of services to the Fund during the COVID-19 pandemic.
Based on these considerations, the Board concluded that the Fund would likely continue to benefit from the nature, extent and quality of these services.
| 32 | MainStay Candriam Emerging Markets Equity Fund |
Investment Performance
In evaluating the Fund’s investment performance, the Board considered investment performance results over various periods in light of the Fund’s investment objective, strategies and risks. The Board considered investment reports on, and analysis of, the Fund’s performance provided to the Board throughout the year. These reports include, among other items, information on the Fund’s gross and net returns, the Fund’s investment performance compared to relevant investment categories and the Fund’s benchmark, the Fund’s risk-adjusted investment performance and the Fund’s investment performance as compared to peer funds, as appropriate, as well as portfolio attribution information and commentary on the effect of market conditions. The Board also considered information provided by Strategic Insight showing the investment performance of the Fund as compared to peer funds.
The Board also gave weight to its discussions with senior management at New York Life Investments concerning the Fund’s investment performance attributable to Candriam Belgium as well as discussions between the Fund’s portfolio managers and the members of the Board’s Investment Committee, which generally occur on an annual basis. In addition, the Board considered any specific actions that New York Life Investments or Candriam Belgium had taken, or had agreed to take, to seek to enhance Fund investment performance and the results of those actions.
Based on these considerations, the Board concluded that its review of the Fund’s investment performance and related information supported a determination to approve the continuation of each of the Advisory Agreements.
Costs of the Services Provided, and Profits Realized, by New York Life Investments and Candriam Belgium
The Board considered the costs of the services provided under each of the Advisory Agreements. The Board also considered the profits realized by New York Life Investments and its affiliates, including Candriam Belgium, due to their relationships with the Fund. Because Candriam Belgium is an affiliate of New York Life Investments whose subadvisory fee is paid by New York Life Investments, not the Fund, the Board considered cost and profitability information for New York Life Investments and Candriam Belgium in the aggregate.
In addition, the Board acknowledged the difficulty in obtaining reliable comparative data about mutual fund managers’ profitability because such information generally is not publicly available and may be impacted by numerous factors, including the structure of a fund manager’s organization, the types of funds it manages, the methodology used to allocate certain fixed costs to specific funds and the manager’s capital structure and costs of capital.
In evaluating the costs of the services provided by New York Life Investments and Candriam Belgium and profits realized by New York Life Investments and its affiliates, including Candriam Belgium, the Board considered, among other factors, each party’s continuing investments in,
or willingness to invest in, personnel, systems, equipment and other resources and infrastructure to support and further enhance the management of the Fund, and that New York Life Investments is responsible for paying the subadvisory fee for the Fund. The Board also considered the financial resources of New York Life Investments and Candriam Belgium and acknowledged that New York Life Investments and Candriam Belgium must be in a position to attract and retain experienced professional personnel and to maintain a strong financial position for New York Life Investments and Candriam Belgium to continue to provide high-quality services to the Fund. The Board recognized that the Fund benefits from the allocation of certain fixed costs among the funds in the MainStay Group of Funds, among other expected benefits resulting from its relationship with New York Life Investments.
The Board considered information regarding New York Life Investments’ methodology for calculating profitability and allocating costs provided by New York Life Investments in connection with the fund profitability analysis presented to the Board. The Board previously engaged an independent consultant to review the methods used to allocate costs among the funds in the MainStay Group of Funds. The Board noted that the independent consultant had concluded that New York Life Investments’ methods for allocating costs and procedures for estimating overall profitability of the relationship with the funds in the MainStay Group of Funds are reasonable and that New York Life Investments continued to use the same method of calculating profit and allocating costs since the independent consultant’s review. The Board recognized the difficulty in calculating and evaluating a manager’s profitability with respect to the Fund and noted that other profitability methodologies may also be reasonable.
The Board also considered certain fall-out benefits that may be realized by New York Life Investments and its affiliates due to their relationships with the Fund, including reputational and other indirect benefits. In addition, the Board considered its review of a money market fund advised by New York Life Investments and an affiliated subadvisor that serves as an investment option for the Fund, including the potential rationale for and costs associated with investments in this money market fund by the Fund, if any, and considered information from New York Life Investments that the nature and type of specific investment advisory services provided to this money market fund are distinct from, or in addition to, the investment advisory services provided to the Fund.
The Board observed that, in addition to fees earned by New York Life Investments for managing the Fund, New York Life Investments’ affiliates also earn revenues from serving the Fund in various other capacities, including as the Fund’s transfer agent and distributor. The Board considered information about these other revenues and their impact on the profitability of the relationship with the Fund to New York Life Investments and its affiliates. The Board noted that, although it assessed the overall profitability of the Fund to New York Life Investments and its affiliates as part of the contract review process, when considering the reasonableness of the fee paid to New York Life Investments and its affiliates under each of the Advisory Agreements, the Board considered
Board Consideration and Approval of Management Agreement and Subadvisory Agreement (Unaudited) (continued)
the profitability of New York Life Investments’ relationship with the Fund on a pre-tax basis and without regard to distribution expenses incurred by New York Life Investments from its own resources.
After evaluating the information deemed relevant by the Trustees, the Board concluded that any profits realized by New York Life Investments and its affiliates, including Candriam Belgium, due to their relationships with the Fund were not excessive.
Management and Subadvisory Fees and Total Ordinary Operating Expenses
The Board evaluated the reasonableness of the fee paid under each of the Advisory Agreements and the Fund’s total ordinary operating expenses. The Board primarily considered the reasonableness of the management fee paid by the Fund to New York Life Investments, because the subadvisory fee paid to Candriam Belgium is paid by New York Life Investments, not the Fund. The Board also considered the reasonableness of the subadvisory fee paid by New York Life Investments and the amount of the management fee retained by New York Life Investments.
In assessing the reasonableness of the Fund’s fees and expenses, the Board primarily considered comparative data provided by Strategic Insight on the fees and expenses charged by similar mutual funds managed by other investment advisers. In addition, the Board considered information provided by New York Life Investments and Candriam Belgium on fees charged to other investment advisory clients, including institutional separate accounts and/or other funds that follow investment strategies similar to those of the Fund, if any. The Board considered the similarities and differences in the contractual management fee schedules of the Fund and these similarly-managed accounts and/or funds, taking into account the rationale for any differences in fee schedules. The Board also took into account explanations provided by New York Life Investments about the more extensive scope of services provided to registered investment companies, such as the Fund, as compared with other investment advisory clients. Additionally, the Board considered the impact of contractual breakpoints, voluntary waivers and expense limitation arrangements on the Fund’s net management fee and expenses. The Board also considered that in proposing fees for the Fund, New York Life Investments considers the competitive marketplace for mutual funds.
The Board noted that, outside of the Fund’s management fee and the fees charged under a share class’s Rule 12b-1 and/or shareholder services plans, a share class’s most significant “other expenses” are transfer agent fees. Transfer agent fees are charged to the Fund based on the number of shareholder accounts (a “per-account” fee). The Board took into account information from New York Life Investments regarding the reasonableness of the Fund’s transfer agent fee schedule, including industry data demonstrating that the per-account fees that NYLIM Service Company LLC, an affiliate of New York Life Investments and the Fund’s transfer agent, charges the Fund are within the range of per-account fees charged by transfer agents to other mutual funds. In addition, the Board considered NYLIM Service Company LLC’s profitability in connection with the transfer agent services it provides to the Fund. The Board also took
into account information received from NYLIM Service Company LLC regarding the sub-transfer agency payments it made to intermediaries in connection with the provision of sub-transfer agency services to the Fund.
The Board considered that, because the Fund’s transfer agent fees are billed on a per-account basis, the impact of transfer agent fees on a share class’s expense ratio may be more significant in cases where the share class has a high number of small accounts. The Board considered the extent to which transfer agent fees comprised total expenses of the Fund. The Board acknowledged the role that the MainStay Group of Funds historically has played in serving the investment needs of New York Life Insurance Company customers, who often maintain smaller account balances than other shareholders of funds, and the impact of small accounts on the expense ratios of Fund share classes. The Board also recognized measures that it and New York Life Investments have taken to mitigate the effect of small accounts on the expense ratios of Fund share classes, including through the imposition of an expense limitation on net transfer agency expenses. The Board noted that, for purposes of allocating transfer agency fees and expenses, each retail fund in the MainStay Group of Funds combines the shareholder accounts of its Class A, A2, I, R1, R2 and R3 shares (as applicable) into one group and the shareholder accounts of its Investor Class, SIMPLE Class and Class B, C and C2 shares (as applicable) into another group. The Board also noted that the per-account fees attributable to each group of share classes is then allocated among the constituent share classes based on relative net assets and that a MainStay Fund’s Class R6 shares, if any, are not combined with any other share class for this purpose. The Board considered New York Life Investments’ rationale with respect to these groupings and previously received a report from an independent consultant engaged to conduct comparative analysis of these groupings. The Board also considered that NYLIM Service Company LLC had waived its contractual cost of living adjustments during the past seven years.
Based on the factors outlined above, the Board concluded that the Fund’s management fee and total ordinary operating expenses were within a range that is competitive and support a conclusion that these fees and expenses are reasonable.
Economies of Scale
The Board considered information regarding economies of scale, including whether the Fund’s expense structure permits economies of scale to be appropriately shared with the Fund’s shareholders. The Board also considered a report from New York Life Investments, previously prepared at the request of the Board, that addressed economies of scale, including with respect to the mutual fund business generally and the various ways in which the benefits of economies of scale may be shared with the funds in the MainStay Group of Funds. Although the Board recognized the difficulty of determining economies of scale with precision, the Board acknowledged that economies of scale may be shared with the Fund in a number of ways, including, for example, through the imposition of management fee breakpoints, initially setting management fee rates at scale or making additional investments to enhance services. The Board
| 34 | MainStay Candriam Emerging Markets Equity Fund |
reviewed information from New York Life Investments showing how the Fund’s management fee schedule compared to fee schedules of other funds and accounts managed by New York Life Investments. The Board also reviewed information from Strategic Insight showing how the Fund’s management fee schedule compared with fees paid for similar services by peer funds at varying asset levels.
Based on this information, the Board concluded that economies of scale are appropriately reflected for the benefit of the Fund’s shareholders through the Fund’s expense structure and other methods to share benefits from economies of scale.
Conclusion
On the basis of the information and factors summarized above, among other information and factors deemed relevant by the Trustees, and the evaluation thereof, the Board, including the Independent Trustees voting separately, unanimously voted to approve the continuation of each of the Advisory Agreements.
Discussion of the Operation and Effectiveness of the Fund's Liquidity Risk Management Program (Unaudited)
In compliance with Rule 22e-4 under the Investment Company Act of 1940, as amended (the “Liquidity Rule”), the Fund has adopted and implemented a liquidity risk management program (the “Program”), which New York Life Investment Management LLC believes is reasonably designed to assess and manage the Fund's liquidity risk (the risk that the Fund could not meet requests to redeem shares issued by the Fund without significant dilution of remaining investors’ interests in the Fund). The Board of Trustees of MainStay Funds Trust (the "Board") designated New York Life Investment Management LLC as administrator of the Program (the “Administrator”). The Administrator has established a Liquidity Risk Management Committee to assist the Administrator in the implementation and day-to-day administration of the Program and to otherwise support the Administrator in fulfilling its responsibilities under the Program.
At a meeting of the Board held on March 8, 2021, the Administrator provided the Board with a written report addressing the Program’s operation and assessing its adequacy and effectiveness of implementation for the period from January 1, 2020 through December 31, 2020 (the "Review Period"), as required under the Liquidity Rule. The report noted that the Administrator concluded that (i) the Program operated effectively to assess and manage the Fund's liquidity risk, (ii) the Program has been adequately and effectively implemented to monitor and, as applicable, respond to the Fund's liquidity developments and (iii) the Fund's investment strategy continues to be appropriate for an open-end fund. In addition, the report discussed notable events that impacted liquidity risk during the Review Period, including the COVID-19 pandemic and the resulting economic shutdown.
In accordance with the Program, the Fund's liquidity risk is assessed no less frequently than annually taking into consideration certain factors, as applicable, such as (i) investment strategy and liquidity of portfolio investments, (ii) short-term and long-term cash flow projections and (iii) holdings of cash and cash equivalents, as well as borrowing arrangements and other funding sources. Certain factors are considered under both normal and reasonably foreseeable stressed conditions.
Each Fund portfolio investment is classified into one of four liquidity categories. The classification is based on a determination of the number of days it is reasonably expected to take to convert the investment into cash, or sell or dispose of the investment, in current market conditions without significantly changing the market value of the investment. The Administrator has delegated liquidity classification determinations to the Fund’s subadvisor, subject to appropriate oversight by the Administrator, and classification determinations are made by taking into account the Fund's reasonably anticipated trade size, various market, trading and investment-specific considerations, as well as market depth, and, in certain cases, third-party vendor data.
The Liquidity Rule requires funds that do not primarily hold assets that are highly liquid investments to adopt a minimum amount of net assets that must be invested in highly liquid investments that are assets (an “HLIM”). In addition, the Liquidity Rule limits a fund's investments in illiquid investments. Specifically, the Liquidity Rule prohibits acquisition of illiquid investments if doing so would result in a fund holding more than 15% of its net assets in illiquid investments that are assets. The Program includes provisions reasonably designed to determine, periodically review and comply with the HLIM requirement, as applicable, and to comply with the 15% limit on illiquid investments.
There can be no assurance that the Program will achieve its objectives under all circumstances in the future. Please refer to the Fund's prospectus for more information regarding the Fund's exposure to liquidity risk and other risks to which it may be subject.
| 36 | MainStay Candriam Emerging Markets Equity Fund |
Proxy Voting Record
The Fund is required to file with the Securities and Exchange Commissions's ("SEC") its proxy voting records for the 12-month period ending June 30 on Form N-PX. The most recent Form N-PX or proxy voting record is available free of charge upon request by calling 800-624-6782; visiting the MainStay Funds’ website at newyorklifeinvestments.com; or visiting the SEC’s website at www.sec.gov.
Shareholder Reports and Quarterly Portfolio Disclosure
The Fund is required to file its complete schedule of portfolio holdings with the SEC 60 days after its first and third fiscal quarter on Form N-PORT. The Fund's holdings report is available free of charge upon request by calling New York Life Investments at 800-624-6782.
This page intentionally left blank.
Equity
U.S. Equity
MainStay Epoch U.S. Equity Yield Fund
MainStay MacKay S&P 500 Index Fund
MainStay Winslow Large Cap Growth Fund
MainStay WMC Enduring Capital Fund
MainStay WMC Growth Fund
MainStay WMC Small Companies Fund
MainStay WMC Value Fund
International Equity
MainStay Epoch International Choice Fund
MainStay MacKay International Equity Fund
MainStay WMC International Research Equity Fund
Emerging Markets Equity
MainStay Candriam Emerging Markets Equity Fund
Global Equity
MainStay Epoch Capital Growth Fund
MainStay Epoch Global Equity Yield Fund
Fixed Income
Taxable Income
MainStay Candriam Emerging Markets Debt Fund
MainStay Floating Rate Fund
MainStay MacKay High Yield Corporate Bond Fund
MainStay MacKay Short Duration High Yield Fund
MainStay MacKay Strategic Bond Fund
MainStay MacKay Total Return Bond Fund
MainStay MacKay U.S. Infrastructure Bond Fund
MainStay Short Term Bond Fund
Tax-Exempt Income
MainStay MacKay California Tax Free Opportunities Fund1
MainStay MacKay High Yield Municipal Bond Fund
MainStay MacKay Intermediate Tax Free Bond Fund
MainStay MacKay New York Tax Free Opportunities Fund2
MainStay MacKay Short Term Municipal Fund
MainStay MacKay Tax Free Bond Fund
Money Market
MainStay Money Market Fund
Mixed Asset
MainStay Balanced Fund
MainStay Income Builder Fund
MainStay MacKay Convertible Fund
Speciality
MainStay CBRE Global Infrastructure Fund
MainStay CBRE Real Estate Fund
MainStay Cushing MLP Premier Fund
Asset Allocation
MainStay Conservative Allocation Fund
MainStay Conservative ETF Allocation Fund
MainStay Defensive ETF Allocation Fund
MainStay Equity Allocation Fund
MainStay Equity ETF Allocation Fund
MainStay Growth Allocation Fund
MainStay Growth ETF Allocation Fund
MainStay Moderate Allocation Fund
MainStay Moderate ETF Allocation Fund
Manager
New York Life Investment Management LLC
New York, New York
Subadvisors
Candriam Belgium S.A.3
Brussels, Belgium
Candriam Luxembourg S.C.A.3
Strassen, Luxembourg
CBRE Clarion Securities LLC
Radnor, Pennsylvania
Cushing Asset Management, LP
Dallas, Texas
Epoch Investment Partners, Inc.
New York, New York
MacKay Shields LLC3
New York, New York
NYL Investors LLC3
New York, New York
Wellington Management Company LLP
Boston, Massachusetts
Winslow Capital Management, LLC
Minneapolis, Minnesota
Legal Counsel
Dechert LLP
Washington, District of Columbia
Independent Registered Public Accounting Firm
KPMG LLP
Philadelphia, Pennsylvania
Distributor
NYLIFE Distributors LLC3
Jersey City, New Jersey
Custodian
JPMorgan Chase Bank, N.A.
New York, New York
1.
This Fund is registered for sale in AZ, CA, NV, OR, TX, UT, WA and MI (Class A and I shares only), and CO, FL, GA, HI, ID, MA, MD, NH, NJ and NY (Class I shares only).
| 2. | This Fund is registered for sale in CA, CT, DE, FL, MA, NJ, NY and VT. |
| 3. | An affiliate of New York Life Investment Management LLC. |
Not part of the Semiannual Report
For more information
800-624-6782
newyorklifeinvestments.com
“New York Life Investments” is both a service mark, and the common trade name, of certain investment advisors affiliated with New York Life Insurance Company. The MainStay Funds® are managed by New York Life Investment Management LLC and distributed by NYLIFE Distributors LLC, 30 Hudson Street, Jersey City, NJ 07302, a wholly owned subsidiary of New York Life Insurance Company. NYLIFE Distributors LLC is a Member FINRA/SIPC.
©2021 NYLIFE Distributors LLC. All rights reserved.
| 1776899MS071-21 | MSCEME10-06/21 |
(NYLIM) NL440
MainStay Asset Allocation Funds
Message from the President and Semiannual Report
Unaudited | April 30, 2021
| MainStay Conservative Allocation Fund |
| MainStay Moderate Allocation Fund |
| MainStay Growth Allocation Fund |
| MainStay Equity Allocation Fund |
Sign up for e-delivery of your shareholder reports. For full details on e-delivery, including who can participate and what you can receive via e-delivery,
please log in to newyorklifeinvestments.com/accounts.
| Not FDIC/NCUA Insured | Not a Deposit | May Lose Value | No Bank Guarantee | Not Insured by Any Government Agency |
This page intentionally left blank
Message from the President
With the approval of COVID-19 vaccines and the passage of relief packages by the U.S. Congress, economic prospects improved during the reporting period, and investor risk appetite increased, benefiting both equities and fixed-income markets. Despite some volatility stemming from a sell-off in longer-dated Treasury securities, the stock market and higher-risk segments of the fixed-income market posted gains for the six months ended April 30, 2021.
By the beginning of the reporting period, the economy had made tremendous progress from the second quarter of 2020, when economic activity plunged. But uncertainty about when vaccines would be available and how quickly they could be administered left investors unsure about the economic outlook.
With the approval of several vaccines in November, the outlook brightened and investors became less risk-averse. Anticipating the likely end of the pandemic and a continuation of the economic recovery, they began to see opportunities in investment-grade and high-yield bonds and more cyclical segments of the stock market. The $900 billion relief and stimulus package passed in December provided further assurance.
In January, the Federal Reserve opted to leave interest rates unchanged, pointing to some uncertainty about the pace of the global recovery. Officials also noted that inflation remained low, citing oil prices in particular.
In March, President Biden signed the $1.9 billion American Rescue Plan, which, among other provisions, called for payments of $1,400 for those earning less than $75,000 per year, plus $1,400 per dependent. This, combined with the Federal Reserve’s new tolerance for inflation and an anticipated $2 trillion infrastructure spending bill, added to growing concerns about higher prices. Supply shortages in some markets caused some prices to soar, heightening concerns further.
In fixed-income markets, an improving economic outlook and rising inflation expectations led to a sell-off in longer-term Treasuries, with the result that the yield on the 10-year note rose sharply, particularly in February and March. Investment grade corporate bonds were also affected. Early in the reporting period, they performed well as investors shifted out of Treasuries, but as the reporting period progressed, they faltered. Longer-dated securities issued in recent years at historically low interest rates became especially unattractive.
High-yield bonds remained steady, supported by more favorable yields and an improved economic outlook, which reduced their perceived risk. Municipal bonds produced modest gains, and
although the sell-off in Treasuries produced some volatility early in 2021, stronger-than-expected tax revenues, $350 billion in financial support from the federal government, and the possibility of an increase in federal income tax rates appeared to buoy the market late in the reporting period.
Inflation concerns and volatility in the Treasury market led to a shift in equities markets. Although the S&P 500® Index, a widely followed measure of U.S. equities, posted double-digit gains and hit a record high, the rise of Treasury yields disrupted valuations, especially those of growth stocks. Technology companies that saw their valuations soar amid the work-from-home trend in 2020 suffered large declines.
But the fiscal stimulus and continued accommodation from the Federal Reserve gave investors confidence the economic recovery would continue. Combined with the sky-high valuations in technology and growth stocks, this increased the appeal of more cyclical and value-oriented shares. As a result, value stocks outperformed growth stocks during the reporting period.
Reflecting the shift in investor sentiment, the performance of S&P 500® Index sectors varied widely. While the information technology sector kept up with the broader market, it lagged cyclical sectors such as energy and financials, which led the way. The shift was further reflected in the performance of small-cap stocks, which outperformed large caps. While developed markets kept pace with the U.S. market, lagging economic and pandemic recoveries appeared to weigh on emerging markets late in the reporting period.
With the lockdown restrictions lifting in the U.S. and the pandemic easing in many regions, we at New York Life Investments are looking forward to a return to a more normal economy. We anticipate that over the next several years, a variety of trends will likely offer long-term investors many attractive opportunities. With this in mind, we continue to develop products and services to help you to take advantage of these trends, manage your risks, and ultimately meet your investment goals.
Sincerely,
Kirk C. Lehneis
President
The opinions expressed are as of the date of this report and are subject to change. There is no guarantee that any forecast made will come to pass. This material does not constitute investment advice and is not intended as an endorsement of any specific investment. Past performance is no guarantee of future results.
Not part of the Semiannual Report
Investors should refer to each Fund’s Summary Prospectus and/or Prospectus and consider each Fund’s investment objectives, strategies, risks, charges and expenses carefully before investing. The Summary Prospectus and/or Prospectus contain this and other information about each Fund. You may obtain copies of each Fund’s Summary Prospectus, Prospectus and Statement of Additional Information free of charge, upon request, by calling toll-free 800-624-6782, by writing to NYLIFE Distributors LLC, Attn: MainStay Marketing Department, 30 Hudson Street, Jersey City, NJ 07302 or by sending an e-mail to MainStayShareholderServices@nylim.com. These documents are also available via the MainStay Funds’ website at newyorklifeinvestments.com. Please read each Fund’s Summary Prospectus and/or Prospectus carefully before investing.
MainStay Conservative Allocation Fund
Investment and Performance Comparison (Unaudited)
Performance data quoted represents past performance. Past performance is no guarantee of future results. Because of market volatility and other factors, current performance may be lower or higher than the figures shown. Investment return and principal value will fluctuate, and as a result, when shares are redeemed, they may be worth more or less than their original cost. The graph below depicts the historical performance of Class I shares of the Fund. Performance will vary from class to class based on differences in class-specific expenses and sales charges. For performance information current to the most recent month-end, please call 800-624-6782 or visit newyorklifeinvestments.com.
The performance table and graph do not reflect the deduction of taxes that a shareholder would pay on distributions or Fund share redemptions. Total returns reflect maximum applicable sales charges as indicated in the table below, if any, changes in share price, and reinvestment of dividend and capital gain distributions. The graph assumes the initial investment amount shown below and reflects the deduction of all sales charges that would have applied for the period of investment. Performance figures may reflect certain fee waivers and/or expense limitations, without which total returns may have been lower. For more information on share classes and current fee waivers and/or expense limitations (if any), please refer to the Notes to Financial Statements.

| Average Annual Total Returns for the Period-Ended April 30, 2021 |
| Class | Sales Charge | | Inception
Date | Six
Months | One Year
or Since
Inception | Five Years
or Since
Inception | Ten Years
or Since
Inception | Gross
Expense
Ratio1 |
| Class A Shares2 | Maximum 3% Initial Sales Charge | With sales charges | 4/4/2005 | 8.41% | 16.38% | 5.78% | 5.30% | 0.97% |
| | | Excluding sales charges | | 11.76 | 19.98 | 6.98 | 5.90 | 0.97 |
| Investor Class Shares2, 3 | Maximum 2.5% Initial Sales Charge | With sales charges | 2/28/2008 | 8.83 | 16.08 | 5.61 | 5.13 | 1.21 |
| | | Excluding sales charges | | 11.62 | 19.67 | 6.81 | 5.72 | 1.21 |
| Class B Shares4 | Maximum 5% CDSC | With sales charges | 4/4/2005 | 6.23 | 13.78 | 5.69 | 4.94 | 1.96 |
| | if Redeemed Within the First Six Years of Purchase | Excluding sales charges | | 11.23 | 18.78 | 6.01 | 4.94 | 1.96 |
| Class C Shares | Maximum 1% CDSC | With sales charges | 4/4/2005 | 10.23 | 17.88 | 6.03 | 4.95 | 1.96 |
| | if Redeemed Within One Year of Purchase | Excluding sales charges | | 11.23 | 18.88 | 6.03 | 4.95 | 1.96 |
| Class I Shares | No Sales Charge | | 4/4/2005 | 11.87 | 20.25 | 7.27 | 6.17 | 0.72 |
| Class R2 Shares | No Sales Charge | | 6/14/2019 | 11.65 | 19.83 | 10.76 | N/A | 1.07 |
| Class R3 Shares | No Sales Charge | | 2/29/2016 | 11.53 | 19.45 | 6.61 | 7.42 | 1.32 |
| SIMPLE Class Shares | No Sales Charge | | 8/31/2020 | 11.49 | 8.39 | N/A | N/A | 1.46 |
| 1. | The gross expense ratios presented reflect the Fund’s “Total Annual Fund Operating Expenses” from the most recent Prospectus, as supplemented and may differ from other expense ratios disclosed in this report. |
| 2. | Prior to July 22, 2019, the maximum initial sales charge applicable was 5.5%, which is reflected in the average annual total return figures shown. |
| 3. | Prior to June 30, 2020, the maximum initial sales charge for Investor Class shares was 3.0%, which is reflected in the average annual total return figures shown. |
| 4. | Class B shares are closed to all new purchases as well as additional investments by existing Class B shareholders. |
The footnotes on the next page are an integral part of the table and graph and should be carefully read in conjunction with them.
| Benchmark Performance | Six
Months | One
Year | Five
Years | Ten
Years |
| S&P 500® Index1 | 28.85% | 45.98% | 17.42% | 14.17% |
| MSCI EAFE® Index (Net)2 | 28.84 | 39.88 | 8.87 | 5.22 |
| Bloomberg Barclays U.S. Aggregate Bond Index3 | -1.52 | -0.27 | 3.19 | 3.39 |
| Conservative Allocation Composite Index4 | 9.91 | 16.07 | 8.16 | 7.09 |
| Morningstar Allocation - 30% to 50% Equity Category Average5 | 13.15 | 21.61 | 6.94 | 5.18 |
| 1. | The S&P 500® Index is the Fund's primary broad-based securities market index for comparison purposes. “S&P 500®” is a trademark of The McGraw-Hill Companies, Inc. The S&P 500® Index is widely regarded as the standard index for measuring large-cap U.S. stock market performance. Results assume reinvestment of all dividends and capital gains. An investment cannot be made directly in an index. |
| 2. | The MSCI EAFE® Index (Net) is the Fund’s secondary benchmark. The MSCI EAFE® Index (Net) consists of international stocks representing the developed world outside of North America. Results assume reinvestment of all dividends and capital gains. An investment cannot be made directly in an index. |
| 3. | The Fund has selected the Bloomberg Barclays U.S. Aggregate Bond Index as an additional benchmark. The Bloomberg Barclays U.S. Aggregate Bond Index is a broad-based benchmark that measures the investment grade, U.S. dollar-denominated, fixed-rate taxable bond market, including Treasurys, government-related and corporate securities, mortgage-backed securities (agency fixed-rate and hybrid adjustable rate mortgage pass-throughs), asset-backed securities, and commercial mortgage-backed securities. Results assume reinvestment of all dividends and capital gains. An investment cannot be made directly in an index. |
| 4. | The Fund has selected the Conservative Allocation Composite Index as an additional benchmark. The Conservative Allocation Composite Index consists of the S&P 500® Index, the MSCI EAFE® Index (Net) and the Bloomberg Barclays U.S. Aggregate Bond Index weighted 30%, 10% and 60%, respectively. Results assume reinvestment of all dividends and capital gains. An investment cannot be made directly in an index. |
| 5. | The Morningstar Allocation – 15% to 30% Equity Category Average is representative of funds that seek to provide both income and capital appreciation by investing in multiple asset classes, including stocks, bonds, and cash. These portfolios are dominated by domestic holdings and have equity exposures between 15% and 30%. Results are based on average total returns of similar funds with all dividends and capital gain distributions reinvested. |
The footnotes on the preceding page are an integral part of the table and graph and should be carefully read in conjunction with them.
| 6 | MainStay Conservative Allocation Fund |
Cost in Dollars of a $1,000 Investment in MainStay Conservative Allocation Fund (Unaudited)
The example below is intended to describe the fees and expenses borne by shareholders during the six-month period from November 1, 2020, to April 30, 2021, and the impact of those costs on your investment.
Example
As a shareholder of the Fund you incur two types of costs: (1) transaction costs, including exchange fees and sales charges (loads) on purchases (as applicable), and (2) ongoing costs, including management fees, distribution and/or service (12b-1) fees, and other Fund expenses (as applicable). This example is intended to help you understand your ongoing costs (in dollars) of investing in the Fund and to compare these costs with the ongoing costs of investing in other mutual funds. The example is based on an investment of $1,000 made at the beginning of the six-month period and held for the entire period from November 1, 2020, to April 30, 2021.
This example illustrates your Fund’s ongoing costs in two ways:
Actual Expenses
The second and third data columns in the table below provide information about actual account values and actual expenses. You may use the information in these columns, together with the amount you invested, to estimate the expenses that you paid during the six months ended April 30, 2021. Simply divide your account value by $1,000 (for example, an
$8,600 account value divided by $1,000 = 8.6), then multiply the result by the number under the heading entitled “Expenses Paid During Period” to estimate the expenses you paid on your account during this period.
Hypothetical Example for Comparison Purposes
The fourth and fifth data columns in the table below provide information about hypothetical account values and hypothetical expenses based on the Fund’s actual expense ratio and an assumed rate of return of 5% per year before expenses, which is not the Fund’s actual return. The hypothetical account values and expenses may not be used to estimate the actual ending account balances or expenses you paid for the six-month period shown. You may use this information to compare the ongoing costs of investing in the Fund with the ongoing costs of investing in other mutual funds. To do so, compare this 5% hypothetical example with the 5% hypothetical examples that appear in the shareholder reports of the other mutual funds.
Please note that the expenses shown in the table are meant to highlight your ongoing costs only and do not reflect any transactional costs, such as exchange fees or sales charges (loads). Therefore, the fourth and fifth data columns of the table are useful in comparing ongoing costs only and will not help you determine the relative total costs of owning different funds. In addition, if these transactional costs were included, your costs would have been higher.
| Share Class | Beginning
Account
Value
11/1/20 | Ending Account
Value (Based
on Actual
Returns and
Expenses)
4/30/21 | Expenses
Paid
During
Period1 | Ending Account
Value (Based
on Hypothetical
5% Annualized
Return and
Actual Expenses)
4/30/21 | Expenses
Paid
During
Period1 | Net Expense
Ratio
During
Period2 |
| Class A Shares | $1,000.00 | $1,117.60 | $1.94 | $1,022.96 | $1.86 | 0.37% |
| Investor Class Shares | $1,000.00 | $1,116.20 | $2.89 | $1,022.07 | $2.76 | 0.55% |
| Class B Shares | $1,000.00 | $1,112.30 | $6.81 | $1,018.35 | $6.51 | 1.30% |
| Class C Shares | $1,000.00 | $1,112.30 | $6.81 | $1,018.35 | $6.51 | 1.30% |
| Class I Shares | $1,000.00 | $1,118.70 | $0.63 | $1,024.20 | $0.60 | 0.12% |
| Class R2 Shares | $1,000.00 | $1,116.50 | $2.47 | $1,022.46 | $2.36 | 0.47% |
| Class R3 Shares | $1,000.00 | $1,115.30 | $3.78 | $1,021.22 | $3.61 | 0.72% |
| SIMPLE Class Shares | $1,000.00 | $1,114.90 | $4.20 | $1,020.83 | $4.01 | 0.80% |
| 1. | Expenses are equal to the Fund’s annualized expense ratio of each class multiplied by the average account value over the period, divided by 365 and multiplied by 181 (to reflect the six-month period). The table above represents the actual expenses incurred during the six-month period. In addition to the fees and expenses which the Fund bears directly, it also indirectly bears a pro rata share of the fees and expenses of the underlying funds in which it invests. Such indirect expenses are not included in the above-reported expense figures. |
| 2. | Expenses are equal to the Fund's annualized expense ratio to reflect the six-month period. |
Asset Diversification as of April 30, 2021 (Unaudited)
| Equity Funds | 36.8% |
| Fixed Income Funds | 55.8 |
| Short-Term Investments | 7.2 |
| Other Assets, Less Liabilities | 0.2 |
See Portfolio of Investments beginning on page 12 for specific holdings within these categories. The Fund’s holdings are subject to change.
| 8 | MainStay Conservative Allocation Fund |
Portfolio Management Discussion and Analysis (Unaudited)
Questions answered by portfolio managers Jae S. Yoon, CFA, Jonathan Swaney, Poul Kristensen, CFA, and Amit Soni, CFA, of New York Life Investment Management LLC, the Fund’s Manager.
How did MainStay Conservative Allocation Fund perform relative to its benchmarks and peer group during the six months ended April 30, 2021?
For the six months ended April 30, 2021, Class I shares of MainStay Conservative Allocation Fund returned 11.87%, underperforming the 28.85% return of the Fund’s primary benchmark, the S&P 500® Index, and the 28.84% return of the MSCI EAFE® Index (Net), which is the Fund’s secondary benchmark. Over the same period, Class I shares of the Fund outperformed the −1.52% return of the Bloomberg Barclays U.S. Aggregate Bond Index and the 9.91% return of the Conservative Allocation Composite Index, both of which are additional benchmarks of the Fund. For the six months ended April 30, 2021, Class I shares of the Fund underperformed the 13.15% return of the Morningstar Allocation—30% to 50% Equity Category Average.1
What factors affected the Fund’s relative performance during the reporting period?
The Fund is a “fund of funds,” meaning that it seeks to achieve its investment objective by investing primarily in mutual funds and exchange-traded funds (“ETFs”) managed by New York Life Investments or its affiliates (the “Underlying Funds”). The Underlying Funds may invest in U.S. equities, international equities and fixed-income instruments, making comparisons to any single index generally less suitable than a weighted combination of indices, which is a more useful yardstick by which to measure performance. The most influential factor affecting returns for the Fund during the reporting period (versus the performance of a weighted combination of indices) is the net performance of the Underlying Funds themselves, relative to their respective benchmarks.
Fund management internally maintains a blend of indices that are taken into consideration when managing the Fund. During the reporting period, the Fund’s performance slightly trailed the performance of the internally maintained blend of indices, primarily due to the materially negative impact of asset class policy. Most significantly, the Fund held underweight exposure to small-cap stocks in the fall of 2020 and into 2021 at a time when these higher beta2 securities rallied powerfully, far surpassing the return on larger company stocks. Management of the Fund’s stock/bond blend detracted from performance as well. For reasons discussed below, the Fund held moderately underweight exposure to equities in the early months of the reporting period, and thereby participated less fully in the ongoing bull market than the internally maintained blend of indices. Similarly, within the fixed-income portion of the Fund, relative performance suffered as
holdings were tilted away from higher-risk, lower-quality instruments.
Some aspects of the Fund’s asset class policy—such as a bias toward value stocks—made positive contributions to relative returns, partially mitigating the negative affects cited above. (Contributions take weightings and total returns into account.) More significant was a strongly positive contribution from the Underlying Funds themselves. After years in which passive strategies generally held the upper hand, during the reporting period active management fared better. As a result, excess returns at the Underlying Fund level made a materially positive contribution to the Fund’s relative performance.
During the reporting period, how was the Fund’s performance materially affected by investments in derivatives?
Total return swaps were used to express most of the Fund’s asset class policy views. Therefore, the swaps can be seen as detracting from the Fund’s relative performance over the course of the reporting period.
How did you allocate the Fund’s assets during the reporting period and why?
The Fund entered the reporting period maintaining a somewhat defensive posture that favored fixed-income instruments over stocks, large companies over small, and high-quality debt over debt issued by less creditworthy borrowers. This positioning arose out of our suspicion, based on the facts then available, that market pricing had gotten ahead of the operating conditions that prevailed at the time and, in our opinion, were likely to persist into the foreseeable future. Equity indices were trading at or near all-time highs and yields of lesser-quality credits stood near all-time lows despite the fact that aggregate output and corporate profits were well below prior peaks, many millions of workers were unemployed, prospects for additional policy support were unclear and the pandemic was anything but contained. Risks appeared skewed to the downside.
Much changed with the announcements of highly successful clinical trials for both the Moderna and Pfizer vaccines, followed shortly thereafter by the granting of emergency use authorizations and rapid distribution to the most vulnerable elements of the population. These developments brought the end of pandemic restrictions into view, ushering in a wave of activity and lifting market prices that much higher.
With the end of restrictions on the horizon, we adjusted the Fund to favor pro-cyclical sectors and businesses in industries likely to benefit most from the reopening of the U.S. economy. We also
| 1. | See page 5 for other share class returns, which may be higher or lower than Class I share returns. See page 6 for more information on benchmark and peer group returns. |
| 2. | Beta is a measure of volatility in relation to the market as a whole. A beta higher than 1 indicates that a security or portfolio will tend to exhibit higher volatility than the market. A beta lower than 1 indicates that a security or portfolio will tend to exhibit lower volatility than the market. |
increased the Fund’s exposure to non-U.S. equities we believed were positioned to experience a recovery similar to that seen in the U.S. but on a lagged basis due to a slower vaccine rollout. Similarly, we slid a little way down the capitalization spectrum, committing a bigger allocation of the Fund’s assets to small- and mid-cap companies we judged likely to fare well in this environment. We also reduced interest rate sensitivity in the bond portion of the Fund, anticipating that mounting inflationary pressures would result in higher bond yields. These adjustments provided a modest tailwind to the Fund’s performance in the first four months of 2021.
How did the Fund’s allocations change over the course of the reporting period?
The restructuring noted above was largely implemented through the use of derivatives, specifically total return swaps. The Fund’s exposure to mid-to-small-cap stocks, non-U.S. markets and a basket of companies specifically leveraged to the reopening of the economy was increased in this way, while exposure was dialed down for large-cap U.S. stocks and a basket of companies identified as having been beneficiaries of lockdown conditions.
We also made a few adjustments at the Underlying Fund level, the most pronounced being a reduction in the Fund’s holdings of MainStay MacKay Total Return Bond Fund with the proceeds redirected to a mix of cash, MainStay Floating Rate Fund, MainStay Short Term Bond Fund and MainStay MacKay Short Duration High Yield Fund. These changes were intended to lessen the Fund’s interest rate sensitivity at a time when yields may rise in response to mounting inflationary concerns.
Other notable changes arose from Fund restructurings as Wellington Management Company was named the new subadvisor on several MainStay Funds that concurrently underwent name changes. A few Funds also were subject to mergers. By way of example, MainStay MacKay Common Stock Fund was renamed MainStay WMC Enduring Capital Fund when Wellington took the helm in early March 2021, and MainStay Epoch U.S. All Cap Fund was merged into MainStay WMC Enduring Capital Fund a short while later.
During the reporting period, which Underlying Equity Funds had the highest total returns and which had the lowest total returns?
The Underlying Equity Funds in which the Fund was invested for the entire reporting period that generated the highest total returns included IQ Chaikin U.S. Small Cap ETF, MainStay WMC Small Companies Fund (known as MainStay MacKay Small Cap Core Fund prior to March 2021), and IQ 500 International ETF. Underlying Equity Funds with the lowest total returns included MainStay Winslow Large Cap Growth Fund, MainStay Epoch International Choice Fund, and MainStay MacKay International Equity Fund.
Which Underlying Equity Funds were the strongest positive contributors to the Fund’s performance and which Underlying Equity Funds were particularly weak?
The positions that made the largest positive contributions to performance during the reporting period were MainStay MacKay S&P 500 Index Fund, IQ Chaikin U.S. Small Cap ETF and MainStay WMC Small Companies Fund (formerly MainStay MacKay Small Cap Core Fund). While no Underlying Equity Funds produced negative absolute returns, those delivering the weakest returns included MainStay Epoch Capital Growth Fund, MainStay MacKay International Equity Fund and MainStay Epoch International Choice Fund.
During the reporting period, which Underlying Fixed-Income Funds had the highest total returns and which Underlying Fixed-Income Funds had the lowest total returns?
The Underlying Fixed-Income Funds held for the entire reporting period that posted the largest total returns were MainStay MacKay Short Duration High Yield Fund and MainStay Floating Rate Fund. Underlying Fixed-Income Funds with the lowest returns were MainStay MacKay Total Return Bond Fund and IQ High Yield Low Volatility ETF.
Which Underlying Fixed-Income Funds were the strongest positive contributors to the Fund’s performance and which Underlying Fixed-Income Funds were particularly weak?
The Underlying Fixed-Income Funds making the strongest positive contributions to the Fund’s performance included MainStay MacKay Short Duration High Yield Fund and MainStay MacKay Total Return Bond Fund. While no Underlying Fixed-Income Funds detracted from the Fund’s absolute performance in any meaningful way, there was effectively no positive contribution to return from either the Fund’s cash holdings or its position in MainStay Short Term Bond Fund. The Fund’s stake in IQ High Yield Low Volatility ETF added very little as well.
How was the Fund positioned at the end of the reporting period?
As of April 30, 2021, in our view, we see two countervailing forces at work within capital markets. The first is the exceptional strength of the domestic economy. The gradual reopening of full business capacity, augmented by massive fiscal and monetary policy support, is yielding a rate of expansion not seen in generations. With this as the backdrop, corporate profit growth has been nothing less than stellar, with high expectations for continued rapid improvement in earnings.
At the same time, we believe there is the need to recognize that price gains in capital markets have significantly outpaced earnings gains, which translates into very high valuations, which in turn
| 10 | MainStay Conservative Allocation Fund |
implies that investors are paying richly for future earnings. Should inflation rise materially, we believe the present value of those future earnings would be diminished, potentially undermining high share price levels and sowing the seeds for a market correction. Paradoxically, it is the same strong economic growth driving profits higher that may spawn faster rates of inflation and bring the rally to an end.
We believe that upside and downside risks are approximately balanced. Therefore, we lean neither toward nor away from risk assets broadly, meaning that the Fund’s stock/bond blend is being held close to that of the benchmark, as is the Fund’s overall exposure to lower credit quality instruments. We see a different story within asset classes as we believe there will be clear winners and losers from increasing consumer mobility and the full reopening of businesses. Two themes evident in the Fund’s holdings revolve around that dynamic. First, we favor more pro-cyclical elements of the economy by tilting toward value stocks and non-U.S. markets. Second, we have taken steps to guard the Fund against a rapid acceleration of inflation. Duration3 has been trimmed (i.e., the Fund has a little less exposure to the long end of the yield curve4 ) and exposure to gold miners has been maintained as a possible hedge.
| 3. | Duration is a measure of the price sensitivity of a fixed-income investment to changes in interest rates. Duration is expressed as a number of years and is considered a more accurate sensitivity gauge than average maturity. |
| 4. | The yield curve is a line that plots the yields of various securities of similar quality—typically U.S. Treasury issues—across a range of maturities. The U.S. Treasury yield curve serves as a benchmark for other debt and is used in economic forecasting. |
The opinions expressed are those of the portfolio managers as of the date of this report and are subject to change. There is no guarantee that any forecasts will come to pass. This material does not constitute investment advice and is not intended as an endorsement of any specific investment.
Portfolio of Investments April 30, 2021† (Unaudited)
| | Shares | Value |
| Affiliated Investment Companies 92.6% |
| Equity Funds 36.8% |
| IQ 50 Percent Hedged FTSE International ETF | 411,401 | $ 10,009,386 |
| IQ 500 International ETF | 263,499 | 8,554,785 |
| IQ Candriam ESG International Equity ETF | 294,959 | 8,614,396 |
| IQ Candriam ESG U.S. Equity ETF | 448,520 | 15,941,881 |
| IQ Chaikin U.S. Large Cap ETF | 350,165 | 11,378,927 |
| IQ Chaikin U.S. Small Cap ETF (a) | 312,485 | 10,948,693 |
| Mainstay Candriam Emerging Markets Equity Fund Class R6 (a) | 558,403 | 7,527,327 |
| MainStay Epoch Capital Growth Fund Class I | 117,240 | 1,822,209 |
| MainStay Epoch International Choice Fund Class I | 123,621 | 5,125,792 |
| MainStay Epoch U.S. Equity Yield Fund Class R6 | 551,207 | 10,471,999 |
| MainStay MacKay International Equity Fund Class R6 | 203,894 | 4,510,705 |
| MainStay MacKay S&P 500 Index Fund Class I | 332,850 | 18,321,216 |
| MainStay Winslow Large Cap Growth Fund Class R6 | 1,295,388 | 18,891,033 |
| Mainstay WMC Enduring Capital Fund Class R6 | 409,495 | 13,535,977 |
| Mainstay WMC Growth Fund Class R6 | 188,403 | 9,948,334 |
| Mainstay WMC International Research Equity Fund Class I | 626,143 | 4,997,310 |
| Mainstay WMC Small Companies Fund Class I | 321,950 | 10,932,734 |
| Mainstay WMC Value Fund Class R6 | 222,619 | 12,044,555 |
Total Equity Funds
(Cost $128,776,791) | | 183,577,259 |
| | Shares | | Value |
| |
| Fixed Income Funds 55.8% |
| IQ S&P High Yield Low Volatility Bond ETF | 197,955 | | $ 4,952,834 |
| MainStay Floating Rate Fund Class R6 | 2,438,341 | | 22,254,495 |
| MainStay MacKay Short Duration High Yield Fund Class I | 4,045,385 | | 39,878,597 |
| MainStay MacKay Total Return Bond Fund Class R6 (a) | 18,774,378 | | 209,172,860 |
| MainStay Short Term Bond Fund Class I | 251,681 | | 2,481,924 |
Total Fixed Income Funds
(Cost $271,914,249) | | | 278,740,710 |
Total Affiliated Investment Companies
(Cost $400,691,040) | | | 462,317,969 |
| Short-Term Investment 7.2% |
| Affiliated Investment Company 7.2% |
| MainStay U.S. Government Liquidity Fund, 0.01% (b) | 35,755,540 | | 35,755,540 |
Total Short-Term Investment
(Cost $35,755,540) | 7.2% | | 35,755,540 |
Total Investments
(Cost $436,446,580) | 99.8% | | 498,073,509 |
| Other Assets, Less Liabilities | 0.2 | | 1,002,148 |
| Net Assets | 100.0% | | $ 499,075,657 |
| † | Percentages indicated are based on Fund net assets. |
| (a) | As of April 30, 2021, the Fund’s ownership exceeds 5% of the outstanding shares of the Underlying Fund’s share class |
| (b) | Current yield as of April 30, 2021. |
Swap Contracts
Open OTC total return equity swap contracts as of April 30, 2021 were as follows1:
Swap
Counterparty | Reference Obligation | Floating Rate2 | Termination
Date(s) | Payment
Frequency
Paid/
Received | Notional
Amount
Long/
(Short)
(000)3 | Unrealized
Appreciation/
(Depreciation)4 |
| Citibank NA | Citi 2nd Wave Virus Basket | 1 month LIBOR BBA plus 0.35% | 12/2/21 | Monthly | 3,720 | $ — |
| Citibank NA | Citi Stay at Home Basket | 1 month LIBOR BBA minus 0.30% | 12/2/21 | Monthly | (3,887) | — |
| Citibank NA | iShares MSCI EAFE ETF | 1 month LIBOR BBA plus 0.40% | 12/2/21 | Monthly | 12,583 | — |
| Citibank NA | iShares MSCI Emerging Markets ETF | 1 month LIBOR BBA plus 0.40% | 12/2/21 | Monthly | 4,963 | — |
| Citibank NA | Portfolio Swap S&P 500 TRI Index | 1 month LIBOR BBA plus 0.10% | 12/2/21 | Monthly | (7,350) | — |
| Citibank NA | Russell 1000 Growth Total Return Index | 1 month LIBOR BBA plus 0.03% | 12/2/21 | Monthly | (9,983) | — |
| Citibank NA | Russell 1000 Value Total Return Index | 1 month LIBOR BBA plus 0.30% | 12/2/21 | Monthly | 10,634 | — |
| Citibank NA | Russell 2000 Total Return Index | 1 month LIBOR BBA minus 0.06% | 12/2/21 | Monthly | (11,624) | — |
| Citibank NA | Russell Midcap Total Return Index | 1 month LIBOR BBA plus 0.31% | 12/2/21 | Monthly | 18,815 | — |
The notes to the financial statements are an integral part of, and should be read in conjunction with, the financial statements.
| 12 | MainStay Conservative Allocation Fund |
Swap
Counterparty | Reference Obligation | Floating Rate2 | Termination
Date(s) | Payment
Frequency
Paid/
Received | Notional
Amount
Long/
(Short)
(000)3 | Unrealized
Appreciation/
(Depreciation)4 |
| Citibank NA | VanEck Vectors Gold Miners ETF | 1 month LIBOR BBA plus 0.50% | 12/2/21 | Monthly | 7,599 | $ — |
| | | | | | | $ — |
| 1. | As of April 30, 2021, cash in the amount $1,352,122 was pledged from brokers for OTC swap contracts. |
| 2. | Fund pays the floating rate and receives the total return of the reference entity. |
| 3. | Notional amounts reflected as a positive value indicate a long position held by the Fund or Index and a negative value indicates a short position. |
| 4. | Reflects the value at reset date as of April 30, 2021. |
| Abbreviation(s): |
| BBA—British Bankers’ Association |
| EAFE—Europe, Australasia and Far East |
| ETF—Exchange-Traded Fund |
| FTSE—Financial Times Stock Exchange |
| LIBOR—London Interbank Offered Rate |
| MSCI—Morgan Stanley Capital International |
The following is a summary of the fair valuations according to the inputs used as of April 30, 2021, for valuing the Fund’s assets:
| Description | Quoted
Prices in
Active
Markets for
Identical
Assets
(Level 1) | | Significant
Other
Observable
Inputs
(Level 2) | | Significant
Unobservable
Inputs
(Level 3) | | Total |
| Asset Valuation Inputs | | | | | | | |
| Investments in Securities (a) | | | | | | | |
| Affiliated Investment Companies | | | | | | | |
| Equity Funds | $ 183,577,259 | | $ — | | $ — | | $ 183,577,259 |
| Fixed Income Funds | 278,740,710 | | — | | — | | 278,740,710 |
| Total Affiliated Investment Companies | 462,317,969 | | — | | — | | 462,317,969 |
| Short-Term Investment | | | | | | | |
| Affiliated Investment Company | 35,755,540 | | — | | — | | 35,755,540 |
| Total Investments in Securities | $ 498,073,509 | | $ — | | $ — | | $ 498,073,509 |
| (a) | For a complete listing of investments, see the Portfolio of Investments. |
The notes to the financial statements are an integral part of, and should be read in conjunction with, the financial statements.
13
Statement of Assets and Liabilities as of April 30, 2021 (Unaudited)
| Assets |
Investment in affiliated investment companies, at value
(identified cost $436,446,580) | $498,073,509 |
| Cash collateral on deposit at broker for swap contracts | 1,352,122 |
| Receivables: | |
| Fund shares sold | 375,047 |
| Dividends and interest | 51,533 |
| Manager (See Note 3) | 4,142 |
| Other assets | 78,583 |
| Total assets | 499,934,936 |
| Liabilities |
| Due to custodian | 348,852 |
| Payables: | |
| Fund shares redeemed | 135,539 |
| NYLIFE Distributors (See Note 3) | 128,931 |
| Transfer agent (See Note 3) | 85,105 |
| Investment securities purchased | 51,207 |
| Shareholder communication | 46,633 |
| Professional fees | 37,900 |
| Dividends and interest on OTC swaps contracts | 21,872 |
| Custodian | 1,279 |
| Accrued expenses | 1,961 |
| Total liabilities | 859,279 |
| Net assets | $499,075,657 |
| Composition of Net Assets |
| Shares of beneficial interest outstanding (par value of $.001 per share) unlimited number of shares authorized | $ 38,007 |
| Additional paid-in-capital | 420,677,769 |
| | 420,715,776 |
| Total distributable earnings (loss) | 78,359,881 |
| Net assets | $499,075,657 |
| Class A | |
| Net assets applicable to outstanding shares | $399,189,739 |
| Shares of beneficial interest outstanding | 30,360,090 |
| Net asset value per share outstanding | $ 13.15 |
| Maximum sales charge (3.00% of offering price) | 0.41 |
| Maximum offering price per share outstanding | $ 13.56 |
| Investor Class | |
| Net assets applicable to outstanding shares | $ 43,474,848 |
| Shares of beneficial interest outstanding | 3,308,263 |
| Net asset value per share outstanding | $ 13.14 |
| Maximum sales charge (2.50% of offering price) | 0.34 |
| Maximum offering price per share outstanding | $ 13.48 |
| Class B | |
| Net assets applicable to outstanding shares | $ 13,307,597 |
| Shares of beneficial interest outstanding | 1,028,213 |
| Net asset value and offering price per share outstanding | $ 12.94 |
| Class C | |
| Net assets applicable to outstanding shares | $ 31,985,803 |
| Shares of beneficial interest outstanding | 2,472,120 |
| Net asset value and offering price per share outstanding | $ 12.94 |
| Class I | |
| Net assets applicable to outstanding shares | $ 8,994,144 |
| Shares of beneficial interest outstanding | 676,299 |
| Net asset value and offering price per share outstanding | $ 13.30 |
| Class R2 | |
| Net assets applicable to outstanding shares | $ 127,371 |
| Shares of beneficial interest outstanding | 9,692 |
| Net asset value and offering price per share outstanding | $ 13.14 |
| Class R3 | |
| Net assets applicable to outstanding shares | $ 1,847,103 |
| Shares of beneficial interest outstanding | 141,073 |
| Net asset value and offering price per share outstanding | $ 13.09 |
| SIMPLE Class | |
| Net assets applicable to outstanding shares | $ 149,052 |
| Shares of beneficial interest outstanding | 11,351 |
| Net asset value and offering price per share outstanding | $ 13.13 |
The notes to the financial statements are an integral part of, and should be read in conjunction with, the financial statements.
| 14 | MainStay Conservative Allocation Fund |
Statement of Operations for the six months ended April 30, 2021 (Unaudited)
| Investment Income (Loss) |
| Income | |
| Dividend distributions from affiliated investment companies | $ 5,191,879 |
| Interest | 1,311 |
| Total income | 5,193,190 |
| Expenses | |
| Distribution/Service—Class A (See Note 3) | 478,765 |
| Distribution/Service—Investor Class (See Note 3) | 53,736 |
| Distribution/Service—Class B (See Note 3) | 66,717 |
| Distribution/Service—Class C (See Note 3) | 181,300 |
| Distribution/Service—Class R2 (See Note 3) | 148 |
| Distribution/Service—Class R3 (See Note 3) | 3,348 |
| Distribution/Service—SIMPLE Class (See Note 3) | 219 |
| Transfer agent (See Note 3) | 227,546 |
| Registration | 62,929 |
| Shareholder communication | 34,522 |
| Professional fees | 30,886 |
| Custodian | 22,801 |
| Trustees | 5,148 |
| Insurance | 2,295 |
| Shareholder service (See Note 3) | 729 |
| Miscellaneous | 8,509 |
| Total expenses before waiver/reimbursement | 1,179,598 |
| Expense waiver/reimbursement from Manager (See Note 3) | (26,496) |
| Net expenses | 1,153,102 |
| Net investment income (loss) | 4,040,088 |
| Realized and Unrealized Gain (Loss) |
| Net realized gain (loss) on: | |
| Affiliated investment company transactions | 8,763,967 |
| Realized capital gain distributions from affiliated investment companies | 10,426,113 |
| Swap transactions | 347,669 |
| Net realized gain (loss) | 19,537,749 |
Net change in unrealized appreciation (depreciation) on:
Affiliated investments companies | 29,454,112 |
| Net realized and unrealized gain (loss) | 48,991,861 |
| Net increase (decrease) in net assets resulting from operations | $53,031,949 |
The notes to the financial statements are an integral part of, and should be read in conjunction with, the financial statements.
15
Statements of Changes in Net Assets
for the six months ended April 30, 2021 (Unaudited) and the year ended October 31, 2020
| | 2021 | 2020 |
| Increase (Decrease) in Net Assets |
| Operations: | | |
| Net investment income (loss) | $ 4,040,088 | $ 8,942,738 |
| Net realized gain (loss) | 19,537,749 | 16,918,778 |
| Net change in unrealized appreciation (depreciation) | 29,454,112 | (4,337,001) |
| Net increase (decrease) in net assets resulting from operations | 53,031,949 | 21,524,515 |
| Distributions to shareholders: | | |
| Class A | (14,655,499) | (8,953,768) |
| Investor Class | (1,594,670) | (1,083,776) |
| Class B | (480,602) | (309,853) |
| Class C | (1,361,368) | (821,143) |
| Class I | (331,487) | (251,310) |
| Class R2 | (4,447) | (2,596) |
| Class R3 | (48,907) | (21,331) |
| SIMPLE Class | (3,063) | — |
| Total distributions to shareholders | (18,480,043) | (11,443,777) |
| Capital share transactions: | | |
| Net proceeds from sales of shares | 29,604,407 | 69,586,971 |
| Net asset value of shares issued to shareholder in reinvestment of distributions | 18,296,270 | 11,288,137 |
| Cost of shares redeemed | (39,606,691) | (85,507,617) |
| Increase (decrease) in net assets derived from capital share transactions | 8,293,986 | (4,632,509) |
| Net increase (decrease) in net assets | 42,845,892 | 5,448,229 |
| Net Assets |
| Beginning of period | 456,229,765 | 450,781,536 |
| End of period | $499,075,657 | $456,229,765 |
The notes to the financial statements are an integral part of, and should be read in conjunction with, the financial statements.
| 16 | MainStay Conservative Allocation Fund |
Financial Highlights selected per share data and ratios
| | Six months ended
April 30,
2021* | | Year Ended October 31, |
| Class A | 2020 | | 2019 | | 2018 | | 2017 | | 2016 |
| Net asset value at beginning of period | $ 12.23 | | $ 11.96 | | $ 11.69 | | $ 12.51 | | $ 11.60 | | $ 11.81 |
| Net investment income (loss) (a) | 0.11 | | 0.25 | | 0.24 | | 0.22 | | 0.22 | | 0.23 |
| Net realized and unrealized gain (loss) on investments | 1.31 | | 0.33 | | 0.69 | | (0.55) | | 0.95 | | 0.01 |
| Total from investment operations | 1.42 | | 0.58 | | 0.93 | | (0.33) | | 1.17 | | 0.24 |
| Less distributions: | | | | | | | | | | | |
| From net investment income | (0.13) | | (0.26) | | (0.28) | | (0.25) | | (0.23) | | (0.25) |
| From net realized gain on investments | (0.37) | | (0.05) | | (0.38) | | (0.24) | | (0.03) | | (0.20) |
| Total distributions | (0.50) | | (0.31) | | (0.66) | | (0.49) | | (0.26) | | (0.45) |
| Net asset value at end of period | $ 13.15 | | $ 12.23 | | $ 11.96 | | $ 11.69 | | $ 12.51 | | $ 11.60 |
| Total investment return (b) | 11.76% | | 5.00% | | 8.54% | | (2.73)% | | 10.36% | | 2.10% |
| Ratios (to average net assets)/Supplemental Data: | | | | | | | | | | | |
| Net investment income (loss) | 1.77%†† | | 2.10% | | 2.11% | | 1.77% | | 1.83% | | 1.99% |
| Net expenses (c) | 0.37%†† | | 0.37% | | 0.38% | | 0.36% | | 0.36% | | 0.36% |
| Portfolio turnover rate | 10% | | 70% | | 46% | | 59% | | 36% | | 44% |
| Net assets at end of period (in 000’s) | $ 399,190 | | $ 355,167 | | $ 334,242 | | $ 299,016 | | $ 314,722 | | $ 253,377 |
| * | Unaudited. |
| †† | Annualized. |
| (a) | Per share data based on average shares outstanding during the period. |
| (b) | Total investment return is calculated exclusive of sales charges and assumes the reinvestment of dividends and distributions. For periods of less than one year, total return is not annualized. |
| (c) | In addition to the fees and expenses which the Fund bears directly, it also indirectly bears a pro-rata share of the fees and expenses of the underlying funds in which it invests. Such indirect expenses are not included in the above expense ratios. |
| | Six months ended
April 30,
2021* | | Year Ended October 31, |
| Investor Class | 2020 | | 2019 | | 2018 | | 2017 | | 2016 |
| Net asset value at beginning of period | $ 12.23 | | $ 11.97 | | $ 11.69 | | $ 12.51 | | $ 11.59 | | $ 11.81 |
| Net investment income (loss) (a) | 0.10 | | 0.23 | | 0.22 | | 0.20 | | 0.20 | | 0.21 |
| Net realized and unrealized gain (loss) on investments | 1.31 | | 0.33 | | 0.70 | | (0.54) | | 0.96 | | 0.01 |
| Total from investment operations | 1.41 | | 0.56 | | 0.92 | | (0.34) | | 1.16 | | 0.22 |
| Less distributions: | | | | | | | | | | | |
| From net investment income | (0.13) | | (0.25) | | (0.26) | | (0.24) | | (0.21) | | (0.24) |
| From net realized gain on investments | (0.37) | | (0.05) | | (0.38) | | (0.24) | | (0.03) | | (0.20) |
| Total distributions | (0.50) | | (0.30) | | (0.64) | | (0.48) | | (0.24) | | (0.44) |
| Net asset value at end of period | $ 13.14 | | $ 12.23 | | $ 11.97 | | $ 11.69 | | $ 12.51 | | $ 11.59 |
| Total investment return (b) | 11.62% | | 4.80% | | 8.43% | | (2.88)% | | 10.18% | | 1.96% |
| Ratios (to average net assets)/Supplemental Data: | | | | | | | | | | | |
| Net investment income (loss) | 1.58% | | 1.93% | | 1.92% | | 1.60% | | 1.63% | | 1.85% |
| Net expenses (c) | 0.55%†† | | 0.55% | | 0.55% | | 0.51% | | 0.51% | | 0.50% |
| Expenses (before waiver/reimbursement) (c) | 0.61%†† | | 0.61% | | 0.59% | | 0.54% | | 0.51% | | 0.50% |
| Portfolio turnover rate | 10% | | 70% | | 46% | | 59% | | 36% | | 44% |
| Net assets at end of period (in 000’s) | $ 43,475 | | $ 41,762 | | $ 44,934 | | $ 37,828 | | $ 37,533 | | $ 74,166 |
| * | Unaudited. |
| †† | Annualized. |
| (a) | Per share data based on average shares outstanding during the period. |
| (b) | Total investment return is calculated exclusive of sales charges and assumes the reinvestment of dividends and distributions. For periods of less than one year, total return is not annualized. |
| (c) | In addition to the fees and expenses which the Fund bears directly, it also indirectly bears a pro-rata share of the fees and expenses of the underlying funds in which it invests. Such indirect expenses are not included in the above expense ratios. |
The notes to the financial statements are an integral part of, and should be read in conjunction with, the financial statements.
17
Financial Highlights selected per share data and ratios
| | Six months ended
April 30,
2021* | | Year Ended October 31, |
| Class B | 2020 | | 2019 | | 2018 | | 2017 | | 2016 |
| Net asset value at beginning of period | $ 12.07 | | $ 11.84 | | $ 11.64 | | $ 12.46 | | $ 11.55 | | $ 11.76 |
| Net investment income (loss) (a) | 0.05 | | 0.15 | | 0.14 | | 0.11 | | 0.11 | | 0.13 |
| Net realized and unrealized gain (loss) on investments | 1.29 | | 0.31 | | 0.69 | | (0.55) | | 0.95 | | 0.01 |
| Total from investment operations | 1.34 | | 0.46 | | 0.83 | | (0.44) | | 1.06 | | 0.14 |
| Less distributions: | | | | | | | | | | | |
| From net investment income | (0.10) | | (0.18) | | (0.25) | | (0.14) | | (0.12) | | (0.15) |
| From net realized gain on investments | (0.37) | | (0.05) | | (0.38) | | (0.24) | | (0.03) | | (0.20) |
| Total distributions | (0.47) | | (0.23) | | (0.63) | | (0.38) | | (0.15) | | (0.35) |
| Net asset value at end of period | $ 12.94 | | $ 12.07 | | $ 11.84 | | $ 11.64 | | $ 12.46 | | $ 11.55 |
| Total investment return (b) | 11.23% | | 3.99% | | 7.61% | | (3.63)% | | 9.30% | | 1.29% |
| Ratios (to average net assets)/Supplemental Data: | | | | | | | | | | | |
| Net investment income (loss) | 0.87%†† | | 1.23% | | 1.22% | | 0.89% | | 0.95% | | 1.11% |
| Net expenses (c) | 1.30%†† | | 1.30% | | 1.30% | | 1.26% | | 1.27% | | 1.25% |
| Expenses (before waiver/reimbursement) (c) | 1.36%†† | | 1.36% | | 1.34% | | 1.29% | | 1.27% | | 1.25% |
| Portfolio turnover rate | 10% | | 70% | | 46% | | 59% | | 36% | | 44% |
| Net assets at end of period (in 000’s) | $ 13,308 | | $ 13,236 | | $ 17,273 | | $ 21,988 | | $ 29,807 | | $ 32,850 |
| * | Unaudited. |
| †† | Annualized. |
| (a) | Per share data based on average shares outstanding during the period. |
| (b) | Total investment return is calculated exclusive of sales charges and assumes the reinvestment of dividends and distributions. For periods of less than one year, total return is not annualized. |
| (c) | In addition to the fees and expenses which the Fund bears directly, it also indirectly bears a pro-rata share of the fees and expenses of the underlying funds in which it invests. Such indirect expenses are not included in the above expense ratios. |
| | Six months ended
April 30,
2021* | | Year Ended October 31, |
| Class C | 2020 | | 2019 | | 2018 | | 2017 | | 2016 |
| Net asset value at beginning of period | $ 12.07 | | $ 11.84 | | $ 11.64 | | $ 12.45 | | $ 11.54 | | $ 11.76 |
| Net investment income (loss) (a) | 0.05 | | 0.14 | | 0.14 | | 0.11 | | 0.11 | | 0.13 |
| Net realized and unrealized gain (loss) on investments | 1.29 | | 0.32 | | 0.69 | | (0.54) | | 0.95 | | 0.00‡ |
| Total from investment operations | 1.34 | | 0.46 | | 0.83 | | (0.43) | | 1.06 | | 0.13 |
| Less distributions: | | | | | | | | | | | |
| From net investment income | (0.10) | | (0.18) | | (0.25) | | (0.14) | | (0.12) | | (0.15) |
| From net realized gain on investments | (0.37) | | (0.05) | | (0.38) | | (0.24) | | (0.03) | | (0.20) |
| Total distributions | (0.47) | | (0.23) | | (0.63) | | (0.38) | | (0.15) | | (0.35) |
| Net asset value at end of period | $ 12.94 | | $ 12.07 | | $ 11.84 | | $ 11.64 | | $ 12.45 | | $ 11.54 |
| Total investment return (b) | 11.23% | | 3.99% | | 7.61% | | (3.56)% | | 9.31% | | 1.20% |
| Ratios (to average net assets)/Supplemental Data: | | | | | | | | | | | |
| Net investment income (loss) | 0.83%†† | | 1.21% | | 1.24% | | 0.89% | | 0.93% | | 1.10% |
| Net expenses (c) | 1.30%†† | | 1.30% | | 1.30% | | 1.26% | | 1.27% | | 1.25% |
| Expenses (before waiver/reimbursement) (c) | 1.36%†† | | 1.36% | | 1.34% | | 1.29% | | 1.27% | | 1.25% |
| Portfolio turnover rate | 10% | | 70% | | 46% | | 59% | | 36% | | 44% |
| Net assets at end of period (in 000’s) | $ 31,986 | | $ 36,802 | | $ 44,222 | | $ 57,482 | | $ 74,457 | | $ 75,946 |
| * | Unaudited. |
| ‡ | Less than one cent per share. |
| †† | Annualized. |
| (a) | Per share data based on average shares outstanding during the period. |
| (b) | Total investment return is calculated exclusive of sales charges and assumes the reinvestment of dividends and distributions. For periods of less than one year, total return is not annualized. |
| (c) | In addition to the fees and expenses which the Fund bears directly, it also indirectly bears a pro-rata share of the fees and expenses of the underlying funds in which it invests. Such indirect expenses are not included in the above expense ratios. |
The notes to the financial statements are an integral part of, and should be read in conjunction with, the financial statements.
| 18 | MainStay Conservative Allocation Fund |
Financial Highlights selected per share data and ratios
| | Six months ended
April 30,
2021* | | Year Ended October 31, |
| Class I | 2020 | | 2019 | | 2018 | | 2017 | | 2016 |
| Net asset value at beginning of period | $ 12.36 | | $ 12.08 | | $ 11.80 | | $ 12.61 | | $ 11.69 | | $ 11.90 |
| Net investment income (loss) (a) | 0.13 | | 0.29 | | 0.28 | | 0.26 | | 0.25 | | 0.26 |
| Net realized and unrealized gain (loss) on investments | 1.32 | | 0.33 | | 0.69 | | (0.54) | | 0.96 | | 0.01 |
| Total from investment operations | 1.45 | | 0.62 | | 0.97 | | (0.28) | | 1.21 | | 0.27 |
| Less distributions: | | | | | | | | | | | |
| From net investment income | (0.14) | | (0.29) | | (0.31) | | (0.29) | | (0.26) | | (0.28) |
| From net realized gain on investments | (0.37) | | (0.05) | | (0.38) | | (0.24) | | (0.03) | | (0.20) |
| Total distributions | (0.51) | | (0.34) | | (0.69) | | (0.53) | | (0.29) | | (0.48) |
| Net asset value at end of period | $ 13.30 | | $ 12.36 | | $ 12.08 | | $ 11.80 | | $ 12.61 | | $ 11.69 |
| Total investment return (b) | 11.87% | | 5.30% | | 8.91% | | (2.38)% (c) | | 10.54% | | 2.42% |
| Ratios (to average net assets)/Supplemental Data: | | | | | | | | | | | |
| Net investment income (loss) | 2.04%†† | | 2.40% | | 2.38% | | 2.12% | | 2.05% | | 2.28% |
| Net expenses (d) | 0.12%†† | | 0.12% | | 0.13% | | 0.11% | | 0.12% | | 0.11% |
| Portfolio turnover rate | 10% | | 70% | | 46% | | 59% | | 36% | | 44% |
| Net assets at end of period (in 000’s) | $ 8,994 | | $ 7,878 | | $ 9,272 | | $ 8,036 | | $ 12,532 | | $ 12,224 |
| * | Unaudited. |
| †† | Annualized. |
| (a) | Per share data based on average shares outstanding during the period. |
| (b) | Total investment return is calculated exclusive of sales charges and assumes the reinvestment of dividends and distributions. Class I shares are not subject to sales charges. For periods of less than one year, total return is not annualized. |
| (c) | Total investment return may reflect adjustments to conform to generally accepted accounting principles. |
| (d) | In addition to the fees and expenses which the Fund bears directly, it also indirectly bears a pro-rata share of the fees and expenses of the underlying funds in which it invests. Such indirect expenses are not included in the above expense ratios. |
| | Six months ended
April 30,
2021* | | Year Ended October 31, | | June 14, 2019^ through
October 31,
2019 |
| Class R2 | 2020 | |
| Net asset value at beginning of period | $ 12.23 | | $ 11.96 | | $ 11.61 |
| Net investment income (loss) (a) | 0.11 | | 0.24 | | 0.08 |
| Net realized and unrealized gain (loss) on investments | 1.30 | | 0.34 | | 0.32 |
| Total from investment operations | 1.41 | | 0.58 | | 0.40 |
| Less distributions: | | | | | |
| From net investment income | (0.13) | | (0.26) | | (0.05) |
| From net realized gain on investments | (0.37) | | (0.05) | | — |
| Total distributions | (0.50) | | (0.31) | | (0.05) |
| Net asset value at end of period | $ 13.14 | | $ 12.23 | | $ 11.96 |
| Total investment return (b) | 11.65% | | 4.93% | | 3.44% |
| Ratios (to average net assets)/Supplemental Data: | | | | | |
| Net investment income (loss) | 1.67%†† | | 2.00% | | 1.83%†† |
| Net expenses (c) | 0.47%†† | | 0.47% | | 0.49%†† |
| Portfolio turnover rate | 10% | | 70% | | 46% |
| Net assets at end of period (in 000’s) | $ 127 | | $ 109 | | $ 100 |
| * | Unaudited. |
| ^ | Inception date. |
| †† | Annualized. |
| (a) | Per share data based on average shares outstanding during the period. |
| (b) | Total investment return is calculated exclusive of sales charges and assumes the reinvestment of dividends and distributions. Class R2 shares are not subject to sales charges. For periods of less than one year, total return is not annualized. |
| (c) | In addition to the fees and expenses which the Fund bears directly, it also indirectly bears a pro-rata share of the fees and expenses of the underlying funds in which it invests. Such indirect expenses are not included in the above expense ratios. |
The notes to the financial statements are an integral part of, and should be read in conjunction with, the financial statements.
19
Financial Highlights selected per share data and ratios
| | Six months ended
April 30,
2021* | | Year Ended October 31, | | February 29, 2016^ through
October 31,
2016 |
| Class R3 | 2020 | | 2019 | | 2018 | | 2017 | |
| Net asset value at beginning of period | $ 12.19 | | $ 11.94 | | $ 11.67 | | $ 12.50 | | $ 11.58 | | $ 10.88 |
| Net investment income (loss) (a) | 0.09 | | 0.20 | | 0.19 | | 0.15 | | 0.18 | | 0.10 |
| Net realized and unrealized gain (loss) on investments | 1.30 | | 0.34 | | 0.70 | | (0.52) | | 0.96 | | 0.72 |
| Total from investment operations | 1.39 | | 0.54 | | 0.89 | | (0.37) | | 1.14 | | 0.82 |
| Less distributions: | | | | | | | | | | | |
| From net investment income | (0.12) | | (0.24) | | (0.24) | | (0.22) | | (0.19) | | (0.12) |
| From net realized gain on investments | (0.37) | | (0.05) | | (0.38) | | (0.24) | | (0.03) | | — |
| Total distributions | (0.49) | | (0.29) | | (0.62) | | (0.46) | | (0.22) | | (0.12) |
| Net asset value at end of period | $ 13.09 | | $ 12.19 | | $ 11.94 | | $ 11.67 | | $ 12.50 | | $ 11.58 |
| Total investment return (b) | 11.53% | | 4.59% | | 8.20% | | (3.06)% | | 9.98% | | 7.59% |
| Ratios (to average net assets)/Supplemental Data: | | | | | | | | | | | |
| Net investment income (loss) | 1.47%†��� | | 1.66% | | 1.68% | | 1.25% | | 1.46% | | 1.34%†† |
| Net expenses (c) | 0.72%†† | | 0.73% | | 0.73% | | 0.71% | | 0.71% | | 0.71%†† |
| Portfolio turnover rate | 10% | | 70% | | 46% | | 59% | | 36% | | 44% |
| Net assets at end of period (in 000’s) | $ 1,847 | | $ 1,249 | | $ 739 | | $ 442 | | $ 62 | | $ 56 |
| * | Unaudited. |
| ^ | Inception date. |
| †† | Annualized. |
| (a) | Per share data based on average shares outstanding during the period. |
| (b) | Total investment return is calculated exclusive of sales charges and assumes the reinvestment of dividends and distributions. Class R3 shares are not subject to sales charges. For periods of less than one year, total return is not annualized. |
| (c) | In addition to the fees and expenses which the Fund bears directly, it also indirectly bears a pro-rata share of the fees and expenses of the underlying funds in which it invests. Such indirect expenses are not included in the above expense ratios. |
The notes to the financial statements are an integral part of, and should be read in conjunction with, the financial statements.
| 20 | MainStay Conservative Allocation Fund |
Financial Highlights selected per share data and ratios
| | Six months ended
April 30,
2021* | | August 31, 2020^ through
October 31, |
| SIMPLE Class | 2020 |
| Net asset value at beginning of period | $ 12.23 | | $ 12.58 |
| Net investment income (loss) (a) | 0.09 | | 0.03 |
| Net realized and unrealized gain (loss) on investments | 1.30 | | (0.38) |
| Total from investment operations | 1.39 | | (0.35) |
| Less distributions: | | | |
| From net investment income | (0.12) | | — |
| From net realized gain on investments | (0.37) | | — |
| Total distributions | (0.49) | | — |
| Net asset value at end of period | $ 13.13 | | $ 12.23 |
| Total investment return (b) | 11.49% | | (2.78)% |
| Ratios (to average net assets)/Supplemental Data: | | | |
| Net investment income (loss) | 1.48%†† | | 1.25%†† |
| Net expenses (c) | 0.80%†† | | 0.80%†† |
| Expenses (before waiver/reimbursement) (c) | 0.86%†† | | 0.88%†† |
| Portfolio turnover rate | 10% | | 70% |
| Net assets at end of period (in 000’s) | $ 149 | | $ 27 |
| * | Unaudited. |
| ^ | Inception date. |
| †† | Annualized. |
| (a) | Per share data based on average shares outstanding during the period. |
| (b) | Total investment return is calculated exclusive of sales charges and assumes the reinvestment of dividends and distributions. SIMPLE Class shares are not subject to sales charges. For periods of less than one year, total return is not annualized. |
| (c) | In addition to the fees and expenses which the Fund bears directly, it also indirectly bears a pro-rata share of the fees and expenses of the underlying funds in which it invests. Such indirect expenses are not included in the above expense ratios. |
The notes to the financial statements are an integral part of, and should be read in conjunction with, the financial statements.
21
MainStay Moderate Allocation Fund
Investment and Performance Comparison (Unaudited)
Performance data quoted represents past performance. Past performance is no guarantee of future results. Because of market volatility and other factors, current performance may be lower or higher than the figures shown. Investment return and principal value will fluctuate, and as a result, when shares are redeemed, they may be worth more or less than their original cost. The graph below depicts the historical performance of Class I shares of the Fund. Performance will vary from class to class based on differences in class-specific expenses and sales charges. For performance information current to the most recent month-end, please call 800-624-6782 or visit newyorklifeinvestments.com.
The performance table and graph do not reflect the deduction of taxes that a shareholder would pay on distributions or Fund share redemptions. Total returns reflect maximum applicable sales charges as indicated in the table below, if any, changes in share price, and reinvestment of dividend and capital gain distributions. The graph assumes the initial investment amount shown below and reflects the deduction of all sales charges that would have applied for the period of investment. Performance figures may reflect certain fee waivers and/or expense limitations, without which total returns may have been lower. For more information on share classes and current fee waivers and/or expense limitations (if any), please refer to the Notes to Financial Statements.
* Previously, the chart presented the Fund’s annual returns for Class B shares. Class I shares are presented for consistency across the MainStay Fund complex.
| Average Annual Total Returns for the Period-Ended April 30, 2021 |
| Class | Sales Charge | | Inception
Date | Six
Months | One Year
or Since
Inception | Five Years
or Since
Inception | Ten Years
or Since
Inception | Gross
Expense
Ratio1 |
| Class A Shares2 | Maximum 3% Initial Sales Charge | With sales charges | 4/4/2005 | 14.38% | 24.91% | 7.92% | 6.78% | 1.00% |
| | | Excluding sales charges | | 17.92 | 28.77 | 9.15 | 7.39 | 1.00 |
| Investor Class Shares2, 3 | Maximum 2.5% Initial Sales Charge | With sales charges | 2/28/2008 | 14.84 | 24.65 | 7.73 | 6.59 | 1.30 |
| | | Excluding sales charges | | 17.78 | 28.51 | 8.95 | 7.19 | 1.30 |
| Class B Shares4 | Maximum 5% CDSC | With sales charges | 4/4/2005 | 12.29 | 22.51 | 7.84 | 6.40 | 2.05 |
| | if Redeemed Within the First Six Years of Purchase | Excluding sales charges | | 17.29 | 27.51 | 8.13 | 6.40 | 2.05 |
| Class C Shares | Maximum 1% CDSC | With sales charges | 4/4/2005 | 16.30 | 26.51 | 8.15 | 6.40 | 2.05 |
| | if Redeemed Within One Year of Purchase | Excluding sales charges | | 17.30 | 27.51 | 8.15 | 6.40 | 2.05 |
| Class I Shares | No Sales Charge | | 4/4/2005 | 18.04 | 29.01 | 9.42 | 7.65 | 0.75 |
| Class R2 Shares | No Sales Charge | | 6/14/2019 | 17.82 | 28.56 | 14.19 | N/A | 1.10 |
| Class R3 Shares | No Sales Charge | | 2/29/2016 | 17.67 | 28.32 | 8.79 | 9.75 | 1.35 |
| SIMPLE Class Shares | No Sales Charge | | 8/31/2020 | 17.59 | 13.12 | N/A | N/A | 1.55 |
| 1. | The gross expense ratios presented reflect the Fund’s “Total Annual Fund Operating Expenses” from the most recent Prospectus, as supplemented and may differ from other expense ratios disclosed in this report. |
| 2. | Prior to July 22, 2019, the maximum initial sales charge applicable was 5.5%, which is reflected in the average annual total return figures shown. |
| 3. | Prior to June 30, 2020, the maximum initial sales charge for Investor Class shares was 3.0%, which is reflected in the average annual total return figures shown. |
| 4. | Class B shares are closed to all new purchases as well as additional investments by existing Class B shareholders. |
The footnotes on the next page are an integral part of the table and graph and should be carefully read in conjunction with them.
| 22 | MainStay Moderate Allocation Fund |
| Benchmark Performance | Six
Months | One
Year | Five
Years | Ten
Years |
| S&P 500® Index1 | 28.85% | 45.98% | 17.42% | 14.17% |
| MSCI EAFE® Index (Net)2 | 28.84 | 39.88 | 8.87 | 5.22 |
| Bloomberg Barclays U.S. Aggregate Bond Index3 | -1.52 | -0.27 | 3.19 | 3.39 |
| Moderate Allocation Composite Index4 | 15.98 | 25.00 | 10.59 | 8.81 |
| Morningstar Allocation - 50% to 70% Equity Category Average5 | 20.03 | 30.67 | 9.84 | 7.46 |
| 1. | The S&P 500® Index is the Fund's primary broad-based securities market index for comparison purposes. “S&P 500®” is a trademark of The McGraw-Hill Companies, Inc. The S&P 500® Index is widely regarded as the standard index for measuring large-cap U.S. stock market performance. Results assume reinvestment of all dividends and capital gains. An investment cannot be made directly in an index. |
| 2. | The MSCI EAFE® Index (Net) is the Fund’s secondary benchmark. The MSCI EAFE® Index (Net) consists of international stocks representing the developed world outside of North America. Results assume reinvestment of all dividends and capital gains. An investment cannot be made directly in an index. |
| 3. | The Fund has selected the Bloomberg Barclays U.S. Aggregate Bond Index as an additional benchmark. The Bloomberg Barclays U.S. Aggregate Bond Index is a broad-based benchmark that measures the investment grade, U.S. dollar-denominated, fixed-rate taxable bond market, including Treasurys, government-related and corporate securities, mortgage-backed securities (agency fixed-rate and hybrid adjustable rate mortgage pass-throughs), asset-backed securities, and commercial mortgage-backed securities. Results assume reinvestment of all dividends and capital gains. An investment cannot be made directly in an index. |
| 4. | The Fund has selected the Moderate Allocation Composite Index as an additional benchmark. The Moderate Allocation Composite Index consists of the S&P 500® Index, the MSCI EAFE® Index (Net) and the Bloomberg Barclays U.S. Aggregate Bond Index weighted 45%, 15% and 40%, respectively. Prior to February 28, 2014, the Moderate Allocation Composite Index consisted of the S&P 500® Index, the MSCI EAFE® Index (Net) and the Bloomberg Barclays U.S. Aggregate Bond Index weighted 50%, 10%, and 40%, respectively. Results assume reinvestment of all dividends and capital gains. An investment cannot be made directly in an index. |
| 5. | The Morningstar Allocation – 50% to 70% Equity Category Average is representative of funds that seek to provide both income and capital appreciation by investing in multiple asset classes, including stocks, bonds, and cash. These portfolios are dominated by domestic holdings and have equity exposures between 50% and 70%. Results are based on average total returns of similar funds with all dividends and capital gain distributions reinvested. |
The footnotes on the preceding page are an integral part of the table and graph and should be carefully read in conjunction with them.
Cost in Dollars of a $1,000 Investment in MainStay Moderate Allocation Fund (Unaudited)
The example below is intended to describe the fees and expenses borne by shareholders during the six-month period from November 1, 2020, to April 30, 2021, and the impact of those costs on your investment.
Example
As a shareholder of the Fund you incur two types of costs: (1) transaction costs, including exchange fees and sales charges (loads) on purchases (as applicable), and (2) ongoing costs, including management fees, distribution and/or service (12b-1) fees, and other Fund expenses (as applicable). This example is intended to help you understand your ongoing costs (in dollars) of investing in the Fund and to compare these costs with the ongoing costs of investing in other mutual funds. The example is based on an investment of $1,000 made at the beginning of the six-month period and held for the entire period from November 1, 2020, to April 30, 2021.
This example illustrates your Fund’s ongoing costs in two ways:
Actual Expenses
The second and third data columns in the table below provide information about actual account values and actual expenses. You may use the information in these columns, together with the amount you invested, to estimate the expenses that you paid during the six months ended April 30, 2021. Simply divide your account value by $1,000 (for example, an
$8,600 account value divided by $1,000 = 8.6), then multiply the result by the number under the heading entitled “Expenses Paid During Period” to estimate the expenses you paid on your account during this period.
Hypothetical Example for Comparison Purposes
The fourth and fifth data columns in the table below provide information about hypothetical account values and hypothetical expenses based on the Fund’s actual expense ratio and an assumed rate of return of 5% per year before expenses, which is not the Fund’s actual return. The hypothetical account values and expenses may not be used to estimate the actual ending account balances or expenses you paid for the six-month period shown. You may use this information to compare the ongoing costs of investing in the Fund with the ongoing costs of investing in other mutual funds. To do so, compare this 5% hypothetical example with the 5% hypothetical examples that appear in the shareholder reports of the other mutual funds.
Please note that the expenses shown in the table are meant to highlight your ongoing costs only and do not reflect any transactional costs, such as exchange fees or sales charges (loads). Therefore, the fourth and fifth data columns of the table are useful in comparing ongoing costs only and will not help you determine the relative total costs of owning different funds. In addition, if these transactional costs were included, your costs would have been higher.
| Share Class | Beginning
Account
Value
11/1/20 | Ending Account
Value (Based
on Actual
Returns and
Expenses)
4/30/21 | Expenses
Paid
During
Period1 | Ending Account
Value (Based
on Hypothetical
5% Annualized
Return and
Actual Expenses)
4/30/21 | Expenses
Paid
During
Period1 | Net Expense
Ratio
During
Period2 |
| Class A Shares | $1,000.00 | $1,179.20 | $1.89 | $1,023.06 | $1.76 | 0.35% |
| Investor Class Shares | $1,000.00 | $1,177.80 | $2.97 | $1,022.07 | $2.76 | 0.55% |
| Class B Shares | $1,000.00 | $1,172.90 | $7.00 | $1,018.35 | $6.51 | 1.30% |
| Class C Shares | $1,000.00 | $1,173.00 | $7.00 | $1,018.35 | $6.51 | 1.30% |
| Class I Shares | $1,000.00 | $1,180.40 | $0.54 | $1,024.30 | $0.50 | 0.10% |
| Class R2 Shares | $1,000.00 | $1,178.20 | $2.43 | $1,022.56 | $2.26 | 0.45% |
| Class R3 Shares | $1,000.00 | $1,176.70 | $3.78 | $1,021.32 | $3.51 | 0.70% |
| SIMPLE Class Shares | $1,000.00 | $1,175.90 | $4.32 | $1,020.83 | $4.01 | 0.80% |
| 1. | Expenses are equal to the Fund’s annualized expense ratio of each class multiplied by the average account value over the period, divided by 365 and multiplied by 181 (to reflect the six-month period). The table above represents the actual expenses incurred during the six-month period. In addition to the fees and expenses which the Fund bears directly, it also indirectly bears a pro rata share of the fees and expenses of the underlying funds in which it invests. Such indirect expenses are not included in the above-reported expense figures. |
| 2. | Expenses are equal to the Fund's annualized expense ratio to reflect the six-month period. |
| 24 | MainStay Moderate Allocation Fund |
Asset Diversification as of April 30, 2021 (Unaudited)
| Equity Funds | 56.4% |
| Fixed Income Funds | 35.4 |
| Short-Term Investments | 8.0 |
| Other Assets, Less Liabilities | 0.2 |
See Portfolio of Investments beginning on page 29 for specific holdings within these categories. The Fund’s holdings are subject to change.
Portfolio Management Discussion and Analysis (Unaudited)
Questions answered by portfolio managers Jae S. Yoon, CFA, Jonathan Swaney, Poul Kristensen, CFA, and Amit Soni, CFA, of New York Life Investment Management LLC, the Fund’s Manager.
How did MainStay Moderate Allocation Fund perform relative to its benchmarks and peer group during the six months ended April 30, 2021?
For the six months ended April 30, 2021, Class I shares of MainStay Moderate Allocation Fund returned 18.04%, underperforming the 28.85% return of the Fund’s primary benchmark, the S&P 500® Index, and the 28.84% return of the MSCI EAFE® Index (Net), which is the Fund’s secondary benchmark. Over the same period, Class I shares of the Fund outperformed the −1.52% return of the Bloomberg Barclays U.S. Aggregate Bond Index and the 15.98% return of the Moderate Allocation Composite Index, both of which are additional benchmarks of the Fund. For the six months ended April 30, 2021, Class I shares of the Fund underperformed the 20.03% return of the Morningstar Allocation—50% to 70% Equity Category Average.1
What factors affected the Fund’s relative performance during the reporting period?
The Fund is a “fund of funds,” meaning that it seeks to achieve its investment objective by investing primarily in mutual funds and exchange-traded funds (“ETFs”) managed by New York Life Investments or its affiliates (the “Underlying Funds”). The Underlying Funds may invest in U.S. equities, international equities and fixed-income instruments, making comparisons to any single index generally less suitable than a weighted combination of indices, which is a more useful yardstick by which to measure performance. The most influential factor affecting returns for the Fund during the reporting period (versus the performance of a weighted combination of indices) is the net performance of the Underlying Funds themselves, relative to their respective benchmarks.
Fund management internally maintains a blend of indices that are taken into consideration when managing the Fund. During the reporting period, the Fund’s relative performance slightly led the performance of the internally maintained blend of indices, primarily due to the materially negative impact of asset class policy. Most significantly, the Fund held underweight exposure to small-cap stocks in the Fall of 2020 and into 2021 at a time when these higher beta2 securities rallied powerfully, far surpassing the return on larger company stocks. Management of the Fund’s stock/bond blend detracted from performance as well. For reasons discussed below, the Fund held moderately underweight exposure to equities in the early months of the reporting period, and thereby participated less fully in the ongoing bull market than the internally maintained blend of indices. Similarly, within the fixed-income portion of the Fund, relative
performance suffered as holdings were tilted away from higher-risk, lower-quality instruments.
Some aspects of the Fund’s asset class policy—such as a bias toward value stocks—made positive contributions to relative returns, partially mitigating the negative affects cited above. (Contributions take weightings and total returns into account.) More significant was a strongly positive contribution from the Underlying Funds themselves. After years in which passive strategies generally held the upper hand, during the reporting period active management fared better. As a result, excess returns at the Underlying Fund level made a materially positive contribution to the Fund’s relative performance.
During the reporting period, how was the Fund’s performance materially affected by investments in derivatives?
Total return swaps were used to express most of the Fund’s asset class policy views. Therefore, the swaps can be seen as detracting from the Fund’s relative performance over the course of the reporting period.
How did you allocate the Fund’s assets during the reporting period and why?
The Fund entered the reporting period maintaining a somewhat defensive posture that favored fixed-income instruments over stocks, large companies over small companies, and high-quality debt over debt issued by less credit-worthy borrowers. This positioning arose out of our suspicion, based on the facts then available, that market pricing pulled ahead the operating conditions that prevailed at the time and, in our opinion, were likely to persist into the foreseeable future. Equity indices were trading at or near all-time highs and yields of lesser-quality credits stood near all-time lows, despite the fact that aggregate output and corporate profits were well below prior peaks. Many millions of workers were unemployed, prospects for additional policy support were unclear and the pandemic was anything but contained at that time. In our view, risks appeared skewed to the downside.
Much changed with the announcements of highly successful clinical trials for both the Moderna and Pfizer vaccines, followed shortly thereafter by the granting of emergency use authorizations and rapid distribution to the most vulnerable members of the population. These developments brought the end of pandemic restrictions into view, ushering in a wave of activity and lifting market prices.
With the end of restrictions on the horizon, we adjusted the Fund to favor pro-cyclical sectors and businesses in industries likely to
| 1. | See page 22 for other share class returns, which may be higher or lower than Class I share returns. See page 23 for more information on benchmark and peer group returns. |
| 2. | Beta is a measure of volatility in relation to the market as a whole. A beta higher than 1 indicates that a security or portfolio will tend to exhibit higher volatility than the market. A beta lower than 1 indicates that a security or portfolio will tend to exhibit lower volatility than the market. |
| 26 | MainStay Moderate Allocation Fund |
benefit most from the reopening of the U.S. economy. We also increased the Fund’s exposure to non-U.S. equities we believed were positioned to experience a recovery similar to that seen in the U.S. but on a lagged basis due to a slower vaccine rollout. Similarly, we slid down the capitalization spectrum, committing a bigger allocation of the Fund’s assets to small- and mid-cap companies we judged likely to fare well in this environment. We also reduced interest rate sensitivity in the bond portion of the Fund, anticipating that mounting inflationary pressures would result in higher bond yields. These adjustments provided a modest tailwind to the Fund’s performance in the first four months of 2021.
How did the Fund’s allocations change over the course of the reporting period?
The restructuring noted above was largely implemented through the use of derivatives, specifically total return swaps. The Fund’s exposure to mid-to-small-cap stocks, non-U.S. markets and a basket of companies specifically leveraged to the reopening of the economy was increased in this way, while exposure was dialed down for large-cap U.S. stocks and a basket of companies identified as having been beneficiaries of lockdown conditions.
We also made a few adjustments at the Underlying Fund level, the most pronounced being a reduction in the Fund’s holdings of MainStay MacKay Total Return Bond Fund with the proceeds redirected to a mix of cash, MainStay Floating Rate Fund, MainStay Short Term Bond Fund and MainStay MacKay Short Duration High Yield Fund. These changes were intended to lessen the Fund’s interest rate sensitivity at a time when yields may rise in response to mounting inflationary concerns.
Other notable changes arose from Fund restructurings as Wellington Management Company was named the new subadvisor on several MainStay Funds that concurrently underwent name changes. A few funds also were subject to mergers. By way of example, MainStay MacKay Common Stock Fund was renamed MainStay WMC Enduring Capital Fund when Wellington took the helm in early March 2021, and MainStay Epoch U.S. All Cap Fund was merged into MainStay WMC Enduring Capital Fund a short while later.
During the reporting period, which Underlying Equity Funds had the highest total returns and which had the lowest total returns?
The Underlying Equity Funds in which the Fund was invested for the entire reporting period that generated the highest total returns included IQ Chaikin U.S. Small Cap ETF, MainStay WMC Small Companies Fund (known as MainStay MacKay Small Cap Core Fund prior to March 2021), and IQ 500 International ETF. Underlying Equity Funds with the lowest total returns included MainStay Winslow Large Cap Growth Fund, MainStay Epoch
International Choice Fund, and MainStay MacKay International Equity Fund.
Which Underlying Equity Funds were the strongest positive contributors to the Fund’s performance and which Underlying Equity Funds were particularly weak?
The positions that made the largest positive contributions to performance during the reporting period were MainStay MacKay S&P 500 Index Fund, IQ Chaikin U.S. Small Cap ETF and MainStay WMC Small Companies Fund (formerly MainStay MacKay Small Cap Core Fund). While no Underlying Equity Funds produced negative absolute returns, those delivering the weakest returns included MainStay Epoch Capital Growth Fund, MainStay MacKay International Equity Fund and MainStay Epoch International Choice Fund.
During the reporting period, which Underlying Fixed-Income Funds had the highest total returns and which Underlying Fixed-Income Funds had the lowest total returns?
The Underlying Fixed-Income Funds held for the entire reporting period that posted the largest total returns were MainStay MacKay Short Duration High Yield Fund and MainStay Floating Rate Fund. Underlying Fixed-Income Funds with the lowest returns were MainStay MacKay Total Return Bond Fund and IQ High Yield Low Volatility ETF.
Which Underlying Fixed-Income Funds were the strongest positive contributors to the Fund’s performance and which Underlying Fixed-Income Funds were particularly weak?
The Underlying Fixed-Income Funds making the strongest positive contributions to the Fund’s performance included MainStay MacKay Short Duration High Yield Fund and MainStay MacKay Total Return Bond Fund. While no Underlying Fixed-Income Funds detracted from absolute performance in any meaningful way, there was effectively no positive contribution to return from either the Fund’s cash holdings or its position in MainStay Short Term Bond Fund. The Fund’s stake in IQ High Yield Low Volatility ETF added very little as well.
How was the Fund positioned at the end of the reporting period?
As of April 30, 2021, we see two countervailing forces at work within capital markets. The first is the exceptional strength of the domestic economy. The gradual reopening of full business capacity, augmented by massive fiscal and monetary policy support, is yielding a rate of expansion not seen in generations. With this as the backdrop, corporate profit growth has been nothing less than stellar, with high expectations for continued rapid improvement in earnings.
At the same time, we recognize that price gains in capital markets have significantly outpaced earnings gains, which translates into very high valuations, which in turn implies that investors are paying richly for future earnings. Should inflation materially rise, the present value of those future earnings would be diminished, potentially undermining high share price levels and sowing the seeds for a market correction. Paradoxically, it is the same strong economic growth driving profits higher that may spawn faster rates of inflation and bring the rally to an end.
We believe that upside and downside risks are approximately balanced. Therefore, we lean neither toward nor away from risk assets broadly, meaning that the Fund’s stock/bond blend is being held close to that of the benchmark, as is the Fund’s overall exposure to lower credit quality instruments. We see a different story within asset classes and believe there will be clear winners and losers from increasing consumer mobility and the full reopening of businesses. Two themes evident in the Fund’s holdings revolve around that dynamic. First, we favor more pro-cyclical elements of the economy by tilting toward value stocks and non-U.S. markets. Second, we have taken steps to guard the Fund against a rapid acceleration of inflation. Duration3 has been trimmed (i.e., the Fund has a little less exposure to the long end of the yield curve4 ) and exposure to gold miners has been maintained as a possible hedge.
| 3. | Duration is a measure of the price sensitivity of a fixed-income investment to changes in interest rates. Duration is expressed as a number of years and is considered a more accurate sensitivity gauge than average maturity. |
| 4. | The yield curve is a line that plots the yields of various securities of similar quality—typically U.S. Treasury issues—across a range of maturities. The U.S. Treasury yield curve serves as a benchmark for other debt and is used in economic forecasting. |
The opinions expressed are those of the portfolio managers as of the date of this report and are subject to change. There is no guarantee that any forecasts will come to pass. This material does not constitute investment advice and is not intended as an endorsement of any specific investment.
| 28 | MainStay Moderate Allocation Fund |
Portfolio of Investments April 30, 2021† (Unaudited)
| | Shares | Value |
| Affiliated Investment Companies 91.8% |
| Equity Funds 56.4% |
| IQ 50 Percent Hedged FTSE International ETF (a) | 698,921 | $ 17,004,748 |
| IQ 500 International ETF (a) | 661,989 | 21,492,201 |
| IQ Candriam ESG International Equity ETF (a) | 737,651 | 21,543,393 |
| IQ Candriam ESG U.S. Equity ETF (a) | 1,114,136 | 39,600,070 |
| IQ Chaikin U.S. Large Cap ETF (a) | 992,109 | 32,239,475 |
| IQ Chaikin U.S. Small Cap ETF (a) | 851,458 | 29,832,960 |
| Mainstay Candriam Emerging Markets Equity Fund Class R6 (a) | 1,578,548 | 21,278,981 |
| MainStay Epoch Capital Growth Fund Class I | 197,510 | 3,069,805 |
| MainStay Epoch International Choice Fund Class I | 376,513 | 15,611,623 |
| MainStay Epoch U.S. Equity Yield Fund Class R6 | 1,450,390 | 27,554,936 |
| MainStay MacKay International Equity Fund Class R6 | 637,679 | 14,107,237 |
| MainStay MacKay S&P 500 Index Fund Class I | 987,516 | 54,356,256 |
| MainStay Winslow Large Cap Growth Fund Class R6 | 3,183,324 | 46,423,369 |
| Mainstay WMC Enduring Capital Fund Class R6 | 1,199,612 | 39,653,519 |
| Mainstay WMC Growth Fund Class R6 | 427,627 | 22,580,171 |
| Mainstay WMC International Research Equity Fund Class I (a) | 1,925,743 | 15,369,550 |
| Mainstay WMC Small Companies Fund Class I (a) | 912,352 | 30,981,557 |
| Mainstay WMC Value Fund Class R6 | 604,650 | 32,713,965 |
Total Equity Funds
(Cost $343,040,095) | | 485,413,816 |
| | Shares | | Value |
| |
| Fixed Income Funds 35.4% |
| IQ S&P High Yield Low Volatility Bond ETF (a) | 335,818 | | $ 8,402,166 |
| MainStay Floating Rate Fund Class R6 | 1,846,115 | | 16,849,309 |
| MainStay MacKay Short Duration High Yield Fund Class I | 4,718,181 | | 46,510,885 |
| MainStay MacKay Total Return Bond Fund Class R6 (a) | 20,501,430 | | 228,414,627 |
| MainStay Short Term Bond Fund Class I | 426,964 | | 4,210,462 |
Total Fixed Income Funds
(Cost $298,037,138) | | | 304,387,449 |
Total Affiliated Investment Companies
(Cost $641,077,233) | | | 789,801,265 |
| Short-Term Investment 8.0% |
| Affiliated Investment Company 8.0% |
| MainStay U.S. Government Liquidity Fund, 0.01% (a)(b) | 68,289,200 | | 68,289,200 |
Total Short-Term Investment
(Cost $68,289,200) | 8.0% | | 68,289,200 |
Total Investments
(Cost $709,366,433) | 99.8% | | 858,090,465 |
| Other Assets, Less Liabilities | 0.2 | | 1,916,161 |
| Net Assets | 100.0% | | $ 860,006,626 |
| † | Percentages indicated are based on Fund net assets. |
| (a) | As of April 30, 2021, the Fund’s ownership exceeds 5% of the outstanding shares of the Underlying Fund’s share class |
| (b) | Current yield as of April 30, 2021. |
Swap Contracts
Open OTC total return equity swap contracts as of April 30, 2021 were as follows1:
Swap
Counterparty | Reference Obligation | Floating Rate2 | Termination
Date(s) | Payment
Frequency
Paid/
Received | Notional
Amount
Long/
(Short)
(000)3 | Unrealized
Appreciation/
(Depreciation)4 |
| Citibank NA | Citi 2nd Wave Virus Basket | 1 month LIBOR BBA plus 0.35% | 12/2/21 | Monthly | 6,274 | $ — |
| Citibank NA | Citi Stay at Home Basket | 1 month LIBOR BBA minus 0.30% | 12/2/21 | Monthly | (6,556) | — |
| Citibank NA | iShares MSCI EAFE ETF | 1 month LIBOR BBA plus 0.40% | 12/2/21 | Monthly | 21,346 | — |
| Citibank NA | iShares MSCI Emerging Markets ETF | 1 month LIBOR BBA plus 0.40% | 12/2/21 | Monthly | 8,420 | — |
| Citibank NA | Portfolio Swap S&P 500 TRI Index | 1 month LIBOR BBA plus 0.10% | 12/2/21 | Monthly | (11,854) | — |
| Citibank NA | Russell 1000 Growth Total Return Index | 1 month LIBOR BBA plus 0.03% | 12/2/21 | Monthly | (9,479) | — |
| Citibank NA | Russell 1000 Value Total Return Index | 1 month LIBOR BBA plus 0.30% | 12/2/21 | Monthly | 25,353 | — |
| Citibank NA | Russell 2000 Total Return Index | 1 month LIBOR BBA minus 0.07% | 12/2/21 | Monthly | (35,920) | — |
The notes to the financial statements are an integral part of, and should be read in conjunction with, the financial statements.
29
Portfolio of Investments April 30, 2021† (Unaudited) (continued)
Swap
Counterparty | Reference Obligation | Floating Rate2 | Termination
Date(s) | Payment
Frequency
Paid/
Received | Notional
Amount
Long/
(Short)
(000)3 | Unrealized
Appreciation/
(Depreciation)4 |
| Citibank NA | Russell Midcap Total Return Index | 1 month LIBOR BBA plus 0.31% | 12/2/21 | Monthly | 33,859 | $ — |
| Citibank NA | VanEck Vectors Gold Miners ETF | 1 month LIBOR BBA plus 0.50% | 12/2/21 | Monthly | 12,890 | — |
| | | | | | | $ — |
| 1. | As of April 30, 2021, cash in the amount $2,505,786 was pledged from brokers for OTC swap contracts. |
| 2. | Fund pays the floating rate and receives the total return of the reference entity. |
| 3. | Notional amounts reflected as a positive value indicate a long position held by the Fund or Index and a negative value indicates a short position. |
| 4. | Reflects the value at reset date as of April 30, 2021. |
| Abbreviation(s): |
| BBA—British Bankers’ Association |
| EAFE—Europe, Australasia and Far East |
| ETF—Exchange-Traded Fund |
| FTSE—Financial Times Stock Exchange |
| LIBOR—London Interbank Offered Rate |
| MSCI—Morgan Stanley Capital International |
The following is a summary of the fair valuations according to the inputs used as of April 30, 2021, for valuing the Fund’s assets:
| Description | Quoted
Prices in
Active
Markets for
Identical
Assets
(Level 1) | | Significant
Other
Observable
Inputs
(Level 2) | | Significant
Unobservable
Inputs
(Level 3) | | Total |
| Asset Valuation Inputs | | | | | | | |
| Investments in Securities (a) | | | | | | | |
| Affiliated Investment Companies | | | | | | | |
| Equity Funds | $ 485,413,816 | | $ — | | $ — | | $ 485,413,816 |
| Fixed Income Funds | 304,387,449 | | — | | — | | 304,387,449 |
| Total Affiliated Investment Companies | 789,801,265 | | — | | — | | 789,801,265 |
| Short-Term Investment | | | | | | | |
| Affiliated Investment Company | 68,289,200 | | — | | — | | 68,289,200 |
| Total Investments in Securities | $ 858,090,465 | | $ — | | $ — | | $ 858,090,465 |
| (a) | For a complete listing of investments, see the Portfolio of Investments. |
The notes to the financial statements are an integral part of, and should be read in conjunction with, the financial statements.
| 30 | MainStay Moderate Allocation Fund |
Statement of Assets and Liabilities as of April 30, 2021 (Unaudited)
| Assets |
Investment in affiliated investment companies, at value
(identified cost $709,366,433) | $858,090,465 |
| Cash collateral on deposit at broker for swap contracts | 2,505,786 |
| Receivables: | |
| Fund shares sold | 365,588 |
| Dividends and interest | 34,848 |
| Manager (See Note 3) | 14,184 |
| Other assets | 79,460 |
| Total assets | 861,090,331 |
| Liabilities |
| Payables: | |
| Dividends and interest on OTC swaps contracts | 297,052 |
| Fund shares redeemed | 241,601 |
| NYLIFE Distributors (See Note 3) | 212,816 |
| Transfer agent (See Note 3) | 180,601 |
| Shareholder communication | 75,528 |
| Professional fees | 38,112 |
| Investment securities purchased | 34,262 |
| Custodian | 2,105 |
| Accrued expenses | 1,628 |
| Total liabilities | 1,083,705 |
| Net assets | $860,006,626 |
| Composition of Net Assets |
| Shares of beneficial interest outstanding (par value of $.001 per share) unlimited number of shares authorized | $ 57,514 |
| Additional paid-in-capital | 670,026,555 |
| | 670,084,069 |
| Total distributable earnings (loss) | 189,922,557 |
| Net assets | $860,006,626 |
| Class A | |
| Net assets applicable to outstanding shares | $678,002,465 |
| Shares of beneficial interest outstanding | 45,326,710 |
| Net asset value per share outstanding | $ 14.96 |
| Maximum sales charge (3.00% of offering price) | 0.46 |
| Maximum offering price per share outstanding | $ 15.42 |
| Investor Class | |
| Net assets applicable to outstanding shares | $106,833,635 |
| Shares of beneficial interest outstanding | 7,127,377 |
| Net asset value per share outstanding | $ 14.99 |
| Maximum sales charge (2.50% of offering price) | 0.38 |
| Maximum offering price per share outstanding | $ 15.37 |
| Class B | |
| Net assets applicable to outstanding shares | $ 31,029,064 |
| Shares of beneficial interest outstanding | 2,093,276 |
| Net asset value and offering price per share outstanding | $ 14.82 |
| Class C | |
| Net assets applicable to outstanding shares | $ 32,034,867 |
| Shares of beneficial interest outstanding | 2,161,915 |
| Net asset value and offering price per share outstanding | $ 14.82 |
| Class I | |
| Net assets applicable to outstanding shares | $ 10,123,327 |
| Shares of beneficial interest outstanding | 671,900 |
| Net asset value and offering price per share outstanding | $ 15.07 |
| Class R2 | |
| Net assets applicable to outstanding shares | $ 166,475 |
| Shares of beneficial interest outstanding | 11,134 |
| Net asset value and offering price per share outstanding | $ 14.95 |
| Class R3 | |
| Net assets applicable to outstanding shares | $ 1,345,892 |
| Shares of beneficial interest outstanding | 90,170 |
| Net asset value and offering price per share outstanding | $ 14.93 |
| SIMPLE Class | |
| Net assets applicable to outstanding shares | $ 470,901 |
| Shares of beneficial interest outstanding | 31,440 |
| Net asset value and offering price per share outstanding | $ 14.98 |
The notes to the financial statements are an integral part of, and should be read in conjunction with, the financial statements.
31
Statement of Operations for the six months ended April 30, 2021 (Unaudited)
| Investment Income (Loss) |
| Income | |
| Dividend distributions from affiliated investment companies | $ 7,573,774 |
| Interest | 2,005 |
| Total income | 7,575,779 |
| Expenses | |
| Distribution/Service—Class A (See Note 3) | 789,806 |
| Distribution/Service—Investor Class (See Note 3) | 132,965 |
| Distribution/Service—Class B (See Note 3) | 160,604 |
| Distribution/Service—Class C (See Note 3) | 182,424 |
| Distribution/Service—Class R2 (See Note 3) | 196 |
| Distribution/Service—Class R3 (See Note 3) | 2,724 |
| Distribution/Service—SIMPLE Class (See Note 3) | 545 |
| Transfer agent (See Note 3) | 467,011 |
| Registration | 62,964 |
| Shareholder communication | 57,191 |
| Professional fees | 40,182 |
| Custodian | 22,464 |
| Trustees | 8,489 |
| Insurance | 3,691 |
| Shareholder service (See Note 3) | 623 |
| Miscellaneous | 11,108 |
| Total expenses before waiver/reimbursement | 1,942,987 |
| Expense waiver/reimbursement from Manager (See Note 3) | (90,487) |
| Net expenses | 1,852,500 |
| Net investment income (loss) | 5,723,279 |
| Realized and Unrealized Gain (Loss) |
| Net realized gain (loss) on: | |
| Affiliated investment company transactions | 22,812,908 |
| Realized capital gain distributions from affiliated investment companies | 25,219,343 |
| Swap transactions | 1,311,631 |
| Net realized gain (loss) | 49,343,882 |
Net change in unrealized appreciation (depreciation) on:
Affiliated investments companies | 76,656,647 |
| Net realized and unrealized gain (loss) | 126,000,529 |
| Net increase (decrease) in net assets resulting from operations | $131,723,808 |
The notes to the financial statements are an integral part of, and should be read in conjunction with, the financial statements.
| 32 | MainStay Moderate Allocation Fund |
Statements of Changes in Net Assets
for the six months ended April 30, 2021 (Unaudited) and the year ended October 31, 2020
| | 2021 | 2020 |
| Increase (Decrease) in Net Assets |
| Operations: | | |
| Net investment income (loss) | $ 5,723,279 | $ 13,176,615 |
| Net realized gain (loss) | 49,343,882 | 35,371,731 |
| Net change in unrealized appreciation (depreciation) | 76,656,647 | (13,740,645) |
| Net increase (decrease) in net assets resulting from operations | 131,723,808 | 34,807,701 |
| Distributions to shareholders: | | |
| Class A | (34,276,012) | (21,900,859) |
| Investor Class | (5,401,003) | (3,720,348) |
| Class B | (1,464,688) | (1,134,789) |
| Class C | (1,732,553) | (1,247,417) |
| Class I | (525,585) | (491,902) |
| Class R2 | (8,311) | (5,717) |
| Class R3 | (53,511) | (35,111) |
| SIMPLE Class | (5,676) | — |
| Total distributions to shareholders | (43,467,339) | (28,536,143) |
| Capital share transactions: | | |
| Net proceeds from sales of shares | 43,290,713 | 84,720,414 |
| Net asset value of shares issued to shareholder in reinvestment of distributions | 43,197,762 | 28,344,237 |
| Cost of shares redeemed | (61,542,171) | (128,342,097) |
| Increase (decrease) in net assets derived from capital share transactions | 24,946,304 | (15,277,446) |
| Net increase (decrease) in net assets | 113,202,773 | (9,005,888) |
| Net Assets |
| Beginning of period | 746,803,853 | 755,809,741 |
| End of period | $860,006,626 | $ 746,803,853 |
The notes to the financial statements are an integral part of, and should be read in conjunction with, the financial statements.
33
Financial Highlights selected per share data and ratios
| | Six months ended
April 30,
2021* | | Year Ended October 31, |
| Class A | 2020 | | 2019 | | 2018 | | 2017 | | 2016 |
| Net asset value at beginning of period | $ 13.41 | | $ 13.28 | | $ 13.14 | | $ 14.23 | | $ 12.83 | | $ 13.32 |
| Net investment income (loss) (a) | 0.11 | | 0.24 | | 0.23 | | 0.20 | | 0.20 | | 0.20 |
| Net realized and unrealized gain (loss) on investments | 2.24 | | 0.41 | | 0.81 | | (0.53) | | 1.67 | | (0.06) |
| Total from investment operations | 2.35 | | 0.65 | | 1.04 | | (0.33) | | 1.87 | | 0.14 |
| Less distributions: | | | | | | | | | | | |
| From net investment income | (0.23) | | (0.26) | | (0.27) | | (0.31) | | (0.25) | | (0.24) |
| From net realized gain on investments | (0.57) | | (0.26) | | (0.63) | | (0.45) | | (0.22) | | (0.39) |
| Total distributions | (0.80) | | (0.52) | | (0.90) | | (0.76) | | (0.47) | | (0.63) |
| Net asset value at end of period | $ 14.96 | | $ 13.41 | | $ 13.28 | | $ 13.14 | | $ 14.23 | | $ 12.83 |
| Total investment return (b) | 17.92% | | 4.96% | | 8.88% | | (2.58)% | | 14.98% | | 1.15% |
| Ratios (to average net assets)/Supplemental Data: | | | | | | | | | | | |
| Net investment income (loss) | 1.50%†† | | 1.87% | | 1.82% | | 1.47% | | 1.52% | | 1.61% |
| Net expenses (c) | 0.35%†† | | 0.36% | | 0.36% | | 0.34% | | 0.35% | | 0.35% |
| Portfolio turnover rate | 13% | | 59% | | 45% | | 52% | | 33% | | 37% |
| Net assets at end of period (in 000’s) | $ 678,002 | | $ 568,079 | | $ 553,530 | | $ 480,956 | | $ 500,627 | | $ 349,764 |
| * | Unaudited. |
| †† | Annualized. |
| (a) | Per share data based on average shares outstanding during the period. |
| (b) | Total investment return is calculated exclusive of sales charges and assumes the reinvestment of dividends and distributions. For periods of less than one year, total return is not annualized. |
| (c) | In addition to the fees and expenses which the Fund bears directly, it also indirectly bears a pro-rata share of the fees and expenses of the underlying funds in which it invests. Such indirect expenses are not included in the above expense ratios. |
| | Six months ended
April 30,
2021* | | Year Ended October 31, |
| Investor Class | 2020 | | 2019 | | 2018 | | 2017 | | 2016 |
| Net asset value at beginning of period | $ 13.42 | | $ 13.28 | | $ 13.14 | | $ 14.22 | | $ 12.81 | | $ 13.31 |
| Net investment income (loss) (a) | 0.09 | | 0.22 | | 0.21 | | 0.18 | | 0.18 | | 0.18 |
| Net realized and unrealized gain (loss) on investments | 2.24 | | 0.41 | | 0.81 | | (0.54) | | 1.67 | | (0.08) |
| Total from investment operations | 2.33 | | 0.63 | | 1.02 | | (0.36) | | 1.85 | | 0.10 |
| Less distributions: | | | | | | | | | | | |
| From net investment income | (0.19) | | (0.23) | | (0.25) | | (0.27) | | (0.22) | | (0.21) |
| From net realized gain on investments | (0.57) | | (0.26) | | (0.63) | | (0.45) | | (0.22) | | (0.39) |
| Total distributions | (0.76) | | (0.49) | | (0.88) | | (0.72) | | (0.44) | | (0.60) |
| Net asset value at end of period | $ 14.99 | | $ 13.42 | | $ 13.28 | | $ 13.14 | | $ 14.22 | | $ 12.81 |
| Total investment return (b) | 17.78% | | 4.83% | | 8.64% | | (2.78)% | | 14.89% | | 0.90% |
| Ratios (to average net assets)/Supplemental Data: | | | | | | | | | | | |
| Net investment income (loss) | 1.29% | | 1.68% | | 1.60% | | 1.30% | | 1.32% | | 1.43% |
| Net expenses (c) | 0.55%†† | | 0.55% | | 0.55% | | 0.51% | | 0.53% | | 0.53% |
| Expenses (before waiver/reimbursement) (c) | 0.65%†† | | 0.66% | | 0.64% | | 0.58% | | 0.53% | | 0.53% |
| Portfolio turnover rate | 13% | | 59% | | 45% | | 52% | | 33% | | 37% |
| Net assets at end of period (in 000’s) | $ 106,834 | | $ 101,831 | | $ 104,946 | | $ 84,202 | | $ 84,951 | | $ 168,146 |
| * | Unaudited. |
| †† | Annualized. |
| (a) | Per share data based on average shares outstanding during the period. |
| (b) | Total investment return is calculated exclusive of sales charges and assumes the reinvestment of dividends and distributions. For periods of less than one year, total return is not annualized. |
| (c) | In addition to the fees and expenses which the Fund bears directly, it also indirectly bears a pro-rata share of the fees and expenses of the underlying funds in which it invests. Such indirect expenses are not included in the above expense ratios. |
The notes to the financial statements are an integral part of, and should be read in conjunction with, the financial statements.
| 34 | MainStay Moderate Allocation Fund |
Financial Highlights selected per share data and ratios
| | Six months ended
April 30,
2021* | | Year Ended October 31, |
| Class B | 2020 | | 2019 | | 2018 | | 2017 | | 2016 |
| Net asset value at beginning of period | $ 13.23 | | $ 13.09 | | $ 12.94 | | $ 14.00 | | $ 12.62 | | $ 13.11 |
| Net investment income (loss) (a) | 0.05 | | 0.13 | | 0.12 | | 0.08 | | 0.08 | | 0.09 |
| Net realized and unrealized gain (loss) on investments | 2.20 | | 0.39 | | 0.79 | | (0.53) | | 1.65 | | (0.08) |
| Total from investment operations | 2.25 | | 0.52 | | 0.91 | | (0.45) | | 1.73 | | 0.01 |
| Less distributions: | | | | | | | | | | | |
| From net investment income | (0.09) | | (0.12) | | (0.13) | | (0.16) | | (0.13) | | (0.11) |
| From net realized gain on investments | (0.57) | | (0.26) | | (0.63) | | (0.45) | | (0.22) | | (0.39) |
| Total distributions | (0.66) | | (0.38) | | (0.76) | | (0.61) | | (0.35) | | (0.50) |
| Net asset value at end of period | $ 14.82 | | $ 13.23 | | $ 13.09 | | $ 12.94 | | $ 14.00 | | $ 12.62 |
| Total investment return (b) | 17.29% | | 4.03% | | 7.82% | | (3.45)% | | 13.98% | | 0.17% |
| Ratios (to average net assets)/Supplemental Data: | | | | | | | | | | | |
| Net investment income (loss) | 0.65%†† | | 1.00% | | 0.96% | | 0.60% | | 0.63% | | 0.71% |
| Net expenses (c) | 1.30%†† | | 1.30% | | 1.30% | | 1.26% | | 1.29% | | 1.28% |
| Expenses (before waiver/reimbursement) (c) | 1.40%†† | | 1.40% | | 1.38% | | 1.33% | | 1.29% | | 1.28% |
| Portfolio turnover rate | 13% | | 59% | | 45% | | 52% | | 33% | | 37% |
| Net assets at end of period (in 000’s) | $ 31,029 | | $ 31,682 | | $ 40,817 | | $ 50,416 | | $ 67,352 | | $ 71,339 |
| * | Unaudited. |
| †† | Annualized. |
| (a) | Per share data based on average shares outstanding during the period. |
| (b) | Total investment return is calculated exclusive of sales charges and assumes the reinvestment of dividends and distributions. For periods of less than one year, total return is not annualized. |
| (c) | In addition to the fees and expenses which the Fund bears directly, it also indirectly bears a pro-rata share of the fees and expenses of the underlying funds in which it invests. Such indirect expenses are not included in the above expense ratios. |
| | Six months ended
April 30,
2021* | | Year Ended October 31, |
| Class C | 2020 | | 2019 | | 2018 | | 2017 | | 2016 |
| Net asset value at beginning of period | $ 13.23 | | $ 13.08 | | $ 12.93 | | $ 14.00 | | $ 12.62 | | $ 13.11 |
| Net investment income (loss) (a) | 0.04 | | 0.13 | | 0.13 | | 0.08 | | 0.08 | | 0.09 |
| Net realized and unrealized gain (loss) on investments | 2.21 | | 0.40 | | 0.78 | | (0.54) | | 1.65 | | (0.08) |
| Total from investment operations | 2.25 | | 0.53 | | 0.91 | | (0.46) | | 1.73 | | 0.01 |
| Less distributions: | | | | | | | | | | | |
| From net investment income | (0.09) | | (0.12) | | (0.13) | | (0.16) | | (0.13) | | (0.11) |
| From net realized gain on investments | (0.57) | | (0.26) | | (0.63) | | (0.45) | | (0.22) | | (0.39) |
| Total distributions | (0.66) | | (0.38) | | (0.76) | | (0.61) | | (0.35) | | (0.50) |
| Net asset value at end of period | $ 14.82 | | $ 13.23 | | $ 13.08 | | $ 12.93 | | $ 14.00 | | $ 12.62 |
| Total investment return (b) | 17.30% | | 4.11% | | 7.83% | | (3.52)% | | 13.98% | | 0.17% |
| Ratios (to average net assets)/Supplemental Data: | | | | | | | | | | | |
| Net investment income (loss) | 0.57%†† | | 0.99% | | 1.00% | | 0.59% | | 0.61% | | 0.69% |
| Net expenses (c) | 1.30%†† | | 1.30% | | 1.30% | | 1.26% | | 1.29% | | 1.28% |
| Expenses (before waiver/reimbursement) (c) | 1.40%†† | | 1.40% | | 1.38% | | 1.33% | | 1.29% | | 1.28% |
| Portfolio turnover rate | 13% | | 59% | | 45% | | 52% | | 33% | | 37% |
| Net assets at end of period (in 000’s) | $ 32,035 | | $ 35,483 | | $ 43,681 | | $ 57,496 | | $ 69,641 | | $ 69,090 |
| * | Unaudited. |
| †† | Annualized. |
| (a) | Per share data based on average shares outstanding during the period. |
| (b) | Total investment return is calculated exclusive of sales charges and assumes the reinvestment of dividends and distributions. For periods of less than one year, total return is not annualized. |
| (c) | In addition to the fees and expenses which the Fund bears directly, it also indirectly bears a pro-rata share of the fees and expenses of the underlying funds in which it invests. Such indirect expenses are not included in the above expense ratios. |
The notes to the financial statements are an integral part of, and should be read in conjunction with, the financial statements.
35
Financial Highlights selected per share data and ratios
| | Six months ended
April 30,
2021* | | Year Ended October 31, |
| Class I | 2020 | | 2019 | | 2018 | | 2017 | | 2016 |
| Net asset value at beginning of period | $ 13.52 | | $ 13.37 | | $ 13.24 | | $ 14.34 | | $ 12.92 | | $ 13.41 |
| Net investment income (loss) (a) | 0.12 | | 0.30 | | 0.28 | | 0.24 | | 0.24 | | 0.24 |
| Net realized and unrealized gain (loss) on investments | 2.26 | | 0.40 | | 0.79 | | (0.54) | | 1.68 | | (0.07) |
| Total from investment operations | 2.38 | | 0.70 | | 1.07 | | (0.30) | | 1.92 | | 0.17 |
| Less distributions: | | | | | | | | | | | |
| From net investment income | (0.26) | | (0.29) | | (0.31) | | (0.35) | | (0.28) | | (0.27) |
| From net realized gain on investments | (0.57) | | (0.26) | | (0.63) | | (0.45) | | (0.22) | | (0.39) |
| Total distributions | (0.83) | | (0.55) | | (0.94) | | (0.80) | | (0.50) | | (0.66) |
| Net asset value at end of period | $ 15.07 | | $ 13.52 | | $ 13.37 | | $ 13.24 | | $ 14.34 | | $ 12.92 |
| Total investment return (b) | 18.04% | | 5.33% | | 9.04% | | (2.39)% | | 15.32% | | 1.41% |
| Ratios (to average net assets)/Supplemental Data: | | | | | | | | | | | |
| Net investment income (loss) | 1.70%†† | | 2.31% | | 2.15% | | 1.75% | | 1.76% | | 1.87% |
| Net expenses (c) | 0.10%†† | | 0.11% | | 0.11% | | 0.09% | | 0.10% | | 0.10% |
| Portfolio turnover rate | 13% | | 59% | | 45% | | 52% | | 33% | | 37% |
| Net assets at end of period (in 000’s) | $ 10,123 | | $ 8,586 | | $ 11,687 | | $ 13,108 | | $ 14,973 | | $ 13,068 |
| * | Unaudited. |
| †† | Annualized. |
| (a) | Per share data based on average shares outstanding during the period. |
| (b) | Total investment return is calculated exclusive of sales charges and assumes the reinvestment of dividends and distributions. Class I shares are not subject to sales charges. For periods of less than one year, total return is not annualized. |
| (c) | In addition to the fees and expenses which the Fund bears directly, it also indirectly bears a pro-rata share of the fees and expenses of the underlying funds in which it invests. Such indirect expenses are not included in the above expense ratios. |
| | Six months ended
April 30,
2021* | | Year Ended October 31, | | June 14, 2019^ through
October 31,
2019 |
| Class R2 | 2020 | |
| Net asset value at beginning of period | $ 13.40 | | $ 13.27 | | $ 12.78 |
| Net investment income (loss) (a) | 0.10 | | 0.24 | | 0.06 |
| Net realized and unrealized gain (loss) on investments | 2.23 | | 0.40 | | 0.43 |
| Total from investment operations | 2.33 | | 0.64 | | 0.49 |
| Less distributions: | | | | | |
| From net investment income | (0.21) | | (0.25) | | — |
| From net realized gain on investments | (0.57) | | (0.26) | | — |
| Total distributions | (0.78) | | (0.51) | | — |
| Net asset value at end of period | $ 14.95 | | $ 13.40 | | $ 13.27 |
| Total investment return (b) | 17.82% | | 4.89% | | 3.83% |
| Ratios (to average net assets)/Supplemental Data: | | | | | |
| Net investment income (loss) | 1.39%†† | | 1.81% | | 1.13%†† |
| Net expenses (c) | 0.45%†† | | 0.46% | | 0.47%†† |
| Portfolio turnover rate | 13% | | 59% | | 45% |
| Net assets at end of period (in 000’s) | $ 166 | | $ 141 | | $ 147 |
| * | Unaudited. |
| ^ | Inception date. |
| †† | Annualized. |
| (a) | Per share data based on average shares outstanding during the period. |
| (b) | Total investment return is calculated exclusive of sales charges and assumes the reinvestment of dividends and distributions. Class R2 shares are not subject to sales charges. For periods of less than one year, total return is not annualized. |
| (c) | In addition to the fees and expenses which the Fund bears directly, it also indirectly bears a pro-rata share of the fees and expenses of the underlying funds in which it invests. Such indirect expenses are not included in the above expense ratios. |
The notes to the financial statements are an integral part of, and should be read in conjunction with, the financial statements.
| 36 | MainStay Moderate Allocation Fund |
Financial Highlights selected per share data and ratios
| | Six months ended
April 30,
2021* | | Year Ended October 31, | | February 29, 2016^ through
October 31, |
| Class R3 | 2020 | | 2019 | | 2018 | | 2017 | | 2016 |
| Net asset value at beginning of period | $ 13.37 | | $ 13.24 | | $ 13.09 | | $ 14.20 | | $ 12.80 | | $ 11.77 |
| Net investment income (loss) (a) | 0.08 | | 0.20 | | 0.17 | | 0.13 | | 0.09 | | 0.07 |
| Net realized and unrealized gain (loss) on investments | 2.23 | | 0.42 | | 0.82 | | (0.50) | | 1.73 | | 0.96 |
| Total from investment operations | 2.31 | | 0.62 | | 0.99 | | (0.37) | | 1.82 | | 1.03 |
| Less distributions: | | | | | | | | | | | |
| From net investment income | (0.18) | | (0.23) | | (0.21) | | (0.29) | | (0.20) | | — |
| From net realized gain on investments | (0.57) | | (0.26) | | (0.63) | | (0.45) | | (0.22) | | — |
| Total distributions | (0.75) | | (0.49) | | (0.84) | | (0.74) | | (0.42) | | — |
| Net asset value at end of period | $ 14.93 | | $ 13.37 | | $ 13.24 | | $ 13.09 | | $ 14.20 | | $ 12.80 |
| Total investment return (b) | 17.67% | | 4.70% | | 8.46% | | (2.91)% | | 14.63% | | 8.75% |
| Ratios (to average net assets)/Supplemental Data: | | | | | | | | | | | |
| Net investment income (loss) | 1.16%†† | | 1.54% | | 1.32% | | 0.94% | | 0.64% | | 0.85%†† |
| Net expenses (c) | 0.70%†† | | 0.71% | | 0.71% | | 0.69% | | 0.69% | | 0.70%†† |
| Portfolio turnover rate | 13% | | 59% | | 45% | | 52% | | 33% | | 37% |
| Net assets at end of period (in 000’s) | $ 1,346 | | $ 964 | | $ 1,004 | | $ 459 | | $ 212 | | $ 64 |
| * | Unaudited. |
| ^ | Inception date. |
| †† | Annualized. |
| (a) | Per share data based on average shares outstanding during the period. |
| (b) | Total investment return is calculated exclusive of sales charges and assumes the reinvestment of dividends and distributions. Class R3 shares are not subject to sales charges. For periods of less than one year, total return is not annualized. |
| (c) | In addition to the fees and expenses which the Fund bears directly, it also indirectly bears a pro-rata share of the fees and expenses of the underlying funds in which it invests. Such indirect expenses are not included in the above expense ratios. |
The notes to the financial statements are an integral part of, and should be read in conjunction with, the financial statements.
37
Financial Highlights selected per share data and ratios
| | Six months ended
April 30,
2021* | | August 31, 2020^ through
October 31, |
| SIMPLE Class | 2020 |
| Net asset value at beginning of period | $ 13.42 | | $ 13.95 |
| Net investment income (loss) (a) | 0.06 | | 0.02 |
| Net realized and unrealized gain (loss) on investments | 2.25 | | (0.55) |
| Total from investment operations | 2.31 | | (0.53) |
| Less distributions: | | | |
| From net investment income | (0.18) | | — |
| From net realized gain on investments | (0.57) | | — |
| Total distributions | (0.75) | | — |
| Net asset value at end of period | $ 14.98 | | $ 13.42 |
| Total investment return (b) | 17.59% | | (3.80)% |
| Ratios (to average net assets)/Supplemental Data: | | | |
| Net investment income (loss) | 0.83%†† | | 0.95%†† |
| Net expenses (c) | 0.80%†† | | 0.80%†† |
| Expenses (before waiver/reimbursement) (c) | 0.90%†† | | 0.93%†† |
| Portfolio turnover rate | 13% | | 59% |
| Net assets at end of period (in 000’s) | $ 471 | | $ 38 |
| * | Unaudited. |
| ^ | Inception date. |
| †† | Annualized. |
| (a) | Per share data based on average shares outstanding during the period. |
| (b) | Total investment return is calculated exclusive of sales charges and assumes the reinvestment of dividends and distributions. SIMPLE Class shares are not subject to sales charges. For periods of less than one year, total return is not annualized. |
| (c) | In addition to the fees and expenses which the Fund bears directly, it also indirectly bears a pro-rata share of the fees and expenses of the underlying funds in which it invests. Such indirect expenses are not included in the above expense ratios. |
The notes to the financial statements are an integral part of, and should be read in conjunction with, the financial statements.
| 38 | MainStay Moderate Allocation Fund |
MainStay Growth Allocation Fund
Investment and Performance Comparison (Unaudited)
Performance data quoted represents past performance. Past performance is no guarantee of future results. Because of market volatility and other factors, current performance may be lower or higher than the figures shown. Investment return and principal value will fluctuate, and as a result, when shares are redeemed, they may be worth more or less than their original cost. The graph below depicts the historical performance of Class I shares of the Fund. Performance will vary from class to class based on differences in class-specific expenses and sales charges. For performance information current to the most recent month-end, please call 800-624-6782 or visit newyorklifeinvestments.com.
The performance table and graph do not reflect the deduction of taxes that a shareholder would pay on distributions or Fund share redemptions. Total returns reflect maximum applicable sales charges as indicated in the table below, if any, changes in share price, and reinvestment of dividend and capital gain distributions. The graph assumes the initial investment amount shown below and reflects the deduction of all sales charges that would have applied for the period of investment. Performance figures may reflect certain fee waivers and/or expense limitations, without which total returns may have been lower. For more information on share classes and current fee waivers and/or expense limitations (if any), please refer to the Notes to Financial Statements.
* Previously, the chart presented the Fund's annual returns for Class B shares. Class I shares are presented for consistency across the MainStay Fund complex.
| Average Annual Total Returns for the Period-Ended April 30, 2021 |
| Class | Sales Charge | | Inception
Date | Six
Months | One Year
or Since
Inception | Five Years
or Since
Inception | Ten Years
or Since
Inception | Gross
Expense
Ratio1 |
| Class A Shares2 | Maximum 3% Initial Sales Charge | With sales charges | 4/4/2005 | 20.74% | 34.43% | 9.49% | 7.80% | 1.07% |
| | | Excluding sales charges | | 24.47 | 38.59 | 10.74 | 8.41 | 1.07 |
| Investor Class Shares2, 3 | Maximum 2.5% Initial Sales Charge | With sales charges | 2/28/2008 | 21.27 | 34.23 | 9.28 | 7.61 | 1.37 |
| | | Excluding sales charges | | 24.38 | 38.39 | 10.53 | 8.22 | 1.37 |
| Class B Shares4 | Maximum 5% CDSC | With sales charges | 4/4/2005 | 18.87 | 32.31 | 9.43 | 7.42 | 2.12 |
| | if Redeemed Within the First Six Years of Purchase | Excluding sales charges | | 23.87 | 37.31 | 9.71 | 7.42 | 2.12 |
| Class C Shares | Maximum 1% CDSC | With sales charges | 4/4/2005 | 22.87 | 36.30 | 9.71 | 7.42 | 2.12 |
| | if Redeemed Within One Year of Purchase | Excluding sales charges | | 23.87 | 37.30 | 9.71 | 7.42 | 2.12 |
| Class I Shares | No Sales Charge | | 4/4/2005 | 24.63 | 38.99 | 11.01 | 8.68 | 0.82 |
| Class R1 Shares | No Sales Charge | | 6/14/2019 | 24.55 | 38.80 | 17.32 | N/A | 0.92 |
| Class R2 Shares | No Sales Charge | | 6/14/2019 | 24.36 | 38.48 | 17.05 | N/A | 1.17 |
| Class R3 Shares | No Sales Charge | | 2/29/2016 | 24.22 | 38.08 | 10.35 | 11.52 | 1.42 |
| SIMPLE Class Shares | No Sales Charge | | 8/31/2020 | 24.15 | 18.37 | N/A | N/A | 1.62 |
| 1. | The gross expense ratios presented reflect the Fund’s “Total Annual Fund Operating Expenses” from the most recent Prospectus, as supplemented and may differ from other expense ratios disclosed in this report. |
| 2. | Prior to July 22, 2019, the maximum initial sales charge applicable was 5.5%, which is reflected in the average annual total return figures shown. |
| 3. | Prior to June 30, 2020, the maximum initial sales charge for Investor Class shares was 3.0%, which is reflected in the average annual total return figures shown. |
| 4. | Class B shares are closed to all new purchases as well as additional investments by existing Class B shareholders. |
The footnotes on the next page are an integral part of the table and graph and should be carefully read in conjunction with them.
| Benchmark Performance | Six
Months | One
Year | Five
Years | Ten
Years |
| S&P 500® Index1 | 28.85% | 45.98% | 17.42% | 14.17% |
| MSCI EAFE® Index (Net)2 | 28.84 | 39.88 | 8.87 | 5.22 |
| Bloomberg Barclays U.S. Aggregate Bond Index3 | -1.52 | -0.27 | 3.19 | 3.39 |
| Growth Allocation Composite Index4 | 22.30 | 34.47 | 12.96 | 10.46 |
| Morningstar Allocation - 70% to 85% Equity Category Average5 | 24.69 | 37.88 | 10.73 | 7.88 |
| 1. | The S&P 500® Index is the Fund's primary broad-based securities market index for comparison purposes. “S&P 500®” is a trademark of The McGraw-Hill Companies, Inc. The S&P 500® Index is widely regarded as the standard index for measuring large-cap U.S. stock market performance. Results assume reinvestment of all dividends and capital gains. An investment cannot be made directly in an index. |
| 2. | The MSCI EAFE® Index (Net) is the Fund’s secondary benchmark. The MSCI EAFE® Index (Net) consists of international stocks representing the developed world outside of North America. Results assume reinvestment of all dividends and capital gains. An investment cannot be made directly in an index. |
| 3. | The Fund has selected the Bloomberg Barclays U.S. Aggregate Bond Index as an additional benchmark. The Bloomberg Barclays U.S. Aggregate Bond Index is a broad-based benchmark that measures the investment grade, U.S. dollar-denominated, fixed-rate taxable bond market, including Treasurys, government-related and corporate securities, mortgage-backed securities (agency fixed-rate and hybrid adjustable rate mortgage pass-throughs), asset-backed securities, and commercial mortgage-backed securities. Results assume reinvestment of all dividends and capital gains. An investment cannot be made directly in an index. |
| 4. | The Fund has selected the Moderate Allocation Composite Index as an additional benchmark. The Moderate Allocation Composite Index consists of the S&P 500® Index, the MSCI EAFE® Index (Net) and the Bloomberg Barclays U.S. Aggregate Bond Index weighted 45%, 15% and 40%, respectively. Results assume reinvestment of all dividends and capital gains. An investment cannot be made directly in an index. |
| 5. | The Morningstar Allocation – 70% to 85% Equity Category Average is representative of funds that seek to provide both income and capital appreciation by investing in multiple asset classes, including stocks, bonds, and cash. These portfolios are dominated by domestic holdings and have equity exposures between 70% and 85%. Results are based on average total returns of similar funds with all dividends and capital gain distributions reinvested. |
The footnotes on the preceding page are an integral part of the table and graph and should be carefully read in conjunction with them.
| 40 | MainStay Growth Allocation Fund |
Cost in Dollars of a $1,000 Investment in MainStay Growth Allocation Fund (Unaudited)
The example below is intended to describe the fees and expenses borne by shareholders during the six-month period from November 1, 2020, to April 30, 2021, and the impact of those costs on your investment.
Example
As a shareholder of the Fund you incur two types of costs: (1) transaction costs, including exchange fees and sales charges (loads) on purchases (as applicable), and (2) ongoing costs, including management fees, distribution and/or service (12b-1) fees, and other Fund expenses (as applicable). This example is intended to help you understand your ongoing costs (in dollars) of investing in the Fund and to compare these costs with the ongoing costs of investing in other mutual funds. The example is based on an investment of $1,000 made at the beginning of the six-month period and held for the entire period from November 1, 2020, to April 30, 2021.
This example illustrates your Fund’s ongoing costs in two ways:
Actual Expenses
The second and third data columns in the table below provide information about actual account values and actual expenses. You may use the information in these columns, together with the amount you invested, to estimate the expenses that you paid during the six months ended April 30, 2021. Simply divide your account value by $1,000 (for example, an
$8,600 account value divided by $1,000 = 8.6), then multiply the result by the number under the heading entitled “Expenses Paid During Period” to estimate the expenses you paid on your account during this period.
Hypothetical Example for Comparison Purposes
The fourth and fifth data columns in the table below provide information about hypothetical account values and hypothetical expenses based on the Fund’s actual expense ratio and an assumed rate of return of 5% per year before expenses, which is not the Fund’s actual return. The hypothetical account values and expenses may not be used to estimate the actual ending account balances or expenses you paid for the six-month period shown. You may use this information to compare the ongoing costs of investing in the Fund with the ongoing costs of investing in other mutual funds. To do so, compare this 5% hypothetical example with the 5% hypothetical examples that appear in the shareholder reports of the other mutual funds.
Please note that the expenses shown in the table are meant to highlight your ongoing costs only and do not reflect any transactional costs, such as exchange fees or sales charges (loads). Therefore, the fourth and fifth data columns of the table are useful in comparing ongoing costs only and will not help you determine the relative total costs of owning different funds. In addition, if these transactional costs were included, your costs would have been higher.
| Share Class | Beginning
Account
Value
11/1/20 | Ending Account
Value (Based
on Actual
Returns and
Expenses)
4/30/21 | Expenses
Paid
During
Period1 | Ending Account
Value (Based
on Hypothetical
5% Annualized
Return and
Actual Expenses)
4/30/21 | Expenses
Paid
During
Period1 | Net Expense
Ratio
During
Period2 |
| Class A Shares | $1,000.00 | $1,244.70 | $2.00 | $1,023.01 | $1.81 | 0.36% |
| Investor Class Shares | $1,000.00 | $1,243.80 | $3.06 | $1,022.07 | $2.76 | 0.55% |
| Class B Shares | $1,000.00 | $1,238.70 | $7.22 | $1,018.35 | $6.51 | 1.30% |
| Class C Shares | $1,000.00 | $1,238.70 | $7.22 | $1,018.35 | $6.51 | 1.30% |
| Class I Shares | $1,000.00 | $1,246.30 | $0.61 | $1,024.25 | $0.55 | 0.11% |
| Class R1 Shares | $1,000.00 | $1,245.50 | $1.17 | $1,023.75 | $1.05 | 0.21% |
| Class R2 Shares | $1,000.00 | $1,243.60 | $2.56 | $1,022.51 | $2.31 | 0.46% |
| Class R3 Shares | $1,000.00 | $1,242.20 | $3.95 | $1,021.27 | $3.56 | 0.71% |
| SIMPLE Class Shares | $1,000.00 | $1,241.50 | $4.45 | $1,020.83 | $4.01 | 0.80% |
| 1. | Expenses are equal to the Fund’s annualized expense ratio of each class multiplied by the average account value over the period, divided by 365 and multiplied by 181 (to reflect the six-month period). The table above represents the actual expenses incurred during the six-month period. In addition to the fees and expenses which the Fund bears directly, it also indirectly bears a pro rata share of the fees and expenses of the underlying funds in which it invests. Such indirect expenses are not included in the above-reported expense figures. |
| 2. | Expenses are equal to the Fund's annualized expense ratio to reflect the six-month period. |
Asset Diversification as of April 30, 2021 (Unaudited)
| Equity Funds | 76.6% |
| Fixed Income Funds | 15.7 |
| Short-Term Investments | 7.6 |
| Other Assets, Less Liabilities | 0.1 |
See Portfolio of Investments beginning on page 46 for specific holdings within these categories. The Fund’s holdings are subject to change.
| 42 | MainStay Growth Allocation Fund |
Portfolio Management Discussion and Analysis (Unaudited)
Questions answered by portfolio managers Jae S. Yoon, CFA, Jonathan Swaney, Poul Kristensen, CFA, and Amit Soni, CFA, of New York Life Investment Management LLC, the Fund’s Manager.
How did MainStay Growth Allocation Fund perform relative to its benchmarks and peer group during the six months ended April 30, 2021?
For the six months ended April 30, 2021, Class I shares of MainStay Growth Allocation Fund returned 24.63%, underperforming the 28.85% return of the Fund’s primary benchmark, the S&P 500® Index, and the 28.84% return of the MSCI EAFE® Index (Net), which is the Fund’s secondary benchmark. Over the same period, Class I shares of the Fund outperformed the −1.52% return of the Bloomberg Barclays U.S. Aggregate Bond Index and the 22.30% return of the Growth Allocation Composite Index, both of which are additional benchmarks of the Fund. For the six months ended April 30, 2021, Class I shares of the Fund underperformed the 24.69% return of the Morningstar Allocation—70% to 85% Equity Category Average.1
What factors affected the Fund’s relative performance during the reporting period?
The Fund is a “fund of funds,” meaning that it seeks to achieve its investment objective by investing primarily in mutual funds and exchange-traded funds (“ETFs”) managed by New York Life Investments or its affiliates (the “Underlying Funds”). The Underlying Funds may invest in U.S. equities, international equities and fixed-income instruments, making comparisons to any single index generally less suitable than a weighted combination of indices, which is a more useful yardstick by which to measure performance. The most influential factor affecting returns for the Fund during the reporting period (versus the performance of a weighted combination of indices) is the net performance of the Underlying Funds themselves, relative to their respective benchmarks.
Fund management internally maintains a blend of indices that are taken into consideration when managing the Fund. During the reporting period, the Fund’s performance trailed the performance of the internally maintained blend of indices primarily due to the materially negative impact of asset class policy. Most significantly, the Fund held underweight exposure to small-cap stocks in the Fall of 2020 and into 2021 at a time when these higher beta2 securities rallied powerfully, far surpassing the return on larger company stocks. Management of the Fund’s stock/bond blend detracted from relative performance as well. For reasons discussed below, the Fund held moderately underweight exposure to equities in the early months of the reporting period, and thereby participated less fully in the ongoing bull market than the internally maintained blend of indices. Similarly, within the fixed-income portion of the Fund, relative performance suffered as
holdings were tilted away from higher-risk, lower-quality instruments.
Some aspects of the Fund’s asset class policy—such as a bias toward value stocks—made positive contributions to relative returns, partially mitigating the negative affects cited above. (Contributions take weightings and total returns into account.) More significant was a strongly positive contribution from the Underlying Funds themselves. After years in which passive strategies generally held the upper hand, during the reporting period active management fared better. As a result, excess returns at the Underlying Fund level made a materially positive contribution to the Fund’s relative performance.
During the reporting period, how was the Fund’s performance materially affected by investments in derivatives?
Total return swaps were used to express most of the Fund’s asset class policy views. Therefore, the swaps can be seen as detracting from the Fund’s relative performance over the course of the reporting period.
How did you allocate the Fund’s assets during the reporting period and why?
The Fund entered the reporting period maintaining a somewhat defensive posture that favored fixed-income instruments over stocks, large companies over small companies, and high-quality debt over debt issued by less credit-worthy borrowers. This positioning arose out of our suspicion, based on the facts then available, that market pricing pulled ahead of the operating conditions that prevailed at the time and, in our opinion, were likely to persist into the foreseeable future. Equity indices were trading at or near all-time highs and yields of lesser-quality credits stood near all-time lows, despite the fact that aggregate output and corporate profits were well below prior peaks. Many millions of workers were unemployed, prospects for additional policy support were unclear and the pandemic was anything but contained at that time. In our view, risks appeared skewed to the downside.
Much changed with the announcements of highly successful clinical trials for both the Moderna and Pfizer vaccines, followed shortly thereafter by the granting of emergency use authorizations and rapid distribution to the most vulnerable members of the population. These developments brought the end of pandemic restrictions into view, ushering in a wave of activity and lifting market prices that much higher.
With the end of restrictions on the horizon, we adjusted the Fund to favor pro-cyclical sectors and businesses in industries likely to
| 1. | See page 39 for other share class returns, which may be higher or lower than Class I share returns. See page 40 for more information on benchmark and peer group returns. |
| 2. | Beta is a measure of volatility in relation to the market as a whole. A beta higher than 1 indicates that a security or portfolio will tend to exhibit higher volatility than the market. A beta lower than 1 indicates that a security or portfolio will tend to exhibit lower volatility than the market. |
benefit most from the reopening of the U.S. economy. We also increased the Fund’s exposure to non-U.S. equities we believed were positioned to experience a recovery similar to that seen in the U.S. but on a lagged basis due to a slower vaccine rollout. Similarly, we slid down the capitalization spectrum, committing a bigger allocation of the Fund’s assets to small- and mid-cap companies that we viewed as likely to fare well in this environment. We also reduced interest rate sensitivity in the bond portion of the Fund, anticipating that mounting inflationary pressures would result in higher bond yields. These adjustments provided a modest tailwind to the Fund’s performance in the first four months of 2021.
How did the Fund’s allocations change over the course of the reporting period?
The restructuring noted above was largely implemented through the use of derivatives, specifically total return swaps. The Fund’s exposure to mid-to-small-cap stocks, non-U.S. markets and a basket of companies specifically leveraged to the reopening of the economy was increased in this way, while exposure was dialed down for large-cap U.S. stocks and a basket of companies identified as having been beneficiaries of lockdown conditions.
We also made a few adjustments at the Underlying Fund level, the most pronounced being a reduction in the Fund’s holdings of MainStay MacKay Total Return Bond Fund with the proceeds redirected to a mix of cash, MainStay Floating Rate Fund, MainStay Short Term Bond Fund and MainStay MacKay Short Duration High Yield Fund. These changes were intended to lessen the Fund’s interest rate sensitivity at a time when yields may rise in response to mounting inflationary concerns.
Other notable changes arose from Fund restructurings as Wellington Management Company was named the new subadvisor on several MainStay Funds that concurrently underwent name changes. A few Funds also were subject to mergers. By way of example, MainStay MacKay Common Stock Fund was renamed MainStay WMC Enduring Capital Fund when Wellington took the helm in early March 2021, and MainStay Epoch U.S. All Cap Fund was merged into MainStay WMC Enduring Capital Fund a short while later.
During the reporting period, which Underlying Equity Funds had the highest total returns and which had the lowest total returns?
The Underlying Equity Funds in which the Fund was invested for the entire reporting period that generated the highest total returns included IQ Chaikin U.S. Small Cap ETF, MainStay WMC Small Companies Fund (known as MainStay MacKay Small Cap Core Fund prior to March 2021), and IQ 500 International ETF. Underlying Equity Funds with the lowest total returns included MainStay Winslow Large Cap Growth Fund, MainStay Epoch
International Choice Fund, and MainStay MacKay International Equity Fund.
Which Underlying Equity Funds were the strongest positive contributors to the Fund’s performance and which Underlying Equity Funds were particularly weak?
The positions that made the largest positive contributions to performance during the reporting period were MainStay MacKay S&P 500 Index Fund, IQ Chaikin U.S. Small Cap ETF and MainStay WMC Small Companies Fund (formerly MainStay MacKay Small Cap Core Fund). While no Underlying Equity Funds produced negative absolute returns, those delivering the weakest returns included MainStay Epoch Capital Growth Fund, MainStay MacKay International Equity Fund and IQ 50% Hedged FTSE International ETF.
During the reporting period, which Underlying Fixed-Income Funds had the highest total returns and which Underlying Fixed-Income Funds had the lowest total returns?
The Underlying Fixed-Income Funds held for the entire reporting period that posted the largest total returns were MainStay MacKay Short Duration High Yield Fund and MainStay Floating Rate Fund. Underlying Fixed-Income Funds with the lowest returns were MainStay MacKay Total Return Bond Fund and IQ High Yield Low Volatility ETF.
Which Underlying Fixed-Income Funds were the strongest positive contributors to the Fund’s performance and which Underlying Fixed-Income Funds were particularly weak?
The Underlying Fixed-Income Funds making the strongest positive contributions to the Fund’s performance included MainStay MacKay Short Duration High Yield Fund and MainStay MacKay Total Return Bond Fund. While no Underlying Fixed-Income Funds detracted from absolute performance in any meaningful way, there was effectively no positive contribution to return from either the Fund’s cash holdings or its position in MainStay Short Term Bond Fund. The Fund’s stake in IQ High Yield Low Volatility ETF added very little as well.
How was the Fund positioned at the end of the reporting period?
As of April 30, 2021, in our view, we see two countervailing forces at work within capital markets. The first is the exceptional strength of the domestic economy. The gradual reopening of full business capacity, augmented by massive fiscal and monetary policy support, is yielding a rate of expansion not seen in generations. With this as the backdrop, corporate profit growth has been nothing less than stellar, with high expectations for continued rapid improvement in earnings.
| 44 | MainStay Growth Allocation Fund |
At the same time, we believe there is the need to recognize that price gains in capital markets have significantly outpaced earnings gains, which translates into very high valuations, which in turn implies that investors are paying richly for future earnings. Should inflation rise materially, we believe the present value of those future earnings would be diminished, potentially undermining high share price levels and sowing the seeds for a market correction. Paradoxically, it is the same strong economic growth driving profits higher that may spawn faster rates of inflation and bring the rally to an end.
We believe that upside and downside risks are approximately balanced. Therefore, we lean neither toward nor away from risk assets broadly, meaning that the Fund’s stock/bond blend is being held close to that of the benchmark, as is the Fund’s overall exposure to lower credit quality instruments. We see a different story within asset classes and believe there will be clear winners and losers from increasing consumer mobility and the full reopening of businesses. Two themes evident in the Fund’s holdings revolve around that dynamic. First, we favor more pro-cyclical elements of the economy by tilting toward value stocks and non-U.S. markets. Second, we have taken steps to guard the Fund against a rapid acceleration of inflation. Duration3 has been trimmed (i.e., the Fund has a little less exposure to the long end of the yield curve4 ) and exposure to gold miners has been maintained as a possible hedge.
| 3. | Duration is a measure of the price sensitivity of a fixed-income investment to changes in interest rates. Duration is expressed as a number of years and is considered a more accurate sensitivity gauge than average maturity. |
| 4. | The yield curve is a line that plots the yields of various securities of similar quality—typically U.S. Treasury issues—across a range of maturities. The U.S. Treasury yield curve serves as a benchmark for other debt and is used in economic forecasting. |
The opinions expressed are those of the portfolio managers as of the date of this report and are subject to change. There is no guarantee that any forecasts will come to pass. This material does not constitute investment advice and is not intended as an endorsement of any specific investment.
Portfolio of Investments April 30, 2021† (Unaudited)
| | Shares | Value |
| Affiliated Investment Companies 92.3% |
| Equity Funds 76.6% |
| IQ 50 Percent Hedged FTSE International ETF (a) | 744,874 | $ 18,122,785 |
| IQ 500 International ETF (a) | 955,935 | 31,035,481 |
| IQ Candriam ESG International Equity ETF (a) | 882,449 | 25,772,276 |
| IQ Candriam ESG U.S. Equity ETF (a) | 1,545,664 | 54,937,999 |
| IQ Chaikin U.S. Large Cap ETF (a) | 1,431,555 | 46,519,668 |
| IQ Chaikin U.S. Small Cap ETF (a) | 1,207,556 | 42,309,743 |
| Mainstay Candriam Emerging Markets Equity Fund Class R6 (a) | 2,362,482 | 31,846,488 |
| MainStay Epoch Capital Growth Fund Class I | 205,105 | 3,187,851 |
| MainStay Epoch International Choice Fund Class I (a) | 601,830 | 24,954,096 |
| MainStay Epoch U.S. Equity Yield Fund Class R6 | 2,057,231 | 39,083,898 |
| MainStay MacKay International Equity Fund Class R6 (a) | 932,644 | 20,632,698 |
| MainStay MacKay S&P 500 Index Fund Class I (a) | 1,400,453 | 77,085,674 |
| MainStay Winslow Large Cap Growth Fund Class R6 | 4,665,947 | 68,044,898 |
| Mainstay WMC Enduring Capital Fund Class R6 (a) | 1,734,299 | 57,327,759 |
| Mainstay WMC Growth Fund Class R6 | 541,429 | 28,589,295 |
| Mainstay WMC International Research Equity Fund Class I (a) | 2,908,151 | 23,210,241 |
| Mainstay WMC Small Companies Fund Class I (a) | 1,304,216 | 44,288,447 |
| Mainstay WMC Value Fund Class R6 | 869,856 | 47,062,671 |
Total Equity Funds
(Cost $484,909,489) | | 684,011,968 |
| | Shares | | Value |
| |
| Fixed Income Funds 15.7% |
| IQ S&P High Yield Low Volatility Bond ETF (a) | 348,632 | | $ 8,722,772 |
| MainStay Floating Rate Fund Class R6 | 1,916,584 | | 17,492,467 |
| MainStay MacKay Short Duration High Yield Fund Class I | 4,898,359 | | 48,287,040 |
| MainStay MacKay Total Return Bond Fund Class R6 | 5,510,662 | | 61,396,487 |
| MainStay Short Term Bond Fund Class I | 443,263 | | 4,371,196 |
Total Fixed Income Funds
(Cost $138,903,389) | | | 140,269,962 |
Total Affiliated Investment Companies
(Cost $623,812,878) | | | 824,281,930 |
| Short-Term Investment 7.6% |
| Affiliated Investment Company 7.6% |
| MainStay U.S. Government Liquidity Fund, 0.01% (a)(b) | 67,543,300 | | 67,543,300 |
Total Short-Term Investment
(Cost $67,543,300) | 7.6% | | 67,543,300 |
Total Investments
(Cost $691,356,178) | 99.9% | | 891,825,230 |
| Other Assets, Less Liabilities | 0.1 | | 1,337,177 |
| Net Assets | 100.0% | | $ 893,162,407 |
| † | Percentages indicated are based on Fund net assets. |
| (a) | As of April 30, 2021, the Fund’s ownership exceeds 5% of the outstanding shares of the Underlying Fund’s share class |
| (b) | Current yield as of April 30, 2021. |
Swap Contracts
Open OTC total return equity swap contracts as of April 30, 2021 were as follows1:
Swap
Counterparty | Reference Obligation | Floating Rate2 | Termination
Date(s) | Payment
Frequency
Paid/
Received | Notional
Amount
Long/
(Short)
(000)3 | Unrealized
Appreciation/
(Depreciation)4 |
| Citibank NA | Citi 2nd Wave Virus Basket | 1 month LIBOR BBA plus 0.35% | 12/2/21 | Monthly | 6,471 | $ — |
| Citibank NA | Citi Stay at Home Basket | 1 month LIBOR BBA minus 0.30% | 12/2/21 | Monthly | (6,762) | — |
| Citibank NA | iShares MSCI EAFE ETF | 1 month LIBOR BBA plus 0.40% | 12/2/21 | Monthly | 22,160 | — |
| Citibank NA | iShares MSCI Emerging Markets ETF | 1 month LIBOR BBA plus 0.40% | 12/2/21 | Monthly | 8,742 | — |
| Citibank NA | Portfolio Swap S&P 500 TRI Index | 1 month LIBOR BBA plus 0.10% | 12/2/21 | Monthly | (11,342) | — |
| Citibank NA | Russell 1000 Growth Total Return Index | 1 month LIBOR BBA plus 0.03% | 12/2/21 | Monthly | (19,107) | — |
| Citibank NA | Russell 1000 Value Total Return Index | 1 month LIBOR BBA plus 0.30% | 12/2/21 | Monthly | 17,228 | — |
| Citibank NA | Russell 2000 Total Return Index | 1 month LIBOR BBA minus 0.06% | 12/2/21 | Monthly | (20,476) | — |
The notes to the financial statements are an integral part of, and should be read in conjunction with, the financial statements.
| 46 | MainStay Growth Allocation Fund |
Swap
Counterparty | Reference Obligation | Floating Rate2 | Termination
Date(s) | Payment
Frequency
Paid/
Received | Notional
Amount
Long/
(Short)
(000)3 | Unrealized
Appreciation/
(Depreciation)4 |
| Citibank NA | Russell Midcap Total Return Index | 1 month LIBOR BBA plus 0.31% | 12/2/21 | Monthly | 36,144 | $ — |
| Citibank NA | VanEck Vectors Gold Miners ETF | 1 month LIBOR BBA plus 0.50% | 12/2/21 | Monthly | 13,382 | — |
| | | | | | | $ — |
| 1. | As of April 30, 2021, cash in the amount $2,079,927 was pledged from brokers for OTC swap contracts. |
| 2. | Fund pays the floating rate and receives the total return of the reference entity. |
| 3. | Notional amounts reflected as a positive value indicate a long position held by the Fund or Index and a negative value indicates a short position. |
| 4. | Reflects the value at reset date as of April 30, 2021. |
| Abbreviation(s): |
| BBA—British Bankers’ Association |
| EAFE—Europe, Australasia and Far East |
| ETF—Exchange-Traded Fund |
| FTSE—Financial Times Stock Exchange |
| LIBOR—London Interbank Offered Rate |
| MSCI—Morgan Stanley Capital International |
The following is a reconciliation of investments in which significant unobservable inputs (Level 3) were used in determining value:
| Description | Quoted
Prices in
Active
Markets for
Identical
Assets
(Level 1) | | Significant
Other
Observable
Inputs
(Level 2) | | Significant
Unobservable
Inputs
(Level 3) | | Total |
| Asset Valuation Inputs | | | | | | | |
| Investments in Securities (a) | | | | | | | |
| Affiliated Investment Companies | | | | | | | |
| Equity Funds | $ 684,011,968 | | $ — | | $ — | | $ 684,011,968 |
| Fixed Income Funds | 140,269,962 | | — | | — | | 140,269,962 |
| Total Affiliated Investment Companies | 824,281,930 | | — | | — | | 824,281,930 |
| Short-Term Investment | | | | | | | |
| Affiliated Investment Company | 67,543,300 | | — | | — | | 67,543,300 |
| Total Investments in Securities | $ 891,825,230 | | $ — | | $ — | | $ 891,825,230 |
| (a) | For a complete listing of investments, see the Portfolio of Investments. |
The notes to the financial statements are an integral part of, and should be read in conjunction with, the financial statements.
47
Statement of Assets and Liabilities as of April 30, 2021 (Unaudited)
| Assets |
Investment in affiliated investment companies, at value
(identified cost $691,356,178) | $891,825,230 |
| Cash collateral on deposit at broker for swap contracts | 2,079,927 |
| Receivables: | |
| Fund shares sold | 504,533 |
| Dividends and interest | 36,128 |
| Manager (See Note 3) | 17,955 |
| Other assets | 83,532 |
| Total assets | 894,547,305 |
| Liabilities |
| Payables: | |
| Fund shares redeemed | 452,650 |
| Dividends and interest on OTC swaps contracts | 323,718 |
| Transfer agent (See Note 3) | 221,140 |
| NYLIFE Distributors (See Note 3) | 220,888 |
| Shareholder communication | 78,736 |
| Professional fees | 45,438 |
| Investment securities purchased | 35,536 |
| Custodian | 5,441 |
| Accrued expenses | 1,351 |
| Total liabilities | 1,384,898 |
| Net assets | $893,162,407 |
| Composition of Net Assets |
| Shares of beneficial interest outstanding (par value of $.001 per share) unlimited number of shares authorized | $ 52,758 |
| Additional paid-in-capital | 638,856,029 |
| | 638,908,787 |
| Total distributable earnings (loss) | 254,253,620 |
| Net assets | $893,162,407 |
| Class A | |
| Net assets applicable to outstanding shares | $683,301,448 |
| Shares of beneficial interest outstanding | 40,340,906 |
| Net asset value per share outstanding | $ 16.94 |
| Maximum sales charge (3.00% of offering price) | 0.52 |
| Maximum offering price per share outstanding | $ 17.46 |
| Investor Class | |
| Net assets applicable to outstanding shares | $131,372,571 |
| Shares of beneficial interest outstanding | 7,742,825 |
| Net asset value per share outstanding | $ 16.97 |
| Maximum sales charge (2.50% of offering price) | 0.44 |
| Maximum offering price per share outstanding | $ 17.41 |
| Class B | |
| Net assets applicable to outstanding shares | $ 34,557,150 |
| Shares of beneficial interest outstanding | 2,066,108 |
| Net asset value and offering price per share outstanding | $ 16.73 |
| Class C | |
| Net assets applicable to outstanding shares | $ 30,872,166 |
| Shares of beneficial interest outstanding | 1,845,425 |
| Net asset value and offering price per share outstanding | $ 16.73 |
| Class I | |
| Net assets applicable to outstanding shares | $ 10,687,326 |
| Shares of beneficial interest outstanding | 622,865 |
| Net asset value and offering price per share outstanding | $ 17.16 |
| Class R1 | |
| Net assets applicable to outstanding shares | $ 45,747 |
| Shares of beneficial interest outstanding | 2,667 |
| Net asset value and offering price per share outstanding | $ 17.15 |
| Class R2 | |
| Net assets applicable to outstanding shares | $ 100,261 |
| Shares of beneficial interest outstanding | 5,921 |
| Net asset value and offering price per share outstanding | $ 16.93 |
| Class R3 | |
| Net assets applicable to outstanding shares | $ 1,252,077 |
| Shares of beneficial interest outstanding | 74,269 |
| Net asset value and offering price per share outstanding | $ 16.86 |
| SIMPLE Class | |
| Net assets applicable to outstanding shares | $ 973,661 |
| Shares of beneficial interest outstanding | 57,383 |
| Net asset value and offering price per share outstanding | $ 16.97 |
The notes to the financial statements are an integral part of, and should be read in conjunction with, the financial statements.
| 48 | MainStay Growth Allocation Fund |
Statement of Operations for the six months ended April 30, 2021 (Unaudited)
| Investment Income (Loss) |
| Income | |
| Dividend distributions from affiliated investment companies | $ 6,698,479 |
| Interest | 2,046 |
| Total income | 6,700,525 |
| Expenses | |
| Distribution/Service—Class A (See Note 3) | 783,414 |
| Distribution/Service—Investor Class (See Note 3) | 165,898 |
| Distribution/Service—Class B (See Note 3) | 173,212 |
| Distribution/Service—Class C (See Note 3) | 168,217 |
| Distribution/Service—Class R2 (See Note 3) | 126 |
| Distribution/Service—Class R3 (See Note 3) | 3,193 |
| Distribution/Service—SIMPLE Class (See Note 3) | 1,259 |
| Transfer agent (See Note 3) | 548,289 |
| Registration | 63,770 |
| Shareholder communication | 61,057 |
| Professional fees | 40,396 |
| Custodian | 23,968 |
| Trustees | 8,480 |
| Insurance | 3,609 |
| Shareholder service (See Note 3) | 709 |
| Miscellaneous | 11,474 |
| Total expenses before waiver/reimbursement | 2,057,071 |
| Expense waiver/reimbursement from Manager (See Note 3) | (113,417) |
| Net expenses | 1,943,654 |
| Net investment income (loss) | 4,756,871 |
| Realized and Unrealized Gain (Loss) |
| Net realized gain (loss) on: | |
| Affiliated investment company transactions | 29,471,570 |
| Realized capital gain distributions from affiliated investment companies | 32,668,496 |
| Swap transactions | 667,238 |
| Net realized gain (loss) | 62,807,304 |
Net change in unrealized appreciation (depreciation) on:
Affiliated investments companies | 111,382,106 |
| Net realized and unrealized gain (loss) | 174,189,410 |
| Net increase (decrease) in net assets resulting from operations | $178,946,281 |
The notes to the financial statements are an integral part of, and should be read in conjunction with, the financial statements.
49
Statements of Changes in Net Assets
for the six months ended April 30, 2021 (Unaudited) and the year ended October 31, 2020
| | 2021 | 2020 |
| Increase (Decrease) in Net Assets |
| Operations: | | |
| Net investment income (loss) | $ 4,756,871 | $ 11,960,559 |
| Net realized gain (loss) | 62,807,304 | 36,289,955 |
| Net change in unrealized appreciation (depreciation) | 111,382,106 | (20,431,629) |
| Net increase (decrease) in net assets resulting from operations | 178,946,281 | 27,818,885 |
| Distributions to shareholders: | | |
| Class A | (31,494,561) | (24,258,592) |
| Investor Class | (6,211,779) | (5,544,925) |
| Class B | (1,465,424) | (1,425,921) |
| Class C | (1,469,549) | (1,220,566) |
| Class I | (489,405) | (485,415) |
| Class R1 | (1,920) | (1,161) |
| Class R2 | (4,993) | (4,340) |
| Class R3 | (56,274) | (56,217) |
| SIMPLE Class | (16,432) | — |
| Total distributions to shareholders | (41,210,337) | (32,997,137) |
| Capital share transactions: | | |
| Net proceeds from sales of shares | 39,977,202 | 73,731,809 |
| Net asset value of shares issued to shareholder in reinvestment of distributions | 41,061,402 | 32,868,088 |
| Cost of shares redeemed | (68,815,427) | (136,672,934) |
| Increase (decrease) in net assets derived from capital share transactions | 12,223,177 | (30,073,037) |
| Net increase (decrease) in net assets | 149,959,121 | (35,251,289) |
| Net Assets |
| Beginning of period | 743,203,286 | 778,454,575 |
| End of period | $893,162,407 | $ 743,203,286 |
The notes to the financial statements are an integral part of, and should be read in conjunction with, the financial statements.
| 50 | MainStay Growth Allocation Fund |
Financial Highlights selected per share data and ratios
| | Six months ended
April 30,
2021* | | Year Ended October 31, |
| Class A | 2020 | | 2019 | | 2018 | | 2017 | | 2016 |
| Net asset value at beginning of period | $ 14.33 | | $ 14.40 | | $ 14.76 | | $ 15.96 | | $ 13.90 | | $ 14.65 |
| Net investment income (loss) (a) | 0.10 | | 0.24 | | 0.22 | | 0.16 | | 0.17 | | 0.18 |
| Net realized and unrealized gain (loss) on investments | 3.33 | | 0.32 | | 0.77 | | (0.55) | | 2.41 | | (0.18) |
| Total from investment operations | 3.43 | | 0.56 | | 0.99 | | (0.39) | | 2.58 | | — |
| Less distributions: | | | | | | | | | | | |
| From net investment income | (0.17) | | (0.26) | | (0.28) | | (0.36) | | (0.20) | | (0.20) |
| From net realized gain on investments | (0.65) | | (0.37) | | (1.07) | | (0.45) | | (0.32) | | (0.55) |
| Total distributions | (0.82) | | (0.63) | | (1.35) | | (0.81) | | (0.52) | | (0.75) |
| Net asset value at end of period | $ 16.94 | | $ 14.33 | | $ 14.40 | | $ 14.76 | | $ 15.96 | | $ 13.90 |
| Total investment return (b) | 24.47% | | 3.89% | | 8.17% | | (2.75)% | | 19.05% | | 0.15% |
| Ratios (to average net assets)/Supplemental Data: | | | | | | | | | | | |
| Net investment income (loss) | 1.23%†† | | 1.69% | | 1.55% | | 1.02% | | 1.16% | | 1.29% |
| Net expenses (c) | 0.36%†† | | 0.37% | | 0.37% | | 0.35% | | 0.36% | | 0.36% |
| Portfolio turnover rate | 15% | | 47% | | 42% | | 47% | | 32% | | 32% |
| Net assets at end of period (in 000’s) | $ 683,301 | | $ 542,938 | | $ 545,586 | | $ 484,182 | | $ 499,998 | | $ 296,060 |
| * | Unaudited. |
| †† | Annualized. |
| (a) | Per share data based on average shares outstanding during the period. |
| (b) | Total investment return is calculated exclusive of sales charges and assumes the reinvestment of dividends and distributions. For periods of less than one year, total return is not annualized. |
| (c) | In addition to the fees and expenses which the Fund bears directly, it also indirectly bears a pro-rata share of the fees and expenses of the underlying funds in which it invests. Such indirect expenses are not included in the above expense ratios. |
| | Six months ended
April 30,
2021* | | Year Ended October 31, |
| Investor Class | 2020 | | 2019 | | 2018 | | 2017 | | 2016 |
| Net asset value at beginning of period | $ 14.33 | | $ 14.40 | | $ 14.76 | | $ 15.93 | | $ 13.88 | | $ 14.63 |
| Net investment income (loss) (a) | 0.08 | | 0.21 | | 0.18 | | 0.14 | | 0.14 | | 0.15 |
| Net realized and unrealized gain (loss) on investments | 3.34 | | 0.32 | | 0.79 | | (0.55) | | 2.40 | | (0.17) |
| Total from investment operations | 3.42 | | 0.53 | | 0.97 | | (0.41) | | 2.54 | | (0.02) |
| Less distributions: | | | | | | | | | | | |
| From net investment income | (0.13) | | (0.23) | | (0.26) | | (0.31) | | (0.17) | | (0.18) |
| From net realized gain on investments | (0.65) | | (0.37) | | (1.07) | | (0.45) | | (0.32) | | (0.55) |
| Total distributions | (0.78) | | (0.60) | | (1.33) | | (0.76) | | (0.49) | | (0.73) |
| Net asset value at end of period | $ 16.97 | | $ 14.33 | | $ 14.40 | | $ 14.76 | | $ 15.93 | | $ 13.88 |
| Total investment return (b) | 24.38% | | 3.70% | | 7.94% | | (2.86)% | | 18.80% | | (0.04)% |
| Ratios (to average net assets)/Supplemental Data: | | | | | | | | | | | |
| Net investment income (loss) | 1.06% | | 1.54% | | 1.32% | | 0.87% | | 0.96% | | 1.09% |
| Net expenses (c) | 0.55%†† | | 0.55% | | 0.55% | | 0.52% | | 0.55% | | 0.55% |
| Expenses (before waiver/reimbursement) (c) | 0.66%†† | | 0.67% | | 0.68% | | 0.61% | | 0.55% | | 0.55% |
| Portfolio turnover rate | 15% | | 47% | | 42% | | 47% | | 32% | | 32% |
| Net assets at end of period (in 000’s) | $ 131,373 | | $ 126,514 | | $ 139,892 | | $ 110,200 | | $ 116,058 | | $ 221,041 |
| * | Unaudited. |
| †† | Annualized. |
| (a) | Per share data based on average shares outstanding during the period. |
| (b) | Total investment return is calculated exclusive of sales charges and assumes the reinvestment of dividends and distributions. For periods of less than one year, total return is not annualized. |
| (c) | In addition to the fees and expenses which the Fund bears directly, it also indirectly bears a pro-rata share of the fees and expenses of the underlying funds in which it invests. Such indirect expenses are not included in the above expense ratios. |
The notes to the financial statements are an integral part of, and should be read in conjunction with, the financial statements.
51
Financial Highlights selected per share data and ratios
| | Six months ended
April 30,
2021* | | Year Ended October 31, |
| Class B | 2020 | | 2019 | | 2018 | | 2017 | | 2016 |
| Net asset value at beginning of period | $ 14.10 | | $ 14.16 | | $ 14.50 | | $ 15.66 | | $ 13.65 | | $ 14.39 |
| Net investment income (loss) (a) | 0.03 | | 0.12 | | 0.10 | | 0.03 | | 0.04 | | 0.05 |
| Net realized and unrealized gain (loss) on investments | 3.27 | | 0.30 | | 0.76 | | (0.55) | | 2.36 | | (0.18) |
| Total from investment operations | 3.30 | | 0.42 | | 0.86 | | (0.52) | | 2.40 | | (0.13) |
| Less distributions: | | | | | | | | | | | |
| From net investment income | (0.02) | | (0.11) | | (0.13) | | (0.19) | | (0.07) | | (0.06) |
| From net realized gain on investments | (0.65) | | (0.37) | | (1.07) | | (0.45) | | (0.32) | | (0.55) |
| Total distributions | (0.67) | | (0.48) | | (1.20) | | (0.64) | | (0.39) | | (0.61) |
| Net asset value at end of period | $ 16.73 | | $ 14.10 | | $ 14.16 | | $ 14.50 | | $ 15.66 | | $ 13.65 |
| Total investment return (b) | 23.87% | | 2.97% | | 7.14% | | (3.60)% | | 17.91% | | (0.81)% |
| Ratios (to average net assets)/Supplemental Data: | | | | | | | | | | | |
| Net investment income (loss) | 0.40%†† | | 0.87% | | 0.73% | | 0.18% | | 0.31% | | 0.39% |
| Net expenses (c) | 1.30%†† | | 1.30% | | 1.30% | | 1.27% | | 1.30% | | 1.30% |
| Expenses (before waiver/reimbursement) (c) | 1.41%†† | | 1.42% | | 1.42% | | 1.36% | | 1.31% | | 1.30% |
| Portfolio turnover rate | 15% | | 47% | | 42% | | 47% | | 32% | | 32% |
| Net assets at end of period (in 000’s) | $ 34,557 | | $ 32,739 | | $ 43,800 | | $ 55,493 | | $ 75,863 | | $ 80,344 |
| * | Unaudited. |
| †† | Annualized. |
| (a) | Per share data based on average shares outstanding during the period. |
| (b) | Total investment return is calculated exclusive of sales charges and assumes the reinvestment of dividends and distributions. For periods of less than one year, total return is not annualized. |
| (c) | In addition to the fees and expenses which the Fund bears directly, it also indirectly bears a pro-rata share of the fees and expenses of the underlying funds in which it invests. Such indirect expenses are not included in the above expense ratios. |
| | Six months ended
April 30,
2021* | | Year Ended October 31, |
| Class C | 2020 | | 2019 | | 2018 | | 2017 | | 2016 |
| Net asset value at beginning of period | $ 14.10 | | $ 14.16 | | $ 14.50 | | $ 15.66 | | $ 13.65 | | $ 14.38 |
| Net investment income (loss) (a) | 0.03 | | 0.11 | | 0.10 | | 0.02 | | 0.04 | | 0.05 |
| Net realized and unrealized gain (loss) on investments | 3.27 | | 0.31 | | 0.76 | | (0.54) | | 2.36 | | (0.17) |
| Total from investment operations | 3.30 | | 0.42 | | 0.86 | | (0.52) | | 2.40 | | (0.12) |
| Less distributions: | | | | | | | | | | | |
| From net investment income | (0.02) | | (0.11) | | (0.13) | | (0.19) | | (0.07) | | (0.06) |
| From net realized gain on investments | (0.65) | | (0.37) | | (1.07) | | (0.45) | | (0.32) | | (0.55) |
| Total distributions | (0.67) | | (0.48) | | (1.20) | | (0.64) | | (0.39) | | (0.61) |
| Net asset value at end of period | $ 16.73 | | $ 14.10 | | $ 14.16 | | $ 14.50 | | $ 15.66 | | $ 13.65 |
| Total investment return (b) | 23.87% | | 2.97% | | 7.14% | | (3.60)% | | 17.91% | | (0.81)% |
| Ratios (to average net assets)/Supplemental Data: | | | | | | | | | | | |
| Net investment income (loss) | 0.35%†† | | 0.81% | | 0.76% | | 0.14% | | 0.25% | | 0.36% |
| Net expenses (c) | 1.30%†† | | 1.30% | | 1.30% | | 1.27% | | 1.30% | | 1.30% |
| Expenses (before waiver/reimbursement) (c) | 1.41%†† | | 1.42% | | 1.42% | | 1.36% | | 1.31% | | 1.30% |
| Portfolio turnover rate | 15% | | 47% | | 42% | | 47% | | 32% | | 32% |
| Net assets at end of period (in 000’s) | $ 30,872 | | $ 31,564 | | $ 36,721 | | $ 47,590 | | $ 55,873 | | $ 51,005 |
| * | Unaudited. |
| †† | Annualized. |
| (a) | Per share data based on average shares outstanding during the period. |
| (b) | Total investment return is calculated exclusive of sales charges and assumes the reinvestment of dividends and distributions. For periods of less than one year, total return is not annualized. |
| (c) | In addition to the fees and expenses which the Fund bears directly, it also indirectly bears a pro-rata share of the fees and expenses of the underlying funds in which it invests. Such indirect expenses are not included in the above expense ratios. |
The notes to the financial statements are an integral part of, and should be read in conjunction with, the financial statements.
| 52 | MainStay Growth Allocation Fund |
Financial Highlights selected per share data and ratios
| | Six months ended
April 30,
2021* | | Year Ended October 31, |
| Class I | 2020 | | 2019 | | 2018 | | 2017 | | 2016 |
| Net asset value at beginning of period | $ 14.52 | | $ 14.58 | | $ 14.94 | | $ 16.14 | | $ 14.05 | | $ 14.80 |
| Net investment income (loss) (a) | 0.12 | | 0.31 | | 0.25 | | 0.21 | | 0.21 | | 0.21 |
| Net realized and unrealized gain (loss) on investments | 3.37 | | 0.30 | | 0.78 | | (0.56) | | 2.43 | | (0.17) |
| Total from investment operations | 3.49 | | 0.61 | | 1.03 | | (0.35) | | 2.64 | | 0.04 |
| Less distributions: | | | | | | | | | | | |
| From net investment income | (0.20) | | (0.30) | | (0.32) | | (0.40) | | (0.23) | | (0.24) |
| From net realized gain on investments | (0.65) | | (0.37) | | (1.07) | | (0.45) | | (0.32) | | (0.55) |
| Total distributions | (0.85) | | (0.67) | | (1.39) | | (0.85) | | (0.55) | | (0.79) |
| Net asset value at end of period | $ 17.16 | | $ 14.52 | | $ 14.58 | | $ 14.94 | | $ 16.14 | | $ 14.05 |
| Total investment return (b) | 24.63% | | 4.16% | | 8.40% | | (2.48)% | | 19.35% | | 0.41% |
| Ratios (to average net assets)/Supplemental Data: | | | | | | | | | | | |
| Net investment income (loss) | 1.48%†† | | 2.18% | | 1.74% | | 1.32% | | 1.40% | | 1.54% |
| Net expenses (c) | 0.11%†† | | 0.11% | | 0.13% | | 0.10% | | 0.11% | | 0.11% |
| Portfolio turnover rate | 15% | | 47% | | 42% | | 47% | | 32% | | 32% |
| Net assets at end of period (in 000’s) | $ 10,687 | | $ 8,063 | | $ 11,037 | | $ 8,129 | | $ 8,435 | | $ 6,976 |
| * | Unaudited. |
| †† | Annualized. |
| (a) | Per share data based on average shares outstanding during the period. |
| (b) | Total investment return is calculated exclusive of sales charges and assumes the reinvestment of dividends and distributions. Class I shares are not subject to sales charges. For periods of less than one year, total return is not annualized. |
| (c) | In addition to the fees and expenses which the Fund bears directly, it also indirectly bears a pro-rata share of the fees and expenses of the underlying funds in which it invests. Such indirect expenses are not included in the above expense ratios. |
| | Six months ended
April 30,
2021* | | Year Ended October 31, | | June 14, 2019^ through
October 31,
2019 |
| Class R1 | 2020 | |
| Net asset value at beginning of period | $ 14.51 | | $ 14.58 | | $ 13.99 |
| Net investment income (loss) (a) | 0.11 | | 0.25 | | 0.05 |
| Net realized and unrealized gain (loss) on investments | 3.37 | | 0.34 | | 0.54 |
| Total from investment operations | 3.48 | | 0.59 | | 0.59 |
| Less distributions: | | | | | |
| From net investment income | (0.19) | | (0.29) | | — |
| From net realized gain on investments | (0.65) | | (0.37) | | — |
| Total distributions | (0.84) | | (0.66) | | — |
| Net asset value at end of period | $ 17.15 | | $ 14.51 | | $ 14.58 |
| Total investment return (b) | 24.55% | | 4.02% | | 4.22% |
| Ratios (to average net assets)/Supplemental Data: | | | | | |
| Net investment income (loss) | 1.35%†† | | 1.74% | | 0.95%†† |
| Net expenses (c) | 0.21%†† | | 0.21% | | 0.23%†† |
| Portfolio turnover rate | 15% | | 47% | | 42% |
| Net assets at end of period (in 000’s) | $ 46 | | $ 32 | | $ 25 |
| * | Unaudited. |
| ^ | Inception date. |
| †† | Annualized. |
| (a) | Per share data based on average shares outstanding during the period. |
| (b) | Total investment return is calculated exclusive of sales charges and assumes the reinvestment of dividends and distributions. Class R1 shares are not subject to sales charges. For periods of less than one year, total return is not annualized. |
| (c) | In addition to the fees and expenses which the Fund bears directly, it also indirectly bears a pro-rata share of the fees and expenses of the underlying funds in which it invests. Such indirect expenses are not included in the above expense ratios. |
The notes to the financial statements are an integral part of, and should be read in conjunction with, the financial statements.
53
Financial Highlights selected per share data and ratios
| | Six months ended
April 30,
2021* | | Year Ended October 31, | | June 14, 2019^ through
October 31,
2019 |
| Class R2 | 2020 | |
| Net asset value at beginning of period | $ 14.32 | | $ 14.40 | | $ 13.82 |
| Net investment income (loss) (a) | 0.09 | | 0.25 | | 0.04 |
| Net realized and unrealized gain (loss) on investments | 3.32 | | 0.29 | | 0.54 |
| Total from investment operations | 3.41 | | 0.54 | | 0.58 |
| Less distributions: | | | | | |
| From net investment income | (0.15) | | (0.25) | | — |
| From net realized gain on investments | (0.65) | | (0.37) | | — |
| Total distributions | (0.80) | | (0.62) | | — |
| Net asset value at end of period | $ 16.93 | | $ 14.32 | | $ 14.40 |
| Total investment return (b) | 24.36% | | 3.75% | | 4.20% |
| Ratios (to average net assets)/Supplemental Data: | | | | | |
| Net investment income (loss) | 1.11%†† | | 1.79% | | 0.68%†† |
| Net expenses (c) | 0.46%†† | | 0.47% | | 0.49%†† |
| Portfolio turnover rate | 15% | | 47% | | 42% |
| Net assets at end of period (in 000’s) | $ 100 | | $ 89 | | $ 130 |
| * | Unaudited. |
| ^ | Inception date. |
| †† | Annualized. |
| (a) | Per share data based on average shares outstanding during the period. |
| (b) | Total investment return is calculated exclusive of sales charges and assumes the reinvestment of dividends and distributions. Class R2 shares are not subject to sales charges. For periods of less than one year, total return is not annualized. |
| (c) | In addition to the fees and expenses which the Fund bears directly, it also indirectly bears a pro-rata share of the fees and expenses of the underlying funds in which it invests. Such indirect expenses are not included in the above expense ratios. |
| | Six months ended
April 30,
2021* | | Year Ended October 31, | | February 29, 2016^ through
October 31,
2016 |
| Class R3 | 2020 | | 2019 | | 2018 | | 2017 | |
| Net asset value at beginning of period | $ 14.24 | | $ 14.33 | | $ 14.68 | | $ 15.90 | | $ 13.87 | | $ 12.58 |
| Net investment income (loss) (a) | 0.06 | | 0.20 | | 0.12 | | 0.06 | | 0.03 | | 0.04 |
| Net realized and unrealized gain (loss) on investments | 3.32 | | 0.31 | | 0.83 | | (0.49) | | 2.48 | | 1.25 |
| Total from investment operations | 3.38 | | 0.51 | | 0.95 | | (0.43) | | 2.51 | | 1.29 |
| Less distributions: | | | | | | | | | | | |
| From net investment income | (0.11) | | (0.23) | | (0.23) | | (0.34) | | (0.16) | | — |
| From net realized gain on investments | (0.65) | | (0.37) | | (1.07) | | (0.45) | | (0.32) | | — |
| Total distributions | (0.76) | | (0.60) | | (1.30) | | (0.79) | | (0.48) | | — |
| Net asset value at end of period | $ 16.86 | | $ 14.24 | | $ 14.33 | | $ 14.68 | | $ 15.90 | | $ 13.87 |
| Total investment return (b) | 24.22% | | 3.53% | | 7.81% | | (3.04)% | | 18.58% | | 10.25% |
| Ratios (to average net assets)/Supplemental Data: | | | | | | | | | | | |
| Net investment income (loss) | 0.81%†† | | 1.43% | | 0.90% | | 0.38% | | 0.21% | | 0.39%†† |
| Net expenses (c) | 0.71%†† | | 0.72% | | 0.73% | | 0.70% | | 0.70% | | 0.71%†† |
| Portfolio turnover rate | 15% | | 47% | | 42% | | 47% | | 32% | | 32% |
| Net assets at end of period (in 000’s) | $ 1,252 | | $ 1,084 | | $ 1,262 | | $ 449 | | $ 185 | | $ 43 |
| * | Unaudited. |
| ^ | Inception date. |
| †† | Annualized. |
| (a) | Per share data based on average shares outstanding during the period. |
| (b) | Total investment return is calculated exclusive of sales charges and assumes the reinvestment of dividends and distributions. Class R3 shares are not subject to sales charges. For periods of less than one year, total return is not annualized. |
| (c) | In addition to the fees and expenses which the Fund bears directly, it also indirectly bears a pro-rata share of the fees and expenses of the underlying funds in which it invests. Such indirect expenses are not included in the above expense ratios. |
The notes to the financial statements are an integral part of, and should be read in conjunction with, the financial statements.
| 54 | MainStay Growth Allocation Fund |
Financial Highlights selected per share data and ratios
| | Six months ended
April 30,
2021* | | August 31, 2020^ through
October 31, |
| SIMPLE Class | 2020 |
| Net asset value at beginning of period | $ 14.33 | | $ 15.03 |
| Net investment income (loss) (a) | 0.04 | | 0.02 |
| Net realized and unrealized gain (loss) on investments | 3.35 | | (0.72) |
| Total from investment operations | 3.39 | | (0.70) |
| Less distributions: | | | |
| From net investment income | (0.10) | | — |
| From net realized gain on investments | (0.65) | | — |
| Total distributions | (0.75) | | — |
| Net asset value at end of period | $ 16.97 | | $ 14.33 |
| Total investment return (b) | 24.15% | | (4.66)% |
| Ratios (to average net assets)/Supplemental Data: | | | |
| Net investment income (loss) | 0.51%†† | | 0.80%†† |
| Net expenses (c) | 0.80%†† | | 0.80%†† |
| Expenses (before waiver/reimbursement) (c) | 0.91%†† | | 0.95%†† |
| Portfolio turnover rate | 15% | | 47% |
| Net assets at end of period (in 000’s) | $ 974 | | $ 180 |
| * | Unaudited. |
| ^ | Inception date. |
| †† | Annualized. |
| (a) | Per share data based on average shares outstanding during the period. |
| (b) | Total investment return is calculated exclusive of sales charges and assumes the reinvestment of dividends and distributions. SIMPLE Class shares are not subject to sales charges. For periods of less than one year, total return is not annualized. |
| (c) | In addition to the fees and expenses which the Fund bears directly, it also indirectly bears a pro-rata share of the fees and expenses of the underlying funds in which it invests. Such indirect expenses are not included in the above expense ratios. |
The notes to the financial statements are an integral part of, and should be read in conjunction with, the financial statements.
55
MainStay Equity Allocation Fund
Investment and Performance Comparison (Unaudited)
Performance data quoted represents past performance. Past performance is no guarantee of future results. Because of market volatility and other factors, current performance may be lower or higher than the figures shown. Investment return and principal value will fluctuate, and as a result, when shares are redeemed, they may be worth more or less than their original cost. The graph below depicts the historical performance of Class I shares of the Fund. Performance will vary from class to class based on differences in class-specific expenses and sales charges. For performance information current to the most recent month-end, please call 800-624-6782 or visit newyorklifeinvestments.com.
The performance table and graph do not reflect the deduction of taxes that a shareholder would pay on distributions or Fund share redemptions. Total returns reflect maximum applicable sales charges as indicated in the table below, if any, changes in share price, and reinvestment of dividend and capital gain distributions. The graph assumes the initial investment amount shown below and reflects the deduction of all sales charges that would have applied for the period of investment. Performance figures may reflect certain fee waivers and/or expense limitations, without which total returns may have been lower. For more information on share classes and current fee waivers and/or expense limitations (if any), please refer to the Notes to Financial Statements.
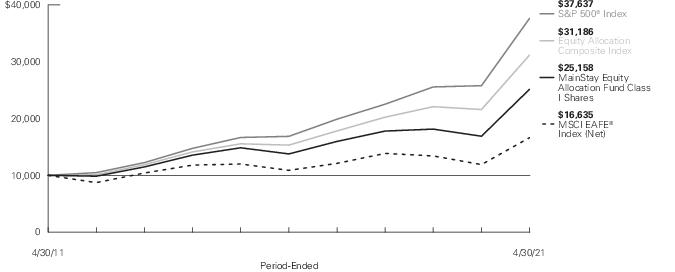
| Average Annual Total Returns for the Period-Ended April 30, 2021 |
| Class | Sales Charge | | Inception
Date | Six
Months | One Year
or Since
Inception | Five
Years | Ten Years
or Since
Inception | Gross
Expense
Ratio1 |
| Class A Shares2 | Maximum 3% Initial Sales Charge | With sales charges | 4/4/2005 | 27.05% | 44.23% | 11.26% | 8.76% | 1.13% |
| | | Excluding sales charges | | 30.98 | 48.69 | 12.53 | 9.38 | 1.13 |
| Investor Class Shares2, 3 | Maximum 2.5% Initial Sales Charge | With sales charges | 2/28/2008 | 27.62 | 44.05 | 11.09 | 8.59 | 1.44 |
| | | Excluding sales charges | | 30.89 | 48.50 | 12.36 | 9.21 | 1.44 |
| Class B Shares4 | Maximum 5% CDSC | With sales charges | 4/4/2005 | 25.38 | 42.37 | 11.27 | 8.41 | 2.19 |
| | if Redeemed Within the First Six Years of Purchase | Excluding sales charges | | 30.38 | 47.37 | 11.53 | 8.41 | 2.19 |
| Class C Shares | Maximum 1% CDSC | With sales charges | 4/4/2005 | 29.41 | 46.37 | 11.53 | 8.41 | 2.19 |
| | if Redeemed Within One Year of Purchase | Excluding sales charges | | 30.41 | 47.37 | 11.53 | 8.41 | 2.19 |
| Class I Shares | No Sales Charge | | 4/4/2005 | 31.11 | 49.01 | 12.81 | 9.67 | 0.88 |
| Class R3 Shares | No Sales Charge | | 2/29/2016 | 30.78 | 48.17 | 12.13 | 13.41 | 1.48 |
| SIMPLE Class Shares | No Sales Charge | | 8/31/2020 | 30.76 | 23.60 | N/A | N/A | 1.69 |
| 1. | The gross expense ratios presented reflect the Fund’s “Total Annual Fund Operating Expenses” from the most recent Prospectus, as supplemented, and may differ from other expense ratios disclosed in this report. |
| 2. | Prior to July 22, 2019, the maximum initial sales charge applicable was 5.5%, which is reflected in the average annual total return figures shown. |
| 3. | Prior to June 30, 2020, the maximum initial sales charge for Investor Class shares was 3.0%, which is reflected in the average annual total return figures shown. |
| 4. | Class B shares are closed to all new purchases as well as additional investments by existing Class B shareholders. |
The footnotes on the next page are an integral part of the table and graph and should be carefully read in conjunction with them.
| 56 | MainStay Equity Allocation Fund |
| Benchmark Performance | Six
Months | One
Year | Five
Years | Ten
Years |
| S&P 500® Index1 | 28.85% | 45.98% | 17.42% | 14.17% |
| MSCI EAFE® Index (Net)2 | 28.84 | 39.88 | 8.87 | 5.22 |
| Equity Allocation Composite Index3 | 28.88 | 44.49 | 15.28 | 12.05 |
| Morningstar Allocation - 85%+ Equity Category Average4 | 30.12 | 46.63 | 12.67 | 9.36 |
| 1. | The S&P 500® Index is the Fund's primary broad-based securities market index for comparison purposes. “S&P 500®” is a trademark of The McGraw-Hill Companies, Inc. The S&P 500® Index is widely regarded as the standard index for measuring large-cap U.S. stock market performance. Results assume reinvestment of all dividends and capital gains. An investment cannot be made directly in an index. |
| 2. | The MSCI EAFE® Index (Net) is the Fund’s secondary benchmark. The MSCI EAFE® Index (Net) consists of international stocks representing the developed world outside of North America. Results assume reinvestment of all dividends and capital gains. An investment cannot be made directly in an index. |
| 3. | The Fund has selected the Equity Allocation Composite Index as an additional benchmark. The Equity Allocation Composite Index consists of the S&P 500® Index and the MSCI EAFE® Index (Net) weighted 75% and 25%, respectively. Prior to February 28, 2014, the Equity Allocation Composite Index consisted of the S&P 500® Index and the MSCI EAFE® Index (Net) weighted 80% and 20%, respectively. Results assume reinvestment of all dividends and capital gains. An investment cannot be made directly in an index. |
| 4. | The Morningstar Allocation – 85%+ Equity Category Average is representative of funds that seek to provide both income and capital appreciation by investing in multiple asset classes, including stocks, bonds, and cash. These portfolios are dominated by domestic holdings and have equity exposures of over 85%. These funds typically allocate at least 10% to equities of foreign companies and do not exclusively allocate between cash and equities. Results are based on average total returns of similar funds with all dividends and capital gain distributions reinvested. |
The footnotes on the preceding page are an integral part of the table and graph and should be carefully read in conjunction with them.
Cost in Dollars of a $1,000 Investment in MainStay Equity Allocation Fund (Unaudited)
The example below is intended to describe the fees and expenses borne by shareholders during the six-month period from November 1, 2020, to April 30, 2021, and the impact of those costs on your investment.
Example
As a shareholder of the Fund you incur two types of costs: (1) transaction costs, including exchange fees and sales charges (loads) on purchases (as applicable), and (2) ongoing costs, including management fees, distribution and/or service (12b-1) fees, and other Fund expenses (as applicable). This example is intended to help you understand your ongoing costs (in dollars) of investing in the Fund and to compare these costs with the ongoing costs of investing in other mutual funds. The example is based on an investment of $1,000 made at the beginning of the six-month period and held for the entire period from November 1, 2020, to April 30, 2021.
This example illustrates your Fund’s ongoing costs in two ways:
Actual Expenses
The second and third data columns in the table below provide information about actual account values and actual expenses. You may use the information in these columns, together with the amount you invested, to estimate the expenses that you paid during the six months ended April 30, 2021. Simply divide your account value by $1,000 (for example, an
$8,600 account value divided by $1,000 = 8.6), then multiply the result by the number under the heading entitled “Expenses Paid During Period” to estimate the expenses you paid on your account during this period.
Hypothetical Example for Comparison Purposes
The fourth and fifth data columns in the table below provide information about hypothetical account values and hypothetical expenses based on the Fund’s actual expense ratio and an assumed rate of return of 5% per year before expenses, which is not the Fund’s actual return. The hypothetical account values and expenses may not be used to estimate the actual ending account balances or expenses you paid for the six-month period shown. You may use this information to compare the ongoing costs of investing in the Fund with the ongoing costs of investing in other mutual funds. To do so, compare this 5% hypothetical example with the 5% hypothetical examples that appear in the shareholder reports of the other mutual funds.
Please note that the expenses shown in the table are meant to highlight your ongoing costs only and do not reflect any transactional costs, such as exchange fees or sales charges (loads). Therefore, the fourth and fifth data columns of the table are useful in comparing ongoing costs only and will not help you determine the relative total costs of owning different funds. In addition, if these transactional costs were included, your costs would have been higher.
| Share Class | Beginning
Account
Value
11/1/20 | Ending Account
Value (Based
on Actual
Returns and
Expenses)
4/30/21 | Expenses
Paid
During
Period1 | Ending Account
Value (Based
on Hypothetical
5% Annualized
Return and
Actual Expenses)
4/30/21 | Expenses
Paid
During
Period1 | Net Expense
Ratio
During
Period2 |
| Class A Shares | $1,000.00 | $1,309.80 | $2.23 | $1,022.86 | $1.96 | 0.39% |
| Investor Class Shares | $1,000.00 | $1,308.90 | $3.15 | $1,022.07 | $2.76 | 0.55% |
| Class B Shares | $1,000.00 | $1,303.80 | $7.43 | $1,018.35 | $6.51 | 1.30% |
| Class C Shares | $1,000.00 | $1,304.10 | $7.43 | $1,018.35 | $6.51 | 1.30% |
| Class I Shares | $1,000.00 | $1,311.10 | $0.80 | $1,024.10 | $0.70 | 0.14% |
| Class R3 Shares | $1,000.00 | $1,307.80 | $4.23 | $1,021.13 | $3.71 | 0.74% |
| SIMPLE Class Shares | $1,000.00 | $1,307.60 | $4.58 | $1,020.83 | $4.01 | 0.80% |
| 1. | Expenses are equal to the Fund’s annualized expense ratio of each class multiplied by the average account value over the period, divided by 365 and multiplied by 181 (to reflect the six-month period). The table above represents the actual expenses incurred during the six-month period. In addition to the fees and expenses which the Fund bears directly, it also indirectly bears a pro rata share of the fees and expenses of the underlying funds in which it invests. Such indirect expenses are not included in the above-reported expense figures. |
| 2. | Expenses are equal to the Fund's annualized expense ratio to reflect the six-month period. |
| 58 | MainStay Equity Allocation Fund |
Asset Diversification as of April 30, 2021 (Unaudited)
| Equity Funds | 96.6 % |
| Short-Term Investments | 3.4 |
| Other Assets, Less Liabilities | (0.0) ‡ |
| ‡ | Less than one-tenth of a percent. |
See Portfolio of Investments beginning on page 62 for specific holdings within these categories. The Fund’s holdings are subject to change.
Portfolio Management Discussion and Analysis (Unaudited)
Questions answered by portfolio managers Jae S. Yoon, CFA, Jonathan Swaney, Poul Kristensen, CFA, and Amit Soni, CFA, of New York Life Investment Management LLC, the Fund’s Manager.
How did MainStay Equity Allocation Fund perform relative to its benchmarks and peer group during the six months ended April 30, 2021?
For the six months ended April 30, 2021, Class I shares of MainStay Equity Allocation Fund returned 31.11%, outperforming the 28.85% return of the Fund’s primary benchmark, the S&P 500® Index, and the 28.84% return of the MSCI EAFE® Index (Net), which is the Fund’s secondary benchmark. Over the same period, Class I shares of the Fund outperformed the 28.88% return of the Equity Allocation Composite Index, which is an additional benchmark of the Fund, and the 30.12% return of the Morningstar Allocation—85%+ Equity Category Average.1
What factors affected the Fund’s relative performance during the reporting period?
The Fund is a “fund of funds,” meaning that it seeks to achieve its investment objective by investing primarily in mutual funds and exchange-traded funds (“ETFs”) managed by New York Life Investments or its affiliates (the “Underlying Funds”). The Underlying Funds may invest in U.S. and international equities across a range of capitalizations and geographies, making comparisons to any single index generally less suitable than a weighted combination of indices, which is a more useful yardstick by which to measure performance. The most influential factor affecting returns for the Fund during the reporting period (versus the performance of a weighted combination of indices) is the net performance of the Underlying Funds themselves, relative to their respective benchmarks.
Fund management internally maintains a blend of indices that are taken into consideration when managing the Fund. Despite the Fund’s strong showing versus its prospectus benchmarks, during the reporting period, the Fund’s performance trailed the performance of the internally maintained blend of indices, primarily due to the materially negative impact of asset class policy. Most significantly, the Fund held underweight exposure to small-cap stocks in the fall of 2020 and into 2021 at a time when these higher beta2 securities rallied powerfully, far surpassing the return on larger company stocks. In addition, for reasons discussed below, the Fund maintained a cash position rather than being fully invested, hence participating less fully in the ongoing bull market than the internally maintained blend of indices.
Some aspects of the Fund’s asset class policy—such as a bias toward value stocks—made positive contributions to relative returns, partially mitigating the negative affects cited above. (Contributions take weightings and total returns into account.) More significant was a strongly positive contribution from the Underlying Funds themselves. After years in which passive
strategies generally held the upper hand, during the reporting period active management fared better. As a result, excess returns at the Underlying Fund level made a materially positive contribution to the Fund’s relative performance.
During the reporting period, how was the Fund’s performance materially affected by investments in derivatives?
Total return swaps were used to express most of the Fund’s asset class policy views. Therefore, the swaps can be seen as detracting from the Fund’s relative performance over the course of the reporting period.
How did you allocate the Fund’s assets during the reporting period and why?
The Fund entered the reporting period maintaining a somewhat defensive posture, holding cash and favoring large companies over small companies. This positioning arose out of our suspicion, based on the facts then available, that market pricing had gotten ahead of the operating conditions that prevailed at the time and, in our opinion, were likely to persist into the foreseeable future. Equity indices were trading at or near all-time highs despite the fact that aggregate output and corporate profits were well below prior peaks, many millions of workers were unemployed, prospects for additional policy support were unclear and the pandemic was anything but contained. Risks appeared skewed to the downside.
Much changed with the announcements of highly successful clinical trials for both the Moderna and Pfizer vaccines, followed shortly thereafter by the granting of emergency use authorizations and rapid distribution to the most vulnerable elements of the population. These developments brought the end of pandemic restrictions into view, ushering in a wave of activity and lifting market prices that much higher.
With the end of restrictions on the horizon, we adjusted the Fund to favor pro-cyclical sectors and businesses in industries likely to benefit most from the reopening of the U.S. economy. We also increased the Fund’s exposure to non-U.S. equities we believed were positioned to experience a recovery similar to that seen in the U.S. but on a lagged basis due to a slower vaccine rollout. Similarly, we slid a little way down the capitalization spectrum, committing a bigger allocation of the Fund’s assets to small- and mid-cap companies we judged likely to fare well in this environment. These adjustments provided a modest tailwind to the Fund’s performance in the first four months of 2021.
| 1. | See page 56 for other share class returns, which may be higher or lower than Class I share returns. See page 57 for more information on benchmark and peer group returns. |
| 2. | Beta is a measure of volatility in relation to the market as a whole. A beta higher than 1 indicates that a security or portfolio will tend to exhibit higher volatility than the market. A beta lower than 1 indicates that a security or portfolio will tend to exhibit lower volatility than the market. |
| 60 | MainStay Equity Allocation Fund |
How did the Fund’s allocations change over the course of the reporting period?
The restructuring noted above was largely implemented through the use of derivatives, specifically total return swaps. The Fund’s exposure to mid-to-small-cap stocks, non-U.S. markets and a basket of companies specifically leveraged to the reopening of the economy was increased in this way, while exposure was dialed down for large-cap U.S. stocks and a basket of companies identified as having been beneficiaries of lockdown conditions.
The most notable changes to Underlying Fund allocations arose from Fund restructurings as Wellington Management Company was named the new subadvisor on several MainStay Funds that concurrently underwent name changes. A few Funds also were subject to mergers. By way of example, MainStay MacKay Common Stock Fund was renamed MainStay WMC Enduring Capital Fund when Wellington took the helm in early March 2021, and MainStay Epoch U.S. All Cap Fund was merged into MainStay WMC Enduring Capital Fund a short while later.
During the reporting period, which Underlying Equity Funds had the highest total returns and which had the lowest total returns?
The Underlying Equity Funds in which the Fund was invested for the entire reporting period that generated the highest total returns included IQ Chaikin U.S. Small Cap ETF, MainStay WMC Small Companies Fund (known as MainStay MacKay Small Cap Core Fund prior to March 2021), and IQ 500 International ETF. Underlying Equity Funds with the lowest total returns included MainStay Winslow Large Cap Growth Fund, MainStay Epoch International Choice Fund, and MainStay MacKay International Equity Fund.
Which Underlying Equity Funds were the strongest positive contributors to the Fund’s performance and which Underlying Equity Funds were particularly weak?
The positions that made the largest positive contributions to performance during the reporting period were MainStay MacKay S&P 500 Index Fund and MainStay WMC Small Companies Fund (formerly MainStay MacKay Small Cap Core Fund). While no Underlying Equity Funds produced negative absolute returns, those delivering the weakest returns included MainStay Epoch Capital Growth Fund, IQ 50% Hedged FTSE International ETF and IQ Candriam ESG International Equity ETF.
How was the Fund positioned at the end of the reporting period?
As of April 30, 2021, in our view, we see two countervailing forces at work within capital markets. The first is the exceptional strength
of the domestic economy. The gradual reopening of full business capacity, augmented by massive fiscal and monetary policy support, is yielding a rate of expansion not seen in generations. With this as the backdrop, corporate profit growth has been nothing less than stellar, with high expectations for continued rapid improvement in earnings.
At the same time, we believe there is the need to recognize that price gains in capital markets have significantly outpaced earnings gains, which translates into very high valuations, which in turn implies that investors are paying richly for future earnings. Should inflation rise materially, we believe the present value of those future earnings would be diminished, potentially undermining high share price levels and sowing the seeds for a market correction. Paradoxically, it is the same strong economic growth driving profits higher that may spawn faster rates of inflation and bring the rally to an end.
We believe that upside and downside risks are approximately balanced. Therefore, we lean neither toward nor away from risk assets broadly. However, within asset classes we believe there will be clear winners and losers from increasing consumer mobility and the full reopening of businesses. The dominant theme evident within the Fund’s holdings revolves around that dynamic: we favor more pro-cyclical elements of the economy by tilting toward value stocks and non-US markets. We also continue to maintain the Fund’s exposure to gold miners as a possible hedge against rising inflation.
The opinions expressed are those of the portfolio managers as of the date of this report and are subject to change. There is no guarantee that any forecasts will come to pass. This material does not constitute investment advice and is not intended as an endorsement of any specific investment.
Portfolio of Investments April 30, 2021† (Unaudited)
| | Shares | Value |
| Affiliated Investment Companies 96.6% |
| Equity Funds 96.6% |
| IQ 50 Percent Hedged FTSE International ETF | 367,831 | $ 8,949,328 |
| IQ 500 International ETF (a) | 594,079 | 19,287,428 |
| IQ Candriam ESG International Equity ETF (a) | 632,623 | 18,476,008 |
| IQ Candriam ESG U.S. Equity ETF (a) | 1,081,007 | 38,422,556 |
| IQ Chaikin U.S. Large Cap ETF (a) | 943,870 | 30,671,905 |
| IQ Chaikin U.S. Small Cap ETF (a) | 629,901 | 22,070,156 |
| Mainstay Candriam Emerging Markets Equity Fund Class R6 (a) | 1,696,432 | 22,868,077 |
| MainStay Epoch Capital Growth Fund Class I | 107,782 | 1,675,197 |
| MainStay Epoch International Choice Fund Class I (a) | 385,836 | 15,998,176 |
| MainStay Epoch U.S. Equity Yield Fund Class R6 | 1,482,952 | 28,173,562 |
| MainStay MacKay International Equity Fund Class R6 | 667,320 | 14,762,990 |
| MainStay MacKay S&P 500 Index Fund Class I | 995,327 | 54,786,182 |
| MainStay Winslow Large Cap Growth Fund Class R6 | 3,190,702 | 46,530,971 |
| Mainstay WMC Enduring Capital Fund Class R6 | 1,217,615 | 40,248,616 |
| Mainstay WMC Growth Fund Class R6 | 338,901 | 17,895,115 |
| Mainstay WMC International Research Equity Fund Class I (a) | 1,908,629 | 15,232,961 |
| | Shares | | Value |
| |
| Equity Funds (continued) |
| Mainstay WMC Small Companies Fund Class I (a) | 722,348 | | $ 24,529,410 |
| Mainstay WMC Value Fund Class R6 | 624,335 | | 33,779,014 |
Total Affiliated Investment Companies
(Cost $333,470,235) | | | 454,357,652 |
| Short-Term Investment 3.4% |
| Affiliated Investment Company 3.4% |
| MainStay U.S. Government Liquidity Fund, 0.01% (b) | 15,912,011 | | 15,912,011 |
Total Short-Term Investment
(Cost $15,912,011) | 3.4% | | 15,912,011 |
Total Investments
(Cost $349,382,246) | 100.0% | | 470,269,663 |
| Other Assets, Less Liabilities | (0.0)‡ | | (42,286) |
| Net Assets | 100.0% | | $ 470,227,377 |
| † | Percentages indicated are based on Fund net assets. |
| ‡ | Less than one-tenth of a percent. |
| (a) | As of April 30, 2021, the Fund’s ownership exceeds 5% of the outstanding shares of the Underlying Fund’s share class |
| (b) | Current yield as of April 30, 2021. |
Swap Contracts
Open OTC total return equity swap contracts as of April 30, 2021 were as follows1:
Swap
Counterparty | Reference Obligation | Floating Rate2 | Termination
Date(s) | Payment
Frequency
Paid/
Received | Notional
Amount
Long/
(Short)
(000)3 | Unrealized
Appreciation/
(Depreciation)4 |
| Citibank NA | Citi 2nd Wave Virus Basket | 1 month LIBOR BBA plus 0.35% | 12/2/21 | Monthly | 3,378 | $ — |
| Citibank NA | Citi Stay at Home Basket | 1 month LIBOR BBA minus 0.30% | 12/2/21 | Monthly | (3,530) | — |
| Citibank NA | iShares MSCI EAFE ETF | 1 month LIBOR BBA plus 0.40% | 12/2/21 | Monthly | 9,316 | — |
| Citibank NA | iShares MSCI Emerging Markets ETF | 1 month LIBOR BBA plus 0.40% | 12/2/21 | Monthly | 4,594 | — |
| Citibank NA | Russell 1000 Growth Total Return Index | 1 month LIBOR BBA plus 0.03% | 12/2/21 | Monthly | (12,301) | — |
| Citibank NA | Russell 1000 Value Total Return Index | 1 month LIBOR BBA plus 0.30% | 12/2/21 | Monthly | 6,845 | — |
| Citibank NA | Russell 2000 Total Return Index | 1 month LIBOR BBA minus 0.07% | 12/2/21 | Monthly | (10,145) | — |
| Citibank NA | Russell Midcap Total Return Index | 1 month LIBOR BBA plus 0.31% | 12/2/21 | Monthly | 18,040 | — |
The notes to the financial statements are an integral part of, and should be read in conjunction with, the financial statements.
| 62 | MainStay Equity Allocation Fund |
Swap
Counterparty | Reference Obligation | Floating Rate2 | Termination
Date(s) | Payment
Frequency
Paid/
Received | Notional
Amount
Long/
(Short)
(000)3 | Unrealized
Appreciation/
(Depreciation)4 |
| Citibank NA | VanEck Vectors Gold Miners ETF | 1 month LIBOR BBA plus 0.50% | 12/2/21 | Monthly | 2,344 | $ — |
| | | | | | | $ — |
| 1. | As of April 30, 2021, cash in the amount $563,555 was pledged from brokers for OTC swap contracts. |
| 2. | Fund pays the floating rate and receives the total return of the reference entity. |
| 3. | Notional amounts reflected as a positive value indicate a long position held by the Fund or Index and a negative value indicates a short position. |
| 4. | Reflects the value at reset date as of April 30, 2021. |
The following is a summary of the fair valuations according to the inputs used as of April 30, 2021, for valuing the Fund’s assets:
| Description | Quoted
Prices in
Active
Markets for
Identical
Assets
(Level 1) | | Significant
Other
Observable
Inputs
(Level 2) | | Significant
Unobservable
Inputs
(Level 3) | | Total |
| Asset Valuation Inputs | | | | | | | |
| Investments in Securities (a) | | | | | | | |
| Affiliated Investment Companies | | | | | | | |
| Equity Funds | $ 454,357,652 | | $ — | | $ — | | $ 454,357,652 |
| Short-Term Investment | | | | | | | |
| Affiliated Investment Company | 15,912,011 | | — | | — | | 15,912,011 |
| Total Investments in Securities | $ 470,269,663 | | $ — | | $ — | | $ 470,269,663 |
| (a) | For a complete listing of investments, see the Portfolio of Investments. |
The notes to the financial statements are an integral part of, and should be read in conjunction with, the financial statements.
63
Statement of Assets and Liabilities as of April 30, 2021 (Unaudited)
| Assets |
Investment in affiliated investment companies, at value
(identified cost $349,382,246) | $470,269,663 |
| Cash collateral on deposit at broker for swap contracts | 563,555 |
| Cash | 10 |
| Receivables: | |
| Fund shares sold | 265,178 |
| Manager (See Note 3) | 13,105 |
| Interest | 135 |
| Other assets | 81,948 |
| Total assets | 471,193,594 |
| Liabilities |
| Payables: | |
| Fund shares redeemed | 546,233 |
| Transfer agent (See Note 3) | 124,898 |
| NYLIFE Distributors (See Note 3) | 118,272 |
| Dividends and interest on OTC swaps contracts | 98,474 |
| Shareholder communication | 42,561 |
| Professional fees | 29,702 |
| Custodian | 3,157 |
| Accrued expenses | 2,920 |
| Total liabilities | 966,217 |
| Net assets | $470,227,377 |
| Composition of Net Assets |
| Shares of beneficial interest outstanding (par value of $.001 per share) unlimited number of shares authorized | $ 25,398 |
| Additional paid-in-capital | 314,771,128 |
| | 314,796,526 |
| Total distributable earnings (loss) | 155,430,851 |
| Net assets | $470,227,377 |
| Class A | |
| Net assets applicable to outstanding shares | $346,089,425 |
| Shares of beneficial interest outstanding | 18,648,305 |
| Net asset value per share outstanding | $ 18.56 |
| Maximum sales charge (3.00% of offering price) | 0.57 |
| Maximum offering price per share outstanding | $ 19.13 |
| Investor Class | |
| Net assets applicable to outstanding shares | $ 78,067,706 |
| Shares of beneficial interest outstanding | 4,206,803 |
| Net asset value per share outstanding | $ 18.56 |
| Maximum sales charge (2.50% of offering price) | 0.48 |
| Maximum offering price per share outstanding | $ 19.04 |
| Class B | |
| Net assets applicable to outstanding shares | $ 21,005,725 |
| Shares of beneficial interest outstanding | 1,169,540 |
| Net asset value and offering price per share outstanding | $ 17.96 |
| Class C | |
| Net assets applicable to outstanding shares | $ 16,530,475 |
| Shares of beneficial interest outstanding | 918,772 |
| Net asset value and offering price per share outstanding | $ 17.99 |
| Class I | |
| Net assets applicable to outstanding shares | $ 6,266,813 |
| Shares of beneficial interest outstanding | 331,196 |
| Net asset value and offering price per share outstanding | $ 18.92 |
| Class R3 | |
| Net assets applicable to outstanding shares | $ 2,023,215 |
| Shares of beneficial interest outstanding | 109,788 |
| Net asset value and offering price per share outstanding | $ 18.43 |
| SIMPLE Class | |
| Net assets applicable to outstanding shares | $ 244,018 |
| Shares of beneficial interest outstanding | 13,151 |
| Net asset value and offering price per share outstanding | $ 18.56 |
The notes to the financial statements are an integral part of, and should be read in conjunction with, the financial statements.
| 64 | MainStay Equity Allocation Fund |
Statement of Operations for the six months ended April 30, 2021 (Unaudited)
| Investment Income (Loss) |
| Income | |
| Dividend distributions from affiliated investment companies | $ 2,829,635 |
| Interest | 690 |
| Total income | 2,830,325 |
| Expenses | |
| Distribution/Service—Class A (See Note 3) | 391,586 |
| Distribution/Service—Investor Class (See Note 3) | 98,237 |
| Distribution/Service—Class B (See Note 3) | 106,267 |
| Distribution/Service—Class C (See Note 3) | 87,449 |
| Distribution/Service—Class R3 (See Note 3) | 4,320 |
| Distribution/Service—SIMPLE Class (See Note 3) | 287 |
| Transfer agent (See Note 3) | 324,090 |
| Registration | 58,829 |
| Shareholder communication | 32,632 |
| Professional fees | 29,387 |
| Custodian | 21,959 |
| Trustees | 4,264 |
| Insurance | 1,729 |
| Shareholder service (See Note 3) | 864 |
| Miscellaneous | 7,524 |
| Total expenses before waiver/reimbursement | 1,169,424 |
| Expense waiver/reimbursement from Manager (See Note 3) | (84,029) |
| Net expenses | 1,085,395 |
| Net investment income (loss) | 1,744,930 |
| Realized and Unrealized Gain (Loss) |
| Net realized gain (loss) on: | |
| Affiliated investment company transactions | 14,087,306 |
| Realized capital gain distributions from affiliated investment companies | 21,532,484 |
| Swap transactions | 2,748,543 |
| Net realized gain (loss) | 38,368,333 |
Net change in unrealized appreciation (depreciation) on:
Affiliated investments companies | 74,256,263 |
| Net realized and unrealized gain (loss) | 112,624,596 |
| Net increase (decrease) in net assets resulting from operations | $114,369,526 |
The notes to the financial statements are an integral part of, and should be read in conjunction with, the financial statements.
65
Statements of Changes in Net Assets
for the six months ended April 30, 2021 (Unaudited) and the year ended October 31, 2020
| | 2021 | 2020 |
| Increase (Decrease) in Net Assets |
| Operations: | | |
| Net investment income (loss) | $ 1,744,930 | $ 4,420,468 |
| Net realized gain (loss) | 38,368,333 | 19,929,273 |
| Net change in unrealized appreciation (depreciation) | 74,256,263 | (10,632,389) |
| Net increase (decrease) in net assets resulting from operations | 114,369,526 | 13,717,352 |
| Distributions to shareholders: | | |
| Class A | (14,573,592) | (13,636,883) |
| Investor Class | (3,373,689) | (3,741,832) |
| Class B | (929,852) | (1,118,722) |
| Class C | (786,948) | (810,025) |
| Class I | (264,076) | (256,613) |
| Class R3 | (71,345) | (56,607) |
| SIMPLE Class | (3,947) | — |
| Total distributions to shareholders | (20,003,449) | (19,620,682) |
| Capital share transactions: | | |
| Net proceeds from sales of shares | 23,444,984 | 48,229,460 |
| Net asset value of shares issued to shareholder in reinvestment of distributions | 19,905,421 | 19,507,022 |
| Cost of shares redeemed | (41,306,194) | (62,267,515) |
| Increase (decrease) in net assets derived from capital share transactions | 2,044,211 | 5,468,967 |
| Net increase (decrease) in net assets | 96,410,288 | (434,363) |
| Net Assets |
| Beginning of period | 373,817,089 | 374,251,452 |
| End of period | $470,227,377 | $373,817,089 |
The notes to the financial statements are an integral part of, and should be read in conjunction with, the financial statements.
| 66 | MainStay Equity Allocation Fund |
Financial Highlights selected per share data and ratios
| | Six months ended
April 30,
2021* | | Year Ended October 31, |
| Class A | 2020 | | 2019 | | 2018 | | 2017 | | 2016 |
| Net asset value at beginning of period | $ 14.86 | | $ 15.10 | | $ 15.60 | | $ 17.01 | | $ 14.37 | | $ 15.36 |
| Net investment income (loss) (a) | 0.08 | | 0.19 | | 0.15 | | 0.12 | | 0.12 | | 0.10 |
| Net realized and unrealized gain (loss) on investments | 4.43 | | 0.38 | | 0.93 | | (0.59) | | 3.08 | | (0.28) |
| Total from investment operations | 4.51 | | 0.57 | | 1.08 | | (0.47) | | 3.20 | | (0.18) |
| Less distributions: | | | | | | | | | | | |
| From net investment income | (0.08) | | (0.28) | | (0.18) | | (0.36) | | (0.13) | | (0.15) |
| From net realized gain on investments | (0.73) | | (0.53) | | (1.40) | | (0.58) | | (0.43) | | (0.66) |
| Total distributions | (0.81) | | (0.81) | | (1.58) | | (0.94) | | (0.56) | | (0.81) |
| Net asset value at end of period | $ 18.56 | | $ 14.86 | | $ 15.10 | | $ 15.60 | | $ 17.01 | | $ 14.37 |
| Total investment return (b) | 30.98% | | 3.70% | | 8.72% | | (3.15)% | | 22.91% | | (1.07)% |
| Ratios (to average net assets)/Supplemental Data: | | | | | | | | | | | |
| Net investment income (loss) | 0.88%†† | | 1.29% | | 1.06% | | 0.69% | | 0.73% | | 0.73% |
| Net expenses (c) | 0.39%†† | | 0.41% | | 0.43% | | 0.38% | | 0.40% | | 0.41% |
| Portfolio turnover rate | 15% | | 36% | | 35% | | 48% | | 30% | | 25% |
| Net assets at end of period (in 000’s) | $ 346,089 | | $ 258,743 | | $ 248,068 | | $ 236,201 | | $ 242,172 | | $ 128,723 |
| * | Unaudited. |
| †† | Annualized. |
| (a) | Per share data based on average shares outstanding during the period. |
| (b) | Total investment return is calculated exclusive of sales charges and assumes the reinvestment of dividends and distributions. For periods of less than one year, total return is not annualized. |
| (c) | In addition to the fees and expenses which the Fund bears directly, it also indirectly bears a pro-rata share of the fees and expenses of the underlying funds in which it invests. Such indirect expenses are not included in the above expense ratios. |
| | Six months ended
April 30,
2021* | | Year Ended October 31, |
| Investor Class | 2020 | | 2019 | | 2018 | | 2017 | | 2016 |
| Net asset value at beginning of period | $ 14.84 | | $ 15.08 | | $ 15.58 | | $ 16.98 | | $ 14.34 | | $ 15.33 |
| Net investment income (loss) (a) | 0.06 | | 0.17 | | 0.13 | | 0.09 | | 0.09 | | 0.08 |
| Net realized and unrealized gain (loss) on investments | 4.43 | | 0.38 | | 0.93 | | (0.59) | | 3.09 | | (0.28) |
| Total from investment operations | 4.49 | | 0.55 | | 1.06 | | (0.50) | | 3.18 | | (0.20) |
| Less distributions: | | | | | | | | | | | |
| From net investment income | (0.04) | | (0.26) | | (0.16) | | (0.32) | | (0.11) | | (0.13) |
| From net realized gain on investments | (0.73) | | (0.53) | | (1.40) | | (0.58) | | (0.43) | | (0.66) |
| Total distributions | (0.77) | | (0.79) | | (1.56) | | (0.90) | | (0.54) | | (0.79) |
| Net asset value at end of period | $ 18.56 | | $ 14.84 | | $ 15.08 | | $ 15.58 | | $ 16.98 | | $ 14.34 |
| Total investment return (b) | 30.89% | | 3.55% | | 8.52% | | (3.34)% | | 22.80% | | (1.23)% |
| Ratios (to average net assets)/Supplemental Data: | | | | | | | | | | | |
| Net investment income (loss) | 0.76% | | 1.18% | | 0.89% | | 0.56% | | 0.61% | | 0.57% |
| Net expenses (c) | 0.55%†† | | 0.55% | | 0.55% | | 0.55% | | 0.55% | | 0.55% |
| Expenses (before waiver/reimbursement) (c) | 0.69%†† | | 0.72% | | 0.72% | | 0.64% | | 0.59% | | 0.60% |
| Portfolio turnover rate | 15% | | 36% | | 35% | | 48% | | 30% | | 25% |
| Net assets at end of period (in 000’s) | $ 78,068 | | $ 73,492 | | $ 75,913 | | $ 66,924 | | $ 71,378 | | $ 123,415 |
| * | Unaudited. |
| †† | Annualized. |
| (a) | Per share data based on average shares outstanding during the period. |
| (b) | Total investment return is calculated exclusive of sales charges and assumes the reinvestment of dividends and distributions. For periods of less than one year, total return is not annualized. |
| (c) | In addition to the fees and expenses which the Fund bears directly, it also indirectly bears a pro-rata share of the fees and expenses of the underlying funds in which it invests. Such indirect expenses are not included in the above expense ratios. |
The notes to the financial statements are an integral part of, and should be read in conjunction with, the financial statements.
67
Financial Highlights selected per share data and ratios
| | Six months ended
April 30,
2021* | | Year Ended October 31, |
| Class B | 2020 | | 2019 | | 2018 | | 2017 | | 2016 |
| Net asset value at beginning of period | $ 14.40 | | $ 14.64 | | $ 15.13 | | $ 16.51 | | $ 13.96 | | $ 14.92 |
| Net investment income (loss) (a) | 0.01 | | 0.08 | | 0.04 | | (0.02) | | (0.01) | | (0.02) |
| Net realized and unrealized gain (loss) on investments | 4.28 | | 0.34 | | 0.89 | | (0.60) | | 2.99 | | (0.27) |
| Total from investment operations | 4.29 | | 0.42 | | 0.93 | | (0.62) | | 2.98 | | (0.29) |
| Less distributions: | | | | | | | | | | | |
| From net investment income | — | | (0.13) | | (0.02) | | (0.18) | | (0.00)‡ | | (0.01) |
| From net realized gain on investments | (0.73) | | (0.53) | | (1.40) | | (0.58) | | (0.43) | | (0.66) |
| Total distributions | (0.73) | | (0.66) | | (1.42) | | (0.76) | | (0.43) | | (0.67) |
| Net asset value at end of period | $ 17.96 | | $ 14.40 | | $ 14.64 | | $ 15.13 | | $ 16.51 | | $ 13.96 |
| Total investment return (b) | 30.38% | | 2.80% | | 7.73% | | (4.09)% | | 21.85% | | (1.88)% |
| Ratios (to average net assets)/Supplemental Data: | | | | | | | | | | | |
| Net investment income (loss) | 0.18%†† | | 0.55% | | 0.28% | | (0.13)% | | (0.05)% | | (0.13)% |
| Net expenses (c) | 1.30%†† | | 1.30% | | 1.30% | | 1.30% | | 1.30% | | 1.30% |
| Expenses (before waiver/reimbursement) (c) | 1.44%†† | | 1.47% | | 1.47% | | 1.39% | | 1.35% | | 1.35% |
| Portfolio turnover rate | 15% | | 36% | | 35% | | 48% | | 30% | | 25% |
| Net assets at end of period (in 000’s) | $ 21,006 | | $ 19,651 | | $ 25,905 | | $ 32,586 | | $ 43,643 | | $ 45,733 |
| * | Unaudited. |
| ‡ | Less than one cent per share. |
| †† | Annualized. |
| (a) | Per share data based on average shares outstanding during the period. |
| (b) | Total investment return is calculated exclusive of sales charges and assumes the reinvestment of dividends and distributions. For periods of less than one year, total return is not annualized. |
| (c) | In addition to the fees and expenses which the Fund bears directly, it also indirectly bears a pro-rata share of the fees and expenses of the underlying funds in which it invests. Such indirect expenses are not included in the above expense ratios. |
| | Six months ended
April 30,
2021* | | Year Ended October 31, |
| Class C | 2020 | | 2019 | | 2018 | | 2017 | | 2016 |
| Net asset value at beginning of period | $ 14.42 | | $ 14.66 | | $ 15.15 | | $ 16.53 | | $ 13.97 | | $ 14.94 |
| Net investment income (loss) (a) | 0.00 | | 0.07 | | 0.05 | | (0.03) | | (0.02) | | (0.02) |
| Net realized and unrealized gain (loss) on investments | 4.30 | | 0.35 | | 0.88 | | (0.59) | | 3.01 | | (0.28) |
| Total from investment operations | 4.30 | | 0.42 | | 0.93 | | (0.62) | | 2.99 | | (0.30) |
| Less distributions: | | | | | | | | | | | |
| From net investment income | — | | (0.13) | | (0.02) | | (0.18) | | (0.00)‡ | | (0.01) |
| From net realized gain on investments | (0.73) | | (0.53) | | (1.40) | | (0.58) | | (0.43) | | (0.66) |
| Total distributions | (0.73) | | (0.66) | | (1.42) | | (0.76) | | (0.43) | | (0.67) |
| Net asset value at end of period | $ 17.99 | | $ 14.42 | | $ 14.66 | | $ 15.15 | | $ 16.53 | | $ 13.97 |
| Total investment return (b) | 30.41% | | 2.79% | | 7.72% | | (4.08)% | | 21.90% | | (2.02)% |
| Ratios (to average net assets)/Supplemental Data: | | | | | | | | | | | |
| Net investment income (loss) | 0.05%†† | | 0.49% | | 0.33% | | (0.16)% | | (0.15)% | | (0.16)% |
| Net expenses (c) | 1.30%†† | | 1.30% | | 1.30% | | 1.30% | | 1.30% | | 1.30% |
| Expenses (before waiver/reimbursement) (c) | 1.44%†† | | 1.47% | | 1.47% | | 1.39% | | 1.35% | | 1.35% |
| Portfolio turnover rate | 15% | | 36% | | 35% | | 48% | | 30% | | 25% |
| Net assets at end of period (in 000’s) | $ 16,530 | | $ 15,805 | | $ 18,411 | | $ 23,998 | | $ 29,233 | | $ 24,268 |
| * | Unaudited. |
| ‡ | Less than one cent per share. |
| †† | Annualized. |
| (a) | Per share data based on average shares outstanding during the period. |
| (b) | Total investment return is calculated exclusive of sales charges and assumes the reinvestment of dividends and distributions. For periods of less than one year, total return is not annualized. |
| (c) | In addition to the fees and expenses which the Fund bears directly, it also indirectly bears a pro-rata share of the fees and expenses of the underlying funds in which it invests. Such indirect expenses are not included in the above expense ratios. |
The notes to the financial statements are an integral part of, and should be read in conjunction with, the financial statements.
| 68 | MainStay Equity Allocation Fund |
Financial Highlights selected per share data and ratios
| | Six months ended
April 30,
2021* | | Year Ended October 31, |
| Class I | 2020 | | 2019 | | 2018 | | 2017 | | 2016 |
| Net asset value at beginning of period | $ 15.15 | | $ 15.37 | | $ 15.86 | | $ 17.29 | | $ 14.59 | | $ 15.58 |
| Net investment income (loss) (a) | 0.10 | | 0.24 | | 0.21 | | 0.16 | | 0.15 | | 0.13 |
| Net realized and unrealized gain (loss) on investments | 4.51 | | 0.39 | | 0.93 | | (0.61) | | 3.15 | | (0.27) |
| Total from investment operations | 4.61 | | 0.63 | | 1.14 | | (0.45) | | 3.30 | | (0.14) |
| Less distributions: | | | | | | | | | | | |
| From net investment income | (0.11) | | (0.32) | | (0.23) | | (0.40) | | (0.17) | | (0.19) |
| From net realized gain on investments | (0.73) | | (0.53) | | (1.40) | | (0.58) | | (0.43) | | (0.66) |
| Total distributions | (0.84) | | (0.85) | | (1.63) | | (0.98) | | (0.60) | | (0.85) |
| Net asset value at end of period | $ 18.92 | | $ 15.15 | | $ 15.37 | | $ 15.86 | | $ 17.29 | | $ 14.59 |
| Total investment return (b) | 31.11% | | 4.02% | | 8.97% | | (2.98)% | | 23.27% | | (0.79)% |
| Ratios (to average net assets)/Supplemental Data: | | | | | | | | | | | |
| Net investment income (loss) | 1.15%†† | | 1.60% | | 1.40% | | 0.96% | | 0.95% | | 0.94% |
| Net expenses (c) | 0.14%†† | | 0.16% | | 0.16% | | 0.13% | | 0.15% | | 0.16% |
| Portfolio turnover rate | 15% | | 36% | | 35% | | 48% | | 30% | | 25% |
| Net assets at end of period (in 000’s) | $ 6,267 | | $ 4,727 | | $ 4,894 | | $ 5,915 | | $ 6,751 | | $ 4,593 |
| * | Unaudited. |
| †† | Annualized. |
| (a) | Per share data based on average shares outstanding during the period. |
| (b) | Total investment return is calculated exclusive of sales charges and assumes the reinvestment of dividends and distributions. Class I shares are not subject to sales charges. For periods of less than one year, total return is not annualized. |
| (c) | In addition to the fees and expenses which the Fund bears directly, it also indirectly bears a pro-rata share of the fees and expenses of the underlying funds in which it invests. Such indirect expenses are not included in the above expense ratios. |
The notes to the financial statements are an integral part of, and should be read in conjunction with, the financial statements.
69
Financial Highlights selected per share data and ratios
| | Six months ended
April 30,
2021* | | Year Ended October 31, | | February 29, 2016^ through
October 31,
2016 |
| Class R3 | 2020 | | 2019 | | 2018 | | 2017 | |
| Net asset value at beginning of period | $ 14.74 | | $ 15.00 | | $ 15.51 | | $ 16.96 | | $ 14.34 | | $ 12.94 |
| Net investment income (loss) (a) | 0.04 | | 0.11 | | 0.06 | | 0.00‡ | | 0.01 | | (0.03) |
| Net realized and unrealized gain (loss) on investments | 4.41 | | 0.40 | | 0.97 | | (0.53) | | 3.13 | | 1.43 |
| Total from investment operations | 4.45 | | 0.51 | | 1.03 | | (0.53) | | 3.14 | | 1.40 |
| Less distributions: | | | | | | | | | | | |
| From net investment income | (0.03) | | (0.24) | | (0.14) | | (0.34) | | (0.09) | | — |
| From net realized gain on investments | (0.73) | | (0.53) | | (1.40) | | (0.58) | | (0.43) | | — |
| Total distributions | (0.76) | | (0.77) | | (1.54) | | (0.92) | | (0.52) | | — |
| Net asset value at end of period | $ 18.43 | | $ 14.74 | | $ 15.00 | | $ 15.51 | | $ 16.96 | | $ 14.34 |
| Total investment return (b) | 30.78% | | 3.30% | | 8.34% | | (3.51)% | | 22.46% | | 10.82% |
| Ratios (to average net assets)/Supplemental Data: | | | | | | | | | | | |
| Net investment income (loss) | 0.52%†† | | 0.78% | | 0.40% | | 0.01% | | 0.06% | | (0.29)%†† |
| Net expenses (c) | 0.74%†† | | 0.76% | | 0.77% | | 0.73% | | 0.73% | | 0.75%†† |
| Expenses (before waiver/reimbursement) (c) | 0.74%†† | | 0.76% | | 0.77% | | 0.73% | | 0.73% | | 0.76%†† |
| Portfolio turnover rate | 15% | | 36% | | 35% | | 48% | | 30% | | 25% |
| Net assets at end of period (in 000’s) | $ 2,023 | | $ 1,375 | | $ 1,060 | | $ 405 | | $ 204 | | $ 28 |
| * | Unaudited. |
| ^ | Inception date. |
| ‡ | Less than one cent per share. |
| †† | Annualized. |
| (a) | Per share data based on average shares outstanding during the period. |
| (b) | Total investment return is calculated exclusive of sales charges and assumes the reinvestment of dividends and distributions. Class R3 shares are not subject to sales charges. For periods of less than one year, total return is not annualized. |
| (c) | In addition to the fees and expenses which the Fund bears directly, it also indirectly bears a pro-rata share of the fees and expenses of the underlying funds in which it invests. Such indirect expenses are not included in the above expense ratios. |
The notes to the financial statements are an integral part of, and should be read in conjunction with, the financial statements.
| 70 | MainStay Equity Allocation Fund |
Financial Highlights selected per share data and ratios
| | Six months ended
April 30,
2021* | | August 31, 2020^ through
October 31, |
| SIMPLE Class | 2020 |
| Net asset value at beginning of period | $ 14.84 | | $ 15.70** |
| Net investment income (loss) (a) | 0.00 | | (0.01) |
| Net realized and unrealized gain (loss) on investments | 4.48 | | (0.85) |
| Total from investment operations | 4.48 | | (0.86) |
| Less distributions: | | | |
| From net investment income | (0.03) | | — |
| From net realized gain on investments | (0.73) | | — |
| Total distributions | (0.76) | | — |
| Net asset value at end of period | $ 18.56 | | $ 14.84 |
| Total investment return (b) | 30.76% | | (5.48)% |
| Ratios (to average net assets)/Supplemental Data: | | | |
| Net investment income (loss)†† | 0.01% | | (0.27)% |
| Net expenses†† (c) | 0.80% | | 0.80% |
| Expenses (before waiver/reimbursement)†† (c) | 0.94% | | 0.97% |
| Portfolio turnover rate | 15% | | 36% |
| Net assets at end of period (in 000’s) | $ 244 | | $ 24 |
| * | Unaudited. |
| ^ | Inception date. |
| ** | Based on the net asset value of Investor Class as of August 31, 2020. |
| †† | Annualized. |
| (a) | Per share data based on average shares outstanding during the period. |
| (b) | Total investment return is calculated exclusive of sales charges and assumes the reinvestment of dividends and distributions. SIMPLE Class shares are not subject to sales charges. For periods of less than one year, total return is not annualized. |
| (c) | In addition to the fees and expenses which the Fund bears directly, it also indirectly bears a pro-rata share of the fees and expenses of the underlying funds in which it invests. Such indirect expenses are not included in the above expense ratios. |
The notes to the financial statements are an integral part of, and should be read in conjunction with, the financial statements.
71
Notes to Financial Statements (Unaudited)
Note 1-Organization and Business
MainStay Funds Trust (the “Trust”) was organized as a Delaware statutory trust on April 28, 2009. The Trust is registered under the Investment Company Act of 1940, as amended (the “1940 Act”), as an open-end management investment company, and is comprised of thirty-two funds (collectively referred to as the “Funds” and each individually, referred to as a “Fund"). These financial statements and notes relate to the MainStay Conservative Allocation Fund, MainStay Moderate Allocation Fund, MainStay Growth Allocation Fund (formerly known as MainStay Moderate Growth Allocation Fund) and MainStay Equity Allocation Fund (formerly known as MainStay Growth Allocation Fund) (collectively referred to as the "Allocation Funds" and each individually referred to as an "Allocation Fund"). Each is a “diversified” fund, as that term is defined in the 1940 Act, as interpreted or modified by regulatory authorities having jurisdiction, from time to time.
The following table lists each Allocation Fund's share classes that have been registered and commenced operations:
| Fund | Share Classes Commenced Operations1 |
| MainStay Conservative Allocation Fund2 | Class A, Investor Class, Class B, Class C, Class I, Class R2, and Class R3 and SIMPLE Class |
| MainStay Moderate Allocation Fund2 | Class A, Investor Class, Class B, Class C, Class I, Class R2, and Class R3 and SIMPLE Class |
| MainStay Growth Allocation Fund | Class A, Investor Class, Class B, Class C, Class I, Class R2, and Class R3 and SIMPLE Class |
| MainStay Equity Allocation Fund2,3 | Class A, Investor Class, Class B, Class C, Class I, Class R2, and Class R3 and SIMPLE Class |
| 1. | For each Allocation Fund, Class R6 shares were registered for sale effective as of February 28, 2020, but as of April 30, 2021 were not yet offered for sale. |
| 2. | For the MainStay Conservative Allocation Fund, MainStay Moderate Allocation Fund and MainStay Equity Allocation, Class R1 shares were registered for sale as of February 28, 2019, but as of April 30, 2021 were not yet offered for sale. |
| 3. | For the MainStay Equity Allocation Fund, Class R2 shares were registered for sale effective February 28, 2019, but as of April 30, 2021 were not yet offered for sale. |
Class B shares of the MainStay Group of Funds are closed to all new purchases as well as additional investments by existing Class B shareholders. Existing Class B shareholders may continue to reinvest dividends and capital gains distributions, as well as exchange their Class B shares for Class B shares of other funds in the MainStay Group of Funds as permitted by the current exchange privileges. Class B shareholders continue to be subject to any applicable contingent deferred sales charge ("CDSC") at the time of redemption. All other features of the Class B shares, including but not limited to the fees and expenses applicable to Class B shares, remain unchanged. Unless redeemed, Class B shareholders will remain in Class B shares of their respective fund until the Class B shares are converted to Class A or Investor Class shares pursuant to the applicable conversion schedule.
Class A and Investor Class shares are offered at net asset value (“NAV”) per share plus an initial sales charge. No initial sales charge applies to investments of $250,000 or more (and certain other qualified purchases) in Class A and Investor Class shares. However, a CDSC of 1.00% may be imposed on certain redemptions made within 18 months of the date of
purchase on shares that were purchased without an initial sales charge. Class C shares are offered at NAV without an initial sales charge, although a CDSC of 1.00% may be imposed on certain redemptions of such shares made within one year of the date of purchase of Class C shares. When Class B shares were offered, they were offered at NAV without an initial sales charge, although a CDSC that declines depending on the number of years a shareholder held its Class B shares may be imposed on certain redemptions of such shares made within six years of the date of purchase of such shares. Class I, Class R1, Class R2, Class R3 and SIMPLE Class shares are offered at NAV without a sales charge. Depending upon eligibility, Class B shares convert to either Class A or Investor Class shares at the end of the calendar quarter eight years after the date they were purchased. In addition, depending upon eligibility, Class C shares convert to either Class A or Investor Class shares at the end of the calendar quarter ten years after the date they were purchased. Additionally, Investor Class shares may convert automatically to Class A shares. SIMPLE Class shares convert to Class A shares, or Investor Class shares if you are not eligible to hold Class A shares, at the end of the calendar quarter, ten years after the date they were purchased. Share class conversions are based on the relevant NAVs of the two classes at the time of the conversion, and no sales load or other charge is imposed. Under certain circumstances and as may be permitted by the Trust’s multiple class plan pursuant to Rule 18f-3 under the 1940 Act, specified share classes of an Allocation Fund may be converted to one or more other share classes of the Allocation Funds as disclosed in the capital share transactions within these Notes. The classes of shares have the same voting (except for issues that relate solely to one class), dividend, liquidation and other rights, and the same terms and conditions, except that under distribution plans pursuant to Rule 12b-1 under the 1940 Act, Class B and Class C shares are subject to higher distribution and/or service fees than Class A, Investor Class, Class R2, Class R3 and SIMPLE Class shares. Class I and Class R1 shares are not subject to a distribution and/or service fee. Class R1, Class R2 and Class R3 shares are subject to a shareholder service fee, which is in addition to fees paid under the distribution plans for Class R2 and Class R3 shares.
The investment objective for each of the Allocation Funds is as follows:
The MainStay Conservative Allocation Fund seeks current income and, secondarily, long-term growth of capital.
The MainStay Moderate Allocation Fund seeks long-term growth of capital and, secondarily, current income.
The MainStay Growth Allocation Fund seeks seeks long-term growth of capital and, secondarily, current income.
The MainStay Equity Allocation Fund seeks long-term growth of capital.
The Allocation Funds are "funds-of-funds" that seek to achieve their investment objectives by investing primarily in mutual funds and exchange-traded funds (“ETFs”) managed by New York Life Investment Management LLC (“New York Life Investments” or “Manager”) or its
| 72 | MainStay Asset Allocation Funds |
affiliates (the “Underlying Funds”). The MainStay Equity Allocation Fund invests, under normal circumstances, at least 80% of its assets (net assets plus any borrowings for investment purposes) in Underlying Equity Funds.
Note 2–Significant Accounting Policies
The Allocation Funds are investment companies and accordingly follow the investment company accounting and reporting guidance of the Financial Accounting Standards Board (“FASB”) Accounting Standard Codification Topic 946 Financial Services—Investment Companies. The Allocation Funds prepare their financial statements in accordance with generally accepted accounting principles (“GAAP”) in the United States of America and follow the significant accounting policies described below.
(A) Securities Valuation. Investments are usually valued as of the close of regular trading on the New York Stock Exchange (the "Exchange") (usually 4:00 p.m. Eastern time) on each day the Allocation Funds are open for business ("valuation date").
The Board of Trustees of the Trust (the "Board") adopted procedures establishing methodologies for the valuation of each Allocation Fund's securities and other assets and delegated the responsibility for valuation determinations under those procedures to the Valuation Committee of the Trust (the “Valuation Committee”). The procedures state that, subject to the oversight of the Board and unless otherwise noted, the responsibility for the day-to-day valuation of portfolio assets (including fair value measurements for the Allocation Funds' assets and liabilities) rests with New York Life Investments. To assess the appropriateness of security valuations, the Manager, the Subadvisor or the Allocation Funds' third-party service provider, who is subject to oversight by the Manager, regularly compares prior day prices, prices on comparable securities and the sale prices to the prior and current day prices and challenges prices with changes exceeding certain tolerance levels with third-party pricing services or broker sources.
The Board authorized the Valuation Committee to appoint a Valuation Subcommittee (the “Subcommittee”) to establish the prices of securities for which market quotations are not readily available or the prices of which are not otherwise readily determinable under the procedures. The Subcommittee meets (in person, via electronic mail or via teleconference) on an as-needed basis. The Valuation Committee meets to ensure that actions taken by the Subcommittee were appropriate.
For those securities valued through either a standardized fair valuation methodology or a fair valuation measurement, the Subcommittee deals with such valuation and the Valuation Committee reviews and affirms, if appropriate, the reasonableness of the valuation based on such methodologies and measurements on a regular basis after considering information that is reasonably available and deemed relevant by the Valuation Committee. Any action taken by the Subcommittee with respect to the valuation of a portfolio security or other asset is submitted for review and ratification (if appropriate) to the Valuation Committee and the Board at the next regularly scheduled meeting.
"Fair value" is defined as the price an Allocation Fund would reasonably expect to receive upon selling an asset or liability in an orderly transaction to an independent buyer in the principal or most advantageous market for the asset or liability. Fair value measurements are determined within a framework that establishes a three-tier hierarchy that maximizes the use of observable market data and minimizes the use of unobservable inputs to establish a classification of fair value measurements for disclosure purposes. "Inputs" refer broadly to the assumptions that market participants would use in pricing the asset or liability, including assumptions about risk, such as the risk inherent in a particular valuation technique used to measure fair value using a pricing model and/or the risk inherent in the inputs for the valuation technique. Inputs may be observable or unobservable. Observable inputs reflect the assumptions market participants would use in pricing the asset or liability based on market data obtained from sources independent of each Allocation Fund. Unobservable inputs reflect each Allocation Fund’s own assumptions about the assumptions market participants would use in pricing the asset or liability based on the information available. The inputs or methodology used for valuing assets or liabilities may not be an indication of the risks associated with investing in those assets or liabilities. The three-tier hierarchy of inputs is summarized below.
| • | Level 1—quoted prices in active markets for an identical asset or liability |
| • | Level 2—other significant observable inputs (including quoted prices for a similar asset or liability in active markets, interest rates and yield curves, prepayment speeds, credit risk, etc.) |
| • | Level 3—significant unobservable inputs (including each Allocation Fund's own assumptions about the assumptions that market participants would use in measuring fair value of an asset or liability) |
The level of an asset or liability within the fair value hierarchy is based on the lowest level of an input, both individually and in the aggregate, that is significant to the fair value measurement. The aggregate value by input level of each Allocation Fund’s assets and liabilities as of April 30, 2021, is included at the end of each Allocation Fund’s Portfolio of Investments.
Exchange-traded funds (“ETFs”) are valued at the last quoted sales prices as of the close of regular trading on the relevant exchange on each valuation date. Securities that are not traded on the valuation date are valued at the mean of the last quoted bid and ask prices. Prices are normally taken from the principal market in which each security trades. These securities are generally categorized as Level 1 in the hierarchy.
Investments in mutual funds, including money market funds, are valued at their respective NAVs at the close of business each day on the valuation date. These securities are generally categorized as Level 1 in the hierarchy.
Swaps are marked to market daily based upon quotations from pricing agents, brokers or market makers. These securities are generally categorized as Level 2 in the hierarchy.
Notes to Financial Statements (Unaudited) (continued)
Total return swap contracts, which are arrangements to exchange a market-linked return for a periodic payment, are based on a notional principal amount. To the extent that the total return of the security, index or other financial measure underlying the transaction exceeds or falls short of the offsetting interest rate obligation, the Allocation Funds will receive a payment from or make a payment to the counterparty. Total return swap contracts are marked to market daily based upon quotations from market makers and these securities are generally categorized as Level 2 in the hierarchy.
Temporary cash investments acquired in excess of 60 days to maturity at the time of purchase are valued using the latest bid prices or using valuations based on a matrix system (which considers such factors as security prices, yields, maturities and ratings), both as furnished by independent pricing services. Temporary cash investments that mature in 60 days or less at the time of purchase ("Short-Term Investments") are valued using the amortized cost method of valuation, unless the use of such method would be inappropriate. The amortized cost method involves valuing a security at its cost on the date of purchase and thereafter assuming a constant amortization to maturity of the difference between such cost and the value on maturity date. Amortized cost approximates the current fair value of a security. Securities valued using the amortized cost method are not valued using quoted prices in an active market and are generally categorized as Level 2 in the hierarchy.
The information above is not intended to reflect an exhaustive list of the methodologies that may be used to value portfolio investments. The valuation procedures permit the use of a variety of valuation methodologies in connection with valuing portfolio investments. The methodology used for a specific type of investment may vary based on the market data available or other considerations. The methodologies summarized above may not represent the specific means by which portfolio investments are valued on any particular business day.
(B) Income Taxes. Each Allocation Fund is treated as a separate entity for federal income tax purposes. The Allocation Funds' policy is to comply with the requirements of the Internal Revenue Code of 1986, as amended (the “Internal Revenue Code”), applicable to regulated investment companies and to distribute all of its taxable income to the shareholders of each Allocation Fund within the allowable time limits.
The Manager evaluates each Allocation Fund’s tax positions to determine if the tax positions taken meet the minimum recognition threshold in connection with accounting for uncertainties in income tax positions taken or expected to be taken for the purposes of measuring and recognizing tax liabilities in the financial statements. Recognition of tax benefits of an uncertain tax position is permitted only to the extent the position is “more likely than not” to be sustained assuming examination by taxing authorities. The Manager analyzed the Allocation Funds' tax positions taken on federal, state and local income tax returns for all open tax years (for up to three tax years) and has concluded that no provisions for federal, state and local income tax are required in the Allocation Funds' financial statements. The Allocation Funds' federal, state and local income tax and federal excise tax returns for tax years for which the
applicable statutes of limitations have not expired are subject to examination by the Internal Revenue Service and state and local departments of revenue.
(C) Dividends and Distributions to Shareholders. Dividends and distributions are recorded on the ex-dividend date. The MainStay Moderate Allocation Fund, MainStay Growth Allocation Fund and MainStay Equity Allocation Fund each intend to declare and pay dividends from net investment income and distributions from net realized capital and currency gains, if any, at least annually. The MainStay Conservative Allocation Fund intends to declare and dividends from net investment income, if any, at least quarterly and distributions from net realized capital and currency gains, if any, at least annually. Unless a shareholder elects otherwise, all dividends and distributions are reinvested at NAV in the same class of shares of the respective Allocation Fund. Dividends and distributions to shareholders are determined in accordance with federal income tax regulations and may differ from determinations using GAAP.
(D) Security Transactions and Investment Income. The Allocation Funds record security transactions on the trade date. Realized gains and losses on security transactions are determined using the identified cost method. Dividends and distributions received by the Allocation Funds from the Underlying Funds are recorded on the ex-dividend date.
Investment income and realized and unrealized gains and losses on investments of the Allocation Funds are allocated pro rata to the separate classes of shares based upon their relative net assets on the date the income is earned or realized and unrealized gains and losses are incurred.
(E) Expenses. Expenses of the Trust are allocated to the individual Funds in proportion to the net assets of the respective Funds when the expenses are incurred, except where direct allocations of expenses can be made. Expenses (other than transfer agent expenses and fees incurred under the shareholder services plans and/or the distribution plans further discussed in Note 3(B)) are allocated to separate classes of shares pro rata based upon their relative net assets on the date the expenses are incurred. The expenses borne by the Allocation Funds, including those of related parties to the Allocation Funds, are shown in the Statement of Operations.
Additionally, the Allocation Funds may invest in mutual funds, which are subject to management fees and other fees that may cause the costs of investing in mutual funds to be greater than the costs of owning the underlying securities directly. These indirect expenses of mutual funds are not included in the amounts shown as expenses in the Statement of Operations or in the expense ratios included in the Financial Highlights.
(F) Use of Estimates. In preparing financial statements in conformity with GAAP, the Manager makes estimates and assumptions that affect the reported amounts and disclosures in the financial statements. Actual results could differ from those estimates and assumptions.
| 74 | MainStay Asset Allocation Funds |
(G) Swap Contracts. The Allocation Funds may enter into credit default, interest rate, equity, index and currency exchange rate swap contracts (“swaps”). In a typical swap transaction, two parties agree to exchange the future returns (or differentials in rates of future returns) earned or realized at periodic intervals on a particular investment or instrument based on a notional principal amount. Generally, the Allocation Funds will enter into a swap on a net basis, which means that the two payment streams under the swap are netted, with the Allocation Funds receiving or paying (as the case may be) only the net amount of the two payment streams. Therefore, the Allocation Funds' current obligation under a swap generally will be equal to the net amount to be paid or received under the swap, based on the relative value of notional positions attributable to each counterparty to the swap. The payments may be adjusted for transaction costs, interest payments, the amount of interest paid on the investment or instrument or other factors. Collateral, in the form of cash or securities, may be required to be held in segregated accounts with the custodian bank or broker in accordance with the terms of the swap. Swap agreements are privately negotiated in the over the counter (“OTC”) market and may be executed in a multilateral or other trade facilities platform, such as a registered commodities exchange (“centrally cleared swaps”).
Certain standardized swaps, including certain credit default and interest rate swaps, are subject to mandatory clearing and exchange-trading, and more types of standardized swaps are expected to be subject to mandatory clearing and exchange-trading in the future. The counterparty risk for exchange-traded and cleared derivatives is expected to be generally lower than for uncleared derivatives, but cleared contracts are not risk-free. In a cleared derivative transaction, the Allocation Funds typically enters into the transaction with a financial institution counterparty, and performance of the transaction is effectively guaranteed by a central clearinghouse, thereby reducing or eliminating the Allocation Funds' exposure to the credit risk of its original counterparty. The Allocation Funds will be required to post specified levels of margin with the clearinghouse or at the instruction of the clearinghouse; the margin required by a clearinghouse may be greater than the margin the Allocation Funds would be required to post in an uncleared transaction.
Swaps are marked to market daily based upon quotations from pricing agents, brokers, or market makers and the change in value, if any, is recorded as unrealized appreciation or depreciation. Any payments made or received upon entering into a swap would be amortized or accreted over the life of the swap and recorded as a realized gain or loss. Early termination of a swap is recorded as a realized gain or loss. Daily changes in valuation of centrally cleared swaps, if any, are recorded as a receivable or payable for the change in value as appropriate on the Statement of Assets and Liabilities.
The Allocation Funds bears the risk of loss of the amount expected to be received under a swap in the event of the default or bankruptcy of the swap counterparty. The Allocation Funds may be able to eliminate its exposure under a swap either by assignment or other disposition, or by entering into an offsetting swap with the same party or a similar
credit-worthy party. Swaps are not actively traded on financial markets. Entering into swaps involves elements of credit, market, and documentation risk in excess of the amounts recognized on the Statement of Assets and Liabilities. Such risks involve the possibilities that there will be no liquid market for these swaps, that the counterparty to the swaps may default on its obligation to perform or disagree as to the meaning of the contractual terms in the swaps and that there may be unfavorable changes in interest rates, the price of the index or the security underlying these transactions.
Equity Swaps (Total Return Swaps). Total return swap contracts are agreements between counterparties to exchange cash flow, one based on a market-linked return of an individual asset or group of assets (such as an index), and the other on a fixed or floating rate. As a total return swap, an equity swap may be structured in different ways. For example, when the Allocation Funds enters into a “long” equity swap, the counterparty may agree to pay the Allocation Funds the amount, if any, by which the notional amount of the equity swap would have increased in value had it been invested in a particular referenced security or securities, plus the dividends that would have been received on those securities. In return, the Allocation Funds will generally agree to pay the counterparty interest on the notional amount of the equity swap plus the amount, if any, by which that notional amount would have decreased in value had it been invested in such referenced security or securities, plus, in certain instances, commissions or trading spreads on the notional amounts. Therefore, the Allocation Funds' return on the equity swap generally should equal the gain or loss on the notional amount, plus dividends on the referenced security or securities less the interest paid by the Allocation Funds on the notional amount. Alternatively, when the Allocation Funds enters into a “short” equity swap, the counterparty will generally agree to pay the Allocation Funds the amount, if any, by which the notional amount of the equity swap would have decreased in value had the Allocation Funds sold a particular referenced security or securities short, less the dividend expense that the Allocation Funds would have incurred on the referenced security or securities, as adjusted for interest payments or other economic factors. In this situation, the Allocation Funds will generally be obligated to pay the amount, if any, by which the notional amount of the swap would have increased in value had it been invested directly in the referenced security or securities.
Equity swaps generally do not involve the delivery of securities or other referenced assets. Accordingly, the risk of loss with respect to equity swaps is normally limited to the net amount of payments that the Allocation Funds is contractually obligated to make. If the other party to an equity swap defaults, the Allocation Funds' risk of loss consists of the net amount of payments that the Allocation Funds is contractually entitled to receive, if any. The Allocation Funds will segregate cash or liquid assets, enter into offsetting transactions or use other measures permitted by applicable law to “cover” the Allocation Funds' current obligations. The Allocation Funds and New York Life Investments, however, believe these transactions do not constitute senior securities under the 1940 Act and, accordingly, will not treat them as being subject to the Allocation Funds' borrowing restrictions.
Notes to Financial Statements (Unaudited) (continued)
Equity swaps are derivatives and their value can be very volatile. The Allocation Funds may engage in total return swaps to gain exposure to emerging markets securities, along with offsetting long total return swap positions to maintain appropriate currency balances and risk exposures across all swap positions. To the extent that the Manager, or the Subadvisor do not accurately analyze and predict future market trends, the values or assets or economic factors, the Allocation Funds may suffer a loss, which may be substantial.
(H) LIBOR Replacement Risk. The Allocation Fund may invest in certain debt securities, derivatives or other financial instruments that utilize the London Interbank Offered Rate ("LIBOR"), as a “benchmark” or “reference rate” for various interest rate calculations. The United Kingdom Financial Conduct Authority, which regulates LIBOR, announced that after 2021 it will cease its active encouragement of banks to provide the quotations needed to sustain LIBOR. However, it is possible that certain LIBOR tenors may continue beyond 2021 and the most widely used LIBOR tenors may continue until mid-2023. As a result, it is anticipated that LIBOR will be discontinued or will no longer be sufficiently robust to be representative of its underlying market around that time. Although financial regulators and industry working groups have suggested alternative reference rates, such as European Interbank Offer Rate (“EURIBOR”), Sterling Overnight Interbank Average Rate (“SONIA”) and Secured Overnight Financing Rate (“SOFR”), there are challenges to converting certain contracts and transactions to a new benchmark and neither the full effects of the transition process nor its ultimate outcome is known. New York Life Investments is currently working to assess exposure and will modify contracts as necessary.
The elimination of LIBOR or changes to other reference rates or any other changes or reforms to the determination or supervision of reference rates could have an adverse impact on the market for, or value of, any securities or payments linked to those reference rates, which may adversely affect the Allocation Funds' performance and/or net asset value. Uncertainty and risk also remain regarding the willingness and ability of issuers and lenders to include revised provisions in new and existing contracts or instruments. Consequently, the transition away from LIBOR to other reference rates may lead to increased volatility and illiquidity in markets that are tied to LIBOR, fluctuations in values of LIBOR-related investments or investments in issuers that utilize LIBOR, increased difficulty in borrowing or refinancing and diminished effectiveness of hedging strategies, adversely affecting the Allocation Funds' performance. Furthermore, the risks associated with the expected discontinuation of LIBOR and transition may be exacerbated if the work necessary to effect an orderly transition to an alternative reference rate is not completed in a timely manner. Because the usefulness of LIBOR as a benchmark could deteriorate during the transition period, these effects could occur prior to the end of 2021 with respect to certain LIBOR tenors or mid-2023 for the remaining LIBOR tenors.
(I) Indemnifications. Under the Trust’s organizational documents, its officers and trustees are indemnified against certain liabilities that may arise out of performance of their duties to the Trust. Additionally, in the
normal course of business, the Allocation Funds enter into contracts with third-party service providers that contain a variety of representations and warranties and that may provide general indemnifications. The Allocation Funds' maximum exposure under these arrangements is unknown, as this would involve future claims that may be made against the Allocation Funds that have not yet occurred. The Manager believes that the risk of loss in connection with these potential indemnification obligations is remote. However, there can be no assurance that material liabilities related to such obligations will not arise in the future, which could adversely impact the Allocation Funds.
(J) Quantitative Disclosure of Derivative Holdings. The following tables show additional disclosures related to the Funds' derivative and hedging activities, including how such activities are accounted for and their effect on the Funds' financial positions, performance and cash flows.
The Allocation Funds entered into total return swap contracts to seek to enhance returns or reduce the risk of loss by hedging certain of the Allocation Funds' holdings. These derivatives are not accounted for as hedging instruments.
MainStay Conservative Allocation Fund
The effect of derivative instruments on the Statement of Operations for the six-month period ended April 30, 2021:
| Net Realized Gain (Loss) from: | Equity
Contracts
Risk | Total |
| Swap Contracts | $347,669 | $347,669 |
| Total Net Realized Gain (Loss) | $347,669 | $347,669 |
| Average Notional Amount | Total |
| Swap Contracts Long | $ 47,951,971 |
| Swap Contracts Short | $(22,448,892) |
MainStay Moderate Allocation Fund
The effect of derivative instruments on the Statement of Operations for the six-month period ended April 30, 2021:
| Net Realized Gain (Loss) from: | Equity
Contracts
Risk | Total |
| Swap Contracts | $1,311,631 | $1,311,631 |
| Total Net Realized Gain (Loss) | $1,311,631 | $1,311,631 |
| Average Notional Amount | Total |
| Swap Contracts Long | $ 85,790,528 |
| Swap Contracts Short | $(42,665,019) |
MainStay Growth Allocation Fund
| 76 | MainStay Asset Allocation Funds |
The effect of derivative instruments on the Statement of Operations for the six-month period ended April 30, 2021:
| Net Realized Gain (Loss) from: | Equity
Contracts
Risk | Total |
| Swap Contracts | $667,238 | $667,238 |
| Total Net Realized Gain (Loss) | $667,238 | $667,238 |
| Average Notional Amount | Total |
| Swap Contracts Long | $ 85,399,622 |
| Swap Contracts Short | $(41,211,907) |
MainStay Equity Allocation Fund
The effect of derivative instruments on the Statement of Operations for the six-month period ended April 30, 2021:
| Net Realized Gain (Loss) from: | Equity
Contracts
Risk | Total |
| Swap Contracts | $2,748,543 | $2,748,543 |
| Total Net Realized Gain (Loss) | $2,748,543 | $2,748,543 |
| Average Notional Amount | Total |
| Swap Contracts Long | $ 37,328,771 |
| Swap Contracts Short | $(20,501,477) |
Note 3–Fees and Related Party Transactions
(A) Manager. New York Life Investments, a registered investment adviser and an indirect, wholly-owned subsidiary of New York Life Insurance Company (“New York Life”), serves as the Allocation Funds' Manager, pursuant to an Amended and Restated Management Agreement (“Management Agreement”) and is responsible for the day-to-day portfolio management of the Allocation Funds. The Manager provides offices, conducts clerical, recordkeeping and bookkeeping services, and keeps most of the financial and accounting records required to be maintained by the Allocation Funds. Except for the portion of salaries and expenses that are the responsibility of the Allocation Funds, the Manager pays the salaries and expenses of all personnel affiliated with the Allocation Funds and certain operational expenses of the Allocation Funds. The Allocation Funds reimburse New York Life Investments in an amount equal to a portion of the compensation of the Chief Compliance Officer attributable to the Allocation Funds.
The Allocation Funds do not pay any fees to the Manager in return for the services performed under the Management Agreement. The Allocation Funds do, however, indirectly pay a proportionate share of the management fees paid to the managers of the Underlying Portfolios/Funds in which the Allocation Funds invest.
Notes to Financial Statements (Unaudited) (continued)
New York Life Investments has contractually agreed to waive fees and/or reimburse expenses so that Total Annual Fund Operating Expenses (excluding taxes, interest, litigation, extraordinary expenses, brokerage and other transaction expenses relating to the purchase and sale of portfolio investments, and acquired (underlying) fund fees and expenses) of a class do not exceed the following percentages of average daily net assets for each class:
| Fund | Class A | Investor Class | Class B | Class C | Class I | Class R1 | Class R2 | Class R3 | SIMPLE Class |
| MainStay Conservative Allocation Fund | 0.50% | 0.55% | 1.30% | 1.30% | 0.25% | 0.35% | 0.60% | 0.85% | 0.80% |
| MainStay Moderate Allocation Fund | 0.50 | 0.55 | 1.30 | 1.30 | 0.25 | 0.35 | 0.60 | 0.85 | 0.80 |
| MainStay Growth Allocation Fund | 0.50 | 0.55 | 1.30 | 1.30 | 0.25 | 0.35 | 0.60 | 0.85 | 0.80 |
| MainStay Equity Allocation Fund | 0.50 | 0.55 | 1.30 | 1.30 | 0.25 | 0.35 | 0.00 | 0.85 | 0.80 |
This agreement will remain in effect until February 28, 2022, and shall renew automatically for one-year terms unless New York Life Investments provides written notice of termination prior to the start of the next term or upon approval of the Board.
During the six-month period ended April 30, 2021, New York Life Investments waived its fees and/or reimbursed expenses of the Allocation Funds as follows:
| Fund | Total |
| MainStay Conservative Allocation Fund | $ 26,496 |
| MainStay Moderate Allocation Fund | 90,487 |
| MainStay Growth Allocation Fund | 113,417 |
| MainStay Equity Allocation Fund | 84,029 |
JPMorgan provides sub-administration and sub-accounting services to the Allocation Funds pursuant to an agreement with New York Life Investments. These services include calculating the daily NAVs of the Allocation Funds, maintaining the general ledger and sub-ledger accounts for the calculation of the Allocation Funds' respective NAVs, and assisting New York Life Investments in conducting various aspects of the Allocation Funds' administrative operations. For providing these services to the Allocation Funds, JPMorgan is compensated by New York Life Investments.
Prior to November 23, 2020, these services were provided by State Street Bank and Trust Company ("State Street").
Pursuant to an agreement between the Trust and New York Life Investments, New York Life Investments is responsible for providing or procuring certain regulatory reporting services for the Allocation Funds. The Allocation Funds will reimburse New York Life Investments for the actual costs incurred by New York Life Investments in connection with providing or procuring these services for the Allocation Funds.
(B) Distribution, Service and Shareholder Service Fees. The Trust, on behalf of the Allocation Funds, has entered into a distribution agreement with NYLIFE Distributors LLC (the “Distributor”), an affiliate of New York Life Investments. The Allocation Funds have adopted distribution plans (the “Plans”) in accordance with the provisions of Rule 12b-1 under the 1940 Act.
Pursuant to the Class A, Investor Class and Class R2 Plans, the Distributor receives a monthly distribution fee from the Class A, Investor Class and Class R2 shares at an annual rate of 0.25% of the average daily net assets of the Class A, Investor Class and Class R2 shares for distribution and/or service activities as designated by the Distributor. Pursuant to the Class B and Class C Plans, Class B and Class C shares pay the Distributor a monthly distribution fee at an annual rate of 0.75%of the average daily net assets of the Class B and Class C shares, along with a service fee at an annual rate of 0.25% of the average daily net assets of the Class B and Class C shares, for a total 12b-1 fee of 1.00%. Pursuant to the Class R3 and SIMPLE Class Plans, Class R3 and SIMPLE Class shares pay the Distributor a monthly fee at an annual rate of 0.25% of the average daily net assets of the Class R3 and SIMPLE Class shares, along with a service fee at an annual rate of 0.25% of the average daily net assets of the Class R3 and SIMPLE Class shares, for a total 12b-1fee of 0.50%. Class I and Class R1 shares are not subject to a distribution and/or service fee.
The Plans provide that the distribution and service fees are payable to the Distributor regardless of the amounts actually expended by the Distributor for distribution of the Allocation Funds' shares and service activities.
In accordance with the Shareholder Services Plans for the Class R1, Class R2 and Class R3 shares, the Manager has agreed to provide, through its affiliates or independent third parties, various shareholder and administrative support services to shareholders of the Class R1, Class R2 and Class R3 shares. For its services, the Manager, its affiliates or independent third-party service providers are entitled to a shareholder service fee accrued daily and paid monthly at an annual rate of 0.10% of the average daily net assets of the Class R1, Class R2 and Class R3 shares. This is in addition to any fees paid under the Class R2 and Class R3 Plans.
During the six-month period ended April 30, 2021, shareholder service fees incurred by the Fund were as follows:
| MainStay Conservative Allocation Fund |
| Class R2 | $ 59 |
| Class R3 | 670 |
| |
| 78 | MainStay Asset Allocation Funds |
| MainStay Moderate Allocation Fund |
| Class R2 | $ 78 |
| Class R3 | 545 |
| |
| MainStay Growth Allocation Fund |
| Class R1 | $ 20 |
| Class R2 | 50 |
| Class R3 | 639 |
| |
| MainStay Equity Allocation Fund |
| Class R3 | $ 864 |
(C) Sales Charges. The Allocation Funds were advised by the Distributor that the amount of initial sales charges retained on sales of each class of shares during the six-month period ended April 30, 2021, was as follows:
| MainStay Conservative Allocation Fund | |
| Class A | $ 19,806 |
| Investor Class | 7,713 |
| |
| MainStay Moderate Allocation Fund | |
| Class A | $ 36,063 |
| Investor Class | 25,175 |
| |
| MainStay Growth Allocation Fund | |
| Class A | $ 36,590 |
| Investor Class | 24,470 |
| |
| MainStay Equity Allocation Fund | |
| Class A | $ 20,755 |
| Investor Class | 16,508 |
The Allocation Funds were also advised that the Distributor retained CDSCs on redemptions of Class A, Investor Class, Class B and Class C shares during the six-month period ended April 30, 2021, as follows:
| MainStay Conservative Allocation Fund | |
| Class A | $ 4,007 |
| Class B | 3,290 |
| Class C | 967 |
| |
| MainStay Moderate Allocation Fund | |
| Class A | $ 7,064 |
| Investor Class | 19 |
| Class B | 6,217 |
| Class C | 666 |
| |
| MainStay Growth Allocation Fund | |
| Class A | $ 2,777 |
| Investor Class | 18 |
| Class B | 4,121 |
| Class C | 1,566 |
| |
| MainStay Equity Allocation Fund | |
| Class A | $ 507 |
| Investor Class | 1 |
| Class B | 12,369 |
| Class C | 4,130 |
(D) Transfer, Dividend Disbursing and Shareholder Servicing Agent. NYLIM Service Company LLC, an affiliate of New York Life Investments, is the Allocation Funds’ transfer, dividend disbursing and shareholder servicing agent pursuant to an agreement between NYLIM Service Company LLC and the Trust. NYLIM Service Company LLC has entered into an agreement with DST Asset Manager Solutions, Inc. ("DST"), pursuant to which DST performs certain transfer agent services on behalf of NYLIM Service Company LLC. New York Life Investments has contractually agreed to limit the transfer agency expenses charged to each of the Fund’s share classes to a maximum of 0.35% of that share class’s average daily net assets on an annual basis after deducting any applicable Fund or class-level expense reimbursement or small account fees. This agreement will remain in effect until August 31, 2021 for SIMPLE Class shares and February 28, 2021 for all other share classes, and shall renew automatically for one-year terms unless New York Life Investments provides written notice of termination prior to the start of the next term or upon approval of the Board. During the six-month period ended April 30, 2021, transfer agent expenses incurred by the Allocation Funds and any reimbursements, pursuant to the aforementioned Transfer Agency expense limitation agreement, were as follows:
| MainStay Conservative Allocation Fund | Expense | Waived |
| Class A | $ 91,533 | $ — |
| Investor Class | 61,982 | — |
| Class B | 19,237 | — |
| Class C | 52,272 | — |
| Class I | 2,047 | — |
| Class R2 | 28 | — |
| Class R3 | 320 | — |
| SIMPLE Class | 127 | — |
Notes to Financial Statements (Unaudited) (continued)
| MainStay Moderate Allocation Fund | Expense | Waived |
| Class A | $ 155,252 | $ — |
| Investor Class | 187,686 | — |
| Class B | 56,673 | — |
| Class C | 64,375 | — |
| Class I | 2,333 | — |
| Class R2 | 39 | — |
| Class R3 | 268 | — |
| SIMPLE Class | 385 | — |
| MainStay Growth Allocation Fund | Expense | Waived |
| Class A | $ 180,432 | $ — |
| Investor Class | 240,177 | — |
| Class B | 62,693 | — |
| Class C | 60,887 | — |
| Class I | 2,779 | — |
| Class R1 | 11 | — |
| Class R2 | 29 | — |
| Class R3 | 368 | — |
| SIMPLE Class | 913 | — |
| MainStay Equity Allocation Fund | Expense | Waived |
| Class A | $ 103,286 | $ — |
| Investor Class | 146,117 | — |
| Class B | 39,515 | — |
| Class C | 32,517 | — |
| Class I | 1,871 | — |
| Class R3 | 570 | — |
| SIMPLE Class | 214 | — |
(E) Small Account Fee. Shareholders with small accounts adversely impact the cost of providing transfer agency services. In an effort to reduce total transfer agency expenses, the Fund has implemented a small account fee on certain types of accounts. As described in the Fund's prospectus, certain shareholders with an account balance of less than $1,000 ($5,000 for Class A share accounts) are charged an annual per account fee of $20 (assessed semi-annually), the proceeds from which offset transfer agent fees as reflected in the Statement of Operations. This small account fee will not apply to certain types of accounts as described further in the Fund’s prospectus.
| 80 | MainStay Asset Allocation Funds |
(F) Investments in Affiliates (in 000’s). During the six-month period ended April 30, 2021, purchases and sales transactions, income earned from investments and shares held of investment companies managed by New York Life Investments or its affiliates were as follows:
| MainStay Conservative Allocation Fund |
| Affiliated Investment Companies | Value,
Beginning
of Period | Purchases
at Cost | Proceeds
from
Sales | Net
Realized
Gain/(Loss)
on Sales | Change in
Unrealized
Appreciation/
(Depreciation) | Value,
End of
Period | Dividend
Income | Other
Distributions | Shares
End of
Period |
| IQ 50 Percent Hedged FTSE International ETF | $ 8,944 | $ 57 | $ (1,302) | $ 148 | $ 2,162 | $ 10,009 | $ 97 | $ — | 411 |
| IQ 500 International ETF | 7,613 | 203 | (1,929) | 47 | 2,621 | 8,555 | 86 | — | 263 |
| IQ Candriam ESG International Equity ETF | 7,577 | — | (964) | 178 | 1,823 | 8,614 | 66 | — | 295 |
| IQ Candriam ESG U.S. Equity ETF | 13,323 | 195 | (1,142) | 145 | 3,421 | 15,942 | 89 | — | 449 |
| IQ Chaikin U.S. Large Cap ETF | 9,398 | 125 | (1,097) | 195 | 2,758 | 11,379 | 82 | — | 350 |
| IQ Chaikin U.S. Small Cap ETF | 9,665 | 69 | (3,699) | 663 | 4,251 | 10,949 | 80 | — | 312 |
| IQ S&P High Yield Low Volatility Bond ETF | 4,659 | 304 | (45) | — | 35 | 4,953 | 90 | — | 198 |
| Mainstay Candriam Emerging Markets Equity Fund Class R6 | 7,199 | 343 | (1,793) | 480 | 1,298 | 7,527 | 38 | — | 558 |
| MainStay Epoch Capital Growth Fund Class I | 2 | 1,696 | (122) | 10 | 236 | 1,822 | —(a) | — | 117 |
| MainStay Epoch International Choice Fund Class I | 4,624 | 37 | (580) | 121 | 924 | 5,126 | 37 | — | 124 |
| MainStay Epoch U.S. Equity Yield Fund Class R6 | 9,395 | 138 | (1,356) | 165 | 2,130 | 10,472 | 127 | — | 551 |
| MainStay Floating Rate Fund Class R6 | 14,005 | 7,972 | (171) | (1) | 449 | 22,254 | 236 | — | 2,438 |
| MainStay MacKay International Equity Fund Class R6 | 4,360 | 674 | (1,382) | 109 | 750 | 4,511 | 6 | 188 | 204 |
| MainStay MacKay S&P 500 Index Fund Class I | 18,660 | 3,860 | (7,744) | 915 | 2,630 | 18,321 | 275 | 1,536 | 333 |
| MainStay MacKay Short Duration High Yield Fund Class I | 34,288 | 4,657 | (540) | (4) | 1,478 | 39,879 | 890 | — | 4,045 |
| MainStay MacKay Total Return Bond Fund Class R6 | 230,371 | 8,391 | (25,731) | 1,051 | (4,909) | 209,173 | 2,754 | 2,584 | 18,774 |
| MainStay Short Term Bond Fund Class I | — | 2,505 | (13) | — | (10) | 2,482 | 8 | — | 252 |
| MainStay U.S. Government Liquidity Fund | 9,631 | 53,084 | (26,959) | — | — | 35,756 | 1 | — | 35,756 |
| MainStay Winslow Large Cap Growth Fund Class R6 | 16,373 | 1,125 | (1,557) | 472 | 2,478 | 18,891 | — | 826 | 1,295 |
| Mainstay WMC Enduring Capital Fund Class R6(b)(c)(d) | 10,038 | 7,240 | (2,676) | 603 | (1,669) | 13,536 | 32 | 4,645 | 409 |
| Mainstay WMC Growth Fund Class R6(e)(f) | 9,849 | 3,657 | (5,190) | 1,962 | (330) | 9,948 | — | 294 | 188 |
| Mainstay WMC International Research Equity Fund Class I(g) | 4,680 | 798 | (1,481) | (172) | 1,172 | 4,997 | 111 | — | 626 |
| Mainstay WMC Small Companies Fund Class I(h) | 10,291 | 58 | (3,656) | 917 | 3,323 | 10,933 | — | — | 322 |
| Mainstay WMC Value Fund Class R6(i)(j) | 10,639 | 440 | (2,228) | 761 | 2,433 | 12,045 | 87 | 353 | 223 |
| | $ 455,584 | $ 97,628 | $ (93,357) | $ 8,765 | $ 29,454 | $ 498,074 | $ 5,192 | $ 10,426 | |
| (a) | Less than $500. |
| (b) | Prior to March 5, 2021, known as MainStay MacKay Common Stock Fund Class I. |
| (c) | As of April 23, 2021, the Fund exchanged in a nontaxable transfer of all shares of the MainStay Epoch U.S. All Cap Fund Class R6 into the newly launched MainStay WMC Enduring Capital Fund Class R6. |
| (d) | As of April 26, 2021, the Fund exchanged in a nontaxable transfer of all shares of the MainStay WMC Enduring Capital Fund Class I into the newly launched MainStay WMC Enduring Capital Fund Class R6. |
| (e) | Prior to March 5, 2021, known as MainStay MacKay Growth Fund Class I. |
| (f) | As of April 26, 2021, the Fund exchanged in a nontaxable transfer of all shares of the MainStay WMC Growth Fund Class I into the newly launched MainStay WMC Growth Fund Class R6. |
| (g) | Prior to March 5, 2021, known as MainStay MacKay International Opportunities Fund Class I. |
| (h) | Prior to March 5, 2021, known as MainStay MacKay Small Cap Core Fund Class I. |
| (i) | Prior to April 26, 2021, known as MainStay MAP Equity Fund Class I. |
| (j) | As of April 26, 2021, the Fund exchanged in a nontaxable transfer of all shares of the MainStay WMC Value Fund Class I into the newly launched MainStay WMC Value Fund Class R6. |
Notes to Financial Statements (Unaudited) (continued)
| MainStay Moderate Allocation Fund |
| Affiliated Investment Companies | Value,
Beginning
of Period | Purchases
at Cost | Proceeds
from
Sales | Net
Realized
Gain/(Loss)
on Sales | Change in
Unrealized
Appreciation/
(Depreciation) | Value,
End of
Period | Dividend
Income | Other
Distributions | Shares
End of
Period |
| IQ 50 Percent Hedged FTSE International ETF | $ 14,168 | $ 6 | $ (944) | $ 150 | $ 3,625 | $ 17,005 | $ 165 | $ — | 699 |
| IQ 500 International ETF | 18,928 | 253 | (4,403) | 139 | 6,575 | 21,492 | 227 | — | 662 |
| IQ Candriam ESG International Equity ETF | 13,712 | 3,848 | — | — | 3,983 | 21,543 | 149 | — | 738 |
| IQ Candriam ESG U.S. Equity ETF | 27,384 | 4,748 | (525) | 21 | 7,972 | 39,600 | 210 | — | 1,114 |
| IQ Chaikin U.S. Large Cap ETF | 27,753 | — | (4,069) | 734 | 7,821 | 32,239 | 235 | — | 992 |
| IQ Chaikin U.S. Small Cap ETF | 21,009 | 1,474 | (4,611) | 1,122 | 10,839 | 29,833 | 208 | — | 851 |
| IQ S&P High Yield Low Volatility Bond ETF | 7,701 | 699 | (54) | — | 56 | 8,402 | 151 | — | 336 |
| Mainstay Candriam Emerging Markets Equity Fund Class R6 | 22,491 | 1,132 | (7,791) | 2,147 | 3,300 | 21,279 | 113 | — | 1,579 |
| MainStay Epoch Capital Growth Fund Class I | 530 | 2,550 | (423) | 129 | 284 | 3,070 | 1 | 58 | 198 |
| MainStay Epoch International Choice Fund Class I | 15,616 | 124 | (3,556) | 1,006 | 2,422 | 15,612 | 123 | — | 377 |
| MainStay Epoch U.S. Equity Yield Fund Class R6 | 27,992 | 352 | (7,216) | 859 | 5,568 | 27,555 | 353 | — | 1,450 |
| MainStay Floating Rate Fund Class R6 | 3,845 | 12,983 | (92) | — | 113 | 16,849 | 97 | — | 1,846 |
| MainStay MacKay International Equity Fund Class R6 | 11,058 | 3,156 | (2,369) | 34 | 2,228 | 14,107 | 16 | 463 | 638 |
| MainStay MacKay S&P 500 Index Fund Class I | 47,832 | 10,701 | (13,616) | 1,577 | 7,862 | 54,356 | 710 | 3,975 | 988 |
| MainStay MacKay Short Duration High Yield Fund Class I | 37,402 | 7,913 | (392) | (3) | 1,591 | 46,511 | 993 | — | 4,718 |
| MainStay MacKay Total Return Bond Fund Class R6 | 265,676 | 11,176 | (44,212) | 1,855 | (6,080) | 228,415 | 3,087 | 2,989 | 20,501 |
| MainStay Short Term Bond Fund Class I | — | 4,244 | (18) | — | (16) | 4,210 | 13 | — | 427 |
| MainStay U.S. Government Liquidity Fund | 14,013 | 96,406 | (42,130) | — | — | 68,289 | 2 | — | 68,289 |
| MainStay Winslow Large Cap Growth Fund Class R6 | 43,159 | 2,089 | (6,280) | 1,917 | 5,538 | 46,423 | — | 2,089 | 3,183 |
| Mainstay WMC Enduring Capital Fund Class R6(a)(b)(c) | 31,027 | 20,950 | (9,413) | 2,311 | (5,221) | 39,654 | 101 | 13,813 | 1,200 |
| Mainstay WMC Growth Fund Class R6(d)(e) | 24,880 | 6,495 | (12,982) | 4,745 | (558) | 22,580 | — | 820 | 428 |
| Mainstay WMC International Research Equity Fund Class I(f) | 15,520 | 1,920 | (5,373) | (93) | 3,396 | 15,370 | 371 | — | 1,926 |
| Mainstay WMC Small Companies Fund Class I(g) | 22,981 | 228 | (2,721) | 661 | 9,833 | 30,982 | — | — | 912 |
| Mainstay WMC Value Fund Class R6(h)(i) | 32,019 | 1,262 | (9,594) | 3,500 | 5,527 | 32,714 | 249 | 1,012 | 605 |
| | $ 746,696 | $ 194,709 | $ (182,784) | $ 22,811 | $ 76,658 | $ 858,090 | $ 7,574 | $ 25,219 | |
| (a) | Prior to March 5, 2021, known as MainStay MacKay Common Stock Fund Class I. |
| (b) | As of April 23, 2021, the Fund exchanged in a nontaxable transfer of all shares of the MainStay Epoch U.S. All Cap Fund Class R6 into the newly launched MainStay WMC Enduring Capital Fund Class R6. |
| (c) | As of April 26, 2021, the Fund exchanged in a nontaxable transfer of all shares of the MainStay WMC Enduring Capital Fund Class I into the newly launched MainStay WMC Enduring Capital Fund Class R6. |
| (d) | Prior to March 5, 2021, known as MainStay MacKay Growth Fund Class I. |
| (e) | As of April 26, 2021, the Fund exchanged in a nontaxable transfer of all shares of the MainStay WMC Growth Fund Class I into the newly launched MainStay WMC Growth Fund Class R6. |
| (f) | Prior to March 5, 2021, known as MainStay MacKay International Opportunities Fund Class I. |
| (g) | Prior to March 5, 2021, known as MainStay MacKay Small Cap Core Fund Class I. |
| (h) | Prior to April 26, 2021, known as MainStay MAP Equity Fund Class I. |
| (i) | As of April 26, 2021, the Fund exchanged in a nontaxable transfer of all shares of the MainStay WMC Value Fund Class I into the newly launched MainStay WMC Value Fund Class R6. |
| 82 | MainStay Asset Allocation Funds |
| MainStay Growth Allocation Fund |
| Affiliated Investment Companies | Value,
Beginning
of Period | Purchases
at Cost | Proceeds
from
Sales | Net
Realized
Gain/(Loss)
on Sales | Change in
Unrealized
Appreciation/
(Depreciation) | Value,
End of
Period | Dividend
Income | Other
Distributions | Shares
End of
Period |
| IQ 50 Percent Hedged FTSE International ETF | $ 14,407 | $ 4 | $ (145) | $ 24 | $ 3,833 | $ 18,123 | $ 171 | $ — | 745 |
| IQ 500 International ETF | 24,478 | — | (2,443) | 71 | 8,929 | 31,035 | 318 | — | 956 |
| IQ Candriam ESG International Equity ETF | 14,193 | 7,479 | — | — | 4,100 | 25,772 | 154 | — | 882 |
| IQ Candriam ESG U.S. Equity ETF | 29,470 | 15,662 | — | — | 9,806 | 54,938 | 276 | — | 1,546 |
| IQ Chaikin U.S. Large Cap ETF | 35,923 | 5 | (919) | 131 | 11,380 | 46,520 | 325 | — | 1,432 |
| IQ Chaikin U.S. Small Cap ETF | 27,568 | 17 | (408) | 77 | 15,056 | 42,310 | 268 | — | 1,208 |
| IQ S&P High Yield Low Volatility Bond ETF | 7,704 | 966 | — | — | 53 | 8,723 | 154 | — | 349 |
| Mainstay Candriam Emerging Markets Equity Fund Class R6 | 31,723 | 170 | (7,990) | 2,107 | 5,836 | 31,846 | 170 | — | 2,362 |
| MainStay Epoch Capital Growth Fund Class I | 1,017 | 2,321 | (570) | 170 | 250 | 3,188 | 3 | 112 | 205 |
| MainStay Epoch International Choice Fund Class I | 23,796 | 189 | (4,371) | 1,222 | 4,118 | 24,954 | 189 | — | 602 |
| MainStay Epoch U.S. Equity Yield Fund Class R6 | 38,662 | 493 | (9,120) | 847 | 8,202 | 39,084 | 493 | — | 2,057 |
| MainStay Floating Rate Fund Class R6 | 3,851 | 13,619 | (91) | — | 113 | 17,492 | 100 | — | 1,917 |
| MainStay MacKay International Equity Fund Class R6 | 16,601 | 740 | (73) | 11 | 3,354 | 20,633 | 23 | 665 | 933 |
| MainStay MacKay S&P 500 Index Fund Class I | 60,921 | 16,084 | (12,496) | 932 | 11,645 | 77,086 | 918 | 5,143 | 1,400 |
| MainStay MacKay Short Duration High Yield Fund Class I | 37,411 | 9,325 | (38) | — | 1,589 | 48,287 | 1,004 | — | 4,898 |
| MainStay MacKay Total Return Bond Fund Class R6 | 112,354 | 4,024 | (53,843) | 1,736 | (2,875) | 61,396 | 1,055 | 1,217 | 5,511 |
| MainStay Short Term Bond Fund Class I | — | 4,395 | (7) | — | (17) | 4,371 | 14 | — | 443 |
| MainStay U.S. Government Liquidity Fund | 13,548 | 120,828 | (66,833) | — | — | 67,543 | 2 | — | 67,543 |
| MainStay Winslow Large Cap Growth Fund Class R6 | 60,469 | 2,974 | (6,052) | 1,507 | 9,147 | 68,045 | — | 2,974 | 4,666 |
| Mainstay WMC Enduring Capital Fund Class R6(a)(b)(c) | 43,730 | 30,342 | (12,485) | 2,773 | (7,032) | 57,328 | 143 | 19,921 | 1,734 |
| Mainstay WMC Growth Fund Class R6(d)(e) | 34,937 | 4,879 | (17,272) | 6,000 | 45 | 28,589 | — | 1,208 | 541 |
| Mainstay WMC International Research Equity Fund Class I(f) | 23,440 | 583 | (5,934) | 291 | 4,830 | 23,210 | 566 | — | 2,908 |
| Mainstay WMC Small Companies Fund Class I(g) | 42,756 | — | (16,187) | 7,316 | 10,403 | 44,288 | — | — | 1,304 |
| Mainstay WMC Value Fund Class R6(h)(i) | 44,370 | 1,781 | (11,963) | 4,256 | 8,619 | 47,063 | 352 | 1,428 | 870 |
| | $ 743,329 | $ 236,880 | $ (229,240) | $ 29,471 | $ 111,384 | $ 891,824 | $ 6,698 | $ 32,668 | |
| (a) | Prior to March 5, 2021, known as MainStay MacKay Common Stock Fund Class I. |
| (b) | As of April 23, 2021, the Fund exchanged in a nontaxable transfer of all shares of the MainStay Epoch U.S. All Cap Fund Class R6 into the newly launched MainStay WMC Enduring Capital Fund Class R6. |
| (c) | As of April 26, 2021, the Fund exchanged in a nontaxable transfer of all shares of the MainStay WMC Enduring Capital Fund Class I into the newly launched MainStay WMC Enduring Capital Fund Class R6. |
| (d) | Prior to March 5, 2021, known as MainStay MacKay Growth Fund Class I. |
| (e) | As of April 26, 2021, the Fund exchanged in a nontaxable transfer of all shares of the MainStay WMC Growth Fund Class I into the newly launched MainStay WMC Growth Fund Class R6. |
| (f) | Prior to March 5, 2021, known as MainStay MacKay International Opportunities Fund Class I. |
| (g) | Prior to March 5, 2021, known as MainStay MacKay Small Cap Core Fund Class I. |
| (h) | Prior to April 26, 2021, known as MainStay MAP Equity Fund Class I. |
| (i) | As of April 26, 2021, the Fund exchanged in a nontaxable transfer of all shares of the MainStay WMC Value Fund Class I into the newly launched MainStay WMC Value Fund Class R6. |
Notes to Financial Statements (Unaudited) (continued)
| MainStay Equity Allocation Fund |
| Affiliated Investment Companies | Value,
Beginning
of Period | Purchases
at Cost | Proceeds
from
Sales | Net
Realized
Gain/(Loss)
on Sales | Change in
Unrealized
Appreciation/
(Depreciation) | Value,
End of
Period | Dividend
Income | Other
Distributions | Shares
End of
Period |
| IQ 50 Percent Hedged FTSE International ETF | $ 6,907 | $ 196 | $ (5) | $ 1 | $ 1,850 | $ 8,949 | $ 82 | $ — | 368 |
| IQ 500 International ETF | 17,072 | — | (3,889) | 194 | 5,910 | 19,287 | 206 | — | 594 |
| IQ Candriam ESG International Equity ETF | 5,869 | 10,597 | — | — | 2,010 | 18,476 | 88 | — | 633 |
| IQ Candriam ESG U.S. Equity ETF | 23,267 | 7,987 | — | — | 7,169 | 38,423 | 195 | — | 1,081 |
| IQ Chaikin U.S. Large Cap ETF | 20,433 | 3,423 | (10) | — | 6,826 | 30,672 | 198 | — | 944 |
| IQ Chaikin U.S. Small Cap ETF | 12,547 | 2,392 | (7) | 1 | 7,137 | 22,070 | 128 | — | 630 |
| Mainstay Candriam Emerging Markets Equity Fund Class R6 | 21,794 | 595 | (5,197) | 1,241 | 4,435 | 22,868 | 124 | — | 1,696 |
| MainStay Epoch Capital Growth Fund Class I | 135 | 1,416 | (97) | 27 | 194 | 1,675 | —(a) | 14 | 108 |
| MainStay Epoch International Choice Fund Class I | 14,397 | 116 | (1,795) | 503 | 2,777 | 15,998 | 116 | — | 386 |
| MainStay Epoch U.S. Equity Yield Fund Class R6 | 26,931 | 361 | (5,653) | 615 | 5,920 | 28,174 | 360 | — | 1,483 |
| MainStay MacKay International Equity Fund Class R6 | 13,318 | 552 | (1,778) | 232 | 2,439 | 14,763 | 18 | 533 | 667 |
| MainStay MacKay S&P 500 Index Fund Class I | 40,481 | 12,126 | (6,426) | 387 | 8,218 | 54,786 | 617 | 3,454 | 995 |
| MainStay U.S. Government Liquidity Fund | 11,905 | 45,504 | (41,497) | — | — | 15,912 | 1 | — | 15,912 |
| MainStay Winslow Large Cap Growth Fund Class R6 | 39,596 | 2,006 | (2,191) | 601 | 6,519 | 46,531 | — | 2,006 | 3,191 |
| Mainstay WMC Enduring Capital Fund Class R6(b)(c)(d) | 26,633 | 21,596 | (4,557) | 930 | (4,353) | 40,249 | 92 | 13,730 | 1,218 |
| Mainstay WMC Growth Fund Class R6(e)(f) | 22,236 | 1,358 | (9,527) | 3,159 | 669 | 17,895 | — | 767 | 339 |
| Mainstay WMC International Research Equity Fund Class I(g) | 14,605 | 549 | (3,182) | 332 | 2,929 | 15,233 | 352 | — | 1,909 |
| Mainstay WMC Small Companies Fund Class I(h) | 24,705 | — | (10,383) | 4,213 | 5,994 | 24,529 | — | — | 722 |
| Mainstay WMC Value Fund Class R6(i)(j) | 30,767 | 1,282 | (7,534) | 1,652 | 7,612 | 33,779 | 253 | 1,028 | 624 |
| | $ 373,598 | $ 112,056 | $ (103,728) | $ 14,088 | $ 74,255 | $ 470,269 | $ 2,830 | $ 21,532 | |
| (a) | Less than $500. |
| (b) | Prior to March 5, 2021, known as MainStay MacKay Common Stock Fund Class I. |
| (c) | As of April 23, 2021, the Fund exchanged in a nontaxable transfer of all shares of the MainStay Epoch U.S. All Cap Fund Class R6 into the newly launched MainStay WMC Enduring Capital Fund Class R6. |
| (d) | As of April 26, 2021, the Fund exchanged in a nontaxable transfer of all shares of the MainStay WMC Enduring Capital Fund Class I into the newly launched MainStay WMC Enduring Capital Fund Class R6. |
| (e) | Prior to March 5, 2021, known as MainStay MacKay Growth Fund Class I. |
| (f) | As of April 26, 2021, the Fund exchanged in a nontaxable transfer of all shares of the MainStay WMC Growth Fund Class I into the newly launched MainStay WMC Growth Fund Class R6. |
| (g) | Prior to March 5, 2021, known as MainStay MacKay International Opportunities Fund Class I. |
| (h) | Prior to March 5, 2021, known as MainStay MacKay Small Cap Core Fund Class I. |
| (i) | Prior to April 26, 2021, known as MainStay MAP Equity Fund Class I. |
| (j) | As of April 26, 2021, the Fund exchanged in a nontaxable transfer of all shares of the MainStay WMC Value Fund Class I into the newly launched MainStay WMC Value Fund Class R6. |
| 84 | MainStay Asset Allocation Funds |
(G) Capital. As of April 30, 2021, New York Life and its affiliates beneficially held shares of the Allocation Funds with the values and percentages of net assets as follows:
| MainStay Conservative Allocation Fund | | |
| SIMPLE Class | $27,097 | 18.2% |
| |
| MainStay Moderate Allocation Fund | | |
| SIMPLE Class | $28,280 | 6.0% |
| |
| MainStay Growth Allocation Fund | | |
| SIMPLE Class | $29,593 | 3.0% |
| |
| MainStay Equity Allocation Fund | | |
| SIMPLE Class | $30,900 | 12.7% |
Note 4-Federal Income Tax
As of April 30, 2021, the cost and unrealized appreciation (depreciation) of each Allocation Fund’s investment portfolio, including applicable derivative contracts and other financial instruments, as determined on a federal income tax basis, were as follows:
| MainStay Conservative Allocation Fund |
| | Federal Tax
Cost | Gross
Unrealized
Appreciation | Gross
Unrealized
(Depreciation) | Net
Unrealized
Appreciation/
(Depreciation) |
| Investments | $434,374,891 | $63,736,999 | $(38,381) | $63,698,618 |
| MainStay Moderate Allocation Fund |
| | Federal Tax
Cost | Gross
Unrealized
Appreciation | Gross
Unrealized
(Depreciation) | Net
Unrealized
Appreciation/
(Depreciation) |
| Investments | $644,140,797 | $213,965,943 | $(16,275) | $213,949,668 |
| MainStay Growth Allocation Fund |
| | Federal Tax
Cost | Gross
Unrealized
Appreciation | Gross
Unrealized
(Depreciation) | Net
Unrealized
Appreciation/
(Depreciation) |
| Investments | $699,436,344 | $194,269,780 | $(1,880,894) | $192,388,886 |
| MainStay Equity Allocation Fund |
| | Federal Tax
Cost | Gross
Unrealized
Appreciation | Gross
Unrealized
(Depreciation) | Net
Unrealized
Appreciation/
(Depreciation) |
| Investments | $353,346,104 | $119,244,931 | $(2,321,372) | $116,923,559 |
Notes to Financial Statements (Unaudited) (continued)
During the year ended October 31, 2020, the tax character of distributions paid as reflected in the Statements of Changes in Net Assets was as follows:
| | 2020 |
| Fund | Tax Based
Distributions
from Ordinary
Income | Tax Based
Distributions
from Long-Term
Capital Gains | Total |
| MainStay Conservative Allocation Fund | $ 9,198,346 | $ 2,245,431 | $11,443,777 |
| MainStay Moderate Allocation Fund | 13,963,635 | 14,572,508 | 28,536,143 |
| MainStay Growth Allocation Fund | 12,956,780 | 20,040,357 | 32,997,137 |
| MainStay Equity Allocation Fund | 6,391,973 | 13,228,709 | 19,620,682 |
Note 5–Custodian
JPMorgan is the custodian of cash and securities held by the Allocation Funds. Custodial fees are charged to each Allocation Fund based on each Allocation Fund's net assets and/or the market value of securities held by each Allocation Fund and the number of certain transactions incurred by each Allocation Fund.
Prior to November 23, 2020, these services were provided by State Street. The services provided by State Street are a direct expense of each Allocation Fund and are included in the Statement of Operations as Custodian fees which totaled $2,519, $2,482, $2,648 and $2,426 for MainStay Conservative Allocation Fund, MainStay Moderate Allocation Fund, MainStay Growth Allocation Fund and MainStay Equity Allocation Fund, respectively, for the period November 1, 2020 through November 22, 2020.
Note 6–Line of Credit
The Allocation Funds and certain other funds managed by New York Life Investments maintain a line of credit with a syndicate of banks in order to secure a source of funds for temporary purposes to meet unanticipated or excessive redemption requests.
Effective July 28, 2020, under the credit agreement (the “Credit Agreement”), the aggregate commitment amount is $600,000,000 with an additional uncommitted amount of $100,000,000. The commitment fee is an annual rate of 0.15% of the average commitment amount payable quarterly, regardless of usage, to JPMorgan, who serves as the agent to the syndicate. The commitment fee is allocated among the Allocation Funds and certain other funds managed by New York Life Investments based upon their respective net assets and other factors. Interest on any revolving credit loan is charged based upon the Federal Funds Rate or the one-month London Interbank Offered Rate ("LIBOR"), whichever is higher. The Credit Agreement expires on July 27, 2021, although the Allocation Funds, certain other funds managed by New York Life Investments and the syndicate of banks may renew the Credit Agreement for an additional year on the same or different terms or enter into a credit agreement with a different syndicate of banks. Prior to July 28, 2020, the aggregate commitment amount and the commitment fee were the same as those under the current Credit Agreement, but State Street served as agent to the syndicate. During the six-month period ended April 30, 2021, there were no borrowings made or outstanding with respect to the Allocation Funds under the Credit Agreement.
Note 7–Interfund Lending Program
Pursuant to an exemptive order issued by the SEC, the Allocation Funds, along with certain other funds managed by New York Life Investments, may participate in an interfund lending program. The interfund lending program provides an alternative credit facility that permits the Allocation Funds and certain other funds managed by New York Life Investments to lend or borrow money for temporary purposes directly to or from one another, subject to the conditions of the exemptive order. During the six-month period ended April 30, 2021, there were no interfund loans made or outstanding with respect to the Allocation Funds.
| 86 | MainStay Asset Allocation Funds |
Note 8–Purchases and Sales of Securities (in 000’s)
During the six-month period ended April 30, 2021, purchases and sales of securities were as follows:
| Fund | Purchases | Sales |
| MainStay Conservative Allocation Fund | $ 45,186 | $ 66,398 |
| MainStay Moderate Allocation Fund | 99,001 | 140,655 |
| MainStay Growth Allocation Fund | 116,431 | 162,407 |
| MainStay Equity Allocation Fund | 66,551 | 62,231 |
Note 9–Capital Share Transactions
Transactions in capital shares for the six-month period ended April 30, 2021 and the year ended October 31, 2020, were as follows:
MainStay Conservative Allocation Fund
| Class A | Shares | Amount |
| Period ended April 30, 2021: | | |
| Shares sold | 1,706,593 | $ 21,999,294 |
| Shares issued to shareholders in reinvestment of distributions | 1,142,808 | 14,502,235 |
| Shares redeemed | (2,315,184) | (29,869,032) |
| Net increase (decrease) in shares outstanding before conversion | 534,217 | 6,632,497 |
| Shares converted into Class A (See Note 1) | 791,509 | 10,214,681 |
| Shares converted from Class A (See Note 1) | (3,704) | (47,762) |
| Net increase (decrease) | 1,322,022 | $ 16,799,416 |
| Year ended October 31, 2020: | | |
| Shares sold | 4,555,270 | $ 54,134,250 |
| Shares issued to shareholders in reinvestment of distributions | 748,023 | 8,838,479 |
| Shares redeemed | (5,264,826) | (62,758,118) |
| Net increase (decrease) in shares outstanding before conversion | 38,467 | 214,611 |
| Shares converted into Class A (See Note 1) | 1,078,679 | 13,029,268 |
| Shares converted from Class A (See Note 1) | (17,626) | (202,003) |
| Net increase (decrease) | 1,099,520 | $ 13,041,876 |
| |
| Investor Class | Shares | Amount |
| Period ended April 30, 2021: | | |
| Shares sold | 269,471 | $ 3,469,731 |
| Shares issued to shareholders in reinvestment of distributions | 125,516 | 1,592,726 |
| Shares redeemed | (219,645) | (2,829,100) |
| Net increase (decrease) in shares outstanding before conversion | 175,342 | 2,233,357 |
| Shares converted into Investor Class (See Note 1) | 126,746 | 1,634,322 |
| Shares converted from Investor Class (See Note 1) | (408,473) | (5,292,213) |
| Net increase (decrease) | (106,385) | $ (1,424,534) |
| Year ended October 31, 2020: | | |
| Shares sold | 824,431 | $ 9,792,729 |
| Shares issued to shareholders in reinvestment of distributions | 91,231 | 1,079,940 |
| Shares redeemed | (529,487) | (6,320,941) |
| Net increase (decrease) in shares outstanding before conversion | 386,175 | 4,551,728 |
| Shares converted into Investor Class (See Note 1) | 147,572 | 1,756,832 |
| Shares converted from Investor Class (See Note 1) | (872,820) | (10,567,390) |
| Net increase (decrease) | (339,073) | $ (4,258,830) |
| |
Notes to Financial Statements (Unaudited) (continued)
| Class B | Shares | Amount |
| Period ended April 30, 2021: | | |
| Shares sold | 71,452 | $ 900,078 |
| Shares issued to shareholders in reinvestment of distributions | 36,979 | 463,346 |
| Shares redeemed | (79,827) | (869,528) |
| Net increase (decrease) in shares outstanding before conversion | 28,604 | 493,896 |
| Shares converted from Class B (See Note 1) | (96,737) | (1,232,650) |
| Net increase (decrease) | (68,133) | $ (738,754) |
| Year ended October 31, 2020: | | |
| Shares sold | 39,533 | $ 470,803 |
| Shares issued to shareholders in reinvestment of distributions | 25,596 | 300,141 |
| Shares redeemed | (197,490) | (2,328,031) |
| Net increase (decrease) in shares outstanding before conversion | (132,361) | (1,557,087) |
| Shares converted from Class B (See Note 1) | (230,140) | (2,719,083) |
| Net increase (decrease) | (362,501) | $ (4,276,170) |
| |
| Class C | Shares | Amount |
| Period ended April 30, 2021: | | |
| Shares sold | 143,085 | $ 1,814,837 |
| Shares issued to shareholders in reinvestment of distributions | 108,257 | 1,356,457 |
| Shares redeemed | (408,012) | (4,983,963) |
| Net increase (decrease) in shares outstanding before conversion | (156,670) | (1,812,669) |
| Shares converted from Class C (See Note 1) | (420,631) | (5,323,237) |
| Net increase (decrease) | (577,301) | $ (7,135,906) |
| Year ended October 31, 2020: | | |
| Shares sold | 275,411 | $ 3,236,982 |
| Shares issued to shareholders in reinvestment of distributions | 68,242 | 799,730 |
| Shares redeemed | (920,352) | (10,825,879) |
| Net increase (decrease) in shares outstanding before conversion | (576,699) | (6,789,167) |
| Shares converted from Class C (See Note 1) | (110,122) | (1,302,106) |
| Net increase (decrease) | (686,821) | $ (8,091,273) |
| |
| Class I | Shares | Amount |
| Period ended April 30, 2021: | | |
| Shares sold | 63,595 | $ 835,388 |
| Shares issued to shareholders in reinvestment of distributions | 25,654 | 328,978 |
| Shares redeemed | (50,502) | (866,081) |
| Net increase (decrease) | 38,747 | $ 298,285 |
| Year ended October 31, 2020: | | |
| Shares sold | 121,201 | $ 1,463,681 |
| Shares issued to shareholders in reinvestment of distributions | 20,782 | 248,251 |
| Shares redeemed | (272,227) | (3,243,975) |
| Net increase (decrease) in shares outstanding before conversion | (130,244) | (1,532,043) |
| Shares converted into Class I (See Note 1) | 356 | 4,482 |
| Net increase (decrease) | (129,888) | $ (1,527,561) |
| |
| 88 | MainStay Asset Allocation Funds |
| Class R2 | Shares | Amount |
| Period ended April 30, 2021: | | |
| Shares sold | 425 | $ 5,522 |
| Shares issued to shareholders in reinvestment of distributions | 350 | 4,447 |
| Shares redeemed | (7) | (91) |
| Net increase (decrease) | 768 | $ 9,878 |
| Year ended October 31, 2020: | | |
| Shares sold | 1,111 | $ 13,003 |
| Shares issued to shareholders in reinvestment of distributions | 219 | 2,596 |
| Shares redeemed | (805) | (9,888) |
| Net increase (decrease) | 525 | $ 5,711 |
| |
| Class R3 | Shares | Amount |
| Period ended April 30, 2021: | | |
| Shares sold | 39,038 | $ 510,431 |
| Shares issued to shareholders in reinvestment of distributions | 3,560 | 45,029 |
| Shares redeemed | (3,948) | (187,956) |
| Net increase (decrease) | 38,650 | $ 367,504 |
| Year ended October 31, 2020: | | |
| Shares sold | 40,680 | $ 447,674 |
| Shares issued to shareholders in reinvestment of distributions | 1,616 | 19,000 |
| Shares redeemed | (1,777) | (20,785) |
| Net increase (decrease) | 40,519 | $ 445,889 |
| |
| SIMPLE Class | Shares | Amount |
| Period ended April 30, 2021: | | |
| Shares sold | 5,328 | $ 69,126 |
| Shares issued to shareholders in reinvestment of distributions | 241 | 3,052 |
| Shares redeemed | (72) | (940) |
| Net increase (decrease) in shares outstanding before conversion | 5,497 | 71,238 |
| Shares converted into SIMPLE Class (See Note 1) | 3,638 | 46,859 |
| Net increase (decrease) | 9,135 | $ 118,097 |
| Year ended October 31, 2020:(a) | | |
| Shares sold | 2,216 | $ 27,849 |
| Net increase (decrease) | 2,216 | $ 27,849 |
| (a) | The inception date of the class was August 31, 2020. |
Notes to Financial Statements (Unaudited) (continued)
MainStay Moderate Allocation Fund
| Class A | Shares | Amount |
| Period ended April 30, 2021: | | |
| Shares sold | 2,009,377 | $ 29,199,123 |
| Shares issued to shareholders in reinvestment of distributions | 2,419,872 | 34,047,604 |
| Shares redeemed | (3,191,540) | (46,065,507) |
| Net increase (decrease) in shares outstanding before conversion | 1,237,709 | 17,181,220 |
| Shares converted into Class A (See Note 1) | 1,749,692 | 25,488,702 |
| Shares converted from Class A (See Note 1) | (8,421) | (122,258) |
| Net increase (decrease) | 2,978,980 | $ 42,547,664 |
| Year ended October 31, 2020: | | |
| Shares sold | 3,980,972 | $ 51,876,101 |
| Shares issued to shareholders in reinvestment of distributions | 1,649,087 | 21,767,987 |
| Shares redeemed | (7,300,012) | (94,067,591) |
| Net increase (decrease) in shares outstanding before conversion | (1,669,953) | (20,423,503) |
| Shares converted into Class A (See Note 1) | 2,346,618 | 30,922,266 |
| Shares converted from Class A (See Note 1) | (25,967) | (318,880) |
| Net increase (decrease) | 650,698 | $ 10,179,883 |
| |
| Investor Class | Shares | Amount |
| Period ended April 30, 2021: | | |
| Shares sold | 728,322 | $ 10,559,251 |
| Shares issued to shareholders in reinvestment of distributions | 382,335 | 5,394,756 |
| Shares redeemed | (447,542) | (6,481,628) |
| Net increase (decrease) in shares outstanding before conversion | 663,115 | 9,472,379 |
| Shares converted into Investor Class (See Note 1) | 168,759 | 2,465,410 |
| Shares converted from Investor Class (See Note 1) | (1,290,450) | (18,856,467) |
| Net increase (decrease) | (458,576) | $ (6,918,678) |
| Year ended October 31, 2020: | | |
| Shares sold | 2,140,418 | $ 27,805,461 |
| Shares issued to shareholders in reinvestment of distributions | 280,917 | 3,716,653 |
| Shares redeemed | (1,042,213) | (13,639,757) |
| Net increase (decrease) in shares outstanding before conversion | 1,379,122 | 17,882,357 |
| Shares converted into Investor Class (See Note 1) | 292,774 | 3,788,048 |
| Shares converted from Investor Class (See Note 1) | (1,986,800) | (26,285,522) |
| Net increase (decrease) | (314,904) | $ (4,615,117) |
| |
| Class B | Shares | Amount |
| Period ended April 30, 2021: | | |
| Shares sold | 11,352 | $ 162,946 |
| Shares issued to shareholders in reinvestment of distributions | 103,272 | 1,444,773 |
| Shares redeemed | (175,673) | (2,520,856) |
| Net increase (decrease) in shares outstanding before conversion | (61,049) | (913,137) |
| Shares converted from Class B (See Note 1) | (240,083) | (3,458,069) |
| Net increase (decrease) | (301,132) | $ (4,371,206) |
| Year ended October 31, 2020: | | |
| Shares sold | 49,147 | $ 643,908 |
| Shares issued to shareholders in reinvestment of distributions | 85,393 | 1,120,352 |
| Shares redeemed | (343,812) | (4,428,240) |
| Net increase (decrease) in shares outstanding before conversion | (209,272) | (2,663,980) |
| Shares converted from Class B (See Note 1) | (515,047) | (6,618,766) |
| Net increase (decrease) | (724,319) | $ (9,282,746) |
| |
| 90 | MainStay Asset Allocation Funds |
| Class C | Shares | Amount |
| Period ended April 30, 2021: | | |
| Shares sold | 102,359 | $ 1,471,542 |
| Shares issued to shareholders in reinvestment of distributions | 123,469 | 1,726,099 |
| Shares redeemed | (351,382) | (5,043,226) |
| Net increase (decrease) in shares outstanding before conversion | (125,554) | (1,845,585) |
| Shares converted from Class C (See Note 1) | (395,231) | (5,678,336) |
| Net increase (decrease) | (520,785) | $ (7,523,921) |
| Year ended October 31, 2020: | | |
| Shares sold | 222,124 | $ 2,860,726 |
| Shares issued to shareholders in reinvestment of distributions | 93,150 | 1,222,134 |
| Shares redeemed | (854,209) | (11,040,666) |
| Net increase (decrease) in shares outstanding before conversion | (538,935) | (6,957,806) |
| Shares converted from Class C (See Note 1) | (117,390) | (1,495,118) |
| Net increase (decrease) | (656,325) | $ (8,452,924) |
| |
| Class I | Shares | Amount |
| Period ended April 30, 2021: | | |
| Shares sold | 75,205 | $ 1,089,847 |
| Shares issued to shareholders in reinvestment of distributions | 36,516 | 517,062 |
| Shares redeemed | (78,022) | (1,127,120) |
| Net increase (decrease) in shares outstanding before conversion | 33,699 | 479,789 |
| Shares converted into Class I (See Note 1) | 3,206 | 46,741 |
| Net increase (decrease) | 36,905 | $ 526,530 |
| Year ended October 31, 2020: | | |
| Shares sold | 101,719 | $ 1,358,661 |
| Shares issued to shareholders in reinvestment of distributions | 35,866 | 476,302 |
| Shares redeemed | (376,366) | (4,920,331) |
| Net increase (decrease) | (238,781) | $ (3,085,368) |
| |
| Class R2 | Shares | Amount |
| Period ended April 30, 2021: | | |
| Shares issued to shareholders in reinvestment of distributions | 591 | $ 8,311 |
| Shares redeemed | — | (1) |
| Net increase (decrease) | 591 | $ 8,310 |
| Year ended October 31, 2020: | | |
| Shares sold | 397 | $ 5,096 |
| Shares issued to shareholders in reinvestment of distributions | 432 | 5,717 |
| Shares redeemed | (1,335) | (16,920) |
| Net increase (decrease) | (506) | $ (6,107) |
| |
Notes to Financial Statements (Unaudited) (continued)
| Class R3 | Shares | Amount |
| Period ended April 30, 2021: | | |
| Shares sold | 30,162 | $ 437,443 |
| Shares issued to shareholders in reinvestment of distributions | 3,804 | 53,481 |
| Shares redeemed | (15,862) | (228,099) |
| Net increase (decrease) | 18,104 | $ 262,825 |
| Year ended October 31, 2020: | | |
| Shares sold | 10,784 | $ 139,435 |
| Shares issued to shareholders in reinvestment of distributions | 2,661 | 35,092 |
| Shares redeemed | (17,176) | (228,592) |
| Net increase (decrease) | (3,731) | $ (54,065) |
| |
| SIMPLE Class | Shares | Amount |
| Period ended April 30, 2021: | | |
| Shares sold | 25,549 | $ 370,561 |
| Shares issued to shareholders in reinvestment of distributions | 402 | 5,676 |
| Shares redeemed | (5,224) | (75,734) |
| Net increase (decrease) in shares outstanding before conversion | 20,727 | 300,503 |
| Shares converted into SIMPLE Class (See Note 1) | 7,898 | 114,277 |
| Net increase (decrease) | 28,625 | $ 414,780 |
| Year ended October 31, 2020:(a) | | |
| Shares sold | 2,241 | $ 31,026 |
| Net increase (decrease) in shares outstanding before conversion | 2,241 | 31,026 |
| Shares converted into SIMPLE Class (See Note 1) | 574 | 7,972 |
| Net increase (decrease) | 2,815 | $ 38,998 |
| (a) | The inception date of the class was August 31, 2020. |
MainStay Growth Allocation Fund
| Class A | Shares | Amount |
| Period ended April 30, 2021: | | |
| Shares sold | 1,623,401 | $ 26,261,695 |
| Shares issued to shareholders in reinvestment of distributions | 2,020,573 | 31,376,307 |
| Shares redeemed | (3,301,920) | (53,081,627) |
| Net increase (decrease) in shares outstanding before conversion | 342,054 | 4,556,375 |
| Shares converted into Class A (See Note 1) | 2,135,176 | 34,561,071 |
| Shares converted from Class A (See Note 1) | (23,046) | (370,234) |
| Net increase (decrease) | 2,454,184 | $ 38,747,212 |
| Year ended October 31, 2020: | | |
| Shares sold | 3,068,182 | $ 42,357,978 |
| Shares issued to shareholders in reinvestment of distributions | 1,676,335 | 24,172,839 |
| Shares redeemed | (7,195,515) | (100,026,192) |
| Net increase (decrease) in shares outstanding before conversion | (2,450,998) | (33,495,375) |
| Shares converted into Class A (See Note 1) | 2,502,392 | 35,854,845 |
| Shares converted from Class A (See Note 1) | (51,533) | (687,081) |
| Net increase (decrease) | (139) | $ 1,672,389 |
| |
| 92 | MainStay Asset Allocation Funds |
| Investor Class | Shares | Amount |
| Period ended April 30, 2021: | | |
| Shares sold | 633,504 | $ 10,181,632 |
| Shares issued to shareholders in reinvestment of distributions | 398,593 | 6,206,093 |
| Shares redeemed | (507,847) | (8,154,313) |
| Net increase (decrease) in shares outstanding before conversion | 524,250 | 8,233,412 |
| Shares converted into Investor Class (See Note 1) | 150,718 | 2,461,595 |
| Shares converted from Investor Class (See Note 1) | (1,758,565) | (28,469,946) |
| Net increase (decrease) | (1,083,597) | $ (17,774,939) |
| Year ended October 31, 2020: | | |
| Shares sold | 1,937,477 | $ 26,904,667 |
| Shares issued to shareholders in reinvestment of distributions | 383,654 | 5,539,985 |
| Shares redeemed | (1,281,335) | (17,937,941) |
| Net increase (decrease) in shares outstanding before conversion | 1,039,796 | 14,506,711 |
| Shares converted into Investor Class (See Note 1) | 264,556 | 3,621,432 |
| Shares converted from Investor Class (See Note 1) | (2,191,990) | (31,581,352) |
| Net increase (decrease) | (887,638) | $ (13,453,209) |
| |
| Class B | Shares | Amount |
| Period ended April 30, 2021: | | |
| Shares sold | 5,147 | $ 81,578 |
| Shares issued to shareholders in reinvestment of distributions | 95,067 | 1,462,126 |
| Shares redeemed | (142,826) | (2,263,184) |
| Net increase (decrease) in shares outstanding before conversion | (42,612) | (719,480) |
| Shares converted from Class B (See Note 1) | (213,788) | (3,411,318) |
| Net increase (decrease) | (256,400) | $ (4,130,798) |
| Year ended October 31, 2020: | | |
| Shares sold | 15,077 | $ 199,799 |
| Shares issued to shareholders in reinvestment of distributions | 99,366 | 1,419,936 |
| Shares redeemed | (431,351) | (5,931,247) |
| Net increase (decrease) in shares outstanding before conversion | (316,908) | (4,311,512) |
| Shares converted from Class B (See Note 1) | (453,254) | (6,187,533) |
| Net increase (decrease) | (770,162) | $ (10,499,045) |
| |
| Class C | Shares | Amount |
| Period ended April 30, 2021: | | |
| Shares sold | 77,656 | $ 1,228,808 |
| Shares issued to shareholders in reinvestment of distributions | 95,377 | 1,467,859 |
| Shares redeemed | (245,466) | (3,902,924) |
| Net increase (decrease) in shares outstanding before conversion | (72,433) | (1,206,257) |
| Shares converted from Class C (See Note 1) | (320,907) | (5,171,857) |
| Net increase (decrease) | (393,340) | $ (6,378,114) |
| Year ended October 31, 2020: | | |
| Shares sold | 182,885 | $ 2,518,183 |
| Shares issued to shareholders in reinvestment of distributions | 84,385 | 1,205,856 |
| Shares redeemed | (534,301) | (7,414,089) |
| Net increase (decrease) in shares outstanding before conversion | (267,031) | (3,690,050) |
| Shares converted from Class C (See Note 1) | (87,272) | (1,179,655) |
| Net increase (decrease) | (354,303) | $ (4,869,705) |
| |
Notes to Financial Statements (Unaudited) (continued)
| Class I | Shares | Amount |
| Period ended April 30, 2021: | | |
| Shares sold | 91,019 | $ 1,480,092 |
| Shares issued to shareholders in reinvestment of distributions | 30,069 | 472,689 |
| Shares redeemed | (55,123) | (902,275) |
| Net increase (decrease) in shares outstanding before conversion | 65,965 | 1,050,506 |
| Shares converted into Class I (See Note 1) | 2,260 | 35,141 |
| Shares converted from Class I (See Note 1) | (569) | (9,450) |
| Net increase (decrease) | 67,656 | $ 1,076,197 |
| Year ended October 31, 2020: | | |
| Shares sold | 82,979 | $ 1,147,287 |
| Shares issued to shareholders in reinvestment of distributions | 32,381 | 472,121 |
| Shares redeemed | (317,430) | (4,544,108) |
| Net increase (decrease) in shares outstanding before conversion | (202,070) | (2,924,700) |
| Shares converted into Class I (See Note 1) | 365 | 5,465 |
| Net increase (decrease) | (201,705) | $ (2,919,235) |
| |
| Class R1 | Shares | Amount |
| Period ended April 30, 2021: | | |
| Shares sold | 358 | $ 5,876 |
| Shares issued to shareholders in reinvestment of distributions | 122 | 1,920 |
| Shares redeemed | (6) | (102) |
| Net increase (decrease) | 474 | $ 7,694 |
| Year ended October 31, 2020: | | |
| Shares sold | 373 | $ 4,987 |
| Shares issued to shareholders in reinvestment of distributions | 80 | 1,161 |
| Shares redeemed | (3) | (52) |
| Net increase (decrease) | 450 | $ 6,096 |
| |
| Class R2 | Shares | Amount |
| Period ended April 30, 2021: | | |
| Shares issued to shareholders in reinvestment of distributions | 322 | $ 4,993 |
| Shares redeemed | (598) | (9,933) |
| Net increase (decrease) | (276) | $ (4,940) |
| Year ended October 31, 2020: | | |
| Shares sold | 181 | $ 2,641 |
| Shares issued to shareholders in reinvestment of distributions | 301 | 4,340 |
| Shares redeemed | (3,336) | (48,954) |
| Net increase (decrease) | (2,854) | $ (41,973) |
| |
| Class R3 | Shares | Amount |
| Period ended April 30, 2021: | | |
| Shares sold | 14,619 | $ 234,556 |
| Shares issued to shareholders in reinvestment of distributions | 3,423 | 52,983 |
| Shares redeemed | (19,927) | (329,961) |
| Net increase (decrease) | (1,885) | $ (42,422) |
| Year ended October 31, 2020: | | |
| Shares sold | 40,591 | $ 562,546 |
| Shares issued to shareholders in reinvestment of distributions | 3,608 | 51,850 |
| Shares redeemed | (56,120) | (770,351) |
| Net increase (decrease) | (11,921) | $ (155,955) |
| |
| 94 | MainStay Asset Allocation Funds |
| SIMPLE Class | Shares | Amount |
| Period ended April 30, 2021: | | |
| Shares sold | 31,163 | $ 502,965 |
| Shares issued to shareholders in reinvestment of distributions | 1,055 | 16,432 |
| Shares redeemed | (10,571) | (171,108) |
| Net increase (decrease) in shares outstanding before conversion | 21,647 | 348,289 |
| Shares converted into SIMPLE Class (See Note 1) | 23,197 | 374,998 |
| Net increase (decrease) | 44,844 | $ 723,287 |
| Year ended October 31, 2020:(a) | | |
| Shares sold | 2,253 | $ 33,721 |
| Net increase (decrease) in shares outstanding before conversion | 2,253 | 33,721 |
| Shares converted into SIMPLE Class (See Note 1) | 10,286 | 153,879 |
| Net increase (decrease) | 12,539 | $ 187,600 |
| (a) | The inception date of the class was August 31, 2020. |
MainStay Equity Allocation Fund
| Class A | Shares | Amount |
| Period ended April 30, 2021: | | |
| Shares sold | 857,791 | $ 14,849,833 |
| Shares issued to shareholders in reinvestment of distributions | 872,418 | 14,499,584 |
| Shares redeemed | (1,783,107) | (30,947,557) |
| Net increase (decrease) in shares outstanding before conversion | (52,898) | (1,598,140) |
| Shares converted into Class A (See Note 1) | 1,295,221 | 22,522,324 |
| Shares converted from Class A (See Note 1) | (10,646) | (185,583) |
| Net increase (decrease) | 1,231,677 | $ 20,738,601 |
| Year ended October 31, 2020: | | |
| Shares sold | 1,931,070 | $ 27,082,898 |
| Shares issued to shareholders in reinvestment of distributions | 897,152 | 13,555,975 |
| Shares redeemed | (3,120,522) | (44,762,253) |
| Net increase (decrease) in shares outstanding before conversion | (292,300) | (4,123,380) |
| Shares converted into Class A (See Note 1) | 1,297,821 | 19,275,661 |
| Shares converted from Class A (See Note 1) | (20,097) | (263,137) |
| Net increase (decrease) | 985,424 | $ 14,889,144 |
| |
| Investor Class | Shares | Amount |
| Period ended April 30, 2021: | | |
| Shares sold | 398,531 | $ 6,862,777 |
| Shares issued to shareholders in reinvestment of distributions | 202,760 | 3,371,905 |
| Shares redeemed | (265,572) | (4,585,484) |
| Net increase (decrease) in shares outstanding before conversion | 335,719 | 5,649,198 |
| Shares converted into Investor Class (See Note 1) | 76,385 | 1,344,500 |
| Shares converted from Investor Class (See Note 1) | (1,158,380) | (20,107,953) |
| Net increase (decrease) | (746,276) | $(13,114,255) |
| Year ended October 31, 2020: | | |
| Shares sold | 1,263,235 | $ 18,001,306 |
| Shares issued to shareholders in reinvestment of distributions | 247,282 | 3,736,474 |
| Shares redeemed | (641,225) | (9,331,023) |
| Net increase (decrease) in shares outstanding before conversion | 869,292 | 12,406,757 |
| Shares converted into Investor Class (See Note 1) | 146,615 | 2,051,268 |
| Shares converted from Investor Class (See Note 1) | (1,096,498) | (16,439,492) |
| Net increase (decrease) | (80,591) | $ (1,981,467) |
| |
Notes to Financial Statements (Unaudited) (continued)
| Class B | Shares | Amount |
| Period ended April 30, 2021: | | |
| Shares sold | 6,962 | $ 117,943 |
| Shares issued to shareholders in reinvestment of distributions | 56,825 | 916,583 |
| Shares redeemed | (130,615) | (2,200,873) |
| Net increase (decrease) in shares outstanding before conversion | (66,828) | (1,166,347) |
| Shares converted from Class B (See Note 1) | (128,503) | (2,165,338) |
| Net increase (decrease) | (195,331) | $ (3,331,685) |
| Year ended October 31, 2020: | | |
| Shares sold | 20,634 | $ 270,100 |
| Shares issued to shareholders in reinvestment of distributions | 74,978 | 1,105,929 |
| Shares redeemed | (219,674) | (3,052,600) |
| Net increase (decrease) in shares outstanding before conversion | (124,062) | (1,676,571) |
| Shares converted from Class B (See Note 1) | (280,314) | (3,857,734) |
| Net increase (decrease) | (404,376) | $ (5,534,305) |
| |
| Class C | Shares | Amount |
| Period ended April 30, 2021: | | |
| Shares sold | 35,947 | $ 604,603 |
| Shares issued to shareholders in reinvestment of distributions | 48,679 | 786,655 |
| Shares redeemed | (161,482) | (2,726,089) |
| Net increase (decrease) in shares outstanding before conversion | (76,856) | (1,334,831) |
| Shares converted from Class C (See Note 1) | (100,270) | (1,722,907) |
| Net increase (decrease) | (177,126) | $ (3,057,738) |
| Year ended October 31, 2020: | | |
| Shares sold | 116,621 | $ 1,602,083 |
| Shares issued to shareholders in reinvestment of distributions | 54,379 | 803,179 |
| Shares redeemed | (272,878) | (3,834,122) |
| Net increase (decrease) in shares outstanding before conversion | (101,878) | (1,428,860) |
| Shares converted from Class C (See Note 1) | (57,811) | (766,566) |
| Net increase (decrease) | (159,689) | $ (2,195,426) |
| |
| Class I | Shares | Amount |
| Period ended April 30, 2021: | | |
| Shares sold | 32,885 | $ 571,872 |
| Shares issued to shareholders in reinvestment of distributions | 15,490 | 262,250 |
| Shares redeemed | (29,316) | (507,868) |
| Net increase (decrease) | 19,059 | $ 326,254 |
| Year ended October 31, 2020: | | |
| Shares sold | 58,859 | $ 883,398 |
| Shares issued to shareholders in reinvestment of distributions | 16,530 | 254,066 |
| Shares redeemed | (81,587) | (1,197,521) |
| Net increase (decrease) | (6,198) | $ (60,057) |
| |
| 96 | MainStay Asset Allocation Funds |
| Class R3 | Shares | Amount |
| Period ended April 30, 2021: | | |
| Shares sold | 17,307 | $ 295,568 |
| Shares issued to shareholders in reinvestment of distributions | 3,904 | 64,497 |
| Shares redeemed | (4,716) | (79,299) |
| Net increase (decrease) | 16,495 | $ 280,766 |
| Year ended October 31, 2020: | | |
| Shares sold | 25,100 | $ 364,584 |
| Shares issued to shareholders in reinvestment of distributions | 3,420 | 51,399 |
| Shares redeemed | (5,937) | (89,996) |
| Net increase (decrease) | 22,583 | $ 325,987 |
| |
| SIMPLE Class | Shares | Amount |
| Period ended April 30, 2021: | | |
| Shares sold | 8,131 | $ 142,388 |
| Shares issued to shareholders in reinvestment of distributions | 237 | 3,947 |
| Shares redeemed | (14,874) | (259,024) |
| Net increase (decrease) in shares outstanding before conversion | (6,506) | (112,689) |
| Shares converted into SIMPLE Class (See Note 1) | 18,059 | 314,957 |
| Net increase (decrease) | 11,553 | $ 202,268 |
| Year ended October 31, 2020:(a) | | |
| Shares sold | 1,598 | $ 25,091 |
| Net increase (decrease) | 1,598 | $ 25,091 |
| (a) | The inception date of the class was August 31, 2020. |
Note 10–Recent Accounting Pronouncement
In March 2020, the Financial Accounting Standards Board issued Accounting Standards Update 2020-04 (“ASU 2020-04”), which provides optional guidance to ease the potential accounting burden associated with transitioning away from LIBOR and other reference rates that are expected to be discontinued. ASU 2020-04 was effective immediately upon release of the update on March 12, 2020 and remains effective through December 31, 2022. At this time, the Manager is evaluating the implications of certain other provisions of ASU 2020-04 related to new disclosure requirements and any impact on the financial statement disclosures has not yet been determined.
Note 11–Other Matters
An outbreak of COVID-19, first detected in December 2019, has developed into a global pandemic and has resulted in travel restrictions, closure of international borders, certain businesses and securities markets, restrictions on securities trading activities, prolonged quarantines, supply chain disruptions, and lower consumer demand, as well as general concern and uncertainty. The continued impact of COVID-19 is uncertain and could further adversely affect the global economy, national economies, individual issuers and capital markets in unforeseeable ways and result in a substantial and extended economic downturn. Developments that disrupt global economies and financial markets, such as COVID-19, may magnify factors that affect the Allocation Funds' performance.
Note 12–Subsequent Events
In connection with the preparation of the financial statements of the Allocation Funds as of and for the six-month period ended April 30, 2021, events and transactions subsequent to April 30, 2021, through the date the financial statements were issued have been evaluated by the Manager for possible adjustment and/or disclosure. No subsequent events requiring financial statement adjustment or disclosure have been identified.
Board Consideration and Approval of Management Agreement (Unaudited)
The continuation of the Management Agreement with respect to the MainStay Conservative Allocation Fund, MainStay Moderate Allocation Fund, MainStay Growth Allocation Fund and MainStay Equity Allocation Fund (“Funds”) and New York Life Investment Management LLC (“New York Life Investments”), following an initial term of up to two years, is subject to annual review and approval by the Board of Trustees of MainStay Funds Trust (“Board” of the “Trust”) in accordance with Section 15 of the Investment Company Act of 1940, as amended (“1940 Act”). At its December 9–10, 2020 meeting, the Board, including the Trustees who are not an “interested person” (as such term is defined in the 1940 Act) of the Trust (“Independent Trustees”) voting separately, unanimously approved the continuation of the Management Agreement for a one-year period.
In reaching the decision to approve the continuation of the Management Agreement, the Board considered information furnished by New York Life Investments in connection with an annual contract review process undertaken by the Board that took place at meetings of the Board and its Contracts Committee during September 2020 through December 2020, as well as other information furnished to the Board and its Committees throughout the year, as deemed relevant by the Trustees. Information requested by and furnished to the Board for consideration in connection with the contract review process included, among other items, reports on each Fund and “peer funds” prepared by Strategic Insight Mutual Fund Research and Consulting, LLC (“Strategic Insight”), an independent third-party service provider engaged by the Board to report objectively on each Fund’s investment performance, management fee and total expenses. The Board also considered information on the fees charged to other investment advisory clients of New York Life Investments that follow investment strategies similar to those of each Fund, if any, and, when applicable, the rationale for any differences in each Fund’s management fee and the fees charged to those other investment advisory clients. In addition, the Board considered information furnished by New York Life Investments in response to requests prepared on behalf of the Board, and in consultation with the Independent Trustees, by independent legal counsel to the Independent Trustees, which encompassed a variety of topics, including those summarized below.
The Board took into account information provided in connection with its meetings throughout the year, including, among other items, information regarding the legal standards and fiduciary obligations applicable to its consideration of the continuation of the Management Agreement and investment performance reports on each Fund as well as presentations from New York Life Investments personnel. The Board also took into account other information received from New York Life Investments throughout the year, including, among other items, periodic reports on legal and compliance matters, risk management, portfolio turnover, brokerage commissions and non-advisory services provided to each Fund by New York Life Investments. The contract review process, including the structure and format for materials provided to the Board, has been developed in consultation with the Board. The Independent Trustees also met in executive sessions with their independent legal counsel and, for a portion thereof, with senior management of New York Life Investments.
In addition to information provided to the Board throughout the year, the Board received information in connection with its June 2020 meeting provided specifically in response to requests prepared on behalf of the Board, and in consultation with the Independent Trustees, by independent legal counsel regarding each Fund’s distribution arrangements. In addition, the Board received information regarding each Fund’s asset levels, share purchase and redemption activity and the payment of Rule 12b-1 and/or other fees by applicable share classes of each Fund, among other information.
In considering the continuation of the Management Agreement, the Trustees reviewed and evaluated the information and factors they believed to reasonably be necessary and appropriate in light of legal advice furnished to them by independent legal counsel and through the exercise of their own business judgment. Although individual Trustees may have weighed certain factors or information differently, the factors considered by the Board are described in greater detail below and include, among other factors: (i) the nature, extent and quality of the services provided to each Fund by New York Life Investments; (ii) the qualifications of the portfolio managers of each Fund and the historical investment performance of each Fund and New York Life Investments; (iii) the costs of the services provided, and profits realized, by New York Life Investments from its relationship with each Fund; (iv) the extent to which economies of scale have been realized or may be realized as each Fund grows and the extent to which economies of scale have benefited or may benefit each Fund’s shareholders; and (v) the reasonableness of each Fund’s management fee and total ordinary operating expenses. Although the Board recognized that comparisons between each Fund’s fees and expenses and those of other funds are imprecise given different terms of agreements, variations in fund strategies and other factors, the Board considered the reasonableness of each Fund’s management fee and total ordinary operating expenses as compared to the peer funds identified by Strategic Insight. Throughout their considerations, the Trustees acknowledged the commitment of New York Life Investments and its affiliates to serve the MainStay Group of Funds, as well as their capacity, experience, resources, financial stability and reputations. The Trustees also acknowledged the entrepreneurial and other risks assumed by New York Life Investments in sponsoring and managing each Fund.
The Trustees noted that, throughout the year, the Trustees are afforded an opportunity to ask questions of, and request additional information or materials from, New York Life Investments. The Board’s decision with respect to the Management Agreement may have also been based, in part, on the Board’s knowledge of New York Life Investments resulting from, among other things, the Board’s consideration of the Management Agreement in prior years, the advisory agreements for other funds in the MainStay Group of Funds, the Board’s review throughout the year of the performance and operations of other funds in the MainStay Group of Funds and each Trustee’s business judgment and industry experience. In addition to considering the above-referenced factors, the Board observed
| 98 | MainStay Asset Allocation Funds |
that in the marketplace there are a range of investment options available to each Fund’s shareholders and such shareholders, having had the opportunity to consider other investment options, have chosen to invest in the Fund.
The factors that figured prominently in the Board’s decision to approve the continuation of the Management Agreement during its December 9–10, 2020 meeting are summarized in more detail below, and the Board did not consider any factor or information controlling in reaching such decision. The Board evaluated the continuation of the Management Agreement on a Fund-by-Fund basis, and its decision was made separately with respect to each Fund.
Nature, Extent and Quality of Services Provided by New York Life Investments
The Board examined the nature, extent and quality of the services that New York Life Investments provides to each Fund. The Board evaluated New York Life Investments’ experience and capabilities in serving as manager of each Fund. The Board noted that New York Life Investments manages other mutual funds, serves a variety of other investment advisory clients, including other pooled investment vehicles, and has experience overseeing mutual fund service providers. The Board considered the experience of senior personnel at New York Life Investments providing management and administrative and other non-advisory services to each Fund as well as New York Life Investments’ reputation and financial condition. The Board observed that New York Life Investments devotes significant resources and time to providing management and non-advisory services to each Fund.
The Board also considered the range of services that New York Life Investments provides to the Funds under the terms of the Management Agreement, including: (i) fund accounting and ongoing supervisory services provided by New York Life Investments’ Fund Administration and Accounting Group; (ii) investment supervisory and analytical services provided by New York Life Investments’ Investment Consulting Group; (iii) compliance services provided by the Trust’s Chief Compliance Officer as well as New York Life Investments’ compliance department, including supervision and implementation of the Funds’ compliance program; (iv) legal services provided by New York Life Investments’ Office of the General Counsel; and (v) risk management monitoring and analysis by compliance and investment personnel. The Board noted that New York Life Investments provides certain other non-advisory services to the Funds. In addition, the Board considered New York Life Investments’ willingness to invest in personnel, infrastructure, technology, operational enhancements, cyber security, information security, shareholder privacy resources and business continuity planning designed to benefit the Funds and noted that New York Life Investments is responsible for compensating the Trust’s officers, except for a portion of the salary of the Trust’s Chief Compliance Officer. The Board recognized that New York Life Investments has provided an increasingly broad array of non-advisory services to the MainStay Group of Funds as a result of regulatory and other developments, including in connection with the designation of New York Life Investments as the administrator of the MainStay Group of Funds’
liquidity risk management program adopted under the 1940 Act. The Board considered benefits to shareholders from being part of the MainStay Group of Funds, including the privilege of exchanging investments between the same class of shares of funds in the MainStay Group of Funds, including without the imposition of a sales charge (if any).
The Board also examined the nature, extent and quality of the investment advisory services that New York Life Investments provides to each Fund and considered the terms of the Management Agreement. The Board evaluated New York Life Investments’ experience in serving as investment adviser to the Funds and advising other portfolios and New York Life Investments’ track record and experience in providing investment advisory services, the experience of investment advisory, senior management and administrative personnel at New York Life Investments and New York Life Investments’ overall resources, legal and compliance environment, capabilities and history. In addition to information provided in connection with quarterly meetings with the Trust’s Chief Compliance Officer, the Board considered information regarding the compliance policies and procedures of New York Life Investments and acknowledged New York Life Investments’ commitment to further developing and strengthening compliance programs relating to the Funds. The Board reviewed New York Life Investments’ ability to attract and retain qualified investment professionals and willingness to invest in personnel to service and support the Funds. In this regard, the Board considered the experience of each Fund’s portfolio managers, the number of accounts managed by the portfolio managers and the method for compensating the portfolio managers.
In addition, the Board considered discussions with New York Life Investments regarding the implementation of its business continuity plans and recognized steps taken by New York Life Investments to continue to provide the same nature, extent and quality of services to each Fund during the COVID-19 pandemic.
Based on these considerations, the Board concluded that each Fund would likely continue to benefit from the nature, extent and quality of these services.
Investment Performance
In evaluating each Fund’s investment performance, the Board considered investment performance results over various periods in light of each Fund’s investment objective, strategies and risks. The Board considered investment reports on, and analysis of, each Fund’s performance provided to the Board throughout the year. These reports include, among other items, information on each Fund’s gross and net returns, each Fund’s investment performance compared to relevant investment categories and each Fund’s benchmarks, each Fund’s risk-adjusted investment performance and each Fund’s investment performance as compared to peer funds, as appropriate, as well as portfolio attribution information and commentary on the effect of market conditions. The Board also considered information provided by Strategic Insight showing the investment performance of each Fund as compared to peer funds.
Board Consideration and Approval of Management Agreement (Unaudited) (continued)
The Board also gave weight to its discussions with senior management at New York Life Investments concerning each Fund’s investment performance as well as discussions between the Fund’s portfolio managers and the members of the Board’s Investment Committee, which generally occur on an annual basis. In addition, the Board considered any specific actions that New York Life Investments had taken, or had agreed to take, to seek to enhance each Fund’s investment performance and the results of those actions.
Because the Funds invest substantially all their assets in other funds advised by New York Life Investments or its affiliates, the Board considered information from New York Life Investments regarding the investment rationale and process for the allocation among and selection of the underlying funds in which the Funds invest, including the investment performance of the underlying funds.
Based on these considerations, the Board concluded that its review of each Fund’s investment performance and related information supported a determination to approve the continuation of the Management Agreement.
Costs of the Services Provided, and Profits Realized, by New York Life Investments
The Board considered the costs of the services provided under the Management Agreement. The Board also considered the profits realized by New York Life Investments and its affiliates due to their relationships with the Funds.
The Board noted that the Funds do not pay a management fee for the allocation and other management services provided by New York Life Investments but that shareholders of the Funds indirectly pay their pro rata share of the fees and expenses of the underlying funds in which the Funds invest. The Board considered that the Funds’ investments in underlying funds managed by New York Life Investments or its affiliates indirectly benefit New York Life Investments or its affiliates. The Board noted that it considers the profits realized by New York Life Investments and its affiliates with respect to the underlying MainStay Funds as part of the annual contract review process for those funds.
In addition, the Board acknowledged the difficulty in obtaining reliable comparative data about mutual fund managers’ profitability because such information generally is not publicly available and may be impacted by numerous factors, including the structure of a fund manager’s organization, the types of funds it manages, the methodology used to allocate certain fixed costs to specific funds and the manager’s capital structure and costs of capital.
In evaluating the costs of the services provided by New York Life Investments and profits realized by New York Life Investments and its affiliates, the Board considered, among other factors, New York Life Investments’ continuing investments in, or willingness to invest in, personnel, systems, equipment and other resources and infrastructure to support and further enhance the management of each Fund. The Board also considered the financial resources of New York Life Investments and
acknowledged that New York Life Investments must be in a position to attract and retain experienced professional personnel and to maintain a strong financial position for New York Life Investments to continue to provide high-quality services to the Funds. The Board recognized that each Fund benefits from the allocation of certain fixed costs among the funds in the MainStay Group of Funds, among other expected benefits resulting from its relationship with New York Life Investments.
The Board considered information regarding New York Life Investments’ methodology for calculating profitability and allocating costs provided by New York Life Investments in connection with the fund profitability analysis presented to the Board. The Board previously engaged an independent consultant to review the methods used to allocate costs among the funds in the MainStay Group of Funds. The Board noted that the independent consultant had concluded that New York Life Investments’ methods for allocating costs and procedures for estimating overall profitability of the relationship with the funds in the MainStay Group of Funds are reasonable and that New York Life Investments continued to use the same method of calculating profit and allocating costs since the independent consultant’s review. The Board recognized the difficulty in calculating and evaluating a manager’s profitability with respect to each Fund and noted that other profitability methodologies may also be reasonable.
The Board also considered certain fall-out benefits that may be realized by New York Life Investments and its affiliates due to their relationships with each Fund, including reputational and other indirect benefits. In addition, the Board considered its review of a money market fund advised by New York Life Investments and an affiliated subadvisor that serves as an investment option for the Funds, including the potential rationale for and costs associated with investments in this money market fund by the Funds, if any, and considered information from New York Life Investments that the nature and type of specific investment advisory services provided to this money market fund are distinct from, or in addition to, the investment advisory services provided to the Funds.
The Board observed that New York Life Investments’ affiliates also earn revenues from serving each Fund in various other capacities, including as each Fund’s transfer agent and distributor. The Board considered information about these other revenues and their impact on the profitability of the relationship with each Fund to New York Life Investments and its affiliates. The Board noted that, although it assessed the overall profitability of each Fund to New York Life Investments and its affiliates as part of the contract review process, when considering the reasonableness of the fee paid to New York Life Investments and its affiliates under the Management Agreement, the Board considered the profitability of New York Life Investments’ relationship with the Funds on a pre-tax basis and without regard to distribution expenses incurred by New York Life Investments from its own resources.
After evaluating the information deemed relevant by the Trustees, the Board concluded that any profits realized by New York Life Investments and its affiliates due to their relationships with each Fund were not excessive.
| 100 | MainStay Asset Allocation Funds |
Management Fees and Total Ordinary Operating Expenses
The Board evaluated the reasonableness of the fees paid under the Management Agreement and each Fund’s total ordinary operating expenses.
In assessing the reasonableness of each Fund’s fees and expenses, the Board primarily considered comparative data provided by Strategic Insight on the fees and expenses charged by similar mutual funds managed by other investment advisers. Because the Funds do not pay a management fee to New York Life Investments, the Board considered the reasonableness of fees and expenses the Funds indirectly pay by investing in underlying funds that charge a management fee. The Board considered New York Life Investments’ process for monitoring and addressing potential conflicts of interest in the selection of underlying funds. In addition, the Board considered information provided by New York Life Investments on fees charged to other investment advisory clients, including institutional separate accounts and/or other funds that follow investment strategies similar to those of each Fund, if any. The Board considered the similarities and differences in the contractual management fee schedules of each Fund and these similarly-managed accounts and/or funds, taking into account the rationale for any differences in fee schedules. The Board also took into account explanations provided by New York Life Investments about the more extensive scope of services provided to registered investment companies, such as the Funds, as compared with other investment advisory clients. Additionally, the Board considered the impact of voluntary waivers and expense limitation arrangements on each Fund’s expenses. The Board also considered that in proposing fees for each Fund, New York Life Investments considers the competitive marketplace for mutual funds.
The Board noted that, outside of the fees charged under a share class’s Rule 12b-1 and/or shareholder services plans, a share class’s most significant “other expenses” are transfer agent fees. Transfer agent fees are charged to each Fund based on the number of shareholder accounts (a “per-account” fee). The Board took into account information from New York Life Investments regarding the reasonableness of each Fund’s transfer agent fee schedule, including industry data demonstrating that the per-account fees that NYLIM Service Company LLC, an affiliate of New York Life Investments and each Fund’s transfer agent, charges each Fund are within the range of per-account fees charged by transfer agents to other mutual funds. In addition, the Board considered NYLIM Service Company LLC’s profitability in connection with the transfer agent services it provides to the Funds. The Board also took into account information received from NYLIM Service Company LLC regarding the sub-transfer agency payments it made to intermediaries in connection with the provision of sub-transfer agency services to the Funds.
The Board considered that, because the Funds’ transfer agent fees are billed on a per-account basis, the impact of transfer agent fees on a share class’s expense ratio may be more significant in cases where the share class has a high number of small accounts. The Board considered the extent to which transfer agent fees comprised total expenses of each Fund. The Board acknowledged the role that the MainStay Group of Funds
historically has played in serving the investment needs of New York Life Insurance Company customers, who often maintain smaller account balances than other shareholders of funds, and the impact of small accounts on the expense ratios of Fund share classes. The Board also recognized measures that it and New York Life Investments have taken to mitigate the effect of small accounts on the expense ratios of Fund share classes, including through the imposition of an expense limitation on net transfer agency expenses. The Board noted that, for purposes of allocating transfer agency fees and expenses, each retail fund in the MainStay Group of Funds combines the shareholder accounts of its Class A, A2, I, R1, R2 and R3 shares (as applicable) into one group and the shareholder accounts of its Investor Class, SIMPLE Class and Class B, C and C2 shares (as applicable) into another group. The Board also noted that the per-account fees attributable to each group of share classes is then allocated among the constituent share classes based on relative net assets and that a MainStay Fund’s Class R6 shares, if any, are not combined with any other share class for this purpose. The Board considered New York Life Investments’ rationale with respect to these groupings and previously received a report from an independent consultant engaged to conduct comparative analysis of these groupings. The Board also considered that NYLIM Service Company LLC had waived its contractual cost of living adjustments during the past seven years.
Based on the factors outlined above, the Board concluded that each Fund’s management fee and total ordinary operating expenses were within a range that is competitive and support a conclusion that these fees and expenses are reasonable.
Economies of Scale
The Board considered information regarding economies of scale, including whether each Fund’s expense structure permits economies of scale to be appropriately shared with each Fund’s shareholders. The Board also considered a report from New York Life Investments, previously prepared at the request of the Board, that addressed economies of scale, including with respect to the mutual fund business generally and the various ways in which the benefits of economies of scale may be shared with the funds in the MainStay Group of Funds. Although the Board recognized the difficulty of determining economies of scale with precision, the Board acknowledged that economies of scale may be shared with each Fund in a number of ways, including, for example, through the imposition of management fee breakpoints, initially setting management fee rates at scale or making additional investments to enhance services. The Board reviewed information from New York Life Investments showing how each Fund’s management fee schedule compared to fee schedules of other funds and accounts managed by New York Life Investments. The Board also reviewed information from Strategic Insight showing how each Fund’s management fee schedule compared with fees paid for similar services by peer funds at varying asset levels. The Board noted that the Funds do not pay a management fee and that the Board separately considers economies of scale as part of its review of the management agreements of underlying MainStay Funds in which the Funds invest and the benefit of any breakpoints in the management fee
Board Consideration and Approval of Management Agreement (Unaudited) (continued)
schedules for the underlying MainStay Funds would pass through to shareholders of the Funds at the specified levels of underlying MainStay Fund assets.
Based on this information, the Board concluded that economies of scale are appropriately reflected for the benefit of each Fund’s shareholders through each Fund’s expense structure and other methods to share benefits from economies of scale.
Conclusion
On the basis of the information and factors summarized above, among other information and factors deemed relevant by the Trustees, and the evaluation thereof, the Board, including the Independent Trustees voting separately, unanimously voted to approve the continuation of the Management Agreement.
| 102 | MainStay Asset Allocation Funds |
Discussion of the Operation and Effectiveness of the Allocation Funds' Liquidity Risk Management Program (Unaudited)
In compliance with Rule 22e-4 under the Investment Company Act of 1940, as amended (the “Liquidity Rule”), the Allocation Funds have adopted and implemented a liquidity risk management program (the “Program”), which New York Life Investment Management LLC believes is reasonably designed to assess and manage the Allocation Funds' liquidity risk (the risk that the Allocation Funds could not meet requests to redeem shares issued by the Allocation Funds without significant dilution of remaining investors’ interests in the Allocation Funds). The Board of Trustees of MainStay Funds Trust (the "Board") designated New York Life Investment Management LLC as administrator of the Program (the “Administrator”). The Administrator has established a Liquidity Risk Management Committee to assist the Administrator in the implementation and day-to-day administration of the Program and to otherwise support the Administrator in fulfilling its responsibilities under the Program.
At a meeting of the Board held on March 8, 2021, the Administrator provided the Board with a written report addressing the Program’s operation and assessing its adequacy and effectiveness of implementation for the period from January 1, 2020 through December 31, 2020 (the "Review Period"), as required under the Liquidity Rule. The report noted that the Administrator concluded that (i) the Program operated effectively to assess and manage the Allocation Funds' liquidity risk, (ii) the Program has been adequately and effectively implemented to monitor and, as applicable, respond to the Allocation Funds' liquidity developments and (iii) the Allocation Funds' investment strategy continues to be appropriate for an open-end fund. In addition, the report discussed notable events that impacted liquidity risk during the Review Period, including the COVID-19 pandemic and the resulting economic shutdown.
In accordance with the Program, the Allocation Funds' liquidity risk is assessed no less frequently than annually taking into consideration certain factors, as applicable, such as (i) investment strategy and liquidity of portfolio investments, (ii) short-term and long-term cash flow projections and (iii) holdings of cash and cash equivalents, as well as borrowing arrangements and other funding sources. Certain factors are considered under both normal and reasonably foreseeable stressed conditions.
Each Allocation Fund's portfolio investment is classified into one of four liquidity categories. The classification is based on a determination of the number of days it is reasonably expected to take to convert the investment into cash, or sell or dispose of the investment, in current market conditions without significantly changing the market value of the investment. The Administrator's liquidity classification determinations are made by taking into account the Allocation Funds' reasonably anticipated trade size, various market, trading and investment-specific considerations, as well as market depth, and, in certain cases, third-party vendor data.
The Liquidity Rule requires funds that do not primarily hold assets that are highly liquid investments to adopt a minimum amount of net assets that must be invested in highly liquid investments that are assets (an “HLIM”). In addition, the Liquidity Rule limits a fund's investments in illiquid investments. Specifically, the Liquidity Rule prohibits acquisition of illiquid investments if doing so would result in a fund holding more than 15% of its net assets in illiquid investments that are assets. The Program includes provisions reasonably designed to determine, periodically review and comply with the HLIM requirement, as applicable, and to comply with the 15% limit on illiquid investments.
There can be no assurance that the Program will achieve its objectives under all circumstances in the future. Please refer to the Allocation Funds' prospectus for more information regarding the Allocation Funds' exposure to liquidity risk and other risks to which it may be subject.
Proxy Voting Record
Each Allocation Fund is required to file with the Securities and Exchange Commissions's ("SEC") its proxy voting records for the 12-month period ending June 30 on Form N-PX. The most recent Form N-PX or proxy voting record is available free of charge upon request by calling 800-624-6782; visiting the MainStay Funds’ website at newyorklifeinvestments.com; or visiting the SEC’s website at www.sec.gov.
Shareholder Reports and Quarterly Portfolio Disclosure
Each Allocation Fund is required to file its complete schedule of portfolio holdings with the SEC 60 days after its first and third fiscal quarter on Form N-PORT. The Allocation Funds' holdings report is available free of charge upon request by calling New York Life Investments at 800-624-6782.
| 104 | MainStay Asset Allocation Funds |
This page intentionally left blank.
This page intentionally left blank.
Equity
U.S. Equity
MainStay Epoch U.S. Equity Yield Fund
MainStay MacKay S&P 500 Index Fund
MainStay Winslow Large Cap Growth Fund
MainStay WMC Enduring Capital Fund
MainStay WMC Growth Fund
MainStay WMC Small Companies Fund
MainStay WMC Value Fund
International Equity
MainStay Epoch International Choice Fund
MainStay MacKay International Equity Fund
MainStay WMC International Research Equity Fund
Emerging Markets Equity
MainStay Candriam Emerging Markets Equity Fund
Global Equity
MainStay Epoch Capital Growth Fund
MainStay Epoch Global Equity Yield Fund
Fixed Income
Taxable Income
MainStay Candriam Emerging Markets Debt Fund
MainStay Floating Rate Fund
MainStay MacKay High Yield Corporate Bond Fund
MainStay MacKay Short Duration High Yield Fund
MainStay MacKay Strategic Bond Fund
MainStay MacKay Total Return Bond Fund
MainStay MacKay U.S. Infrastructure Bond Fund
MainStay Short Term Bond Fund
Tax-Exempt Income
MainStay MacKay California Tax Free Opportunities Fund1
MainStay MacKay High Yield Municipal Bond Fund
MainStay MacKay Intermediate Tax Free Bond Fund
MainStay MacKay New York Tax Free Opportunities Fund2
MainStay MacKay Short Term Municipal Fund
MainStay MacKay Tax Free Bond Fund
Money Market
MainStay Money Market Fund
Mixed Asset
MainStay Balanced Fund
MainStay Income Builder Fund
MainStay MacKay Convertible Fund
Speciality
MainStay CBRE Global Infrastructure Fund
MainStay CBRE Real Estate Fund
MainStay Cushing MLP Premier Fund
Asset Allocation
MainStay Conservative Allocation Fund
MainStay Conservative ETF Allocation Fund
MainStay Defensive ETF Allocation Fund
MainStay Equity Allocation Fund
MainStay Equity ETF Allocation Fund
MainStay Growth Allocation Fund
MainStay Growth ETF Allocation Fund
MainStay Moderate Allocation Fund
MainStay Moderate ETF Allocation Fund
Manager
New York Life Investment Management LLC
New York, New York
Subadvisors
Candriam Belgium S.A.3
Brussels, Belgium
Candriam Luxembourg S.C.A.3
Strassen, Luxembourg
CBRE Clarion Securities LLC
Radnor, Pennsylvania
Cushing Asset Management, LP
Dallas, Texas
Epoch Investment Partners, Inc.
New York, New York
MacKay Shields LLC3
New York, New York
NYL Investors LLC3
New York, New York
Wellington Management Company LLP
Boston, Massachusetts
Winslow Capital Management, LLC
Minneapolis, Minnesota
Legal Counsel
Dechert LLP
Washington, District of Columbia
Independent Registered Public Accounting Firm
KPMG LLP
Philadelphia, Pennsylvania
Distributor
NYLIFE Distributors LLC3
Jersey City, New Jersey
Custodian
JPMorgan Chase Bank, N.A.
New York, New York
1.
This Fund is registered for sale in AZ, CA, NV, OR, TX, UT, WA and MI (Class A and I shares only), and CO, FL, GA, HI, ID, MA, MD, NH, NJ and NY (Class I shares only).
| 2. | This Fund is registered for sale in CA, CT, DE, FL, MA, NJ, NY and VT. |
| 3. | An affiliate of New York Life Investment Management LLC. |
Not part of the Semiannual Report
For more information
800-624-6782
newyorklifeinvestments.com
“New York Life Investments” is both a service mark, and the common trade name, of certain investment advisors affiliated with New York Life Insurance Company. The MainStay Funds® are managed by New York Life Investment Management LLC and distributed by NYLIFE Distributors LLC, 30 Hudson Street, Jersey City, NJ 07302, a wholly owned subsidiary of New York Life Insurance Company. NYLIFE Distributors LLC is a Member FINRA/SIPC.
©2021 NYLIFE Distributors LLC. All rights reserved.
| 1737576MS071-21 | MSAA10-06/21 |
(NYLIM) NL224
MainStay Epoch Capital Growth Fund
Message from the President and Semiannual Report
Unaudited | April 30, 2021
Sign up for e-delivery of your shareholder reports. For full details on e-delivery, including who can participate and what you can receive via e-delivery,
please log in to newyorklifeinvestments.com/accounts.
| Not FDIC/NCUA Insured | Not a Deposit | May Lose Value | No Bank Guarantee | Not Insured by Any Government Agency |
This page intentionally left blank
Message from the President
With the approval of COVID-19 vaccines and the passage of relief packages by the U.S. Congress, economic prospects improved during the reporting period, and investor risk appetite increased, benefiting both equities and fixed-income markets. Despite some volatility stemming from a sell-off in longer-dated Treasury securities, the stock market and higher-risk segments of the fixed-income market posted gains for the six months ended April 30, 2021.
By the beginning of the reporting period, the economy had made tremendous progress from the second quarter of 2020, when economic activity plunged. But uncertainty about when vaccines would be available and how quickly they could be administered left investors unsure about the economic outlook.
With the approval of several vaccines in November, the outlook brightened and investors became less risk-averse. Anticipating the likely end of the pandemic and a continuation of the economic recovery, they began to see opportunities in investment-grade and high-yield bonds and more cyclical segments of the stock market. The $900 billion relief and stimulus package passed in December provided further assurance.
In January, the Federal Reserve opted to leave interest rates unchanged, pointing to some uncertainty about the pace of the global recovery. Officials also noted that inflation remained low, citing oil prices in particular.
In March, President Biden signed the $1.9 billion American Rescue Plan, which, among other provisions, called for payments of $1,400 for those earning less than $75,000 per year, plus $1,400 per dependent. This, combined with the Federal Reserve’s new tolerance for inflation and an anticipated $2 trillion infrastructure spending bill, added to growing concerns about higher prices. Supply shortages in some markets caused some prices to soar, heightening concerns further.
In fixed-income markets, an improving economic outlook and rising inflation expectations led to a sell-off in longer-term Treasuries, with the result that the yield on the 10-year note rose sharply, particularly in February and March. Investment grade corporate bonds were also affected. Early in the reporting period, they performed well as investors shifted out of Treasuries, but as the reporting period progressed, they faltered. Longer-dated securities issued in recent years at historically low interest rates became especially unattractive.
High-yield bonds remained steady, supported by more favorable yields and an improved economic outlook, which reduced their perceived risk. Municipal bonds produced modest gains, and
although the sell-off in Treasuries produced some volatility early in 2021, stronger-than-expected tax revenues, $350 billion in financial support from the federal government, and the possibility of an increase in federal income tax rates appeared to buoy the market late in the reporting period.
Inflation concerns and volatility in the Treasury market led to a shift in equities markets. Although the S&P 500® Index, a widely followed measure of U.S. equities, posted double-digit gains and hit a record high, the rise of Treasury yields disrupted valuations, especially those of growth stocks. Technology companies that saw their valuations soar amid the work-from-home trend in 2020 suffered large declines.
But the fiscal stimulus and continued accommodation from the Federal Reserve gave investors confidence the economic recovery would continue. Combined with the sky-high valuations in technology and growth stocks, this increased the appeal of more cyclical and value-oriented shares. As a result, value stocks outperformed growth stocks during the reporting period.
Reflecting the shift in investor sentiment, the performance of S&P 500® Index sectors varied widely. While the information technology sector kept up with the broader market, it lagged cyclical sectors such as energy and financials, which led the way. The shift was further reflected in the performance of small-cap stocks, which outperformed large caps. While developed markets kept pace with the U.S. market, lagging economic and pandemic recoveries appeared to weigh on emerging markets late in the reporting period.
With the lockdown restrictions lifting in the U.S. and the pandemic easing in many regions, we at New York Life Investments are looking forward to a return to a more normal economy. We anticipate that over the next several years, a variety of trends will likely offer long-term investors many attractive opportunities. With this in mind, we continue to develop products and services to help you to take advantage of these trends, manage your risks, and ultimately meet your investment goals.
Sincerely,
Kirk C. Lehneis
President
The opinions expressed are as of the date of this report and are subject to change. There is no guarantee that any forecast made will come to pass. This material does not constitute investment advice and is not intended as an endorsement of any specific investment. Past performance is no guarantee of future results.
Not part of the Semiannual Report
Investors should refer to the Fund’s Summary Prospectus and/or Prospectus and consider the Fund’s investment objectives, strategies, risks, charges and expenses carefully before investing. The Summary Prospectus and/or Prospectus contain this and other information about the Fund. You may obtain copies of the Fund’s Summary Prospectus, Prospectus and Statement of Additional Information free of charge, upon request, by calling toll-free 800-624-6782, by writing to NYLIFE Distributors LLC, Attn: MainStay Marketing Department, 30 Hudson Street, Jersey City, NJ 07302 or by sending an e-mail to MainStayShareholderServices@nylim.com. These documents are also available via the MainStay Funds’ website at newyorklifeinvestments.com. Please read the Fund’s Summary Prospectus and/or Prospectus carefully before investing.
Investment and Performance Comparison (Unaudited)
Performance data quoted represents past performance. Past performance is no guarantee of future results. Because of market volatility and other factors, current performance may be lower or higher than the figures shown. Investment return and principal value will fluctuate, and as a result, when shares are redeemed, they may be worth more or less than their original cost. The graph below depicts the historical performance of Class I shares of the Fund. Performance will vary from class to class based on differences in class-specific expenses and sales charges. For performance information current to the most recent month-end, please call 800-624-6782 or visit newyorklifeinvestments.com.
The performance table and graph do not reflect the deduction of taxes that a shareholder would pay on distributions or Fund share redemptions. Total returns reflect maximum applicable sales charges as indicated in the table below, if any, changes in share price, and reinvestment of dividend and capital gain distributions. The graph assumes the initial investment amount shown below and reflects the deduction of all sales charges that would have applied for the period of investment. Performance figures may reflect certain fee waivers and/or expense limitations, without which total returns may have been lower. For more information on share classes and current fee waivers and/or expense limitations (if any), please refer to the Notes to Financial Statements.
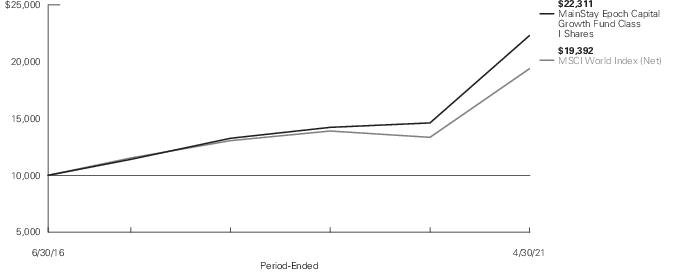
| Average Annual Total Returns for the Period-Ended April 30, 2021 |
| Class | Sales Charge | | Inception
Date | Six
Months | One
Year | Since
Inception | Gross
Expense
Ratio1 |
| Class A Shares | Maximum 5.5% Initial Sales Charge | With sales charges | 6/30/2016 | 22.31% | 43.96% | 16.41% | 1.16% |
| | | Excluding sales charges | | 29.43 | 52.34 | 17.78 | 1.16 |
| Investor Class Shares2 | Maximum 5% Initial Sales Charge | With sales charges | 6/30/2016 | 22.66 | 43.55 | 16.16 | 1.36 |
| | | Excluding sales charges | | 29.12 | 51.90 | 17.53 | 1.36 |
| Class C Shares | Maximum 1% CDSC | With sales charges | 6/30/2016 | 27.85 | 49.89 | 16.68 | 2.11 |
| | if Redeemed Within One Year of Purchase | Excluding sales charges | | 28.85 | 50.89 | 16.68 | 2.11 |
| Class I Shares | No Sales Charge | | 6/30/2016 | 29.57 | 52.67 | 18.05 | 0.93 |
| 1. | The gross expense ratios presented reflect the Fund’s “Total Annual Fund Operating Expenses” from the most recent Prospectus, as supplemented, and may differ from other expense ratios disclosed in this report. |
| 2. | Prior to June 30, 2020, the maximum initial sales charge was 5.5%, which is reflected in the average annual total return figures shown. |
The footnotes on the next page are an integral part of the table and graph and should be carefully read in conjunction with them.
| Benchmark Performance | Six
Months | One
Year | Since
Inception |
| MSCI World Index (Net)1 | 29.10% | 45.33% | 14.69% |
| Morningstar World Large Stock Category Average2 | 25.00 | 52.60 | 18.62 |
| 1. | The MSCI World Index (Net) is the Fund's primary broad-based securities market index for comparison purposes. The MSCI World Index (Net) is a free float-adjusted market capitalization weighted index that is designed to measure the equity market performance of developed markets. Results assume reinvestment of all dividends and capital gains. An investment cannot be made directly in an index. |
| 2. | The Morningstar World Large Stock Growth Category Average is a representative of funds that invest in a variety of international stocks and typically skew towards large caps that are more expensive or projected to grow faster than other global large-cap stocks. World large stock growth portfolios have few geographical limitations. It is common for these portfolios to invest the majority of their assets in developed markets, with the remainder divided among the globe's emerging markets. These portfolios are not significantly overweight U.S. equity exposure relative to the Morningstar Global Market Index and maintain at least a 20% absolute U.S. exposure. Results are based on average total returns of similar funds with all dividends and capital gain distributions reinvested. |
The footnotes on the preceding page are an integral part of the table and graph and should be carefully read in conjunction with them.
| 6 | MainStay Epoch Capital Growth Fund |
Cost in Dollars of a $1,000 Investment in MainStay Epoch Capital Growth Fund (Unaudited)
The example below is intended to describe the fees and expenses borne by shareholders during the six-month period from November 1, 2020, to April 30, 2021, and the impact of those costs on your investment.
Example
As a shareholder of the Fund you incur two types of costs: (1) transaction costs, including exchange fees and sales charges (loads) on purchases (as applicable), and (2) ongoing costs, including management fees, distribution and/or service (12b-1) fees, and other Fund expenses (as applicable). This example is intended to help you understand your ongoing costs (in dollars) of investing in the Fund and to compare these costs with the ongoing costs of investing in other mutual funds. The example is based on an investment of $1,000 made at the beginning of the six-month period and held for the entire period from November 1, 2020, to April 30, 2021.
This example illustrates your Fund’s ongoing costs in two ways:
Actual Expenses
The second and third data columns in the table below provide information about actual account values and actual expenses. You may use the information in these columns, together with the amount you invested, to estimate the expenses that you paid during the six months ended April 30, 2021. Simply divide your account value by $1,000 (for example, an
$8,600 account value divided by $1,000 = 8.6), then multiply the result by the number under the heading entitled “Expenses Paid During Period” to estimate the expenses you paid on your account during this period.
Hypothetical Example for Comparison Purposes
The fourth and fifth data columns in the table below provide information about hypothetical account values and hypothetical expenses based on the Fund’s actual expense ratio and an assumed rate of return of 5% per year before expenses, which is not the Fund’s actual return. The hypothetical account values and expenses may not be used to estimate the actual ending account balances or expenses you paid for the six-month period shown. You may use this information to compare the ongoing costs of investing in the Fund with the ongoing costs of investing in other mutual funds. To do so, compare this 5% hypothetical example with the 5% hypothetical examples that appear in the shareholder reports of the other mutual funds.
Please note that the expenses shown in the table are meant to highlight your ongoing costs only and do not reflect any transactional costs, such as exchange fees or sales charges (loads). Therefore, the fourth and fifth data columns of the table are useful in comparing ongoing costs only and will not help you determine the relative total costs of owning different funds. In addition, if these transactional costs were included, your costs would have been higher.
| Share Class | Beginning
Account
Value
11/1/20 | Ending Account
Value (Based
on Actual
Returns and
Expenses)
4/30/21 | Expenses
Paid
During
Period1 | Ending Account
Value (Based
on Hypothetical
5% Annualized
Return and
Actual Expenses)
4/30/21 | Expenses
Paid
During
Period1 | Net Expense
Ratio
During
Period2 |
| Class A Shares | $1,000.00 | $1,294.30 | $ 6.54 | $1,019.09 | $ 5.76 | 1.15% |
| Investor Class Shares | $1,000.00 | $1,291.20 | $ 8.01 | $1,017.80 | $ 7.05 | 1.41% |
| Class C Shares | $1,000.00 | $1,288.50 | $12.26 | $1,014.08 | $10.79 | 2.16% |
| Class I Shares | $1,000.00 | $1,295.70 | $ 5.12 | $1,020.33 | $ 4.51 | 0.90% |
| 1. | Expenses are equal to the Fund’s annualized expense ratio of each class multiplied by the average account value over the period, divided by 365 and multiplied by 181 (to reflect the six-month period). The table above represents the actual expenses incurred during the six-month period. In addition to the fees and expenses which the Fund bears directly, it also indirectly bears a pro rata share of the fees and expenses of the underlying funds in which it invests. Such indirect expenses are not included in the above-reported expense figures. |
| 2. | Expenses are equal to the Fund's annualized expense ratio to reflect the six-month period. |
Country Composition as of April 30, 2021 (Unaudited)
| United States | 62.4% |
| Japan | 4.6 |
| Switzerland | 3.5 |
| Australia | 3.2 |
| Sweden | 2.8 |
| Canada | 2.7 |
| Denmark | 2.7 |
| China | 2.2 |
| Netherlands | 2.2 |
| United Kingdom | 2.1 |
| Italy | 2.1 |
| Spain | 1.6 |
| Taiwan | 1.5 |
| Jordan | 1.1 |
| Hong Kong | 1.1% |
| Mexico | 1.0 |
| France | 0.8 |
| Portugal | 0.8 |
| Norway | 0.5 |
| Malta | 0.5 |
| Singapore | 0.5 |
| New Zealand | 0.5 |
| Indonesia | 0.4 |
| South Africa | 0.3 |
| Malaysia | 0.3 |
| Other Assets, Less Liabilities | –1.4 |
| | 100.0% |
See Portfolio of Investments beginning on page 12 for specific holdings within these categories. The Fund's holdings are subject to change.
Top Ten Holdings as of April 30, 2021 (excluding short-term investments) (Unaudited)
| 1. | LPL Financial Holdings, Inc. |
| 2. | Microsoft Corp. |
| 3. | CSL Ltd. |
| 4. | Wingstop, Inc. |
| 5. | Fortinet, Inc. |
| 6. | Alphabet, Inc., Class A |
| 7. | Applied Materials, Inc. |
| 8. | Lam Research Corp. |
| 9. | Fastenal Co. |
| 10. | Monster Beverage Corp. |
| 8 | MainStay Epoch Capital Growth Fund |
Portfolio Management Discussion and Analysis (Unaudited)
Questions answered by portfolio managers William W. Priest, CFA, Steven D. Bleiberg, Michael A. Welhoelter, CFA, and David J. Siino, CFA, CAIA, of Epoch Investment Partners, Inc., the Fund’s Subadvisor.
How did MainStay Epoch Capital Growth Fund perform relative to its benchmark and peer group during the six months ended April 30, 2021?
For the six months ended April 30, 2021, Class I shares of MainStay Epoch Capital Growth Fund returned 29.57%, outperforming the 29.10% return of the Fund’s primary benchmark, the MSCI World Index (Net). Over the same period, Class I shares also outperformed the 25.00% return of the Morningstar World Large Stock Growth Category Average.1
What factors affected the Fund’s relative performance during the reporting period?
In early November 2020, shortly after the beginning of the reporting period, news of successful COVID-19 vaccine trials led investors to believe that the COVID-19 pandemic would soon be brought under control and that the world economy would see faster growth as lockdowns ended. The result was strong stock market performance for sectors thought to benefit from faster growth, particularly the energy and financials sectors. Conversely, the health care sector underperformed as investors believed that many health care companies would see reduced demand from a waning pandemic. The Fund held underweight exposure to the energy and financials sectors, and overweight exposure to health care, positions that detracted from performance relative to the MSCI World Index (Net). However, stock selection within sectors bolstered relative returns enough to more than offset the negative impact of sector allocations.
During the reporting period, which sectors and/or countries were the strongest positive contributors to the Fund’s relative performance and which sectors and/or countries were particularly weak?
During the reporting period, the information technology, consumer discretionary and utilities sectors provided positive contributions to the Fund’s performance relative to the MSCI World Index (Net). (Contributions take weightings and total returns into account.) During the same period, the health care, materials and energy sectors proved particularly weak.
During the reporting period, which individual stocks made the strongest positive contributions to the Fund’s absolute performance and which stocks detracted the most?
The strongest positive contributors to the Fund’s absolute performance during the reporting period included positions in independent broker-dealer LPL Financial and semiconductor manufacturing equipment makers Applied Materials and Lam Research.
LPL, the largest independent broker-dealer in the country, benefited from stronger-than-expected client inflows and the steepening of the yield curve.2 The company's platform attracts so-called “breakaway” brokers who prefer LPL's advisor-centric model over wirehouses. LPL consistently reinvests by adding new products and capabilities to its platform, and recruiting and/or acquiring new advisors, while returning the remaining free cash flow to shareholders. Higher current and expected interest rates benefit LPL, which earns a significant percentage of its gross profit from net interest earned on client cash balances.
Applied Materials continued to benefit from strong sales of its semiconductor manufacturing equipment, driven by increased secular demand for chips. Large customers like Taiwan Semiconductor Manufacturing, Samsung and Intel boosted their 2021 capital expenditures outlook during the reporting period, and projected robust spending through 2025. Applied Materials posted strong financial results in mid-February 2021 that showed it gaining an increased share of semiconductor equipment spending and reported improved demand from display manufacturers, which make up its second-largest end market. The company is investing significant sums in research and development, while forecasting a return of 80 to 100% of remaining free cash flow to shareholders. We believe this makes a case for sustainable return on invested capital (ROIC) going forward.
Lam Research benefited from greater-than-expected near-term demand for its semiconductor equipment, as well as significant increases in future expectations. Lam expects its largest increase in demand in 2021 to come from manufacturers of DRAM computer memory chips, an area where Lam holds the leading market share. The company spends approximately $10 on research and development for $1 of capital expenditure, which we adjust for when calculating ROIC. We believe Lam’s investments in developing next generation etch and deposition equipment will position the company to meet future demand, maintain its pricing power and sustain returns.
The most significant detractors from the Fund’s absolute performance during the same period were holdings in nitrile glove manufacturer Hartalega Holdings, feminine care products company Unicharm, and gold mining company Kirkland Lake Gold.
Malaysia-based Hartalega is investing to double its glove-making capacity by 2027. Hartalega has also invested in automation technology making it the industry's most efficient producer (measured by sales per employee), which in turn has generated industry-leading profitability. In the short term, its stock was negatively impacted by the successful rollout of the COVID-19 vaccines, which are likely to dampen the recent surge in demand
| 1. | See page 5 for other share class returns, which may be higher or lower than Class I share returns. See page 6 for more information on benchmark and peer group returns. |
| 2. | The yield curve is a line that plots the yields of various securities of similar quality—typically U.S. Treasury issues—across a range of maturities. The U.S. Treasury yield curve serves as a benchmark for other debt and is used in economic forecasting. |
for gloves. But we believe the company’s efficiency and profitability provide a long-term competitive advantage in an industry experiencing secular growth. Industry demand was growing at 8%–10% per year before the pandemic emerged. Demand is relatively inelastic as usage is a critical necessity in many medical, industrial, laboratory and other settings. Per capita consumption of gloves in emerging and developing markets is well below usage in the western world, which we believe leaves significant room for growth.
Shares in Japan-based Unicharm lagged behind the market like many stocks in the consumer staples sector (the second-worst performing sector during the reporting period, after utilities) as investors focused on companies thought likely to see an acceleration in growth and profitability as the effects of the COVID-19 pandemic receded. The Fund still holds stock in the company, which we expect to continue earning good returns on invested capital.
Shares in Canada-based Kirkland Lake Gold lost ground as the price of gold declined during the reporting period. In our opinion, the company’s long-term value will be determined first by management's ability to reinvest in existing properties to expand production, and second by its success in acquiring new properties at favorable prices, all while operating efficiently. The Fund continues to hold a position in Kirkland Lake Gold because the company has demonstrated its ability to perform well in these respects, over time.
What were some of the Fund’s largest purchases and sales during the reporting period?
Significant new purchases during the reporting period included shares of Logitech International, Medpace Holdings, and Tecan Group.
Logitech International designs, manufactures and markets peripherals for PCs, tablets and other digital platforms. Logitech's two biggest product segments are creativity & productivity (mice, keyboards, webcams, tablet keyboards) and gaming (gaming mice and keyboards, headsets, steering wheels, etc.), with additional segments related to video collaboration, music and smart home products. Margins and ROIC have been on an upward trajectory in recent years as higher-margin segments, namely gaming and video collaboration, have increased significantly as a percentage of revenue. We believe Logitech is well placed to benefit from several ongoing trends, including the increased use of video for remote work and learning, gaming, and content creation.
Medpace Holdings is a contract research organization (CRO) that provides fully outsourced clinical trial management services to biotechnology, pharmaceutical and medical device companies across all major therapeutic areas. The CRO industry generally has benefited from two factors: first, consistent growth in overall research and development spending by pharmaceutical firms, and
second, a steady trend toward more outsourcing. These two factors have allowed CRO companies to grow without needing to compete aggressively with each other on price. Rather, participants compete on other factors, such as experience within specific therapeutic areas, quality of staff and services, reliability, or the ability to organize and manage large-scale global clinical trials. Medpace Holdings has specialized in servicing the specific needs of small and mid-sized biotechnology companies. The company's reputation for working with small and mid-sized biotechnology firms and for successfully operating trials has created trusted relationships that have helped Medpace Holdings build a profitable and growing business. The company is highly diversified by customer and product, and has primarily grown organically. We believe the expanding number of small biotechnology firms should provide additional growth opportunities for the company.
Tecan Group, based in Switzerland, develops, manufactures and distributes laboratory automation equipment and systems, primarily for use in life sciences research and diagnostics laboratories. The company sells directly to labs under the Tecan brand and also provides products and services to leading diagnostics original equipment manufacturers around the world that are incorporated into the products of those firms. A significant percentage of sales are consumables used during testing. Tecan's competitive advantage is its technical expertise in a niche market that makes labs more productive. We believe that aging populations, growth in diagnostics testing and rising health care standards are likely to produce volume growth in labs, which, in turn, should drive strong demand for investment in lab automation. In our estimation, the company invests substantially in research and development, has long-established relationships, a good reputation and a track record of reliability.
The Fund’s largest sales during the same period included positions in Alexion Pharmaceuticals, Canadian National Railway, and S&P Global. In December 2020, AstraZeneca announced a deal to acquire Alexion, driving the stock sharply higher. The Fund sold its shares rather than adopt a position in AstraZeneca. The Fund sold its holdings in railroad company Canadian National because we thought the company’s ongoing effort to acquire Kansas City Southern (another railroad company) displayed a lack of commitment to sensible capital allocation policies. Similarly, we sold the Fund’s position in financial data and analytics firm S&P Global after the company announced its acquisition of IHS Markit at a price that we believed would generate a poor return on invested capital.
How did the Fund’s sector and/or country weightings change during the reporting period?
During the reporting period, the Fund’s trades, combined with the varying impact of performance across sectors, caused sector exposure to increase most notably in health care and information
| 10 | MainStay Epoch Capital Growth Fund |
technology. During the same period, sector exposure declined most significantly in industrials and financials. From a country perspective, the largest changes included an increase in exposure to Swiss stocks and a decrease in exposure to Chinese equities.
How was the Fund positioned at the end of the reporting period?
As of April 30, 2021, the Fund held its most overweight exposures relative to the MSCI World Index (Net) to the health care and information technology sectors. As of the same date, the Fund’s most underweight positions were in the financials and communication services sectors.
The opinions expressed are those of the portfolio managers as of the date of this report and are subject to change. There is no guarantee that any forecasts will come to pass. This material does not constitute investment advice and is not intended as an endorsement of any specific investment.
Portfolio of Investments April 30, 2021† (Unaudited)
| | Shares | Value |
| Common Stocks 97.9% |
| Australia 3.2% |
| CSL Ltd. (Biotechnology) | 5,187 | $ 1,083,503 |
| Northern Star Resources Ltd. (Metals & Mining) | 44,517 | 360,427 |
| REA Group Ltd. (Interactive Media & Services) | 3,183 | 388,278 |
| Silver Lake Resources Ltd. (Metals & Mining) (a) | 228,668 | 307,389 |
| | | 2,139,597 |
| Canada 2.7% |
| Alimentation Couche-Tard, Inc., Class B (Food & Staples Retailing) | 15,830 | 536,403 |
| Constellation Software, Inc. (Software) | 562 | 824,804 |
| Kirkland Lake Gold Ltd. (Metals & Mining) | 12,961 | 481,576 |
| | | 1,842,783 |
| China 2.2% |
| A-Living Smart City Services Co. Ltd. (Commercial Services & Supplies) (b) | 37,000 | 170,526 |
| Autohome, Inc. ADR (Interactive Media & Services) | 5,611 | 520,308 |
| Hangzhou Robam Appliances Co. Ltd., Class A (Household Durables) | 47,400 | 281,038 |
| SITC International Holdings Co. Ltd. (Marine) | 48,000 | 183,219 |
| Yum China Holdings, Inc. (Hotels, Restaurants & Leisure) | 5,148 | 323,912 |
| | | 1,479,003 |
| Denmark 2.7% |
| Coloplast A/S, Class B (Health Care Equipment & Supplies) | 4,097 | 677,905 |
| Genmab A/S (Biotechnology) (a) | 1,371 | 505,799 |
| Novo Nordisk A/S, Class B (Pharmaceuticals) | 8,551 | 632,014 |
| | | 1,815,718 |
| France 0.8% |
| Sartorius Stedim Biotech (Life Sciences Tools & Services) | 1,233 | 566,267 |
| Hong Kong 1.1% |
| AIA Group Ltd. (Insurance) | 26,800 | 341,221 |
| Hong Kong Exchanges & Clearing Ltd. (Capital Markets) | 7,100 | 429,597 |
| | | 770,818 |
| Indonesia 0.4% |
| Bank Central Asia Tbk PT (Banks) | 132,300 | 293,313 |
| | Shares | Value |
| |
| Italy 2.1% |
| DiaSorin SpA (Health Care Equipment & Supplies) | 1,310 | $ 222,461 |
| FinecoBank Banca Fineco SpA (Banks) | 41,494 | 714,370 |
| Recordati Industria Chimica e Farmaceutica SpA (Pharmaceuticals) | 8,883 | 489,552 |
| | | 1,426,383 |
| Japan 4.6% |
| Digital Arts, Inc. (Software) | 4,300 | 349,382 |
| Hoya Corp. (Health Care Equipment & Supplies) | 4,000 | 455,119 |
| IR Japan Holdings Ltd. (Professional Services) | 1,100 | 144,634 |
| Lasertec Corp. (Semiconductors & Semiconductor Equipment) | 2,900 | 513,185 |
| Medical Data Vision Co. Ltd. (Health Care Technology) | 12,400 | 217,842 |
| Nexon Co. Ltd. (Entertainment) | 14,800 | 490,896 |
| Unicharm Corp. (Household Products) | 15,100 | 586,370 |
| Zenkoku Hosho Co. Ltd. (Diversified Financial Services) | 7,700 | 345,581 |
| | | 3,103,009 |
| Jordan 1.1% |
| Hikma Pharmaceuticals plc (Pharmaceuticals) | 23,109 | 778,718 |
| Malaysia 0.3% |
| Hartalega Holdings Bhd (Health Care Equipment & Supplies) | 83,700 | 210,047 |
| Malta 0.5% |
| Kindred Group plc SDR (Hotels, Restaurants & Leisure) | 18,734 | 324,200 |
| Mexico 1.0% |
| Wal-Mart de Mexico SAB de CV (Food & Staples Retailing) | 208,600 | 682,839 |
| Netherlands 2.2% |
| ASML Holding NV (Semiconductors & Semiconductor Equipment) | 1,275 | 829,588 |
| BE Semiconductor Industries NV (Semiconductors & Semiconductor Equipment) | 6,351 | 514,021 |
| Topicus.com, Inc. (Software) (a) | 1,632 | 122,153 |
| | | 1,465,762 |
| 12 | MainStay Epoch Capital Growth Fund |
| | Shares | Value |
| Common Stocks (continued) |
| New Zealand 0.5% |
| Fisher & Paykel Healthcare Corp. Ltd. (Health Care Equipment & Supplies) | 11,871 | $ 305,391 |
| Norway 0.5% |
| Salmar ASA (Food Products) | 4,805 | 333,533 |
| Portugal 0.8% |
| Jeronimo Martins SGPS SA (Food & Staples Retailing) | 30,146 | 550,532 |
| Singapore 0.5% |
| Singapore Exchange Ltd. (Capital Markets) | 41,200 | 323,532 |
| South Africa 0.3% |
| FirstRand Ltd. (Diversified Financial Services) | 63,237 | 222,556 |
| Spain 1.6% |
| Amadeus IT Group SA (IT Services) | 5,974 | 407,233 |
| Industria de Diseno Textil SA (Specialty Retail) (c) | 19,128 | 681,161 |
| | | 1,088,394 |
| Sweden 2.8% |
| Atlas Copco AB, Class B (Machinery) (c) | 10,583 | 549,430 |
| Epiroc AB, Class B (Machinery) | 12,477 | 244,808 |
| Evolution Gaming Group AB (Hotels, Restaurants & Leisure) (b) | 2,491 | 491,988 |
| Swedish Match AB (Tobacco) | 7,670 | 629,144 |
| | | 1,915,370 |
| Switzerland 3.5% |
| Kuehne + Nagel International AG (Registered) (Marine) | 1,597 | 477,395 |
| Logitech International SA (Registered) (Technology Hardware, Storage & Peripherals) | 7,356 | 824,806 |
| Partners Group Holding AG (Capital Markets) | 330 | 469,751 |
| Tecan Group AG (Registered) (Life Sciences Tools & Services) | 1,261 | 614,172 |
| | | 2,386,124 |
| Taiwan 1.5% |
| eMemory Technology, Inc. (Semiconductors & Semiconductor Equipment) | 11,000 | 409,891 |
| | Shares | Value |
| |
| Taiwan (continued) |
| Largan Precision Co. Ltd. (Electronic Equipment, Instruments & Components) | 2,000 | $ 222,081 |
| Taiwan Semiconductor Manufacturing Co. Ltd. (Semiconductors & Semiconductor Equipment) | 17,000 | 368,387 |
| | | 1,000,359 |
| United Kingdom 2.1% |
| Fevertree Drinks plc (Beverages) | 15,032 | 520,660 |
| Games Workshop Group plc (Leisure Products) | 2,946 | 441,440 |
| Howden Joinery Group plc (Trading Companies & Distributors) | 41,648 | 465,205 |
| | | 1,427,305 |
| United States 58.9% |
| Accenture plc, Class A (IT Services) | 2,307 | 668,961 |
| Adobe, Inc. (Software) (a) | 892 | 453,439 |
| Align Technology, Inc. (Health Care Equipment & Supplies) (a) | 1,228 | 731,311 |
| Alphabet, Inc., Class A (Interactive Media & Services) (a) | 429 | 1,009,652 |
| Apple, Inc. (Technology Hardware, Storage & Peripherals) | 6,167 | 810,714 |
| Applied Materials, Inc. (Semiconductors & Semiconductor Equipment) | 7,571 | 1,004,747 |
| Arista Networks, Inc. (Communications Equipment) (a) | 1,883 | 593,465 |
| Artisan Partners Asset Management, Inc., Class A (Capital Markets) | 11,728 | 597,190 |
| Automatic Data Processing, Inc. (IT Services) | 3,249 | 607,531 |
| Avast plc (Software) (b) | 68,110 | 449,340 |
| Booking Holdings, Inc. (Hotels, Restaurants & Leisure) (a) | 237 | 584,461 |
| Bruker Corp. (Life Sciences Tools & Services) | 8,276 | 567,072 |
| Chemed Corp. (Health Care Providers & Services) | 1,255 | 598,146 |
| Copart, Inc. (Commercial Services & Supplies) (a) | 5,236 | 651,934 |
| Corcept Therapeutics, Inc. (Pharmaceuticals) (a) | 13,815 | 314,844 |
| Costco Wholesale Corp. (Food & Staples Retailing) | 2,274 | 846,133 |
| Deckers Outdoor Corp. (Textiles, Apparel & Luxury Goods) (a) | 1,856 | 627,699 |
| Domino's Pizza, Inc. (Hotels, Restaurants & Leisure) | 1,657 | 699,817 |
| Donaldson Co., Inc. (Machinery) | 4,631 | 291,197 |
Portfolio of Investments April 30, 2021† (Unaudited) (continued)
| | Shares | Value |
| Common Stocks (continued) |
| United States (continued) |
| Electronic Arts, Inc. (Entertainment) | 4,289 | $ 609,381 |
| Eli Lilly and Co. (Pharmaceuticals) | 3,072 | 561,469 |
| Expeditors International of Washington, Inc. (Air Freight & Logistics) | 2,814 | 309,146 |
| Exponent, Inc. (Professional Services) | 6,211 | 598,306 |
| Fastenal Co. (Trading Companies & Distributors) | 17,713 | 926,036 |
| Ferguson plc (Trading Companies & Distributors) | 4,741 | 597,923 |
| Fortinet, Inc. (Software) (a) | 4,983 | 1,017,678 |
| Gentex Corp. (Auto Components) | 22,432 | 789,158 |
| Home Depot, Inc. (The) (Specialty Retail) | 1,960 | 634,393 |
| IDEXX Laboratories, Inc. (Health Care Equipment & Supplies) (a) | 1,101 | 604,438 |
| Incyte Corp. (Biotechnology) (a) | 5,077 | 433,474 |
| Intuit, Inc. (Software) | 1,458 | 600,929 |
| Intuitive Surgical, Inc. (Health Care Equipment & Supplies) (a) | 336 | 290,640 |
| Jack Henry & Associates, Inc. (IT Services) | 1,525 | 248,316 |
| KLA Corp. (Semiconductors & Semiconductor Equipment) | 2,506 | 790,267 |
| Lam Research Corp. (Semiconductors & Semiconductor Equipment) | 1,569 | 973,486 |
| Liberty Media Corp-Liberty SiriusXM (a) | | |
| Class A (Media) | 6,442 | 291,114 |
| Class C (Media) | 606 | 27,409 |
| |
| LPL Financial Holdings, Inc. (Capital Markets) | 7,609 | 1,192,330 |
| Masimo Corp. (Health Care Equipment & Supplies) (a) | 3,629 | 844,359 |
| Mastercard, Inc., Class A (IT Services) | 2,207 | 843,206 |
| Medpace Holdings, Inc. (Life Sciences Tools & Services) (a) | 4,664 | 791,388 |
| Mettler-Toledo International, Inc. (Life Sciences Tools & Services) (a) | 584 | 766,979 |
| Microsoft Corp. (Software) | 4,647 | 1,171,881 |
| Monolithic Power Systems, Inc. (Semiconductors & Semiconductor Equipment) | 2,467 | 891,524 |
| Monster Beverage Corp. (Beverages) (a) | 9,492 | 921,199 |
| MSCI, Inc. (Capital Markets) | 688 | 334,210 |
| Paychex, Inc. (IT Services) | 7,158 | 697,833 |
| Rollins, Inc. (Commercial Services & Supplies) | 5,578 | 207,948 |
| Southwest Airlines Co. (Airlines) (a) | 8,424 | 528,859 |
| Starbucks Corp. (Hotels, Restaurants & Leisure) | 5,374 | 615,269 |
| | Shares | | Value |
| |
| United States (continued) |
| |
| T. Rowe Price Group, Inc. (Capital Markets) | 2,918 | | $ 522,906 |
| Take-Two Interactive Software, Inc. (Entertainment) (a) | 4,069 | | 713,621 |
| Texas Instruments, Inc. (Semiconductors & Semiconductor Equipment) | 3,689 | | 665,901 |
| TJX Cos., Inc. (The) (Specialty Retail) | 5,717 | | 405,907 |
| Trex Co., Inc. (Building Products) (a) | 5,871 | | 634,009 |
| Union Pacific Corp. (Road & Rail) | 2,659 | | 590,537 |
| UnitedHealth Group, Inc. (Health Care Providers & Services) | 1,718 | | 685,138 |
| Veeva Systems, Inc., Class A (Health Care Technology) (a) | 1,966 | | 555,297 |
| West Pharmaceutical Services, Inc. (Health Care Equipment & Supplies) | 964 | | 316,693 |
| Western Alliance Bancorp (Banks) | 5,908 | | 620,754 |
| Wingstop, Inc. (Hotels, Restaurants & Leisure) | 6,712 | | 1,063,248 |
| Yum! Brands, Inc. (Hotels, Restaurants & Leisure) | 2,648 | | 316,489 |
| Zoetis, Inc. (Pharmaceuticals) | 3,518 | | 608,720 |
| | | | 39,917,421 |
Total Common Stocks
(Cost $49,009,591) | | | 66,368,974 |
| Short-Term Investments 3.5% |
| Affiliated Investment Company 1.9% |
| United States 1.9% |
| MainStay U.S. Government Liquidity Fund, 0.01% (d) | 1,274,532 | | 1,274,532 |
| Unaffiliated Investment Company 1.6% |
| United States 1.6% |
| BlackRock Liquidity FedFund, 0.05% (d)(e) | 1,092,023 | | 1,092,023 |
Total Short-Term Investments
(Cost $2,366,555) | | | 2,366,555 |
Total Investments
(Cost $51,376,146) | 101.4% | | 68,735,529 |
| Other Assets, Less Liabilities | (1.4) | | (928,969) |
| Net Assets | 100.0% | | $ 67,806,560 |
| † | Percentages indicated are based on Fund net assets. |
| (a) | Non-income producing security. |
| (b) | May be sold to institutional investors only under Rule 144A or securities offered pursuant to Section 4(a)(2) of the Securities Act of 1933, as amended. |
| 14 | MainStay Epoch Capital Growth Fund |
| (c) | All or a portion of this security was held on loan. As of April 30, 2021, the aggregate market value of securities on loan was $1,029,929; the total market value of collateral held by the Fund was $1,105,565. The market value of the collateral held included non-cash collateral in the form of U.S. Treasury securities with a value of $13,542. The Fund received cash collateral with a value of $1,092,023. (See Note 2(I)) |
| (d) | Current yield as of April 30, 2021. |
| (e) | Represents a security purchased with cash collateral received for securities on loan. |
| Abbreviation(s): |
| ADR—American Depositary Receipt |
| SDR—Special Drawing Right |
The following is a summary of the fair valuations according to the inputs used as of April 30, 2021, for valuing the Fund’s assets:
| Description | Quoted
Prices in
Active
Markets for
Identical
Assets
(Level 1) | | Significant
Other
Observable
Inputs
(Level 2) | | Significant
Unobservable
Inputs
(Level 3) | | Total |
| Asset Valuation Inputs | | | | | | | |
| Investments in Securities (a) | | | | | | | |
| Common Stocks | $ 63,552,897 | | $ 2,816,077 | | $ — | | $ 66,368,974 |
| Short-Term Investments | | | | | | | |
| Affiliated Investment Company | 1,274,532 | | — | | — | | 1,274,532 |
| Unaffiliated Investment Company | 1,092,023 | | — | | — | | 1,092,023 |
| Total Short-Term Investments | 2,366,555 | | — | | — | | 2,366,555 |
| Total Investments in Securities | $ 65,919,452 | | $ 2,816,077 | | $ — | | $ 68,735,529 |
| (a) | For a complete listing of investments and their industries, see the Portfolio of Investments. |
Portfolio of Investments April 30, 2021† (Unaudited) (continued)
The table below sets forth the diversification of the Fund’s investments by industry.
Industry Diversification
| | Value | | Percent |
| Air Freight & Logistics | $ 309,146 | | 0.4% |
| Airlines | 528,859 | | 0.8 |
| Auto Components | 789,158 | | 1.2 |
| Banks | 1,628,437 | | 2.4 |
| Beverages | 1,441,859 | | 2.2 |
| Biotechnology | 2,022,776 | | 3.0 |
| Building Products | 634,009 | | 0.9 |
| Capital Markets | 3,869,516 | | 5.8 |
| Commercial Services & Supplies | 1,030,408 | | 1.5 |
| Communications Equipment | 593,465 | | 0.9 |
| Diversified Financial Services | 568,137 | | 0.8 |
| Electronic Equipment, Instruments & Components | 222,081 | | 0.3 |
| Entertainment | 1,813,898 | | 2.6 |
| Food & Staples Retailing | 2,615,907 | | 3.8 |
| Food Products | 333,533 | | 0.5 |
| Health Care Equipment & Supplies | 4,658,364 | | 6.9 |
| Health Care Providers & Services | 1,283,284 | | 1.9 |
| Health Care Technology | 773,139 | | 1.1 |
| Hotels, Restaurants & Leisure | 4,419,384 | | 6.6 |
| Household Durables | 281,038 | | 0.4 |
| Household Products | 586,370 | | 0.9 |
| Insurance | 341,221 | | 0.5 |
| Interactive Media & Services | 1,918,238 | | 2.9 |
| IT Services | 3,473,080 | | 5.1 |
| Leisure Products | 441,440 | | 0.6 |
| Life Sciences Tools & Services | 3,305,878 | | 4.8 |
| Machinery | 1,085,435 | | 1.6 |
| Marine | 660,614 | | 1.0 |
| Media | 318,523 | | 0.4 |
| Metals & Mining | 1,149,392 | | 1.7 |
| Pharmaceuticals | 3,385,317 | | 4.9 |
| Professional Services | 742,940 | | 1.1 |
| Road & Rail | 590,537 | | 0.9 |
| Semiconductors & Semiconductor Equipment | 6,960,997 | | 10.4 |
| Software | 4,989,606 | | 7.4 |
| Specialty Retail | 1,721,461 | | 2.5 |
| Technology Hardware, Storage & Peripherals | 1,635,520 | | 2.4 |
| Textiles, Apparel & Luxury Goods | 627,699 | | 0.9 |
| Tobacco | 629,144 | | 0.9 |
| Trading Companies & Distributors | 1,989,164 | | 3.0 |
| | 66,368,974 | | 97.9 |
| | Value | | Percent |
| Short-Term Investments | $ 2,366,555 | | 3.5% |
| Other Assets, Less Liabilities | (928,969) | | (1.4) |
| Net Assets | $67,806,560 | | 100.0% |
| † | Percentages indicated are based on Fund net assets. |
| 16 | MainStay Epoch Capital Growth Fund |
Statement of Assets and Liabilities as of April 30, 2021 (Unaudited)
| Assets |
Investment in unaffiliated securities, at value
(identified cost $50,101,614) including securities on loan of $1,029,929 | $67,460,997 |
Investment in affiliated investment companies, at value
(identified cost $1,274,532) | 1,274,532 |
| Due from broker | 147,756 |
| Receivables: | |
| Fund shares sold | 202,196 |
| Dividends and interest | 151,648 |
| Securities lending | 597 |
| Investment securities sold | 3 |
| Other assets | 24,419 |
| Total assets | 69,262,148 |
| Liabilities |
| Cash collateral received for securities on loan | 1,092,023 |
| Due to custodian | 5,455 |
| Foreign currency due to custodian, at value | 3,360 |
| Payables: | |
| Investment securities purchased | 260,690 |
| Manager (See Note 3) | 30,779 |
| Professional fees | 28,564 |
| Shareholder communication | 13,916 |
| Custodian | 9,729 |
| NYLIFE Distributors (See Note 3) | 4,088 |
| Transfer agent (See Note 3) | 1,933 |
| Fund shares redeemed | 234 |
| Trustees | 31 |
| Accrued expenses | 4,786 |
| Total liabilities | 1,455,588 |
| Net assets | $67,806,560 |
| Composition of Net Assets |
| Shares of beneficial interest outstanding (par value of $.001 per share) unlimited number of shares authorized | $ 4,368 |
| Additional paid-in-capital | 33,191,020 |
| | 33,195,388 |
| Total distributable earnings (loss) | 34,611,172 |
| Net assets | $67,806,560 |
| Class A | |
| Net assets applicable to outstanding shares | $14,938,478 |
| Shares of beneficial interest outstanding | 963,368 |
| Net asset value per share outstanding | $ 15.51 |
| Maximum sales charge (5.50% of offering price) | 0.90 |
| Maximum offering price per share outstanding | $ 16.41 |
| Investor Class | |
| Net assets applicable to outstanding shares | $ 1,796,542 |
| Shares of beneficial interest outstanding | 116,096 |
| Net asset value per share outstanding | $ 15.47 |
| Maximum sales charge (5.00% of offering price) | 0.81 |
| Maximum offering price per share outstanding | $ 16.28 |
| Class C | |
| Net assets applicable to outstanding shares | $ 1,125,124 |
| Shares of beneficial interest outstanding | 74,782 |
| Net asset value and offering price per share outstanding | $ 15.05 |
| Class I | |
| Net assets applicable to outstanding shares | $49,946,416 |
| Shares of beneficial interest outstanding | 3,213,575 |
| Net asset value and offering price per share outstanding | $ 15.54 |
The notes to the financial statements are an integral part of, and should be read in conjunction with, the financial statements.
17
Statement of Operations for the six months ended April 30, 2021 (Unaudited)
| Investment Income (Loss) |
| Income | |
| Dividends-unaffiliated (net of foreign tax withholding of $21,471) | $ 393,622 |
| Securities lending | 724 |
| Dividends-affiliated | 96 |
| Total income | 394,442 |
| Expenses | |
| Manager (See Note 3) | 244,894 |
| Registration | 31,058 |
| Custodian | 28,808 |
| Professional fees | 27,787 |
| Distribution/Service—Class A (See Note 3) | 12,710 |
| Distribution/Service—Investor Class (See Note 3) | 1,990 |
| Distribution/Service—Class C (See Note 3) | 5,898 |
| Transfer agent (See Note 3) | 9,489 |
| Shareholder communication | 7,220 |
| Interest expense | 1,300 |
| Trustees | 789 |
| Insurance | 570 |
| Miscellaneous | 4,934 |
| Total expenses before waiver/reimbursement | 377,447 |
| Expense waiver/reimbursement from Manager (See Note 3) | (58,052) |
| Net expenses | 319,395 |
| Net investment income (loss) | 75,047 |
| Realized and Unrealized Gain (Loss) |
| Net realized gain (loss) on: | |
| Unaffiliated investment transactions | 17,415,002 |
| Foreign currency transactions | (20,896) |
| Net realized gain (loss) | 17,394,106 |
| Net change in unrealized appreciation (depreciation) on: | |
| Unaffiliated investments | 262,998 |
| Translation of other assets and liabilities in foreign currencies | 974 |
| Net change in unrealized appreciation (depreciation) | 263,972 |
| Net realized and unrealized gain (loss) | 17,658,078 |
| Net increase (decrease) in net assets resulting from operations | $17,733,125 |
The notes to the financial statements are an integral part of, and should be read in conjunction with, the financial statements.
| 18 | MainStay Epoch Capital Growth Fund |
Statements of Changes in Net Assets
for the six months ended April 30, 2021 (Unaudited) and the year ended October 31, 2020
| | 2021 | 2020 |
| Increase (Decrease) in Net Assets |
| Operations: | | |
| Net investment income (loss) | $ 75,047 | $ 277,155 |
| Net realized gain (loss) | 17,394,106 | 19,404,085 |
| Net change in unrealized appreciation (depreciation) | 263,972 | (2,801,415) |
| Net increase (decrease) in net assets resulting from operations | 17,733,125 | 16,879,825 |
| Distributions to shareholders: | | |
| Class A | (1,425,751) | (216,436) |
| Investor Class | (268,239) | (60,202) |
| Class C | (201,859) | (58,323) |
| Class I | (10,411,550) | (6,493,759) |
| Total distributions to shareholders | (12,307,399) | (6,828,720) |
| Capital share transactions: | | |
| Net proceeds from sales of shares | 30,856,678 | 5,483,276 |
| Net asset value of shares issued to shareholder in reinvestment of distributions | 12,162,652 | 6,767,399 |
| Cost of shares redeemed | (46,441,619) | (82,415,573) |
| Increase (decrease) in net assets derived from capital share transactions | (3,422,289) | (70,164,898) |
| Net increase (decrease) in net assets | 2,003,437 | (60,113,793) |
| Net Assets |
| Beginning of period | 65,803,123 | 125,916,916 |
| End of period | $ 67,806,560 | $ 65,803,123 |
The notes to the financial statements are an integral part of, and should be read in conjunction with, the financial statements.
19
Financial Highlights selected per share data and ratios
| | Six months ended
April 30,
2021* | | Year Ended October 31, | | June 30, 2016^ through
October 31,
2016 |
| Class A | 2020 | | 2019 | | 2018 | | 2017 | |
| Net asset value at beginning of period | $ 14.43 | | $ 13.20 | | $ 12.21 | | $ 12.55 | | $ 10.10 | | $ 10.00 |
| Net investment income (loss) | 0.00‡ (a) | | 0.00‡ (a) | | 0.07(a) | | 0.07(a) | | 0.05(a) | | 0.01 |
| Net realized and unrealized gain (loss) on investments | 3.84 | | 1.92 | | 1.81 | | 0.02 | | 2.42 | | 0.09 |
| Net realized and unrealized gain (loss) on foreign currency transactions‡ | (0.00) | | (0.00) | | (0.00) | | (0.00) | | (0.00) | | (0.00) |
| Total from investment operations | 3.84 | | 1.92 | | 1.88 | | 0.09 | | 2.47 | | 0.10 |
| Less distributions: | | | | | | | | | | | |
| From net investment income | (0.03) | | (0.07) | | (0.08) | | (0.07) | | (0.02) | | — |
| From net realized gain on investments | (2.73) | | (0.62) | | (0.81) | | (0.36) | | — | | — |
| Total distributions | (2.76) | | (0.69) | | (0.89) | | (0.43) | | (0.02) | | — |
| Net asset value at end of period | $ 15.51 | | $ 14.43 | | $ 13.20 | | $ 12.21 | | $ 12.55 | | $ 10.10 |
| Total investment return (b) | 29.43% | | 15.31% | | 16.82% | | 0.63% | | 24.52% | | 1.00% |
| Ratios (to average net assets)/Supplemental Data: | | | | | | | | | | | |
| Net investment income (loss) | 0.02%†† | | 0.01% | | 0.58% | | 0.57% | | 0.46% | | 0.22%†† |
| Net expenses (c) | 1.15%†† (d) | | 1.13% | | 1.15% | | 1.15% | | 1.15% | | 1.20%†† |
| Expenses (before waiver/reimbursement) (c) | 1.34%†† (d) | | 1.16% | | 1.27% | | 1.15% | | 1.15% | | 1.61%†† |
| Portfolio turnover rate | 59% | | 43% | | 46% | | 51% | | 56% | | 26% |
| Net assets at end of period (in 000’s) | $ 14,938 | | $ 6,733 | | $ 4,041 | | $ 268 | | $ 110 | | $ 25 |
| * | Unaudited. |
| ^ | Inception date. |
| ‡ | Less than one cent per share. |
| †† | Annualized. |
| (a) | Per share data based on average shares outstanding during the period. |
| (b) | Total investment return is calculated exclusive of sales charges and assumes the reinvestment of dividends and distributions. For periods of less than one year, total return is not annualized. |
| (c) | In addition to the fees and expenses which the Fund bears directly, it also indirectly bears a pro-rata share of the fees and expenses of the underlying funds in which it invests. Such indirect expenses are not included in the above expense ratios. |
| (d) | Net of interest expense of less than 0.01%. (See Note 6) |
The notes to the financial statements are an integral part of, and should be read in conjunction with, the financial statements.
| 20 | MainStay Epoch Capital Growth Fund |
Financial Highlights selected per share data and ratios
| | Six months ended
April 30,
2021* | | Year Ended October 31, | | June 30, 2016^ through
October 31,
2016 |
| Investor Class | 2020 | | 2019 | | 2018 | | 2017 | |
| Net asset value at beginning of period | $ 14.40 | | $ 13.16 | | $ 12.18 | | $ 12.54 | | $ 10.10 | | $ 10.00 |
| Net investment income (loss) | (0.02) (a) | | (0.02) (a) | | 0.04(a) | | 0.05(a) | | 0.05(a) | | 0.01 |
| Net realized and unrealized gain (loss) on investments | 3.82 | | 1.92 | | 1.80 | | 0.01 | | 2.41 | | 0.09 |
| Net realized and unrealized gain (loss) on foreign currency transactions‡ | (0.00) | | (0.00) | | (0.00) | | (0.00) | | (0.00) | | (0.00) |
| Total from investment operations | 3.80 | | 1.90 | | 1.84 | | 0.06 | | 2.46 | | 0.10 |
| Less distributions: | | | | | | | | | | | |
| From net investment income | (0.00)‡ | | (0.04) | | (0.05) | | (0.06) | | (0.02) | | — |
| From net realized gain on investments | (2.73) | | (0.62) | | (0.81) | | (0.36) | | — | | — |
| Total distributions | (2.73) | | (0.66) | | (0.86) | | (0.42) | | (0.02) | | — |
| Net asset value at end of period | $ 15.47 | | $ 14.40 | | $ 13.16 | | $ 12.18 | | $ 12.54 | | $ 10.10 |
| Total investment return (b) | 29.12% | | 15.14% | | 16.42% | | 0.40% | | 24.43% | | 1.00% |
| Ratios (to average net assets)/Supplemental Data: | | | | | | | | | | | |
| Net investment income (loss) | (0.21)%†† | | (0.17)% | | 0.30% | | 0.40% | | 0.39% | | 0.23%†† |
| Net expenses (c) | 1.41%†† (d) | | 1.34% | | 1.43% | | 1.40% | | 1.27% | | 1.20%†† |
| Expenses (before waiver/reimbursement) (c) | 1.55%†† (d) | | 1.36% | | 1.54% | | 1.40% | | 1.27% | | 1.61%†† |
| Portfolio turnover rate | 59% | | 43% | | 46% | | 51% | | 56% | | 26% |
| Net assets at end of period (in 000’s) | $ 1,797 | | $ 1,416 | | $ 1,177 | | $ 78 | | $ 75 | | $ 25 |
| * | Unaudited. |
| ^ | Inception date. |
| ‡ | Less than one cent per share. |
| †† | Annualized. |
| (a) | Per share data based on average shares outstanding during the period. |
| (b) | Total investment return is calculated exclusive of sales charges and assumes the reinvestment of dividends and distributions. For periods of less than one year, total return is not annualized. |
| (c) | In addition to the fees and expenses which the Fund bears directly, it also indirectly bears a pro-rata share of the fees and expenses of the underlying funds in which it invests. Such indirect expenses are not included in the above expense ratios. |
| (d) | Net of interest expense of less than 0.01%. (See Note 6) |
The notes to the financial statements are an integral part of, and should be read in conjunction with, the financial statements.
21
Financial Highlights selected per share data and ratios
| | Six months ended
April 30,
2021* | | Year Ended October 31, | | June 30, 2016^ through
October 31,
2016 |
| Class C | 2020 | | 2019 | | 2018 | | 2017 | |
| Net asset value at beginning of period | $ 14.10 | | $ 12.97 | | $ 12.04 | | $ 12.44 | | $ 10.08 | | $ 10.00 |
| Net investment income (loss) | (0.07) (a) | | (0.12) (a) | | (0.06) (a) | | (0.05) (a) | | (0.03) (a) | | (0.02) |
| Net realized and unrealized gain (loss) on investments | 3.75 | | 1.87 | | 1.80 | | 0.01 | | 2.39 | | 0.10 |
| Net realized and unrealized gain (loss) on foreign currency transactions‡ | (0.00) | | (0.00) | | (0.00) | | (0.00) | | (0.00) | | (0.00) |
| Total from investment operations | 3.68 | | 1.75 | | 1.74 | | (0.04) | | 2.36 | | 0.08 |
| Less distributions: | | | | | | | | | | | |
| From net investment income | — | | (0.62) | | (0.81) | | (0.36) | | — | | — |
| From net realized gain on investments | (2.73) | | — | | — | | — | | — | | — |
| Total distributions | (2.73) | | (0.62) | | (0.81) | | (0.36) | | — | | — |
| Net asset value at end of period | $ 15.05 | | $ 14.10 | | $ 12.97 | | $ 12.04 | | $ 12.44 | | $ 10.08 |
| Total investment return (b) | 28.85% | | 14.24% | | 15.59% | | (0.38)% | | 23.41% | | 0.80% |
| Ratios (to average net assets)/Supplemental Data: | | | | | | | | | | | |
| Net investment income (loss) | (1.00)%†† | | (0.92)% | | (0.46)% | | (0.40)% | | (0.27)% | | (0.50)%†† |
| Net expenses (c) | 2.16%†† (d) | | 2.09% | | 2.17% | | 2.15% | | 1.99% | | 1.95%†† |
| Expenses (before waiver/reimbursement) (c) | 2.30%†† (d) | | 2.11% | | 2.27% | | 2.15% | | 1.99% | | 2.36%†† |
| Portfolio turnover rate | 59% | | 43% | | 46% | | 51% | | 56% | | 26% |
| Net assets at end of period (in 000’s) | $ 1,125 | | $ 1,152 | | $ 1,236 | | $ 41 | | $ 41 | | $ 25 |
| * | Unaudited. |
| ^ | Inception date. |
| ‡ | Less than one cent per share. |
| †† | Annualized. |
| (a) | Per share data based on average shares outstanding during the period. |
| (b) | Total investment return is calculated exclusive of sales charges and assumes the reinvestment of dividends and distributions. For periods of less than one year, total return is not annualized. |
| (c) | In addition to the fees and expenses which the Fund bears directly, it also indirectly bears a pro-rata share of the fees and expenses of the underlying funds in which it invests. Such indirect expenses are not included in the above expense ratios. |
| (d) | Net of interest expense of less than 0.01%. (See Note 6) |
The notes to the financial statements are an integral part of, and should be read in conjunction with, the financial statements.
| 22 | MainStay Epoch Capital Growth Fund |
Financial Highlights selected per share data and ratios
| | Six months ended
April 30,
2021* | | Year Ended October 31, | | June 30, 2016^ through
October 31,
2016 |
| Class I | 2020 | | 2019 | | 2018 | | 2017 | |
| Net asset value at beginning of period | $ 14.47 | | $ 13.23 | | $ 12.24 | | $ 12.57 | | $ 10.11 | | $ 10.00 |
| Net investment income (loss) | 0.02(a) | | 0.04(a) | | 0.08(a) | | 0.11(a) | | 0.09(a) | | 0.02 |
| Net realized and unrealized gain (loss) on investments | 3.85 | | 1.92 | | 1.83 | | 0.01 | | 2.40 | | 0.09 |
| Net realized and unrealized gain (loss) on foreign currency transactions‡ | (0.00) | | (0.00) | | (0.00) | | (0.00) | | (0.00) | | (0.00) |
| Total from investment operations | 3.87 | | 1.96 | | 1.91 | | 0.12 | | 2.49 | | 0.11 |
| Less distributions: | | | | | | | | | | | |
| From net investment income | (0.07) | | (0.10) | | (0.11) | | (0.09) | | (0.03) | | — |
| From net realized gain on investments | (2.73) | | (0.62) | | (0.81) | | (0.36) | | — | | — |
| Total distributions | (2.80) | | (0.72) | | (0.92) | | (0.45) | | (0.03) | | — |
| Net asset value at end of period | $ 15.54 | | $ 14.47 | | $ 13.23 | | $ 12.24 | | $ 12.57 | | $ 10.11 |
| Total investment return (b) | 29.57% | | 15.58% | | 17.11% | | 0.87% | | 24.74% | | 1.10% |
| Ratios (to average net assets)/Supplemental Data: | | | | | | | | | | | |
| Net investment income (loss) | 0.31%†† | | 0.29% | | 0.66% | | 0.83% | | 0.78% | | 0.63%†† |
| Net expenses (c) | 0.90%†† (d) | | 0.90% | | 0.90% | | 0.90% | | 0.93% | | 0.95%†† |
| Expenses (before waiver/reimbursement) (c) | 1.08%†† (d) | | 0.93% | | 1.00% | | 0.90% | | 0.93% | | 1.36%†† |
| Portfolio turnover rate | 59% | | 43% | | 46% | | 51% | | 56% | | 26% |
| Net assets at end of period (in 000’s) | $ 49,946 | | $ 56,502 | | $ 119,464 | | $ 106,925 | | $ 107,596 | | $ 82,970 |
| * | Unaudited. |
| ^ | Inception date. |
| ‡ | Less than one cent per share. |
| †† | Annualized. |
| (a) | Per share data based on average shares outstanding during the period. |
| (b) | Total investment return is calculated exclusive of sales charges and assumes the reinvestment of dividends and distributions. Class I shares are not subject to sales charges. For periods of less than one year, total return is not annualized. |
| (c) | In addition to the fees and expenses which the Fund bears directly, it also indirectly bears a pro-rata share of the fees and expenses of the underlying funds in which it invests. Such indirect expenses are not included in the above expense ratios. |
| (d) | Net of interest expense of less than 0.01%. (See Note 6) |
The notes to the financial statements are an integral part of, and should be read in conjunction with, the financial statements.
23
Notes to Financial Statements (Unaudited)
Note 1-Organization and Business
MainStay Funds Trust (the “Trust”) was organized as a Delaware statutory trust on April 28, 2009. The Trust is registered under the Investment Company Act of 1940, as amended (the “1940 Act”), as an open-end management investment company, and is comprised of thirty-two funds (collectively referred to as the “Funds”). These financial statements and notes relate to the MainStay Epoch Capital Growth Fund (the "Fund"), a “diversified” fund, as that term is defined in the 1940 Act, as interpreted or modified by regulatory authorities having jurisdiction, from time to time.
The following table lists the Fund's share classes that have been registered and commenced operations:
| Class | Commenced Operations |
| Class A | June 30, 2016 |
| Investor Class | June 30, 2016 |
| Class C | June 30, 2016 |
| Class I | June 30, 2016 |
| Class R6 | N/A* |
| SIMPLE Class | N/A* |
| * | Class R6 shares were registered for sale effective as of February 28, 2017 and SIMPLE Class shares were registered for sale effective as of August 31, 2020 but have not yet commenced operations. |
Class A and Investor Class shares are offered at net asset value (“NAV”) per share plus an initial sales charge. No initial sales charge applies to investments of $1 million or more (and certain other qualified purchases) in Class A and Investor Class shares. However, a contingent deferred sales charge (“CDSC”) of 1.00% may be imposed on certain redemptions made within 18 months of the date of purchase on shares that were purchased without an initial sales charge. Class C shares are offered at NAV without an initial sales charge, although a 1.00% CDSC may be imposed on certain redemptions of such shares made within one year of the date of purchase of Class C shares. Class I shares are offered at NAV without a sales charge. Class R6 and SIMPLE Class shares are currently expected to be offered at NAV without a sales charge. Depending upon eligibility, Class C shares convert to either Class A or Investor Class shares at the end of the calendar quarter ten years after the date they were purchased. Additionally, Investor Class shares may convert automatically to Class A shares. Under certain circumstances and as may be permitted by the Trust’s multiple class plan pursuant to Rule 18f-3 under the 1940 Act, specified share classes of the Fund may be converted to one or more other share classes of the Fund as disclosed in the capital share transactions within these Notes. The classes of shares have the same voting (except for issues that relate solely to one class), dividend, liquidation and other rights, and the same terms and conditions, except that under distribution plans pursuant to Rule 12b-1 under the 1940 Act, Class C shares are subject to higher distribution and/or service fees than Class A, Investor Class and SIMPLE Class shares. Class I and Class R6 shares are not subject to a distribution and/or service fee.
The Fund's investment objective is to seek long-term capital appreciation.
Note 2–Significant Accounting Policies
The Fund is an investment company and accordingly follows the investment company accounting and reporting guidance of the Financial Accounting Standards Board (“FASB”) Accounting Standard Codification Topic 946 Financial Services—Investment Companies. The Fund prepares its financial statements in accordance with generally accepted accounting principles (“GAAP”) in the United States of America and follows the significant accounting policies described below.
(A) Securities Valuation. Investments are usually valued as of the close of regular trading on the New York Stock Exchange (the "Exchange") (usually 4:00 p.m. Eastern time) on each day the Fund is open for business ("valuation date").
The Board of Trustees of the Trust (the "Board") adopted procedures establishing methodologies for the valuation of the Fund's securities and other assets and delegated the responsibility for valuation determinations under those procedures to the Valuation Committee of the Trust (the “Valuation Committee”). The procedures state that, subject to the oversight of the Board and unless otherwise noted, the responsibility for the day-to-day valuation of portfolio assets (including fair value measurements for the Fund's assets and liabilities) rests with New York Life Investment Management LLC (“New York Life Investments” or the "Manager"), aided to whatever extent necessary by the Subadvisor (as defined in Note 3(A)). To assess the appropriateness of security valuations, the Manager, the Subadvisor or the Fund's third-party service provider, who is subject to oversight by the Manager, regularly compares prior day prices, prices on comparable securities and the sale prices to the prior and current day prices and challenges prices with changes exceeding certain tolerance levels with third-party pricing services or broker sources.
The Board authorized the Valuation Committee to appoint a Valuation Subcommittee (the “Subcommittee”) to establish the prices of securities for which market quotations are not readily available or the prices of which are not otherwise readily determinable under the procedures. The Subcommittee meets (in person, via electronic mail or via teleconference) on an as-needed basis. The Valuation Committee meets to ensure that actions taken by the Subcommittee were appropriate.
For those securities valued through either a standardized fair valuation methodology or a fair valuation measurement, the Subcommittee deals with such valuation and the Valuation Committee reviews and affirms, if appropriate, the reasonableness of the valuation based on such methodologies and measurements on a regular basis after considering information that is reasonably available and deemed relevant by the Valuation Committee. Any action taken by the Subcommittee with respect to the valuation of a portfolio security or other asset is submitted for review and ratification (if appropriate) to the Valuation Committee and the Board at the next regularly scheduled meeting.
"Fair value" is defined as the price the Fund would reasonably expect to receive upon selling an asset or liability in an orderly transaction to an independent buyer in the principal or most advantageous market for the
| 24 | MainStay Epoch Capital Growth Fund |
asset or liability. Fair value measurements are determined within a framework that establishes a three-tier hierarchy that maximizes the use of observable market data and minimizes the use of unobservable inputs to establish a classification of fair value measurements for disclosure purposes. "Inputs" refer broadly to the assumptions that market participants would use in pricing the asset or liability, including assumptions about risk, such as the risk inherent in a particular valuation technique used to measure fair value using a pricing model and/or the risk inherent in the inputs for the valuation technique. Inputs may be observable or unobservable. Observable inputs reflect the assumptions market participants would use in pricing the asset or liability based on market data obtained from sources independent of the Fund. Unobservable inputs reflect the Fund’s own assumptions about the assumptions market participants would use in pricing the asset or liability based on the information available. The inputs or methodology used for valuing assets or liabilities may not be an indication of the risks associated with investing in those assets or liabilities. The three-tier hierarchy of inputs is summarized below.
| • | Level 1—quoted prices in active markets for an identical asset or liability |
| • | Level 2—other significant observable inputs (including quoted prices for a similar asset or liability in active markets, interest rates and yield curves, prepayment speeds, credit risk, etc.) |
| • | Level 3—significant unobservable inputs (including the Fund's own assumptions about the assumptions that market participants would use in measuring fair value of an asset or liability) |
The level of an asset or liability within the fair value hierarchy is based on the lowest level of an input, both individually and in the aggregate, that is significant to the fair value measurement. The aggregate value by input level of the Fund’s assets and liabilities as of April 30, 2021, is included at the end of the Portfolio of Investments.
The Fund may use third-party vendor evaluations, whose prices may be derived from one or more of the following standard inputs, among others:
| • Broker/dealer quotes | • Benchmark securities |
| • Two-sided markets | • Reference data (corporate actions or material event notices) |
| • Bids/offers | • Monthly payment information |
| • Industry and economic events | • Reported trades |
An asset or liability for which market values cannot be measured using the methodologies described above is valued by methods deemed reasonable in good faith by the Valuation Committee, following the procedures established by the Board, to represent fair value. Under these procedures, the Fund generally uses a market-based approach which may use related or comparable assets or liabilities, recent transactions, market multiples, book values and other relevant information. The Fund may also use an income-based valuation approach in which the anticipated future cash flows of the asset or liability are discounted to calculate fair value. Discounts may also be applied due to the nature
and/or duration of any restrictions on the disposition of the asset or liability. Fair value represents a good faith approximation of the value of a security. Fair value determinations involve the consideration of a number of subjective factors, an analysis of applicable facts and circumstances and the exercise of judgment. As a result, it is possible that the fair value for a security determined in good faith in accordance with the Fund's valuation procedures may differ from valuations for the same security determined by other funds using their own valuation procedures. Although the Fund's valuation procedures are designed to value a security at the price the Fund may reasonably expect to receive upon the security's sale in an orderly transaction, there can be no assurance that any fair value determination thereunder would, in fact, approximate the amount that the Fund would actually realize upon the sale of the security or the price at which the security would trade if a reliable market price were readily available. During the six-month period ended April 30, 2021, there were no material changes to the fair value methodologies.
Securities which may be valued in this manner include, but are not limited to: (i) a security for which trading has been halted or suspended; (ii) a debt security that has recently gone into default and for which there is not a current market quotation; (iii) a security of an issuer that has entered into a restructuring; (iv) a security that has been delisted from a national exchange; (v) a security for which the market price is not readily available from a third-party pricing source or, if so provided, does not, in the opinion of the Manager or the Subadvisor, reflect the security's market value; (vi) a security subject to trading collars for which no or limited trading takes place; and (vii) a security whose principal market has been temporarily closed at a time when, under normal conditions, it would be open. Securities valued in this manner are generally categorized as Level 3 in the hierarchy. No securities held by the Fund as of April 30, 2021 were fair valued in such a manner.
Certain securities held by the Fund may principally trade in foreign markets. Events may occur between the time the foreign markets close and the time at which the Fund's NAVs are calculated. These events may include, but are not limited to, situations relating to a single issuer in a market sector, significant fluctuations in U.S. or foreign markets, natural disasters, armed conflicts, governmental actions or other developments not tied directly to the securities markets. Should the Manager or the Subadvisor conclude that such events may have affected the accuracy of the last price of such securities reported on the local foreign market, the Subcommittee may, pursuant to procedures adopted by the Board, adjust the value of the local price to reflect the estimated impact on the price of such securities as a result of such events. In this instance, securities are generally categorized as Level 3 in the hierarchy. Additionally, certain foreign equity securities are also fair valued whenever the movement of a particular index exceeds certain thresholds. In such cases, the securities are fair valued by applying factors provided by a third-party vendor in accordance with valuation procedures adopted by the Board and are generally categorized as Level 2 in the hierarchy. No foreign equity securities held by the Fund as of April 30, 2021 were fair valued in such a manner.
Notes to Financial Statements (Unaudited) (continued)
Equity securities are valued at the last quoted sales prices as of the close of regular trading on the relevant exchange on each valuation date. Securities that are not traded on the valuation date are valued at the mean of the last quoted bid and ask prices. Prices are normally taken from the principal market in which each security trades. These securities are generally categorized as Level 1 in the hierarchy.
Investments in mutual funds, including money market funds, are valued at their respective NAVs at the close of business each day on the valuation date. These securities are generally categorized as Level 1 in the hierarchy.
Temporary cash investments acquired in excess of 60 days to maturity at the time of purchase are valued using the latest bid prices or using valuations based on a matrix system (which considers such factors as security prices, yields, maturities and ratings), both as furnished by independent pricing services. Temporary cash investments that mature in 60 days or less at the time of purchase ("Short-Term Investments") are valued using the amortized cost method of valuation, unless the use of such method would be inappropriate. The amortized cost method involves valuing a security at its cost on the date of purchase and thereafter assuming a constant amortization to maturity of the difference between such cost and the value on maturity date. Amortized cost approximates the current fair value of a security. Securities valued using the amortized cost method are not valued using quoted prices in an active market and are generally categorized as Level 2 in the hierarchy.
The information above is not intended to reflect an exhaustive list of the methodologies that may be used to value portfolio investments. The valuation procedures permit the use of a variety of valuation methodologies in connection with valuing portfolio investments. The methodology used for a specific type of investment may vary based on the market data available or other considerations. The methodologies summarized above may not represent the specific means by which portfolio investments are valued on any particular business day.
(B) Income Taxes. The Fund's policy is to comply with the requirements of the Internal Revenue Code of 1986, as amended (the “Internal Revenue Code”), applicable to regulated investment companies and to distribute all of its taxable income to the shareholders of the Fund within the allowable time limits.
The Manager evaluates the Fund’s tax positions to determine if the tax positions taken meet the minimum recognition threshold in connection with accounting for uncertainties in income tax positions taken or expected to be taken for the purposes of measuring and recognizing tax liabilities in the financial statements. Recognition of tax benefits of an uncertain tax position is permitted only to the extent the position is “more likely than not” to be sustained assuming examination by taxing authorities. The Manager analyzed the Fund's tax positions taken on federal, state and local income tax returns for all open tax years (for up to three tax years) and has concluded that no provisions for federal, state and local income tax are required in the Fund's financial statements. The Fund's federal, state and local income tax and federal excise tax returns
for tax years for which the applicable statutes of limitations have not expired are subject to examination by the Internal Revenue Service and state and local departments of revenue.
(C) Foreign Taxes. The Fund may be subject to foreign taxes on income and other transaction-based taxes imposed by certain countries in which it invests. A portion of the taxes on gains on investments or currency purchases/repatriation may be reclaimable. The Fund will accrue such taxes and reclaims as applicable, based upon its current interpretation of tax rules and regulations that exist in the markets in which it invests.
The Fund may be subject to taxation on realized capital gains, repatriation proceeds and other transaction-based taxes imposed by certain countries in which it invests. The Fund will accrue such taxes as applicable based upon its current interpretation of tax rules and regulations that exist in the market in which it invests. Capital gains taxes relating to positions still held are reflected as a liability in the Statement of Assets and Liabilities, as well as an adjustment to the Fund's net unrealized appreciation (depreciation). Taxes related to capital gains realized, if any, are reflected as part of net realized gain (loss) in the Statement of Operations. Changes in tax liabilities related to capital gains taxes on unrealized investment gains, if any, are reflected as part of the change in net unrealized appreciation (depreciation) on investments in the Statement of Operations. Transaction-based charges are generally assessed as a percentage of the transaction amount.
(D) Dividends and Distributions to Shareholders. Dividends and distributions are recorded on the ex-dividend date. The Fund intends to declare and pay dividends from net investment income and distributions from net realized capital and currency gains, if any, at least annually. Unless a shareholder elects otherwise, all dividends and distributions are reinvested at NAV in the same class of shares of the Fund. Dividends and distributions to shareholders are determined in accordance with federal income tax regulations and may differ from determinations using GAAP.
(E) Security Transactions and Investment Income. The Fund records security transactions on the trade date. Realized gains and losses on security transactions are determined using the identified cost method. Dividend income is recognized on the ex-dividend date, net of any foreign tax withheld at the source, and interest income is accrued as earned using the effective interest rate method. Distributions received from real estate investment trusts may be classified as dividends, capital gains and/or return of capital.
Investment income and realized and unrealized gains and losses on investments of the Fund are allocated pro rata to the separate classes of shares based upon their relative net assets on the date the income is earned or realized and unrealized gains and losses are incurred.
(F) Expenses. Expenses of the Trust are allocated to the individual Funds in proportion to the net assets of the respective Funds when the expenses are incurred, except where direct allocations of expenses can be made. Expenses (other than transfer agent expenses and fees incurred under the shareholder services plans and/or the distribution plans further
| 26 | MainStay Epoch Capital Growth Fund |
discussed in Note 3(B)) are allocated to separate classes of shares pro rata based upon their relative net assets on the date the expenses are incurred. The expenses borne by the Fund, including those of related parties to the Fund, are shown in the Statement of Operations.
Additionally, the Fund may invest in mutual funds, which are subject to management fees and other fees that may cause the costs of investing in mutual funds to be greater than the costs of owning the underlying securities directly. These indirect expenses of mutual funds are not included in the amounts shown as expenses in the Statement of Operations or in the expense ratios included in the Financial Highlights.
(G) Use of Estimates. In preparing financial statements in conformity with GAAP, the Manager makes estimates and assumptions that affect the reported amounts and disclosures in the financial statements. Actual results could differ from those estimates and assumptions.
(H) Foreign Currency Transactions. The Fund's books and records are maintained in U.S. dollars. Prices of securities denominated in foreign currency amounts are translated into U.S. dollars at the mean between the buying and selling rates last quoted by any major U.S. bank at the following dates:
(i) market value of investment securities, other assets and liabilities— at the valuation date; and
(ii) purchases and sales of investment securities, income and expenses—at the date of such transactions.
The assets and liabilities that are denominated in foreign currency amounts are presented at the exchange rates and market values at the close of the period. The realized and unrealized changes in net assets arising from fluctuations in exchange rates and market prices of securities are not separately presented.
Net realized gain (loss) on foreign currency transactions represents net currency gains or losses realized as a result of differences between the amounts of securities sale proceeds or purchase cost, dividends, interest and withholding taxes as recorded on the Fund's books, and the U.S. dollar equivalent amount actually received or paid. Net currency gains or losses from valuing such foreign currency denominated assets and liabilities, other than investments at valuation date exchange rates, are reflected in unrealized foreign exchange gains or losses.
(I) Securities Lending. In order to realize additional income, the Fund may engage in securities lending, subject to the limitations set forth in the 1940 Act and relevant guidance by the staff of the Securities and Exchange Commission (“SEC”). If the Fund engages in securities lending, the Fund will lend through its custodian, JPMorgan Chase Bank, N.A., ("JPMorgan"), acting as securities lending agent on behalf of the Fund. Under the current arrangement, JPMorgan will manage the Fund's collateral in accordance with the securities lending agency agreement between the Fund and JPMorgan, and indemnify the Fund against counterparty risk. The loans will be collateralized by cash (which may be invested in a money market fund) and/or non-cash collateral (which may include U.S. Treasury securities and/or U.S. government agency securities
issued or guaranteed by the United States government or its agencies or instrumentalities) at least equal at all times to the market value of the securities loaned. The Fund bears the risk of delay in recovery of, or loss of rights in, the securities loaned. The Fund may also record a realized gain or loss on securities deemed sold due to a borrower’s inability to return securities on loan. The Fund bears the risk of any loss on investment of cash collateral. The Fund will receive compensation for lending its securities in the form of fees or it will retain a portion of interest earned on the investment of any cash collateral. The Fund will also continue to receive interest and dividends on the securities loaned and any gain or loss in the market price of the securities loaned that may occur during the term of the loan will be for the account of the Fund. Income earned from securities lending activities, if any, is reflected in the Statement of Operations. Securities on loan as of April 30, 2021, are shown in the Portfolio of Investments.
Prior to November 23, 2020, these services were provided by State Street Bank and Trust Company (“State Street”).
(J) Foreign Securities Risk. The Fund may invest in foreign securities, which carry certain risks that are in addition to the usual risks inherent in domestic securities. These risks include those resulting from currency fluctuations, future adverse political or economic developments and possible imposition of currency exchange blockages or other foreign governmental laws or restrictions. These risks are likely to be greater in emerging markets than in developed markets. The ability of issuers of debt securities held by the Fund to meet their obligations may be affected by, among other things, economic or political developments in a specific country, industry or region.
(K) Indemnifications. Under the Trust’s organizational documents, its officers and trustees are indemnified against certain liabilities that may arise out of performance of their duties to the Trust. Additionally, in the normal course of business, the Fund enters into contracts with third-party service providers that contain a variety of representations and warranties and that may provide general indemnifications. The Fund's maximum exposure under these arrangements is unknown, as this would involve future claims that may be made against the Fund that have not yet occurred. The Manager believes that the risk of loss in connection with these potential indemnification obligations is remote. However, there can be no assurance that material liabilities related to such obligations will not arise in the future, which could adversely impact the Fund.
Note 3–Fees and Related Party Transactions
(A) Manager and Subadvisor. New York Life Investments, a registered investment adviser and an indirect, wholly-owned subsidiary of New York Life Insurance Company (“New York Life”), serves as the Fund’s Manager, pursuant to an Amended and Restated Management Agreement (“Management Agreement”). The Manager provides offices, conducts clerical, recordkeeping and bookkeeping services and keeps most of the financial and accounting records required to be maintained by the Fund. Except for the portion of salaries and expenses that are the responsibility of the Fund, the Manager pays the salaries and expenses of all personnel
Notes to Financial Statements (Unaudited) (continued)
affiliated with the Fund and certain operational expenses of the Fund. The Fund reimburses New York Life Investments in an amount equal to the portion of the compensation of the Chief Compliance Officer attributable to the Fund. Epoch Investment Partners, Inc. (“Epoch” or the “Subadvisor”), a registered investment adviser, serves as Subadvisor to the Fund and is responsible for the day-to-day portfolio management of the Fund. Pursuant to the terms of an Amended and Restated Subadvisory Agreement (“Subadvisory Agreement”) between New York Life Investments and Epoch, New York Life Investments pays for the services of the Subadvisor.
Pursuant to the Management Agreement, the Fund pays the Manager a monthly fee for the services performed and the facilities furnished at an annual rate of 0.75% of the Fund's average daily net assets.
New York Life Investments has contractually agreed to waive fees and/or reimburse expenses so that Total Annual Fund Operating Expenses (excluding taxes, interest, litigation, extraordinary expenses, brokerage and other transaction expenses relating to the purchase or sale of portfolio investments and acquired (underlying) fund fees and expenses) do not exceed the following percentages of average daily net assets: Class A,1.15% and Class I, 0.90%. This agreement will remain in effect until February 28, 2022, and shall renew automatically for one-year terms unless New York Life Investments provides written notice of termination prior to the start of the next term or upon approval of the Board.
During the six-month period ended April 30, 2021, New York Life Investments earned fees from the Fund in the amount of $244,894 and waived fees and/or reimbursed expenses, including the voluntary waiver/reimbursement of certain class specific expenses in the amount of $58,052 and paid the Subadvisor in the amount of $93,566.
JPMorgan provides sub-administration and sub-accounting services to the Fund pursuant to an agreement with New York Life Investments. These services include calculating the daily NAVs of the Fund, maintaining the general ledger and sub-ledger accounts for the calculation of the Fund's NAVs, and assisting New York Life Investments in conducting various aspects of the Fund's administrative operations. For providing these services to the Fund, JPMorgan is compensated by New York Life Investments.
Prior to November 23, 2020, these services were provided by State Street.
Pursuant to an agreement between the Trust and New York Life Investments, New York Life Investments is responsible for providing or procuring certain regulatory reporting services for the Fund. The Fund will reimburse New York Life Investments for the actual costs incurred by New York Life Investments in connection with providing or procuring these services for the Fund.
(B) Distribution and Service Fees. The Trust, on behalf of the Fund, has entered into a distribution agreement with NYLIFE Distributors LLC (the “Distributor”), an affiliate of New York Life
Investments. The Fund has adopted distribution plans (the “Plans”) in accordance with the provisions of Rule 12b-1 under the 1940 Act.
Pursuant to the Class A and Investor Class Plans, the Distributor receives a monthly distribution fee from the Class A and Investor Class shares at an annual rate of 0.25% of the average daily net assets of the Class A and Investor Class shares for distribution and/or service activities as designated by the Distributor. Pursuant to the Class C Plan, Class C shares pay the Distributor a monthly distribution fee at an annual rate of 0.75% of the average daily net assets of the Class) C shares, along with a service fee at an annual rate of 0.25% of the average daily net assets of the Class C shares, for a total 12b-1 fee of 1.00%. Class I shares are not subject to a distribution and/or service fee.
The Plans provide that the distribution and service fees are payable to the Distributor regardless of the amounts actually expended by the Distributor for distribution of the Fund's shares and service activities.
(C) Sales Charges. The Fund was advised by the Distributor that the amount of initial sales charges retained on sales of Class A and Investor Class shares during the six-month period ended April 30, 2021, were $9,232 and $377, respectively.
(D) Transfer, Dividend Disbursing and Shareholder Servicing Agent. NYLIM Service Company LLC, an affiliate of New York Life Investments, is the Fund's transfer, dividend disbursing and shareholder servicing agent pursuant to an agreement between NYLIM Service Company LLC and the Trust. NYLIM Service Company LLC has entered into an agreement with DST Asset Manager Solutions, Inc. ("DST"), pursuant to which DST performs certain transfer agent services on behalf of NYLIM Service Company LLC. New York Life Investments has contractually agreed to limit the transfer agency expenses charged to the Fund’s share classes to a maximum of 0.35% of that share class’s average daily net assets on an annual basis after deducting any applicable Fund or class-level expense reimbursement or small account fees. This agreement will remain in effect until February 28, 2022, and shall renew automatically for one-year terms unless New York Life Investments provides written notice of termination prior to the start of the next term or upon approval of the Board. During the six-month period ended April 30, 2021, transfer agent expenses incurred by the Fund and any reimbursements, pursuant to the aforementioned Transfer Agency expense limitation agreement, were as follows:
| Class | Expense | Waived |
| Class A | $1,013 | $— |
| Investor Class | 1,876 | — |
| Class C | 1,391 | — |
| Class I | 5,209 | — |
(E) Small Account Fee. Shareholders with small accounts adversely impact the cost of providing transfer agency services. In an effort to reduce total transfer agency expenses, the Fund has implemented a small account fee on certain types of accounts. As described in the Fund's prospectus, certain shareholders with an account balance of less than
| 28 | MainStay Epoch Capital Growth Fund |
$1,000 ($5,000 for Class A share accounts) are charged an annual per account fee of $20 (assessed semi-annually), the proceeds from which offset transfer agent fees as reflected in the Statement of Operations.
This small account fee will not apply to certain types of accounts as described further in the Fund’s prospectus.
(F) Investments in Affiliates (in 000’s). During the six-month period ended April 30, 2021, purchases and sales transactions, income earned from investments and shares held of investment companies managed by New York Life Investments or its affiliates were as follows:
| Affiliated Investment Companies | Value,
Beginning
of Period | Purchases
at Cost | Proceeds
from
Sales | Net
Realized
Gain/(Loss)
on Sales | Change in
Unrealized
Appreciation/
(Depreciation) | Value,
End of
Period | Dividend
Income | Other
Distributions | Shares
End of
Period |
| MainStay U.S. Government Liquidity Fund | $ 739 | $ 49,197 | $ (48,661) | $ — | $ — | $ 1,275 | $ —(a) | $ — | 1,275 |
Note 4-Federal Income Tax
As of April 30, 2021, the cost and unrealized appreciation (depreciation) of the Fund’s investment portfolio, including applicable derivative contracts and other financial instruments, as determined on a federal income tax basis, were as follows:
| | Federal Tax
Cost | Gross
Unrealized
Appreciation | Gross
Unrealized
(Depreciation) | Net
Unrealized
Appreciation/
(Depreciation) |
| Investments | $51,463,440 | $17,690,192 | $(418,103) | $17,272,089 |
During the year ended October 31, 2020, the tax character of distributions paid as reflected in the Statements of Changes in Net Assets was as follows:
| | 2020 |
| Distributions paid from: | |
| Ordinary Income | $1,782,438 |
| Long-Term Capital Gains | 5,046,282 |
| Total | $6,828,720 |
Note 5–Custodian
JPMorgan is the custodian of cash and securities held by the Fund. Custodial fees are charged to the Fund based on the Fund's net assets and/or the market value of securities held by the Fund and the number of certain transactions incurred by the Fund.
Prior to November 23, 2020, these services were provided by State Street. The services provided by State Street were a direct expense of the Fund and are included in the Statement of Operations as Custodian fees which totaled $3,183 for the period November 1, 2020 through November 22, 2020.
Note 6–Line of Credit
The Fund and certain other funds managed by New York Life Investments maintain a line of credit with a syndicate of banks in order to secure a source of funds for temporary purposes to meet unanticipated or excessive redemption requests.
Effective July 28, 2020, under the credit agreement (the “Credit Agreement”), the aggregate commitment amount is $600,000,000 with an additional uncommitted amount of $100,000,000. The commitment fee is an annual rate of 0.15% of the average commitment amount payable quarterly, regardless of usage, to JPMorgan, who serves as the agent to the syndicate. The commitment fee is allocated among the Fund and certain other funds managed by New York Life Investments based upon their respective net assets and other factors. Interest on any revolving credit loan is charged based upon the Federal Funds Rate or the one-month London Interbank Offered Rate (“LIBOR”), whichever is higher. The Credit Agreement expires on July 27, 2021, although the Fund, certain other funds managed by New York Life Investments and the syndicate of banks may renew the Credit Agreement for an additional year on the same or different terms or enter into a credit agreement with a different syndicate of banks. Prior to July 28, 2020, the aggregate commitment amount and the commitment fee were the same as those under the current Credit Agreement, but State Street served as agent to the syndicate. During the six-month period ended April 30, 2021, the Fund utilized the line of credit for 5 days, maintained an average daily balance of $18,084,000, at a weighted average interest rate of 1.39% and incurred interest expense in the amount of $1,300. As of April 30, 2021, there were no borrowings made or outstanding with respect to the Fund under the Credit Agreement or the credit agreement for which State Street served as agent.
Note 7–Interfund Lending Program
Pursuant to an exemptive order issued by the SEC, the Fund, along with certain other funds managed by New York Life Investments, may participate in an interfund lending program. The interfund lending program provides an alternative credit facility that permits the Fund and certain other funds managed by New York Life Investments to lend or borrow money for temporary purposes directly to or from one another,
Notes to Financial Statements (Unaudited) (continued)
subject to the conditions of the exemptive order. During the six-month period ended April 30, 2021, there were no interfund loans made or outstanding with respect to the Fund.
Note 8–Purchases and Sales of Securities (in 000’s)
During the six-month period ended April 30, 2021, purchases and sales of securities, other than short-term securities, were $36,532 and $52,819, respectively.
Note 9–Capital Share Transactions
Transactions in capital shares for the six-month period ended April 30, 2021 and the year ended October 31, 2020, were as follows:
| Class A | Shares | Amount |
| Period ended April 30, 2021: | | |
| Shares sold | 444,610 | $ 6,560,301 |
| Shares issued to shareholders in reinvestment of distributions | 103,916 | 1,408,059 |
| Shares redeemed | (78,836) | (1,124,773) |
| Net increase (decrease) in shares outstanding before conversion | 469,690 | 6,843,587 |
| Shares converted into Class A (See Note 1) | 27,127 | 384,659 |
| Net increase (decrease) | 496,817 | $ 7,228,246 |
| Year ended October 31, 2020: | | |
| Shares sold | 239,000 | $ 3,229,497 |
| Shares issued to shareholders in reinvestment of distributions | 16,668 | 211,190 |
| Shares redeemed | (116,611) | (1,575,416) |
| Net increase (decrease) in shares outstanding before conversion | 139,057 | 1,865,271 |
| Shares converted into Class A (See Note 1) | 21,301 | 286,849 |
| Net increase (decrease) | 160,358 | $ 2,152,120 |
| |
| Investor Class | Shares | Amount |
| Period ended April 30, 2021: | | |
| Shares sold | 27,832 | $ 407,987 |
| Shares issued to shareholders in reinvestment of distributions | 19,811 | 268,239 |
| Shares redeemed | (7,162) | (105,143) |
| Net increase (decrease) in shares outstanding before conversion | 40,481 | 571,083 |
| Shares converted into Investor Class (See Note 1) | 2,980 | 42,857 |
| Shares converted from Investor Class (See Note 1) | (25,700) | (363,568) |
| Net increase (decrease) | 17,761 | $ 250,372 |
| Year ended October 31, 2020: | | |
| Shares sold | 50,554 | $ 634,358 |
| Shares issued to shareholders in reinvestment of distributions | 4,752 | 60,202 |
| Shares redeemed | (25,159) | (311,389) |
| Net increase (decrease) in shares outstanding before conversion | 30,147 | 383,171 |
| Shares converted into Investor Class (See Note 1) | 132 | 1,674 |
| Shares converted from Investor Class (See Note 1) | (21,330) | (286,849) |
| Net increase (decrease) | 8,949 | $ 97,996 |
| |
| Class C | Shares | Amount |
| Period ended April 30, 2021: | | |
| Shares sold | 23,937 | $ 340,148 |
| Shares issued to shareholders in reinvestment of distributions | 15,244 | 201,064 |
| Shares redeemed | (41,520) | (596,409) |
| Net increase (decrease) in shares outstanding before conversion | (2,339) | (55,197) |
| Shares converted from Class C (See Note 1) | (4,581) | (63,948) |
| Net increase (decrease) | (6,920) | $ (119,145) |
| Year ended October 31, 2020: | | |
| Shares sold | 29,319 | $ 371,654 |
| Shares issued to shareholders in reinvestment of distributions | 4,637 | 57,917 |
| Shares redeemed | (47,422) | (579,725) |
| Net increase (decrease) in shares outstanding before conversion | (13,466) | (150,154) |
| Shares converted from Class C (See Note 1) | (134) | (1,674) |
| Net increase (decrease) | (13,600) | $ (151,828) |
| |
| 30 | MainStay Epoch Capital Growth Fund |
| Class I | Shares | Amount |
| Period ended April 30, 2021: | | |
| Shares sold | 1,728,815 | $ 23,548,242 |
| Shares issued to shareholders in reinvestment of distributions | 758,502 | 10,285,290 |
| Shares redeemed | (3,178,559) | (44,615,294) |
| Net increase (decrease) | (691,242) | $(10,781,762) |
| Year ended October 31, 2020: | | |
| Shares sold | 95,403 | $ 1,247,767 |
| Shares issued to shareholders in reinvestment of distributions | 507,736 | 6,438,090 |
| Shares redeemed | (5,728,339) | (79,949,043) |
| Net increase (decrease) | (5,125,200) | $(72,263,186) |
Note 10–Recent Accounting Pronouncement
In March 2020, the Financial Accounting Standards Board issued Accounting Standards Update 2020-04 (“ASU 2020-04”), which provides optional guidance to ease the potential accounting burden associated with transitioning away from LIBOR and other reference rates that are expected to be discontinued. ASU 2020-04 was effective immediately upon release of the update on March 12, 2020 and remains effective through December 31, 2022. At this time, the Manager is evaluating the implications of certain other provisions of ASU 2020-04 related to new disclosure requirements and any impact on the financial statement disclosures has not yet been determined.
Note 11–Other Matters
An outbreak of COVID-19, first detected in December 2019, has developed into a global pandemic and has resulted in travel restrictions, closure of international borders, certain businesses and securities markets, restrictions on securities trading activities, prolonged quarantines, supply chain disruptions, and lower consumer demand, as well as general concern and uncertainty. The continued impact of COVID-19 is uncertain and could further adversely affect the global economy, national economies, individual issuers and capital markets in unforeseeable ways and result in a substantial and extended economic downturn. Developments that disrupt global economies and financial markets, such as COVID-19, may magnify factors that affect the Fund's performance.
Note 12–Subsequent Events
In connection with the preparation of the financial statements of the Fund as of and for the six-month period ended April 30, 2021, events and transactions subsequent to April 30, 2021, through the date the financial statements were issued have been evaluated by the Manager for possible adjustment and/or disclosure. No subsequent events requiring financial statement adjustment or disclosure have been identified.
Board Consideration and Approval of Management Agreement and Subadvisory Agreement (Unaudited)
The continuation of the Management Agreement with respect to the MainStay Epoch Capital Growth Fund (“Fund”) and New York Life Investment Management LLC (“New York Life Investments”) and the Subadvisory Agreement between New York Life Investments and Epoch Investment Partners, Inc. (“Epoch”) with respect to the Fund (together, “Advisory Agreements”), following an initial term of up to two years, is subject to annual review and approval by the Board of Trustees of MainStay Funds Trust (“Board” of the “Trust”) in accordance with Section 15 of the Investment Company Act of 1940, as amended (“1940 Act”). At its December 9–10, 2020 meeting, the Board, including the Trustees who are not an “interested person” (as such term is defined in the 1940 Act) of the Trust (“Independent Trustees”) voting separately, unanimously approved the continuation of each of the Advisory Agreements for a one-year period.
In reaching the decision to approve the continuation of each of the Advisory Agreements, the Board considered information furnished by New York Life Investments and Epoch in connection with an annual contract review process undertaken by the Board that took place at meetings of the Board and its Contracts Committee during September 2020 through December 2020, as well as other information furnished to the Board and its Committees throughout the year, as deemed relevant by the Trustees. Information requested by and furnished to the Board for consideration in connection with the contract review process included, among other items, reports on the Fund and “peer funds” prepared by Strategic Insight Mutual Fund Research and Consulting, LLC (“Strategic Insight”), an independent third-party service provider engaged by the Board to report objectively on the Fund’s investment performance, management fee and total expenses. The Board also considered information on the fees charged to other investment advisory clients of New York Life Investments and/or Epoch that follow investment strategies similar to those of the Fund, if any, and, when applicable, the rationale for any differences in the Fund’s management and subadvisory fees and the fees charged to those other investment advisory clients. In addition, the Board considered information furnished by New York Life Investments and Epoch in response to requests prepared on behalf of the Board, and in consultation with the Independent Trustees, by independent legal counsel to the Independent Trustees, which encompassed a variety of topics, including those summarized below.
The Board took into account information provided in connection with its meetings throughout the year, including, among other items, information regarding the legal standards and fiduciary obligations applicable to its consideration of the continuation of each of the Advisory Agreements and investment performance reports on the Fund as well as presentations from New York Life Investments and Epoch personnel. The Board also took into account other information received from New York Life Investments throughout the year, including, among other items, periodic reports on legal and compliance matters, risk management, portfolio turnover, brokerage commissions and non-advisory services provided to the Fund by New York Life Investments. The contract review process, including the structure and format for materials provided to the Board, has been developed in consultation with the Board. The Independent
Trustees also met in executive sessions with their independent legal counsel and, for a portion thereof, with senior management of New York Life Investments.
In addition to information provided to the Board throughout the year, the Board received information in connection with its June 2020 meeting provided specifically in response to requests prepared on behalf of the Board, and in consultation with the Independent Trustees, by independent legal counsel regarding the Fund’s distribution arrangements. In addition, the Board received information regarding the Fund’s asset levels, share purchase and redemption activity and the payment of Rule 12b-1 and/or other fees by applicable share classes of the Fund, among other information.
In considering the continuation of each of the Advisory Agreements, the Trustees reviewed and evaluated the information and factors they believed to reasonably be necessary and appropriate in light of legal advice furnished to them by independent legal counsel and through the exercise of their own business judgment. Although individual Trustees may have weighed certain factors or information differently, the factors considered by the Board are described in greater detail below and include, among other factors: (i) the nature, extent and quality of the services provided to the Fund by New York Life Investments and Epoch; (ii) the qualifications of the portfolio managers of the Fund and the historical investment performance of the Fund, New York Life Investments and Epoch; (iii) the costs of the services provided, and profits realized, by New York Life Investments and Epoch from their relationships with the Fund; (iv) the extent to which economies of scale have been realized or may be realized as the Fund grows and the extent to which economies of scale have benefited or may benefit the Fund’s shareholders; and (v) the reasonableness of the Fund’s management and subadvisory fees and total ordinary operating expenses. Although the Board recognized that comparisons between the Fund’s fees and expenses and those of other funds are imprecise given different terms of agreements, variations in fund strategies and other factors, the Board considered the reasonableness of the Fund’s management fee and total ordinary operating expenses as compared to the peer funds identified by Strategic Insight. Throughout their considerations, the Trustees acknowledged the commitment of New York Life Investments and its affiliates to serve the MainStay Group of Funds, as well as their capacity, experience, resources, financial stability and reputations. The Trustees also acknowledged the entrepreneurial and other risks assumed by New York Life Investments in sponsoring and managing the Fund.
The Trustees noted that, throughout the year, the Trustees are afforded an opportunity to ask questions of, and request additional information or materials from, New York Life Investments and Epoch. The Board’s decision with respect to each of the Advisory Agreements may have also been based, in part, on the Board’s knowledge of New York Life Investments and Epoch resulting from, among other things, the Board’s consideration of each of the Advisory Agreements in prior years, the advisory agreements for other funds in the MainStay Group of Funds, the Board’s review throughout the year of the performance and operations of other funds in the MainStay Group of Funds and each Trustee’s business
| 32 | MainStay Epoch Capital Growth Fund |
judgment and industry experience. In addition to considering the above-referenced factors, the Board observed that in the marketplace there are a range of investment options available to the Fund’s shareholders and such shareholders, having had the opportunity to consider other investment options, have chosen to invest in the Fund.
The factors that figured prominently in the Board’s decision to approve the continuation of each of the Advisory Agreements during its December 9–10, 2020 meeting are summarized in more detail below, and the Board did not consider any factor or information controlling in reaching such decision.
Nature, Extent and Quality of Services Provided by New York Life Investments and Epoch
The Board examined the nature, extent and quality of the services that New York Life Investments provides to the Fund. The Board evaluated New York Life Investments’ experience and capabilities in serving as manager of the Fund and considered that the Fund operates in a “manager-of-managers” structure. The Board also considered New York Life Investments’ responsibilities and services provided pursuant to this structure, including evaluating the performance of Epoch, making recommendations to the Board as to whether the Subadvisory Agreement should be renewed, modified or terminated and periodically reporting to the Board regarding the results of New York Life Investments’ evaluation and monitoring functions. The Board noted that New York Life Investments manages other mutual funds, serves a variety of other investment advisory clients, including other pooled investment vehicles, and has experience overseeing mutual fund service providers, including subadvisors. The Board considered the experience of senior personnel at New York Life Investments providing management and administrative and other non-advisory services to the Fund as well as New York Life Investments’ reputation and financial condition. The Board observed that New York Life Investments devotes significant resources and time to providing management and non-advisory services to the Fund, including New York Life Investments’ supervision and due diligence reviews of Epoch and ongoing analysis of, and interactions with, Epoch with respect to, among other things, the Fund’s investment performance and risks as well as Epoch’s investment capabilities and subadvisory services with respect to the Fund.
The Board also considered the range of services that New York Life Investments provides to the Fund under the terms of the Management Agreement, including: (i) fund accounting and ongoing supervisory services provided by New York Life Investments’ Fund Administration and Accounting Group; (ii) investment supervisory and analytical services provided by New York Life Investments’ Investment Consulting Group; (iii) compliance services provided by the Trust’s Chief Compliance Officer as well as New York Life Investments’ compliance department, including supervision and implementation of the Fund’s compliance program; (iv) legal services provided by New York Life Investments’ Office of the General Counsel; and (v) risk management monitoring and analysis by compliance and investment personnel. The Board noted that New York Life Investments provides certain other non-advisory services to the Fund.
In addition, the Board considered New York Life Investments’ willingness to invest in personnel, infrastructure, technology, operational enhancements, cyber security, information security, shareholder privacy resources and business continuity planning designed to benefit the Fund and noted that New York Life Investments is responsible for compensating the Trust’s officers, except for a portion of the salary of the Trust’s Chief Compliance Officer. The Board recognized that New York Life Investments has provided an increasingly broad array of non-advisory services to the MainStay Group of Funds as a result of regulatory and other developments, including in connection with the designation of New York Life Investments as the administrator of the MainStay Group of Funds’ liquidity risk management program adopted under the 1940 Act. The Board considered benefits to shareholders from being part of the MainStay Group of Funds, including the privilege of exchanging investments between the same class of shares of funds in the MainStay Group of Funds, including without the imposition of a sales charge (if any).
The Board also examined the nature, extent and quality of the investment advisory services that Epoch provides to the Fund and considered the terms of each of the Advisory Agreements. The Board evaluated Epoch’s experience in serving as subadvisor to the Fund and advising other portfolios and Epoch’s track record and experience in providing investment advisory services, the experience of investment advisory, senior management and administrative personnel at Epoch and New York Life Investments’ and Epoch’s overall resources, legal and compliance environment, capabilities and history. In addition to information provided in connection with quarterly meetings with the Trust’s Chief Compliance Officer, the Board considered information regarding the compliance policies and procedures of New York Life Investments and Epoch and acknowledged their commitment to further developing and strengthening compliance programs relating to the Fund. The Board reviewed Epoch’s ability to attract and retain qualified investment professionals and willingness to invest in personnel to service and support the Fund. In this regard, the Board considered the experience of the Fund’s portfolio managers, the number of accounts managed by the portfolio managers and the method for compensating the portfolio managers.
In addition, the Board considered discussions with New York Life Investments regarding the implementation of its business continuity plans and recognized steps taken by New York Life Investments and Epoch to continue to provide the same nature, extent and quality of services to the Fund during the COVID-19 pandemic.
Based on these considerations, the Board concluded that the Fund would likely continue to benefit from the nature, extent and quality of these services.
Investment Performance
In evaluating the Fund’s investment performance, the Board considered investment performance results over various periods in light of the Fund’s investment objective, strategies and risks. The Board considered investment reports on, and analysis of, the Fund’s performance provided
Board Consideration and Approval of Management Agreement and Subadvisory Agreement (Unaudited) (continued)
to the Board throughout the year. These reports include, among other items, information on the Fund’s gross and net returns, the Fund’s investment performance compared to relevant investment categories and the Fund’s benchmark, the Fund’s risk-adjusted investment performance and the Fund’s investment performance as compared to peer funds, as appropriate, as well as portfolio attribution information and commentary on the effect of market conditions. The Board also considered information provided by Strategic Insight showing the investment performance of the Fund as compared to peer funds.
The Board also gave weight to its discussions with senior management at New York Life Investments concerning the Fund’s investment performance attributable to Epoch as well as discussions between the Fund’s portfolio managers and the members of the Board’s Investment Committee, which generally occur on an annual basis. In addition, the Board considered any specific actions that New York Life Investments or Epoch had taken, or had agreed to take, to seek to enhance Fund investment performance and the results of those actions.
Based on these considerations, the Board concluded that its review of the Fund’s investment performance and related information supported a determination to approve the continuation of each of the Advisory Agreements.
Costs of the Services Provided, and Profits Realized, by New York Life Investments and Epoch
The Board considered the costs of the services provided under each of the Advisory Agreements. The Board also considered the profits realized by New York Life Investments and its affiliates and Epoch due to their relationships with the Fund. The Board considered that Epoch’s subadvisory fee had been negotiated at arm’s-length by New York Life Investments and that this fee is paid by New York Life Investments, not the Fund, and the relevance of Epoch’s profitability was considered by the Trustees in that context. On this basis, the Board primarily considered the costs and profitability for New York Life Investments and its affiliates with respect to the Fund.
In addition, the Board acknowledged the difficulty in obtaining reliable comparative data about mutual fund managers’ profitability because such information generally is not publicly available and may be impacted by numerous factors, including the structure of a fund manager’s organization, the types of funds it manages, the methodology used to allocate certain fixed costs to specific funds and the manager’s capital structure and costs of capital.
In evaluating the costs of the services provided by New York Life Investments and Epoch and profits realized by New York Life Investments and its affiliates and Epoch, the Board considered, among other factors, each party’s continuing investments in, or willingness to invest in, personnel, systems, equipment and other resources and infrastructure to support and further enhance the management of the Fund, and that New York Life Investments is responsible for paying the subadvisory fee for the Fund. The Board also considered the financial resources of New York Life Investments and Epoch and acknowledged that New York Life
Investments and Epoch must be in a position to attract and retain experienced professional personnel and to maintain a strong financial position for New York Life Investments and Epoch to continue to provide high-quality services to the Fund. The Board recognized that the Fund benefits from the allocation of certain fixed costs among the funds in the MainStay Group of Funds, among other expected benefits resulting from its relationship with New York Life Investments.
The Board considered information regarding New York Life Investments’ methodology for calculating profitability and allocating costs provided by New York Life Investments in connection with the fund profitability analysis presented to the Board. The Board previously engaged an independent consultant to review the methods used to allocate costs among the funds in the MainStay Group of Funds. The Board noted that the independent consultant had concluded that New York Life Investments’ methods for allocating costs and procedures for estimating overall profitability of the relationship with the funds in the MainStay Group of Funds are reasonable and that New York Life Investments continued to use the same method of calculating profit and allocating costs since the independent consultant’s review. The Board recognized the difficulty in calculating and evaluating a manager’s profitability with respect to the Fund and noted that other profitability methodologies may also be reasonable.
The Board also considered certain fall-out benefits that may be realized by New York Life Investments and its affiliates due to their relationships with the Fund, including reputational and other indirect benefits. In this regard, the Board also requested and received information from New York Life Investments concerning other material business relationships between Epoch and its affiliates and New York Life Investments and its affiliates. In addition, the Board considered its review of a money market fund advised by New York Life Investments and an affiliated subadvisor that serves as an investment option for the Fund, including the potential rationale for and costs associated with investments in this money market fund by the Fund, if any, and considered information from New York Life Investments that the nature and type of specific investment advisory services provided to this money market fund are distinct from, or in addition to, the investment advisory services provided to the Fund.
The Board observed that, in addition to fees earned by New York Life Investments for managing the Fund, New York Life Investments’ affiliates also earn revenues from serving the Fund in various other capacities, including as the Fund’s transfer agent and distributor. The Board considered information about these other revenues and their impact on the profitability of the relationship with the Fund to New York Life Investments and its affiliates. The Board noted that, although it assessed the overall profitability of the Fund to New York Life Investments and its affiliates as part of the contract review process, when considering the reasonableness of the fee paid to New York Life Investments and its affiliates under the Management Agreement, the Board considered the profitability of New York Life Investments’ relationship with the Fund on a pre-tax basis and without regard to distribution expenses incurred by New York Life Investments from its own resources.
| 34 | MainStay Epoch Capital Growth Fund |
After evaluating the information deemed relevant by the Trustees, the Board concluded that any profits realized by New York Life Investments and its affiliates due to their relationships with the Fund were not excessive. With respect to Epoch, the Board considered that any profits realized by Epoch due to its relationship with the Fund are the result of arm’s-length negotiations between New York Life Investments and Epoch, acknowledging that any such profits are based on the subadvisory fee paid to Epoch by New York Life Investments, not the Fund.
Management and Subadvisory Fees and Total Ordinary Operating Expenses
The Board evaluated the reasonableness of the fee paid under each of the Advisory Agreements and the Fund’s total ordinary operating expenses. The Board primarily considered the reasonableness of the management fee paid by the Fund to New York Life Investments, because the subadvisory fee paid to Epoch is paid by New York Life Investments, not the Fund. The Board also considered the reasonableness of the subadvisory fee paid by New York Life Investments and the amount of the management fee retained by New York Life Investments.
In assessing the reasonableness of the Fund’s fees and expenses, the Board primarily considered comparative data provided by Strategic Insight on the fees and expenses charged by similar mutual funds managed by other investment advisers. In addition, the Board considered information provided by New York Life Investments and Epoch on fees charged to other investment advisory clients, including institutional separate accounts and/or other funds that follow investment strategies similar to those of the Fund, if any. The Board considered the similarities and differences in the contractual management fee schedules of the Fund and these similarly-managed accounts and/or funds, taking into account the rationale for any differences in fee schedules. The Board also took into account explanations provided by New York Life Investments about the more extensive scope of services provided to registered investment companies, such as the Fund, as compared with other investment advisory clients. Additionally, the Board considered the impact of voluntary waivers and expense limitation arrangements on the Fund’s net management fee and expenses. The Board also considered that in proposing fees for the Fund, New York Life Investments considers the competitive marketplace for mutual funds.
The Board noted that, outside of the Fund’s management fee and the fees charged under a share class’s Rule 12b-1 and/or shareholder services plans, a share class’s most significant “other expenses” are transfer agent fees. Transfer agent fees are charged to the Fund based on the number of shareholder accounts (a “per-account” fee). The Board took into account information from New York Life Investments regarding the reasonableness of the Fund’s transfer agent fee schedule, including industry data demonstrating that the per-account fees that NYLIM Service Company LLC, an affiliate of New York Life Investments and the Fund’s transfer agent, charges the Fund are within the range of per-account fees charged by transfer agents to other mutual funds. In addition, the Board considered NYLIM Service Company LLC’s profitability in connection with the transfer agent services it provides to the Fund. The Board also took
into account information received from NYLIM Service Company LLC regarding the sub-transfer agency payments it made to intermediaries in connection with the provision of sub-transfer agency services to the Fund.
The Board considered that, because the Fund’s transfer agent fees are billed on a per-account basis, the impact of transfer agent fees on a share class’s expense ratio may be more significant in cases where the share class has a high number of small accounts. The Board considered the extent to which transfer agent fees comprised total expenses of the Fund. The Board acknowledged the role that the MainStay Group of Funds historically has played in serving the investment needs of New York Life Insurance Company customers, who often maintain smaller account balances than other shareholders of funds, and the impact of small accounts on the expense ratios of Fund share classes. The Board also recognized measures that it and New York Life Investments have taken to mitigate the effect of small accounts on the expense ratios of Fund share classes, including through the imposition of an expense limitation on net transfer agency expenses. The Board noted that, for purposes of allocating transfer agency fees and expenses, each retail fund in the MainStay Group of Funds combines the shareholder accounts of its Class A, A2, I, R1, R2 and R3 shares (as applicable) into one group and the shareholder accounts of its Investor Class, SIMPLE Class and Class B, C and C2 shares (as applicable) into another group. The Board also noted that the per-account fees attributable to each group of share classes is then allocated among the constituent share classes based on relative net assets and that a MainStay Fund’s Class R6 shares, if any, are not combined with any other share class for this purpose. The Board considered New York Life Investments’ rationale with respect to these groupings and previously received a report from an independent consultant engaged to conduct comparative analysis of these groupings. The Board also considered that NYLIM Service Company LLC had waived its contractual cost of living adjustments during the past seven years.
Based on the factors outlined above, the Board concluded that the Fund’s management fee and total ordinary operating expenses were within a range that is competitive and support a conclusion that these fees and expenses are reasonable.
Economies of Scale
The Board considered information regarding economies of scale, including whether the Fund’s expense structure permits economies of scale to be appropriately shared with the Fund’s shareholders. The Board also considered a report from New York Life Investments, previously prepared at the request of the Board, that addressed economies of scale, including with respect to the mutual fund business generally and the various ways in which the benefits of economies of scale may be shared with the funds in the MainStay Group of Funds. Although the Board recognized the difficulty of determining economies of scale with precision, the Board acknowledged that economies of scale may be shared with the Fund in a number of ways, including, for example, through the imposition of management fee breakpoints, initially setting management fee rates at scale or making additional investments to enhance services. The Board
Board Consideration and Approval of Management Agreement and Subadvisory Agreement (Unaudited) (continued)
reviewed information from New York Life Investments showing how the Fund’s management fee schedule compared to fee schedules of other funds and accounts managed by New York Life Investments. The Board also reviewed information from Strategic Insight showing how the Fund’s management fee schedule compared with fees paid for similar services by peer funds at varying asset levels.
Based on this information, the Board concluded that economies of scale are appropriately reflected for the benefit of the Fund’s shareholders through the Fund’s expense structure and other methods to share benefits from economies of scale.
Conclusion
On the basis of the information and factors summarized above, among other information and factors deemed relevant by the Trustees, and the evaluation thereof, the Board, including the Independent Trustees voting separately, unanimously voted to approve the continuation of each of the Advisory Agreements.
| 36 | MainStay Epoch Capital Growth Fund |
Discussion of the Operation and Effectiveness of the Fund's Liquidity Risk Management Program (Unaudited)
In compliance with Rule 22e-4 under the Investment Company Act of 1940, as amended (the “Liquidity Rule”), the Fund has adopted and implemented a liquidity risk management program (the “Program”), which New York Life Investment Management LLC believes is reasonably designed to assess and manage the Fund's liquidity risk (the risk that the Fund could not meet requests to redeem shares issued by the Fund without significant dilution of remaining investors’ interests in the Fund). The Board of Trustees of MainStay Funds Trust (the "Board") designated New York Life Investment Management LLC as administrator of the Program (the “Administrator”). The Administrator has established a Liquidity Risk Management Committee to assist the Administrator in the implementation and day-to-day administration of the Program and to otherwise support the Administrator in fulfilling its responsibilities under the Program.
At a meeting of the Board held on March 8, 2021, the Administrator provided the Board with a written report addressing the Program’s operation and assessing its adequacy and effectiveness of implementation for the period from January 1, 2020 through December 31, 2020 (the "Review Period"), as required under the Liquidity Rule. The report noted that the Administrator concluded that (i) the Program operated effectively to assess and manage the Fund's liquidity risk, (ii) the Program has been adequately and effectively implemented to monitor and, as applicable, respond to the Fund's liquidity developments and (iii) the Fund's investment strategy continues to be appropriate for an open-end fund. In addition, the report discussed notable events that impacted liquidity risk during the Review Period, including the COVID-19 pandemic and the resulting economic shutdown.
In accordance with the Program, the Fund's liquidity risk is assessed no less frequently than annually taking into consideration certain factors, as applicable, such as (i) investment strategy and liquidity of portfolio investments, (ii) short-term and long-term cash flow projections and (iii) holdings of cash and cash equivalents, as well as borrowing arrangements and other funding sources. Certain factors are considered under both normal and reasonably foreseeable stressed conditions.
Each Fund portfolio investment is classified into one of four liquidity categories. The classification is based on a determination of the number of days it is reasonably expected to take to convert the investment into cash, or sell or dispose of the investment, in current market conditions without significantly changing the market value of the investment. The Administrator has delegated liquidity classification determinations to the Fund’s subadvisor, subject to appropriate oversight by the Administrator, and classification determinations are made by taking into account the Fund's reasonably anticipated trade size, various market, trading and investment-specific considerations, as well as market depth, and, in certain cases, third-party vendor data.
The Liquidity Rule requires funds that do not primarily hold assets that are highly liquid investments to adopt a minimum amount of net assets that must be invested in highly liquid investments that are assets (an “HLIM”). In addition, the Liquidity Rule limits a fund's investments in illiquid investments. Specifically, the Liquidity Rule prohibits acquisition of illiquid investments if doing so would result in a fund holding more than 15% of its net assets in illiquid investments that are assets. The Program includes provisions reasonably designed to determine, periodically review and comply with the HLIM requirement, as applicable, and to comply with the 15% limit on illiquid investments.
There can be no assurance that the Program will achieve its objectives under all circumstances in the future. Please refer to the Fund's prospectus for more information regarding the Fund's exposure to liquidity risk and other risks to which it may be subject.
Proxy Voting Record
The Fund is required to file with the Securities and Exchange Commissions's ("SEC") its proxy voting records for the 12-month period ending June 30 on Form N-PX. The most recent Form N-PX or proxy voting record is available free of charge upon request by calling 800-624-6782; visiting the MainStay Funds’ website at newyorklifeinvestments.com; or visiting the SEC’s website at www.sec.gov.
Shareholder Reports and Quarterly Portfolio Disclosure
The Fund is required to file its complete schedule of portfolio holdings with the SEC 60 days after its first and third fiscal quarter on Form N-PORT. The Fund's holdings report is available free of charge upon request by calling New York Life Investments at 800-624-6782.
| 38 | MainStay Epoch Capital Growth Fund |
Equity
U.S. Equity
MainStay Epoch U.S. Equity Yield Fund
MainStay MacKay S&P 500 Index Fund
MainStay Winslow Large Cap Growth Fund
MainStay WMC Enduring Capital Fund
MainStay WMC Growth Fund
MainStay WMC Small Companies Fund
MainStay WMC Value Fund
International Equity
MainStay Epoch International Choice Fund
MainStay MacKay International Equity Fund
MainStay WMC International Research Equity Fund
Emerging Markets Equity
MainStay Candriam Emerging Markets Equity Fund
Global Equity
MainStay Epoch Capital Growth Fund
MainStay Epoch Global Equity Yield Fund
Fixed Income
Taxable Income
MainStay Candriam Emerging Markets Debt Fund
MainStay Floating Rate Fund
MainStay MacKay High Yield Corporate Bond Fund
MainStay MacKay Short Duration High Yield Fund
MainStay MacKay Strategic Bond Fund
MainStay MacKay Total Return Bond Fund
MainStay MacKay U.S. Infrastructure Bond Fund
MainStay Short Term Bond Fund
Tax-Exempt Income
MainStay MacKay California Tax Free Opportunities Fund1
MainStay MacKay High Yield Municipal Bond Fund
MainStay MacKay Intermediate Tax Free Bond Fund
MainStay MacKay New York Tax Free Opportunities Fund2
MainStay MacKay Short Term Municipal Fund
MainStay MacKay Tax Free Bond Fund
Money Market
MainStay Money Market Fund
Mixed Asset
MainStay Balanced Fund
MainStay Income Builder Fund
MainStay MacKay Convertible Fund
Speciality
MainStay CBRE Global Infrastructure Fund
MainStay CBRE Real Estate Fund
MainStay Cushing MLP Premier Fund
Asset Allocation
MainStay Conservative Allocation Fund
MainStay Conservative ETF Allocation Fund
MainStay Defensive ETF Allocation Fund
MainStay Equity Allocation Fund
MainStay Equity ETF Allocation Fund
MainStay Growth Allocation Fund
MainStay Growth ETF Allocation Fund
MainStay Moderate Allocation Fund
MainStay Moderate ETF Allocation Fund
Manager
New York Life Investment Management LLC
New York, New York
Subadvisors
Candriam Belgium S.A.3
Brussels, Belgium
Candriam Luxembourg S.C.A.3
Strassen, Luxembourg
CBRE Clarion Securities LLC
Radnor, Pennsylvania
Cushing Asset Management, LP
Dallas, Texas
Epoch Investment Partners, Inc.
New York, New York
MacKay Shields LLC3
New York, New York
NYL Investors LLC3
New York, New York
Wellington Management Company LLP
Boston, Massachusetts
Winslow Capital Management, LLC
Minneapolis, Minnesota
Legal Counsel
Dechert LLP
Washington, District of Columbia
Independent Registered Public Accounting Firm
KPMG LLP
Philadelphia, Pennsylvania
Distributor
NYLIFE Distributors LLC3
Jersey City, New Jersey
Custodian
JPMorgan Chase Bank, N.A.
New York, New York
1.
This Fund is registered for sale in AZ, CA, NV, OR, TX, UT, WA and MI (Class A and I shares only), and CO, FL, GA, HI, ID, MA, MD, NH, NJ and NY (Class I shares only).
| 2. | This Fund is registered for sale in CA, CT, DE, FL, MA, NJ, NY and VT. |
| 3. | An affiliate of New York Life Investment Management LLC. |
Not part of the Semiannual Report
For more information
800-624-6782
newyorklifeinvestments.com
“New York Life Investments” is both a service mark, and the common trade name, of certain investment advisors affiliated with New York Life Insurance Company. The MainStay Funds® are managed by New York Life Investment Management LLC and distributed by NYLIFE Distributors LLC, 30 Hudson Street, Jersey City, NJ 07302, a wholly owned subsidiary of New York Life Insurance Company. NYLIFE Distributors LLC is a Member FINRA/SIPC.
©2021 NYLIFE Distributors LLC. All rights reserved.
| 1736838MS071-21 | MSECG10-06/21 |
(NYLIM) NL284
MainStay Epoch Global Equity Yield Fund
Message from the President and Semiannual Report
Unaudited | April 30, 2021
Sign up for e-delivery of your shareholder reports. For full details on e-delivery, including who can participate and what you can receive via e-delivery,
please log in to newyorklifeinvestments.com/accounts.
| Not FDIC/NCUA Insured | Not a Deposit | May Lose Value | No Bank Guarantee | Not Insured by Any Government Agency |
This page intentionally left blank
Message from the President
With the approval of COVID-19 vaccines and the passage of relief packages by the U.S. Congress, economic prospects improved during the reporting period, and investor risk appetite increased, benefiting both equities and fixed-income markets. Despite some volatility stemming from a sell-off in longer-dated Treasury securities, the stock market and higher-risk segments of the fixed-income market posted gains for the six months ended April 30, 2021.
By the beginning of the reporting period, the economy had made tremendous progress from the second quarter of 2020, when economic activity plunged. But uncertainty about when vaccines would be available and how quickly they could be administered left investors unsure about the economic outlook.
With the approval of several vaccines in November, the outlook brightened and investors became less risk-averse. Anticipating the likely end of the pandemic and a continuation of the economic recovery, they began to see opportunities in investment-grade and high-yield bonds and more cyclical segments of the stock market. The $900 billion relief and stimulus package passed in December provided further assurance.
In January, the Federal Reserve opted to leave interest rates unchanged, pointing to some uncertainty about the pace of the global recovery. Officials also noted that inflation remained low, citing oil prices in particular.
In March, President Biden signed the $1.9 billion American Rescue Plan, which, among other provisions, called for payments of $1,400 for those earning less than $75,000 per year, plus $1,400 per dependent. This, combined with the Federal Reserve’s new tolerance for inflation and an anticipated $2 trillion infrastructure spending bill, added to growing concerns about higher prices. Supply shortages in some markets caused some prices to soar, heightening concerns further.
In fixed-income markets, an improving economic outlook and rising inflation expectations led to a sell-off in longer-term Treasuries, with the result that the yield on the 10-year note rose sharply, particularly in February and March. Investment grade corporate bonds were also affected. Early in the reporting period, they performed well as investors shifted out of Treasuries, but as the reporting period progressed, they faltered. Longer-dated securities issued in recent years at historically low interest rates became especially unattractive.
High-yield bonds remained steady, supported by more favorable yields and an improved economic outlook, which reduced their perceived risk. Municipal bonds produced modest gains, and
although the sell-off in Treasuries produced some volatility early in 2021, stronger-than-expected tax revenues, $350 billion in financial support from the federal government, and the possibility of an increase in federal income tax rates appeared to buoy the market late in the reporting period.
Inflation concerns and volatility in the Treasury market led to a shift in equities markets. Although the S&P 500® Index, a widely followed measure of U.S. equities, posted double-digit gains and hit a record high, the rise of Treasury yields disrupted valuations, especially those of growth stocks. Technology companies that saw their valuations soar amid the work-from-home trend in 2020 suffered large declines.
But the fiscal stimulus and continued accommodation from the Federal Reserve gave investors confidence the economic recovery would continue. Combined with the sky-high valuations in technology and growth stocks, this increased the appeal of more cyclical and value-oriented shares. As a result, value stocks outperformed growth stocks during the reporting period.
Reflecting the shift in investor sentiment, the performance of S&P 500® Index sectors varied widely. While the information technology sector kept up with the broader market, it lagged cyclical sectors such as energy and financials, which led the way. The shift was further reflected in the performance of small-cap stocks, which outperformed large caps. While developed markets kept pace with the U.S. market, lagging economic and pandemic recoveries appeared to weigh on emerging markets late in the reporting period.
With the lockdown restrictions lifting in the U.S. and the pandemic easing in many regions, we at New York Life Investments are looking forward to a return to a more normal economy. We anticipate that over the next several years, a variety of trends will likely offer long-term investors many attractive opportunities. With this in mind, we continue to develop products and services to help you to take advantage of these trends, manage your risks, and ultimately meet your investment goals.
Sincerely,
Kirk C. Lehneis
President
The opinions expressed are as of the date of this report and are subject to change. There is no guarantee that any forecast made will come to pass. This material does not constitute investment advice and is not intended as an endorsement of any specific investment. Past performance is no guarantee of future results.
Not part of the Semiannual Report
Investors should refer to the Fund’s Summary Prospectus and/or Prospectus and consider the Fund’s investment objectives, strategies, risks, charges and expenses carefully before investing. The Summary Prospectus and/or Prospectus contain this and other information about the Fund. You may obtain copies of the Fund’s Summary Prospectus, Prospectus and Statement of Additional Information free of charge, upon request, by calling toll-free 800-624-6782, by writing to NYLIFE Distributors LLC, Attn: MainStay Marketing Department, 30 Hudson Street, Jersey City, NJ 07302 or by sending an e-mail to MainStayShareholderServices@nylim.com. These documents are also available via the MainStay Funds’ website at newyorklifeinvestments.com. Please read the Fund’s Summary Prospectus and/or Prospectus carefully before investing.
Investment and Performance Comparison (Unaudited)
Performance data quoted represents past performance. Past performance is no guarantee of future results. Because of market volatility and other factors, current performance may be lower or higher than the figures shown. Investment return and principal value will fluctuate, and as a result, when shares are redeemed, they may be worth more or less than their original cost. The graph below depicts the historical performance of Class I shares of the Fund. Performance will vary from class to class based on differences in class-specific expenses and sales charges. For performance information current to the most recent month-end, please call 800-624-6782 or visit newyorklifeinvestments.com.
The performance table and graph do not reflect the deduction of taxes that a shareholder would pay on distributions or Fund share redemptions. Total returns reflect maximum applicable sales charges as indicated in the table below, if any, changes in share price, and reinvestment of dividend and capital gain distributions. The graph assumes the initial investment amount shown below and reflects the deduction of all sales charges that would have applied for the period of investment. Performance figures may reflect certain fee waivers and/or expense limitations, without which total returns may have been lower. For more information on share classes and current fee waivers and/or expense limitations (if any), please refer to the Notes to Financial Statements.
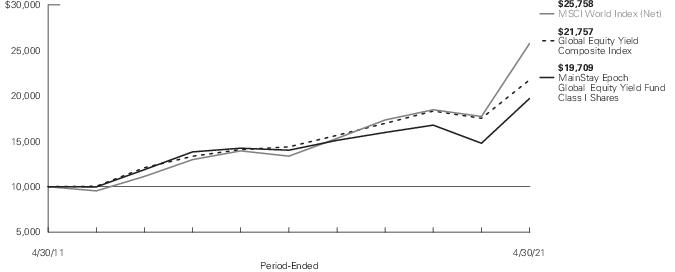
| Average Annual Total Returns for the Period-Ended April 30, 2021 |
| Class | Sales Charge | | Inception
Date | Six
Months | One
Year | Five
Years | Ten Years
or Since
Inception | Gross
Expense
Ratio1 |
| Class A Shares | Maximum 5.5% Initial Sales Charge | With sales charges | 8/2/2006 | 20.15% | 25.69% | 5.58% | 6.15% | 1.14% |
| | | Excluding sales charges | | 27.14 | 33.00 | 6.78 | 6.75 | 1.14 |
| Investor Class Shares | Maximum 5% Initial Sales Charge | With sales charges | 11/16/2009 | 20.74 | 25.63 | 5.58 | 6.15 | 1.13 |
| | | Excluding sales charges | | 27.10 | 32.94 | 6.78 | 6.75 | 1.13 |
| Class C Shares | Maximum 1% CDSC | With sales charges | 11/16/2009 | 25.69 | 31.03 | 6.01 | 5.96 | 1.88 |
| | if Redeemed Within One Year of Purchase | Excluding sales charges | | 26.69 | 32.03 | 6.01 | 5.96 | 1.88 |
| Class I Shares | No Sales Charge | | 12/27/2005 | 27.35 | 33.33 | 7.06 | 7.02 | 0.89 |
| Class R2 Shares | No Sales Charge | | 2/28/2014 | 27.01 | 32.76 | 6.64 | 5.33 | 1.24 |
| Class R3 Shares | No Sales Charge | | 2/29/2016 | 26.90 | 32.49 | 6.36 | 7.59 | 1.49 |
| Class R6 Shares | No Sales Charge | | 6/17/2013 | 27.43 | 31.89 | 6.93 | 6.73 | 0.76 |
| 1. | The gross expense ratios presented reflect the Fund’s “Total Annual Fund Operating Expenses” from the most recent Prospectus, as supplemented, and may differ from other expense ratios disclosed in this report. |
The footnotes on the next page are an integral part of the table and graph and should be carefully read in conjunction with them.
| Benchmark Performance | Six
Months | One
Year | Five
Years | Ten
Years |
| MSCI World Index (Net)1 | 29.10% | 45.33% | 14.03% | 9.92% |
| Global Equity Yield Composite Index2 | 20.43 | 24.13 | 8.63 | 8.08 |
| Morningstar World Large Stock Value Category Average3 | 33.34 | 42.03 | 9.45 | 7.40 |
| 1. | The MSCI World Index (Net) is the Fund's primary broad-based securities market index for comparison purposes. The MSCI World Index (Net) is a free float-adjusted market capitalization weighted index that is designed to measure the equity market performance of developed markets. Results assume reinvestment of all dividends and capital gains. An investment cannot be made directly in an index. |
| 2. | The Fund has selected the Global Equity Yield Composite Index as its secondary benchmark. The Global Equity Yield Composite Index consists of the MSCI World High Dividend Yield Index and the MSCI World Minimum Volatility (USD) Index weighted at 60% and 40%, respectively. The MSCI World High Dividend Yield Index is based on the MSCI World Index and is designed to reflect the performance of equities in the MSCI World Index (excluding real estate investment trusts) with higher dividend income and quality characteristics than average dividend yields that are both sustainable and persistent. The MSCI World Minimum Volatility (USD) Index aims to reflect the performance characteristics of a minimum variance strategy applied to the MSCI large and mid-cap equity universe across 23 developed markets countries. The MSCI World Minimum Volatility (USD) Index is calculated by optimizing the MSCI World Index for the lowest absolute risk (within a given set of constraints). Results assume reinvestment of all dividends and capital gains. An investment cannot be made directly in an index. |
| 3. | The Morningstar World Large Stock Value Category Average is representative of funds that invest in a variety of international stocks and typically skew towards large caps that are less expensive or growing more slowly than other global large-cap stocks. World large stock value portfolios have few geographical limitations. It is common for these portfolios to invest the majority of their assets in developed markets, with the remainder divided among the globe’s emerging markets. These portfolios are not significantly overweight U.S. equity exposure relative to the Morningstar Global Market Index and maintain at least a 20% absolute U.S. exposure. Results are based on average total returns of similar funds with all dividends and capital gain distributions reinvested. |
The footnotes on the preceding page are an integral part of the table and graph and should be carefully read in conjunction with them.
| 6 | MainStay Epoch Global Equity Yield Fund |
Cost in Dollars of a $1,000 Investment in MainStay Epoch Global Equity Yield Fund (Unaudited)
The example below is intended to describe the fees and expenses borne by shareholders during the six-month period from November 1, 2020, to April 30, 2021, and the impact of those costs on your investment.
Example
As a shareholder of the Fund you incur two types of costs: (1) transaction costs, including exchange fees and sales charges (loads) on purchases (as applicable), and (2) ongoing costs, including management fees, distribution and/or service (12b-1) fees, and other Fund expenses (as applicable). This example is intended to help you understand your ongoing costs (in dollars) of investing in the Fund and to compare these costs with the ongoing costs of investing in other mutual funds. The example is based on an investment of $1,000 made at the beginning of the six-month period and held for the entire period from November 1, 2020, to April 30, 2021.
This example illustrates your Fund’s ongoing costs in two ways:
Actual Expenses
The second and third data columns in the table below provide information about actual account values and actual expenses. You may use the information in these columns, together with the amount you invested, to estimate the expenses that you paid during the six months ended April 30, 2021. Simply divide your account value by $1,000 (for example, an
$8,600 account value divided by $1,000 = 8.6), then multiply the result by the number under the heading entitled “Expenses Paid During Period” to estimate the expenses you paid on your account during this period.
Hypothetical Example for Comparison Purposes
The fourth and fifth data columns in the table below provide information about hypothetical account values and hypothetical expenses based on the Fund’s actual expense ratio and an assumed rate of return of 5% per year before expenses, which is not the Fund’s actual return. The hypothetical account values and expenses may not be used to estimate the actual ending account balances or expenses you paid for the six-month period shown. You may use this information to compare the ongoing costs of investing in the Fund with the ongoing costs of investing in other mutual funds. To do so, compare this 5% hypothetical example with the 5% hypothetical examples that appear in the shareholder reports of the other mutual funds.
Please note that the expenses shown in the table are meant to highlight your ongoing costs only and do not reflect any transactional costs, such as exchange fees or sales charges (loads). Therefore, the fourth and fifth data columns of the table are useful in comparing ongoing costs only and will not help you determine the relative total costs of owning different funds. In addition, if these transactional costs were included, your costs would have been higher.
| Share Class | Beginning
Account
Value
11/1/20 | Ending Account
Value (Based
on Actual
Returns and
Expenses)
4/30/21 | Expenses
Paid
During
Period1 | Ending Account
Value (Based
on Hypothetical
5% Annualized
Return and
Actual Expenses)
4/30/21 | Expenses
Paid
During
Period1 | Net Expense
Ratio
During
Period2 |
| Class A Shares | $1,000.00 | $1,271.40 | $ 6.14 | $1,019.39 | $5.46 | 1.09% |
| Investor Class Shares | $1,000.00 | $1,271.00 | $ 6.53 | $1,019.04 | $5.81 | 1.16% |
| Class C Shares | $1,000.00 | $1,266.90 | $10.40 | $1,015.62 | $9.25 | 1.85% |
| Class I Shares | $1,000.00 | $1,273.50 | $ 4.74 | $1,020.63 | $4.21 | 0.84% |
| Class R2 Shares | $1,000.00 | $1,270.10 | $ 7.20 | $1,018.45 | $6.41 | 1.28% |
| Class R3 Shares | $1,000.00 | $1,269.00 | $ 8.61 | $1,017.21 | $7.65 | 1.53% |
| Class R6 Shares | $1,000.00 | $1,274.30 | $ 4.12 | $1,021.18 | $3.66 | 0.73% |
| 1. | Expenses are equal to the Fund’s annualized expense ratio of each class multiplied by the average account value over the period, divided by 365 and multiplied by 181 (to reflect the six-month period). The table above represents the actual expenses incurred during the six-month period. In addition to the fees and expenses which the Fund bears directly, it also indirectly bears a pro rata share of the fees and expenses of the underlying funds in which it invests. Such indirect expenses are not included in the above-reported expense figures. |
| 2. | Expenses are equal to the Fund's annualized expense ratio to reflect the six-month period. |
Country Composition as of April 30, 2021 (Unaudited)
| United States | 60.4% |
| Canada | 8.0 |
| Germany | 7.5 |
| United Kingdom | 6.8 |
| France | 5.1 |
| Italy | 3.2 |
| Japan | 2.5 |
| Switzerland | 2.4 |
| Taiwan | 1.7% |
| Republic of Korea | 1.6 |
| Norway | 1.1 |
| Singapore | 0.6 |
| Spain | 0.6 |
| Other Assets, Less Liabilities | –1.5 |
| | 100.0% |
See Portfolio of Investments beginning on page 12 for specific holdings within these categories. The Fund's holdings are subject to change.
Top Ten Holdings as of April 30, 2021 (excluding short-term investments) (Unaudited)
| 1. | Allianz SE (Registered) |
| 2. | Microsoft Corp. |
| 3. | AbbVie, Inc. |
| 4. | Taiwan Semiconductor Manufacturing Co. Ltd., Sponsored |
| 5. | Nutrien Ltd. |
| 6. | Samsung Electronics Co. Ltd. |
| 7. | Iron Mountain, Inc. |
| 8. | International Business Machines Corp. |
| 9. | Philip Morris International, Inc. |
| 10. | Verizon Communications, Inc. |
| 8 | MainStay Epoch Global Equity Yield Fund |
Portfolio Management Discussion and Analysis (Unaudited)
Questions answered by portfolio managers Kera Van Valen, CFA, John Tobin, PhD, CFA, Michael A. Welhoelter, CFA, and William W. Priest, CFA, of Epoch Investment Partners, Inc., the Fund’s Subadvisor.
How did MainStay Epoch Global Equity Yield Fund perform relative to its benchmarks and peer group during the six months ended April 30, 2021?
For the six months ended April 30, 2021, Class I shares of MainStay Epoch Global Equity Yield Fund returned 27.35%, underperforming the 29.10% return of the Fund’s primary benchmark, the MSCI World Index (Net). Over the same period, Class I shares outperformed the 20.43% return of the Global Equity Yield Composite Index, which is the Fund’s secondary benchmark, and underperformed the 33.34% return of the Morningstar World Large Stock Value Category Average.1
What factors affected the Fund’s relative performance during the reporting period?
The most significant detractor from performance relative to the MSCI World Index (Net) was the Fund’s comparatively overweight exposure to utilities, furthered by underperforming stock selections in the sector. Utilities are generally considered a defensive sector, and traditionally defensive investments were out of favor during the reporting period. Stock selection in the communication services sector also detracted from the Fund’s relative performance.
During the reporting period, which sectors and/or countries were the strongest positive contributors to the Fund’s relative performance and which sectors and/or countries were particularly weak?
During the reporting period, the strongest positive sector contributions to the Fund’s performance relative to the MSCI World Index (Net) came from information technology and materials, while utilities and communication services were the weakest. (Contributions take weightings and total returns into account.) In terms of countries, Germany and Japan were the strongest contributors, while the U.K. and Italy were the weakest.
Having been out of favor during most of the COVID-19 pandemic, the dividend yield factor was finally rewarded by the market during the reporting period. By the fall of 2020, progress on the vaccine rollout and the reopening of economies created a more widespread recovery across sectors in the equity markets, and dividend yield was no longer a headwind. It is worth noting that having exposure to dividend yield bolstered the Fund’s performance.
During the reporting period, which individual stocks made the strongest positive contributions to the Fund’s absolute performance and which stocks detracted the most?
Top contributors to the Fund’s absolute performance during the reporting period included semiconductor equipment maker KLA and insurer MetLife.
KLA is a leading provider of tools for inspection, process control and yield management for the semiconductor industry. Shares outperformed on underlying demand for the company’s products as semiconductor production continued to be capacity constrained. Semiconductor manufacturers announced increases in capital spending for 2021, and we expect that capital spending in the area will remain elevated over the next several years. The growth in both logic and memory channels supports numerous industries, with industrial and automotive most prominent among them. The company has historically returned a majority of free cash flow back to shareholders through a progressive dividend and share repurchases.
MetLife serves retail and commercial customers globally with an array of insurance offerings including life, disability, accident, health, dental, annuities and property/casualty coverage. The company is particularly strong in the group benefits area and has a significant presence outside the United States in Asia (Japan), Latin America and the EMEA (Europe, Middle East and Africa) region. Shares traded higher following the release of strong results for the fourth quarter of 2020 and the full year. MetLife executed well, delivering along multiple fronts with top-line growth across business lines and geographies, limited pandemic-related impacts and good expense control. The company also approved a new $3 billion share buyback program and stated its intention to complete the program in 2021. We believe management remains committed to rewarding shareholders with an attractive growing dividend, debt reduction and share repurchases.
The most significant detractors from the Fund’s absolute performance during the same period were utility American Electric Power Company (“AEP”) and global products company Procter & Gamble (“P&G”).
AEP is a regulated utility company that operates in several eastern, midwestern and southern states of the United States. The company also manages the largest electric transmission network
| 1. | See page 5 for other share class returns, which may be higher or lower than Class I share returns. See page 6 for more information on benchmark and peer group returns. |
in the country. Shares underperformed along with utility peers as positive vaccine news in early November led to a significant rise in interest rates and a rally in recovery stocks. Shares were also weighed down by an FBI investigation of FirstEnergy, an AEP peer that also operates in Ohio. We believe it is worth noting that Ohio represents less than 15% of AEP's total rate base. Management has remained focused on delivering regulated earnings growth with an emphasis on transmission and distribution, leading to strong cash flow generation and mid-to-high single digit growth. AEP has historically rewarded its shareholders with an attractive and growing dividend.
P&G is a global consumer and household products manufacturer and marketer. Despite posting strong earnings growth for the third quarter of 2020, P&G shares traded lower as investors shifted focus to concerns over rising input costs, increased competitive intensity and more difficult comparable company analysis (comps) ahead. While commodity inflation remained a short-term headwind as of the end of the reporting period, we believe the company’s top-line growth is likely to benefit from recent reinvestment, enabling P&G to extend market share gains. In our opinion, management remains disciplined about returning cash to shareholders via dividends and share repurchases.
Positions in both AEP and P&G remained in the Fund as of the end of the reporting period.
What were some of the Fund’s largest purchases and sales during the reporting period?
The Fund initiated positions in Norway-based telecommunications company Telenor and Japan-based automobile maker Toyota Motor during the reporting period.
Telenor is a telecommunications operator with major operations in the Nordic countries and Asia. Telenor operates the best or second-best networks in the markets that it serves. This network superiority gives the company pricing power in developed markets that remains very competitive. We believe its greatest growth opportunities are in emerging markets, which benefit from increasing cellular and smartphone penetration, and a growing population base. Cash flow growth from more developed markets is likely to come from share gains, moving customers to more expensive offerings and leveraging its largely fixed-cost network. Telenor has historically paid a well-covered dividend and has returned cash to shareholders through regular share repurchases.
Toyota Motor is the world's second-largest car manufacturer. It produces vehicles worldwide in a variety of configurations, including passenger cars, minivans, trucks and SUVs, and offers financing support to dealers and customers for both purchase and lease. We believe the company’s greatest growth opportunities are in increasing penetration of vehicle sales in emerging markets, taking share in fleet vehicles through its hydrogen offerings, leveraging its production capacity in developed markets on its
internal combustion engine and appealing to a higher proportion of customers by concentrating on hybrid electric vehicles. Toyota has historically returned cash to shareholders through a well-supported dividend and regular share repurchases.
The Fund’s most significant sales during the same period included entirely closing its positions in French tire manufacturer Michelin and Swedish industrial equipment maker Atlas Copco.
The second largest tire manufacturer in the world, Michelin produces passenger, truck and specialty tires. Michelin aims to outpace industry growth as a result of its industry-leading technology that allows the company to charge premium prices and expand its market share. Passenger tire growth is largely a result of increasing miles driven, from which replacement demand follows. Truck sales are supported by increasing trade, while Michelin's specialty tire sales depend on a robust mining, agriculture, aircraft and infrastructure market. Michelin has historically paid a well-covered dividend in addition to maintaining its ongoing share repurchase program. The Fund exited its position to allocate the assets to other shareholder yield opportunities.
Atlas Copco makes products and provides services to improve productivity, energy efficiency and safety in manufacturing processes. Cash flow growth drivers include global industrial production, market share gains driven by the company's high level of product innovation and incremental contributions from acquisitions. Atlas Copco has historically returned cash to shareholders through a growing dividend with a 50% earnings payout target. The Fund exited its position in favor of other investment opportunities.
How did the Fund’s sector and country weightings change during the reporting period?
During the reporting period, the Fund’s most significant sector allocation changes were decreases in exposure to utilities and health care, and increases in exposure to financials and energy. From a country perspective, the Fund’s most significant allocation changes included increased exposure to Canada and Germany, and reduced exposure to the United States and Sweden. The Fund’s sector and country allocations are a result of our bottom-up fundamental investment process and reflect the companies and securities that we confidently believe can collect and distribute sustainable, growing shareholder yield.
How was the Fund positioned at the end of the reporting period?
As of April 30, 2021, the Fund’s largest sector allocations on an absolute basis were to financials and information technology, while its smallest total sector allocations were to real estate and energy. As of the same date, relative to the MSCI World Index (Net), the Fund held its most overweight exposure to utilities, a defensive sector that is typically more heavily represented in the
| 10 | MainStay Epoch Global Equity Yield Fund |
Fund. The Fund’s most significant underweight exposures were to the information technology and consumer discretionary sectors.
The opinions expressed are those of the portfolio managers as of the date of this report and are subject to change. There is no guarantee that any forecasts will come to pass. This material does not constitute investment advice and is not intended as an endorsement of any specific investment.
Portfolio of Investments April 30, 2021† (Unaudited)
| | Shares | Value |
| Common Stocks 97.3% |
| Canada 8.0% |
| BCE, Inc. (Diversified Telecommunication Services) | 277,586 | $ 13,121,057 |
| Fortis, Inc. (Electric Utilities) | 190,297 | 8,488,781 |
| Great-West Lifeco, Inc. (Insurance) | 399,832 | 11,593,388 |
| Nutrien Ltd. (Chemicals) | 365,544 | 20,174,373 |
| Restaurant Brands International, Inc. (Hotels, Restaurants & Leisure) | 157,389 | 10,798,459 |
| Rogers Communications, Inc., Class B (Wireless Telecommunication Services) | 137,121 | 6,753,696 |
| Royal Bank of Canada (Banks) | 165,783 | 15,822,319 |
| TELUS Corp. (Diversified Telecommunication Services) | 523,066 | 10,851,550 |
| | | 97,603,623 |
| France 5.1% |
| AXA SA (Insurance) (a) | 442,100 | 12,503,884 |
| Danone SA (Food Products) | 92,975 | 6,553,614 |
| Orange SA (Diversified Telecommunication Services) | 952,703 | 11,854,757 |
| Sanofi (Pharmaceuticals) (a) | 148,158 | 15,544,790 |
| TOTAL SE (Oil, Gas & Consumable Fuels) | 367,885 | 16,287,320 |
| | | 62,744,365 |
| Germany 7.5% |
| Allianz SE (Registered) (Insurance) | 87,105 | 22,661,838 |
| BASF SE (Chemicals) | 178,325 | 14,381,364 |
| Bayer AG (Registered) (Pharmaceuticals) | 89,296 | 5,777,906 |
| Deutsche Post AG (Registered) (Air Freight & Logistics) | 239,460 | 14,093,693 |
| Deutsche Telekom AG (Registered) (Diversified Telecommunication Services) | 438,453 | 8,434,082 |
| Muenchener Rueckversicherungs-Gesellschaft AG (Registered) (Insurance) | 56,186 | 16,255,816 |
| Siemens AG (Registered) (Industrial Conglomerates) | 63,209 | 10,549,351 |
| | | 92,154,050 |
| Italy 3.2% |
| Assicurazioni Generali SpA (Insurance) | 588,509 | 11,805,221 |
| Snam SpA (Gas Utilities) | 3,172,176 | 17,848,343 |
| | Shares | Value |
| |
| Italy (continued) |
| Terna Rete Elettrica Nazionale SpA (Electric Utilities) | 1,263,854 | $ 9,314,342 |
| | | 38,967,906 |
| Japan 2.5% |
| Takeda Pharmaceutical Co. Ltd. (Pharmaceuticals) | 456,700 | 15,189,903 |
| Tokio Marine Holdings, Inc. (Insurance) | 185,900 | 8,896,120 |
| Toyota Motor Corp. (Automobiles) | 84,200 | 6,261,263 |
| | | 30,347,286 |
| Norway 1.1% |
| Orkla ASA (Food Products) | 656,508 | 6,700,735 |
| Telenor ASA (Diversified Telecommunication Services) | 409,069 | 7,295,326 |
| | | 13,996,061 |
| Republic of Korea 1.6% |
| Samsung Electronics Co. Ltd. GDR (Technology Hardware, Storage & Peripherals) | 10,974 | 19,983,654 |
| Singapore 0.6% |
| Singapore Exchange Ltd. (Capital Markets) | 936,400 | 7,353,282 |
| Spain 0.6% |
| Industria de Diseno Textil SA (Specialty Retail) | 189,796 | 6,758,758 |
| Switzerland 2.4% |
| Nestle SA (Registered) (Food Products) | 72,908 | 8,692,278 |
| Novartis AG (Registered) (Pharmaceuticals) | 121,102 | 10,337,927 |
| Roche Holding AG (Pharmaceuticals) | 29,765 | 9,699,495 |
| | | 28,729,700 |
| Taiwan 1.7% |
| Taiwan Semiconductor Manufacturing Co. Ltd., Sponsored ADR (Semiconductors & Semiconductor Equipment) | 174,131 | 20,328,053 |
| United Kingdom 6.8% |
| AstraZeneca plc, Sponsored ADR (Pharmaceuticals) (a) | 145,482 | 7,720,730 |
| BAE Systems plc (Aerospace & Defense) | 2,335,879 | 16,329,838 |
The notes to the financial statements are an integral part of, and should be read in conjunction with, the financial statements.
| 12 | MainStay Epoch Global Equity Yield Fund |
| | Shares | Value |
| Common Stocks (continued) |
| United Kingdom (continued) |
| British American Tobacco plc (Tobacco) | 354,161 | $ 13,118,039 |
| British American Tobacco plc, Sponsored ADR (Tobacco) | 116,720 | 4,378,167 |
| Coca-Cola European Partners plc (Beverages) | 121,737 | 6,917,097 |
| GlaxoSmithKline plc (Pharmaceuticals) | 627,077 | 11,601,267 |
| National Grid plc (Multi-Utilities) | 719,049 | 9,042,646 |
| Unilever plc (Personal Products) | 248,824 | 14,541,058 |
| | | 83,648,842 |
| United States 56.2% |
| AbbVie, Inc. (Biotechnology) | 196,097 | 21,864,815 |
| Altria Group, Inc. (Tobacco) | 336,782 | 16,081,340 |
| Ameren Corp. (Multi-Utilities) | 91,637 | 7,774,483 |
| American Electric Power Co., Inc. (Electric Utilities) | 104,680 | 9,286,163 |
| American Tower Corp. (Equity Real Estate Investment Trusts) | 25,418 | 6,475,744 |
| Amgen, Inc. (Biotechnology) | 34,782 | 8,335,158 |
| Analog Devices, Inc. (Semiconductors & Semiconductor Equipment) | 89,510 | 13,709,352 |
| Apple, Inc. (Technology Hardware, Storage & Peripherals) | 89,011 | 11,701,386 |
| AT&T, Inc. (Diversified Telecommunication Services) | 343,806 | 10,798,946 |
| BlackRock, Inc. (Capital Markets) | 8,361 | 6,850,167 |
| Broadcom, Inc. (Semiconductors & Semiconductor Equipment) | 29,315 | 13,373,503 |
| Chevron Corp. (Oil, Gas & Consumable Fuels) | 98,995 | 10,203,415 |
| Cisco Systems, Inc. (Communications Equipment) | 320,781 | 16,330,961 |
| Coca-Cola Co. (The) (Beverages) | 166,217 | 8,972,394 |
| Dominion Energy, Inc. (Multi-Utilities) | 160,197 | 12,799,740 |
| Dow, Inc. (Chemicals) | 182,605 | 11,412,812 |
| Duke Energy Corp. (Electric Utilities) | 84,614 | 8,519,784 |
| Eaton Corp. plc (Electrical Equipment) | 75,918 | 10,850,960 |
| Emerson Electric Co. (Electrical Equipment) | 91,302 | 8,261,918 |
| Entergy Corp. (Electric Utilities) | 107,690 | 11,769,440 |
| Enterprise Products Partners LP (Oil, Gas & Consumable Fuels) | 565,625 | 13,015,031 |
| Evergy, Inc. (Electric Utilities) | 167,740 | 10,730,328 |
| Hanesbrands, Inc. (Textiles, Apparel & Luxury Goods) | 403,002 | 8,487,222 |
| Hasbro, Inc. (Leisure Products) | 123,239 | 12,256,119 |
| | Shares | Value |
| |
| United States (continued) |
| Home Depot, Inc. (The) (Specialty Retail) | 23,076 | $ 7,469,009 |
| Intel Corp. (Semiconductors & Semiconductor Equipment) | 118,392 | 6,811,092 |
| International Business Machines Corp. (IT Services) | 136,667 | 19,390,314 |
| Iron Mountain, Inc. (Equity Real Estate Investment Trusts) | 491,963 | 19,737,556 |
| Johnson & Johnson (Pharmaceuticals) | 62,875 | 10,231,649 |
| JPMorgan Chase & Co. (Banks) | 71,570 | 11,008,182 |
| Kimberly-Clark Corp. (Household Products) | 87,289 | 11,637,369 |
| KLA Corp. (Semiconductors & Semiconductor Equipment) | 56,878 | 17,936,477 |
| Las Vegas Sands Corp. (Hotels, Restaurants & Leisure) (b) | 98,995 | 6,064,434 |
| Lazard Ltd., Class A (Capital Markets) | 247,222 | 11,122,518 |
| Leggett & Platt, Inc. (Household Durables) | 190,632 | 9,468,691 |
| Lockheed Martin Corp. (Aerospace & Defense) | 21,404 | 8,145,506 |
| LyondellBasell Industries NV, Class A (Chemicals) | 111,418 | 11,558,503 |
| Magellan Midstream Partners LP (Oil, Gas & Consumable Fuels) | 207,688 | 9,713,568 |
| McDonald's Corp. (Hotels, Restaurants & Leisure) | 32,775 | 7,737,522 |
| Medtronic plc (Health Care Equipment & Supplies) | 48,828 | 6,392,562 |
| Merck & Co., Inc. (Pharmaceuticals) | 166,217 | 12,383,166 |
| MetLife, Inc. (Insurance) | 286,616 | 18,237,376 |
| Microsoft Corp. (Software) | 87,562 | 22,081,385 |
| MSC Industrial Direct Co., Inc., Class A (Trading Companies & Distributors) | 100,332 | 9,045,933 |
| Omnicom Group, Inc. (Media) | 84,614 | 6,960,348 |
| PepsiCo, Inc. (Beverages) | 49,497 | 7,135,487 |
| Pfizer, Inc. (Pharmaceuticals) | 303,338 | 11,724,014 |
| Philip Morris International, Inc. (Tobacco) | 194,310 | 18,459,450 |
| Phillips 66 (Oil, Gas & Consumable Fuels) | 97,657 | 7,901,428 |
| PNC Financial Services Group, Inc. (The) (Banks) | 45,484 | 8,503,234 |
| Procter & Gamble Co. (The) (Household Products) | 42,474 | 5,666,881 |
| Raytheon Technologies Corp. (Aerospace & Defense) | 83,346 | 6,937,721 |
The notes to the financial statements are an integral part of, and should be read in conjunction with, the financial statements.
13
Portfolio of Investments April 30, 2021† (Unaudited) (continued)
| | Shares | Value |
| Common Stocks (continued) |
| United States (continued) |
| T. Rowe Price Group, Inc. (Capital Markets) | 36,454 | $ 6,532,557 |
| Target Corp. (Multiline Retail) | 32,106 | 6,654,290 |
| Texas Instruments, Inc. (Semiconductors & Semiconductor Equipment) | 93,793 | 16,930,574 |
| Truist Financial Corp. (Banks) | 199,693 | 11,843,792 |
| United Parcel Service, Inc., Class B (Air Freight & Logistics) | 38,461 | 7,840,659 |
| Vail Resorts, Inc. (Hotels, Restaurants & Leisure) | 19,732 | 6,416,057 |
| Verizon Communications, Inc. (Diversified Telecommunication Services) | 319,391 | 18,457,606 |
| Watsco, Inc. (Trading Companies & Distributors) | 33,444 | 9,794,410 |
| WEC Energy Group, Inc. (Multi-Utilities) | 85,951 | 8,351,859 |
| Welltower, Inc. (Equity Real Estate Investment Trusts) | 104,680 | 7,854,140 |
| WP Carey, Inc. (Equity Real Estate Investment Trusts) | 91,386 | 6,843,898 |
| | | 686,842,398 |
Total Common Stocks
(Cost $925,954,717) | | 1,189,457,978 |
| Short-Term Investments 4.2% |
| Affiliated Investment Company 1.7% |
| United States 1.7% |
| MainStay U.S. Government Liquidity Fund, 0.01% (c) | 20,876,052 | 20,876,052 |
| | Shares | | Value |
| |
| Unaffiliated Investment Company 2.5% |
| United States 2.5% |
| BlackRock Liquidity FedFund, 0.05% (c)(d) | 30,214,648 | | $ 30,214,648 |
Total Short-Term Investments
(Cost $51,090,700) | | | 51,090,700 |
Total Investments
(Cost $977,045,417) | 101.5% | | 1,240,548,678 |
| Other Assets, Less Liabilities | (1.5) | | (17,998,154) |
| Net Assets | 100.0% | | $ 1,222,550,524 |
| † | Percentages indicated are based on Fund net assets. |
| (a) | All or a portion of this security was held on loan. As of April 30, 2021, the aggregate market value of securities on loan was $35,706,163; the total market value of collateral held by the Fund was $37,411,610. The market value of the collateral held included non-cash collateral in the form of U.S. Treasury securities with a value of $7,196,962. The Fund received cash collateral with a value of $30,214,648. (See Note 2(I)) |
| (b) | Non-income producing security. |
| (c) | Current yield as of April 30, 2021. |
| (d) | Represents a security purchased with cash collateral received for securities on loan. |
| Abbreviation(s): |
| ADR—American Depositary Receipt |
| GDR—Global Depositary Receipt |
The notes to the financial statements are an integral part of, and should be read in conjunction with, the financial statements.
| 14 | MainStay Epoch Global Equity Yield Fund |
The following is a summary of the fair valuations according to the inputs used as of April 30, 2021, for valuing the Fund’s assets:
| Description | Quoted
Prices in
Active
Markets for
Identical
Assets
(Level 1) | | Significant
Other
Observable
Inputs
(Level 2) | | Significant
Unobservable
Inputs
(Level 3) | | Total |
| Asset Valuation Inputs | | | | | | | |
| Investments in Securities (a) | | | | | | | |
| Common Stocks | $ 1,189,457,978 | | $ — | | $ — | | $ 1,189,457,978 |
| Short-Term Investments | | | | | | | |
| Affiliated Investment Company | 20,876,052 | | — | | — | | 20,876,052 |
| Unaffiliated Investment Company | 30,214,648 | | — | | — | | 30,214,648 |
| Total Short-Term Investments | 51,090,700 | | — | | — | | 51,090,700 |
| Total Investments in Securities | $ 1,240,548,678 | | $ — | | $ — | | $ 1,240,548,678 |
| (a) | For a complete listing of investments and their industries, see the Portfolio of Investments. |
The notes to the financial statements are an integral part of, and should be read in conjunction with, the financial statements.
15
Portfolio of Investments April 30, 2021† (Unaudited) (continued)
The table below sets forth the diversification of the Fund’s investments by industry.
Industry Diversification
| | Value | | Percent |
| Aerospace & Defense | $ 31,413,065 | | 2.6% |
| Air Freight & Logistics | 21,934,352 | | 1.7 |
| Automobiles | 6,261,263 | | 0.5 |
| Banks | 47,177,527 | | 3.9 |
| Beverages | 23,024,978 | | 1.9 |
| Biotechnology | 30,199,973 | | 2.5 |
| Capital Markets | 31,858,524 | | 2.6 |
| Chemicals | 57,527,052 | | 4.6 |
| Communications Equipment | 16,330,961 | | 1.3 |
| Diversified Telecommunication Services | 80,813,324 | | 6.7 |
| Electric Utilities | 58,108,838 | | 4.9 |
| Electrical Equipment | 19,112,878 | | 1.6 |
| Equity Real Estate Investment Trusts | 40,911,338 | | 3.3 |
| Food Products | 21,946,627 | | 1.7 |
| Gas Utilities | 17,848,343 | | 1.4 |
| Health Care Equipment & Supplies | 6,392,562 | | 0.5 |
| Hotels, Restaurants & Leisure | 31,016,472 | | 2.5 |
| Household Durables | 9,468,691 | | 0.8 |
| Household Products | 17,304,250 | | 1.5 |
| Industrial Conglomerates | 10,549,351 | | 0.9 |
| Insurance | 101,953,643 | | 8.2 |
| IT Services | 19,390,314 | | 1.6 |
| Leisure Products | 12,256,119 | | 1.0 |
| Media | 6,960,348 | | 0.6 |
| Multiline Retail | 6,654,290 | | 0.5 |
| Multi-Utilities | 37,968,728 | | 3.0 |
| Oil, Gas & Consumable Fuels | 57,120,762 | | 4.6 |
| Personal Products | 14,541,058 | | 1.2 |
| Pharmaceuticals | 110,210,847 | | 9.1 |
| Semiconductors & Semiconductor Equipment | 89,089,051 | | 7.4 |
| Software | 22,081,385 | | 1.8 |
| Specialty Retail | 14,227,767 | | 1.2 |
| Technology Hardware, Storage & Peripherals | 31,685,040 | | 2.6 |
| Textiles, Apparel & Luxury Goods | 8,487,222 | | 0.7 |
| Tobacco | 52,036,996 | | 4.3 |
| Trading Companies & Distributors | 18,840,343 | | 1.5 |
| Wireless Telecommunication Services | 6,753,696 | | 0.6 |
| | 1,189,457,978 | | 97.3 |
| Short-Term Investments | 51,090,700 | | 4.2 |
| Other Assets, Less Liabilities | (17,998,154) | | (1.5) |
| Net Assets | $1,222,550,524 | | 100.0% |
| † | Percentages indicated are based on Fund net assets. |
The notes to the financial statements are an integral part of, and should be read in conjunction with, the financial statements.
| 16 | MainStay Epoch Global Equity Yield Fund |
Statement of Assets and Liabilities as of April 30, 2021 (Unaudited)
| Assets |
Investment in unaffiliated securities, at value
(identified cost $956,169,365) including securities on loan of $35,706,163 | $1,219,672,626 |
Investment in affiliated investment companies, at value
(identified cost $20,876,052) | 20,876,052 |
Cash denominated in foreign currencies
(identified cost $5,778,471) | 5,824,312 |
| Cash | 373 |
| Due from custodian | 213,309 |
| Receivables: | |
| Dividends and interest | 7,959,450 |
| Fund shares sold | 1,087,790 |
| Securities lending | 22,396 |
| Other assets | 66,667 |
| Total assets | 1,255,722,975 |
| Liabilities |
| Cash collateral received for securities on loan | 30,214,648 |
| Payables: | |
| Fund shares redeemed | 1,310,812 |
| Manager (See Note 3) | 604,364 |
| Transfer agent (See Note 3) | 445,793 |
| Investment securities purchased | 357,396 |
| Shareholder communication | 71,846 |
| Professional fees | 61,131 |
| NYLIFE Distributors (See Note 3) | 57,773 |
| Custodian | 40,754 |
| Trustees | 1,437 |
| Accrued expenses | 6,497 |
| Total liabilities | 33,172,451 |
| Net assets | $1,222,550,524 |
| Composition of Net Assets |
| Shares of beneficial interest outstanding (par value of $.001 per share) unlimited number of shares authorized | $ 61,713 |
| Additional paid-in-capital | 1,092,648,785 |
| | 1,092,710,498 |
| Total distributable earnings (loss) | 129,840,026 |
| Net assets | $1,222,550,524 |
| Class A | |
| Net assets applicable to outstanding shares | $ 131,259,231 |
| Shares of beneficial interest outstanding | 6,611,297 |
| Net asset value per share outstanding | $ 19.85 |
| Maximum sales charge (5.50% of offering price) | 1.16 |
| Maximum offering price per share outstanding | $ 21.01 |
| Investor Class | |
| Net assets applicable to outstanding shares | $ 9,576,565 |
| Shares of beneficial interest outstanding | 483,355 |
| Net asset value per share outstanding | $ 19.81 |
| Maximum sales charge (5.00% of offering price) | 1.04 |
| Maximum offering price per share outstanding | $ 20.85 |
| Class C | |
| Net assets applicable to outstanding shares | $ 34,464,496 |
| Shares of beneficial interest outstanding | 1,746,253 |
| Net asset value and offering price per share outstanding | $ 19.74 |
| Class I | |
| Net assets applicable to outstanding shares | $1,045,166,020 |
| Shares of beneficial interest outstanding | 52,766,550 |
| Net asset value and offering price per share outstanding | $ 19.81 |
| Class R2 | |
| Net assets applicable to outstanding shares | $ 542,692 |
| Shares of beneficial interest outstanding | 27,322 |
| Net asset value and offering price per share outstanding | $ 19.86 |
| Class R3 | |
| Net assets applicable to outstanding shares | $ 544,776 |
| Shares of beneficial interest outstanding | 27,461 |
| Net asset value and offering price per share outstanding | $ 19.84 |
| Class R6 | |
| Net assets applicable to outstanding shares | $ 996,744 |
| Shares of beneficial interest outstanding | 50,944 |
| Net asset value and offering price per share outstanding | $ 19.57 |
The notes to the financial statements are an integral part of, and should be read in conjunction with, the financial statements.
17
Statement of Operations for the six months ended April 30, 2021 (Unaudited)
| Investment Income (Loss) |
| Income | |
| Dividends-unaffiliated (net of foreign tax withholding of $1,348,730) | $ 22,355,578 |
| Securities lending | 55,428 |
| Dividends-affiliated | 776 |
| Other | 9,472 |
| Total income | 22,421,254 |
| Expenses | |
| Manager (See Note 3) | 4,206,006 |
| Transfer agent (See Note 3) | 1,135,387 |
| Distribution/Service—Class A (See Note 3) | 146,081 |
| Distribution/Service—Investor Class (See Note 3) | 11,173 |
| Distribution/Service—Class C (See Note 3) | 209,285 |
| Distribution/Service—Class R2 (See Note 3) | 631 |
| Distribution/Service—Class R3 (See Note 3) | 1,276 |
| Professional fees | 71,823 |
| Shareholder communication | 68,787 |
| Registration | 66,667 |
| Custodian | 51,302 |
| Trustees | 15,135 |
| Interest expense | 10,996 |
| Insurance | 8,074 |
| Shareholder service (See Note 3) | 508 |
| Miscellaneous | 30,058 |
| Total expenses before waiver/reimbursement | 6,033,189 |
| Expense waiver/reimbursement from Manager (See Note 3) | (606,227) |
| Net expenses | 5,426,962 |
| Net investment income (loss) | 16,994,292 |
| Realized and Unrealized Gain (Loss) |
| Net realized gain (loss) on: | |
| Unaffiliated investment transactions | 84,095,671 |
| Foreign currency transactions | 37,875 |
| Net realized gain (loss) | 84,133,546 |
| Net change in unrealized appreciation (depreciation) on: | |
| Unaffiliated investments | 198,771,547 |
| Translation of other assets and liabilities in foreign currencies | (15,769) |
| Net change in unrealized appreciation (depreciation) | 198,755,778 |
| Net realized and unrealized gain (loss) | 282,889,324 |
| Net increase (decrease) in net assets resulting from operations | $299,883,616 |
The notes to the financial statements are an integral part of, and should be read in conjunction with, the financial statements.
| 18 | MainStay Epoch Global Equity Yield Fund |
Statements of Changes in Net Assets
for the six months ended April 30, 2021 (Unaudited) and the year ended October 31, 2020
| | 2021 | 2020 |
| Increase (Decrease) in Net Assets |
| Operations: | | |
| Net investment income (loss) | $ 16,994,292 | $ 47,575,194 |
| Net realized gain (loss) | 84,133,546 | (200,601,648) |
| Net change in unrealized appreciation (depreciation) | 198,755,778 | (66,389,034) |
| Net increase (decrease) in net assets resulting from operations | 299,883,616 | (219,415,488) |
| Distributions to shareholders: | | |
| Class A | (1,707,333) | (5,145,312) |
| Investor Class | (124,659) | (414,339) |
| Class C | (357,345) | (3,136,339) |
| Class I | (15,500,436) | (70,734,292) |
| Class R2 | (6,709) | (23,851) |
| Class R3 | (6,165) | (20,647) |
| Class R6 | (7,993) | (2,664,103) |
| Total distributions to shareholders | (17,710,640) | (82,138,883) |
| Capital share transactions: | | |
| Net proceeds from sales of shares | 139,873,089 | 361,913,175 |
| Net asset value of shares issued to shareholder in reinvestment of distributions | 15,666,536 | 69,769,141 |
| Cost of shares redeemed | (476,545,676) | (828,069,448) |
| Increase (decrease) in net assets derived from capital share transactions | (321,006,051) | (396,387,132) |
| Net increase (decrease) in net assets | (38,833,075) | (697,941,503) |
| Net Assets |
| Beginning of period | 1,261,383,599 | 1,959,325,102 |
| End of period | $1,222,550,524 | $1,261,383,599 |
The notes to the financial statements are an integral part of, and should be read in conjunction with, the financial statements.
19
Financial Highlights selected per share data and ratios
| | Six months ended
April 30,
2021* | | Year Ended October 31, |
| Class A | 2020 | | 2019 | | 2018 | | 2017 | | 2016 |
| Net asset value at beginning of period | $ 15.83 | | $ 18.75 | | $ 18.38 | | $ 19.66 | | $ 17.42 | | $ 18.83 |
| Net investment income (loss) (a) | 0.22 | | 0.46 | | 0.57 | | 0.60 | | 0.49 | | 0.53 |
| Net realized and unrealized gain (loss) on investments | 4.06 | | (2.59) | | 1.42 | | (1.30) | | 2.24 | | (0.41) |
| Net realized and unrealized gain (loss) on foreign currency transactions‡ | 0.00 | | 0.00 | | (0.00) | | (0.00) | | 0.00 | | (0.00) |
| Total from investment operations | 4.28 | | (2.13) | | 1.99 | | (0.70) | | 2.73 | | 0.12 |
| Less distributions: | | | | | | | | | | | |
| From net investment income | (0.26) | | (0.45) | | (0.59) | | (0.56) | | (0.49) | | (0.51) |
| From net realized gain on investments | — | | (0.34) | | (1.03) | | (0.02) | | — | | (1.02) |
| Total distributions | (0.26) | | (0.79) | | (1.62) | | (0.58) | | (0.49) | | (1.53) |
| Net asset value at end of period | $ 19.85 | | $ 15.83 | | $ 18.75 | | $ 18.38 | | $ 19.66 | | $ 17.42 |
| Total investment return (b) | 27.14% | | (11.48)% | | 11.66% | | (3.64)% | | 15.88% | | 0.87% |
| Ratios (to average net assets)/Supplemental Data: | | | | | | | | | | | |
| Net investment income (loss) | 2.42%†† | | 2.74% | | 3.17% | | 3.07% | | 2.62% | | 2.97% |
| Net expenses (c) | 1.09%†† (d) | | 1.09% (d) | | 1.10% (d) | | 1.10% | | 1.14% | | 1.11% (d) |
| Expenses (before waiver/reimbursement) (c) | 1.19%†† | | 1.14% | | 1.14% | | 1.16% | | 1.14% | | 1.11% |
| Portfolio turnover rate | 17% | | 40% | | 24% | | 15% | | 18% | | 21% |
| Net assets at end of period (in 000’s) | $ 131,259 | | $ 103,166 | | $ 125,791 | | $ 134,136 | | $ 782,204 | | $ 900,737 |
| * | Unaudited. |
| ‡ | Less than one cent per share. |
| †† | Annualized. |
| (a) | Per share data based on average shares outstanding during the period. |
| (b) | Total investment return is calculated exclusive of sales charges and assumes the reinvestment of dividends and distributions. For periods of less than one year, total return is not annualized. |
| (c) | In addition to the fees and expenses which the Fund bears directly, it also indirectly bears a pro-rata share of the fees and expenses of the underlying funds in which it invests. Such indirect expenses are not included in the above expense ratios. |
| (d) | Net of interest expense of less than 0.01%. (See Note 6) |
The notes to the financial statements are an integral part of, and should be read in conjunction with, the financial statements.
| 20 | MainStay Epoch Global Equity Yield Fund |
Financial Highlights selected per share data and ratios
| | Six months ended
April 30,
2021* | | Year Ended October 31, |
| Investor Class | 2020 | | 2019 | | 2018 | | 2017 | | 2016 |
| Net asset value at beginning of period | $ 15.80 | | $ 18.72 | | $ 18.35 | | $ 19.63 | | $ 17.39 | | $ 18.80 |
| Net investment income (loss) (a) | 0.21 | | 0.46 | | 0.57 | | 0.54 | | 0.49 | | 0.53 |
| Net realized and unrealized gain (loss) on investments | 4.06 | | (2.59) | | 1.42 | | (1.24) | | 2.25 | | (0.41) |
| Net realized and unrealized gain (loss) on foreign currency transactions‡ | 0.00 | | 0.00 | | (0.00) | | (0.00) | | 0.00 | | (0.00) |
| Total from investment operations | 4.27 | | (2.13) | | 1.99 | | (0.70) | | 2.74 | | 0.12 |
| Less distributions: | | | | | | | | | | | |
| From net investment income | (0.26) | | (0.45) | | (0.59) | | (0.56) | | (0.50) | | (0.51) |
| From net realized gain on investments | — | | (0.34) | | (1.03) | | (0.02) | | — | | (1.02) |
| Total distributions | (0.26) | | (0.79) | | (1.62) | | (0.58) | | (0.50) | | (1.53) |
| Net asset value at end of period | $ 19.81 | | $ 15.80 | | $ 18.72 | | $ 18.35 | | $ 19.63 | | $ 17.39 |
| Total investment return (b) | 27.10% | | (11.53)% | | 11.67% | | (3.65)% | | 15.93% | | 0.87% |
| Ratios (to average net assets)/Supplemental Data: | | | | | | | | | | | |
| Net investment income (loss) | 2.33%†† | | 2.70% | | 3.15% | | 2.80% | | 2.66% | | 3.04% |
| Net expenses (c) | 1.16%†† (d) | | 1.13% (d) | | 1.11% (d) | | 1.10% | | 1.11% | | 1.11% (d) |
| Expenses (before waiver/reimbursement) (c) | 1.17%†† | | 1.13% | | 1.11% | | 1.10% | | 1.11% | | 1.11% |
| Portfolio turnover rate | 17% | | 40% | | 24% | | 15% | | 18% | | 21% |
| Net assets at end of period (in 000’s) | $ 9,577 | | $ 7,897 | | $ 10,067 | | $ 9,582 | | $ 10,849 | | $ 10,419 |
| * | Unaudited. |
| ‡ | Less than one cent per share. |
| †† | Annualized. |
| (a) | Per share data based on average shares outstanding during the period. |
| (b) | Total investment return is calculated exclusive of sales charges and assumes the reinvestment of dividends and distributions. For periods of less than one year, total return is not annualized. |
| (c) | In addition to the fees and expenses which the Fund bears directly, it also indirectly bears a pro-rata share of the fees and expenses of the underlying funds in which it invests. Such indirect expenses are not included in the above expense ratios. |
| (d) | Net of interest expense of less than 0.01%. (See Note 6) |
The notes to the financial statements are an integral part of, and should be read in conjunction with, the financial statements.
21
Financial Highlights selected per share data and ratios
| | Six months ended
April 30,
2021* | | Year Ended October 31, |
| Class C | 2020 | | 2019 | | 2018 | | 2017 | | 2016 |
| Net asset value at beginning of period | $ 15.73 | | $ 18.62 | | $ 18.25 | | $ 19.53 | | $ 17.30 | | $ 18.71 |
| Net investment income (loss) (a) | 0.14 | | 0.34 | | 0.44 | | 0.40 | | 0.35 | | 0.40 |
| Net realized and unrealized gain (loss) on investments | 4.05 | | (2.57) | | 1.41 | | (1.25) | | 2.24 | | (0.41) |
| Net realized and unrealized gain (loss) on foreign currency transactions‡ | 0.00 | | 0.00 | | (0.00) | | (0.00) | | 0.00 | | (0.00) |
| Total from investment operations | 4.19 | | (2.23) | | 1.85 | | (0.85) | | 2.59 | | (0.01) |
| Less distributions: | | | | | | | | | | | |
| From net investment income | (0.18) | | (0.32) | | (0.45) | | (0.41) | | (0.36) | | (0.38) |
| From net realized gain on investments | — | | (0.34) | | (1.03) | | (0.02) | | — | | (1.02) |
| Total distributions | (0.18) | | (0.66) | | (1.48) | | (0.43) | | (0.36) | | (1.40) |
| Net asset value at end of period | $ 19.74 | | $ 15.73 | | $ 18.62 | | $ 18.25 | | $ 19.53 | | $ 17.30 |
| Total investment return (b) | 26.69% | | (12.14)% | | 10.88% | | (4.41)% | | 15.08% | | 0.11% |
| Ratios (to average net assets)/Supplemental Data: | | | | | | | | | | | |
| Net investment income (loss) | 1.58%†† | | 2.00% | | 2.47% | | 2.08% | | 1.91% | | 2.26% |
| Net expenses (c) | 1.85%†† (d) | | 1.84% (d) | | 1.85% (d) | | 1.84% | | 1.86% | | 1.86% (d) |
| Expenses (before waiver/reimbursement) (c) | 1.92%†† | | 1.88% | | 1.87% | | 1.85% | | 1.86% | | 1.86% |
| Portfolio turnover rate | 17% | | 40% | | 24% | | 15% | | 18% | | 21% |
| Net assets at end of period (in 000’s) | $ 34,464 | | $ 42,298 | | $ 97,872 | | $ 138,182 | | $ 189,291 | | $ 221,557 |
| * | Unaudited. |
| ‡ | Less than one cent per share. |
| †† | Annualized. |
| (a) | Per share data based on average shares outstanding during the period. |
| (b) | Total investment return is calculated exclusive of sales charges and assumes the reinvestment of dividends and distributions. For periods of less than one year, total return is not annualized. |
| (c) | In addition to the fees and expenses which the Fund bears directly, it also indirectly bears a pro-rata share of the fees and expenses of the underlying funds in which it invests. Such indirect expenses are not included in the above expense ratios. |
| (d) | Net of interest expense of less than 0.01%. (See Note 6) |
The notes to the financial statements are an integral part of, and should be read in conjunction with, the financial statements.
| 22 | MainStay Epoch Global Equity Yield Fund |
Financial Highlights selected per share data and ratios
| | Six months ended
April 30,
2021* | | Year Ended October 31, |
| Class I | 2020 | | 2019 | | 2018 | | 2017 | | 2016 |
| Net asset value at beginning of period | $ 15.79 | | $ 18.72 | | $ 18.34 | | $ 19.63 | | $ 17.39 | | $ 18.80 |
| Net investment income (loss) (a) | 0.27 | | 0.50 | | 0.62 | | 0.59 | | 0.53 | | 0.57 |
| Net realized and unrealized gain (loss) on investments | 4.03 | | (2.59) | | 1.43 | | (1.25) | | 2.25 | | (0.40) |
| Net realized and unrealized gain (loss) on foreign currency transactions‡ | 0.00 | | 0.00 | | (0.00) | | (0.00) | | 0.00 | | (0.00) |
| Total from investment operations | 4.30 | | (2.09) | | 2.05 | | (0.66) | | 2.78 | | 0.17 |
| Less distributions: | | | | | | | | | | | |
| From net investment income | (0.28) | | (0.50) | | (0.64) | | (0.61) | | (0.54) | | (0.56) |
| From net realized gain on investments | — | | (0.34) | | (1.03) | | (0.02) | | — | | (1.02) |
| Total distributions | (0.28) | | (0.84) | | (1.67) | | (0.63) | | (0.54) | | (1.58) |
| Net asset value at end of period | $ 19.81 | | $ 15.79 | | $ 18.72 | | $ 18.34 | | $ 19.63 | | $ 17.39 |
| Total investment return (b) | 27.35% | | (11.31)% | | 12.03% | | (3.44)% | | 16.20% | | 1.12% |
| Ratios (to average net assets)/Supplemental Data: | | | | | | | | | | | |
| Net investment income (loss) | 2.93%†† | | 2.98% | | 3.44% | | 3.03% | | 2.87% | | 3.25% |
| Net expenses (c) | 0.84%†† (d) | | 0.84% (d) | | 0.85% (d) | | 0.85% | | 0.89% | | 0.86% (d) |
| Expenses (before waiver/reimbursement) (c) | 0.94%†† | | 0.89% | | 0.89% | | 0.91% | | 0.89% | | 0.86% |
| Portfolio turnover rate | 17% | | 40% | | 24% | | 15% | | 18% | | 21% |
| Net assets at end of period (in 000’s) | $ 1,045,166 | | $ 1,106,793 | | $ 1,657,341 | | $ 2,279,815 | | $ 2,850,185 | | $ 2,817,292 |
| * | Unaudited. |
| ‡ | Less than one cent per share. |
| †† | Annualized. |
| (a) | Per share data based on average shares outstanding during the period. |
| (b) | Total investment return is calculated exclusive of sales charges and assumes the reinvestment of dividends and distributions. Class I shares are not subject to sales charges. For periods of less than one year, total return is not annualized. |
| (c) | In addition to the fees and expenses which the Fund bears directly, it also indirectly bears a pro-rata share of the fees and expenses of the underlying funds in which it invests. Such indirect expenses are not included in the above expense ratios. |
| (d) | Net of interest expense of less than 0.01%. (See Note 6) |
The notes to the financial statements are an integral part of, and should be read in conjunction with, the financial statements.
23
Financial Highlights selected per share data and ratios
| | Six months ended
April 30,
2021* | | Year Ended October 31, |
| Class R2 | 2020 | | 2019 | | 2018 | | 2017 | | 2016 |
| Net asset value at beginning of period | $ 15.84 | | $ 18.77 | | $ 18.39 | | $ 19.67 | | $ 17.42 | | $ 18.83 |
| Net investment income (loss) (a) | 0.24 | | 0.44 | | 0.55 | | 0.50 | | 0.48 | | 0.50 |
| Net realized and unrealized gain (loss) on investments | 4.03 | | (2.60) | | 1.42 | | (1.24) | | 2.25 | | (0.39) |
| Net realized and unrealized gain (loss) on foreign currency transactions‡ | 0.00 | | 0.00 | | (0.00) | | (0.00) | | 0.00 | | (0.00) |
| Total from investment operations | 4.27 | | (2.16) | | 1.97 | | (0.74) | | 2.73 | | 0.11 |
| Less distributions: | | | | | | | | | | | |
| From net investment income | (0.25) | | (0.43) | | (0.56) | | (0.52) | | (0.48) | | (0.50) |
| From net realized gain on investments | — | | (0.34) | | (1.03) | | (0.02) | | — | | (1.02) |
| Total distributions | (0.25) | | (0.77) | | (1.59) | | (0.54) | | (0.48) | | (1.52) |
| Net asset value at end of period | $ 19.86 | | $ 15.84 | | $ 18.77 | | $ 18.39 | | $ 19.67 | | $ 17.42 |
| Total investment return (b) | 27.01% | | (11.66)% | | 11.55% | | (3.81)% | | 15.83% | | 0.77% |
| Ratios (to average net assets)/Supplemental Data: | | | | | | | | | | | |
| Net investment income (loss) | 2.63%†† | | 2.59% | | 3.02% | | 2.60% | | 2.58% | | 2.86% |
| Net expenses (c) | 1.28%†† (d) | | 1.24% (d) | | 1.24% (d) | | 1.27% | | 1.23% | | 1.21% (d) |
| Expenses (before waiver/reimbursement) (c) | 1.29%†† | | 1.24% | | 1.24% | | 1.27% | | 1.23% | | 1.21% |
| Portfolio turnover rate | 17% | | 40% | | 24% | | 15% | | 18% | | 21% |
| Net assets at end of period (in 000’s) | $ 543 | | $ 459 | | $ 632 | | $ 583 | | $ 293 | | $ 374 |
| * | Unaudited. |
| ‡ | Less than one cent per share. |
| †† | Annualized. |
| (a) | Per share data based on average shares outstanding during the period. |
| (b) | Total investment return is calculated exclusive of sales charges and assumes the reinvestment of dividends and distributions. Class R2 shares are not subject to sales charges. For periods of less than one year, total return is not annualized. |
| (c) | In addition to the fees and expenses which the Fund bears directly, it also indirectly bears a pro-rata share of the fees and expenses of the underlying funds in which it invests. Such indirect expenses are not included in the above expense ratios. |
| (d) | Net of interest expense of less than 0.01%. (See Note 6) |
The notes to the financial statements are an integral part of, and should be read in conjunction with, the financial statements.
| 24 | MainStay Epoch Global Equity Yield Fund |
Financial Highlights selected per share data and ratios
| | Six months ended
April 30,
2021* | | Year Ended October 31, | | February 29, 2016^ through
October 31,
2016 |
| Class R3 | 2020 | | 2019 | | 2018 | | 2017 | |
| Net asset value at beginning of period | $ 15.82 | | $ 18.74 | | $ 18.36 | | $ 19.65 | | $ 17.41 | | $ 16.80 |
| Net investment income (loss) (a) | 0.18 | | 0.40 | | 0.53 | | 0.47 | | 0.29 | | 0.29 |
| Net realized and unrealized gain (loss) on investments | 4.06 | | (2.60) | | 1.40 | | (1.26) | | 2.39 | | 0.69 |
| Net realized and unrealized gain (loss) on foreign currency transactions | 0.00‡ | | 0.00‡ | | (0.00)‡ | | (0.00)‡ | | 0.00‡ | | 0.01 |
| Total from investment operations | 4.24 | | (2.20) | | 1.93 | | (0.79) | | 2.68 | | 0.99 |
| Less distributions: | | | | | | | | | | | |
| From net investment income | (0.22) | | (0.38) | | (0.52) | | (0.48) | | (0.44) | | (0.38) |
| From net realized gain on investments | — | | (0.34) | | (1.03) | | (0.02) | | — | | — |
| Total distributions | (0.22) | | (0.72) | | (1.55) | | (0.50) | | (0.44) | | (0.38) |
| Net asset value at end of period | $ 19.84 | | $ 15.82 | | $ 18.74 | | $ 18.36 | | $ 19.65 | | $ 17.41 |
| Total investment return (b) | 26.90% | | (11.87)% | | 11.28% | | (4.10)% | | 15.53% | | 5.84% |
| Ratios (to average net assets)/Supplemental Data: | | | | | | | | | | | |
| Net investment income (loss) | 1.96%†† | | 2.33% | | 2.92% | | 2.42% | | 1.54% | | 2.42%†† |
| Net expenses (c) | 1.53%†† (d) | | 1.49% (d) | | 1.49% (d) | | 1.52% | | 1.50% | | 1.45%†† |
| Expenses (before waiver/reimbursement) (c) | 1.54%†† | | 1.49% | | 1.49% | | 1.52% | | 1.50% | | 1.45%†† |
| Portfolio turnover rate | 17% | | 40% | | 24% | | 15% | | 18% | | 21% |
| Net assets at end of period (in 000’s) | $ 545 | | $ 446 | | $ 568 | | $ 690 | | $ 543 | | $ 51 |
| * | Unaudited. |
| ^ | Inception date. |
| ‡ | Less than one cent per share. |
| †† | Annualized. |
| (a) | Per share data based on average shares outstanding during the period. |
| (b) | Total investment return is calculated exclusive of sales charges and assumes the reinvestment of dividends and distributions. Class R3 shares are not subject to sales charges. For periods of less than one year, total return is not annualized. |
| (c) | In addition to the fees and expenses which the Fund bears directly, it also indirectly bears a pro-rata share of the fees and expenses of the underlying funds in which it invests. Such indirect expenses are not included in the above expense ratios. |
| (d) | Net of interest expense of less than 0.01%. (See Note 6) |
The notes to the financial statements are an integral part of, and should be read in conjunction with, the financial statements.
25
Financial Highlights selected per share data and ratios
| | Six months ended
April 30,
2021* | | Year Ended October 31, |
| Class R6 | 2020 | | 2019 | | 2018 | | 2017 | | 2016 |
| Net asset value at beginning of period | $ 15.60 | | $ 18.73 | | $ 18.35 | | $ 19.64 | | $ 17.40 | | $ 18.81 |
| Net investment income (loss) (a) | 0.28 | | 0.54 | | 0.63 | | 0.63 | | 0.48 | | 0.53 |
| Net realized and unrealized gain (loss) on investments | 3.98 | | (2.81) | | 1.43 | | (1.27) | | 2.33 | | (0.34) |
| Net realized and unrealized gain (loss) on foreign currency transactions‡ | 0.00 | | 0.00 | | (0.00) | | (0.00) | | 0.00 | | (0.00) |
| Total from investment operations | 4.26 | | (2.27) | | 2.06 | | (0.64) | | 2.81 | | 0.19 |
| Less distributions: | | | | | | | | | | | |
| From net investment income | (0.29) | | (0.52) | | (0.65) | | (0.63) | | (0.57) | | (0.58) |
| From net realized gain on investments | — | | (0.34) | | (1.03) | | (0.02) | | — | | (1.02) |
| Total distributions | (0.29) | | (0.86) | | (1.68) | | (0.65) | | (0.57) | | (1.60) |
| Net asset value at end of period | $ 19.57 | | $ 15.60 | | $ 18.73 | | $ 18.35 | | $ 19.64 | | $ 17.40 |
| Total investment return (b) | 27.43% | | (12.32)% | | 12.14% | | (3.32)% | | 16.36% | | 1.25% |
| Ratios (to average net assets)/Supplemental Data: | | | | | | | | | | | |
| Net investment income (loss) | 3.01%†† | | 3.18% | | 3.50% | | 3.25% | | 2.55% | | 3.04% |
| Net expenses (c) | 0.73%†† (d) | | 0.74% (d) | | 0.75% (d) | | 0.74% | | 0.74% | | 0.74% (d) |
| Expenses (before waiver/reimbursement) (c) | 0.74%†† | | 0.76% | | 0.75% | | 0.74% | | 0.74% | | 0.74% |
| Portfolio turnover rate | 17% | | 40% | | 24% | | 15% | | 18% | | 21% |
| Net assets at end of period (in 000’s) | $ 997 | | $ 325 | | $ 67,054 | | $ 83,418 | | $ 111,720 | | $ 33,404 |
| * | Unaudited. |
| ‡ | Less than one cent per share. |
| †† | Annualized. |
| (a) | Per share data based on average shares outstanding during the period. |
| (b) | Total investment return is calculated exclusive of sales charges and assumes the reinvestment of dividends and distributions. Class R6 shares are not subject to sales charges. For periods of less than one year, total return is not annualized. |
| (c) | In addition to the fees and expenses which the Fund bears directly, it also indirectly bears a pro-rata share of the fees and expenses of the underlying funds in which it invests. Such indirect expenses are not included in the above expense ratios. |
| (d) | Net of interest expense of less than 0.01%. (See Note 6) |
The notes to the financial statements are an integral part of, and should be read in conjunction with, the financial statements.
| 26 | MainStay Epoch Global Equity Yield Fund |
Notes to Financial Statements (Unaudited)
Note 1-Organization and Business
MainStay Funds Trust (the “Trust”) was organized as a Delaware statutory trust on April 28, 2009. The Trust is registered under the Investment Company Act of 1940, as amended (the “1940 Act”), as an open-end management investment company, and is comprised of thirty-two funds (collectively referred to as the “Funds”). These financial statements and notes relate to the MainStay Epoch Global Equity Yield Fund (the "Fund"), a “diversified” fund, as that term is defined in the 1940 Act, as interpreted or modified by regulatory authorities having jurisdiction, from time to time.
The following table lists the Fund's share classes that have been registered and commenced operations:
| Class | Commenced Operations |
| Class A | August 2, 2006 |
| Investor Class | November 16, 2009 |
| Class C | November 16, 2009 |
| Class I | December 27, 2005 |
| Class R2 | February 28, 2014 |
| Class R3 | February 29, 2016 |
| Class R6 | June 17, 2013 |
| SIMPLE Class | N/A* |
| * | SIMPLE Class shares were registered for sale effective as of August 31, 2020 but have not yet commenced operations. |
Class A and Investor Class shares are offered at net asset value (“NAV”) per share plus an initial sales charge. No initial sales charge applies to investments of $1 million or more (and certain other qualified purchases) in Class A and Investor Class shares. However, a contingent deferred sales charge (“CDSC”) of 1.00% may be imposed on certain redemptions made within 18 months of the date of purchase on shares that were purchased without an initial sales charge. Class C shares are offered at NAV without an initial sales charge, although a 1.00% CDSC may be imposed on certain redemptions of such shares made within one year of the date of purchase of Class C shares. Class I, Class R2, Class R3 and Class R6 shares are offered at NAV without a sales charge. SIMPLE Class shares are currently expected to be offered at NAV without a sales charge. In addition, depending upon eligibility, Class C shares convert to either Class A or Investor Class shares at the end of the calendar quarter ten years after the date they were purchased. Additionally, Investor Class shares may convert automatically to Class A shares. Under certain circumstances and as may be permitted by the Trust’s multiple class plan pursuant to Rule 18f-3 under the 1940 Act, specified share classes of the Fund may be converted to one or more other share classes of the Fund as disclosed in the capital share transactions within these Notes. The classes of shares have the same voting (except for issues that relate solely to one class), dividend, liquidation and other rights, and the same terms and conditions, except that Class C shares are subject to higher distribution and/or service fees than Class A, Investor Class, Class R2, Class R3 and SIMPLE Class shares under distribution plans pursuant to Rule 12b-1 under the 1940 Act. Class I and Class R6 shares are not
subject to a distribution and/or service fee. Class R2 and Class R3 shares are subject to a shareholder service fee, which is in addition to fees paid under the distribution plans for Class R2 and Class R3 shares.
The Fund's investment objective is to seek a high level of income. Capital appreciation is a secondary investment objective.
Note 2–Significant Accounting Policies
The Fund is an investment company and accordingly follows the investment company accounting and reporting guidance of the Financial Accounting Standards Board (“FASB”) Accounting Standard Codification Topic 946 Financial Services—Investment Companies. The Fund prepares its financial statements in accordance with generally accepted accounting principles (“GAAP”) in the United States of America and follows the significant accounting policies described below.
(A) Securities Valuation. Investments are usually valued as of the close of regular trading on the New York Stock Exchange (the "Exchange") (usually 4:00 p.m. Eastern time) on each day the Fund is open for business ("valuation date").
The Board of Trustees of the Trust (the "Board") adopted procedures establishing methodologies for the valuation of the Fund's securities and other assets and delegated the responsibility for valuation determinations under those procedures to the Valuation Committee of the Trust (the “Valuation Committee”). The procedures state that, subject to the oversight of the Board and unless otherwise noted, the responsibility for the day-to-day valuation of portfolio assets (including fair value measurements for the Fund's assets and liabilities) rests with New York Life Investment Management LLC (“New York Life Investments” or the "Manager"), aided to whatever extent necessary by the Subadvisor (as defined in Note 3(A)). To assess the appropriateness of security valuations, the Manager, the Subadvisor or the Fund's third-party service provider, who is subject to oversight by the Manager, regularly compares prior day prices, prices on comparable securities and the sale prices to the prior and current day prices and challenges prices with changes exceeding certain tolerance levels with third-party pricing services or broker sources.
The Board authorized the Valuation Committee to appoint a Valuation Subcommittee (the “Subcommittee”) to establish the prices of securities for which market quotations are not readily available or the prices of which are not otherwise readily determinable under the procedures. The Subcommittee meets (in person, via electronic mail or via teleconference) on an as-needed basis. The Valuation Committee meets to ensure that actions taken by the Subcommittee were appropriate.
For those securities valued through either a standardized fair valuation methodology or a fair valuation measurement, the Subcommittee deals with such valuation and the Valuation Committee reviews and affirms, if appropriate, the reasonableness of the valuation based on such methodologies and measurements on a regular basis after considering information that is reasonably available and deemed relevant by the Valuation Committee. Any action taken by the Subcommittee with respect
Notes to Financial Statements (Unaudited) (continued)
to the valuation of a portfolio security or other asset is submitted for review and ratification (if appropriate) to the Valuation Committee and the Board at the next regularly scheduled meeting.
"Fair value" is defined as the price the Fund would reasonably expect to receive upon selling an asset or liability in an orderly transaction to an independent buyer in the principal or most advantageous market for the asset or liability. Fair value measurements are determined within a framework that establishes a three-tier hierarchy that maximizes the use of observable market data and minimizes the use of unobservable inputs to establish a classification of fair value measurements for disclosure purposes. "Inputs" refer broadly to the assumptions that market participants would use in pricing the asset or liability, including assumptions about risk, such as the risk inherent in a particular valuation technique used to measure fair value using a pricing model and/or the risk inherent in the inputs for the valuation technique. Inputs may be observable or unobservable. Observable inputs reflect the assumptions market participants would use in pricing the asset or liability based on market data obtained from sources independent of the Fund. Unobservable inputs reflect the Fund’s own assumptions about the assumptions market participants would use in pricing the asset or liability based on the information available. The inputs or methodology used for valuing assets or liabilities may not be an indication of the risks associated with investing in those assets or liabilities. The three-tier hierarchy of inputs is summarized below.
| • | Level 1—quoted prices in active markets for an identical asset or liability |
| • | Level 2—other significant observable inputs (including quoted prices for a similar asset or liability in active markets, interest rates and yield curves, prepayment speeds, credit risk, etc.) |
| • | Level 3—significant unobservable inputs (including the Fund's own assumptions about the assumptions that market participants would use in measuring fair value of an asset or liability) |
The level of an asset or liability within the fair value hierarchy is based on the lowest level of an input, both individually and in the aggregate, that is significant to the fair value measurement. The aggregate value by input level of the Fund’s assets and liabilities as of April 30, 2021, is included at the end of the Portfolio of Investments.
The Fund may use third-party vendor evaluations, whose prices may be derived from one or more of the following standard inputs, among others:
| • Broker/dealer quotes | • Benchmark securities |
| • Two-sided markets | • Reference data (corporate actions or material event notices) |
| • Bids/offers | • Monthly payment information |
| • Industry and economic events | • Reported trades |
An asset or liability for which market values cannot be measured using the methodologies described above is valued by methods deemed reasonable in good faith by the Valuation Committee, following the procedures established by the Board, to represent fair value. Under these
procedures, the Fund generally uses a market-based approach which may use related or comparable assets or liabilities, recent transactions, market multiples, book values and other relevant information. The Fund may also use an income-based valuation approach in which the anticipated future cash flows of the asset or liability are discounted to calculate fair value. Discounts may also be applied due to the nature and/or duration of any restrictions on the disposition of the asset or liability. Fair value represents a good faith approximation of the value of a security. Fair value determinations involve the consideration of a number of subjective factors, an analysis of applicable facts and circumstances and the exercise of judgment. As a result, it is possible that the fair value for a security determined in good faith in accordance with the Fund's valuation procedures may differ from valuations for the same security determined by other funds using their own valuation procedures. Although the Fund's valuation procedures are designed to value a security at the price the Fund may reasonably expect to receive upon the security's sale in an orderly transaction, there can be no assurance that any fair value determination thereunder would, in fact, approximate the amount that the Fund would actually realize upon the sale of the security or the price at which the security would trade if a reliable market price were readily available. During the six-month period ended April 30, 2021, there were no material changes to the fair value methodologies.
Securities which may be valued in this manner include, but are not limited to: (i) a security for which trading has been halted or suspended; (ii) a debt security that has recently gone into default and for which there is not a current market quotation; (iii) a security of an issuer that has entered into a restructuring; (iv) a security that has been delisted from a national exchange; (v) a security for which the market price is not readily available from a third-party pricing source or, if so provided, does not, in the opinion of the Manager or the Subadvisor, reflect the security's market value; (vi) a security subject to trading collars for which no or limited trading takes place; and (vii) a security whose principal market has been temporarily closed at a time when, under normal conditions, it would be open. Securities valued in this manner are generally categorized as Level 3 in the hierarchy. No securities held by the Fund as of April 30, 2021 were fair valued in such a manner.
Certain securities held by the Fund may principally trade in foreign markets. Events may occur between the time the foreign markets close and the time at which the Fund's NAVs are calculated. These events may include, but are not limited to, situations relating to a single issuer in a market sector, significant fluctuations in U.S. or foreign markets, natural disasters, armed conflicts, governmental actions or other developments not tied directly to the securities markets. Should the Manager or the Subadvisor conclude that such events may have affected the accuracy of the last price of such securities reported on the local foreign market, the Subcommittee may, pursuant to procedures adopted by the Board, adjust the value of the local price to reflect the estimated impact on the price of such securities as a result of such events. In this instance, securities are generally categorized as Level 3 in the hierarchy. Additionally, certain foreign equity securities are also fair valued whenever the movement of a particular index exceeds certain thresholds. In such cases, the securities
| 28 | MainStay Epoch Global Equity Yield Fund |
are fair valued by applying factors provided by a third-party vendor in accordance with valuation procedures adopted by the Board and are generally categorized as Level 2 in the hierarchy. No foreign equity securities held by the Fund as of April 30, 2021 were fair valued in such a manner.
Equity securities are valued at the last quoted sales prices as of the close of regular trading on the relevant exchange on each valuation date. Securities that are not traded on the valuation date are valued at the mean of the last quoted bid and ask prices. Prices are normally taken from the principal market in which each security trades. These securities are generally categorized as Level 1 in the hierarchy.
Investments in mutual funds, including money market funds, are valued at their respective NAVs at the close of business each day on the valuation date. These securities are generally categorized as Level 1 in the hierarchy.
Temporary cash investments acquired in excess of 60 days to maturity at the time of purchase are valued using the latest bid prices or using valuations based on a matrix system (which considers such factors as security prices, yields, maturities and ratings), both as furnished by independent pricing services. Temporary cash investments that mature in 60 days or less at the time of purchase ("Short-Term Investments") are valued using the amortized cost method of valuation, unless the use of such method would be inappropriate. The amortized cost method involves valuing a security at its cost on the date of purchase and thereafter assuming a constant amortization to maturity of the difference between such cost and the value on maturity date. Amortized cost approximates the current fair value of a security. Securities valued using the amortized cost method are not valued using quoted prices in an active market and are generally categorized as Level 2 in the hierarchy.
The information above is not intended to reflect an exhaustive list of the methodologies that may be used to value portfolio investments. The valuation procedures permit the use of a variety of valuation methodologies in connection with valuing portfolio investments. The methodology used for a specific type of investment may vary based on the market data available or other considerations. The methodologies summarized above may not represent the specific means by which portfolio investments are valued on any particular business day.
(B) Income Taxes. The Fund's policy is to comply with the requirements of the Internal Revenue Code of 1986, as amended (the “Internal Revenue Code”), applicable to regulated investment companies and to distribute all of its taxable income to the shareholders of the Fund within the allowable time limits.
The Manager evaluates the Fund’s tax positions to determine if the tax positions taken meet the minimum recognition threshold in connection with accounting for uncertainties in income tax positions taken or expected to be taken for the purposes of measuring and recognizing tax liabilities in the financial statements. Recognition of tax benefits of an uncertain tax position is permitted only to the extent the position is “more likely than not” to be sustained assuming examination by taxing
authorities. The Manager analyzed the Fund's tax positions taken on federal, state and local income tax returns for all open tax years (for up to three tax years) and has concluded that no provisions for federal, state and local income tax are required in the Fund's financial statements. The Fund's federal, state and local income tax and federal excise tax returns for tax years for which the applicable statutes of limitations have not expired are subject to examination by the Internal Revenue Service and state and local departments of revenue.
(C) Foreign Taxes. The Fund may be subject to foreign taxes on income and other transaction-based taxes imposed by certain countries in which it invests. A portion of the taxes on gains on investments or currency purchases/repatriation may be reclaimable. The Fund will accrue such taxes and reclaims as applicable, based upon its current interpretation of tax rules and regulations that exist in the markets in which it invests.
The Fund may be subject to taxation on realized capital gains, repatriation proceeds and other transaction-based taxes imposed by certain countries in which it invests. The Fund will accrue such taxes as applicable based upon its current interpretation of tax rules and regulations that exist in the market in which it invests. Capital gains taxes relating to positions still held are reflected as a liability in the Statement of Assets and Liabilities, as well as an adjustment to the Fund's net unrealized appreciation (depreciation). Taxes related to capital gains realized, if any, are reflected as part of net realized gain (loss) in the Statement of Operations. Changes in tax liabilities related to capital gains taxes on unrealized investment gains, if any, are reflected as part of the change in net unrealized appreciation (depreciation) on investments in the Statement of Operations. Transaction-based charges are generally assessed as a percentage of the transaction amount.
(D) Dividends and Distributions to Shareholders. Dividends and distributions are recorded on the ex-dividend date. The Fund intends to declare and pay dividends from net investment income, if any, at least quarterly and distributions from net realized capital and currency gains, if any, at least annually. Unless a shareholder elects otherwise, all dividends and distributions are reinvested at NAV in the same class of shares of the Fund. Dividends and distributions to shareholders are determined in accordance with federal income tax regulations and may differ from determinations using GAAP.
(E) Security Transactions and Investment Income. The Fund records security transactions on the trade date. Realized gains and losses on security transactions are determined using the identified cost method. Dividend income is recognized on the ex-dividend date, net of any foreign tax withheld at the source, and interest income is accrued as earned using the effective interest rate method. Distributions received from real estate investment trusts may be classified as dividends, capital gains and/or return of capital.
Investment income and realized and unrealized gains and losses on investments of the Fund are allocated pro rata to the separate classes of
Notes to Financial Statements (Unaudited) (continued)
shares based upon their relative net assets on the date the income is earned or realized and unrealized gains and losses are incurred.
(F) Expenses. Expenses of the Trust are allocated to the individual Funds in proportion to the net assets of the respective Funds when the expenses are incurred, except where direct allocations of expenses can be made. Expenses (other than transfer agent expenses and fees incurred under the shareholder services plans and/or the distribution plans further discussed in Note 3(B)) are allocated to separate classes of shares pro rata based upon their relative net assets on the date the expenses are incurred. The expenses borne by the Fund, including those of related parties to the Fund, are shown in the Statement of Operations.
Additionally, the Fund may invest in mutual funds, which are subject to management fees and other fees that may cause the costs of investing in mutual funds to be greater than the costs of owning the underlying securities directly. These indirect expenses of mutual funds are not included in the amounts shown as expenses in the Statement of Operations or in the expense ratios included in the Financial Highlights.
(G) Use of Estimates. In preparing financial statements in conformity with GAAP, the Manager makes estimates and assumptions that affect the reported amounts and disclosures in the financial statements. Actual results could differ from those estimates and assumptions.
(H) Foreign Currency Transactions. The Fund's books and records are maintained in U.S. dollars. Prices of securities denominated in foreign currency amounts are translated into U.S. dollars at the mean between the buying and selling rates last quoted by any major U.S. bank at the following dates:
(i) market value of investment securities, other assets and liabilities— at the valuation date; and
(ii) purchases and sales of investment securities, income and expenses—at the date of such transactions.
The assets and liabilities that are denominated in foreign currency amounts are presented at the exchange rates and market values at the close of the period. The realized and unrealized changes in net assets arising from fluctuations in exchange rates and market prices of securities are not separately presented.
Net realized gain (loss) on foreign currency transactions represents net currency gains or losses realized as a result of differences between the amounts of securities sale proceeds or purchase cost, dividends, interest and withholding taxes as recorded on the Fund's books, and the U.S. dollar equivalent amount actually received or paid. Net currency gains or losses from valuing such foreign currency denominated assets and liabilities, other than investments at valuation date exchange rates, are reflected in unrealized foreign exchange gains or losses.
(I) Securities Lending. In order to realize additional income, the Fund may engage in securities lending, subject to the limitations set forth in the 1940 Act and relevant guidance by the staff of the Securities and Exchange Commission (“SEC”). If the Fund engages in securities lending,
the Fund will lend through its custodian, JPMorgan Chase Bank, N.A., ("JPMorgan"), acting as securities lending agent on behalf of the Fund. Under the current arrangement, JPMorgan will manage the Fund's collateral in accordance with the securities lending agency agreement between the Fund and JPMorgan, and indemnify the Fund against counterparty risk. The loans will be collateralized by cash (which may be invested in a money market fund) and/or non-cash collateral (which may include U.S. Treasury securities and/or U.S. government agency securities issued or guaranteed by the United States government or its agencies or instrumentalities) at least equal at all times to the market value of the securities loaned. The Fund bears the risk of delay in recovery of, or loss of rights in, the securities loaned. The Fund may also record a realized gain or loss on securities deemed sold due to a borrower’s inability to return securities on loan. The Fund bears the risk of any loss on investment of cash collateral. The Fund will receive compensation for lending its securities in the form of fees or it will retain a portion of interest earned on the investment of any cash collateral. The Fund will also continue to receive interest and dividends on the securities loaned and any gain or loss in the market price of the securities loaned that may occur during the term of the loan will be for the account of the Fund. Income earned from securities lending activities, if any, is reflected in the Statement of Operations. Securities on loan as of April 30, 2021, are shown in the Portfolio of Investments.
Prior to November 23, 2020, these services were provided by State Street Bank and Trust Company (“State Street”).
(J) Foreign Securities Risk. The Fund may invest in foreign securities, which carry certain risks that are in addition to the usual risks inherent in domestic securities. These risks include those resulting from currency fluctuations, future adverse political or economic developments and possible imposition of currency exchange blockages or other foreign governmental laws or restrictions. These risks are likely to be greater in emerging markets than in developed markets. The ability of issuers of debt securities held by the Fund to meet their obligations may be affected by, among other things, economic or political developments in a specific country, industry or region.
(K) Large Transaction Risks. From time to time, the Fund may receive large purchase or redemption orders from affiliated or unaffiliated mutual funds or other investors. Such large transactions could have adverse effects on the Fund’s performance if the Fund were required to sell securities or invest cash at times when it otherwise would not do so. This activity could also accelerate the realization of capital gains and increase the Fund’s transaction costs. The Fund has adopted procedures designed to mitigate the negative impacts of such large transactions, but there can be no assurance that these procedures will be effective.
(L) Indemnifications. Under the Trust’s organizational documents, its officers and trustees are indemnified against certain liabilities that may arise out of performance of their duties to the Trust. Additionally, in the normal course of business, the Fund enters into contracts with third-party service providers that contain a variety of representations and warranties and that may provide general indemnifications. The Fund's maximum
| 30 | MainStay Epoch Global Equity Yield Fund |
exposure under these arrangements is unknown, as this would involve future claims that may be made against the Fund that have not yet occurred. The Manager believes that the risk of loss in connection with these potential indemnification obligations is remote. However, there can be no assurance that material liabilities related to such obligations will not arise in the future, which could adversely impact the Fund.
Note 3–Fees and Related Party Transactions
(A) Manager and Subadvisor. New York Life Investments, a registered investment adviser and an indirect, wholly-owned subsidiary of New York Life Insurance Company (“New York Life”), serves as the Fund’s Manager, pursuant to an Amended and Restated Management Agreement (“Management Agreement”). The Manager provides offices, conducts clerical, recordkeeping and bookkeeping services and keeps most of the financial and accounting records required to be maintained by the Fund. Except for the portion of salaries and expenses that are the responsibility of the Fund, the Manager pays the salaries and expenses of all personnel affiliated with the Fund and certain operational expenses of the Fund. The Fund reimburses New York Life Investments in an amount equal to the portion of the compensation of the Chief Compliance Officer attributable to the Fund. Epoch Investment Partners, Inc. (“Epoch” or the “Subadvisor”), a registered investment adviser, serves as Subadvisor to the Fund and is responsible for the day-to-day portfolio management of the Fund. Pursuant to the terms of an Amended and Restated Subadvisory Agreement (“Subadvisory Agreement”) between New York Life Investments and Epoch, New York Life Investments pays for the services of the Subadvisor.
Pursuant to the Management Agreement, the Fund pays the Manager a monthly fee for the services performed and the facilities furnished at an annual rate of 0.70% of the Fund's average daily net assets.
New York Life Investments has contractually agreed to waive fees and/or reimburse expenses so that Total Annual Fund Operating Expenses (excluding taxes, interest, litigation, extraordinary expenses, brokerage and other transaction expenses relating to the purchase or sale of portfolio investments and acquired (underlying) fund fees and expenses) do not exceed the following percentages of average daily net assets: Class A, 1.09%; Class C, 1.84%; Class I, 0.84%; and Class R6, 0.74%. This agreement will remain in effect until February 28, 2022, and shall renew automatically for one-year terms unless New York Life Investments provides written notice of termination prior to the start of the next term or upon approval of the Board.
During the six-month period ended April 30, 2021, New York Life Investments earned fees from the Fund in the amount of $4,206,006 and waived fees and/or reimbursed certain class specific expenses in the amount of $606,227 and paid the Subadvisor in the amount of $2,103,814.
JPMorgan provides sub-administration and sub-accounting services to the Fund pursuant to an agreement with New York Life Investments. These services include calculating the daily NAVs of the Fund,
maintaining the general ledger and sub-ledger accounts for the calculation of the Fund's NAVs, and assisting New York Life Investments in conducting various aspects of the Fund's administrative operations. For providing these services to the Fund, JPMorgan is compensated by New York Life Investments.
Prior to November 23, 2020, these services were provided by State Street.
Pursuant to an agreement between the Trust and New York Life Investments, New York Life Investments is responsible for providing or procuring certain regulatory reporting services for the Fund. The Fund will reimburse New York Life Investments for the actual costs incurred by New York Life Investments in connection with providing or procuring these services for the Fund.
(B) Distribution and Service Fees. The Trust, on behalf of the Fund, has entered into a distribution agreement with NYLIFE Distributors LLC (the “Distributor”), an affiliate of New York Life Investments. The Fund has adopted distribution plans (the “Plans”) in accordance with the provisions of Rule 12b-1 under the 1940 Act.
Pursuant to the Class A, Investor Class and Class R2 Plans, the Distributor receives a monthly distribution fee from the Class A, Investor Class and Class R2 shares at an annual rate of 0.25% of the average daily net assets of the Class A, Investor Class and Class R2 shares for distribution and/or service activities as designated by the Distributor. Pursuant to the Class C Plan, Class C shares pay the Distributor a monthly distribution fee at an annual rate of 0.75% of the average daily net assets of the Class C shares, along with a service fee at an annual rate of 0.25% of the average daily net assets of the Class C shares, for a total 12b-1 fee of 1.00%. Pursuant to the Class R3 Plan, Class R3 shares pay the Distributor a monthly fee at an annual rate of 0.25% of the average daily net assets of the Class R3 shares, along with a service fee at an annual rate of 0.25% of the average daily net assets of the Class R3 shares, for a total 12b-1 fee of 0.50%. Class I and Class R6 shares are not subject to a distribution and/or service fee.
The Plans provide that the distribution and service fees are payable to the Distributor regardless of the amounts actually expended by the Distributor for distribution of the Fund's shares and service activities.
In accordance with the Shareholder Services Plans for the Class R2 and Class R3 shares, the Manager has agreed to provide, through its affiliates or independent third parties, various shareholder and administrative support services to shareholders of the Class R2 and Class R3 shares. For its services, the Manager, its affiliates or independent third-party service providers are entitled to a shareholder service fee accrued daily and paid monthly at an annual rate of 0.10% of the average daily net assets of the Class R2 and Class R3 shares. This is in addition to any fees paid under the Class R2 and Class R3 Plans.
Notes to Financial Statements (Unaudited) (continued)
During the six-month period ended April 30, 2021, shareholder service fees incurred by the Fund were as follows:
(C) Sales Charges. The Fund was advised by the Distributor that the amount of initial sales charges retained on sales of Class A and Investor Class shares during the six-month period ended April 30, 2021, were $4,690 and $451, respectively.
The Fund was also advised that the Distributor retained CDSCs on redemptions of Class A and Class C shares during the six-month period ended April 30, 2021, of $1,347 and $655, respectively.
(D) Transfer, Dividend Disbursing and Shareholder Servicing Agent. NYLIM Service Company LLC, an affiliate of New York Life Investments, is the Fund's transfer, dividend disbursing and shareholder servicing agent pursuant to an agreement between NYLIM Service Company LLC and the Trust. NYLIM Service Company LLC has entered into an agreement with DST Asset Manager Solutions, Inc. ("DST"), pursuant to which DST performs certain transfer agent services on behalf of NYLIM Service Company LLC. New York Life Investments has contractually agreed to limit the transfer agency expenses charged to the Fund’s share classes to a maximum of 0.35% of that share class’s average daily net assets on an annual basis after deducting any applicable Fund or class-level expense reimbursement or small account fees. This agreement will remain in effect until February 28, 2022, and
shall renew automatically for one-year terms unless New York Life Investments provides written notice of termination prior to the start of the next term or upon approval of the Board. During the six-month period ended April 30, 2021, transfer agent expenses incurred by the Fund and any reimbursements, pursuant to the aforementioned Transfer Agency expense limitation agreement, were as follows:
| Class | Expense | Waived |
| Class A | $111,065 | $— |
| Investor Class | 7,667 | — |
| Class C | 35,756 | — |
| Class I | 979,925 | — |
| Class R2 | 479 | — |
| Class R3 | 485 | — |
| Class R6 | 10 | — |
(E) Small Account Fee. Shareholders with small accounts adversely impact the cost of providing transfer agency services. In an effort to reduce total transfer agency expenses, the Fund has implemented a small account fee on certain types of accounts. As described in the Fund's prospectus, certain shareholders with an account balance of less than $1,000 ($5,000 for Class A share accounts) are charged an annual per account fee of $20 (assessed semi-annually), the proceeds from which offset transfer agent fees as reflected in the Statement of Operations. This small account fee will not apply to certain types of accounts as described further in the Fund’s prospectus.
(F) Investments in Affiliates (in 000’s). During the six-month period ended April 30, 2021, purchases and sales transactions, income earned from investments and shares held of investment companies managed by New York Life Investments or its affiliates were as follows:
| Affiliated Investment Companies | Value,
Beginning
of Period | Purchases
at Cost | Proceeds
from
Sales | Net
Realized
Gain/(Loss)
on Sales | Change in
Unrealized
Appreciation/
(Depreciation) | Value,
End of
Period | Dividend
Income | Other
Distributions | Shares
End of
Period |
| MainStay U.S. Government Liquidity Fund | $ 18,692 | $ 270,521 | $ (268,337) | $ — | $ — | $ 20,876 | $ 1 | $ — | 20,876 |
(G) Capital. As of April 30, 2021, New York Life and its affiliates beneficially held shares of the Fund with the values and percentages of net assets as follows:
| Class R2 | $36,273 | 6.7% |
| Class R3 | 36,485 | 6.7 |
Note 4-Federal Income Tax
As of April 30, 2021, the cost and unrealized appreciation (depreciation) of the Fund’s investment portfolio, including applicable derivative contracts and other financial instruments, as determined on a federal income tax basis, were as follows:
| | Federal Tax
Cost | Gross
Unrealized
Appreciation | Gross
Unrealized
(Depreciation) | Net
Unrealized
Appreciation/
(Depreciation) |
| Investments | $993,743,584 | $264,134,795 | $(17,329,701) | $246,805,094 |
As of October 31, 2020, for federal income tax purposes, capital loss carryforwards of $205,555,324 were available as shown in the table below, to the extent provided by the regulations to offset future realized gains of the Fund through the years indicated. To the extent that these capital loss carryforwards are used to offset future capital gains, it is
| 32 | MainStay Epoch Global Equity Yield Fund |
probable that the capital gains so offset will not be distributed to shareholders. No capital gain distributions shall be made until any capital loss carryforwards have been fully utilized.
Capital Loss
Available Through | Short-Term
Capital Loss
Amounts (000’s) | Long-Term
Capital Loss
Amounts (000’s) |
| Unlimited | $69,975 | $135,580 |
During the year ended October 31, 2020, the tax character of distributions paid as reflected in the Statements of Changes in Net Assets was as follows:
| | 2020 |
| Distributions paid from: | |
| Ordinary Income | $46,400,441 |
| Long-Term Capital Gains | 35,738,442 |
| Total | $82,138,883 |
Note 5–Custodian
JPMorgan is the custodian of cash and securities held by the Fund. Custodial fees are charged to the Fund based on the Fund's net assets and/or the market value of securities held by the Fund and the number of certain transactions incurred by the Fund.
Prior to November 23, 2020, these services were provided by State Street. The services provided by State Street were a direct expense of the Fund and are included in the Statement of Operations as Custodian fees which totaled $7,893 for the period November 1, 2020 through November 22, 2020.
Note 6–Line of Credit
The Fund and certain other funds managed by New York Life Investments maintain a line of credit with a syndicate of banks in order to secure a source of funds for temporary purposes to meet unanticipated or excessive redemption requests.
Effective July 28, 2020, under the credit agreement (the “Credit Agreement”), the aggregate commitment amount is $600,000,000 with an additional uncommitted amount of $100,000,000. The commitment fee is an annual rate of 0.15% of the average commitment amount payable quarterly, regardless of usage, to JPMorgan, who serves as the agent to the syndicate. The commitment fee is allocated among the Fund and certain other funds managed by New York Life Investments based upon their respective net assets and other factors. Interest on any revolving credit loan is charged based upon the Federal Funds Rate or the one-month London Interbank Offered Rate (“LIBOR”), whichever is higher. The Credit Agreement expires on July 27, 2021, although the Fund, certain other funds managed by New York Life Investments and the syndicate of banks may renew the Credit Agreement for an additional year on the same or different terms or enter into a credit agreement with a different syndicate of banks. Prior to July 28, 2020, the aggregate commitment amount and the commitment fee were the same as those under the current Credit Agreement, but State Street served as agent to
the syndicate. During the six-month period ended April 30, 2021, the Fund utilized the line of credit for 6 days, maintained an average daily balance of $41,527,600, at a weighted average interest rate of 1.37% and incurred interest expense in the amount of $10,995. As of April 30, 2021, there were no borrowings outstanding with respect to the Fund under the Credit Agreement or the credit agreement for which State Street served as agent.
Note 7–Interfund Lending Program
Pursuant to an exemptive order issued by the SEC, the Fund, along with certain other funds managed by New York Life Investments, may participate in an interfund lending program. The interfund lending program provides an alternative credit facility that permits the Fund and certain other funds managed by New York Life Investments to lend or borrow money for temporary purposes directly to or from one another, subject to the conditions of the exemptive order. During the six-month period ended April 30, 2021, there were no interfund loans made or outstanding with respect to the Fund.
Note 8–Purchases and Sales of Securities (in 000’s)
During the six-month period ended April 30, 2021, purchases and sales of securities, other than short-term securities, were $202,897 and $514,532, respectively.
Note 9–Capital Share Transactions
Transactions in capital shares for the six-month period ended April 30, 2021 and the year ended October 31, 2020, were as follows:
| Class A | Shares | Amount |
| Period ended April 30, 2021: | | |
| Shares sold | 860,943 | $ 16,454,149 |
| Shares issued to shareholders in reinvestment of distributions | 73,365 | 1,395,270 |
| Shares redeemed | (889,939) | (16,350,637) |
| Net increase (decrease) in shares outstanding before conversion | 44,369 | 1,498,782 |
| Shares converted into Class A (See Note 1) | 49,952 | 949,684 |
| Shares converted from Class A (See Note 1) | (428) | (8,525) |
| Net increase (decrease) | 93,893 | $ 2,439,941 |
| Year ended October 31, 2020: | | |
| Shares sold | 1,967,589 | $ 32,849,885 |
| Shares issued to shareholders in reinvestment of distributions | 281,903 | 4,699,048 |
| Shares redeemed | (2,495,861) | (40,787,576) |
| Net increase (decrease) in shares outstanding before conversion | (246,369) | (3,238,643) |
| Shares converted into Class A (See Note 1) | 71,291 | 1,178,778 |
| Shares converted from Class A (See Note 1) | (14,681) | (255,118) |
| Net increase (decrease) | (189,759) | $ (2,314,983) |
| |
Notes to Financial Statements (Unaudited) (continued)
| Investor Class | Shares | Amount |
| Period ended April 30, 2021: | | |
| Shares sold | 26,887 | $ 511,911 |
| Shares issued to shareholders in reinvestment of distributions | 6,535 | 123,865 |
| Shares redeemed | (40,119) | (742,454) |
| Net increase (decrease) in shares outstanding before conversion | (6,697) | (106,678) |
| Shares converted into Investor Class (See Note 1) | 11,327 | 218,199 |
| Shares converted from Investor Class (See Note 1) | (21,209) | (398,895) |
| Net increase (decrease) | (16,579) | $ (287,374) |
| Year ended October 31, 2020: | | |
| Shares sold | 72,783 | $ 1,217,338 |
| Shares issued to shareholders in reinvestment of distributions | 24,777 | 412,254 |
| Shares redeemed | (104,256) | (1,752,343) |
| Net increase (decrease) in shares outstanding before conversion | (6,696) | (122,751) |
| Shares converted into Investor Class (See Note 1) | 3,709 | 60,290 |
| Shares converted from Investor Class (See Note 1) | (34,880) | (596,092) |
| Net increase (decrease) | (37,867) | $ (658,553) |
| |
| Class C | Shares | Amount |
| Period ended April 30, 2021: | | |
| Shares sold | 28,230 | $ 528,668 |
| Shares issued to shareholders in reinvestment of distributions | 17,617 | 332,754 |
| Shares redeemed | (951,180) | (17,836,152) |
| Net increase (decrease) in shares outstanding before conversion | (905,333) | (16,974,730) |
| Shares converted from Class C (See Note 1) | (37,755) | (721,754) |
| Net increase (decrease) | (943,088) | $ (17,696,484) |
| Year ended October 31, 2020: | | |
| Shares sold | 180,256 | $ 3,062,043 |
| Shares issued to shareholders in reinvestment of distributions | 138,025 | 2,312,613 |
| Shares redeemed | (2,842,169) | (46,642,965) |
| Net increase (decrease) in shares outstanding before conversion | (2,523,888) | (41,268,309) |
| Shares converted from Class C (See Note 1) | (42,044) | (668,840) |
| Net increase (decrease) | (2,565,932) | $ (41,937,149) |
| |
| Class I | Shares | Amount |
| Period ended April 30, 2021: | | |
| Shares sold | 6,471,616 | $ 121,756,402 |
| Shares issued to shareholders in reinvestment of distributions | 729,061 | 13,793,806 |
| Shares redeemed | (24,513,786) | (441,503,506) |
| Net increase (decrease) in shares outstanding before conversion | (17,313,109) | (305,953,298) |
| Shares converted into Class I (See Note 1) | 663 | 12,348 |
| Shares converted from Class I (See Note 1) | (2,856) | (51,057) |
| Net increase (decrease) | (17,315,302) | $(305,992,007) |
| Year ended October 31, 2020: | | |
| Shares sold | 19,441,904 | $ 320,299,767 |
| Shares issued to shareholders in reinvestment of distributions | 3,586,988 | 59,636,707 |
| Shares redeemed | (41,503,028) | (672,684,989) |
| Net increase (decrease) in shares outstanding before conversion | (18,474,136) | (292,748,515) |
| Shares converted into Class I (See Note 1) | 16,253 | 280,982 |
| Net increase (decrease) | (18,457,883) | $(292,467,533) |
| |
| Class R2 | Shares | Amount |
| Period ended April 30, 2021: | | |
| Shares issued to shareholders in reinvestment of distributions | 353 | $ 6,709 |
| Shares redeemed | (1,983) | (35,258) |
| Net increase (decrease) | (1,630) | $ (28,549) |
| Year ended October 31, 2020: | | |
| Shares sold | 1,271 | $ 22,020 |
| Shares issued to shareholders in reinvestment of distributions | 1,430 | 23,851 |
| Shares redeemed | (7,402) | (123,706) |
| Net increase (decrease) | (4,701) | $ (77,835) |
| |
| Class R3 | Shares | Amount |
| Period ended April 30, 2021: | | |
| Shares sold | 1,277 | $ 23,720 |
| Shares issued to shareholders in reinvestment of distributions | 323 | 6,139 |
| Shares redeemed | (2,315) | (43,043) |
| Net increase (decrease) | (715) | $ (13,184) |
| Year ended October 31, 2020: | | |
| Shares sold | 3,768 | $ 63,647 |
| Shares issued to shareholders in reinvestment of distributions | 1,222 | 20,565 |
| Shares redeemed | (7,128) | (104,448) |
| Net increase (decrease) | (2,138) | $ (20,236) |
| |
| 34 | MainStay Epoch Global Equity Yield Fund |
| Class R6 | Shares | Amount |
| Period ended April 30, 2021: | | |
| Shares sold | 31,478 | $ 598,239 |
| Shares issued to shareholders in reinvestment of distributions | 426 | 7,993 |
| Shares redeemed | (1,789) | (34,626) |
| Net increase (decrease) | 30,115 | $ 571,606 |
| Year ended October 31, 2020: | | |
| Shares sold | 313,727 | $ 4,398,475 |
| Shares issued to shareholders in reinvestment of distributions | 161,020 | 2,664,103 |
| Shares redeemed | (4,034,612) | (65,973,421) |
| Net increase (decrease) | (3,559,865) | $ (58,910,843) |
Note 10–Recent Accounting Pronouncement
In March 2020, the Financial Accounting Standards Board issued Accounting Standards Update 2020-04 (“ASU 2020-04”), which provides optional guidance to ease the potential accounting burden associated with transitioning away from LIBOR and other reference rates that are expected to be discontinued. ASU 2020-04 was effective immediately upon release of the update on March 12, 2020 and remains effective through December 31, 2022. At this time, the Manager is evaluating the implications of certain other provisions of ASU 2020-04 related to new disclosure requirements and any impact on the financial statement disclosures has not yet been determined.
Note 11–Other Matters
An outbreak of COVID-19, first detected in December 2019, has developed into a global pandemic and has resulted in travel restrictions, closure of international borders, certain businesses and securities markets, restrictions on securities trading activities, prolonged quarantines, supply chain disruptions, and lower consumer demand, as well as general concern and uncertainty. The continued impact of COVID-19 is uncertain and could further adversely affect the global economy, national economies, individual issuers and capital markets in unforeseeable ways and result in a substantial and extended economic downturn. Developments that disrupt global economies and financial markets, such as COVID-19, may magnify factors that affect the Fund's performance.
Note 12–Subsequent Events
In connection with the preparation of the financial statements of the Fund as of and for the six-month period ended April 30, 2021, events and transactions subsequent to April 30, 2021, through the date the financial statements were issued have been evaluated by the Manager for possible adjustment and/or disclosure. No subsequent events requiring financial statement adjustment or disclosure have been identified.
Board Consideration and Approval of Management Agreement and Subadvisory Agreement (Unaudited)
The continuation of the Management Agreement with respect to the MainStay Epoch Global Equity Yield Fund (“Fund”) and New York Life Investment Management LLC (“New York Life Investments”) and the Subadvisory Agreement between New York Life Investments and Epoch Investment Partners, Inc. (“Epoch”) with respect to the Fund (together, “Advisory Agreements”), following an initial term of up to two years, is subject to annual review and approval by the Board of Trustees of MainStay Funds Trust (“Board” of the “Trust”) in accordance with Section 15 of the Investment Company Act of 1940, as amended (“1940 Act”). At its December 9–10, 2020 meeting, the Board, including the Trustees who are not an “interested person” (as such term is defined in the 1940 Act) of the Trust (“Independent Trustees”) voting separately, unanimously approved the continuation of each of the Advisory Agreements for a one-year period.
In reaching the decision to approve the continuation of each of the Advisory Agreements, the Board considered information furnished by New York Life Investments and Epoch in connection with an annual contract review process undertaken by the Board that took place at meetings of the Board and its Contracts Committee during September 2020 through December 2020, as well as other information furnished to the Board and its Committees throughout the year, as deemed relevant by the Trustees. Information requested by and furnished to the Board for consideration in connection with the contract review process included, among other items, reports on the Fund and “peer funds” prepared by Strategic Insight Mutual Fund Research and Consulting, LLC (“Strategic Insight”), an independent third-party service provider engaged by the Board to report objectively on the Fund’s investment performance, management fee and total expenses. The Board also considered information on the fees charged to other investment advisory clients of New York Life Investments and/or Epoch that follow investment strategies similar to those of the Fund, if any, and, when applicable, the rationale for any differences in the Fund’s management and subadvisory fees and the fees charged to those other investment advisory clients. In addition, the Board considered information furnished by New York Life Investments and Epoch in response to requests prepared on behalf of the Board, and in consultation with the Independent Trustees, by independent legal counsel to the Independent Trustees, which encompassed a variety of topics, including those summarized below.
The Board took into account information provided in connection with its meetings throughout the year, including, among other items, information regarding the legal standards and fiduciary obligations applicable to its consideration of the continuation of each of the Advisory Agreements and investment performance reports on the Fund as well as presentations from New York Life Investments and Epoch personnel. The Board also took into account other information received from New York Life Investments throughout the year, including, among other items, periodic reports on legal and compliance matters, risk management, portfolio turnover, brokerage commissions and non-advisory services provided to the Fund by New York Life Investments. The contract review process, including the structure and format for materials provided to the Board, has been developed in consultation with the Board. The Independent
Trustees also met in executive sessions with their independent legal counsel and, for a portion thereof, with senior management of New York Life Investments.
In addition to information provided to the Board throughout the year, the Board received information in connection with its June 2020 meeting provided specifically in response to requests prepared on behalf of the Board, and in consultation with the Independent Trustees, by independent legal counsel regarding the Fund’s distribution arrangements. In addition, the Board received information regarding the Fund’s asset levels, share purchase and redemption activity and the payment of Rule 12b-1 and/or other fees by applicable share classes of the Fund, among other information.
In considering the continuation of each of the Advisory Agreements, the Trustees reviewed and evaluated the information and factors they believed to reasonably be necessary and appropriate in light of legal advice furnished to them by independent legal counsel and through the exercise of their own business judgment. Although individual Trustees may have weighed certain factors or information differently, the factors considered by the Board are described in greater detail below and include, among other factors: (i) the nature, extent and quality of the services provided to the Fund by New York Life Investments and Epoch; (ii) the qualifications of the portfolio managers of the Fund and the historical investment performance of the Fund, New York Life Investments and Epoch; (iii) the costs of the services provided, and profits realized, by New York Life Investments and Epoch from their relationships with the Fund; (iv) the extent to which economies of scale have been realized or may be realized as the Fund grows and the extent to which economies of scale have benefited or may benefit the Fund’s shareholders; and (v) the reasonableness of the Fund’s management and subadvisory fees and total ordinary operating expenses. Although the Board recognized that comparisons between the Fund’s fees and expenses and those of other funds are imprecise given different terms of agreements, variations in fund strategies and other factors, the Board considered the reasonableness of the Fund’s management fee and total ordinary operating expenses as compared to the peer funds identified by Strategic Insight. Throughout their considerations, the Trustees acknowledged the commitment of New York Life Investments and its affiliates to serve the MainStay Group of Funds, as well as their capacity, experience, resources, financial stability and reputations. The Trustees also acknowledged the entrepreneurial and other risks assumed by New York Life Investments in sponsoring and managing the Fund.
The Trustees noted that, throughout the year, the Trustees are afforded an opportunity to ask questions of, and request additional information or materials from, New York Life Investments and Epoch. The Board’s decision with respect to each of the Advisory Agreements may have also been based, in part, on the Board’s knowledge of New York Life Investments and Epoch resulting from, among other things, the Board’s consideration of each of the Advisory Agreements in prior years, the advisory agreements for other funds in the MainStay Group of Funds, the Board’s review throughout the year of the performance and operations of other funds in the MainStay Group of Funds and each Trustee’s business
| 36 | MainStay Epoch Global Equity Yield Fund |
judgment and industry experience. In addition to considering the above-referenced factors, the Board observed that in the marketplace there are a range of investment options available to the Fund’s shareholders and such shareholders, having had the opportunity to consider other investment options, have chosen to invest in the Fund.
The factors that figured prominently in the Board’s decision to approve the continuation of each of the Advisory Agreements during its December 9–10, 2020 meeting are summarized in more detail below, and the Board did not consider any factor or information controlling in reaching such decision.
Nature, Extent and Quality of Services Provided by New York Life Investments and Epoch
The Board examined the nature, extent and quality of the services that New York Life Investments provides to the Fund. The Board evaluated New York Life Investments’ experience and capabilities in serving as manager of the Fund and considered that the Fund operates in a “manager-of-managers” structure. The Board also considered New York Life Investments’ responsibilities and services provided pursuant to this structure, including evaluating the performance of Epoch, making recommendations to the Board as to whether the Subadvisory Agreement should be renewed, modified or terminated and periodically reporting to the Board regarding the results of New York Life Investments’ evaluation and monitoring functions. The Board noted that New York Life Investments manages other mutual funds, serves a variety of other investment advisory clients, including other pooled investment vehicles, and has experience overseeing mutual fund service providers, including subadvisors. The Board considered the experience of senior personnel at New York Life Investments providing management and administrative and other non-advisory services to the Fund as well as New York Life Investments’ reputation and financial condition. The Board observed that New York Life Investments devotes significant resources and time to providing management and non-advisory services to the Fund, including New York Life Investments’ supervision and due diligence reviews of Epoch and ongoing analysis of, and interactions with, Epoch with respect to, among other things, the Fund’s investment performance and risks as well as Epoch’s investment capabilities and subadvisory services with respect to the Fund.
The Board also considered the range of services that New York Life Investments provides to the Fund under the terms of the Management Agreement, including: (i) fund accounting and ongoing supervisory services provided by New York Life Investments’ Fund Administration and Accounting Group; (ii) investment supervisory and analytical services provided by New York Life Investments’ Investment Consulting Group; (iii) compliance services provided by the Trust’s Chief Compliance Officer as well as New York Life Investments’ compliance department, including supervision and implementation of the Fund’s compliance program; (iv) legal services provided by New York Life Investments’ Office of the General Counsel; and (v) risk management monitoring and analysis by compliance and investment personnel. The Board noted that New York Life Investments provides certain other non-advisory services to the Fund.
In addition, the Board considered New York Life Investments’ willingness to invest in personnel, infrastructure, technology, operational enhancements, cyber security, information security, shareholder privacy resources and business continuity planning designed to benefit the Fund and noted that New York Life Investments is responsible for compensating the Trust’s officers, except for a portion of the salary of the Trust’s Chief Compliance Officer. The Board recognized that New York Life Investments has provided an increasingly broad array of non-advisory services to the MainStay Group of Funds as a result of regulatory and other developments, including in connection with the designation of New York Life Investments as the administrator of the MainStay Group of Funds’ liquidity risk management program adopted under the 1940 Act. The Board considered benefits to shareholders from being part of the MainStay Group of Funds, including the privilege of exchanging investments between the same class of shares of funds in the MainStay Group of Funds, including without the imposition of a sales charge (if any).
The Board also examined the nature, extent and quality of the investment advisory services that Epoch provides to the Fund and considered the terms of each of the Advisory Agreements. The Board evaluated Epoch’s experience in serving as subadvisor to the Fund and advising other portfolios and Epoch’s track record and experience in providing investment advisory services, the experience of investment advisory, senior management and administrative personnel at Epoch and New York Life Investments’ and Epoch’s overall resources, legal and compliance environment, capabilities and history. In addition to information provided in connection with quarterly meetings with the Trust’s Chief Compliance Officer, the Board considered information regarding the compliance policies and procedures of New York Life Investments and Epoch and acknowledged their commitment to further developing and strengthening compliance programs relating to the Fund. The Board reviewed Epoch’s ability to attract and retain qualified investment professionals and willingness to invest in personnel to service and support the Fund. In this regard, the Board considered the experience of the Fund’s portfolio managers, the number of accounts managed by the portfolio managers and the method for compensating the portfolio managers.
In addition, the Board considered discussions with New York Life Investments regarding the implementation of its business continuity plans and recognized steps taken by New York Life Investments and Epoch to continue to provide the same nature, extent and quality of services to the Fund during the COVID-19 pandemic.
Based on these considerations, the Board concluded that the Fund would likely continue to benefit from the nature, extent and quality of these services.
Investment Performance
In evaluating the Fund’s investment performance, the Board considered investment performance results over various periods in light of the Fund’s investment objective, strategies and risks. The Board considered investment reports on, and analysis of, the Fund’s performance provided
Board Consideration and Approval of Management Agreement and Subadvisory Agreement (Unaudited) (continued)
to the Board throughout the year. These reports include, among other items, information on the Fund’s gross and net returns, the Fund’s investment performance compared to relevant investment categories and the Fund’s benchmarks, the Fund’s risk-adjusted investment performance and the Fund’s investment performance as compared to peer funds, as appropriate, as well as portfolio attribution information and commentary on the effect of market conditions. The Board also considered information provided by Strategic Insight showing the investment performance of the Fund as compared to peer funds.
The Board also gave weight to its discussions with senior management at New York Life Investments concerning the Fund’s investment performance attributable to Epoch as well as discussions between the Fund’s portfolio managers and the members of the Board’s Investment Committee, which generally occur on an annual basis. In addition, the Board considered any specific actions that New York Life Investments or Epoch had taken, or had agreed to take, to seek to enhance Fund investment performance and the results of those actions. In considering the investment performance of the Fund, the Board noted that the Fund underperformed its peer funds for the one-, three-, five- and ten-year periods ended July 31, 2020. The Board considered its discussions with representatives from New York Life Investments and Epoch regarding the Fund’s investment performance.
Based on these considerations, the Board concluded that its review of the Fund’s investment performance and related information supported a determination to approve the continuation of each of the Advisory Agreements.
Costs of the Services Provided, and Profits Realized, by New York Life Investments and Epoch
The Board considered the costs of the services provided under each of the Advisory Agreements. The Board also considered the profits realized by New York Life Investments and its affiliates and Epoch due to their relationships with the Fund. The Board considered that Epoch’s subadvisory fee had been negotiated at arm’s-length by New York Life Investments and that this fee is paid by New York Life Investments, not the Fund, and the relevance of Epoch’s profitability was considered by the Trustees in that context. On this basis, the Board primarily considered the costs and profitability for New York Life Investments and its affiliates with respect to the Fund.
In addition, the Board acknowledged the difficulty in obtaining reliable comparative data about mutual fund managers’ profitability because such information generally is not publicly available and may be impacted by numerous factors, including the structure of a fund manager’s organization, the types of funds it manages, the methodology used to allocate certain fixed costs to specific funds and the manager’s capital structure and costs of capital.
In evaluating the costs of the services provided by New York Life Investments and Epoch and profits realized by New York Life Investments and its affiliates and Epoch, the Board considered, among other factors, each party’s continuing investments in, or willingness to invest in,
personnel, systems, equipment and other resources and infrastructure to support and further enhance the management of the Fund, and that New York Life Investments is responsible for paying the subadvisory fee for the Fund. The Board also considered the financial resources of New York Life Investments and Epoch and acknowledged that New York Life Investments and Epoch must be in a position to attract and retain experienced professional personnel and to maintain a strong financial position for New York Life Investments and Epoch to continue to provide high-quality services to the Fund. The Board recognized that the Fund benefits from the allocation of certain fixed costs among the funds in the MainStay Group of Funds, among other expected benefits resulting from its relationship with New York Life Investments.
The Board considered information regarding New York Life Investments’ methodology for calculating profitability and allocating costs provided by New York Life Investments in connection with the fund profitability analysis presented to the Board. The Board previously engaged an independent consultant to review the methods used to allocate costs among the funds in the MainStay Group of Funds. The Board noted that the independent consultant had concluded that New York Life Investments’ methods for allocating costs and procedures for estimating overall profitability of the relationship with the funds in the MainStay Group of Funds are reasonable and that New York Life Investments continued to use the same method of calculating profit and allocating costs since the independent consultant’s review. The Board recognized the difficulty in calculating and evaluating a manager’s profitability with respect to the Fund and noted that other profitability methodologies may also be reasonable.
The Board also considered certain fall-out benefits that may be realized by New York Life Investments and its affiliates due to their relationships with the Fund, including reputational and other indirect benefits. In this regard, the Board also requested and received information from New York Life Investments concerning other material business relationships between Epoch and its affiliates and New York Life Investments and its affiliates. In addition, the Board considered its review of a money market fund advised by New York Life Investments and an affiliated subadvisor that serves as an investment option for the Fund, including the potential rationale for and costs associated with investments in this money market fund by the Fund, if any, and considered information from New York Life Investments that the nature and type of specific investment advisory services provided to this money market fund are distinct from, or in addition to, the investment advisory services provided to the Fund.
The Board observed that, in addition to fees earned by New York Life Investments for managing the Fund, New York Life Investments’ affiliates also earn revenues from serving the Fund in various other capacities, including as the Fund’s transfer agent and distributor. The Board considered information about these other revenues and their impact on the profitability of the relationship with the Fund to New York Life Investments and its affiliates. The Board noted that, although it assessed the overall profitability of the Fund to New York Life Investments and its affiliates as part of the contract review process, when considering the reasonableness of the fee paid to New York Life Investments and its
| 38 | MainStay Epoch Global Equity Yield Fund |
affiliates under the Management Agreement, the Board considered the profitability of New York Life Investments’ relationship with the Fund on a pre-tax basis and without regard to distribution expenses incurred by New York Life Investments from its own resources.
After evaluating the information deemed relevant by the Trustees, the Board concluded that any profits realized by New York Life Investments and its affiliates due to their relationships with the Fund were not excessive. With respect to Epoch, the Board considered that any profits realized by Epoch due to its relationship with the Fund are the result of arm’s-length negotiations between New York Life Investments and Epoch, acknowledging that any such profits are based on the subadvisory fee paid to Epoch by New York Life Investments, not the Fund.
Management and Subadvisory Fees and Total Ordinary Operating Expenses
The Board evaluated the reasonableness of the fee paid under each of the Advisory Agreements and the Fund’s total ordinary operating expenses. The Board primarily considered the reasonableness of the management fee paid by the Fund to New York Life Investments, because the subadvisory fee paid to Epoch is paid by New York Life Investments, not the Fund. The Board also considered the reasonableness of the subadvisory fee paid by New York Life Investments and the amount of the management fee retained by New York Life Investments.
In assessing the reasonableness of the Fund’s fees and expenses, the Board primarily considered comparative data provided by Strategic Insight on the fees and expenses charged by similar mutual funds managed by other investment advisers. In addition, the Board considered information provided by New York Life Investments and Epoch on fees charged to other investment advisory clients, including institutional separate accounts and/or other funds that follow investment strategies similar to those of the Fund, if any. The Board considered the similarities and differences in the contractual management fee schedules of the Fund and these similarly-managed accounts and/or funds, taking into account the rationale for any differences in fee schedules. The Board also took into account explanations provided by New York Life Investments about the more extensive scope of services provided to registered investment companies, such as the Fund, as compared with other investment advisory clients. Additionally, the Board considered the impact of voluntary waivers and expense limitation arrangements on the Fund’s net management fee and expenses. The Board also considered that in proposing fees for the Fund, New York Life Investments considers the competitive marketplace for mutual funds.
The Board noted that, outside of the Fund’s management fee and the fees charged under a share class’s Rule 12b-1 and/or shareholder services plans, a share class’s most significant “other expenses” are transfer agent fees. Transfer agent fees are charged to the Fund based on the number of shareholder accounts (a “per-account” fee). The Board took into account information from New York Life Investments regarding the reasonableness of the Fund’s transfer agent fee schedule, including industry data demonstrating that the per-account fees that NYLIM Service
Company LLC, an affiliate of New York Life Investments and the Fund’s transfer agent, charges the Fund are within the range of per-account fees charged by transfer agents to other mutual funds. In addition, the Board considered NYLIM Service Company LLC’s profitability in connection with the transfer agent services it provides to the Fund. The Board also took into account information received from NYLIM Service Company LLC regarding the sub-transfer agency payments it made to intermediaries in connection with the provision of sub-transfer agency services to the Fund.
The Board considered that, because the Fund’s transfer agent fees are billed on a per-account basis, the impact of transfer agent fees on a share class’s expense ratio may be more significant in cases where the share class has a high number of small accounts. The Board considered the extent to which transfer agent fees comprised total expenses of the Fund. The Board acknowledged the role that the MainStay Group of Funds historically has played in serving the investment needs of New York Life Insurance Company customers, who often maintain smaller account balances than other shareholders of funds, and the impact of small accounts on the expense ratios of Fund share classes. The Board also recognized measures that it and New York Life Investments have taken to mitigate the effect of small accounts on the expense ratios of Fund share classes, including through the imposition of an expense limitation on net transfer agency expenses. The Board noted that, for purposes of allocating transfer agency fees and expenses, each retail fund in the MainStay Group of Funds combines the shareholder accounts of its Class A, A2, I, R1, R2 and R3 shares (as applicable) into one group and the shareholder accounts of its Investor Class, SIMPLE Class and Class B, C and C2 shares (as applicable) into another group. The Board also noted that the per-account fees attributable to each group of share classes is then allocated among the constituent share classes based on relative net assets and that a MainStay Fund’s Class R6 shares, if any, are not combined with any other share class for this purpose. The Board considered New York Life Investments’ rationale with respect to these groupings and previously received a report from an independent consultant engaged to conduct comparative analysis of these groupings. The Board also considered that NYLIM Service Company LLC had waived its contractual cost of living adjustments during the past seven years.
Based on the factors outlined above, the Board concluded that the Fund’s management fee and total ordinary operating expenses were within a range that is competitive and support a conclusion that these fees and expenses are reasonable.
Economies of Scale
The Board considered information regarding economies of scale, including whether the Fund’s expense structure permits economies of scale to be appropriately shared with the Fund’s shareholders. The Board also considered a report from New York Life Investments, previously prepared at the request of the Board, that addressed economies of scale, including with respect to the mutual fund business generally and the various ways in which the benefits of economies of scale may be shared with the funds in the MainStay Group of Funds. Although the Board
Board Consideration and Approval of Management Agreement and Subadvisory Agreement (Unaudited) (continued)
recognized the difficulty of determining economies of scale with precision, the Board acknowledged that economies of scale may be shared with the Fund in a number of ways, including, for example, through the imposition of management fee breakpoints, initially setting management fee rates at scale or making additional investments to enhance services. The Board reviewed information from New York Life Investments showing how the Fund’s management fee schedule compared to fee schedules of other funds and accounts managed by New York Life Investments. The Board also reviewed information from Strategic Insight showing how the Fund’s management fee schedule compared with fees paid for similar services by peer funds at varying asset levels.
Based on this information, the Board concluded that economies of scale are appropriately reflected for the benefit of the Fund’s shareholders through the Fund’s expense structure and other methods to share benefits from economies of scale.
Conclusion
On the basis of the information and factors summarized above, among other information and factors deemed relevant by the Trustees, and the evaluation thereof, the Board, including the Independent Trustees voting separately, unanimously voted to approve the continuation of each of the Advisory Agreements.
| 40 | MainStay Epoch Global Equity Yield Fund |
Discussion of the Operation and Effectiveness of the Fund's Liquidity Risk Management Program (Unaudited)
In compliance with Rule 22e-4 under the Investment Company Act of 1940, as amended (the “Liquidity Rule”), the Fund has adopted and implemented a liquidity risk management program (the “Program”), which New York Life Investment Management LLC believes is reasonably designed to assess and manage the Fund's liquidity risk (the risk that the Fund could not meet requests to redeem shares issued by the Fund without significant dilution of remaining investors’ interests in the Fund). The Board of Trustees of MainStay Funds Trust (the "Board") designated New York Life Investment Management LLC as administrator of the Program (the “Administrator”). The Administrator has established a Liquidity Risk Management Committee to assist the Administrator in the implementation and day-to-day administration of the Program and to otherwise support the Administrator in fulfilling its responsibilities under the Program.
At a meeting of the Board held on March 8, 2021, the Administrator provided the Board with a written report addressing the Program’s operation and assessing its adequacy and effectiveness of implementation for the period from January 1, 2020 through December 31, 2020 (the "Review Period"), as required under the Liquidity Rule. The report noted that the Administrator concluded that (i) the Program operated effectively to assess and manage the Fund's liquidity risk, (ii) the Program has been adequately and effectively implemented to monitor and, as applicable, respond to the Fund's liquidity developments and (iii) the Fund's investment strategy continues to be appropriate for an open-end fund. In addition, the report discussed notable events that impacted liquidity risk during the Review Period, including the COVID-19 pandemic and the resulting economic shutdown.
In accordance with the Program, the Fund's liquidity risk is assessed no less frequently than annually taking into consideration certain factors, as applicable, such as (i) investment strategy and liquidity of portfolio investments, (ii) short-term and long-term cash flow projections and (iii) holdings of cash and cash equivalents, as well as borrowing arrangements and other funding sources. Certain factors are considered under both normal and reasonably foreseeable stressed conditions.
Each Fund portfolio investment is classified into one of four liquidity categories. The classification is based on a determination of the number of days it is reasonably expected to take to convert the investment into cash, or sell or dispose of the investment, in current market conditions without significantly changing the market value of the investment. The Administrator has delegated liquidity classification determinations to the Fund’s subadvisor, subject to appropriate oversight by the Administrator, and classification determinations are made by taking into account the Fund's reasonably anticipated trade size, various market, trading and investment-specific considerations, as well as market depth, and, in certain cases, third-party vendor data.
The Liquidity Rule requires funds that do not primarily hold assets that are highly liquid investments to adopt a minimum amount of net assets that must be invested in highly liquid investments that are assets (an “HLIM”). In addition, the Liquidity Rule limits a fund's investments in illiquid investments. Specifically, the Liquidity Rule prohibits acquisition of illiquid investments if doing so would result in a fund holding more than 15% of its net assets in illiquid investments that are assets. The Program includes provisions reasonably designed to determine, periodically review and comply with the HLIM requirement, as applicable, and to comply with the 15% limit on illiquid investments.
There can be no assurance that the Program will achieve its objectives under all circumstances in the future. Please refer to the Fund's prospectus for more information regarding the Fund's exposure to liquidity risk and other risks to which it may be subject.
Proxy Voting Record
The Fund is required to file with the Securities and Exchange Commissions's ("SEC") its proxy voting records for the 12-month period ending June 30 on Form N-PX. The most recent Form N-PX or proxy voting record is available free of charge upon request by calling 800-624-6782; visiting the MainStay Funds’ website at newyorklifeinvestments.com; or visiting the SEC’s website at www.sec.gov.
Shareholder Reports and Quarterly Portfolio Disclosure
The Fund is required to file its complete schedule of portfolio holdings with the SEC 60 days after its first and third fiscal quarter on Form N-PORT. The Fund's holdings report is available free of charge upon request by calling New York Life Investments at 800-624-6782.
| 42 | MainStay Epoch Global Equity Yield Fund |
Equity
U.S. Equity
MainStay Epoch U.S. Equity Yield Fund
MainStay MacKay S&P 500 Index Fund
MainStay Winslow Large Cap Growth Fund
MainStay WMC Enduring Capital Fund
MainStay WMC Growth Fund
MainStay WMC Small Companies Fund
MainStay WMC Value Fund
International Equity
MainStay Epoch International Choice Fund
MainStay MacKay International Equity Fund
MainStay WMC International Research Equity Fund
Emerging Markets Equity
MainStay Candriam Emerging Markets Equity Fund
Global Equity
MainStay Epoch Capital Growth Fund
MainStay Epoch Global Equity Yield Fund
Fixed Income
Taxable Income
MainStay Candriam Emerging Markets Debt Fund
MainStay Floating Rate Fund
MainStay MacKay High Yield Corporate Bond Fund
MainStay MacKay Short Duration High Yield Fund
MainStay MacKay Strategic Bond Fund
MainStay MacKay Total Return Bond Fund
MainStay MacKay U.S. Infrastructure Bond Fund
MainStay Short Term Bond Fund
Tax-Exempt Income
MainStay MacKay California Tax Free Opportunities Fund1
MainStay MacKay High Yield Municipal Bond Fund
MainStay MacKay Intermediate Tax Free Bond Fund
MainStay MacKay New York Tax Free Opportunities Fund2
MainStay MacKay Short Term Municipal Fund
MainStay MacKay Tax Free Bond Fund
Money Market
MainStay Money Market Fund
Mixed Asset
MainStay Balanced Fund
MainStay Income Builder Fund
MainStay MacKay Convertible Fund
Speciality
MainStay CBRE Global Infrastructure Fund
MainStay CBRE Real Estate Fund
MainStay Cushing MLP Premier Fund
Asset Allocation
MainStay Conservative Allocation Fund
MainStay Conservative ETF Allocation Fund
MainStay Defensive ETF Allocation Fund
MainStay Equity Allocation Fund
MainStay Equity ETF Allocation Fund
MainStay Growth Allocation Fund
MainStay Growth ETF Allocation Fund
MainStay Moderate Allocation Fund
MainStay Moderate ETF Allocation Fund
Manager
New York Life Investment Management LLC
New York, New York
Subadvisors
Candriam Belgium S.A.3
Brussels, Belgium
Candriam Luxembourg S.C.A.3
Strassen, Luxembourg
CBRE Clarion Securities LLC
Radnor, Pennsylvania
Cushing Asset Management, LP
Dallas, Texas
Epoch Investment Partners, Inc.
New York, New York
MacKay Shields LLC3
New York, New York
NYL Investors LLC3
New York, New York
Wellington Management Company LLP
Boston, Massachusetts
Winslow Capital Management, LLC
Minneapolis, Minnesota
Legal Counsel
Dechert LLP
Washington, District of Columbia
Independent Registered Public Accounting Firm
KPMG LLP
Philadelphia, Pennsylvania
Distributor
NYLIFE Distributors LLC3
Jersey City, New Jersey
Custodian
JPMorgan Chase Bank, N.A.
New York, New York
1.
This Fund is registered for sale in AZ, CA, NV, OR, TX, UT, WA and MI (Class A and I shares only), and CO, FL, GA, HI, ID, MA, MD, NH, NJ and NY (Class I shares only).
| 2. | This Fund is registered for sale in CA, CT, DE, FL, MA, NJ, NY and VT. |
| 3. | An affiliate of New York Life Investment Management LLC. |
Not part of the Semiannual Report
For more information
800-624-6782
newyorklifeinvestments.com
“New York Life Investments” is both a service mark, and the common trade name, of certain investment advisors affiliated with New York Life Insurance Company. The MainStay Funds® are managed by New York Life Investment Management LLC and distributed by NYLIFE Distributors LLC, 30 Hudson Street, Jersey City, NJ 07302, a wholly owned subsidiary of New York Life Insurance Company. NYLIFE Distributors LLC is a Member FINRA/SIPC.
©2021 NYLIFE Distributors LLC. All rights reserved.
| 1737580MS071-21 | MSEGE10-06/21 |
(NYLIM) NL241
MainStay Epoch International Choice Fund
Message from the President and Semiannual Report
Unaudited | April 30, 2021
Sign up for e-delivery of your shareholder reports. For full details on e-delivery, including who can participate and what you can receive via e-delivery,
please log in to newyorklifeinvestments.com/accounts.
| Not FDIC/NCUA Insured | Not a Deposit | May Lose Value | No Bank Guarantee | Not Insured by Any Government Agency |
This page intentionally left blank
Message from the President
With the approval of COVID-19 vaccines and the passage of relief packages by the U.S. Congress, economic prospects improved during the reporting period, and investor risk appetite increased, benefiting both equities and fixed-income markets. Despite some volatility stemming from a sell-off in longer-dated Treasury securities, the stock market and higher-risk segments of the fixed-income market posted gains for the six months ended April 30, 2021.
By the beginning of the reporting period, the economy had made tremendous progress from the second quarter of 2020, when economic activity plunged. But uncertainty about when vaccines would be available and how quickly they could be administered left investors unsure about the economic outlook.
With the approval of several vaccines in November, the outlook brightened and investors became less risk-averse. Anticipating the likely end of the pandemic and a continuation of the economic recovery, they began to see opportunities in investment-grade and high-yield bonds and more cyclical segments of the stock market. The $900 billion relief and stimulus package passed in December provided further assurance.
In January, the Federal Reserve opted to leave interest rates unchanged, pointing to some uncertainty about the pace of the global recovery. Officials also noted that inflation remained low, citing oil prices in particular.
In March, President Biden signed the $1.9 billion American Rescue Plan, which, among other provisions, called for payments of $1,400 for those earning less than $75,000 per year, plus $1,400 per dependent. This, combined with the Federal Reserve’s new tolerance for inflation and an anticipated $2 trillion infrastructure spending bill, added to growing concerns about higher prices. Supply shortages in some markets caused some prices to soar, heightening concerns further.
In fixed-income markets, an improving economic outlook and rising inflation expectations led to a sell-off in longer-term Treasuries, with the result that the yield on the 10-year note rose sharply, particularly in February and March. Investment grade corporate bonds were also affected. Early in the reporting period, they performed well as investors shifted out of Treasuries, but as the reporting period progressed, they faltered. Longer-dated securities issued in recent years at historically low interest rates became especially unattractive.
High-yield bonds remained steady, supported by more favorable yields and an improved economic outlook, which reduced their perceived risk. Municipal bonds produced modest gains, and
although the sell-off in Treasuries produced some volatility early in 2021, stronger-than-expected tax revenues, $350 billion in financial support from the federal government, and the possibility of an increase in federal income tax rates appeared to buoy the market late in the reporting period.
Inflation concerns and volatility in the Treasury market led to a shift in equities markets. Although the S&P 500® Index, a widely followed measure of U.S. equities, posted double-digit gains and hit a record high, the rise of Treasury yields disrupted valuations, especially those of growth stocks. Technology companies that saw their valuations soar amid the work-from-home trend in 2020 suffered large declines.
But the fiscal stimulus and continued accommodation from the Federal Reserve gave investors confidence the economic recovery would continue. Combined with the sky-high valuations in technology and growth stocks, this increased the appeal of more cyclical and value-oriented shares. As a result, value stocks outperformed growth stocks during the reporting period.
Reflecting the shift in investor sentiment, the performance of S&P 500® Index sectors varied widely. While the information technology sector kept up with the broader market, it lagged cyclical sectors such as energy and financials, which led the way. The shift was further reflected in the performance of small-cap stocks, which outperformed large caps. While developed markets kept pace with the U.S. market, lagging economic and pandemic recoveries appeared to weigh on emerging markets late in the reporting period.
With the lockdown restrictions lifting in the U.S. and the pandemic easing in many regions, we at New York Life Investments are looking forward to a return to a more normal economy. We anticipate that over the next several years, a variety of trends will likely offer long-term investors many attractive opportunities. With this in mind, we continue to develop products and services to help you to take advantage of these trends, manage your risks, and ultimately meet your investment goals.
Sincerely,
Kirk C. Lehneis
President
The opinions expressed are as of the date of this report and are subject to change. There is no guarantee that any forecast made will come to pass. This material does not constitute investment advice and is not intended as an endorsement of any specific investment. Past performance is no guarantee of future results.
Not part of the Semiannual Report
Investors should refer to the Fund’s Summary Prospectus and/or Prospectus and consider the Fund’s investment objectives, strategies, risks, charges and expenses carefully before investing. The Summary Prospectus and/or Prospectus contain this and other information about the Fund. You may obtain copies of the Fund’s Summary Prospectus, Prospectus and Statement of Additional Information free of charge, upon request, by calling toll-free 800-624-6782, by writing to NYLIFE Distributors LLC, Attn: MainStay Marketing Department, 30 Hudson Street, Jersey City, NJ 07302 or by sending an e-mail to MainStayShareholderServices@nylim.com. These documents are also available via the MainStay Funds’ website at newyorklifeinvestments.com. Please read the Fund’s Summary Prospectus and/or Prospectus carefully before investing.
Investment and Performance Comparison (Unaudited)
Performance data quoted represents past performance. Past performance is no guarantee of future results. Because of market volatility and other factors, current performance may be lower or higher than the figures shown. Investment return and principal value will fluctuate, and as a result, when shares are redeemed, they may be worth more or less than their original cost. The graph below depicts the historical performance of Class I shares of the Fund. Performance will vary from class to class based on differences in class-specific expenses and sales charges. For performance information current to the most recent month-end, please call 800-624-6782 or visit newyorklifeinvestments.com.
The performance table and graph do not reflect the deduction of taxes that a shareholder would pay on distributions or Fund share redemptions. Total returns reflect maximum applicable sales charges as indicated in the table below, if any, changes in share price, and reinvestment of dividend and capital gain distributions. The graph assumes the initial investment amount shown below and reflects the deduction of all sales charges that would have applied for the period of investment. Performance figures may reflect certain fee waivers and/or expense limitations, without which total returns may have been lower. For more information on share classes and current fee waivers and/or expense limitations (if any), please refer to the Notes to Financial Statements.
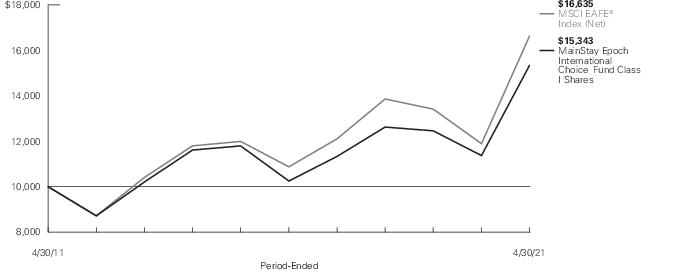
| Average Annual Total Returns for the Period-Ended April 30, 2021 |
| Class | Sales Charge | | Inception
Date | Six
Months | One Year
or Since
Inception | Five
Years | Ten
Years | Gross
Expense
Ratio1 |
| Class A Shares | Maximum 5.5% Initial Sales Charge | With sales charges | 9/1/2006 | 16.96% | 27.19% | 6.91% | 3.49% | 1.20% |
| | | Excluding sales charges | | 23.77 | 34.60 | 8.13 | 4.07 | 1.20 |
| Investor Class Shares2 | Maximum 5% Initial Sales Charge | With sales charges | 4/29/2008 | 17.45 | 26.87 | 6.68 | 3.31 | 1.46 |
| | | Excluding sales charges | | 23.63 | 34.26 | 7.89 | 3.90 | 1.46 |
| Class C Shares | Maximum 1% CDSC | With sales charges | 9/1/2006 | 22.15 | 32.28 | 7.04 | 3.10 | 2.21 |
| | if Redeemed Within One Year of Purchase | Excluding sales charges | | 23.15 | 33.28 | 7.04 | 3.10 | 2.21 |
| Class I Shares | No Sales Charge | | 12/31/1997 | 23.93 | 34.95 | 8.40 | 4.37 | 0.95 |
| Class R1 Shares | No Sales Charge | | 9/1/2006 | 23.88 | 34.83 | 8.30 | 4.27 | 1.05 |
| Class R2 Shares | No Sales Charge | | 9/1/2006 | 23.75 | 34.50 | 8.03 | 3.98 | 1.30 |
| Class R3 Shares | No Sales Charge | | 9/1/2006 | 23.58 | 34.14 | 7.75 | 3.71 | 1.55 |
| SIMPLE Class Shares | No Sales Charge | | 8/31/2020 | 23.49 | 15.54 | N/A | N/A | 1.71 |
| 1. | The gross expense ratios presented reflect the Fund’s “Total Annual Fund Operating Expenses” from the most recent Prospectus, as supplemented, and may differ from other expense ratios disclosed in this report. |
| 2. | Prior to June 30, 2020, the maximum initial sales charge was 5.5%, which is reflected in the average annual total return figures shown. |
The footnotes on the next page are an integral part of the table and graph and should be carefully read in conjunction with them.
| Benchmark Performance | Six
Months | One
Year | Five
Years | Ten
Years |
| MSCI EAFE® Index (Net)1 | 28.84% | 39.88% | 8.87% | 5.22% |
| Morningstar Foreign Large Blend Category Average2 | 27.60 | 41.69 | 8.84 | 4.72 |
| 1. | The MSCI EAFE® Index (Net) is the Fund’s primary broad-based securities market index for comparison purposes. The MSCI EAFE® Index (Net) consists of international stocks representing the developed world outside of North America. Results assume reinvestment of all dividends and capital gains. An investment cannot be made directly in an index. |
| 2. | The Morningstar Foreign Large Blend Category Average is representative of funds that invest in a variety of big international stocks. Most of these portfolios divide their assets among a dozen or more developed markets, including Japan, Britain, France, and Germany. These portfolios primarily invest in stocks that have market caps in the top 70% of each economically integrated market (such as Europe or Asia ex-Japan). The blend style is assigned to portfolios where neither growth nor value characteristics predominate. These portfolios typically will have less than 20% of assets invested in U.S. stocks. Results are based on average total returns of similar funds with all dividends and capital gain distributions reinvested. |
The footnotes on the preceding page are an integral part of the table and graph and should be carefully read in conjunction with them.
| 6 | MainStay Epoch International Choice Fund |
Cost in Dollars of a $1,000 Investment in MainStay Epoch International Choice Fund (Unaudited)
The example below is intended to describe the fees and expenses borne by shareholders during the six-month period from November 1, 2020, to April 30, 2021, and the impact of those costs on your investment.
Example
As a shareholder of the Fund you incur two types of costs: (1) transaction costs, including exchange fees and sales charges (loads) on purchases (as applicable), and (2) ongoing costs, including management fees, distribution and/or service (12b-1) fees, and other Fund expenses (as applicable). This example is intended to help you understand your ongoing costs (in dollars) of investing in the Fund and to compare these costs with the ongoing costs of investing in other mutual funds. The example is based on an investment of $1,000 made at the beginning of the six-month period and held for the entire period from November 1, 2020, to April 30, 2021.
This example illustrates your Fund’s ongoing costs in two ways:
Actual Expenses
The second and third data columns in the table below provide information about actual account values and actual expenses. You may use the information in these columns, together with the amount you invested, to estimate the expenses that you paid during the six months ended April 30, 2021. Simply divide your account value by $1,000 (for example, an
$8,600 account value divided by $1,000 = 8.6), then multiply the result by the number under the heading entitled “Expenses Paid During Period” to estimate the expenses you paid on your account during this period.
Hypothetical Example for Comparison Purposes
The fourth and fifth data columns in the table below provide information about hypothetical account values and hypothetical expenses based on the Fund’s actual expense ratio and an assumed rate of return of 5% per year before expenses, which is not the Fund’s actual return. The hypothetical account values and expenses may not be used to estimate the actual ending account balances or expenses you paid for the six-month period shown. You may use this information to compare the ongoing costs of investing in the Fund with the ongoing costs of investing in other mutual funds. To do so, compare this 5% hypothetical example with the 5% hypothetical examples that appear in the shareholder reports of the other mutual funds.
Please note that the expenses shown in the table are meant to highlight your ongoing costs only and do not reflect any transactional costs, such as exchange fees or sales charges (loads). Therefore, the fourth and fifth data columns of the table are useful in comparing ongoing costs only and will not help you determine the relative total costs of owning different funds. In addition, if these transactional costs were included, your costs would have been higher.
| Share Class | Beginning
Account
Value
11/1/20 | Ending Account
Value (Based
on Actual
Returns and
Expenses)
4/30/21 | Expenses
Paid
During
Period1 | Ending Account
Value (Based
on Hypothetical
5% Annualized
Return and
Actual Expenses)
4/30/21 | Expenses
Paid
During
Period1 | Net Expense
Ratio
During
Period2 |
| Class A Shares | $1,000.00 | $1,237.70 | $ 6.77 | $1,018.75 | $ 6.11 | 1.22% |
| Investor Class Shares | $1,000.00 | $1,236.30 | $ 8.10 | $1,017.56 | $ 7.30 | 1.46% |
| Class C Shares | $1,000.00 | $1,231.50 | $12.23 | $1,013.84 | $11.04 | 2.21% |
| Class I Shares | $1,000.00 | $1,239.30 | $ 5.27 | $1,020.08 | $ 4.76 | 0.95% |
| Class R1 Shares | $1,000.00 | $1,238.80 | $ 5.83 | $1,019.59 | $ 5.26 | 1.05% |
| Class R2 Shares | $1,000.00 | $1,237.50 | $ 7.21 | $1,018.35 | $ 6.51 | 1.30% |
| Class R3 Shares | $1,000.00 | $1,235.80 | $ 8.70 | $1,017.01 | $ 7.85 | 1.57% |
| SIMPLE Class Shares | $1,000.00 | $1,234.90 | $ 9.50 | $1,016.36 | $ 8.57 | 1.71% |
| 1. | Expenses are equal to the Fund’s annualized expense ratio of each class multiplied by the average account value over the period, divided by 365 and multiplied by 181 (to reflect the six-month period). The table above represents the actual expenses incurred during the six-month period. In addition to the fees and expenses which the Fund bears directly, it also indirectly bears a pro rata share of the fees and expenses of the underlying funds in which it invests. Such indirect expenses are not included in the above-reported expense figures. |
| 2. | Expenses are equal to the Fund's annualized expense ratio to reflect the six-month period. |
Country Composition as of April 30, 2021 (Unaudited)
| France | 22.7% |
| Japan | 18.2 |
| United States | 16.7 |
| United Kingdom | 15.4 |
| Netherlands | 10.1 |
| Switzerland | 9.8 |
| Spain | 5.3 |
| Finland | 3.2 |
| Macao | 2.9% |
| Republic of Korea | 2.5 |
| Taiwan | 2.5 |
| Italy | 2.0 |
| Other Assets, Less Liabilities | –11.3 |
| | 100.0% |
See Portfolio of Investments beginning on page 12 for specific holdings within these categories. The Fund's holdings are subject to change.
Top Ten Holdings as of April 30, 2021 (excluding short-term investments) (Unaudited)
| 1. | AXA SA |
| 2. | Swiss Re AG |
| 3. | Bureau Veritas SA |
| 4. | Koninklijke Philips NV |
| 5. | Takeda Pharmaceutical Co. Ltd. |
| 6. | ABB Ltd. (Registered) |
| 7. | Nordea Bank Abp |
| 8. | Coca-Cola European Partners plc |
| 9. | Willis Towers Watson plc |
| 10. | Rentokil Initial plc |
| 8 | MainStay Epoch International Choice Fund |
Portfolio Management Discussion and Analysis (Unaudited)
Questions answered by portfolio managers Michael A. Welhoelter, CFA, William J. Booth, CFA, and Glen Petraglia, CFA, of Epoch Investment Partners, Inc., the Fund’s Subadvisor .
How did MainStay Epoch International Choice Fund perform relative to its benchmark and peer group during the six months ended April 30, 2021?
For the six months ended April 30, 2021, Class I shares of MainStay Epoch International Choice Fund returned 23.93%, underperforming the 28.84% return of the Fund’s primary benchmark, the MSCI EAFE® Index (Net). Over the same period, Class I shares also underperformed the 27.60% return of the Morningstar Foreign Large Blend Category Average.1
What factors affected the Fund’s relative performance during the reporting period?
Both sector allocations and stock selection detracted from the Fund’s performance relative to the MSCI EAFE® Index (Net). Among the Fund’s sector allocations, underweight positions in the energy and financials sectors were the largest detractors. Stock selections in communication services and materials proved the most notable detractors, while selections in the consumer staples sector bolstered relative returns.
During the reporting period, which sectors and/or countries were the strongest positive contributors to the Fund’s relative performance and which sectors and/or countries were particularly weak?
During the reporting period, the countries making the strongest positive contributions to the Fund’s performance relative to the MSCI EAFE® Index (Net) included Japan and the Netherlands. (Contributions take weightings and total returns into account.) Conversely, the countries detracting most significantly from the Fund’s relative returns were France, Spain and the U.K.
During the reporting period, which individual stocks made the strongest positive contributions to the Fund’s absolute performance and which stocks detracted the most?
The Fund’s top contributors to absolute performance included shares in South Korea-based diversified electronics device maker Samsung Electronics, French insurer AXA and Netherlands-based semiconductor manufacturing equipment maker ASML Holding.
Samsung Electronics is a leading manufacturer of mobile devices, display technology, DRAM and NAND digital memory, and consumer electronics. It also provides foundry services to third parties along with developing and building its own semiconductors. Share prices increased on improving NAND and DRAM supply/demand projections, firming up pricing for both. Demand was broadly based, but increased memory capacity in 5G phones and data center demand were important drivers.
AXA continued to deliver solid cash flow generation while further reinforcing its strong balance sheet. U.S. subsidiary AXA XL built additional reserves to address potential COVID-19-related claims, which proved slow to materialize given the economic stimulus and better-than-expected business conditions. Investors began appreciating the high likelihood that the company’s reserves may prove sufficient, while cash generation started to grow again as planned. Near-term capital return to shareholders also appears increasingly likely, providing additional support to the company’s shares.
ASML’s products allow semiconductor manufacturers to choose the optimal numerical aperture and wavelength for their applications and assure uniformity. The stock was buoyed by upgraded spending plans from several top semiconductor companies, including TSM, Samsung and Intel, as the industry’s top players vie for a competitive edge. At the same time, announcements of support by the U.S. and European Union for more localized semiconductor production highlighted the push to secure semiconductor independence by governments around the world. In our view, ASML is unlike any other company in the semiconductor chain due to its monopoly on the photolithography process. We believe ASML is on track to sell at least 40 EUV (extreme ultraviolet) systems in 2021, up from 31 EUV units in 2020, with capacity constraint being the primary limiting factor as demand appears robust.
During the same period, the most significant detractors from the Fund’s absolute performance were France-based video game maker Ubisoft Entertainment, Spain-based wireless infrastructure company Cellnex Telecom and Taiwanese semiconductor maker Taiwan Semiconductor Manufacturing.
During the reporting period, Ubisoft Entertainment posted strong third-quarter 2020 results due to contributions from new releases and strong engagement across the company’s portfolio of games. However, full-year guidance was tightened, including some projected weakness based on the delayed timing of some titles. We view the delay of these new releases as an immaterial shifting of revenue, profit and cash flows into future quarters. We continue to believe the company has a significant runway for margin improvement and free cash flow growth over the next several years due to bookings growth from current and upcoming projects, higher margin bookings from the continued shift from physical to digital delivery, and a greater mix of bookings from in-game purchase.
Due to its business model’s lack of economic sensitivity, Cellnex Telecom stock suffered as investors favored companies poised to benefit from a reopening of the economy.
The Fund initiated its position in Taiwan Semiconductor Manufacturing (TSM) toward the end of the reporting period prior
| 1. | See page 5 for other share class returns, which may be higher or lower than Class I share returns. See page 6 for more information on benchmark and peer group returns. |
to a dip in the share price. The company manufactures and markets integrated circuits for use in computer, communication, consumer electronics, automotive and industrial equipment industries. TSM makes chips for semiconductor and systems companies that do not have their own manufacturing facilities, such as AMD, Broadcom, NVIDIA and QUALCOMM. Remaining sales come from integrated device manufacturers, including STMicroelectronics and Texas Instruments. In our opinion, TSM is a high-quality company with a dominant market leadership position, high margins and a high return on invested capital. We view the company as a global leader with a visible roadmap to further market share gains, supported by the structural industry trends mentioned above. The company has historically been a good steward of capital with an attractive dividend payout ratio.
What were some of the Fund’s largest purchases and sales during the reporting period?
The Fund’s largest purchases during the reporting period included shares in Western European Coca-Cola bottler Coca-Cola European Partners, Japanese machine maker Toyota Industries and European utility company Enel.
Coca-Cola European Partners (CCEP) distributes and sells ready-to-drink beverages through the following brands: Coca-Cola, Diet Coke or Coca-Cola Light, Coke Zero, Coca-Cola Life, Fanta and Sprite. It also offers energy drinks, waters, juices, sports drinks and ready-to-drink teas. As of July 2020, CCEP volumes had recovered nearly completely from the pandemic-related slowdown after having bottomed at in April of that year. Thus, it appeared to us that the worst had passed, barring further geographically broad lockdowns in Western Europe. Our expectation was that, as volumes sequentially recovered, fixed-cost absorption and margins should also recover. CCEP was aggressive through the crisis in reducing costs, targeting significant savings in discretionary operating expenses such as trade marketing, incentives and travel. Some of these savings may become permanent, and we see an opportunity for the company to improve the efficiency of its promotions when they do return to a more normalized environment. CCEP also took the opportunity to eliminate lesser-selling products, which should improve line efficiency. We anticipate free cash flow returning to pre-pandemic levels in 2022, despite assuming volumes remain slightly below 2019 levels for the legacy CCEP business. Furthermore, CCEP has made an offer to acquire Coca-Cola Amatil, the Coca-Cola bottler in Australia, New Zealand and Indonesia. We believe this proposed transaction offers the opportunity for CCEP management to employ a playbook similar to that executed in Western Europe to reinvigorate revenue growth in Australia and extract operating efficiencies, thereby generating attractive returns for shareholders.
Holdings in Toyota Industries stock provide the Fund with exposure to automation and electrification trends. The company originally,
and still, manufactures automatic looms. The company has also established leadership in materials handling equipment (forklifts) and automotive parts (air conditioning compressors). In our opinion, it is well positioned to grow profitably, providing balanced exposure to both long-term structural trends and cyclical near-term recovery. Accelerating e-commerce growth worldwide is driving increased demand for Toyota Industries' materials handling equipment and solutions. Furthermore, as the company’s logistics solutions business leverages the benefits from recent acquisitions and continues to scale, we believe it should be able to increase operating margins from the mid-single digits to the high-single digits during the next several years. Rising electric vehicle penetration is increasing demand for the company's automotive compressors. The company boasts a leading position and majority market share in electric compressors, where demand is rising due to their high efficiency and long-drive range. Given these positive trends, we view the company as positioned to deliver mid-single digit sales growth, low-teens operating profit growth, and steady free cash flow generation for several years. Importantly, the company's major equity holdings in Toyota Motor, Denso and Aisin Seiki accounted for more than 80% of its market cap at the time of the Fund’s investment, implying the valuation of the underlying business was highly discounted.
We believe Enel is well positioned for growth in renewable energy. It operates as a multinational power company and is an integrated player in the global power, gas and renewables markets. The world of utilities is experiencing an era of profound transformation, mainly driven by the challenge of decarbonizing the energy sector. We believe the progressive shift of generation from fossil fuels to renewable sources, together with the acceleration in the electrification of final consumption, will be the main trends in the energy transition. Energy infrastructures and digital platforms will be key factors in enabling this transition and achieving the United Nations' Sustainable Development Goals and the milestones associated with the European Green Deal. Enel's management has executed well over the last six years and has recently communicated a shareholder value creation model that includes raising the dividend at a steadily compounded rate while generating strong earnings per share growth. Importantly, the company has also communicated solid plans for expanding its mix of green energy projects while significantly reducing its reliance on fossil fuels. Indeed, Enel’s stated goal is to be coal-free by 2027 and to expand its renewables mix to over 80% of generation capacity from roughly 55% today. Enel's plans are partially in response to the European Green Deal, which proposes several green energy targets and milestones out to 2050. We believe that, as the mix increasingly shifts toward renewables and if management executes on its three-year plan to create shareholder value, the company’s valuation should expand to reflect the improved mix and execution.
During the same period, the Fund’s most significant sales included positions in Swiss food and drink producer Nestlé, Swiss
| 10 | MainStay Epoch International Choice Fund |
pharmaceutical firm Roche Holdings and Japanese security services firm Secom.
During the reporting period, we believed it made sense for the Fund to own companies across the spectrum of sensitivity to the current crisis, from relatively unaffected names to those that we believed should significantly benefit from a return to some sense of normalcy. To better balance the Fund’s holdings across this spectrum, we exited the Fund’s positions in Nestlé and Roche. In our view, these two defensive businesses have been relatively immune to the crisis. Based on the positive vaccine news in the fourth quarter of 2020 and the potential for the pandemic to resolve sooner rather than later, we believed it prudent to modestly shift the Fund’s exposure to names with greater exposure to economic reopening and recovery.
With regard to Secom, while the company has a resilient business model with defensive characteristics, we find those same attributes in Enel, described above. However, we believe Enel offers a more attractive medium-term growth profile, driven by its investment in renewable energy. Accordingly, we elected to sell the Fund’s Secom shares and use the proceeds to initiate a position in Enel.
How did the Fund’s sector and/or country weightings change during the reporting period?
The Fund’s largest increases in sector weight during the reporting period were in consumer discretionary and financials. Conversely, the Fund saw reductions in exposure to the health care and communication services sectors. From a country perspective, the Fund experienced its largest increase in exposure to France and its most significant reduction in exposure to Switzerland.
How was the Fund positioned at the end of the reporting period?
As of April 30, 2021, the Fund held its most overweight exposures relative to the MSCI EAFE® Index (Net) to the information technology, consumer discretionary and communication services sectors. As of the same date, the Fund’s most underweight positions were in the energy, real estate and financials sectors.
The opinions expressed are those of the portfolio managers as of the date of this report and are subject to change. There is no guarantee that any forecasts will come to pass. This material does not constitute investment advice and is not intended as an endorsement of any specific investment.
Portfolio of Investments April 30, 2021† (Unaudited)
| | Shares | Value |
| Common Stocks 97.8% |
| Finland 3.2% |
| Nordea Bank Abp (Banks) | 978,395 | $ 10,165,863 |
| France 22.7% |
| AXA SA (Insurance) (a) | 460,691 | 13,029,692 |
| Bureau Veritas SA (Professional Services) | 394,654 | 11,800,138 |
| EssilorLuxottica SA (Textiles, Apparel & Luxury Goods) | 40,890 | 6,803,744 |
| Kering SA (Textiles, Apparel & Luxury Goods) | 5,961 | 4,776,547 |
| Pernod Ricard SA (Beverages) | 35,928 | 7,373,291 |
| Sanofi (Pharmaceuticals) (a) | 87,355 | 9,165,318 |
| Schneider Electric SE (Electrical Equipment) (a) | 56,159 | 8,981,133 |
| Ubisoft Entertainment SA (Entertainment) (b) | 126,426 | 9,493,649 |
| | | 71,423,512 |
| Italy 2.0% |
| Enel SpA (Electric Utilities) | 625,754 | 6,219,369 |
| Japan 18.2% |
| Asahi Group Holdings Ltd. (Beverages) | 188,400 | 7,869,393 |
| Hoya Corp. (Health Care Equipment & Supplies) | 72,400 | 8,237,661 |
| Keyence Corp. (Electronic Equipment, Instruments & Components) | 16,400 | 7,881,124 |
| SoftBank Group Corp. (Wireless Telecommunication Services) | 75,600 | 6,837,826 |
| Sony Group Corp. (Household Durables) | 83,800 | 8,357,764 |
| Takeda Pharmaceutical Co. Ltd. (Pharmaceuticals) | 306,500 | 10,194,231 |
| Toyota Industries Corp. (Auto Components) | 96,000 | 7,685,973 |
| | | 57,063,972 |
| Macao 2.9% |
| Sands China Ltd. (Hotels, Restaurants & Leisure) | 1,903,100 | 9,040,506 |
| Netherlands 10.1% |
| Akzo Nobel NV (Chemicals) | 60,995 | 7,327,258 |
| ASML Holding NV (Semiconductors & Semiconductor Equipment) | 13,565 | 8,826,172 |
| Koninklijke DSM NV (Chemicals) | 29,644 | 5,317,413 |
| | Shares | Value |
| |
| Netherlands (continued) |
| Koninklijke Philips NV (Health Care Equipment & Supplies) | 184,274 | $ 10,385,955 |
| | | 31,856,798 |
| Republic of Korea 2.5% |
| Samsung Electronics Co. Ltd. GDR (Technology Hardware, Storage & Peripherals) | 4,380 | 7,975,980 |
| Spain 5.3% |
| Cellnex Telecom SA (Diversified Telecommunication Services) | 157,290 | 8,895,353 |
| Industria de Diseno Textil SA (Specialty Retail) (a) | 216,491 | 7,709,384 |
| | | 16,604,737 |
| Switzerland 9.8% |
| ABB Ltd. (Registered) (Electrical Equipment) | 313,939 | 10,192,490 |
| STMicroelectronics NV (Semiconductors & Semiconductor Equipment) | 222,296 | 8,327,677 |
| Swiss Re AG (Insurance) | 131,809 | 12,250,696 |
| | | 30,770,863 |
| Taiwan 2.5% |
| Taiwan Semiconductor Manufacturing Co. Ltd., Sponsored ADR (Semiconductors & Semiconductor Equipment) | 67,356 | 7,863,139 |
| United Kingdom 15.4% |
| Coca-Cola European Partners plc (Beverages) | 175,255 | 9,957,989 |
| Croda International plc (Chemicals) | 66,720 | 6,232,597 |
| InterContinental Hotels Group plc (Hotels, Restaurants & Leisure) | 98,369 | 6,999,121 |
| Linde plc (Chemicals) | 31,831 | 9,098,573 |
| Rentokil Initial plc (Commercial Services & Supplies) | 1,379,936 | 9,536,426 |
| Unilever plc (Personal Products) | 112,360 | 6,566,221 |
| | | 48,390,927 |
| United States 3.2% |
| Willis Towers Watson plc (Insurance) | 38,127 | 9,869,555 |
Total Common Stocks
(Cost $247,924,964) | | 307,245,221 |
The notes to the financial statements are an integral part of, and should be read in conjunction with, the financial statements.
| 12 | MainStay Epoch International Choice Fund |
| | Shares | | Value |
| Short-Term Investments 13.5% |
| Affiliated Investment Company 0.7% |
| United States 0.7% |
| MainStay U.S. Government Liquidity Fund, 0.01% (c) | 2,160,928 | | $ 2,160,928 |
| Unaffiliated Investment Company 12.8% |
| United States 12.8% |
| BlackRock Liquidity FedFund, 0.05% (c)(d) | 40,195,171 | | 40,195,171 |
Total Short-Term Investments
(Cost $42,356,099) | | | 42,356,099 |
Total Investments
(Cost $290,281,063) | 111.3% | | 349,601,320 |
| Other Assets, Less Liabilities | (11.3) | | (35,373,755) |
| Net Assets | 100.0% | | $ 314,227,565 |
| † | Percentages indicated are based on Fund net assets. |
| (a) | All or a portion of this security was held on loan. As of April 30, 2021, the aggregate market value of securities on loan was $37,918,987. The Fund received cash collateral with a value of $40,195,171. (See Note 2(H)) |
| (b) | Non-income producing security. |
| (c) | Current yield as of April 30, 2021. |
| (d) | Represents a security purchased with cash collateral received for securities on loan. |
| Abbreviation(s): |
| ADR—American Depositary Receipt |
| GDR—Global Depositary Receipt |
The following is a summary of the fair valuations according to the inputs used as of April 30, 2021, for valuing the Fund’s assets:
| Description | Quoted
Prices in
Active
Markets for
Identical
Assets
(Level 1) | | Significant
Other
Observable
Inputs
(Level 2) | | Significant
Unobservable
Inputs
(Level 3) | | Total |
| Asset Valuation Inputs | | | | | | | |
| Investments in Securities (a) | | | | | | | |
| Common Stocks | $ 307,245,221 | | $ — | | $ — | | $ 307,245,221 |
| Short-Term Investments | | | | | | | |
| Affiliated Investment Company | 2,160,928 | | — | | — | | 2,160,928 |
| Unaffiliated Investment Company | 40,195,171 | | — | | — | | 40,195,171 |
| Total Short-Term Investments | 42,356,099 | | — | | — | | 42,356,099 |
| Total Investments in Securities | $ 349,601,320 | | $ — | | $ — | | $ 349,601,320 |
| (a) | For a complete listing of investments and their industries, see the Portfolio of Investments. |
The notes to the financial statements are an integral part of, and should be read in conjunction with, the financial statements.
13
Portfolio of Investments April 30, 2021† (Unaudited) (continued)
The table below sets forth the diversification of the Fund’s investments by industry.
Industry Diversification
| | Value | | Percent |
| Auto Components | $ 7,685,973 | | 2.5% |
| Banks | 10,165,863 | | 3.2 |
| Beverages | 25,200,673 | | 8.0 |
| Chemicals | 27,975,841 | | 8.9 |
| Commercial Services & Supplies | 9,536,426 | | 3.0 |
| Diversified Telecommunication Services | 8,895,353 | | 2.8 |
| Electric Utilities | 6,219,369 | | 2.0 |
| Electrical Equipment | 19,173,623 | | 6.1 |
| Electronic Equipment, Instruments & Components | 7,881,124 | | 2.5 |
| Entertainment | 9,493,649 | | 3.0 |
| Health Care Equipment & Supplies | 18,623,616 | | 5.9 |
| Hotels, Restaurants & Leisure | 16,039,627 | | 5.1 |
| Household Durables | 8,357,764 | | 2.7 |
| Insurance | 35,149,943 | | 11.2 |
| Personal Products | 6,566,221 | | 2.1 |
| Pharmaceuticals | 19,359,549 | | 6.1 |
| Professional Services | 11,800,138 | | 3.8 |
| Semiconductors & Semiconductor Equipment | 25,016,988 | | 8.0 |
| Specialty Retail | 7,709,384 | | 2.5 |
| Technology Hardware, Storage & Peripherals | 7,975,980 | | 2.5 |
| Textiles, Apparel & Luxury Goods | 11,580,291 | | 3.7 |
| Wireless Telecommunication Services | 6,837,826 | | 2.2 |
| | 307,245,221 | | 97.8 |
| Short-Term Investments | 42,356,099 | | 13.5 |
| Other Assets, Less Liabilities | (35,373,755) | | (11.3) |
| Net Assets | $314,227,565 | | 100.0% |
| † | Percentages indicated are based on Fund net assets. |
The notes to the financial statements are an integral part of, and should be read in conjunction with, the financial statements.
| 14 | MainStay Epoch International Choice Fund |
Statement of Assets and Liabilities as of April 30, 2021 (Unaudited)
| Assets |
Investment in unaffiliated securities, at value
(identified cost $288,120,135) including securities on loan of $37,918,987 | $347,440,392 |
Investment in affiliated investment companies, at value
(identified cost $2,160,928) | 2,160,928 |
Cash denominated in foreign currencies
(identified cost $1,566,073) | 1,562,037 |
| Receivables: | |
| Dividends and interest | 3,647,379 |
| Fund shares sold | 103,342 |
| Securities lending | 1,222 |
| Other assets | 64,070 |
| Total assets | 354,979,370 |
| Liabilities |
| Cash collateral received for securities on loan | 40,195,171 |
| Due to custodian | 6,836 |
| Payables: | |
| Manager (See Note 3) | 203,911 |
| Fund shares redeemed | 202,421 |
| Professional fees | 39,624 |
| Transfer agent (See Note 3) | 38,595 |
| Custodian | 30,345 |
| Shareholder communication | 21,786 |
| NYLIFE Distributors (See Note 3) | 13,116 |
| Total liabilities | 40,751,805 |
| Net assets | $314,227,565 |
| Composition of Net Assets |
| Shares of beneficial interest outstanding (par value of $.001 per share) unlimited number of shares authorized | $ 7,579 |
| Additional paid-in-capital | 339,035,577 |
| | 339,043,156 |
| Total distributable earnings (loss) | (24,815,591) |
| Net assets | $314,227,565 |
| Class A | |
| Net assets applicable to outstanding shares | $ 27,328,481 |
| Shares of beneficial interest outstanding | 658,597 |
| Net asset value per share outstanding | $ 41.49 |
| Maximum sales charge (5.50% of offering price) | 2.41 |
| Maximum offering price per share outstanding | $ 43.90 |
| Investor Class | |
| Net assets applicable to outstanding shares | $ 5,831,470 |
| Shares of beneficial interest outstanding | 140,704 |
| Net asset value per share outstanding | $ 41.44 |
| Maximum sales charge (5.00% of offering price) | 2.18 |
| Maximum offering price per share outstanding | $ 43.62 |
| Class C | |
| Net assets applicable to outstanding shares | $ 1,507,439 |
| Shares of beneficial interest outstanding | 37,190 |
| Net asset value and offering price per share outstanding | $ 40.53 |
| Class I | |
| Net assets applicable to outstanding shares | $265,888,007 |
| Shares of beneficial interest outstanding | 6,412,542 |
| Net asset value and offering price per share outstanding | $ 41.46 |
| Class R1 | |
| Net assets applicable to outstanding shares | $ 188,137 |
| Shares of beneficial interest outstanding | 4,549 |
| Net asset value and offering price per share outstanding | $ 41.36 |
| Class R2 | |
| Net assets applicable to outstanding shares | $ 8,901,023 |
| Shares of beneficial interest outstanding | 214,550 |
| Net asset value and offering price per share outstanding | $ 41.49 |
| Class R3 | |
| Net assets applicable to outstanding shares | $ 4,554,121 |
| Shares of beneficial interest outstanding | 110,412 |
| Net asset value and offering price per share outstanding | $ 41.25 |
| SIMPLE Class | |
| Net assets applicable to outstanding shares | $ 28,887 |
| Shares of beneficial interest outstanding | 696 |
| Net asset value and offering price per share outstanding | $ 41.50 |
The notes to the financial statements are an integral part of, and should be read in conjunction with, the financial statements.
15
Statement of Operations for the six months ended April 30, 2021 (Unaudited)
| Investment Income (Loss) |
| Income | |
| Dividends-unaffiliated (net of foreign tax withholding of $399,862) | $ 2,697,105 |
| Securities lending | 2,133 |
| Dividends-affiliated | 194 |
| Interest | 117 |
| Total income | 2,699,549 |
| Expenses | |
| Manager (See Note 3) | 1,285,765 |
| Transfer agent (See Note 3) | 114,193 |
| Distribution/Service—Class A (See Note 3) | 30,447 |
| Distribution/Service—Investor Class (See Note 3) | 7,293 |
| Distribution/Service—Class C (See Note 3) | 18,165 |
| Distribution/Service—Class R2 (See Note 3) | 11,221 |
| Distribution/Service—Class R3 (See Note 3) | 11,452 |
| Distribution/Service—SIMPLE Class (See Note 3) | 68 |
| Registration | 50,458 |
| Professional fees | 41,897 |
| Custodian | 37,429 |
| Shareholder communication | 15,068 |
| Shareholder service (See Note 3) | 6,908 |
| Trustees | 3,562 |
| Insurance | 1,761 |
| Miscellaneous | 15,115 |
| Total expenses before waiver/reimbursement | 1,650,802 |
| Expense waiver/reimbursement from Manager (See Note 3) | (23,525) |
| Net expenses | 1,627,277 |
| Net investment income (loss) | 1,072,272 |
| Realized and Unrealized Gain (Loss) |
| Net realized gain (loss) on: | |
| Unaffiliated investment transactions | 37,213,865 |
| Foreign currency transactions | (35,080) |
| Net realized gain (loss) | 37,178,785 |
| Net change in unrealized appreciation (depreciation) on: | |
| Unaffiliated investments | 30,328,008 |
| Translation of other assets and liabilities in foreign currencies | 11,917 |
| Net change in unrealized appreciation (depreciation) | 30,339,925 |
| Net realized and unrealized gain (loss) | 67,518,710 |
| Net increase (decrease) in net assets resulting from operations | $68,590,982 |
The notes to the financial statements are an integral part of, and should be read in conjunction with, the financial statements.
| 16 | MainStay Epoch International Choice Fund |
Statements of Changes in Net Assets
for the six months ended April 30, 2021 (Unaudited) and the year ended October 31, 2020
| | 2021 | 2020 |
| Increase (Decrease) in Net Assets |
| Operations: | | |
| Net investment income (loss) | $ 1,072,272 | $ 2,470,985 |
| Net realized gain (loss) | 37,178,785 | 22,742,759 |
| Net change in unrealized appreciation (depreciation) | 30,339,925 | (32,190,752) |
| Net increase (decrease) in net assets resulting from operations | 68,590,982 | (6,977,008) |
| Distributions to shareholders: | | |
| Class A | (107,083) | (593,066) |
| Investor Class | (14,596) | (147,791) |
| Class C | — | (96,034) |
| Class I | (2,007,419) | (9,881,928) |
| Class R1 | (1,681) | (6,332) |
| Class R2 | (33,206) | (264,219) |
| Class R3 | (7,839) | (114,342) |
| Total distributions to shareholders | (2,171,824) | (11,103,712) |
| Capital share transactions: | | |
| Net proceeds from sales of shares | 10,088,620 | 11,259,590 |
| Net asset value of shares issued to shareholder in reinvestment of distributions | 2,142,672 | 10,980,506 |
| Cost of shares redeemed | (60,052,007) | (115,962,014) |
| Increase (decrease) in net assets derived from capital share transactions | (47,820,715) | (93,721,918) |
| Net increase (decrease) in net assets | 18,598,443 | (111,802,638) |
| Net Assets |
| Beginning of period | 295,629,122 | 407,431,760 |
| End of period | $314,227,565 | $ 295,629,122 |
The notes to the financial statements are an integral part of, and should be read in conjunction with, the financial statements.
17
Financial Highlights selected per share data and ratios
| | Six months ended
April 30,
2021* | | Year Ended October 31, |
| Class A | 2020 | | 2019 | | 2018 | | 2017 | | 2016 |
| Net asset value at beginning of period | $ 33.68 | | $ 35.57 | | $ 33.37 | | $ 36.20 | | $ 30.39 | | $ 32.22 |
| Net investment income (loss) (a) | 0.11 | | 0.17 | | 0.74 | | 0.50 | | 0.34 | | 0.40 |
| Net realized and unrealized gain (loss) on investments | 7.88 | | (1.13) | | 1.95 | | (2.93) | | 6.41 | | (1.83) |
| Net realized and unrealized gain (loss) on foreign currency transactions | (0.00)‡ | | (0.01) | | 0.01 | | (0.01) | | 0.00‡ | | (0.01) |
| Total from investment operations | 7.99 | | (0.97) | | 2.70 | | (2.44) | | 6.75 | | (1.44) |
| Less distributions: | | | | | | | | | | | |
| From net investment income | (0.18) | | (0.92) | | (0.50) | | (0.39) | | (0.94) | | (0.39) |
| Net asset value at end of period | $ 41.49 | | $ 33.68 | | $ 35.57 | | $ 33.37 | | $ 36.20 | | $ 30.39 |
| Total investment return (b) | 23.77% | | (2.87)% | | 8.30% | | (6.82)% | | 22.95% | | (4.49)% |
| Ratios (to average net assets)/Supplemental Data: | | | | | | | | | | | |
| Net investment income (loss) | 0.58%†† | | 0.48% | | 2.19% | | 1.40% | | 1.05% | | 1.32% |
| Net expenses (c) | 1.22%†† | | 1.20% (d) | | 1.19% (d) | | 1.18% (d) | | 1.23% | | 1.24% (d) |
| Portfolio turnover rate | 25% | | 52% | | 47% | | 44% | | 8% | | 46% |
| Net assets at end of period (in 000’s) | $ 27,328 | | $ 20,108 | | $ 23,114 | | $ 23,409 | | $ 33,997 | | $ 36,584 |
| * | Unaudited. |
| ‡ | Less than one cent per share. |
| †† | Annualized. |
| (a) | Per share data based on average shares outstanding during the period. |
| (b) | Total investment return is calculated exclusive of sales charges and assumes the reinvestment of dividends and distributions. For periods of less than one year, total return is not annualized. |
| (c) | In addition to the fees and expenses which the Fund bears directly, it also indirectly bears a pro-rata share of the fees and expenses of the underlying funds in which it invests. Such indirect expenses are not included in the above expense ratios. |
| (d) | Net of interest expense of less than 0.01%. (See Note 6) |
| | Six months ended
April 30,
2021* | | Year Ended October 31, |
| Investor Class | 2020 | | 2019 | | 2018 | | 2017 | | 2016 |
| Net asset value at beginning of period | $ 33.60 | | $ 35.49 | | $ 33.30 | | $ 36.13 | | $ 30.36 | | $ 32.19 |
| Net investment income (loss) (a) | 0.05 | | 0.08 | | 0.66 | | 0.45 | | 0.30 | | 0.37 |
| Net realized and unrealized gain (loss) on investments | 7.88 | | (1.12) | | 1.94 | | (2.95) | | 6.39 | | (1.84) |
| Net realized and unrealized gain (loss) on foreign currency transactions | (0.00)‡ | | (0.01) | | 0.01 | | (0.01) | | 0.00‡ | | (0.01) |
| Total from investment operations | 7.93 | | (1.05) | | 2.61 | | (2.51) | | 6.69 | | (1.48) |
| Less distributions: | | | | | | | | | | | |
| From net investment income | (0.09) | | (0.84) | | (0.42) | | (0.32) | | (0.92) | | (0.35) |
| Net asset value at end of period | $ 41.44 | | $ 33.60 | | $ 35.49 | | $ 33.30 | | $ 36.13 | | $ 30.36 |
| Total investment return (b) | 23.63% | | (3.10)% | | 8.02% | | (7.00)% | | 22.74% | | (4.63)% |
| Ratios (to average net assets)/Supplemental Data: | | | | | | | | | | | |
| Net investment income (loss) | 0.23%†† | | 0.23% | | 1.97% | | 1.27% | | 0.92% | | 1.24% |
| Net expenses (c) | 1.46%†† | | 1.46% (d) | | 1.41% (d) | | 1.38% (d) | | 1.39% | | 1.39% (d) |
| Expenses (before waiver/reimbursement) (c) | 1.46%†† | | 1.46% (d) | | 1.42% (d) | | 1.38% (d) | | 1.39% | | 1.39% (d) |
| Portfolio turnover rate | 25% | | 52% | | 47% | | 44% | | 8% | | 46% |
| Net assets at end of period (in 000’s) | $ 5,831 | | $ 5,308 | | $ 6,306 | | $ 5,901 | | $ 6,757 | | $ 7,802 |
| * | Unaudited. |
| ‡ | Less than one cent per share. |
| †† | Annualized. |
| (a) | Per share data based on average shares outstanding during the period. |
| (b) | Total investment return is calculated exclusive of sales charges and assumes the reinvestment of dividends and distributions. For periods of less than one year, total return is not annualized. |
| (c) | In addition to the fees and expenses which the Fund bears directly, it also indirectly bears a pro-rata share of the fees and expenses of the underlying funds in which it invests. Such indirect expenses are not included in the above expense ratios. |
| (d) | Net of interest expense of less than 0.01%. (See Note 6) |
The notes to the financial statements are an integral part of, and should be read in conjunction with, the financial statements.
| 18 | MainStay Epoch International Choice Fund |
Financial Highlights selected per share data and ratios
| | Six months ended
April 30,
2021* | | Year Ended October 31, |
| Class C | 2020 | | 2019 | | 2018 | | 2017 | | 2016 |
| Net asset value at beginning of period | $ 32.90 | | $ 34.73 | | $ 32.54 | | $ 35.41 | | $ 29.74 | | $ 31.52 |
| Net investment income (loss) (a) | (0.19) | | (0.17) | | 0.42 | | 0.19 | | 0.04 | | 0.14 |
| Net realized and unrealized gain (loss) on investments | 7.82 | | (1.12) | | 1.91 | | (2.99) | | 6.30 | | (1.81) |
| Net realized and unrealized gain (loss) on foreign currency transactions | (0.00)‡ | | (0.01) | | 0.01 | | (0.01) | | 0.00‡ | | (0.01) |
| Total from investment operations | 7.63 | | (1.30) | | 2.34 | | (2.81) | | 6.34 | | (1.68) |
| Less distributions: | | | | | | | | | | | |
| From net investment income | — | | (0.53) | | (0.15) | | (0.06) | | (0.67) | | (0.10) |
| Net asset value at end of period | $ 40.53 | | $ 32.90 | | $ 34.73 | | $ 32.54 | | $ 35.41 | | $ 29.74 |
| Total investment return (b) | 23.15% | | (3.81)% | | 7.25% | | (7.96)% | | 21.82% | | (5.35)% |
| Ratios (to average net assets)/Supplemental Data: | | | | | | | | | | | |
| Net investment income (loss) | (0.99)%†† | | (0.51)% | | 1.27% | | 0.53% | | 0.13% | | 0.47% |
| Net expenses (c) | 2.21%†† | | 2.21% (d) | | 2.16% (d) | | 2.13% (d) | | 2.14% | | 2.14% (d) |
| Expenses (before waiver/reimbursement) (c) | 2.21%†† | | 2.21% (d) | | 2.17% (d) | | 2.13% (d) | | 2.14% | | 2.14% (d) |
| Portfolio turnover rate | 25% | | 52% | | 47% | | 44% | | 8% | | 46% |
| Net assets at end of period (in 000’s) | $ 1,507 | | $ 4,740 | | $ 6,416 | | $ 9,354 | | $ 11,625 | | $ 12,156 |
| * | Unaudited. |
| ‡ | Less than one cent per share. |
| †† | Annualized. |
| (a) | Per share data based on average shares outstanding during the period. |
| (b) | Total investment return is calculated exclusive of sales charges and assumes the reinvestment of dividends and distributions. For periods of less than one year, total return is not annualized. |
| (c) | In addition to the fees and expenses which the Fund bears directly, it also indirectly bears a pro-rata share of the fees and expenses of the underlying funds in which it invests. Such indirect expenses are not included in the above expense ratios. |
| (d) | Net of interest expense of less than 0.01%. (See Note 6) |
| | Six months ended
April 30,
2021* | | Year Ended October 31, |
| Class I | 2020 | | 2019 | | 2018 | | 2017 | | 2016 |
| Net asset value at beginning of period | $ 33.69 | | $ 35.58 | | $ 33.40 | | $ 36.25 | | $ 30.46 | | $ 32.30 |
| Net investment income (loss) (a) | 0.14 | | 0.26 | | 0.80 | | 0.60 | | 0.39 | | 0.54 |
| Net realized and unrealized gain (loss) on investments | 7.90 | | (1.13) | | 1.97 | | (2.95) | | 6.45 | | (1.88) |
| Net realized and unrealized gain (loss) on foreign currency transactions | (0.00)‡ | | (0.01) | | 0.01 | | (0.01) | | 0.00‡ | | (0.01) |
| Total from investment operations | 8.04 | | (0.88) | | 2.78 | | (2.36) | | 6.84 | | (1.35) |
| Less distributions: | | | | | | | | | | | |
| From net investment income | (0.27) | | (1.01) | | (0.60) | | (0.49) | | (1.05) | | (0.49) |
| Net asset value at end of period | $ 41.46 | | $ 33.69 | | $ 35.58 | | $ 33.40 | | $ 36.25 | | $ 30.46 |
| Total investment return (b) | 23.93% | | (2.61)% | | 8.57% | | (6.62)% | | 23.29% | | (4.21)% |
| Ratios (to average net assets)/Supplemental Data: | | | | | | | | | | | |
| Net investment income (loss) | 0.72%†† | | 0.76% | | 2.40% | | 1.67% | | 1.21% | | 1.81% |
| Net expenses (c) | 0.95%†† | | 0.95% (d) | | 0.94% (d) | | 0.93% (d) | | 0.95% | | 0.95% (d) |
| Expenses (before waiver/reimbursement) (c) | 0.97%†† | | 0.96% (d) | | 0.94% (d) | | 0.93% (d) | | 0.99% | | 0.99% (d) |
| Portfolio turnover rate | 25% | | 52% | | 47% | | 44% | | 8% | | 46% |
| Net assets at end of period (in 000’s) | $ 265,888 | | $ 252,974 | | $ 355,348 | | $ 479,523 | | $ 549,162 | | $ 753,205 |
| * | Unaudited. |
| ‡ | Less than one cent per share. |
| †† | Annualized. |
| (a) | Per share data based on average shares outstanding during the period. |
| (b) | Total investment return is calculated exclusive of sales charges and assumes the reinvestment of dividends and distributions. Class I shares are not subject to sales charges. For periods of less than one year, total return is not annualized. |
| (c) | In addition to the fees and expenses which the Fund bears directly, it also indirectly bears a pro-rata share of the fees and expenses of the underlying funds in which it invests. Such indirect expenses are not included in the above expense ratios. |
| (d) | Net of interest expense of less than 0.01%. (See Note 6) |
The notes to the financial statements are an integral part of, and should be read in conjunction with, the financial statements.
19
Financial Highlights selected per share data and ratios
| | Six months ended
April 30,
2021* | | Year Ended October 31, |
| Class R1 | 2020 | | 2019 | | 2018 | | 2017 | | 2016 |
| Net asset value at beginning of period | $ 33.60 | | $ 35.48 | | $ 33.30 | | $ 36.18 | | $ 30.39 | | $ 32.23 |
| Net investment income (loss) (a) | 0.14 | | 0.21 | | 0.81 | | 0.64 | | 0.36 | | 0.49 |
| Net realized and unrealized gain (loss) on investments | 7.88 | | (1.11) | | 1.92 | | (3.02) | | 6.44 | | (1.86) |
| Net realized and unrealized gain (loss) on foreign currency transactions | (0.01) | | (0.01) | | 0.01 | | (0.02) | | 0.00‡ | | (0.01) |
| Total from investment operations | 8.01 | | (0.91) | | 2.74 | | (2.40) | | 6.80 | | (1.38) |
| Less distributions: | | | | | | | | | | | |
| From net investment income | (0.25) | | (0.97) | | (0.56) | | (0.48) | | (1.01) | | (0.46) |
| Net asset value at end of period | $ 41.36 | | $ 33.60 | | $ 35.48 | | $ 33.30 | | $ 36.18 | | $ 30.39 |
| Total investment return (b) | 23.88% | | (2.69)% | | 8.45% | | (6.72)% | | 23.16% | | (4.33)% |
| Ratios (to average net assets)/Supplemental Data: | | | | | | | | | | | |
| Net investment income (loss) | 0.69%†† | | 0.63% | | 2.43% | | 1.79% | | 1.14% | | 1.62% |
| Net expenses (c) | 1.05%†† | | 1.05% (d) | | 1.04% (d) | | 1.03% (d) | | 1.05% | | 1.05% (d) |
| Expenses (before waiver/reimbursement) (c) | 1.07%†† | | 1.06% (d) | | 1.04% (d) | | 1.03% (d) | | 1.12% | | 1.09% (d) |
| Portfolio turnover rate | 25% | | 52% | | 47% | | 44% | | 8% | | 46% |
| Net assets at end of period (in 000’s) | $ 188 | | $ 201 | | $ 230 | | $ 229 | | $ 257 | | $ 1,330 |
| * | Unaudited. |
| ‡ | Less than one cent per share. |
| †† | Annualized. |
| (a) | Per share data based on average shares outstanding during the period. |
| (b) | Total investment return is calculated exclusive of sales charges and assumes the reinvestment of dividends and distributions. Class R1 shares are not subject to sales charges. For periods of less than one year, total return is not annualized. |
| (c) | In addition to the fees and expenses which the Fund bears directly, it also indirectly bears a pro-rata share of the fees and expenses of the underlying funds in which it invests. Such indirect expenses are not included in the above expense ratios. |
| (d) | Net of interest expense of less than 0.01%. (See Note 6) |
| | Six months ended
April 30,
2021* | | Year Ended October 31, |
| Class R2 | 2020 | | 2019 | | 2018 | | 2017 | | 2016 |
| Net asset value at beginning of period | $ 33.65 | | $ 35.54 | | $ 33.33 | | $ 36.16 | | $ 30.37 | | $ 32.19 |
| Net investment income (loss) (a) | 0.08 | | 0.13 | | 0.71 | | 0.48 | | 0.31 | | 0.40 |
| Net realized and unrealized gain (loss) on investments | 7.90 | | (1.13) | | 1.95 | | (2.95) | | 6.41 | | (1.85) |
| Net realized and unrealized gain (loss) on foreign currency transactions | (0.00)‡ | | (0.01) | | 0.01 | | (0.01) | | 0.00‡ | | (0.01) |
| Total from investment operations | 7.98 | | (1.01) | | 2.67 | | (2.48) | | 6.72 | | (1.46) |
| Less distributions: | | | | | | | | | | | |
| From net investment income | (0.14) | | (0.88) | | (0.46) | | (0.35) | | (0.93) | | (0.36) |
| Net asset value at end of period | $ 41.49 | | $ 33.65 | | $ 35.54 | | $ 33.33 | | $ 36.16 | | $ 30.37 |
| Total investment return (b) | 23.75% | | (2.94)% | | 8.17% | | (6.92)% | | 22.83% | | (4.55)% |
| Ratios (to average net assets)/Supplemental Data: | | | | | | | | | | | |
| Net investment income (loss) | 0.40%†† | | 0.39% | | 2.12% | | 1.33% | | 0.96% | | 1.32% |
| Net expenses (c) | 1.30%†† | | 1.30% (d) | | 1.29% (d) | | 1.28% (d) | | 1.30% | | 1.30% (d) |
| Expenses (before waiver/reimbursement) (c) | 1.32%†† | | 1.31% (d) | | 1.29% (d) | | 1.28% (d) | | 1.34% | | 1.34% (d) |
| Portfolio turnover rate | 25% | | 52% | | 47% | | 44% | | 8% | | 46% |
| Net assets at end of period (in 000’s) | $ 8,901 | | $ 7,827 | | $ 10,884 | | $ 14,656 | | $ 23,119 | | $ 34,189 |
| * | Unaudited. |
| ‡ | Less than one cent per share. |
| †† | Annualized. |
| (a) | Per share data based on average shares outstanding during the period. |
| (b) | Total investment return is calculated exclusive of sales charges and assumes the reinvestment of dividends and distributions. Class R2 shares are not subject to sales charges. For periods of less than one year, total return is not annualized. |
| (c) | In addition to the fees and expenses which the Fund bears directly, it also indirectly bears a pro-rata share of the fees and expenses of the underlying funds in which it invests. Such indirect expenses are not included in the above expense ratios. |
| (d) | Net of interest expense of less than 0.01%. (See Note 6) |
The notes to the financial statements are an integral part of, and should be read in conjunction with, the financial statements.
| 20 | MainStay Epoch International Choice Fund |
Financial Highlights selected per share data and ratios
| | Six months ended
April 30,
2021* | | Year Ended October 31, |
| Class R3 | 2020 | | 2019 | | 2018 | | 2017 | | 2016 |
| Net asset value at beginning of period | $ 33.43 | | $ 35.31 | | $ 33.10 | | $ 35.90 | | $ 30.13 | | $ 31.94 |
| Net investment income (loss) (a) | 0.02 | | 0.04 | | 0.62 | | 0.40 | | 0.24 | | 0.31 |
| Net realized and unrealized gain (loss) on investments | 7.86 | | (1.12) | | 1.94 | | (2.94) | | 6.36 | | (1.84) |
| Net realized and unrealized gain (loss) on foreign currency transactions | (0.00)‡ | | (0.01) | | 0.01 | | (0.01) | | 0.00‡ | | (0.01) |
| Total from investment operations | 7.88 | | (1.09) | | 2.57 | | (2.55) | | 6.60 | | (1.54) |
| Less distributions: | | | | | | | | | | | |
| From net investment income | (0.06) | | (0.79) | | (0.36) | | (0.25) | | (0.83) | | (0.27) |
| Net asset value at end of period | $ 41.25 | | $ 33.43 | | $ 35.31 | | $ 33.10 | | $ 35.90 | | $ 30.13 |
| Total investment return (b) | 23.58% | | (3.21)% | | 7.90% | | (7.15)% | | 22.53% | | (4.84)% |
| Ratios (to average net assets)/Supplemental Data: | | | | | | | | | | | |
| Net investment income (loss) | 0.10%†† | | 0.12% | | 1.85% | | 1.13% | | 0.74% | | 1.03% |
| Net expenses (c) | 1.57%†† | | 1.55% (d) | | 1.54% (d) | | 1.53% (d) | | 1.59% | | 1.59% (d) |
| Portfolio turnover rate | 25% | | 52% | | 47% | | 44% | | 8% | | 46% |
| Net assets at end of period (in 000’s) | $ 4,554 | | $ 4,447 | | $ 5,134 | | $ 5,609 | | $ 7,360 | | $ 9,011 |
| * | Unaudited. |
| ‡ | Less than one cent per share. |
| †† | Annualized. |
| (a) | Per share data based on average shares outstanding during the period. |
| (b) | Total investment return is calculated exclusive of sales charges and assumes the reinvestment of dividends and distributions. Class R3 shares are not subject to sales charges. For periods of less than one year, total return is not annualized. |
| (c) | In addition to the fees and expenses which the Fund bears directly, it also indirectly bears a pro-rata share of the fees and expenses of the underlying funds in which it invests. Such indirect expenses are not included in the above expense ratios. |
| (d) | Net of interest expense of less than 0.01%. (See Note 6) |
| | Six months ended
April 30,
2021* | | August 31, 2020^ through
October 31, |
| SIMPLE Class | 2020 |
| Net asset value at beginning of period | $ 33.59 | | $ 35.90 |
| Net investment income (loss) (a) | 0.01 | | (0.02) |
| Net realized and unrealized gain (loss) on investments | 7.91 | | (2.27) |
| Net realized and unrealized gain (loss) on foreign currency transactions | (0.01) | | (0.02) |
| Total from investment operations | 7.91 | | (2.31) |
| Net asset value at end of period | $ 41.50 | | $ 33.59 |
| Total investment return (b) | 23.49% | | (6.43)% |
| Ratios (to average net assets)/Supplemental Data: | | | |
| Net investment income (loss)†† | 0.03% | | (0.29)% |
| Net expenses†† (c) | 1.71% | | 1.69% (d) |
| Portfolio turnover rate | 25% | | 52% |
| Net assets at end of period (in 000’s) | $ 29 | | $ 23 |
| * | Unaudited. |
| ^ | Inception date. |
| †† | Annualized. |
| (a) | Per share data based on average shares outstanding during the period. |
| (b) | Total investment return is calculated exclusive of sales charges and assumes the reinvestment of dividends and distributions. SIMPLE Class shares are not subject to sales charges. For periods of less than one year, total return is not annualized. |
| (c) | In addition to the fees and expenses which the Fund bears directly, it also indirectly bears a pro-rata share of the fees and expenses of the underlying funds in which it invests. Such indirect expenses are not included in the above expense ratios. |
| (d) | Net of interest expense of less than 0.01%. (See Note 6) |
The notes to the financial statements are an integral part of, and should be read in conjunction with, the financial statements.
21
Notes to Financial Statements (Unaudited)
Note 1-Organization and Business
MainStay Funds Trust (the “Trust”) was organized as a Delaware statutory trust on April 28, 2009. The Trust is registered under the Investment Company Act of 1940, as amended (the “1940 Act”), as an open-end management investment company, and is comprised of thirty-two funds (collectively referred to as the “Funds”). These financial statements and notes relate to the MainStay Epoch International Choice Fund (the "Fund"), a “diversified” fund, as that term is defined in the 1940 Act, as interpreted or modified by regulatory authorities having jurisdiction, from time to time.
The following table lists the Fund's share classes that have been registered and commenced operations:
| Class | Commenced Operations |
| Class A | September 1, 2006 |
| Investor Class | April 29, 2008 |
| Class C | September 1, 2006 |
| Class I | December 31, 1997 |
| Class R1 | September 1, 2006 |
| Class R2 | September 1, 2006 |
| Class R3 | September 1, 2006 |
| SIMPLE Class | August 31, 2020 |
| Class R6 | N/A* |
| * | Class R6 shares were registered for sale effective as of February 28, 2017 but have not yet commenced operations. |
Class A and Investor Class shares are offered at net asset value (“NAV”) per share plus an initial sales charge. No initial sales charge applies to investments of $1 million or more (and certain other qualified purchases) in Class A and Investor Class shares. However, a contingent deferred sales charge (“CDSC”) of 1.00% may be imposed on certain redemptions made within 18 months of the date of purchase on shares that were purchased without an initial sales charge. Class C shares are offered at NAV without an initial sales charge, although a 1.00% CDSC may be imposed on certain redemptions of such shares made within one year of the date of purchase of Class C shares. Class I, Class R1, Class R2, Class R3 and SIMPLE Class shares are offered at NAV without a sales charge. Class R6 shares are currently expected to be offered at NAV without a sales charge. In addition, depending upon eligibility, Class C shares convert to either Class A or Investor Class shares at the end of the calendar quarter ten years after the date they were purchased. Additionally, Investor Class shares may convert automatically to Class A shares. SIMPLE Class shares convert to Class A shares, or Investor Class shares if you are not eligible to hold Class A shares, at the end of the calendar quarter, ten years after the date they were purchased. Share class conversions are based on the relevant NAVs of the two classes at the time of the conversion, and no sales load or other charge is imposed. Under certain circumstances and as may be permitted by the Trust’s multiple class plan pursuant to Rule 18f-3 under the 1940 Act, specified share classes of the Fund may be converted to one or more other share classes of the Fund as disclosed in the capital share transactions within
these Notes. The classes of shares have the same voting (except for issues that relate solely to one class), dividend, liquidation and other rights, and the same terms and conditions, except that under distribution plans pursuant to Rule 12b-1 under the 1940 Act, Class C shares are subject to higher distribution and/or service fees than Class A, Investor Class, Class R2, Class R3 and SIMPLE Class shares. Class I, Class R1 and Class R6 shares are not subject to a distribution and/or service fee. Class R1, Class R2 and Class R3 shares are subject to a shareholder service fee, which is in addition to fees paid under the distribution plans for Class R2 and Class R3 shares.
The Fund's investment objective is to seek total return.
Note 2–Significant Accounting Policies
The Fund is an investment company and accordingly follows the investment company accounting and reporting guidance of the Financial Accounting Standards Board (“FASB”) Accounting Standard Codification Topic 946 Financial Services—Investment Companies. The Fund prepares its financial statements in accordance with generally accepted accounting principles (“GAAP”) in the United States of America and follows the significant accounting policies described below.
(A) Securities Valuation. Investments are usually valued as of the close of regular trading on the New York Stock Exchange (the "Exchange") (usually 4:00 p.m. Eastern time) on each day the Fund is open for business ("valuation date").
The Board of Trustees of the Trust (the "Board") adopted procedures establishing methodologies for the valuation of the Fund's securities and other assets and delegated the responsibility for valuation determinations under those procedures to the Valuation Committee of the Trust (the “Valuation Committee”). The procedures state that, subject to the oversight of the Board and unless otherwise noted, the responsibility for the day-to-day valuation of portfolio assets (including fair value measurements for the Fund's assets and liabilities) rests with New York Life Investment Management LLC (“New York Life Investments” or the "Manager"), aided to whatever extent necessary by the Subadvisor (as defined in Note 3(A)). To assess the appropriateness of security valuations, the Manager, the Subadvisor or the Fund's third-party service provider, who is subject to oversight by the Manager, regularly compares prior day prices, prices on comparable securities and the sale prices to the prior and current day prices and challenges prices with changes exceeding certain tolerance levels with third-party pricing services or broker sources.
The Board authorized the Valuation Committee to appoint a Valuation Subcommittee (the “Subcommittee”) to establish the prices of securities for which market quotations are not readily available or the prices of which are not otherwise readily determinable under the procedures. The Subcommittee meets (in person, via electronic mail or via teleconference) on an as-needed basis. The Valuation Committee meets to ensure that actions taken by the Subcommittee were appropriate.
| 22 | MainStay Epoch International Choice Fund |
For those securities valued through either a standardized fair valuation methodology or a fair valuation measurement, the Subcommittee deals with such valuation and the Valuation Committee reviews and affirms, if appropriate, the reasonableness of the valuation based on such methodologies and measurements on a regular basis after considering information that is reasonably available and deemed relevant by the Valuation Committee. Any action taken by the Subcommittee with respect to the valuation of a portfolio security or other asset is submitted for review and ratification (if appropriate) to the Valuation Committee and the Board at the next regularly scheduled meeting.
"Fair value" is defined as the price the Fund would reasonably expect to receive upon selling an asset or liability in an orderly transaction to an independent buyer in the principal or most advantageous market for the asset or liability. Fair value measurements are determined within a framework that establishes a three-tier hierarchy that maximizes the use of observable market data and minimizes the use of unobservable inputs to establish a classification of fair value measurements for disclosure purposes. "Inputs" refer broadly to the assumptions that market participants would use in pricing the asset or liability, including assumptions about risk, such as the risk inherent in a particular valuation technique used to measure fair value using a pricing model and/or the risk inherent in the inputs for the valuation technique. Inputs may be observable or unobservable. Observable inputs reflect the assumptions market participants would use in pricing the asset or liability based on market data obtained from sources independent of the Fund. Unobservable inputs reflect the Fund’s own assumptions about the assumptions market participants would use in pricing the asset or liability based on the information available. The inputs or methodology used for valuing assets or liabilities may not be an indication of the risks associated with investing in those assets or liabilities. The three-tier hierarchy of inputs is summarized below.
| • | Level 1—quoted prices in active markets for an identical asset or liability |
| • | Level 2—other significant observable inputs (including quoted prices for a similar asset or liability in active markets, interest rates and yield curves, prepayment speeds, credit risk, etc.) |
| • | Level 3—significant unobservable inputs (including the Fund's own assumptions about the assumptions that market participants would use in measuring fair value of an asset or liability) |
The level of an asset or liability within the fair value hierarchy is based on the lowest level of an input, both individually and in the aggregate, that is significant to the fair value measurement. The aggregate value by input level of the Fund’s assets and liabilities as of April 30, 2021, is included at the end of the Portfolio of Investments.
The Fund may use third-party vendor evaluations, whose prices may be derived from one or more of the following standard inputs, among others:
| • Broker/dealer quotes | • Benchmark securities |
| • Two-sided markets | • Reference data (corporate actions or material event notices) |
| • Bids/offers | • Monthly payment information |
| • Industry and economic events | • Reported trades |
An asset or liability for which market values cannot be measured using the methodologies described above is valued by methods deemed reasonable in good faith by the Valuation Committee, following the procedures established by the Board, to represent fair value. Under these procedures, the Fund generally uses a market-based approach which may use related or comparable assets or liabilities, recent transactions, market multiples, book values and other relevant information. The Fund may also use an income-based valuation approach in which the anticipated future cash flows of the asset or liability are discounted to calculate fair value. Discounts may also be applied due to the nature and/or duration of any restrictions on the disposition of the asset or liability. Fair value represents a good faith approximation of the value of a security. Fair value determinations involve the consideration of a number of subjective factors, an analysis of applicable facts and circumstances and the exercise of judgment. As a result, it is possible that the fair value for a security determined in good faith in accordance with the Fund's valuation procedures may differ from valuations for the same security determined by other funds using their own valuation procedures. Although the Fund's valuation procedures are designed to value a security at the price the Fund may reasonably expect to receive upon the security's sale in an orderly transaction, there can be no assurance that any fair value determination thereunder would, in fact, approximate the amount that the Fund would actually realize upon the sale of the security or the price at which the security would trade if a reliable market price were readily available. During the six-month period ended April 30, 2021, there were no material changes to the fair value methodologies.
Securities which may be valued in this manner include, but are not limited to: (i) a security for which trading has been halted or suspended; (ii) a debt security that has recently gone into default and for which there is not a current market quotation; (iii) a security of an issuer that has entered into a restructuring; (iv) a security that has been delisted from a national exchange; (v) a security for which the market price is not readily available from a third-party pricing source or, if so provided, does not, in the opinion of the Manager or the Subadvisor, reflect the security's market value; (vi) a security subject to trading collars for which no or limited trading takes place; and (vii) a security whose principal market has been temporarily closed at a time when, under normal conditions, it would be open. Securities valued in this manner are generally categorized as Level 3 in the hierarchy. No securities held by the Fund as of April 30, 2021 were fair valued in such a manner.
Certain securities held by the Fund may principally trade in foreign markets. Events may occur between the time the foreign markets close and the time at which the Fund's NAVs are calculated. These events may
Notes to Financial Statements (Unaudited) (continued)
include, but are not limited to, situations relating to a single issuer in a market sector, significant fluctuations in U.S. or foreign markets, natural disasters, armed conflicts, governmental actions or other developments not tied directly to the securities markets. Should the Manager or the Subadvisor conclude that such events may have affected the accuracy of the last price of such securities reported on the local foreign market, the Subcommittee may, pursuant to procedures adopted by the Board, adjust the value of the local price to reflect the estimated impact on the price of such securities as a result of such events. In this instance, securities are generally categorized as Level 3 in the hierarchy. Additionally, certain foreign equity securities are also fair valued whenever the movement of a particular index exceeds certain thresholds. In such cases, the securities are fair valued by applying factors provided by a third-party vendor in accordance with valuation procedures adopted by the Board and are generally categorized as Level 2 in the hierarchy. No foreign equity securities held by the Fund as of April 30, 2021 were fair valued in such a manner.
Equity securities are valued at the last quoted sales prices as of the close of regular trading on the relevant exchange on each valuation date. Securities that are not traded on the valuation date are valued at the mean of the last quoted bid and ask prices. Prices are normally taken from the principal market in which each security trades. These securities are generally categorized as Level 1 in the hierarchy.
Investments in mutual funds, including money market funds, are valued at their respective NAVs at the close of business each day on the valuation date. These securities are generally categorized as Level 1 in the hierarchy.
Temporary cash investments acquired in excess of 60 days to maturity at the time of purchase are valued using the latest bid prices or using valuations based on a matrix system (which considers such factors as security prices, yields, maturities and ratings), both as furnished by independent pricing services. Temporary cash investments that mature in 60 days or less at the time of purchase ("Short-Term Investments") are valued using the amortized cost method of valuation, unless the use of such method would be inappropriate. The amortized cost method involves valuing a security at its cost on the date of purchase and thereafter assuming a constant amortization to maturity of the difference between such cost and the value on maturity date. Amortized cost approximates the current fair value of a security. Securities valued using the amortized cost method are not valued using quoted prices in an active market and are generally categorized as Level 2 in the hierarchy.
The information above is not intended to reflect an exhaustive list of the methodologies that may be used to value portfolio investments. The valuation procedures permit the use of a variety of valuation methodologies in connection with valuing portfolio investments. The methodology used for a specific type of investment may vary based on the market data available or other considerations. The methodologies summarized above may not represent the specific means by which portfolio investments are valued on any particular business day.
(B) Income Taxes. The Fund's policy is to comply with the requirements of the Internal Revenue Code of 1986, as amended (the “Internal Revenue Code”), applicable to regulated investment companies and to distribute all of its taxable income to the shareholders of the Fund within the allowable time limits.
The Manager evaluates the Fund’s tax positions to determine if the tax positions taken meet the minimum recognition threshold in connection with accounting for uncertainties in income tax positions taken or expected to be taken for the purposes of measuring and recognizing tax liabilities in the financial statements. Recognition of tax benefits of an uncertain tax position is permitted only to the extent the position is “more likely than not” to be sustained assuming examination by taxing authorities. The Manager analyzed the Fund's tax positions taken on federal, state and local income tax returns for all open tax years (for up to three tax years) and has concluded that no provisions for federal, state and local income tax are required in the Fund's financial statements. The Fund's federal, state and local income tax and federal excise tax returns for tax years for which the applicable statutes of limitations have not expired are subject to examination by the Internal Revenue Service and state and local departments of revenue.
(C) Foreign Taxes. The Fund may be subject to foreign taxes on income and other transaction-based taxes imposed by certain countries in which it invests. A portion of the taxes on gains on investments or currency purchases/repatriation may be reclaimable. The Fund will accrue such taxes and reclaims as applicable, based upon its current interpretation of tax rules and regulations that exist in the markets in which it invests.
The Fund may be subject to taxation on realized capital gains, repatriation proceeds and other transaction-based taxes imposed by certain countries in which it invests. The Fund will accrue such taxes as applicable based upon its current interpretation of tax rules and regulations that exist in the market in which it invests. Capital gains taxes relating to positions still held are reflected as a liability in the Statement of Assets and Liabilities, as well as an adjustment to the Fund's net unrealized appreciation (depreciation). Taxes related to capital gains realized, if any, are reflected as part of net realized gain (loss) in the Statement of Operations. Changes in tax liabilities related to capital gains taxes on unrealized investment gains, if any, are reflected as part of the change in net unrealized appreciation (depreciation) on investments in the Statement of Operations. Transaction-based charges are generally assessed as a percentage of the transaction amount.
(D) Dividends and Distributions to Shareholders. Dividends and distributions are recorded on the ex-dividend date. The Fund intends to declare and pay dividends from net investment income and distributions from net realized capital and currency gains, if any, at least annually. Unless a shareholder elects otherwise, all dividends and distributions are reinvested at NAV in the same class of shares of the Fund. Dividends and distributions to shareholders are determined in accordance with federal income tax regulations and may differ from determinations using GAAP.
| 24 | MainStay Epoch International Choice Fund |
(E) Security Transactions and Investment Income. The Fund records security transactions on the trade date. Realized gains and losses on security transactions are determined using the identified cost method. Dividend income is recognized on the ex-dividend date, net of any foreign tax withheld at the source, and interest income is accrued as earned using the effective interest rate method. Distributions received from real estate investment trusts may be classified as dividends, capital gains and/or return of capital. Discounts and premiums on securities purchased for the Fund are accreted and amortized, respectively, on the effective interest rate method over the life of the respective securities.
Investment income and realized and unrealized gains and losses on investments of the Fund are allocated pro rata to the separate classes of shares based upon their relative net assets on the date the income is earned or realized and unrealized gains and losses are incurred.
(F) Expenses. Expenses of the Trust are allocated to the individual Funds in proportion to the net assets of the respective Funds when the expenses are incurred, except where direct allocations of expenses can be made. Expenses (other than transfer agent expenses and fees incurred under the shareholder services plans and/or the distribution plans further discussed in Note 3(B)) are allocated to separate classes of shares pro rata based upon their relative net assets on the date the expenses are incurred. The expenses borne by the Fund, including those of related parties to the Fund, are shown in the Statement of Operations.
Additionally, the Fund may invest in mutual funds, which are subject to management fees and other fees that may cause the costs of investing in mutual funds to be greater than the costs of owning the underlying securities directly. These indirect expenses of mutual funds are not included in the amounts shown as expenses in the Statement of Operations or in the expense ratios included in the Financial Highlights.
(G) Use of Estimates. In preparing financial statements in conformity with GAAP, the Manager makes estimates and assumptions that affect the reported amounts and disclosures in the financial statements. Actual results could differ from those estimates and assumptions.
(H) Securities Lending. In order to realize additional income, the Fund may engage in securities lending, subject to the limitations set forth in the 1940 Act and relevant guidance by the staff of the Securities and Exchange Commission (“SEC”). If the Fund engages in securities lending, the Fund will lend through its custodian, JPMorgan Chase Bank, N.A., ("JPMorgan"), acting as securities lending agent on behalf of the Fund. Under the current arrangement, JPMorgan will manage the Fund's collateral in accordance with the securities lending agency agreement between the Fund and JPMorgan, and indemnify the Fund against counterparty risk. The loans will be collateralized by cash (which may be invested in a money market fund) and/or non-cash collateral (which may include U.S. Treasury securities and/or U.S. government agency securities issued or guaranteed by the United States government or its agencies or instrumentalities) at least equal at all times to the market value of the securities loaned. The Fund bears the risk of delay in recovery of, or loss of rights in, the securities loaned. The Fund may also record a realized
gain or loss on securities deemed sold due to a borrower’s inability to return securities on loan. The Fund bears the risk of any loss on investment of cash collateral. The Fund will receive compensation for lending its securities in the form of fees or it will retain a portion of interest earned on the investment of any cash collateral. The Fund will also continue to receive interest and dividends on the securities loaned and any gain or loss in the market price of the securities loaned that may occur during the term of the loan will be for the account of the Fund. Income earned from securities lending activities, if any, is reflected in the Statement of Operations. Securities on loan as of April 30, 2021, are shown in the Portfolio of Investments.
Prior to November 23, 2020, these services were provided by State Street Bank and Trust Company (“State Street”).
(I) Foreign Securities Risk. The Fund invests in foreign securities, which carry certain risks that are in addition to the usual risks inherent in domestic securities. These risks include those resulting from currency fluctuations, future adverse political or economic developments and possible imposition of currency exchange blockages or other foreign governmental laws or restrictions. These risks are likely to be greater in emerging markets than in developed markets. The ability of issuers of debt securities held by the Fund to meet their obligations may be affected by, among other things, economic or political developments in a specific country, industry or region.
(J) Indemnifications. Under the Trust’s organizational documents, its officers and trustees are indemnified against certain liabilities that may arise out of performance of their duties to the Trust. Additionally, in the normal course of business, the Fund enters into contracts with third-party service providers that contain a variety of representations and warranties and that may provide general indemnifications. The Fund's maximum exposure under these arrangements is unknown, as this would involve future claims that may be made against the Fund that have not yet occurred. The Manager believes that the risk of loss in connection with these potential indemnification obligations is remote. However, there can be no assurance that material liabilities related to such obligations will not arise in the future, which could adversely impact the Fund.
Note 3–Fees and Related Party Transactions
(A) Manager and Subadvisor. New York Life Investments, a registered investment adviser and an indirect, wholly-owned subsidiary of New York Life Insurance Company (“New York Life”), serves as the Fund’s Manager, pursuant to an Amended and Restated Management Agreement (“Management Agreement”). The Manager provides offices, conducts clerical, recordkeeping and bookkeeping services and keeps most of the financial and accounting records required to be maintained by the Fund. Except for the portion of salaries and expenses that are the responsibility of the Fund, the Manager pays the salaries and expenses of all personnel affiliated with the Fund and certain operational expenses of the Fund. The Fund reimburses New York Life Investments in an amount equal to the portion of the compensation of the Chief Compliance Officer attributable to the Fund. Epoch Investment Partners, Inc. (“Epoch” or the
Notes to Financial Statements (Unaudited) (continued)
“Subadvisor”), a registered investment adviser, serves as Subadvisor to the Fund and is responsible for the day-to-day portfolio management of the Fund. Pursuant to the terms of an Amended and Restated Subadvisory Agreement (“Subadvisory Agreement”) between New York Life Investments and Epoch, New York Life Investments pays for the services of the Subadvisor.
Pursuant to the Management Agreement, the Fund pays the Manager a monthly fee for the services performed and the facilities furnished at an annual rate of the Fund’s average daily net assets as follows: 0.80% up to $5 billion; 0.775% from $5 billion to $7.5 billion; and 0.75% in excess of $7.5 billion. During the six-month period ended April 30, 2021, the effective management fee rate was 0.80% of the Fund’s average daily net assets, exclusive of any applicable waivers/reimbursements.
New York Life Investments has contractually agreed to waive fees and/or reimburse expenses so that Total Annual Fund Operating Expenses (excluding taxes, interest, litigation, extraordinary expenses, brokerage and other transaction expenses relating to the purchase or sale of portfolio investments and acquired (underlying) fund fees and expenses) do not exceed the following percentages of average daily net assets: Class I, 0.95%. This agreement will remain in effect until February 28, 2022, and shall renew automatically for one-year terms unless New York Life Investments provides written notice of termination prior to the start of the next term or upon approval of the Board.
Additionally, New York Life Investments has agreed to further voluntarily waive fees and/or reimburse expenses of the appropriate class of the Fund so that Total Annual Fund Operating Expenses (excluding taxes, interest, litigation, extraordinary expenses, brokerage and other transaction expenses relating to the purchase and sale of portfolio investments, and acquired (underlying) fund fees and expenses) do not exceed the following percentages of average daily net assets: Class R1, 1.05%; and Class R2, 1.30%. This voluntary waiver or reimbursement may be discontinued at any time without notice.
During the six-month period ended April 30, 2021, New York Life Investments earned fees from the Fund in the amount of $1,285,765 and waived fees and/or reimbursed expenses, including the voluntary waiver/reimbursement of certain class specific expenses in the amount of $23,525 and paid the Subadvisor in the amount of $631,359.
JPMorgan provides sub-administration and sub-accounting services to the Fund pursuant to an agreement with New York Life Investments. These services include calculating the daily NAVs of the Fund, maintaining the general ledger and sub-ledger accounts for the calculation of the Fund's NAVs, and assisting New York Life Investments in conducting various aspects of the Fund's administrative operations. For providing these services to the Fund, JPMorgan is compensated by New York Life Investments.
Prior to November 23, 2020, these services were provided by State Street.
Pursuant to an agreement between the Trust and New York Life Investments, New York Life Investments is responsible for providing or
procuring certain regulatory reporting services for the Fund. The Fund will reimburse New York Life Investments for the actual costs incurred by New York Life Investments in connection with providing or procuring these services for the Fund.
(B) Distribution and Service Fees. The Trust, on behalf of the Fund, has entered into a distribution agreement with NYLIFE Distributors LLC (the “Distributor”), an affiliate of New York Life Investments. The Fund has adopted distribution plans (the “Plans”) in accordance with the provisions of Rule 12b-1 under the 1940 Act.
Pursuant to the Class A, Investor Class and Class R2 Plans, the Distributor receives a monthly distribution fee from the Class A, Investor Class and Class R2 shares at an annual rate of 0.25% of the average daily net assets of the Class A, Investor Class and Class R2 shares for distribution and/or service activities as designated by the Distributor. Pursuant to the Class C Plan, Class C shares pay the Distributor a monthly distribution fee at an annual rate of 0.75% of the average daily net assets of the Class C shares, along with a service fee at an annual rate of 0.25% of the average daily net assets of the Class C shares, for a total 12b-1 fee of 1.00%. Pursuant to the Class R3 and SIMPLE Class Plan, Class R3 and SIMPLE Class shares pay the Distributor a monthly fee at an annual rate of 0.25% of the average daily net assets of the Class R3 and SIMPLE Class shares, along with a service fee at an annual rate of 0.25% of the average daily net assets of the Class R3 and SIMPLE Class shares, for a total 12b-1 fee of 0.50%. Class I and Class R1 shares are not subject to a distribution and/or service fee.
The Plans provide that the distribution and service fees are payable to the Distributor regardless of the amounts actually expended by the Distributor for distribution of the Fund's shares and service activities.
In accordance with the Shareholder Services Plans for the Class R1, Class R2 and Class R3 shares, the Manager has agreed to provide, through its affiliates or independent third parties, various shareholder and administrative support services to shareholders of the Class R1, Class R2 and Class R3 shares. For its services, the Manager, its affiliates or independent third-party service providers are entitled to a shareholder service fee accrued daily and paid monthly at an annual rate of 0.10% of the average daily net assets of the Class R1, Class R2 and Class R3 shares. This is in addition to any fees paid under the Class R2 and Class R3 Plans.
During the six-month period ended April 30, 2021, shareholder service fees incurred by the Fund were as follows:
| |
| Class R1 | $ 130 |
| Class R2 | 4,488 |
| Class R3 | 2,290 |
(C) Sales Charges. The Fund was advised by the Distributor that the amount of initial sales charges retained on sales of Class A and Investor Class shares during the six-month period ended April 30, 2021, were $758 and $858, respectively.
| 26 | MainStay Epoch International Choice Fund |
(D) Transfer, Dividend Disbursing and Shareholder Servicing Agent. NYLIM Service Company LLC, an affiliate of New York Life Investments, is the Fund's transfer, dividend disbursing and shareholder servicing agent pursuant to an agreement between NYLIM Service Company LLC and the Trust. NYLIM Service Company LLC has entered into an agreement with DST Asset Manager Solutions, Inc. ("DST"), pursuant to which DST performs certain transfer agent services on behalf of NYLIM Service Company LLC. New York Life Investments has contractually agreed to limit the transfer agency expenses charged to the Fund’s share classes to a maximum of 0.35% of that share class’s average daily net assets on an annual basis after deducting any applicable Fund or class-level expense reimbursement or small account fees. This agreement will remain in effect until February 28, 2022, and shall renew automatically for one-year terms unless New York Life Investments provides written notice of termination prior to the start of the next term or upon approval of the Board. During the six-month period ended April 30, 2021, transfer agent expenses incurred by the Fund and any reimbursements, pursuant to the aforementioned Transfer Agency expense limitation agreement, were as follows:
| Class | Expense | Waived |
| Class A | $ 7,773 | $— |
| Investor Class | 9,030 | — |
| Class C | 5,623 | — |
| Class I | 87,317 | — |
| Class R1 | 83 | — |
| Class R2 | 2,864 | — |
| Class R3 | 1,461 | — |
| SIMPLE Class | 42 | — |
(E) Small Account Fee. Shareholders with small accounts adversely impact the cost of providing transfer agency services. In an effort to reduce total transfer agency expenses, the Fund has implemented a small account fee on certain types of accounts. As described in the Fund's prospectus, certain shareholders with an account balance of less than $1,000 ($5,000 for Class A share accounts) are charged an annual per account fee of $20 (assessed semi-annually), the proceeds from which offset transfer agent fees as reflected in the Statement of Operations. This small account fee will not apply to certain types of accounts as described further in the Fund’s prospectus.
(F) Investments in Affiliates (in 000’s). During the six-month period ended April 30, 2021, purchases and sales transactions, income earned from investments and shares held of investment companies managed by New York Life Investments or its affiliates were as follows:
| Affiliated Investment Companies | Value,
Beginning
of Period | Purchases
at Cost | Proceeds
from
Sales | Net
Realized
Gain/(Loss)
on Sales | Change in
Unrealized
Appreciation/
(Depreciation) | Value,
End of
Period | Dividend
Income | Other
Distributions | Shares
End of
Period |
| MainStay U.S. Government Liquidity Fund | $ 12,460 | $ 59,843 | $ (70,142) | $ — | $ — | $ 2,161 | $ —(a) | $ — | 2,161 |
(G) Capital. As of April 30, 2021, New York Life and its affiliates beneficially held shares of the Fund with the values and percentages of net assets as follows:
| SIMPLE Class | $28,887 | 100.0% |
Note 4-Federal Income Tax
As of April 30, 2021, the cost and unrealized appreciation (depreciation) of the Fund’s investment portfolio, including applicable derivative contracts and other financial instruments, as determined on a federal income tax basis, were as follows:
| | Federal Tax
Cost | Gross
Unrealized
Appreciation | Gross
Unrealized
(Depreciation) | Net
Unrealized
Appreciation/
(Depreciation) |
| Investments | $290,281,063 | $64,603,986 | $(5,283,729) | $59,320,257 |
Notes to Financial Statements (Unaudited) (continued)
As of October 31, 2020, for federal income tax purposes, capital loss carryforwards of $121,816,202 were available as shown in the table below, to the extent provided by the regulations to offset future realized gains of the Fund through the years indicated. To the extent that these capital loss carryforwards are used to offset future capital gains, it is probable that the capital gains so offset will not be distributed to shareholders. No capital gain distributions shall be made until any capital loss carryforwards have been fully utilized.
Capital Loss
Available Through | Short-Term
Capital Loss
Amounts (000’s) | Long-Term
Capital Loss
Amounts (000’s) |
| Unlimited | $86,867 | $34,949 |
During the year ended October 31, 2020, the tax character of distributions paid as reflected in the Statements of Changes in Net Assets was as follows:
| | 2020 |
| Distributions paid from: | |
| Ordinary Income | $11,103,712 |
Note 5–Custodian
JPMorgan is the custodian of cash and securities held by the Fund. Custodial fees are charged to the Fund based on the Fund's net assets and/or the market value of securities held by the Fund and the number of certain transactions incurred by the Fund.
Prior to November 23, 2020, these services were provided by State Street. The services provided by State Street were a direct expense of the Fund and are included in the Statement of Operations as Custodian fees which totaled $4,136 for the period November 1, 2020 through November 22, 2020.
Note 6–Line of Credit
The Fund and certain other funds managed by New York Life Investments maintain a line of credit with a syndicate of banks in order to secure a source of funds for temporary purposes to meet unanticipated or excessive redemption requests.
Effective July 28, 2020, under the credit agreement (the “Credit Agreement”), the aggregate commitment amount is $600,000,000 with an additional uncommitted amount of $100,000,000. The commitment fee is an annual rate of 0.15% of the average commitment amount payable quarterly, regardless of usage, to JPMorgan, who serves as the agent to the syndicate. The commitment fee is allocated among the Fund and certain other funds managed by New York Life Investments based upon their respective net assets and other factors. Interest on any revolving credit loan is charged based upon the Federal Funds Rate or the one-month London Interbank Offered Rate (“LIBOR”), whichever is higher. The Credit Agreement expires on July 27, 2021, although the Fund, certain other funds managed by New York Life Investments and the syndicate of banks may renew the Credit Agreement for an additional year on the same or different terms or enter into a credit agreement with
a different syndicate of banks. Prior to July 28, 2020, the aggregate commitment amount and the commitment fee were the same as those under the current Credit Agreement, but State Street served as agent to the syndicate. During the six-month period ended April 30, 2021, there were no borrowings made or outstanding with respect to the Fund under the Credit Agreement or the credit agreement for which State Street served as agent.
Note 7–Interfund Lending Program
Pursuant to an exemptive order issued by the SEC, the Fund, along with certain other funds managed by New York Life Investments, may participate in an interfund lending program. The interfund lending program provides an alternative credit facility that permits the Fund and certain other funds managed by New York Life Investments to lend or borrow money for temporary purposes directly to or from one another, subject to the conditions of the exemptive order. During the six-month period ended April 30, 2021, there were no interfund loans made or outstanding with respect to the Fund.
Note 8–Purchases and Sales of Securities (in 000’s)
During the six-month period ended April 30, 2021, purchases and sales of securities, other than short-term securities, were $76,533 and $124,589, respectively.
Note 9–Capital Share Transactions
Transactions in capital shares for the six-month period ended April 30, 2021 and the year ended October 31, 2020, were as follows:
| Class A | Shares | Amount |
| Period ended April 30, 2021: | | |
| Shares sold | 100,768 | $ 4,024,877 |
| Shares issued to shareholders in reinvestment of distributions | 2,704 | 104,608 |
| Shares redeemed | (57,317) | (2,227,373) |
| Net increase (decrease) in shares outstanding before conversion | 46,155 | 1,902,112 |
| Shares converted into Class A (See Note 1) | 15,377 | 607,916 |
| Net increase (decrease) | 61,532 | $ 2,510,028 |
| Year ended October 31, 2020: | | |
| Shares sold | 45,816 | $ 1,584,483 |
| Shares issued to shareholders in reinvestment of distributions | 16,255 | 578,034 |
| Shares redeemed | (131,556) | (4,470,389) |
| Net increase (decrease) in shares outstanding before conversion | (69,485) | (2,307,872) |
| Shares converted into Class A (See Note 1) | 17,297 | 624,193 |
| Shares converted from Class A (See Note 1) | (634) | (19,458) |
| Net increase (decrease) | (52,822) | $ (1,703,137) |
| |
| 28 | MainStay Epoch International Choice Fund |
| Investor Class | Shares | Amount |
| Period ended April 30, 2021: | | |
| Shares sold | 5,015 | $ 201,508 |
| Shares issued to shareholders in reinvestment of distributions | 377 | 14,577 |
| Shares redeemed | (9,699) | (387,605) |
| Net increase (decrease) in shares outstanding before conversion | (4,307) | (171,520) |
| Shares converted into Investor Class (See Note 1) | 2,012 | 80,838 |
| Shares converted from Investor Class (See Note 1) | (14,969) | (591,301) |
| Net increase (decrease) | (17,264) | $ (681,983) |
| Year ended October 31, 2020: | | |
| Shares sold | 9,664 | $ 320,204 |
| Shares issued to shareholders in reinvestment of distributions | 4,140 | 147,224 |
| Shares redeemed | (18,461) | (629,678) |
| Net increase (decrease) in shares outstanding before conversion | (4,657) | (162,250) |
| Shares converted into Investor Class (See Note 1) | 1,568 | 51,241 |
| Shares converted from Investor Class (See Note 1) | (16,594) | (599,457) |
| Net increase (decrease) | (19,683) | $ (710,466) |
| |
| Class C | Shares | Amount |
| Period ended April 30, 2021: | | |
| Shares sold | 1,060 | $ 39,561 |
| Shares redeemed | (105,452) | (4,114,920) |
| Net increase (decrease) in shares outstanding before conversion | (104,392) | (4,075,359) |
| Shares converted from Class C (See Note 1) | (2,481) | (97,453) |
| Net increase (decrease) | (106,873) | $ (4,172,812) |
| Year ended October 31, 2020: | | |
| Shares sold | 705 | $ 23,145 |
| Shares issued to shareholders in reinvestment of distributions | 2,660 | 93,255 |
| Shares redeemed | (42,219) | (1,431,418) |
| Net increase (decrease) in shares outstanding before conversion | (38,854) | (1,315,018) |
| Shares converted from Class C (See Note 1) | (1,823) | (60,828) |
| Net increase (decrease) | (40,677) | $ (1,375,846) |
| |
| Class I | Shares | Amount |
| Period ended April 30, 2021: | | |
| Shares sold | 115,117 | $ 4,544,173 |
| Shares issued to shareholders in reinvestment of distributions | 51,337 | 1,982,113 |
| Shares redeemed | (1,263,376) | (50,328,356) |
| Net increase (decrease) | (1,096,922) | $ (43,802,070) |
| Year ended October 31, 2020: | | |
| Shares sold | 223,965 | $ 7,156,222 |
| Shares issued to shareholders in reinvestment of distributions | 275,900 | 9,791,683 |
| Shares redeemed | (2,978,309) | (103,949,238) |
| Net increase (decrease) in shares outstanding before conversion | (2,478,444) | (87,001,333) |
| Shares converted into Class I (See Note 1) | 140 | 4,309 |
| Net increase (decrease) | (2,478,304) | $ (86,997,024) |
| |
| Class R1 | Shares | Amount |
| Period ended April 30, 2021: | | |
| Shares sold | 1,059 | $ 41,391 |
| Shares issued to shareholders in reinvestment of distributions | 44 | 1,682 |
| Shares redeemed | (2,549) | (106,342) |
| Net increase (decrease) | (1,446) | $ (63,269) |
| Year ended October 31, 2020: | | |
| Shares sold | 5,602 | $ 194,538 |
| Shares issued to shareholders in reinvestment of distributions | 163 | 5,764 |
| Shares redeemed | (6,242) | (205,781) |
| Net increase (decrease) | (477) | $ (5,479) |
| |
| Class R2 | Shares | Amount |
| Period ended April 30, 2021: | | |
| Shares sold | 19,223 | $ 757,589 |
| Shares issued to shareholders in reinvestment of distributions | 826 | 31,942 |
| Shares redeemed | (38,089) | (1,522,131) |
| Net increase (decrease) | (18,040) | $ (732,600) |
| Year ended October 31, 2020: | | |
| Shares sold | 37,649 | $ 1,244,859 |
| Shares issued to shareholders in reinvestment of distributions | 7,208 | 256,320 |
| Shares redeemed | (118,556) | (3,997,761) |
| Net increase (decrease) | (73,699) | $ (2,496,582) |
| |
Notes to Financial Statements (Unaudited) (continued)
| Class R3 | Shares | Amount |
| Period ended April 30, 2021: | | |
| Shares sold | 12,074 | $ 479,521 |
| Shares issued to shareholders in reinvestment of distributions | 201 | 7,750 |
| Shares redeemed | (34,891) | (1,365,280) |
| Net increase (decrease) | (22,616) | $ (878,009) |
| Year ended October 31, 2020: | | |
| Shares sold | 21,759 | $ 711,139 |
| Shares issued to shareholders in reinvestment of distributions | 3,056 | 108,226 |
| Shares redeemed | (37,202) | (1,277,749) |
| Net increase (decrease) | (12,387) | $ (458,384) |
| |
| SIMPLE Class | Shares | Amount |
| Period ended October 31, 2020:(a) | | |
| Shares sold | 696 | $ 25,000 |
| Net increase (decrease) | 696 | $ 25,000 |
| (a) | The inception date of the SIMPLE Class was August 31, 2020. |
Note 10–Recent Accounting Pronouncement
In March 2020, the Financial Accounting Standards Board issued Accounting Standards Update 2020-04 (“ASU 2020-04”), which provides optional guidance to ease the potential accounting burden associated with transitioning away from LIBOR and other reference rates that are expected to be discontinued. ASU 2020-04 was effective immediately upon release of the update on March 12, 2020 and remains effective through December 31, 2022. At this time, the Manager is evaluating the implications of certain other provisions of ASU 2020-04 related to new disclosure requirements and any impact on the financial statement disclosures has not yet been determined.
Note 11–Other Matters
An outbreak of COVID-19, first detected in December 2019, has developed into a global pandemic and has resulted in travel restrictions, closure of international borders, certain businesses and securities markets, restrictions on securities trading activities, prolonged quarantines, supply chain disruptions, and lower consumer demand, as well as general concern and uncertainty. The continued impact of COVID-19 is uncertain and could further adversely affect the global economy, national economies, individual issuers and capital markets in unforeseeable ways and result in a substantial and extended economic downturn. Developments that disrupt global economies and financial markets, such as COVID-19, may magnify factors that affect the Fund's performance.
Note 12–Subsequent Events
In connection with the preparation of the financial statements of the Fund as of and for the six-month period ended April 30, 2021, events and transactions subsequent to April 30, 2021, through the date the financial statements were issued have been evaluated by the Manager for possible adjustment and/or disclosure. No subsequent events requiring financial statement adjustment or disclosure have been identified.
| 30 | MainStay Epoch International Choice Fund |
Board Consideration and Approval of Management Agreement and Subadvisory Agreement (Unaudited)
The continuation of the Management Agreement with respect to the MainStay Epoch International Choice Fund (“Fund”) and New York Life Investment Management LLC (“New York Life Investments”) and the Subadvisory Agreement between New York Life Investments and Epoch Investment Partners, Inc. (“Epoch”) with respect to the Fund (together, “Advisory Agreements”), following an initial term of up to two years, is subject to annual review and approval by the Board of Trustees of MainStay Funds Trust (“Board” of the “Trust”) in accordance with Section 15 of the Investment Company Act of 1940, as amended (“1940 Act”). At its December 9–10, 2020 meeting, the Board, including the Trustees who are not an “interested person” (as such term is defined in the 1940 Act) of the Trust (“Independent Trustees”) voting separately, unanimously approved the continuation of each of the Advisory Agreements for a one-year period.
In reaching the decision to approve the continuation of each of the Advisory Agreements, the Board considered information furnished by New York Life Investments and Epoch in connection with an annual contract review process undertaken by the Board that took place at meetings of the Board and its Contracts Committee during September 2020 through December 2020, as well as other information furnished to the Board and its Committees throughout the year, as deemed relevant by the Trustees. Information requested by and furnished to the Board for consideration in connection with the contract review process included, among other items, reports on the Fund and “peer funds” prepared by Strategic Insight Mutual Fund Research and Consulting, LLC (“Strategic Insight”), an independent third-party service provider engaged by the Board to report objectively on the Fund’s investment performance, management fee and total expenses. The Board also considered information on the fees charged to other investment advisory clients of New York Life Investments and/or Epoch that follow investment strategies similar to those of the Fund, if any, and, when applicable, the rationale for any differences in the Fund’s management and subadvisory fees and the fees charged to those other investment advisory clients. In addition, the Board considered information furnished by New York Life Investments and Epoch in response to requests prepared on behalf of the Board, and in consultation with the Independent Trustees, by independent legal counsel to the Independent Trustees, which encompassed a variety of topics, including those summarized below.
The Board took into account information provided in connection with its meetings throughout the year, including, among other items, information regarding the legal standards and fiduciary obligations applicable to its consideration of the continuation of each of the Advisory Agreements and investment performance reports on the Fund as well as presentations from New York Life Investments and Epoch personnel. The Board also took into account other information received from New York Life Investments throughout the year, including, among other items, periodic reports on legal and compliance matters, risk management, portfolio turnover, brokerage commissions and non-advisory services provided to the Fund by New York Life Investments. The contract review process, including the structure and format for materials provided to the Board, has been developed in consultation with the Board. The Independent
Trustees also met in executive sessions with their independent legal counsel and, for a portion thereof, with senior management of New York Life Investments.
In addition to information provided to the Board throughout the year, the Board received information in connection with its June 2020 meeting provided specifically in response to requests prepared on behalf of the Board, and in consultation with the Independent Trustees, by independent legal counsel regarding the Fund’s distribution arrangements. In addition, the Board received information regarding the Fund’s asset levels, share purchase and redemption activity and the payment of Rule 12b-1 and/or other fees by applicable share classes of the Fund, among other information.
In considering the continuation of each of the Advisory Agreements, the Trustees reviewed and evaluated the information and factors they believed to reasonably be necessary and appropriate in light of legal advice furnished to them by independent legal counsel and through the exercise of their own business judgment. Although individual Trustees may have weighed certain factors or information differently, the factors considered by the Board are described in greater detail below and include, among other factors: (i) the nature, extent and quality of the services provided to the Fund by New York Life Investments and Epoch; (ii) the qualifications of the portfolio managers of the Fund and the historical investment performance of the Fund, New York Life Investments and Epoch; (iii) the costs of the services provided, and profits realized, by New York Life Investments and Epoch from their relationships with the Fund; (iv) the extent to which economies of scale have been realized or may be realized as the Fund grows and the extent to which economies of scale have benefited or may benefit the Fund’s shareholders; and (v) the reasonableness of the Fund’s management and subadvisory fees and total ordinary operating expenses. Although the Board recognized that comparisons between the Fund’s fees and expenses and those of other funds are imprecise given different terms of agreements, variations in fund strategies and other factors, the Board considered the reasonableness of the Fund’s management fee and total ordinary operating expenses as compared to the peer funds identified by Strategic Insight. Throughout their considerations, the Trustees acknowledged the commitment of New York Life Investments and its affiliates to serve the MainStay Group of Funds, as well as their capacity, experience, resources, financial stability and reputations. The Trustees also acknowledged the entrepreneurial and other risks assumed by New York Life Investments in sponsoring and managing the Fund.
The Trustees noted that, throughout the year, the Trustees are afforded an opportunity to ask questions of, and request additional information or materials from, New York Life Investments and Epoch. The Board’s decision with respect to each of the Advisory Agreements may have also been based, in part, on the Board’s knowledge of New York Life Investments and Epoch resulting from, among other things, the Board’s consideration of each of the Advisory Agreements in prior years, the advisory agreements for other funds in the MainStay Group of Funds, the Board’s review throughout the year of the performance and operations of other funds in the MainStay Group of Funds and each Trustee’s business
Board Consideration and Approval of Management Agreement and Subadvisory Agreement (Unaudited) (continued)
judgment and industry experience. In addition to considering the above-referenced factors, the Board observed that in the marketplace there are a range of investment options available to the Fund’s shareholders and such shareholders, having had the opportunity to consider other investment options, have chosen to invest in the Fund.
The factors that figured prominently in the Board’s decision to approve the continuation of each of the Advisory Agreements during its December 9–10, 2020 meeting are summarized in more detail below, and the Board did not consider any factor or information controlling in reaching such decision.
Nature, Extent and Quality of Services Provided by New York Life Investments and Epoch
The Board examined the nature, extent and quality of the services that New York Life Investments provides to the Fund. The Board evaluated New York Life Investments’ experience and capabilities in serving as manager of the Fund and considered that the Fund operates in a “manager-of-managers” structure. The Board also considered New York Life Investments’ responsibilities and services provided pursuant to this structure, including evaluating the performance of Epoch, making recommendations to the Board as to whether the Subadvisory Agreement should be renewed, modified or terminated and periodically reporting to the Board regarding the results of New York Life Investments’ evaluation and monitoring functions. The Board noted that New York Life Investments manages other mutual funds, serves a variety of other investment advisory clients, including other pooled investment vehicles, and has experience overseeing mutual fund service providers, including subadvisors. The Board considered the experience of senior personnel at New York Life Investments providing management and administrative and other non-advisory services to the Fund as well as New York Life Investments’ reputation and financial condition. The Board observed that New York Life Investments devotes significant resources and time to providing management and non-advisory services to the Fund, including New York Life Investments’ supervision and due diligence reviews of Epoch and ongoing analysis of, and interactions with, Epoch with respect to, among other things, the Fund’s investment performance and risks as well as Epoch’s investment capabilities and subadvisory services with respect to the Fund.
The Board also considered the range of services that New York Life Investments provides to the Fund under the terms of the Management Agreement, including: (i) fund accounting and ongoing supervisory services provided by New York Life Investments’ Fund Administration and Accounting Group; (ii) investment supervisory and analytical services provided by New York Life Investments’ Investment Consulting Group; (iii) compliance services provided by the Trust’s Chief Compliance Officer as well as New York Life Investments’ compliance department, including supervision and implementation of the Fund’s compliance program; (iv) legal services provided by New York Life Investments’ Office of the General Counsel; and (v) risk management monitoring and analysis by compliance and investment personnel. The Board noted that New York Life Investments provides certain other non-advisory services to the Fund.
In addition, the Board considered New York Life Investments’ willingness to invest in personnel, infrastructure, technology, operational enhancements, cyber security, information security, shareholder privacy resources and business continuity planning designed to benefit the Fund and noted that New York Life Investments is responsible for compensating the Trust’s officers, except for a portion of the salary of the Trust’s Chief Compliance Officer. The Board recognized that New York Life Investments has provided an increasingly broad array of non-advisory services to the MainStay Group of Funds as a result of regulatory and other developments, including in connection with the designation of New York Life Investments as the administrator of the MainStay Group of Funds’ liquidity risk management program adopted under the 1940 Act. The Board considered benefits to shareholders from being part of the MainStay Group of Funds, including the privilege of exchanging investments between the same class of shares of funds in the MainStay Group of Funds, including without the imposition of a sales charge (if any).
The Board also examined the nature, extent and quality of the investment advisory services that Epoch provides to the Fund and considered the terms of each of the Advisory Agreements. The Board evaluated Epoch’s experience in serving as subadvisor to the Fund and advising other portfolios and Epoch’s track record and experience in providing investment advisory services, the experience of investment advisory, senior management and administrative personnel at Epoch and New York Life Investments’ and Epoch’s overall resources, legal and compliance environment, capabilities and history. In addition to information provided in connection with quarterly meetings with the Trust’s Chief Compliance Officer, the Board considered information regarding the compliance policies and procedures of New York Life Investments and Epoch and acknowledged their commitment to further developing and strengthening compliance programs relating to the Fund. The Board reviewed Epoch’s ability to attract and retain qualified investment professionals and willingness to invest in personnel to service and support the Fund. In this regard, the Board considered the experience of the Fund’s portfolio managers, the number of accounts managed by the portfolio managers and the method for compensating the portfolio managers.
In addition, the Board considered discussions with New York Life Investments regarding the implementation of its business continuity plans and recognized steps taken by New York Life Investments and Epoch to continue to provide the same nature, extent and quality of services to the Fund during the COVID-19 pandemic.
Based on these considerations, the Board concluded that the Fund would likely continue to benefit from the nature, extent and quality of these services.
Investment Performance
In evaluating the Fund’s investment performance, the Board considered investment performance results over various periods in light of the Fund’s investment objective, strategies and risks. The Board considered investment reports on, and analysis of, the Fund’s performance provided
| 32 | MainStay Epoch International Choice Fund |
to the Board throughout the year. These reports include, among other items, information on the Fund’s gross and net returns, the Fund’s investment performance compared to relevant investment categories and the Fund’s benchmark, the Fund’s risk-adjusted investment performance and the Fund’s investment performance as compared to peer funds, as appropriate, as well as portfolio attribution information and commentary on the effect of market conditions. The Board also considered information provided by Strategic Insight showing the investment performance of the Fund as compared to peer funds.
The Board also gave weight to its discussions with senior management at New York Life Investments concerning the Fund’s investment performance attributable to Epoch as well as discussions between the Fund’s portfolio managers and the members of the Board’s Investment Committee, which generally occur on an annual basis. In addition, the Board considered any specific actions that New York Life Investments or Epoch had taken, or had agreed to take, to seek to enhance Fund investment performance and the results of those actions.
Based on these considerations, the Board concluded that its review of the Fund’s investment performance and related information supported a determination to approve the continuation of each of the Advisory Agreements.
Costs of the Services Provided, and Profits Realized, by New York Life Investments and Epoch
The Board considered the costs of the services provided under each of the Advisory Agreements. The Board also considered the profits realized by New York Life Investments and its affiliates and Epoch due to their relationships with the Fund. The Board considered that Epoch’s subadvisory fee had been negotiated at arm’s-length by New York Life Investments and that this fee is paid by New York Life Investments, not the Fund, and the relevance of Epoch’s profitability was considered by the Trustees in that context. On this basis, the Board primarily considered the costs and profitability for New York Life Investments and its affiliates with respect to the Fund.
In addition, the Board acknowledged the difficulty in obtaining reliable comparative data about mutual fund managers’ profitability because such information generally is not publicly available and may be impacted by numerous factors, including the structure of a fund manager’s organization, the types of funds it manages, the methodology used to allocate certain fixed costs to specific funds and the manager’s capital structure and costs of capital.
In evaluating the costs of the services provided by New York Life Investments and Epoch and profits realized by New York Life Investments and its affiliates and Epoch, the Board considered, among other factors, each party’s continuing investments in, or willingness to invest in, personnel, systems, equipment and other resources and infrastructure to support and further enhance the management of the Fund, and that New York Life Investments is responsible for paying the subadvisory fee for the Fund. The Board also considered the financial resources of New York Life Investments and Epoch and acknowledged that New York Life
Investments and Epoch must be in a position to attract and retain experienced professional personnel and to maintain a strong financial position for New York Life Investments and Epoch to continue to provide high-quality services to the Fund. The Board recognized that the Fund benefits from the allocation of certain fixed costs among the funds in the MainStay Group of Funds, among other expected benefits resulting from its relationship with New York Life Investments.
The Board considered information regarding New York Life Investments’ methodology for calculating profitability and allocating costs provided by New York Life Investments in connection with the fund profitability analysis presented to the Board. The Board previously engaged an independent consultant to review the methods used to allocate costs among the funds in the MainStay Group of Funds. The Board noted that the independent consultant had concluded that New York Life Investments’ methods for allocating costs and procedures for estimating overall profitability of the relationship with the funds in the MainStay Group of Funds are reasonable and that New York Life Investments continued to use the same method of calculating profit and allocating costs since the independent consultant’s review. The Board recognized the difficulty in calculating and evaluating a manager’s profitability with respect to the Fund and noted that other profitability methodologies may also be reasonable.
The Board also considered certain fall-out benefits that may be realized by New York Life Investments and its affiliates due to their relationships with the Fund, including reputational and other indirect benefits. In this regard, the Board also requested and received information from New York Life Investments concerning other material business relationships between Epoch and its affiliates and New York Life Investments and its affiliates. In addition, the Board considered its review of a money market fund advised by New York Life Investments and an affiliated subadvisor that serves as an investment option for the Fund, including the potential rationale for and costs associated with investments in this money market fund by the Fund, if any, and considered information from New York Life Investments that the nature and type of specific investment advisory services provided to this money market fund are distinct from, or in addition to, the investment advisory services provided to the Fund.
The Board observed that, in addition to fees earned by New York Life Investments for managing the Fund, New York Life Investments’ affiliates also earn revenues from serving the Fund in various other capacities, including as the Fund’s transfer agent and distributor. The Board considered information about these other revenues and their impact on the profitability of the relationship with the Fund to New York Life Investments and its affiliates. The Board noted that, although it assessed the overall profitability of the Fund to New York Life Investments and its affiliates as part of the contract review process, when considering the reasonableness of the fee paid to New York Life Investments and its affiliates under the Management Agreement, the Board considered the profitability of New York Life Investments’ relationship with the Fund on a pre-tax basis and without regard to distribution expenses incurred by New York Life Investments from its own resources.
Board Consideration and Approval of Management Agreement and Subadvisory Agreement (Unaudited) (continued)
After evaluating the information deemed relevant by the Trustees, the Board concluded that any profits realized by New York Life Investments and its affiliates due to their relationships with the Fund were not excessive. With respect to Epoch, the Board considered that any profits realized by Epoch due to its relationship with the Fund are the result of arm’s-length negotiations between New York Life Investments and Epoch, acknowledging that any such profits are based on the subadvisory fee paid to Epoch by New York Life Investments, not the Fund.
Management and Subadvisory Fees and Total Ordinary Operating Expenses
The Board evaluated the reasonableness of the fee paid under each of the Advisory Agreements and the Fund’s total ordinary operating expenses. The Board primarily considered the reasonableness of the management fee paid by the Fund to New York Life Investments, because the subadvisory fee paid to Epoch is paid by New York Life Investments, not the Fund. The Board also considered the reasonableness of the subadvisory fee paid by New York Life Investments and the amount of the management fee retained by New York Life Investments.
In assessing the reasonableness of the Fund’s fees and expenses, the Board primarily considered comparative data provided by Strategic Insight on the fees and expenses charged by similar mutual funds managed by other investment advisers. In addition, the Board considered information provided by New York Life Investments and Epoch on fees charged to other investment advisory clients, including institutional separate accounts and/or other funds that follow investment strategies similar to those of the Fund, if any. The Board considered the similarities and differences in the contractual management fee schedules of the Fund and these similarly-managed accounts and/or funds, taking into account the rationale for any differences in fee schedules. The Board also took into account explanations provided by New York Life Investments about the more extensive scope of services provided to registered investment companies, such as the Fund, as compared with other investment advisory clients. Additionally, the Board considered the impact of contractual breakpoints, voluntary waivers and expense limitation arrangements on the Fund’s net management fee and expenses. The Board also considered that in proposing fees for the Fund, New York Life Investments considers the competitive marketplace for mutual funds.
The Board noted that, outside of the Fund’s management fee and the fees charged under a share class’s Rule 12b-1 and/or shareholder services plans, a share class’s most significant “other expenses” are transfer agent fees. Transfer agent fees are charged to the Fund based on the number of shareholder accounts (a “per-account” fee). The Board took into account information from New York Life Investments regarding the reasonableness of the Fund’s transfer agent fee schedule, including industry data demonstrating that the per-account fees that NYLIM Service Company LLC, an affiliate of New York Life Investments and the Fund’s transfer agent, charges the Fund are within the range of per-account fees charged by transfer agents to other mutual funds. In addition, the Board considered NYLIM Service Company LLC’s profitability in connection with the transfer agent services it provides to the Fund. The Board also took
into account information received from NYLIM Service Company LLC regarding the sub-transfer agency payments it made to intermediaries in connection with the provision of sub-transfer agency services to the Fund.
The Board considered that, because the Fund’s transfer agent fees are billed on a per-account basis, the impact of transfer agent fees on a share class’s expense ratio may be more significant in cases where the share class has a high number of small accounts. The Board considered the extent to which transfer agent fees comprised total expenses of the Fund. The Board acknowledged the role that the MainStay Group of Funds historically has played in serving the investment needs of New York Life Insurance Company customers, who often maintain smaller account balances than other shareholders of funds, and the impact of small accounts on the expense ratios of Fund share classes. The Board also recognized measures that it and New York Life Investments have taken to mitigate the effect of small accounts on the expense ratios of Fund share classes, including through the imposition of an expense limitation on net transfer agency expenses. The Board noted that, for purposes of allocating transfer agency fees and expenses, each retail fund in the MainStay Group of Funds combines the shareholder accounts of its Class A, A2, I, R1, R2 and R3 shares (as applicable) into one group and the shareholder accounts of its Investor Class, SIMPLE Class and Class B, C and C2 shares (as applicable) into another group. The Board also noted that the per-account fees attributable to each group of share classes is then allocated among the constituent share classes based on relative net assets and that a MainStay Fund’s Class R6 shares, if any, are not combined with any other share class for this purpose. The Board considered New York Life Investments’ rationale with respect to these groupings and previously received a report from an independent consultant engaged to conduct comparative analysis of these groupings. The Board also considered that NYLIM Service Company LLC had waived its contractual cost of living adjustments during the past seven years.
Based on the factors outlined above, the Board concluded that the Fund’s management fee and total ordinary operating expenses were within a range that is competitive and support a conclusion that these fees and expenses are reasonable.
Economies of Scale
The Board considered information regarding economies of scale, including whether the Fund’s expense structure permits economies of scale to be appropriately shared with the Fund’s shareholders. The Board also considered a report from New York Life Investments, previously prepared at the request of the Board, that addressed economies of scale, including with respect to the mutual fund business generally and the various ways in which the benefits of economies of scale may be shared with the funds in the MainStay Group of Funds. Although the Board recognized the difficulty of determining economies of scale with precision, the Board acknowledged that economies of scale may be shared with the Fund in a number of ways, including, for example, through the imposition of management fee breakpoints, initially setting management fee rates at scale or making additional investments to enhance services. The Board
| 34 | MainStay Epoch International Choice Fund |
reviewed information from New York Life Investments showing how the Fund’s management fee schedule compared to fee schedules of other funds and accounts managed by New York Life Investments. The Board also reviewed information from Strategic Insight showing how the Fund’s management fee schedule compared with fees paid for similar services by peer funds at varying asset levels.
Based on this information, the Board concluded that economies of scale are appropriately reflected for the benefit of the Fund’s shareholders through the Fund’s expense structure and other methods to share benefits from economies of scale.
Conclusion
On the basis of the information and factors summarized above, among other information and factors deemed relevant by the Trustees, and the evaluation thereof, the Board, including the Independent Trustees voting separately, unanimously voted to approve the continuation of each of the Advisory Agreements.
Discussion of the Operation and Effectiveness of the Fund's Liquidity Risk Management Program (Unaudited)
In compliance with Rule 22e-4 under the Investment Company Act of 1940, as amended (the “Liquidity Rule”), the Fund has adopted and implemented a liquidity risk management program (the “Program”), which New York Life Investment Management LLC believes is reasonably designed to assess and manage the Fund's liquidity risk (the risk that the Fund could not meet requests to redeem shares issued by the Fund without significant dilution of remaining investors’ interests in the Fund). The Board of Trustees of MainStay Funds Trust (the "Board") designated New York Life Investment Management LLC as administrator of the Program (the “Administrator”). The Administrator has established a Liquidity Risk Management Committee to assist the Administrator in the implementation and day-to-day administration of the Program and to otherwise support the Administrator in fulfilling its responsibilities under the Program.
At a meeting of the Board held on March 8, 2021, the Administrator provided the Board with a written report addressing the Program’s operation and assessing its adequacy and effectiveness of implementation for the period from January 1, 2020 through December 31, 2020 (the "Review Period"), as required under the Liquidity Rule. The report noted that the Administrator concluded that (i) the Program operated effectively to assess and manage the Fund's liquidity risk, (ii) the Program has been adequately and effectively implemented to monitor and, as applicable, respond to the Fund's liquidity developments and (iii) the Fund's investment strategy continues to be appropriate for an open-end fund. In addition, the report discussed notable events that impacted liquidity risk during the Review Period, including the COVID-19 pandemic and the resulting economic shutdown.
In accordance with the Program, the Fund's liquidity risk is assessed no less frequently than annually taking into consideration certain factors, as applicable, such as (i) investment strategy and liquidity of portfolio investments, (ii) short-term and long-term cash flow projections and (iii) holdings of cash and cash equivalents, as well as borrowing arrangements and other funding sources. Certain factors are considered under both normal and reasonably foreseeable stressed conditions.
Each Fund portfolio investment is classified into one of four liquidity categories. The classification is based on a determination of the number of days it is reasonably expected to take to convert the investment into cash, or sell or dispose of the investment, in current market conditions without significantly changing the market value of the investment. The Administrator has delegated liquidity classification determinations to the Fund’s subadvisor, subject to appropriate oversight by the Administrator, and classification determinations are made by taking into account the Fund's reasonably anticipated trade size, various market, trading and investment-specific considerations, as well as market depth, and, in certain cases, third-party vendor data.
The Liquidity Rule requires funds that do not primarily hold assets that are highly liquid investments to adopt a minimum amount of net assets that must be invested in highly liquid investments that are assets (an “HLIM”). In addition, the Liquidity Rule limits a fund's investments in illiquid investments. Specifically, the Liquidity Rule prohibits acquisition of illiquid investments if doing so would result in a fund holding more than 15% of its net assets in illiquid investments that are assets. The Program includes provisions reasonably designed to determine, periodically review and comply with the HLIM requirement, as applicable, and to comply with the 15% limit on illiquid investments.
There can be no assurance that the Program will achieve its objectives under all circumstances in the future. Please refer to the Fund's prospectus for more information regarding the Fund's exposure to liquidity risk and other risks to which it may be subject.
| 36 | MainStay Epoch International Choice Fund |
Proxy Voting Record
The Fund is required to file with the Securities and Exchange Commissions's ("SEC") its proxy voting records for the 12-month period ending June 30 on Form N-PX. The most recent Form N-PX or proxy voting record is available free of charge upon request by calling 800-624-6782; visiting the MainStay Funds’ website at newyorklifeinvestments.com; or visiting the SEC’s website at www.sec.gov.
Shareholder Reports and Quarterly Portfolio Disclosure
The Fund is required to file its complete schedule of portfolio holdings with the SEC 60 days after its first and third fiscal quarter on Form N-PORT. The Fund's holdings report is available free of charge upon request by calling New York Life Investments at 800-624-6782.
This page intentionally left blank.
Equity
U.S. Equity
MainStay Epoch U.S. Equity Yield Fund
MainStay MacKay S&P 500 Index Fund
MainStay Winslow Large Cap Growth Fund
MainStay WMC Enduring Capital Fund
MainStay WMC Growth Fund
MainStay WMC Small Companies Fund
MainStay WMC Value Fund
International Equity
MainStay Epoch International Choice Fund
MainStay MacKay International Equity Fund
MainStay WMC International Research Equity Fund
Emerging Markets Equity
MainStay Candriam Emerging Markets Equity Fund
Global Equity
MainStay Epoch Capital Growth Fund
MainStay Epoch Global Equity Yield Fund
Fixed Income
Taxable Income
MainStay Candriam Emerging Markets Debt Fund
MainStay Floating Rate Fund
MainStay MacKay High Yield Corporate Bond Fund
MainStay MacKay Short Duration High Yield Fund
MainStay MacKay Strategic Bond Fund
MainStay MacKay Total Return Bond Fund
MainStay MacKay U.S. Infrastructure Bond Fund
MainStay Short Term Bond Fund
Tax-Exempt Income
MainStay MacKay California Tax Free Opportunities Fund1
MainStay MacKay High Yield Municipal Bond Fund
MainStay MacKay Intermediate Tax Free Bond Fund
MainStay MacKay New York Tax Free Opportunities Fund2
MainStay MacKay Short Term Municipal Fund
MainStay MacKay Tax Free Bond Fund
Money Market
MainStay Money Market Fund
Mixed Asset
MainStay Balanced Fund
MainStay Income Builder Fund
MainStay MacKay Convertible Fund
Speciality
MainStay CBRE Global Infrastructure Fund
MainStay CBRE Real Estate Fund
MainStay Cushing MLP Premier Fund
Asset Allocation
MainStay Conservative Allocation Fund
MainStay Conservative ETF Allocation Fund
MainStay Defensive ETF Allocation Fund
MainStay Equity Allocation Fund
MainStay Equity ETF Allocation Fund
MainStay Growth Allocation Fund
MainStay Growth ETF Allocation Fund
MainStay Moderate Allocation Fund
MainStay Moderate ETF Allocation Fund
Manager
New York Life Investment Management LLC
New York, New York
Subadvisors
Candriam Belgium S.A.3
Brussels, Belgium
Candriam Luxembourg S.C.A.3
Strassen, Luxembourg
CBRE Clarion Securities LLC
Radnor, Pennsylvania
Cushing Asset Management, LP
Dallas, Texas
Epoch Investment Partners, Inc.
New York, New York
MacKay Shields LLC3
New York, New York
NYL Investors LLC3
New York, New York
Wellington Management Company LLP
Boston, Massachusetts
Winslow Capital Management, LLC
Minneapolis, Minnesota
Legal Counsel
Dechert LLP
Washington, District of Columbia
Independent Registered Public Accounting Firm
KPMG LLP
Philadelphia, Pennsylvania
Distributor
NYLIFE Distributors LLC3
Jersey City, New Jersey
Custodian
JPMorgan Chase Bank, N.A.
New York, New York
1.
This Fund is registered for sale in AZ, CA, NV, OR, TX, UT, WA and MI (Class A and I shares only), and CO, FL, GA, HI, ID, MA, MD, NH, NJ and NY (Class I shares only).
| 2. | This Fund is registered for sale in CA, CT, DE, FL, MA, NJ, NY and VT. |
| 3. | An affiliate of New York Life Investment Management LLC. |
Not part of the Semiannual Report
For more information
800-624-6782
newyorklifeinvestments.com
“New York Life Investments” is both a service mark, and the common trade name, of certain investment advisors affiliated with New York Life Insurance Company. The MainStay Funds® are managed by New York Life Investment Management LLC and distributed by NYLIFE Distributors LLC, 30 Hudson Street, Jersey City, NJ 07302, a wholly owned subsidiary of New York Life Insurance Company. NYLIFE Distributors LLC is a Member FINRA/SIPC.
©2021 NYLIFE Distributors LLC. All rights reserved.
| 1737115MS071-21 | MSEIC10-06/21 |
(NYLIM) NL319
MainStay Epoch U.S. Equity Yield Fund
Message from the President and Semiannual Report
Unaudited | April 30, 2021
Sign up for e-delivery of your shareholder reports. For full details on e-delivery, including who can participate and what you can receive via e-delivery,
please log in to newyorklifeinvestments.com/accounts.
| Not FDIC/NCUA Insured | Not a Deposit | May Lose Value | No Bank Guarantee | Not Insured by Any Government Agency |
This page intentionally left blank
Message from the President
With the approval of COVID-19 vaccines and the passage of relief packages by the U.S. Congress, economic prospects improved during the reporting period, and investor risk appetite increased, benefiting both equities and fixed-income markets. Despite some volatility stemming from a sell-off in longer-dated Treasury securities, the stock market and higher-risk segments of the fixed-income market posted gains for the six months ended April 30, 2021.
By the beginning of the reporting period, the economy had made tremendous progress from the second quarter of 2020, when economic activity plunged. But uncertainty about when vaccines would be available and how quickly they could be administered left investors unsure about the economic outlook.
With the approval of several vaccines in November, the outlook brightened and investors became less risk-averse. Anticipating the likely end of the pandemic and a continuation of the economic recovery, they began to see opportunities in investment-grade and high-yield bonds and more cyclical segments of the stock market. The $900 billion relief and stimulus package passed in December provided further assurance.
In January, the Federal Reserve opted to leave interest rates unchanged, pointing to some uncertainty about the pace of the global recovery. Officials also noted that inflation remained low, citing oil prices in particular.
In March, President Biden signed the $1.9 billion American Rescue Plan, which, among other provisions, called for payments of $1,400 for those earning less than $75,000 per year, plus $1,400 per dependent. This, combined with the Federal Reserve’s new tolerance for inflation and an anticipated $2 trillion infrastructure spending bill, added to growing concerns about higher prices. Supply shortages in some markets caused some prices to soar, heightening concerns further.
In fixed-income markets, an improving economic outlook and rising inflation expectations led to a sell-off in longer-term Treasuries, with the result that the yield on the 10-year note rose sharply, particularly in February and March. Investment grade corporate bonds were also affected. Early in the reporting period, they performed well as investors shifted out of Treasuries, but as the reporting period progressed, they faltered. Longer-dated securities issued in recent years at historically low interest rates became especially unattractive.
High-yield bonds remained steady, supported by more favorable yields and an improved economic outlook, which reduced their perceived risk. Municipal bonds produced modest gains, and
although the sell-off in Treasuries produced some volatility early in 2021, stronger-than-expected tax revenues, $350 billion in financial support from the federal government, and the possibility of an increase in federal income tax rates appeared to buoy the market late in the reporting period.
Inflation concerns and volatility in the Treasury market led to a shift in equities markets. Although the S&P 500® Index, a widely followed measure of U.S. equities, posted double-digit gains and hit a record high, the rise of Treasury yields disrupted valuations, especially those of growth stocks. Technology companies that saw their valuations soar amid the work-from-home trend in 2020 suffered large declines.
But the fiscal stimulus and continued accommodation from the Federal Reserve gave investors confidence the economic recovery would continue. Combined with the sky-high valuations in technology and growth stocks, this increased the appeal of more cyclical and value-oriented shares. As a result, value stocks outperformed growth stocks during the reporting period.
Reflecting the shift in investor sentiment, the performance of S&P 500® Index sectors varied widely. While the information technology sector kept up with the broader market, it lagged cyclical sectors such as energy and financials, which led the way. The shift was further reflected in the performance of small-cap stocks, which outperformed large caps. While developed markets kept pace with the U.S. market, lagging economic and pandemic recoveries appeared to weigh on emerging markets late in the reporting period.
With the lockdown restrictions lifting in the U.S. and the pandemic easing in many regions, we at New York Life Investments are looking forward to a return to a more normal economy. We anticipate that over the next several years, a variety of trends will likely offer long-term investors many attractive opportunities. With this in mind, we continue to develop products and services to help you to take advantage of these trends, manage your risks, and ultimately meet your investment goals.
Sincerely,
Kirk C. Lehneis
President
The opinions expressed are as of the date of this report and are subject to change. There is no guarantee that any forecast made will come to pass. This material does not constitute investment advice and is not intended as an endorsement of any specific investment. Past performance is no guarantee of future results.
Not part of the Semiannual Report
Investors should refer to the Fund’s Summary Prospectus and/or Prospectus and consider the Fund’s investment objectives, strategies, risks, charges and expenses carefully before investing. The Summary Prospectus and/or Prospectus contain this and other information about the Fund. You may obtain copies of the Fund’s Summary Prospectus, Prospectus and Statement of Additional Information free of charge, upon request, by calling toll-free 800-624-6782, by writing to NYLIFE Distributors LLC, Attn: MainStay Marketing Department, 30 Hudson Street, Jersey City, NJ 07302 or by sending an e-mail to MainStayShareholderServices@nylim.com. These documents are also available via the MainStay Funds’ website at newyorklifeinvestments.com. Please read the Fund’s Summary Prospectus and/or Prospectus carefully before investing.
Investment and Performance Comparison (Unaudited)
Performance data quoted represents past performance. Past performance is no guarantee of future results. Because of market volatility and other factors, current performance may be lower or higher than the figures shown. Investment return and principal value will fluctuate, and as a result, when shares are redeemed, they may be worth more or less than their original cost. The graph below depicts the historical performance of Class I shares of the Fund. Performance will vary from class to class based on differences in class-specific expenses and sales charges. For performance information current to the most recent month-end, please call 800-624-6782 or visit newyorklifeinvestments.com.
The performance table and graph do not reflect the deduction of taxes that a shareholder would pay on distributions or Fund share redemptions. Total returns reflect maximum applicable sales charges as indicated in the table below, if any, changes in share price, and reinvestment of dividend and capital gain distributions. The graph assumes the initial investment amount shown below and reflects the deduction of all sales charges that would have applied for the period of investment. Performance figures may reflect certain fee waivers and/or expense limitations, without which total returns may have been lower. For more information on share classes and current fee waivers and/or expense limitations (if any), please refer to the Notes to Financial Statements.

| Average Annual Total Returns for the Period-Ended April 30, 2021 |
| Class | Sales Charge | | Inception
Date | Six
Months | One Year
or Since
Inception | Five Years
or Since
Inception | Ten
Years | Gross
Expense
Ratio1 |
| Class A Shares | Maximum 5.5% Initial Sales Charge | With sales charges | 2/3/2009 | 20.00% | 26.83% | 8.90% | 9.20% | 1.09% |
| | | Excluding sales charges | | 26.98 | 34.21 | 10.14 | 9.82 | 1.09 |
| Investor Class Shares2 | Maximum 5% Initial Sales Charge | With sales charges | 11/16/2009 | 20.52 | 26.59 | 8.69 | 9.03 | 1.38 |
| | | Excluding sales charges | | 26.86 | 33.95 | 9.93 | 9.65 | 1.38 |
| Class B Shares3 | Maximum 5% CDSC | With sales charges | 5/8/2017 | 21.42 | 27.90 | 8.08 | N/A | 2.13 |
| | if Redeemed Within the First Six Years of Purchase | Excluding sales charges | | 26.42 | 32.90 | 8.47 | N/A | 2.13 |
| Class C Shares | Maximum 1% CDSC | With sales charges | 11/16/2009 | 25.35 | 31.93 | 9.10 | 8.84 | 2.13 |
| | if Redeemed Within One Year of Purchase | Excluding sales charges | | 26.35 | 32.93 | 9.10 | 8.84 | 2.13 |
| Class I Shares | No Sales Charge | | 12/3/2008 | 27.30 | 34.70 | 10.45 | 10.11 | 0.84 |
| Class R1 Shares | No Sales Charge | | 5/8/2017 | 27.14 | 34.49 | 9.68 | N/A | 0.94 |
| Class R2 Shares | No Sales Charge | | 5/8/2017 | 27.01 | 34.17 | 9.39 | N/A | 1.19 |
| Class R3 Shares | No Sales Charge | | 5/8/2017 | 26.77 | 33.75 | 9.12 | N/A | 1.44 |
| Class R6 Shares | No Sales Charge | | 5/8/2017 | 27.22 | 34.72 | 9.90 | N/A | 0.74 |
| SIMPLE Class Shares | No Sales Charge | | 8/31/2020 | 26.70 | 21.43 | N/A | N/A | 1.63 |
| 1. | The gross expense ratios presented reflect the Fund’s “Total Annual Fund Operating Expenses” from the most recent Prospectus, as supplemented, and may differ from other expense ratios disclosed in this report. |
| 2. | Prior to June 30, 2020, the maximum initial sales charge was 5.5%, which is reflected in the average annual total return figures shown. |
| 3. | Class B shares are closed to all new purchases as well as additional investments by existing Class B shareholders. |
The footnotes on the next page are an integral part of the table and graph and should be carefully read in conjunction with them.
| Benchmark Performance | Six
Months | One
Year | Five
Years | Ten
Years |
| Russell 1000® Value Index1 | 36.30% | 45.92% | 12.15% | 11.13% |
| U.S. Equity Yield Composite Index2 | 21.14 | 26.18 | 11.46 | 11.59 |
| Morningstar Large Value Category Average3 | 35.83 | 45.77 | 11.90 | 10.04 |
| 1. | The Fund has selected the Russell 1000® Value Index as its primary benchmark. The Russell 1000® Value Index measures the performance of the large-cap value segment of the U.S. equity universe. It includes those Russell 1000® Index companies with lower price-to-book ratios and lower expected growth values. Results assume reinvestment of all dividends and capital gains. An investment cannot be made directly in an index. |
| 2. | The Fund has selected the U.S. Equity Yield Composite Index as its secondary benchmark. The U.S. Equity Yield Composite Index consists of the MSCI USA High Dividend Yield Index and the MSCI USA Minimum Volatility (USD) Index weighted at 60% and 40%, respectively. The MSCI USA High Dividend Yield Index is based on the MSCI USA Index and includes large and mid-cap stocks. The MSCI USA High Dividend Yield Index is designed to reflect the performance of equities in the MSCI USA Index (excluding real estate investment trusts) with higher dividend income and quality characteristics than average dividend yields that are both sustainable and persistent. The MSCI USA Minimum Volatility (USD) Index aims to reflect the performance characteristics of a minimum variance strategy applied to the large and mid-cap USA equity universe. The MSCI USA Minimum Volatility (USD) Index is calculated by optimizing the MSCI USA Index in USD for the lowest absolute risk (within a given set of constraints). Results assume reinvestment of all dividends and capital gains. An investment cannot be made directly in an index. |
| 3. | The Morningstar Large Value Category Average is representative of funds that invest primarily in big U.S. companies that are less expensive or growing more slowly than other large-cap stocks. Results are based on average total returns of similar funds with all dividends and capital gain distributions reinvested. |
The footnotes on the preceding page are an integral part of the table and graph and should be carefully read in conjunction with them.
| 6 | MainStay Epoch U.S. Equity Yield Fund |
Cost in Dollars of a $1,000 Investment in MainStay Epoch U.S. Equity Yield Fund (Unaudited)
The example below is intended to describe the fees and expenses borne by shareholders during the six-month period from November 1, 2020, to April 30, 2021, and the impact of those costs on your investment.
Example
As a shareholder of the Fund you incur two types of costs: (1) transaction costs, including exchange fees and sales charges (loads) on purchases (as applicable), and (2) ongoing costs, including management fees, distribution and/or service (12b-1) fees, and other Fund expenses (as applicable). This example is intended to help you understand your ongoing costs (in dollars) of investing in the Fund and to compare these costs with the ongoing costs of investing in other mutual funds. The example is based on an investment of $1,000 made at the beginning of the six-month period and held for the entire period from November 1, 2020, to April 30, 2021.
This example illustrates your Fund’s ongoing costs in two ways:
Actual Expenses
The second and third data columns in the table below provide information about actual account values and actual expenses. You may use the information in these columns, together with the amount you invested, to estimate the expenses that you paid during the six months ended April 30, 2021. Simply divide your account value by $1,000 (for example, an
$8,600 account value divided by $1,000 = 8.6), then multiply the result by the number under the heading entitled “Expenses Paid During Period” to estimate the expenses you paid on your account during this period.
Hypothetical Example for Comparison Purposes
The fourth and fifth data columns in the table below provide information about hypothetical account values and hypothetical expenses based on the Fund’s actual expense ratio and an assumed rate of return of 5% per year before expenses, which is not the Fund’s actual return. The hypothetical account values and expenses may not be used to estimate the actual ending account balances or expenses you paid for the six-month period shown. You may use this information to compare the ongoing costs of investing in the Fund with the ongoing costs of investing in other mutual funds. To do so, compare this 5% hypothetical example with the 5% hypothetical examples that appear in the shareholder reports of the other mutual funds.
Please note that the expenses shown in the table are meant to highlight your ongoing costs only and do not reflect any transactional costs, such as exchange fees or sales charges (loads). Therefore, the fourth and fifth data columns of the table are useful in comparing ongoing costs only and will not help you determine the relative total costs of owning different funds. In addition, if these transactional costs were included, your costs would have been higher.
| Share Class | Beginning
Account
Value
11/1/20 | Ending Account
Value (Based
on Actual
Returns and
Expenses)
4/30/21 | Expenses
Paid
During
Period1 | Ending Account
Value (Based
on Hypothetical
5% Annualized
Return and
Actual Expenses)
4/30/21 | Expenses
Paid
During
Period1 | Net Expense
Ratio
During
Period2 |
| Class A Shares | $1,000.00 | $1,269.80 | $ 6.08 | $1,019.44 | $ 5.41 | 1.08% |
| Investor Class Shares | $1,000.00 | $1,268.60 | $ 7.48 | $1,018.20 | $ 6.66 | 1.33% |
| Class B Shares | $1,000.00 | $1,264.20 | $11.68 | $1,014.48 | $10.39 | 2.08% |
| Class C Shares | $1,000.00 | $1,263.50 | $11.67 | $1,014.48 | $10.39 | 2.08% |
| Class I Shares | $1,000.00 | $1,273.00 | $ 4.11 | $1,021.18 | $ 3.66 | 0.73% |
| Class R1 Shares | $1,000.00 | $1,271.40 | $ 5.24 | $1,020.18 | $ 4.66 | 0.93% |
| Class R2 Shares | $1,000.00 | $1,270.10 | $ 6.64 | $1,018.94 | $ 5.91 | 1.18% |
| Class R3 Shares | $1,000.00 | $1,267.70 | $ 8.04 | $1,017.70 | $ 7.15 | 1.43% |
| Class R6 Shares | $1,000.00 | $1,272.20 | $ 4.11 | $1,021.18 | $ 3.66 | 0.73% |
| SIMPLE Class Shares | $1,000.00 | $1,267.00 | $ 8.94 | $1,016.91 | $ 7.95 | 1.59% |
| 1. | Expenses are equal to the Fund’s annualized expense ratio of each class multiplied by the average account value over the period, divided by 365 and multiplied by 181 (to reflect the six-month period). The table above represents the actual expenses incurred during the six-month period. In addition to the fees and expenses which the Fund bears directly, it also indirectly bears a pro rata share of the fees and expenses of the underlying funds in which it invests. Such indirect expenses are not included in the above-reported expense figures. |
| 2. | Expenses are equal to the Fund's annualized expense ratio to reflect the six-month period. |
Industry Composition as of April 30, 2021 (Unaudited)
| Banks | 6.4% |
| Semiconductors & Semiconductor Equipment | 6.3 |
| Insurance | 6.1 |
| Pharmaceuticals | 5.3 |
| Electric Utilities | 5.1 |
| Chemicals | 4.7 |
| Multi–Utilities | 4.1 |
| Oil, Gas & Consumable Fuels | 3.9 |
| Capital Markets | 3.8 |
| Equity Real Estate Investment Trusts | 3.7 |
| Biotechnology | 3.2 |
| Household Products | 3.1 |
| Electrical Equipment | 3.1 |
| Tobacco | 3.0 |
| Aerospace & Defense | 2.9 |
| Beverages | 2.8 |
| Diversified Telecommunication Services | 2.8 |
| Hotels, Restaurants & Leisure | 2.3 |
| Media | 2.2 |
| Software | 2.0 |
| Commercial Services & Supplies | 2.0% |
| Health Care Equipment & Supplies | 1.9 |
| Health Care Providers & Services | 1.9 |
| IT Services | 1.7 |
| Trading Companies & Distributors | 1.5 |
| Specialty Retail | 1.4 |
| Food & Staples Retailing | 1.4 |
| Industrial Conglomerates | 1.4 |
| Communications Equipment | 1.3 |
| Multiline Retail | 1.2 |
| Air Freight & Logistics | 1.0 |
| Leisure Products | 1.0 |
| Containers & Packaging | 1.0 |
| Technology Hardware, Storage & Peripherals | 1.0 |
| Household Durables | 0.8 |
| Textiles, Apparel & Luxury Goods | 0.7 |
| Short–Term Investments | 1.8 |
| Other Assets, Less Liabilities | 0.2 |
| | 100.0% |
See Portfolio of Investments beginning on page 11 for specific holdings within these categories. The Fund's holdings are subject to change.
Top Ten Holdings as of April 30, 2021 (excluding short-term investments) (Unaudited)
| 1. | Microsoft Corp. |
| 2. | MetLife, Inc. |
| 3. | Medtronic plc |
| 4. | Johnson & Johnson |
| 5. | JPMorgan Chase & Co. |
| 6. | AbbVie, Inc. |
| 7. | Nutrien Ltd. |
| 8. | Verizon Communications, Inc. |
| 9. | Eaton Corp. plc |
| 10. | Truist Financial Corp. |
| 8 | MainStay Epoch U.S. Equity Yield Fund |
Portfolio Management Discussion and Analysis (Unaudited)
Questions answered by portfolio managers Kera Van Valen, CFA, John Tobin, PhD, CFA, Michael A. Welhoelter, CFA, and William W. Priest, CFA, of Epoch Investment Partners, Inc., the Fund’s Subadvisor.
How did MainStay Epoch U.S. Equity Yield Fund perform relative to its benchmarks and peer group during the six months ended April 30, 2021?
For the six months ended April 30, 2021, Class I shares of MainStay Epoch U.S. Equity Yield Fund returned 27.30%, underperforming the 36.30% return of the Fund’s primary benchmark, the Russell 1000® Value Index. Over the same period, Class I shares outperformed the 21.14% return of the U.S. Equity Yield Composite Index, which is the Fund’s secondary benchmark, and underperformed the 35.83% return of the Morningstar Large Value Category Average.1
What factors affected the Fund’s relative performance during the reporting period?
The Fund underperformed the Russell 1000® Value Index during the reporting period as the market favored stocks of companies that had deeper value characteristics than what the Fund normally invests in. Underweight exposure to financials and underperforming stock selections in the sector were the most significant detractors from the Fund’s relative returns, as investors digested a rising yield environment. Overweight exposure to utilities and weak stock selection further detracted from relative performance.
During the reporting period, which sectors were the strongest positive contributors to the Fund’s relative performance and which sectors were particularly weak?
During the reporting period, the strongest positive sector contributions to the Fund’s performance relative to the Russell 1000® Value Index came from health care. (Contributions take weightings and total returns into account.) During the same period, the most significant sector detractors from relative returns were financials and utilities.
During the reporting period, which individual stocks made the strongest positive contributions to the Fund’s absolute performance and which stocks detracted the most?
Top contributors to the Fund’s absolute performance during the reporting period included semiconductor equipment maker KLA and insurer MetLife.
KLA is a leading provider of tools for inspection, process control and yield management for the semiconductor industry. Shares outperformed on underlying demand for the company’s products as semiconductor production continued to be capacity constrained. Semiconductor manufacturers announced increases in capital spending for 2021, and we expect that capital spending in the area will remain elevated over the next several years. The growth in both logic and memory channels supports numerous industries, with industrials and automotive most prominent among them. The company has historically returned a majority of free cash flow back to shareholders through a progressive dividend and share repurchase program.
MetLife (MET) serves retail and commercial customers globally with a comprehensive array of insurance offering, including life,
disability, accident & health, dental, annuities and property/casualty coverage. The company is particularly strong in the group benefits area, and has a significant presence outside the United States in Asia (Japan), Latin America and the EMEA (Europe, Middle East and Africa) region. Shares traded higher following the release of strong results for the fourth quarter of 2020 and the full year of 2020. MET executed well, delivering along multiple fronts with top-line growth across business lines and geographies, limited pandemic-related impacts and good expense control. The company also approved a new $3 billion share buyback program and stated its intention to complete the program in 2021. We believe management remains committed to rewarding shareholders with an attractive growing dividend, debt reduction and share repurchase program.
The most significant detractors from the Fund’s absolute performance during the same period were utility American Electric Power Company and global products company Procter & Gamble.
American Electric Power (AEP) is mainly a regulated utility company that operates in several eastern, midwestern and southern states of the United States. The company also manages the largest electric transmission network in the country. Shares underperformed along with utility peers as positive vaccine news in early November led to a significant rise in interest rates and a rally in recovery stocks. Shares were also weighed down by an FBI investigation of FirstEnergy, an AEP peer that also operates in Ohio. We believe it is worth noting that Ohio represents less than 15% of AEP's total rate base. Management has remained focused on delivering regulated earnings growth with an emphasis on transmission and distribution, leading to strong cash flow generation and mid-to-high single-digits growth. AEP has historically rewarded its shareholders with an attractive and growing dividend.
Procter & Gamble (P&G) is a global consumer and household products manufacturer and marketer. Despite posting strong earnings growth for the third quarter of 2020, P&G shares traded lower as investors shifted focus to concerns over rising input costs, increased competitive intensity and more difficult comps (comparable company analysis) ahead. While commodity inflation remained a short-term headwind as of the end of the reporting period, we believe the company’s top-line growth is likely to benefit from recent reinvestment, enabling P&G to extend market share gains. In our opinion, management remains disciplined about returning cash to shareholders via dividends and share repurchases.
Positions in both AEP and P&G remained in the Fund as of the end of the reporting period.
What were some of the Fund’s largest purchases and sales during the reporting period?
New purchases initiated during the reporting period included advertising agency Omnicom and real estate investment trust (REIT) W.P. Carey.
Omnicom is the world's second largest advertising agency, providing creative content creation, planning and media strategy,
| 1. | See page 5 for other share class returns, which may be higher or lower than Class I share returns. See page 6 for more information on benchmark and peer group returns. |
analytics and execution services. Omnicom, with its quick shift to digital and effective programing advertising model, has been able to sustain organic growth. While it has not been immune to the systematic shift away from the traditional advertising model, particularly by consumer packaged goods companies, we believe it has been able to navigate this decline better than most competitors and has grown in the digital space faster than the traditional advertising decline. We believe this growth should be sustainable, and that the rapid shift which occurred during the early days of the pandemic pulled forward some of the decline rate, lessening headwinds going forward. The more persistent traditional business that remains, as well as the industry’s digital growth areas, should allow the company to grow cash flow near the mid-single digits. Omnicom has historically paid a well-covered dividend and has an aggressive share repurchase program, which we believe will resume once the current pandemic uncertainty abates.
W.P. Carey owns a portfolio of commercial real estate leased to a broadly diverse group of tenants spanning multiple sectors (including industrials, warehouse, office, retail and self-storage) and geographic regions (primarily in the U.S. and Europe). Growth has occurred organically due to built-in rent escalations, and inorganically through the acquisition and development of new properties. The company has historically maintained a strong, investment-grade balance sheet and paid an attractive, growing dividend.
The Fund’s most significant sales during the same period included closing its positions entirely in integrated circuit maker Maxim Integrated Products and food seasoning company McCormick.
Maxim Integrated Products is a large supplier of analog chips to the automotive, communications, computing, consumer and industrials markets. The company’s cash flow growth has been driven by underlying demand, principally in the industrials and automotive sectors. Maxim has also benefited from improved profitability as it has streamlined its operations and leveraged its fixed cost base. Industrials demand has been driven by factory automation and strength in the company’s automotive group led by its Serial Link product, which is a beneficiary of the emergence of advanced driver-assistance systems and electric vehicles. Analog Devices announced in July it would acquire Maxim, leading the Fund to sell its shares to maintain diversification and fund other shareholder yield opportunities.
McCormick is a global leader in seasonings and flavorings. Sales growth has been driven by new products and expanded distribution. Flavor has been an advantaged global category supported by consumer demand for appetizing food and healthy eating. The Fund exited its position on concerns surrounding the sustainability of the company’s cash flow growth as the economy reopens post pandemic. The trade was made to fund other shareholder yield opportunities.
How did the Fund’s sector weightings change during the reporting period?
The Fund’s most significant sector weighting changes during the reporting period were decreases in consumer staples and utilities; and increases in financials and energy. The Fund’s sector allocations are a result of our bottom-up fundamental investment process and reflect the companies and securities that we confidently believe can collect and distribute sustainable, growing shareholder yield.
How was the Fund positioned at the end of the reporting period?
As of April 30, 2021, the Fund’s largest sector allocations on an absolute basis were to financials, health care and information technology, while its smallest total sector allocations were to real estate and energy. As of the same date, relative to the Russell 1000® Value Index, the Fund held its most overweight exposure to utilities, a defensive sector that is typically more heavily represented in the Fund, as well as consumer staples. The Fund’s most significant underweight exposures were to the financials and communication services sectors.
The opinions expressed are those of the portfolio managers as of the date of this report and are subject to change. There is no guarantee that any forecasts will come to pass. This material does not constitute investment advice and is not intended as an endorsement of any specific investment.
| 10 | MainStay Epoch U.S. Equity Yield Fund |
Portfolio of Investments April 30, 2021† (Unaudited)
| | Shares | Value |
| Common Stocks 98.0% |
| Aerospace & Defense 2.9% |
| General Dynamics Corp. | 35,572 | $ 6,766,862 |
| Lockheed Martin Corp. | 32,433 | 12,342,702 |
| Raytheon Technologies Corp. | 130,119 | 10,831,106 |
| | | 29,940,670 |
| Air Freight & Logistics 1.0% |
| United Parcel Service, Inc., Class B | 50,568 | 10,308,792 |
| Banks 6.4% |
| Bank of America Corp. | 263,783 | 10,691,125 |
| JPMorgan Chase & Co. | 118,573 | 18,237,713 |
| PNC Financial Services Group, Inc. (The) | 51,963 | 9,714,483 |
| Truist Financial Corp. | 291,422 | 17,284,239 |
| U.S. Bancorp | 182,764 | 10,847,043 |
| | | 66,774,603 |
| Beverages 2.8% |
| Coca-Cola Co. (The) | 179,604 | 9,695,024 |
| Coca-Cola European Partners plc | 143,264 | 8,140,261 |
| PepsiCo, Inc. | 79,514 | 11,462,738 |
| | | 29,298,023 |
| Biotechnology 3.2% |
| AbbVie, Inc. | 162,117 | 18,076,045 |
| Amgen, Inc. | 66,128 | 15,846,914 |
| | | 33,922,959 |
| Capital Markets 3.8% |
| BlackRock, Inc. | 20,576 | 16,857,917 |
| CME Group, Inc. | 39,059 | 7,889,527 |
| Lazard Ltd., Class A | 199,643 | 8,981,938 |
| T. Rowe Price Group, Inc. | 33,828 | 6,061,978 |
| | | 39,791,360 |
| Chemicals 4.7% |
| Dow, Inc. | 245,517 | 15,344,813 |
| LyondellBasell Industries NV, Class A | 95,727 | 9,930,719 |
| Nutrien Ltd. | 321,769 | 17,758,431 |
| PPG Industries, Inc. | 36,067 | 6,176,113 |
| | | 49,210,076 |
| Commercial Services & Supplies 2.0% |
| Republic Services, Inc. | 94,510 | 10,046,413 |
| Waste Management, Inc. | 75,678 | 10,441,294 |
| | | 20,487,707 |
| | Shares | Value |
| |
| Communications Equipment 1.3% |
| Cisco Systems, Inc. | 268,882 | $ 13,688,783 |
| Containers & Packaging 1.0% |
| Amcor plc | 842,881 | 9,903,852 |
| Diversified Telecommunication Services 2.8% |
| AT&T, Inc. | 365,136 | 11,468,922 |
| Verizon Communications, Inc. | 306,198 | 17,695,182 |
| | | 29,164,104 |
| Electric Utilities 5.1% |
| Alliant Energy Corp. | 107,413 | 6,033,388 |
| American Electric Power Co., Inc. | 99,741 | 8,848,024 |
| Duke Energy Corp. | 79,863 | 8,041,405 |
| Entergy Corp. | 126,943 | 13,873,601 |
| Evergy, Inc. | 138,801 | 8,879,100 |
| Eversource Energy | 86,140 | 7,426,991 |
| | | 53,102,509 |
| Electrical Equipment 3.1% |
| Eaton Corp. plc | 122,758 | 17,545,801 |
| Emerson Electric Co. | 162,166 | 14,674,401 |
| | | 32,220,202 |
| Equity Real Estate Investment Trusts 3.7% |
| American Tower Corp. | 36,967 | 9,418,083 |
| Iron Mountain, Inc. | 396,174 | 15,894,501 |
| Welltower, Inc. | 90,420 | 6,784,213 |
| WP Carey, Inc. | 92,713 | 6,943,276 |
| | | 39,040,073 |
| Food & Staples Retailing 1.4% |
| Walmart, Inc. | 103,926 | 14,540,287 |
| Health Care Equipment & Supplies 1.9% |
| Medtronic plc | 153,099 | 20,043,721 |
| Health Care Providers & Services 1.9% |
| CVS Health Corp. | 121,712 | 9,298,797 |
| UnitedHealth Group, Inc. | 26,505 | 10,570,194 |
| | | 19,868,991 |
| Hotels, Restaurants & Leisure 2.3% |
| Las Vegas Sands Corp. (a) | 84,396 | 5,170,099 |
| McDonald's Corp. | 57,543 | 13,584,752 |
| Vail Resorts, Inc. | 17,089 | 5,556,659 |
| | | 24,311,510 |
The notes to the financial statements are an integral part of, and should be read in conjunction with, the financial statements.
11
Portfolio of Investments April 30, 2021† (Unaudited) (continued)
| | Shares | Value |
| Common Stocks (continued) |
| Household Durables 0.8% |
| Leggett & Platt, Inc. | 175,335 | $ 8,708,889 |
| Household Products 3.1% |
| Colgate-Palmolive Co. | 59,635 | 4,812,544 |
| Kimberly-Clark Corp. | 99,044 | 13,204,546 |
| Procter & Gamble Co. (The) | 108,111 | 14,424,170 |
| | | 32,441,260 |
| Industrial Conglomerates 1.4% |
| Honeywell International, Inc. | 64,867 | 14,467,936 |
| Insurance 6.1% |
| Allianz SE, ADR | 379,086 | 9,861,240 |
| Arthur J Gallagher & Co. | 109,157 | 15,822,307 |
| Marsh & McLennan Cos., Inc. | 55,799 | 7,571,924 |
| MetLife, Inc. | 332,847 | 21,179,055 |
| Travelers Cos., Inc. (The) | 59,635 | 9,223,149 |
| | | 63,657,675 |
| IT Services 1.7% |
| Automatic Data Processing, Inc. | 29,042 | 5,430,564 |
| International Business Machines Corp. | 51,266 | 7,273,620 |
| Paychex, Inc. | 55,102 | 5,371,894 |
| | | 18,076,078 |
| Leisure Products 1.0% |
| Hasbro, Inc. | 101,884 | 10,132,364 |
| Media 2.2% |
| Comcast Corp., Class A | 288,761 | 16,213,930 |
| Omnicom Group, Inc. | 79,867 | 6,569,859 |
| | | 22,783,789 |
| Multiline Retail 1.2% |
| Target Corp. | 57,851 | 11,990,198 |
| Multi-Utilities 4.1% |
| Ameren Corp. | 131,128 | 11,124,899 |
| CMS Energy Corp. | 88,266 | 5,683,448 |
| Dominion Energy, Inc. | 111,250 | 8,888,875 |
| NiSource, Inc. | 225,289 | 5,862,020 |
| WEC Energy Group, Inc. | 114,737 | 11,148,994 |
| | | 42,708,236 |
| Oil, Gas & Consumable Fuels 3.9% |
| Chevron Corp. | 130,489 | 13,449,501 |
| Enterprise Products Partners LP | 485,980 | 11,182,400 |
| | Shares | Value |
| |
| Oil, Gas & Consumable Fuels (continued) |
| Magellan Midstream Partners LP | 178,798 | $ 8,362,383 |
| Phillips 66 | 96,674 | 7,821,893 |
| | | 40,816,177 |
| Pharmaceuticals 5.3% |
| Eli Lilly and Co. | 42,547 | 7,776,315 |
| Johnson & Johnson | 116,481 | 18,954,953 |
| Merck & Co., Inc. | 210,991 | 15,718,830 |
| Pfizer, Inc. | 336,888 | 13,020,721 |
| | | 55,470,819 |
| Semiconductors & Semiconductor Equipment 6.3% |
| Analog Devices, Inc. | 98,346 | 15,062,673 |
| Broadcom, Inc. | 22,668 | 10,341,142 |
| Intel Corp. | 188,671 | 10,854,243 |
| KLA Corp. | 50,568 | 15,946,619 |
| Texas Instruments, Inc. | 76,724 | 13,849,449 |
| | | 66,054,126 |
| Software 2.0% |
| Microsoft Corp. | 84,745 | 21,370,994 |
| Specialty Retail 1.4% |
| Home Depot, Inc. (The) | 45,337 | 14,674,227 |
| Technology Hardware, Storage & Peripherals 1.0% |
| Apple, Inc. | 75,329 | 9,902,750 |
| Textiles, Apparel & Luxury Goods 0.7% |
| Hanesbrands, Inc. | 333,400 | 7,021,404 |
| Tobacco 3.0% |
| Altria Group, Inc. | 271,324 | 12,955,721 |
| British American Tobacco plc, Sponsored | 179,255 | 6,723,855 |
| Philip Morris International, Inc. | 124,502 | 11,827,690 |
| | | 31,507,266 |
| Trading Companies & Distributors 1.5% |
| MSC Industrial Direct Co., Inc., Class A | 83,001 | 7,483,370 |
| Watsco, Inc. | 28,876 | 8,456,625 |
| | | 15,939,995 |
Total Common Stocks
(Cost $752,590,696) | | 1,023,342,405 |
The notes to the financial statements are an integral part of, and should be read in conjunction with, the financial statements.
| 12 | MainStay Epoch U.S. Equity Yield Fund |
| | Shares | | Value |
| Short-Term Investment 1.8% |
| Affiliated Investment Company 1.8% |
| MainStay U.S. Government Liquidity Fund, 0.01% (b) | 19,533,739 | | $ 19,533,739 |
Total Short-Term Investment
(Cost $19,533,739) | | | 19,533,739 |
Total Investments
(Cost $772,124,435) | 99.8% | | 1,042,876,144 |
| Other Assets, Less Liabilities | 0.2 | | 1,669,257 |
| Net Assets | 100.0% | | $ 1,044,545,401 |
| † | Percentages indicated are based on Fund net assets. |
| (a) | Non-income producing security. |
| (b) | Current yield as of April 30, 2021. |
| Abbreviation(s): |
| ADR—American Depositary Receipt |
The following is a summary of the fair valuations according to the inputs used as of April 30, 2021, for valuing the Fund’s assets:
| Description | Quoted
Prices in
Active
Markets for
Identical
Assets
(Level 1) | | Significant
Other
Observable
Inputs
(Level 2) | | Significant
Unobservable
Inputs
(Level 3) | | Total |
| Asset Valuation Inputs | | | | | | | |
| Investments in Securities (a) | | | | | | | |
| Common Stocks | $ 1,023,342,405 | | $ — | | $ — | | $ 1,023,342,405 |
| Short-Term Investment | | | | | | | |
| Affiliated Investment Company | 19,533,739 | | — | | — | | 19,533,739 |
| Total Investments in Securities | $ 1,042,876,144 | | $ — | | $ — | | $ 1,042,876,144 |
| (a) | For a complete listing of investments and their industries, see the Portfolio of Investments. |
The notes to the financial statements are an integral part of, and should be read in conjunction with, the financial statements.
13
Statement of Assets and Liabilities as of April 30, 2021 (Unaudited)
| Assets |
Investment in unaffiliated securities, at value
(identified cost $752,590,696) | $1,023,342,405 |
Investment in affiliated investment companies, at value
(identified cost $19,533,739) | 19,533,739 |
| Receivables: | |
| Dividends and interest | 1,770,813 |
| Fund shares sold | 1,451,539 |
| Other assets | 97,967 |
| Total assets | 1,046,196,463 |
| Liabilities |
| Payables: | |
| Fund shares redeemed | 578,433 |
| Manager (See Note 3) | 554,219 |
| Transfer agent (See Note 3) | 247,398 |
| NYLIFE Distributors (See Note 3) | 138,527 |
| Shareholder communication | 66,733 |
| Professional fees | 51,519 |
| Custodian | 8,393 |
| Securities lending | 31 |
| Accrued expenses | 5,809 |
| Total liabilities | 1,651,062 |
| Net assets | $1,044,545,401 |
| Composition of Net Assets |
| Shares of beneficial interest outstanding (par value of $.001 per share) unlimited number of shares authorized | $ 55,389 |
| Additional paid-in-capital | 804,252,371 |
| | 804,307,760 |
| Total distributable earnings (loss) | 240,237,641 |
| Net assets | $1,044,545,401 |
| Class A | |
| Net assets applicable to outstanding shares | $477,905,806 |
| Shares of beneficial interest outstanding | 25,424,697 |
| Net asset value per share outstanding | $ 18.80 |
| Maximum sales charge (5.50% of offering price) | 1.09 |
| Maximum offering price per share outstanding | $ 19.89 |
| Investor Class | |
| Net assets applicable to outstanding shares | $ 91,767,463 |
| Shares of beneficial interest outstanding | 4,905,140 |
| Net asset value per share outstanding | $ 18.71 |
| Maximum sales charge (5.00% of offering price) | 0.98 |
| Maximum offering price per share outstanding | $ 19.69 |
| Class B | |
| Net assets applicable to outstanding shares | $ 9,316,776 |
| Shares of beneficial interest outstanding | 513,871 |
| Net asset value and offering price per share outstanding | $ 18.13 |
| Class C | |
| Net assets applicable to outstanding shares | $ 15,534,433 |
| Shares of beneficial interest outstanding | 856,891 |
| Net asset value and offering price per share outstanding | $ 18.13 |
| Class I | |
| Net assets applicable to outstanding shares | $333,033,938 |
| Shares of beneficial interest outstanding | 17,528,984 |
| Net asset value and offering price per share outstanding | $ 19.00 |
| Class R1 | |
| Net assets applicable to outstanding shares | $ 811,609 |
| Shares of beneficial interest outstanding | 42,742 |
| Net asset value and offering price per share outstanding | $ 18.99 |
| Class R2 | |
| Net assets applicable to outstanding shares | $ 1,485,090 |
| Shares of beneficial interest outstanding | 79,029 |
| Net asset value and offering price per share outstanding | $ 18.79 |
| Class R3 | |
| Net assets applicable to outstanding shares | $ 3,583,093 |
| Shares of beneficial interest outstanding | 190,659 |
| Net asset value and offering price per share outstanding | $ 18.79 |
| Class R6 | |
| Net assets applicable to outstanding shares | $111,076,835 |
| Shares of beneficial interest outstanding | 5,845,636 |
| Net asset value and offering price per share outstanding | $ 19.00 |
| SIMPLE Class | |
| Net assets applicable to outstanding shares | $ 30,358 |
| Shares of beneficial interest outstanding | 1,619 |
| Net asset value and offering price per share outstanding | $ 18.75 |
The notes to the financial statements are an integral part of, and should be read in conjunction with, the financial statements.
| 14 | MainStay Epoch U.S. Equity Yield Fund |
Statement of Operations for the six months ended April 30, 2021 (Unaudited)
| Investment Income (Loss) |
| Income | |
| Dividends-unaffiliated (net of foreign tax withholding of $53,105) | $ 15,607,729 |
| Securities lending | 1,194 |
| Dividends-affiliated | 777 |
| Interest | 538 |
| Total income | 15,610,238 |
| Expenses | |
| Manager (See Note 3) | 3,355,885 |
| Distribution/Service—Class A (See Note 3) | 539,412 |
| Distribution/Service—Investor Class (See Note 3) | 112,038 |
| Distribution/Service—Class B (See Note 3) | 46,367 |
| Distribution/Service—Class C (See Note 3) | 91,009 |
| Distribution/Service—Class R2 (See Note 3) | 2,012 |
| Distribution/Service—Class R3 (See Note 3) | 8,306 |
| Distribution/Service—SIMPLE Class (See Note 3) | 69 |
| Transfer agent (See Note 3) | 601,970 |
| Registration | 83,328 |
| Professional fees | 55,087 |
| Shareholder communication | 52,984 |
| Custodian | 13,477 |
| Trustees | 10,120 |
| Insurance | 4,867 |
| Shareholder service (See Note 3) | 2,838 |
| Miscellaneous | 18,726 |
| Total expenses before waiver/reimbursement | 4,998,495 |
| Expense waiver/reimbursement from Manager (See Note 3) | (224,688) |
| Net expenses | 4,773,807 |
| Net investment income (loss) | 10,836,431 |
| Realized and Unrealized Gain (Loss) |
| Net realized gain (loss) on investments | 17,556,988 |
| Net change in unrealized appreciation (depreciation) on investments | 202,137,078 |
| Net realized and unrealized gain (loss) | 219,694,066 |
| Net increase (decrease) in net assets resulting from operations | $230,530,497 |
The notes to the financial statements are an integral part of, and should be read in conjunction with, the financial statements.
15
Statements of Changes in Net Assets
for the six months ended April 30, 2021 (Unaudited) and the year ended October 31, 2020
| | 2021 | 2020 |
| Increase (Decrease) in Net Assets |
| Operations: | | |
| Net investment income (loss) | $ 10,836,431 | $ 23,698,826 |
| Net realized gain (loss) | 17,556,988 | (50,103,104) |
| Net change in unrealized appreciation (depreciation) | 202,137,078 | (67,038,827) |
| Net increase (decrease) in net assets resulting from operations | 230,530,497 | (93,443,105) |
| Distributions to shareholders: | | |
| Class A | (4,789,228) | (16,706,327) |
| Investor Class | (865,417) | (3,466,598) |
| Class B | (59,158) | (399,186) |
| Class C | (115,681) | (864,846) |
| Class I | (3,836,781) | (12,528,780) |
| Class R1 | (8,993) | (31,602) |
| Class R2 | (21,561) | (97,989) |
| Class R3 | (32,735) | (142,203) |
| Class R6 | (1,401,463) | (6,826,494) |
| SIMPLE Class | (173) | (53) |
| Total distributions to shareholders | (11,131,190) | (41,064,078) |
| Capital share transactions: | | |
| Net proceeds from sales of shares | 55,396,115 | 148,903,903 |
| Net asset value of shares issued to shareholder in reinvestment of distributions | 10,974,544 | 40,502,287 |
| Cost of shares redeemed | (111,959,901) | (268,406,883) |
| Increase (decrease) in net assets derived from capital share transactions | (45,589,242) | (79,000,693) |
| Net increase (decrease) in net assets | 173,810,065 | (213,507,876) |
| Net Assets |
| Beginning of period | 870,735,336 | 1,084,243,212 |
| End of period | $1,044,545,401 | $ 870,735,336 |
The notes to the financial statements are an integral part of, and should be read in conjunction with, the financial statements.
| 16 | MainStay Epoch U.S. Equity Yield Fund |
Financial Highlights selected per share data and ratios
| | Six months ended
April 30,
2021* | | Year Ended October 31, |
| Class A | 2020 | | 2019 | | 2018 | | 2017 | | 2016 |
| Net asset value at beginning of period | $ 14.96 | | $ 17.07 | | $ 15.70 | | $ 16.31 | | $ 14.23 | | $ 14.06 |
| Net investment income (loss) (a) | 0.19 | | 0.36 | | 0.36 | | 0.33 | | 0.31 | | 0.29 |
| Net realized and unrealized gain (loss) on investments | 3.84 | | (1.83) | | 1.84 | | (0.06) | | 2.13 | | 0.69 |
| Total from investment operations | 4.03 | | (1.47) | | 2.20 | | 0.27 | | 2.44 | | 0.98 |
| Less distributions: | | | | | | | | | | | |
| From net investment income | (0.19) | | (0.34) | | (0.37) | | (0.32) | | (0.30) | | (0.26) |
| From net realized gain on investments | — | | (0.30) | | (0.46) | | (0.56) | | (0.06) | | (0.55) |
| Total distributions | (0.19) | | (0.64) | | (0.83) | | (0.88) | | (0.36) | | (0.81) |
| Net asset value at end of period | $ 18.80 | | $ 14.96 | | $ 17.07 | | $ 15.70 | | $ 16.31 | | $ 14.23 |
| Total investment return (b) | 26.98% | | (8.77)% | | 14.49% | | 1.62% | | 17.34% | | 7.43% |
| Ratios (to average net assets)/Supplemental Data: | | | | | | | | | | | |
| Net investment income (loss) | 2.17%†† | | 2.31% | | 2.21% | | 2.06% | | 1.92% | | 2.04% (c) |
| Net expenses (d) | 1.08%†† | | 1.08% (e) | | 1.08% | | 1.07% | | 1.08% | | 1.16% (f) |
| Expenses (before waiver/reimbursement) (d) | 1.09%†† | | 1.09% | | 1.08% | | 1.07% | | 1.08% | | 1.33% (f) |
| Portfolio turnover rate | 6% | | 29% | | 18% | | 17% | | 28% | | 14% |
| Net assets at end of period (in 000’s) | $ 477,906 | | $ 379,695 | | $ 450,979 | | $ 405,863 | | $ 435,116 | | $ 26,701 |
| * | Unaudited. |
| †† | Annualized. |
| (a) | Per share data based on average shares outstanding during the period. |
| (b) | Total investment return is calculated exclusive of sales charges and assumes the reinvestment of dividends and distributions. For periods of less than one year, total return is not annualized. |
| (c) | Without the custody fee reimbursement, net investment income (loss) would have been 2.03%. |
| (d) | In addition to the fees and expenses which the Fund bears directly, it also indirectly bears a pro-rata share of the fees and expenses of the underlying funds in which it invests. Such indirect expenses are not included in the above expense ratios. |
| (e) | Net of interest expense of less than 0.01%. (See Note 6) |
| (f) | Without the custody fee reimbursement, net expenses would have been 1.17%. |
The notes to the financial statements are an integral part of, and should be read in conjunction with, the financial statements.
17
Financial Highlights selected per share data and ratios
| | Six months ended
April 30,
2021* | | Year Ended October 31, |
| Investor Class | 2020 | | 2019 | | 2018 | | 2017 | | 2016 |
| Net asset value at beginning of period | $ 14.89 | | $ 16.99 | | $ 15.63 | | $ 16.24 | | $ 14.17 | | $ 14.01 |
| Net investment income (loss) (a) | 0.16 | | 0.32 | | 0.32 | | 0.30 | | 0.30 | | 0.27 |
| Net realized and unrealized gain (loss) on investments | 3.82 | | (1.82) | | 1.83 | | (0.06) | | 2.10 | | 0.68 |
| Total from investment operations | 3.98 | | (1.50) | | 2.15 | | 0.24 | | 2.40 | | 0.95 |
| Less distributions: | | | | | | | | | | | |
| From net investment income | (0.16) | | (0.30) | | (0.33) | | (0.29) | | (0.27) | | (0.24) |
| From net realized gain on investments | — | | (0.30) | | (0.46) | | (0.56) | | (0.06) | | (0.55) |
| Total distributions | (0.16) | | (0.60) | | (0.79) | | (0.85) | | (0.33) | | (0.79) |
| Net asset value at end of period | $ 18.71 | | $ 14.89 | | $ 16.99 | | $ 15.63 | | $ 16.24 | | $ 14.17 |
| Total investment return (b) | 26.86% | | (8.99)% | | 14.25% | | 1.45% | | 17.12% | | 7.30% |
| Ratios (to average net assets)/Supplemental Data: | | | | | | | | | | | |
| Net investment income (loss) | 1.85%†† | | 2.07% | | 2.01% | | 1.90% | | 1.89% | | 1.92% (c) |
| Net expenses (d) | 1.33%†† | | 1.33% (e) | | 1.30% | | 1.24% | | 1.28% | | 1.34% (f) |
| Expenses (before waiver/reimbursement) (d) | 1.39%†† | | 1.38% | | 1.35% | | 1.29% | | 1.28% | | 1.51% |
| Portfolio turnover rate | 6% | | 29% | | 18% | | 17% | | 28% | | 14% |
| Net assets at end of period (in 000’s) | $ 91,767 | | $ 81,365 | | $ 100,602 | | $ 98,939 | | $ 114,150 | | $ 2,861 |
| * | Unaudited. |
| †† | Annualized. |
| (a) | Per share data based on average shares outstanding during the period. |
| (b) | Total investment return is calculated exclusive of sales charges and assumes the reinvestment of dividends and distributions. For periods of less than one year, total return is not annualized. |
| (c) | Without the custody fee reimbursement, net investment income (loss) would have been 1.91%. |
| (d) | In addition to the fees and expenses which the Fund bears directly, it also indirectly bears a pro-rata share of the fees and expenses of the underlying funds in which it invests. Such indirect expenses are not included in the above expense ratios. |
| (e) | Net of interest expense of less than 0.01%. (See Note 6) |
| (f) | Without the custody fee reimbursement, net expenses would have been 1.35%. |
The notes to the financial statements are an integral part of, and should be read in conjunction with, the financial statements.
| 18 | MainStay Epoch U.S. Equity Yield Fund |
Financial Highlights selected per share data and ratios
| | Six months ended
April 30,
2021* | | Year Ended October 31, | | May 8, 2017^ through
October 31,
2017 |
| Class B | 2020 | | 2019 | | 2018 | |
| Net asset value at beginning of period | $ 14.43 | | $ 16.48 | | $ 15.18 | | $ 15.79 | | $ 14.97 |
| Net investment income (loss) (a) | 0.09 | | 0.21 | | 0.20 | | 0.18 | | 0.07 |
| Net realized and unrealized gain (loss) on investments | 3.71 | | (1.78) | | 1.77 | | (0.06) | | 0.84 |
| Total from investment operations | 3.80 | | (1.57) | | 1.97 | | 0.12 | | 0.91 |
| Less distributions: | | | | | | | | | |
| From net investment income | (0.10) | | (0.18) | | (0.21) | | (0.17) | | (0.09) |
| From net realized gain on investments | — | | (0.30) | | (0.46) | | (0.56) | | — |
| Total distributions | (0.10) | | (0.48) | | (0.67) | | (0.73) | | (0.09) |
| Net asset value at end of period | $ 18.13 | | $ 14.43 | | $ 16.48 | | $ 15.18 | | $ 15.79 |
| Total investment return (b) | 26.42% | | (9.71)% | | 13.40% | | 0.70% | | 6.11% |
| Ratios (to average net assets)/Supplemental Data: | | | | | | | | | |
| Net investment income (loss) | 1.12%†† | | 1.36% | | 1.29% | | 1.18% | | 0.98%†† |
| Net expenses (c) | 2.08%†† | | 2.08% (d) | | 2.05% | | 1.99% | | 2.04%†† |
| Expenses (before waiver/reimbursement) (c) | 2.14%†† | | 2.13% | | 2.10% | | 2.04% | | 2.04%†† |
| Portfolio turnover rate | 6% | | 29% | | 18% | | 17% | | 28% |
| Net assets at end of period (in 000’s) | $ 9,317 | | $ 8,894 | | $ 14,579 | | $ 17,984 | | $ 26,167 |
| * | Unaudited. |
| ^ | Inception date. |
| †† | Annualized. |
| (a) | Per share data based on average shares outstanding during the period. |
| (b) | Total investment return is calculated exclusive of sales charges and assumes the reinvestment of dividends and distributions. For periods of less than one year, total return is not annualized. |
| (c) | In addition to the fees and expenses which the Fund bears directly, it also indirectly bears a pro-rata share of the fees and expenses of the underlying funds in which it invests. Such indirect expenses are not included in the above expense ratios. |
| (d) | Net of interest expense of less than 0.01%. (See Note 6) |
The notes to the financial statements are an integral part of, and should be read in conjunction with, the financial statements.
19
Financial Highlights selected per share data and ratios
| | Six months ended
April 30,
2021* | | Year Ended October 31, |
| Class C | 2020 | | 2019 | | 2018 | | 2017 | | 2016 |
| Net asset value at beginning of period | $ 14.43 | | $ 16.47 | | $ 15.17 | | $ 15.79 | | $ 13.80 | | $ 13.66 |
| Net investment income (loss) (a) | 0.09 | | 0.20 | | 0.20 | | 0.18 | | 0.16 | | 0.15 |
| Net realized and unrealized gain (loss) on investments | 3.71 | | (1.76) | | 1.77 | | (0.07) | | 2.06 | | 0.69 |
| Total from investment operations | 3.80 | | (1.56) | | 1.97 | | 0.11 | | 2.22 | | 0.84 |
| Less distributions: | | | | | | | | | | | |
| From net investment income | (0.10) | | (0.18) | | (0.21) | | (0.17) | | (0.17) | | (0.15) |
| From net realized gain on investments | — | | (0.30) | | (0.46) | | (0.56) | | (0.06) | | (0.55) |
| Total distributions | (0.10) | | (0.48) | | (0.67) | | (0.73) | | (0.23) | | (0.70) |
| Net asset value at end of period | $ 18.13 | | $ 14.43 | | $ 16.47 | | $ 15.17 | | $ 15.79 | | $ 13.80 |
| Total investment return (b) | 26.35% | | (9.66)% | | 13.41% | | 0.63% | | 16.20% | | 6.55% |
| Ratios (to average net assets)/Supplemental Data: | | | | | | | | | | | |
| Net investment income (loss) | 1.14%†† | | 1.35% | | 1.30% | | 1.16% | | 1.06% | | 1.09% (c) |
| Net expenses (d) | 2.08%†† | | 2.08% (e) | | 2.05% | | 1.99% | | 2.04% | | 2.07% (f) |
| Expenses (before waiver/reimbursement) (d) | 2.14%†† | | 2.13% | | 2.10% | | 2.04% | | 2.04% | | 2.24% |
| Portfolio turnover rate | 6% | | 29% | | 18% | | 17% | | 28% | | 14% |
| Net assets at end of period (in 000’s) | $ 15,534 | | $ 17,920 | | $ 30,663 | | $ 40,888 | | $ 54,550 | | $ 8,416 |
| * | Unaudited. |
| †† | Annualized. |
| (a) | Per share data based on average shares outstanding during the period. |
| (b) | Total investment return is calculated exclusive of sales charges and assumes the reinvestment of dividends and distributions. For periods of less than one year, total return is not annualized. |
| (c) | Without the custody fee reimbursement, net investment income (loss) would have been 1.08%. |
| (d) | In addition to the fees and expenses which the Fund bears directly, it also indirectly bears a pro-rata share of the fees and expenses of the underlying funds in which it invests. Such indirect expenses are not included in the above expense ratios. |
| (e) | Net of interest expense of less than 0.01%. (See Note 6) |
| (f) | Without the custody fee reimbursement, net expenses would have been 2.08%. |
The notes to the financial statements are an integral part of, and should be read in conjunction with, the financial statements.
| 20 | MainStay Epoch U.S. Equity Yield Fund |
Financial Highlights selected per share data and ratios
| | Six months ended
April 30,
2021* | | Year Ended October 31, |
| Class I | 2020 | | 2019 | | 2018 | | 2017 | | 2016 |
| Net asset value at beginning of period | $ 15.11 | | $ 17.24 | | $ 15.85 | | $ 16.46 | | $ 14.35 | | $ 14.17 |
| Net investment income (loss) (a) | 0.21 | | 0.41 | | 0.40 | | 0.39 | | 0.37 | | 0.31 |
| Net realized and unrealized gain (loss) on investments | 3.90 | | (1.85) | | 1.86 | | (0.08) | | 2.13 | | 0.72 |
| Total from investment operations | 4.11 | | (1.44) | | 2.26 | | 0.31 | | 2.50 | | 1.03 |
| Less distributions: | | | | | | | | | | | |
| From net investment income | (0.22) | | (0.39) | | (0.41) | | (0.36) | | (0.33) | | (0.30) |
| From net realized gain on investments | — | | (0.30) | | (0.46) | | (0.56) | | (0.06) | | (0.55) |
| Total distributions | (0.22) | | (0.69) | | (0.87) | | (0.92) | | (0.39) | | (0.85) |
| Net asset value at end of period | $ 19.00 | | $ 15.11 | | $ 17.24 | | $ 15.85 | | $ 16.46 | | $ 14.35 |
| Total investment return (b) | 27.30% | | (8.50)% | | 14.76% | | 1.86% | | 17.66% | | 7.76% |
| Ratios (to average net assets)/Supplemental Data: | | | | | | | | | | | |
| Net investment income (loss) | 2.44%†† | | 2.63% | | 2.46% | | 2.37% | | 2.31% | | 2.18% (c) |
| Net expenses (d) | 0.73%†† | | 0.76% (e) | | 0.83% | | 0.81% | | 0.83% | | 0.87% (f) |
| Expenses (before waiver/reimbursement) (d) | 0.84%†† | | 0.84% | | 0.83% | | 0.81% | | 0.83% | | 1.04% |
| Portfolio turnover rate | 6% | | 29% | | 18% | | 17% | | 28% | | 14% |
| Net assets at end of period (in 000’s) | $ 333,034 | | $ 269,100 | | $ 313,261 | | $ 276,587 | | $ 587,427 | | $ 63,995 |
| * | Unaudited. |
| †† | Annualized. |
| (a) | Per share data based on average shares outstanding during the period. |
| (b) | Total investment return is calculated exclusive of sales charges and assumes the reinvestment of dividends and distributions. Class I shares are not subject to sales charges. For periods of less than one year, total return is not annualized. |
| (c) | Without the custody fee reimbursement, net investment income (loss) would have been 2.16%. |
| (d) | In addition to the fees and expenses which the Fund bears directly, it also indirectly bears a pro-rata share of the fees and expenses of the underlying funds in which it invests. Such indirect expenses are not included in the above expense ratios. |
| (e) | Net of interest expense of less than 0.01%. (See Note 6) |
| (f) | Without the custody fee reimbursement, net expenses would have been 0.89%. |
The notes to the financial statements are an integral part of, and should be read in conjunction with, the financial statements.
21
Financial Highlights selected per share data and ratios
| | Six months ended
April 30,
2021* | | Year Ended October 31, | | May 8, 2017^ through
October 31,
2017 |
| Class R1 | 2020 | | 2019 | | 2018 | |
| Net asset value at beginning of period | $ 15.11 | | $ 17.24 | | $ 15.84 | | $ 16.45 | | $ 15.59 |
| Net investment income (loss) (a) | 0.19 | | 0.41 | | 0.38 | | 0.37 | | 0.17 |
| Net realized and unrealized gain (loss) on investments | 3.89 | | (1.88) | | 1.87 | | (0.07) | | 0.86 |
| Total from investment operations | 4.08 | | (1.47) | | 2.25 | | 0.30 | | 1.03 |
| Less distributions: | | | | | | | | | |
| From net investment income | (0.20) | | (0.36) | | (0.39) | | (0.35) | | (0.17) |
| From net realized gain on investments | — | | (0.30) | | (0.46) | | (0.56) | | — |
| Total distributions | (0.20) | | (0.66) | | (0.85) | | (0.91) | | (0.17) |
| Net asset value at end of period | $ 18.99 | | $ 15.11 | | $ 17.24 | | $ 15.84 | | $ 16.45 |
| Total investment return (b) | 27.14% | | (8.66)% | | 14.73% | | 1.69% | | 6.70% |
| Ratios (to average net assets)/Supplemental Data: | | | | | | | | | |
| Net investment income (loss) | 2.19%†† | | 2.54% | | 2.32% | | 2.31% | | 2.15%†† |
| Net expenses (c) | 0.93%†† | | 0.93% (d) | | 0.93% | | 0.92% | | 0.92%†† |
| Expenses (before waiver/reimbursement) (c) | 0.94%†† | | 0.94% | | 0.93% | | 0.92% | | 0.92%†† |
| Portfolio turnover rate | 6% | | 29% | | 18% | | 17% | | 28% |
| Net assets at end of period (in 000’s) | $ 812 | | $ 530 | | $ 1,009 | | $ 778 | | $ 1,835 |
| * | Unaudited. |
| ^ | Inception date. |
| †† | Annualized. |
| (a) | Per share data based on average shares outstanding during the period. |
| (b) | Total investment return is calculated exclusive of sales charges and assumes the reinvestment of dividends and distributions. Class R1 shares are not subject to sales charges. For periods of less than one year, total return is not annualized. |
| (c) | In addition to the fees and expenses which the Fund bears directly, it also indirectly bears a pro-rata share of the fees and expenses of the underlying funds in which it invests. Such indirect expenses are not included in the above expense ratios. |
| (d) | Net of interest expense of less than 0.01%. (See Note 6) |
The notes to the financial statements are an integral part of, and should be read in conjunction with, the financial statements.
| 22 | MainStay Epoch U.S. Equity Yield Fund |
Financial Highlights selected per share data and ratios
| | Six months ended
April 30,
2021* | | Year Ended October 31, | | May 8, 2017^ through
October 31,
2017 |
| Class R2 | 2020 | | 2019 | | 2018 | |
| Net asset value at beginning of period | $ 14.95 | | $ 17.06 | | $ 15.69 | | $ 16.30 | | $ 15.46 |
| Net investment income (loss) (a) | 0.18 | | 0.35 | | 0.34 | | 0.32 | | 0.15 |
| Net realized and unrealized gain (loss) on investments | 3.84 | | (1.84) | | 1.84 | | (0.06) | | 0.84 |
| Total from investment operations | 4.02 | | (1.49) | | 2.18 | | 0.26 | | 0.99 |
| Less distributions: | | | | | | | | | |
| From net investment income | (0.18) | | (0.32) | | (0.35) | | (0.31) | | (0.15) |
| From net realized gain on investments | — | | (0.30) | | (0.46) | | (0.56) | | — |
| Total distributions | (0.18) | | (0.62) | | (0.81) | | (0.87) | | (0.15) |
| Net asset value at end of period | $ 18.79 | | $ 14.95 | | $ 17.06 | | $ 15.69 | | $ 16.30 |
| Total investment return (b) | 27.01% | | (8.87)% | | 14.39% | | 1.51% | | 6.45% |
| Ratios (to average net assets)/Supplemental Data: | | | | | | | | | |
| Net investment income (loss) | 2.16%†† | | 2.23% | | 2.12% | | 2.02% | | 1.85%†† |
| Net expenses (c) | 1.18%†† | | 1.18% (d) | | 1.18% | | 1.17% | | 1.17%†† |
| Expenses (before waiver/reimbursement) (c) | 1.19%†† | | 1.19% | | 1.18% | | 1.17% | | 1.17%†† |
| Portfolio turnover rate | 6% | | 29% | | 18% | | 17% | | 28% |
| Net assets at end of period (in 000’s) | $ 1,485 | | $ 2,135 | | $ 2,812 | | $ 2,665 | | $ 5,506 |
| * | Unaudited. |
| ^ | Inception date. |
| †† | Annualized. |
| (a) | Per share data based on average shares outstanding during the period. |
| (b) | Total investment return is calculated exclusive of sales charges and assumes the reinvestment of dividends and distributions. Class R2 shares are not subject to sales charges. For periods of less than one year, total return is not annualized. |
| (c) | In addition to the fees and expenses which the Fund bears directly, it also indirectly bears a pro-rata share of the fees and expenses of the underlying funds in which it invests. Such indirect expenses are not included in the above expense ratios. |
| (d) | Net of interest expense of less than 0.01%. (See Note 6) |
The notes to the financial statements are an integral part of, and should be read in conjunction with, the financial statements.
23
Financial Highlights selected per share data and ratios
| | Six months ended
April 30,
2021* | | Year Ended October 31, | | May 8, 2017^ through
October 31,
2017 |
| Class R3 | 2020 | | 2019 | | 2018 | |
| Net asset value at beginning of period | $ 14.96 | | $ 17.06 | | $ 15.69 | | $ 16.30 | | $ 15.46 |
| Net investment income (loss) (a) | 0.15 | | 0.31 | | 0.30 | | 0.28 | | 0.12 |
| Net realized and unrealized gain (loss) on investments | 3.84 | | (1.83) | | 1.84 | | (0.07) | | 0.86 |
| Total from investment operations | 3.99 | | (1.52) | | 2.14 | | 0.21 | | 0.98 |
| Less distributions: | | | | | | | | | |
| From net investment income | (0.16) | | (0.28) | | (0.31) | | (0.26) | | (0.14) |
| From net realized gain on investments | — | | (0.30) | | (0.46) | | (0.56) | | — |
| Total distributions | (0.16) | | (0.58) | | (0.77) | | (0.82) | | (0.14) |
| Net asset value at end of period | $ 18.79 | | $ 14.96 | | $ 17.06 | | $ 15.69 | | $ 16.30 |
| Total investment return (b) | 26.77% | | (9.06)% | | 14.11% | | 1.25% | | 6.34% |
| Ratios (to average net assets)/Supplemental Data: | | | | | | | | | |
| Net investment income (loss) | 1.77%†† | | 1.96% | | 1.86% | | 1.75% | | 1.55%†† |
| Net expenses (c) | 1.43%†† | | 1.43% (d) | | 1.43% | | 1.42% | | 1.42%†† |
| Expenses (before waiver/reimbursement) (c) | 1.44%†† | | 1.44% | | 1.43% | | 1.42% | | 1.42%†† |
| Portfolio turnover rate | 6% | | 29% | | 18% | | 17% | | 28% |
| Net assets at end of period (in 000’s) | $ 3,583 | | $ 3,184 | | $ 4,339 | | $ 3,817 | | $ 5,422 |
| * | Unaudited. |
| ^ | Inception date. |
| †† | Annualized. |
| (a) | Per share data based on average shares outstanding during the period. |
| (b) | Total investment return is calculated exclusive of sales charges and assumes the reinvestment of dividends and distributions. Class R3 shares are not subject to sales charges. For periods of less than one year, total return is not annualized. |
| (c) | In addition to the fees and expenses which the Fund bears directly, it also indirectly bears a pro-rata share of the fees and expenses of the underlying funds in which it invests. Such indirect expenses are not included in the above expense ratios. |
| (d) | Net of interest expense of less than 0.01%. (See Note 6) |
The notes to the financial statements are an integral part of, and should be read in conjunction with, the financial statements.
| 24 | MainStay Epoch U.S. Equity Yield Fund |
Financial Highlights selected per share data and ratios
| | Six months ended
April 30,
2021* | | Year Ended October 31, | | May 8, 2017^ through
October 31,
2017 |
| Class R6 | 2020 | | 2019 | | 2018 | |
| Net asset value at beginning of period | $ 15.12 | | $ 17.25 | | $ 15.85 | | $ 16.46 | | $ 15.59 |
| Net investment income (loss) (a) | 0.21 | | 0.42 | | 0.42 | | 0.37 | | 0.23 |
| Net realized and unrealized gain (loss) on investments | 3.89 | | (1.86) | | 1.86 | | (0.04) | | 0.82 |
| Total from investment operations | 4.10 | | (1.44) | | 2.28 | | 0.33 | | 1.05 |
| Less distributions: | | | | | | | | | |
| From net investment income | (0.22) | | (0.39) | | (0.42) | | (0.38) | | (0.18) |
| From net realized gain on investments | — | | (0.30) | | (0.46) | | (0.56) | | — |
| Total distributions | (0.22) | | (0.69) | | (0.88) | | (0.94) | | (0.18) |
| Net asset value at end of period | $ 19.00 | | $ 15.12 | | $ 17.25 | | $ 15.85 | | $ 16.46 |
| Total investment return (b) | 27.22% | | (8.46)% | | 14.94% | | 1.95% | | 6.79% |
| Ratios (to average net assets)/Supplemental Data: | | | | | | | | | |
| Net investment income (loss) | 2.48%†† | | 2.68% | | 2.60% | | 2.31% | | 2.94%†† |
| Net expenses (c) | 0.73%†† | | 0.73% (d) | | 0.73% | | 0.73% | | 0.72%†† |
| Expenses (before waiver/reimbursement) (c) | 0.74%†† | | 0.74% | | 0.73% | | 0.73% | | 0.72%†† |
| Portfolio turnover rate | 6% | | 29% | | 18% | | 17% | | 28% |
| Net assets at end of period (in 000’s) | $ 111,077 | | $ 107,887 | | $ 165,999 | | $ 190,456 | | $ 723 |
| * | Unaudited. |
| ^ | Inception date. |
| †† | Annualized. |
| (a) | Per share data based on average shares outstanding during the period. |
| (b) | Total investment return is calculated exclusive of sales charges and assumes the reinvestment of dividends and distributions. Class R6 shares are not subject to sales charges. For periods of less than one year, total return is not annualized. |
| (c) | In addition to the fees and expenses which the Fund bears directly, it also indirectly bears a pro-rata share of the fees and expenses of the underlying funds in which it invests. Such indirect expenses are not included in the above expense ratios. |
| (d) | Net of interest expense of less than 0.01%. (See Note 6) |
The notes to the financial statements are an integral part of, and should be read in conjunction with, the financial statements.
25
Financial Highlights selected per share data and ratios
| | Six months ended
April 30,
2021* | | August 31, 2020^ through
October 31, |
| SIMPLE Class | 2020 |
| Net asset value at beginning of period | $ 14.89 | | $ 15.57** |
| Net investment income (loss) (a) | 0.13 | | 0.03 |
| Net realized and unrealized gain (loss) on investments | 3.84 | | (0.68) |
| Total from investment operations | 3.97 | | (0.65) |
| Less distributions: | | | |
| From net investment income | (0.11) | | (0.03) |
| Net asset value at end of period | $ 18.75 | | $ 14.89 |
| Total investment return (b) | 26.70% | | (4.16)% |
| Ratios (to average net assets)/Supplemental Data: | | | |
| Net investment income (loss) | 1.57%†† | | 0.98%†† |
| Net expenses (c) | 1.59%†† | | 1.57%†† (d) |
| Expenses (before waiver/reimbursement) (c) | 1.65%†† | | 1.63%†† |
| Portfolio turnover rate | 6% | | 29% |
| Net assets at end of period (in 000’s) | $ 30 | | $ 24 |
| * | Unaudited. |
| ^ | Inception date. |
| ** | Based on the net asset value of Investor Class as of August 31, 2020. |
| †† | Annualized. |
| (a) | Per share data based on average shares outstanding during the period. |
| (b) | Total investment return is calculated exclusive of sales charges and assumes the reinvestment of dividends and distributions. SIMPLE Class shares are not subject to sales charges. For periods of less than one year, total return is not annualized. |
| (c) | In addition to the fees and expenses which the Fund bears directly, it also indirectly bears a pro-rata share of the fees and expenses of the underlying funds in which it invests. Such indirect expenses are not included in the above expense ratios. |
| (d) | Net of interest expense of less than 0.01%. (See Note 6) |
The notes to the financial statements are an integral part of, and should be read in conjunction with, the financial statements.
| 26 | MainStay Epoch U.S. Equity Yield Fund |
Notes to Financial Statements (Unaudited)
Note 1-Organization and Business
MainStay Funds Trust (the “Trust”) was organized as a Delaware statutory trust on April 28, 2009. The Trust is registered under the Investment Company Act of 1940, as amended (the “1940 Act”), as an open-end management investment company, and is comprised of thirty-two funds (collectively referred to as the “Funds”). These financial statements and notes relate to the MainStay Epoch U.S. Equity Yield Fund (the "Fund"), a “diversified” fund, as that term is defined in the 1940 Act, as interpreted or modified by regulatory authorities having jurisdiction, from time to time.
The following table lists the Fund's share classes that have been registered and commenced operations:
| Class | Commenced Operations |
| Class A | February 3, 2009 |
| Investor Class | November 16, 2009 |
| Class B | May 08, 2017 |
| Class C | November 16, 2009 |
| Class I | December 3, 2008 |
| Class R1 | May 8, 2017 |
| Class R2 | May 8, 2017 |
| Class R3 | May 8, 2017 |
| Class R6 | May 8, 2017 |
| SIMPLE Class | August 31, 2020 |
Class B shares of the MainStay Group of Funds are closed to all new purchases as well as additional investments by existing Class B shareholders. Existing Class B shareholders may continue to reinvest dividends and capital gains distributions, as well as exchange their Class B shares for Class B shares of other funds in the MainStay Group of Funds as permitted by the current exchange privileges. Class B shareholders continue to be subject to any applicable contingent deferred sales charge ("CDSC") at the time of redemption. All other features of the Class B shares, including but not limited to the fees and expenses applicable to Class B shares, remain unchanged. Unless redeemed, Class B shareholders will remain in Class B shares of their respective fund until the Class B shares are converted to Class A or Investor Class shares pursuant to the applicable conversion schedule.
Class A and Investor Class shares are offered at net asset value (“NAV”) per share plus an initial sales charge. No initial sales charge applies to investments of $1 million or more (and certain other qualified purchases) in Class A and Investor Class shares. However, a CDSC of 1.00% may be imposed on certain redemptions made within 18 months of the date of purchase on shares that were purchased without an initial sales charge. Class B and Class C shares are offered at NAV without an initial sales charge, although a CDSC that declines depending on the number of years a shareholder held its Class B shares may be imposed on redemptions made within six years of the date of purchase of such shares and a 1.00% CDSC may be imposed on redemptions made within one year of the date of purchase of Class C shares. Class I, Class R1, Class R2, Class R3, Class R6 and SIMPLE Class shares are offered at NAV without a sales charge. Depending upon eligibility, Class B shares convert to either
Class A or Investor Class shares at the end of the calendar quarter eight years after the date they were purchased. In addition, depending upon eligibility, Class C shares convert to either Class A or Investor Class shares at the end of the calendar quarter ten years after the date they were purchased. Additionally, Investor Class shares may convert automatically to Class A shares. SIMPLE Class shares convert to Class A shares, or Investor Class shares if you are not eligible to hold Class A shares, at the end of the calendar quarter, ten years after the date they were purchased. Share class conversions are based on the relevant NAVs of the two classes at the time of the conversion, and no sales load or other charge is imposed. Under certain circumstances and as may be permitted by the Trust’s multiple class plan pursuant to Rule 18f-3 under the 1940 Act, specified share classes of the Fund may be converted to one or more other share classes of the Fund as disclosed in the capital share transactions within these Notes. The classes of shares have the same voting (except for issues that relate solely to one class), dividend, liquidation and other rights, and the same terms and conditions, except that Class B and Class C shares are subject to higher distribution and/or service fees than Class A, Investor Class, Class R2, Class R3 and SIMPLE Class shares under distribution plans pursuant to Rule 12b-1 under the 1940 Act. Class I, Class R1 and Class R6 shares are not subject to a distribution and/or service fee. Class R1, Class R2 and Class R3 shares are subject to a shareholder service fee, which is in addition to fees paid under a distribution plan for Class R1, Class R2 and Class R3 shares.
The Fund's investment objective is to seek current income and capital appreciation.
Note 2–Significant Accounting Policies
The Fund is an investment company and accordingly follows the investment company accounting and reporting guidance of the Financial Accounting Standards Board (“FASB”) Accounting Standard Codification Topic 946 Financial Services—Investment Companies. The Fund prepares its financial statements in accordance with generally accepted accounting principles (“GAAP”) in the United States of America and follows the significant accounting policies described below.
(A) Securities Valuation. Investments are usually valued as of the close of regular trading on the New York Stock Exchange (the "Exchange") (usually 4:00 p.m. Eastern time) on each day the Fund is open for business ("valuation date").
The Board of Trustees of the Trust (the "Board") adopted procedures establishing methodologies for the valuation of the Fund's securities and other assets and delegated the responsibility for valuation determinations under those procedures to the Valuation Committee of the Trust (the “Valuation Committee”). The procedures state that, subject to the oversight of the Board and unless otherwise noted, the responsibility for the day-to-day valuation of portfolio assets (including fair value measurements for the Fund's assets and liabilities) rests with New York Life Investment Management LLC (“New York Life Investments” or the "Manager"), aided to whatever extent necessary by the Subadvisor (as defined in Note 3(A)). To assess the appropriateness of security
Notes to Financial Statements (Unaudited) (continued)
valuations, the Manager, the Subadvisor or the Fund's third-party service provider, who is subject to oversight by the Manager, regularly compares prior day prices, prices on comparable securities and the sale prices to the prior and current day prices and challenges prices with changes exceeding certain tolerance levels with third-party pricing services or broker sources.
The Board authorized the Valuation Committee to appoint a Valuation Subcommittee (the “Subcommittee”) to establish the prices of securities for which market quotations are not readily available or the prices of which are not otherwise readily determinable under the procedures. The Subcommittee meets (in person, via electronic mail or via teleconference) on an as-needed basis. The Valuation Committee meets to ensure that actions taken by the Subcommittee were appropriate.
For those securities valued through either a standardized fair valuation methodology or a fair valuation measurement, the Subcommittee deals with such valuation and the Valuation Committee reviews and affirms, if appropriate, the reasonableness of the valuation based on such methodologies and measurements on a regular basis after considering information that is reasonably available and deemed relevant by the Valuation Committee. Any action taken by the Subcommittee with respect to the valuation of a portfolio security or other asset is submitted for review and ratification (if appropriate) to the Valuation Committee and the Board at the next regularly scheduled meeting.
"Fair value" is defined as the price the Fund would reasonably expect to receive upon selling an asset or liability in an orderly transaction to an independent buyer in the principal or most advantageous market for the asset or liability. Fair value measurements are determined within a framework that establishes a three-tier hierarchy that maximizes the use of observable market data and minimizes the use of unobservable inputs to establish a classification of fair value measurements for disclosure purposes. "Inputs" refer broadly to the assumptions that market participants would use in pricing the asset or liability, including assumptions about risk, such as the risk inherent in a particular valuation technique used to measure fair value using a pricing model and/or the risk inherent in the inputs for the valuation technique. Inputs may be observable or unobservable. Observable inputs reflect the assumptions market participants would use in pricing the asset or liability based on market data obtained from sources independent of the Fund. Unobservable inputs reflect the Fund’s own assumptions about the assumptions market participants would use in pricing the asset or liability based on the information available. The inputs or methodology used for valuing assets or liabilities may not be an indication of the risks associated with investing in those assets or liabilities. The three-tier hierarchy of inputs is summarized below.
| • | Level 1—quoted prices in active markets for an identical asset or liability |
| • | Level 2—other significant observable inputs (including quoted prices for a similar asset or liability in active markets, interest rates and yield curves, prepayment speeds, credit risk, etc.) |
| • | Level 3—significant unobservable inputs (including the Fund's own assumptions about the assumptions that market participants would use in measuring fair value of an asset or liability) |
The level of an asset or liability within the fair value hierarchy is based on the lowest level of an input, both individually and in the aggregate, that is significant to the fair value measurement. The aggregate value by input level of the Fund’s assets and liabilities as of April 30, 2021, is included at the end of the Portfolio of Investments.
The Fund may use third-party vendor evaluations, whose prices may be derived from one or more of the following standard inputs, among others:
| • Broker/dealer quotes | • Benchmark securities |
| • Two-sided markets | • Reference data (corporate actions or material event notices) |
| • Bids/offers | • Monthly payment information |
| • Industry and economic events | • Reported trades |
An asset or liability for which market values cannot be measured using the methodologies described above is valued by methods deemed reasonable in good faith by the Valuation Committee, following the procedures established by the Board, to represent fair value. Under these procedures, the Fund generally uses a market-based approach which may use related or comparable assets or liabilities, recent transactions, market multiples, book values and other relevant information. The Fund may also use an income-based valuation approach in which the anticipated future cash flows of the asset or liability are discounted to calculate fair value. Discounts may also be applied due to the nature and/or duration of any restrictions on the disposition of the asset or liability. Fair value represents a good faith approximation of the value of a security. Fair value determinations involve the consideration of a number of subjective factors, an analysis of applicable facts and circumstances and the exercise of judgment. As a result, it is possible that the fair value for a security determined in good faith in accordance with the Fund's valuation procedures may differ from valuations for the same security determined by other funds using their own valuation procedures. Although the Fund's valuation procedures are designed to value a security at the price the Fund may reasonably expect to receive upon the security's sale in an orderly transaction, there can be no assurance that any fair value determination thereunder would, in fact, approximate the amount that the Fund would actually realize upon the sale of the security or the price at which the security would trade if a reliable market price were readily available. During the six-month period ended April 30, 2021, there were no material changes to the fair value methodologies.
Securities which may be valued in this manner include, but are not limited to: (i) a security for which trading has been halted or suspended; (ii) a debt security that has recently gone into default and for which there is not a current market quotation; (iii) a security of an issuer that has entered into a restructuring; (iv) a security that has been delisted from a national exchange; (v) a security for which the market price is not readily available from a third-party pricing source or, if so provided, does not, in the opinion of the Manager or the Subadvisor, reflect the security's market
| 28 | MainStay Epoch U.S. Equity Yield Fund |
value; (vi) a security subject to trading collars for which no or limited trading takes place; and (vii) a security whose principal market has been temporarily closed at a time when, under normal conditions, it would be open. Securities valued in this manner are generally categorized as Level 3 in the hierarchy. No securities held by the Fund as of April 30, 2021 were fair valued in such a manner.
Certain securities held by the Fund may principally trade in foreign markets. Events may occur between the time the foreign markets close and the time at which the Fund's NAVs are calculated. These events may include, but are not limited to, situations relating to a single issuer in a market sector, significant fluctuations in U.S. or foreign markets, natural disasters, armed conflicts, governmental actions or other developments not tied directly to the securities markets. Should the Manager or the Subadvisor conclude that such events may have affected the accuracy of the last price of such securities reported on the local foreign market, the Subcommittee may, pursuant to procedures adopted by the Board, adjust the value of the local price to reflect the estimated impact on the price of such securities as a result of such events. In this instance, securities are generally categorized as Level 3 in the hierarchy. Additionally, certain foreign equity securities are also fair valued whenever the movement of a particular index exceeds certain thresholds. In such cases, the securities are fair valued by applying factors provided by a third-party vendor in accordance with valuation procedures adopted by the Board and are generally categorized as Level 2 in the hierarchy. No foreign equity securities held by the Fund as of April 30, 2021 were fair valued in such a manner.
Equity securities are valued at the last quoted sales prices as of the close of regular trading on the relevant exchange on each valuation date. Securities that are not traded on the valuation date are valued at the mean of the last quoted bid and ask prices. Prices are normally taken from the principal market in which each security trades. These securities are generally categorized as Level 1 in the hierarchy.
Investments in mutual funds, including money market funds, are valued at their respective NAVs at the close of business each day on the valuation date. These securities are generally categorized as Level 1 in the hierarchy.
Temporary cash investments acquired in excess of 60 days to maturity at the time of purchase are valued using the latest bid prices or using valuations based on a matrix system (which considers such factors as security prices, yields, maturities and ratings), both as furnished by independent pricing services. Temporary cash investments that mature in 60 days or less at the time of purchase ("Short-Term Investments") are valued using the amortized cost method of valuation, unless the use of such method would be inappropriate. The amortized cost method involves valuing a security at its cost on the date of purchase and thereafter assuming a constant amortization to maturity of the difference between such cost and the value on maturity date. Amortized cost approximates the current fair value of a security. Securities valued using the amortized cost method are not valued using quoted prices in an active market and are generally categorized as Level 2 in the hierarchy.
The information above is not intended to reflect an exhaustive list of the methodologies that may be used to value portfolio investments. The valuation procedures permit the use of a variety of valuation methodologies in connection with valuing portfolio investments. The methodology used for a specific type of investment may vary based on the market data available or other considerations. The methodologies summarized above may not represent the specific means by which portfolio investments are valued on any particular business day.
(B) Income Taxes. The Fund's policy is to comply with the requirements of the Internal Revenue Code of 1986, as amended (the “Internal Revenue Code”), applicable to regulated investment companies and to distribute all of its taxable income to the shareholders of the Fund within the allowable time limits.
The Manager evaluates the Fund’s tax positions to determine if the tax positions taken meet the minimum recognition threshold in connection with accounting for uncertainties in income tax positions taken or expected to be taken for the purposes of measuring and recognizing tax liabilities in the financial statements. Recognition of tax benefits of an uncertain tax position is permitted only to the extent the position is “more likely than not” to be sustained assuming examination by taxing authorities. The Manager analyzed the Fund's tax positions taken on federal, state and local income tax returns for all open tax years (for up to three tax years) and has concluded that no provisions for federal, state and local income tax are required in the Fund's financial statements. The Fund's federal, state and local income tax and federal excise tax returns for tax years for which the applicable statutes of limitations have not expired are subject to examination by the Internal Revenue Service and state and local departments of revenue.
(C) Foreign Taxes. The Fund may be subject to foreign taxes on income and other transaction-based taxes imposed by certain countries in which it invests. A portion of the taxes on gains on investments or currency purchases/repatriation may be reclaimable. The Fund will accrue such taxes and reclaims as applicable, based upon its current interpretation of tax rules and regulations that exist in the markets in which it invests.
The Fund may be subject to taxation on realized capital gains, repatriation proceeds and other transaction-based taxes imposed by certain countries in which it invests. The Fund will accrue such taxes as applicable based upon its current interpretation of tax rules and regulations that exist in the market in which it invests. Capital gains taxes relating to positions still held are reflected as a liability in the Statement of Assets and Liabilities, as well as an adjustment to the Fund's net unrealized appreciation (depreciation). Taxes related to capital gains realized, if any, are reflected as part of net realized gain (loss) in the Statement of Operations. Changes in tax liabilities related to capital gains taxes on unrealized investment gains, if any, are reflected as part of the change in net unrealized appreciation (depreciation) on investments in the Statement of Operations. Transaction-based charges are generally assessed as a percentage of the transaction amount.
Notes to Financial Statements (Unaudited) (continued)
(D) Dividends and Distributions to Shareholders. Dividends and distributions are recorded on the ex-dividend date. The Fund intends to declare and pay dividends from net investment income, if any, at least quarterly and distributions from net realized capital and currency gains, if any, at least annually. Unless a shareholder elects otherwise, all dividends and distributions are reinvested at NAV in the same class of shares of the Fund. Dividends and distributions to shareholders are determined in accordance with federal income tax regulations and may differ from determinations using GAAP.
(E) Security Transactions and Investment Income. The Fund records security transactions on the trade date. Realized gains and losses on security transactions are determined using the identified cost method. Dividend income is recognized on the ex-dividend date, net of any foreign tax withheld at the source, and interest income is accrued as earned using the effective interest rate method. Distributions received from real estate investment trusts may be classified as dividends, capital gains and/or return of capital.
Investment income and realized and unrealized gains and losses on investments of the Fund are allocated pro rata to the separate classes of shares based upon their relative net assets on the date the income is earned or realized and unrealized gains and losses are incurred.
(F) Expenses. Expenses of the Trust are allocated to the individual Funds in proportion to the net assets of the respective Funds when the expenses are incurred, except where direct allocations of expenses can be made. Expenses (other than transfer agent expenses and fees incurred under the shareholder services plans and/or the distribution plans further discussed in Note 3(B)) are allocated to separate classes of shares pro rata based upon their relative net assets on the date the expenses are incurred. The expenses borne by the Fund, including those of related parties to the Fund, are shown in the Statement of Operations.
Additionally, the Fund may invest in mutual funds, which are subject to management fees and other fees that may cause the costs of investing in mutual funds to be greater than the costs of owning the underlying securities directly. These indirect expenses of mutual funds are not included in the amounts shown as expenses in the Statement of Operations or in the expense ratios included in the Financial Highlights.
(G) Use of Estimates. In preparing financial statements in conformity with GAAP, the Manager makes estimates and assumptions that affect the reported amounts and disclosures in the financial statements. Actual results could differ from those estimates and assumptions.
(H) Securities Lending. In order to realize additional income, the Fund may engage in securities lending, subject to the limitations set forth in the 1940 Act and relevant guidance by the staff of the Securities and Exchange Commission (“SEC”). If the Fund engages in securities lending, the Fund will lend through its custodian, JPMorgan Chase Bank, N.A., ("JPMorgan"), acting as securities lending agent on behalf of the Fund. Under the current arrangement, JPMorgan will manage the Fund's collateral in accordance with the securities lending agency agreement between the Fund and JPMorgan, and indemnify the Fund against
counterparty risk. The loans will be collateralized by cash (which may be invested in a money market fund) and/or non-cash collateral (which may include U.S. Treasury securities and/or U.S. government agency securities issued or guaranteed by the United States government or its agencies or instrumentalities) at least equal at all times to the market value of the securities loaned. The Fund bears the risk of delay in recovery of, or loss of rights in, the securities loaned. The Fund may also record a realized gain or loss on securities deemed sold due to a borrower’s inability to return securities on loan. The Fund bears the risk of any loss on investment of cash collateral. The Fund will receive compensation for lending its securities in the form of fees or it will retain a portion of interest earned on the investment of any cash collateral. The Fund will also continue to receive interest and dividends on the securities loaned and any gain or loss in the market price of the securities loaned that may occur during the term of the loan will be for the account of the Fund. Income earned from securities lending activities, if any, is reflected in the Statement of Operations. As of April 30, 2021, the Fund did not have any portfolio securities on loan.
Prior to November 23, 2020, these services were provided by State Street Bank and Trust Company (“State Street”).
(I) Large Transaction Risks. From time to time, the Fund may receive large purchase or redemption orders from affiliated or unaffiliated mutual funds or other investors. Such large transactions could have adverse effects on the Fund’s performance if the Fund were required to sell securities or invest cash at times when it otherwise would not do so. This activity could also accelerate the realization of capital gains and increase the Fund’s transaction costs. The Fund has adopted procedures designed to mitigate the negative impacts of such large transactions, but there can be no assurance that these procedures will be effective.
(J) Indemnifications. Under the Trust’s organizational documents, its officers and trustees are indemnified against certain liabilities that may arise out of performance of their duties to the Trust. Additionally, in the normal course of business, the Fund enters into contracts with third-party service providers that contain a variety of representations and warranties and that may provide general indemnifications. The Fund's maximum exposure under these arrangements is unknown, as this would involve future claims that may be made against the Fund that have not yet occurred. The Manager believes that the risk of loss in connection with these potential indemnification obligations is remote. However, there can be no assurance that material liabilities related to such obligations will not arise in the future, which could adversely impact the Fund.
Note 3–Fees and Related Party Transactions
(A) Manager and Subadvisor. New York Life Investments, a registered investment adviser and an indirect, wholly-owned subsidiary of New York Life Insurance Company (“New York Life”), serves as the Fund’s Manager, pursuant to an Amended and Restated Management Agreement (“Management Agreement”). The Manager provides offices, conducts clerical, recordkeeping and bookkeeping services and keeps most of the financial and accounting records required to be maintained by the Fund.
| 30 | MainStay Epoch U.S. Equity Yield Fund |
Except for the portion of salaries and expenses that are the responsibility of the Fund, the Manager pays the salaries and expenses of all personnel affiliated with the Fund and certain operational expenses of the Fund. The Fund reimburses New York Life Investments in an amount equal to the portion of the compensation of the Chief Compliance Officer attributable to the Fund. Epoch Investment Partners, Inc. (“Epoch” or the “Subadvisor”), a registered investment adviser, serves as Subadvisor to the Fund and is responsible for the day-to-day portfolio management of the Fund. Pursuant to the terms of an Amended and Restated Subadvisory Agreement (“Subadvisory Agreement”) between New York Life Investments and Epoch, New York Life Investments pays for the services of the Subadvisor.
Pursuant to the Management Agreement, the Fund pays the Manager a monthly fee for the services performed and the facilities furnished at an annual rate of the Fund’s average daily net assets as follows: 0.70% up to $500 million; 0.68% from $500 million to $1 billion; 0.66% from $1 billion to $2 billion; and 0.65% in excess of $2 billion. During the six-month period ended April 30, 2021, the effective management fee rate was 0.69% of the Fund’s average daily net assets, exclusive of any applicable waivers/reimbursements.
New York Life Investments has contractually agreed to waive fees and/or reimburse expenses so that Total Annual Fund Operating Expenses (excluding taxes, interest, litigation, extraordinary expenses, brokerage and other transaction expenses relating to the purchase or sale of portfolio investments, and acquired (underlying) fund fees and expenses) of Class I do not exceed 0.73%. In addition, New York Life Investments will waive fees and/or reimburse expenses so that Total Annual Fund Operating Expenses (excluding taxes, interest, litigation, extraordinary expenses, brokerage and other transaction expenses relating to the purchase or sale of portfolio investments, and acquired (underlying) fund fees and expenses) of Class R6 do not exceed those of Class I. These agreements will remain in effect until February 28, 2022, and shall renew automatically for one-year terms unless New York Life Investments provides written notice of termination prior to the start of the next term or upon approval of the Board.
During the six-month period ended April 30, 2021, New York Life Investments earned fees from the Fund in the amount of $3,355,885 and waived fees and/or reimbursed certain class specific expenses in the amount of $224,688 and paid the Subadvisor in the amount of $1,581,970.
JPMorgan provides sub-administration and sub-accounting services to the Fund pursuant to an agreement with New York Life Investments. These services include calculating the daily NAVs of the Fund, maintaining the general ledger and sub-ledger accounts for the calculation of the Fund's NAVs, and assisting New York Life Investments in conducting various aspects of the Fund's administrative operations. For providing these services to the Fund, JPMorgan is compensated by New York Life Investments.
Prior to November 23, 2020, these services were provided by State Street.
Pursuant to an agreement between the Trust and New York Life Investments, New York Life Investments is responsible for providing or procuring certain regulatory reporting services for the Fund. The Fund will reimburse New York Life Investments for the actual costs incurred by New York Life Investments in connection with providing or procuring these services for the Fund.
(B) Distribution and Service Fees. The Trust, on behalf of the Fund, has entered into a distribution agreement with NYLIFE Distributors LLC (the “Distributor”), an affiliate of New York Life Investments. The Fund has adopted distribution plans (the “Plans”) in accordance with the provisions of Rule 12b-1 under the 1940 Act.
Pursuant to the Class A and Investor Class Plans, the Distributor receives a monthly distribution fee from the Class A and Investor Class shares at an annual rate of 0.25% of the average daily net assets of the Class A and Investor Class shares for distribution and/or service activities as designated by the Distributor. Pursuant to the Class B and Class C Plans, the Distributor receives a monthly distribution fee at an annual rate of 0.75% of the average daily net assets of the Class B and Class C shares, along with a service fee at an annual rate of 0.25% of the average daily net assets of the Class B and Class C shares, for a total 12b-1 fee of 1.00%. Pursuant to the Class R3 and SIMPLE Class shares Plans, Class R3 and SIMPLE Class shares pay the Distributor a monthly fee at an annual rate of 0.25% of the average daily net assets of the Class R3 and SIMPLE Class shares, along with a service fee at an annual rate of 0.25% of the average daily net assets of the Class R3 and SIMPLE Class shares, for a total 12b-1 fee of 0.50%. Class I, Class R1 and Class R6 shares are not subject to a distribution and/or service fee.
The Plans provide that the distribution and service fees are payable to the Distributor regardless of the amounts actually expended by the Distributor for distribution of the Fund's shares and service activities.
In accordance with the Shareholder Services Plans for the Class R1, Class R2 and Class R3 shares, the Manager has agreed to provide, through its affiliates or independent third parties, various shareholder and administrative support services to shareholders of the Class R1, Class R2 and Class R3 shares. For its services, the Manager, its affiliates or independent third-party service providers are entitled to a shareholder service fee accrued daily and paid monthly at an annual rate of 0.10% of the average daily net assets of the Class R1, Class R2 and Class R3 shares. This is in addition to any fees paid under the Class R2 and Class R3 Plans.
During the six-month period ended April 30, 2021, shareholder service fees incurred by the Fund were as follows:
| |
| Class R1 | $ 372 |
| Class R2 | 805 |
| Class R3 | 1,661 |
Notes to Financial Statements (Unaudited) (continued)
(C) Sales Charges. The Fund was advised by the Distributor that the amount of initial sales charges retained on sales of Class A and Investor Class shares during the six-month period ended April 30, 2021, were $28,082 and $6,524, respectively.
The Fund was also advised that the Distributor retained CDSCs on redemptions of Class A, Investor Class, Class B and Class C shares during the six-month period ended April 30, 2021, of $4,832, $1, $1,370 and $668, respectively.
(D) Transfer, Dividend Disbursing and Shareholder Servicing Agent. NYLIM Service Company LLC, an affiliate of New York Life Investments, is the Fund's transfer, dividend disbursing and shareholder servicing agent pursuant to an agreement between NYLIM Service Company LLC and the Trust. NYLIM Service Company LLC has entered into an agreement with DST Asset Manager Solutions, Inc. ("DST"), pursuant to which DST performs certain transfer agent services on behalf of NYLIM Service Company LLC. New York Life Investments has contractually agreed to limit the transfer agency expenses charged to the Fund’s share classes to a maximum of 0.35% of that share class’s average daily net assets on an annual basis after deducting any applicable Fund or class-level expense reimbursement or small account fees. This agreement will remain in effect until August 31, 2021 for SIMPLE Class shares and February 28, 2022 for all other share classes, and shall renew automatically for one-year terms unless New York Life Investments provides written notice of termination prior to the start of the next term or upon approval of the Board. During the six-month period ended April 30, 2021, transfer agent expenses incurred by the Fund and
any reimbursements, pursuant to the aforementioned Transfer Agency expense limitation agreement, were as follows:
| Class | Expense | Waived |
| Class A | $209,883 | $ — |
| Investor Class | 181,564 | (23,385) |
| Class B | 18,783 | (2,410) |
| Class C | 36,865 | (4,723) |
| Class I | 149,855 | — |
| Class R1 | 362 | — |
| Class R2 | 782 | — |
| Class R3 | 1,616 | — |
| Class R6 | 2,204 | — |
| SIMPLE Class | 56 | (7) |
(E) Small Account Fee. Shareholders with small accounts adversely impact the cost of providing transfer agency services. In an effort to reduce total transfer agency expenses, the Fund has implemented a small account fee on certain types of accounts. As described in the Fund's prospectus, certain shareholders with an account balance of less than $1,000 ($5,000 for Class A share accounts) are charged an annual per account fee of $20 (assessed semi-annually), the proceeds from which offset transfer agent fees as reflected in the Statement of Operations. This small account fee will not apply to certain types of accounts as described further in the Fund’s prospectus.
(F) Investments in Affiliates (in 000’s). During the six-month period ended April 30, 2021, purchases and sales transactions, income earned from investments and shares held of investment companies managed by New York Life Investments or its affiliates were as follows:
| Affiliated Investment Companies | Value,
Beginning
of Period | Purchases
at Cost | Proceeds
from
Sales | Net
Realized
Gain/(Loss)
on Sales | Change in
Unrealized
Appreciation/
(Depreciation) | Value,
End of
Period | Dividend
Income | Other
Distributions | Shares
End of
Period |
| MainStay U.S. Government Liquidity Fund | $ 28,294 | $ 83,989 | $ (92,749) | $ — | $ — | $ 19,534 | $ 1 | $ — | 19,534 |
(G) Capital. As of April 30, 2021, New York Life and its affiliates beneficially held shares of the Fund with the values and percentages of net assets as follows:
| SIMPLE Class | $30,353 | 100.0% |
Note 4-Federal Income Tax
As of April 30, 2021, the cost and unrealized appreciation (depreciation) of the Fund’s investment portfolio, including applicable derivative contracts and other financial instruments, as determined on a federal income tax basis, were as follows:
| | Federal Tax
Cost | Gross
Unrealized
Appreciation | Gross
Unrealized
(Depreciation) | Net
Unrealized
Appreciation/
(Depreciation) |
| Investments | $766,051,222 | $296,620,051 | $(19,795,129) | $276,824,922 |
During the year ended October 31, 2020, the tax character of distributions paid as reflected in the Statements of Changes in Net Assets was as follows:
| | 2020 |
| Distributions paid from: | |
| Ordinary Income | $21,923,519 |
| Long-Term Capital Gains | 19,140,559 |
| Total | $41,064,078 |
Note 5–Custodian
JPMorgan is the custodian of cash and securities held by the Fund. Custodial fees are charged to the Fund based on the Fund's net assets and/or the market value of securities held by the Fund and the number of certain transactions incurred by the Fund.
| 32 | MainStay Epoch U.S. Equity Yield Fund |
Prior to November 23, 2020, these services were provided by State Street. The services provided by State Street were a direct expense of the Fund and are included in the Statement of Operations as Custodian fees which totaled $1,489 for the period November 1, 2020 through November 22, 2020.
Note 6–Line of Credit
The Fund and certain other funds managed by New York Life Investments maintain a line of credit with a syndicate of banks in order to secure a source of funds for temporary purposes to meet unanticipated or excessive redemption requests.
Effective July 28, 2020, under the credit agreement (the “Credit Agreement”), the aggregate commitment amount is $600,000,000 with an additional uncommitted amount of $100,000,000. The commitment fee is an annual rate of 0.15% of the average commitment amount payable quarterly, regardless of usage, to JPMorgan, who serves as the agent to the syndicate. The commitment fee is allocated among the Fund and certain other funds managed by New York Life Investments based upon their respective net assets and other factors. Interest on any revolving credit loan is charged based upon the Federal Funds Rate or the one-month London Interbank Offered Rate ("LIBOR"), whichever is higher. The Credit Agreement expires on July 27, 2021, although the Fund, certain other funds managed by New York Life Investments and the syndicate of banks may renew the Credit Agreement for an additional year on the same or different terms or enter into a credit agreement with a different syndicate of banks. Prior to July 28, 2020, the aggregate commitment amount and the commitment fee were the same as those under the current Credit Agreement, but State Street served as agent to the syndicate. During the six-month period ended April 30, 2021, there were no borrowings made or outstanding with respect to the Fund under the Credit Agreement or the credit agreement for which State Street served as agent.
Note 7–Interfund Lending Program
Pursuant to an exemptive order issued by the SEC, the Fund, along with certain other funds managed by New York Life Investments, may participate in an interfund lending program. The interfund lending program provides an alternative credit facility that permits the Fund and certain other funds managed by New York Life Investments to lend or borrow money for temporary purposes directly to or from one another, subject to the conditions of the exemptive order. During the six-month period ended April 30, 2021, there were no interfund loans made or outstanding with respect to the Fund.
Note 8–Purchases and Sales of Securities (in 000’s)
During the six-month period ended April 30, 2021, purchases and sales of securities, other than short-term securities, were $53,689 and $91,970, respectively.
Note 9–Capital Share Transactions
Transactions in capital shares for the six-month period ended April 30, 2021 and the year ended October 31, 2020, were as follows:
| Class A | Shares | Amount |
| Period ended April 30, 2021: | | |
| Shares sold | 1,378,584 | $ 23,976,941 |
| Shares issued to shareholders in reinvestment of distributions | 270,863 | 4,690,445 |
| Shares redeemed | (2,169,233) | (37,242,162) |
| Net increase (decrease) in shares outstanding before conversion | (519,786) | (8,574,776) |
| Shares converted into Class A (See Note 1) | 583,464 | 10,292,192 |
| Shares converted from Class A (See Note 1) | (24,183) | (413,826) |
| Net increase (decrease) | 39,495 | $ 1,303,590 |
| Year ended October 31, 2020: | | |
| Shares sold | 2,332,674 | $ 36,272,057 |
| Shares issued to shareholders in reinvestment of distributions | 1,043,950 | 16,404,472 |
| Shares redeemed | (4,998,543) | (75,708,799) |
| Net increase (decrease) in shares outstanding before conversion | (1,621,919) | (23,032,270) |
| Shares converted into Class A (See Note 1) | 622,803 | 10,121,700 |
| Shares converted from Class A (See Note 1) | (36,798) | (537,284) |
| Net increase (decrease) | (1,035,914) | $ (13,447,854) |
| |
| Investor Class | Shares | Amount |
| Period ended April 30, 2021: | | |
| Shares sold | 92,780 | $ 1,592,789 |
| Shares issued to shareholders in reinvestment of distributions | 50,150 | 860,908 |
| Shares redeemed | (243,764) | (4,171,718) |
| Net increase (decrease) in shares outstanding before conversion | (100,834) | (1,718,021) |
| Shares converted into Investor Class (See Note 1) | 51,385 | 904,332 |
| Shares converted from Investor Class (See Note 1) | (511,514) | (8,979,916) |
| Net increase (decrease) | (560,963) | $ (9,793,605) |
| Year ended October 31, 2020: | | |
| Shares sold | 270,284 | $ 4,138,236 |
| Shares issued to shareholders in reinvestment of distributions | 219,312 | 3,451,003 |
| Shares redeemed | (525,089) | (8,114,014) |
| Net increase (decrease) in shares outstanding before conversion | (35,493) | (524,775) |
| Shares converted into Investor Class (See Note 1) | 89,418 | 1,358,880 |
| Shares converted from Investor Class (See Note 1) | (509,950) | (8,361,449) |
| Net increase (decrease) | (456,025) | $ (7,527,344) |
| |
Notes to Financial Statements (Unaudited) (continued)
| Class B | Shares | Amount |
| Period ended April 30, 2021: | | |
| Shares sold | 3,567 | $ 59,768 |
| Shares issued to shareholders in reinvestment of distributions | 3,550 | 58,654 |
| Shares redeemed | (37,240) | (617,055) |
| Net increase (decrease) in shares outstanding before conversion | (30,123) | (498,633) |
| Shares converted from Class B (See Note 1) | (72,325) | (1,215,049) |
| Net increase (decrease) | (102,448) | $ (1,713,682) |
| Year ended October 31, 2020: | | |
| Shares sold | 7,068 | $ 110,395 |
| Shares issued to shareholders in reinvestment of distributions | 25,338 | 394,504 |
| Shares redeemed | (133,598) | (1,997,777) |
| Net increase (decrease) in shares outstanding before conversion | (101,192) | (1,492,878) |
| Shares converted from Class B (See Note 1) | (167,336) | (2,481,456) |
| Net increase (decrease) | (268,528) | $ (3,974,334) |
| |
| Class C | Shares | Amount |
| Period ended April 30, 2021: | | |
| Shares sold | 52,105 | $ 876,852 |
| Shares issued to shareholders in reinvestment of distributions | 6,987 | 115,142 |
| Shares redeemed | (386,569) | (6,563,475) |
| Net increase (decrease) in shares outstanding before conversion | (327,477) | (5,571,481) |
| Shares converted from Class C (See Note 1) | (57,554) | (995,285) |
| Net increase (decrease) | (385,031) | $ (6,566,766) |
| Year ended October 31, 2020: | | |
| Shares sold | 235,502 | $ 3,705,877 |
| Shares issued to shareholders in reinvestment of distributions | 52,734 | 818,324 |
| Shares redeemed | (881,029) | (13,010,985) |
| Net increase (decrease) in shares outstanding before conversion | (592,793) | (8,486,784) |
| Shares converted from Class C (See Note 1) | (26,684) | (385,344) |
| Net increase (decrease) | (619,477) | $ (8,872,128) |
| |
| Class I | Shares | Amount |
| Period ended April 30, 2021: | | |
| Shares sold | 1,586,172 | $ 27,532,301 |
| Shares issued to shareholders in reinvestment of distributions | 216,102 | 3,785,424 |
| Shares redeemed | (2,103,220) | (36,840,572) |
| Net increase (decrease) in shares outstanding before conversion | (300,946) | (5,522,847) |
| Shares converted into Class I (See Note 1) | 23,574 | 407,552 |
| Net increase (decrease) | (277,372) | $ (5,115,295) |
| Year ended October 31, 2020: | | |
| Shares sold | 6,046,881 | $ 89,114,571 |
| Shares issued to shareholders in reinvestment of distributions | 781,886 | 12,338,626 |
| Shares redeemed | (7,211,459) | (107,323,610) |
| Net increase (decrease) in shares outstanding before conversion | (382,692) | (5,870,413) |
| Shares converted into Class I (See Note 1) | 19,579 | 287,919 |
| Net increase (decrease) | (363,113) | $ (5,582,494) |
| |
| Class R1 | Shares | Amount |
| Period ended April 30, 2021: | | |
| Shares sold | 15,600 | $ 271,853 |
| Shares issued to shareholders in reinvestment of distributions | 514 | 8,993 |
| Shares redeemed | (8,463) | (153,761) |
| Net increase (decrease) | 7,651 | $ 127,085 |
| Year ended October 31, 2020: | | |
| Shares sold | 8,452 | $ 133,176 |
| Shares issued to shareholders in reinvestment of distributions | 1,949 | 31,602 |
| Shares redeemed | (33,874) | (451,774) |
| Net increase (decrease) | (23,473) | $ (286,996) |
| |
| Class R2 | Shares | Amount |
| Period ended April 30, 2021: | | |
| Shares sold | 5,309 | $ 89,717 |
| Shares issued to shareholders in reinvestment of distributions | 1,222 | 20,913 |
| Shares redeemed | (70,267) | (1,179,726) |
| Net increase (decrease) | (63,736) | $ (1,069,096) |
| Year ended October 31, 2020: | | |
| Shares sold | 22,786 | $ 344,684 |
| Shares issued to shareholders in reinvestment of distributions | 6,091 | 96,110 |
| Shares redeemed | (50,907) | (757,593) |
| Net increase (decrease) | (22,030) | $ (316,799) |
| |
| 34 | MainStay Epoch U.S. Equity Yield Fund |
| Class R3 | Shares | Amount |
| Period ended April 30, 2021: | | |
| Shares sold | 16,922 | $ 294,591 |
| Shares issued to shareholders in reinvestment of distributions | 1,881 | 32,430 |
| Shares redeemed | (41,064) | (696,198) |
| Net increase (decrease) | (22,261) | $ (369,177) |
| Year ended October 31, 2020: | | |
| Shares sold | 42,848 | $ 656,589 |
| Shares issued to shareholders in reinvestment of distributions | 8,905 | 141,099 |
| Shares redeemed | (93,160) | (1,445,161) |
| Net increase (decrease) | (41,407) | $ (647,473) |
| |
| Class R6 | Shares | Amount |
| Period ended April 30, 2021: | | |
| Shares sold | 40,303 | $ 701,303 |
| Shares issued to shareholders in reinvestment of distributions | 80,189 | 1,401,462 |
| Shares redeemed | (1,412,042) | (24,495,234) |
| Net increase (decrease) | (1,291,550) | $ (22,392,469) |
| Year ended October 31, 2020: | | |
| Shares sold | 927,546 | $ 14,403,318 |
| Shares issued to shareholders in reinvestment of distributions | 433,166 | 6,826,494 |
| Shares redeemed | (3,848,764) | (59,597,170) |
| Net increase (decrease) in shares outstanding before conversion | (2,488,052) | (38,367,358) |
| Shares converted from Class R6 (See Note 1) | (232) | (2,966) |
| Net increase (decrease) | (2,488,284) | $ (38,370,324) |
| |
| SIMPLE Class | Shares | Amount |
| Period ended April 30, 2021: | | |
| Shares issued to shareholders in reinvestment of distributions | 10 | $ 173 |
| Net increase (decrease) | 10 | $ 173 |
| Period ended October 31, 2020:(a) | | |
| Shares sold | 1,605 | $ 25,000 |
| Shares issued to shareholders in reinvestment of distributions | 4 | 53 |
| Net increase (decrease) | 1,609 | $ 25,053 |
| (a) | The inception date of the class was August 31, 2020. |
Note 10–Recent Accounting Pronouncement
In March 2020, the Financial Accounting Standards Board issued Accounting Standards Update 2020-04 (“ASU 2020-04”), which provides optional guidance to ease the potential accounting burden associated with transitioning away from LIBOR and other reference rates that are expected to be discontinued. ASU 2020-04 was effective immediately upon release of the update on March 12, 2020 and remains effective
through December 31, 2022. At this time, the Manager is evaluating the implications of certain other provisions of ASU 2020-04 related to new disclosure requirements and any impact on the financial statement disclosures has not yet been determined.
Note 11–Other Matters
An outbreak of COVID-19, first detected in December 2019, has developed into a global pandemic and has resulted in travel restrictions, closure of international borders, certain businesses and securities markets, restrictions on securities trading activities, prolonged quarantines, supply chain disruptions, and lower consumer demand, as well as general concern and uncertainty. The continued impact of COVID-19 is uncertain and could further adversely affect the global economy, national economies, individual issuers and capital markets in unforeseeable ways and result in a substantial and extended economic downturn. Developments that disrupt global economies and financial markets, such as COVID-19, may magnify factors that affect the Fund's performance.
Note 12–Subsequent Events
In connection with the preparation of the financial statements of the Fund as of and for the six-month period ended April 30, 2021, events and transactions subsequent to April 30, 2021, through the date the financial statements were issued have been evaluated by the Manager for possible adjustment and/or disclosure. No subsequent events requiring financial statement adjustment or disclosure have been identified.
Board Consideration and Approval of Management Agreement and Subadvisory Agreement (Unaudited)
The continuation of the Management Agreement with respect to the MainStay Epoch U.S. Equity Yield Fund (“Fund”) and New York Life Investment Management LLC (“New York Life Investments”) and the Subadvisory Agreement between New York Life Investments and Epoch Investment Partners, Inc. (“Epoch”) with respect to the Fund (together, “Advisory Agreements”), following an initial term of up to two years, is subject to annual review and approval by the Board of Trustees of MainStay Funds Trust (“Board” of the “Trust”) in accordance with Section 15 of the Investment Company Act of 1940, as amended (“1940 Act”). At its December 9–10, 2020 meeting, the Board, including the Trustees who are not an “interested person” (as such term is defined in the 1940 Act) of the Trust (“Independent Trustees”) voting separately, unanimously approved the continuation of each of the Advisory Agreements for a one-year period.
In reaching the decision to approve the continuation of each of the Advisory Agreements, the Board considered information furnished by New York Life Investments and Epoch in connection with an annual contract review process undertaken by the Board that took place at meetings of the Board and its Contracts Committee during September 2020 through December 2020, as well as other information furnished to the Board and its Committees throughout the year, as deemed relevant by the Trustees. Information requested by and furnished to the Board for consideration in connection with the contract review process included, among other items, reports on the Fund and “peer funds” prepared by Strategic Insight Mutual Fund Research and Consulting, LLC (“Strategic Insight”), an independent third-party service provider engaged by the Board to report objectively on the Fund’s investment performance, management fee and total expenses. The Board also considered information on the fees charged to other investment advisory clients of New York Life Investments and/or Epoch that follow investment strategies similar to those of the Fund, if any, and, when applicable, the rationale for any differences in the Fund’s management and subadvisory fees and the fees charged to those other investment advisory clients. In addition, the Board considered information furnished by New York Life Investments and Epoch in response to requests prepared on behalf of the Board, and in consultation with the Independent Trustees, by independent legal counsel to the Independent Trustees, which encompassed a variety of topics, including those summarized below.
The Board took into account information provided in connection with its meetings throughout the year, including, among other items, information regarding the legal standards and fiduciary obligations applicable to its consideration of the continuation of each of the Advisory Agreements and investment performance reports on the Fund as well as presentations from New York Life Investments and Epoch personnel. The Board also took into account other information received from New York Life Investments throughout the year, including, among other items, periodic reports on legal and compliance matters, risk management, portfolio turnover, brokerage commissions and non-advisory services provided to the Fund by New York Life Investments. The contract review process, including the structure and format for materials provided to the Board, has been developed in consultation with the Board. The Independent
Trustees also met in executive sessions with their independent legal counsel and, for a portion thereof, with senior management of New York Life Investments.
In addition to information provided to the Board throughout the year, the Board received information in connection with its June 2020 meeting provided specifically in response to requests prepared on behalf of the Board, and in consultation with the Independent Trustees, by independent legal counsel regarding the Fund’s distribution arrangements. In addition, the Board received information regarding the Fund’s asset levels, share purchase and redemption activity and the payment of Rule 12b-1 and/or other fees by applicable share classes of the Fund, among other information.
In considering the continuation of each of the Advisory Agreements, the Trustees reviewed and evaluated the information and factors they believed to reasonably be necessary and appropriate in light of legal advice furnished to them by independent legal counsel and through the exercise of their own business judgment. Although individual Trustees may have weighed certain factors or information differently, the factors considered by the Board are described in greater detail below and include, among other factors: (i) the nature, extent and quality of the services provided to the Fund by New York Life Investments and Epoch; (ii) the qualifications of the portfolio managers of the Fund and the historical investment performance of the Fund, New York Life Investments and Epoch; (iii) the costs of the services provided, and profits realized, by New York Life Investments and Epoch from their relationships with the Fund; (iv) the extent to which economies of scale have been realized or may be realized as the Fund grows and the extent to which economies of scale have benefited or may benefit the Fund’s shareholders; and (v) the reasonableness of the Fund’s management and subadvisory fees and total ordinary operating expenses. Although the Board recognized that comparisons between the Fund’s fees and expenses and those of other funds are imprecise given different terms of agreements, variations in fund strategies and other factors, the Board considered the reasonableness of the Fund’s management fee and total ordinary operating expenses as compared to the peer funds identified by Strategic Insight. Throughout their considerations, the Trustees acknowledged the commitment of New York Life Investments and its affiliates to serve the MainStay Group of Funds, as well as their capacity, experience, resources, financial stability and reputations. The Trustees also acknowledged the entrepreneurial and other risks assumed by New York Life Investments in sponsoring and managing the Fund.
The Trustees noted that, throughout the year, the Trustees are afforded an opportunity to ask questions of, and request additional information or materials from, New York Life Investments and Epoch. The Board’s decision with respect to each of the Advisory Agreements may have also been based, in part, on the Board’s knowledge of New York Life Investments and Epoch resulting from, among other things, the Board’s consideration of each of the Advisory Agreements in prior years, the advisory agreements for other funds in the MainStay Group of Funds, the Board’s review throughout the year of the performance and operations of other funds in the MainStay Group of Funds and each Trustee’s business
| 36 | MainStay Epoch U.S. Equity Yield Fund |
judgment and industry experience. In addition to considering the above-referenced factors, the Board observed that in the marketplace there are a range of investment options available to the Fund’s shareholders and such shareholders, having had the opportunity to consider other investment options, have chosen to invest in the Fund.
The factors that figured prominently in the Board’s decision to approve the continuation of each of the Advisory Agreements during its December 9–10, 2020 meeting are summarized in more detail below, and the Board did not consider any factor or information controlling in reaching such decision.
Nature, Extent and Quality of Services Provided by New York Life Investments and Epoch
The Board examined the nature, extent and quality of the services that New York Life Investments provides to the Fund. The Board evaluated New York Life Investments’ experience and capabilities in serving as manager of the Fund and considered that the Fund operates in a “manager-of-managers” structure. The Board also considered New York Life Investments’ responsibilities and services provided pursuant to this structure, including evaluating the performance of Epoch, making recommendations to the Board as to whether the Subadvisory Agreement should be renewed, modified or terminated and periodically reporting to the Board regarding the results of New York Life Investments’ evaluation and monitoring functions. The Board noted that New York Life Investments manages other mutual funds, serves a variety of other investment advisory clients, including other pooled investment vehicles, and has experience overseeing mutual fund service providers, including subadvisors. The Board considered the experience of senior personnel at New York Life Investments providing management and administrative and other non-advisory services to the Fund as well as New York Life Investments’ reputation and financial condition. The Board observed that New York Life Investments devotes significant resources and time to providing management and non-advisory services to the Fund, including New York Life Investments’ supervision and due diligence reviews of Epoch and ongoing analysis of, and interactions with, Epoch with respect to, among other things, the Fund’s investment performance and risks as well as Epoch’s investment capabilities and subadvisory services with respect to the Fund.
The Board also considered the range of services that New York Life Investments provides to the Fund under the terms of the Management Agreement, including: (i) fund accounting and ongoing supervisory services provided by New York Life Investments’ Fund Administration and Accounting Group; (ii) investment supervisory and analytical services provided by New York Life Investments’ Investment Consulting Group; (iii) compliance services provided by the Trust’s Chief Compliance Officer as well as New York Life Investments’ compliance department, including supervision and implementation of the Fund’s compliance program; (iv) legal services provided by New York Life Investments’ Office of the General Counsel; and (v) risk management monitoring and analysis by compliance and investment personnel. The Board noted that New York Life Investments provides certain other non-advisory services to the Fund.
In addition, the Board considered New York Life Investments’ willingness to invest in personnel, infrastructure, technology, operational enhancements, cyber security, information security, shareholder privacy resources and business continuity planning designed to benefit the Fund and noted that New York Life Investments is responsible for compensating the Trust’s officers, except for a portion of the salary of the Trust’s Chief Compliance Officer. The Board recognized that New York Life Investments has provided an increasingly broad array of non-advisory services to the MainStay Group of Funds as a result of regulatory and other developments, including in connection with the designation of New York Life Investments as the administrator of the MainStay Group of Funds’ liquidity risk management program adopted under the 1940 Act. The Board considered benefits to shareholders from being part of the MainStay Group of Funds, including the privilege of exchanging investments between the same class of shares of funds in the MainStay Group of Funds, including without the imposition of a sales charge (if any).
The Board also examined the nature, extent and quality of the investment advisory services that Epoch provides to the Fund and considered the terms of each of the Advisory Agreements. The Board evaluated Epoch’s experience in serving as subadvisor to the Fund and advising other portfolios and Epoch’s track record and experience in providing investment advisory services, the experience of investment advisory, senior management and administrative personnel at Epoch and New York Life Investments’ and Epoch’s overall resources, legal and compliance environment, capabilities and history. In addition to information provided in connection with quarterly meetings with the Trust’s Chief Compliance Officer, the Board considered information regarding the compliance policies and procedures of New York Life Investments and Epoch and acknowledged their commitment to further developing and strengthening compliance programs relating to the Fund. The Board reviewed Epoch’s ability to attract and retain qualified investment professionals and willingness to invest in personnel to service and support the Fund. In this regard, the Board considered the experience of the Fund’s portfolio managers, the number of accounts managed by the portfolio managers and the method for compensating the portfolio managers.
In addition, the Board considered discussions with New York Life Investments regarding the implementation of its business continuity plans and recognized steps taken by New York Life Investments and Epoch to continue to provide the same nature, extent and quality of services to the Fund during the COVID-19 pandemic.
Based on these considerations, the Board concluded that the Fund would likely continue to benefit from the nature, extent and quality of these services.
Investment Performance
In evaluating the Fund’s investment performance, the Board considered investment performance results over various periods in light of the Fund’s investment objective, strategies and risks. The Board considered investment reports on, and analysis of, the Fund’s performance provided
Board Consideration and Approval of Management Agreement and Subadvisory Agreement (Unaudited) (continued)
to the Board throughout the year. These reports include, among other items, information on the Fund’s gross and net returns, the Fund’s investment performance compared to relevant investment categories and the Fund’s benchmarks, the Fund’s risk-adjusted investment performance and the Fund’s investment performance as compared to peer funds, as appropriate, as well as portfolio attribution information and commentary on the effect of market conditions. The Board also considered information provided by Strategic Insight showing the investment performance of the Fund as compared to peer funds.
The Board also gave weight to its discussions with senior management at New York Life Investments concerning the Fund’s investment performance attributable to Epoch as well as discussions between the Fund’s portfolio managers and the members of the Board’s Investment Committee, which generally occur on an annual basis. In addition, the Board considered any specific actions that New York Life Investments or Epoch had taken, or had agreed to take, to seek to enhance Fund investment performance and the results of those actions.
Based on these considerations, the Board concluded that its review of the Fund’s investment performance and related information supported a determination to approve the continuation of each of the Advisory Agreements.
Costs of the Services Provided, and Profits Realized, by New York Life Investments and Epoch
The Board considered the costs of the services provided under each of the Advisory Agreements. The Board also considered the profits realized by New York Life Investments and its affiliates and Epoch due to their relationships with the Fund. The Board considered that Epoch’s subadvisory fee had been negotiated at arm’s-length by New York Life Investments and that this fee is paid by New York Life Investments, not the Fund, and the relevance of Epoch’s profitability was considered by the Trustees in that context. On this basis, the Board primarily considered the costs and profitability for New York Life Investments and its affiliates with respect to the Fund.
In addition, the Board acknowledged the difficulty in obtaining reliable comparative data about mutual fund managers’ profitability because such information generally is not publicly available and may be impacted by numerous factors, including the structure of a fund manager’s organization, the types of funds it manages, the methodology used to allocate certain fixed costs to specific funds and the manager’s capital structure and costs of capital.
In evaluating the costs of the services provided by New York Life Investments and Epoch and profits realized by New York Life Investments and its affiliates and Epoch, the Board considered, among other factors, each party’s continuing investments in, or willingness to invest in, personnel, systems, equipment and other resources and infrastructure to support and further enhance the management of the Fund, and that New York Life Investments is responsible for paying the subadvisory fee for the Fund. The Board also considered the financial resources of New York Life Investments and Epoch and acknowledged that New York Life
Investments and Epoch must be in a position to attract and retain experienced professional personnel and to maintain a strong financial position for New York Life Investments and Epoch to continue to provide high-quality services to the Fund. The Board recognized that the Fund benefits from the allocation of certain fixed costs among the funds in the MainStay Group of Funds, among other expected benefits resulting from its relationship with New York Life Investments.
The Board considered information regarding New York Life Investments’ methodology for calculating profitability and allocating costs provided by New York Life Investments in connection with the fund profitability analysis presented to the Board. The Board previously engaged an independent consultant to review the methods used to allocate costs among the funds in the MainStay Group of Funds. The Board noted that the independent consultant had concluded that New York Life Investments’ methods for allocating costs and procedures for estimating overall profitability of the relationship with the funds in the MainStay Group of Funds are reasonable and that New York Life Investments continued to use the same method of calculating profit and allocating costs since the independent consultant’s review. The Board recognized the difficulty in calculating and evaluating a manager’s profitability with respect to the Fund and noted that other profitability methodologies may also be reasonable.
The Board also considered certain fall-out benefits that may be realized by New York Life Investments and its affiliates due to their relationships with the Fund, including reputational and other indirect benefits. In this regard, the Board also requested and received information from New York Life Investments concerning other material business relationships between Epoch and its affiliates and New York Life Investments and its affiliates. In addition, the Board considered its review of a money market fund advised by New York Life Investments and an affiliated subadvisor that serves as an investment option for the Fund, including the potential rationale for and costs associated with investments in this money market fund by the Fund, if any, and considered information from New York Life Investments that the nature and type of specific investment advisory services provided to this money market fund are distinct from, or in addition to, the investment advisory services provided to the Fund.
The Board observed that, in addition to fees earned by New York Life Investments for managing the Fund, New York Life Investments’ affiliates also earn revenues from serving the Fund in various other capacities, including as the Fund’s transfer agent and distributor. The Board considered information about these other revenues and their impact on the profitability of the relationship with the Fund to New York Life Investments and its affiliates. The Board noted that, although it assessed the overall profitability of the Fund to New York Life Investments and its affiliates as part of the contract review process, when considering the reasonableness of the fee paid to New York Life Investments and its affiliates under the Management Agreement, the Board considered the profitability of New York Life Investments’ relationship with the Fund on a pre-tax basis and without regard to distribution expenses incurred by New York Life Investments from its own resources.
| 38 | MainStay Epoch U.S. Equity Yield Fund |
After evaluating the information deemed relevant by the Trustees, the Board concluded that any profits realized by New York Life Investments and its affiliates due to their relationships with the Fund were not excessive. With respect to Epoch, the Board considered that any profits realized by Epoch due to its relationship with the Fund are the result of arm’s-length negotiations between New York Life Investments and Epoch, acknowledging that any such profits are based on the subadvisory fee paid to Epoch by New York Life Investments, not the Fund.
Management and Subadvisory Fees and Total Ordinary Operating Expenses
The Board evaluated the reasonableness of the fee paid under each of the Advisory Agreements and the Fund’s total ordinary operating expenses. The Board primarily considered the reasonableness of the management fee paid by the Fund to New York Life Investments, because the subadvisory fee paid to Epoch is paid by New York Life Investments, not the Fund. The Board also considered the reasonableness of the subadvisory fee paid by New York Life Investments and the amount of the management fee retained by New York Life Investments.
In assessing the reasonableness of the Fund’s fees and expenses, the Board primarily considered comparative data provided by Strategic Insight on the fees and expenses charged by similar mutual funds managed by other investment advisers. In addition, the Board considered information provided by New York Life Investments and Epoch on fees charged to other investment advisory clients, including institutional separate accounts and/or other funds that follow investment strategies similar to those of the Fund, if any. The Board considered the similarities and differences in the contractual management fee schedules of the Fund and these similarly-managed accounts and/or funds, taking into account the rationale for any differences in fee schedules. The Board also took into account explanations provided by New York Life Investments about the more extensive scope of services provided to registered investment companies, such as the Fund, as compared with other investment advisory clients. Additionally, the Board considered the impact of contractual breakpoints, voluntary waivers and expense limitation arrangements on the Fund’s net management fee and expenses. The Board also considered that in proposing fees for the Fund, New York Life Investments considers the competitive marketplace for mutual funds.
The Board noted that, outside of the Fund’s management fee and the fees charged under a share class’s Rule 12b-1 and/or shareholder services plans, a share class’s most significant “other expenses” are transfer agent fees. Transfer agent fees are charged to the Fund based on the number of shareholder accounts (a “per-account” fee). The Board took into account information from New York Life Investments regarding the reasonableness of the Fund’s transfer agent fee schedule, including industry data demonstrating that the per-account fees that NYLIM Service Company LLC, an affiliate of New York Life Investments and the Fund’s transfer agent, charges the Fund are within the range of per-account fees charged by transfer agents to other mutual funds. In addition, the Board considered NYLIM Service Company LLC’s profitability in connection with the transfer agent services it provides to the Fund. The Board also took
into account information received from NYLIM Service Company LLC regarding the sub-transfer agency payments it made to intermediaries in connection with the provision of sub-transfer agency services to the Fund.
The Board considered that, because the Fund’s transfer agent fees are billed on a per-account basis, the impact of transfer agent fees on a share class’s expense ratio may be more significant in cases where the share class has a high number of small accounts. The Board considered the extent to which transfer agent fees comprised total expenses of the Fund. The Board acknowledged the role that the MainStay Group of Funds historically has played in serving the investment needs of New York Life Insurance Company customers, who often maintain smaller account balances than other shareholders of funds, and the impact of small accounts on the expense ratios of Fund share classes. The Board also recognized measures that it and New York Life Investments have taken to mitigate the effect of small accounts on the expense ratios of Fund share classes, including through the imposition of an expense limitation on net transfer agency expenses. The Board noted that, for purposes of allocating transfer agency fees and expenses, each retail fund in the MainStay Group of Funds combines the shareholder accounts of its Class A, A2, I, R1, R2 and R3 shares (as applicable) into one group and the shareholder accounts of its Investor Class, SIMPLE Class and Class B, C and C2 shares (as applicable) into another group. The Board also noted that the per-account fees attributable to each group of share classes is then allocated among the constituent share classes based on relative net assets and that a MainStay Fund’s Class R6 shares, if any, are not combined with any other share class for this purpose. The Board considered New York Life Investments’ rationale with respect to these groupings and previously received a report from an independent consultant engaged to conduct comparative analysis of these groupings. The Board also considered that NYLIM Service Company LLC had waived its contractual cost of living adjustments during the past seven years.
Based on the factors outlined above, the Board concluded that the Fund’s management fee and total ordinary operating expenses were within a range that is competitive and support a conclusion that these fees and expenses are reasonable.
Economies of Scale
The Board considered information regarding economies of scale, including whether the Fund’s expense structure permits economies of scale to be appropriately shared with the Fund’s shareholders. The Board also considered a report from New York Life Investments, previously prepared at the request of the Board, that addressed economies of scale, including with respect to the mutual fund business generally and the various ways in which the benefits of economies of scale may be shared with the funds in the MainStay Group of Funds. Although the Board recognized the difficulty of determining economies of scale with precision, the Board acknowledged that economies of scale may be shared with the Fund in a number of ways, including, for example, through the imposition of management fee breakpoints, initially setting management fee rates at scale or making additional investments to enhance services. The Board
Board Consideration and Approval of Management Agreement and Subadvisory Agreement (Unaudited) (continued)
reviewed information from New York Life Investments showing how the Fund’s management fee schedule compared to fee schedules of other funds and accounts managed by New York Life Investments. The Board also reviewed information from Strategic Insight showing how the Fund’s management fee schedule compared with fees paid for similar services by peer funds at varying asset levels.
Based on this information, the Board concluded that economies of scale are appropriately reflected for the benefit of the Fund’s shareholders through the Fund’s expense structure and other methods to share benefits from economies of scale.
Conclusion
On the basis of the information and factors summarized above, among other information and factors deemed relevant by the Trustees, and the evaluation thereof, the Board, including the Independent Trustees voting separately, unanimously voted to approve the continuation of each of the Advisory Agreements.
| 40 | MainStay Epoch U.S. Equity Yield Fund |
Discussion of the Operation and Effectiveness of the Fund's Liquidity Risk Management Program (Unaudited)
In compliance with Rule 22e-4 under the Investment Company Act of 1940, as amended (the “Liquidity Rule”), the Fund has adopted and implemented a liquidity risk management program (the “Program”), which New York Life Investment Management LLC believes is reasonably designed to assess and manage the Fund's liquidity risk (the risk that the Fund could not meet requests to redeem shares issued by the Fund without significant dilution of remaining investors’ interests in the Fund). The Board of Trustees of MainStay Funds Trust (the "Board") designated New York Life Investment Management LLC as administrator of the Program (the “Administrator”). The Administrator has established a Liquidity Risk Management Committee to assist the Administrator in the implementation and day-to-day administration of the Program and to otherwise support the Administrator in fulfilling its responsibilities under the Program.
At a meeting of the Board held on March 8, 2021, the Administrator provided the Board with a written report addressing the Program’s operation and assessing its adequacy and effectiveness of implementation for the period from January 1, 2020 through December 31, 2020 (the "Review Period"), as required under the Liquidity Rule. The report noted that the Administrator concluded that (i) the Program operated effectively to assess and manage the Fund's liquidity risk, (ii) the Program has been adequately and effectively implemented to monitor and, as applicable, respond to the Fund's liquidity developments and (iii) the Fund's investment strategy continues to be appropriate for an open-end fund. In addition, the report discussed notable events that impacted liquidity risk during the Review Period, including the COVID-19 pandemic and the resulting economic shutdown.
In accordance with the Program, the Fund's liquidity risk is assessed no less frequently than annually taking into consideration certain factors, as applicable, such as (i) investment strategy and liquidity of portfolio investments, (ii) short-term and long-term cash flow projections and (iii) holdings of cash and cash equivalents, as well as borrowing arrangements and other funding sources. Certain factors are considered under both normal and reasonably foreseeable stressed conditions.
Each Fund portfolio investment is classified into one of four liquidity categories. The classification is based on a determination of the number of days it is reasonably expected to take to convert the investment into cash, or sell or dispose of the investment, in current market conditions without significantly changing the market value of the investment. The Administrator has delegated liquidity classification determinations to the Fund’s subadvisor, subject to appropriate oversight by the Administrator, and classification determinations are made by taking into account the Fund's reasonably anticipated trade size, various market, trading and investment-specific considerations, as well as market depth, and, in certain cases, third-party vendor data.
The Liquidity Rule requires funds that do not primarily hold assets that are highly liquid investments to adopt a minimum amount of net assets that must be invested in highly liquid investments that are assets (an “HLIM”). In addition, the Liquidity Rule limits a fund's investments in illiquid investments. Specifically, the Liquidity Rule prohibits acquisition of illiquid investments if doing so would result in a fund holding more than 15% of its net assets in illiquid investments that are assets. The Program includes provisions reasonably designed to determine, periodically review and comply with the HLIM requirement, as applicable, and to comply with the 15% limit on illiquid investments.
There can be no assurance that the Program will achieve its objectives under all circumstances in the future. Please refer to the Fund's prospectus for more information regarding the Fund's exposure to liquidity risk and other risks to which it may be subject.
Proxy Voting Record
The Fund is required to file with the Securities and Exchange Commissions's ("SEC") its proxy voting records for the 12-month period ending June 30 on Form N-PX. The most recent Form N-PX or proxy voting record is available free of charge upon request by calling 800-624-6782; visiting the MainStay Funds’ website at newyorklifeinvestments.com; or visiting the SEC’s website at www.sec.gov.
Shareholder Reports and Quarterly Portfolio Disclosure
The Fund is required to file its complete schedule of portfolio holdings with the SEC 60 days after its first and third fiscal quarter on Form N-PORT. The Fund's holdings report is available free of charge upon request by calling New York Life Investments at 800-624-6782.
| 42 | MainStay Epoch U.S. Equity Yield Fund |
Equity
U.S. Equity
MainStay Epoch U.S. Equity Yield Fund
MainStay MacKay S&P 500 Index Fund
MainStay Winslow Large Cap Growth Fund
MainStay WMC Enduring Capital Fund
MainStay WMC Growth Fund
MainStay WMC Small Companies Fund
MainStay WMC Value Fund
International Equity
MainStay Epoch International Choice Fund
MainStay MacKay International Equity Fund
MainStay WMC International Research Equity Fund
Emerging Markets Equity
MainStay Candriam Emerging Markets Equity Fund
Global Equity
MainStay Epoch Capital Growth Fund
MainStay Epoch Global Equity Yield Fund
Fixed Income
Taxable Income
MainStay Candriam Emerging Markets Debt Fund
MainStay Floating Rate Fund
MainStay MacKay High Yield Corporate Bond Fund
MainStay MacKay Short Duration High Yield Fund
MainStay MacKay Strategic Bond Fund
MainStay MacKay Total Return Bond Fund
MainStay MacKay U.S. Infrastructure Bond Fund
MainStay Short Term Bond Fund
Tax-Exempt Income
MainStay MacKay California Tax Free Opportunities Fund1
MainStay MacKay High Yield Municipal Bond Fund
MainStay MacKay Intermediate Tax Free Bond Fund
MainStay MacKay New York Tax Free Opportunities Fund2
MainStay MacKay Short Term Municipal Fund
MainStay MacKay Tax Free Bond Fund
Money Market
MainStay Money Market Fund
Mixed Asset
MainStay Balanced Fund
MainStay Income Builder Fund
MainStay MacKay Convertible Fund
Speciality
MainStay CBRE Global Infrastructure Fund
MainStay CBRE Real Estate Fund
MainStay Cushing MLP Premier Fund
Asset Allocation
MainStay Conservative Allocation Fund
MainStay Conservative ETF Allocation Fund
MainStay Defensive ETF Allocation Fund
MainStay Equity Allocation Fund
MainStay Equity ETF Allocation Fund
MainStay Growth Allocation Fund
MainStay Growth ETF Allocation Fund
MainStay Moderate Allocation Fund
MainStay Moderate ETF Allocation Fund
Manager
New York Life Investment Management LLC
New York, New York
Subadvisors
Candriam Belgium S.A.3
Brussels, Belgium
Candriam Luxembourg S.C.A.3
Strassen, Luxembourg
CBRE Clarion Securities LLC
Radnor, Pennsylvania
Cushing Asset Management, LP
Dallas, Texas
Epoch Investment Partners, Inc.
New York, New York
MacKay Shields LLC3
New York, New York
NYL Investors LLC3
New York, New York
Wellington Management Company LLP
Boston, Massachusetts
Winslow Capital Management, LLC
Minneapolis, Minnesota
Legal Counsel
Dechert LLP
Washington, District of Columbia
Independent Registered Public Accounting Firm
KPMG LLP
Philadelphia, Pennsylvania
Distributor
NYLIFE Distributors LLC3
Jersey City, New Jersey
Custodian
JPMorgan Chase Bank, N.A.
New York, New York
1.
This Fund is registered for sale in AZ, CA, NV, OR, TX, UT, WA and MI (Class A and I shares only), and CO, FL, GA, HI, ID, MA, MD, NH, NJ and NY (Class I shares only).
| 2. | This Fund is registered for sale in CA, CT, DE, FL, MA, NJ, NY and VT. |
| 3. | An affiliate of New York Life Investment Management LLC. |
Not part of the Semiannual Report
For more information
800-624-6782
newyorklifeinvestments.com
“New York Life Investments” is both a service mark, and the common trade name, of certain investment advisors affiliated with New York Life Insurance Company. The MainStay Funds® are managed by New York Life Investment Management LLC and distributed by NYLIFE Distributors LLC, 30 Hudson Street, Jersey City, NJ 07302, a wholly owned subsidiary of New York Life Insurance Company. NYLIFE Distributors LLC is a Member FINRA/SIPC.
©2021 NYLIFE Distributors LLC. All rights reserved.
| 1736843MS071-21 | MSEUE10-06/21 |
(NYLIM) NL239
MainStay Floating Rate Fund
Message from the President and Semiannual Report
Unaudited | April 30, 2021
Sign up for e-delivery of your shareholder reports. For full details on e-delivery, including who can participate and what you can receive via e-delivery,
please log in to newyorklifeinvestments.com/accounts.
| Not FDIC/NCUA Insured | Not a Deposit | May Lose Value | No Bank Guarantee | Not Insured by Any Government Agency |
This page intentionally left blank
Message from the President
With the approval of COVID-19 vaccines and the passage of relief packages by the U.S. Congress, economic prospects improved during the reporting period, and investor risk appetite increased, benefiting both equities and fixed-income markets. Despite some volatility stemming from a sell-off in longer-dated Treasury securities, the stock market and higher-risk segments of the fixed-income market posted gains for the six months ended April 30, 2021.
By the beginning of the reporting period, the economy had made tremendous progress from the second quarter of 2020, when economic activity plunged. But uncertainty about when vaccines would be available and how quickly they could be administered left investors unsure about the economic outlook.
With the approval of several vaccines in November, the outlook brightened and investors became less risk-averse. Anticipating the likely end of the pandemic and a continuation of the economic recovery, they began to see opportunities in investment-grade and high-yield bonds and more cyclical segments of the stock market. The $900 billion relief and stimulus package passed in December provided further assurance.
In January, the Federal Reserve opted to leave interest rates unchanged, pointing to some uncertainty about the pace of the global recovery. Officials also noted that inflation remained low, citing oil prices in particular.
In March, President Biden signed the $1.9 billion American Rescue Plan, which, among other provisions, called for payments of $1,400 for those earning less than $75,000 per year, plus $1,400 per dependent. This, combined with the Federal Reserve’s new tolerance for inflation and an anticipated $2 trillion infrastructure spending bill, added to growing concerns about higher prices. Supply shortages in some markets caused some prices to soar, heightening concerns further.
In fixed-income markets, an improving economic outlook and rising inflation expectations led to a sell-off in longer-term Treasuries, with the result that the yield on the 10-year note rose sharply, particularly in February and March. Investment grade corporate bonds were also affected. Early in the reporting period, they performed well as investors shifted out of Treasuries, but as the reporting period progressed, they faltered. Longer-dated securities issued in recent years at historically low interest rates became especially unattractive.
High-yield bonds remained steady, supported by more favorable yields and an improved economic outlook, which reduced their perceived risk. Municipal bonds produced modest gains, and
although the sell-off in Treasuries produced some volatility early in 2021, stronger-than-expected tax revenues, $350 billion in financial support from the federal government, and the possibility of an increase in federal income tax rates appeared to buoy the market late in the reporting period.
Inflation concerns and volatility in the Treasury market led to a shift in equities markets. Although the S&P 500® Index, a widely followed measure of U.S. equities, posted double-digit gains and hit a record high, the rise of Treasury yields disrupted valuations, especially those of growth stocks. Technology companies that saw their valuations soar amid the work-from-home trend in 2020 suffered large declines.
But the fiscal stimulus and continued accommodation from the Federal Reserve gave investors confidence the economic recovery would continue. Combined with the sky-high valuations in technology and growth stocks, this increased the appeal of more cyclical and value-oriented shares. As a result, value stocks outperformed growth stocks during the reporting period.
Reflecting the shift in investor sentiment, the performance of S&P 500® Index sectors varied widely. While the information technology sector kept up with the broader market, it lagged cyclical sectors such as energy and financials, which led the way. The shift was further reflected in the performance of small-cap stocks, which outperformed large caps. While developed markets kept pace with the U.S. market, lagging economic and pandemic recoveries appeared to weigh on emerging markets late in the reporting period.
With the lockdown restrictions lifting in the U.S. and the pandemic easing in many regions, we at New York Life Investments are looking forward to a return to a more normal economy. We anticipate that over the next several years, a variety of trends will likely offer long-term investors many attractive opportunities. With this in mind, we continue to develop products and services to help you to take advantage of these trends, manage your risks, and ultimately meet your investment goals.
Sincerely,
Kirk C. Lehneis
President
The opinions expressed are as of the date of this report and are subject to change. There is no guarantee that any forecast made will come to pass. This material does not constitute investment advice and is not intended as an endorsement of any specific investment. Past performance is no guarantee of future results.
Not part of the Semiannual Report
Investors should refer to the Fund’s Summary Prospectus and/or Prospectus and consider the Fund’s investment objectives, strategies, risks, charges and expenses carefully before investing. The Summary Prospectus and/or Prospectus contain this and other information about the Fund. You may obtain copies of the Fund’s Summary Prospectus, Prospectus and Statement of Additional Information free of charge, upon request, by calling toll-free 800-624-6782, by writing to NYLIFE Distributors LLC, Attn: MainStay Marketing Department, 30 Hudson Street, Jersey City, NJ 07302 or by sending an e-mail to MainStayShareholderServices@nylim.com. These documents are also available via the MainStay Funds’ website at newyorklifeinvestments.com. Please read the Fund’s Summary Prospectus and/or Prospectus carefully before investing.
Investment and Performance Comparison (Unaudited)
Performance data quoted represents past performance. Past performance is no guarantee of future results. Because of market volatility and other factors, current performance may be lower or higher than the figures shown. Investment return and principal value will fluctuate, and as a result, when shares are redeemed, they may be worth more or less than their original cost. The graph below depicts the historical performance of Class I shares of the Fund. Performance will vary from class to class based on differences in class-specific expenses and sales charges. For performance information current to the most recent month-end, please call 800-624-6782 or visit newyorklifeinvestments.com.
The performance table and graph do not reflect the deduction of taxes that a shareholder would pay on distributions or Fund share redemptions. Total returns reflect maximum applicable sales charges as indicated in the table below, if any, changes in share price, and reinvestment of dividend and capital gain distributions. The graph assumes the initial investment amount shown below and reflects the deduction of all sales charges that would have applied for the period of investment. Performance figures may reflect certain fee waivers and/or expense limitations, without which total returns may have been lower. For more information on share classes and current fee waivers and/or expense limitations (if any), please refer to the Notes to Financial Statements.
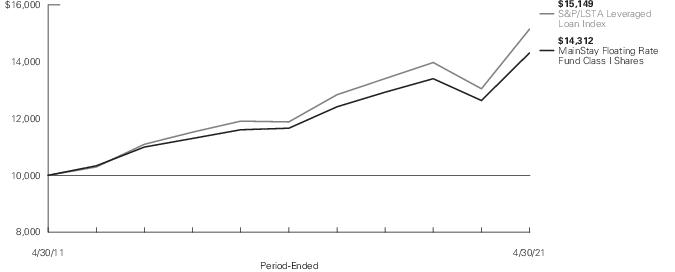
| Average Annual Total Returns for the Period-Ended April 30, 2021 |
| Class | Sales Charge | | Inception
Date | Six
Months | One
Year | Five
Years | Ten Years
or Since
Inception | Gross
Expense
Ratio1 |
| Class A Shares | Maximum 3% Initial Sales Charge | With sales charges | 5/3/2004 | 1.33% | 9.61% | 3.29% | 3.08% | 1.14% |
| | | Excluding sales charges | | 4.47 | 13.00 | 3.92 | 3.39 | 1.14 |
| Investor Class Shares2 | Maximum 2.5% Initial Sales Charge | With sales charges | 2/28/2008 | 1.83 | 9.58 | 3.28 | 3.06 | 1.13 |
| | | Excluding sales charges | | 4.44 | 12.97 | 3.91 | 3.37 | 1.13 |
| Class B Shares3 | Maximum 3% CDSC | With sales charges | 5/3/2004 | 1.05 | 9.11 | 3.16 | 2.61 | 1.88 |
| | if Redeemed Within the First Four Years of Purchase | Excluding sales charges | | 4.05 | 12.11 | 3.16 | 2.61 | 1.88 |
| Class C Shares | Maximum 1% CDSC | With sales charges | 5/3/2004 | 3.17 | 11.25 | 3.16 | 2.61 | 1.88 |
| | if Redeemed Within One Year of Purchase | Excluding sales charges | | 4.17 | 12.25 | 3.16 | 2.61 | 1.88 |
| Class I Shares | No Sales Charge | | 5/3/2004 | 4.60 | 13.29 | 4.18 | 3.65 | 0.89 |
| Class R3 Shares | No Sales Charge | | 2/29/2016 | 4.40 | 12.73 | 3.58 | 4.27 | 1.49 |
| Class R6 Shares | No Sales Charge | | 2/28/2019 | 4.81 | 13.64 | 3.96 | N/A | 0.66 |
| SIMPLE Class Shares | No Sales Charge | | 8/31/2020 | 4.43 | 5.02 | N/A | N/A | 1.38 |
| 1. | The gross expense ratios presented reflect the Fund’s “Total Annual Fund Operating Expenses” from the most recent Prospectus, as supplemented and may differ from other expense ratios disclosed in this report. |
| 2. | Prior to June 30, 2020, the maximum initial sales charge was 3.0%, which is reflected in the average annual total return figures shown. |
| 3. | Class B shares are closed to all new purchases as well as additional investments by existing Class B shareholders. |
The footnotes on the next page are an integral part of the table and graph and should be carefully read in conjunction with them.
| Benchmark Performance | Six
Months | One
Year | Five
Years | Ten
Years |
| S&P/LSTA Leveraged Loan Index1 | 5.99% | 16.10% | 4.98% | 4.24% |
| Morningstar Bank Loan Category Average2 | 5.35 | 13.59 | 3.86 | 3.52 |
| 1. | The S&P/LSTA Leveraged Loan Index is the Fund’s primary broad-based securities market index for comparison purposes. The S&P/LSTA Leveraged Loan Index is a broad-based index designed to reflect the performance of U.S. dollar facilities in the leveraged loan market. Results assume reinvestment of all dividends and capital gains. An investment cannot be made directly in an index. |
| 2. | The Morningstar Bank Loan Category Average is representative of funds that invest in floating-rate bank loans instead of bonds. In exchange for their credit risk, these loans offer high interest payments that typically float above a common short-term benchmark. Results are based on average total returns of similar funds with all dividends and capital gain distributions reinvested. |
The footnotes on the preceding page are an integral part of the table and graph and should be carefully read in conjunction with them.
| 6 | MainStay Floating Rate Fund |
Cost in Dollars of a $1,000 Investment in MainStay Floating Rate Fund (Unaudited)
The example below is intended to describe the fees and expenses borne by shareholders during the six-month period from November 1, 2020, to April 30, 2021, and the impact of those costs on your investment.
Example
As a shareholder of the Fund you incur two types of costs: (1) transaction costs, including exchange fees and sales charges (loads) on purchases (as applicable), and (2) ongoing costs, including management fees, distribution and/or service (12b-1) fees, and other Fund expenses (as applicable). This example is intended to help you understand your ongoing costs (in dollars) of investing in the Fund and to compare these costs with the ongoing costs of investing in other mutual funds. The example is based on an investment of $1,000 made at the beginning of the six-month period and held for the entire period from November 1, 2020, to April 30, 2021.
This example illustrates your Fund’s ongoing costs in two ways:
Actual Expenses
The second and third data columns in the table below provide information about actual account values and actual expenses. You may use the information in these columns, together with the amount you invested, to estimate the expenses that you paid during the six months ended April 30, 2021. Simply divide your account value by $1,000 (for example, an
$8,600 account value divided by $1,000 = 8.6), then multiply the result by the number under the heading entitled “Expenses Paid During Period” to estimate the expenses you paid on your account during this period.
Hypothetical Example for Comparison Purposes
The fourth and fifth data columns in the table below provide information about hypothetical account values and hypothetical expenses based on the Fund’s actual expense ratio and an assumed rate of return of 5% per year before expenses, which is not the Fund’s actual return. The hypothetical account values and expenses may not be used to estimate the actual ending account balances or expenses you paid for the six-month period shown. You may use this information to compare the ongoing costs of investing in the Fund with the ongoing costs of investing in other mutual funds. To do so, compare this 5% hypothetical example with the 5% hypothetical examples that appear in the shareholder reports of the other mutual funds.
Please note that the expenses shown in the table are meant to highlight your ongoing costs only and do not reflect any transactional costs, such as exchange fees or sales charges (loads). Therefore, the fourth and fifth data columns of the table are useful in comparing ongoing costs only and will not help you determine the relative total costs of owning different funds. In addition, if these transactional costs were included, your costs would have been higher.
| Share Class | Beginning
Account
Value
11/1/20 | Ending Account
Value (Based
on Actual
Returns and
Expenses)
4/30/21 | Expenses
Paid
During
Period1 | Ending Account
Value (Based
on Hypothetical
5% Annualized
Return and
Actual Expenses)
4/30/21 | Expenses
Paid
During
Period1 | Net Expense
Ratio
During
Period2 |
| Class A Shares | $1,000.00 | $1,044.70 | $5.58 | $1,019.34 | $5.51 | 1.10% |
| Investor Class Shares | $1,000.00 | $1,044.40 | $5.83 | $1,019.09 | $5.76 | 1.15% |
| Class B Shares | $1,000.00 | $1,040.50 | $9.66 | $1,015.32 | $9.54 | 1.91% |
| Class C Shares | $1,000.00 | $1,041.70 | $9.62 | $1,015.37 | $9.49 | 1.90% |
| Class I Shares | $1,000.00 | $1,046.00 | $4.26 | $1,020.63 | $4.21 | 0.84% |
| Class R3 Shares | $1,000.00 | $1,044.00 | $7.40 | $1,017.56 | $7.30 | 1.46% |
| Class R6 Shares | $1,000.00 | $1,048.10 | $3.30 | $1,021.57 | $3.26 | 0.65% |
| SIMPLE Class Shares | $1,000.00 | $1,044.30 | $7.10 | $1,017.85 | $7.00 | 1.40% |
| 1. | Expenses are equal to the Fund’s annualized expense ratio of each class multiplied by the average account value over the period, divided by 365 and multiplied by 181 (to reflect the six-month period). The table above represents the actual expenses incurred during the six-month period. In addition to the fees and expenses which the Fund bears directly, it also indirectly bears a pro rata share of the fees and expenses of the underlying funds in which it invests. Such indirect expenses are not included in the above-reported expense figures. |
| 2. | Expenses are equal to the Fund's annualized expense ratio to reflect the six-month period. |
Industry Composition as of April 30, 2021 (Unaudited)
| Electronics | 11.4% |
| Finance | 11.0 |
| Healthcare, Education & Childcare | 8.5 |
| Hotels, Motels, Inns & Gaming | 5.1 |
| Telecommunications | 4.9 |
| Chemicals, Plastics & Rubber | 4.4 |
| Broadcasting & Entertainment | 3.5 |
| Diversified/Conglomerate Service | 3.4 |
| Insurance | 3.4 |
| Exchange–Traded Funds | 3.2 |
| Containers, Packaging & Glass | 3.0 |
| Buildings & Real Estate | 2.6 |
| Diversified/Conglomerate Manufacturing | 2.6 |
| Aerospace & Defense | 2.6 |
| Utilities | 2.5 |
| Beverage, Food & Tobacco | 2.4 |
| Retail Store | 2.4 |
| Personal, Food & Miscellaneous Services | 2.0 |
| Automobile | 1.8 |
| Leisure, Amusement, Motion Pictures & Entertainment | 1.7 |
| Banking | 1.6 |
| Personal & Nondurable Consumer Products | 1.2 |
| Oil & Gas | 1.1 |
| Mining, Steel, Iron & Non–Precious Metals | 1.0 |
| Affiliated Investment Company | 0.9 |
| Printing & Publishing | 0.8 |
| Entertainment | 0.8 |
| Machinery (Non–Agriculture, Non–Construct & Non–Electronic) | 0.7 |
| Commercial Services | 0.7 |
| Services: Business | 0.6 |
| Diversified Financial Services | 0.6 |
| Personal & Nondurable Consumer Products (Manufacturing Only) | 0.5 |
| Retail | 0.5 |
| Home and Office Furnishings, Housewares & Durable Consumer Products | 0.3 |
| Ecological | 0.3% |
| Manufacturing | 0.3 |
| Lodging | 0.3 |
| Building Materials | 0.3 |
| Cargo Transport | 0.2 |
| Personal Transportation | 0.2 |
| Auto Manufacturers | 0.2 |
| Real Estate | 0.2 |
| Packaging & Containers | 0.2 |
| Environmental Control | 0.2 |
| Airlines | 0.2 |
| Radio and TV Broadcasting | 0.1 |
| Pharmaceuticals | 0.1 |
| Electric | 0.1 |
| Food | 0.1 |
| Trucking & Leasing | 0.1 |
| Distribution & Wholesale | 0.1 |
| Real Estate Investment Trusts | 0.1 |
| Mining | 0.1 |
| Chemicals | 0.1 |
| Media | 0.1 |
| Healthcare–Services | 0.0‡ |
| Iron & Steel | 0.0‡ |
| Machinery–Diversified | 0.0‡ |
| Oil & Gas Services | 0.0‡ |
| Oil, Gas & Consumable Fuels | 0.0‡ |
| Health Care Equipment & Supplies | 0.0‡ |
| Health Care Providers & Services | 0.0‡ |
| Metals & Mining | 0.0‡ |
| Communications Equipment | 0.0‡ |
| Independent Power and Renewable Electricity Producers | 0.0‡ |
| Short–Term Investments | 12.6 |
| Other Assets, Less Liabilities | –9.9 |
| | 100.0% |
‡ Less than one-tenth of a percent.
See Portfolio of Investments beginning on page 12 for specific holdings within these categories. The Fund's holdings are subject to change.
| 8 | MainStay Floating Rate Fund |
Top Ten Holdings or Issuers Held as of April 30, 2021 (excluding short-term investments) (Unaudited)
| 1. | Invesco Senior Loan ETF |
| 2. | SPDR Blackstone Senior Loan ETF |
| 3. | Asurion LLC, 3.113%-5.363%, due 11/3/23–1/31/28 |
| 4. | MainStay MacKay High Yield Corporate Bond Fund |
| 5. | Caesars Resort Collection LLC, 2.863%-5.75%, due 12/23/24–7/21/25 |
| 6. | Dell International LLC, 2.00%, due 9/19/25 |
| 7. | MH Sub I LLC, 3.613%-4.75%, due 9/13/24 |
| 8. | Sunshine Luxembourg VII SARL, 4.50%, due 10/1/26 |
| 9. | Scientific Games International, Inc., 2.863%-7.00%, due 8/14/24–5/15/28 |
| 10. | Camelot U.S. Acquisition 1 Co., 3.113%-4.00%, due 10/30/26 |
Portfolio Management Discussion and Analysis (Unaudited)
Questions answered by portfolio managers Robert H. Dial, Mark A. Campellone and Arthur S. Torrey of NYL Investors LLC, the Fund’s Subadvisor.
How did MainStay Floating Rate Fund perform relative to its benchmarks and peer group during the six months ended April 30, 2021?
For the six months ended April 30, 2021, Class I shares of MainStay Floating Rate Fund returned 4.60%, underperforming the 5.99% return of the Fund’s primary benchmark, the S&P/LSTA Leveraged Loan Index. Over the same period, Class I shares also underperformed the 5.35% return of the Morningstar Bank Loan Category Average.1
Were there any changes to the Fund during the reporting period?
Effective February 28, 2021, the Credit Suisse Leveraged Loan Index was removed as a secondary benchmark for the Fund.
What factors affected the Fund’s relative performance during the reporting period?
Market conditions were generally favorable for the reporting period with the floating-rate market realizing largely positive relative performance consistent with other risk assets, including equities and high yield. These risk assets continued to recover from the impact of the global onset of the COVID-19 pandemic in February and March of 2020. The sell-off in February and March was the most severe since the market’s recovery from the Global Financial Crisis that began in 2008. The segments of the loan market that underperformed most in the prior reporting period, including lower credit quality and more COVID-19-sensitive sectors, tended to outperform in the current reporting period. The Fund has historically been positioned with higher credit quality and less exposure to COVID-19-impacted sectors and underperformed as a result. The Fund realized strong inflows during the reporting period and cash was also a drag on relative performance.
What was the Fund’s duration2 strategy during the reporting period?
Floating-rate loans are, by their nature, a low-duration asset. Loans earn a stated spread3 over a floating reference rate, which is tied to LIBOR.4 Issuers can generally borrow under a 30-to-90-day range with LIBOR. The weighted average time to LIBOR reset on the Fund’s portfolio averaged less than 40 days during the reporting period.
During the reporting period, which sectors were the strongest positive contributors to the Fund’s relative performance and which sectors were particularly weak?
The strongest positive contributions to performance relative to the S&P/LSTA Leveraged Loan Index included the Fund’s market weight exposure to the home furnishings sector, its out-of-benchmark positions and its overweight exposure to hotels & gaming. (Contributions take weightings and total returns into account.) Conversely, the most significant detractors from the Fund’s relative performance were underweight positions in the electronics, oil & gas and business services sectors.
What were some of the Fund’s largest purchases and sales during the reporting period?
The Fund’s largest purchases during the reporting period included loans issued by financial services company Ascensus, information and analytics provider Corelogic and pharmaceutical company Organon, reflecting our favorable view towards the relative value, business prospects and management of these issuers. The largest sales during the reporting period were loans issued by gaming and entertainment operator Gateway Casinos and human resource outsourcing services provider Tempo Acquisition. The sale of the Fund’s entire Gateway position reflected concerns regarding future company performance, while the partial sale of Tempo holdings left the Fund with a market-weight position, reflecting our view of its relative value.
How did the Fund’s sector weightings change during the reporting period?
As the economy and markets partially recovered from the onset of COVID-19, we increased the Fund’s weightings in out-of-benchmark positions in high-yield bonds, air transportation and retail. Conversely, we reduced the Fund’s weightings in electronics, gaming and utilities.
How was the Fund positioned at the end of the reporting period?
As of April 30, 2021, we remain cautiously optimistic about the floating-rate bond market, and have maintained the Fund’s overweight positions in packaging, gaming and building materials. As of the same date, the Fund remains underweight in electronics, business services and health care. We continue to
| 1. | See page 5 for other share class returns, which may be higher or lower than Class I share returns. See page 6 for more information on benchmark and peer group return |
| 2. | Duration is a measure of the price sensitivity of a fixed-income investment to changes in interest rates. Duration is expressed as a number of years and is considered a more accurate sensitivity gauge than average maturity. |
| 3. | The terms “spread” and “yield spread” may refer to the difference in yield between a security or type of security and comparable U.S. Treasury issues. The terms may also refer to the difference in yield between two specific securities or types of securities at a given time. |
| 4. | The London InterBank Offered Rate (“LIBOR”) is a composite of interest rates at which banks borrow from one another in the London market, and it is a widely used benchmark for short-term interest rates. LIBOR will be discontinued at the end of 2021, which may cause increased volatility and illiquidity in the markets for instruments with terms tied to LIBOR, or other adverse consequences for these instruments. These events may adversely affect the Fund and its investments in such instruments. |
| 10 | MainStay Floating Rate Fund |
look for opportunities to add exposure in these underweight sectors, subject to the Fund’s underwriting criteria.
From a ratings perspective, the Fund has moved closer to a market-weight position in BB-and-better-rated credit, while adopting an overweight position in B-rated credit, reflecting our view on improving credit fundamentals for the loan market and better relative performance.5 We are looking to lower the Fund’s cash balances with additional purchases subject to market conditions.
| 5. | An obligation rated ‘BB’ by Standard & Poor’s (“S&P”) is deemed by S&P to be less vulnerable to nonpayment than other speculative issues. In the opinion of S&P, however, the obligor faces major ongoing uncertainties or exposure to adverse business, financial or economic conditions which could lead to the obligor’s inadequate capacity to meet its financial commitment on the obligation. An obligation rated ‘B’ by S&P is deemed by S&P to be more vulnerable to nonpayment than obligations rated ‘BB’, but in the opinion of S&P, the obligor currently has the capacity to meet its financial commitment on the obligation. It is the opinion of S&P that adverse business, financial, or economic conditions will likely impair the obligor's capacity or willingness to meet its financial commitment on the obligation. When applied to Fund holdings, ratings are based solely on the creditworthiness of the bonds in the portfolio and are not meant to represent the security or safety of the Fund |
The opinions expressed are those of the portfolio managers as of the date of this report and are subject to change. There is no guarantee that any forecasts will come to pass. This material does not constitute investment advice and is not intended as an endorsement of any specific investment.
Portfolio of Investments April 30, 2021† (Unaudited)
| | Principal
Amount | Value |
| Long-Term Bonds 93.1% |
| Asset-Backed Securities 0.6% |
| Other Asset-Backed Securities 0.6% |
| Octagon Investment Partners 51 Ltd. (a)(b)(c) | |
| Series 2021-1A, Class B | | |
| (zero coupon) (3 Month LIBOR + 1.70%), due 7/20/34 | $ 2,500,000 | $ 2,500,265 |
| Series 2021-1A, Class E | | |
| (zero coupon) (3 Month LIBOR + 6.75%), due 7/20/34 | 2,500,000 | 2,499,735 |
| Rockland Park CLO Ltd. (a)(b)(c) | |
| Series 2021-1A, Class B | | |
| (zero coupon) (3 Month LIBOR + 1.65%), due 4/20/34 | 2,500,000 | 2,500,000 |
| Series 2021-1A, Class E | | |
| (zero coupon) (3 Month LIBOR + 6.25%), due 4/20/34 | 2,500,000 | 2,500,000 |
Total Asset-Backed Securities
(Cost $10,000,000) | | 10,000,000 |
| Corporate Bonds 4.1% |
| Aerospace & Defense 0.2% |
| Howmet Aerospace, Inc. | | |
| 6.875%, due 5/1/25 | 500,000 | 580,000 |
| Spirit AeroSystems, Inc. | | |
| 7.50%, due 4/15/25 (a) | 2,100,000 | 2,250,213 |
| | | 2,830,213 |
| Airlines 0.2% |
| United Airlines, Inc. (a) | | |
| 4.375%, due 4/15/26 | 800,000 | 830,176 |
| 4.625%, due 4/15/29 | 2,400,000 | 2,494,080 |
| | | 3,324,256 |
| Auto Manufacturers 0.2% |
| Ford Motor Co. | | |
| 8.50%, due 4/21/23 | 700,000 | 784,000 |
| 9.00%, due 4/22/25 | 1,400,000 | 1,709,750 |
| | | 2,493,750 |
| Building Materials 0.3% |
| JELD-WEN, Inc. (a) | | |
| 4.625%, due 12/15/25 | 590,000 | 601,800 |
| 4.875%, due 12/15/27 | 780,000 | 815,100 |
| Koppers, Inc. | | |
| 6.00%, due 2/15/25 (a) | 2,000,000 | 2,055,000 |
| | Principal
Amount | Value |
| |
| Building Materials (continued) |
| U.S. Concrete, Inc. | | |
| 5.125%, due 3/1/29 (a) | $ 400,000 | $ 413,000 |
| | | 3,884,900 |
| Chemicals 0.1% |
| Kraton Polymers LLC | | |
| 4.25%, due 12/15/25 (a) | 800,000 | 812,000 |
| Nouryon Holding BV | | |
| 8.00%, due 10/1/26 (a) | 1,000,000 | 1,062,600 |
| | | 1,874,600 |
| Commercial Services 0.4% |
| Herc Holdings, Inc. | | |
| 5.50%, due 7/15/27 (a) | 850,000 | 898,875 |
| Jaguar Holding Co. II | | |
| 4.625%, due 6/15/25 (a) | 2,800,000 | 2,943,305 |
| Prime Security Services Borrower LLC | | |
| 6.25%, due 1/15/28 (a) | 1,000,000 | 1,045,000 |
| Team Health Holdings, Inc. | | |
| 6.375%, due 2/1/25 (a) | 1,000,000 | 882,500 |
| | | 5,769,680 |
| Distribution & Wholesale 0.1% |
| IAA, Inc. | | |
| 5.50%, due 6/15/27 (a) | 500,000 | 525,625 |
| KAR Auction Services, Inc. | | |
| 5.125%, due 6/1/25 (a) | 400,000 | 405,576 |
| | | 931,201 |
| Electric 0.1% |
| Vistra Operations Co., LLC | | |
| 5.00%, due 7/31/27 (a) | 1,500,000 | 1,554,045 |
| Entertainment 0.1% |
| Caesars Resort Collection LLC | | |
| 5.75%, due 7/1/25 (a) | 500,000 | 526,385 |
| Scientific Games International, Inc. | | |
| 7.00%, due 5/15/28 (a) | 1,350,000 | 1,451,250 |
| | | 1,977,635 |
| Environmental Control 0.2% |
| GFL Environmental, Inc. (a) | | |
| 3.75%, due 8/1/25 | 2,000,000 | 2,035,000 |
| 4.25%, due 6/1/25 | 1,200,000 | 1,236,000 |
| 8.50%, due 5/1/27 | 462,000 | 505,890 |
| | | 3,776,890 |
The notes to the financial statements are an integral part of, and should be read in conjunction with, the financial statements.
| 12 | MainStay Floating Rate Fund |
| | Principal
Amount | Value |
| Corporate Bonds (continued) |
| Food 0.1% |
| Post Holdings, Inc. | | |
| 5.50%, due 12/15/29 (a) | $ 240,000 | $ 258,372 |
| US Foods, Inc. | | |
| 6.25%, due 4/15/25 (a) | 1,200,000 | 1,274,634 |
| | | 1,533,006 |
| Healthcare-Services 0.0% ‡ |
| Acadia Healthcare Co., Inc. | | |
| 5.00%, due 4/15/29 (a) | 240,000 | 248,100 |
| Insurance 0.1% |
| GTCR AP Finance, Inc. | | |
| 8.00%, due 5/15/27 (a) | 900,000 | 958,500 |
| Iron & Steel 0.0% ‡ |
| Carpenter Technology Corp. | | |
| 6.375%, due 7/15/28 | 630,000 | 690,919 |
| Lodging 0.3% |
| Boyd Gaming Corp. | | |
| 4.75%, due 12/1/27 | 600,000 | 615,054 |
| 8.625%, due 6/1/25 (a) | 2,000,000 | 2,214,400 |
| Hilton Domestic Operating Co., Inc. | | |
| 5.375%, due 5/1/25 (a) | 1,000,000 | 1,053,150 |
| | | 3,882,604 |
| Machinery-Diversified 0.0% ‡ |
| GrafTech Finance, Inc. | | |
| 4.625%, due 12/15/28 (a) | 430,000 | 442,100 |
| Media 0.1% |
| Radiate Holdco LLC | | |
| 4.50%, due 9/15/26 (a) | 730,000 | 742,775 |
| Univision Communications, Inc. | | |
| 6.625%, due 6/1/27 (a) | 1,400,000 | 1,517,250 |
| | | 2,260,025 |
| Mining 0.1% |
| Kaiser Aluminum Corp. | | |
| 6.50%, due 5/1/25 (a) | 1,550,000 | 1,643,000 |
| Oil & Gas Services 0.0% ‡ |
| USA Compression Partners LP | | |
| 6.875%, due 4/1/26 | 640,000 | 671,162 |
| | Principal
Amount | Value |
| |
| Packaging & Containers 0.2% |
| Ardagh Metal Packaging Finance USA LLC | | |
| 4.00%, due 9/1/29 (a) | $ 1,600,000 | $ 1,592,000 |
| Ardagh Packaging Finance plc | | |
| 5.25%, due 4/30/25 (a) | 1,000,000 | 1,048,750 |
| Plastipak Holdings, Inc. | | |
| 6.25%, due 10/15/25 (a) | 530,000 | 544,575 |
| | | 3,185,325 |
| Pharmaceuticals 0.1% |
| Bausch Health Cos., Inc. | | |
| 5.50%, due 11/1/25 (a) | 700,000 | 721,875 |
| Organon Finance 1 LLC | | |
| 5.125%, due 4/30/31 (a) | 1,400,000 | 1,452,640 |
| | | 2,174,515 |
| Real Estate 0.2% |
| Realogy Group LLC (a) | | |
| 5.75%, due 1/15/29 | 1,670,000 | 1,732,625 |
| 7.625%, due 6/15/25 | 560,000 | 611,800 |
| | | 2,344,425 |
| Real Estate Investment Trusts 0.1% |
| Iron Mountain, Inc. | | |
| 5.00%, due 7/15/28 (a) | 650,000 | 672,750 |
| RHP Hotel Properties LP | | |
| 4.75%, due 10/15/27 | 300,000 | 308,736 |
| | | 981,486 |
| Retail 0.5% |
| 1011778 B.C. Unlimited Liability Co. | | |
| 4.00%, due 10/15/30 (a) | 3,120,000 | 3,042,001 |
| IRB Holding Corp. | | |
| 7.00%, due 6/15/25 (a) | 580,000 | 624,196 |
| LBM Acquisition LLC | | |
| 6.25%, due 1/15/29 (a) | 2,000,000 | 2,050,000 |
| Magic Mergeco, Inc. (a) | | |
| 5.25%, due 5/1/28 | 1,050,000 | 1,063,125 |
| 7.875%, due 5/1/29 | 1,400,000 | 1,438,500 |
| | | 8,217,822 |
| Telecommunications 0.3% |
| Frontier Communications Corp. | | |
| 5.875%, due 10/15/27 (a) | 560,000 | 595,000 |
| LogMeIn, Inc. | | |
| 5.50%, due 9/1/27 (a) | 2,200,000 | 2,292,972 |
| Lumen Technologies, Inc. | | |
| 4.50%, due 1/15/29 (a) | 1,330,000 | 1,310,050 |
The notes to the financial statements are an integral part of, and should be read in conjunction with, the financial statements.
13
Portfolio of Investments April 30, 2021† (Unaudited) (continued)
| | Principal
Amount | Value |
| Corporate Bonds (continued) |
| Telecommunications (continued) |
| Telesat Canada | | |
| 4.875%, due 6/1/27 (a) | $ 900,000 | $ 877,500 |
| | | 5,075,522 |
| Trucking & Leasing 0.1% |
| DAE Funding LLC | | |
| 5.00%, due 8/1/24 (a) | 1,000,000 | 1,026,250 |
Total Corporate Bonds
(Cost $61,098,112) | | 63,751,931 |
| Loan Assignments 88.4% |
| Aerospace & Defense 2.4% |
| AI Convoy (Luxembourg) SARL | | |
| USD Facility Term Loan B | | |
| 4.50% (2 Month LIBOR + 3.50%, 6 Month LIBOR + 3.50%), due 1/18/27 (c) | 1,608,750 | 1,607,074 |
| Asplundh Tree Expert LLC | | |
| Amendment No. 1 Term Loan | | |
| 1.863% (1 Month LIBOR + 1.75%), due 9/7/27 (c) | 3,865,163 | 3,850,066 |
| CP Atlas Buyer, Inc. | | |
| Term Loan B | | |
| 4.25% (3 Month LIBOR + 3.75%), due 11/23/27 (c) | 5,500,000 | 5,480,062 |
| Dynasty Acquisition Co., Inc. (c) | | |
| 2020 Term Loan B1 | | |
| 3.703% (3 Month LIBOR + 3.50%), due 4/6/26 | 1,817,426 | 1,764,493 |
| 2020 Term Loan B2 | | |
| 3.703% (3 Month LIBOR + 3.50%), due 4/6/26 | 977,111 | 948,652 |
| Kestrel Bidco, Inc. | | |
| Term Loan | | |
| 4.00% (3 Month LIBOR + 3.00%), due 12/11/26 (c) | 1,234,375 | 1,191,687 |
| Russell Investments U.S. Institutional Holdco, Inc. | | |
| 2025 Term Loan | | |
| 4.50% (3 Month LIBOR + 3.50%), due 5/30/25 (c) | 5,548,133 | 5,485,717 |
| Science Applications International Corp. | | |
| Tranche Term Loan B | | |
| 1.988% (1 Month LIBOR + 1.875%), due 10/31/25 (c) | 2,047,500 | 2,036,409 |
| | Principal
Amount | Value |
| |
| Aerospace & Defense (continued) |
| SkyMiles IP Ltd. | | |
| Initial Term Loan | | |
| 4.75% (3 Month LIBOR + 3.75%), due 10/20/27 (c) | $ 1,814,286 | $ 1,905,757 |
| TransDigm, Inc. (c) | | |
| Tranche Refinancing Term Loan E | | |
| 2.363% (1 Month LIBOR + 2.25%), due 5/30/25 | 970,219 | 957,788 |
| Tranche Refinancing Term Loan F | | |
| 2.363% (1 Month LIBOR + 2.25%), due 12/9/25 | 8,386,103 | 8,278,417 |
| United AirLines, Inc. | | |
| Term Loan B | | |
| 4.50% (3 Month LIBOR + 3.75%), due 4/21/28 (c) | 4,200,000 | 4,248,002 |
| | | 37,754,124 |
| Automobile 1.8% |
| American Axle & Manufacturing, Inc. | | |
| Tranche Term Loan B | | |
| 3.00% (1 Month LIBOR + 2.25%), due 4/6/24 (c) | 1,528,589 | 1,519,273 |
| Autokiniton U.S. Holdings, Inc. | | |
| Closing Date Term Loan B | | |
| 5.00% (1 Month LIBOR + 4.50%), due 4/6/28 (c) | 3,900,000 | 3,929,250 |
| Belron Finance LLC | | |
| 2019 Dollar Second Incremental Loan | | |
| 2.438% (3 Month LIBOR + 2.25%), due 10/30/26 (c) | 1,234,375 | 1,223,574 |
| Belron Group SA | | |
| Dollar Third Incremental Loan | | |
| 3.25% (1 Month LIBOR + 2.75%), due 4/13/28 (c) | 2,418,750 | 2,408,168 |
| Chassix, Inc. | | |
| Initial Term Loan | | |
| 6.50% (3 Month LIBOR + 5.50%), due 11/15/23 (c) | 2,401,517 | 2,353,487 |
| Clarios Global LP | | |
| First Lien Amendment No. 1 Dollar Term Loan | | |
| 3.363% (1 Month LIBOR + 3.25%), due 4/30/26 (c) | 2,455,590 | 2,427,965 |
| KAR Auction Services, Inc. | | |
| Tranche Term Loan B6 | | |
| 2.375% (1 Month LIBOR + 2.25%), due 9/19/26 (c) | 736,281 | 725,237 |
The notes to the financial statements are an integral part of, and should be read in conjunction with, the financial statements.
| 14 | MainStay Floating Rate Fund |
| | Principal
Amount | Value |
| Loan Assignments (continued) |
| Automobile (continued) |
| Mavis Tire Express Services Corp. (c) | | |
| First Lien Closing Term Loan | | |
| 3.363% (1 Month LIBOR + 3.25%), due 3/20/25 | $ 4,109,263 | $ 4,096,421 |
| First Lien Term Loan B2 | | |
| 5.00% (1 Month LIBOR + 4.00%), due 3/20/25 | 498,750 | 497,753 |
| Wand Newco 3, Inc. | | |
| First Lien Tranche Term Loan B1 | | |
| 3.113% (1 Month LIBOR + 3.00%), due 2/5/26 (c) | 9,254,955 | 9,123,359 |
| | | 28,304,487 |
| Banking 1.6% |
| Apollo Commercial Real Estate Finance, Inc. (c) | | |
| Initial Term Loan | | |
| 2.858% (1 Month LIBOR + 2.75%), due 5/15/26 | 1,473,750 | 1,447,959 |
| Term Loan B1 | | |
| 4.00% (1 Month LIBOR + 3.50%), due 3/11/28 | 3,000,000 | 2,977,500 |
| Broadstreet Partners, Inc. | | |
| First Lien 2020 Initial Term Loan | | |
| 3.363% (1 Month LIBOR + 3.25%), due 1/27/27 (c) | 3,337,652 | 3,303,812 |
| Brookfield Property REIT, Inc. | | |
| Initial Term Loan B | | |
| 2.613% (1 Month LIBOR + 2.50%), due 8/27/25 (c) | 1,378,423 | 1,304,908 |
| Edelman Financial Engines Center LLC | | |
| First Lien 2021 Initial Term Loan | | |
| 4.25% (1 Month LIBOR + 3.50%), due 4/7/28 (c) | 7,737,000 | 7,701,217 |
| Greenhill & Co., Inc. | | |
| New Term Loan | | |
| 3.363% (1 Month LIBOR + 3.25%), due 4/12/24 (c)(d)(e) | 1,466,740 | 1,459,406 |
| Jane Street Group LLC | | |
| Dollar Term Loan | | |
| 2.863% (1 Month LIBOR + 2.75%), due 1/21/27 (c) | 6,881,753 | 6,830,139 |
| | | 25,024,941 |
| | Principal
Amount | Value |
| |
| Beverage, Food & Tobacco 2.4% |
| 8th Avenue Food & Provisions, Inc. | | |
| First Lien Term Loan | | |
| 3.608% (1 Month LIBOR + 3.50%), due 10/1/25 (c) | $ 3,343,449 | $ 3,337,180 |
| American Seafoods Group LLC | | |
| First Lien Tranche Term Loan B | | |
| 3.75% (1 Month LIBOR + 2.75%, 3 Month LIBOR + 2.75%), due 8/21/23 (c) | 1,154,513 | 1,150,183 |
| Arctic Glacier Group Holdings, Inc. | | |
| Specified Refinancing Term Loan | | |
| 4.50% (3 Month LIBOR + 3.50%), due 3/20/24 (c)(d) | 961,552 | 909,467 |
| B&G Foods, Inc. | | |
| Tranche Term Loan B4 | | |
| 2.613% (1 Month LIBOR + 2.50%), due 10/10/26 (c) | 825,833 | 824,113 |
| CHG PPC Parent LLC | | |
| First Lien Initial Term Loan | | |
| 2.863% (1 Month LIBOR + 2.75%), due 3/31/25 (c) | 3,646,875 | 3,601,289 |
| City Brewing Co. LLC | | |
| First Lien Closing Date Term Loan | | |
| 4.25% (3 Month LIBOR + 3.50%), due 4/5/28 (c) | 3,800,000 | 3,804,750 |
| Froneri International Ltd. | | |
| First Lien Facility Term Loan B2 | | |
| 2.363% (1 Month LIBOR + 2.25%), due 1/29/27 (c) | 2,992,387 | 2,947,128 |
| H Food Holdings LLC | | |
| Initial Term Loan B | | |
| 3.801% (1 Month LIBOR + 3.6875%), due 5/23/25 (c) | 3,623,470 | 3,589,250 |
| JBS USA Lux SA | | |
| New Term Loan | | |
| 2.113% (1 Month LIBOR + 2.00%), due 5/1/26 (c) | 7,635,605 | 7,610,156 |
| Sunshine Investments BV | | |
| Facility Term Loan B3 | | |
| 3.198% (3 Month LIBOR + 3.00%), due 3/28/25 (c) | 4,214,899 | 4,183,287 |
| U.S. Foods, Inc. | | |
| Initial Term Loan | | |
| 1.863% (1 Month LIBOR + 1.75%), due 6/27/23 (c) | 4,414,788 | 4,359,604 |
The notes to the financial statements are an integral part of, and should be read in conjunction with, the financial statements.
15
Portfolio of Investments April 30, 2021† (Unaudited) (continued)
| | Principal
Amount | Value |
| Loan Assignments (continued) |
| Beverage, Food & Tobacco (continued) |
| United Natural Foods, Inc. | | |
| Initial Term Loan | | |
| 3.613% (1 Month LIBOR + 3.50%), due 10/22/25 (c) | $ 1,560,252 | $ 1,558,601 |
| | | 37,875,008 |
| Broadcasting & Entertainment 3.5% |
| Altice France SA | | |
| USD Incremental Term Loan B13 | | |
| 4.198% (3 Month LIBOR + 4.00%), due 8/14/26 (c) | 7,018,461 | 6,991,047 |
| Charter Communications Operating LLC | | |
| Term Loan B1 | | |
| 1.87% (1 Month LIBOR + 1.75%), due 4/30/25 (c) | 9,675,000 | 9,662,151 |
| Clear Channel Outdoor Holdings, Inc. | | |
| Term Loan B | | |
| 3.685% (3 Month LIBOR + 3.50%), due 8/21/26 (c) | 1,231,250 | 1,190,721 |
| Diamond Sports Group LLC | | |
| Term Loan | | |
| 3.37% (1 Month LIBOR + 3.25%), due 8/24/26 (c) | 2,950,050 | 2,094,536 |
| Gray Television, Inc. | | |
| Term Loan C | | |
| 2.615% (1 Month LIBOR + 2.50%), due 1/2/26 (c) | 3,011,963 | 2,991,882 |
| Nexstar Broadcasting, Inc. | | |
| Term Loan B4 | | |
| 2.615% (1 Month LIBOR + 2.50%), due 9/18/26 (c) | 5,480,394 | 5,452,992 |
| Numericable U.S. LLC (c) | | |
| USD Term Loan B11 | | |
| 2.936% (1 Month LIBOR + 2.75%), due 7/31/25 | 435,859 | 426,706 |
| Term Loan B12 | | |
| 3.871% (3 Month LIBOR + 3.6875%), due 1/31/26 | 3,859,976 | 3,826,201 |
| Radiate Holdco LLC | | |
| Term Loan B | | |
| 4.25% (1 Month LIBOR + 3.50%), due 9/25/26 (c) | 7,743,598 | 7,746,014 |
| Terrier Media Buyer, Inc. | | |
| First Lien 2021 Term Loan B | | |
| 3.613% (1 Month LIBOR + 3.50%), due 12/17/26 (c) | 6,127,144 | 6,081,190 |
| | Principal
Amount | Value |
| |
| Broadcasting & Entertainment (continued) |
| Univision Communications, Inc. | | |
| First Lien 2017 Replacement Repriced Term Loan | | |
| 3.75% (1 Month LIBOR + 2.75%), due 3/15/24 (c) | $ 4,966,237 | $ 4,949,943 |
| WideOpenWest Finance LLC | | |
| Eighth Amendment Term Loan B | | |
| 4.25% (1 Month LIBOR + 3.25%), due 8/18/23 (c) | 2,869,733 | 2,859,996 |
| | | 54,273,379 |
| Buildings & Real Estate 2.6% |
| Beacon Roofing Supply, Inc. | | |
| Cov-Lite Term Loan B | | |
| TBD, due 4/21/28 | 3,500,000 | 3,486,875 |
| Core & Main LP | | |
| Initial Term Loan | | |
| 3.75% (1 Month LIBOR + 2.75%, 3 Month LIBOR + 2.75%), due 8/1/24 (c) | 5,495,376 | 5,467,899 |
| Cornerstone Building Brands, Inc. | | |
| Tranche Term Loan B | | |
| 3.75% (1 Month LIBOR + 3.25%), due 4/12/28 (c) | 6,631,641 | 6,573,615 |
| Cushman & Wakefield U.S. Borrower LLC | | |
| Replacement Term Loan | | |
| 2.863% (1 Month LIBOR + 2.75%), due 8/21/25 (c) | 3,910,500 | 3,811,107 |
| Hamilton Holdco LLC | | |
| Term Loan | | |
| 2.21% (3 Month LIBOR + 2.00%), due 1/2/27 (c) | 1,458,750 | 1,445,986 |
| Jeld-Wen | | |
| First Lien Term Loan B4 | | |
| 2.113% (1 Month LIBOR + 2.00%), due 12/14/24 (c) | 1,662,891 | 1,650,159 |
| Realogy Group LLC | | |
| Extended 2025 Term Loan | | |
| 3.00% (1 Month LIBOR + 2.25%), due 2/8/25 (c) | 767,205 | 760,081 |
| SIWF Holdings, Inc. (c) | | |
| First Lien Initial Term Loan | | |
| 4.363% (1 Month LIBOR + 4.25%), due 6/15/25 | 2,829,997 | 2,822,214 |
| Second Lien Initial Term Loan | | |
| 8.613% (1 Month LIBOR + 8.50%), due 6/15/26 | 480,000 | 477,800 |
The notes to the financial statements are an integral part of, and should be read in conjunction with, the financial statements.
| 16 | MainStay Floating Rate Fund |
| | Principal
Amount | Value |
| Loan Assignments (continued) |
| Buildings & Real Estate (continued) |
| SRS Distribution, Inc. | | |
| Initial Term Loan | | |
| 3.113% (1 Month LIBOR + 3.00%), due 5/23/25 (c) | $ 3,594,594 | $ 3,540,175 |
| Wilsonart LLC | | |
| Tranche Term Loan E | | |
| 4.50% (3 Month LIBOR + 3.50%), due 12/31/26 (c) | 6,879,100 | 6,866,202 |
| ZEBRA BUYER LLC | | |
| Term Loan | | |
| TBD, due 4/21/28 | 4,200,000 | 4,192,999 |
| | | 41,095,112 |
| Cargo Transport 0.2% |
| Genesee & Wyoming, Inc. | | |
| Initial Term Loan | | |
| 2.203% (3 Month LIBOR + 2.00%), due 12/30/26 (c) | 2,970,000 | 2,957,006 |
| Chemicals, Plastics & Rubber 4.4% |
| Allnex (Luxembourg) & Cy S.C.A. (c)(d) | | |
| Tranche Term Loan B2 | | |
| 4.00% (1 Month LIBOR + 3.25%), due 9/13/23 | 1,101,025 | 1,099,648 |
| Tranche Term Loan B3 | | |
| 4.00% (1 Month LIBOR + 3.25%), due 9/13/23 | 829,560 | 828,523 |
| Alpha 3 BV | | |
| Initial Dollar Term Loan | | |
| 3.00% (3 Month LIBOR + 2.50%), due 3/18/28 (c) | 4,096,000 | 4,066,988 |
| Altium Packaging LLC | | |
| First Lien 2021 Term Loan | | |
| 3.25% (1 Month LIBOR + 2.75%), due 2/3/28 (c) | 3,085,106 | 3,051,041 |
| Aruba Investments Holdings LLC | | |
| First Lien Initial Dollar Term Loan | | |
| 4.75% (3 Month LIBOR + 4.00%), due 11/24/27 (c) | 1,066,655 | 1,063,988 |
| Cabot Microelectronics Corp. | | |
| Term Loan B1 | | |
| 2.125% (1 Month LIBOR + 2.00%), due 11/17/25 (c) | 1,835,849 | 1,833,554 |
| Diamond (BC) BV | | |
| Initial Term Loan 3.187%-3.185% | | |
| (2 Month LIBOR + 3.00%, 3 Month LIBOR + 3.00%), due 9/6/24 (c) | 2,240,267 | 2,228,665 |
| | Principal
Amount | Value |
| |
| Chemicals, Plastics & Rubber (continued) |
| Emerald Performance Materials LLC | | |
| Cov-Lite Term Loan | | |
| 5.00% (1 Month LIBOR + 4.00%), due 8/12/25 (c) | $ 1,714,041 | $ 1,714,898 |
| Flex Acquisition Co., Inc. | | |
| 2021 Specified Refinancing Term Loan | | |
| 4.00% (3 Month LIBOR + 3.50%), due 3/2/28 (c) | 4,645,444 | 4,591,245 |
| INEOS Styrolution Group GmbH | | |
| 2026 Tranche Dollar Term Loan B3 | | |
| 3.25% (3 Month LIBOR + 2.75%), due 1/29/26 (c) | 3,560,000 | 3,543,311 |
| INEOS U.S. Finance LLC | | |
| 2024 New Dollar Term Loan B | | |
| 2.113% (1 Month LIBOR + 2.00%), due 4/1/24 (c) | 2,400,380 | 2,373,649 |
| Innophos Holdings, Inc. | | |
| Initial Term Loan | | |
| 3.613% (1 Month LIBOR + 3.50%), due 2/5/27 (c) | 2,474,990 | 2,467,256 |
| Jazz Pharmaceuticals, Inc. | | |
| Term Loan | | |
| TBD, due 4/21/28 | 7,000,000 | 7,015,750 |
| Milk Specialties Co. | | |
| New Term Loan B | | |
| 5.00% (1 Month LIBOR + 4.00%), due 8/16/23 (c)(d) | 1,051,004 | 1,049,252 |
| Minerals Technologies, Inc. | | |
| New Term Loan B1 | | |
| 3.00% (1 Month LIBOR + 2.25%, 2 Month LIBOR + 2.25%), due 2/14/24 (c)(d) | 1,183,342 | 1,184,081 |
| Nouryon Finance BV | | |
| Initial Dollar Term Loan B | | |
| 2.865% (1 Month LIBOR + 2.75%), due 10/1/25 (c) | 5,076,036 | 5,007,510 |
| Oxea Holding Vier GMBH | | |
| Term Loan B2 | | |
| 3.625% (1 Month LIBOR + 3.50%), due 10/14/24 (c) | 3,046,678 | 3,006,690 |
| Pactiv Evergreen, Inc. | | |
| Tranche U.S. Term Loan B1 | | |
| 2.863% (1 Month LIBOR + 2.75%), due 2/5/23 (c) | 1,013,051 | 1,010,835 |
The notes to the financial statements are an integral part of, and should be read in conjunction with, the financial statements.
17
Portfolio of Investments April 30, 2021† (Unaudited) (continued)
| | Principal
Amount | Value |
| Loan Assignments (continued) |
| Chemicals, Plastics & Rubber (continued) |
| PAREXEL International Corp. | | |
| Initial Term Loan | | |
| 2.863% (1 Month LIBOR + 2.75%), due 9/27/24 (c) | $ 2,188,137 | $ 2,167,168 |
| PPD, Inc. | | |
| Initial Term Loan | | |
| 2.75% (1 Month LIBOR + 2.25%), due 1/13/28 (c) | 4,692,745 | 4,682,187 |
| PQ Corp. | | |
| Third Amendment Tranche Term Loan B1 | | |
| 2.436% (3 Month LIBOR + 2.25%), due 2/7/27 (c) | 1,838,110 | 1,824,653 |
| SCIH Salt Holdings, Inc. | | |
| Term Loan B | | |
| TBD, due 3/16/27 | 6,666,667 | 6,633,333 |
| Tricorbraun Holdings, Inc. | | |
| First Lien Closing Date Initial Term Loan | | |
| 3.75% (3 Month LIBOR + 3.25%), due 3/3/28 (c) | 3,852,262 | 3,813,204 |
| First Lien Delayed Draw Term Loan | | |
| 3.75%, due 3/3/28 (d) | 28,883 | 28,590 |
| Tronox Finance LLC | | |
| First Lien Refinancing Term Loan 2.629%-2.77% | | |
| (1 Month LIBOR + 2.50%, 3 Month LIBOR + 2.50%), due 3/10/28 (c) | 1,620,617 | 1,605,568 |
| Univar Solutions USA, Inc. | | |
| Term Loan B5 | | |
| 2.113% (1 Month LIBOR + 2.00%), due 7/1/26 (c) | 592,500 | 589,620 |
| Venator Finance SARL | | |
| Initial Term Loan | | |
| 3.113% (1 Month LIBOR + 3.00%), due 8/8/24 (c) | 1,406,568 | 1,383,711 |
| | | 69,864,918 |
| Commercial Services 0.3% |
| MHI Holdings LLC | | |
| Initial Term Loan | | |
| 5.113% (1 Month LIBOR + 5.00%), due 9/21/26 (c) | 2,788,402 | 2,793,630 |
| | Principal
Amount | Value |
| |
| Commercial Services (continued) |
| Sotheby's | | |
| 2021 Refinancing Term Loan | | |
| 5.50% (3 Month LIBOR + 4.75%), due 1/15/27 (c) | $ 2,296,915 | $ 2,312,707 |
| | | 5,106,337 |
| Containers, Packaging & Glass 3.0% |
| Alliance Laundry Systems LLC | | |
| Initial Term Term Loan B | | |
| 4.25% (1 Month LIBOR + 3.50%, 3 Month LIBOR + 3.50%), due 10/8/27 (c) | 4,812,937 | 4,810,358 |
| Anchor Glass Container Corp. | | |
| First Lien July 2017 Additional Term Loan | | |
| 3.75% (3 Month LIBOR + 2.75%), due 12/7/23 (c) | 2,667,051 | 2,400,346 |
| Berlin Packaging LLC | | |
| Tranche Initial Term Loan B4 | | |
| 3.75% (3 Month LIBOR + 3.25%), due 3/11/28 (c) | 4,000,000 | 3,942,500 |
| Berry Global, Inc. | | |
| Term Loan Z | | |
| 1.861% (1 Month LIBOR + 1.75%), due 7/1/26 (c) | 3,684,516 | 3,651,510 |
| BWAY Holding Co. | | |
| Initial Term Loan | | |
| 3.443% (3 Month LIBOR + 3.25%), due 4/3/24 (c) | 4,792,857 | 4,624,360 |
| Charter NEX U.S., Inc. | | |
| First Lien Initial Term Loan | | |
| 5.00% (1 Month LIBOR + 4.25%), due 12/1/27 (c) | 851,755 | 854,476 |
| Clearwater Paper Corp. | | |
| Initial Term Loan | | |
| 3.125% (1 Month LIBOR + 3.00%), due 7/26/26 (c) | 1,077,083 | 1,077,083 |
| Fort Dearborn Holding Co., Inc. (c) | | |
| First Lien Initial Term Loan | | |
| 5.00% (1 Month LIBOR + 4.00%, 3 Month LIBOR + 4.00%), due 10/19/23 | 2,363,987 | 2,360,047 |
| Second Lien Initial Term Loan | | |
| 9.50% (3 Month LIBOR + 8.50%), due 10/21/24 (d) | 1,500,000 | 1,496,250 |
The notes to the financial statements are an integral part of, and should be read in conjunction with, the financial statements.
| 18 | MainStay Floating Rate Fund |
| | Principal
Amount | Value |
| Loan Assignments (continued) |
| Containers, Packaging & Glass (continued) |
| Graham Packaging Co., Inc. | | |
| 2021 Initial Term Loan | | |
| 3.75% (1 Month LIBOR + 3.00%), due 8/4/27 (c) | $ 7,571,610 | $ 7,548,380 |
| Pretium PKG Holdings, Inc. | | |
| First Lien Initial Term Loan | | |
| 4.75% (3 Month LIBOR + 4.00%), due 11/5/27 (c) | 2,570,641 | 2,571,443 |
| Pro Mach Group, Inc. | | |
| First Lien Term Loan | | |
| 2.863% (1 Month LIBOR + 2.75%), due 3/7/25 (c) | 2,000,000 | 1,962,500 |
| Reynolds Consumer Products LLC | | |
| Initial Term Loan | | |
| 1.863% (1 Month LIBOR + 1.75%), due 2/4/27 (c) | 2,171,970 | 2,159,752 |
| Tank Holding Corp. (c) | | |
| First Lien 2020 Refinancing Term Loan | | |
| 3.363% (1 Month LIBOR + 3.25%), due 3/26/26 | 4,437,784 | 4,373,990 |
| First Lien 2020 Incremental Term Loan | | |
| 5.75% (3 Month LIBOR + 5.00%), due 3/26/26 (d) | 857,850 | 857,135 |
| Trident TPI Holdings, Inc. | | |
| Tranche Term Loan B1 | | |
| 4.00% (3 Month LIBOR + 3.00%), due 10/17/24 (c) | 2,011,947 | 1,999,012 |
| | | 46,689,142 |
| Diversified/Conglomerate Manufacturing 2.6% |
| AI Ladder (Luxembourg) Subco SARL | | |
| Facility Term Loan B | | |
| 4.613% (1 Month LIBOR + 4.50%), due 7/9/25 (c)(d) | 1,974,723 | 1,974,723 |
| Allied Universal Holdco LLC | | |
| Initial Term Loan | | |
| 4.363% (1 Month LIBOR + 4.25%), due 7/10/26 (c) | 3,974,899 | 3,965,956 |
| Bright Bidco BV | | |
| 2018 Refinancing Term Loan B | | |
| 4.50% (3 Month LIBOR + 3.50%), due 6/30/24 (c) | 2,870,489 | 2,189,449 |
| | Principal
Amount | Value |
| |
| Diversified/Conglomerate Manufacturing (continued) |
| Filtration Group Corp. | | |
| First Lien Initial Dollar Term Loan | | |
| 3.113% (1 Month LIBOR + 3.00%), due 3/31/25 (c) | $ 2,891,673 | $ 2,859,141 |
| Gardner Denver, Inc. | | |
| 2020 GDI Tranche Dollar Term Loan B2 | | |
| 1.863% (1 Month LIBOR + 1.75%), due 3/1/27 (c) | 3,394,517 | 3,347,136 |
| GYP Holdings III Corp. | | |
| First Lien 2021 Incremental Term Loan | | |
| 2.613% (1 Month LIBOR + 2.50%), due 6/1/25 (c) | 2,613,000 | 2,605,652 |
| Hyster-Yale Group, Inc. | | |
| Term Loan B | | |
| 3.363% (1 Month LIBOR + 3.25%), due 5/30/23 (c)(d)(e) | 812,500 | 806,406 |
| Ingersoll-Rand Services Co. | | |
| 2020 Spinco Tranche Dollar Term Loan B1 | | |
| 1.863% (1 Month LIBOR + 1.75%), due 3/1/27 (c) | 864,339 | 852,274 |
| Iron Mountain Information Management LLC | | |
| Incremental Term Loan B | | |
| 1.863% (1 Month LIBOR + 1.75%), due 1/2/26 (c) | 3,261,472 | 3,218,665 |
| LTI Holdings, Inc. | | |
| First Lien Initial Term Loan | | |
| 3.613% (1 Month LIBOR + 3.50%), due 9/6/25 (c) | 1,352,658 | 1,330,678 |
| Pre-Paid Legal Services | | |
| First Lien Term Loan | | |
| 3.363% (1 Month LIBOR + 3.25%), due 5/1/25 (c) | 3,840,993 | 3,803,382 |
| QUIKRETE Holdings, Inc. | | |
| First Lien Initial Term Loan | | |
| 2.613% (1 Month LIBOR + 2.50%), due 2/1/27 (c) | 2,347,122 | 2,322,184 |
| Red Ventures LLC (c) | | |
| First Lien Term Loan B2 | | |
| 2.613% (1 Month LIBOR + 2.50%), due 11/8/24 | 5,677,687 | 5,585,424 |
| First Lien Term Loan B3 | | |
| 4.25% (1 Month LIBOR + 3.50%), due 11/8/24 | 1,995,000 | 1,990,012 |
The notes to the financial statements are an integral part of, and should be read in conjunction with, the financial statements.
19
Portfolio of Investments April 30, 2021† (Unaudited) (continued)
| | Principal
Amount | Value |
| Loan Assignments (continued) |
| Diversified/Conglomerate Manufacturing (continued) |
| TRC Co.s, Inc. Term Loan | | |
| 4.50% (1 Month LIBOR + 3.50%), due 6/21/24 (c)(d) | $ 2,451,459 | $ 2,435,373 |
| WP CPP Holdings LLC | | |
| First Lien Term Loan | | |
| 4.75% (3 Month LIBOR + 3.75%), due 4/30/25 (c) | 997,556 | 967,213 |
| | | 40,253,668 |
| Diversified/Conglomerate Service 3.4% |
| Applied Systems, Inc. (c) | | |
| First Lien Closing Date Term Loan 3.50%-5.25% | | |
| (3 Month LIBOR + 2.00%, 3 Month LIBOR + 3.00%), due 9/19/24 | 3,463,798 | 3,447,560 |
| Second Lien 2021 Term Loan | | |
| 6.25% (3 Month LIBOR + 5.50%), due 9/19/25 | 1,982,109 | 1,998,213 |
| Blackhawk Network Holdings, Inc. | | |
| First Lien Term Loan | | |
| 3.113% (1 Month LIBOR + 3.00%), due 6/15/25 (c) | 2,910,151 | 2,871,501 |
| BrightView Landscapes LLC | | |
| First Lien 2018 Initial Term Loan | | |
| 2.625% (1 Month LIBOR + 2.50%), due 8/15/25 (c) | 1,446,738 | 1,439,504 |
| CCC Information Services, Inc. | | |
| First Lien Initial Term Loan | | |
| 4.00% (1 Month LIBOR + 3.00%), due 4/29/24 (c) | 1,873,561 | 1,873,172 |
| Change Healthcare Holdings, Inc. | | |
| Closing Date Term Loan | | |
| 3.50% (1 Month LIBOR + 2.50%, 3 Month LIBOR + 2.50%), due 3/1/24 (c) | 2,599,144 | 2,595,895 |
| Greeneden U.S. Holdings I LLC | | |
| Initial Term Loan | | |
| 4.75% (1 Month LIBOR + 4.00%), due 12/1/27 (c) | 1,433,293 | 1,435,801 |
| IRI Holdings, Inc. | | |
| First Lien Initial Term Loan | | |
| 4.363% (1 Month LIBOR + 4.25%), due 12/1/25 (c) | 6,149,577 | 6,129,081 |
| Mitchell International, Inc. | | |
| First Lien Initial Term Loan | | |
| 3.363% (1 Month LIBOR + 3.25%), due 11/29/24 (c) | 1,914,084 | 1,884,574 |
| | Principal
Amount | Value |
| |
| Diversified/Conglomerate Service (continued) |
| MKS Instruments, Inc. | | |
| Tranche Term Loan B6 | | |
| 1.863% (1 Month LIBOR + 1.75%), due 2/2/26 (c) | $ 1,277,609 | $ 1,273,084 |
| Monitronics International, Inc. | | |
| Term Loan | | |
| 7.75% (1 Month LIBOR + 6.50%), due 3/29/24 (c)(d) | 1,835,143 | 1,795,381 |
| Prime Security Services Borrower LLC | | |
| First Lien 2021 Refinancing Term Loan | | |
| 3.50% (1 Month LIBOR + 2.75%, 3 Month LIBOR + 2.75%), due 9/23/26 (c) | 8,887,944 | 8,869,057 |
| TruGreen LP | | |
| First Lien Second Refinancing Term Loan | | |
| 4.75% (1 Month LIBOR + 4.00%), due 11/2/27 (c) | 4,980,407 | 4,972,105 |
| Verint Systems, Inc. | | |
| Refinancing Term Loan | | |
| 2.115% (1 Month LIBOR + 2.00%), due 6/28/24 (c) | 705,883 | 702,353 |
| Verscend Holding Corp. | | |
| Term Loan B1 | | |
| 4.113% (1 Month LIBOR + 4.00%), due 8/27/25 (c) | 8,162,486 | 8,172,689 |
| WEX, Inc. | | |
| Term Loan B | | |
| 2.363% (1 Month LIBOR + 2.25%), due 3/31/28 (c) | 4,000,000 | 3,980,000 |
| | | 53,439,970 |
| Ecological 0.3% |
| GFL Environmental, Inc. | | |
| 2020 Refinancing Term Loan | | |
| 3.50% (1 Month LIBOR + 3.00%), due 5/30/25 (c) | 3,445,956 | 3,445,419 |
| Sophia, LP | | |
| Closing Date Term Loan | | |
| 4.50% (3 Month LIBOR + 3.75%), due 10/7/27 (c) | 890,626 | 890,254 |
| | | 4,335,673 |
| Electronics 11.4% |
| ASG Technologies Group, Inc. | | |
| Replacement Term Loan | | |
| 4.50% (1 Month LIBOR + 3.50%), due 7/31/24 (c)(d) | 2,730,255 | 2,716,604 |
The notes to the financial statements are an integral part of, and should be read in conjunction with, the financial statements.
| 20 | MainStay Floating Rate Fund |
| | Principal
Amount | Value |
| Loan Assignments (continued) |
| Electronics (continued) |
| Avast Software BV | | |
| Initial Dollar Term Loan | | |
| 2.203% (3 Month LIBOR + 2.00%), due 3/22/28 (c) | $ 800,000 | $ 798,400 |
| Barracuda Networks, Inc. | | |
| First Lien Term Loan | | |
| 4.50% (3 Month LIBOR + 3.75%), due 2/12/25 (c) | 3,943,887 | 3,935,999 |
| Camelot U.S. Acquisition 1 Co. (c) | | |
| Initial Term Loan | | |
| 3.113% (1 Month LIBOR + 3.00%), due 10/30/26 | 3,250,954 | 3,218,444 |
| Amendment No. 2 Incremental Term Loan | | |
| 4.00% (1 Month LIBOR + 3.00%), due 10/30/26 | 7,231,875 | 7,233,683 |
| Castle U.S. Holding Corp. | | |
| Initial Dollar Term Loan | | |
| 3.953% (3 Month LIBOR + 3.75%), due 1/29/27 (c) | 2,291,215 | 2,236,322 |
| Castle US Holding Corp. | | |
| Incremental Term Loan B | | |
| TBD, due 1/31/27 | 5,000,000 | 4,880,210 |
| Celestial-Saturn Parent, Inc. | | |
| Term Loan | | |
| TBD, due 4/14/28 | 9,333,333 | 9,282,775 |
| CommScope, Inc. | | |
| Initial Term Loan | | |
| 3.363% (1 Month LIBOR + 3.25%), due 4/6/26 (c) | 10,349,766 | 10,260,820 |
| DCert Buyer, Inc. | | |
| First Lien Initial Term Loan | | |
| 4.113% (1 Month LIBOR + 4.00%), due 10/16/26 (c) | 3,476,222 | 3,470,013 |
| Dell International LLC | | |
| Refinancing Term Loan B2 | | |
| 2.00% (1 Month LIBOR + 1.75%), due 9/19/25 (c) | 11,466,244 | 11,448,001 |
| Diebold Nixdorf, Inc. | | |
| New Dollar Term Loan B | | |
| 2.875% (1 Month LIBOR + 2.75%), due 11/6/23 (c) | 948,844 | 925,123 |
| ECi Macola/MAX Holding LLC | | |
| First Lien Initial Term Loan | | |
| 4.50% (3 Month LIBOR + 3.75%), due 11/9/27 (c) | 3,491,250 | 3,492,339 |
| | Principal
Amount | Value |
| |
| Electronics (continued) |
| Epicor Software Corp., | | |
| Term Loan C | | |
| 4.00% (1 Month LIBOR + 3.25%), due 7/30/27 (c) | $ 6,790,542 | $ 6,776,655 |
| Flexera Software LLC | | |
| First Lien Term Loan B1 | | |
| 4.50% (3 Month LIBOR + 3.75%), due 3/3/28 (c) | 3,302,155 | 3,308,347 |
| Go Daddy Operating Co. LLC | | |
| Tranche Term Loan B2 | | |
| 1.863% (1 Month LIBOR + 1.75%), due 2/15/24 (c) | 2,193,347 | 2,175,153 |
| Helios Software Holdings, Inc. | | |
| 2021 Initial Dollar Term Loan | | |
| 3.93% (3 Month LIBOR + 3.75%), due 3/11/28 (c) | 1,988,571 | 1,972,828 |
| Hyland Software, Inc. (c) | | |
| First Lien 2018 Refinancing Term Loan | | |
| 4.25% (1 Month LIBOR + 3.50%), due 7/1/24 | 5,434,046 | 5,437,443 |
| Second Lien 2021 Refinancing Term Loan | | |
| 7.00% (1 Month LIBOR + 6.25%), due 7/7/25 | 1,996,667 | 1,999,162 |
| Informatica LLC | | |
| 2020 Dollar Term Loan | | |
| 3.363% (1 Month LIBOR + 3.25%), due 2/25/27 (c) | 2,970,000 | 2,940,763 |
| ION Trading Finance Ltd. | | |
| 2021 Initial Dollar Term Loan | | |
| 4.952% (3 Month LIBOR + 4.75%), due 4/1/28 (c) | 4,000,000 | 3,998,752 |
| MA FinanceCo. LLC (c) | | |
| Tranche Term Loan B3 | | |
| 2.863% (1 Month LIBOR + 2.75%), due 6/21/24 | 390,152 | 384,983 |
| Tranche Term Loan B4 | | |
| 5.25% (3 Month LIBOR + 4.25%), due 6/5/25 (d) | 993,671 | 996,983 |
| McAfee LLC | | |
| USD Term Loan B | | |
| 3.86% (1 Month LIBOR + 3.75%), due 9/30/24 (c) | 8,296,152 | 8,290,967 |
The notes to the financial statements are an integral part of, and should be read in conjunction with, the financial statements.
21
Portfolio of Investments April 30, 2021† (Unaudited) (continued)
| | Principal
Amount | Value |
| Loan Assignments (continued) |
| Electronics (continued) |
| MH Sub I LLC (c) | | |
| First Lien Amendment No. 2 Initial Term Loan | | |
| 3.613% (1 Month LIBOR + 3.50%), due 9/13/24 | $ 4,100,221 | $ 4,060,072 |
| 1st Lien 2020 June New Term Loan | | |
| 4.75% (1 Month LIBOR + 3.75%), due 9/13/24 | 6,891,731 | 6,884,840 |
| Milano Acquisition Corp., | | |
| First Lien Term Loan B | | |
| 4.75% (3 Month LIBOR + 4.00%), due 10/1/27 (c) | 1,662,500 | 1,660,941 |
| Misys Ltd. (c) | | |
| First Lien Dollar Term Loan | | |
| 4.50% (6 Month LIBOR + 3.50%), due 6/13/24 | 3,047,011 | 2,991,784 |
| Second Lien Dollar Term Loan | | |
| 8.25% (6 Month LIBOR + 7.25%), due 6/13/25 | 2,450,000 | 2,469,906 |
| Oberthur Technologies Holding S.A.S. | | |
| Facility Term Loan B1 | | |
| 5.25% (3 Month LIBOR + 3.75%), due 1/10/26 (c) | 2,182,330 | 2,150,140 |
| Project Alpha Intermediate Holding, Inc. | | |
| 2021 Refinancing Term Loan | | |
| 4.12% (1 Month LIBOR + 4.00%), due 4/26/24 (c) | 2,288,777 | 2,281,624 |
| Project Leopard Holdings, Inc. | | |
| 2018 Repricing Term Loan | | |
| 5.75% (3 Month LIBOR + 4.75%), due 7/5/24 (c) | 1,930,312 | 1,931,760 |
| Rocket Software, Inc. | | |
| First Lien Initial Term Loan | | |
| 4.363% (1 Month LIBOR + 4.25%), due 11/28/25 (c) | 2,058,000 | 2,039,992 |
| Seattle SpinCo, Inc. | | |
| Initial Term Loan | | |
| 2.863% (1 Month LIBOR + 2.75%), due 6/21/24 (c) | 2,634,795 | 2,599,884 |
| Solera LLC | | |
| Dollar Term Loan | | |
| 2.863% (1 Month LIBOR + 2.75%), due 3/3/23 (c) | 1,343,914 | 1,337,194 |
| | Principal
Amount | Value |
| |
| Electronics (continued) |
| SS&C Technologies Holdings, Inc. (c) | | |
| Term Loan B3 | | |
| 1.863% (1 Month LIBOR + 1.75%), due 4/16/25 | $ 4,169,434 | $ 4,115,577 |
| Term Loan B4 | | |
| 1.863% (1 Month LIBOR + 1.75%), due 4/16/25 | 3,092,173 | 3,052,361 |
| Surf Holdings LLC SARL | | |
| First Lien Dollar Tranche Term Loan | | |
| 3.676% (3 Month LIBOR + 3.50%), due 3/5/27 (c) | 3,033,613 | 3,002,898 |
| Syncsort, Inc. | | |
| Term Loan B | | |
| TBD, due 3/19/28 | 4,000,000 | 3,981,668 |
| Tempo Acquisition LLC | | |
| Extended Term Loan | | |
| 3.75% (1 Month LIBOR + 3.25%), due 11/2/26 (c) | 1,422,072 | 1,420,650 |
| ThoughtWorks, Inc. | | |
| Incremental Term Loan | | |
| 3.75% (1 Month LIBOR + 3.25%), due 3/24/28 (c) | 2,400,000 | 2,389,999 |
| Tibco Software, Inc. (c) | | |
| Term Loan B3 | | |
| 3.87% (1 Month LIBOR + 3.75%), due 6/30/26 | 8,988,750 | 8,923,582 |
| Second Lien Term Loan | | |
| 7.37% (1 Month LIBOR + 7.25%), due 3/3/28 | 600,000 | 606,563 |
| Trader Corporation | | |
| First Lien 2017 Refinancing Term Loan | | |
| 4.00% (1 Month LIBOR + 3.00%), due 9/28/23 (c) | 4,034,981 | 4,034,981 |
| UKG, Inc. (c) | | |
| First Lien Initial Term Loan | | |
| 3.863% (1 Month LIBOR + 3.75%), due 5/4/26 | 1,970,000 | 1,970,307 |
| First Lien 2021 Incremental Term Loan | | |
| 4.00% (3 Month LIBOR + 3.25%), due 5/4/26 | 4,425,309 | 4,428,469 |
| Vertiv Group Corp. | | |
| Term Loan B | | |
| 2.861% (1 Month LIBOR + 2.75%), due 3/2/27 (c) | 5,962,556 | 5,927,151 |
The notes to the financial statements are an integral part of, and should be read in conjunction with, the financial statements.
| 22 | MainStay Floating Rate Fund |
| | Principal
Amount | Value |
| Loan Assignments (continued) |
| Electronics (continued) |
| VS Buyer LLC | | |
| Initial Term Loan | | |
| 3.113% (1 Month LIBOR + 3.00%), due 2/28/27 (c) | $ 1,485,000 | $ 1,472,006 |
| Western Digital Corp. | | |
| U.S. Term Loan B4 | | |
| 1.863% (1 Month LIBOR + 1.75%), due 4/29/23 (c) | 1,489,077 | 1,486,684 |
| | | 179,401,802 |
| Entertainment 0.7% |
| Formula One Management Ltd. | | |
| USD Facility Term Loan B3 | | |
| 3.50% (1 Month LIBOR + 2.50%), due 2/1/24 (c) | 3,650,036 | 3,622,153 |
| J&J Ventures Gaming LLC | | |
| Term Loan | | |
| 4.75% (1 Month LIBOR + 4.00%), due 4/26/28 (c) | 7,500,000 | 7,481,250 |
| | | 11,103,403 |
| Finance 11.0% |
| AAdvantage Loyalty IP Ltd. | | |
| Initial Term Loan | | |
| 5.50% (6 Month LIBOR + 4.75%), due 4/20/28 (c) | 5,200,000 | 5,338,939 |
| Acuity Specialty Products, Inc. | | |
| First Lien Initial Term Loan | | |
| 5.00% (3 Month LIBOR + 4.00%), due 8/12/24 (c)(d) | 6,032,305 | 5,954,072 |
| Acuris Finance US, Inc. | | |
| Initial Dollar Term Loan | | |
| 4.50% (3 Month LIBOR + 4.00%), due 2/16/28 (c) | 6,125,000 | 6,119,898 |
| ADMI Corp. | | |
| Amendment No.4 Refinancing Term Loan | | |
| 3.25% (1 Month LIBOR + 2.75%), due 12/23/27 (c) | 2,500,000 | 2,481,945 |
| AlixPartners LLP | | |
| Initial Dollar Term Loan | | |
| 3.25% (1 Month LIBOR + 2.75%), due 2/4/28 (c) | 7,000,000 | 6,965,973 |
| Alliant Holdings I, Inc. | | |
| Initial Term Loan | | |
| TBD, due 11/6/27 (b) | 4,000,000 | 3,996,876 |
| | Principal
Amount | Value |
| |
| Finance (continued) |
| Amentum Government Services Holdings LLC (c) | | |
| First Lien Tranche Term Loan 1 | | |
| 3.613% (1 Month LIBOR + 3.50%), due 1/29/27 | $ 620,313 | $ 613,722 |
| First Lien Tranche Term Loan 2 | | |
| 5.50% (3 Month LIBOR + 4.75%), due 1/29/27 | 1,000,000 | 1,005,000 |
| Blue Tree Holdings, Inc. | | |
| Term Loan | | |
| 2.65% (3 Month LIBOR + 2.50%), due 3/4/28 (c) | 1,500,000 | 1,486,875 |
| Brand Energy & Infrastructure Services, Inc. | | |
| Initial Term Loan | | |
| 5.25% (3 Month LIBOR + 4.25%), due 6/21/24 (c) | 1,532,511 | 1,488,177 |
| Colouroz Investment (c)(d) | | |
| 1 GMBH First Lien Initial Term Loan C 5.25%-6.00% | | |
| (2 Month LIBOR + 4.25%, 3 Month LIBOR + 4.25%), due 9/21/23 | 343,639 | 335,334 |
| 2 GMBH First Lien Initial Term Loan B2 5.25%-6.00% | | |
| 5.25% (2 Month LIBOR + 4.25%, 3 Month LIBOR + 4.25%), due 9/21/23 | 2,078,734 | 2,028,498 |
| Covia Holdings LLC | | |
| Initial Term Loan | | |
| 5.00% (3 Month LIBOR + 4.00%), due 7/31/26 (c) | 837,917 | 807,019 |
| CPC Acquisition Corp. | | |
| First Lien Initial Term Loan | | |
| 4.50% (3 Month LIBOR + 3.75%), due 12/29/27 (c) | 6,500,000 | 6,422,812 |
| Cyxtera DC Holdings, Inc. | | |
| Second Lien Initial Term Loan | | |
| 8.25% (3 Month LIBOR + 7.25%), due 5/1/25 (c)(d) | 1,200,000 | 1,186,500 |
| Deerfield Dakota Holding LLC | | |
| First Lien Initial Dollar Term Loan | | |
| 4.75% (1 Month LIBOR + 3.75%), due 4/9/27 (c) | 5,478,700 | 5,487,833 |
| EG Group Ltd. | | |
| Term Loan | | |
| TBD, due 3/11/26 | 3,000,000 | 2,977,500 |
The notes to the financial statements are an integral part of, and should be read in conjunction with, the financial statements.
23
Portfolio of Investments April 30, 2021† (Unaudited) (continued)
| | Principal
Amount | Value |
| Loan Assignments (continued) |
| Finance (continued) |
| Endurance International Group, Inc., | | |
| Initial Term Loan | | |
| 4.25% (3 Month LIBOR + 3.50%), due 2/10/28 (c) | $ 4,772,234 | $ 4,730,477 |
| FC Compassus LLC | | |
| Term Loan B1 | | |
| 5.00% (3 Month LIBOR + 4.25%), due 12/31/26 (c)(d) | 6,440,733 | 6,472,936 |
| Great Outdoors Group LLC | | |
| Term Loan B1 | | |
| 5.00% (3 Month LIBOR + 4.25%), due 3/6/28 (c) | 9,835,350 | 9,869,774 |
| Greenrock Finance, Inc. | | |
| First Lien Initial USD Term Loan B | | |
| 4.50% (3 Month LIBOR + 3.50%), due 6/28/24 (c)(d) | 1,915,291 | 1,886,561 |
| Indy US Bidco LLC | | |
| Tranche Term Loan B1 | | |
| 4.111% (1 Month LIBOR + 4.00%), due 3/6/28 (c) | 6,500,000 | 6,485,102 |
| Intelsat Jackson Holdings SA | | |
| Term Loan | | |
| 6.50% (3 Month LIBOR + 5.50%), due 7/13/22 (c) | 411,246 | 414,947 |
| IPS Acquisition LLC | | |
| First Lien Term Loan B2 | | |
| 4.25% (1 Month LIBOR + 3.25%), due 11/7/24 (c) | 951,841 | 949,859 |
| iStar, Inc. | | |
| Term Loan 2.861%-2.864% | | |
| (1 Month LIBOR + 2.75%), due 6/28/23 (c) | 630,585 | 629,797 |
| LBM Acquisition LLC | | |
| First Lien Initial Term Loan | | |
| 4.50% (3 Month LIBOR + 3.75%), due 12/17/27 (c) | 2,936,364 | 2,931,777 |
| Lonza Specialty Ingredients | | |
| Term Loan B | | |
| TBD, due 1/1/28 | 3,500,000 | 3,465,000 |
| LSF11 Skyscraper Holdco SARL | | |
| Facility Term Loan B3 | | |
| 4.25% (3 Month LIBOR + 3.50%), due 9/29/27 (c) | 6,200,000 | 6,192,250 |
| Minimax Viking GmbH | | |
| Facility Term Loan B1C | | |
| 3.50% (1 Month LIBOR + 2.75%), due 7/31/25 (c) | 4,149,582 | 4,141,802 |
| | Principal
Amount | Value |
| |
| Finance (continued) |
| ON Semiconductor Corp. | | |
| 2019 New Replacement Term Loan B4 | | |
| 2.113% (1 Month LIBOR + 2.00%), due 9/19/26 (c) | $ 487,563 | $ 486,233 |
| Onex TSG Intermediate Corp. | | |
| Initial Term Loan | | |
| 5.50% (3 Month LIBOR + 4.75%), due 2/28/28 (c) | 4,000,000 | 3,958,332 |
| Pactiv Evergreen, Inc. | | |
| U.S. Tranche Term Loan B2 | | |
| 3.363% (1 Month LIBOR + 3.25%), due 2/5/26 (c) | 1,122,187 | 1,111,667 |
| Park River Holdings, Inc. | | |
| First Lien Initial Term Loan | | |
| 4.00% (3 Month LIBOR + 3.25%), due 12/28/27 (c) | 3,666,667 | 3,644,322 |
| Peak 10 Holding Corp. | | |
| First Lien Initial Term Loan | | |
| 3.703% (3 Month LIBOR + 3.50%), due 8/1/24 (c) | 2,702,000 | 2,505,262 |
| Peraton Corp | | |
| First Lien Term Loan B | | |
| 4.50% (1 Month LIBOR + 3.75%), due 2/1/28 (c) | 3,750,127 | 3,744,659 |
| Pluto Acquisition I, Inc. | | |
| First Lien 2020 Incremental Term Loan | | |
| 5.50% (1 Month LIBOR + 5.00%), due 6/22/26 (c) | 3,890,250 | 3,899,976 |
| PODS, LLC | | |
| Initial Term Loan | | |
| 3.75% (1 Month LIBOR + 3.00%), due 3/31/28 (c) | 7,000,000 | 6,967,499 |
| Potters Industries LLC | | |
| Initial Term Loan | | |
| 4.75% (3 Month LIBOR + 4.00%), due 12/14/27 (c) | 1,200,000 | 1,200,000 |
| PQ Group Holdings, Inc. | | |
| Term Loan B | | |
| TBD, due 1/1/28 | 2,100,000 | 2,089,500 |
| RealPage, Inc. | | |
| First Lien Initial Term Loan | | |
| 3.75%, due 4/24/28 | 4,846,154 | 4,822,597 |
| Sinclair Television Group, Inc. | | |
| Term Loan B3 | | |
| TBD, due 4/1/28 | 3,000,000 | 2,988,750 |
The notes to the financial statements are an integral part of, and should be read in conjunction with, the financial statements.
| 24 | MainStay Floating Rate Fund |
| | Principal
Amount | Value |
| Loan Assignments (continued) |
| Finance (continued) |
| Transplace Holdings, Inc. | | |
| First Lien Closing Date Term Loan | | |
| 4.75% (3 Month LIBOR + 3.75%), due 10/7/24 (c)(d) | $ 1,235,792 | $ 1,236,307 |
| Triton Water Holdings, Inc. | | |
| First Lien Initial Term Loan | | |
| 4.00% (3 Month LIBOR + 3.50%), due 3/31/28 (c) | 9,960,000 | 9,922,650 |
| Truck Hero, Inc. | | |
| Initial Term Loan | | |
| 4.50% (1 Month LIBOR + 3.75%), due 1/31/28 (c) | 4,020,000 | 4,008,945 |
| USS Ultimate Holdings, Inc. (c) | | |
| First Lien Initial Term Loan | | |
| 4.75% (1 Month LIBOR + 3.75%), due 8/25/24 | 1,833,500 | 1,834,154 |
| Second Lien Initial Term Loan | | |
| 8.75% (1 Month LIBOR + 7.75%), due 8/25/25 (d) | 600,000 | 598,125 |
| WCG Purchaser Corp. | | |
| First Lien Initial Term Loan | | |
| 5.00% (3 Month LIBOR + 4.00%), due 1/8/27 (c) | 3,804,583 | 3,814,095 |
| WildBrain Ltd. | | |
| Initial Term Loan | | |
| 5.00% (1 Month LIBOR + 4.25%), due 3/24/28 (c) | 5,640,000 | 5,590,650 |
| WIN Waste Innovations Holdings Inc. | | |
| Initial Term Loan | | |
| 3.25% (1 Month LIBOR + 2.75%), due 3/24/28 (c) | 4,960,000 | 4,938,300 |
| | | 172,229,278 |
| Healthcare, Education & Childcare 8.5% |
| Agiliti Health, Inc. | | |
| Initial Term Loan | | |
| 2.875% (1 Month LIBOR + 2.75%), due 1/4/26 (c) | 2,058,000 | 2,042,565 |
| AHP Health Partners, Inc. | | |
| Term Loan B1 | | |
| 4.75% (1 Month LIBOR + 3.75%), due 6/30/25 (c) | 3,046,127 | 3,048,030 |
| Akorn Operating Co. LLC | | |
| Term Loan | | |
| 8.50% (3 Month LIBOR + 7.50%), due 10/1/25 (c) | 149,190 | 152,919 |
| | Principal
Amount | Value |
| |
| Healthcare, Education & Childcare (continued) |
| Alliance Healthcare Services, Inc. | | |
| First Lien Initial Term Loan | | |
| 5.50% (1 Month LIBOR + 4.50%), due 10/24/23 (c)(d) | $ 925,874 | $ 870,900 |
| Alvogen Pharma U.S., Inc. | | |
| January 2020 Loan | | |
| 6.25% (3 Month LIBOR + 5.25%), due 12/31/23 (c) | 943,433 | 933,409 |
| Amneal Pharmaceuticals LLC | | |
| Initial Term Loan | | |
| 3.625% (1 Month LIBOR + 3.50%), due 5/4/25 (c) | 6,081,867 | 5,955,668 |
| athenahealth, Inc. | | |
| First Lien Term Loan B1 | | |
| 4.453% (3 Month LIBOR + 4.25%), due 2/11/26 (c) | 9,126,126 | 9,154,646 |
| Auris Luxembourg III SARL | | |
| First Lien Facility Term Loan B2 | | |
| 3.863% (1 Month LIBOR + 3.75%), due 2/27/26 (c) | 1,384,009 | 1,357,021 |
| Avantor Funding, Inc. | | |
| Initial Dollar Term Loan B3 | | |
| 3.00% (1 Month LIBOR + 2.00%), due 11/21/24 (c) | 1,152,449 | 1,151,296 |
| Bausch Health Cos., Inc. | | |
| Initial Term Loan | | |
| 3.109% (1 Month LIBOR + 3.00%), due 6/2/25 (c) | 6,447,802 | 6,437,053 |
| Carestream Dental Equipment, Inc. | | |
| First Lien Initial Term Loan | | |
| 4.25% (3 Month LIBOR + 3.25%), due 9/1/24 (c) | 1,934,849 | 1,905,827 |
| Carestream Health, Inc. (c) | | |
| First Lien 2023 Extended Term Loan | | |
| 7.75% (3 Month LIBOR + 6.75%), due 5/8/23 | 2,719,672 | 2,716,272 |
| Second Lien 2023 Extended Term Loan | | |
| 13.50% (3 Month LIBOR + 4.50%), due 8/8/23 | 2,183,959 | 2,031,082 |
| DaVita, Inc. | | |
| Tranche Term Loan B1 | | |
| 1.863% (1 Month LIBOR + 1.75%), due 8/12/26 (c) | 3,693,867 | 3,670,319 |
The notes to the financial statements are an integral part of, and should be read in conjunction with, the financial statements.
25
Portfolio of Investments April 30, 2021† (Unaudited) (continued)
| | Principal
Amount | Value |
| Loan Assignments (continued) |
| Healthcare, Education & Childcare (continued) |
| Elanco Animal Health, Inc. | | |
| Term Loan | | |
| 1.865% (1 Month LIBOR + 1.75%), due 8/1/27 (c) | $ 2,815,607 | $ 2,775,384 |
| Endo Luxembourg Finance Co. I SARL | | |
| 2021 Term Loan B | | |
| 5.75% (1 Month LIBOR + 5.00%), due 3/27/28 (c) | 5,000,000 | 4,859,375 |
| Envision Healthcare Corp. | | |
| Initial Term Loan | | |
| 3.863% (1 Month LIBOR + 3.75%), due 10/10/25 (c) | 3,294,151 | 2,777,674 |
| eResearchTechnology, Inc. | | |
| First Lien Initial Term Loan | | |
| 5.50% (1 Month LIBOR + 4.50%), due 2/4/27 (c) | 4,976,487 | 4,988,152 |
| EWT Holdings III Corp. | | |
| Initial Term Loan | | |
| 2.615% (1 Month LIBOR + 2.50%), due 4/1/28 (c) | 4,725,000 | 4,689,562 |
| ExamWorks Group, Inc. | | |
| Term Loan B1 | | |
| 4.25% (3 Month LIBOR + 3.25%), due 7/27/23 (c) | 4,672,645 | 4,668,472 |
| Gentiva Health Services, Inc. | | |
| First Lien Term Loan B1 | | |
| 2.875% (1 Month LIBOR + 2.75%), due 7/2/25 (c) | 2,731,362 | 2,722,259 |
| Grifols Worldwide Operations Ltd. | | |
| Tranche Term Loan B | | |
| 2.087% (1 Week LIBOR + 2.00%), due 11/15/27 (c) | 3,979,924 | 3,932,889 |
| HCA, Inc. | | |
| Tranche Term Loan B12 | | |
| 1.863% (1 Month LIBOR + 1.75%), due 3/13/25 (c) | 2,450,063 | 2,448,532 |
| Horizon Therapeutics USA, Inc. | | |
| Incremental Term Loan B2 | | |
| 2.50% (1 Month LIBOR + 2.00%), due 3/15/28 (c) | 2,666,667 | 2,656,667 |
| Insulet Corp. | | |
| Term Loan B | | |
| TBD, due 4/30/28 | 5,600,000 | 5,586,000 |
| Journey Personal Care Corp. | | |
| Initial Term Loan | | |
| 5.00% (3 Month LIBOR + 4.25%), due 3/1/28 (c) | 5,000,000 | 5,000,000 |
| | Principal
Amount | Value |
| |
| Healthcare, Education & Childcare (continued) |
| LifePoint Health, Inc. | | |
| First Lien Term Loan B | | |
| 3.863% (1 Month LIBOR + 3.75%), due 11/16/25 (c) | $ 4,642,116 | $ 4,624,128 |
| Mallinckrodt International Finance SA | | |
| 2017 Term Loan B | | |
| 5.50% (1 Month LIBOR + 4.75%), due 9/24/24 (c)(f)(g) | 2,007,731 | 1,962,917 |
| National Mentor Holdings, Inc. (c) | | |
| First Lien Initial Term Loan | | |
| 4.50% (1 Month LIBOR + 3.75%, 3 Month LIBOR + 3.75%), due 3/2/28 | 3,148,688 | 3,142,293 |
| First Lien Term Loan C | | |
| 4.50% (3 Month LIBOR + 3.75%), due 3/2/28 (d) | 104,956 | 104,563 |
| Organon & Co. | | |
| Term Loan | | |
| TBD, due 4/8/28 | 8,750,000 | 8,723,435 |
| Ortho-Clinical Diagnostics, Inc. | | |
| Second Amendment New Term Loan | | |
| 3.361% (1 Month LIBOR + 3.25%), due 6/30/25 (c) | 2,606,177 | 2,601,110 |
| Press Ganey | | |
| Initial Term Loan | | |
| TBD, due 1/1/38 | 2,000,000 | 1,990,000 |
| Select Medical Corp. | | |
| Tranche Term Loan B | | |
| 2.37% (1 Month LIBOR + 2.25%), due 3/6/25 (c) | 4,354,845 | 4,315,382 |
| Sound Inpatient Physicians, Inc. | | |
| First Lien Initial Term Loan | | |
| 2.863% (1 Month LIBOR + 2.75%), due 6/27/25 (c)(d) | 1,945,000 | 1,931,871 |
| Sunshine Luxembourg VII SARL | | |
| Facility Term Loan B3 | | |
| 4.50% (3 Month LIBOR + 3.75%), due 10/1/26 (c) | 10,877,171 | 10,879,434 |
| Team Health Holdings, Inc. | | |
| Initial Term Loan | | |
| 3.75% (1 Month LIBOR + 2.75%), due 2/6/24 (c) | 2,767,507 | 2,577,240 |
| U.S. Anesthesia Partners, Inc. | | |
| First Lien Initial Term Loan | | |
| 4.00% (6 Month LIBOR + 3.00%), due 6/23/24 (c) | 2,376,607 | 2,338,836 |
| | | 133,723,182 |
The notes to the financial statements are an integral part of, and should be read in conjunction with, the financial statements.
| 26 | MainStay Floating Rate Fund |
| | Principal
Amount | Value |
| Loan Assignments (continued) |
| Home and Office Furnishings, Housewares & Durable Consumer Products 0.3% |
| Serta Simmons Bedding LLC | | |
| First Lien Initial Term Loan | | |
| 4.50% (3 Month LIBOR + 3.50%), due 11/8/23 (c) | $ 5,885,152 | $ 4,531,567 |
| Hotels, Motels, Inns & Gaming 5.1% |
| Aimbridge Acquisition Co., Inc. | | |
| First Lien 2019 Initial Term Loan | | |
| 3.863% (1 Month LIBOR + 3.75%), due 2/2/26 (c) | 5,213,718 | 5,065,998 |
| AP Gaming I LLC | | |
| First Lien Incremental Term Loan B | | |
| 4.50% (3 Month LIBOR + 3.50%), due 2/15/24 (c) | 2,985,441 | 2,953,100 |
| Caesars Resort Collection LLC | | |
| Term Loan B | | |
| 2.863% (1 Month LIBOR + 2.75%), due 12/23/24 (c) | 9,612,712 | 9,501,570 |
| Churchill Downs, Inc. | | |
| Facility Term Loan B | | |
| 2.12% (1 Month LIBOR + 2.00%), due 12/27/24 (c) | 2,418,750 | 2,410,688 |
| CityCenter Holdings LLC Term Loan B | | |
| 3.00% (1 Month LIBOR + 2.25%), due 4/18/24 (c) | 4,559,595 | 4,507,032 |
| Everi Payments Inc., (c) | | |
| Term Loan B | | |
| 3.50% (1 Month LIBOR + 2.75%), due 5/9/24 | 4,253,389 | 4,217,235 |
| Term Loan | | |
| 11.50% (1 Month LIBOR + 10.50%), due 5/9/24 (d)(e) | 794,000 | 829,730 |
| Flutter Entertainment plc | | |
| USD Term Loan | | |
| 3.703% (3 Month LIBOR + 3.50%), due 7/10/25 (c) | 94,842 | 95,079 |
| Four Seasons Holdings, Inc. | | |
| First Lien 2013 Term Loan | | |
| 2.113% (1 Month LIBOR + 2.00%), due 11/30/23 (c) | 1,453,305 | 1,449,267 |
| Golden Entertainment, Inc. | | |
| First Lien Facilty Term Loan B | | |
| 3.75% (1 Month LIBOR + 3.00%), due 10/20/24 (c) | 1,600,000 | 1,582,499 |
| | Principal
Amount | Value |
| |
| Hotels, Motels, Inns & Gaming (continued) |
| GVC Holdings plc, | | |
| USD Facility Term Loan B3 | | |
| 3.00% (6 Month LIBOR + 2.00%), due 3/29/24 (c) | $ 7,897,146 | $ 7,862,597 |
| Hilton Worldwide Finance LLC | | |
| Refinancing Term Loan B2 | | |
| 1.861% (1 Month LIBOR + 1.75%), due 6/22/26 (c) | 1,720,157 | 1,704,323 |
| PCI Gaming Authority | | |
| Facility Term Loan B | | |
| 2.61% (1 Month LIBOR + 2.50%), due 5/29/26 (c) | 3,658,702 | 3,625,547 |
| Penn National Gaming, Inc. | | |
| Facility Term Loan B1 | | |
| 3.00% (1 Month LIBOR + 2.25%), due 10/15/25 (c) | 2,413,931 | 2,399,392 |
| Scientific Games International, Inc. | | |
| Initial Term Loan B5 | | |
| 2.863% (1 Month LIBOR + 2.75%), due 8/14/24 (c) | 9,394,172 | 9,247,924 |
| Station Casinos LLC | | |
| Facility Term Loan B1 | | |
| 2.50% (1 Month LIBOR + 2.25%), due 2/8/27 (c) | 6,991,739 | 6,886,863 |
| UFC Holdings, LLC | | |
| First Lien Term Loan B3 | | |
| 3.75% (3 Month LIBOR + 3.00%), due 4/29/26 (c) | 8,418,970 | 8,385,647 |
| Wyndham Destinations, Inc. | | |
| Term Loan B | | |
| 2.363% (1 Month LIBOR + 2.25%), due 5/30/25 (c) | 3,900,000 | 3,862,950 |
| Wyndham Hotels & Resorts, Inc. | | |
| Term Loan B | | |
| 1.863% (1 Month LIBOR + 1.75%), due 5/30/25 (c) | 3,412,500 | 3,378,375 |
| | | 79,965,816 |
| Insurance 3.3% |
| Acrisure LLC | | |
| First Lien 2020 Term Loan | | |
| 3.703% (3 Month LIBOR + 3.50%), due 2/15/27 (c) | 4,937,531 | 4,855,238 |
| AmWINS Group, Inc. | | |
| Term Loan | | |
| 3.00% (1 Month LIBOR + 2.25%), due 2/19/28 (c) | 1,995,000 | 1,973,268 |
The notes to the financial statements are an integral part of, and should be read in conjunction with, the financial statements.
27
Portfolio of Investments April 30, 2021† (Unaudited) (continued)
| | Principal
Amount | Value |
| Loan Assignments (continued) |
| Insurance (continued) |
| AssuredPartners, Inc. | | |
| 2020 February Refinancing Term Loan | | |
| 3.613% (1 Month LIBOR + 3.50%), due 2/12/27 (c) | $ 5,010,666 | $ 4,959,663 |
| Asurion LLC (c) | | |
| Replacement Term Loan B6 | | |
| 3.113% (1 Month LIBOR + 3.00%), due 11/3/23 | 2,308,444 | 2,301,590 |
| New Term Loan B7 | | |
| 3.113% (1 Month LIBOR + 3.00%), due 11/3/24 | 802,159 | 797,145 |
| New Term Loan B8 | | |
| 3.363% (1 Month LIBOR + 3.25%), due 12/23/26 | 1,995,000 | 1,980,349 |
| New Term Loan B9 | | |
| 3.363% (1 Month LIBOR + 3.25%), due 7/31/27 | 2,000,000 | 1,984,584 |
| Second Lien Term Loan B3 | | |
| 5.363% (1 Month LIBOR + 5.25%), due 1/31/28 | 8,200,000 | 8,312,750 |
| Hub International Ltd. (c) | | |
| Initial Term Loan 3.150%-3.175% | | |
| (2 Month LIBOR + 3.00%, 3 Month LIBOR + 3.00%), due 4/25/25 | 1,593,400 | 1,571,490 |
| Incremental Term Loan B3 | | |
| 4.00% (3 Month LIBOR + 3.25%), due 4/25/25 | 5,000,000 | 4,993,305 |
| NFP Corp. | | |
| Closing Date Term Loan | | |
| 3.363% (1 Month LIBOR + 3.25%), due 2/15/27 (c) | 3,398,231 | 3,347,788 |
| Ryan Specialty Group LLC | | |
| Initial Term Loan | | |
| 3.75% (1 Month LIBOR + 3.00%), due 9/1/27 (c) | 995,000 | 992,512 |
| Sedgwick Claims Management Services, Inc. (c) | | |
| Initial Term Loan | | |
| 3.363% (1 Month LIBOR + 3.25%), due 12/31/25 | 4,880,113 | 4,807,927 |
| 2019 Term Loan | | |
| 3.863% (1 Month LIBOR + 3.75%), due 9/3/26 | 2,992,386 | 2,976,176 |
| | Principal
Amount | Value |
| |
| Insurance (continued) |
| USI, Inc. (c) | | |
| 2017 New Term Loan | | |
| 3.203% (3 Month LIBOR + 3.00%), due 5/16/24 | $ 4,332,654 | $ 4,282,365 |
| 2019 New Term Loan | | |
| 3.453% (3 Month LIBOR + 3.25%), due 12/2/26 | 987,504 | 977,423 |
| | | 51,113,573 |
| Leisure, Amusement, Motion Pictures & Entertainment 1.7% |
| Alterra Mountain Co. | | |
| Initial Bluebird Term Loan | | |
| 2.863% (1 Month LIBOR + 2.75%), due 7/31/24 (c) | 4,852,159 | 4,766,344 |
| Bombardier Recreational Products, Inc. | | |
| 2020 Replacement Term Loan | | |
| 2.113% (1 Month LIBOR + 2.00%), due 5/24/27 (c) | 4,285,053 | 4,225,646 |
| Boyd Gaming Corp. | | |
| Refinacing Term Loan B | | |
| 2.337% (1 Week LIBOR + 2.25%), due 9/15/23 (c) | 1,988,251 | 1,984,274 |
| Creative Artists Agency LLC | | |
| Closing Date Term Loan | | |
| 3.863% (1 Month LIBOR + 3.75%), due 11/27/26 (c) | 2,468,750 | 2,446,763 |
| Fitness International LLC (c) | | |
| Term Loan A | | |
| 4.25% (1 Month LIBOR + 3.25%), due 1/8/25 | 1,617,188 | 1,538,350 |
| Term Loan B | | |
| 4.25% (1 Month LIBOR + 3.25%), due 4/18/25 | 291,959 | 277,048 |
| Lions Gate Capital Holdings LLC | | |
| Term Loan B | | |
| 2.363% (1 Month LIBOR + 2.25%), due 3/24/25 (c) | 1,372,242 | 1,358,520 |
| Marriott Ownership Resorts, Inc. | | |
| 2019 Refinancing Term Loan | | |
| 1.863% (1 Month LIBOR + 1.75%), due 8/29/25 (c) | 2,410,432 | 2,362,975 |
| TKC Holdings, Inc | | |
| First Lien Initial Term Loan | | |
| 4.75% (1 Month LIBOR + 3.75%), due 2/1/23 (c) | 2,682,560 | 2,628,909 |
The notes to the financial statements are an integral part of, and should be read in conjunction with, the financial statements.
| 28 | MainStay Floating Rate Fund |
| | Principal
Amount | Value |
| Loan Assignments (continued) |
| Leisure, Amusement, Motion Pictures & Entertainment (continued) |
| William Morris Endeavor Entertainment LLC | | |
| First Lien Term Loan B1 2.87%-2.94% | | |
| (1 Month LIBOR + 2.75%, 3 Month LIBOR + 2.75%), due 5/18/25 (c) | $ 4,546,195 | $ 4,408,391 |
| | | 25,997,220 |
| Machinery (Non-Agriculture, Non-Construct & Non-Electronic) 0.7% |
| Advanced Drainage Systems, Inc. | | |
| Initial Term Loan | | |
| 2.375% (1 Month LIBOR + 2.25%), due 7/31/26 (c) | 470,893 | 470,501 |
| Altra Industrial Motion Corp. | | |
| Term Loan | | |
| 2.113% (1 Month LIBOR + 2.00%), due 10/1/25 (c) | 2,611,940 | 2,597,248 |
| Brown Group Holdings LLC | | |
| Term Loan B | | |
| TBD, due 4/22/28 | 1,750,000 | 1,740,375 |
| CPM Holdings, Inc. (c) | | |
| First Lien Initial Term Loan | | |
| 3.615% (1 Month LIBOR + 3.50%), due 11/17/25 | 1,461,337 | 1,444,166 |
| Second Lien Initial Term Loan | | |
| 8.365% (1 Month LIBOR + 8.25%), due 11/16/26 (d) | 797,980 | 787,340 |
| Titan Acquisition Ltd. | | |
| Initial Term Loan | | |
| 3.267% (3 Month LIBOR + 3.00%), due 3/28/25 (c) | 2,516,811 | 2,460,534 |
| Welbilt, Inc. | | |
| Term Loan B | | |
| 2.611% (1 Month LIBOR + 2.50%), due 10/23/25 (c) | 1,994,060 | 1,969,134 |
| | | 11,469,298 |
| Manufacturing 0.3% |
| FCG Acquisitions, Inc. | | |
| First Lien Initial Term Loan | | |
| 4.25% (3 Month LIBOR + 3.75%), due 3/31/28 (c) | 3,360,000 | 3,339,000 |
| | Principal
Amount | Value |
| |
| Manufacturing (continued) |
| Weber-Stephen Products LLC | | |
| Initial Term Loan B | | |
| 4.00% (1 Month LIBOR + 3.25%), due 10/30/27 (c) | $ 718,200 | $ 717,302 |
| | | 4,056,302 |
| Mining, Steel, Iron & Non-Precious Metals 0.9% |
| American Rock Salt Company LLC | | |
| First Lien Initial Loan | | |
| 4.50% (1 Month LIBOR + 3.50%), due 3/21/25 (c) | 2,993,483 | 2,992,235 |
| Gates Global LLC | | |
| Initial Dollar Term Loan B3 | | |
| 3.50% (1 Month LIBOR + 2.75%), due 3/31/27 (c) | 4,967,910 | 4,948,247 |
| Graftech International Ltd. | | |
| Initial Term Loan | | |
| 3.50% (1 Month LIBOR + 3.00%), due 2/12/25 (c) | 2,054,623 | 2,050,343 |
| MRC Global (U.S.), Inc. | | |
| 2018 Refinancing Term Loan | | |
| 3.109% (1 Month LIBOR + 3.00%), due 9/20/24 (c) | 2,319,792 | 2,308,193 |
| U.S. Silica Co. | | |
| Term Loan | | |
| 5.00% (1 Month LIBOR + 4.00%), due 5/1/25 (c) | 1,430,205 | 1,368,911 |
| | | 13,667,929 |
| Oil & Gas 1.1% |
| Buckeye Partners LP 2021 | | |
| 2021 Tranche Term Loan B1 | | |
| 2.359% (1 Month LIBOR + 2.25%), due 11/1/26 (c) | 2,351,295 | 2,340,420 |
| ChampionX Corp. | | |
| Initial Term Loan | | |
| 2.625% (1 Month LIBOR + 2.50%), due 5/9/25 (c)(d) | 472,289 | 469,337 |
| Fleet Midco I Ltd. | | |
| Facility Term Loan B | | |
| 3.109% (1 Month LIBOR + 3.00%), due 10/7/26 (c) | 1,231,250 | 1,212,781 |
| GIP III Stetson I, LP | | |
| Initial Term Loan | | |
| 4.359% (1 Month LIBOR + 4.25%), due 7/18/25 (c)(d) | 2,147,547 | 2,060,303 |
The notes to the financial statements are an integral part of, and should be read in conjunction with, the financial statements.
29
Portfolio of Investments April 30, 2021† (Unaudited) (continued)
| | Principal
Amount | Value |
| Loan Assignments (continued) |
| Oil & Gas (continued) |
| Keane Group Holdings LLC | | |
| Initial Term Loan | | |
| 5.00% (1 Month LIBOR + 4.00%), due 5/25/25 (c) | $ 949,185 | $ 925,455 |
| Lucid Energy Group II Borrower LLC | | |
| First Lien Initial Term Loan | | |
| 4.00% (1 Month LIBOR + 3.00%), due 2/17/25 (c) | 2,522,000 | 2,483,118 |
| Medallion Midland Acquisition LLC | | |
| Initial Term Loan | | |
| 4.25% (1 Month LIBOR + 3.25%), due 10/30/24 (c) | 1,354,500 | 1,339,827 |
| Murphy Oil USA, Inc. | | |
| Tranche Term Loan B | | |
| 2.25% (1 Month LIBOR + 1.75%), due 1/31/28 (c) | 800,000 | 801,000 |
| NorthRiver Midstream Finance LP | | |
| Initial Term Loan B | | |
| 3.452% (3 Month LIBOR + 3.25%), due 10/1/25 (c) | 2,730,000 | 2,685,638 |
| PES Holdings LLC | | |
| Tranche Term Loan C | | |
| (1 Month LIBOR + 4.50%), due 12/31/22 (c)(d)(f)(g) | 1,895,098 | 23,689 |
| Prairie ECI Acquiror LP | | |
| Initial Term Loan B | | |
| 4.863% (1 Month LIBOR + 4.75%), due 3/11/26 (c) | 1,185,525 | 1,151,935 |
| Traverse Midstream Partners LLC | | |
| Advance Term Loan | | |
| 6.50% (1 Month LIBOR + 5.50%), due 9/27/24 (c) | 1,865,657 | 1,863,908 |
| | | 17,357,411 |
| Personal & Nondurable Consumer Products 1.2% |
| Caesars Resort Collection LLC | | |
| Term Loan B1 | | |
| 4.613% (1 Month LIBOR + 4.50%), due 7/21/25 (c) | 1,940,250 | 1,943,646 |
| Foundation Building Materials, Inc. | | |
| First Lien Initial Term Loan | | |
| 3.75% (3 Month LIBOR + 3.25%), due 1/31/28 (c) | 7,250,000 | 7,183,974 |
| Leslie's Poolmart, Inc. | | |
| Initial Term Loan | | |
| 3.25% (3 Month LIBOR + 2.75%), due 3/9/28 (c) | 7,000,000 | 6,958,749 |
| | Principal
Amount | Value |
| |
| Personal & Nondurable Consumer Products (continued) |
| Michaels Stores, Inc. (The) | | |
| Term Loan B | | |
| 5.00% (3 Month LIBOR + 4.25%), due 4/15/28 (c) | $ 2,800,000 | $ 2,783,900 |
| Prestige Brands, Inc. | | |
| Term Loan B4 | | |
| 2.109% (1 Month LIBOR + 2.00%), due 1/26/24 (c) | 487,696 | 488,076 |
| Spectrum Brands, Inc. | | |
| 2021 Term Loan | | |
| 2.50% (3 Month LIBOR + 2.00%), due 3/3/28 (c) | 300,000 | 298,625 |
| | | 19,656,970 |
| Personal & Nondurable Consumer Products (Manufacturing Only) 0.5% |
| American Builders & Contractors Supply Co., Inc. | | |
| Restatement Effective Date Term Loan | | |
| 2.113% (1 Month LIBOR + 2.00%), due 1/15/27 (c) | 2,708,750 | 2,685,663 |
| Hercules Achievement, Inc. | | |
| First Lien Initial Term Loan | | |
| 4.50% (1 Month LIBOR + 3.50%), due 12/16/24 (c) | 4,353,872 | 4,170,191 |
| SRAM LLC, | | |
| 1st Lien Term Loan | | |
| 3.75% (1 Month LIBOR + 2.75%, 3 Month LIBOR + 2.75%), due 3/15/24 (c) | 932,498 | 927,835 |
| | | 7,783,689 |
| Personal Transportation 0.2% |
| Uber Technologies, Inc. | | |
| 2021 Incremental Term Loan | | |
| 3.606% (1 Month LIBOR + 3.50%), due 4/4/25 (c) | 3,698,403 | 3,693,011 |
| Personal, Food & Miscellaneous Services 2.0% |
| 1011778 B.C. Unlimited Liability Co. | | |
| Term Loan B4 | | |
| 1.863% (1 Month LIBOR + 1.75%), due 11/19/26 (c) | 2,090,146 | 2,056,182 |
| Aramark Intermediate HoldCo Corp. (c) | | |
| U.S. Term Loan B3 | | |
| 1.863% (1 Month LIBOR + 1.75%), due 3/11/25 | 1,480,650 | 1,459,762 |
The notes to the financial statements are an integral part of, and should be read in conjunction with, the financial statements.
| 30 | MainStay Floating Rate Fund |
| | Principal
Amount | Value |
| Loan Assignments (continued) |
| Personal, Food & Miscellaneous Services (continued) |
| Aramark Intermediate HoldCo Corp. (c) (continued) | | |
| U.S. Term Loan B4 | | |
| 1.863% (1 Month LIBOR + 1.75%), due 1/15/27 | $ 1,732,500 | $ 1,703,986 |
| U.S. Term Loan B5 | | |
| 2.613% (1 Month LIBOR + 2.50%), due 4/6/28 | 6,400,000 | 6,368,000 |
| Hillman Group, Inc. (The) | | |
| Term Loan B1 | | |
| TBD, due 2/24/28 | 1,939,522 | 1,927,400 |
| IRB Holding Corp. (c) | | |
| 2020 Replacement Term Loan B | | |
| 3.75% (3 Month LIBOR + 2.75%), due 2/5/25 | 2,405,204 | 2,386,831 |
| Fourth Amendment Incremental Term Loan | | |
| 4.25% (3 Month LIBOR + 3.25%), due 12/15/27 | 7,148,750 | 7,123,429 |
| KFC Holding Co. | | |
| 2021 Term Loan B | | |
| 1.865% (1 Month LIBOR + 1.75%), due 3/15/28 (c) | 2,217,086 | 2,215,503 |
| WW International, Inc. | | |
| Initial Term Loan | | |
| 4.00% (1 Month LIBOR + 3.50%), due 4/13/28 (c) | 6,400,000 | 6,402,669 |
| | | 31,643,762 |
| Printing & Publishing 0.8% |
| Getty Images, Inc. | | |
| Initial Dollar Term Loan | | |
| 4.625% (1 Month LIBOR + 4.50%), due 2/19/26 (c) | 992,954 | 983,733 |
| McGraw Hill LLC | | |
| First Lien Term Loan B | | |
| 5.75% (3 Month LIBOR + 4.75%), due 11/1/24 (c) | 1,226,684 | 1,232,818 |
| Severin Acquisition LLC | | |
| First Lien Initial Term Loan | | |
| 3.366% (1 Month LIBOR + 3.25%), due 8/1/25 (c) | 4,431,377 | 4,375,984 |
| Springer Nature Deutschland GmbH | | |
| Initial Term Loan B18 | | |
| 4.00% (1 Month LIBOR + 3.25%), due 8/14/26 (c) | 5,520,552 | 5,501,573 |
| | | 12,094,108 |
| | Principal
Amount | Value |
| |
| Radio and TV Broadcasting 0.1% |
| Nielsen Finance LLC | | |
| Term Loan B4 | | |
| 2.113% (1 Month LIBOR + 2.00%), due 10/4/23 (c) | $ 855,929 | $ 854,003 |
| Retail Store 2.4% |
| Alphabet Holding Co., Inc. | | |
| First Lien Initial Term Loan | | |
| 3.613% (1 Month LIBOR + 3.50%), due 9/26/24 (c) | 7,240,143 | 7,231,998 |
| BJ's Wholesale Club, Inc. | | |
| First Lien Tranche Term Loan B | | |
| 2.111% (1 Month LIBOR + 2.00%), due 2/3/24 (c) | 2,909,968 | 2,906,662 |
| EG Group Ltd. (c) | | |
| USD Facility Term Loan B | | |
| 4.203% (3 Month LIBOR + 4.00%), due 2/7/25 | 1,235,084 | 1,215,323 |
| USD Additional Facility Term Loan | | |
| 4.203% (3 Month LIBOR + 4.00%), due 2/7/25 | 1,445,273 | 1,422,149 |
| Harbor Freight Tools USA, Inc. | | |
| 2020 Initial Term Loan B | | |
| 3.75% (1 Month LIBOR + 3.00%), due 10/19/27 (c) | 7,016,368 | 7,010,790 |
| Petco Health and Wellness Co., Inc. | | |
| First Lien Initial Term Loan | | |
| 4.00% (3 Month LIBOR + 3.25%), due 3/3/28 (c) | 4,000,000 | 3,975,000 |
| PetSmart LLC | | |
| Initial Term Loan | | |
| 4.50% (3 Month LIBOR + 3.75%), due 2/11/28 (c) | 9,100,000 | 9,118,200 |
| White Cap Buyer LLC | | |
| Initial Closing Date Term Loan | | |
| 4.50% (3 Month LIBOR + 4.00%), due 10/19/27 (c) | 4,978,741 | 4,975,629 |
| | | 37,855,751 |
| Services: Business 0.6% |
| Dun & Bradstreet Corp. | | |
| The Initial Term Borrowing | | |
| 3.361% (1 Month LIBOR + 3.25%), due 2/6/26 (c) | 6,039,875 | 6,005,901 |
The notes to the financial statements are an integral part of, and should be read in conjunction with, the financial statements.
31
Portfolio of Investments April 30, 2021† (Unaudited) (continued)
| | Principal
Amount | Value |
| Loan Assignments (continued) |
| Services: Business (continued) |
| Intrado Corp. | | |
| Initial Term Loan B | | |
| 5.00% (3 Month LIBOR + 4.00%), due 10/10/24 (c) | $ 3,839,500 | $ 3,745,647 |
| | | 9,751,548 |
| Telecommunications 4.6% |
| Avaya, Inc. | | |
| Tranche Term Loan B2 | | |
| 4.115% (1 Month LIBOR + 4.00%), due 12/15/27 (c) | 3,947,115 | 3,950,818 |
| Azalea TopCo, Inc. | | |
| First Lien Initial Term Loan | | |
| 3.712% (3 Month LIBOR + 3.50%), due 7/24/26 (c) | 2,462,500 | 2,439,633 |
| Boxer Parent Co., Inc. | | |
| 2021 Replacement Dollar Term Loan | | |
| 3.863%, due 10/2/25 | 3,362,769 | 3,342,516 |
| Cablevision Lightpath LLC | | |
| Initial Term Loan | | |
| 3.75% (1 Month LIBOR + 3.25%), due 11/30/27 (c) | 2,000,000 | 1,991,072 |
| Conduent, Inc. | | |
| Term Loan B | | |
| 2.613% (1 Month LIBOR + 2.50%), due 12/7/23 (c) | 2,877,165 | 2,832,808 |
| Connect Finco SARL | | |
| Amendement No.1 Refinancing Term Loan | | |
| 4.50% (1 Month LIBOR + 3.50%), due 12/11/26 (c) | 2,722,500 | 2,713,426 |
| CSC Holdings LLC | | |
| September 2019 Initial Term Loan | | |
| 2.615% (1 Month LIBOR + 2.50%), due 4/15/27 (c) | 9,641,867 | 9,578,163 |
| Cyxtera DC Holdings, Inc. | | |
| First Lien Initial Term Loan | | |
| 4.00% (3 Month LIBOR + 3.00%), due 5/1/24 (c)(d) | 1,443,750 | 1,405,130 |
| Frontier Communications Corp. | | |
| Term Loan B2 | | |
| (zero coupon), due 10/8/21 (d) | 826,383 | 820,701 |
| Refinancing Term Loan | | |
| 4.50% (1 Month LIBOR + 3.75%), due 5/1/28 (c) | 3,023,617 | 3,002,830 |
| | Principal
Amount | Value |
| |
| Telecommunications (continued) |
| Gogo, Inc. | | |
| Term Loan B | | |
| TBD, due 4/21/28 | $ 5,500,000 | $ 5,479,375 |
| Intelsat Jackson Holdings SA | | |
| Tranche Term Loan B3 | | |
| 8.00% (1 Month LIBOR + 4.75%), due 11/27/23 (c) | 2,702,081 | 2,743,096 |
| Level 3 Financing, Inc. | | |
| Tranche 2027 Term Loan B | | |
| 1.863% (1 Month LIBOR + 1.75%), due 3/1/27 (c) | 2,500,000 | 2,469,270 |
| Lumen Technologies, Inc. | | |
| Term Loan B | | |
| 2.363% (1 Month LIBOR + 2.25%), due 3/15/27 (c) | 8,690,499 | 8,583,075 |
| Redstone HoldCo 2 LP | | |
| Term Loan | | |
| TBD, due 4/14/28 | 4,671,613 | 4,629,279 |
| SBA Senior Finance II LLC | | |
| Initial Term Loan | | |
| 1.87% (1 Month LIBOR + 1.75%), due 4/11/25 (c) | 6,347,976 | 6,294,812 |
| Telesat Canada | | |
| Term Loan B5 | | |
| 2.87% (1 Month LIBOR + 2.75%), due 12/7/26 (c) | 2,034,078 | 1,923,711 |
| Zayo Group Holdings, Inc. | | |
| Initial Dollar Term Loan | | |
| 3.113% (1 Month LIBOR + 3.00%), due 3/9/27 (c) | 7,575,110 | 7,497,328 |
| | | 71,697,043 |
| Utilities 2.5% |
| Astoria Energy LLC | | |
| 2020 Advance Term Loan B | | |
| 4.50% (3 Month LIBOR + 3.50%), due 12/10/27 (c) | 933,423 | 933,714 |
| Brookfield WEC Holdings, Inc. | | |
| First Lien 2021 Initial Term Loan | | |
| 3.25% (1 Month LIBOR + 2.75%), due 8/1/25 (c) | 10,423,875 | 10,305,157 |
| Calpine Corp. 2019 Term Loan | | |
| 2.12% (1 Month LIBOR + 2.00%), due 4/5/26 (c) | 2,063,250 | 2,034,020 |
| Compass Power Generation LLC | | |
| Tranche Term Loan B1 | | |
| 4.50% (1 Month LIBOR + 3.50%), due 12/20/24 (c) | 1,449,472 | 1,440,413 |
The notes to the financial statements are an integral part of, and should be read in conjunction with, the financial statements.
| 32 | MainStay Floating Rate Fund |
| | Principal
Amount | Value |
| Loan Assignments (continued) |
| Utilities (continued) |
| Edgewater Generation LLC Term Loan | | |
| 3.863% (1 Month LIBOR + 3.75%), due 12/13/25 (c) | $ 4,801,252 | $ 4,633,208 |
| ExGen Renewables IV LLC | | |
| Term Loan | | |
| 3.75% (3 Month LIBOR + 2.75%), due 12/15/27 (c) | 2,693,250 | 2,692,690 |
| Granite Generation LLC | | |
| Term Loan | | |
| 4.75% (1 Month LIBOR + 3.75%, 3 Month LIBOR + 3.75%), due 11/9/26 (c) | 4,672,141 | 4,656,289 |
| Hamilton Projects Acquiror LLC | | |
| Term Loan | | |
| 5.75% (3 Month LIBOR + 4.75%), due 6/17/27 (c) | 2,481,250 | 2,476,082 |
| Helix Gen Funding LLC | | |
| Term Loan | | |
| 4.75% (1 Month LIBOR + 3.75%), due 6/3/24 (c) | 1,318,555 | 1,277,350 |
| PG&E Corp. | | |
| Term Loan | | |
| 3.50% (3 Month LIBOR + 3.00%), due 6/23/25 (c) | 3,225,625 | 3,211,513 |
| Southeast PowerGen LLC | | |
| Advance Term Loan B | | |
| 4.50% (1 Month LIBOR + 3.50%), due 12/2/21 (c) | 806,048 | 786,568 |
| Vistra Operations Co., LLC | | |
| First Lien 2018 Incremental Term Loan 1.863%-1.865% | | |
| (1 Month LIBOR + 1.75%), due 12/31/25 (c) | 4,972,836 | 4,929,945 |
| | | 39,376,949 |
Total Loan Assignments
(Cost $1,397,308,818) | | 1,385,997,380 |
Total Long-Term Bonds
(Cost $1,468,406,930) | | 1,459,749,311 |
| |
| | Shares | Value |
| Affiliated Investment Company 0.9% |
| Fixed Income Fund 0.9% | | |
| MainStay MacKay High Yield Corporate Bond Fund Class I | 2,399,065 | $ 13,553,998 |
Total Affiliated Investment Company
(Cost $13,605,526) | | 13,553,998 |
| Common Stocks 0.1% |
| Communications Equipment 0.0% ‡ |
| Energy Future Holdings Corp. (d)(e)(h)(i) | 175,418 | — |
| Millennium Corporate Trust (d)(e)(h)(i) | 4,973 | — |
| Millennium Lender Trust (d)(e)(h)(i) | 5,298 | — |
| | | — |
| Metals & Mining 0.0% ‡ |
| AFGlobal Corp. (d)(e)(h)(i) | 60,753 | 412,513 |
| Mining, Steel, Iron & Non-Precious Metals 0.1% |
| Covia Holdings Corp. (d)(e)(h)(i) | 83,168 | 717,324 |
| Oil, Gas & Consumable Fuels 0.0% ‡ |
| Ascent Resources (d)(e)(h)(i) | 244,062 | 165,962 |
| Summit Midstream Partners LP (i) | 15,430 | 364,302 |
| | | 530,264 |
| Pharmaceuticals 0.0% ‡ |
| Akorn, Inc. (d)(e)(h)(i) | 12,701 | 196,866 |
Total Common Stocks
(Cost $3,933,281) | | 1,856,967 |
| Exchange-Traded Funds 3.2% |
| Invesco Senior Loan ETF | 1,355,000 | 30,013,250 |
| SPDR Blackstone Senior Loan ETF | 437,000 | 20,062,670 |
Total Exchange-Traded Funds
(Cost $50,097,018) | | 50,075,920 |
| |
The notes to the financial statements are an integral part of, and should be read in conjunction with, the financial statements.
33
Portfolio of Investments April 30, 2021† (Unaudited) (continued)
| | Number of
Rights | Value |
| Rights 0.0% ‡ |
| Independent Power and Renewable Electricity Producers 0.0% ‡ |
| Vistra Energy Corp. | | |
| Expires 12/31/46 (d)(e)(h)(i) | 107,130 | $ 112,486 |
Total Rights
(Cost $87,847) | | 112,486 |
| |
| | Number of
Warrants | |
| Warrants 0.0% ‡ |
| Health Care Equipment & Supplies 0.0% ‡ |
| Carestream Health, Inc. | | |
| Expires 12/21/31 (d)(e)(h)(i) | 43 | — |
| Health Care Providers & Services 0.0% ‡ |
| THAIHOT Investment Co. Ltd. | | |
| Expires 10/13/27 (d)(e)(h)(i) | 26 | — |
| Oil, Gas & Consumable Fuels 0.0% ‡ |
| Ascent Resources (d)(e)(h)(i) | | |
1st Lien Warrants
Expires 3/30/23 | 23,368 | 234 |
2nd Lien Tranche A
Expires 3/30/23 | 62,000 | 620 |
2nd Lien Tranche B
Expires 3/30/30 | 30,044 | 300 |
| | | 1,154 |
Total Warrants
(Cost $12,795) | | 1,154 |
| |
| | Principal
Amount | |
| Short-Term Investments 12.6% |
| U.S. Treasury Debt 12.6% |
| U.S. Treasury Bills (j) | | |
| 0.005%, due 6/22/21 | $ 27,075,000 | 27,074,624 |
| 0.006%, due 5/25/21 | 6,996,000 | 6,995,979 |
| 0.007%, due 6/10/21 | 20,362,000 | 20,361,785 |
| 0.008%, due 5/11/21 | 8,504,000 | 8,503,989 |
| 0.009%, due 5/20/21 | 8,674,000 | 8,673,959 |
| 0.01%, due 5/4/21 | 98,087,000 | 98,086,993 |
| 0.01%, due 6/8/21 | 6,181,000 | 6,180,938 |
| | Principal
Amount | | Value |
| |
| U.S. Treasury Debt (continued) |
| U.S. Treasury Bills (j) (continued) | | | |
| 0.013%, due 5/6/21 | $ 5,334,000 | | $ 5,333,998 |
| 0.015%, due 6/15/21 | 16,933,000 | | 16,932,924 |
Total Short-Term Investments
(Cost $198,145,164) | | | 198,145,189 |
Total Investments
(Cost $1,734,288,561) | 109.9% | | 1,723,495,025 |
| Other Assets, Less Liabilities | (9.9) | | (155,051,590) |
| Net Assets | 100.0% | | $ 1,568,443,435 |
| † | Percentages indicated are based on Fund net assets. |
| ‡ | Less than one-tenth of a percent. |
| (a) | May be sold to institutional investors only under Rule 144A or securities offered pursuant to Section 4(a)(2) of the Securities Act of 1933, as amended. |
| (b) | Delayed delivery security. |
| (c) | Floating rate—Rate shown was the rate in effect as of April 30, 2021. |
| (d) | Illiquid security—As of April 30, 2021, the total market value deemed illiquid under procedures approved by the Board of Trustees was $50,246,024, which represented 3.2% of the Fund’s net assets. |
| (e) | Security in which significant unobservable inputs (Level 3) were used in determining fair value. |
| (f) | Issue in default. |
| (g) | Issue in non-accrual status. |
| (h) | Fair valued security—Represents fair value as measured in good faith under procedures approved by the Board of Trustees. As of April 30, 2021, the total market value was $1,606,305, which represented 0.1% of the Fund’s net assets. |
| (i) | Non-income producing security. |
| (j) | Interest rate shown represents yield to maturity. |
| Abbreviation(s): |
| CLO—Collateralized Loan Obligation |
| ETF—Exchange-Traded Fund |
| LIBOR—London Interbank Offered Rate |
| REIT—Real Estate Investment Trust |
| SPDR—Standard & Poor’s Depositary Receipt |
| TBD—To Be Determined |
| USD—United States Dollar |
The notes to the financial statements are an integral part of, and should be read in conjunction with, the financial statements.
| 34 | MainStay Floating Rate Fund |
The following is a summary of the fair valuations according to the inputs used as of April 30, 2021, for valuing the Fund’s assets:
| Description | Quoted
Prices in
Active
Markets for
Identical
Assets
(Level 1) | | Significant
Other
Observable
Inputs
(Level 2) | | Significant
Unobservable
Inputs
(Level 3) | | Total |
| Asset Valuation Inputs | | | | | | | |
| Investments in Securities (a) | | | | | | | |
| Long-Term Bonds | | | | | | | |
| Asset-Backed Securities | $ — | | $ 10,000,000 | | $ — | | $ 10,000,000 |
| Corporate Bonds | — | | 63,751,931 | | — | | 63,751,931 |
| Loan Assignments | — | | 1,382,901,838 | | 3,095,542 | | 1,385,997,380 |
| Total Long-Term Bonds | — | | 1,456,653,769 | | 3,095,542 | | 1,459,749,311 |
| Affiliated Investment Company | | | | | | | |
| Fixed Income Fund | 13,553,998 | | — | | — | | 13,553,998 |
| Common Stocks | 364,302 | | — | | 1,492,665 | | 1,856,967 |
| Exchange-Traded Funds | 50,075,920 | | — | | — | | 50,075,920 |
| Rights | — | | — | | 112,486 | | 112,486 |
| Warrants | — | | — | | 1,154 | | 1,154 |
| Short-Term Investments | | | | | | | |
| U.S. Treasury Debt | — | | 198,145,189 | | — | | 198,145,189 |
| Total Investments in Securities | $ 63,994,220 | | $ 1,654,798,958 | | $ 4,701,847 | | $ 1,723,495,025 |
| (a) | For a complete listing of investments and their industries, see the Portfolio of Investments. |
The following is a reconciliation of investments in which significant unobservable inputs (Level 3) were used in determining value:
Investments in
Securities | Balance
as of
October 31,
2020 | | Accrued
Discounts
(Premiums) | | Realized
Gain
(Loss) | | Change in
Unrealized
Appreciation
(Depreciation) | | Purchases | | Sales | | Transfers
in to
Level 3 | | Transfers
out of
Level 3 | | Balance
as of
April 30,
2021 | | Change in
Unrealized
Appreciation
(Depreciation)
from
Investments
Still Held as
of April 30,
2021 |
| Long-Term Bonds | | | | | | | | | | | | | | | | | | | |
| Loan Assignments | $15,007,590 | | $5,219 | | $ 8,787 | | $203,239 | | $ — | | $(3,348,184) | | $— | | $(8,781,109) | | $3,095,542 | | $ 72,694 |
| Common Stocks | 1,056,068 | | — | | (784,919) | | 560,397 | | 661,119 | | — | | — | | — | | 1,492,665 | | (224,523) |
| Rights | 116,772 | | — | | — | | (4,286) | | — | | — | | — | | — | | 112,486 | | (4,286) |
| Warrants | 1,174 | | — | | (127,585) | | 127,565 | | — | | — | | — | | — | | 1,154 | | — |
| Total | $16,181,604 | | $5,219 | | $(903,717) | | $886,915 | | $661,119 | | $(3,348,184) | | $— | | $(8,781,109) | | $4,701,847 | | $(156,115) |
As of April 30, 2021, Loan Assignments with a market value of $8,781,109 transferred from Level 3 to Level 2 as the the fair value obtained by an independent pricing service, utilized significant other observable inputs. As of October 31, 2020, the fair value obtained for these Loan Assignments, as determined by an independent pricing service, utilized significant unobservable inputs.
The notes to the financial statements are an integral part of, and should be read in conjunction with, the financial statements.
35
Statement of Assets and Liabilities as of April 30, 2021 (Unaudited)
| Assets |
Investment in unaffiliated securities, at value
(identified cost $1,720,683,035) | $1,709,941,027 |
Investment in affiliated investment companies, at value
(identified cost $13,605,526) | 13,553,998 |
| Cash | 9,925,474 |
| Receivables: | |
| Fund shares sold | 12,370,140 |
| Interest | 3,343,682 |
| Investment securities sold | 433,086 |
| Other assets | 141,955 |
| Total assets | 1,749,709,362 |
| Liabilities |
| Unrealized depreciation on unfunded commitments (See Note 5) | 491 |
| Payables: | |
| Investment securities purchased | 177,458,097 |
| Fund shares redeemed | 2,027,140 |
| Manager (See Note 3) | 740,492 |
| Transfer agent (See Note 3) | 338,781 |
| NYLIFE Distributors (See Note 3) | 116,164 |
| Professional fees | 72,634 |
| Shareholder communication | 67,721 |
| Custodian | 19,286 |
| Accrued expenses | 21,480 |
| Distributions payable | 403,641 |
| Total liabilities | 181,265,927 |
| Net assets | $1,568,443,435 |
| Composition of Net Assets |
| Shares of beneficial interest outstanding (par value of $.001 per share) unlimited number of shares authorized | $ 171,884 |
| Additional paid-in-capital | 1,669,378,560 |
| | 1,669,550,444 |
| Total distributable earnings (loss) | (101,107,009) |
| Net assets | $1,568,443,435 |
| Class A | |
| Net assets applicable to outstanding shares | $338,435,238 |
| Shares of beneficial interest outstanding | 37,094,110 |
| Net asset value per share outstanding | $ 9.12 |
| Maximum sales charge (3.00% of offering price) | 0.28 |
| Maximum offering price per share outstanding | $ 9.40 |
| Investor Class | |
| Net assets applicable to outstanding shares | $ 20,008,532 |
| Shares of beneficial interest outstanding | 2,192,925 |
| Net asset value per share outstanding | $ 9.12 |
| Maximum sales charge (2.50% of offering price) | 0.23 |
| Maximum offering price per share outstanding | $ 9.35 |
| Class B | |
| Net assets applicable to outstanding shares | $ 1,078,518 |
| Shares of beneficial interest outstanding | 118,108 |
| Net asset value and offering price per share outstanding | $ 9.13 |
| Class C | |
| Net assets applicable to outstanding shares | $ 51,891,311 |
| Shares of beneficial interest outstanding | 5,685,497 |
| Net asset value and offering price per share outstanding | $ 9.13 |
| Class I | |
| Net assets applicable to outstanding shares | $894,516,000 |
| Shares of beneficial interest outstanding | 98,032,501 |
| Net asset value and offering price per share outstanding | $ 9.12 |
| Class R3 | |
| Net assets applicable to outstanding shares | $ 540,102 |
| Shares of beneficial interest outstanding | 59,174 |
| Net asset value and offering price per share outstanding | $ 9.13 |
| Class R6 | |
| Net assets applicable to outstanding shares | $261,947,491 |
| Shares of beneficial interest outstanding | 28,699,014 |
| Net asset value and offering price per share outstanding | $ 9.13 |
| SIMPLE Class | |
| Net assets applicable to outstanding shares | $ 26,243 |
| Shares of beneficial interest outstanding | 2,876 |
| Net asset value and offering price per share outstanding | $ 9.12 |
The notes to the financial statements are an integral part of, and should be read in conjunction with, the financial statements.
| 36 | MainStay Floating Rate Fund |
Statement of Operations for the six months ended April 30, 2021 (Unaudited)
| Investment Income (Loss) |
| Income | |
| Interest | $18,312,782 |
| Dividend distributions from affiliated investment companies | 197,912 |
| Dividend distributions from unaffiliated investment companies | 193,323 |
| Other | 31,816 |
| Total income | 18,735,833 |
| Expenses | |
| Manager (See Note 3) | 3,381,665 |
| Transfer agent (See Note 3) | 981,188 |
| Distribution/Service—Class A (See Note 3) | 375,942 |
| Distribution/Service—Investor Class (See Note 3) | 25,269 |
| Distribution/Service—Class B (See Note 3) | 6,463 |
| Distribution/Service—Class C (See Note 3) | 271,717 |
| Distribution/Service—Class R3 (See Note 3) | 1,315 |
| Distribution/Service—SIMPLE Class (See Note 3) | 65 |
| Registration | 87,131 |
| Professional fees | 79,235 |
| Shareholder communication | 54,099 |
| Custodian | 24,596 |
| Trustees | 10,321 |
| Insurance | 5,155 |
| Shareholder service (See Note 3) | 263 |
| Miscellaneous | 36,234 |
| Total expenses | 5,340,658 |
| Net investment income (loss) | 13,395,175 |
| Realized and Unrealized Gain (Loss) |
| Net realized gain (loss) on investments | (1,518,093) |
| Net change in unrealized appreciation (depreciation) on: | |
| Unaffiliated investments | 32,599,031 |
| Affiliated investment companies | 24,791 |
| Unfunded commitments | (3,370) |
| Net change in unrealized appreciation (depreciation) | 32,620,452 |
| Net realized and unrealized gain (loss) | 31,102,359 |
| Net increase (decrease) in net assets resulting from operations | $44,497,534 |
The notes to the financial statements are an integral part of, and should be read in conjunction with, the financial statements.
37
Statements of Changes in Net Assets
for the six months ended April 30, 2021 (Unaudited) and the year ended October 31, 2020
| | 2021 | 2020 |
| Increase (Decrease) in Net Assets |
| Operations: | | |
| Net investment income (loss) | $ 13,395,175 | $ 38,218,810 |
| Net realized gain (loss) | (1,518,093) | (34,451,729) |
| Net change in unrealized appreciation (depreciation) | 32,620,452 | (2,721,653) |
| Net increase (decrease) in net assets resulting from operations | 44,497,534 | 1,045,428 |
| Distributions to shareholders: | | |
| Class A | (3,798,674) | (10,522,933) |
| Investor Class | (251,690) | (762,499) |
| Class B | (11,350) | (66,199) |
| Class C | (470,315) | (1,995,961) |
| Class I | (8,233,098) | (20,109,843) |
| Class R3 | (5,745) | (14,407) |
| Class R6 | (2,307,205) | (4,747,393) |
| SIMPLE Class | (288) | (114) |
| Total distributions to shareholders | (15,078,365) | (38,219,349) |
| Capital share transactions: | | |
| Net proceeds from sales of shares | 789,917,110 | 421,730,401 |
| Net asset value of shares issued to shareholder in reinvestment of distributions | 13,438,714 | 33,963,067 |
| Cost of shares redeemed | (187,273,018) | (734,801,144) |
| Increase (decrease) in net assets derived from capital share transactions | 616,082,806 | (279,107,676) |
| Net increase (decrease) in net assets | 645,501,975 | (316,281,597) |
| Net Assets |
| Beginning of period | 922,941,460 | 1,239,223,057 |
| End of period | $1,568,443,435 | $ 922,941,460 |
The notes to the financial statements are an integral part of, and should be read in conjunction with, the financial statements.
| 38 | MainStay Floating Rate Fund |
Financial Highlights selected per share data and ratios
| | Six months ended
April 30,
2021* | | Year Ended October 31, |
| Class A | 2020 | | 2019 | | 2018 | | 2017 | | 2016 |
| Net asset value at beginning of period | $ 8.84 | | $ 9.02 | | $ 9.28 | | $ 9.35 | | $ 9.29 | | $ 9.15 |
| Net investment income (loss) | 0.10(a) | | 0.31(a) | | 0.43(a) | | 0.40 | | 0.35 | | 0.32 |
| Net realized and unrealized gain (loss) on investments | 0.29 | | (0.18) | | (0.26) | | (0.07) | | 0.06 | | 0.14 |
| Total from investment operations | 0.39 | | 0.13 | | 0.17 | | 0.33 | | 0.41 | | 0.46 |
| Less distributions: | | | | | | | | | | | |
| From net investment income | (0.11) | | (0.31) | | (0.43) | | (0.40) | | (0.35) | | (0.32) |
| Net asset value at end of period | $ 9.12 | | $ 8.84 | | $ 9.02 | | $ 9.28 | | $ 9.35 | | $ 9.29 |
| Total investment return (b) | 4.47% | | 1.55% | | 1.94% | | 3.54% | | 4.50% | | 5.23% |
| Ratios (to average net assets)/Supplemental Data: | | | | | | | | | | | |
| Net investment income (loss) | 2.24%†† | | 3.56% | | 4.76% | | 4.23% | | 3.76% | | 3.59% (c) |
| Net expenses (d) | 1.10%†† | | 1.14% | | 1.09% | | 1.05% | | 1.01% | | 1.07% (e) |
| Portfolio turnover rate | 15% | | 22% | | 19% | | 32% | | 58% | | 36% |
| Net assets at end of period (in 000’s) | $ 338,435 | | $ 279,188 | | $ 338,392 | | $ 383,590 | | $ 371,186 | | $ 318,281 |
| * | Unaudited. |
| †† | Annualized. |
| (a) | Per share data based on average shares outstanding during the period. |
| (b) | Total investment return is calculated exclusive of sales charges and assumes the reinvestment of dividends and distributions. For periods of less than one year, total return is not annualized. |
| (c) | Without the custody fee reimbursement, net investment income (loss) would have been 3.58%. |
| (d) | In addition to the fees and expenses which the Fund bears directly, it also indirectly bears a pro-rata share of the fees and expenses of the underlying funds in which it invests. Such indirect expenses are not included in the above expense ratios. |
| (e) | Without the custody fee reimbursement, net expenses would have been 1.08%. |
| | Six months ended
April 30,
2021* | | Year Ended October 31, |
| Investor Class | 2020 | | 2019 | | 2018 | | 2017 | | 2016 |
| Net asset value at beginning of period | $ 8.84 | | $ 9.02 | | $ 9.28 | | $ 9.35 | | $ 9.29 | | $ 9.15 |
| Net investment income (loss) | 0.10(a) | | 0.31(a) | | 0.43(a) | | 0.40 | | 0.35 | | 0.33 |
| Net realized and unrealized gain (loss) on investments | 0.29 | | (0.18) | | (0.26) | | (0.07) | | 0.06 | | 0.14 |
| Total from investment operations | 0.39 | | 0.13 | | 0.17 | | 0.33 | | 0.41 | | 0.47 |
| Less distributions: | | | | | | | | | | | |
| From net investment income | (0.11) | | (0.31) | | (0.43) | | (0.40) | | (0.35) | | (0.33) |
| Net asset value at end of period | $ 9.12 | | $ 8.84 | | $ 9.02 | | $ 9.28 | | $ 9.35 | | $ 9.29 |
| Total investment return (b) | 4.44% | | 1.55% | | 1.95% | | 3.54% | | 4.44% | | 5.24% |
| Ratios (to average net assets)/Supplemental Data: | | | | | | | | | | | |
| Net investment income (loss) | 2.20%†† | | 3.55% | | 4.77% | | 4.24% | | 3.66% | | 3.60% |
| Net expenses (c) | 1.15%†† | | 1.13% | | 1.08% | | 1.05% | | 1.06% | | 1.06% (d) |
| Portfolio turnover rate | 15% | | 22% | | 19% | | 32% | | 58% | | 36% |
| Net assets at end of period (in 000’s) | $ 20,009 | | $ 20,569 | | $ 23,496 | | $ 21,731 | | $ 21,238 | | $ 29,269 |
| * | Unaudited. |
| †† | Annualized. |
| (a) | Per share data based on average shares outstanding during the period. |
| (b) | Total investment return is calculated exclusive of sales charges and assumes the reinvestment of dividends and distributions. For periods of less than one year, total return is not annualized. |
| (c) | In addition to the fees and expenses which the Fund bears directly, it also indirectly bears a pro-rata share of the fees and expenses of the underlying funds in which it invests. Such indirect expenses are not included in the above expense ratios. |
| (d) | Without the custody fee reimbursement, net expenses would have been 1.07%. |
The notes to the financial statements are an integral part of, and should be read in conjunction with, the financial statements.
39
Financial Highlights selected per share data and ratios
| | Six months ended
April 30,
2021* | | Year Ended October 31, |
| Class B | 2020 | | 2019 | | 2018 | | 2017 | | 2016 |
| Net asset value at beginning of period | $ 8.85 | | $ 9.03 | | $ 9.28 | | $ 9.36 | | $ 9.29 | | $ 9.16 |
| Net investment income (loss) | 0.07(a) | | 0.25(a) | | 0.37(a) | | 0.33 | | 0.28 | | 0.25 |
| Net realized and unrealized gain (loss) on investments | 0.29 | | (0.18) | | (0.25) | | (0.08) | | 0.07 | | 0.14 |
| Total from investment operations | 0.36 | | 0.07 | | 0.12 | | 0.25 | | 0.35 | | 0.39 |
| Less distributions: | | | | | | | | | | | |
| From net investment income | (0.08) | | (0.25) | | (0.37) | | (0.33) | | (0.28) | | (0.26) |
| Net asset value at end of period | $ 9.13 | | $ 8.85 | | $ 9.03 | | $ 9.28 | | $ 9.36 | | $ 9.29 |
| Total investment return (b) | 4.05% | | 0.79% | | 1.19% | | 2.66% (c) | | 3.78% | | 4.34% |
| Ratios (to average net assets)/Supplemental Data: | | | | | | | | | | | |
| Net investment income (loss) | 1.47%†† | | 2.87% | | 4.04% | | 3.47% | | 2.92% | | 2.85% (d) |
| Net expenses���(e) | 1.91%†† | | 1.88% | | 1.83% | | 1.80% | | 1.81% | | 1.81% (f) |
| Portfolio turnover rate | 15% | | 22% | | 19% | | 32% | | 58% | | 36% |
| Net assets at end of period (in 000’s) | $ 1,079 | | $ 1,584 | | $ 3,119 | | $ 5,259 | | $ 6,536 | | $ 7,621 |
| * | Unaudited. |
| †† | Annualized. |
| (a) | Per share data based on average shares outstanding during the period. |
| (b) | Total investment return is calculated exclusive of sales charges and assumes the reinvestment of dividends and distributions. For periods of less than one year, total return is not annualized. |
| (c) | Total investment return may reflect adjustments to conform to generally accepted accounting principles. |
| (d) | Without the custody fee reimbursement, net investment income (loss) would have been 2.84%. |
| (e) | In addition to the fees and expenses which the Fund bears directly, it also indirectly bears a pro-rata share of the fees and expenses of the underlying funds in which it invests. Such indirect expenses are not included in the above expense ratios. |
| (f) | Without the custody fee reimbursement, net expenses would have been 1.82%. |
| | Six months ended
April 30,
2021* | | Year Ended October 31, |
| Class C | 2020 | | 2019 | | 2018 | | 2017 | | 2016 |
| Net asset value at beginning of period | $ 8.84 | | $ 9.03 | | $ 9.28 | | $ 9.36 | | $ 9.29 | | $ 9.16 |
| Net investment income (loss) | 0.07(a) | | 0.25(a) | | 0.37(a) | | 0.33 | | 0.28 | | 0.26 |
| Net realized and unrealized gain (loss) on investments | 0.30 | | (0.19) | | (0.25) | | (0.08) | | 0.07 | | 0.13 |
| Total from investment operations | 0.37 | | 0.06 | | 0.12 | | 0.25 | | 0.35 | | 0.39 |
| Less distributions: | | | | | | | | | | | |
| From net investment income | (0.08) | | (0.25) | | (0.37) | | (0.33) | | (0.28) | | (0.26) |
| Net asset value at end of period | $ 9.13 | | $ 8.84 | | $ 9.03 | | $ 9.28 | | $ 9.36 | | $ 9.29 |
| Total investment return (b) | 4.17% | | 0.68% | | 1.30% | | 2.66% (c) | | 3.66% | | 4.34% |
| Ratios (to average net assets)/Supplemental Data: | | | | | | | | | | | |
| Net investment income (loss) | 1.43%†† | | 2.85% | | 4.03% | | 3.48% | | 2.94% | | 2.85% (d) |
| Net expenses (e) | 1.90%†† | | 1.88% | | 1.83% | | 1.80% | | 1.81% | | 1.81% (f) |
| Portfolio turnover rate | 15% | | 22% | | 19% | | 32% | | 58% | | 36% |
| Net assets at end of period (in 000’s) | $ 51,891 | | $ 55,153 | | $ 86,012 | | $ 142,134 | | $ 154,399 | | $ 159,480 |
| * | Unaudited. |
| †† | Annualized. |
| (a) | Per share data based on average shares outstanding during the period. |
| (b) | Total investment return is calculated exclusive of sales charges and assumes the reinvestment of dividends and distributions. For periods of less than one year, total return is not annualized. |
| (c) | Total investment return may reflect adjustments to conform to generally accepted accounting principles. |
| (d) | Without the custody fee reimbursement, net investment income (loss) would have been 2.84%. |
| (e) | In addition to the fees and expenses which the Fund bears directly, it also indirectly bears a pro-rata share of the fees and expenses of the underlying funds in which it invests. Such indirect expenses are not included in the above expense ratios. |
| (f) | Without the custody fee reimbursement, net expenses would have been 1.82%. |
The notes to the financial statements are an integral part of, and should be read in conjunction with, the financial statements.
| 40 | MainStay Floating Rate Fund |
Financial Highlights selected per share data and ratios
| | Six months ended
April 30,
2021* | | Year Ended October 31, |
| Class I | 2020 | | 2019 | | 2018 | | 2017 | | 2016 |
| Net asset value at beginning of period | $ 8.84 | | $ 9.03 | | $ 9.28 | | $ 9.35 | | $ 9.29 | | $ 9.16 |
| Net investment income (loss) | 0.11(a) | | 0.33(a) | | 0.46(a) | | 0.42 | | 0.38 | | 0.35 |
| Net realized and unrealized gain (loss) on investments | 0.30 | | (0.19) | | (0.25) | | (0.07) | | 0.06 | | 0.13 |
| Total from investment operations | 0.41 | | 0.14 | | 0.21 | | 0.35 | | 0.44 | | 0.48 |
| Less distributions: | | | | | | | | | | | |
| From net investment income | (0.13) | | (0.33) | | (0.46) | | (0.42) | | (0.38) | | (0.35) |
| Net asset value at end of period | $ 9.12 | | $ 8.84 | | $ 9.03 | | $ 9.28 | | $ 9.35 | | $ 9.29 |
| Total investment return (b) | 4.60% | | 1.69% | | 2.31% | | 3.80% | | 4.76% | | 5.38% |
| Ratios (to average net assets)/Supplemental Data: | | | | | | | | | | | |
| Net investment income (loss) | 2.43%†† | | 3.85% | | 5.02% | | 4.49% | | 4.01% | | 3.84% (c) |
| Net expenses (d) | 0.84%†† | | 0.89% | | 0.84% | | 0.80% | | 0.76% | | 0.82% (e) |
| Portfolio turnover rate | 15% | | 22% | | 19% | | 32% | | 58% | | 36% |
| Net assets at end of period (in 000’s) | $ 894,516 | | $ 445,468 | | $ 716,692 | | $ 1,048,033 | | $ 943,093 | | $ 805,208 |
| * | Unaudited. |
| †† | Annualized. |
| (a) | Per share data based on average shares outstanding during the period. |
| (b) | Total investment return is calculated exclusive of sales charges and assumes the reinvestment of dividends and distributions. Class I shares are not subject to sales charges. For periods of less than one year, total return is not annualized. |
| (c) | Without the custody fee reimbursement, net investment income (loss) would have been 3.83%. |
| (d) | In addition to the fees and expenses which the Fund bears directly, it also indirectly bears a pro-rata share of the fees and expenses of the underlying funds in which it invests. Such indirect expenses are not included in the above expense ratios. |
| (e) | Without the custody fee reimbursement, net expenses would have been 0.83%. |
| | Six months ended
April 30,
2021* | | Year Ended October 31, | | February 29, 2016^ through
October 31,
2016 |
| Class R3 | 2020 | | 2019 | | 2018 | | 2017 | |
| Net asset value at beginning of period | $ 8.84 | | $ 9.03 | | $ 9.28 | | $ 9.35 | | $ 9.29 | | $ 8.82 |
| Net investment income (loss) | 0.09(a) | | 0.28(a) | | 0.40(a) | | 0.36 | | 0.32 | | 0.20 |
| Net realized and unrealized gain (loss) on investments | 0.30 | | (0.19) | | (0.25) | | (0.07) | | 0.06 | | 0.47 |
| Total from investment operations | 0.39 | | 0.09 | | 0.15 | | 0.29 | | 0.38 | | 0.67 |
| Less distributions: | | | | | | | | | | | |
| From net investment income | (0.10) | | (0.28) | | (0.40) | | (0.36) | | (0.32) | | (0.20) |
| Net asset value at end of period | $ 9.13 | | $ 8.84 | | $ 9.03 | | $ 9.28 | | $ 9.35 | | $ 9.29 |
| Total investment return (b) | 4.40% | | 1.08% | | 1.69% | | 3.18% | | 4.14% | | 7.64% |
| Ratios (to average net assets)/Supplemental Data: | | | | | | | | | | | |
| Net investment income (loss) | 1.89%†† | | 3.14% | | 4.37% | | 3.97% | | 3.52% | | 3.25%†† |
| Net expenses (c) | 1.46%†† | | 1.49% | | 1.43% | | 1.40% | | 1.35% | | 1.42%†† |
| Portfolio turnover rate | 15% | | 22% | | 19% | | 32% | | 58% | | 36% |
| Net assets at end of period (in 000’s) | $ 540 | | $ 523 | | $ 436 | | $ 379 | | $ 62 | | $ 27 |
| * | Unaudited. |
| ^ | Inception date. |
| †† | Annualized. |
| (a) | Per share data based on average shares outstanding during the period. |
| (b) | Total investment return is calculated exclusive of sales charges and assumes the reinvestment of dividends and distributions. Class R3 shares are not subject to sales charges. For periods of less than one year, total return is not annualized. |
| (c) | In addition to the fees and expenses which the Fund bears directly, it also indirectly bears a pro-rata share of the fees and expenses of the underlying funds in which it invests. Such indirect expenses are not included in the above expense ratios. |
The notes to the financial statements are an integral part of, and should be read in conjunction with, the financial statements.
41
Financial Highlights selected per share data and ratios
| | Six months ended
April 30,
2021* | | Year Ended October 31, | | February 28, 2019^ through
October 31,
2019 |
| Class R6 | 2020 | |
| Net asset value at beginning of period | $ 8.84 | | $ 9.03 | | $ 9.18 |
| Net investment income (loss) (a) | 0.12 | | 0.35 | | 0.32 |
| Net realized and unrealized gain (loss) on investments | 0.30 | | (0.19) | | (0.15) |
| Total from investment operations | 0.42 | | 0.16 | | 0.17 |
| Less distributions: | | | | | |
| From net investment income | (0.13) | | (0.35) | | (0.32) |
| Net asset value at end of period | $ 9.13 | | $ 8.84 | | $ 9.03 |
| Total investment return (b) | 4.81% | | 1.92% | | 1.84% |
| Ratios (to average net assets)/Supplemental Data: | | | | | |
| Net investment income (loss) | 2.71%†† | | 3.99% | | 5.18%†† |
| Net expenses (c) | 0.65%†† | | 0.67% | | 0.64%†† |
| Portfolio turnover rate | 15% | | 22% | | 19% |
| Net assets at end of period (in 000’s) | $ 261,947 | | $ 120,432 | | $ 71,077 |
| * | Unaudited. |
| ^ | Inception date. |
| †† | Annualized. |
| (a) | Per share data based on average shares outstanding during the period. |
| (b) | Total investment return is calculated exclusive of sales charges and assumes the reinvestment of dividends and distributions. Class R6 shares are not subject to sales charges. For periods of less than one year, total return is not annualized. |
| (c) | In addition to the fees and expenses which the Fund bears directly, it also indirectly bears a pro-rata share of the fees and expenses of the underlying funds in which it invests. Such indirect expenses are not included in the above expense ratios. |
| | Six months ended
April 30,
2021* | | August 31, 2020^ through
October 31, |
| SIMPLE Class | 2020 |
| Net asset value at beginning of period | $ 8.84 | | $ 8.83** |
| Net investment income (loss) (a) | 0.09 | | 0.04 |
| Net realized and unrealized gain (loss) on investments | 0.29 | | 0.01 |
| Total from investment operations | 0.38 | | 0.05 |
| Less distributions: | | | |
| From net investment income | (0.10) | | (0.04) |
| Net asset value at end of period | $ 9.12 | | $ 8.84 |
| Total investment return (b) | 4.43% | | 0.57% |
| Ratios (to average net assets)/Supplemental Data: | | | |
| Net investment income (loss)†† | 1.95% | | 2.72% |
| Net expenses†† (c) | 1.40% | | 1.37% |
| Portfolio turnover rate | 15% | | 22% |
| Net assets at end of period (in 000’s) | $ 26 | | $ 25 |
| * | Unaudited. |
| ^ | Inception date. |
| ** | Based on the net asset value of Investor Class as of August 31, 2020. |
| †† | Annualized. |
| (a) | Per share data based on average shares outstanding during the period. |
| (b) | Total investment return is calculated exclusive of sales charges and assumes the reinvestment of dividends and distributions. SIMPLE Class shares are not subject to sales charges. For periods of less than one year, total return is not annualized. |
| (c) | In addition to the fees and expenses which the Fund bears directly, it also indirectly bears a pro-rata share of the fees and expenses of the underlying funds in which it invests. Such indirect expenses are not included in the above expense ratios. |
The notes to the financial statements are an integral part of, and should be read in conjunction with, the financial statements.
| 42 | MainStay Floating Rate Fund |
Notes to Financial Statements (Unaudited)
Note 1-Organization and Business
MainStay Funds Trust (the “Trust”) was organized as a Delaware statutory trust on April 28, 2009. The Trust is registered under the Investment Company Act of 1940, as amended (the “1940 Act”), as an open-end management investment company, and is comprised of thirty-two funds (collectively referred to as the “Funds”). These financial statements and notes relate to the MainStay Floating Rate Fund (the "Fund"), a “diversified” fund, as that term is defined in the 1940 Act, as interpreted or modified by regulatory authorities having jurisdiction, from time to time.
The following table lists the Fund's share classes that have been registered and commenced operations:
| Class | Commenced Operations |
| Class A | May 3, 2004 |
| Investor Class | February 28, 2008 |
| Class B | May 3, 2004 |
| Class C | May 3, 2004 |
| Class I | May 3, 2004 |
| Class R3 | February 29, 2016 |
| Class R6 | February 28, 2019 |
| SIMPLE Class | August 31, 2020 |
Class B shares of the MainStay Group of Funds are closed to all new purchases as well as additional investments by existing Class B shareholders. Existing Class B shareholders may continue to reinvest dividends and capital gains distributions, as well as exchange their Class B shares for Class B shares of other funds in the MainStay Group of Funds as permitted by the current exchange privileges. Class B shareholders continue to be subject to any applicable contingent deferred sales charge ("CDSC") at the time of redemption. All other features of the Class B shares, including but not limited to the fees and expenses applicable to Class B shares, remain unchanged. Unless redeemed, Class B shareholders will remain in Class B shares of their respective fund until the Class B shares are converted to Class A or Investor Class shares pursuant to the applicable conversion schedule.
Class A and Investor Class shares are offered at net asset value (“NAV”) per share plus an initial sales charge. No initial sales charge applies to investments of $250,000 or more (and certain other qualified purchases) in Class A and Investor Class shares. However, a CDSC of 1.00% may be imposed on certain redemptions of Class A and Investor Class shares made within 18 months of the date of purchase on shares that were purchased without an initial sales charge. However, a CDSC of 1.00% may be imposed on certain redemptions made within 18 months of the date of purchase on shares that were purchased without an initial sales charge. For purchases of Class A and Investor Class shares made from August 1, 2017 through April 14, 2019, a CDSC of 1.00% may be imposed on certain redemptions (for investments of $500,000 which paid no initial sales charge) of such shares within 18 months of the date of purchase on shares that were purchased without an initial sales charge. Class C shares are offered at NAV without an initial sales charge, although a 1.00% CDSC may be imposed on redemptions of such shares
made within one year of the date of purchase of Class C shares. Investments in Class C shares are subject to a purchase maximum of $250,000. When Class B shares were offered, they were offered at NAV without an initial sales charge, although a CDSC that declines depending on the number of years a shareholder held its Class B shares may be imposed on certain redemptions of such shares made within six years of the date of purchase of such shares. Class I, Class R3, Class R6 and SIMPLE Class shares are offered at NAV without a sales charge. Depending upon eligibility, Class B shares convert to Class A or Investor Class shares at the end of the calendar quarter four years after the date they were purchased. In addition, depending upon eligibility, Class C shares convert to either Class A or Investor Class shares at the end of the calendar quarter ten years after the date they were purchased. Additionally, Investor Class shares may convert automatically to Class A shares. SIMPLE Class shares convert to Class A shares, or Investor Class shares if you are not eligible to hold Class A shares, at the end of the calendar quarter, ten years after the date they were purchased. Share class conversions are based on the relevant NAVs of the two classes at the time of the conversion, and no sales load or other charge is imposed. Under certain circumstances and as may be permitted by the Trust’s multiple class plan pursuant to Rule 18f-3 under the 1940 Act, specified share classes of the Fund may be converted to one or more other share classes of the Fund as disclosed in the capital share transactions within these Notes. The classes of shares have the same voting (except for issues that relate solely to one class), dividend, liquidation and other rights, and the same terms and conditions, except that under distribution plans pursuant to Rule 12b-1 under the 1940 Act, Class B and Class C shares are subject to higher distribution and/or service fees than Class A, Investor Class, Class R3 and SIMPLE Class shares. Class I and Class R6 shares are not subject to a distribution and/or service fee. Class R3 shares are subject to a shareholder service fee, which is in addition to fees paid under the distribution plan for Class R3 shares.
The Fund's investment objective is to seek high current income.
Note 2–Significant Accounting Policies
The Fund is an investment company and accordingly follows the investment company accounting and reporting guidance of the Financial Accounting Standards Board (“FASB”) Accounting Standard Codification Topic 946 Financial Services—Investment Companies. The Fund prepares its financial statements in accordance with generally accepted accounting principles (“GAAP”) in the United States of America and follows the significant accounting policies described below.
(A) Securities Valuation. Investments are usually valued as of the close of regular trading on the New York Stock Exchange (the "Exchange") (usually 4:00 p.m. Eastern time) on each day the Fund is open for business ("valuation date").
The Board of Trustees of the Trust (the "Board") adopted procedures establishing methodologies for the valuation of the Fund's securities and other assets and delegated the responsibility for valuation determinations under those procedures to the Valuation Committee of the Trust (the
Notes to Financial Statements (Unaudited) (continued)
“Valuation Committee”). The procedures state that, subject to the oversight of the Board and unless otherwise noted, the responsibility for the day-to-day valuation of portfolio assets (including fair value measurements for the Fund's assets and liabilities) rests with New York Life Investment Management LLC (“New York Life Investments” or the "Manager"), aided to whatever extent necessary by the Subadvisor (as defined in Note 3(A)). To assess the appropriateness of security valuations, the Manager, the Subadvisor or the Fund's third-party service provider, who is subject to oversight by the Manager, regularly compares prior day prices, prices on comparable securities and the sale prices to the prior and current day prices and challenges prices with changes exceeding certain tolerance levels with third-party pricing services or broker sources.
The Board authorized the Valuation Committee to appoint a Valuation Subcommittee (the “Subcommittee”) to establish the prices of securities for which market quotations are not readily available or the prices of which are not otherwise readily determinable under the procedures. The Subcommittee meets (in person, via electronic mail or via teleconference) on an as-needed basis. The Valuation Committee meets to ensure that actions taken by the Subcommittee were appropriate.
For those securities valued through either a standardized fair valuation methodology or a fair valuation measurement, the Subcommittee deals with such valuation and the Valuation Committee reviews and affirms, if appropriate, the reasonableness of the valuation based on such methodologies and measurements on a regular basis after considering information that is reasonably available and deemed relevant by the Valuation Committee. Any action taken by the Subcommittee with respect to the valuation of a portfolio security or other asset is submitted for review and ratification (if appropriate) to the Valuation Committee and the Board at the next regularly scheduled meeting.
"Fair value" is defined as the price the Fund would reasonably expect to receive upon selling an asset or liability in an orderly transaction to an independent buyer in the principal or most advantageous market for the asset or liability. Fair value measurements are determined within a framework that establishes a three-tier hierarchy that maximizes the use of observable market data and minimizes the use of unobservable inputs to establish a classification of fair value measurements for disclosure purposes. "Inputs" refer broadly to the assumptions that market participants would use in pricing the asset or liability, including assumptions about risk, such as the risk inherent in a particular valuation technique used to measure fair value using a pricing model and/or the risk inherent in the inputs for the valuation technique. Inputs may be observable or unobservable. Observable inputs reflect the assumptions market participants would use in pricing the asset or liability based on market data obtained from sources independent of the Fund. Unobservable inputs reflect the Fund’s own assumptions about the assumptions market participants would use in pricing the asset or liability based on the information available. The inputs or methodology used for valuing assets or liabilities may not be an indication of the risks associated with investing in those assets or liabilities. The three-tier hierarchy of inputs is summarized below.
| • | Level 1—quoted prices in active markets for an identical asset or liability |
| • | Level 2—other significant observable inputs (including quoted prices for a similar asset or liability in active markets, interest rates and yield curves, prepayment speeds, credit risk, etc.) |
| • | Level 3—significant unobservable inputs (including the Fund's own assumptions about the assumptions that market participants would use in measuring fair value of an asset or liability) |
The level of an asset or liability within the fair value hierarchy is based on the lowest level of an input, both individually and in the aggregate, that is significant to the fair value measurement. The aggregate value by input level of the Fund’s assets and liabilities as of April 30, 2021, is included at the end of the Portfolio of Investments.
The Fund may use third-party vendor evaluations, whose prices may be derived from one or more of the following standard inputs, among others:
| • Benchmark yields | • Reported trades |
| • Broker/dealer quotes | • Issuer spreads |
| • Two-sided markets | • Benchmark securities |
| • Bids/offers | • Reference data (corporate actions or material event notices) |
| • Industry and economic events | • Comparable bonds |
| • Monthly payment information | |
An asset or liability for which market values cannot be measured using the methodologies described above is valued by methods deemed reasonable in good faith by the Valuation Committee, following the procedures established by the Board, to represent fair value. Under these procedures, the Fund generally uses a market-based approach which may use related or comparable assets or liabilities, recent transactions, market multiples, book values and other relevant information. The Fund may also use an income-based valuation approach in which the anticipated future cash flows of the asset or liability are discounted to calculate fair value. Discounts may also be applied due to the nature and/or duration of any restrictions on the disposition of the asset or liability. Fair value represents a good faith approximation of the value of a security. Fair value determinations involve the consideration of a number of subjective factors, an analysis of applicable facts and circumstances and the exercise of judgment. As a result, it is possible that the fair value for a security determined in good faith in accordance with the Fund's valuation procedures may differ from valuations for the same security determined by other funds using their own valuation procedures. Although the Fund's valuation procedures are designed to value a security at the price the Fund may reasonably expect to receive upon the security's sale in an orderly transaction, there can be no assurance that any fair value determination thereunder would, in fact, approximate the amount that the Fund would actually realize upon the sale of the security or the price at which the security would trade if a reliable market price were readily available. During the six-month period ended April 30, 2021, there were no material changes to the fair value methodologies.
| 44 | MainStay Floating Rate Fund |
Securities which may be valued in this manner include, but are not limited to: (i) a security for which trading has been halted or suspended; (ii) a debt security that has recently gone into default and for which there is not a current market quotation; (iii) a security of an issuer that has entered into a restructuring; (iv) a security that has been delisted from a national exchange; (v) a security for which the market price is not readily available from a third-party pricing source or, if so provided, does not, in the opinion of the Manager or the Subadvisor, reflect the security's market value; (vi) a security subject to trading collars for which no or limited trading takes place; and (vii) a security whose principal market has been temporarily closed at a time when, under normal conditions, it would be open. Securities valued in this manner are generally categorized as Level 3 in the hierarchy. Securities that were fair valued in such a manner as of April 30, 2021, are shown in the Portfolio of Investments.
Equity securities, rights and warrants are valued at the last quoted sales prices as of the close of regular trading on the relevant exchange on each valuation date. Securities that are not traded on the valuation date are valued at the mean of the last quoted bid and ask prices. Prices are normally taken from the principal market in which each security trades. These securities are generally categorized as Level 1 in the hierarchy.
Exchange-traded funds (“ETFs”) are valued at the last quoted sales prices as of the close of regular trading on the relevant exchange on each valuation date. Securities that are not traded on the valuation date are valued at the mean of the last quoted bid and ask prices. Prices are normally taken from the principal market in which each security trades. These securities are generally categorized as Level 1 in the hierarchy.
Investments in mutual funds, including money market funds, are valued at their respective NAVs at the close of business each day on the valuation date. These securities are generally categorized as Level 1 in the hierarchy.
Debt securities (other than convertible and municipal bonds) are valued at the evaluated bid prices (evaluated mean prices in the case of convertible and municipal bonds) supplied by a pricing agent or broker selected by the Manager, in consultation with the Subadvisor. The evaluations are market-based measurements processed through a pricing application and represents the pricing agent’s good faith determination as to what a holder may receive in an orderly transaction under market conditions. The rules based logic utilizes valuation techniques that reflect participants’ assumptions and vary by asset class and per methodology, maximizing the use of relevant observable data including quoted prices for similar assets, benchmark yield curves and market corroborated inputs. The evaluated bid or mean prices are deemed by the Manager, in consultation with the Subadvisor, to be representative of market values at the regular close of trading of the Exchange on each valuation date. Debt securities purchased on a delayed delivery basis are marked to market daily until settlement at the forward settlement date. Debt securities, including corporate bonds, U.S. government and federal agency bonds, municipal bonds, foreign bonds, convertible bonds, asset-backed securities and mortgage-backed securities are generally categorized as Level 2 in the hierarchy.
Loan assignments, participations and commitments are valued at the average of bid quotations obtained from the engaged independent pricing service and are generally categorized as Level 2 in the hierarchy. Certain loan assignments, participations and commitments may be valued by utilizing significant unobservable inputs obtained from the pricing service and are generally categorized as Level 3 in the hierarchy.
Temporary cash investments acquired in excess of 60 days to maturity at the time of purchase are valued using the latest bid prices or using valuations based on a matrix system (which considers such factors as security prices, yields, maturities and ratings), both as furnished by independent pricing services. Temporary cash investments that mature in 60 days or less at the time of purchase ("Short-Term Investments") are valued using the amortized cost method of valuation, unless the use of such method would be inappropriate. The amortized cost method involves valuing a security at its cost on the date of purchase and thereafter assuming a constant amortization to maturity of the difference between such cost and the value on maturity date. Amortized cost approximates the current fair value of a security. Securities valued using the amortized cost method are not valued using quoted prices in an active market and are generally categorized as Level 2 in the hierarchy.
The information above is not intended to reflect an exhaustive list of the methodologies that may be used to value portfolio investments. The valuation procedures permit the use of a variety of valuation methodologies in connection with valuing portfolio investments. The methodology used for a specific type of investment may vary based on the market data available or other considerations. The methodologies summarized above may not represent the specific means by which portfolio investments are valued on any particular business day.
A portfolio investment may be classified as an illiquid investment under the Trust's written liquidity risk management program and related procedures (“Liquidity Program”). Illiquidity of an investment might prevent the sale of such investment at a time when the Manager or the Subadvisor might wish to sell, and these investments could have the effect of decreasing the overall level of the Fund's liquidity. Further, the lack of an established secondary market may make it more difficult to value illiquid investments, requiring the Fund to rely on judgments that may be somewhat subjective in measuring value, which could vary materially from the amount that the Fund could realize upon disposition. Difficulty in selling illiquid investments may result in a loss or may be costly to the Fund. An illiquid investment is any investment that the Manager or Subadvisor reasonably expects cannot be sold or disposed of in current market conditions in seven calendar days or less without the sale or disposition significantly changing the market value of the investment. The liquidity classification of each investment will be made using information obtained after reasonable inquiry and taking into account, among other things, relevant market, trading and investment-specific considerations in accordance with the Liquidity Program. Illiquid investments are often valued in accordance with methods deemed by the Board in good faith to be reasonable and appropriate to accurately reflect their fair value. The liquidity of the Fund's investments was determined as of April 30, 2021, and can change at any
Notes to Financial Statements (Unaudited) (continued)
time. Illiquid investments as of April 30, 2021, are shown in the Portfolio of Investments.
(B) Income Taxes. The Fund's policy is to comply with the requirements of the Internal Revenue Code of 1986, as amended (the “Internal Revenue Code”), applicable to regulated investment companies and to distribute all of its taxable income to the shareholders of the Fund within the allowable time limits.
The Manager evaluates the Fund’s tax positions to determine if the tax positions taken meet the minimum recognition threshold in connection with accounting for uncertainties in income tax positions taken or expected to be taken for the purposes of measuring and recognizing tax liabilities in the financial statements. Recognition of tax benefits of an uncertain tax position is permitted only to the extent the position is “more likely than not” to be sustained assuming examination by taxing authorities. The Manager analyzed the Fund's tax positions taken on federal, state and local income tax returns for all open tax years (for up to three tax years) and has concluded that no provisions for federal, state and local income tax are required in the Fund's financial statements. The Fund's federal, state and local income tax and federal excise tax returns for tax years for which the applicable statutes of limitations have not expired are subject to examination by the Internal Revenue Service and state and local departments of revenue.
(C) Dividends and Distributions to Shareholders. Dividends and distributions are recorded on the ex-dividend date. The Fund intends to declare dividends from net investment income, if any, daily and intends to pay them at least monthly and pays distributions from net realized capital and currency gains, if any, at least annually. Unless a shareholder elects otherwise, all dividends and distributions are reinvested at NAV in the same class of shares of the Fund. Dividends and distributions to shareholders are determined in accordance with federal income tax regulations and may differ from determinations using GAAP.
(D) Security Transactions and Investment Income. The Fund records security transactions on the trade date. Realized gains and losses on security transactions are determined using the identified cost method. Dividend income is recognized on the ex-dividend date, net of any foreign tax withheld at the source. Premiums and discount on purchased securities other than bank loans, are accreted and amortized, respectively on the effective interest rate method. Premiums and discounts on purchased bank loan securities are accreted and amortized, respectively, on the straight line method. Distributions received from real estate investment trusts may be classified as dividends, capital gains and/or return of capital.
Investment income and realized and unrealized gains and losses on investments of the Fund are allocated pro rata to the separate classes of shares based upon their relative net assets on the date the income is earned or realized and unrealized gains and losses are incurred.
The Fund may place a debt security on non-accrual status and reduce related interest income by ceasing current accruals and writing off all or a portion of any interest receivables when the collection of all or a portion of
such interest has become doubtful. A debt security is removed from non-accrual status when the issuer resumes interest payments or when collectability of interest is reasonably assured.
(E) Expenses. Expenses of the Trust are allocated to the individual Funds in proportion to the net assets of the respective Funds when the expenses are incurred, except where direct allocations of expenses can be made. Expenses (other than transfer agent expenses and fees incurred under the shareholder services plans and/or the distribution plans further discussed in Note 3(B)) are allocated to separate classes of shares pro rata based upon their relative net assets on the date the expenses are incurred. The expenses borne by the Fund, including those of related parties to the Fund, are shown in the Statement of Operations.
Additionally, the Fund may invest in mutual funds, which are subject to management fees and other fees that may cause the costs of investing in mutual funds to be greater than the costs of owning the underlying securities directly. These indirect expenses of mutual funds are not included in the amounts shown as expenses in the Statement of Operations or in the expense ratios included in the Financial Highlights.
(F) Use of Estimates. In preparing financial statements in conformity with GAAP, the Manager makes estimates and assumptions that affect the reported amounts and disclosures in the financial statements. Actual results could differ from those estimates and assumptions.
(G) Loan Assignments, Participations and Commitments. The Fund may invest in loan assignments and participations ("loans"). Commitments are agreements to make money available to a borrower in a specified amount, at a specified rate and within a specified time. The Fund records an investment when the borrower withdraws money on a commitment or when a funded loan is purchased (trade date) and records interest as earned. These loans pay interest at rates that are periodically reset by reference to a base lending rate plus a spread. These base lending rates are generally the prime rate offered by a designated U.S. bank or the London Interbank Offered Rate ("LIBOR").
The loans in which the Fund may invest are generally readily marketable, but may be subject to some restrictions on resale. For example, the Fund may be contractually obligated to receive approval from the agent bank and/or borrower prior to the sale of these investments. If the Fund purchases an assignment from a lender, the Fund will generally have direct contractual rights against the borrower in favor of the lender. If the Fund purchases a participation interest either from a lender or a participant, the Fund typically will have established a direct contractual relationship with the seller of the participation interest, but not with the borrower. Consequently, the Fund is subject to the credit risk of the lender or participant who sold the participation interest to the Fund, in addition to the usual credit risk of the borrower. In the event that the borrower, selling participant or intermediate participants become insolvent or enter into bankruptcy, the Fund may incur certain costs and delays in realizing payment, or may suffer a loss of principal and/or interest.
Unfunded commitments represent the remaining obligation of the Fund to the borrower. At any point in time, up to the maturity date of the issue, the
| 46 | MainStay Floating Rate Fund |
borrower may demand the unfunded portion. Unfunded amounts, if any, are marked to market and any unrealized gains or losses are recorded in the Statement of Assets and Liabilities. As of April 30, 2021, the Fund held unfunded commitments. (See Note 5).
(H) Rights and Warrants. Rights are certificates that permit the holder to purchase a certain number of shares, or a fractional share, of a new stock from the issuer at a specific price. Warrants are instruments that entitle the holder to buy an equity security at a specific price for a specific period of time. These investments can provide a greater potential for profit or loss than an equivalent investment in the underlying security. Prices of these investments do not necessarily move in tandem with the prices of the underlying securities.
There is risk involved in the purchase of rights and warrants in that these investments are speculative investments. The Fund could also lose the entire value of its investment in warrants if such warrants are not exercised by the date of its expiration. The Fund is exposed to risk until the sale or exercise of each right or warrant is completed. Rights and Warrants as of April 30, 2021 are shown in the Portfolio of Investments.
(I) Delayed Delivery Transactions. The Fund may purchase or sell securities on a delayed delivery basis. These transactions involve a commitment by the Fund to purchase or sell securities for a predetermined price or yield, with payment and delivery taking place beyond the customary settlement period. When delayed delivery purchases are outstanding, the Fund will designate liquid assets in an amount sufficient to meet the purchase price. When purchasing a security on a delayed delivery basis, the Fund assumes the rights and risks of ownership of the security, including the risk of price and yield fluctuations, and takes such fluctuations into account when determining its NAV. The Fund may dispose of or renegotiate a delayed delivery transaction after it is entered into, and may sell delayed delivery securities before they are delivered, which may result in a realized gain or loss. When the Fund has sold a security it owns on a delayed delivery basis, the Fund does not participate in future gains and losses with respect to the security. As of April 30, 2021, delayed delivery transactions are shown in the Portfolio of Investments.
(J) Loan Risk. The Fund may invest in loans which are usually rated below investment grade and are generally considered speculative because they present a greater risk of loss, including default, than higher rated debt securities. These investments pay investors a higher interest rate than investment grade debt securities because of the increased risk of loss. Although certain loans are collateralized, there is no guarantee that the value of the collateral will be sufficient to repay the loan. In a recession or serious credit event, the value of these investments could decline significantly. As a result of these and other events, the Fund's NAVs could go down and you could lose money.
In addition, loans generally are subject to the extended settlement periods that may be longer than seven days. As a result, the Fund may be adversely affected by selling other investments at an unfavorable time and/or under unfavorable conditions or engaging in borrowing
transactions, such as borrowing against its credit facility, to raise cash to meet redemption obligations or pursue other investment opportunities.
In certain circumstances, loans may not be deemed to be securities. As a result, the Fund may not have the protection of anti-fraud provisions of the federal securities laws. In such cases, the Fund generally must rely on the contractual provisions in the loan agreement and common-law fraud protections under applicable state law.
(K) Foreign Securities Risk. The Fund may invest in foreign securities, which carry certain risks that are in addition to the usual risks inherent in domestic securities. These risks include those resulting from currency fluctuations, future adverse political or economic developments and possible imposition of currency exchange blockages or other foreign governmental laws or restrictions. These risks are likely to be greater in emerging markets than in developed markets. The ability of issuers of debt securities held by the Fund to meet their obligations may be affected by, among other things, economic or political developments in a specific country, industry or region.
(L) Debt Securities Risk. The Fund's investments may include securities such as variable rate notes, floaters and mortgage-related and asset-backed securities. If expectations about changes in interest rates or assessments of an issuer's credit worthiness or market conditions are incorrect, investments in these types of securities could lose money for the Fund.
(M) LIBOR Replacement Risk. The Fund may invest in certain debt securities, derivatives or other financial instruments that utilize the London Interbank Offered Rate ("LIBOR"), as a “benchmark” or “reference rate” for various interest rate calculations. The United Kingdom Financial Conduct Authority, which regulates LIBOR, announced that after 2021 it will cease its active encouragement of banks to provide the quotations needed to sustain LIBOR. However, it is possible that certain LIBOR tenors may continue beyond 2021 and the most widely used LIBOR tenors may continue until mid-2023. As a result, it is anticipated that LIBOR will be discontinued or will no longer be sufficiently robust to be representative of its underlying market around that time. Although financial regulators and industry working groups have suggested alternative reference rates, such as European Interbank Offer Rate (“EURIBOR”), Sterling Overnight Interbank Average Rate (“SONIA”) and Secured Overnight Financing Rate (“SOFR”), there are challenges to converting certain contracts and transactions to a new benchmark and neither the full effects of the transition process nor its ultimate outcome is known. New York Life Investments is currently working to assess exposure and will modify contracts as necessary.
The elimination of LIBOR or changes to other reference rates or any other changes or reforms to the determination or supervision of reference rates could have an adverse impact on the market for, or value of, any securities or payments linked to those reference rates, which may adversely affect the Fund's performance and/or net asset value. Uncertainty and risk also remain regarding the willingness and ability of issuers and lenders to include revised provisions in new and existing
Notes to Financial Statements (Unaudited) (continued)
contracts or instruments. Consequently, the transition away from LIBOR to other reference rates may lead to increased volatility and illiquidity in markets that are tied to LIBOR, fluctuations in values of LIBOR-related investments or investments in issuers that utilize LIBOR, increased difficulty in borrowing or refinancing and diminished effectiveness of hedging strategies, adversely affecting the Fund's performance. Furthermore, the risks associated with the expected discontinuation of LIBOR and transition may be exacerbated if the work necessary to effect an orderly transition to an alternative reference rate is not completed in a timely manner. Because the usefulness of LIBOR as a benchmark could deteriorate during the transition period, these effects could occur prior to the end of 2021 with respect to certain LIBOR tenors or mid-2023 for the remaining LIBOR tenors.
(N) Indemnifications. Under the Trust’s organizational documents, its officers and trustees are indemnified against certain liabilities that may arise out of performance of their duties to the Trust. Additionally, in the normal course of business, the Fund enters into contracts with third-party service providers that contain a variety of representations and warranties and that may provide general indemnifications. The Fund's maximum exposure under these arrangements is unknown, as this would involve future claims that may be made against the Fund that have not yet occurred. The Manager believes that the risk of loss in connection with these potential indemnification obligations is remote. However, there can be no assurance that material liabilities related to such obligations will not arise in the future, which could adversely impact the Fund.
Note 3–Fees and Related Party Transactions
(A) Manager and Subadvisor. New York Life Investments, a registered investment adviser and an indirect, wholly-owned subsidiary of New York Life Insurance Company ("New York Life"), serves as the Fund's Manager pursuant to an Amended and Restated Management Agreement ("Management Agreement"). The Manager provides offices, conducts clerical, recordkeeping and bookkeeping services and keeps most of the financial and accounting records required to be maintained by the Fund. Except for the portion of salaries and expenses that are the responsibility of the Fund, the Manager pays the salaries and expenses of all personnel affiliated with the Fund and certain operational expenses of the Fund. The Fund reimburses New York Life Investments in an amount equal to the portion of the compensation of the Chief Compliance Officer attributable to the Fund. NYL Investors LLC ("NYL Investors" or ''Subadvisor''), a registered investment adviser and a direct, wholly-owned subsidiary of New York Life, serves as Subadvisor to the Fund and is responsible for the day-to-day portfolio management of the Fund. Pursuant to the terms of a Subadvisory Agreement ("Subadvisory Agreement") between New York Life Investments and NYL Investors, New York Life Investments pays for the services of the Subadvisor.
Pursuant to the Management Agreement, the Fund pays the Manager a monthly fee for the services performed and the facilities furnished at an annual rate of the Fund’s average daily net assets as follows: 0.60% up to $1 billion; 0.575% from $1 billion to $3 billion; and 0.565% in excess
of $3 billion. During the six-month period ended April 30, 2021, the effective management fee rate was 0.60%.
Effective February 28, 2021, New York Life Investments has contractually agreed to waive fees and/or reimburse expenses so that Total Annual Fund Operating Expenses (excluding taxes, interest, litigation, extraordinary expenses, brokerage and other transaction expenses relating to the purchase or sale of portfolio investments, and acquired (underlying) fund fees and expenses) for Class A shares do not exceed 1.05% of the Fund’s average daily net assets. New York Life Investments will apply an equivalent waiver or reimbursement, in an equal number of basis points, to the other share classes of the Fund, except for Class R6 shares. New York Life Investments has contractually agreed to waive fees and/or reimburse expenses so that Class R6 fees and expenses do not exceed those of Class I. This agreement will remain in effect until February 28, 2022, and shall renew automatically for one-year terms unless New York Life Investments provides written notice of termination prior to the start of the next term or upon approval of the Board.
During the six-month period ended April 30, 2021, New York Life Investments earned fees from the Fund in the amount of $3,381,665 and paid the Subadvisor in the amount of $1,690,833.
JPMorgan Chase Bank, N.A. ("JPMorgan") provides sub-administration and sub-accounting services to the Fund pursuant to an agreement with New York Life Investments. These services include calculating the daily NAVs of the Fund, maintaining the general ledger and sub-ledger accounts for the calculation of the Fund's NAVs, and assisting New York Life Investments in conducting various aspects of the Fund's administrative operations. For providing these services to the Fund, JPMorgan is compensated by New York Life Investments.
Prior to November 23, 2020, these services were provided by State Street Bank and Trust Company ("State Street").
Pursuant to an agreement between the Trust and New York Life Investments, New York Life Investments is responsible for providing or procuring certain regulatory reporting services for the Fund. The Fund will reimburse New York Life Investments for the actual costs incurred by New York Life Investments in connection with providing or procuring these services for the Fund.
(B) Distribution and Service Fees. The Trust, on behalf of the Fund, has entered into a distribution agreement with NYLIFE Distributors LLC (the “Distributor”), an affiliate of New York Life Investments. The Fund has adopted distribution plans (the “Plans”) in accordance with the provisions of Rule 12b-1 under the 1940 Act.
Pursuant to the Class A and Investor Class Plans, the Distributor receives a monthly distribution fee from the Class A and Investor Class shares at an annual rate of 0.25% of the average daily net assets of the Class A and Investor Class shares for distribution and/or service activities as designated by the Distributor. Pursuant to the Class B and Class C Plans, the Distributor receives a monthly distribution fee at an annual rate of 0.75% of the average daily net assets of the Class B and Class C shares,
| 48 | MainStay Floating Rate Fund |
along with a service fee at an annual rate of 0.25% of the average daily net assets of the Class B and Class C shares, for a total 12b-1 fee of 1.00%. Pursuant to the Class R3 and SIMPLE Class shares Plans, Class R3 and SIMPLE Class shares pay the Distributor a monthly fee at an annual rate of 0.25% of the average daily net assets of the Class R3 and SIMPLE Class shares, along with a service fee at an annual rate of 0.25% of the average daily net assets of the Class R3 and SIMPLE Class shares, for a total 12b-1 fee of 0.50%. Class I, Class R1 and Class R6 shares are not subject to a distribution and/or service fee.
The Plans provide that the distribution and service fees are payable to the Distributor regardless of the amounts actually expended by the Distributor for distribution of the Fund's shares and service activities.
In accordance with the Shareholder Services Plans for the Class R3 shares, the Manager has agreed to provide, through its affiliates or independent third parties, various shareholder and administrative support services to shareholders of the Class R3 shares. For its services, the Manager, its affiliates or independent third-party service providers are entitled to a shareholder service fee accrued daily and paid monthly at an annual rate of 0.10% of the average daily net assets of the Class R3 shares. This is in addition to any fees paid under the Class R3 Plan.
During the six-month period ended April 30, 2021, shareholder service fees incurred by the Fund were as follows:
(C) Sales Charges. The Fund was advised by the Distributor that the amount of initial sales charges retained on sales of Class A and Investor Class shares during the six-month period ended April 30, 2021, were $19,362 and $938, respectively.
The Fund was also advised that the Distributor retained CDSCs on redemptions of Class A, Investor Class and Class C shares during the six-month period ended April 30, 2021, of $7,086, $11 and $1,637, respectively.
(D) Transfer, Dividend Disbursing and Shareholder Servicing Agent. NYLIM Service Company LLC, an affiliate of New York Life Investments, is the Fund's transfer, dividend disbursing and shareholder
servicing agent pursuant to an agreement between NYLIM Service Company LLC and the Trust. NYLIM Service Company LLC has entered into an agreement with DST Asset Manager Solutions, Inc. ("DST"), pursuant to which DST performs certain transfer agent services on behalf of NYLIM Service Company LLC. New York Life Investments has contractually agreed to limit the transfer agency expenses charged to the Fund’s share classes to a maximum of 0.35% of that share class’s average daily net assets on an annual basis after deducting any applicable Fund or class-level expense reimbursement or small account fees. This agreement will remain in effect until February 28, 2022, and shall renew automatically for one-year terms unless New York Life Investments provides written notice of termination prior to the start of the next term or upon approval of the Board. During the six-month period ended April 30, 2021, transfer agent expenses incurred by the Fund and any reimbursements, pursuant to the aforementioned Transfer Agency expense limitation agreement, were as follows:
| Class | Expense | Waived |
| Class A | $300,847 | $— |
| Investor Class | 25,276 | — |
| Class B | 1,612 | — |
| Class C | 67,959 | — |
| Class I | 581,816 | — |
| Class R3 | 533 | — |
| Class R6 | 3,113 | — |
| SIMPLE Class | 32 | — |
(E) Small Account Fee. Shareholders with small accounts adversely impact the cost of providing transfer agency services. In an effort to reduce total transfer agency expenses, the Fund has implemented a small account fee on certain types of accounts. As described in the Fund's prospectus, certain shareholders with an account balance of less than $1,000 ($5,000 for Class A share accounts) are charged an annual per account fee of $20 (assessed semi-annually), the proceeds from which offset transfer agent fees as reflected in the Statement of Operations. This small account fee will not apply to certain types of accounts as described further in the Fund’s prospectus.
(F) Investments in Affiliates (in 000’s). During the six-month period ended April 30, 2021, purchases and sales transactions, income earned from investments and shares held of investment companies managed by New York Life Investments or its affiliates were as follows:
| Affiliated Investment Companies | Value,
Beginning
of Period | Purchases
at Cost | Proceeds
from
Sales | Net
Realized
Gain/(Loss)
on Sales | Change in
Unrealized
Appreciation/
(Depreciation) | Value,
End of
Period | Dividend
Income | Other
Distributions | Shares
End of
Period |
| MainStay MacKay High Yield Corporate Bond Fund Class I | $ 1,529 | $ 12,000 | $ — | $ — | $ 25 | $ 13,554 | $ 198 | $ — | 2,399 |
Notes to Financial Statements (Unaudited) (continued)
(G) Capital. As of April 30, 2021, New York Life and its affiliates beneficially held shares of the Fund with the values and percentages of net assets as follows:
| Class R6 | $27,125 | 0.0%‡ |
| SIMPLE Class | 26,207 | 99.9 |
| ‡ | Less than one-tenth of a percent. |
Note 4-Federal Income Tax
As of April 30, 2021, the cost and unrealized appreciation (depreciation) of the Fund’s investment portfolio, including applicable derivative contracts and other financial instruments, as determined on a federal income tax basis, were as follows:
| | Federal Tax
Cost | Gross
Unrealized
Appreciation | Gross
Unrealized
(Depreciation) | Net
Unrealized
Appreciation/
(Depreciation) |
| Investments | $1,734,302,550 | $5,136,740 | $(15,944,265) | $(10,807,525) |
As of October 31, 2020, for federal income tax purposes, capital loss carryforwards of $87,007,585 were available as shown in the table below, to the extent provided by the regulations to offset future realized gains of the Fund through the years indicated. To the extent that these capital loss carryforwards are used to offset future capital gains, it is probable that the capital gains so offset will not be distributed to shareholders. No capital gain distributions shall be made until any capital loss carryforwards have been fully utilized.
Capital Loss
Available Through | Short-Term
Capital Loss
Amounts (000’s) | Long-Term
Capital Loss
Amounts (000’s) |
| Unlimited | $12,001 | $75,006 |
During the year ended October 31, 2020, the tax character of distributions paid as reflected in the Statements of Changes in Net Assets was as follows:
| | 2020 |
| Distributions paid from: | |
| Ordinary Income | $38,219,349 |
Note 5–Commitments and Contingencies
As of April 30, 2021, the Fund had unfunded commitments pursuant to the following loan agreements:
| Borrower | Unfunded
Commitments | Unrealized
Appreciation/
(Depreciation) |
FCG Acquisitions, Inc.
First Lien Delayed Draw Term Loan TBD,
due 3/31/28 | $ 635,600 | $ (4,400) |
Hillman Group, Inc. (The)
Delayed Term Loan B1 TBD,
due 2/24/28 | 391,350 | (2,462) |
LBM Acquisition LLC
First Lien Initial Delayed Draw Term Loan TBD,
due 12/17/27 | 651,506 | (403) |
National Mentor Holdings, Inc.
First Lien Delayed Draw Term Loan TBD,
due 3/2/28 | 345,652 | (1,064) |
Peraton Corp
Delayed Draw Term Loan TBD,
due 2/1/28 | 6,590,251 | 23,377 |
Redstone HoldCo 2 LP
Delayed Draw Term Loan TBD,
due 4/14/28 | 1,809,341 | (19,046) |
Spa Holdings 3 Oy
USD Facility Term Loan B
(3 Month LIBOR + 4.50%, 12 Month LIBOR + 4.50%),
due 2/4/28 | 3,196,000 | 12,000 |
Tricorbraun Holdings, Inc.
First Lien Delayed Draw Term Loan 3.75%,
due 3/3/28 | 829,113 | (8,493) |
| Total | $14,448,813 | $ (491) |
Commitments are available until maturity date.
Note 6–Custodian
JPMorgan is the custodian of cash and securities held by the Fund. Custodial fees are charged to the Fund based on the Fund's net assets and/or the market value of securities held by the Fund and the number of certain transactions incurred by the Fund.
Prior to November 23, 2020, these services were provided by State Street. The services provided by State Street were a direct expense of the Fund and are included in the Statement of Operations as Custodian fees which totaled $2,990 for the period November 1, 2020 through November 22, 2020.
| 50 | MainStay Floating Rate Fund |
Note 7–Line of Credit
The Fund and certain other funds managed by New York Life Investments maintain a line of credit with a syndicate of banks in order to secure a source of funds for temporary purposes to meet unanticipated or excessive redemption requests.
Effective July 28, 2020, under the credit agreement (the “Credit Agreement”), the aggregate commitment amount is $600,000,000 with an additional uncommitted amount of $100,000,000. The commitment fee is an annual rate of 0.15% of the average commitment amount payable quarterly, regardless of usage, to JPMorgan, who serves as the agent to the syndicate. The commitment fee is allocated among the Fund and certain other funds managed by New York Life Investments based upon their respective net assets and other factors. Interest on any revolving credit loan is charged based upon the Federal Funds Rate or the one-month London Interbank Offered Rate ("LIBOR"), whichever is higher. The Credit Agreement expires on July 27, 2021, although the Fund, certain other funds managed by New York Life Investments and the syndicate of banks may renew the Credit Agreement for an additional year on the same or different terms or enter into a credit agreement with a different syndicate of banks. Prior to July 28, 2020, the aggregate commitment amount and the commitment fee were the same as those under the current Credit Agreement, but State Street served as agent to the syndicate. During the six-month period ended April 30, 2021, there were no borrowings made or outstanding with respect to the Fund under the Credit Agreement or the credit agreement for which State Street served as agent.
Note 8–Interfund Lending Program
Pursuant to an exemptive order issued by the SEC, the Fund, along with certain other funds managed by New York Life Investments, may participate in an interfund lending program. The interfund lending program provides an alternative credit facility that permits the Fund and certain other funds managed by New York Life Investments to lend or borrow money for temporary purposes directly to or from one another, subject to the conditions of the exemptive order. During the six-month period ended April 30, 2021, there were no interfund loans made or outstanding with respect to the Fund.
Note 9–Purchases and Sales of Securities (in 000’s)
During the six-month period ended April 30, 2021, purchases and sales of securities, other than short-term securities, were $785,526 and $159,675, respectively.
Note 10–Capital Share Transactions
Transactions in capital shares for the six-month period ended April 30, 2021 and the year ended October 31, 2020, were as follows:
| Class A | Shares | Amount |
| Period ended April 30, 2021: | | |
| Shares sold | 8,698,661 | $ 79,221,416 |
| Shares issued to shareholders in reinvestment of distributions | 379,910 | 3,453,462 |
| Shares redeemed | (3,954,329) | (35,915,193) |
| Net increase (decrease) in shares outstanding before conversion | 5,124,242 | 46,759,685 |
| Shares converted into Class A (See Note 1) | 419,808 | 3,819,521 |
| Shares converted from Class A (See Note 1) | (33,780) | (308,371) |
| Net increase (decrease) | 5,510,270 | $ 50,270,835 |
| Year ended October 31, 2020: | | |
| Shares sold | 7,514,805 | $ 65,926,964 |
| Shares issued to shareholders in reinvestment of distributions | 1,092,678 | 9,580,788 |
| Shares redeemed | (14,895,988) | (128,631,458) |
| Net increase (decrease) in shares outstanding before conversion | (6,288,505) | (53,123,706) |
| Shares converted into Class A (See Note 1) | 411,788 | 3,619,575 |
| Shares converted from Class A (See Note 1) | (35,269) | (299,342) |
| Net increase (decrease) | (5,911,986) | $ (49,803,473) |
| |
| Investor Class | Shares | Amount |
| Period ended April 30, 2021: | | |
| Shares sold | 113,134 | $ 1,030,559 |
| Shares issued to shareholders in reinvestment of distributions | 26,927 | 244,710 |
| Shares redeemed | (192,442) | (1,748,886) |
| Net increase (decrease) in shares outstanding before conversion | (52,381) | (473,617) |
| Shares converted into Investor Class (See Note 1) | 96,647 | 880,573 |
| Shares converted from Investor Class (See Note 1) | (178,145) | (1,619,197) |
| Net increase (decrease) | (133,879) | $ (1,212,241) |
| Year ended October 31, 2020: | | |
| Shares sold | 350,736 | $ 3,071,570 |
| Shares issued to shareholders in reinvestment of distributions | 84,641 | 741,391 |
| Shares redeemed | (554,264) | (4,840,508) |
| Net increase (decrease) in shares outstanding before conversion | (118,887) | (1,027,547) |
| Shares converted into Investor Class (See Note 1) | 88,715 | 770,502 |
| Shares converted from Investor Class (See Note 1) | (246,579) | (2,173,906) |
| Net increase (decrease) | (276,751) | $ (2,430,951) |
| |
Notes to Financial Statements (Unaudited) (continued)
| Class B | Shares | Amount |
| Period ended April 30, 2021: | | |
| Shares sold | 1,691 | $ 15,442 |
| Shares issued to shareholders in reinvestment of distributions | 942 | 8,561 |
| Shares redeemed | (39,724) | (360,275) |
| Net increase (decrease) in shares outstanding before conversion | (37,091) | (336,272) |
| Shares converted from Class B (See Note 1) | (23,842) | (216,636) |
| Net increase (decrease) | (60,933) | $ (552,908) |
| Year ended October 31, 2020: | | |
| Shares sold | 30,627 | $ 271,910 |
| Shares issued to shareholders in reinvestment of distributions | 5,817 | 51,077 |
| Shares redeemed | (151,686) | (1,315,517) |
| Net increase (decrease) in shares outstanding before conversion | (115,242) | (992,530) |
| Shares converted from Class B (See Note 1) | (50,958) | (450,253) |
| Net increase (decrease) | (166,200) | $ (1,442,783) |
| |
| Class C | Shares | Amount |
| Period ended April 30, 2021: | | |
| Shares sold | 1,132,256 | $ 10,319,042 |
| Shares issued to shareholders in reinvestment of distributions | 50,265 | 456,960 |
| Shares redeemed | (1,427,411) | (12,984,747) |
| Net increase (decrease) in shares outstanding before conversion | (244,890) | (2,208,745) |
| Shares converted from Class C (See Note 1) | (306,692) | (2,793,588) |
| Net increase (decrease) | (551,582) | $ (5,002,333) |
| Year ended October 31, 2020: | | |
| Shares sold | 626,809 | $ 5,580,245 |
| Shares issued to shareholders in reinvestment of distributions | 209,233 | 1,834,843 |
| Shares redeemed | (3,976,492) | (34,517,599) |
| Net increase (decrease) in shares outstanding before conversion | (3,140,450) | (27,102,511) |
| Shares converted from Class C (See Note 1) | (149,408) | (1,309,722) |
| Net increase (decrease) | (3,289,858) | $ (28,412,233) |
| |
| Class I | Shares | Amount |
| Period ended April 30, 2021: | | |
| Shares sold | 60,259,014 | $ 549,743,276 |
| Shares issued to shareholders in reinvestment of distributions | 765,690 | 6,964,029 |
| Shares redeemed | (13,414,486) | (121,997,341) |
| Net increase (decrease) in shares outstanding before conversion | 47,610,218 | 434,709,964 |
| Shares converted into Class I (See Note 1) | 34,074 | 311,061 |
| Net increase (decrease) | 47,644,292 | $ 435,021,025 |
| Year ended October 31, 2020: | | |
| Shares sold | 20,292,680 | $ 178,350,288 |
| Shares issued to shareholders in reinvestment of distributions | 1,932,498 | 16,996,203 |
| Shares redeemed | (51,237,430) | (452,297,579) |
| Net increase (decrease) in shares outstanding before conversion | (29,012,252) | (256,951,088) |
| Shares converted into Class I (See Note 1) | 4,755 | 42,279 |
| Net increase (decrease) | (29,007,497) | $(256,908,809) |
| |
| Class R3 | Shares | Amount |
| Period ended April 30, 2021: | | |
| Shares sold | 3,007 | $ 27,262 |
| Shares issued to shareholders in reinvestment of distributions | 510 | 4,637 |
| Shares redeemed | (3,516) | (31,862) |
| Net increase (decrease) | 1 | $ 37 |
| Year ended October 31, 2020: | | |
| Shares sold | 14,015 | $ 122,516 |
| Shares issued to shareholders in reinvestment of distributions | 1,290 | 11,295 |
| Shares redeemed | (4,393) | (39,356) |
| Net increase (decrease) | 10,912 | $ 94,455 |
| |
| 52 | MainStay Floating Rate Fund |
| Class R6 | Shares | Amount |
| Period ended April 30, 2021: | | |
| Shares sold | 16,403,036 | $ 149,560,113 |
| Shares issued to shareholders in reinvestment of distributions | 253,320 | 2,306,067 |
| Shares redeemed | (1,566,350) | (14,234,714) |
| Net increase (decrease) in shares outstanding before conversion | 15,090,006 | 137,631,466 |
| Shares converted from Class R6 (See Note 1) | (8,040) | (73,363) |
| Net increase (decrease) | 15,081,966 | $ 137,558,103 |
| Year ended October 31, 2020: | | |
| Shares sold | 18,428,506 | $ 168,381,908 |
| Shares issued to shareholders in reinvestment of distributions | 547,422 | 4,747,356 |
| Shares redeemed | (13,208,597) | (113,159,127) |
| Net increase (decrease) in shares outstanding before conversion | 5,767,331 | 59,970,137 |
| Shares converted from Class R6 (See Note 1) | (22,832) | (199,133) |
| Net increase (decrease) | 5,744,499 | $ 59,771,004 |
| |
| SIMPLE Class | Shares | Amount |
| Period ended April 30, 2021: | | |
| Shares issued to shareholders in reinvestment of distributions | 32 | $ 288 |
| Net increase (decrease) | 32 | $ 288 |
| Period ended October 31, 2020:(a) | | |
| Shares sold | 2,831 | $ 25,000 |
| Shares issued to shareholders in reinvestment of distributions | 13 | 114 |
| Net increase (decrease) | 2,844 | $ 25,114 |
| (a) | The inception date of the class was August 31, 2020. |
Note 11–Recent Accounting Pronouncement
In March 2020, the Financial Accounting Standards Board issued Accounting Standards Update 2020-04 (“ASU 2020-04”), which provides optional guidance to ease the potential accounting burden associated with transitioning away from LIBOR and other reference rates that are expected to be discontinued. ASU 2020-04 was effective immediately upon release of the update on March 12, 2020 and remains effective through December 31, 2022. At this time, the Manager is evaluating the implications of certain other provisions of ASU 2020-04 related to new disclosure requirements and any impact on the financial statement disclosures has not yet been determined.
Note 12–Other Matters
An outbreak of COVID-19, first detected in December 2019, has developed into a global pandemic and has resulted in travel restrictions, closure of international borders, certain businesses and securities markets, restrictions on securities trading activities, prolonged
quarantines, supply chain disruptions, and lower consumer demand, as well as general concern and uncertainty. The continued impact of COVID-19 is uncertain and could further adversely affect the global economy, national economies, individual issuers and capital markets in unforeseeable ways and result in a substantial and extended economic downturn. Developments that disrupt global economies and financial markets, such as COVID-19, may magnify factors that affect the Fund's performance.
Note 13–Subsequent Events
In connection with the preparation of the financial statements of the Fund as of and for the six-month period ended April 30, 2021, events and transactions subsequent to April 30, 2021, through the date the financial statements were issued have been evaluated by the Manager for possible adjustment and/or disclosure. No subsequent events requiring financial statement adjustment or disclosure have been identified.
Board Consideration and Approval of Management Agreement and Subadvisory Agreement (Unaudited)
The continuation of the Management Agreement with respect to the MainStay Floating Rate Fund (“Fund”) and New York Life Investment Management LLC (“New York Life Investments”) and the Subadvisory Agreement between New York Life Investments and NYL Investors LLC (“NYL Investors”) with respect to the Fund (together, “Advisory Agreements”), following an initial term of up to two years, is subject to annual review and approval by the Board of Trustees of MainStay Funds Trust (“Board” of the “Trust”) in accordance with Section 15 of the Investment Company Act of 1940, as amended (“1940 Act”). At its December 9–10, 2020 meeting, the Board, including the Trustees who are not an “interested person” (as such term is defined in the 1940 Act) of the Trust (“Independent Trustees”) voting separately, unanimously approved the continuation of each of the Advisory Agreements for a one-year period.
In reaching the decision to approve the continuation of each of the Advisory Agreements, the Board considered information furnished by New York Life Investments and NYL Investors in connection with an annual contract review process undertaken by the Board that took place at meetings of the Board and its Contracts Committee during September 2020 through December 2020, as well as other information furnished to the Board and its Committees throughout the year, as deemed relevant by the Trustees. Information requested by and furnished to the Board for consideration in connection with the contract review process included, among other items, reports on the Fund and “peer funds” prepared by Strategic Insight Mutual Fund Research and Consulting, LLC (“Strategic Insight”), an independent third-party service provider engaged by the Board to report objectively on the Fund’s investment performance, management fee and total expenses. The Board also considered information on the fees charged to other investment advisory clients of New York Life Investments and/or NYL Investors that follow investment strategies similar to those of the Fund, if any, and, when applicable, the rationale for any differences in the Fund’s management and subadvisory fees and the fees charged to those other investment advisory clients. In addition, the Board considered information furnished by New York Life Investments and NYL Investors in response to requests prepared on behalf of the Board, and in consultation with the Independent Trustees, by independent legal counsel to the Independent Trustees, which encompassed a variety of topics, including those summarized below.
The Board took into account information provided in connection with its meetings throughout the year, including, among other items, information regarding the legal standards and fiduciary obligations applicable to its consideration of the continuation of each of the Advisory Agreements and investment performance reports on the Fund as well as presentations from New York Life Investments and NYL Investors personnel. The Board also took into account other information received from New York Life Investments throughout the year, including, among other items, periodic reports on legal and compliance matters, risk management, portfolio turnover, brokerage commissions and non-advisory services provided to the Fund by New York Life Investments. The contract review process, including the structure and format for materials provided to the Board, has been developed in consultation with the Board. The Independent
Trustees also met in executive sessions with their independent legal counsel and, for a portion thereof, with senior management of New York Life Investments.
In addition to information provided to the Board throughout the year, the Board received information in connection with its June 2020 meeting provided specifically in response to requests prepared on behalf of the Board, and in consultation with the Independent Trustees, by independent legal counsel regarding the Fund’s distribution arrangements. In addition, the Board received information regarding the Fund’s asset levels, share purchase and redemption activity and the payment of Rule 12b-1 and/or other fees by applicable share classes of the Fund, among other information.
In considering the continuation of each of the Advisory Agreements, the Trustees reviewed and evaluated the information and factors they believed to reasonably be necessary and appropriate in light of legal advice furnished to them by independent legal counsel and through the exercise of their own business judgment. Although individual Trustees may have weighed certain factors or information differently, the factors considered by the Board are described in greater detail below and include, among other factors: (i) the nature, extent and quality of the services provided to the Fund by New York Life Investments and NYL Investors; (ii) the qualifications of the portfolio managers of the Fund and the historical investment performance of the Fund, New York Life Investments and NYL Investors; (iii) the costs of the services provided, and profits realized, by New York Life Investments and NYL Investors from their relationships with the Fund; (iv) the extent to which economies of scale have been realized or may be realized as the Fund grows and the extent to which economies of scale have benefited or may benefit the Fund’s shareholders; and (v) the reasonableness of the Fund’s management and subadvisory fees and total ordinary operating expenses. Although the Board recognized that comparisons between the Fund’s fees and expenses and those of other funds are imprecise given different terms of agreements, variations in fund strategies and other factors, the Board considered the reasonableness of the Fund’s management fee and total ordinary operating expenses as compared to the peer funds identified by Strategic Insight. Throughout their considerations, the Trustees acknowledged the commitment of New York Life Investments and its affiliates to serve the MainStay Group of Funds, as well as their capacity, experience, resources, financial stability and reputations. The Trustees also acknowledged the entrepreneurial and other risks assumed by New York Life Investments in sponsoring and managing the Fund.
The Trustees noted that, throughout the year, the Trustees are afforded an opportunity to ask questions of, and request additional information or materials from, New York Life Investments and NYL Investors. The Board’s decision with respect to each of the Advisory Agreements may have also been based, in part, on the Board’s knowledge of New York Life Investments and NYL Investors resulting from, among other things, the Board’s consideration of each of the Advisory Agreements in prior years, the advisory agreements for other funds in the MainStay Group of Funds, the Board’s review throughout the year of the performance and operations of other funds in the MainStay Group of Funds and each
| 54 | MainStay Floating Rate Fund |
Trustee’s business judgment and industry experience. In addition to considering the above-referenced factors, the Board observed that in the marketplace there are a range of investment options available to the Fund’s shareholders and such shareholders, having had the opportunity to consider other investment options, have chosen to invest in the Fund.
The factors that figured prominently in the Board’s decision to approve the continuation of each of the Advisory Agreements during its December 9–10, 2020 meeting are summarized in more detail below, and the Board did not consider any factor or information controlling in reaching such decision.
Nature, Extent and Quality of Services Provided by New York Life Investments and NYL Investors
The Board examined the nature, extent and quality of the services that New York Life Investments provides to the Fund. The Board evaluated New York Life Investments’ experience and capabilities in serving as manager of the Fund and considered that the Fund operates in a “manager-of-managers” structure. The Board also considered New York Life Investments’ responsibilities and services provided pursuant to this structure, including evaluating the performance of NYL Investors, making recommendations to the Board as to whether the Subadvisory Agreement should be renewed, modified or terminated and periodically reporting to the Board regarding the results of New York Life Investments’ evaluation and monitoring functions. The Board noted that New York Life Investments manages other mutual funds, serves a variety of other investment advisory clients, including other pooled investment vehicles, and has experience overseeing mutual fund service providers, including subadvisors. The Board considered the experience of senior personnel at New York Life Investments providing management and administrative and other non-advisory services to the Fund as well as New York Life Investments’ reputation and financial condition. The Board observed that New York Life Investments devotes significant resources and time to providing management and non-advisory services to the Fund, including New York Life Investments’ supervision and due diligence reviews of NYL Investors and ongoing analysis of, and interactions with, NYL Investors with respect to, among other things, the Fund’s investment performance and risks as well as NYL Investors’ investment capabilities and subadvisory services with respect to the Fund.
The Board also considered the range of services that New York Life Investments provides to the Fund under the terms of the Management Agreement, including: (i) fund accounting and ongoing supervisory services provided by New York Life Investments’ Fund Administration and Accounting Group; (ii) investment supervisory and analytical services provided by New York Life Investments’ Investment Consulting Group; (iii) compliance services provided by the Trust’s Chief Compliance Officer as well as New York Life Investments’ compliance department, including supervision and implementation of the Fund’s compliance program; (iv) legal services provided by New York Life Investments’ Office of the General Counsel; and (v) risk management monitoring and analysis by compliance and investment personnel. The Board noted that New York Life Investments provides certain other non-advisory services to the Fund.
In addition, the Board considered New York Life Investments’ willingness to invest in personnel, infrastructure, technology, operational enhancements, cyber security, information security, shareholder privacy resources and business continuity planning designed to benefit the Fund and noted that New York Life Investments is responsible for compensating the Trust’s officers, except for a portion of the salary of the Trust’s Chief Compliance Officer. The Board recognized that New York Life Investments has provided an increasingly broad array of non-advisory services to the MainStay Group of Funds as a result of regulatory and other developments, including in connection with the designation of New York Life Investments as the administrator of the MainStay Group of Funds’ liquidity risk management program adopted under the 1940 Act. The Board considered benefits to shareholders from being part of the MainStay Group of Funds, including the privilege of exchanging investments between the same class of shares of funds in the MainStay Group of Funds, including without the imposition of a sales charge (if any).
The Board also examined the nature, extent and quality of the investment advisory services that NYL Investors provides to the Fund and considered the terms of each of the Advisory Agreements. The Board evaluated NYL Investors’ experience in serving as subadvisor to the Fund and advising other portfolios and NYL Investors’ track record and experience in providing investment advisory services, the experience of investment advisory, senior management and administrative personnel at NYL Investors and New York Life Investments’ and NYL Investors’ overall resources, legal and compliance environment, capabilities and history. In addition to information provided in connection with quarterly meetings with the Trust’s Chief Compliance Officer, the Board considered information regarding the compliance policies and procedures of New York Life Investments and NYL Investors and acknowledged their commitment to further developing and strengthening compliance programs relating to the Fund. The Board reviewed NYL Investors’ ability to attract and retain qualified investment professionals and willingness to invest in personnel to service and support the Fund. In this regard, the Board considered the experience of the Fund’s portfolio managers, the number of accounts managed by the portfolio managers and the method for compensating the portfolio managers.
In addition, the Board considered discussions with New York Life Investments regarding the implementation of its business continuity plans and recognized steps taken by New York Life Investments and NYL Investors to continue to provide the same nature, extent and quality of services to the Fund during the COVID-19 pandemic.
Based on these considerations, the Board concluded that the Fund would likely continue to benefit from the nature, extent and quality of these services.
Investment Performance
In evaluating the Fund’s investment performance, the Board considered investment performance results over various periods in light of the Fund’s investment objective, strategies and risks. The Board considered
Board Consideration and Approval of Management Agreement and Subadvisory Agreement (Unaudited) (continued)
investment reports on, and analysis of, the Fund’s performance provided to the Board throughout the year. These reports include, among other items, information on the Fund’s gross and net returns, the Fund’s investment performance compared to relevant investment categories and the Fund’s benchmarks, the Fund’s risk-adjusted investment performance and the Fund’s investment performance as compared to peer funds, as appropriate, as well as portfolio attribution information and commentary on the effect of market conditions. The Board also considered information provided by Strategic Insight showing the investment performance of the Fund as compared to peer funds.
The Board also gave weight to its discussions with senior management at New York Life Investments concerning the Fund’s investment performance attributable to NYL Investors as well as discussions between the Fund’s portfolio managers and the members of the Board’s Investment Committee, which generally occur on an annual basis. In addition, the Board considered any specific actions that New York Life Investments or NYL Investors had taken, or had agreed to take, to seek to enhance Fund investment performance and the results of those actions.
Based on these considerations, the Board concluded that its review of the Fund’s investment performance and related information supported a determination to approve the continuation of each of the Advisory Agreements.
Costs of the Services Provided, and Profits Realized, by New York Life Investments and NYL Investors
The Board considered the costs of the services provided under each of the Advisory Agreements. The Board also considered the profits realized by New York Life Investments and its affiliates, including NYL Investors, due to their relationships with the Fund. Because NYL Investors is an affiliate of New York Life Investments whose subadvisory fee is paid by New York Life Investments, not the Fund, the Board considered cost and profitability information for New York Life Investments and NYL Investors in the aggregate.
In addition, the Board acknowledged the difficulty in obtaining reliable comparative data about mutual fund managers’ profitability because such information generally is not publicly available and may be impacted by numerous factors, including the structure of a fund manager’s organization, the types of funds it manages, the methodology used to allocate certain fixed costs to specific funds and the manager’s capital structure and costs of capital.
In evaluating the costs of the services provided by New York Life Investments and NYL Investors and profits realized by New York Life Investments and its affiliates, including NYL Investors, the Board considered, among other factors, each party’s continuing investments in, or willingness to invest in, personnel, systems, equipment and other resources and infrastructure to support and further enhance the management of the Fund, and that New York Life Investments is responsible for paying the subadvisory fee for the Fund. The Board also considered the financial resources of New York Life Investments and NYL Investors and acknowledged that New York Life Investments and NYL
Investors must be in a position to attract and retain experienced professional personnel and to maintain a strong financial position for New York Life Investments and NYL Investors to continue to provide high-quality services to the Fund. The Board recognized that the Fund benefits from the allocation of certain fixed costs among the funds in the MainStay Group of Funds, among other expected benefits resulting from its relationship with New York Life Investments.
The Board considered information regarding New York Life Investments’ methodology for calculating profitability and allocating costs provided by New York Life Investments in connection with the fund profitability analysis presented to the Board. The Board previously engaged an independent consultant to review the methods used to allocate costs among the funds in the MainStay Group of Funds. The Board noted that the independent consultant had concluded that New York Life Investments’ methods for allocating costs and procedures for estimating overall profitability of the relationship with the funds in the MainStay Group of Funds are reasonable and that New York Life Investments continued to use the same method of calculating profit and allocating costs since the independent consultant’s review. The Board recognized the difficulty in calculating and evaluating a manager’s profitability with respect to the Fund and noted that other profitability methodologies may also be reasonable.
The Board also considered certain fall-out benefits that may be realized by New York Life Investments and its affiliates due to their relationships with the Fund, including reputational and other indirect benefits. In addition, the Board considered its review of a money market fund advised by New York Life Investments and an affiliated subadvisor that serves as an investment option for the Fund, including the potential rationale for and costs associated with investments in this money market fund by the Fund, if any, and considered information from New York Life Investments that the nature and type of specific investment advisory services provided to this money market fund are distinct from, or in addition to, the investment advisory services provided to the Fund.
The Board observed that, in addition to fees earned by New York Life Investments for managing the Fund, New York Life Investments’ affiliates also earn revenues from serving the Fund in various other capacities, including as the Fund’s transfer agent and distributor. The Board considered information about these other revenues and their impact on the profitability of the relationship with the Fund to New York Life Investments and its affiliates. The Board noted that, although it assessed the overall profitability of the Fund to New York Life Investments and its affiliates as part of the contract review process, when considering the reasonableness of the fee paid to New York Life Investments and its affiliates under each of the Advisory Agreements, the Board considered the profitability of New York Life Investments’ relationship with the Fund on a pre-tax basis and without regard to distribution expenses incurred by New York Life Investments from its own resources.
| 56 | MainStay Floating Rate Fund |
After evaluating the information deemed relevant by the Trustees, the Board concluded that any profits realized by New York Life Investments and its affiliates, including NYL Investors, due to their relationships with the Fund were not excessive.
Management and Subadvisory Fees and Total Ordinary Operating Expenses
The Board evaluated the reasonableness of the fee paid under each of the Advisory Agreements and the Fund’s total ordinary operating expenses. The Board primarily considered the reasonableness of the management fee paid by the Fund to New York Life Investments, because the subadvisory fee paid to NYL Investors is paid by New York Life Investments, not the Fund. The Board also considered the reasonableness of the subadvisory fee paid by New York Life Investments and the amount of the management fee retained by New York Life Investments.
In assessing the reasonableness of the Fund’s fees and expenses, the Board primarily considered comparative data provided by Strategic Insight on the fees and expenses charged by similar mutual funds managed by other investment advisers. In addition, the Board considered information provided by New York Life Investments and NYL Investors on fees charged to other investment advisory clients, including institutional separate accounts and/or other funds that follow investment strategies similar to those of the Fund, if any. The Board considered the similarities and differences in the contractual management fee schedules of the Fund and these similarly-managed accounts and/or funds, taking into account the rationale for any differences in fee schedules. The Board also took into account explanations provided by New York Life Investments about the more extensive scope of services provided to registered investment companies, such as the Fund, as compared with other investment advisory clients. Additionally, the Board considered the impact of contractual breakpoints, voluntary waivers and expense limitation arrangements on the Fund’s net management fee and expenses. The Board also considered that in proposing fees for the Fund, New York Life Investments considers the competitive marketplace for mutual funds. The Board considered its discussions with representatives from New York Life Investments regarding the total expenses for the Fund. The Board noted that New York Life Investments proposed, and the Board had approved, the implementation of an expense limitation arrangement for Class A shares of the Fund and that New York Life Investments will apply an equivalent waiver or reimbursement as the Class A shares waiver/reimbursement to the other applicable share classes of the Fund, effective February 28, 2021.
The Board noted that, outside of the Fund’s management fee and the fees charged under a share class’s Rule 12b-1 and/or shareholder services plans, a share class’s most significant “other expenses” are transfer agent fees. Transfer agent fees are charged to the Fund based on the number of shareholder accounts (a “per-account” fee). The Board took into account information from New York Life Investments regarding the reasonableness of the Fund’s transfer agent fee schedule, including industry data demonstrating that the per-account fees that NYLIM Service Company LLC, an affiliate of New York Life Investments and the Fund’s
transfer agent, charges the Fund are within the range of per-account fees charged by transfer agents to other mutual funds. In addition, the Board considered NYLIM Service Company LLC’s profitability in connection with the transfer agent services it provides to the Fund. The Board also took into account information received from NYLIM Service Company LLC regarding the sub-transfer agency payments it made to intermediaries in connection with the provision of sub-transfer agency services to the Fund.
The Board considered that, because the Fund’s transfer agent fees are billed on a per-account basis, the impact of transfer agent fees on a share class’s expense ratio may be more significant in cases where the share class has a high number of small accounts. The Board considered the extent to which transfer agent fees comprised total expenses of the Fund. The Board acknowledged the role that the MainStay Group of Funds historically has played in serving the investment needs of New York Life Insurance Company customers, who often maintain smaller account balances than other shareholders of funds, and the impact of small accounts on the expense ratios of Fund share classes. The Board also recognized measures that it and New York Life Investments have taken to mitigate the effect of small accounts on the expense ratios of Fund share classes, including through the imposition of an expense limitation on net transfer agency expenses. The Board noted that, for purposes of allocating transfer agency fees and expenses, each retail fund in the MainStay Group of Funds combines the shareholder accounts of its Class A, A2, I, R1, R2 and R3 shares (as applicable) into one group and the shareholder accounts of its Investor Class, SIMPLE Class and Class B, C and C2 shares (as applicable) into another group. The Board also noted that the per-account fees attributable to each group of share classes is then allocated among the constituent share classes based on relative net assets and that a MainStay Fund’s Class R6 shares, if any, are not combined with any other share class for this purpose. The Board considered New York Life Investments’ rationale with respect to these groupings and previously received a report from an independent consultant engaged to conduct comparative analysis of these groupings. The Board also considered that NYLIM Service Company LLC had waived its contractual cost of living adjustments during the past seven years.
Based on the factors outlined above, the Board concluded that the Fund’s management fee and total ordinary operating expenses were within a range that is competitive and support a conclusion that these fees and expenses are reasonable.
Economies of Scale
The Board considered information regarding economies of scale, including whether the Fund’s expense structure permits economies of scale to be appropriately shared with the Fund’s shareholders. The Board also considered a report from New York Life Investments, previously prepared at the request of the Board, that addressed economies of scale, including with respect to the mutual fund business generally and the various ways in which the benefits of economies of scale may be shared with the funds in the MainStay Group of Funds. Although the Board recognized the difficulty of determining economies of scale with precision,
Board Consideration and Approval of Management Agreement and Subadvisory Agreement (Unaudited) (continued)
the Board acknowledged that economies of scale may be shared with the Fund in a number of ways, including, for example, through the imposition of management fee breakpoints, initially setting management fee rates at scale or making additional investments to enhance services. The Board reviewed information from New York Life Investments showing how the Fund’s management fee schedule compared to fee schedules of other funds and accounts managed by New York Life Investments. The Board also reviewed information from Strategic Insight showing how the Fund’s management fee schedule compared with fees paid for similar services by peer funds at varying asset levels.
Based on this information, the Board concluded that economies of scale are appropriately reflected for the benefit of the Fund’s shareholders through the Fund’s expense structure and other methods to share benefits from economies of scale.
Conclusion
On the basis of the information and factors summarized above, among other information and factors deemed relevant by the Trustees, and the evaluation thereof, the Board, including the Independent Trustees voting separately, unanimously voted to approve the continuation of each of the Advisory Agreements.
| 58 | MainStay Floating Rate Fund |
Discussion of the Operation and Effectiveness of the Fund's Liquidity Risk Management Program (Unaudited)
In compliance with Rule 22e-4 under the Investment Company Act of 1940, as amended (the “Liquidity Rule”), the Fund has adopted and implemented a liquidity risk management program (the “Program”), which New York Life Investment Management LLC believes is reasonably designed to assess and manage the Fund's liquidity risk (the risk that the Fund could not meet requests to redeem shares issued by the Fund without significant dilution of remaining investors’ interests in the Fund). The Board of Trustees of MainStay Funds Trust (the "Board") designated New York Life Investment Management LLC as administrator of the Program (the “Administrator”). The Administrator has established a Liquidity Risk Management Committee to assist the Administrator in the implementation and day-to-day administration of the Program and to otherwise support the Administrator in fulfilling its responsibilities under the Program.
At a meeting of the Board held on March 8, 2021, the Administrator provided the Board with a written report addressing the Program’s operation and assessing its adequacy and effectiveness of implementation for the period from January 1, 2020 through December 31, 2020 (the "Review Period"), as required under the Liquidity Rule. The report noted that the Administrator concluded that (i) the Program operated effectively to assess and manage the Fund's liquidity risk, (ii) the Program has been adequately and effectively implemented to monitor and, as applicable, respond to the Fund's liquidity developments and (iii) the Fund's investment strategy continues to be appropriate for an open-end fund. In addition, the report discussed notable events that impacted liquidity risk during the Review Period, including the COVID-19 pandemic and the resulting economic shutdown.
In accordance with the Program, the Fund's liquidity risk is assessed no less frequently than annually taking into consideration certain factors, as applicable, such as (i) investment strategy and liquidity of portfolio investments, (ii) short-term and long-term cash flow projections and (iii) holdings of cash and cash equivalents, as well as borrowing arrangements and other funding sources. Certain factors are considered under both normal and reasonably foreseeable stressed conditions.
Each Fund portfolio investment is classified into one of four liquidity categories. The classification is based on a determination of the number of days it is reasonably expected to take to convert the investment into cash, or sell or dispose of the investment, in current market conditions without significantly changing the market value of the investment. The Administrator has delegated liquidity classification determinations to the Fund’s subadvisor, subject to appropriate oversight by the Administrator, and classification determinations are made by taking into account the Fund's reasonably anticipated trade size, various market, trading and investment-specific considerations, as well as market depth, and, in certain cases, third-party vendor data.
The Liquidity Rule requires funds that do not primarily hold assets that are highly liquid investments to adopt a minimum amount of net assets that must be invested in highly liquid investments that are assets (an “HLIM”). In addition, the Liquidity Rule limits a fund's investments in illiquid investments. Specifically, the Liquidity Rule prohibits acquisition of illiquid investments if doing so would result in a fund holding more than 15% of its net assets in illiquid investments that are assets. The Program includes provisions reasonably designed to determine, periodically review and comply with the HLIM requirement, as applicable, and to comply with the 15% limit on illiquid investments.
There can be no assurance that the Program will achieve its objectives under all circumstances in the future. Please refer to the Fund's prospectus for more information regarding the Fund's exposure to liquidity risk and other risks to which it may be subject.
Proxy Voting Record
The Fund is required to file with the Securities and Exchange Commissions's ("SEC") its proxy voting records for the 12-month period ending June 30 on Form N-PX. The most recent Form N-PX or proxy voting record is available free of charge upon request by calling 800-624-6782; visiting the MainStay Funds’ website at newyorklifeinvestments.com; or visiting the SEC’s website at www.sec.gov.
Shareholder Reports and Quarterly Portfolio Disclosure
The Fund is required to file its complete schedule of portfolio holdings with the SEC 60 days after its first and third fiscal quarter on Form N-PORT. The Fund's holdings report is available free of charge upon request by calling New York Life Investments at 800-624-6782.
| 60 | MainStay Floating Rate Fund |
This page intentionally left blank.
This page intentionally left blank.
Equity
U.S. Equity
MainStay Epoch U.S. Equity Yield Fund
MainStay MacKay S&P 500 Index Fund
MainStay Winslow Large Cap Growth Fund
MainStay WMC Enduring Capital Fund
MainStay WMC Growth Fund
MainStay WMC Small Companies Fund
MainStay WMC Value Fund
International Equity
MainStay Epoch International Choice Fund
MainStay MacKay International Equity Fund
MainStay WMC International Research Equity Fund
Emerging Markets Equity
MainStay Candriam Emerging Markets Equity Fund
Global Equity
MainStay Epoch Capital Growth Fund
MainStay Epoch Global Equity Yield Fund
Fixed Income
Taxable Income
MainStay Candriam Emerging Markets Debt Fund
MainStay Floating Rate Fund
MainStay MacKay High Yield Corporate Bond Fund
MainStay MacKay Short Duration High Yield Fund
MainStay MacKay Strategic Bond Fund
MainStay MacKay Total Return Bond Fund
MainStay MacKay U.S. Infrastructure Bond Fund
MainStay Short Term Bond Fund
Tax-Exempt Income
MainStay MacKay California Tax Free Opportunities Fund1
MainStay MacKay High Yield Municipal Bond Fund
MainStay MacKay Intermediate Tax Free Bond Fund
MainStay MacKay New York Tax Free Opportunities Fund2
MainStay MacKay Short Term Municipal Fund
MainStay MacKay Tax Free Bond Fund
Money Market
MainStay Money Market Fund
Mixed Asset
MainStay Balanced Fund
MainStay Income Builder Fund
MainStay MacKay Convertible Fund
Speciality
MainStay CBRE Global Infrastructure Fund
MainStay CBRE Real Estate Fund
MainStay Cushing MLP Premier Fund
Asset Allocation
MainStay Conservative Allocation Fund
MainStay Conservative ETF Allocation Fund
MainStay Defensive ETF Allocation Fund
MainStay Equity Allocation Fund
MainStay Equity ETF Allocation Fund
MainStay Growth Allocation Fund
MainStay Growth ETF Allocation Fund
MainStay Moderate Allocation Fund
MainStay Moderate ETF Allocation Fund
Manager
New York Life Investment Management LLC
New York, New York
Subadvisors
Candriam Belgium S.A.3
Brussels, Belgium
Candriam Luxembourg S.C.A.3
Strassen, Luxembourg
CBRE Clarion Securities LLC
Radnor, Pennsylvania
Cushing Asset Management, LP
Dallas, Texas
Epoch Investment Partners, Inc.
New York, New York
MacKay Shields LLC3
New York, New York
NYL Investors LLC3
New York, New York
Wellington Management Company LLP
Boston, Massachusetts
Winslow Capital Management, LLC
Minneapolis, Minnesota
Legal Counsel
Dechert LLP
Washington, District of Columbia
Independent Registered Public Accounting Firm
KPMG LLP
Philadelphia, Pennsylvania
Distributor
NYLIFE Distributors LLC3
Jersey City, New Jersey
Custodian
JPMorgan Chase Bank, N.A.
New York, New York
1.
This Fund is registered for sale in AZ, CA, NV, OR, TX, UT, WA and MI (Class A and I shares only), and CO, FL, GA, HI, ID, MA, MD, NH, NJ and NY (Class I shares only).
| 2. | This Fund is registered for sale in CA, CT, DE, FL, MA, NJ, NY and VT. |
| 3. | An affiliate of New York Life Investment Management LLC. |
Not part of the Semiannual Report
For more information
800-624-6782
newyorklifeinvestments.com
“New York Life Investments” is both a service mark, and the common trade name, of certain investment advisors affiliated with New York Life Insurance Company. The MainStay Funds® are managed by New York Life Investment Management LLC and distributed by NYLIFE Distributors LLC, 30 Hudson Street, Jersey City, NJ 07302, a wholly owned subsidiary of New York Life Insurance Company. NYLIFE Distributors LLC is a Member FINRA/SIPC.
©2021 NYLIFE Distributors LLC. All rights reserved.
| 1738065MS071-21 | MSFR10-06/21 |
(NYLIM) NL225
MainStay MacKay California Tax Free Opportunities Fund
Message from the President and Semiannual Report
Unaudited | April 30, 2021
Sign up for e-delivery of your shareholder reports. For full details on e-delivery, including who can participate and what you can receive via e-delivery,
please log in to newyorklifeinvestments.com/accounts.
| Not FDIC/NCUA Insured | Not a Deposit | May Lose Value | No Bank Guarantee | Not Insured by Any Government Agency |
This page intentionally left blank
Message from the President
With the approval of COVID-19 vaccines and the passage of relief packages by the U.S. Congress, economic prospects improved during the reporting period, and investor risk appetite increased, benefiting both equities and fixed-income markets. Despite some volatility stemming from a sell-off in longer-dated Treasury securities, the stock market and higher-risk segments of the fixed-income market posted gains for the six months ended April 30, 2021.
By the beginning of the reporting period, the economy had made tremendous progress from the second quarter of 2020, when economic activity plunged. But uncertainty about when vaccines would be available and how quickly they could be administered left investors unsure about the economic outlook.
With the approval of several vaccines in November, the outlook brightened and investors became less risk-averse. Anticipating the likely end of the pandemic and a continuation of the economic recovery, they began to see opportunities in investment-grade and high-yield bonds and more cyclical segments of the stock market. The $900 billion relief and stimulus package passed in December provided further assurance.
In January, the Federal Reserve opted to leave interest rates unchanged, pointing to some uncertainty about the pace of the global recovery. Officials also noted that inflation remained low, citing oil prices in particular.
In March, President Biden signed the $1.9 billion American Rescue Plan, which, among other provisions, called for payments of $1,400 for those earning less than $75,000 per year, plus $1,400 per dependent. This, combined with the Federal Reserve’s new tolerance for inflation and an anticipated $2 trillion infrastructure spending bill, added to growing concerns about higher prices. Supply shortages in some markets caused some prices to soar, heightening concerns further.
In fixed-income markets, an improving economic outlook and rising inflation expectations led to a sell-off in longer-term Treasuries, with the result that the yield on the 10-year note rose sharply, particularly in February and March. Investment grade corporate bonds were also affected. Early in the reporting period, they performed well as investors shifted out of Treasuries, but as the reporting period progressed, they faltered. Longer-dated securities issued in recent years at historically low interest rates became especially unattractive.
High-yield bonds remained steady, supported by more favorable yields and an improved economic outlook, which reduced their perceived risk. Municipal bonds produced modest gains, and
although the sell-off in Treasuries produced some volatility early in 2021, stronger-than-expected tax revenues, $350 billion in financial support from the federal government, and the possibility of an increase in federal income tax rates appeared to buoy the market late in the reporting period.
Inflation concerns and volatility in the Treasury market led to a shift in equities markets. Although the S&P 500® Index, a widely followed measure of U.S. equities, posted double-digit gains and hit a record high, the rise of Treasury yields disrupted valuations, especially those of growth stocks. Technology companies that saw their valuations soar amid the work-from-home trend in 2020 suffered large declines.
But the fiscal stimulus and continued accommodation from the Federal Reserve gave investors confidence the economic recovery would continue. Combined with the sky-high valuations in technology and growth stocks, this increased the appeal of more cyclical and value-oriented shares. As a result, value stocks outperformed growth stocks during the reporting period.
Reflecting the shift in investor sentiment, the performance of S&P 500® Index sectors varied widely. While the information technology sector kept up with the broader market, it lagged cyclical sectors such as energy and financials, which led the way. The shift was further reflected in the performance of small-cap stocks, which outperformed large caps. While developed markets kept pace with the U.S. market, lagging economic and pandemic recoveries appeared to weigh on emerging markets late in the reporting period.
With the lockdown restrictions lifting in the U.S. and the pandemic easing in many regions, we at New York Life Investments are looking forward to a return to a more normal economy. We anticipate that over the next several years, a variety of trends will likely offer long-term investors many attractive opportunities. With this in mind, we continue to develop products and services to help you to take advantage of these trends, manage your risks, and ultimately meet your investment goals.
Sincerely,
Kirk C. Lehneis
President
The opinions expressed are as of the date of this report and are subject to change. There is no guarantee that any forecast made will come to pass. This material does not constitute investment advice and is not intended as an endorsement of any specific investment. Past performance is no guarantee of future results.
Not part of the Semiannual Report
Investors should refer to the Fund’s Summary Prospectus and/or Prospectus and consider the Fund’s investment objectives, strategies, risks, charges and expenses carefully before investing. The Summary Prospectus and/or Prospectus contain this and other information about the Fund. You may obtain copies of the Fund’s Summary Prospectus, Prospectus and Statement of Additional Information free of charge, upon request, by calling toll-free 800-624-6782, by writing to NYLIFE Distributors LLC, Attn: MainStay Marketing Department, 30 Hudson Street, Jersey City, NJ 07302 or by sending an e-mail to MainStayShareholderServices@nylim.com. These documents are also available via the MainStay Funds’ website at newyorklifeinvestments.com. Please read the Fund’s Summary Prospectus and/or Prospectus carefully before investing.
Investment and Performance Comparison (Unaudited)
Performance data quoted represents past performance. Past performance is no guarantee of future results. Because of market volatility and other factors, current performance may be lower or higher than the figures shown. Investment return and principal value will fluctuate, and as a result, when shares are redeemed, they may be worth more or less than their original cost. The graph below depicts the historical performance of Class I shares of the Fund. Performance will vary from class to class based on differences in class-specific expenses and sales charges. For performance information current to the most recent month-end, please call 800-624-6782 or visit newyorklifeinvestments.com.
The performance table and graph do not reflect the deduction of taxes that a shareholder would pay on distributions or Fund share redemptions. Total returns reflect maximum applicable sales charges as indicated in the table below, if any, changes in share price, and reinvestment of dividend and capital gain distributions. The graph assumes the initial investment amount shown below and reflects the deduction of all sales charges that would have applied for the period of investment. Performance figures may reflect certain fee waivers and/or expense limitations, without which total returns may have been lower. For more information on share classes and current fee waivers and/or expense limitations (if any), please refer to the Notes to Financial Statements.
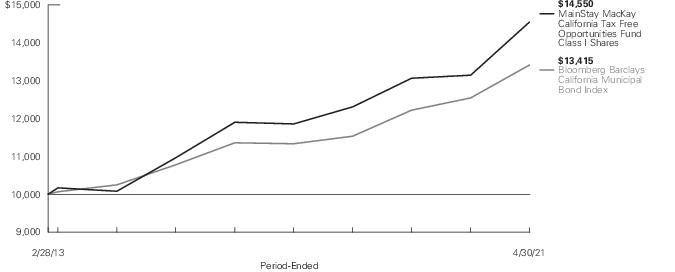
| Average Annual Total Returns for the Period-Ended April 30, 2021 |
| Class | Sales Charge | | Inception
Date | Six
Months | One Year
or Since
Inception | Five Years
or Since
Inception | Since
Inception | Gross
Expense
Ratio1 |
| Class A Shares | Maximum 4.5% Initial Sales Charge | With sales charges | 2/28/2013 | -0.87% | 5.36% | 2.87% | 3.83% | 0.75% |
| | | Excluding sales charges | | 3.80 | 10.32 | 3.82 | 4.42 | 0.75 |
| Investor Class Shares2 | Maximum 4% Initial Sales Charge | With sales charges | 2/28/2013 | -0.45 | 5.34 | 2.84 | 3.77 | 0.77 |
| | | Excluding sales charges | | 3.70 | 10.30 | 3.79 | 4.36 | 0.77 |
| Class C Shares | Maximum 1% CDSC | With sales charges | 2/28/2013 | 2.66 | 9.12 | 3.55 | 4.10 | 1.02 |
| | if Redeemed Within One Year of Purchase | Excluding sales charges | | 3.66 | 10.12 | 3.55 | 4.10 | 1.02 |
| Class C2 Shares | Maximum 1% CDSC | With sales charges | 8/31/2020 | 2.67 | 2.25 | N/A | N/A | 1.17 |
| | if Redeemed Within One Year of Purchase | Excluding sales charges | | 3.67 | 3.25 | N/A | N/A | 1.17 |
| Class I Shares | No Sales Charge | | 2/28/2013 | 3.93 | 10.70 | 4.10 | 4.70 | 0.50 |
| Class R6 Shares | No Sales Charge | | 11/1/2019 | 3.94 | 10.72 | 4.54 | N/A | 0.48 |
| 1. | The gross expense ratios presented reflect the Fund’s “Total Annual Fund Operating Expenses” from the most recent Prospectus and may differ from other expense ratios disclosed in this report. |
| 2. | Prior to June 30, 2020, the maximum initial sales charge for Investor Class shares was 4.5%, which is reflected in the average annual total return figures shown. |
The footnotes on the next page are an integral part of the table and graph and should be carefully read in conjunction with them.
| Benchmark Performance | Six
Months | One
Year | Five
Years | Since
Inception |
| Bloomberg Barclays California Municipal Bond Index1 | 2.09% | 6.94% | 3.38% | 3.66% |
| Morningstar Muni California Long Category Average2 | 3.48 | 9.89 | 3.42 | 3.69 |
| 1. | The Bloomberg Barclays California Municipal Bond Index is the Fund’s primary broad-based securities market index for comparison purposes. The Bloomberg Barclays California Municipal Bond Index is a market-value-weighted index of California investment grade tax exempt fixed-rate municipal bonds with maturities of one year or more. Results assume reinvestment of all dividends and capital gains. An investment cannot be made directly in an index. |
| 2. | The Morningstar Muni California Long Category Average is representative of funds that invest at least 80% of assets in California municipal debt. These portfolios have durations of more than 7.0 years. Results are based on average total returns of similar funds with all dividends and capital gain distributions reinvested. |
The footnotes on the preceding page are an integral part of the table and graph and should be carefully read in conjunction with them.
| 6 | MainStay MacKay California Tax Free Opportunities Fund |
Cost in Dollars of a $1,000 Investment in MainStay MacKay California Tax Free Opportunities Fund (Unaudited)
The example below is intended to describe the fees and expenses borne by shareholders during the six-month period from November 1, 2020, to April 30, 2021, and the impact of those costs on your investment.
Example
As a shareholder of the Fund you incur two types of costs: (1) transaction costs, including exchange fees and sales charges (loads) on purchases (as applicable), and (2) ongoing costs, including management fees, distribution and/or service (12b-1) fees, and other Fund expenses (as applicable). This example is intended to help you understand your ongoing costs (in dollars) of investing in the Fund and to compare these costs with the ongoing costs of investing in other mutual funds. The example is based on an investment of $1,000 made at the beginning of the six-month period and held for the entire period from November 1, 2020, to April 30, 2021.
This example illustrates your Fund’s ongoing costs in two ways:
Actual Expenses
The second and third data columns in the table below provide information about actual account values and actual expenses. You may use the information in these columns, together with the amount you invested, to estimate the expenses that you paid during the six months ended April 30, 2021. Simply divide your account value by $1,000 (for example, an
$8,600 account value divided by $1,000 = 8.6), then multiply the result by the number under the heading entitled “Expenses Paid During Period” to estimate the expenses you paid on your account during this period.
Hypothetical Example for Comparison Purposes
The fourth and fifth data columns in the table below provide information about hypothetical account values and hypothetical expenses based on the Fund’s actual expense ratio and an assumed rate of return of 5% per year before expenses, which is not the Fund’s actual return. The hypothetical account values and expenses may not be used to estimate the actual ending account balances or expenses you paid for the six-month period shown. You may use this information to compare the ongoing costs of investing in the Fund with the ongoing costs of investing in other mutual funds. To do so, compare this 5% hypothetical example with the 5% hypothetical examples that appear in the shareholder reports of the other mutual funds.
Please note that the expenses shown in the table are meant to highlight your ongoing costs only and do not reflect any transactional costs, such as exchange fees or sales charges (loads). Therefore, the fourth and fifth data columns of the table are useful in comparing ongoing costs only and will not help you determine the relative total costs of owning different funds. In addition, if these transactional costs were included, your costs would have been higher.
| Share Class | Beginning
Account
Value
11/1/20 | Ending Account
Value (Based
on Actual
Returns and
Expenses)
4/30/21 | Expenses
Paid
During
Period1 | Ending Account
Value (Based
on Hypothetical
5% Annualized
Return and
Actual Expenses)
4/30/21 | Expenses
Paid
During
Period1 | Net Expense
Ratio
During
Period2 |
| Class A Shares | $1,000.00 | $1,038.00 | $3.79 | $1,021.08 | $3.76 | 0.75% |
| Investor Class Shares | $1,000.00 | $1,037.00 | $3.89 | $1,020.98 | $3.86 | 0.77% |
| Class C Shares | $1,000.00 | $1,036.60 | $5.15 | $1,019.74 | $5.11 | 1.02% |
| Class C2 Shares | $1,000.00 | $1,036.70 | $5.81 | $1,019.09 | $5.76 | 1.15% |
| Class I Shares | $1,000.00 | $1,039.30 | $2.53 | $1,022.32 | $2.51 | 0.50% |
| Class R6 Shares | $1,000.00 | $1,039.40 | $2.43 | $1,022.41 | $2.41 | 0.48% |
| 1. | Expenses are equal to the Fund’s annualized expense ratio of each class multiplied by the average account value over the period, divided by 365 and multiplied by 181 (to reflect the six-month period). The table above represents the actual expenses incurred during the six-month period. In addition to the fees and expenses which the Fund bears directly, it also indirectly bears a pro rata share of the fees and expenses of the underlying funds in which it invests. Such indirect expenses are not included in the above-reported expense figures. |
| 2. | Expenses are equal to the Fund's annualized expense ratio to reflect the six-month period. |
Industry Composition as of April 30, 2021 (Unaudited)
| General Obligation | 37.2% |
| Other Revenue | 20.5 |
| Transportation | 9.8 |
| Water & Sewer | 7.1 |
| Education | 6.4 |
| Hospital | 4.4 |
| Utilities | 3.3 |
| Housing | 2.9 |
| General | 2.7% |
| Certificate of Participation/Lease | 0.9 |
| School District | 0.3 |
| Development | 0.3 |
| Short–Term Investment | 0.5 |
| Other Assets, Less Liabilities | 3.7 |
| | 100.0% |
See Portfolio of Investments beginning on page 11 for specific holdings within these categories. The Fund's holdings are subject to change.
Top Ten Issuers Held as of April 30, 2021 (excluding short-term investments) (Unaudited)
| 1. | California Municipal Finance Authority, 3.25%-5.30%, due 2/1/27–10/1/54 |
| 2. | California Health Facilities Financing Authority, 4.00%-5.00%, due 9/1/30–11/15/49 |
| 3. | State of California, 0.055%-5.00%, due 11/1/27–5/1/48 |
| 4. | San Francisco City & County Airport Commission, 5.00%, due 5/1/27–5/1/50 |
| 5. | City of Los Angeles, 4.00%-5.25%, due 5/15/25–5/15/48 |
| 6. | Anaheim Public Financing Authority, 5.00%, due 9/1/26–9/1/35 |
| 7. | San Francisco Bay Area Rapid Transit District, 3.00%-4.00%, due 8/1/37–8/1/50 |
| 8. | California Statewide Communities Development Authority, 2.625%-6.375%, due 6/1/29–6/1/51 |
| 9. | Los Angeles Unified School District, 3.00%-5.25%, due 7/1/25–7/1/42 |
| 10. | Sacramento Municipal Utility District, 4.00%-5.00%, due 8/15/37–8/15/45 |
| 8 | MainStay MacKay California Tax Free Opportunities Fund |
Portfolio Management Discussion and Analysis (Unaudited)
Questions answered by portfolio managers John Loffredo, CFA, Robert DiMella, CFA, Michael Petty, David Dowden, Scott Sprauer, Frances Lewis and Michael Denlinger, CFA, of MacKay Shields LLC, the Fund’s Subadvisor.
How did MainStay MacKay California Tax Free Opportunities Fund perform relative to its benchmark and peer group during the six months ended April 30, 2021?
For the six months ended April 30, 2021, Class I shares of MainStay MacKay California Tax Free Opportunities Fund returned 3.93%, outperforming the 2.09% return of the Fund’s primary benchmark, the Bloomberg Barclays California Municipal Bond Index (the "Index"). Over the same period, Class I shares also outperformed the 3.48% return of the Morningstar Muni California Long Category Average.1
Were there any changes to the Fund during the reporting period?
During the reporting period, Michael Denlinger was added as a portfolio manager of the Fund.
What factors affected the Fund’s relative performance during the reporting period?
During the reporting period, both tax-exempt and taxable investment-grade municipal bonds posted positive returns. However, the high-yield segment of the market outperformed both investment-grade and taxable municipal bonds as investors extended out the yield curve2and went down the rating scale looking for yield. Furthermore, performance in the long end outperformed short-end maturities.
In addition, municipal demand was revived with the availability of COVID-19 vaccines and the growing expectation of the potentially massive impact of the American Rescue Plan Act of 2021 on the fiscal health of states, local governments and an array of municipal government agencies and authorities.
During this period, the Fund outperformed the Bloomberg Barclays California Municipal Bond Index primarily due to security selection, which included selection among higher-quality bonds rated AAA to AA.3
In addition, security selection among non-rated holdings made a positive contribution to relative returns. (Contributions take weightings and total returns into account.) From a geographic perspective, overweight exposure to, and security selection among, Puerto Rico bonds contributed positively to relative performance. Among maturities, greater-than-30-year maturities assisted relative performance.
During the reporting period, how was the Fund’s performance materially affected by investments in derivatives?
During the reporting period, the Fund held a small position in U.S. Treasury futures that contributed positively to benchmark-relative performance.
What was the Fund’s duration4 strategy during the reporting period?
The Fund's duration was targeted to remain in a neutral range relative to the Fund's investable universe as outlined in the Prospectus. In addition to investment grade California bonds, the Fund may also invest in bonds of U.S. territories (Puerto Rico, Guam and the U.S.Virgin Islands) and up to 20% of net assets in securities below investment grade. Since the Fund's investable universe is broader than the Bloomberg Barclays California Municipal Bond Index, the Fund's duration may also differ from that of the Index.
During the reporting period, the Fund maintained a longer duration posture than the benchmark. As of April 30, 2021, the Fund’s modified duration to worst5 was 5.66 years, while the Bloomberg Barclays California Municipal Bond Index had a modified duration to worst of 4.99 years.
During the reporting period, which sectors were the strongest positive contributors to the Fund’s relative performance and which sectors were particularly weak?
During the reporting period, security selection among the Fund’s local and state general obligation and education holdings made a positive contribution to relative performance. Meanwhile, the Fund’s cash position was the most significant drag on relative performance, along with underweight exposure to transportation and security selection in the housing sector.
What were some of the Fund’s largest purchases and sales during the reporting period?
The Fund remained focused on diversification and liquidity, so no individual purchase or sale was considered to be significant, although sector overweights or security structure, in their entirety, would have an impact.
| 1. | See page 5 for other share class returns, which may be higher or lower than Class I share returns. See page 6 for more information on benchmark and peer group returns. |
| 2. | The yield curve is a line that plots the yields of various securities of similar quality—typically U.S. Treasury issues—across a range of maturities. The U.S. Treasury yield curve serves as a benchmark for other debt and is used in economic forecasting. |
| 3. | An obligation rated ‘AAA’ has the highest rating assigned by Standard & Poor’s (“S&P”), and in the opinion of S&P, the obligor’s capacity to meet its financial commitment on the obligation is extremely strong. An obligation rated ‘AA’ by S&P is deemed by S&P to differ from the highest-rated obligations only to a small degree. In the opinion of S&P, the obligor's capacity to meet its financial commitment on the obligation is very strong. When applied to Fund holdings, ratings are based solely on the creditworthiness of the bonds in the portfolio and are not meant to represent the security or safety of the Fund. |
| 4. | Duration is a measure of the price sensitivity of a fixed-income investment to changes in interest rates. Duration is expressed as a number of years and is considered a more accurate sensitivity gauge than average maturity. |
How did the Fund’s sector weightings change during the reporting period?
During the reporting period, there were no material changes to the Fund’s sector allocations. There was an increased allocation to the state general obligation, housing and resource recovery sectors. Conversely, there was a decreased allocation to the local general obligation, prerefunded/ETM (escrowed to maturity) and special tax sectors. Moreover, the Fund increased its state/territory exposure to Puerto Rico during the reporting period. Lastly, the Fund increased its credit exposure to credits rated BB and CC during the reporting period, while decreasing its exposure to credits rated AA and B.6
How was the Fund positioned at the end of the reporting period?
As of April 30, 2021, the Fund held an overweight position relative to the Bloomberg Barclays California Municipal Bond Index in the local general obligation and special tax sectors. In addition, the Fund held overweight exposure to bonds from Puerto Rico and non-investment grade credit, which are not included in the benchmark.
As of the same date, the Fund held relatively underweight exposure to the state general obligation and prerefunded/ETM sectors. Other underweight exposures included AA-rated securities and bonds with maturities of five-to-ten years.
| 6. | An obligation rated ‘BB’ by S&P is deemed by S&P to be less vulnerable to nonpayment than other speculative issues. In the opinion of S&P, however, the obligor faces major ongoing uncertainties or exposure to adverse business, financial or economic conditions which could lead to the obligor’s inadequate capacity to meet its financial commitment on the obligation. An obligation rated ‘B’ by S&P is deemed by S&P to be more vulnerable to nonpayment than obligations rated ‘BB’, but in the opinion of S&P, the obligor currently has the capacity to meet its financial commitment on the obligation. It is the opinion of S&P that adverse business, financial, or economic conditions will likely impair the obligor's capacity or willingness to meet its financial commitment on the obligation. An obligation rated 'CC' by S&P is deemed by S&P to be currently highly vulnerable to nonpayment. The 'CC' rating is used when a default has not yet occurred, but S&P expects default to be a virtual certainty, regardless of the anticipated time to default. When applied to Fund holdings, ratings are based solely on the creditworthiness of the bonds in the portfolio and are not meant to represent the security or safety of the Fund. |
The opinions expressed are those of the portfolio managers as of the date of this report and are subject to change. There is no guarantee that any forecasts will come to pass. This material does not constitute investment advice and is not intended as an endorsement of any specific investment.
| 10 | MainStay MacKay California Tax Free Opportunities Fund |
Portfolio of Investments April 30, 2021† (Unaudited)
| | Principal
Amount | Value |
| Municipal Bonds 95.8% |
| Long-Term Municipal Bonds 93.2% |
| Certificate of Participation/Lease 0.9% |
| City of Newark CA, Financing Project, Certificates of Participation | | |
| 3.00%, due 6/1/39 | $ 3,550,000 | $ 3,790,592 |
| 3.00%, due 6/1/40 | 3,560,000 | 3,794,104 |
| 3.00%, due 6/1/41 | 650,000 | 690,984 |
| Mesa Water District, Certificate of Participation | | |
| 4.00%, due 3/15/45 | 1,450,000 | 1,718,629 |
| Oxnard School District, COPS, Property Acquisition and Improvement Project, Certificate of Participation | | |
| Insured: BAM | | |
| 2.00%, due 8/1/45 (a) | 1,000,000 | 1,110,539 |
| | | 11,104,848 |
| Development 0.3% |
| California Statewide Communities Development Authority, Buck Institute for Research on Aging, Revenue Bonds | | |
| Insured: AGM | | |
| 5.00%, due 11/15/49 | 1,000,000 | 1,168,785 |
| City of Irvine CA, Reassessment District No. 19-1, Special Assessment | | |
| 5.00%, due 9/2/44 | 1,800,000 | 2,266,025 |
| | | 3,434,810 |
| Education 6.4% |
| California Educational Facilities Authority, Claremont Mckenna College, Revenue Bonds | | |
| Series A | | |
| 4.00%, due 1/1/39 | 1,800,000 | 2,016,371 |
| California Educational Facilities Authority, Loma Linda University, Revenue Bonds | | |
| Series A | | |
| 5.00%, due 4/1/23 | 570,000 | 621,397 |
| Series A | | |
| 5.00%, due 4/1/24 | 280,000 | 317,192 |
| | Principal
Amount | Value |
| |
| Education (continued) |
| California Educational Facilities Authority, Loyola Marymount University, Green Bond, Revenue Bonds | | |
| Series B | | |
| 5.00%, due 10/1/31 | $ 525,000 | $ 664,456 |
| Series B | | |
| 5.00%, due 10/1/35 | 640,000 | 799,369 |
| California Educational Facilities Authority, Mount St. Mary's University, Revenue Bonds | | |
| Series A | | |
| 5.00%, due 10/1/38 | 620,000 | 766,649 |
| California Enterprise Development Authority, Thacher School Project (The), Revenue Bonds | | |
| 4.00%, due 9/1/44 | 3,450,000 | 4,023,231 |
| California Infrastructure and Economic Development Bank, Equitable School Revolving Fund LLC Obligated Group, Revenue Bonds | | |
| Series B | | |
| 5.00%, due 11/1/39 | 300,000 | 369,974 |
| Series B | | |
| 5.00%, due 11/1/44 | 350,000 | 427,519 |
| Series B | | |
| 5.00%, due 11/1/49 | 500,000 | 608,822 |
| California Infrastructure and Economic Development Bank, Equitable School Revolving Fund LLC Obligated Group, Green Bond, Revenue Bonds | | |
| Series B | | |
| 4.00%, due 11/1/45 | 850,000 | 991,748 |
| Series B | | |
| 4.00%, due 11/1/55 | 915,000 | 1,062,536 |
| California Infrastructure and Economic Development Bank, Wonderful Foundations Charter School Portfolio Project, Revenue Bonds | | |
| Series A | | |
| 5.00%, due 1/1/55 (b) | 2,645,000 | 3,020,254 |
| California Municipal Finance Authority, California Baptist University, Revenue Bonds | | |
| Series A | | |
| 5.00%, due 11/1/46 (b) | 1,000,000 | 1,118,283 |
The notes to the financial statements are an integral part of, and should be read in conjunction with, the financial statements.
11
Portfolio of Investments April 30, 2021† (Unaudited) (continued)
| | Principal
Amount | Value |
| Long-Term Municipal Bonds (continued) |
| Education (continued) |
| California Municipal Finance Authority, California Lutheran University, Revenue Bonds | | |
| 5.00%, due 10/1/31 | $ 235,000 | $ 291,970 |
| 5.00%, due 10/1/33 | 225,000 | 277,822 |
| 5.00%, due 10/1/35 | 225,000 | 276,414 |
| 5.00%, due 10/1/36 | 285,000 | 349,186 |
| 5.00%, due 10/1/37 | 310,000 | 379,091 |
| California Municipal Finance Authority, Charter School, King Chavez Academy, Revenue Bonds (b) | | |
| Series A | | |
| 5.00%, due 5/1/36 | 1,275,000 | 1,396,732 |
| Series A | | |
| 5.00%, due 5/1/46 | 1,325,000 | 1,432,316 |
| California Municipal Finance Authority, Charter School, Palmdale Aerospace Academy Projects (The), Revenue Bonds (b) | | |
| Series A | | |
| 5.00%, due 7/1/36 | 1,300,000 | 1,447,668 |
| Series A | | |
| 5.00%, due 7/1/46 | 795,000 | 871,627 |
| California Municipal Finance Authority, Claremont Graduate University, Revenue Bonds | | |
| Series B | | |
| 5.00%, due 10/1/54 (b) | 1,380,000 | 1,582,807 |
| California Municipal Finance Authority, Creative Center Los Altos Project (The), Revenue Bonds (b) | | |
| Series B | | |
| 4.00%, due 11/1/36 | 400,000 | 409,511 |
| Series B | | |
| 4.50%, due 11/1/46 | 1,600,000 | 1,649,436 |
| California Municipal Finance Authority, National University, Revenue Bonds | | |
| Series A | | |
| 5.00%, due 4/1/31 | 1,000,000 | 1,278,010 |
| California Municipal Finance Authority, Partnerships to Uplift Community Project, Revenue Bonds | | |
| Series A | | |
| 5.30%, due 8/1/47 | 500,000 | 511,489 |
| California Municipal Finance Authority, Pomona College, Revenue Bonds | | |
| 4.00%, due 1/1/43 | 10,000,000 | 12,034,836 |
| | Principal
Amount | Value |
| |
| Education (continued) |
| California Municipal Finance Authority, Southern California Institute of Architecture Project, Revenue Bonds | | |
| 5.00%, due 12/1/38 | $ 845,000 | $ 974,715 |
| California Public Finance Authority, California University of Science & Medicine Obligated Group, Revenue Bonds | | |
| Series A | | |
| 6.25%, due 7/1/54 (b) | 1,000,000 | 1,145,226 |
| California School Facilities Financing Authority, Azusa Unified School District, Revenue Bonds | | |
| Insured: AGM | | |
| (zero coupon), due 8/1/49 | 7,905,000 | 2,607,218 |
| California School Finance Authority, Revenue Bonds | | |
| Series A | | |
| 5.00%, due 7/1/37 (b) | 500,000 | 570,001 |
| California School Finance Authority, Aspire Public Schools Obligated Group, Revenue Bonds (b) | | |
| 5.00%, due 8/1/27 | 500,000 | 581,959 |
| 5.00%, due 8/1/28 | 700,000 | 810,113 |
| 5.00%, due 8/1/36 | 600,000 | 682,832 |
| 5.00%, due 8/1/41 | 750,000 | 852,456 |
| 5.00%, due 8/1/46 | 975,000 | 1,108,365 |
| California School Finance Authority, Classical Academies Project, Revenue Bonds | | |
| Series A | | |
| 5.00%, due 10/1/37 (b) | 1,485,000 | 1,754,047 |
| California School Finance Authority, Grimmway Schools Obligated Group, Revenue Bonds | | |
| Series A | | |
| 5.00%, due 7/1/46 (b) | 750,000 | 818,539 |
| California School Finance Authority, High Tech High Learning Project, Revenue Bonds | | |
| Series A | | |
| 5.00%, due 7/1/49 (b) | 500,000 | 559,707 |
| California School Finance Authority, Kipp Social Public Schools Project, Revenue Bonds | | |
| Series A | | |
| 5.00%, due 7/1/34 | 600,000 | 664,052 |
The notes to the financial statements are an integral part of, and should be read in conjunction with, the financial statements.
| 12 | MainStay MacKay California Tax Free Opportunities Fund |
| | Principal
Amount | Value |
| Long-Term Municipal Bonds (continued) |
| Education (continued) |
| California State University, Systemwide, Revenue Bonds | | |
| Series A | | |
| 4.00%, due 11/1/37 | $ 2,375,000 | $ ���2,706,309 |
| California Statewide Communities Development Authority, Lancer Plaza Project, Revenue Bonds | | |
| 5.875%, due 11/1/43 | 1,000,000 | 1,078,017 |
| Del Mar Union School District Community Facilities District No. 99-1, Special Tax | | |
| Insured: BAM | | |
| 4.00%, due 9/1/44 | 1,450,000 | 1,666,773 |
| Irvine Unified School District, Community Facilities District No. 9, Special Tax | | |
| Series A | | |
| 5.00%, due 9/1/33 | 410,000 | 531,578 |
| Series A | | |
| 5.00%, due 9/1/34 | 225,000 | 290,713 |
| Series A | | |
| 5.00%, due 9/1/36 | 550,000 | 703,970 |
| Rio Elementary School District Community Facilities District, Special Tax, Special Tax | | |
| Insured: BAM | | |
| 5.00%, due 9/1/35 | 500,000 | 595,320 |
| University of California, Revenue Bonds | | |
| Series BE | | |
| 4.00%, due 5/15/47 | 6,500,000 | 7,700,252 |
| University of California, Limited Project, Revenue Bonds | | |
| Series Q | | |
| 3.00%, due 5/15/51 | 7,500,000 | 7,959,980 |
| | | 77,358,858 |
| General 1.4% |
| Cathedral City Redevelopment Agency, Merged Redevelopment Project Area, Tax Allocation | | |
| Series A, Insured: AGM | | |
| 5.00%, due 8/1/26 | 1,000,000 | 1,128,497 |
| Series A, Insured: AGM | | |
| 5.00%, due 8/1/34 | 1,000,000 | 1,127,376 |
| | Principal
Amount | Value |
| |
| General (continued) |
| City of Irvine CA, Community Facilities District No. 2013-3, Special Tax | | |
| 5.00%, due 9/1/49 | $ 1,385,000 | $ 1,541,136 |
| City of Rocklin CA, Community Facilities District No. 10, Special Tax | | |
| 5.00%, due 9/1/39 | 1,150,000 | 1,288,680 |
| Greenfield Redevelopment Agency, Tax Allocation | | |
| Insured: BAM | | |
| 4.00%, due 2/1/26 | 285,000 | 328,573 |
| Madera Redevelopment Agency, Successor Agency, Tax Allocation | | |
| Series A | | |
| 5.00%, due 9/1/37 | 1,180,000 | 1,465,196 |
| Mountain View Shoreline Regional Park Community, Tax Allocation | | |
| Series A, Insured: AGM | | |
| 5.00%, due 8/1/36 | 1,645,000 | 2,047,786 |
| Riverside County Public Financing Authority, Desert Communities And Interstate 215 Corridor Projects, Tax Allocation | | |
| Series A, Insured: BAM | | |
| 4.00%, due 10/1/40 | 1,000,000 | 1,125,380 |
| Riverside County Public Financing Authority, Project Area No. 1 Desert Communities & Interstate 215 Corridor Project, Tax Allocation | | |
| Series A, Insured: BAM | | |
| 4.00%, due 10/1/32 | 1,050,000 | 1,154,224 |
| San Francisco City & County Redevelopment Agency, Mission Bay South Redevelopment Project, Tax Allocation | | |
| Series C | | |
| 5.00%, due 8/1/36 | 1,250,000 | 1,460,198 |
| South Orange County Public Financing Authority, Special Tax, Senior Lien | | |
| Series A | | |
| 5.00%, due 8/15/32 | 775,000 | 799,514 |
| Transbay Joint Powers Authority, Green Bond, Tax Allocation, Senior Lien | | |
| Series A | | |
| 5.00%, due 10/1/45 | 1,000,000 | 1,237,614 |
The notes to the financial statements are an integral part of, and should be read in conjunction with, the financial statements.
13
Portfolio of Investments April 30, 2021† (Unaudited) (continued)
| | Principal
Amount | Value |
| Long-Term Municipal Bonds (continued) |
| General (continued) |
| Transbay Joint Powers Authority, Green Bond, Tax Allocation, Senior Lien (continued) | | |
| Series A | | |
| 5.00%, due 10/1/49 | $ 1,200,000 | $ 1,479,020 |
| | | 16,183,194 |
| General Obligation 36.2% |
| Alta Loma School District, Unlimited General Obligation | | |
| Series B | | |
| 5.00%, due 8/1/44 | 3,375,000 | 4,188,589 |
| Banning Unified School District, Election 2016, Unlimited General Obligation | | |
| Series A, Insured: AGM | | |
| 4.00%, due 8/1/46 | 500,000 | 559,097 |
| Beaumont Unified School District, Election 2008, Unlimited General Obligation | | |
| Series F | | |
| 2.50%, due 8/1/46 | 1,000,000 | 1,004,779 |
| Series D, Insured: BAM | | |
| 5.25%, due 8/1/44 | 1,000,000 | 1,236,845 |
| Brawley Union High School District, Election 2018, Unlimited General Obligation | | |
| Series A, Insured: BAM | | |
| 5.00%, due 8/1/44 | 1,280,000 | 1,536,179 |
| Cabrillo Unified School District, Election 2018, Unlimited General Obligation | | |
| Series A | | |
| 5.00%, due 8/1/45 | 4,245,000 | 5,044,486 |
| Campbell Union High School District, Election 2016, Unlimited General Obligation | | |
| Series B | | |
| 4.00%, due 8/1/38 | 2,500,000 | 2,849,720 |
| Central Union High School District, Election 2016, Unlimited General Obligation | | |
| 5.25%, due 8/1/46 | 2,000,000 | 2,435,970 |
| Ceres Unified School District, Unlimited General Obligation | | |
| Insured: BAM | | |
| (zero coupon), due 8/1/37 | 500,000 | 294,036 |
| | Principal
Amount | Value |
| |
| General Obligation (continued) |
| Chaffey Joint Union High School District, Unlimited General Obligation | | |
| Series D | | |
| 4.00%, due 8/1/49 | $ 5,000,000 | $ 5,769,666 |
| Chino Valley Unified School District, Election 2016, Limited General Obligation | | |
| Series B | | |
| 3.375%, due 8/1/50 | 3,050,000 | 3,382,409 |
| Series B | | |
| 4.00%, due 8/1/45 | 1,000,000 | 1,186,194 |
| Chowchilla Elementary School District, Madera County, Unlimited General Obligation | | |
| Series B | | |
| 5.00%, due 8/1/43 | 960,000 | 1,146,722 |
| City & County of San Francisco, Unlimited General Obligation | | |
| Series R-1 | | |
| 4.00%, due 6/15/32 | 1,000,000 | 1,206,947 |
| City of Foster City CA, Levee Protection Planning & Improvements Project, Unlimited General Obligation | | |
| 3.00%, due 8/1/45 | 2,500,000 | 2,643,943 |
| Coast Community College District, Election 2012, Unlimited General Obligation | | |
| Series D | | |
| 4.50%, due 8/1/39 | 500,000 | 602,340 |
| Commonwealth of Puerto Rico, Unlimited General Obligation | | |
| Series A | | |
| 5.25%, due 7/1/37 (c)(d) | 5,000,000 | 4,431,250 |
| Commonwealth of Puerto Rico, Public Improvement, Unlimited General Obligation | | |
| Insured: AMBAC | | |
| 4.50%, due 7/1/23 | 330,000 | 330,499 |
| Series A, Insured: AGC | | |
| 5.00%, due 7/1/23 | 270,000 | 277,530 |
| Series A-4, Insured: AGM | | |
| 5.00%, due 7/1/31 | 410,000 | 421,434 |
| Series A, Insured: AGM | | |
| 5.00%, due 7/1/35 | 2,175,000 | 2,262,767 |
| Series A | | |
| 5.25%, due 7/1/23 (c)(d) | 1,890,000 | 1,675,012 |
The notes to the financial statements are an integral part of, and should be read in conjunction with, the financial statements.
| 14 | MainStay MacKay California Tax Free Opportunities Fund |
| | Principal
Amount | Value |
| Long-Term Municipal Bonds (continued) |
| General Obligation (continued) |
| Commonwealth of Puerto Rico, Public Improvement, Unlimited General Obligation (continued) | | |
| Series C, Insured: AGM | | |
| 5.25%, due 7/1/26 | $ 445,000 | $ 450,162 |
| Series A-4, Insured: AGM | | |
| 5.25%, due 7/1/30 | 175,000 | 180,084 |
| Series A, Insured: AGM | | |
| 5.50%, due 7/1/27 | 620,000 | 627,195 |
| Series E | | |
| 5.50%, due 7/1/31 (c)(d) | 900,000 | 788,625 |
| Compton Unified School District, Unlimited General Obligation | | |
| Series B, Insured: BAM | | |
| 3.00%, due 6/1/49 | 3,125,000 | 3,241,753 |
| Corona-Norco Unified School District, Election 2014, Unlimited General Obligation | | |
| Series C | | |
| 4.00%, due 8/1/49 | 935,000 | 1,069,343 |
| Cuyama Joint Unified School District, Election 2016, Unlimited General Obligation | | |
| Series B, Insured: AGM | | |
| 5.25%, due 8/1/48 | 500,000 | 606,141 |
| Davis Joint Unified School District, Unlimited General Obligation | | |
| Insured: BAM | | |
| 3.00%, due 8/1/38 | 4,190,000 | 4,507,627 |
| Insured: BAM | | |
| 3.00%, due 8/1/41 | 4,695,000 | 5,019,347 |
| Denair Unified School District, Election 2007, Unlimited General Obligation | | |
| Insured: AGM | | |
| (zero coupon), due 8/1/41 | 4,260,000 | 2,336,846 |
| Desert Sands Unified School District, Unlimited General Obligation | | |
| 2.00%, due 8/1/40 | 1,100,000 | 1,090,278 |
| Dublin Unified School District, Green Bond, Unlimited General Obligation | | |
| Series C | | |
| 3.00%, due 8/1/41 | 3,000,000 | 3,296,776 |
| El Monte Union High School District, Unlimited General Obligation | | |
| Series A | | |
| 4.00%, due 6/1/38 | 1,195,000 | 1,368,619 |
| | Principal
Amount | Value |
| |
| General Obligation (continued) |
| El Rancho Unified School District, Election 2016, Unlimited General Obligation | | |
| Series A, Insured: BAM | | |
| 5.25%, due 8/1/46 | $ 2,745,000 | $ 3,440,216 |
| El Segundo Unified School District, Unlimited General Obligation | | |
| Series B | | |
| 2.00%, due 8/1/46 | 1,510,000 | 1,416,022 |
| Series B | | |
| 2.00%, due 8/1/47 | 1,675,000 | 1,563,808 |
| Series B | | |
| 2.00%, due 8/1/48 | 400,000 | 371,761 |
| Series B | | |
| 2.125%, due 8/1/50 | 5,575,000 | 5,273,473 |
| Enterprise Elementary School District, Unlimited General Obligation | | |
| Series B, Insured: AGM | | |
| 5.00%, due 8/1/49 | 4,130,000 | 4,868,774 |
| Etiwanda School District, Election of 2016, Unlimited General Obligation | | |
| Series A | | |
| 4.00%, due 8/1/49 | 2,000,000 | 2,307,374 |
| Eureka City Schools, Unlimited General Obligation | | |
| Insured: BAM | | |
| 4.00%, due 8/1/49 | 3,500,000 | 4,041,343 |
| Folsom Cordova Unified School District School Facilities Improvement Dist No. 5, Election 2014, Unlimited General Obligation | | |
| Series A | | |
| 5.25%, due 10/1/35 | 4,710,000 | 5,659,653 |
| Fresno Unified School District, Election 2010, Unlimited General Obligation | | |
| Series F | | |
| 4.00%, due 8/1/32 | 1,475,000 | 1,704,711 |
| Glendale Community College District, Unlimited General Obligation | | |
| Series B | | |
| 3.00%, due 8/1/47 | 6,500,000 | 6,900,016 |
| Hartnell Community College District, Unlimited General Obligation | | |
| Series A | | |
| (zero coupon), due 8/1/37 | 2,500,000 | 1,422,738 |
| Series B | | |
| 3.00%, due 8/1/38 | 375,000 | 409,541 |
The notes to the financial statements are an integral part of, and should be read in conjunction with, the financial statements.
15
Portfolio of Investments April 30, 2021† (Unaudited) (continued)
| | Principal
Amount | Value |
| Long-Term Municipal Bonds (continued) |
| General Obligation (continued) |
Hartnell Community College District, Unlimited General Obligation
(continued) | | |
| Series B | | |
| 3.00%, due 8/1/40 | $ 525,000 | $ 567,372 |
| Series B | | |
| 3.00%, due 8/1/45 | 3,500,000 | 3,712,119 |
| Holtville Unified School District, Unlimited General Obligation | | |
| Series A, Insured: AGM | | |
| 5.00%, due 8/1/44 | 1,240,000 | 1,590,084 |
| Huntington Beach City School District, Election 2016, Unlimited General Obligation | | |
| Series B | | |
| 4.00%, due 8/1/44 | 1,525,000 | 1,722,715 |
| Series B | | |
| 4.00%, due 8/1/48 | 1,500,000 | 1,688,601 |
| Inglewood Unified School District, Unlimited General Obligation | | |
| Series C, Insured: BAM | | |
| 5.00%, due 8/1/32 | 400,000 | 492,023 |
| Series C, Insured: BAM | | |
| 5.00%, due 8/1/34 | 585,000 | 720,005 |
| Inglewood Unified School District, Election 2012, Unlimited General Obligation | | |
| Series B, Insured: BAM | | |
| 5.00%, due 8/1/25 | 250,000 | 296,471 |
| Series B, Insured: BAM | | |
| 5.00%, due 8/1/35 | 800,000 | 952,011 |
| Jefferson Union High School District, Unlimited General Obligation | | |
| Series A | | |
| 4.00%, due 8/1/45 | 1,250,000 | 1,422,684 |
| Jurupa Unified School District, Unlimited General Obligation | | |
| Series B | | |
| 5.00%, due 8/1/33 | 1,555,000 | 1,939,386 |
| Series B | | |
| 5.00%, due 8/1/37 | 1,000,000 | 1,238,712 |
| Jurupa Unified School District, Election 2014, Unlimited General Obligation | | |
| Series C | | |
| 4.00%, due 8/1/43 | 1,675,000 | 1,951,391 |
| | Principal
Amount | Value |
| |
| General Obligation (continued) |
| Jurupa Unified School District, Election 2014, Unlimited General Obligation (continued) | | |
| Series C | | |
| 5.25%, due 8/1/43 | $ 2,000,000 | $ 2,525,422 |
| Kerman Unified School District, Election 2016, Unlimited General Obligation | | |
| Insured: BAM | | |
| 5.25%, due 8/1/46 | 1,755,000 | 2,199,483 |
| Kern Community College District, Facilities Improvement District No. 1, Unlimited General Obligation | | |
| (zero coupon), due 8/1/23 | 2,000,000 | 1,984,080 |
| Kern Community College District, Safety Repair & Improvement, Unlimited General Obligation | | |
| Series C | | |
| 5.75%, due 11/1/34 | 650,000 | 739,793 |
| Lemoore Union High School District, Election 2016, Unlimited General Obligation | | |
| Series A | | |
| 5.50%, due 8/1/42 | 560,000 | 713,435 |
| Lennox School District, Election 2016, Unlimited General Obligation | | |
| Insured: AGM | | |
| 4.00%, due 8/1/47 | 3,000,000 | 3,325,593 |
| Livermore Valley Joint Unified School District, Unlimited General Obligation | | |
| 3.00%, due 8/1/40 | 2,890,000 | 3,054,395 |
| Local Public Schools Funding Authority School Improvement District No. 2016-1, Unlimited General Obligation | | |
| Series A, Insured: BAM | | |
| 3.00%, due 8/1/37 | 1,000,000 | 1,073,384 |
| Series A, Insured: BAM | | |
| 3.00%, due 8/1/38 | 1,250,000 | 1,336,006 |
| Series A, Insured: BAM | | |
| 3.00%, due 8/1/40 | 1,230,000 | 1,306,898 |
| Lodi Unified School District, Election of 2016, Unlimited General Obligation | | |
| Series 2020 | | |
| 3.00%, due 8/1/43 | 3,475,000 | 3,693,744 |
| Series 2020 | | |
| 4.00%, due 8/1/38 | 2,830,000 | 3,305,969 |
The notes to the financial statements are an integral part of, and should be read in conjunction with, the financial statements.
| 16 | MainStay MacKay California Tax Free Opportunities Fund |
| | Principal
Amount | Value |
| Long-Term Municipal Bonds (continued) |
| General Obligation (continued) |
Lodi Unified School District, Election of 2016, Unlimited General Obligation
(continued) | | |
| Series 2020 | | |
| 4.00%, due 8/1/39 | $ 1,300,000 | $ 1,515,875 |
| Long Beach Community College District, Unlimited General Obligation | | |
| Series C | | |
| 4.00%, due 8/1/49 | 3,000,000 | 3,464,008 |
| Long Beach Unified School District, Unlimited General Obligation | | |
| Series A | | |
| 4.00%, due 8/1/43 | 6,500,000 | 7,290,079 |
| Long Beach Unified School District, Election 2016, Unlimited General Obligation | | |
| Series A | | |
| 5.00%, due 8/1/32 | 3,985,000 | 4,852,996 |
| Series A | | |
| 5.00%, due 8/1/33 | 2,825,000 | 3,435,460 |
| Los Angeles Community College District, Unlimited General Obligation | | |
| Series I | | |
| 4.00%, due 8/1/33 | 2,865,000 | 3,356,208 |
| Series I | | |
| 4.00%, due 8/1/34 | 4,000,000 | 4,676,682 |
| Los Angeles Unified School District, Unlimited General Obligation | | |
| Series C | | |
| 3.00%, due 7/1/38 | 4,500,000 | 4,945,036 |
| Series C | | |
| 4.00%, due 7/1/33 | 3,125,000 | 3,887,140 |
| Series C | | |
| 4.00%, due 7/1/38 | 4,500,000 | 5,471,080 |
| Series A | | |
| 5.00%, due 7/1/25 | 1,250,000 | 1,490,890 |
| Los Angeles Unified School District, Election of 2005, Unlimited General Obligation | | |
| Series M-1 | | |
| 5.25%, due 7/1/42 | 2,990,000 | 3,744,506 |
| Los Rios Community College District, Unlimited General Obligation | | |
| Series D | | |
| 4.00%, due 8/1/35 | 250,000 | 290,068 |
| | Principal
Amount | Value |
| |
| General Obligation (continued) |
Los Rios Community College District, Unlimited General Obligation
(continued) | | |
| Series D | | |
| 4.00%, due 8/1/39 | $ 1,000,000 | $ 1,150,478 |
| Lucia Mar Unified School District, Unlimited General Obligation | | |
| Series C | | |
| 3.00%, due 8/1/47 | 7,000,000 | 7,468,952 |
| Series C | | |
| 4.00%, due 8/1/49 | 1,500,000 | 1,750,554 |
| Manteca Unified School District, Unlimited General Obligation | | |
| 4.00%, due 8/1/45 | 2,000,000 | 2,316,067 |
| Marysville Joint Unified School District, Election 2008, Unlimited General Obligation | | |
| Insured: AGM | | |
| (zero coupon), due 8/1/35 | 1,500,000 | 970,090 |
| Insured: AGM | | |
| (zero coupon), due 8/1/36 | 2,000,000 | 1,231,839 |
| Insured: AGM | | |
| (zero coupon), due 8/1/37 | 2,000,000 | 1,175,115 |
| Moraga Elementary School District, Election 2016, Unlimited General Obligation | | |
| Series B | | |
| 3.00%, due 8/1/44 | 1,335,000 | 1,410,095 |
| Moreno Valley Unified School District, Election 2014, Unlimited General Obligation | | |
| Series B, Insured: AGM | | |
| 5.00%, due 8/1/47 | 3,250,000 | 3,958,019 |
| Mount San Jacinto Community College District, Election 2014, Unlimited General Obligation | | |
| Series B | | |
| 4.00%, due 8/1/38 | 1,985,000 | 2,339,905 |
| Mountain View-Whisman School District, Election 2020, Unlimited General Obligation | | |
| Series A | | |
| 3.00%, due 9/1/34 | 505,000 | 575,458 |
| Series A | | |
| 3.00%, due 9/1/36 | 750,000 | 846,705 |
| Series A | | |
| 3.00%, due 9/1/40 | 1,160,000 | 1,280,171 |
The notes to the financial statements are an integral part of, and should be read in conjunction with, the financial statements.
17
Portfolio of Investments April 30, 2021† (Unaudited) (continued)
| | Principal
Amount | Value |
| Long-Term Municipal Bonds (continued) |
| General Obligation (continued) |
| Napa Valley Unified School District, Election 2016, Unlimited General Obligation | | |
| Series C, Insured: AGM | | |
| 4.00%, due 8/1/44 | $ 10,000,000 | $ 11,470,037 |
| Natomas Unified School District, Election 2018, Unlimited General Obligation | | |
| Series A, Insured: AGM | | |
| 4.00%, due 8/1/49 | 5,000,000 | 5,679,385 |
| Needles Unified School District, Capital Appreciation, Election 2008, Unlimited General Obligation | | |
| Series B, Insured: AGM | | |
| (zero coupon), due 8/1/45 (a) | 1,250,000 | 1,370,869 |
| Newport Mesa Unified School District, Capital, Appreciation, Election 2005, Unlimited General Obligation | | |
| Series 2007, Insured: NATL-RE | | |
| (zero coupon), due 8/1/30 | 4,000,000 | 3,520,880 |
| North Orange County Community College District, Election 2014, Unlimited General Obligation | | |
| Series B | | |
| 4.00%, due 8/1/32 | 450,000 | 553,055 |
| Series B | | |
| 4.00%, due 8/1/33 | 300,000 | 365,304 |
| Oceanside Unified School District, Unrefunded, Unlimited General Obligation | | |
| Series C | | |
| (zero coupon), due 8/1/51 | 25,000 | 3,936 |
| Oxnard Union High School District, Election 2018, Unlimited General Obligation | | |
| Series A | | |
| 4.00%, due 8/1/38 | 1,000,000 | 1,139,888 |
| Series B | | |
| 4.00%, due 8/1/42 | 1,500,000 | 1,733,464 |
| Palo Verde Community College District, Election 2014, Unlimited General Obligation | | |
| Series A, Insured: AGM | | |
| 4.00%, due 8/1/45 | 500,000 | 556,010 |
| | Principal
Amount | Value |
| |
| General Obligation (continued) |
| Palomar Community College District, Election 2006, Unlimited General Obligation | | |
| Series B | | |
| (zero coupon), due 8/1/39 (a) | $ 2,000,000 | $ 2,588,187 |
| Perris Union High School District, Election 2018, Unlimited General Obligation | | |
| Series A, Insured: AGM | | |
| 4.00%, due 9/1/38 | 3,550,000 | 4,230,366 |
| Redwood City School District, Election 2015, Unlimited General Obligation | | |
| Series C | | |
| 4.00%, due 8/1/44 | 1,800,000 | 2,110,226 |
| 5.25%, due 8/1/44 | 2,000,000 | 2,507,273 |
| Rio Hondo Community College District, Election 2004, Unlimited General Obligation | | |
| Series C | | |
| (zero coupon), due 8/1/42 (a) | 2,000,000 | 2,690,893 |
| Riverside Unified School District, Election 2016, Unlimited General Obligation | | |
| Series B | | |
| 4.00%, due 8/1/42 | 1,700,000 | 1,969,232 |
| Robla School District, Election 2018, Unlimited General Obligation | | |
| Series A, Insured: AGM | | |
| 4.00%, due 8/1/35 | 435,000 | 503,588 |
| Series A, Insured: AGM | | |
| 4.00%, due 8/1/36 | 500,000 | 577,477 |
| Series A, Insured: AGM | | |
| 4.00%, due 8/1/37 | 500,000 | 576,142 |
| Series A, Insured: AGM | | |
| 4.00%, due 8/1/40 | 2,070,000 | 2,369,804 |
| Series A, Insured: AGM | | |
| 5.00%, due 8/1/44 | 1,720,000 | 2,128,758 |
| San Bernardino City Unified School District, Election 2012, Unlimited General Obligation | | |
| Series F, Insured: AGM | | |
| 3.00%, due 8/1/44 | 3,500,000 | 3,731,291 |
| Series C, Insured: AGM | | |
| 5.00%, due 8/1/34 | 655,000 | 771,324 |
The notes to the financial statements are an integral part of, and should be read in conjunction with, the financial statements.
| 18 | MainStay MacKay California Tax Free Opportunities Fund |
| | Principal
Amount | Value |
| Long-Term Municipal Bonds (continued) |
| General Obligation (continued) |
| San Bernardino Community College District, Election 2018, Unlimited General Obligation | | |
| Series A | | |
| 4.00%, due 8/1/49 | $ 5,675,000 | $ 6,499,382 |
| San Diego Community College District, Unlimited General Obligation | | |
| 4.00%, due 8/1/36 | 6,000,000 | 6,881,001 |
| San Diego Unified School District, Unlimited General Obligation | | |
| Series D-2 | | |
| 2.00%, due 7/1/45 | 1,245,000 | 1,173,343 |
| San Diego Unified School District, Election 2012, Unlimited General Obligation | | |
| Series I | | |
| 4.00%, due 7/1/34 | 1,000,000 | 1,173,223 |
| San Francisco Bay Area Rapid Transit District, Election 2004, Green Bond, Unlimited General Obligation | | |
| Series F-1 | | |
| 3.00%, due 8/1/37 | 1,505,000 | 1,663,403 |
| Series F-1 | | |
| 3.00%, due 8/1/38 | 2,590,000 | 2,842,571 |
| San Francisco Bay Area Rapid Transit District, Election 2016, Green Bond, Unlimited General Obligation | | |
| Series B-1 | | |
| 4.00%, due 8/1/37 | 9,695,000 | 11,810,633 |
| San Francisco Bay Area Rapid Transit District, Green Bonds, Unlimited General Obligation | | |
| Series C-1 | | |
| 3.00%, due 8/1/50 | 4,000,000 | 4,260,820 |
| San Francisco Community College District, Election 2020, Unlimited General Obligation | | |
| 3.00%, due 6/15/45 | 5,000,000 | 5,310,929 |
| San Jose Evergreen Community College District, Election 2016, Unlimited General Obligation | | |
| Series B | | |
| 3.00%, due 9/1/38 | 1,500,000 | 1,641,516 |
| Series B | | |
| 3.00%, due 9/1/39 | 2,250,000 | 2,457,113 |
| | Principal
Amount | Value |
| |
| General Obligation (continued) |
San Jose Evergreen Community College District, Election 2016, Unlimited General Obligation
(continued) | | |
| Series B | | |
| 3.00%, due 9/1/40 | $ 2,500,000 | $ 2,724,947 |
| San Leandro Unified School District, Election 2016, Unlimited General Obligation | | |
| Series B, Insured: BAM | | |
| 5.00%, due 8/1/35 | 500,000 | 630,741 |
| Series B, Insured: BAM | | |
| 5.00%, due 8/1/36 | 1,955,000 | 2,459,723 |
| Series A, Insured: BAM | | |
| 5.25%, due 8/1/42 | 1,000,000 | 1,247,891 |
| San Lorenzo Valley Unified School District, Election 2020, Unlimited General Obligation | | |
| Series A | | |
| 4.00%, due 8/1/45 | 1,000,000 | 1,158,034 |
| Series A | | |
| 5.00%, due 8/1/50 | 2,005,000 | 2,464,289 |
| San Mateo Union High School District, Election 2020, Unlimited General Obligation | | |
| Series A | | |
| 2.25%, due 9/1/42 | 2,000,000 | 2,019,135 |
| San Rafael City Elementary School District, Election 2005, Unlimited General Obligation | | |
| Series C | | |
| 4.00%, due 8/1/47 | 1,720,000 | 1,955,493 |
| San Ysidro School District, Unlimited General Obligation | | |
| Insured: AGM | | |
| (zero coupon), due 8/1/47 | 3,000,000 | 864,643 |
| San Ysidro School District, Election 2020, Unlimited General Obligation | | |
| Series A, Insured: BAM | | |
| 4.00%, due 8/1/40 | 975,000 | 1,116,742 |
| Series A, Insured: BAM | | |
| 4.00%, due 8/1/45 | 2,320,000 | 2,630,741 |
| Sanger Unified School District, Election 2018, Unlimited General Obligation | | |
| Series B, Insured: BAM | | |
| 3.00%, due 8/1/45 | 500,000 | 527,539 |
The notes to the financial statements are an integral part of, and should be read in conjunction with, the financial statements.
19
Portfolio of Investments April 30, 2021† (Unaudited) (continued)
| | Principal
Amount | Value |
| Long-Term Municipal Bonds (continued) |
| General Obligation (continued) |
| Santa Barbara Unified School District, Election 2010, Unlimited General Obligation | | |
| Series A | | |
| (zero coupon), due 8/1/36 (a) | $ 1,000,000 | $ 1,456,537 |
| Santa Barbara Unified School District, Election 2016, Unlimited General Obligation | | |
| Series B | | |
| 4.00%, due 8/1/42 | 2,750,000 | 3,202,453 |
| Santa Monica Community College District, Election 2016, Unlimited General Obligation | | |
| Series A | | |
| 4.00%, due 8/1/47 | 1,250,000 | 1,459,937 |
| Santa Monica-Malibu Unified School District, School Facilities Improvement District No. 1, Unlimited General Obligation | | |
| Series A | | |
| 4.00%, due 8/1/39 | 1,015,000 | 1,198,261 |
| Santee School District, Unlimited General Obligation | | |
| 5.00%, due 8/1/48 | 2,205,000 | 2,737,002 |
| Shasta Union High School District, Election 2016, Unlimited General Obligation | | |
| 4.00%, due 8/1/44 | 1,135,000 | 1,289,998 |
| 5.25%, due 8/1/43 | 1,000,000 | 1,258,969 |
| Simi Valley Unified School District, Election 2016, Unlimited General Obligation | | |
| Series B | | |
| 4.00%, due 8/1/33 | 175,000 | 206,038 |
| Series B | | |
| 4.00%, due 8/1/38 | 370,000 | 431,018 |
| Series B | | |
| 4.00%, due 8/1/39 | 350,000 | 406,977 |
| Series B | | |
| 4.00%, due 8/1/40 | 1,455,000 | 1,689,218 |
| Series B | | |
| 5.00%, due 8/1/42 | 1,375,000 | 1,705,487 |
| Series B | | |
| 5.00%, due 8/1/44 | 1,200,000 | 1,489,276 |
| | Principal
Amount | Value |
| |
| General Obligation (continued) |
| Southwestern Community College District, Unlimited General Obligation | | |
| Series A | | |
| 4.00%, due 8/1/47 | $ 2,000,000 | $ 2,273,829 |
| State of California, Unlimited General Obligation | | |
| 4.00%, due 9/1/34 | 3,500,000 | 4,067,071 |
| 4.00%, due 3/1/36 | 5,000,000 | 6,070,606 |
| State of California, Various Purposes, Unlimited General Obligation | | |
| 3.00%, due 11/1/34 | 3,750,000 | 4,269,709 |
| 4.00%, due 3/1/40 | 3,500,000 | 4,203,803 |
| 4.00%, due 3/1/46 | 3,000,000 | 3,551,919 |
| 5.00%, due 11/1/27 | 2,380,000 | 3,033,402 |
| 5.00%, due 4/1/28 | 2,930,000 | 3,765,926 |
| 5.00%, due 8/1/37 | 2,900,000 | 3,682,859 |
| Tahoe Forest Hospital District, California Hospital District, Unlimited General Obligation | | |
| 5.00%, due 8/1/29 | 1,815,000 | 2,171,481 |
| Temecula Valley Unified School District, Election 2012, Unlimited General Obligation | | |
| Series C | | |
| 5.25%, due 8/1/44 | 1,000,000 | 1,201,221 |
| Turlock Unified School District, School Facilities Improvement District No. 1, Unlimited General Obligation | | |
| 4.00%, due 8/1/33 | 480,000 | 555,052 |
| 4.00%, due 8/1/34 | 515,000 | 594,082 |
| 4.00%, due 8/1/35 | 545,000 | 625,982 |
| Vacaville Unified School District, Election 2014, Unlimited General Obligation | | |
| Series D | | |
| 4.00%, due 8/1/30 | 200,000 | 243,914 |
| Series C | | |
| 4.00%, due 8/1/31 | 490,000 | 569,004 |
| Series C | | |
| 4.00%, due 8/1/32 | 555,000 | 643,592 |
| Series C | | |
| 4.00%, due 8/1/33 | 625,000 | 723,418 |
| Series D | | |
| 4.00%, due 8/1/36 | 300,000 | 354,019 |
| Series D | | |
| 4.00%, due 8/1/37 | 300,000 | 353,084 |
The notes to the financial statements are an integral part of, and should be read in conjunction with, the financial statements.
| 20 | MainStay MacKay California Tax Free Opportunities Fund |
| | Principal
Amount | Value |
| Long-Term Municipal Bonds (continued) |
| General Obligation (continued) |
| Vacaville Unified School District, Election 2014, Unlimited General Obligation (continued) | | |
| Series D | | |
| 4.00%, due 8/1/38 | $ 500,000 | $ 587,139 |
| Series D | | |
| 4.00%, due 8/1/40 | 500,000 | 584,502 |
| Series D | | |
| 4.00%, due 8/1/45 | 2,050,000 | 2,373,969 |
| Series C | | |
| 5.00%, due 8/1/39 | 500,000 | 599,787 |
| Series C | | |
| 5.00%, due 8/1/40 | 1,225,000 | 1,466,023 |
| Series C | | |
| 5.00%, due 8/1/41 | 1,350,000 | 1,612,578 |
| Series C | | |
| 5.00%, due 8/1/42 | 1,000,000 | 1,192,256 |
| Washington Unified School District, Capital Appreciation, Election 2004, Unlimited General Obligation | | |
| Series B, Insured: BAM-TCRS NATL | | |
| (zero coupon), due 8/1/31 | 2,400,000 | 1,991,845 |
| West Contra Costa Unified School District, Election 2010, Unlimited General Obligation | | |
| Series E | | |
| 4.00%, due 8/1/38 | 1,500,000 | 1,747,959 |
| West Contra Costa Unified School District, Election 2012, Unlimited General Obligation | | |
| Series D | | |
| 4.00%, due 8/1/38 | 1,500,000 | 1,747,959 |
| West Contra Costa Unified School District, Election 2020, Unlimited General Obligation | | |
| Series E, Insured: AGM | | |
| 3.00%, due 8/1/35 | 855,000 | 947,622 |
| Series E, Insured: AGM | | |
| 3.00%, due 8/1/37 | 750,000 | 822,287 |
| Series E, Insured: AGM | | |
| 3.00%, due 8/1/38 | 675,000 | 731,961 |
| Series E, Insured: AGM | | |
| 3.00%, due 8/1/39 | 700,000 | 757,071 |
| Series E, Insured: AGM | | |
| 3.00%, due 8/1/40 | 650,000 | 698,570 |
| Series E, Insured: AGM | | |
| 3.00%, due 8/1/45 | 4,000,000 | 4,244,375 |
| | Principal
Amount | Value |
| |
| General Obligation (continued) |
| West Contra Costa Unified School District, National Senior Campuses, Unlimited General Obligation | | |
| Series E, Insured: AGM | | |
| 3.00%, due 8/1/36 | $ 1,000,000 | $ 1,100,072 |
| Westminster School District, Election 2008, Unlimited General Obligation | | |
| Series B, Insured: BAM | | |
| (zero coupon), due 8/1/48 | 5,000,000 | 885,895 |
| Whittier Union High School District, Unlimited General Obligation | | |
| Series A | | |
| 3.00%, due 8/1/46 | 4,725,000 | 5,038,787 |
| | | 436,170,934 |
| Hospital 4.4% |
| California Health Facilities Financing Authority, Children's Hospital Los Angeles Obligated Group, Revenue Bonds | | |
| Series A | | |
| 5.00%, due 8/15/42 | 500,000 | 588,848 |
| Series A | | |
| 5.00%, due 8/15/47 | 1,000,000 | 1,173,607 |
| California Health Facilities Financing Authority, Children's Hospital of Orange County, Revenue Bonds | | |
| Series A | | |
| 4.00%, due 11/1/36 | 310,000 | 370,774 |
| Series A | | |
| 4.00%, due 11/1/37 | 500,000 | 596,292 |
| Series A | | |
| 4.00%, due 11/1/38 | 250,000 | 297,374 |
| California Health Facilities Financing Authority, City of Hope Obligated Group, Revenue Bonds | | |
| 5.00%, due 11/15/37 | 1,600,000 | 1,820,569 |
| 5.00%, due 11/15/49 | 2,500,000 | 2,990,102 |
| California Health Facilities Financing Authority, CommonSpirit Health Obligated Group, Revenue Bonds | | |
| Series A | | |
| 4.00%, due 4/1/40 | 3,000,000 | 3,515,413 |
| Series A | | |
| 4.00%, due 4/1/49 | 7,500,000 | 8,643,020 |
The notes to the financial statements are an integral part of, and should be read in conjunction with, the financial statements.
21
Portfolio of Investments April 30, 2021† (Unaudited) (continued)
| | Principal
Amount | Value |
| Long-Term Municipal Bonds (continued) |
| Hospital (continued) |
| California Health Facilities Financing Authority, El Camino Hospital, Revenue Bonds | | |
| 4.125%, due 2/1/47 | $ 750,000 | $ 845,402 |
| 5.00%, due 2/1/36 | 1,035,000 | 1,236,864 |
| California Health Facilities Financing Authority, Kaiser Permanente, Revenue Bonds | | |
| Series C | | |
| 5.00%, due 6/1/41 (e) | 5,000,000 | 6,629,374 |
| California Health Facilities Financing Authority, Stanford Health Care Obligated Group, Revenue Bonds | | |
| Series A | | |
| 5.00%, due 11/15/36 | 3,000,000 | 3,765,168 |
| California Health Facilities Financing Authority, Sutter Health Obligated Group, Revenue Bonds | | |
| Series A | | |
| 5.00%, due 11/15/34 | 475,000 | 573,003 |
| Series A | | |
| 5.00%, due 11/15/37 | 5,175,000 | 6,428,576 |
| Series A | | |
| 5.00%, due 11/15/38 | 1,600,000 | 1,983,569 |
| California Municipal Finance Authority, Community Medical Centers, Revenue Bonds | | |
| Series A | | |
| 5.00%, due 2/1/27 | 1,100,000 | 1,358,304 |
| Series A | | |
| 5.00%, due 2/1/37 | 1,000,000 | 1,195,476 |
| California Municipal Finance Authority, Healthright 360, Revenue Bonds | | |
| Series A | | |
| 5.00%, due 11/1/39 (b) | 1,000,000 | 1,112,145 |
| California Public Finance Authority, Henry Mayo Newhall Hospital Obligated Group, Revenue Bonds | | |
| 5.00%, due 10/15/47 | 1,000,000 | 1,143,419 |
| California Statewide Communities Development Authority, Emanate Health, Revenue Bonds | | |
| Series A | | |
| 4.00%, due 4/1/45 | 1,000,000 | 1,152,991 |
| Series A | | |
| 5.00%, due 4/1/34 | 1,275,000 | 1,635,233 |
| | Principal
Amount | Value |
| |
| Hospital (continued) |
| California Statewide Communities Development Authority, Methodist Hospital of Southern California, Revenue Bonds | | |
| 5.00%, due 1/1/38 | $ 1,500,000 | $ 1,786,945 |
| 5.00%, due 1/1/48 | 1,000,000 | 1,176,276 |
| Washington Township Health Care District, Revenue Bonds | | |
| Series B | | |
| 4.00%, due 7/1/36 | 1,380,000 | 1,503,613 |
| | | 53,522,357 |
| Housing 2.9% |
| California Community College Financing Authority, Orange Coast College Project, Revenue Bonds | | |
| 5.00%, due 5/1/29 | 800,000 | 916,518 |
| California Enterprise Development Authority, Provident Group-SDSU Properties LLC M@College Project, Revenue Bonds, First Tier | | |
| Series A | | |
| 5.00%, due 8/1/40 | 650,000 | 805,725 |
| Series A | | |
| 5.00%, due 8/1/45 | 700,000 | 855,868 |
| Series A | | |
| 5.00%, due 8/1/55 | 1,000,000 | 1,208,788 |
| California Municipal Finance Authority, CHF Davis I LLC, Revenue Bonds | | |
| Insured: BAM | | |
| 5.00%, due 5/15/29 | 5,000,000 | 6,316,787 |
| California Municipal Finance Authority, Mobile Home Park Senior Caritas Project, Revenue Bonds, Senior Lien | | |
| Series A | | |
| 4.00%, due 8/15/42 | 1,540,000 | 1,695,376 |
| Series A | | |
| 5.00%, due 8/15/29 | 805,000 | 979,466 |
| Series A | | |
| 5.00%, due 8/15/31 | 140,000 | 168,514 |
| California Municipal Finance Authority, P3 Claremont Holdings LLC, Claremont Colleges Project, Revenue Bonds | | |
| Series A-P3 | | |
| 5.00%, due 7/1/40 (b) | 1,000,000 | 1,139,079 |
The notes to the financial statements are an integral part of, and should be read in conjunction with, the financial statements.
| 22 | MainStay MacKay California Tax Free Opportunities Fund |
| | Principal
Amount | Value |
| Long-Term Municipal Bonds (continued) |
| Housing (continued) |
| California Municipal Finance Authority, Windsor Mobile Country Club, Revenue Bonds | | |
| Series A | | |
| 4.00%, due 11/15/37 | $ 1,320,000 | $ 1,443,584 |
| California Statewide Communities Development Authority, CHF-Irvine LLC, Student Housing, Revenue Bonds | | |
| 5.00%, due 5/15/40 | 1,025,000 | 1,181,005 |
| 5.00%, due 5/15/47 | 3,500,000 | 4,091,532 |
| California Statewide Communities Development Authority, Lancer Educational Student Housing Project, Revenue Bonds (b) | | |
| Series A | | |
| 3.00%, due 6/1/29 | 750,000 | 772,998 |
| Series A | | |
| 5.00%, due 6/1/34 | 375,000 | 438,083 |
| Series A | | |
| 5.00%, due 6/1/51 | 1,750,000 | 1,979,203 |
| California Statewide Communities Development Authority, Provident Group Pomona Properties LLC Project, Revenue Bonds | | |
| Series A | | |
| 5.75%, due 1/15/45 (b) | 400,000 | 417,036 |
| Hastings Campus Housing Finance Authority, Green Bond, Revenue Bonds, Senior Lien | | |
| Series A | | |
| 5.00%, due 7/1/45 | 4,500,000 | 5,231,494 |
| Series A | | |
| 5.00%, due 7/1/61 | 5,000,000 | 5,730,735 |
| | | 35,371,791 |
| Other Revenue 20.3% |
| ABAG Finance Authority for Nonprofit Corp., Episcopal Senior Communities, Revenue Bonds | | |
| Series A | | |
| 5.00%, due 7/1/42 | 500,000 | 515,599 |
| Anaheim Public Financing Authority, City of Anaheim, Revenue Bonds | | |
| Series A | | |
| 5.00%, due 5/1/33 | 1,000,000 | 1,103,111 |
| | Principal
Amount | Value |
| |
| Other Revenue (continued) |
Anaheim Public Financing Authority, City of Anaheim, Revenue Bonds
(continued) | | |
| Series A, Insured: BAM | | |
| 5.00%, due 9/1/35 | $ 4,500,000 | $ 5,462,039 |
| Anaheim Public Financing Authority, Public Improvement Project, Revenue Bonds | | |
| Series A, Insured: AGM | | |
| 5.00%, due 9/1/26 | 8,000,000 | 9,657,938 |
| Series A, Insured: AGM | | |
| 5.00%, due 9/1/27 | 5,000,000 | 6,167,615 |
| Series A, Insured: AGM | | |
| 5.00%, due 9/1/28 | 2,250,000 | 2,817,972 |
| Burlingame California Financing Authority, Community Center Project, Revenue Bonds | | |
| 5.00%, due 7/1/47 | 1,515,000 | 1,882,713 |
| California Community Housing Agency, Essential Housing, Revenue Bonds, Senior Lien | | |
| Series A-1 | | |
| 4.00%, due 2/1/56 (b) | 3,000,000 | 3,321,310 |
| California County Tobacco Securitization Agency, Golden Gate Tobacco Funding Corp., Asset-Backed, Revenue Bonds | | |
| Series A | | |
| 5.00%, due 6/1/47 | 1,275,000 | 1,275,501 |
| California County Tobacco Securitization Agency, Tobacco Settlement, Revenue Bonds | | |
| Series B-2 | | |
| (zero coupon), due 6/1/55 | 3,500,000 | 684,297 |
| California County Tobacco Securitization Agency, Tobacco Settlement, Revenue Bonds, Senior Lien | | |
| Series A | | |
| 4.00%, due 6/1/34 | 300,000 | 364,390 |
| Series A | | |
| 4.00%, due 6/1/35 | 500,000 | 605,459 |
| Series A | | |
| 4.00%, due 6/1/36 | 300,000 | 361,574 |
| Series A | | |
| 4.00%, due 6/1/37 | 275,000 | 330,202 |
| Series A | | |
| 4.00%, due 6/1/38 | 275,000 | 329,166 |
The notes to the financial statements are an integral part of, and should be read in conjunction with, the financial statements.
23
Portfolio of Investments April 30, 2021† (Unaudited) (continued)
| | Principal
Amount | Value |
| Long-Term Municipal Bonds (continued) |
| Other Revenue (continued) |
| California County Tobacco Securitization Agency, Tobacco Settlement, Revenue Bonds, Senior Lien (continued) | | |
| Series A | | |
| 4.00%, due 6/1/39 | $ 350,000 | $ 417,729 |
| Series A | | |
| 4.00%, due 6/1/40 | 500,000 | 595,263 |
| Series A | | |
| 4.00%, due 6/1/49 | 1,500,000 | 1,739,726 |
| California Health Facilities Financing Authority, Lundquist Institute For Biomedical Innovation, Revenue Bonds | | |
| 5.00%, due 9/1/30 | 1,300,000 | 1,599,192 |
| 5.00%, due 9/1/31 | 1,365,000 | 1,672,663 |
| 5.00%, due 9/1/32 | 1,435,000 | 1,753,029 |
| 5.00%, due 9/1/34 | 1,590,000 | 1,931,737 |
| California Housing Finance, City & County of San Francisco, Revenue Bonds | | |
| Series N | | |
| 4.00%, due 4/1/45 | 4,000,000 | 4,742,925 |
| California Infrastructure and Economic Development Bank, California State Teachers' Retirement System, Green Bond, Revenue Bonds | | |
| 5.00%, due 8/1/38 | 1,200,000 | 1,527,067 |
| California Infrastructure and Economic Development Bank, California State Teachers' Retirement System, Green Bond, Green Bond, Revenue Bonds | | |
| 5.00%, due 8/1/37 | 1,050,000 | 1,339,504 |
| California Infrastructure and Economic Development Bank, Salvation Army Western Territory (The), Revenue Bonds | | |
| 4.00%, due 9/1/33 | 1,225,000 | 1,400,057 |
| 4.00%, due 9/1/34 | 1,000,000 | 1,139,637 |
| California Municipal Finance Authority, Asian Community Center of Sacramento Valley, Inc., Revenue Bonds | | |
| Insured: California Mortgage Insurance | | |
| 5.00%, due 4/1/48 | 1,545,000 | 1,823,224 |
| | Principal
Amount | Value |
| |
| Other Revenue (continued) |
| California Municipal Finance Authority, Orange County Civic Center Infrastructure Program, Revenue Bonds | | |
| Series A | | |
| 5.00%, due 6/1/37 | $ 2,085,000 | $ 2,591,452 |
| California Municipal Finance Authority, United Airlines, Inc. Project, Revenue Bonds | | |
| 4.00%, due 7/15/29 (f) | 5,000,000 | 5,765,479 |
| California State Public Works Board, Various Capital Projects, Revenue Bonds | | |
| Series B | | |
| 4.00%, due 5/1/39 | 1,500,000 | 1,827,871 |
| Series B | | |
| 4.00%, due 5/1/40 | 1,000,000 | 1,215,965 |
| Series B | | |
| 4.00%, due 5/1/41 | 1,500,000 | 1,818,523 |
| California Statewide Communities Development Authority, A Community of Seniors, Redwoods Project, Revenue Bonds | | |
| Series A, Insured: California Mortgage Insurance | | |
| 5.375%, due 11/15/44 | 535,000 | 590,296 |
| California Statewide Communities Development Authority, California Baptist University, Revenue Bonds | | |
| Series A | | |
| 6.375%, due 11/1/43 | 500,000 | 551,882 |
| California Statewide Financing Authority, Tobacco Settlement Asset Backed, Revenue Bonds | | |
| Series C | | |
| (zero coupon), due 6/1/55 (b) | 20,000,000 | 1,916,722 |
| Children's Trust Fund, Asset-Backed, Revenue Bonds | | |
| Series A | | |
| (zero coupon), due 5/15/50 | 1,500,000 | 234,429 |
| City of Sacramento CA, Transient Occupancy Tax, Revenue Bonds | | |
| Series C | | |
| 5.00%, due 6/1/48 | 4,860,000 | 5,747,161 |
| City of Santa Ana CA, Gas Tax, Revenue Bonds | | |
| 4.00%, due 1/1/38 | 1,360,000 | 1,582,137 |
The notes to the financial statements are an integral part of, and should be read in conjunction with, the financial statements.
| 24 | MainStay MacKay California Tax Free Opportunities Fund |
| | Principal
Amount | Value |
| Long-Term Municipal Bonds (continued) |
| Other Revenue (continued) |
| CSCDA Community Improvement Authority, Revenue Bonds (b) | | |
| Series A | | |
| 4.00%, due 8/1/56 | $ 10,000,000 | $ 10,753,104 |
| Series A | | |
| 5.00%, due 7/1/51 | 2,000,000 | 2,319,177 |
| CSCDA Community Improvement Authority, Jefferson Anaheim, Revenue Bonds | | |
| 3.125%, due 8/1/56 (b) | 5,000,000 | 4,820,377 |
| CSCDA Community Improvement Authority, Ocennaire Long Beach, Revenue Bonds | | |
| 4.00%, due 9/1/56 (b) | 1,000,000 | 1,076,614 |
| Del Mar Race Track Authority, Revenue Bonds | | |
| 5.00%, due 10/1/30 | 1,000,000 | 1,050,958 |
| FHLMC Multifamily VRD Certificates, VRD Certificates, Revenue Bonds | | |
| Series M-057 | | |
| 2.40%, due 10/15/29 | 2,995,000 | 3,168,833 |
| GDB Debt Recovery Authority of Puerto Rico, Revenue Bonds | | |
| 7.50%, due 8/20/40 | 1,305,627 | 1,119,575 |
| Golden State Tobacco Securitization Corp., Asset-Backed, Revenue Bonds | | |
| Series A-2 | | |
| 5.30%, due 6/1/37 (a) | 2,500,000 | 2,594,616 |
| Guam Economic Development & Commerce Authority, Tobacco Settlement Asset-Backed, Revenue Bonds | | |
| Series A | | |
| 5.625%, due 6/1/47 | 1,025,000 | 1,025,361 |
| Imperial Irrigation District Electric System, Revenue Bonds | | |
| Series C | | |
| 5.00%, due 11/1/37 | 1,000,000 | 1,195,768 |
| Series B-2 | | |
| 5.00%, due 11/1/41 | 5,475,000 | 6,585,546 |
| Livermore Valley Water Financing Authority, Alameda County Flood Control & Water Conservation District Zone No. 7, Revenue Bonds | | |
| Series A | | |
| 5.00%, due 7/1/47 | 3,945,000 | 4,888,069 |
| | Principal
Amount | Value |
| |
| Other Revenue (continued) |
| Lodi Public Financing Authority, Electric System, Revenue Bonds | | |
| Insured: AGM | | |
| 5.00%, due 9/1/31 | $ 1,330,000 | $ 1,671,433 |
| Insured: AGM | | |
| 5.00%, due 9/1/32 | 1,650,000 | 2,060,652 |
| Los Angeles County Facilities, Inc., County of Los Angeles, Revenue Bonds | | |
| Series A | | |
| 5.00%, due 12/1/38 | 1,910,000 | 2,410,835 |
| Los Angeles County Metropolitan Transportation Authority, Green Bond, Revenue Bonds | | |
| Series A | | |
| 4.00%, due 6/1/37 | 4,000,000 | 4,885,694 |
| Montclair Financing Authority, Public Facilities Project, Revenue Bonds | | |
| Insured: AGM | | |
| 5.00%, due 10/1/32 | 1,000,000 | 1,142,762 |
| Mountain House Public Financing Authority, Green Bond, Revenue Bonds | | |
| Series B, Insured: BAM | | |
| 4.00%, due 12/1/40 | 1,380,000 | 1,604,060 |
| Orange City Public Facilities Financing Authority, City of Orange, Revenue Bonds | | |
| Series A | | |
| 4.00%, due 11/1/50 | 2,000,000 | 2,286,656 |
| Orange County Local Transportation Authority, Sales Tax, Revenue Bonds | | |
| 4.00%, due 2/15/38 | 10,000,000 | 11,845,972 |
| Pico Rivera Public Financing Authority, City of Pico Rivera, Revenue Bonds | | |
| Insured: NATL-RE | | |
| 5.25%, due 9/1/34 | 1,560,000 | 1,910,741 |
| Puerto Rico Convention Center District Authority, Hotel Occupancy Tax, Revenue Bonds | | |
| Series A, Insured: AGC | | |
| 4.50%, due 7/1/36 | 1,100,000 | 1,120,723 |
| Puerto Rico Municipal Finance Agency, Revenue Bonds | | |
| Series A, Insured: AGM | | |
| 5.25%, due 8/1/21 | 300,000 | 301,760 |
The notes to the financial statements are an integral part of, and should be read in conjunction with, the financial statements.
25
Portfolio of Investments April 30, 2021† (Unaudited) (continued)
| | Principal
Amount | Value |
| Long-Term Municipal Bonds (continued) |
| Other Revenue (continued) |
| Puerto Rico Public Buildings Authority, Government Facilities, Revenue Bonds (c)(d) | | |
| Series S, Insured: COMMWLTH GTD | | |
| 5.00%, due 7/1/24 | $ 1,305,000 | $ 1,259,325 |
| Series N, Insured: COMMWLTH GTD | | |
| 5.00%, due 7/1/32 | 3,130,000 | 3,059,575 |
| Series U, Insured: COMMWLTH GTD | | |
| 5.25%, due 7/1/42 | 3,000,000 | 2,756,250 |
| Series S, Insured: COMMWLTH GTD | | |
| 5.75%, due 7/1/22 | 2,000,000 | 1,967,500 |
| Puerto Rico Public Buildings Authority, Unrefunded, Government Facilities, Revenue Bonds | | |
| Series I, Insured: COMMWLTH GTD | | |
| 5.25%, due 7/1/29 (c)(d) | 1,515,000 | 1,488,488 |
| Puerto Rico Sales Tax Financing Corp., Revenue Bonds | | |
| Series A-1 | | |
| 4.50%, due 7/1/34 | 1,500,000 | 1,640,430 |
| Series A-1 | | |
| 4.75%, due 7/1/53 | 1,000,000 | 1,112,400 |
| Series A-1 | | |
| 5.00%, due 7/1/58 | 13,000,000 | 14,677,780 |
| Riverside County Transportation Commission, Sales Tax, Revenue Bonds | | |
| Series B | | |
| 4.00%, due 6/1/36 | 5,000,000 | 5,775,984 |
| San Bernardino County Financing Authority, Court House Facilities Project, Revenue Bonds | | |
| Series C, Insured: NATL-RE | | |
| 5.50%, due 6/1/37 | 1,150,000 | 1,355,620 |
| San Diego County Regional Transportation Commission, Green Bond, Revenue Bonds | | |
| Series A | | |
| 5.00%, due 4/1/38 | 1,000,000 | 1,306,980 |
| Series A | | |
| 5.00%, due 4/1/39 | 1,000,000 | 1,303,563 |
| Series A | | |
| 5.00%, due 4/1/40 | 675,000 | 877,528 |
| | Principal
Amount | Value |
| |
| Other Revenue (continued) |
| San Diego County Regional Transportation Commission, Green Bond, Revenue Bonds (continued) | | |
| Series A | | |
| 5.00%, due 4/1/44 | $ 2,800,000 | $ 3,604,948 |
| San Francisco Bay Area Rapid Transit District, Sales Tax, Revenue Bonds | | |
| Series A | | |
| 4.00%, due 7/1/36 | 1,850,000 | 2,165,588 |
| San Joaquin County Transportation Authority, Sales Tax Revenue, Revenue Bonds | | |
| Series K | | |
| 5.00%, due 3/1/37 | 1,705,000 | 2,091,718 |
| San Mateo Joint Powers Financing Authority, Capital Projects, Revenue Bonds | | |
| Series A | | |
| 5.00%, due 7/15/43 | 3,000,000 | 3,683,139 |
| South Bayside Waste Management Authority, Prerefunded, Green Bond, Revenue Bonds | | |
| Series B, Insured: AGM | | |
| 5.00%, due 9/1/25 (f) | 50,000 | 59,402 |
| Series B, Insured: AGM | | |
| 5.00%, due 9/1/27 (f) | 55,000 | 69,103 |
| Series B, Insured: AGM | | |
| 5.00%, due 9/1/29 (f) | 15,000 | 19,627 |
| Series B, Insured: AGM | | |
| 5.00%, due 9/1/30 (f) | 25,000 | 32,712 |
| Series B, Insured: AGM | | |
| 5.00%, due 9/1/31 (f) | 15,000 | 19,627 |
| Series 2019A, Insured: AGM | | |
| 5.00%, due 9/1/32 | 15,000 | 19,837 |
| Series 2019A, Insured: AGM | | |
| 5.00%, due 9/1/39 | 80,000 | 105,799 |
| South Bayside Waste Management Authority, Unrefunded, Green Bond, Revenue Bonds | | |
| Series B, Insured: AGM | | |
| 5.00%, due 9/1/25 (f) | 1,465,000 | 1,742,660 |
| Series B, Insured: AGM | | |
| 5.00%, due 9/1/27 (f) | 1,615,000 | 2,023,474 |
| Series B, Insured: AGM | | |
| 5.00%, due 9/1/29 (f) | 405,000 | 525,468 |
| Series B, Insured: AGM | | |
| 5.00%, due 9/1/30 (f) | 690,000 | 887,609 |
The notes to the financial statements are an integral part of, and should be read in conjunction with, the financial statements.
| 26 | MainStay MacKay California Tax Free Opportunities Fund |
| | Principal
Amount | Value |
| Long-Term Municipal Bonds (continued) |
| Other Revenue (continued) |
| South Bayside Waste Management Authority, Unrefunded, Green Bond, Revenue Bonds (continued) | | |
| Series B, Insured: AGM | | |
| 5.00%, due 9/1/31 (f) | $ 395,000 | $ 503,432 |
| Series 2019A, Insured: AGM | | |
| 5.00%, due 9/1/32 | 485,000 | 621,243 |
| Series 2019A, Insured: AGM | | |
| 5.00%, due 9/1/39 | 2,450,000 | 3,075,091 |
| Stockton Public Financing Authority, Water Revenue, Green Bonds, Revenue Bonds | | |
| Series A, Insured: BAM | | |
| 4.00%, due 10/1/37 | 2,500,000 | 2,886,242 |
| Series A, Insured: BAM | | |
| 5.00%, due 10/1/32 | 1,275,000 | 1,595,333 |
| Series A, Insured: BAM | | |
| 5.00%, due 10/1/34 | 1,500,000 | 1,866,676 |
| Territory of Guam, Business Privilege Tax, Revenue Bonds | | |
| Series B-1 | | |
| 5.00%, due 1/1/27 | 1,500,000 | 1,541,409 |
| Series D | | |
| 5.00%, due 11/15/27 | 1,000,000 | 1,149,604 |
| Series A | | |
| 5.125%, due 1/1/42 | 2,890,000 | 2,973,498 |
| Territory of Guam, Hotel Occupancy Tax, Revenue Bonds | | |
| Series A | | |
| 6.50%, due 11/1/40 | 1,740,000 | 1,740,000 |
| Tobacco Securitization Authority of Northern California, Sacramento County Tobacco Securitization Corp., Revenue Bonds, Senior Lien | | |
| (zero coupon), due 6/1/60 | 12,500,000 | 3,007,954 |
| 4.00%, due 6/1/49 | 1,000,000 | 1,139,258 |
| Tobacco Securitization Authority of Southern California, San Diego County Tobacco Asset Securitization Corp., Asset-Backed, Revenue Bonds | | |
| Series A | | |
| 5.00%, due 6/1/48 | 2,400,000 | 2,971,134 |
| | Principal
Amount | Value |
| |
| Other Revenue (continued) |
| Virgin Islands Public Finance Authority, Gross Receipts Taxes Loan, Revenue Bonds | | |
| Series A | | |
| 5.00%, due 10/1/29 | $ 1,500,000 | $ 1,440,329 |
| Series A | | |
| 5.00%, due 10/1/32 | 1,250,000 | 1,184,517 |
| Virgin Islands Public Finance Authority, Matching Fund Loan, Revenue Bonds | | |
| Series A | | |
| 6.00%, due 10/1/39 | 780,000 | 781,786 |
| Series A | | |
| 6.625%, due 10/1/29 | 280,000 | 282,281 |
| Series A | | |
| 6.75%, due 10/1/37 | 2,450,000 | 2,469,957 |
| Virgin Islands Public Finance Authority, Matching Fund Loan, Revenue Bonds, Senior Lien | | |
| Series A | | |
| 5.00%, due 10/1/25 | 620,000 | 621,454 |
| Virgin Islands Public Finance Authority, United States Virgin Islands Federal Excise Tax, Revenue Bonds | | |
| Series A, Insured: AGM | | |
| 5.00%, due 10/1/32 | 1,205,000 | 1,266,388 |
| West Hollywood Public Financing Authority, City of West Hollywood, Revenue Bonds | | |
| Series A | | |
| 3.00%, due 4/1/42 | 3,300,000 | 3,563,614 |
| | | 244,555,176 |
| School District 0.3% |
| Alvord Unified School District, Election 2012, Unlimited General Obligation | | |
| Series A, Insured: AGM | | |
| 5.25%, due 8/1/37 | 825,000 | 920,309 |
| Fontana Unified School District, Unlimited General Obligation | | |
| Series C | | |
| (zero coupon), due 8/1/33 | 2,825,000 | 1,602,928 |
The notes to the financial statements are an integral part of, and should be read in conjunction with, the financial statements.
27
Portfolio of Investments April 30, 2021† (Unaudited) (continued)
| | Principal
Amount | Value |
| Long-Term Municipal Bonds (continued) |
| School District (continued) |
| Santa Barbara Unified School District, Election 2010, Unlimited General Obligation | | |
| Series B | | |
| 5.00%, due 8/1/38 | $ 1,000,000 | $ 1,109,929 |
| | | 3,633,166 |
| Transportation 9.8% |
| Alameda Corridor Transportation Authority, Revenue Bonds, Senior Lien | | |
| Series A, Insured: AGM | | |
| 5.00%, due 10/1/29 | 1,000,000 | 1,110,148 |
| Antonio B Won Pat International Airport Authority, Revenue Bonds | | |
| Series C, Insured: AGM | | |
| 6.00%, due 10/1/34 (f) | 1,000,000 | 1,095,779 |
| California Municipal Finance Authority, LAX Integrated Express Solutions Project, Revenue Bonds | | |
| Series A | | |
| 5.00%, due 6/30/31 (f) | 3,100,000 | 3,837,210 |
| California Municipal Finance Authority, LINXS APM Project, Revenue Bonds | | |
| Series A, Insured: AGM | | |
| 3.25%, due 12/31/32 (f) | 1,000,000 | 1,091,444 |
| City of Long Beach CA, Harbor, Revenue Bonds | | |
| Series A | | |
| 5.00%, due 5/15/36 | 1,000,000 | 1,289,249 |
| Series A | | |
| 5.00%, due 5/15/37 | 1,000,000 | 1,285,463 |
| Series A | | |
| 5.00%, due 5/15/38 | 2,000,000 | 2,564,653 |
| City of Los Angeles, Revenue Bonds, Senior Lien | | |
| Series B | | |
| 4.00%, due 5/15/39 | 5,000,000 | 6,022,718 |
| City of Los Angeles, Department of Airports, Revenue Bonds | | |
| Series B | | |
| 5.00%, due 5/15/25 (f) | 710,000 | 836,525 |
| Series D | | |
| 5.00%, due 5/15/26 (f) | 1,000,000 | 1,212,866 |
| Series A | | |
| 5.00%, due 5/15/29 (f) | 3,125,000 | 4,041,145 |
| | Principal
Amount | Value |
| |
| Transportation (continued) |
City of Los Angeles, Department of Airports, Revenue Bonds
(continued) | | |
| Series A | | |
| 5.00%, due 5/15/31 (f) | $ 2,815,000 | $ 3,417,552 |
| Series E | | |
| 5.00%, due 5/15/37 (f) | 1,250,000 | 1,576,423 |
| Series F | | |
| 5.00%, due 5/15/37 (f) | 875,000 | 1,092,946 |
| Series A | | |
| 5.00%, due 5/15/40 | 6,175,000 | 7,940,341 |
| Series A | | |
| 5.25%, due 5/15/48 (f) | 1,375,000 | 1,681,988 |
| City of Palm Springs CA, Airport Passenger Facility Charge, Revenue Bonds (f) | | |
| Insured: BAM | | |
| 5.00%, due 6/1/30 | 640,000 | 739,454 |
| Insured: BAM | | |
| 5.00%, due 6/1/31 | 1,130,000 | 1,304,133 |
| County of Sacramento, Airport System, Revenue Bonds | | |
| Series C | | |
| 5.00%, due 7/1/38 (f) | 3,000,000 | 3,643,690 |
| Foothill-Eastern Transportation Corridor Agency, Revenue Bonds, Junior Lien | | |
| Series C | | |
| 4.00%, due 1/15/43 | 525,000 | 612,658 |
| Foothill-Eastern Transportation Corridor Agency, Revenue Bonds, Senior Lien | | |
| Series A | | |
| 4.00%, due 1/15/46 | 1,500,000 | 1,764,676 |
| Norman Y Mineta San Jose International Airport SJC, Revenue Bonds (f) | | |
| Series A, Insured: BAM | | |
| 4.00%, due 3/1/42 | 4,755,000 | 5,299,540 |
| Series A | | |
| 5.00%, due 3/1/41 | 2,500,000 | 2,982,205 |
| Series A | | |
| 5.00%, due 3/1/47 | 4,390,000 | 5,239,818 |
| Peninsula Corridor Joint Powers Board, Farebox, Revenue Bonds | | |
| Series A | | |
| 5.00%, due 10/1/32 | 500,000 | 643,882 |
The notes to the financial statements are an integral part of, and should be read in conjunction with, the financial statements.
| 28 | MainStay MacKay California Tax Free Opportunities Fund |
| | Principal
Amount | Value |
| Long-Term Municipal Bonds (continued) |
| Transportation (continued) |
Peninsula Corridor Joint Powers Board, Farebox, Revenue Bonds
(continued) | | |
| Series A | | |
| 5.00%, due 10/1/33 | $ 500,000 | $ 641,684 |
| Series A | | |
| 5.00%, due 10/1/34 | 500,000 | 639,983 |
| Series A | | |
| 5.00%, due 10/1/35 | 350,000 | 446,952 |
| Series A | | |
| 5.00%, due 10/1/44 | 4,035,000 | 4,808,808 |
| Port of Oakland, Revenue Bonds (f) | | |
| Series D | | |
| 5.00%, due 11/1/28 | 2,250,000 | 2,797,135 |
| Series D | | |
| 5.00%, due 11/1/29 | 1,850,000 | 2,293,066 |
| Puerto Rico Highway & Transportation Authority, Revenue Bonds | | |
| Series D, Insured: AGM | | |
| 5.00%, due 7/1/32 | 1,205,000 | 1,238,606 |
| Series G, Insured: AGC | | |
| 5.00%, due 7/1/42 | 40,000 | 41,116 |
| Series N, Insured: NATL-RE | | |
| 5.25%, due 7/1/32 | 640,000 | 716,302 |
| Insured: AMBAC | | |
| 5.50%, due 7/1/26 | 460,000 | 506,384 |
| San Francisco City & County Airport Commission, San Francisco International Airport, Revenue Bonds, Second Series | | |
| Series H | | |
| 5.00%, due 5/1/27 (f) | 7,000,000 | 8,703,845 |
| Series D | | |
| 5.00%, due 5/1/30 | 2,595,000 | 3,376,850 |
| Series D | | |
| 5.00%, due 5/1/31 | 2,200,000 | 2,849,566 |
| Series D | | |
| 5.00%, due 5/1/38 | 4,600,000 | 5,817,511 |
| Series E | | |
| 5.00%, due 5/1/45 (f) | 3,460,000 | 4,234,605 |
| Series E | | |
| 5.00%, due 5/1/50 (f) | 4,100,000 | 5,000,861 |
| San Francisco Municipal Transportation Agency, Revenue Bonds | | |
| 5.00%, due 3/1/44 | 1,500,000 | 1,701,809 |
| | Principal
Amount | Value |
| |
| Transportation (continued) |
| San Joaquin Hills Transportation Corridor Agency, Revenue Bonds, Junior Lien | | |
| Series B | | |
| 5.25%, due 1/15/44 | $ 4,000,000 | $ 4,483,982 |
| Series B | | |
| 5.25%, due 1/15/49 | 500,000 | 559,321 |
| San Joaquin Hills Transportation Corridor Agency, Revenue Bonds, Senior Lien | | |
| Series A | | |
| 5.00%, due 1/15/44 | 3,500,000 | 3,925,691 |
| Series A | | |
| 5.00%, due 1/15/50 | 500,000 | 557,620 |
| | | 117,668,203 |
| Utilities 3.3% |
| California Infrastructure and Economic Development Bank, Independent System Operator Corp. Project, Revenue Bonds | | |
| 5.00%, due 2/1/39 | 1,000,000 | 1,084,877 |
| City of Riverside CA, Electric, Revenue Bonds | | |
| Series A | | |
| 5.00%, due 10/1/31 | 750,000 | 971,844 |
| Guam Government Waterworks Authority, Water and Wastewater System, Revenue Bonds | | |
| 5.25%, due 7/1/33 | 1,100,000 | 1,216,545 |
| 5.50%, due 7/1/43 | 3,500,000 | 3,889,630 |
| Guam Power Authority, Revenue Bonds | | |
| Series A | | |
| 5.00%, due 10/1/34 | 1,000,000 | 1,039,579 |
| Series A | | |
| 5.00%, due 10/1/40 | 1,000,000 | 1,156,029 |
| Los Angeles Department of Water & Power System, Revenue Bonds | | |
| Series C | | |
| 5.00%, due 7/1/37 | 2,860,000 | 3,697,837 |
| Puerto Rico Electric Power Authority, Revenue Bonds | | |
| Series UU, Insured: AGC | | |
| 4.25%, due 7/1/27 | 460,000 | 461,135 |
| Series SS, Insured: NATL-RE | | |
| 5.00%, due 7/1/22 | 640,000 | 649,254 |
The notes to the financial statements are an integral part of, and should be read in conjunction with, the financial statements.
29
Portfolio of Investments April 30, 2021† (Unaudited) (continued)
| | Principal
Amount | Value |
| Long-Term Municipal Bonds (continued) |
| Utilities (continued) |
| Puerto Rico Electric Power Authority, Revenue Bonds (continued) | | |
| Series UU, Insured: AGM | | |
| 5.00%, due 7/1/24 | $ 225,000 | $ 231,275 |
| Series XX-RSA-1 | | |
| 5.25%, due 7/1/40 (c)(d) | 1,000,000 | 930,000 |
| Sacramento Municipal Utility District, Revenue Bonds | | |
| Series G | | |
| 5.00%, due 8/15/37 | 8,000,000 | 10,344,572 |
| Sacramento Municipal Utility District, Electric Revenue, Green Bonds, Revenue Bonds | | |
| Series H | | |
| 4.00%, due 8/15/45 | 7,500,000 | 9,000,721 |
| Turlock Irrigation District, Revenue Bonds | | |
| 5.00%, due 1/1/38 | 600,000 | 778,677 |
| 5.00%, due 1/1/39 | 500,000 | 647,233 |
| 5.00%, due 1/1/44 | 3,165,000 | 4,050,260 |
| | | 40,149,468 |
| Water & Sewer 7.0% |
| City of Clovis CA, Wastewater, Revenue Bonds | | |
| Insured: AGM | | |
| 5.25%, due 8/1/29 | 500,000 | 596,087 |
| City of Culver City CA, Wastewater Facilities, Revenue Bonds | | |
| Series A | | |
| 4.00%, due 9/1/44 | 1,690,000 | 1,990,784 |
| City of Oxnard CA, Wastewater, Revenue Bonds | | |
| Insured: BAM | | |
| 4.00%, due 6/1/32 | 1,920,000 | 2,227,212 |
| Insured: BAM | | |
| 4.00%, due 6/1/34 | 2,080,000 | 2,383,842 |
| Insured: BAM | | |
| 5.00%, due 6/1/30 | 1,340,000 | 1,675,729 |
| City of Oxnard CA, Water System, Revenue Bonds | | |
| Insured: BAM | | |
| 5.00%, due 6/1/35 | 1,125,000 | 1,395,205 |
| | Principal
Amount | Value |
| |
| Water & Sewer (continued) |
| City of San Francisco CA, Public Utilities Commission Water, Green Bond, Revenue Bonds | | |
| Series A | | |
| 4.00%, due 11/1/50 | $ 4,000,000 | $ 4,754,851 |
| City of San Francisco CA, Public Utilities Commission, Hetch Hetchy Water, Revenue Bonds | | |
| Series D | | |
| 3.00%, due 11/1/50 | 3,750,000 | 4,017,177 |
| City of Santa Cruz CA, Water, Green Bond, Revenue Bonds | | |
| 5.00%, due 3/1/49 | 2,000,000 | 2,517,704 |
| City of Vernon CA, Water System, Revenue Bonds | | |
| Series A, Insured: AGM | | |
| 3.375%, due 8/1/40 | 650,000 | 701,350 |
| Series A, Insured: AGM | | |
| 3.50%, due 8/1/45 | 725,000 | 779,920 |
| Series A, Insured: AGM | | |
| 5.00%, due 8/1/30 | 985,000 | 1,269,148 |
| Series A, Insured: AGM | | |
| 5.00%, due 8/1/35 | 1,000,000 | 1,265,791 |
| Colton Utility Authority, Revenue Bonds | | |
| Insured: AGM | | |
| 4.00%, due 3/1/47 | 2,500,000 | 2,754,051 |
| Contra Costa Water District, Revenue Bonds | | |
| Series V | | |
| 5.00%, due 10/1/44 | 6,000,000 | 7,696,235 |
| Eastern Municipal Water District, Water & Wastewater, Revenue Bonds | | |
| Series A | | |
| 5.00%, due 7/1/45 | 2,850,000 | 3,373,879 |
| Eastern Municipal Water District Financing Authority, Water & Wastewater, Revenue Bonds | | |
| Series A | | |
| 4.00%, due 7/1/37 | 1,700,000 | 2,090,647 |
| Series A | | |
| 4.00%, due 7/1/38 | 1,500,000 | 1,835,198 |
| Guam Government Waterworks Authority, Water and Wastewater System, Revenue Bonds | | |
| 5.00%, due 1/1/46 | 6,290,000 | 7,101,847 |
The notes to the financial statements are an integral part of, and should be read in conjunction with, the financial statements.
| 30 | MainStay MacKay California Tax Free Opportunities Fund |
| | Principal
Amount | Value |
| Long-Term Municipal Bonds (continued) |
| Water & Sewer (continued) |
Guam Government Waterworks Authority, Water and Wastewater System, Revenue Bonds
(continued) | | |
| Series A | | |
| 5.00%, due 1/1/50 | $ 2,500,000 | $ 3,046,372 |
| Los Angeles County Sanitation Districts Financing Authority, Green Bond, Revenue Bonds | | |
| Series A | | |
| 4.00%, due 10/1/33 | 1,000,000 | 1,151,082 |
| Los Angeles Department of Water, Revenue Bonds | | |
| Series A | | |
| 5.00%, due 7/1/35 | 1,500,000 | 1,850,345 |
| Moulton-Niguel Water District, Revenue Bonds | | |
| 5.00%, due 9/1/39 | 3,685,000 | 4,702,541 |
| Oxnard Financing Authority, Waste Water, Revenue Bonds | | |
| Insured: AGM | | |
| 5.00%, due 6/1/34 | 1,000,000 | 1,128,875 |
| Puerto Rico Commonwealth Aqueduct & Sewer Authority, Revenue Bonds, Senior Lien | | |
| Series A | | |
| 5.00%, due 7/1/33 | 355,000 | 374,664 |
| Series A | | |
| 5.50%, due 7/1/28 | 1,500,000 | 1,591,999 |
| Rancho Water District Financing Authority, Revenue Bonds | | |
| Series A | | |
| 4.00%, due 8/1/37 | 2,750,000 | 3,371,847 |
| San Diego County Water Authority, Green Bond, Revenue Bonds | | |
| Series B | | |
| 4.00%, due 5/1/38 | 5,000,000 | 6,225,813 |
| San Joaquin Area Flood Control Agency, California Smith Canal Area Assessment, Special Assessment | | |
| Insured: AGM | | |
| 3.00%, due 10/1/32 | 660,000 | 717,192 |
| Insured: AGM | | |
| 3.00%, due 10/1/34 | 700,000 | 755,328 |
| Insured: AGM | | |
| 3.25%, due 10/1/40 | 2,000,000 | 2,154,332 |
| | Principal
Amount | Value |
| |
| Water & Sewer (continued) |
| San Joaquin Area Flood Control Agency, California Smith Canal Area Assessment, Special Assessment (continued) | | |
| Insured: AGM | | |
| 3.375%, due 10/1/45 | $ 1,250,000 | $ 1,342,717 |
| Insured: AGM | | |
| 3.375%, due 10/1/50 | 1,000,000 | 1,068,209 |
| Santa Margarita-Dana Point Authority, Water District Improvement, Revenue Bonds | | |
| 4.00%, due 8/1/36 | 2,025,000 | 2,338,783 |
| Silicon Valley Clean Water, Revenue Bonds | | |
| 5.00%, due 8/1/45 | 500,000 | 597,103 |
| Watereuse Finance Authority, Vallejo Sanitation And Flood Control District Refunding Program, Revenue Bonds | | |
| Series A | | |
| 5.50%, due 5/1/36 | 500,000 | 573,525 |
| West Sacramento Financing Authority, Water Capital Projects, Revenue Bonds | | |
| Insured: BAM | | |
| 4.00%, due 10/1/39 | 300,000 | 341,096 |
| | | 83,758,480 |
Total Long-Term Municipal Bonds
(Cost $1,049,602,087) | | 1,122,911,285 |
| Short-Term Municipal Notes 2.6% |
| General 1.3% |
| Invesco California Value Municipal Income Trust | | |
| 1.11%, due 12/1/22 (b)(g)(h) | 15,000,000 | 15,000,000 |
| General Obligation 1.0% |
| State of California, Unlimited General Obligation | | |
| Series A | | |
| 0.055%, due 5/1/48 (h) | 12,500,000 | 12,500,000 |
The notes to the financial statements are an integral part of, and should be read in conjunction with, the financial statements.
31
Portfolio of Investments April 30, 2021† (Unaudited) (continued)
| | Principal
Amount | | Value |
| Short-Term Municipal Notes (continued) |
| Other Revenue 0.2% |
| California Statewide Communities Development Authority, Southern California Edison Co., Revenue Bonds | | | |
| Series C | | | |
| 2.625%, due 11/1/33 (e)(h) | $ 1,655,000 | | $ 1,751,983 |
| Water & Sewer 0.1% |
| Metropolitan Water District of Southern California, Revenue Bonds | | | |
| Series A | | | |
| 0.03%, due 7/1/47 (e)(h) | 800,000 | | 800,000 |
| Metropolitan Water District of Southern California, Special Variable Rate, Revenue Bonds | | | |
| Series A-2 | | | |
| 0.02%, due 7/1/37 (e)(h) | 560,000 | | 560,000 |
| | | | 1,360,000 |
Total Short-Term Municipal Notes
(Cost $30,559,713) | | | 30,611,983 |
Total Municipal Bonds
(Cost $1,080,161,800) | | | 1,153,523,268 |
| |
| | Shares | | |
| Short-Term Investment 0.5% |
| Unaffiliated Investment Company 0.5% |
| BlackRock Liquidity Funds MuniCash, 0.01% | 5,889,026 | | 5,890,155 |
Total Short-Term Investment
(Cost $5,890,155) | | | 5,890,155 |
Total Investments
(Cost $1,086,051,955) | 96.3% | | 1,159,413,423 |
| Other Assets, Less Liabilities | 3.7 | | 45,160,230 |
| Net Assets | 100.0% | | $ 1,204,573,653 |
| † | Percentages indicated are based on Fund net assets. |
| (a) | Step coupon—Rate shown was the rate in effect as of April 30, 2021. |
| (b) | May be sold to institutional investors only under Rule 144A or securities offered pursuant to Section 4(a)(2) of the Securities Act of 1933, as amended. |
| (c) | Issue in default. |
| (d) | Issue in non-accrual status. |
| (e) | Coupon rate may change based on changes of the underlying collateral or prepayments of principal. Rate shown was the rate in effect as of April 30, 2021. |
| (f) | Interest on these securities was subject to alternative minimum tax. |
| (g) | Floating rate—Rate shown was the rate in effect as of April 30, 2021. |
| (h) | Variable-rate demand notes (VRDNs)—Provide the right to sell the security at face value on either that day or within the rate-reset period. VRDNs will normally trade as if the maturity is the earlier put date, even though stated maturity is longer. The interest rate is reset on the put date at a stipulated daily, weekly, monthly, quarterly, or other specified time interval to reflect current market conditions. These securities do not indicate a reference rate and spread in their description. The maturity date shown is the final maturity. |
Futures Contracts
As of April 30, 2021, the Fund held the following futures contracts1:
| Type | Number of
Contracts | Expiration
Date | Value at
Trade Date | Current
Notional
Amount | Unrealized
Appreciation
(Depreciation)2 |
| Short Contracts | | | | | |
| U.S. Treasury 10 Year Notes | (490) | June 2021 | $ (65,242,326) | $ (64,695,313) | $ 547,013 |
The notes to the financial statements are an integral part of, and should be read in conjunction with, the financial statements.
| 32 | MainStay MacKay California Tax Free Opportunities Fund |
| Type | Number of
Contracts | Expiration
Date | Value at
Trade Date | Current
Notional
Amount | Unrealized
Appreciation
(Depreciation)2 |
| U.S. Treasury Long Bonds | (150) | June 2021 | $ (23,690,272) | $ (23,587,499) | $ 102,773 |
| Net Unrealized Appreciation | | | | | $ 649,786 |
| 1. | As of April 30, 2021, cash in the amount of $1,302,250 was on deposit with a broker or futures commission merchant for futures transactions. |
| 2. | Represents the difference between the value of the contracts at the time they were opened and the value as of April 30, 2021. |
| Abbreviation(s): |
| AGC—Assured Guaranty Corp. |
| AGM—Assured Guaranty Municipal Corp. |
| AMBAC—Ambac Assurance Corp. |
| BAM—Build America Mutual Assurance Co. |
| CHF—Collegiate Housing Foundation |
| COMMWLTH GTD—Commonwealth Guaranteed |
| FHLMC—Federal Home Loan Mortgage Corp. |
| NATL—National Public Finance Guarantee Corp. |
| NATL-RE—National Public Finance Guarantee Corp. |
The following is a summary of the fair valuations according to the inputs used as of April 30, 2021, for valuing the Fund’s assets:
| Description | Quoted
Prices in
Active
Markets for
Identical
Assets
(Level 1) | | Significant
Other
Observable
Inputs
(Level 2) | | Significant
Unobservable
Inputs
(Level 3) | | Total |
| Asset Valuation Inputs | | | | | | | |
| Investments in Securities (a) | | | | | | | |
| Municipal Bonds | | | | | | | |
| Long-Term Municipal Bonds | $ — | | $ 1,122,911,285 | | $ — | | $ 1,122,911,285 |
| Short-Term Municipal Notes | — | | 30,611,983 | | — | | 30,611,983 |
| Total Municipal Bonds | — | | 1,153,523,268 | | — | | 1,153,523,268 |
| Short-Term Investment | | | | | | | |
| Unaffiliated Investment Company | 5,890,155 | | — | | — | | 5,890,155 |
| Total Investments in Securities | 5,890,155 | | 1,153,523,268 | | — | | 1,159,413,423 |
| Other Financial Instruments | | | | | | | |
| Futures Contracts (b) | 649,786 | | — | | — | | 649,786 |
| Total Other Financial Instruments | 649,786 | | — | | — | | 649,786 |
| Total Investments in Securities and Other Financial Instruments | $ 6,539,941 | | $ 1,153,523,268 | | $ — | | $ 1,160,063,209 |
| (a) | For a complete listing of investments and their industries, see the Portfolio of Investments. |
| (b) | The value listed for these securities reflects unrealized appreciation (depreciation) as shown on the Portfolio of Investments. |
The notes to the financial statements are an integral part of, and should be read in conjunction with, the financial statements.
33
Statement of Assets and Liabilities as of April 30, 2021 (Unaudited)
| Assets |
Investment in securities, at value
(identified cost $1,086,051,955) | $1,159,413,423 |
| Cash collateral on deposit at broker for futures contracts | 1,302,250 |
| Cash | 29,899,036 |
| Receivables: | |
| Interest | 11,161,684 |
| Fund shares sold | 3,906,258 |
| Investment securities sold | 1,775,223 |
| Variation margin on futures contracts | 68,122 |
| Other assets | 21,576 |
| Total assets | 1,207,547,572 |
| Liabilities |
| Payables: | |
| Fund shares redeemed | 1,629,649 |
| Manager (See Note 3) | 443,429 |
| NYLIFE Distributors (See Note 3) | 111,868 |
| Professional fees | 52,650 |
| Transfer agent (See Note 3) | 42,218 |
| Custodian | 12,795 |
| Shareholder communication | 12,280 |
| Accrued expenses | 1,477 |
| Distributions payable | 667,553 |
| Total liabilities | 2,973,919 |
| Net assets | $1,204,573,653 |
| Composition of Net Assets |
| Shares of beneficial interest outstanding (par value of $.001 per share) unlimited number of shares authorized | $ 109,161 |
| Additional paid-in-capital | 1,154,103,700 |
| | 1,154,212,861 |
| Total distributable earnings (loss) | 50,360,792 |
| Net assets | $1,204,573,653 |
| Class A | |
| Net assets applicable to outstanding shares | $420,499,017 |
| Shares of beneficial interest outstanding | 38,108,889 |
| Net asset value per share outstanding | $ 11.03 |
| Maximum sales charge (4.50% of offering price) | 0.52 |
| Maximum offering price per share outstanding | $ 11.55 |
| Investor Class | |
| Net assets applicable to outstanding shares | $ 687,025 |
| Shares of beneficial interest outstanding | 62,261 |
| Net asset value per share outstanding | $ 11.03 |
| Maximum sales charge (4.00% of offering price) | 0.46 |
| Maximum offering price per share outstanding | $ 11.49 |
| Class C | |
| Net assets applicable to outstanding shares | $ 62,587,769 |
| Shares of beneficial interest outstanding | 5,671,281 |
| Net asset value and offering price per share outstanding | $ 11.04 |
| Class C2 | |
| Net assets applicable to outstanding shares | $ 189,580 |
| Shares of beneficial interest outstanding | 17,176 |
| Net asset value and offering price per share outstanding | $ 11.04 |
| Class I | |
| Net assets applicable to outstanding shares | $718,243,560 |
| Shares of beneficial interest outstanding | 65,086,955 |
| Net asset value and offering price per share outstanding | $ 11.04 |
| Class R6 | |
| Net assets applicable to outstanding shares | $ 2,366,702 |
| Shares of beneficial interest outstanding | 214,380 |
| Net asset value and offering price per share outstanding | $ 11.04 |
The notes to the financial statements are an integral part of, and should be read in conjunction with, the financial statements.
| 34 | MainStay MacKay California Tax Free Opportunities Fund |
Statement of Operations for the six months ended April 30, 2021 (Unaudited)
| Investment Income (Loss) |
| Income | |
| Interest | $15,826,136 |
| Expenses | |
| Manager (See Note 3) | 2,783,590 |
| Distribution/Service—Class A (See Note 3) | 502,687 |
| Distribution/Service—Investor Class (See Note 3) | 862 |
| Distribution/Service—Class C (See Note 3) | 157,360 |
| Distribution/Service—Class C2 (See Note 3) | 488 |
| Transfer agent (See Note 3) | 135,361 |
| Professional fees | 61,292 |
| Custodian | 15,709 |
| Shareholder communication | 14,849 |
| Registration | 12,457 |
| Trustees | 12,027 |
| Insurance | 4,623 |
| Miscellaneous | 17,114 |
| Total expenses before waiver/reimbursement | 3,718,419 |
| Expense waiver/reimbursement from Manager (See Note 3) | (187,431) |
| Net expenses | 3,530,988 |
| Net investment income (loss) | 12,295,148 |
| Realized and Unrealized Gain (Loss) |
| Net realized gain (loss) on: | |
| Unaffiliated investment transactions | 1,149,462 |
| Futures transactions | 4,672,084 |
| Net realized gain (loss) | 5,821,546 |
| Net change in unrealized appreciation (depreciation) on: | |
| Unaffiliated investments | 24,999,780 |
| Futures contracts | 58,413 |
| Net change in unrealized appreciation (depreciation) | 25,058,193 |
| Net realized and unrealized gain (loss) | 30,879,739 |
| Net increase (decrease) in net assets resulting from operations | $43,174,887 |
The notes to the financial statements are an integral part of, and should be read in conjunction with, the financial statements.
35
Statements of Changes in Net Assets
for the six months ended April 30, 2021 (Unaudited) and the year ended October 31, 2020
| | 2021 | 2020 |
| Increase (Decrease) in Net Assets |
| Operations: | | |
| Net investment income (loss) | $ 12,295,148 | $ 19,311,828 |
| Net realized gain (loss) | 5,821,546 | (8,349,814) |
| Net change in unrealized appreciation (depreciation) | 25,058,193 | 11,566,222 |
| Net increase (decrease) in net assets resulting from operations | 43,174,887 | 22,525,236 |
| Distributions to shareholders: | | |
| Class A | (4,702,475) | (8,444,924) |
| Investor Class | (8,027) | (15,590) |
| Class C | (653,470) | (1,330,416) |
| Class C2 | (1,389) | (85) |
| Class I | (8,965,586) | (14,540,611) |
| Class R6 | (33,957) | (69,947) |
| Total distributions to shareholders | (14,364,904) | (24,401,573) |
| Capital share transactions: | | |
| Net proceeds from sales of shares | 217,974,563 | 560,826,541 |
| Net asset value of shares issued to shareholder in reinvestment of distributions | 9,844,447 | 16,605,174 |
| Cost of shares redeemed | (147,170,130) | (255,608,127) |
| Increase (decrease) in net assets derived from capital share transactions | 80,648,880 | 321,823,588 |
| Net increase (decrease) in net assets | 109,458,863 | 319,950,251 |
| Net Assets |
| Beginning of period | 1,095,114,790 | 775,164,539 |
| End of period | $1,204,573,653 | $1,095,114,790 |
The notes to the financial statements are an integral part of, and should be read in conjunction with, the financial statements.
| 36 | MainStay MacKay California Tax Free Opportunities Fund |
Financial Highlights selected per share data and ratios
| | Six months ended
April 30,
2021* | | Year Ended October 31, |
| Class A | 2020 | | 2019 | | 2018 | | 2017 | | 2016 |
| Net asset value at beginning of period | $ 10.75 | | $ 10.76 | | $ 10.12 | | $ 10.29 | | $ 10.48 | | $ 10.11 |
| Net investment income (loss) | 0.11 | | 0.23 | | 0.28 | | 0.31 | | 0.32 | | 0.33 |
| Net realized and unrealized gain (loss) on investments | 0.30 | | 0.03 | | 0.64 | | (0.17) | | (0.19) | | 0.37 |
| Total from investment operations | 0.41 | | 0.26 | | 0.92 | | 0.14 | | 0.13 | | 0.70 |
| Less distributions: | | | | | | | | | | | |
| From net investment income | (0.13) | | (0.27) | | (0.28) | | (0.31) | | (0.32) | | (0.33) |
| Net asset value at end of period | $ 11.03 | | $ 10.75 | | $ 10.76 | | $ 10.12 | | $ 10.29 | | $ 10.48 |
| Total investment return (a) | 3.80% | | 2.46% | | 9.20% | | 1.39% | | 1.36% | | 6.98% |
| Ratios (to average net assets)/Supplemental Data: | | | | | | | | | | | |
| Net investment income (loss) | 2.00%†† | | 1.97% | | 2.65% | | 3.04% | | 3.17% | | 3.01% |
| Net expenses (b) | 0.75%†† | | 0.75% | | 0.75% | | 0.75% | | 0.75% | | 0.75% |
| Expenses (before waiver/reimbursement) (b) | 0.78%†† | | 0.80% | | 0.81% | | 0.82% | | 0.82% | | 0.83% |
| Portfolio turnover rate | 6% (c) | | 29% (c) | | 47% (c) | | 32% | | 83% | | 27% |
| Net assets at end of period (in 000’s) | $ 420,499 | | $ 373,966 | | $ 292,589 | | $ 145,668 | | $ 107,278 | | $ 146,843 |
| * | Unaudited. |
| †† | Annualized. |
| (a) | Total investment return is calculated exclusive of sales charges and assumes the reinvestment of dividends and distributions. For periods of less than one year, total return is not annualized. |
| (b) | In addition to the fees and expenses which the Fund bears directly, it also indirectly bears a pro-rata share of the fees and expenses of the underlying funds in which it invests. Such indirect expenses are not included in the above expense ratios. |
| (c) | The portfolio turnover rate includes variable rate demand notes. |
| | Six months ended
April 30,
2021* | | Year Ended October 31, |
| Investor Class | 2020 | | 2019 | | 2018 | | 2017 | | 2016 |
| Net asset value at beginning of period | $ 10.76 | | $ 10.76 | | $ 10.12 | | $ 10.29 | | $ 10.49 | | $ 10.11 |
| Net investment income (loss) | 0.10 | | 0.23 | | 0.28 | | 0.31 | | 0.32 | | 0.33 |
| Net realized and unrealized gain (loss) on investments | 0.30 | | 0.04 | | 0.64 | | (0.17) | | (0.20) | | 0.38 |
| Total from investment operations | 0.40 | | 0.27 | | 0.92 | | 0.14 | | 0.12 | | 0.71 |
| Less distributions: | | | | | | | | | | | |
| From net investment income | (0.13) | | (0.27) | | (0.28) | | 0.31 | | (0.32) | | (0.33) |
| Net asset value at end of period | $ 11.03 | | $ 10.76 | | $ 10.76 | | $ 10.12 | | $ 10.29 | | $ 10.49 |
| Total investment return (a) | 3.70% | | 2.53% | | 9.18% | | 1.36% | | 1.23% | | 7.04% |
| Ratios (to average net assets)/Supplemental Data: | | | | | | | | | | | |
| Net investment income (loss) | 1.90%†† | | 1.95% | | 2.65% | | 3.03% | | 3.15% | | 3.04% |
| Net expenses (b) | 0.77%†† | | 0.77% | | 0.77% | | 0.78% | | 0.79% | | 0.79% |
| Expenses (before waiver/reimbursement) (b) | 0.80%†† | | 0.82% | | 0.83% | | 0.85% | | 0.86% | | 0.87% |
| Portfolio turnover rate | 6% (c) | | 29% (c) | | 47% (c) | | 32% | | 83% | | 27% |
| Net assets at end of period (in 000’s) | $ 687 | | $ 672 | | $ 506 | | $ 343 | | $ 285 | | $ 369 |
| * | Unaudited. |
| †† | Annualized. |
| (a) | Total investment return is calculated exclusive of sales charges and assumes the reinvestment of dividends and distributions. For periods of less than one year, total return is not annualized. |
| (b) | In addition to the fees and expenses which the Fund bears directly, it also indirectly bears a pro-rata share of the fees and expenses of the underlying funds in which it invests. Such indirect expenses are not included in the above expense ratios. |
| (c) | The portfolio turnover rate includes variable rate demand notes. |
The notes to the financial statements are an integral part of, and should be read in conjunction with, the financial statements.
37
Financial Highlights selected per share data and ratios
| | Six months ended
April 30,
2021* | | Year Ended October 31, |
| Class C | 2020 | | 2019 | | 2018 | | 2017 | | 2016 |
| Net asset value at beginning of period | $ 10.76 | | $ 10.77 | | $ 10.12 | | $ 10.29 | | $ 10.48 | | $ 10.11 |
| Net investment income (loss) | 0.09 | | 0.19 | | 0.25 | | 0.28 | | 0.30 | | 0.30 |
| Net realized and unrealized gain (loss) on investments | 0.30 | | 0.04 | | 0.65 | | (0.17) | | (0.19) | | 0.37 |
| Total from investment operations | 0.39 | | 0.23 | | 0.90 | | 0.11 | | 0.11 | | 0.67 |
| Less distributions: | | | | | | | | | | | |
| From net investment income | (0.11) | | (0.24) | | (0.25) | | (0.28) | | (0.30) | | (0.30) |
| Net asset value at end of period | $ 11.04 | | $ 10.76 | | $ 10.77 | | $ 10.12 | | $ 10.29 | | $ 10.48 |
| Total investment return (a) | 3.66% | | 2.18% | | 9.01% | | 1.11% | | 1.07% | | 6.67% |
| Ratios (to average net assets)/Supplemental Data: | | | | | | | | | | | |
| Net investment income (loss) | 1.67%†† | | 1.70% | | 2.38% | | 2.76% | | 2.89% | | 2.75% |
| Net expenses (b) | 1.02%†† | | 1.02% | | 1.02% | | 1.03% | | 1.04% | | 1.04% |
| Expenses (before waiver/reimbursement) (b) | 1.05%†† | | 1.07% | | 1.08% | | 1.10% | | 1.11% | | 1.12% |
| Portfolio turnover rate | 6% (c) | | 29% (c) | | 47% (c) | | 32% | | 83% | | 27% |
| Net assets at end of period (in 000’s) | $ 62,588 | | $ 61,662 | | $ 52,964 | | $ 29,450 | | $ 26,623 | | $ 26,156 |
| * | Unaudited. |
| †† | Annualized. |
| (a) | Total investment return is calculated exclusive of sales charges and assumes the reinvestment of dividends and distributions. For periods of less than one year, total return is not annualized. |
| (b) | In addition to the fees and expenses which the Fund bears directly, it also indirectly bears a pro-rata share of the fees and expenses of the underlying funds in which it invests. Such indirect expenses are not included in the above expense ratios. |
| (c) | The portfolio turnover rate includes variable rate demand notes. |
| | Six months ended
April 30,
2021* | | August 31, 2020^ through
October 31, |
| Class C2 | 2020 |
| Net asset value at beginning of period | $ 10.75 | | $ 10.83 |
| Net investment income (loss) | 0.07 | | 0.03 |
| Net realized and unrealized gain (loss) on investments | 0.32 | | (0.07) |
| Total from investment operations | 0.39 | | (0.04) |
| Less distributions: | | | |
| From net investment income | (0.10) | | (0.04) |
| Net asset value at end of period | $ 11.04 | | $ 10.75 |
| Total investment return (a) | 3.67% | | (0.40)% |
| Ratios (to average net assets)/Supplemental Data: | | | |
| Net investment income (loss)†† | 1.35% | | 1.49% |
| Net expenses†† (b) | 1.15% | | 1.16% |
| Expenses (before waiver/reimbursement)†† (b) | 1.18% | | 1.22% |
| Portfolio turnover rate (c) | 6% | | 29% |
| Net assets at end of period (in 000’s) | $ 190 | | $ 25 |
| * | Unaudited. |
| ^ | Inception date. |
| †† | Annualized. |
| (a) | Total investment return is calculated exclusive of sales charges and assumes the reinvestment of dividends and distributions. For periods of less than one year, total return is not annualized. |
| (b) | In addition to the fees and expenses which the Fund bears directly, it also indirectly bears a pro-rata share of the fees and expenses of the underlying funds in which it invests. Such indirect expenses are not included in the above expense ratios. |
| (c) | The portfolio turnover rate includes variable rate demand notes. |
The notes to the financial statements are an integral part of, and should be read in conjunction with, the financial statements.
| 38 | MainStay MacKay California Tax Free Opportunities Fund |
Financial Highlights selected per share data and ratios
| | Six months ended
April 30,
2021* | | Year Ended October 31, |
| Class I | 2020 | | 2019 | | 2018 | | 2017 | | 2016 |
| Net asset value at beginning of period | $ 10.76 | | $ 10.76 | | $ 10.12 | | $ 10.29 | | $ 10.48 | | $ 10.11 |
| Net investment income (loss) | 0.12 | | 0.28 | | 0.31 | | 0.34 | | 0.35 | | 0.36 |
| Net realized and unrealized gain (loss) on investments | 0.30 | | 0.02 | | 0.64 | | (0.17) | | (0.19) | | 0.37 |
| Total from investment operations | 0.42 | | 0.30 | | 0.95 | | 0.17 | | 0.16 | | 0.73 |
| Less distributions: | | | | | | | | | | | |
| From net investment income | (0.14) | | (0.30) | | (0.31) | | (0.34) | | (0.35) | | (0.36) |
| Net asset value at end of period | $ 11.04 | | $ 10.76 | | $ 10.76 | | $ 10.12 | | $ 10.29 | | $ 10.48 |
| Total investment return (a) | 3.93% | | 2.81% | | 9.48% | | 1.65% | | 1.62% | | 7.25% |
| Ratios (to average net assets)/Supplemental Data: | | | | | | | | | | | |
| Net investment income (loss) | 2.23%†† | | 2.20% | | 2.91% | | 3.29% | | 3.42% | | 3.28% |
| Net expenses (b) | 0.50%†† | | 0.50% | | 0.50% | | 0.50% | | 0.50% | | 0.50% |
| Expenses (before waiver/reimbursement) (b) | 0.53%†† | | 0.55% | | 0.56% | | 0.57% | | 0.57% | | 0.58% |
| Portfolio turnover rate | 6% (c) | | 29% (c) | | 47% (c) | | 32% | | 83% | | 27% |
| Net assets at end of period (in 000’s) | $ 718,244 | | $ 655,579 | | $ 429,106 | | $ 228,220 | | $ 148,819 | | $ 154,379 |
| * | Unaudited. |
| †† | Annualized. |
| (a) | Total investment return is calculated exclusive of sales charges and assumes the reinvestment of dividends and distributions. Class I shares are not subject to sales charges. For periods of less than one year, total return is not annualized. |
| (b) | In addition to the fees and expenses which the Fund bears directly, it also indirectly bears a pro-rata share of the fees and expenses of the underlying funds in which it invests. Such indirect expenses are not included in the above expense ratios. |
| (c) | The portfolio turnover rate includes variable rate demand notes. |
| | Six months ended
April 30,
2021* | | November 1, 2019^ through
October 31, |
| Class R6 | 2020 |
| Net asset value at beginning of period | $ 10.76 | | $ 10.77 |
| Net investment income (loss) | 0.12 | | 0.25 |
| Net realized and unrealized gain (loss) on investments | 0.30 | | 0.04 |
| Total from investment operations | 0.42 | | 0.29 |
| Less distributions: | | | |
| From net investment income | (0.14) | | (0.30) |
| Net asset value at end of period | $ 11.04 | | $ 10.76 |
| Total investment return (a) | 3.94% | | 2.83% |
| Ratios (to average net assets)/Supplemental Data: | | | |
| Net investment income (loss) | 2.21%†† | | 2.25% |
| Net expenses (b) | 0.48%†† | | 0.48% |
| Expenses (before waiver/reimbursement) (b) | 0.51%†† | | 0.53% |
| Portfolio turnover rate (c) | 6% | | 29% |
| Net assets at end of period (in 000’s) | $ 2,367 | | $ 3,211 |
| * | Unaudited. |
| ^ | Inception date. |
| †† | Annualized. |
| (a) | Total investment return is calculated exclusive of sales charges and assumes the reinvestment of dividends and distributions. Class R6 shares are not subject to sales charges. For periods of less than one year, total return is not annualized. |
| (b) | In addition to the fees and expenses which the Fund bears directly, it also indirectly bears a pro-rata share of the fees and expenses of the underlying funds in which it invests. Such indirect expenses are not included in the above expense ratios. |
| (c) | The portfolio turnover rate includes variable rate demand notes. |
The notes to the financial statements are an integral part of, and should be read in conjunction with, the financial statements.
39
5. Modified duration is inversely related to the approximate percentage change in price for a given change in yield. Duration to worst is the duration of a bond computed using the bond’s nearest call date or maturity, whichever comes first. This measure ignores future cash flow fluctuations due to embedded optionality.
Notes to Financial Statements (Unaudited)
Note 1-Organization and Business
MainStay Funds Trust (the “Trust”) was organized as a Delaware statutory trust on April 28, 2009. The Trust is registered under the Investment Company Act of 1940, as amended (the “1940 Act”), as an open-end management investment company, and is comprised of thirty-two funds (collectively referred to as the “Funds”). These financial statements and notes relate to the MainStay MacKay California Tax Free Opportunities Fund (the "Fund"), a “diversified” fund, as that term is defined in the 1940 Act, as interpreted or modified by regulatory authorities having jurisdiction, from time to time.
The following table lists the Fund's share classes that have been registered and commenced operations:
| Class | Commenced Operations |
| Class A | February 28, 2013 |
| Investor Class | February 28, 2013 |
| Class C | February 28, 2013 |
| Class C2 | August 31, 2020 |
| Class I | February 28, 2013 |
| Class R6 | November 1, 2019 |
| SIMPLE Class | N/A* |
| * | SIMPLE Class shares were registered for sale effective as of August 31, 2020 but have not yet commenced operations. |
Class A and Investor Class shares are offered at net asset value (“NAV”) per share plus an initial sales charge. No initial sales charge applies to investments of $250,000 or more (and certain other qualified purchases) in Class A and Investor Class shares. However, a contingent deferred sales charge (“CDSC”) of 1.00% may be imposed on certain redemptions made within 18 months of the date of purchase on shares that were purchased without an initial sales charge. Class C and Class C2 shares are offered at NAV without an initial sales charge, although a 1.00% CDSC may be imposed on certain redemptions of such shares made within one year of the date of purchase of Class C and Class C2 shares. Class I and Class R6 shares are offered at NAV without a sales charge. SIMPLE Class shares are currently expected to be offered at NAV without a sales charge. In addition, depending upon eligibility, Class C shares convert to either Class A or Investor Class shares at the end of the calendar quarter ten years after the date they were purchased. Additionally, Investor Class shares may convert automatically to Class A shares based on a shareholder’s account balance as described in the Fund’s prospectus. Under certain circumstances and as may be permitted by the Trust’s multiple class plan pursuant to Rule 18f-3 under the 1940 Act, specified share classes of the Fund may be converted to one or more other share classes of the Fund as disclosed in the capital share transactions within these Notes. The classes of shares have the same voting (except for issues that relate solely to one class), dividend, liquidation and other rights, and the same terms and conditions, except that under distribution plans pursuant to Rule 12b-1 under the 1940 Act, Class C and Class C2 shares are subject to higher distribution and/or
service fees than Class A, Investor Class and SIMPLE Class shares. Class I and Class R6 shares are not subject to a distribution and/or service fee.
The Fund's investment objective is to seek current income exempt from federal and California income taxes.
Note 2–Significant Accounting Policies
The Fund is an investment company and accordingly follows the investment company accounting and reporting guidance of the Financial Accounting Standards Board (“FASB”) Accounting Standard Codification Topic 946 Financial Services—Investment Companies. The Fund prepares its financial statements in accordance with generally accepted accounting principles (“GAAP”) in the United States of America and follows the significant accounting policies described below.
(A) Securities Valuation. Investments are usually valued as of the close of regular trading on the New York Stock Exchange (the "Exchange") (usually 4:00 p.m. Eastern time) on each day the Fund is open for business ("valuation date").
The Board of Trustees of the Trust (the "Board") adopted procedures establishing methodologies for the valuation of the Fund's securities and other assets and delegated the responsibility for valuation determinations under those procedures to the Valuation Committee of the Trust (the “Valuation Committee”). The procedures state that, subject to the oversight of the Board and unless otherwise noted, the responsibility for the day-to-day valuation of portfolio assets (including fair value measurements for the Fund's assets and liabilities) rests with New York Life Investment Management LLC (“New York Life Investments” or the "Manager"), aided to whatever extent necessary by the Subadvisor (as defined in Note 3(A)). To assess the appropriateness of security valuations, the Manager, the Subadvisor or the Fund's third-party service provider, who is subject to oversight by the Manager, regularly compares prior day prices, prices on comparable securities and the sale prices to the prior and current day prices and challenges prices with changes exceeding certain tolerance levels with third-party pricing services or broker sources.
The Board authorized the Valuation Committee to appoint a Valuation Subcommittee (the “Subcommittee”) to establish the prices of securities for which market quotations are not readily available or the prices of which are not otherwise readily determinable under the procedures. The Subcommittee meets (in person, via electronic mail or via teleconference) on an as-needed basis. The Valuation Committee meets to ensure that actions taken by the Subcommittee were appropriate.
For those securities valued through either a standardized fair valuation methodology or a fair valuation measurement, the Subcommittee deals with such valuation and the Valuation Committee reviews and affirms, if appropriate, the reasonableness of the valuation based on such methodologies and measurements on a regular basis after considering information that is reasonably available and deemed relevant by the Valuation Committee. Any action taken by the Subcommittee with respect
| 40 | MainStay MacKay California Tax Free Opportunities Fund |
to the valuation of a portfolio security or other asset is submitted for review and ratification (if appropriate) to the Valuation Committee and the Board at the next regularly scheduled meeting.
"Fair value" is defined as the price the Fund would reasonably expect to receive upon selling an asset or liability in an orderly transaction to an independent buyer in the principal or most advantageous market for the asset or liability. Fair value measurements are determined within a framework that establishes a three-tier hierarchy that maximizes the use of observable market data and minimizes the use of unobservable inputs to establish a classification of fair value measurements for disclosure purposes. "Inputs" refer broadly to the assumptions that market participants would use in pricing the asset or liability, including assumptions about risk, such as the risk inherent in a particular valuation technique used to measure fair value using a pricing model and/or the risk inherent in the inputs for the valuation technique. Inputs may be observable or unobservable. Observable inputs reflect the assumptions market participants would use in pricing the asset or liability based on market data obtained from sources independent of the Fund. Unobservable inputs reflect the Fund’s own assumptions about the assumptions market participants would use in pricing the asset or liability based on the information available. The inputs or methodology used for valuing assets or liabilities may not be an indication of the risks associated with investing in those assets or liabilities. The three-tier hierarchy of inputs is summarized below.
| • | Level 1—quoted prices in active markets for an identical asset or liability |
| • | Level 2—other significant observable inputs (including quoted prices for a similar asset or liability in active markets, interest rates and yield curves, prepayment speeds, credit risk, etc.) |
| • | Level 3—significant unobservable inputs (including the Fund's own assumptions about the assumptions that market participants would use in measuring fair value of an asset or liability) |
The level of an asset or liability within the fair value hierarchy is based on the lowest level of an input, both individually and in the aggregate, that is significant to the fair value measurement. The aggregate value by input level of the Fund’s assets and liabilities as of April 30, 2021, is included at the end of the Portfolio of Investments.
The Fund may use third-party vendor evaluations, whose prices may be derived from one or more of the following standard inputs, among others:
| • Benchmark yields | • Reported trades |
| • Broker/dealer quotes | • Issuer spreads |
| • Two-sided markets | • Benchmark securities |
| • Bids/offers | • Reference data (corporate actions or material event notices) |
| • Industry and economic events | • Comparable bonds |
| • Monthly payment information | |
An asset or liability for which market values cannot be measured using the methodologies described above is valued by methods deemed reasonable in good faith by the Valuation Committee, following the procedures established by the Board, to represent fair value. Under these procedures, the Fund generally uses a market-based approach which may use related or comparable assets or liabilities, recent transactions, market multiples, book values and other relevant information. The Fund may also use an income-based valuation approach in which the anticipated future cash flows of the asset or liability are discounted to calculate fair value. Discounts may also be applied due to the nature and/or duration of any restrictions on the disposition of the asset or liability. Fair value represents a good faith approximation of the value of a security. Fair value determinations involve the consideration of a number of subjective factors, an analysis of applicable facts and circumstances and the exercise of judgment. As a result, it is possible that the fair value for a security determined in good faith in accordance with the Fund's valuation procedures may differ from valuations for the same security determined by other funds using their own valuation procedures. Although the Fund's valuation procedures are designed to value a security at the price the Fund may reasonably expect to receive upon the security's sale in an orderly transaction, there can be no assurance that any fair value determination thereunder would, in fact, approximate the amount that the Fund would actually realize upon the sale of the security or the price at which the security would trade if a reliable market price were readily available. During the six-month period ended April 30, 2021, there were no material changes to the fair value methodologies.
Securities which may be valued in this manner include, but are not limited to: (i) a security for which trading has been halted or suspended; (ii) a debt security that has recently gone into default and for which there is not a current market quotation; (iii) a security of an issuer that has entered into a restructuring; (iv) a security that has been delisted from a national exchange; (v) a security for which the market price is not readily available from a third-party pricing source or, if so provided, does not, in the opinion of the Manager or the Subadvisor, reflect the security's market value; (vi) a security subject to trading collars for which no or limited trading takes place; and (vii) a security whose principal market has been temporarily closed at a time when, under normal conditions, it would be open. Securities valued in this manner are generally categorized as Level 3 in the hierarchy. No securities held by the Fund as of April 30, 2021 were fair valued in such a manner.
Investments in mutual funds, including money market funds, are valued at their respective NAVs at the close of business each day on the valuation date. These securities are generally categorized as Level 1 in the hierarchy.
Futures contracts are valued at the last posted settlement price on the market where such futures are primarily traded. These securities are generally categorized as Level 1 in the hierarchy.
Municipal debt securities are valued at the evaluated mean prices supplied by a pricing agent or broker selected by the Manager, in consultation with the Subadvisor. The evaluations are market-based
Notes to Financial Statements (Unaudited) (continued)
measurements processed through a pricing application and represents the pricing agent's good faith determination as to what a holder may receive in an orderly transaction under market conditions. The rules-based logic utilizes valuation techniques that reflect participants' assumptions and vary by asset class and per methodology, maximizing the use of relevant observable data including quoted prices for similar assets, benchmark yield curves and market corroborated inputs. The evaluated bid or mean prices are deemed by the Manager, in consultation with the Subadvisor, to be representative of market values, at the regular close of trading of the Exchange on each valuation date. Municipal debt securities purchased on a delayed delivery basis are marked to market daily until settlement at the forward settlement date. Municipal debt securities are generally categorized as Level 2 in the hierarchy.
Temporary cash investments acquired in excess of 60 days to maturity at the time of purchase are valued using the latest bid prices or using valuations based on a matrix system (which considers such factors as security prices, yields, maturities and ratings), both as furnished by independent pricing services. Temporary cash investments that mature in 60 days or less at the time of purchase ("Short-Term Investments") are valued using the amortized cost method of valuation, unless the use of such method would be inappropriate. The amortized cost method involves valuing a security at its cost on the date of purchase and thereafter assuming a constant amortization to maturity of the difference between such cost and the value on maturity date. Amortized cost approximates the current fair value of a security. Securities valued using the amortized cost method are not valued using quoted prices in an active market and are generally categorized as Level 2 in the hierarchy.
The information above is not intended to reflect an exhaustive list of the methodologies that may be used to value portfolio investments. The valuation procedures permit the use of a variety of valuation methodologies in connection with valuing portfolio investments. The methodology used for a specific type of investment may vary based on the market data available or other considerations. The methodologies summarized above may not represent the specific means by which portfolio investments are valued on any particular business day.
(B) Income Taxes. The Fund's policy is to comply with the requirements of the Internal Revenue Code of 1986, as amended (the “Internal Revenue Code”), applicable to regulated investment companies and to distribute all of its taxable income to the shareholders of the Fund within the allowable time limits.
The Manager evaluates the Fund’s tax positions to determine if the tax positions taken meet the minimum recognition threshold in connection with accounting for uncertainties in income tax positions taken or expected to be taken for the purposes of measuring and recognizing tax liabilities in the financial statements. Recognition of tax benefits of an uncertain tax position is permitted only to the extent the position is “more likely than not” to be sustained assuming examination by taxing authorities. The Manager analyzed the Fund's tax positions taken on federal, state and local income tax returns for all open tax years (for up to three tax years) and has concluded that no provisions for federal, state
and local income tax are required in the Fund's financial statements. The Fund's federal, state and local income tax and federal excise tax returns for tax years for which the applicable statutes of limitations have not expired are subject to examination by the Internal Revenue Service and state and local departments of revenue.
(C) Dividends and Distributions to Shareholders. Dividends and distributions are recorded on the ex-dividend date. The Fund intends to declare dividends from net investment income, if any, daily and intends to pay them at least monthly and declares and pays distributions from net realized capital gains, if any, at least annually. Unless a shareholder elects otherwise, all dividends and distributions are reinvested at NAV in the same class of shares of the Fund. Dividends and distributions to shareholders are determined in accordance with federal income tax regulations and may differ from determinations using GAAP.
(D) Security Transactions and Investment Income. The Fund records security transactions on the trade date. Realized gains and losses on security transactions are determined using the identified cost method. Distributions received from real estate investment trusts may be classified as dividends, capital gains and/or return of capital. Discounts and premiums on securities purchased, other than temporary cash investments that mature in 60 days or less at the time of purchase, for the Fund are accreted and amortized, respectively, on the effective interest rate method.
Investment income and realized and unrealized gains and losses on investments of the Fund are allocated pro rata to the separate classes of shares based upon their relative net assets on the date the income is earned or realized and unrealized gains and losses are incurred.
The Fund may place a debt security on non-accrual status and reduce related interest income by ceasing current accruals and writing off all or a portion of any interest receivables when the collection of all or a portion of such interest has become doubtful. A debt security is removed from non-accrual status when the issuer resumes interest payments or when collectability of interest is reasonably assured.
(E) Expenses. Expenses of the Trust are allocated to the individual Funds in proportion to the net assets of the respective Funds when the expenses are incurred, except where direct allocations of expenses can be made. Expenses (other than transfer agent expenses and fees incurred under the shareholder services plans and/or the distribution plans further discussed in Note 3(B)) are allocated to separate classes of shares pro rata based upon their relative net assets on the date the expenses are incurred. The expenses borne by the Fund, including those of related parties to the Fund, are shown in the Statement of Operations.
Additionally, the Fund may invest in mutual funds, which are subject to management fees and other fees that may cause the costs of investing in mutual funds to be greater than the costs of owning the underlying securities directly. These indirect expenses of mutual funds are not included in the amounts shown as expenses in the Statement of Operations or in the expense ratios included in the Financial Highlights.
| 42 | MainStay MacKay California Tax Free Opportunities Fund |
(F) Use of Estimates. In preparing financial statements in conformity with GAAP, the Manager makes estimates and assumptions that affect the reported amounts and disclosures in the financial statements. Actual results could differ from those estimates and assumptions.
(G) Futures Contracts. A futures contract is an agreement to purchase or sell a specified quantity of an underlying instrument at a specified future date and price, or to make or receive a cash payment based on the value of a financial instrument (e.g., foreign currency, interest rate, security or securities index). The Fund is subject to risks such as market price risk and/or interest rate risk in the normal course of investing in these contracts. Upon entering into a futures contract, the Fund is required to pledge to the broker or futures commission merchant an amount of cash and/or U.S. government securities equal to a certain percentage of the collateral amount, known as the “initial margin.” During the period the futures contract is open, changes in the value of the contract are recognized as unrealized appreciation or depreciation by marking to market such contract on a daily basis to reflect the market value of the contract at the end of each day’s trading. The Fund agrees to receive from or pay to the broker or futures commission merchant an amount of cash equal to the daily fluctuation in the value of the contract. Such receipts or payments are known as “variation margin.” When the futures contract is closed, the Fund records a realized gain or loss equal to the difference between the proceeds from (or cost of) the closing transaction and the Fund's basis in the contract.
The use of futures contracts involves, to varying degrees, elements of market risk in excess of the amount recognized in the Statement of Assets and Liabilities. The contract or notional amounts and variation margin reflect the extent of the Fund's involvement in open futures positions. There are several risks associated with the use of futures contracts as hedging techniques. There can be no assurance that a liquid market will exist at the time when the Fund seeks to close out a futures contract. If no liquid market exists, the Fund would remain obligated to meet margin requirements until the position is closed. Futures contracts may involve a small initial investment relative to the risk assumed, which could result in losses greater than if the Fund did not invest in futures contracts. Futures contracts may be more volatile than direct investments in the instrument underlying the futures and may not correlate to the underlying instrument, causing a given hedge not to achieve its objectives. The Fund's activities in futures contracts have minimal counterparty risk as they are conducted through regulated exchanges that guarantee the futures against default by the counterparty. In the event of a bankruptcy or insolvency of a futures commission merchant that holds margin on behalf of the Fund, the Fund may not be entitled to the return of the entire margin owed to the Fund, potentially resulting in a loss. The Fund may invest in futures contracts to seek enhanced returns or to reduce the risk of loss by hedging certain of its holdings. The Fund's investment in futures contracts and other derivatives may increase the volatility of the Fund's NAVs and may result in a loss to the Fund. Open futures contracts as of April 30, 2021 are shown in the Portfolio of Investments.
(H) Municipal Bond Risk. The Fund may invest more heavily in municipal bonds from certain cities, states, territories or regions than others, which may increase the Fund’s exposure to losses resulting from economic, political, regulatory occurrences, or declines in tax revenue impacting these particular cities, states, territories or regions. In addition, many state and municipal governments that issue securities are under significant economic and financial stress and may not be able to satisfy their obligations, and these events may be made worse due to economic challenges posed by COVID-19. The Fund may invest a substantial amount of its assets in municipal bonds whose interest is paid solely from revenues of similar projects, such as tobacco settlement bonds. If the Fund concentrates its investments in this manner, it assumes the legal and economic risks relating to such projects and this may have a significant impact on the Fund’s investment performance.
Certain of the issuers in which the Fund may invest have recently experienced, or may experience, significant financial difficulties and repeated credit rating downgrades. On May 3, 2017, the Commonwealth of Puerto Rico began proceedings pursuant to the Puerto Rico Oversight, Management, and Economic Stability Act (“PROMESA”) to seek bankruptcy-type protections from approximately $74 billion in debt and approximately $48 billion in unfunded pension obligations. In addition, the economic downturn following the outbreak of COVID-19 and the resulting pressure on Puerto Rico’s budget have further contributed to its financial challenges. The federal government has passed certain relief packages, such as the Coronavirus Aid, Relief, and Economic Security Act and the American Rescue Plan, which include more than $5 billion in disaster relief funds for the U.S. territories, including Puerto Rico. However, there can be no assurances that the federal funds allocated to the Commonwealth will be sufficient to address the economic challenges arising from COVID-19. Puerto Rico has reached agreements with certain bondholders to restructure outstanding debt issued by certain of Puerto Rico’s instrumentalities and is negotiating the restructuring of its debt with certain other bondholders. Under the terms of these agreements, amounts due to bondholders, including the Fund, may be substantially lower than the original investment. Any agreement to restructure such outstanding debt must be approved by the judge overseeing the debt restructuring. Puerto Rico’s debt restructuring process and other economic, political, social, environmental or health factors or developments could occur rapidly and may significantly affect the value of municipal securities of Puerto Rico. Due to the ongoing budget impact from COVID-19 on the Commonwealth’s finances, the Federal Oversight and Management Board or the Commonwealth could seek to revise or even terminate earlier agreements reached with certain creditors prior to the outbreak of COVID-19. Any agreement between the Federal Oversight and Management Board and creditors is subject to approval by the judge overseeing the Title III proceedings. The composition of the Federal Oversight and Management Board has changed significantly during the past year due to existing members either stepping down or being replaced following the expiration of a member's term. There is no assurance that board members will approve the restructuring agreements the prior board had negotiated.
Notes to Financial Statements (Unaudited) (continued)
The Fund’s vulnerability to potential losses associated with such developments may be reduced through investing in municipal securities that feature credit enhancements (such as bond insurance). The bond insurance provider pays both principal and interest when due to the bond holder. The magnitude of Puerto Rico’s debt restructuring or other adverse economic developments could pose significant strains on the ability of municipal securities insurers to meet all future claims. As of April 30, 2021, 65.6% of the Puerto Rico municipal securities held by the Fund were insured.
(I) Indemnifications. Under the Trust’s organizational documents, its officers and trustees are indemnified against certain liabilities that may arise out of performance of their duties to the Trust. Additionally, in the normal course of business, the Fund enters into contracts with third-party service providers that contain a variety of representations and warranties and that may provide general indemnifications. The Fund's maximum exposure under these arrangements is unknown, as this would involve future claims that may be made against the Fund that have not yet occurred. The Manager believes that the risk of loss in connection with these potential indemnification obligations is remote. However, there can be no assurance that material liabilities related to such obligations will not arise in the future, which could adversely impact the Fund.
(J) Quantitative Disclosure of Derivative Holdings. The following tables show additional disclosures related to the Fund's derivative and hedging activities, including how such activities are accounted for and their effect on the Fund's financial positions, performance and cash flows.
The Fund entered into futures contracts to help manage the duration and yield curve positioning of the portfolio. These derivatives are not accounted for as hedging instruments.
Fair value of derivative instruments as of April 30, 2021:
| Asset Derivatives | Interest
Rate
Contracts
Risk | Total |
| Futures Contracts - Net Assets—Net unrealized appreciation on futures contracts (a) | $649,786 | $649,786 |
| Total Fair Value | $649,786 | $649,786 |
| (a) | Includes cumulative appreciation (depreciation) of futures contracts as reported in the Portfolio of Investments. Only current day’s variation margin is reported within the Statement of Assets and Liabilities. |
The effect of derivative instruments on the Statement of Operations for the six-month period ended April 30, 2021:
| Net Realized Gain (Loss) from: | Interest
Rate
Contracts
Risk | Total |
| Futures Contracts | $4,672,084 | $4,672,084 |
| Total Net Realized Gain (Loss) | $4,672,084 | $4,672,084 |
| Net Change in Unrealized Appreciation (Depreciation) | Interest
Rate
Contracts
Risk | Total |
| Futures Contracts | $58,413 | $58,413 |
| Total Net Change in Unrealized Appreciation (Depreciation) | $58,413 | $58,413 |
| Average Notional Amount | Total |
| Futures Contracts Short | $(59,106,245) |
Note 3–Fees and Related Party Transactions
(A) Manager and Subadvisor. New York Life Investments, a registered investment adviser and an indirect, wholly-owned subsidiary of New York Life Insurance Company ("New York Life"), serves as the Fund's Manager, pursuant to an Amended and Restated Management Agreement ("Management Agreement"). The Manager provides offices, conducts clerical, recordkeeping and bookkeeping services and keeps most of the financial and accounting records required to be maintained by the Fund. Except for the portion of salaries and expenses that are the responsibility of the Fund, the Manager pays the salaries and expenses of all personnel affiliated with the Fund and certain operational expenses of the Fund. The Fund reimburses New York Life Investments in an amount equal to the portion of the compensation of the Chief Compliance Officer attributable to the Fund. MacKay Shields LLC ("MacKay Shields" or the "Subadvisor"), a registered investment adviser and an indirect, wholly-owned subsidiary of New York Life, serves as Subadvisor to the Fund and is responsible for the day-to-day portfolio management of the Fund. Pursuant to the terms of an Amended and Restated Subadvisory Agreement ("Subadvisory Agreement") between New York Life Investments and MacKay Shields, New York Life Investments pays for the services of the Subadvisor.
Effective February 28, 2021, pursuant to the Management Agreement, the Fund pays the Manager a monthly fee for the services performed and the facilities furnished at an annual rate of the Fund’s average daily net assets as follows: 0.45% up to $1 billion; 0.43% from $1 billion up to $3 billion and 0.42% in excess of $3 billion. During the six-month period ended April 30, 2021, the effective management fee rate was 0.48% of the Fund’s average daily net assets, exclusive of any applicable waivers/reimbursements.
Prior to February 28, 2021, the Fund paid the Manager a monthly fee for the services performed and the facilities furnished at an annual rate of the Fund’s average daily net assets as follows: 0.50% up to $1 billion and 0.48% in excess of $1 billion.
Prior to February 28, 2021, New York Life Investments had contractually agreed to waive a portion of its management fee so that the management fee would not exceed the Fund’s average daily net assets as follows: 0.45% up to $1 billion and 0.43% in excess of $1 billion.
New York Life Investments has contractually agreed to waive fees and/or reimburse expenses so that Total Annual Fund Operating Expenses
| 44 | MainStay MacKay California Tax Free Opportunities Fund |
(excluding taxes, interest, litigation, extraordinary expenses, brokerage and other transaction expenses relating to the purchase or sale of portfolio investments and acquired (underlying) fund fees and expenses) of Class A shares do not exceed 0.75% of its average daily net assets. New York Life Investments will apply an equivalent waiver or reimbursement, in an equal number of basis points to Investor Class, Class C, Class C2 and Class I shares. New York Life Investments has contractually agreed to waive fees and/or reimburse expenses so that Total Annual Fund Operating Expenses (excluding taxes, interest, litigation, extraordinary expenses, brokerage and other transaction expenses relating to the purchase or sale of portfolio investments, and acquired (underlying) fund fees and expenses) of Class R6 do not exceed those of Class I. These agreements will remain in effect until February 28, 2022, and shall renew automatically for one-year terms unless New York Life Investments provides written notice of termination prior to the start of the next term or upon approval of the Board.
During the six-month period ended April 30, 2021, New York Life Investments earned fees from the Fund in the amount of $2,783,590 and waived fees and/or reimbursed expenses in the amount of $187,431 and paid the Subadvisor fees in the amount of $1,320,181.
JPMorgan Chase Bank, N.A. ("JPMorgan") provides sub-administration and sub-accounting services to the Fund pursuant to an agreement with New York Life Investments. These services include calculating the daily NAVs of the Fund, maintaining the general ledger and sub-ledger accounts for the calculation of the Fund's NAVs, and assisting New York Life Investments in conducting various aspects of the Fund's administrative operations. For providing these services to the Fund, JPMorgan is compensated by New York Life Investments.
Prior to November 23, 2020, these services were provided by State Street Bank and Trust Company ("State Street").
Pursuant to an agreement between the Trust and New York Life Investments, New York Life Investments is responsible for providing or procuring certain regulatory reporting services for the Fund. The Fund will reimburse New York Life Investments for the actual costs incurred by New York Life Investments in connection with providing or procuring these services for the Fund.
(B) Distribution and Service Fees. The Trust, on behalf of the Fund, has entered into a distribution agreement with NYLIFE Distributors LLC (the “Distributor”), an affiliate of New York Life Investments. The Fund has adopted distribution plans (the “Plans”) in accordance with the provisions of Rule 12b-1 under the 1940 Act.
Pursuant to the Class A and Investor Class Plans, the Distributor receives a monthly distribution fee from Class A and Investor Class shares at an annual rate of 0.25% of the average daily net assets of the Class A and Investor Class shares for distribution and/or service activities as designated by the Distributor. Pursuant to the Class C Plan, Class C shares pay the Distributor a monthly distribution fee at an annual rate of 0.25% of the average daily net assets of the Class C shares, along with a service fee at an annual rate of 0.25% of the average daily net assets of
the Class C shares, for a total 12b-1 fee of 0.50%. Pursuant to the Class C2 Plan, Class C2 shares pay the Distributor a monthly distribution fee at an annual rate of 0.40% of the average daily net assets of the Class C2 shares, along with a service fee at an annual rate of 0.25% of the average daily net assets of the Class C shares, for a total 12b-1 fee of 0.65%. Class I and Class R6 shares are not subject to a distribution and/or service fee.
The Plans provide that the distribution and service fees are payable to the Distributor regardless of the amounts actually expended by the Distributor for distribution of the Fund's shares and service activities.
(C) Sales Charges. The Fund was advised by the Distributor that the amount of initial sales charges retained on sales of Class A and Investor Class shares during the six-month period ended April 30, 2021, were $3,029 and $509, respectively.
The Fund was also advised that the Distributor retained CDSCs on redemptions of Class A and Class C shares during the six-month period ended April 30, 2021, of $20,061 and $6,657, respectively.
(D) Transfer, Dividend Disbursing and Shareholder Servicing Agent. NYLIM Service Company LLC, an affiliate of New York Life Investments, is the Fund's transfer, dividend disbursing and shareholder servicing agent pursuant to an agreement between NYLIM Service Company LLC and the Trust. NYLIM Service Company LLC has entered into an agreement with DST Asset Manager Solutions, Inc. ("DST"), pursuant to which DST performs certain transfer agent services on behalf of NYLIM Service Company LLC. New York Life Investments has contractually agreed to limit the transfer agency expenses charged to the Fund’s share classes to a maximum of 0.35% of that share class’s average daily net assets on an annual basis after deducting any applicable Fund or class-level expense reimbursement or small account fees. This agreement will remain in effect until February 28, 2022, and shall renew automatically for one-year terms unless New York Life Investments provides written notice of termination prior to the start of the next term or upon approval of the Board. During the six-month period ended April 30, 2021, transfer agent expenses incurred by the Fund and any reimbursements, pursuant to the aforementioned Transfer Agency expense limitation agreement, were as follows:
| Class | Expense | Waived |
| Class A | $44,653 | $— |
| Investor Class | 149 | — |
| Class C | 13,555 | — |
| Class C2 | 32 | — |
| Class I | 76,920 | — |
| Class R6 | 52 | — |
(E) Small Account Fee. Shareholders with small accounts adversely impact the cost of providing transfer agency services. In an effort to reduce total transfer agency expenses, the Fund has implemented a small account fee on certain types of accounts. As described in the Fund's prospectus, certain shareholders with an account balance of less than
Notes to Financial Statements (Unaudited) (continued)
$1,000 ($5,000 for Class A share accounts) are charged an annual per account fee of $20 (assessed semi-annually), the proceeds from which offset transfer agent fees as reflected in the Statement of Operations. This small account fee will not apply to certain types of accounts as described further in the Fund’s prospectus.
(F) Capital. As of April 30, 2021, New York Life and its affiliates beneficially held shares of the Fund with the values and percentages of net assets as follows:
| Class C2 | $25,779 | 13.6% |
| Class R6 | 26,638 | 1.1 |
Note 4-Federal Income Tax
As of April 30, 2021, the cost and unrealized appreciation (depreciation) of the Fund’s investment portfolio, including applicable derivative contracts and other financial instruments, as determined on a federal income tax basis, were as follows:
| | Federal Tax
Cost | Gross
Unrealized
Appreciation | Gross
Unrealized
(Depreciation) | Net
Unrealized
Appreciation/
(Depreciation) |
| Investments | $1,090,390,826 | $69,759,346 | $(736,749) | $69,022,597 |
As of October 31, 2020, for federal income tax purposes, capital loss carryforwards of $17,905,133 were available as shown in the table below, to the extent provided by the regulations to offset future realized gains of the Fund through the years indicated. To the extent that these capital loss carryforwards are used to offset future capital gains, it is probable that the capital gains so offset will not be distributed to shareholders. No capital gain distributions shall be made until any capital loss carryforwards have been fully utilized.
Capital Loss
Available Through | Short-Term
Capital Loss
Amounts (000’s) | Long-Term
Capital Loss
Amounts (000’s) |
| Unlimited | $14,747 | $3,158 |
During the year ended October 31, 2020, the tax character of distributions paid as reflected in the Statements of Changes in Net Assets was as follows:
| | 2020 |
| Distributions paid from: | |
| Ordinary Income | $ 344,603 |
| Long-Term Capital Gains | 24,056,970 |
| Total | $24,401,573 |
Note 5–Custodian
JPMorgan is the custodian of cash and securities held by the Fund. Custodial fees are charged to the Fund based on the Fund's net assets and/or the market value of securities held by the Fund and the number of certain transactions incurred by the Fund.
Prior to November 23, 2020, these services were provided by State Street. The services provided by State Street were a direct expense of the Fund and are included in the Statement of Operations as Custodian fees which totaled $1,909 for the period November 1, 2020 through November 22, 2020.
Note 6–Line of Credit
The Fund and certain other funds managed by New York Life Investments maintain a line of credit with a syndicate of banks in order to secure a source of funds for temporary purposes to meet unanticipated or excessive redemption requests.
Effective July 28, 2020, under the credit agreement (the “Credit Agreement”), the aggregate commitment amount is $600,000,000 with an additional uncommitted amount of $100,000,000. The commitment fee is an annual rate of 0.15% of the average commitment amount payable quarterly, regardless of usage, to JPMorgan, who serves as the agent to the syndicate. The commitment fee is allocated among the Fund and certain other funds managed by New York Life Investments based upon their respective net assets and other factors. Interest on any revolving credit loan is charged based upon the Federal Funds Rate or the one-month London Interbank Offered Rate ("LIBOR"), whichever is higher. The Credit Agreement expires on July 27, 2021, although the Fund, certain other funds managed by New York Life Investments and the syndicate of banks may renew the Credit Agreement for an additional year on the same or different terms or enter into a credit agreement with a different syndicate of banks. Prior to July 28, 2020, the aggregate commitment amount and the commitment fee were the same as those under the current Credit Agreement, but State Street served as agent to the syndicate. During the six-month period ended April 30, 2021, there were no borrowings made or outstanding with respect to the Fund under the Credit Agreement or the credit agreement for which State Street served as agent.
Note 7–Interfund Lending Program
Pursuant to an exemptive order issued by the SEC, the Fund, along with certain other funds managed by New York Life Investments, may participate in an interfund lending program. The interfund lending program provides an alternative credit facility that permits the Fund and certain other funds managed by New York Life Investments to lend or borrow money for temporary purposes directly to or from one another, subject to the conditions of the exemptive order. During the six-month period ended April 30, 2021, there were no interfund loans made or outstanding with respect to the Fund.
Note 8–Purchases and Sales of Securities (in 000’s)
During the six-month period ended April 30, 2021, purchases and sales of securities, other than short-term securities, were $128,764 and $70,089, respectively.
| 46 | MainStay MacKay California Tax Free Opportunities Fund |
Note 9–Capital Share Transactions
Transactions in capital shares for the six-month period ended April 30, 2021 and the year ended October 31, 2020, were as follows:
| Class A | Shares | Amount |
| Period ended April 30, 2021: | | |
| Shares sold | 6,837,119 | $ 75,220,152 |
| Shares issued to shareholders in reinvestment of distributions | 347,258 | 3,813,340 |
| Shares redeemed | (3,798,773) | (41,703,174) |
| Net increase (decrease) in shares outstanding before conversion | 3,385,604 | 37,330,318 |
| Shares converted into Class A (See Note 1) | 6,675 | 73,350 |
| Shares converted from Class A (See Note 1) | (55,852) | (609,652) |
| Net increase (decrease) | 3,336,427 | $ 36,794,016 |
| Year ended October 31, 2020: | | |
| Shares sold | 15,364,215 | $ 165,522,071 |
| Shares issued to shareholders in reinvestment of distributions | 646,812 | 6,952,966 |
| Shares redeemed | (8,397,726) | (87,737,921) |
| Net increase (decrease) in shares outstanding before conversion | 7,613,301 | 84,737,116 |
| Shares converted into Class A (See Note 1) | 12,481 | 134,788 |
| Shares converted from Class A (See Note 1) | (35,652) | (389,338) |
| Net increase (decrease) | 7,590,130 | $ 84,482,566 |
| |
| Investor Class | Shares | Amount |
| Period ended April 30, 2021: | | |
| Shares sold | 9,131 | $ 100,179 |
| Shares issued to shareholders in reinvestment of distributions | 722 | 7,925 |
| Shares redeemed | (3,782) | (41,512) |
| Net increase (decrease) in shares outstanding before conversion | 6,071 | 66,592 |
| Shares converted into Investor Class (See Note 1) | 367 | 4,024 |
| Shares converted from Investor Class (See Note 1) | (6,673) | (73,350) |
| Net increase (decrease) | (235) | $ (2,734) |
| Year ended October 31, 2020: | | |
| Shares sold | 34,785 | $ 373,425 |
| Shares issued to shareholders in reinvestment of distributions | 1,428 | 15,340 |
| Shares redeemed | (9,830) | (106,319) |
| Net increase (decrease) in shares outstanding before conversion | 26,383 | 282,446 |
| Shares converted into Investor Class (See Note 1) | 1,596 | 15,719 |
| Shares converted from Investor Class (See Note 1) | (12,481) | (134,788) |
| Net increase (decrease) | 15,498 | $ 163,377 |
| |
| Class C | Shares | Amount |
| Period ended April 30, 2021: | | |
| Shares sold | 588,681 | $ 6,465,294 |
| Shares issued to shareholders in reinvestment of distributions | 44,981 | 494,110 |
| Shares redeemed | (693,863) | (7,613,378) |
| Net increase (decrease) in shares outstanding before conversion | (60,201) | (653,974) |
| Shares converted from Class C (See Note 1) | (1,128) | (12,437) |
| Net increase (decrease) | (61,329) | $ (666,411) |
| Year ended October 31, 2020: | | |
| Shares sold | 2,081,990 | $ 22,255,317 |
| Shares issued to shareholders in reinvestment of distributions | 94,756 | 1,018,484 |
| Shares redeemed | (1,358,716) | (14,447,185) |
| Net increase (decrease) in shares outstanding before conversion | 818,030 | 8,826,616 |
| Shares converted from Class C (See Note 1) | (5,258) | (57,004) |
| Net increase (decrease) | 812,772 | $ 8,769,612 |
| |
| Class C2 | Shares | Amount |
| Period ended April 30, 2021: | | |
| Shares sold | 14,788 | $ 161,475 |
| Shares issued to shareholders in reinvestment of distributions | 126 | 1,389 |
| Shares redeemed | (54) | (599) |
| Net increase (decrease) | 14,860 | $ 162,265 |
| Year ended October 31, 2020:(a) | | |
| Shares sold | 2,308 | $ 25,000 |
| Shares issued to shareholders in reinvestment of distributions | 8 | 85 |
| Net increase (decrease) | 2,316 | $ 25,085 |
| |
Notes to Financial Statements (Unaudited) (continued)
| Class I | Shares | Amount |
| Period ended April 30, 2021: | | |
| Shares sold | 12,376,109 | $ 135,922,463 |
| Shares issued to shareholders in reinvestment of distributions | 500,107 | 5,493,726 |
| Shares redeemed | (8,798,370) | (96,753,489) |
| Net increase (decrease) in shares outstanding before conversion | 4,077,846 | 44,662,700 |
| Shares converted into Class I (See Note 1) | 56,613 | 618,065 |
| Net increase (decrease) | 4,134,459 | $ 45,280,765 |
| Year ended October 31, 2020: | | |
| Shares sold | 34,582,281 | $ 368,151,490 |
| Shares issued to shareholders in reinvestment of distributions | 794,861 | 8,548,352 |
| Shares redeemed | (14,328,906) | (152,011,170) |
| Net increase (decrease) in shares outstanding before conversion | 21,048,236 | 224,688,672 |
| Shares converted into Class I (See Note 1) | 39,319 | 430,623 |
| Net increase (decrease) | 21,087,555 | $ 225,119,295 |
| |
| Class R6 | Shares | Amount |
| Period ended April 30, 2021: | | |
| Shares sold | 9,572 | $ 105,000 |
| Shares issued to shareholders in reinvestment of distributions | 3,090 | 33,957 |
| Shares redeemed | (96,759) | (1,057,978) |
| Net increase (decrease) | (84,097) | $ (919,021) |
| Year ended October 31, 2020:(b) | | |
| Shares sold | 412,645 | $ 4,499,238 |
| Shares issued to shareholders in reinvestment of distributions | 6,522 | 69,947 |
| Shares redeemed | (120,690) | (1,305,532) |
| Net increase (decrease) | 298,477 | $ 3,263,653 |
| (a) | The inception date of the class was August 31, 2020. |
| (b) | The inception date of the class was November 1, 2019. |
Note 10–Recent Accounting Pronouncement
In March 2020, the Financial Accounting Standards Board issued Accounting Standards Update 2020-04 (“ASU 2020-04”), which provides optional guidance to ease the potential accounting burden associated with transitioning away from LIBOR and other reference rates that are expected to be discontinued. ASU 2020-04 was effective immediately upon release of the update on March 12, 2020 and remains effective through December 31, 2022. At this time, the Manager is evaluating the implications of certain other provisions of ASU 2020-04 related to new disclosure requirements and any impact on the financial statement disclosures has not yet been determined.
Note 11–Other Matters
An outbreak of COVID-19, first detected in December 2019, has developed into a global pandemic and has resulted in travel restrictions, closure of international borders, certain businesses and securities markets, restrictions on securities trading activities, prolonged quarantines, supply chain disruptions, and lower consumer demand, as well as general concern and uncertainty. The continued impact of COVID-19 is uncertain and could further adversely affect the global economy, national economies, individual issuers and capital markets in unforeseeable ways and result in a substantial and extended economic downturn. Developments that disrupt global economies and financial markets, such as COVID-19, may magnify factors that affect the Fund's performance.
Note 12–Subsequent Events
In connection with the preparation of the financial statements of the Fund as of and for the six-month period ended April 30, 2021, events and transactions subsequent to April 30, 2021, through the date the financial statements were issued have been evaluated by the Manager for possible adjustment and/or disclosure. No subsequent events requiring financial statement adjustment or disclosure have been identified.
| 48 | MainStay MacKay California Tax Free Opportunities Fund |
Board Consideration and Approval of Management Agreement and Subadvisory Agreement (Unaudited)
The continuation of the Management Agreement with respect to the MainStay MacKay California Tax Free Opportunities Fund (“Fund”) and New York Life Investment Management LLC (“New York Life Investments”) and the Subadvisory Agreement between New York Life Investments and MacKay Shields LLC (“MacKay”) with respect to the Fund (together, “Advisory Agreements”), following an initial term of up to two years, is subject to annual review and approval by the Board of Trustees of MainStay Funds Trust (“Board” of the “Trust”) in accordance with Section 15 of the Investment Company Act of 1940, as amended (“1940 Act”). At its December 9–10, 2020 meeting, the Board, including the Trustees who are not an “interested person” (as such term is defined in the 1940 Act) of the Trust (“Independent Trustees”) voting separately, unanimously approved the continuation of each of the Advisory Agreements for a one-year period.
In reaching the decision to approve the continuation of each of the Advisory Agreements, the Board considered information furnished by New York Life Investments and MacKay in connection with an annual contract review process undertaken by the Board that took place at meetings of the Board and its Contracts Committee during September 2020 through December 2020, as well as other information furnished to the Board and its Committees throughout the year, as deemed relevant by the Trustees. Information requested by and furnished to the Board for consideration in connection with the contract review process included, among other items, reports on the Fund and “peer funds” prepared by Strategic Insight Mutual Fund Research and Consulting, LLC (“Strategic Insight”), an independent third-party service provider engaged by the Board to report objectively on the Fund’s investment performance, management fee and total expenses. The Board also considered information on the fees charged to other investment advisory clients of New York Life Investments and/or MacKay that follow investment strategies similar to those of the Fund, if any, and, when applicable, the rationale for any differences in the Fund’s management and subadvisory fees and the fees charged to those other investment advisory clients. In addition, the Board considered information furnished by New York Life Investments and MacKay in response to requests prepared on behalf of the Board, and in consultation with the Independent Trustees, by independent legal counsel to the Independent Trustees, which encompassed a variety of topics, including those summarized below.
The Board took into account information provided in connection with its meetings throughout the year, including, among other items, information regarding the legal standards and fiduciary obligations applicable to its consideration of the continuation of each of the Advisory Agreements and investment performance reports on the Fund as well as presentations from New York Life Investments and MacKay personnel. The Board also took into account other information received from New York Life Investments throughout the year, including, among other items, periodic reports on legal and compliance matters, risk management, portfolio turnover, brokerage commissions and non-advisory services provided to the Fund by New York Life Investments. The contract review process, including the structure and format for materials provided to the Board, has been developed in consultation with the Board. The Independent
Trustees also met in executive sessions with their independent legal counsel and, for a portion thereof, with senior management of New York Life Investments.
In addition to information provided to the Board throughout the year, the Board received information in connection with its June 2020 meeting provided specifically in response to requests prepared on behalf of the Board, and in consultation with the Independent Trustees, by independent legal counsel regarding the Fund’s distribution arrangements. In addition, the Board received information regarding the Fund’s asset levels, share purchase and redemption activity and the payment of Rule 12b-1 and/or other fees by applicable share classes of the Fund, among other information.
In considering the continuation of each of the Advisory Agreements, the Trustees reviewed and evaluated the information and factors they believed to reasonably be necessary and appropriate in light of legal advice furnished to them by independent legal counsel and through the exercise of their own business judgment. Although individual Trustees may have weighed certain factors or information differently, the factors considered by the Board are described in greater detail below and include, among other factors: (i) the nature, extent and quality of the services provided to the Fund by New York Life Investments and MacKay; (ii) the qualifications of the portfolio managers of the Fund and the historical investment performance of the Fund, New York Life Investments and MacKay; (iii) the costs of the services provided, and profits realized, by New York Life Investments and MacKay from their relationships with the Fund; (iv) the extent to which economies of scale have been realized or may be realized as the Fund grows and the extent to which economies of scale have benefited or may benefit the Fund’s shareholders; and (v) the reasonableness of the Fund’s management and subadvisory fees and total ordinary operating expenses. Although the Board recognized that comparisons between the Fund’s fees and expenses and those of other funds are imprecise given different terms of agreements, variations in fund strategies and other factors, the Board considered the reasonableness of the Fund’s management fee and total ordinary operating expenses as compared to the peer funds identified by Strategic Insight. Throughout their considerations, the Trustees acknowledged the commitment of New York Life Investments and its affiliates to serve the MainStay Group of Funds, as well as their capacity, experience, resources, financial stability and reputations. The Trustees also acknowledged the entrepreneurial and other risks assumed by New York Life Investments in sponsoring and managing the Fund.
The Trustees noted that, throughout the year, the Trustees are afforded an opportunity to ask questions of, and request additional information or materials from, New York Life Investments and MacKay. The Board’s decision with respect to each of the Advisory Agreements may have also been based, in part, on the Board’s knowledge of New York Life Investments and MacKay resulting from, among other things, the Board’s consideration of each of the Advisory Agreements in prior years, the advisory agreements for other funds in the MainStay Group of Funds, the Board’s review throughout the year of the performance and operations of other funds in the MainStay Group of Funds and each Trustee’s business
Board Consideration and Approval of Management Agreement and Subadvisory Agreement (Unaudited) (continued)
judgment and industry experience. In addition to considering the above-referenced factors, the Board observed that in the marketplace there are a range of investment options available to the Fund’s shareholders and such shareholders, having had the opportunity to consider other investment options, have chosen to invest in the Fund.
The factors that figured prominently in the Board’s decision to approve the continuation of each of the Advisory Agreements during its December 9–10, 2020 meeting are summarized in more detail below, and the Board did not consider any factor or information controlling in reaching such decision.
Nature, Extent and Quality of Services Provided by New York Life Investments and MacKay
The Board examined the nature, extent and quality of the services that New York Life Investments provides to the Fund. The Board evaluated New York Life Investments’ experience and capabilities in serving as manager of the Fund and considered that the Fund operates in a “manager-of-managers” structure. The Board also considered New York Life Investments’ responsibilities and services provided pursuant to this structure, including evaluating the performance of MacKay, making recommendations to the Board as to whether the Subadvisory Agreement should be renewed, modified or terminated and periodically reporting to the Board regarding the results of New York Life Investments’ evaluation and monitoring functions. The Board noted that New York Life Investments manages other mutual funds, serves a variety of other investment advisory clients, including other pooled investment vehicles, and has experience overseeing mutual fund service providers, including subadvisors. The Board considered the experience of senior personnel at New York Life Investments providing management and administrative and other non-advisory services to the Fund as well as New York Life Investments’ reputation and financial condition. The Board observed that New York Life Investments devotes significant resources and time to providing management and non-advisory services to the Fund, including New York Life Investments’ supervision and due diligence reviews of MacKay and ongoing analysis of, and interactions with, MacKay with respect to, among other things, the Fund’s investment performance and risks as well as MacKay’s investment capabilities and subadvisory services with respect to the Fund.
The Board also considered the range of services that New York Life Investments provides to the Fund under the terms of the Management Agreement, including: (i) fund accounting and ongoing supervisory services provided by New York Life Investments’ Fund Administration and Accounting Group; (ii) investment supervisory and analytical services provided by New York Life Investments’ Investment Consulting Group; (iii) compliance services provided by the Trust’s Chief Compliance Officer as well as New York Life Investments’ compliance department, including supervision and implementation of the Fund’s compliance program; (iv) legal services provided by New York Life Investments’ Office of the General Counsel; and (v) risk management monitoring and analysis by compliance and investment personnel. The Board noted that New York Life Investments provides certain other non-advisory services to the Fund.
In addition, the Board considered New York Life Investments’ willingness to invest in personnel, infrastructure, technology, operational enhancements, cyber security, information security, shareholder privacy resources and business continuity planning designed to benefit the Fund and noted that New York Life Investments is responsible for compensating the Trust’s officers, except for a portion of the salary of the Trust’s Chief Compliance Officer. The Board recognized that New York Life Investments has provided an increasingly broad array of non-advisory services to the MainStay Group of Funds as a result of regulatory and other developments, including in connection with the designation of New York Life Investments as the administrator of the MainStay Group of Funds’ liquidity risk management program adopted under the 1940 Act. The Board considered benefits to shareholders from being part of the MainStay Group of Funds, including the privilege of exchanging investments between the same class of shares of funds in the MainStay Group of Funds, including without the imposition of a sales charge (if any).
The Board also examined the nature, extent and quality of the investment advisory services that MacKay provides to the Fund and considered the terms of each of the Advisory Agreements. The Board evaluated MacKay’s experience in serving as subadvisor to the Fund and advising other portfolios and MacKay’s track record and experience in providing investment advisory services, the experience of investment advisory, senior management and administrative personnel at MacKay and New York Life Investments’ and MacKay’s overall resources, legal and compliance environment, capabilities and history. In addition to information provided in connection with quarterly meetings with the Trust’s Chief Compliance Officer, the Board considered information regarding the compliance policies and procedures of New York Life Investments and MacKay and acknowledged their commitment to further developing and strengthening compliance programs relating to the Fund. The Board reviewed MacKay’s ability to attract and retain qualified investment professionals and willingness to invest in personnel to service and support the Fund. In this regard, the Board considered the experience of the Fund’s portfolio managers, the number of accounts managed by the portfolio managers and the method for compensating the portfolio managers.
In addition, the Board considered discussions with New York Life Investments regarding the implementation of its business continuity plans and recognized steps taken by New York Life Investments and MacKay to continue to provide the same nature, extent and quality of services to the Fund during the COVID-19 pandemic.
Based on these considerations, the Board concluded that the Fund would likely continue to benefit from the nature, extent and quality of these services.
Investment Performance
In evaluating the Fund’s investment performance, the Board considered investment performance results over various periods in light of the Fund’s investment objective, strategies and risks. The Board considered
| 50 | MainStay MacKay California Tax Free Opportunities Fund |
investment reports on, and analysis of, the Fund’s performance provided to the Board throughout the year. These reports include, among other items, information on the Fund’s gross and net returns, the Fund’s investment performance compared to relevant investment categories and the Fund’s benchmark, the Fund’s risk-adjusted investment performance and the Fund’s investment performance as compared to peer funds, as appropriate, as well as portfolio attribution information and commentary on the effect of market conditions. The Board also considered information provided by Strategic Insight showing the investment performance of the Fund as compared to peer funds.
The Board also gave weight to its discussions with senior management at New York Life Investments concerning the Fund’s investment performance attributable to MacKay as well as discussions between the Fund’s portfolio managers and the members of the Board’s Investment Committee, which generally occur on an annual basis. In addition, the Board considered any specific actions that New York Life Investments or MacKay had taken, or had agreed to take, to seek to enhance Fund investment performance and the results of those actions.
Based on these considerations, the Board concluded that its review of the Fund’s investment performance and related information supported a determination to approve the continuation of each of the Advisory Agreements.
Costs of the Services Provided, and Profits Realized, by New York Life Investments and MacKay
The Board considered the costs of the services provided under each of the Advisory Agreements. The Board also considered the profits realized by New York Life Investments and its affiliates, including MacKay, due to their relationships with the Fund. Because MacKay is an affiliate of New York Life Investments whose subadvisory fee is paid by New York Life Investments, not the Fund, the Board considered cost and profitability information for New York Life Investments and MacKay in the aggregate.
In addition, the Board acknowledged the difficulty in obtaining reliable comparative data about mutual fund managers’ profitability because such information generally is not publicly available and may be impacted by numerous factors, including the structure of a fund manager’s organization, the types of funds it manages, the methodology used to allocate certain fixed costs to specific funds and the manager’s capital structure and costs of capital.
In evaluating the costs of the services provided by New York Life Investments and MacKay and profits realized by New York Life Investments and its affiliates, including MacKay, the Board considered, among other factors, each party’s continuing investments in, or willingness to invest in, personnel, systems, equipment and other resources and infrastructure to support and further enhance the management of the Fund, and that New York Life Investments is responsible for paying the subadvisory fee for the Fund. The Board also considered the financial resources of New York Life Investments and MacKay and acknowledged that New York Life Investments and MacKay must be in a position to attract and retain experienced professional
personnel and to maintain a strong financial position for New York Life Investments and MacKay to continue to provide high-quality services to the Fund. The Board recognized that the Fund benefits from the allocation of certain fixed costs among the funds in the MainStay Group of Funds, among other expected benefits resulting from its relationship with New York Life Investments.
The Board considered information regarding New York Life Investments’ methodology for calculating profitability and allocating costs provided by New York Life Investments in connection with the fund profitability analysis presented to the Board. The Board previously engaged an independent consultant to review the methods used to allocate costs among the funds in the MainStay Group of Funds. The Board noted that the independent consultant had concluded that New York Life Investments’ methods for allocating costs and procedures for estimating overall profitability of the relationship with the funds in the MainStay Group of Funds are reasonable and that New York Life Investments continued to use the same method of calculating profit and allocating costs since the independent consultant’s review. The Board recognized the difficulty in calculating and evaluating a manager’s profitability with respect to the Fund and noted that other profitability methodologies may also be reasonable.
The Board also considered certain fall-out benefits that may be realized by New York Life Investments and its affiliates due to their relationships with the Fund, including reputational and other indirect benefits. In addition, the Board considered its review of a money market fund advised by New York Life Investments and an affiliated subadvisor that serves as an investment option for the Fund, including the potential rationale for and costs associated with investments in this money market fund by the Fund, if any, and considered information from New York Life Investments that the nature and type of specific investment advisory services provided to this money market fund are distinct from, or in addition to, the investment advisory services provided to the Fund.
The Board observed that, in addition to fees earned by New York Life Investments for managing the Fund, New York Life Investments’ affiliates also earn revenues from serving the Fund in various other capacities, including as the Fund’s transfer agent and distributor. The Board considered information about these other revenues and their impact on the profitability of the relationship with the Fund to New York Life Investments and its affiliates. The Board noted that, although it assessed the overall profitability of the Fund to New York Life Investments and its affiliates as part of the contract review process, when considering the reasonableness of the fee paid to New York Life Investments and its affiliates under each of the Advisory Agreements, the Board considered the profitability of New York Life Investments’ relationship with the Fund on a pre-tax basis and without regard to distribution expenses incurred by New York Life Investments from its own resources.
After evaluating the information deemed relevant by the Trustees, the Board concluded that any profits realized by New York Life Investments and its affiliates, including MacKay, due to their relationships with the Fund were not excessive.
Board Consideration and Approval of Management Agreement and Subadvisory Agreement (Unaudited) (continued)
Management and Subadvisory Fees and Total Ordinary Operating Expenses
The Board evaluated the reasonableness of the fee paid under each of the Advisory Agreements and the Fund’s total ordinary operating expenses. The Board primarily considered the reasonableness of the management fee paid by the Fund to New York Life Investments, because the subadvisory fee paid to MacKay is paid by New York Life Investments, not the Fund. The Board also considered the reasonableness of the subadvisory fee paid by New York Life Investments and the amount of the management fee retained by New York Life Investments.
In assessing the reasonableness of the Fund’s fees and expenses, the Board primarily considered comparative data provided by Strategic Insight on the fees and expenses charged by similar mutual funds managed by other investment advisers. In addition, the Board considered information provided by New York Life Investments and MacKay on fees charged to other investment advisory clients, including institutional separate accounts and/or other funds that follow investment strategies similar to those of the Fund, if any. The Board considered the similarities and differences in the contractual management fee schedules of the Fund and these similarly-managed accounts and/or funds, taking into account the rationale for any differences in fee schedules. The Board also took into account explanations provided by New York Life Investments about the more extensive scope of services provided to registered investment companies, such as the Fund, as compared with other investment advisory clients. Additionally, the Board considered the impact of contractual breakpoints, voluntary waivers and expense limitation arrangements on the Fund’s net management fee and expenses. The Board also considered that in proposing fees for the Fund, New York Life Investments considers the competitive marketplace for mutual funds. The Board noted that New York Life Investments proposed, and the Board had approved, the elimination of the management fee waiver for the Fund and a reduction in the management fee for the Fund, effective February 28, 2021. The Board also noted that New York Life Investments proposed, and the Board had approved, an additional management fee breakpoint for the Fund, effective February 28, 2021.
The Board noted that, outside of the Fund’s management fee and the fees charged under a share class’s Rule 12b-1 and/or shareholder services plans, a share class’s most significant “other expenses” are transfer agent fees. Transfer agent fees are charged to the Fund based on the number of shareholder accounts (a “per-account” fee). The Board took into account information from New York Life Investments regarding the reasonableness of the Fund’s transfer agent fee schedule, including industry data demonstrating that the per-account fees that NYLIM Service Company LLC, an affiliate of New York Life Investments and the Fund’s transfer agent, charges the Fund are within the range of per-account fees charged by transfer agents to other mutual funds. In addition, the Board considered NYLIM Service Company LLC’s profitability in connection with the transfer agent services it provides to the Fund. The Board also took
into account information received from NYLIM Service Company LLC regarding the sub-transfer agency payments it made to intermediaries in connection with the provision of sub-transfer agency services to the Fund.
The Board considered that, because the Fund’s transfer agent fees are billed on a per-account basis, the impact of transfer agent fees on a share class’s expense ratio may be more significant in cases where the share class has a high number of small accounts. The Board considered the extent to which transfer agent fees comprised total expenses of the Fund. The Board acknowledged the role that the MainStay Group of Funds historically has played in serving the investment needs of New York Life Insurance Company customers, who often maintain smaller account balances than other shareholders of funds, and the impact of small accounts on the expense ratios of Fund share classes. The Board also recognized measures that it and New York Life Investments have taken to mitigate the effect of small accounts on the expense ratios of Fund share classes, including through the imposition of an expense limitation on net transfer agency expenses. The Board noted that, for purposes of allocating transfer agency fees and expenses, each retail fund in the MainStay Group of Funds combines the shareholder accounts of its Class A, A2, I, R1, R2 and R3 shares (as applicable) into one group and the shareholder accounts of its Investor Class, SIMPLE Class and Class B, C and C2 shares (as applicable) into another group. The Board also noted that the per-account fees attributable to each group of share classes is then allocated among the constituent share classes based on relative net assets and that a MainStay Fund’s Class R6 shares, if any, are not combined with any other share class for this purpose. The Board considered New York Life Investments’ rationale with respect to these groupings and previously received a report from an independent consultant engaged to conduct comparative analysis of these groupings. The Board also considered that NYLIM Service Company LLC had waived its contractual cost of living adjustments during the past seven years.
Based on the factors outlined above, the Board concluded that the Fund’s management fee and total ordinary operating expenses were within a range that is competitive and support a conclusion that these fees and expenses are reasonable.
Economies of Scale
The Board considered information regarding economies of scale, including whether the Fund’s expense structure permits economies of scale to be appropriately shared with the Fund’s shareholders. The Board also considered a report from New York Life Investments, previously prepared at the request of the Board, that addressed economies of scale, including with respect to the mutual fund business generally and the various ways in which the benefits of economies of scale may be shared with the funds in the MainStay Group of Funds. Although the Board recognized the difficulty of determining economies of scale with precision, the Board acknowledged that economies of scale may be shared with the Fund in a number of ways, including, for example, through the imposition of management fee breakpoints, initially setting management fee rates at scale or making additional investments to enhance services. The Board
| 52 | MainStay MacKay California Tax Free Opportunities Fund |
reviewed information from New York Life Investments showing how the Fund’s management fee schedule compared to fee schedules of other funds and accounts managed by New York Life Investments. The Board also reviewed information from Strategic Insight showing how the Fund’s management fee schedule compared with fees paid for similar services by peer funds at varying asset levels.
Based on this information, the Board concluded that economies of scale are appropriately reflected for the benefit of the Fund’s shareholders through the Fund’s expense structure and other methods to share benefits from economies of scale.
Conclusion
On the basis of the information and factors summarized above, among other information and factors deemed relevant by the Trustees, and the evaluation thereof, the Board, including the Independent Trustees voting separately, unanimously voted to approve the continuation of each of the Advisory Agreements.
Discussion of the Operation and Effectiveness of the Fund's Liquidity Risk Management Program (Unaudited)
In compliance with Rule 22e-4 under the Investment Company Act of 1940, as amended (the “Liquidity Rule”), the Fund has adopted and implemented a liquidity risk management program (the “Program”), which New York Life Investment Management LLC believes is reasonably designed to assess and manage the Fund's liquidity risk (the risk that the Fund could not meet requests to redeem shares issued by the Fund without significant dilution of remaining investors’ interests in the Fund). The Board of Trustees of MainStay Funds Trust (the "Board") designated New York Life Investment Management LLC as administrator of the Program (the “Administrator”). The Administrator has established a Liquidity Risk Management Committee to assist the Administrator in the implementation and day-to-day administration of the Program and to otherwise support the Administrator in fulfilling its responsibilities under the Program.
At a meeting of the Board held on March 8, 2021, the Administrator provided the Board with a written report addressing the Program’s operation and assessing its adequacy and effectiveness of implementation for the period from January 1, 2020 through December 31, 2020 (the "Review Period"), as required under the Liquidity Rule. The report noted that the Administrator concluded that (i) the Program operated effectively to assess and manage the Fund's liquidity risk, (ii) the Program has been adequately and effectively implemented to monitor and, as applicable, respond to the Fund's liquidity developments and (iii) the Fund's investment strategy continues to be appropriate for an open-end fund. In addition, the report discussed notable events that impacted liquidity risk during the Review Period, including the COVID-19 pandemic and the resulting economic shutdown.
In accordance with the Program, the Fund's liquidity risk is assessed no less frequently than annually taking into consideration certain factors, as applicable, such as (i) investment strategy and liquidity of portfolio investments, (ii) short-term and long-term cash flow projections and (iii) holdings of cash and cash equivalents, as well as borrowing arrangements and other funding sources. Certain factors are considered under both normal and reasonably foreseeable stressed conditions.
Each Fund portfolio investment is classified into one of four liquidity categories. The classification is based on a determination of the number of days it is reasonably expected to take to convert the investment into cash, or sell or dispose of the investment, in current market conditions without significantly changing the market value of the investment. The Administrator has delegated liquidity classification determinations to the Fund’s subadvisor, subject to appropriate oversight by the Administrator, and classification determinations are made by taking into account the Fund's reasonably anticipated trade size, various market, trading and investment-specific considerations, as well as market depth, and, in certain cases, third-party vendor data.
The Liquidity Rule requires funds that do not primarily hold assets that are highly liquid investments to adopt a minimum amount of net assets that must be invested in highly liquid investments that are assets (an “HLIM”). In addition, the Liquidity Rule limits a fund's investments in illiquid investments. Specifically, the Liquidity Rule prohibits acquisition of illiquid investments if doing so would result in a fund holding more than 15% of its net assets in illiquid investments that are assets. The Program includes provisions reasonably designed to determine, periodically review and comply with the HLIM requirement, as applicable, and to comply with the 15% limit on illiquid investments.
There can be no assurance that the Program will achieve its objectives under all circumstances in the future. Please refer to the Fund's prospectus for more information regarding the Fund's exposure to liquidity risk and other risks to which it may be subject.
| 54 | MainStay MacKay California Tax Free Opportunities Fund |
Proxy Voting Record
The Fund is required to file with the Securities and Exchange Commissions's ("SEC") its proxy voting records for the 12-month period ending June 30 on Form N-PX. The most recent Form N-PX or proxy voting record is available free of charge upon request by calling 800-624-6782; visiting the MainStay Funds’ website at newyorklifeinvestments.com; or visiting the SEC’s website at www.sec.gov.
Shareholder Reports and Quarterly Portfolio Disclosure
The Fund is required to file its complete schedule of portfolio holdings with the SEC 60 days after its first and third fiscal quarter on Form N-PORT. The Fund's holdings report is available free of charge upon request by calling New York Life Investments at 800-624-6782.
This page intentionally left blank.
This page intentionally left blank.
This page intentionally left blank.
Equity
U.S. Equity
MainStay Epoch U.S. Equity Yield Fund
MainStay MacKay S&P 500 Index Fund
MainStay Winslow Large Cap Growth Fund
MainStay WMC Enduring Capital Fund
MainStay WMC Growth Fund
MainStay WMC Small Companies Fund
MainStay WMC Value Fund
International Equity
MainStay Epoch International Choice Fund
MainStay MacKay International Equity Fund
MainStay WMC International Research Equity Fund
Emerging Markets Equity
MainStay Candriam Emerging Markets Equity Fund
Global Equity
MainStay Epoch Capital Growth Fund
MainStay Epoch Global Equity Yield Fund
Fixed Income
Taxable Income
MainStay Candriam Emerging Markets Debt Fund
MainStay Floating Rate Fund
MainStay MacKay High Yield Corporate Bond Fund
MainStay MacKay Short Duration High Yield Fund
MainStay MacKay Strategic Bond Fund
MainStay MacKay Total Return Bond Fund
MainStay MacKay U.S. Infrastructure Bond Fund
MainStay Short Term Bond Fund
Tax-Exempt Income
MainStay MacKay California Tax Free Opportunities Fund1
MainStay MacKay High Yield Municipal Bond Fund
MainStay MacKay Intermediate Tax Free Bond Fund
MainStay MacKay New York Tax Free Opportunities Fund2
MainStay MacKay Short Term Municipal Fund
MainStay MacKay Tax Free Bond Fund
Money Market
MainStay Money Market Fund
Mixed Asset
MainStay Balanced Fund
MainStay Income Builder Fund
MainStay MacKay Convertible Fund
Speciality
MainStay CBRE Global Infrastructure Fund
MainStay CBRE Real Estate Fund
MainStay Cushing MLP Premier Fund
Asset Allocation
MainStay Conservative Allocation Fund
MainStay Conservative ETF Allocation Fund
MainStay Defensive ETF Allocation Fund
MainStay Equity Allocation Fund
MainStay Equity ETF Allocation Fund
MainStay Growth Allocation Fund
MainStay Growth ETF Allocation Fund
MainStay Moderate Allocation Fund
MainStay Moderate ETF Allocation Fund
Manager
New York Life Investment Management LLC
New York, New York
Subadvisors
Candriam Belgium S.A.3
Brussels, Belgium
Candriam Luxembourg S.C.A.3
Strassen, Luxembourg
CBRE Clarion Securities LLC
Radnor, Pennsylvania
Cushing Asset Management, LP
Dallas, Texas
Epoch Investment Partners, Inc.
New York, New York
MacKay Shields LLC3
New York, New York
NYL Investors LLC3
New York, New York
Wellington Management Company LLP
Boston, Massachusetts
Winslow Capital Management, LLC
Minneapolis, Minnesota
Legal Counsel
Dechert LLP
Washington, District of Columbia
Independent Registered Public Accounting Firm
KPMG LLP
Philadelphia, Pennsylvania
Distributor
NYLIFE Distributors LLC3
Jersey City, New Jersey
Custodian
JPMorgan Chase Bank, N.A.
New York, New York
1.
This Fund is registered for sale in AZ, CA, NV, OR, TX, UT, WA and MI (Class A and I shares only), and CO, FL, GA, HI, ID, MA, MD, NH, NJ and NY (Class I shares only).
| 2. | This Fund is registered for sale in CA, CT, DE, FL, MA, NJ, NY and VT. |
| 3. | An affiliate of New York Life Investment Management LLC. |
Not part of the Semiannual Report
For more information
800-624-6782
newyorklifeinvestments.com
“New York Life Investments” is both a service mark, and the common trade name, of certain investment advisors affiliated with New York Life Insurance Company. The MainStay Funds® are managed by New York Life Investment Management LLC and distributed by NYLIFE Distributors LLC, 30 Hudson Street, Jersey City, NJ 07302, a wholly owned subsidiary of New York Life Insurance Company. NYLIFE Distributors LLC is a Member FINRA/SIPC.
©2021 NYLIFE Distributors LLC. All rights reserved.
| 1738062MS071-21 | MSCTF10-06/21 |
(NYLIM) NL237
MainStay MacKay High Yield Municipal Bond Fund
Message from the President and Semiannual Report
Unaudited | April 30, 2021
Sign up for e-delivery of your shareholder reports. For full details on e-delivery, including who can participate and what you can receive via e-delivery,
please log in to newyorklifeinvestments.com/accounts.
| Not FDIC/NCUA Insured | Not a Deposit | May Lose Value | No Bank Guarantee | Not Insured by Any Government Agency |
This page intentionally left blank
Message from the President
With the approval of COVID-19 vaccines and the passage of relief packages by the U.S. Congress, economic prospects improved during the reporting period, and investor risk appetite increased, benefiting both equities and fixed-income markets. Despite some volatility stemming from a sell-off in longer-dated Treasury securities, the stock market and higher-risk segments of the fixed-income market posted gains for the six months ended April 30, 2021.
By the beginning of the reporting period, the economy had made tremendous progress from the second quarter of 2020, when economic activity plunged. But uncertainty about when vaccines would be available and how quickly they could be administered left investors unsure about the economic outlook.
With the approval of several vaccines in November, the outlook brightened and investors became less risk-averse. Anticipating the likely end of the pandemic and a continuation of the economic recovery, they began to see opportunities in investment-grade and high-yield bonds and more cyclical segments of the stock market. The $900 billion relief and stimulus package passed in December provided further assurance.
In January, the Federal Reserve opted to leave interest rates unchanged, pointing to some uncertainty about the pace of the global recovery. Officials also noted that inflation remained low, citing oil prices in particular.
In March, President Biden signed the $1.9 billion American Rescue Plan, which, among other provisions, called for payments of $1,400 for those earning less than $75,000 per year, plus $1,400 per dependent. This, combined with the Federal Reserve’s new tolerance for inflation and an anticipated $2 trillion infrastructure spending bill, added to growing concerns about higher prices. Supply shortages in some markets caused some prices to soar, heightening concerns further.
In fixed-income markets, an improving economic outlook and rising inflation expectations led to a sell-off in longer-term Treasuries, with the result that the yield on the 10-year note rose sharply, particularly in February and March. Investment grade corporate bonds were also affected. Early in the reporting period, they performed well as investors shifted out of Treasuries, but as the reporting period progressed, they faltered. Longer-dated securities issued in recent years at historically low interest rates became especially unattractive.
High-yield bonds remained steady, supported by more favorable yields and an improved economic outlook, which reduced their perceived risk. Municipal bonds produced modest gains, and
although the sell-off in Treasuries produced some volatility early in 2021, stronger-than-expected tax revenues, $350 billion in financial support from the federal government, and the possibility of an increase in federal income tax rates appeared to buoy the market late in the reporting period.
Inflation concerns and volatility in the Treasury market led to a shift in equities markets. Although the S&P 500® Index, a widely followed measure of U.S. equities, posted double-digit gains and hit a record high, the rise of Treasury yields disrupted valuations, especially those of growth stocks. Technology companies that saw their valuations soar amid the work-from-home trend in 2020 suffered large declines.
But the fiscal stimulus and continued accommodation from the Federal Reserve gave investors confidence the economic recovery would continue. Combined with the sky-high valuations in technology and growth stocks, this increased the appeal of more cyclical and value-oriented shares. As a result, value stocks outperformed growth stocks during the reporting period.
Reflecting the shift in investor sentiment, the performance of S&P 500® Index sectors varied widely. While the information technology sector kept up with the broader market, it lagged cyclical sectors such as energy and financials, which led the way. The shift was further reflected in the performance of small-cap stocks, which outperformed large caps. While developed markets kept pace with the U.S. market, lagging economic and pandemic recoveries appeared to weigh on emerging markets late in the reporting period.
With the lockdown restrictions lifting in the U.S. and the pandemic easing in many regions, we at New York Life Investments are looking forward to a return to a more normal economy. We anticipate that over the next several years, a variety of trends will likely offer long-term investors many attractive opportunities. With this in mind, we continue to develop products and services to help you to take advantage of these trends, manage your risks, and ultimately meet your investment goals.
Sincerely,
Kirk C. Lehneis
President
The opinions expressed are as of the date of this report and are subject to change. There is no guarantee that any forecast made will come to pass. This material does not constitute investment advice and is not intended as an endorsement of any specific investment. Past performance is no guarantee of future results.
Not part of the Semiannual Report
Investors should refer to the Fund’s Summary Prospectus and/or Prospectus and consider the Fund’s investment objectives, strategies, risks, charges and expenses carefully before investing. The Summary Prospectus and/or Prospectus contain this and other information about the Fund. You may obtain copies of the Fund’s Summary Prospectus, Prospectus and Statement of Additional Information free of charge, upon request, by calling toll-free 800-624-6782, by writing to NYLIFE Distributors LLC, Attn: MainStay Marketing Department, 30 Hudson Street, Jersey City, NJ 07302 or by sending an e-mail to MainStayShareholderServices@nylim.com. These documents are also available via the MainStay Funds’ website at newyorklifeinvestments.com. Please read the Fund’s Summary Prospectus and/or Prospectus carefully before investing.
Investment and Performance Comparison (Unaudited)
Performance data quoted represents past performance. Past performance is no guarantee of future results. Because of market volatility and other factors, current performance may be lower or higher than the figures shown. Investment return and principal value will fluctuate, and as a result, when shares are redeemed, they may be worth more or less than their original cost. The graph below depicts the historical performance of Class I shares of the Fund. Performance will vary from class to class based on differences in class-specific expenses and sales charges. For performance information current to the most recent month-end, please call 800-624-6782 or visit newyorklifeinvestments.com.
The performance table and graph do not reflect the deduction of taxes that a shareholder would pay on distributions or Fund share redemptions. Total returns reflect maximum applicable sales charges as indicated in the table below, if any, changes in share price, and reinvestment of dividend and capital gain distributions. The graph assumes the initial investment amount shown below and reflects the deduction of all sales charges that would have applied for the period of investment. Performance figures may reflect certain fee waivers and/or expense limitations, without which total returns may have been lower. For more information on share classes and current fee waivers and/or expense limitations (if any), please refer to the Notes to Financial Statements.
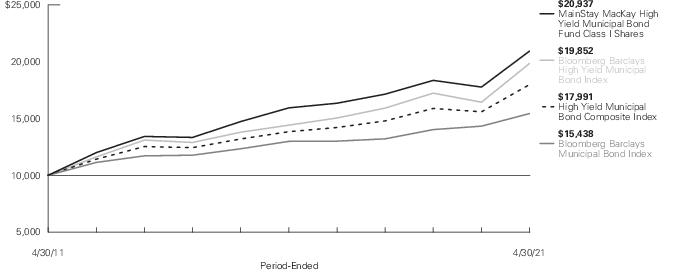
| Average Annual Total Returns for the Period-Ended April 30, 2021 |
| Class | Sales Charge | | Inception
Date | Six
Months | One
Year | Five Years
or Since
Inception | Ten
Years | Gross
Expense
Ratio1 |
| Class A Shares | Maximum 4.5% Initial Sales Charge | With sales charges | 3/31/2010 | 2.51% | 12.24% | 4.38% | 6.90% | 0.86% |
| | | Excluding sales charges | | 7.34 | 17.53 | 5.34 | 7.39 | 0.86 |
| Investor Class Shares2 | Maximum 4% Initial Sales Charge | With sales charges | 3/31/2010 | 3.04 | 12.25 | 4.36 | 6.89 | 0.87 |
| | | Excluding sales charges | | 7.34 | 17.54 | 5.33 | 7.38 | 0.87 |
| Class C Shares | Maximum 1% CDSC | With sales charges | 3/31/2010 | 5.95 | 15.59 | 4.53 | 6.57 | 1.62 |
| | if Redeemed Within One Year of Purchase | Excluding sales charges | | 6.95 | 16.59 | 4.53 | 6.57 | 1.62 |
| Class I Shares | No Sales Charge | | 3/31/2010 | 7.47 | 17.82 | 5.61 | 7.67 | 0.61 |
| Class R6 Shares | No Sales Charge | | 11/1/2019 | 7.50 | 17.79 | 6.20 | N/A | 0.56 |
| 1. | The gross expense ratios presented reflect the Fund’s “Total Annual Fund Operating Expenses” from the most recent Prospectus, as supplemented, and may differ from other expense ratios disclosed in this report. |
| 2. | Prior to June 30, 2020, the maximum initial sales charge for Investor Class shares was 4.5%, which is reflected in the average annual total return figures shown. |
The footnotes on the next page are an integral part of the table and graph and should be carefully read in conjunction with them.
| Benchmark Performance | Six
Months | One
Year | Five
Years | Ten
Years |
| Bloomberg Barclays Municipal Bond Index1 | 2.62% | 7.75% | 3.51% | 4.44% |
| Bloomberg Barclays High Yield Municipal Bond Index2 | 8.08 | 20.78 | 6.61 | 7.10 |
| High Yield Municipal Bond Composite Index3 | 5.87 | 15.41 | 5.39 | 6.05 |
| Morningstar High Yield Muni Category Average4 | 6.50 | 15.64 | 4.46 | 5.94 |
| 1. | The Bloomberg Barclays Municipal Bond Index is the Fund’s primary broadbased securities market index for comparison purposes. The Bloomberg Barclays Municipal Bond Index is considered representative of the broadbased market for investment-grade, tax-exempt bonds with a maturity of at least one year. Bonds subject to the alternative minimum tax or with floating or zero coupons are excluded. Results assume reinvestment of all dividends and capital gains. An investment cannot be made directly in an index. |
| 2. | The Fund has selected the Bloomberg Barclays High Yield Municipal Bond Index as an additional benchmark. The Bloomberg Barclays Municipal High Yield Bond Index is a flagship measure of the non-investment grade and nonrated U.S. dollar-denominated tax-exempt bond market. |
| 3. | The High Yield Municipal Bond Composite Index is the Fund’s secondary benchmark. The High Yield Municipal Bond Composite Index consists of the Bloomberg Barclays High Yield Municipal Bond Index and the Bloomberg Barclays Municipal Bond Index weighted 60%/40%, respectively. The Bloomberg Barclays High Yield Municipal Bond Index is made up of bonds that are non-investment grade, unrated, or rated below Ba1 by Moody’s Investors Service with a remaining maturity of at least one year. Results assume reinvestment of all dividends and capital gains. An investment cannot be made directly in an index. |
| 4. | The Morningstar High Yield Muni Category Average is representative of funds that invest a substantial portion of assets in high-income municipal securities that are not rated or that are rated at the level of or below BBB by a major ratings agency such as Standard & Poor’s or Moody’s. Results are based on average total returns of similar funds with all dividends and capital gain distributions reinvested. |
The footnotes on the preceding page are an integral part of the table and graph and should be carefully read in conjunction with them.
| 6 | MainStay MacKay High Yield Municipal Bond Fund |
Cost in Dollars of a $1,000 Investment in MainStay MacKay High Yield Municipal Bond Fund (Unaudited)
The example below is intended to describe the fees and expenses borne by shareholders during the six-month period from November 1, 2020, to April 30, 2021, and the impact of those costs on your investment.
Example
As a shareholder of the Fund you incur two types of costs: (1) transaction costs, including exchange fees and sales charges (loads) on purchases (as applicable), and (2) ongoing costs, including management fees, distribution and/or service (12b-1) fees, and other Fund expenses (as applicable). This example is intended to help you understand your ongoing costs (in dollars) of investing in the Fund and to compare these costs with the ongoing costs of investing in other mutual funds. The example is based on an investment of $1,000 made at the beginning of the six-month period and held for the entire period from November 1, 2020, to April 30, 2021.
This example illustrates your Fund’s ongoing costs in two ways:
Actual Expenses
The second and third data columns in the table below provide information about actual account values and actual expenses. You may use the information in these columns, together with the amount you invested, to estimate the expenses that you paid during the six months ended April 30, 2021. Simply divide your account value by $1,000 (for example, an
$8,600 account value divided by $1,000 = 8.6), then multiply the result by the number under the heading entitled “Expenses Paid During Period” to estimate the expenses you paid on your account during this period.
Hypothetical Example for Comparison Purposes
The fourth and fifth data columns in the table below provide information about hypothetical account values and hypothetical expenses based on the Fund’s actual expense ratio and an assumed rate of return of 5% per year before expenses, which is not the Fund’s actual return. The hypothetical account values and expenses may not be used to estimate the actual ending account balances or expenses you paid for the six-month period shown. You may use this information to compare the ongoing costs of investing in the Fund with the ongoing costs of investing in other mutual funds. To do so, compare this 5% hypothetical example with the 5% hypothetical examples that appear in the shareholder reports of the other mutual funds.
Please note that the expenses shown in the table are meant to highlight your ongoing costs only and do not reflect any transactional costs, such as exchange fees or sales charges (loads). Therefore, the fourth and fifth data columns of the table are useful in comparing ongoing costs only and will not help you determine the relative total costs of owning different funds. In addition, if these transactional costs were included, your costs would have been higher.
| Share Class | Beginning
Account
Value
11/1/20 | Ending Account
Value (Based
on Actual
Returns and
Expenses)
4/30/21 | Expenses
Paid
During
Period1 | Ending Account
Value (Based
on Hypothetical
5% Annualized
Return and
Actual Expenses)
4/30/21 | Expenses
Paid
During
Period1 | Net Expense
Ratio
During
Period2 |
| Class A Shares | $1,000.00 | $1,073.40 | $4.32 | $1,020.63 | $4.21 | 0.84% |
| Investor Class Shares | $1,000.00 | $1,073.40 | $4.42 | $1,020.53 | $4.31 | 0.86% |
| Class C Shares | $1,000.00 | $1,069.50 | $8.26 | $1,016.81 | $8.05 | 1.61% |
| Class I Shares | $1,000.00 | $1,074.70 | $3.04 | $1,021.87 | $2.96 | 0.59% |
| Class R6 Shares | $1,000.00 | $1,075.00 | $2.83 | $1,022.07 | $2.76 | 0.55% |
| 1. | Expenses are equal to the Fund’s annualized expense ratio of each class multiplied by the average account value over the period, divided by 365 and multiplied by 181 (to reflect the six-month period). The table above represents the actual expenses incurred during the six-month period. In addition to the fees and expenses which the Fund bears directly, it also indirectly bears a pro rata share of the fees and expenses of the underlying funds in which it invests. Such indirect expenses are not included in the above-reported expense figures. |
| 2. | Expenses are equal to the Fund's annualized expense ratio to reflect the six-month period. |
Portfolio Composition as of April 30, 2021 (Unaudited)
| Puerto Rico | 12.1% |
| Illinois | 10.9 |
| California | 10.5 |
| New York | 9.1 |
| New Jersey | 5.2 |
| Texas | 5.0 |
| Ohio | 4.7 |
| Pennsylvania | 3.4 |
| Florida | 3.0 |
| Colorado | 2.4 |
| Michigan | 2.2 |
| Virginia | 2.0 |
| Wisconsin | 2.0 |
| District of Columbia | 2.0 |
| Georgia | 1.5 |
| Massachusetts | 1.4 |
| North Carolina | 1.4 |
| Minnesota | 1.2 |
| Arizona | 1.1 |
| U.S. Virgin Islands | 1.0 |
| Kentucky | 0.9 |
| South Carolina | 0.8 |
| Guam | 0.8 |
| Arkansas | 0.8 |
| Missouri | 0.8 |
| Washington | 0.7 |
| Iowa | 0.7 |
| Indiana | 0.7 |
| Alabama | 0.6 |
| Utah | 0.6 |
| Connecticut | 0.5% |
| Tennessee | 0.5 |
| Nevada | 0.5 |
| Alaska | 0.4 |
| North Dakota | 0.4 |
| Delaware | 0.4 |
| Hawaii | 0.4 |
| Oklahoma | 0.4 |
| Multi–State | 0.3 |
| Maryland | 0.3 |
| West Virginia | 0.3 |
| Louisiana | 0.3 |
| New Hampshire | 0.2 |
| Mississippi | 0.2 |
| Rhode Island | 0.2 |
| Kansas | 0.2 |
| Oregon | 0.1 |
| Maine | 0.1 |
| Montana | 0.1 |
| New Mexico | 0.1 |
| Idaho | 0.0‡ |
| South Dakota | 0.0‡ |
| Vermont | 0.0‡ |
| Wyoming | 0.0‡ |
| Short–Term Investment | 1.5 |
| Other Assets, Less Liabilities | 3.1 |
| | 100.0% |
| ‡ | Less than one–tenth of a percent. |
See Portfolio of Investments beginning on page 11 for specific holdings within these categories. The Fund's holdings are subject to change.
Top Ten Issuers Held as of April 30, 2021 (excluding short-term investments) (Unaudited)
| 1. | Metropolitan Pier & Exposition Authority, (zero coupon)-5.00%, due 12/15/31–6/15/57 |
| 2. | Metropolitan Transportation Authority, 0.07%-5.00%, due 5/15/21–11/15/54 |
| 3. | Puerto Rico Sales Tax Financing Corp., (zero coupon)-5.00%, due 7/1/27–7/1/58 |
| 4. | Puerto Rico Commonwealth Aqueduct & Sewer Authority, 4.00%-6.00%, due 7/1/21–7/1/47 |
| 5. | Chicago Board of Education, (zero coupon)-7.00%, due 12/1/26–12/1/46 |
| 6. | Golden State Tobacco Securitization Corp., (zero coupon)-5.30%, due 6/1/36–6/1/47 |
| 7. | Puerto Rico Electric Power Authority, 0.655%-7.00%, due 7/1/19–7/1/43 |
| 8. | State of Illinois, 3.25%-5.75%, due 11/1/21–10/1/45 |
| 9. | Buckeye Tobacco Settlement Financing Authority, 4.00%-5.00%, due 6/1/48–6/1/55 |
| 10. | New York Transportation Development Corp., 4.375%-5.375%, due 8/1/26–1/1/50 |
| 8 | MainStay MacKay High Yield Municipal Bond Fund |
Portfolio Management Discussion and Analysis (Unaudited)
Questions answered by portfolio managers John Loffredo, CFA, Robert DiMella, CFA, Michael Petty, David Dowden, Scott Sprauer and Frances Lewis of MacKay Shields LLC, the Fund’s Subadvisor.
How did MainStay MacKay High Yield Municipal Bond Fund perform relative to its benchmarks and peer group during the six months ended April 30, 2021?
For the six months ended April 30, 2021, Class I shares of MainStay MacKay High Yield Municipal Bond Fund returned 7.47%, outperforming the 2.62% return of the Fund’s primary benchmark, the Bloomberg Barclays Municipal Bond Index (the "Index"). During the same period, Class I shares underperformed the 8.08% return of the Fund’s secondary benchmark, the Bloomberg Barclays High Yield Municipal Bond Index, and outperformed the 5.87% return of the High Yield Municipal Bond Composite Index, an additional benchmark of the Fund. For the six months ended April 30, 2021, Class I shares outperformed the 6.50% return of the Morningstar High Yield Muni Category Average.1
What factors affected the Fund’s relative performance during the reporting period?
During reporting period, both tax-exempt and taxable investment-grade municipal bonds posted positive returns. However, the high-yield segment of the market outperformed both investment-grade and taxable municipal bonds as investors extended out the yield curve2 and went down the rating scale looking for yield. Furthermore, performance in the long-end outperformed short-end maturities, and the states of Illinois and New Jersey outperformed the overall municipal market.
In addition, municipal demand was revived with the availability of COVID-19 vaccines and the growing expectation of the potentially massive impact of the American Rescue Plan Act of 2021 on the fiscal health of states, local governments and an array of municipal government agencies and authorities.
During this time period, the Fund outperformed the Bloomberg Barclays Municipal Bond Index primarily due to positive security selection. An underweight exposure to higher-quality bonds rated AAA to AA3 and security selection among, non-rated holdings made an additional positive contribution to relative returns. (Contributions take weightings and total returns into account.) From a geographic perspective, overweight exposure to, and security selection among, Puerto Rico and Illinois bonds
contributed positively to relative performance. Among maturities, greater than 30-year maturities assisted relative performance.
During the reporting period, how was the Fund’s performance materially affected by investments in derivatives?
During the reporting period, the Fund held a small position in U.S. Treasury futures that had a minimal impact on relative performance.
What was the Fund’s duration4 strategy during the reporting period?
During the reporting period, the Fund maintained a longer duration posture than the benchmark. The Fund’s duration was targeted to maintain a neutral range relative to the investable universe as outlined in the prospectus. In addition to investment-grade bonds, the Fund normally invests a substantial amount of its assets in municipal securities rated below investment grade. Since the Fund’s investable universe is broader than that of the Bloomberg Barclays Municipal Bond Index, the Fund’s duration may differ from the Index. As of April 30, 2021, the Fund’s modified duration to worst was 5.22 years, while the Index had a modified duration to worst5 of 4.75 years.
During the reporting period, which sectors were the strongest positive contributors to the Fund’s relative performance and which sectors were particularly weak?
During the reporting period, security selection within the education, electric and IDR/PCR (industry development revenue/pollution control revenue) sectors contributed positively to relative performance. Conversely, the Fund’s cash position was the most significant drag on relative performance. All other sectors either performed in line with or outperformed the primary benchmark.
What were some of the Fund’s largest purchases and sales during the reporting period?
As the Fund remains focused on diversification and liquidity, no individual purchase or sale were considered significant, although
| 1. | See page 5 for other share class returns, which may be higher or lower than Class I share returns. See page 6 for more information on benchmark and peer group returns. |
| 2. | The yield curve is a line that plots the yields of various securities of similar quality—typically U.S. Treasury issues—across a range of maturities. The U.S. Treasury yield curve serves as a benchmark for other debt and is used in economic forecasting. |
| 3. | An obligation rated ‘AAA’ has the highest rating assigned by Standard & Poor’s (“S&P”), and in the opinion of S&P, the obligor’s capacity to meet its financial commitment on the obligation is extremely strong. An obligation rated ‘AA’ by S&P is deemed by S&P to differ from the highest-rated obligations only to a small degree. In the opinion of S&P, the obligor’s capacity to meet its financial commitment on the obligation is very strong. When applied to Fund holdings, ratings are based solely on the creditworthiness of the bonds in the portfolio and are not meant to represent the security or safety of the Fund. |
| 4. | Duration is a measure of the price sensitivity of a fixed-income investment to changes in interest rates. Duration is expressed as a number of years and is considered a more accurate sensitivity gauge than average maturity. |
| 5. | Modified duration is inversely related to the approximate percentage change in price for a given change in yield. Duration to worst is the duration of a bond computed using the bond’s nearest call date or maturity, whichever comes first. This measure ignores future cash flow fluctuations due to embedded optionality. |
sector overweights or security structure, in their entirety, had an impact.
How did the Fund’s sector weighting change during the reporting period?
During the reporting period, there were no material changes to the sector allocations. There was an increase in the Fund’s allocation to the transportation, leasing and water/sewer sectors. Conversely, there was a decrease to the Fund’s allocation to the hospital, prerefunded/ETM (escrowed to maturity)and education sectors. Across geography, consistent with the team's 2021 Municipal Market Insights,6 the Fund increased its exposure to Puerto Rico and New York bonds. In addition, the Fund decreased its exposure to Texas bonds. Lastly, the Fund increased its credit exposure to bonds rated AA and BB, while decreasing its credit exposure to bonds rated A and B.7
How was the Fund positioned at the end of the reporting period?
As of April 30, 2021, the Fund held overweight positions relative to the Bloomberg Barclays Municipal Bond Index in the tobacco and hospital sectors. The Fund also held overweight exposure to bonds from Puerto Rico and Illinois, as well as an overweight position in credits that are below investment grade, which are not held in the benchmark.
As of the same date, the Fund held relatively underweight exposure to the local and state general obligation sectors. Other underweight exposures relative to the benchmark included AAA- and AA-rated securities and bonds with maturities of five to ten years.
| 6. | To view the 2021 Municipal Market Insights visit newyorklifeinvestments.com/insights. |
| 7. | An obligation rated ‘A’ by S&P is deemed by S&P to be somewhat more susceptible to the adverse effects of changes in circumstances and economic conditions than obligations in higher-rated categories. In the opinion of S&P, however, the obligor's capacity to meet its financial commitment on the obligation is still strong. An obligation rated ‘BB’ by S&P is deemed by S&P to be less vulnerable to nonpayment than other speculative issues. In the opinion of S&P, however, the obligor faces major ongoing uncertainties or exposure to adverse business, financial or economic conditions which could lead to the obligor’s inadequate capacity to meet its financial commitment on the obligation. An obligation rated ‘B’ by S&P is deemed by S&P to be more vulnerable to nonpayment than obligations rated ‘BB’, but in the opinion of S&P, the obligor currently has the capacity to meet its financial commitment on the obligation. It is the opinion of S&P that adverse business, financial, or economic conditions will likely impair the obligor's capacity or willingness to meet its financial commitment on the obligation. When applied to Fund holdings, ratings are based solely on the creditworthiness of the bonds in the portfolio and are not meant to represent the security or safety of the Fund. |
The opinions expressed are those of the portfolio managers as of the date of this report and are subject to change. There is no guarantee that any forecasts will come to pass. This material does not constitute investment advice and is not intended as an endorsement of any specific investment.
| 10 | MainStay MacKay High Yield Municipal Bond Fund |
Portfolio of Investments April 30, 2021† (Unaudited)
| | Principal
Amount | Value |
| Municipal Bonds 94.5% |
| Long-Term Municipal Bonds 85.1% |
| Alabama 0.5% |
| Alabama Special Care Facilities Financing Authority-Birmingham AL, Methodist Home for the Aging, Revenue Bonds | | |
| 5.75%, due 6/1/45 | $ 1,250,000 | $ 1,303,445 |
| County of Jefferson, Sewer, Revenue Bonds, Senior Lien | | |
| Series A, Insured: AGM | | |
| 5.50%, due 10/1/53 | 11,960,000 | 13,481,671 |
| County of Jefferson, Sewer, Revenue Bonds, Sub. Lien | | |
| Series D | | |
| 6.00%, due 10/1/42 | 2,500,000 | 2,920,016 |
| Homewood Educational Building Authority, Samford University Project, Revenue Bonds | | |
| Series A | | |
| 4.00%, due 12/1/33 | 400,000 | 467,168 |
| Series A | | |
| 4.00%, due 12/1/35 | 1,000,000 | 1,161,965 |
| Series A | | |
| 4.00%, due 12/1/36 | 615,000 | 710,272 |
| Series A | | |
| 4.00%, due 12/1/37 | 650,000 | 748,550 |
| Series A | | |
| 4.00%, due 12/1/39 | 1,760,000 | 2,017,223 |
| Series A | | |
| 4.00%, due 12/1/41 | 2,750,000 | 3,136,360 |
| Montgomery Educational Building Authority, Faulkner University, Revenue Bonds | | |
| Series A | | |
| 5.00%, due 10/1/43 | 5,080,000 | 5,525,568 |
| Prichard Water Works & Sewer Board, Revenue Bonds | | |
| 4.00%, due 11/1/49 | 3,000,000 | 3,298,318 |
| Tuscaloosa County Industrial Development Authority, Hunt Refining Project, Revenue Bonds (a) | | |
| Series A | | |
| 4.50%, due 5/1/32 | 5,000,000 | 5,716,432 |
| Series A | | |
| 5.25%, due 5/1/44 | 16,500,000 | 19,209,811 |
| | | 59,696,799 |
| | Principal
Amount | Value |
| |
| Alaska 0.4% |
| Alaska Industrial Development & Export Authority, Tanana Chiefs Conference Project, Revenue Bonds | | |
| Series A | | |
| 4.00%, due 10/1/44 | $ 10,000,000 | $ 11,292,090 |
| Series A | | |
| 4.00%, due 10/1/49 | 6,140,000 | 6,893,103 |
| Alaska Industrial Development & Export Authority, Interior Gas Utility Project, Revenue Bonds | | |
| Series A | | |
| 5.00%, due 6/1/40 | 1,795,000 | 2,049,230 |
| Series A | | |
| 5.00%, due 6/1/50 | 3,485,000 | 3,922,690 |
| Northern Tobacco Securitization Corp., Tobacco Settlement Asset-Backed, Revenue Bonds | | |
| Series A | | |
| 5.00%, due 6/1/46 | 24,160,000 | 24,463,858 |
| | | 48,620,971 |
| Arizona 1.1% |
| Arizona Health Facilities Authority, Phoenix Children's Hospital, Revenue Bonds | | |
| Series A | | |
| 5.00%, due 2/1/42 | 7,945,000 | 8,198,446 |
| Arizona Industrial Development Authority, Provident Group, NCCU Properties LLC, Central University Project, Revenue Bonds | | |
| Series A, Insured: BAM | | |
| 4.00%, due 6/1/44 | 2,500,000 | 2,825,308 |
| Series A, Insured: BAM | | |
| 5.00%, due 6/1/58 | 5,750,000 | 6,939,370 |
| Arizona Industrial Development Authority, University of Indianapolis, Health Pavilion Project, Revenue Bonds | | |
| Series A | | |
| 4.00%, due 10/1/49 | 1,000,000 | 1,086,869 |
| Series A | | |
| 5.00%, due 10/1/45 | 1,875,000 | 2,224,417 |
The notes to the financial statements are an integral part of, and should be read in conjunction with, the financial statements.
11
Portfolio of Investments April 30, 2021† (Unaudited) (continued)
| | Principal
Amount | Value |
| Long-Term Municipal Bonds (continued) |
| Arizona (continued) |
| Arizona Industrial Development Authority, Idaho State Tax Commission, Linder Village Project, Revenue Bonds | | |
| 5.00%, due 6/1/31 (a) | $ 4,000,000 | $ 4,221,835 |
| Arizona Industrial Development Authority, Arizona Agribusiness and Equine Center, Inc., Revenue Bonds (a) | | |
| Series B | | |
| 5.00%, due 3/1/37 | 3,280,000 | 3,721,943 |
| Series B | | |
| 5.00%, due 3/1/42 | 3,435,000 | 3,857,259 |
| Arizona Industrial Development Authority, Mater Academy of Nevada, Bonanza Campus Project, Revenue Bonds | | |
| Series A | | |
| 5.00%, due 12/15/50 (a) | 1,500,000 | 1,700,624 |
| Arizona Industrial Development Authority, Provident Group, Eastern Michigan University Parking Project, Revenue Bonds | | |
| 5.00%, due 5/1/51 | 1,000,000 | 1,039,984 |
| Arizona Industrial Development Authority, Basis Schools Project, Revenue Bonds | | |
| Series A | | |
| 5.375%, due 7/1/50 (a) | 1,500,000 | 1,684,263 |
| Arizona Industrial Development Authority, American Charter Schools Foundation, Revenue Bonds (a) | | |
| 6.00%, due 7/1/37 | 3,035,000 | 3,725,161 |
| 6.00%, due 7/1/47 | 6,935,000 | 8,369,331 |
| City of Phoenix, Basis Schools Project, Revenue Bonds (a) | | |
| Series A | | |
| 5.00%, due 7/1/35 | 1,700,000 | 1,875,297 |
| Series A | | |
| 5.00%, due 7/1/45 | 1,000,000 | 1,087,805 |
| Series A | | |
| 5.00%, due 7/1/46 | 4,120,000 | 4,480,068 |
| | Principal
Amount | Value |
| |
| Arizona (continued) |
| City of Phoenix, Downtown Phoenix Student Housing LLC, Revenue Bonds | | |
| Series A | | |
| 5.00%, due 7/1/37 | $ 1,000,000 | $ 1,158,636 |
| Series A | | |
| 5.00%, due 7/1/59 | 2,200,000 | 2,505,990 |
| City of Phoenix, Villa Montessori, Inc. Project, Revenue Bonds | | |
| 5.00%, due 7/1/45 | 1,150,000 | 1,250,871 |
| City of Phoenix, Espiritu Community Development Corp., Revenue Bonds | | |
| Series A | | |
| 6.25%, due 7/1/36 | 895,000 | 895,940 |
| City of Phoenix, Great Hearts Academies Project, Revenue Bonds | | |
| 6.40%, due 7/1/47 | 1,000,000 | 1,009,725 |
| Florence Town, Inc. Industrial Development Authority, Legacy Traditional School Project, Revenue Bonds | | |
| 6.00%, due 7/1/43 | 2,450,000 | 2,660,274 |
| Glendale Industrial Development Authority, People of Faith, Inc. Obligated Group, Revenue Bonds | | |
| Series A | | |
| 5.00%, due 5/15/56 | 8,500,000 | 9,495,755 |
| Industrial Development Authority of the County of Pima (The), Charter Schools Project, Revenue Bonds | | |
| Series Q | | |
| 5.375%, due 7/1/31 | 1,815,000 | 1,871,859 |
| Industrial Development Authority of the County of Pima (The), American Leadership AC, Revenue Bonds | | |
| 5.625%, due 6/15/45 (a) | 3,985,000 | 4,340,139 |
| Maricopa County Industrial Development Authority, Horizon Community Learning Center, Revenue Bonds | | |
| 5.00%, due 7/1/35 | 3,000,000 | 3,281,649 |
The notes to the financial statements are an integral part of, and should be read in conjunction with, the financial statements.
| 12 | MainStay MacKay High Yield Municipal Bond Fund |
| | Principal
Amount | Value |
| Long-Term Municipal Bonds (continued) |
| Arizona (continued) |
| Maricopa County Pollution Control Corp., El Paso Electric Co. Project, Revenue Bonds | | |
| Series A | | |
| 3.60%, due 2/1/40 | $ 14,400,000 | $ 15,939,426 |
| Series B | | |
| 3.60%, due 4/1/40 | 9,000,000 | 9,959,164 |
| Pinal County Industrial Development Authority, WOF SW GGP 1 LLC Project, Green Bond, Revenue Bonds | | |
| 7.25%, due 10/1/33 (a)(b) | 5,145,000 | 5,701,653 |
| | | 117,109,061 |
| Arkansas 0.7% |
| Arkansas Development Finance Authority, Washington Regional Medical Center, Revenue Bonds | | |
| 4.00%, due 2/1/42 | 6,725,000 | 7,519,934 |
| Series C | | |
| 5.00%, due 2/1/33 | 1,425,000 | 1,584,752 |
| Series C | | |
| 5.00%, due 2/1/35 | 1,170,000 | 1,297,700 |
| Arkansas Development Finance Authority, Baptist Health, Revenue Bonds | | |
| 4.00%, due 12/1/44 | 650,000 | 727,149 |
| Arkansas Development Finance Authority, Big River Steel Project, Revenue Bonds | | |
| 4.50%, due 9/1/49 (a)(b) | 12,250,000 | 13,397,517 |
| Arkansas Development Finance Authority, Big River Steel Project, Green Bond, Revenue Bonds | | |
| Series A | | |
| 4.75%, due 9/1/49 (a)(b) | 46,500,000 | 52,022,517 |
| | | 76,549,569 |
| California 8.3% |
| Alameda Corridor Transportation Authority, Revenue Bonds, Senior Lien | | |
| Series A, Insured: NATL-RE | | |
| (zero coupon), due 10/1/35 | 3,440,000 | 2,577,476 |
| | Principal
Amount | Value |
| |
| California (continued) |
| Antelope Valley Healthcare District, Antelope Valley Healthcare District Obligated Group, Revenue Bonds | | |
| Series A | | |
| 5.00%, due 3/1/46 | $ 1,095,000 | $ 1,107,940 |
| Bassett Unified School District, Capital Appreciation, Election 2004, Unlimited General Obligation | | |
| Series C, Insured: NATL-RE | | |
| (zero coupon), due 8/1/41 | 2,050,000 | 1,229,575 |
| Series C, Insured: NATL-RE | | |
| (zero coupon), due 8/1/42 | 2,000,000 | 1,158,817 |
| California Community Housing Agency, Essential Housing, Revenue Bonds | | |
| Series A | | |
| 4.00%, due 2/1/56 (a) | 5,000,000 | 5,337,619 |
| California Community Housing Agency, Essential Housing, Revenue Bonds, Senior Lien (a) | | |
| Series A1 | | |
| 4.00%, due 2/1/56 | 14,000,000 | 15,552,313 |
| Series A-1 | | |
| 4.00%, due 2/1/56 | 3,500,000 | 3,874,862 |
| California Community Housing Agency, Essential Housing, Serenity at Larkspur Apartments, Revenue Bonds | | |
| Series A | | |
| 5.00%, due 2/1/50 (a) | 9,345,000 | 10,710,468 |
| California Infrastructure and Economic Development Bank, Wonderful Foundations Charter School Portfolio Project, Revenue Bonds | | |
| Series A | | |
| 5.00%, due 1/1/55 (a) | 3,325,000 | 3,796,728 |
| California Municipal Finance Authority, LINXS APM Project, Revenue Bonds | | |
| Series A, Insured: AGM | | |
| 3.25%, due 12/31/32 (b) | 5,965,000 | 6,510,460 |
| California Municipal Finance Authority, United Airlines, Inc. Project, Revenue Bonds | | |
| 4.00%, due 7/15/29 (b) | 21,275,000 | 24,532,115 |
The notes to the financial statements are an integral part of, and should be read in conjunction with, the financial statements.
13
Portfolio of Investments April 30, 2021† (Unaudited) (continued)
| | Principal
Amount | Value |
| Long-Term Municipal Bonds (continued) |
| California (continued) |
| California Municipal Finance Authority, William Jessup University, Revenue Bonds | | |
| 5.00%, due 8/1/28 | $ 1,000,000 | $ 1,156,021 |
| 5.00%, due 8/1/48 | 2,675,000 | 2,941,885 |
| California Municipal Finance Authority, LINX APM Project, Revenue Bonds, Senior Lien (b) | | |
| Series A | | |
| 5.00%, due 12/31/43 | 36,000,000 | 43,520,616 |
| Series B | | |
| 5.00%, due 6/1/48 | 3,000,000 | 3,602,018 |
| California Municipal Finance Authority, Charter School, Palmdale Aerospace Academy Projects (The), Revenue Bonds | | |
| Series A | | |
| 5.00%, due 7/1/46 (a) | 2,665,000 | 2,921,870 |
| California Municipal Finance Authority, Northbay Healthcare Group, Revenue Bonds | | |
| Series A | | |
| 5.00%, due 11/1/47 | 5,515,000 | 6,166,549 |
| California Municipal Finance Authority, CHF-Davis I LLC, West Village Student Housing Project, Revenue Bonds | | |
| 5.00%, due 5/15/48 | 20,000,000 | 23,608,062 |
| 5.00%, due 5/15/51 | 20,000,000 | 23,562,776 |
| California Municipal Finance Authority, Healthright 360, Revenue Bonds | | |
| Series A | | |
| 5.00%, due 11/1/49 (a) | 2,000,000 | 2,195,207 |
| California Municipal Finance Authority, Partnerships to Uplift Community Project, Revenue Bonds | | |
| Series A | | |
| 5.30%, due 8/1/47 | 1,525,000 | 1,560,041 |
| California Municipal Finance Authority, Baptist University, Revenue Bonds (a) | | |
| Series A | | |
| 5.375%, due 11/1/40 | 3,000,000 | 3,380,604 |
| Series A | | |
| 5.50%, due 11/1/45 | 6,000,000 | 6,743,972 |
| | Principal
Amount | Value |
| |
| California (continued) |
| California Municipal Finance Authority, Southwestern Law School, Revenue Bonds | | |
| 6.50%, due 11/1/41 | $ 1,000,000 | $ 1,024,597 |
| California Public Finance Authority, California University of Science & Medicine Obligated Group, Revenue Bonds | | |
| Series A | | |
| 6.25%, due 7/1/54 (a) | 5,515,000 | 6,315,923 |
| California Public Finance Authority, California University of Science & Medicine, Revenue Bonds | | |
| 7.50%, due 7/1/36 (a) | 9,500,000 | 10,440,832 |
| California School Finance Authority, High Tech High Learning Project, Revenue Bonds | | |
| Series A | | |
| 5.00%, due 7/1/49 (a) | 3,000,000 | 3,358,242 |
| California School Finance Authority, Aspire Public Schools Obligated Group, Revenue Bonds | | |
| Series A | | |
| 5.00%, due 8/1/50 (a) | 1,800,000 | 2,145,883 |
| California School Finance Authority, Teach Public Schools Obligated Group, Revenue Bonds | | |
| Series A | | |
| 5.00%, due 6/1/58 (a) | 2,000,000 | 2,150,458 |
| California Statewide Communities Development Authority, Community Infrastructure Program, Special Assessment | | |
| Series 2021 A | | |
| 4.00%, due 9/2/41 (c) | 2,000,000 | 2,210,739 |
| California Statewide Communities Development Authority, Methodist Hospital of Southern California, Revenue Bonds | | |
| 4.375%, due 1/1/48 | 2,185,000 | 2,456,983 |
| 5.00%, due 1/1/43 | 7,500,000 | 8,876,657 |
| California Statewide Communities Development Authority, Lancer Educational Student Housing Project, Revenue Bonds (a) | | |
| Series A | | |
| 5.00%, due 6/1/36 | 2,250,000 | 2,488,227 |
The notes to the financial statements are an integral part of, and should be read in conjunction with, the financial statements.
| 14 | MainStay MacKay High Yield Municipal Bond Fund |
| | Principal
Amount | Value |
| Long-Term Municipal Bonds (continued) |
| California (continued) |
California Statewide Communities Development Authority, Lancer Educational Student Housing Project, Revenue Bonds (a)
(continued) | | |
| Series A | | |
| 5.00%, due 6/1/46 | $ 2,000,000 | $ 2,177,131 |
| Series A | | |
| 5.00%, due 6/1/51 | 1,250,000 | 1,413,716 |
| California Statewide Communities Development Authority, Loma Linda University Medical Center, Revenue Bonds | | |
| Series A | | |
| 5.00%, due 12/1/41 (a) | 1,700,000 | 1,918,340 |
| Series A | | |
| 5.00%, due 12/1/46 (a) | 4,545,000 | 5,099,055 |
| Series A | | |
| 5.25%, due 12/1/56 (a) | 20,000,000 | 22,543,812 |
| Series A | | |
| 5.50%, due 12/1/54 | 3,800,000 | 4,258,006 |
| Series A | | |
| 5.50%, due 12/1/58 (a) | 24,275,000 | 28,778,233 |
| California Statewide Communities Development Authority, Redlands Community Hospital, Revenue Bonds | | |
| 5.00%, due 10/1/46 | 1,560,000 | 1,787,583 |
| California Statewide Communities Development Authority, Irvine Campus Apartments, Revenue Bonds | | |
| 5.00%, due 5/15/50 | 2,000,000 | 2,334,308 |
| California Statewide Communities Development Authority, Lancer Plaza Project, Revenue Bonds | | |
| 5.625%, due 11/1/33 | 680,000 | 735,995 |
| 5.875%, due 11/1/43 | 435,000 | 468,937 |
| California Statewide Communities Development Authority, California Baptist University, Revenue Bonds | | |
| Series A | | |
| 6.375%, due 11/1/43 | 3,535,000 | 3,901,805 |
| Series A | | |
| 7.50%, due 11/1/41 | 1,000,000 | 1,035,907 |
| | Principal
Amount | Value |
| |
| California (continued) |
| California Statewide Financing Authority, Tobacco Settlement Asset Backed, Revenue Bonds | | |
| Series C | | |
| (zero coupon), due 6/1/55 (a) | $ 128,700,000 | $ 12,334,106 |
| Cathedral City Public Financing Authority, Capital Appreciation, Tax Allocation | | |
| Series A, Insured: NATL-RE | | |
| (zero coupon), due 8/1/23 | 925,000 | 904,408 |
| Series A, Insured: NATL-RE | | |
| (zero coupon), due 8/1/26 | 1,085,000 | 1,000,969 |
| City of Los Angeles, Department of Airports, Revenue Bonds, Senior Lien | | |
| Series C | | |
| 4.00%, due 5/15/50 (b) | 29,845,000 | 34,592,325 |
| City of San Buenaventura CA, Community Memorial Health System, Revenue Bonds | | |
| 7.50%, due 12/1/41 | 6,150,000 | 6,357,339 |
| CSCDA Community Improvement Authority, Jefferson Anaheim, Revenue Bonds | | |
| 3.125%, due 8/1/56 (a) | 2,500,000 | 2,410,188 |
| CSCDA Community Improvement Authority, Revenue Bonds (a) | | |
| Series A | | |
| 4.00%, due 8/1/56 | 6,500,000 | 6,989,518 |
| Series A | | |
| 5.00%, due 7/1/51 | 16,000,000 | 18,553,418 |
| CSCDA Community Improvement Authority, Ocennaire Long Beach, Revenue Bonds | | |
| 4.00%, due 9/1/56 (a) | 3,000,000 | 3,229,841 |
| Davis Redevelopment Successor Agency, Davis Redevelopment Project, Tax Allocation | | |
| Series A | | |
| 7.00%, due 12/1/36 | 1,375,000 | 1,429,112 |
| Del Mar Race Track Authority, Revenue Bonds | | |
| 5.00%, due 10/1/35 | 1,665,000 | 1,733,805 |
| Fontana Unified School District, Unlimited General Obligation | | |
| Series C | | |
| (zero coupon), due 8/1/38 | 10,000,000 | 4,092,405 |
The notes to the financial statements are an integral part of, and should be read in conjunction with, the financial statements.
15
Portfolio of Investments April 30, 2021† (Unaudited) (continued)
| | Principal
Amount | Value |
| Long-Term Municipal Bonds (continued) |
| California (continued) |
Fontana Unified School District, Unlimited General Obligation
(continued) | | |
| Series C | | |
| (zero coupon), due 8/1/39 | $ 17,900,000 | $ 6,894,142 |
| Series C | | |
| (zero coupon), due 8/1/43 | 16,000,000 | 4,855,611 |
| Series C | | |
| (zero coupon), due 8/1/44 | 8,000,000 | 2,294,004 |
| Foothill-Eastern Transportation Corridor Agency, Revenue Bonds | | |
| Series B-2 | | |
| 3.50%, due 1/15/53 (d) | 13,715,000 | 15,331,150 |
| Foothill-Eastern Transportation Corridor Agency, Revenue Bonds, Junior Lien | | |
| Series C | | |
| 4.00%, due 1/15/43 | 5,248,000 | 6,124,245 |
| Foothill-Eastern Transportation Corridor Agency, Revenue Bonds, Senior Lien | | |
| Series A | | |
| 4.00%, due 1/15/46 | 9,015,000 | 10,605,704 |
| Series A | | |
| 4.00%, due 1/15/46 | 45,653,000 | 53,708,508 |
| Fresno Unified School District, Election 2001, Unlimited General Obligation | | |
| Series G | | |
| (zero coupon), due 8/1/41 | 10,000,000 | 2,525,114 |
| Golden State Tobacco Securitization Corp., Revenue Bonds | | |
| Series B | | |
| (zero coupon), due 6/1/47 (e) | 625,000,000 | 138,605,125 |
| Series A-1 | | |
| 3.50%, due 6/1/36 | 7,570,000 | 7,705,417 |
| Series A-1 | | |
| 5.00%, due 6/1/47 | 20,385,000 | 21,062,844 |
| Series A-2 | | |
| 5.00%, due 6/1/47 | 33,460,000 | 34,572,615 |
| Series A-1 | | |
| 5.25%, due 6/1/47 | 4,000,000 | 4,144,906 |
| Golden State Tobacco Securitization Corp., Asset-Backed, Revenue Bonds | | |
| Series A-2 | | |
| 5.30%, due 6/1/37 (d) | 20,365,000 | 21,135,740 |
| | Principal
Amount | Value |
| |
| California (continued) |
| Hastings Campus Housing Finance Authority, Green Bond, Revenue Bonds, Senior Lien | | |
| Series A | | |
| 5.00%, due 7/1/61 | $ 60,000,000 | $ 68,768,826 |
| Independent Cities Finance Authority, Sales Tax, Revenue Bonds | | |
| Insured: AGM | | |
| 4.00%, due 6/1/51 (a) | 1,250,000 | 1,408,726 |
| Inland Empire Tobacco Securitization Corp., Revenue Bonds | | |
| Series D | | |
| (zero coupon), due 6/1/57 | 275,450,000 | 22,914,438 |
| Mendocino-Lake Community College District, Capital Appreciation, Election of 2006, Unlimited General Obligation | | |
| Series B, Insured: AGM | | |
| (zero coupon), due 8/1/39 | 8,400,000 | 2,230,397 |
| Riverside County Transportation Commission, Revenue Bonds, Senior Lien | | |
| Series A | | |
| 5.75%, due 6/1/48 | 1,480,000 | 1,614,081 |
| Rohnerville School District, Election 2010, Unlimited General Obligation | | |
| Series B, Insured: AGM | | |
| (zero coupon), due 8/1/42 | 1,000,000 | 561,630 |
| Series B, Insured: AGM | | |
| (zero coupon), due 8/1/47 | 1,000,000 | 476,091 |
| San Francisco City & County Redevelopment Agency, Community Facilities District No. 6 Bay Public, Special Tax | | |
| Series C | | |
| (zero coupon), due 8/1/37 | 5,015,000 | 2,099,056 |
| Series C | | |
| (zero coupon), due 8/1/38 | 2,000,000 | 782,853 |
| San Joaquin Hills Transportation Corridor Agency, Revenue Bonds, Senior Lien | | |
| Series A | | |
| 5.00%, due 1/15/50 | 18,150,000 | 20,241,597 |
The notes to the financial statements are an integral part of, and should be read in conjunction with, the financial statements.
| 16 | MainStay MacKay High Yield Municipal Bond Fund |
| | Principal
Amount | Value |
| Long-Term Municipal Bonds (continued) |
| California (continued) |
| San Joaquin Hills Transportation Corridor Agency, Revenue Bonds, Junior Lien | | |
| Series B | | |
| 5.25%, due 1/15/44 | $ 16,500,000 | $ 18,496,426 |
| Series B | | |
| 5.25%, due 1/15/49 | 4,220,000 | 4,720,668 |
| Santa Ana Unified School District, Capital Appreciation, Election 2008, Unlimited General Obligation | | |
| Series B, Insured: AGC | | |
| (zero coupon), due 8/1/47 | 25,000,000 | 10,510,585 |
| Sierra Kings Health Care District, Unlimited General Obligation | | |
| 5.00%, due 8/1/37 | 2,465,000 | 2,724,027 |
| Stockton Unified School District, Capital Appreciation, Election 2008, Unlimited General Obligation | | |
| Series D, Insured: AGM | | |
| (zero coupon), due 8/1/42 | 9,080,000 | 5,338,841 |
| Sutter Union High School District, Election 2008, Unlimited General Obligation | | |
| Series B | | |
| (zero coupon), due 6/1/50 | 16,260,000 | 2,604,182 |
| Tobacco Securitization Authority of Southern California, San Diego County Tobacco Asset Securitization Corp., Asset-Backed, Revenue Bonds | | |
| Series B-2 | | |
| (zero coupon), due 6/1/54 | 19,000,000 | 3,634,012 |
| Westminster School District, Election 2008, Unlimited General Obligation | | |
| Series B, Insured: BAM | | |
| (zero coupon), due 8/1/53 | 20,000,000 | 2,405,266 |
| | | 910,393,624 |
| Colorado 2.4% |
| 3rd and Havana Metropolitan District, Tax Supported, Limited General Obligation | | |
| Series A | | |
| 5.25%, due 12/1/49 | 2,250,000 | 2,447,832 |
| | Principal
Amount | Value |
| |
| Colorado (continued) |
| Allison Valley Metropolitan District No. 2, Limited General Obligation | | |
| 4.70%, due 12/1/47 | $ 2,500,000 | $ 2,633,415 |
| Arista Metropolitan District, Limited General Obligation | | |
| Series A | | |
| 5.125%, due 12/1/48 | 3,500,000 | 3,765,732 |
| Arkansas River Power Authority, Revenue Bonds | | |
| Series A | | |
| 5.00%, due 10/1/43 | 14,675,000 | 17,023,784 |
| Belleview Station Metropolitan District No. 2, Limited General Obligation | | |
| 5.125%, due 12/1/46 | 2,375,000 | 2,467,813 |
| Broadway Park North Metropolitan District No. 2, Limited General Obligation (a) | | |
| 5.00%, due 12/1/40 | 1,000,000 | 1,104,682 |
| 5.00%, due 12/1/49 | 1,000,000 | 1,096,544 |
| Broadway Station Metropolitan District No. 2, Limited General Obligation | | |
| Series A | | |
| 5.125%, due 12/1/48 | 3,000,000 | 3,267,985 |
| Central Platte Valley Metropolitan District, Unlimited General Obligation | | |
| Series A | | |
| 5.375%, due 12/1/33 | 1,500,000 | 1,628,343 |
| Citadel on Colfax Business Improvement District, Revenue Bonds | | |
| Series A | | |
| 5.35%, due 12/1/50 | 1,000,000 | 1,081,520 |
| City & County of Denver, United Airlines, Inc., Project, Revenue Bonds | | |
| 5.00%, due 10/1/32 (b) | 7,100,000 | 7,585,781 |
| City of Fruita CO, Canyons Hospital & Medical Center Project, Revenue Bonds | | |
| Series A | | |
| 5.50%, due 1/1/48 (a) | 10,000,000 | 10,853,983 |
The notes to the financial statements are an integral part of, and should be read in conjunction with, the financial statements.
17
Portfolio of Investments April 30, 2021† (Unaudited) (continued)
| | Principal
Amount | Value |
| Long-Term Municipal Bonds (continued) |
| Colorado (continued) |
| Colorado Health Facilities Authority, CommonSpirit Health Obligated Group, Revenue Bonds | | |
| Series A-2 | | |
| 3.25%, due 8/1/49 | $ 12,000,000 | $ 12,731,550 |
| Series A-1 | | |
| 4.00%, due 8/1/44 | 20,195,000 | 22,879,424 |
| Series A-2 | | |
| 4.00%, due 8/1/49 | 5,905,000 | 6,664,505 |
| Series A-2 | | |
| 5.00%, due 8/1/44 | 12,000,000 | 14,788,700 |
| Colorado Health Facilities Authority, Covenant Living Communities and Services Obligated Group, Revenue Bonds | | |
| Series A | | |
| 5.00%, due 12/1/35 | 3,500,000 | 3,897,209 |
| Series A | | |
| 5.00%, due 12/1/48 | 7,500,000 | 8,597,099 |
| Colorado Health Facilities Authority, Frasier Meadows Retirement Community Project, Revenue Bonds | | |
| Series A | | |
| 5.25%, due 5/15/47 | 2,000,000 | 2,314,587 |
| Colorado Health Facilities Authority, Mental Health Center of Denver Project, Revenue Bonds | | |
| Series A | | |
| 5.75%, due 2/1/44 | 4,175,000 | 4,475,943 |
| Copper Ridge Metropolitan District, Revenue Bonds | | |
| 5.00%, due 12/1/39 | 4,250,000 | 4,516,667 |
| Denver Health & Hospital Authority, 550 Acoma, Inc., Certificate of Participation | | |
| 5.00%, due 12/1/48 | 1,755,000 | 2,115,393 |
| Denver Health & Hospital Authority, Revenue Bonds | | |
| Series A | | |
| 5.25%, due 12/1/45 | 4,250,000 | 4,626,451 |
| Dominion Water & Sanitation District, Revenue Bonds | | |
| 5.75%, due 12/1/36 | 9,935,000 | 10,367,976 |
| 6.00%, due 12/1/46 | 967,000 | 1,009,024 |
| | Principal
Amount | Value |
| |
| Colorado (continued) |
| E-470 Public Highway Authority, Revenue Bonds | | |
| Series B, Insured: NATL-RE | | |
| (zero coupon), due 9/1/22 | $ 5,000,000 | $ 4,978,089 |
| Series B, Insured: NATL-RE | | |
| (zero coupon), due 9/1/25 | 245,000 | 236,293 |
| Series B, Insured: NATL-RE | | |
| (zero coupon), due 9/1/26 | 4,540,000 | 4,304,169 |
| Series B, Insured: NATL-RE | | |
| (zero coupon), due 9/1/29 | 4,510,000 | 3,972,624 |
| Series B, Insured: NATL-RE | | |
| (zero coupon), due 9/1/30 | 500,000 | 427,739 |
| Series B, Insured: NATL-RE | | |
| (zero coupon), due 9/1/35 | 2,245,000 | 1,315,064 |
| Series B, Insured: NATL-RE | | |
| (zero coupon), due 9/1/37 | 1,170,000 | 618,200 |
| Series B, Insured: NATL-RE | | |
| (zero coupon), due 9/1/39 | 515,000 | 245,354 |
| Series A | | |
| (zero coupon), due 9/1/40 | 5,250,000 | 3,298,994 |
| Series A | | |
| (zero coupon), due 9/1/41 | 3,925,000 | 2,381,024 |
| Eagle County Airport Terminal Corp., Revenue Bonds | | |
| Series B | | |
| 5.00%, due 5/1/33 (b) | 2,435,000 | 2,794,458 |
| Evan's Place Metropolitan District, Limited General Obligation | | |
| Series A(3) | | |
| 5.00%, due 12/1/50 | 1,500,000 | 1,648,683 |
| Great Western Metropolitan District, Limited General Obligation | | |
| 4.75%, due 12/1/50 | 1,500,000 | 1,591,057 |
| Green Valley Ranch East Metropolitan District No. 6, Limited General Obligation | | |
| Series A | | |
| 5.875%, due 12/1/50 | 1,325,000 | 1,463,445 |
| Jefferson Center Metropolitan District No. 1, Revenue Bonds | | |
| Series B | | |
| 5.75%, due 12/15/50 | 4,615,000 | 4,950,473 |
| Jones District Community Authority Board, Revenue Bonds | | |
| (zero coupon), due 12/1/50 (d) | 5,050,000 | 4,376,630 |
The notes to the financial statements are an integral part of, and should be read in conjunction with, the financial statements.
| 18 | MainStay MacKay High Yield Municipal Bond Fund |
| | Principal
Amount | Value |
| Long-Term Municipal Bonds (continued) |
| Colorado (continued) |
| Karl's Farm Metropolitan District No. 2, Limited General Obligation | | |
| Series A | | |
| 5.625%, due 12/1/50 (a) | $ 1,485,000 | $ 1,627,947 |
| Mayfield Metropolitan District, Limited General Obligation | | |
| Series A | | |
| 5.75%, due 12/1/50 | 1,190,000 | 1,319,671 |
| Mirabelle Metropolitan District No. 2, Limited General Obligation, Senior Lien | | |
| Series A | | |
| 5.00%, due 12/1/49 | 1,250,000 | 1,348,890 |
| Nine Mile Metropolitan District, Revenue Bonds | | |
| 5.125%, due 12/1/40 | 1,505,000 | 1,678,147 |
| North Range Metropolitan District No. 3, Limited General Obligation | | |
| Series 2020A-3 | | |
| 5.25%, due 12/1/50 | 2,000,000 | 2,219,586 |
| Park Creek Metropolitan District, Revenue Bonds, Senior Lien | | |
| Series A, Insured: AGM | | |
| 4.00%, due 12/1/39 | 4,055,000 | 4,854,716 |
| Series A, Insured: AGM | | |
| 4.00%, due 12/1/46 | 21,450,000 | 25,311,425 |
| Park Creek Metropolitan District, Senior Ltd., Property, Revenue Bonds, Senior Lien | | |
| Series A | | |
| 5.00%, due 12/1/45 | 4,000,000 | 4,604,072 |
| Raindance Metropolitan District No. 1 Non-Potable Water System, Revenue Bonds | | |
| 5.25%, due 12/1/50 | 1,500,000 | 1,635,938 |
| Raindance Metropolitan District No. 2, Limited General Obligation | | |
| Series A | | |
| 5.00%, due 12/1/49 | 2,500,000 | 2,688,530 |
| Southglenn Metropolitan District, Special Revenue, Limited General Obligation | | |
| 5.00%, due 12/1/46 | 2,100,000 | 2,181,200 |
| | Principal
Amount | Value |
| |
| Colorado (continued) |
| Sterling Ranch Community Authority Board, Colorado Limited Tax Supported And Special Revenue Senior Bonds, Revenue Bonds | | |
| Series A | | |
| 4.25%, due 12/1/50 | $ 1,250,000 | $ 1,390,517 |
| Series A, Insured: MUN GOVT GTD | | |
| 5.00%, due 12/1/47 | 3,500,000 | 3,715,071 |
| Village Metropolitan District (The), Special Revenue And Limited Property Tax, Limited General Obligation | | |
| 5.00%, due 12/1/40 | 750,000 | 832,758 |
| Village Metropolitan District (The), Limited General Obligation | | |
| 5.00%, due 12/1/49 | 1,000,000 | 1,102,097 |
| Villages at Castle Rock Metropolitan District No. 6, Cobblestone Ranch Project, Limited General Obligation | | |
| Series 2 | | |
| (zero coupon), due 12/1/37 | 44,000,000 | 14,631,703 |
| | | 263,686,506 |
| Connecticut 0.5% |
| City of Hartford CT, Unlimited General Obligation | | |
| Series B, Insured: State Guaranteed | | |
| 5.00%, due 4/1/26 | 60,000 | 65,153 |
| Series B, Insured: State Guaranteed | | |
| 5.00%, due 4/1/27 | 500,000 | 541,907 |
| Series B, Insured: State Guaranteed | | |
| 5.00%, due 4/1/30 | 640,000 | 691,200 |
| Series B, Insured: State Guaranteed | | |
| 5.00%, due 4/1/33 | 100,000 | 107,857 |
| Connecticut State Health & Educational Facilities Authority, McLean Issue, Revenue Bonds (a) | | |
| Series B-1 | | |
| 3.25%, due 1/1/27 | 750,000 | 765,204 |
The notes to the financial statements are an integral part of, and should be read in conjunction with, the financial statements.
19
Portfolio of Investments April 30, 2021† (Unaudited) (continued)
| | Principal
Amount | Value |
| Long-Term Municipal Bonds (continued) |
| Connecticut (continued) |
| Connecticut State Health & Educational Facilities Authority, McLean Issue, Revenue Bonds (a) (continued) | | |
| Series A | | |
| 5.00%, due 1/1/30 | $ 500,000 | $ 568,287 |
| Connecticut State Health & Educational Facilities Authority, University of Hartford (The), Revenue Bonds | | |
| Series N | | |
| 4.00%, due 7/1/39 | 5,850,000 | 6,378,398 |
| Series N | | |
| 4.00%, due 7/1/49 | 7,750,000 | 8,319,816 |
| Series N | | |
| 5.00%, due 7/1/31 | 575,000 | 696,802 |
| Series N | | |
| 5.00%, due 7/1/32 | 575,000 | 693,996 |
| Series N | | |
| 5.00%, due 7/1/33 | 475,000 | 571,369 |
| Series N | | |
| 5.00%, due 7/1/34 | 700,000 | 838,434 |
| Connecticut State Health & Educational Facilities Authority, Mary Wade Home Obligated Group, Revenue Bonds (a) | | |
| Series A-1 | | |
| 4.50%, due 10/1/34 | 2,350,000 | 2,452,191 |
| Series A-1 | | |
| 5.00%, due 10/1/39 | 1,000,000 | 1,064,193 |
| Connecticut State Health & Educational Facilities Authority, University of New Haven, Inc., Revenue Bonds | | |
| Series K-3 | | |
| 5.00%, due 7/1/48 | 3,695,000 | 4,195,513 |
| Connecticut State Health & Educational Facilities Authority, Griffin Health Obligated Group, Revenue Bonds | | |
| Series G-1 | | |
| 5.00%, due 7/1/50 (a) | 1,750,000 | 1,956,957 |
| | Principal
Amount | Value |
| |
| Connecticut (continued) |
| Connecticut State Health & Educational Facilities Authority, Church Home of Hartford Obligated Group, Revenue Bonds | | |
| Series A | | |
| 5.00%, due 9/1/53 (a) | $ 1,500,000 | $ 1,646,568 |
| Connecticut State Higher Education Supplement Loan Authority, Revenue Bonds | | |
| Series B | | |
| 3.25%, due 11/15/35 (b) | 9,020,000 | 9,185,695 |
| Hartford Stadium Authority, Stadium Authority Lease, Revenue Bonds | | |
| Series A | | |
| 5.00%, due 2/1/36 | 1,475,000 | 1,479,126 |
| State of Connecticut, Unlimited General Obligation | | |
| Series C | | |
| 5.00%, due 6/15/28 | 5,000,000 | 6,445,271 |
| Series E | | |
| 5.00%, due 9/15/37 | 2,250,000 | 2,819,436 |
| | | 51,483,373 |
| Delaware 0.4% |
| County of Kent DE, Student Housing & Dining Facility, CHF-Dover LLC, Delaware State University Project, Revenue Bonds | | |
| Series A | | |
| 5.00%, due 7/1/40 | 1,050,000 | 1,187,353 |
| Series A | | |
| 5.00%, due 7/1/48 | 2,735,000 | 3,057,563 |
| Series A | | |
| 5.00%, due 7/1/53 | 4,340,000 | 4,838,005 |
| Series A | | |
| 5.00%, due 7/1/58 | 6,950,000 | 7,725,392 |
| Delaware State Health Facilities Authority, Beebe Medical Center, Revenue Bonds | | |
| 4.25%, due 6/1/38 | 2,235,000 | 2,538,101 |
| 4.375%, due 6/1/48 | 9,650,000 | 10,856,331 |
| 5.00%, due 6/1/37 | 1,000,000 | 1,208,800 |
| 5.00%, due 6/1/43 | 5,000,000 | 5,968,194 |
The notes to the financial statements are an integral part of, and should be read in conjunction with, the financial statements.
| 20 | MainStay MacKay High Yield Municipal Bond Fund |
| | Principal
Amount | Value |
| Long-Term Municipal Bonds (continued) |
| Delaware (continued) |
| Delaware State Health Facilities Authority, Nanticoke Memorial Hospital Project, Revenue Bonds | | |
| 5.00%, due 7/1/32 | $ 3,855,000 | $ 4,242,726 |
| Delaware State Health Facilities Authority, Christiana Health Care System Obligated Group, Revenue Bonds | | |
| Series A | | |
| 5.00%, due 10/1/40 | 7,000,000 | 8,895,843 |
| | | 50,518,308 |
| District of Columbia 2.0% |
| District of Columbia, Tobacco Settlement Financing Corp., Asset Backed, Revenue Bonds | | |
| Series A | | |
| (zero coupon), due 6/15/46 | 85,000,000 | 18,121,507 |
| District of Columbia, KIPP DC Project, Revenue Bonds | | |
| 4.00%, due 7/1/49 | 1,375,000 | 1,527,638 |
| District of Columbia, Provident Group-Howard Properties LLC, Revenue Bonds | | |
| 5.00%, due 10/1/30 | 1,500,000 | 1,539,772 |
| 5.00%, due 10/1/45 | 5,355,000 | 5,452,448 |
| District of Columbia, Friendship Public Charter School, Revenue Bonds | | |
| Series A | | |
| 5.00%, due 6/1/46 | 1,400,000 | 1,591,191 |
| District of Columbia, District of Columbia International School Obligated Group, Revenue Bonds | | |
| 5.00%, due 7/1/49 | 1,670,000 | 1,928,637 |
| 5.00%, due 7/1/54 | 1,905,000 | 2,194,812 |
| District of Columbia, Two Rivers Public Charter School, Inc., Revenue Bonds | | |
| 5.00%, due 6/1/55 | 4,200,000 | 4,855,049 |
| District of Columbia, Methodist Home, Revenue Bonds | | |
| Series A | | |
| 5.25%, due 1/1/39 | 1,015,000 | 1,015,928 |
| | Principal
Amount | Value |
| |
| District of Columbia (continued) |
| Metropolitan Washington Airports Authority Dulles Toll Road, Revenue Bonds, Senior Lien | | |
| Series B | | |
| (zero coupon), due 10/1/39 | $ 5,005,000 | $ 3,160,976 |
| Metropolitan Washington Airports Authority Dulles Toll Road, Revenue Bonds, Sub. Lien | | |
| Series B | | |
| 4.00%, due 10/1/44 | 23,780,000 | 27,283,346 |
| Series B | | |
| 4.00%, due 10/1/49 | 10,435,000 | 11,902,658 |
| Series B, Insured: AGM | | |
| 4.00%, due 10/1/53 | 17,500,000 | 20,086,481 |
| Series B | | |
| 4.00%, due 10/1/53 | 68,280,000 | 77,525,529 |
| Metropolitan Washington Airports Authority Dulles Toll Road, Revenue Bonds | | |
| Series A | | |
| 5.00%, due 10/1/53 | 40,000,000 | 41,481,748 |
| | | 219,667,720 |
| Florida 2.7% |
| Capital Trust Agency, Wonderful Foundations Charter School, Revenue Bonds | | |
| Series B | | |
| (zero coupon), due 1/1/60 | 16,000,000 | 1,510,094 |
| Series A | | |
| 5.00%, due 1/1/55 (a) | 10,780,000 | 12,033,613 |
| Capital Trust Agency, Odyssey Charter School, Inc., Revenue Bonds | | |
| Series A | | |
| 5.50%, due 7/1/47 (a) | 2,000,000 | 2,238,574 |
| Celebration Pointe Community Development District, Special Assessment | | |
| 5.125%, due 5/1/45 | 2,630,000 | 2,754,194 |
| City of Atlantic Beach FL, Fleet Landing Project, Revenue Bonds | | |
| Series B-2 | | |
| 3.00%, due 11/15/23 | 3,500,000 | 3,501,625 |
| Series B-1 | | |
| 3.25%, due 11/15/24 | 2,155,000 | 2,156,301 |
| Series A | | |
| 5.00%, due 11/15/48 | 3,000,000 | 3,355,576 |
The notes to the financial statements are an integral part of, and should be read in conjunction with, the financial statements.
21
Portfolio of Investments April 30, 2021† (Unaudited) (continued)
| | Principal
Amount | Value |
| Long-Term Municipal Bonds (continued) |
| Florida (continued) |
City of Atlantic Beach FL, Fleet Landing Project, Revenue Bonds
(continued) | | |
| Series B | | |
| 5.625%, due 11/15/43 | $ 1,500,000 | $ 1,605,469 |
| City of Fort Myers FL, Utility System, Revenue Bonds | | |
| Series A | | |
| 4.00%, due 10/1/49 | 10,500,000 | 12,086,270 |
| City of Orlando FL, Tourist Development Tax, Unrefunded, Revenue Bonds | | |
| Series C, Insured: AGC | | |
| 5.50%, due 11/1/38 | 325,000 | 325,852 |
| City of Tallahassee FL, Memorial HealthCare, Inc., Revenue Bonds | | |
| Series A | | |
| 5.00%, due 12/1/55 | 7,500,000 | 8,396,335 |
| Collier County Educational Facilities Authority, Ave Maria University, Inc. Project, Revenue Bonds | | |
| Series A | | |
| 5.25%, due 6/1/28 | 2,250,000 | 2,413,099 |
| Series A | | |
| 6.125%, due 6/1/43 | 2,500,000 | 2,694,007 |
| County of Osceola, Transportation, Revenue Bonds | | |
| Series A-1 | | |
| 4.00%, due 10/1/54 | 4,345,000 | 4,910,390 |
| Series A-1 | | |
| 5.00%, due 10/1/44 | 4,730,000 | 5,851,847 |
| Series A-1 | | |
| 5.00%, due 10/1/49 | 6,900,000 | 8,483,286 |
| Epperson North Community Development District, Assessment Area | | |
| 3.50%, due 5/1/41 | 1,000,000 | 1,010,949 |
| Escambia County Health Facilities Authority, Baptist Health Care Corp., Revenue Bonds | | |
| Series A | | |
| 4.00%, due 8/15/50 | 9,990,000 | 11,364,325 |
| Series A, Insured: AGM | | |
| 4.00%, due 8/15/50 | 4,510,000 | 5,188,564 |
| | Principal
Amount | Value |
| |
| Florida (continued) |
| Florida Development Finance Corp., River City Science Academy Project, Revenue Bonds | | |
| Series A | | |
| 4.00%, due 7/1/45 | $ 600,000 | $ 647,515 |
| Series A | | |
| 4.00%, due 7/1/55 | 600,000 | 642,263 |
| Florida Development Finance Corp., Florida Charter Foundation, Inc. Project, Revenue Bonds | | |
| Series A | | |
| 4.75%, due 7/15/36 (a) | 4,605,000 | 4,966,947 |
| Florida Development Finance Corp., Mater Academy Project, Revenue Bonds | | |
| Series A | | |
| 5.00%, due 6/15/50 | 6,500,000 | 7,375,826 |
| Series A | | |
| 5.00%, due 6/15/55 | 5,100,000 | 5,753,126 |
| Florida Higher Educational Facilities Financial Authority, Ringling College Project, Revenue Bonds | | |
| 4.00%, due 3/1/47 | 6,670,000 | 7,032,957 |
| Florida Higher Educational Facilities Financial Authority, Saint Leo University Project, Revenue Bonds | | |
| 5.00%, due 3/1/44 | 1,370,000 | 1,561,603 |
| 5.00%, due 3/1/49 | 1,630,000 | 1,849,417 |
| Hillsborough County Industrial Development Authority, Tampa General Hospital Project, Revenue Bonds | | |
| Series A | | |
| 4.00%, due 8/1/50 | 100,000,000 | 114,075,890 |
| Lee County Industrial Development Authority, Preserve Project, Revenue Bonds | | |
| Series A | | |
| 5.75%, due 12/1/52 (a) | 7,425,000 | 7,612,423 |
| Martin County Health Facilities Authority, Martin Memorial Medical Center, Revenue Bonds | | |
| Series FL | | |
| 5.00%, due 11/15/45 | 3,500,000 | 4,079,967 |
The notes to the financial statements are an integral part of, and should be read in conjunction with, the financial statements.
| 22 | MainStay MacKay High Yield Municipal Bond Fund |
| | Principal
Amount | Value |
| Long-Term Municipal Bonds (continued) |
| Florida (continued) |
| Miami Beach Health Facilities Authority, Mount Sinai Medical Center of Florida, Revenue Bonds | | |
| 5.00%, due 11/15/29 | $ 1,825,000 | $ 1,960,266 |
| 5.00%, due 11/15/39 | 2,230,000 | 2,458,921 |
| Mid-Bay Bridge Authority, Revenue Bonds | | |
| Series A | | |
| 5.00%, due 10/1/35 | 1,500,000 | 1,720,808 |
| Series C | | |
| 5.00%, due 10/1/40 | 1,000,000 | 1,129,954 |
| Series A | | |
| 7.25%, due 10/1/40 | 2,500,000 | 2,572,847 |
| Mirada II Community Development District, Capital Improvement, Special Assessment | | |
| 3.125%, due 5/1/31 | 500,000 | 505,331 |
| 3.50%, due 5/1/41 | 1,000,000 | 1,011,797 |
| New Port Tampa Bay Community Development District, Special Assessment | | |
| 3.50%, due 5/1/31 | 310,000 | 314,791 |
| 3.875%, due 5/1/41 | 1,000,000 | 1,017,435 |
| 4.125%, due 5/1/52 | 365,000 | 370,683 |
| North Powerline Road Community Development District, Special Assessment | | |
| 3.625%, due 5/1/40 | 500,000 | 511,966 |
| 4.00%, due 5/1/51 | 1,080,000 | 1,119,658 |
| North Sumter County Utility Dependent District, Central Sumter Utility, Revenue Bonds, Senior Lien | | |
| 5.00%, due 10/1/49 | 2,750,000 | 3,399,565 |
| 5.00%, due 10/1/54 | 7,000,000 | 8,620,676 |
| Osceola County Expressway Authority, Poinciana Parkway Project, Revenue Bonds, Senior Lien | | |
| Series B-2 | | |
| (zero coupon), due 10/1/36 (d) | 4,000,000 | 4,901,957 |
| | Principal
Amount | Value |
| |
| Florida (continued) |
| Pinellas County Educational Facilities Authority, Pinellas Academy Math & Science Project, Revenue Bonds | | |
| Series A | | |
| 5.00%, due 12/15/48 (a) | $ 3,280,000 | $ 3,759,797 |
| Polk County Industrial Development Authority, Carpenter's Home Estates, Inc. Project, Revenue Bonds | | |
| Series A | | |
| 5.00%, due 1/1/49 | 1,750,000 | 1,903,328 |
| Series A | | |
| 5.00%, due 1/1/55 | 800,000 | 868,345 |
| Seminole County Industrial Development Authority, Legacy Pointe at UCF Project, Revenue Bonds | | |
| 5.25%, due 11/15/39 | 1,000,000 | 982,551 |
| Series A | | |
| 5.50%, due 11/15/49 | 1,000,000 | 976,078 |
| 5.75%, due 11/15/54 | 1,000,000 | 1,001,980 |
| Shingle Creek at Bronson Community Development District, Special Assessment, Special Assessment | | |
| 3.50%, due 6/15/41 | 1,000,000 | 1,017,055 |
| Stillwater Community Development District, 2021 Project, Special Assessment (a) | | |
| 3.00%, due 6/15/31 | 410,000 | 414,746 |
| 3.50%, due 6/15/41 | 1,000,000 | 1,019,646 |
| V-Dana Community Development District, Special Assessment | | |
| 3.625%, due 5/1/41 | 1,040,000 | 1,057,472 |
| V-Dana Community Development District, Assessment Area 1-2020 Project, Special Assessment | | |
| 4.00%, due 5/1/51 (a) | 1,200,000 | 1,254,552 |
| Veranda Community Development District II, Special Assessment | | |
| 3.60%, due 5/1/41 (a) | 330,000 | 337,519 |
| | | 293,688,028 |
The notes to the financial statements are an integral part of, and should be read in conjunction with, the financial statements.
23
Portfolio of Investments April 30, 2021† (Unaudited) (continued)
| | Principal
Amount | Value |
| Long-Term Municipal Bonds (continued) |
| Georgia 1.3% |
| Cedartown Polk County Hospital Authority, Polk Medical Center Project, Revenue Bonds | | |
| 5.00%, due 7/1/39 | $ 8,100,000 | $ 9,299,817 |
| Development Authority of Cobb County (The), Kennesaw State University Real Estate Foundations Project, Revenue Bonds | | |
| Series C | | |
| 5.00%, due 7/15/38 | 2,390,000 | 2,631,597 |
| Fulton County Residential Care Facilities for the Elderly Authority, Lenbrook Square Foundation, Inc., Revenue Bonds | | |
| Series A | | |
| 5.00%, due 7/1/36 | 4,000,000 | 4,298,570 |
| Gainesville & Hall County Development Authority, Riverside Military Academy, Inc., Revenue Bonds | | |
| 5.125%, due 3/1/52 | 1,500,000 | 1,464,685 |
| George L Smith II Congress Center Authority, Convention Centre Hotel, Revenue Bonds, Second Tier (a) | | |
| 3.625%, due 1/1/31 | 1,750,000 | 1,876,965 |
| 5.00%, due 1/1/36 | 1,710,000 | 2,000,508 |
| 5.00%, due 1/1/54 | 4,000,000 | 4,552,051 |
| George L Smith II Congress Center Authority, Convention Centre Hotel, Revenue Bonds, First Tier | | |
| 4.00%, due 1/1/54 | 5,000,000 | 5,686,960 |
| Main Street Natural Gas, Inc., Revenue Bonds | | |
| Series A | | |
| 4.00%, due 5/15/39 | 6,800,000 | 7,732,640 |
| Series A | | |
| 5.00%, due 5/15/38 | 3,500,000 | 4,954,329 |
| Series A | | |
| 5.00%, due 5/15/49 | 18,750,000 | 27,839,284 |
| Municipal Electric Authority of Georgia, Plant Vogtle Units 3 & 4 Project, Revenue Bonds | | |
| Series B | | |
| 4.00%, due 1/1/49 | 35,610,000 | 39,684,240 |
| | Principal
Amount | Value |
| |
| Georgia (continued) |
Municipal Electric Authority of Georgia, Plant Vogtle Units 3 & 4 Project, Revenue Bonds
(continued) | | |
| Series A | | |
| 5.00%, due 1/1/56 | $ 6,000,000 | $ 7,151,728 |
| Series A | | |
| 5.00%, due 1/1/63 | 3,000,000 | 3,555,424 |
| Municipal Electric Authority of Georgia, Project One Subordinated Bonds, Revenue Bonds | | |
| Series A | | |
| 4.00%, due 1/1/49 | 8,700,000 | 9,824,418 |
| Private Colleges & Universities Authority, Mercer University Project, Revenue Bonds | | |
| 5.00%, due 10/1/45 | 6,000,000 | 6,602,342 |
| | | 139,155,558 |
| Guam 0.8% |
| Antonio B Won Pat International Airport Authority, Revenue Bonds | | |
| Series C | | |
| 6.375%, due 10/1/43 (b) | 3,000,000 | 3,224,789 |
| Guam Department of Education, John F. Kennedy High School Refunding & Energy Efficiency Project, Certificate of Participation | | |
| Series A | | |
| 4.25%, due 2/1/30 | 1,190,000 | 1,263,209 |
| Series A | | |
| 5.00%, due 2/1/40 | 5,125,000 | 5,562,402 |
| Guam Government Waterworks Authority, Water and Wastewater System, Revenue Bonds | | |
| 5.00%, due 7/1/40 | 9,020,000 | 10,470,947 |
| 5.00%, due 1/1/46 | 4,200,000 | 4,742,092 |
| 5.50%, due 7/1/43 | 13,565,000 | 15,075,097 |
| Port Authority of Guam, Revenue Bonds | | |
| Series A | | |
| 5.00%, due 7/1/48 | 5,200,000 | 6,121,268 |
| Territory of Guam, Revenue Bonds | | |
| Series D | | |
| 5.00%, due 11/15/29 | 1,455,000 | 1,658,436 |
The notes to the financial statements are an integral part of, and should be read in conjunction with, the financial statements.
| 24 | MainStay MacKay High Yield Municipal Bond Fund |
| | Principal
Amount | Value |
| Long-Term Municipal Bonds (continued) |
| Guam (continued) |
Territory of Guam, Revenue Bonds
(continued) | | |
| Series D | | |
| 5.00%, due 11/15/39 | $ 26,250,000 | $ 29,420,438 |
| Territory of Guam, Business Privilege Tax, Revenue Bonds | | |
| Series A | | |
| 5.125%, due 1/1/42 | 3,420,000 | 3,518,811 |
| Territory of Guam, Hotel Occupancy Tax, Revenue Bonds | | |
| Series A | | |
| 6.50%, due 11/1/40 | 3,990,000 | 3,990,000 |
| | | 85,047,489 |
| Hawaii 0.4% |
| Kauai County Community Facilities District, Community Facilities District No. 2008-1, Special Tax | | |
| 5.00%, due 5/15/44 | 1,775,000 | 2,063,547 |
| 5.00%, due 5/15/49 | 2,750,000 | 3,175,235 |
| State of Hawaii Department of Budget & Finance, Hawaiian Electric Co., Inc., Revenue Bonds | | |
| 3.50%, due 10/1/49 | 25,875,000 | 27,024,134 |
| Series B | | |
| 4.00%, due 3/1/37 (b) | 4,200,000 | 4,666,026 |
| State of Hawaii Department of Budget & Finance, Chaminade University of Honolulu, Revenue Bonds | | |
| Series A | | |
| 5.00%, due 1/1/45 (a) | 1,500,000 | 1,528,379 |
| State of Hawaii Department of Budget & Finance, Hawaii Pacific University, Revenue Bonds | | |
| 6.625%, due 7/1/33 | 2,085,000 | 2,269,126 |
| Series A | | |
| 6.875%, due 7/1/43 | 4,640,000 | 5,033,106 |
| | | 45,759,553 |
| Idaho 0.0% ‡ |
| Idaho Health Facilities Authority, Madison Memorial Hospital, Revenue Bonds | | |
| 5.00%, due 9/1/37 | 1,000,000 | 1,113,706 |
| | Principal
Amount | Value |
| |
| Illinois 10.4% |
| Bridgeview Finance Corp., Sales Tax, Revenue Bonds | | |
| Series A | | |
| 5.00%, due 12/1/37 | $ 1,260,000 | $ 1,288,808 |
| Series A | | |
| 5.00%, due 12/1/42 | 7,500,000 | 7,594,426 |
| Chicago Board of Education, Capital Appreciation, School Reform, Unlimited General Obligation | | |
| Series A, Insured: NATL-RE | | |
| (zero coupon), due 12/1/27 | 5,425,000 | 4,824,683 |
| Series B-1, Insured: NATL-RE | | |
| (zero coupon), due 12/1/30 | 13,300,000 | 10,676,451 |
| Series B-1, Insured: NATL-RE | | |
| (zero coupon), due 12/1/31 | 1,095,000 | 849,544 |
| Series A, Insured: NATL-RE | | |
| (zero coupon), due 12/1/31 | 170,000 | 131,893 |
| Chicago Board of Education, Unlimited General Obligation | | |
| Series A | | |
| 5.00%, due 12/1/29 | 9,000,000 | 11,191,121 |
| Series B | | |
| 5.00%, due 12/1/32 | 1,250,000 | 1,537,225 |
| Series A | | |
| 5.00%, due 12/1/32 | 2,875,000 | 3,588,773 |
| Series B | | |
| 5.00%, due 12/1/33 | 2,050,000 | 2,152,260 |
| Series B | | |
| 5.00%, due 12/1/33 | 1,400,000 | 1,715,127 |
| Series G | | |
| 5.00%, due 12/1/34 | 5,000,000 | 5,921,744 |
| Series A | | |
| 5.00%, due 12/1/34 | 2,000,000 | 2,480,230 |
| Series A | | |
| 5.00%, due 12/1/35 | 4,200,000 | 5,202,089 |
| Series H | | |
| 5.00%, due 12/1/36 | 4,730,000 | 5,577,446 |
| Series A | | |
| 5.00%, due 12/1/36 | 2,000,000 | 2,473,138 |
| Series B | | |
| 5.00%, due 12/1/36 | 1,400,000 | 1,731,197 |
| Series A | | |
| 5.00%, due 12/1/37 | 10,950,000 | 13,498,822 |
| Series A | | |
| 5.00%, due 12/1/38 | 5,000,000 | 6,144,524 |
| Series A | | |
| 5.00%, due 12/1/39 | 7,650,000 | 9,386,381 |
The notes to the financial statements are an integral part of, and should be read in conjunction with, the financial statements.
25
Portfolio of Investments April 30, 2021† (Unaudited) (continued)
| | Principal
Amount | Value |
| Long-Term Municipal Bonds (continued) |
| Illinois (continued) |
Chicago Board of Education, Unlimited General Obligation
(continued) | | |
| Series A | | |
| 5.00%, due 12/1/40 | $ 5,240,000 | $ 6,424,323 |
| Series A | | |
| 5.00%, due 12/1/41 | 1,805,000 | 1,836,580 |
| Series A | | |
| 5.00%, due 12/1/41 | 5,350,000 | 6,538,645 |
| Series A | | |
| 5.00%, due 12/1/42 | 21,065,000 | 21,977,652 |
| Series H | | |
| 5.00%, due 12/1/46 | 7,000,000 | 8,067,974 |
| Series D | | |
| 5.00%, due 12/1/46 | 6,500,000 | 7,610,870 |
| Series C | | |
| 5.25%, due 12/1/39 | 1,405,000 | 1,553,143 |
| Series A | | |
| 5.25%, due 12/1/41 | 5,295,000 | 5,395,359 |
| Series A | | |
| 5.50%, due 12/1/39 | 6,995,000 | 7,140,820 |
| Series B | | |
| 6.50%, due 12/1/46 | 1,900,000 | 2,314,341 |
| Series A | | |
| 7.00%, due 12/1/44 | 11,375,000 | 13,727,372 |
| Chicago Board of Education, Revenue Bonds | | |
| 5.00%, due 4/1/46 | 5,000,000 | 5,810,076 |
| 6.00%, due 4/1/46 | 35,000,000 | 42,072,642 |
| Chicago Board of Education, Dedicated Capital Improvement, Unlimited General Obligation | | |
| Series C | | |
| 5.00%, due 12/1/34 | 2,270,000 | 2,689,116 |
| Series B | | |
| 7.00%, due 12/1/42 (a) | 10,000,000 | 12,936,630 |
| Series A | | |
| 7.00%, due 12/1/46 (a) | 4,000,000 | 5,130,197 |
| Chicago Board of Education, Dedicated Capital Improvement, Revenue Bonds | | |
| 5.00%, due 4/1/35 | 1,615,000 | 1,924,414 |
| 5.00%, due 4/1/36 | 1,270,000 | 1,509,261 |
| 5.00%, due 4/1/37 | 435,000 | 514,953 |
| 5.00%, due 4/1/42 | 3,500,000 | 4,098,326 |
| | Principal
Amount | Value |
| |
| Illinois (continued) |
| Chicago Board of Education, School Reform Board, Unlimited General Obligation | | |
| Series A, Insured: AGC-ICC FGIC | | |
| 5.50%, due 12/1/26 | $ 19,400,000 | $ 23,039,285 |
| Chicago O'Hare International Airport, TRIPS Obligated Group, Revenue Bonds | | |
| 5.00%, due 7/1/38 (b) | 1,500,000 | 1,784,112 |
| Chicago O'Hare International Airport, Trips Obligated Group, Revenue Bonds | | |
| 5.00%, due 7/1/48 (b) | 5,000,000 | 5,907,543 |
| Chicago Transit Authority, Sales Tax Receipts, Revenue Bonds, Second Lien | | |
| 5.00%, due 12/1/46 | 9,000,000 | 10,800,284 |
| City of Chicago IL, City Colleges Capital Improvement Project, Unlimited General Obligation | | |
| Insured: NATL-RE | | |
| (zero coupon), due 1/1/34 | 300,000 | 212,710 |
| City of Chicago IL, Waterworks, Revenue Bonds, Second Lien | | |
| 4.00%, due 11/1/37 | 15,200,000 | 15,864,508 |
| City of Chicago IL, Taxable Project, Unlimited General Obligation | | |
| Series A | | |
| 4.625%, due 1/1/32 | 145,000 | 145,256 |
| Series A | | |
| 5.00%, due 1/1/35 | 13,020,000 | 14,062,691 |
| Series A | | |
| 5.00%, due 1/1/36 | 3,250,000 | 3,506,537 |
| Series A | | |
| 5.25%, due 1/1/35 | 6,000,000 | 6,013,580 |
| Series B | | |
| 5.50%, due 1/1/31 | 2,360,000 | 2,670,856 |
| Series D | | |
| 5.50%, due 1/1/37 | 3,500,000 | 3,921,896 |
| Series D | | |
| 5.50%, due 1/1/40 | 1,245,000 | 1,389,941 |
| Series A | | |
| 5.75%, due 1/1/34 | 3,850,000 | 4,636,275 |
| City of Chicago IL, Unlimited General Obligation | | |
| Series C | | |
| 5.00%, due 1/1/38 | 2,410,000 | 2,718,005 |
The notes to the financial statements are an integral part of, and should be read in conjunction with, the financial statements.
| 26 | MainStay MacKay High Yield Municipal Bond Fund |
| | Principal
Amount | Value |
| Long-Term Municipal Bonds (continued) |
| Illinois (continued) |
| City of Chicago IL, Unlimited General Obligation (continued) | | |
| Series A | | |
| 5.00%, due 1/1/39 | $ 6,000,000 | $ 7,147,547 |
| Series A | | |
| 5.00%, due 1/1/40 | 4,200,000 | 4,993,657 |
| Series A | | |
| 5.00%, due 1/1/44 | 6,500,000 | 7,660,951 |
| Series A | | |
| 5.50%, due 1/1/49 | 18,650,000 | 22,501,167 |
| Series A | | |
| 6.00%, due 1/1/38 | 40,020,000 | 48,566,531 |
| City of Chicago IL, Wastewater Transmission Project, Revenue Bonds, Second Lien | | |
| 5.00%, due 1/1/39 | 240,000 | 266,519 |
| City of Chicago IL, Project, Unlimited General Obligation | | |
| Series A | | |
| 5.00%, due 1/1/40 | 3,700,000 | 3,707,156 |
| Illinois Finance Authority, University of Illinois Health Services, Revenue Bonds | | |
| 4.00%, due 10/1/50 | 13,280,000 | 15,054,192 |
| 4.00%, due 10/1/55 | 6,950,000 | 7,846,959 |
| Illinois Finance Authority, Rosalind Franklin University of Medicine & Science, Revenue Bonds | | |
| Series C | | |
| 4.25%, due 8/1/42 | 2,900,000 | 3,208,154 |
| Illinois Finance Authority, Noble Network Charter Schools, Revenue Bonds | | |
| 5.00%, due 9/1/32 | 1,830,000 | 1,967,674 |
| 6.25%, due 9/1/39 | 150,000 | 162,374 |
| Illinois Finance Authority, Friendship Village Schaumburg, Revenue Bonds (f)(g) | | |
| 5.00%, due 2/15/37 | 7,675,000 | 5,613,672 |
| 5.125%, due 2/15/45 | 6,015,000 | 4,410,421 |
| Illinois Finance Authority, Columbia College Chicago, Revenue Bonds | | |
| Series A | | |
| 5.00%, due 12/1/37 | 10,000,000 | 11,128,355 |
| | Principal
Amount | Value |
| |
| Illinois (continued) |
| Illinois Finance Authority, Christian Homes, Inc., Revenue Bonds | | |
| 5.00%, due 5/15/40 | $ 1,265,000 | $ 1,382,926 |
| Illinois Finance Authority, Student Housing & Academic Facility, CHF-Chicago LLC, University of Illinois at Chicago Project, Revenue Bonds | | |
| Series A | | |
| 5.00%, due 2/15/47 | 6,500,000 | 7,223,117 |
| Series A | | |
| 5.00%, due 2/15/50 | 1,835,000 | 2,035,819 |
| Illinois Finance Authority, Franciscan Communities, Inc., Revenue Bonds | | |
| Series A | | |
| 5.00%, due 5/15/47 | 1,155,000 | 1,269,517 |
| Illinois Finance Authority, Chicago International School Project, Revenue Bonds | | |
| Series A | | |
| 5.00%, due 12/1/47 | 3,000,000 | 3,351,089 |
| Illinois Finance Authority, Rosalind Franklin University of Medicine and Science, Revenue Bonds | | |
| 5.00%, due 8/1/49 | 1,300,000 | 1,498,134 |
| Illinois Finance Authority, Roosevelt University Project, Revenue Bonds | | |
| 5.50%, due 4/1/32 | 2,000,000 | 2,004,097 |
| Series A | | |
| 6.125%, due 4/1/58 (a) | 6,500,000 | 7,770,649 |
| Illinois Finance Authority, Charter School Project, Revenue Bonds | | |
| 7.125%, due 10/1/41 | 1,500,000 | 1,525,460 |
| Metropolitan Pier & Exposition Authority, McCormick Place Expansion Project, Revenue Bonds | | |
| Series A, Insured: NATL-RE | | |
| (zero coupon), due 12/15/31 | 5,000,000 | 3,911,535 |
| Series A, Insured: NATL-RE | | |
| (zero coupon), due 12/15/32 | 18,945,000 | 14,350,557 |
| Series A, Insured: NATL-RE | | |
| (zero coupon), due 6/15/33 | 26,320,000 | 19,618,952 |
| Series A, Insured: NATL-RE | | |
| (zero coupon), due 12/15/33 | 12,600,000 | 9,229,651 |
The notes to the financial statements are an integral part of, and should be read in conjunction with, the financial statements.
27
Portfolio of Investments April 30, 2021† (Unaudited) (continued)
| | Principal
Amount | Value |
| Long-Term Municipal Bonds (continued) |
| Illinois (continued) |
| Metropolitan Pier & Exposition Authority, McCormick Place Expansion Project, Revenue Bonds (continued) | | |
| Series A, Insured: NATL-RE | | |
| (zero coupon), due 6/15/34 | $ 46,915,000 | $ 33,811,401 |
| Series A, Insured: NATL-RE | | |
| (zero coupon), due 12/15/36 | 33,845,000 | 22,215,147 |
| Series A, Insured: NATL-RE | | |
| (zero coupon), due 6/15/37 | 16,000,000 | 10,294,581 |
| Series A, Insured: NATL-RE | | |
| (zero coupon), due 12/15/37 | 65,600,000 | 41,444,971 |
| Series B | | |
| (zero coupon), due 12/15/50 | 35,930,000 | 13,523,912 |
| Series B, Insured: AGM | | |
| (zero coupon), due 12/15/50 | 10,000,000 | 4,180,499 |
| Series B | | |
| (zero coupon), due 12/15/51 | 56,600,000 | 20,548,505 |
| Series B | | |
| (zero coupon), due 12/15/54 | 57,560,000 | 18,735,107 |
| (zero coupon), due 12/15/56 | 30,150,000 | 9,135,444 |
| Series B, Insured: AGM | | |
| (zero coupon), due 12/15/56 | 36,795,000 | 12,648,381 |
| Series A | | |
| 4.00%, due 6/15/50 | 22,800,000 | 25,604,234 |
| Series B, Insured: State Appropriations | | |
| 4.25%, due 6/15/42 | 1,660,000 | 1,703,724 |
| Series A | | |
| 5.00%, due 6/15/42 | 7,150,000 | 7,418,012 |
| Series A, Insured: BAM | | |
| 5.00%, due 6/15/42 | 395,000 | 413,121 |
| 5.00%, due 6/15/42 | 1,000,000 | 1,237,503 |
| Series A | | |
| 5.00%, due 12/15/45 | 750,000 | 906,791 |
| 5.00%, due 6/15/50 | 18,000,000 | 21,653,267 |
| Series A | | |
| 5.00%, due 6/15/57 | 2,000,000 | 2,356,370 |
| Metropolitan Pier & Exposition Authority, McCormick Place Expansion Project, Capital Appreciation, Revenue Bonds | | |
| Insured: AGM | | |
| (zero coupon), due 6/15/44 | 80,320,000 | 41,937,168 |
| Insured: AGM | | |
| (zero coupon), due 6/15/45 | 8,000,000 | 4,003,426 |
| | Principal
Amount | Value |
| |
| Illinois (continued) |
| Northern Illinois University, Auxiliary Facilities System, Revenue Bonds | | |
| Series B, Insured: BAM | | |
| 4.00%, due 4/1/37 | $ 1,300,000 | $ 1,512,631 |
| Series B, Insured: BAM | | |
| 4.00%, due 4/1/39 | 1,300,000 | 1,505,584 |
| Series B, Insured: BAM | | |
| 4.00%, due 4/1/41 | 1,350,000 | 1,558,661 |
| Sangamon County Water Reclamation District, Alternative Revenue Source, Unlimited General Obligation | | |
| Series A, Insured: BAM | | |
| 4.00%, due 1/1/44 | 5,000,000 | 5,662,215 |
| Series A | | |
| 4.00%, due 1/1/49 | 14,000,000 | 15,704,350 |
| State of Illinois, Unlimited General Obligation | | |
| Series D | | |
| 3.25%, due 11/1/26 | 5,540,000 | 6,098,424 |
| Insured: BAM | | |
| 4.00%, due 6/1/41 | 25,955,000 | 28,030,621 |
| Series C | | |
| 4.00%, due 10/1/41 | 7,900,000 | 8,965,761 |
| Series C | | |
| 4.00%, due 10/1/42 | 9,000,000 | 10,187,147 |
| Series C | | |
| 4.25%, due 10/1/45 | 24,000,000 | 27,298,603 |
| Series A | | |
| 4.50%, due 12/1/41 | 6,775,000 | 7,622,838 |
| Series D | | |
| 5.00%, due 11/1/21 | 5,000,000 | 5,112,105 |
| Series A | | |
| 5.00%, due 12/1/25 | 3,270,000 | 3,864,584 |
| Series D | | |
| 5.00%, due 11/1/26 | 4,245,000 | 5,064,936 |
| Series D | | |
| 5.00%, due 11/1/27 | 11,000,000 | 13,342,659 |
| Series A | | |
| 5.00%, due 12/1/27 | 2,315,000 | 2,838,490 |
| Series B | | |
| 5.00%, due 12/1/27 | 9,365,000 | 11,482,702 |
| 5.00%, due 2/1/28 | 2,700,000 | 3,231,123 |
| Series C | | |
| 5.00%, due 11/1/29 | 14,635,000 | 17,442,723 |
| Series A | | |
| 5.00%, due 1/1/31 | 8,110,000 | 8,341,927 |
The notes to the financial statements are an integral part of, and should be read in conjunction with, the financial statements.
| 28 | MainStay MacKay High Yield Municipal Bond Fund |
| | Principal
Amount | Value |
| Long-Term Municipal Bonds (continued) |
| Illinois (continued) |
| State of Illinois, Unlimited General Obligation (continued) | | |
| Series A | | |
| 5.00%, due 12/1/31 | $ 2,985,000 | $ 3,561,956 |
| Series A | | |
| 5.00%, due 12/1/39 | 2,400,000 | 2,815,181 |
| Series A | | |
| 5.00%, due 5/1/40 | 2,000,000 | 2,364,771 |
| 5.50%, due 7/1/38 | 3,000,000 | 3,255,857 |
| 5.75%, due 5/1/45 | 17,420,000 | 22,362,037 |
| State of Illinois, Rebuild Illinois Program, Unlimited General Obligation | | |
| Series C | | |
| 4.00%, due 11/1/41 | 20,000,000 | 22,456,214 |
| Upper Illinois River Valley Development Authority, Morris Hospital Obligated Group, Revenue Bonds | | |
| 5.00%, due 12/1/48 | 15,305,000 | 18,164,624 |
| Village of Bridgeview IL, Unlimited General Obligation | | |
| Series A | | |
| 5.125%, due 12/1/44 | 100,000 | 95,122 |
| Series A | | |
| 5.50%, due 12/1/43 | 1,545,000 | 1,544,893 |
| Series A | | |
| 5.50%, due 12/1/43 | 1,260,000 | 1,261,185 |
| Series A | | |
| 5.625%, due 12/1/41 | 4,190,000 | 4,226,970 |
| Series A | | |
| 5.75%, due 12/1/35 | 2,705,000 | 2,743,844 |
| Village of Matteson IL, Utility Revenue Source, Unlimited General Obligation | | |
| Insured: AGM | | |
| 4.00%, due 12/1/26 | 200,000 | 200,264 |
| Village of Oak Lawn IL, Corporate Purpose, Unlimited General Obligation | | |
| Insured: NATL-RE | | |
| 4.40%, due 12/1/26 | 400,000 | 400,714 |
| Insured: NATL-RE | | |
| 4.45%, due 12/1/28 | 430,000 | 430,744 |
| Insured: NATL-RE | | |
| 4.50%, due 12/1/30 | 475,000 | 475,818 |
| | Principal
Amount | Value |
| |
| Illinois (continued) |
| Village of Oak Lawn IL, Corporate Purpose, Unlimited General Obligation (continued) | | |
| Insured: NATL-RE | | |
| 4.50%, due 12/1/32 | $ 520,000 | $ 520,784 |
| Insured: NATL-RE | | |
| 4.50%, due 12/1/34 | 575,000 | 575,880 |
| Village of Riverdale IL, Unlimited General Obligation | | |
| 8.00%, due 10/1/36 | 1,750,000 | 1,778,164 |
| Village of Romeoville IL, Lewis University, Revenue Bonds | | |
| Series B | | |
| 4.125%, due 10/1/41 | 1,000,000 | 1,047,294 |
| Series B | | |
| 4.125%, due 10/1/46 | 2,100,000 | 2,189,658 |
| Series B | | |
| 5.00%, due 10/1/36 | 1,000,000 | 1,096,199 |
| Series B | | |
| 5.00%, due 10/1/39 | 1,275,000 | 1,391,856 |
| | | 1,146,918,564 |
| Indiana 0.3% |
| City of Valparaiso IN, Pratt Paper LLC Project, Revenue Bonds | | |
| 7.00%, due 1/1/44 (b) | 5,500,000 | 6,189,994 |
| Gary Chicago International Airport Authority, Revenue Bonds | | |
| 5.00%, due 2/1/29 | 1,170,000 | 1,284,905 |
| 5.25%, due 2/1/34 | 750,000 | 818,289 |
| Indiana Finance Authority, United States Steel Corp., Revenue Bonds | | |
| 4.125%, due 12/1/26 | 3,000,000 | 3,266,853 |
| Series A | | |
| 6.75%, due 5/1/39 (b) | 1,250,000 | 1,561,917 |
| Indiana Finance Authority, Marquette Project, Revenue Bonds | | |
| 5.00%, due 3/1/39 | 5,505,000 | 5,723,632 |
| Indiana Finance Authority, University of Indianapolis Education Facilities Project, Revenue Bonds | | |
| 5.00%, due 10/1/43 | 2,000,000 | 2,276,588 |
The notes to the financial statements are an integral part of, and should be read in conjunction with, the financial statements.
29
Portfolio of Investments April 30, 2021† (Unaudited) (continued)
| | Principal
Amount | Value |
| Long-Term Municipal Bonds (continued) |
| Indiana (continued) |
| Indiana Finance Authority, BHI Senior Living, Inc., Revenue Bonds | | |
| Series A | | |
| 5.00%, due 11/15/48 | $ 5,000,000 | $ 5,592,626 |
| Series A | | |
| 5.00%, due 11/15/53 | 4,400,000 | 4,911,474 |
| Indiana Finance Authority, King's Daughters Hospital & Healthcare (The), Revenue Bonds | | |
| 5.50%, due 8/15/40 | 4,835,000 | 4,844,359 |
| 5.50%, due 8/15/45 | 210,000 | 210,405 |
| Indiana Finance Authority, Educational Facilities-Marian University Project, Revenue Bonds | | |
| 6.375%, due 9/15/41 | 670,000 | 685,165 |
| | | 37,366,207 |
| Iowa 0.7% |
| City of Coralville IA, Annual Appropriation, Revenue Bonds | | |
| Series B | | |
| 4.25%, due 5/1/37 | 7,365,000 | 7,370,573 |
| City of Coralville IA, Annual Appropriation, Tax Allocation | | |
| Series C | | |
| 4.50%, due 5/1/47 | 2,930,000 | 3,015,139 |
| Iowa Finance Authority, Iowa Fertilizer Company Project, Revenue Bonds | | |
| 3.125%, due 12/1/22 | 4,005,000 | 4,085,751 |
| 5.25%, due 12/1/25 | 7,500,000 | 8,221,700 |
| Iowa Finance Authority, Lifespace Communities, Inc., Revenue Bonds | | |
| Series A-1 | | |
| 4.00%, due 5/15/55 | 3,750,000 | 4,077,546 |
| Iowa Finance Authority, Northcrest, Inc. Project, Revenue Bonds | | |
| Series A | | |
| 5.00%, due 3/1/48 | 1,500,000 | 1,607,507 |
| Iowa Higher Education Loan Authority, Des Moines University Project, Revenue Bonds | | |
| 4.00%, due 10/1/45 | 3,000,000 | 3,378,948 |
| 4.00%, due 10/1/50 | 11,000,000 | 12,341,560 |
| | Principal
Amount | Value |
| |
| Iowa (continued) |
| Iowa Tobacco Settlement Authority, Capital Appreciation, Revenue Bonds | | |
| Series B-2 | | |
| (zero coupon), due 6/1/65 | $ 90,000,000 | $ 15,757,371 |
| Iowa Tobacco Settlement Authority, Revenue Bonds | | |
| Series C | | |
| 5.375%, due 6/1/38 | 6,145,000 | 6,146,807 |
| Series C | | |
| 5.625%, due 6/1/46 | 6,730,000 | 6,732,072 |
| Xenia Rural Water District, Capital Loan Notes, Revenue Bonds | | |
| 5.00%, due 12/1/36 | 3,000,000 | 3,484,035 |
| 5.00%, due 12/1/41 | 3,000,000 | 3,453,102 |
| | | 79,672,111 |
| Kansas 0.2% |
| Wyandotte County-Kansas City Unified Government, Vacation Village Project Area 4 - Major Multi-Sport Athletic Complex Project, Revenue Bonds | | |
| (zero coupon), due 9/1/34 (a) | 59,995,000 | 18,903,063 |
| Kentucky 0.8% |
| City of Campbellsville KY, Campbellsville University Project, Revenue Bonds | | |
| 5.00%, due 3/1/39 | 4,730,000 | 4,923,457 |
| City of Columbia KY, Lindsey Wilson College Project, Revenue Bonds | | |
| 5.00%, due 12/1/33 | 3,855,000 | 4,386,812 |
| City of Glasgow KY, TJ Samson Community Hospital Obligated Group, Revenue Bonds | | |
| Series 2011 | | |
| 6.45%, due 2/1/41 | 1,000,000 | 1,010,318 |
| Kentucky Economic Development Finance Authority, Next Generation Kentucky Information Highway Project, Revenue Bonds | | |
| Series A | | |
| 5.00%, due 7/1/32 | 6,450,000 | 7,296,364 |
The notes to the financial statements are an integral part of, and should be read in conjunction with, the financial statements.
| 30 | MainStay MacKay High Yield Municipal Bond Fund |
| | Principal
Amount | Value |
| Long-Term Municipal Bonds (continued) |
| Kentucky (continued) |
| Kentucky Economic Development Finance Authority, Owensboro Health, Revenue Bonds | | |
| Series A | | |
| 5.00%, due 6/1/41 | $ 4,425,000 | $ 4,969,151 |
| Series A | | |
| 5.00%, due 6/1/45 | 9,725,000 | 10,831,309 |
| Kentucky Economic Development Finance Authority, CommonSpirit Health Obligated Group, Revenue Bonds | | |
| Series A-1 | | |
| 5.00%, due 8/1/44 | 5,000,000 | 6,161,958 |
| Series A-2 | | |
| 5.00%, due 8/1/44 | 6,000,000 | 7,394,350 |
| Series A-2 | | |
| 5.00%, due 8/1/49 | 6,300,000 | 7,687,029 |
| Kentucky Municipal Power Agency, Prairie State Project, Revenue Bonds | | |
| Series A | | |
| 4.00%, due 9/1/45 | 21,445,000 | 23,669,057 |
| Louisville/Jefferson County Metropolitan Government, Norton Healthcare, Inc., Revenue Bonds | | |
| Series A | | |
| 4.00%, due 10/1/34 | 5,575,000 | 6,207,061 |
| | | 84,536,866 |
| Louisiana 0.2% |
| Calcasieu Parish Memorial Hospital Service District, Lake Charles Memorial Hospital Project, Revenue Bonds | | |
| 5.00%, due 12/1/39 | 3,675,000 | 3,990,474 |
| City of New Orleans LA, Water System, Revenue Bonds | | |
| 5.00%, due 12/1/44 | 5,500,000 | 6,390,736 |
| Louisiana Public Facilities Authority, Ochsner Clinic Foundation Obligated Group, Revenue Bonds | | |
| 5.00%, due 5/15/47 | 5,000,000 | 5,705,991 |
| | Principal
Amount | Value |
| |
| Louisiana (continued) |
| Louisiana Public Facilities Authority, Belle Chasse Academy, Inc., Revenue Bonds | | |
| 6.50%, due 5/1/31 | $ 3,700,000 | $ 3,700,000 |
| | | 19,787,201 |
| Maine 0.1% |
| City of Portland ME, General Airport, Green Bond, Revenue Bonds | | |
| 4.00%, due 1/1/40 | 1,400,000 | 1,587,206 |
| Maine Health & Higher Educational Facilities Authority, Northern Light Health Obligated Group, Revenue Bonds | | |
| 5.00%, due 7/1/33 | 3,825,000 | 4,021,919 |
| 5.00%, due 7/1/43 | 2,590,000 | 2,703,894 |
| | | 8,313,019 |
| Maryland 0.3% |
| County of Baltimore, Oak Crest Village, Inc. Facility, Revenue Bonds | | |
| 4.00%, due 1/1/45 | 1,750,000 | 1,947,212 |
| 4.00%, due 1/1/50 | 2,500,000 | 2,772,368 |
| County of Frederick, Oakdale Lake Linganore Project, Tax Allocation | | |
| 3.75%, due 7/1/39 | 1,410,000 | 1,478,689 |
| County of Frederick, Urbana Community Development Authority, Special Tax | | |
| Series C | | |
| 4.00%, due 7/1/50 | 1,000,000 | 1,123,821 |
| County of Frederick, Mount St Mary's University, Inc., Revenue Bonds (a) | | |
| Series A | | |
| 5.00%, due 9/1/37 | 3,000,000 | 3,341,380 |
| Series A | | |
| 5.00%, due 9/1/45 | 500,000 | 548,143 |
| Maryland Economic Development Corp., Port Convinfton Project, Tax Allocation | | |
| 3.25%, due 9/1/30 | 1,250,000 | 1,375,591 |
| 4.00%, due 9/1/50 | 4,000,000 | 4,412,145 |
The notes to the financial statements are an integral part of, and should be read in conjunction with, the financial statements.
31
Portfolio of Investments April 30, 2021† (Unaudited) (continued)
| | Principal
Amount | Value |
| Long-Term Municipal Bonds (continued) |
| Maryland (continued) |
| Maryland Health & Higher Educational Facilities Authority, Stevenson University, Inc. Project, Revenue Bonds | | |
| Series A | | |
| 4.00%, due 6/1/51 | $ 1,000,000 | $ 1,119,437 |
| 4.00%, due 6/1/55 | 1,000,000 | 1,112,884 |
| Maryland Health & Higher Educational Facilities Authority, Broadmead Issue, Revenue Bonds | | |
| Series A | | |
| 5.00%, due 7/1/38 | 1,000,000 | 1,141,508 |
| Series A | | |
| 5.00%, due 7/1/48 | 3,000,000 | 3,388,345 |
| Maryland Health & Higher Educational Facilities Authority, Meritus Medical Center Issue, Revenue Bonds | | |
| 5.00%, due 7/1/45 | 4,000,000 | 4,525,592 |
| Maryland Health & Higher Educational Facilities Authority, Green Street Academy Inc., Revenue Bonds (a) | | |
| Series A | | |
| 5.125%, due 7/1/37 | 1,260,000 | 1,384,201 |
| Series A | | |
| 5.375%, due 7/1/52 | 1,530,000 | 1,669,902 |
| Maryland Health & Higher Educational Facilities Authority, Edenwald Issue, Revenue Bonds | | |
| 5.25%, due 1/1/37 | 1,000,000 | 1,107,937 |
| | | 32,449,155 |
| Massachusetts 1.2% |
| Massachusetts Development Finance Agency, Wellforce Obligated Group, Revenue Bonds | | |
| Series A | | |
| 4.00%, due 7/1/44 | 17,750,000 | 20,013,164 |
| Massachusetts Development Finance Agency, Linden Ponds, Inc., Revenue Bonds (a) | | |
| 5.00%, due 11/15/33 | 3,000,000 | 3,340,542 |
| 5.125%, due 11/15/46 | 6,000,000 | 6,588,304 |
| | Principal
Amount | Value |
| |
| Massachusetts (continued) |
| Massachusetts Development Finance Agency, Milford Regional Medical Center, Revenue Bonds (a) | | |
| Series G | | |
| 5.00%, due 7/15/35 | $ 270,000 | $ 317,027 |
| Series G | | |
| 5.00%, due 7/15/36 | 235,000 | 275,062 |
| Series G | | |
| 5.00%, due 7/15/37 | 245,000 | 285,869 |
| Series G | | |
| 5.00%, due 7/15/46 | 1,100,000 | 1,265,442 |
| Massachusetts Development Finance Agency, Western New England University, Revenue Bonds | | |
| 5.00%, due 9/1/40 | 1,325,000 | 1,503,073 |
| 5.00%, due 9/1/45 | 1,175,000 | 1,324,241 |
| Massachusetts Development Finance Agency, Dexter Southfield, Revenue Bonds | | |
| 5.00%, due 5/1/41 | 3,000,000 | 3,435,169 |
| Massachusetts Development Finance Agency, UMass Dartmouth Student Housing Project, Revenue Bonds | | |
| 5.00%, due 10/1/43 | 2,000,000 | 2,187,396 |
| 5.00%, due 10/1/48 | 8,000,000 | 8,722,378 |
| 5.00%, due 10/1/54 | 16,000,000 | 17,379,718 |
| Massachusetts Development Finance Agency, UMass Memorial Health Care Obligated Group, Revenue Bonds | | |
| Series L | | |
| 5.00%, due 7/1/44 | 8,455,000 | 10,221,087 |
| Series I | | |
| 5.00%, due 7/1/46 | 2,000,000 | 2,371,714 |
| Massachusetts Development Finance Agency, Boston Medical Center, Green Bond, Revenue Bonds | | |
| 5.00%, due 7/1/44 | 1,000,000 | 1,128,373 |
| Massachusetts Development Finance Agency, UMass Boston Student Housing Project, Revenue Bonds | | |
| 5.00%, due 10/1/48 | 21,405,000 | 23,028,514 |
The notes to the financial statements are an integral part of, and should be read in conjunction with, the financial statements.
| 32 | MainStay MacKay High Yield Municipal Bond Fund |
| | Principal
Amount | Value |
| Long-Term Municipal Bonds (continued) |
| Massachusetts (continued) |
| Massachusetts Development Finance Agency, CareGroup Obligated Group, Revenue Bonds | | |
| Series J2 | | |
| 5.00%, due 7/1/53 | $ 6,785,000 | $ 8,124,797 |
| Massachusetts Development Finance Agency, Lawrence General Hospital, Revenue Bonds | | |
| Series A | | |
| 5.50%, due 7/1/44 | 6,000,000 | 6,008,222 |
| Massachusetts Development Finance Agency, North Hill Communities Inc., Revenue Bonds | | |
| Series A | | |
| 6.50%, due 11/15/43 (a) | 2,000,000 | 2,317,884 |
| Massachusetts Educational Financing Authority, Revenue Bonds | | |
| Series B | | |
| 3.00%, due 7/1/35 (b) | 11,100,000 | 11,729,066 |
| | | 131,567,042 |
| Michigan 2.2% |
| Calhoun County Hospital Finance Authority, Oaklawn Hospital, Revenue Bonds | | |
| 5.00%, due 2/15/41 | 3,260,000 | 3,560,995 |
| 5.00%, due 2/15/47 | 3,000,000 | 3,210,077 |
| Chandler Park Academy, Revenue Bonds | | |
| 5.125%, due 11/1/30 | 1,050,000 | 1,051,600 |
| 5.125%, due 11/1/35 | 605,000 | 605,841 |
| City of Detroit MI, Water Supply System, Revenue Bonds, Senior Lien | | |
| Series C | | |
| 4.50%, due 7/1/27 | 165,000 | 166,154 |
| Series A | | |
| 5.00%, due 7/1/36 | 655,000 | 660,100 |
| City of Detroit MI, Water Supply System, Revenue Bonds | | |
| Series Second LIEN B, Insured: NATL-RE | | |
| 5.00%, due 7/1/34 | 10,000 | 10,036 |
| | Principal
Amount | Value |
| |
| Michigan (continued) |
City of Detroit MI, Water Supply System, Revenue Bonds
(continued) | | |
| Series A | | |
| 5.25%, due 7/1/41 | $ 10,840,000 | $ 10,928,698 |
| City of Detroit MI, Unlimited General Obligation | | |
| Insured: AMBAC | | |
| 4.60%, due 4/1/24 | 20,150 | 20,162 |
| 5.00%, due 4/1/27 | 850,000 | 1,005,080 |
| 5.00%, due 4/1/31 | 1,000,000 | 1,186,932 |
| 5.00%, due 4/1/33 | 1,200,000 | 1,415,868 |
| 5.00%, due 4/1/35 | 1,000,000 | 1,174,743 |
| 5.00%, due 4/1/37 | 1,100,000 | 1,285,825 |
| 5.00%, due 4/1/38 | 850,000 | 991,451 |
| Insured: AMBAC | | |
| 5.25%, due 4/1/22 | 58,125 | 58,228 |
| Insured: AMBAC | | |
| 5.25%, due 4/1/24 | 45,725 | 45,774 |
| 5.50%, due 4/1/45 | 1,100,000 | 1,365,311 |
| 5.50%, due 4/1/50 | 2,070,000 | 2,555,900 |
| City of Detroit MI, Great Lakes Water Authority Water Supply System, Revenue Bonds, Senior Lien | | |
| Series C | | |
| 5.00%, due 7/1/41 | 1,620,000 | 1,632,615 |
| City of Detroit MI, Water and Sewage Disposable System, Revenue Bonds | | |
| Series A | | |
| 5.25%, due 7/1/39 | 5,000,000 | 5,298,017 |
| Michigan Finance Authority, Tobacco Settlement Asset-Backed, Capital Appreciation, Revenue Bonds, Senior Lien | | |
| Series B | | |
| (zero coupon), due 6/1/45 | 50,000,000 | 13,891,970 |
| Michigan Finance Authority, Tobacco Settlement Asset-Backed, Revenue Bonds, Senior Lien | | |
| Series B-2 | | |
| (zero coupon), due 6/1/65 | 181,000,000 | 23,314,302 |
| Series A | | |
| 4.00%, due 6/1/49 | 7,000,000 | 7,978,624 |
The notes to the financial statements are an integral part of, and should be read in conjunction with, the financial statements.
33
Portfolio of Investments April 30, 2021† (Unaudited) (continued)
| | Principal
Amount | Value |
| Long-Term Municipal Bonds (continued) |
| Michigan (continued) |
| Michigan Finance Authority, Wayne County Criminal Justice Center Project, Revenue Bonds, Senior Lien | | |
| 4.00%, due 11/1/48 | $ 7,000,000 | $ 7,992,191 |
| Michigan Finance Authority, Local Government Loan Program, Revenue Bonds | | |
| Series D-4 | | |
| 5.00%, due 7/1/34 | 1,000,000 | 1,136,810 |
| Michigan Finance Authority, Local Government Loan Program, Revenue Bonds, Senior Lien | | |
| Series C-1 | | |
| 5.00%, due 7/1/44 | 1,000,000 | 1,056,710 |
| Michigan Finance Authority, Great Lakes Water Authority Sewage Disposal System, Revenue Bonds | | |
| Series C | | |
| 5.00%, due 7/1/34 | 1,000,000 | 1,171,883 |
| Series C | | |
| 5.00%, due 7/1/35 | 2,000,000 | 2,340,185 |
| Michigan Finance Authority, College for Creative Studies, Revenue Bonds | | |
| 5.00%, due 12/1/36 | 1,000,000 | 1,060,802 |
| 5.00%, due 12/1/40 | 1,700,000 | 1,795,639 |
| 5.00%, due 12/1/45 | 4,700,000 | 4,943,452 |
| Michigan Finance Authority, Lawrence Technological University, Revenue Bonds | | |
| 5.00%, due 2/1/37 | 1,550,000 | 1,664,900 |
| 5.25%, due 2/1/32 | 3,600,000 | 3,960,666 |
| Michigan Finance Authority, Local Government Loan Program, Public Lightning Local Project, Revenue Bonds | | |
| Series B | | |
| 5.00%, due 7/1/44 | 4,000,000 | 4,285,034 |
| Michigan Finance Authority, Landmark Academy, Revenue Bonds | | |
| 5.00%, due 6/1/45 | 2,920,000 | 3,158,121 |
| | Principal
Amount | Value |
| |
| Michigan (continued) |
| Michigan Finance Authority, Presbyterian Villages of Michigan Obligated Group, Revenue Bonds | | |
| 5.50%, due 11/15/45 | $ 1,025,000 | $ 1,088,120 |
| Michigan Finance Authority, Universal Learning Academy, Revenue Bonds | | |
| 5.75%, due 11/1/40 | 2,630,000 | 2,973,854 |
| Michigan Finance Authority, Public School Academy-Voyageur, Revenue Bonds | | |
| 5.90%, due 7/15/46 (a) | 2,060,000 | 1,815,239 |
| Michigan Finance Authority, Public School Academy-Detroit, Revenue Bonds | | |
| 7.00%, due 10/1/31 | 2,120,000 | 1,993,231 |
| 7.00%, due 10/1/36 | 1,740,000 | 1,577,292 |
| Michigan Municipal Bond Authority, Local Government Loan Program, Revenue Bonds | | |
| Series A, Insured: AMBAC | | |
| 4.50%, due 5/1/31 | 305,000 | 305,320 |
| Michigan Public Educational Facilities Authority, Richfield Public School Academy, Revenue Bonds | | |
| 5.00%, due 9/1/36 | 150,000 | 150,000 |
| Michigan Strategic Fund, Holland Home Obligated Group, Revenue Bonds | | |
| 5.00%, due 11/15/42 | 6,265,000 | 6,882,363 |
| Michigan Strategic Fund, I-75 Improvement Project, Revenue Bonds (b) | | |
| 5.00%, due 12/31/43 | 1,500,000 | 1,815,985 |
| 5.00%, due 6/30/48 | 18,000,000 | 21,659,024 |
| Michigan Tobacco Settlement Finance Authority, Tobacco Settlement Asset-Backed, Capital Appreciation, Revenue Bonds | | |
| Series B | | |
| (zero coupon), due 6/1/46 | 291,930,000 | 36,203,932 |
| Series B | | |
| (zero coupon), due 6/1/52 | 23,420,000 | 2,561,804 |
| Series C | | |
| (zero coupon), due 6/1/58 (e) | 978,750,000 | 49,545,500 |
The notes to the financial statements are an integral part of, and should be read in conjunction with, the financial statements.
| 34 | MainStay MacKay High Yield Municipal Bond Fund |
| | Principal
Amount | Value |
| Long-Term Municipal Bonds (continued) |
| Michigan (continued) |
| Richfield Public School Academy, Revenue Bonds | | |
| 4.00%, due 9/1/30 | $ 750,000 | $ 793,259 |
| | | 247,345,619 |
| Minnesota 1.2% |
| City of Blaine MN, Crest View Senior Communities Project, Revenue Bonds | | |
| Series A | | |
| 6.125%, due 7/1/45 | 2,100,000 | 1,987,376 |
| City of Crookston MN, Riverview Healthcare Project, Revenue Bonds | | |
| 5.00%, due 5/1/51 | 4,000,000 | 4,130,281 |
| City of Forest Lake MN, Lakes International Language Academy Project, Revenue Bonds | | |
| Series A | | |
| 5.375%, due 8/1/50 | 1,250,000 | 1,426,988 |
| City of Ham Lake MN, Parnassus Preparatory School Project, Revenue Bonds | | |
| Series A | | |
| 5.00%, due 11/1/47 | 3,500,000 | 3,844,550 |
| City of Minneapolis MN, Twin Cities International School Project, Revenue Bonds | | |
| Series A | | |
| 5.00%, due 12/1/47 (a) | 4,085,000 | 4,492,353 |
| City of Rochester MN, Samaritan Bethany, Inc. Project, Revenue Bonds | | |
| Series A | | |
| 5.00%, due 8/1/48 | 2,000,000 | 2,086,714 |
| City of St Paul Minnesota, Healtheast Care System Project, Revenue Bonds | | |
| Series A | | |
| 5.00%, due 11/15/29 | 1,745,000 | 2,098,064 |
| Series A | | |
| 5.00%, due 11/15/40 | 1,775,000 | 2,134,134 |
| City of St Paul Minnesota, Hmong College Preparatory Academy Project, Revenue Bonds | | |
| Series A | | |
| 5.75%, due 9/1/46 | 3,000,000 | 3,496,192 |
| | Principal
Amount | Value |
| |
| Minnesota (continued) |
| City of St Paul Minnesota, Nova Classical Academy, Revenue Bonds | | |
| Series A | | |
| 6.625%, due 9/1/42 | $ 1,000,000 | $ 1,021,162 |
| Duluth Economic Development Authority, Essentia Health Obligated Group, Revenue Bonds | | |
| Series A | | |
| 5.00%, due 2/15/48 | 8,550,000 | 10,141,331 |
| Series A | | |
| 5.00%, due 2/15/53 | 26,250,000 | 31,020,617 |
| Series A | | |
| 5.25%, due 2/15/58 | 50,655,000 | 60,791,587 |
| Duluth Economic Development Authority, Cambia Hills of Bethel Project, Revenue Bonds | | |
| 5.625%, due 12/1/55 (f)(g) | 6,000,000 | 4,800,000 |
| Minnesota Higher Education Facilities Authority, Augsburg College, Revenue Bonds | | |
| Series A | | |
| 5.00%, due 5/1/46 | 325,000 | 338,078 |
| | | 133,809,427 |
| Mississippi 0.0% ‡ |
| Mississippi Development Bank, Magnolia Regional Health Center Project, Revenue Bonds | | |
| Series A | | |
| 6.75%, due 10/1/36 | 1,250,000 | 1,269,124 |
| Missouri 0.4% |
| Branson Industrial Development Authority, Tax Increment, Branson Landing-Retail Project, Tax Allocation | | |
| 5.25%, due 6/1/21 | 60,000 | 60,027 |
| 5.50%, due 6/1/29 | 3,510,000 | 3,511,059 |
| City of Lees Summit MO, Department of Airports, Summit Fair Project, Tax Allocation | | |
| 4.875%, due 11/1/37��(a) | 3,045,000 | 3,030,990 |
The notes to the financial statements are an integral part of, and should be read in conjunction with, the financial statements.
35
Portfolio of Investments April 30, 2021† (Unaudited) (continued)
| | Principal
Amount | Value |
| Long-Term Municipal Bonds (continued) |
| Missouri (continued) |
| Kansas City Land Clearance Redevelopment Authority, Convention Center Hotel Project, Tax Allocation | | |
| Series B | | |
| 5.00%, due 2/1/50 (a) | $ 5,000,000 | $ 5,353,607 |
| Lees Summit Industrial Development Authority, Fair Community Improvement District, Special Assessment | | |
| 5.00%, due 5/1/35 | 1,100,000 | 1,100,635 |
| 6.00%, due 5/1/42 | 2,800,000 | 2,801,718 |
| Maryland Heights Industrial Development Authority, St. Louis Community Ice Center Project, Revenue Bonds | | |
| Series A | | |
| 5.00%, due 3/15/49 | 7,750,000 | 6,991,478 |
| St Joseph Industrial Development Authority, Living Community of St Joseph, Revenue Bonds | | |
| Series A | | |
| 4.50%, due 1/1/40 | 2,000,000 | 2,030,969 |
| St Louis County Industrial Development Authority, Nazareth Living Center Project, Revenue Bonds | | |
| Series A | | |
| 5.125%, due 8/15/45 | 1,900,000 | 1,948,612 |
| St Louis Land Clearance for Redevelopment Authority, Scottrade Center Project, Revenue Bonds | | |
| Series A | | |
| 5.00%, due 4/1/48 | 3,250,000 | 3,742,365 |
| State of Missouri, Health & Educational Facilities Authority, Revenue Bonds | | |
| Series A | | |
| 4.00%, due 6/15/41 | 3,300,000 | 3,523,764 |
| Series A | | |
| 4.00%, due 10/1/43 | 1,125,000 | 1,228,329 |
| 5.00%, due 11/1/40 | 2,000,000 | 2,365,507 |
| Series A | | |
| 5.00%, due 6/15/45 | 3,520,000 | 4,174,407 |
| | | 41,863,467 |
| | Principal
Amount | Value |
| |
| Montana 0.1% |
| Montana Facility Finance Authority, Montana Children's Home and Hospital, Revenue Bonds | | |
| Series A | | |
| 4.00%, due 7/1/50 | $ 10,000,000 | $ 10,387,016 |
| Montana Facility Finance Authority, Kalispell Regional Medical Center, Revenue Bonds | | |
| Series B | | |
| 5.00%, due 7/1/48 | 5,765,000 | 6,642,496 |
| | | 17,029,512 |
| Nevada 0.3% |
| City of Reno NV, Sales Tax, Transportation Rail Access Corridor Project, Revenue Bonds | | |
| Series C | | |
| (zero coupon), due 7/1/58 (a) | 18,000,000 | 2,938,072 |
| Series A | | |
| 4.00%, due 6/1/43 | 2,500,000 | 2,633,627 |
| City of Reno NV, Sales Tax, Revenue Bonds | | |
| Series D | | |
| (zero coupon), due 7/1/58 (a) | 9,000,000 | 947,297 |
| Las Vegas Convention & Visitors Authority, Revenue Bonds | | |
| Series B | | |
| 4.00%, due 7/1/39 | 4,710,000 | 5,216,933 |
| Series B | | |
| 4.00%, due 7/1/40 | 4,640,000 | 5,131,753 |
| Las Vegas Redevelopment Agency, Tax Allocation | | |
| 5.00%, due 6/15/45 | 2,750,000 | 3,094,688 |
| State of Nevada Department of Business & Industry, Somerset Academy of Las Vegas, Revenue Bonds (a) | | |
| Series A | | |
| 5.00%, due 12/15/38 | 1,000,000 | 1,109,660 |
| Series A | | |
| 5.00%, due 12/15/48 | 3,465,000 | 3,789,553 |
| Tahoe-Douglas Visitors Authority, Revenue Bonds | | |
| 5.00%, due 7/1/34 | 2,000,000 | 2,357,737 |
| 5.00%, due 7/1/40 | 2,500,000 | 2,894,927 |
| | | 30,114,247 |
The notes to the financial statements are an integral part of, and should be read in conjunction with, the financial statements.
| 36 | MainStay MacKay High Yield Municipal Bond Fund |
| | Principal
Amount | Value |
| Long-Term Municipal Bonds (continued) |
| New Hampshire 0.2% |
| Manchester Housing and Redevelopment Authority, Inc., Revenue Bonds | | |
| Series B, Insured: ACA | | |
| (zero coupon), due 1/1/26 | $ 1,975,000 | $ 1,616,451 |
| New Hampshire Business Finance Authority, Springpoint Senior Living Project, Revenue Bonds | | |
| 4.00%, due 1/1/41 | 3,175,000 | 3,514,171 |
| 4.00%, due 1/1/51 | 4,600,000 | 5,039,465 |
| New Hampshire Business Finance Authority, The Vista Project, Revenue Bonds | | |
| Series A | | |
| 5.75%, due 7/1/54 (a) | 1,500,000 | 1,576,091 |
| New Hampshire Health and Education Facilities Authority Act, Southern New Hampshire University, Revenue Bonds | | |
| 5.00%, due 1/1/42 | 2,825,000 | 2,915,499 |
| New Hampshire Health and Education Facilities Authority Act, Catholic Medical Center, Revenue Bonds | | |
| 5.00%, due 7/1/44 | 3,000,000 | 3,493,873 |
| New Hampshire Health and Education Facilities Authority Act, Kendal at Hanover, Revenue Bonds | | |
| 5.00%, due 10/1/46 | 1,800,000 | 2,033,083 |
| | | 20,188,633 |
| New Jersey 4.0% |
| City of Atlantic City NJ, Unlimited General Obligation | | |
| Insured: AGM | | |
| 4.00%, due 11/1/26 | 805,000 | 842,321 |
| Essex County Improvement Authority, New Jersey Institute of Technology, NIJIT Student Housing Project, Revenue Bonds | | |
| Series A, Insured: BAM | | |
| 4.00%, due 8/1/51 | 1,500,000 | 1,774,490 |
| Series A, Insured: BAM | | |
| 4.00%, due 8/1/56 | 2,600,000 | 3,063,277 |
| Series A, Insured: BAM | | |
| 4.00%, due 8/1/60 | 2,250,000 | 2,630,536 |
| | Principal
Amount | Value |
| |
| New Jersey (continued) |
| Essex County Improvement Authority, North Star Academy Charter School of New York Inc. Project, Revenue Bonds (a) | | |
| 4.00%, due 7/15/60 | $ 12,255,000 | $ 13,345,363 |
| Series A | | |
| 4.00%, due 8/1/60 | 4,005,000 | 4,362,835 |
| New Jersey Economic Development Authority, Motor Vehicle Surcharge, Revenue Bonds | | |
| Series A | | |
| 4.00%, due 7/1/34 | 1,000,000 | 1,120,676 |
| New Jersey Economic Development Authority, New Jersey Transit Transportation Project, Revenue Bonds | | |
| Series A | | |
| 4.00%, due 11/1/39 | 2,000,000 | 2,287,721 |
| Series A | | |
| 4.00%, due 11/1/44 | 11,500,000 | 12,994,665 |
| Series A | | |
| 5.00%, due 11/1/35 | 10,000,000 | 12,495,915 |
| Series A | | |
| 5.00%, due 11/1/36 | 3,500,000 | 4,356,450 |
| New Jersey Economic Development Authority, School Facilities Construction, Revenue Bonds | | |
| Series QQQ | | |
| 4.00%, due 6/15/46 | 2,750,000 | 3,134,528 |
| Series QQQ | | |
| 4.00%, due 6/15/50 | 5,215,000 | 5,918,416 |
| Series LLL | | |
| 5.00%, due 6/15/44 | 1,000,000 | 1,220,392 |
| Series LLL | | |
| 5.00%, due 6/15/49 | 7,090,000 | 8,599,441 |
| New Jersey Economic Development Authority, Revenue Bonds | | |
| Series A | | |
| 5.00%, due 7/1/33 | 1,765,000 | 2,079,280 |
| New Jersey Economic Development Authority, Provident Group-Kean Properties LLC, Revenue Bonds | | |
| Series A | | |
| 5.00%, due 7/1/37 | 500,000 | 530,789 |
The notes to the financial statements are an integral part of, and should be read in conjunction with, the financial statements.
37
Portfolio of Investments April 30, 2021† (Unaudited) (continued)
| | Principal
Amount | Value |
| Long-Term Municipal Bonds (continued) |
| New Jersey (continued) |
New Jersey Economic Development Authority, Provident Group-Kean Properties LLC, Revenue Bonds
(continued) | | |
| Series A | | |
| 5.00%, due 1/1/50 | $ 3,100,000 | $ 3,245,833 |
| New Jersey Economic Development Authority, State Government Buildings Project, Revenue Bonds | | |
| Series C | | |
| 5.00%, due 6/15/42 | 9,210,000 | 11,055,143 |
| New Jersey Economic Development Authority, Port Newark Container Terminal LLC, Revenue Bonds | | |
| 5.00%, due 10/1/47 (b) | 10,000,000 | 11,503,584 |
| New Jersey Economic Development Authority, Provident Group-Rowan Properties LLC, Revenue Bonds | | |
| Series A | | |
| 5.00%, due 1/1/48 | 12,410,000 | 12,943,713 |
| New Jersey Economic Development Authority, The Goethals Bridge Replacement Project, Revenue Bonds (b) | | |
| 5.125%, due 1/1/34 | 3,000,000 | 3,345,623 |
| Insured: AGM | | |
| 5.125%, due 7/1/42 | 1,705,000 | 1,903,826 |
| 5.375%, due 1/1/43 | 2,000,000 | 2,240,171 |
| New Jersey Economic Development Authority, UMM Energy Partners LLC, Revenue Bonds | | |
| Series A | | |
| 5.125%, due 6/15/43 (b) | 2,000,000 | 2,077,247 |
| New Jersey Economic Development Authority, United Airlines, Inc., Revenue Bonds | | |
| 5.25%, due 9/15/29 | 10,420,000 | 11,060,565 |
| | Principal
Amount | Value |
| |
| New Jersey (continued) |
| New Jersey Economic Development Authority, Continental Airlines, Inc. Project, Revenue Bonds | | |
| Series B | | |
| 5.625%, due 11/15/30 (b) | $ 15,085,000 | $ 16,930,701 |
| New Jersey Economic Development Authority, Team Academy Charter School Project, Revenue Bonds | | |
| 6.00%, due 10/1/43 | 2,055,000 | 2,247,310 |
| New Jersey Educational Facilities Authority, St Elizabeth University, Revenue Bonds | | |
| Series D | | |
| 5.00%, due 7/1/46 | 2,190,000 | 2,301,469 |
| New Jersey Health Care Facilities Financing Authority, University Hospital, Revenue Bonds | | |
| Series A, Insured: AGM | | |
| 5.00%, due 7/1/46 | 3,750,000 | 4,297,412 |
| New Jersey Health Care Facilities Financing Authority, St. Peter's University Hospital, Revenue Bonds | | |
| 5.75%, due 7/1/37 | 2,520,000 | 2,527,611 |
| 6.25%, due 7/1/35 | 2,725,000 | 2,742,330 |
| New Jersey Transportation Trust Fund Authority, Transportation System, Revenue Bonds | | |
| Series 2020AA | | |
| 4.00%, due 6/15/36 | 2,750,000 | 3,233,908 |
| Series 2020AA | | |
| 4.00%, due 6/15/38 | 8,750,000 | 10,193,761 |
| Series 2020AA | | |
| 4.00%, due 6/15/39 | 3,000,000 | 3,480,314 |
| Series 2020AA | | |
| 4.00%, due 6/15/45 | 6,000,000 | 6,846,429 |
| Series 2020AA | | |
| 4.00%, due 6/15/50 | 65,500,000 | 74,334,850 |
| New Jersey Transportation Trust Fund Authority, Revenue Bonds | | |
| Series BB | | |
| 4.00%, due 6/15/50 | 5,105,000 | 5,714,163 |
| Series AAA | | |
| 5.00%, due 6/15/50 | 10,705,000 | 13,206,309 |
The notes to the financial statements are an integral part of, and should be read in conjunction with, the financial statements.
| 38 | MainStay MacKay High Yield Municipal Bond Fund |
| | Principal
Amount | Value |
| Long-Term Municipal Bonds (continued) |
| New Jersey (continued) |
| New Jersey Turnpike Authority, Revenue Bonds | | |
| Series E | | |
| 5.00%, due 1/1/45 | $ 8,830,000 | $ 10,146,971 |
| South Jersey Port Corp., Marine Terminal, Revenue Bonds (b) | | |
| Series B | | |
| 5.00%, due 1/1/42 | 16,550,000 | 19,275,740 |
| Series B | | |
| 5.00%, due 1/1/48 | 10,710,000 | 12,380,594 |
| South Jersey Port Corp., Revenue Bonds | | |
| Series A | | |
| 5.00%, due 1/1/49 | 12,455,000 | 14,738,572 |
| South Jersey Transportation Authority, Revenue Bonds | | |
| Series A | | |
| 4.00%, due 11/1/50 | 25,000,000 | 28,638,643 |
| Series A | | |
| 5.00%, due 11/1/39 | 500,000 | 558,153 |
| Series A | | |
| 5.00%, due 11/1/45 | 10,500,000 | 13,131,630 |
| Tobacco Settlement Financing Corp., Revenue Bonds | | |
| Series A | | |
| 5.00%, due 6/1/46 | 10,215,000 | 12,116,102 |
| Series B | | |
| 5.00%, due 6/1/46 | 38,700,000 | 45,348,114 |
| | | 444,523,886 |
| New Mexico 0.1% |
| City of Santa Fe NM, El Castillo Retirement Residences Project, Revenue Bonds | | |
| Series B-1 | | |
| 2.625%, due 5/15/25 | 1,000,000 | 1,003,226 |
| New Mexico Hospital Equipment Loan Council, Improvement and Refunding, Gerald Champion, Revenue Bonds | | |
| Series 2012A | | |
| 5.50%, due 7/1/42 | 7,250,000 | 7,600,046 |
| | | 8,603,272 |
| | Principal
Amount | Value |
| |
| New York 7.6% |
| Albany Industrial Development Agency, Brighter Choice Charter School, Revenue Bonds | | |
| Series A | | |
| 5.00%, due 4/1/32 | $ 1,500,000 | $ 1,503,724 |
| Build NYC Resource Corp., Pratt Paper, Inc. Project, Revenue Bonds | | |
| 5.00%, due 1/1/35 (a)(b) | 1,500,000 | 1,678,784 |
| Build NYC Resource Corp., Metropolitan Lighthouse Charter School Project, Revenue Bonds | | |
| Series A | | |
| 5.00%, due 6/1/47 (a) | 1,225,000 | 1,357,991 |
| Build NYC Resource Corp., Hellenic Classical Charter Schools, Revenue Bonds | | |
| Series A | | |
| 5.00%, due 12/1/51 (a) | 2,125,000 | 2,401,307 |
| City of New Rochelle NY, Iona College Project, Revenue Bonds | | |
| Series A | | |
| 5.00%, due 7/1/40 | 3,455,000 | 3,839,814 |
| City of Newburgh NY, Limited General Obligation | | |
| Series A | | |
| 5.00%, due 6/15/21 | 750,000 | 753,196 |
| Series A | | |
| 5.00%, due 6/15/26 | 960,000 | 1,011,909 |
| Series A | | |
| 5.50%, due 6/15/31 | 750,000 | 794,727 |
| County of Suffolk NY, Limited General Obligation | | |
| Series I | | |
| 2.00%, due 7/22/21 | 29,000,000 | 29,113,787 |
| Dutchess County Local Development Corp., Bard College Project, Revenue Bonds | | |
| Series A | | |
| 5.00%, due 7/1/51 (a) | 7,000,000 | 8,323,323 |
| Erie Tobacco Asset Securitization Corp., Revenue Bonds | | |
| Series B | | |
| (zero coupon), due 6/1/47 | 40,000,000 | 8,838,304 |
The notes to the financial statements are an integral part of, and should be read in conjunction with, the financial statements.
39
Portfolio of Investments April 30, 2021† (Unaudited) (continued)
| | Principal
Amount | Value |
| Long-Term Municipal Bonds (continued) |
| New York (continued) |
| Huntington Local Development Corp., Fountaingate Gardens Project, Revenue Bonds | | |
| Series B | | |
| 4.00%, due 7/1/27 | $ 6,000,000 | $ 6,124,621 |
| Series A | | |
| 5.25%, due 7/1/56 | 1,000,000 | 1,060,348 |
| Jefferson County Civic Facility Development Corp., Samaritan Medical Center Project, Revenue Bonds | | |
| Series A | | |
| 4.00%, due 11/1/42 | 3,605,000 | 3,830,893 |
| Metropolitan Transportation Authority, Green Bond, Revenue Bonds | | |
| Series E | | |
| 4.00%, due 11/15/45 | 11,685,000 | 13,352,146 |
| Series A-1 | | |
| 4.00%, due 11/15/46 | 21,945,000 | 24,899,232 |
| Series D-2 | | |
| 4.00%, due 11/15/47 | 7,500,000 | 8,551,224 |
| Series A-1 | | |
| 4.00%, due 11/15/48 | 15,000,000 | 17,185,695 |
| Series A-1 | | |
| 4.00%, due 11/15/49 | 15,000,000 | 17,170,788 |
| Series A-1 | | |
| 4.00%, due 11/15/50 | 68,500,000 | 78,331,524 |
| Series A-1, Insured: AGM | | |
| 4.00%, due 11/15/54 | 29,535,000 | 33,675,837 |
| Series A-2 | | |
| 5.00%, due 11/15/27 | 3,400,000 | 4,150,254 |
| Series B | | |
| 5.00%, due 11/15/28 | 1,190,000 | 1,519,613 |
| Series D | | |
| 5.00%, due 11/15/45 | 26,000,000 | 32,332,240 |
| Metropolitan Transportation Authority, Revenue Bonds | | |
| Series B-2A | | |
| 5.00%, due 5/15/21 | 3,850,000 | 3,855,798 |
| Series B-2 | | |
| 5.00%, due 5/15/21 | 6,300,000 | 6,309,487 |
| Series D-1 | | |
| 5.00%, due 9/1/22 | 17,800,000 | 18,910,261 |
| Series F | | |
| 5.00%, due 11/15/22 | 17,150,000 | 18,383,627 |
| | Principal
Amount | Value |
| |
| New York (continued) |
Metropolitan Transportation Authority, Revenue Bonds
(continued) | | |
| Series A-1 | | |
| 5.00%, due 2/1/23 | $ 10,000,000 | $ 10,805,566 |
| Series D | | |
| 5.00%, due 11/15/27 | 2,305,000 | 2,813,628 |
| Series F | | |
| 5.00%, due 11/15/30 | 10,260,000 | 10,899,671 |
| Series B | | |
| 5.00%, due 11/15/40 | 15,000,000 | 17,033,322 |
| Monroe County Industrial Development Corp., St. Ann's Community Project, Revenue Bonds | | |
| 5.00%, due 1/1/40 | 3,000,000 | 3,292,942 |
| MTA Hudson Rail Yards Trust Obligations, Election 2016, Revenue Bonds | | |
| Series A | | |
| 5.00%, due 11/15/56 | 7,400,000 | 8,023,278 |
| Nassau County Tobacco Settlement Corp., Tobacco Settlement Asset-Backed, Revenue Bonds | | |
| Series A-3 | | |
| 5.00%, due 6/1/35 | 2,075,000 | 2,102,475 |
| Series A-3 | | |
| 5.125%, due 6/1/46 | 13,155,000 | 13,401,377 |
| New York City Industrial Development Agency, Yankee Stadium Project, Revenue Bonds | | |
| Series A | | |
| 3.00%, due 3/1/49 | 13,050,000 | 13,357,050 |
| New York Convention Center Development Corp., Hotel Unit Fee, Revenue Bonds, Senior Lien | | |
| Series A | | |
| (zero coupon), due 11/15/47 | 10,000,000 | 4,558,550 |
| New York Counties Tobacco Trust V, Pass Through, Capital Appreciation, Revenue Bonds | | |
| Series S | | |
| (zero coupon), due 6/1/38 | 2,500,000 | 911,612 |
| New York Liberty Development Corp., 3 World Trade Center LLC, Revenue Bonds (a) | | |
| 5.00%, due 11/15/44 | 2,000,000 | 2,189,213 |
The notes to the financial statements are an integral part of, and should be read in conjunction with, the financial statements.
| 40 | MainStay MacKay High Yield Municipal Bond Fund |
| | Principal
Amount | Value |
| Long-Term Municipal Bonds (continued) |
| New York (continued) |
New York Liberty Development Corp., 3 World Trade Center LLC, Revenue Bonds (a)
(continued) | | |
| 5.15%, due 11/15/34 | $ 4,150,000 | $ 4,638,579 |
| 5.375%, due 11/15/40 | 6,500,000 | 7,255,942 |
| 7.25%, due 11/15/44 | 10,500,000 | 11,667,829 |
| New York State Dormitory Authority, Montefiore Obligated Group, Revenue Bonds | | |
| Series A | | |
| 4.00%, due 8/1/37 | 3,250,000 | 3,681,451 |
| Series A | | |
| 4.00%, due 8/1/38 | 3,250,000 | 3,673,152 |
| Series A | | |
| 5.00%, due 8/1/32 | 3,935,000 | 4,844,117 |
| Series A | | |
| 5.00%, due 8/1/35 | 2,350,000 | 2,871,476 |
| New York State Dormitory Authority, NYU Langone Hospitals Obligated Group, Revenue Bonds | | |
| Series A | | |
| 4.00%, due 7/1/50 | 6,000,000 | 6,982,147 |
| Series A | | |
| 4.00%, due 7/1/53 | 2,800,000 | 3,250,530 |
| New York State Dormitory Authority, Orange Regional Medical Center Obligated Group, Revenue Bonds (a) | | |
| 5.00%, due 12/1/29 | 1,000,000 | 1,183,400 |
| 5.00%, due 12/1/30 | 1,200,000 | 1,411,113 |
| New York State Dormitory Authority, Touro College and University System Obligated Group, Revenue Bonds | | |
| 5.00%, due 1/1/47 | 9,000,000 | 10,200,666 |
| New York Transportation Development Corp., Delta Air Lines, Inc. - Laguardia Airport Terminals C&D Redevelopment Project, Revenue Bonds (b) | | |
| 4.375%, due 10/1/45 | 49,360,000 | 57,852,126 |
| 5.00%, due 10/1/35 | 11,000,000 | 14,047,691 |
| 5.00%, due 10/1/40 | 42,740,000 | 53,663,767 |
| | Principal
Amount | Value |
| |
| New York (continued) |
| New York Transportation Development Corp., American Airlines, Inc. John F. Kennedy International Airport Project, Revenue Bonds (b) | | |
| 5.00%, due 8/1/26 | $ 10,200,000 | $ 10,307,776 |
| 5.25%, due 8/1/31 | 5,030,000 | 6,294,779 |
| 5.375%, due 8/1/36 | 6,470,000 | 8,002,216 |
| New York Transportation Development Corp., Laguardia Airport Terminal B Redevelopment Project, Revenue Bonds | | |
| Series A | | |
| 5.25%, due 1/1/50 (b) | 35,110,000 | 39,742,940 |
| Oneida County Local Development Corp., Mohawk Valley Health System Project, Revenue Bonds | | |
| Series A, Insured: AGM | | |
| 3.00%, due 12/1/40 | 3,755,000 | 3,956,210 |
| Series A, Insured: AGM | | |
| 3.00%, due 12/1/44 | 6,750,000 | 7,021,515 |
| Orange County Funding Corp., Mount St Mary College, Revenue Bonds | | |
| Series A | | |
| 5.00%, due 7/1/42 | 1,430,000 | 1,472,843 |
| Port Authority of New York & New Jersey, Revenue Bonds (b) | | |
| 4.00%, due 7/15/50 | 5,930,000 | 6,759,992 |
| 4.00%, due 7/15/55 | 12,895,000 | 14,618,991 |
| Riverhead Industrial Development Agency, Riverhead Charter School, Revenue Bonds | | |
| Series 2013A | | |
| 7.00%, due 8/1/43 | 1,500,000 | 1,639,487 |
| Rockland Tobacco Asset Securitization Corp., Tobacco Settlement Asset-Backed, Revenue Bonds | | |
| Series B | | |
| (zero coupon), due 8/15/50 (a) | 13,000,000 | 1,929,424 |
| Southold Local Development Corp., Peconic Landing, Inc. Project, Revenue Bonds | | |
| 4.00%, due 12/1/45 | 815,000 | 843,538 |
The notes to the financial statements are an integral part of, and should be read in conjunction with, the financial statements.
41
Portfolio of Investments April 30, 2021† (Unaudited) (continued)
| | Principal
Amount | Value |
| Long-Term Municipal Bonds (continued) |
| New York (continued) |
| Suffolk Tobacco Asset Securitization Corp., Tobacco Settlement Asset-Backed, Revenue Bonds | | |
| Series B | | |
| 6.00%, due 6/1/48 | $ 1,125,000 | $ 1,126,832 |
| Suffolk Tobacco Asset Securitization Corp., Tobacco Settlement Asset-Backed, Capital Appreciation, Revenue Bonds | | |
| Series C | | |
| 6.625%, due 6/1/44 | 13,000,000 | 13,384,569 |
| Tompkins County Development Corp., Kendal at Ithaca, Inc. Project, Revenue Bonds | | |
| Series 2014A | | |
| 5.00%, due 7/1/44 | 915,000 | 985,757 |
| Town of Oyster Bay, Limited General Obligation | | |
| Series A | | |
| 2.00%, due 3/11/22 | 82,952,867 | 84,163,962 |
| Westchester County Local Development Corp., Pace University, Revenue Bonds | | |
| Series A | | |
| 5.50%, due 5/1/42 | 6,205,000 | 6,849,979 |
| | | 834,973,934 |
| North Carolina 0.7% |
| North Carolina Department of Transportation, I-77 Hot Lanes Project, Revenue Bonds | | |
| 5.00%, due 6/30/54 (b) | 10,000,000 | 11,000,267 |
| North Carolina Medical Care Commission, United Methodist Retirement Homes, Revenue Bonds | | |
| Series A | | |
| 5.00%, due 10/1/47 | 4,100,000 | 4,422,581 |
| North Carolina Medical Care Commission, Pines at Davidson Project (The), Revenue Bonds | | |
| Series A | | |
| 5.00%, due 1/1/49 | 4,500,000 | 4,967,124 |
| | Principal
Amount | Value |
| |
| North Carolina (continued) |
| North Carolina Medical Care Commission, Sharon Towers, Revenue Bonds | | |
| Series A | | |
| 5.00%, due 7/1/49 | $ 1,500,000 | $ 1,661,024 |
| North Carolina Turnpike Authority, Triangle Expressway System, Revenue Bonds, Senior Lien | | |
| Insured: AGM | | |
| 3.00%, due 1/1/42 | 2,800,000 | 2,974,172 |
| 5.00%, due 1/1/49 | 25,000,000 | 30,491,387 |
| Insured: AGM | | |
| 5.00%, due 1/1/49 | 5,000,000 | 6,282,106 |
| North Carolina Turnpike Authority, Monroe Expressway Toll, Revenue Bonds | | |
| Series A | | |
| 5.00%, due 7/1/54 | 10,000,000 | 11,388,078 |
| | | 73,186,739 |
| North Dakota 0.4% |
| County of Cass ND, Essentia Health Obligated Group, Revenue Bonds | | |
| Series B | | |
| 5.25%, due 2/15/53 | 9,500,000 | 11,422,376 |
| County of Ward ND, Trinity Health Obligated Group, Revenue Bonds | | |
| Series C | | |
| 5.00%, due 6/1/48 | 28,640,000 | 32,757,771 |
| | | 44,180,147 |
| Ohio 4.4% |
| Akron Bath Copley Joint Township Hospital District, Summa Health System Obligated Group, Revenue Bonds | | |
| 5.25%, due 11/15/46 | 20,725,000 | 24,080,208 |
| Buckeye Tobacco Settlement Financing Authority, Revenue Bonds, Senior Lien | | |
| Series A-2 | | |
| 4.00%, due 6/1/48 | 1,500,000 | 1,695,954 |
| Series B-2 | | |
| 5.00%, due 6/1/55 | 186,775,000 | 209,968,272 |
The notes to the financial statements are an integral part of, and should be read in conjunction with, the financial statements.
| 42 | MainStay MacKay High Yield Municipal Bond Fund |
| | Principal
Amount | Value |
| Long-Term Municipal Bonds (continued) |
| Ohio (continued) |
| Cleveland-Cuyahoga County Port Authority, Euclid Avenue Development Corp. Project, Revenue Bonds | | |
| 4.00%, due 8/1/44 | $ 12,720,000 | $ 14,659,056 |
| Cleveland-Cuyahoga County Port Authority, Centers for Dialysis Care Project, Revenue Bonds | | |
| Series A | | |
| 5.00%, due 12/1/42 | 5,205,000 | 5,833,352 |
| Series A | | |
| 5.00%, due 12/1/47 | 1,435,000 | 1,593,900 |
| Cleveland-Cuyahoga County Port Authority, Starwood Wasserman University Heights Holding LLC, Revenue Bonds (e)(f)(g) | | |
| Series A | | |
| 7.00%, due 12/1/18 | 710,000 | 184,600 |
| Series A | | |
| 7.35%, due 12/1/31 | 6,000,000 | 1,560,000 |
| County of Cuyahoga, MetroHealth System (The), Revenue Bonds | | |
| 4.75%, due 2/15/47 | 1,440,000 | 1,597,408 |
| 5.00%, due 2/15/37 | 5,350,000 | 6,256,252 |
| 5.00%, due 2/15/52 | 7,000,000 | 8,025,915 |
| 5.00%, due 2/15/57 | 8,610,000 | 9,855,794 |
| 5.50%, due 2/15/57 | 33,730,000 | 39,657,747 |
| County of Cuyahoga, MetroHealth System, Revenue Bonds | | |
| 5.50%, due 2/15/52 | 1,550,000 | 1,826,268 |
| County of Hamilton OH, Life Enriching Communities Project, Revenue Bonds | | |
| 5.00%, due 1/1/42 | 1,080,000 | 1,116,777 |
| 5.00%, due 1/1/46 | 2,090,000 | 2,258,104 |
| County of Hamilton OH, Christ Hospital Project, Revenue Bonds | | |
| 5.50%, due 6/1/42 | 2,500,000 | 2,643,608 |
| County of Lucas, Promedica Healthcare Obligated Group, Revenue Bonds | | |
| Series A | | |
| 5.25%, due 11/15/48 | 53,350,000 | 61,630,283 |
| | Principal
Amount | Value |
| |
| Ohio (continued) |
| Franklin County Convention Facilities Authority, Greater Columbus Convention Center Hotel Expansion Project, Revenue Bonds | | |
| 5.00%, due 12/1/51 | $ 4,500,000 | $ 5,221,387 |
| Ohio Air Quality Development Authority, Ohio Valley Electric Corp., Revenue Bonds | | |
| Series A | | |
| 3.25%, due 9/1/29 | 1,500,000 | 1,609,753 |
| Ohio Air Quality Development Authority, Pratt Paper LLC Project, Revenue Bonds | | |
| 4.50%, due 1/15/48 (a)(b) | 10,560,000 | 11,959,012 |
| Ohio Higher Educational Facility Commission, Tiffin University Project, Revenue Bonds | | |
| 4.00%, due 11/1/49 | 5,000,000 | 5,218,639 |
| 5.00%, due 11/1/44 | 750,000 | 857,263 |
| Ohio Higher Educational Facility Commission, University of Findlay (The), Revenue Bonds | | |
| 5.00%, due 3/1/39 | 1,675,000 | 1,937,371 |
| 5.00%, due 3/1/44 | 9,610,000 | 10,977,229 |
| Ohio Higher Educational Facility Commission, Menorah Park Obligated Group, Revenue Bonds | | |
| 5.25%, due 1/1/48 | 5,210,000 | 5,224,123 |
| Ohio Higher Educational Facility Commission, Cleveland Institute of Art (The), Revenue Bonds | | |
| 5.25%, due 12/1/48 | 1,000,000 | 1,116,240 |
| 5.50%, due 12/1/53 | 1,215,000 | 1,371,983 |
| Port of Greater Cincinnati Development Authority, Revenue Bonds | | |
| Series A | | |
| 3.00%, due 5/1/23 | 4,400,000 | 4,406,984 |
| State of Ohio, University Hospitals Health System, Revenue Bonds | | |
| Series A | | |
| 4.00%, due 1/15/50 | 25,000,000 | 28,680,737 |
The notes to the financial statements are an integral part of, and should be read in conjunction with, the financial statements.
43
Portfolio of Investments April 30, 2021† (Unaudited) (continued)
| | Principal
Amount | Value |
| Long-Term Municipal Bonds (continued) |
| Ohio (continued) |
| Summit County Development Finance Authority, Cleveland-Flats East Development, Revenue Bonds | | |
| Series B | | |
| 6.875%, due 5/15/40 | $ 1,100,000 | $ 1,103,688 |
| Toledo-Lucas County Port Authority, University of Toledo Project, Revenue Bonds | | |
| Series A | | |
| 5.00%, due 7/1/34 | 1,400,000 | 1,514,890 |
| Series A | | |
| 5.00%, due 7/1/39 | 2,000,000 | 2,146,925 |
| Series A | | |
| 5.00%, due 7/1/46 | 9,790,000 | 10,448,827 |
| | | 488,238,549 |
| Oklahoma 0.4% |
| Norman Regional Hospital Authority, Norman Regional Hospital Authority Obligated Group, Revenue Bonds | | |
| 4.00%, due 9/1/37 | 2,215,000 | 2,430,284 |
| 5.00%, due 9/1/37 | 3,500,000 | 4,100,580 |
| Oklahoma Development Finance Authority, Provident Oklahoma Education Resources, Inc. Cross Village Student Housing Project, Revenue Bonds | | |
| Series A | | |
| 5.00%, due 8/1/47 | 20,110,000 | 14,680,300 |
| Series A | | |
| 5.25%, due 8/1/57 | 25,250,000 | 18,432,500 |
| Tulsa County Industrial Authority, Montereau, Inc., Project, Revenue Bonds | | |
| 5.25%, due 11/15/45 | 1,250,000 | 1,370,003 |
| | | 41,013,667 |
| Oregon 0.1% |
| Astoria Hospital Facilities Authority, Columbia Memorial Hospital Obligated Group, Revenue Bonds | | |
| 3.50%, due 8/1/42 | 845,000 | 886,852 |
| | Principal
Amount | Value |
| |
| Oregon (continued) |
| Medford Hospital Facilities Authority, Rogue Valley Manor, Revenue Bonds | | |
| Series 2013A | | |
| 5.00%, due 10/1/42 | $ 4,605,000 | $ 4,884,507 |
| Oregon State Facilities Authority, Prerefunded-Samaritan Health, Revenue Bonds | | |
| Series A | | |
| 5.00%, due 10/1/46 | 190,000 | 233,625 |
| Oregon State Facilities Authority, Unrefunded-Samaritan Health, Revenue Bonds | | |
| Series A | | |
| 5.00%, due 10/1/46 | 2,810,000 | 3,243,234 |
| Oregon State Facilities Authority, College Housing Northwest Project, Revenue Bonds | | |
| Series A | | |
| 5.00%, due 10/1/48 (a) | 1,560,000 | 1,635,139 |
| Yamhill County Hospital Authority, Friendsview Retirement Community, Revenue Bonds | | |
| Series A | | |
| 5.00%, due 11/15/46 | 1,000,000 | 1,059,531 |
| | | 11,942,888 |
| Pennsylvania 3.4% |
| Allegheny County Higher Education Building Authority, Carlow University Project, Revenue Bonds | | |
| 7.00%, due 11/1/40 | 1,000,000 | 1,033,349 |
| Allegheny County Hospital Development Authority, Allegheny Health Network Obligated Group, Revenue Bonds | | |
| Series A | | |
| 4.00%, due 4/1/44 | 16,500,000 | 18,254,465 |
| Allegheny County Industrial Development Authority, Propel Charter School - Sunrise, Revenue Bonds | | |
| 6.00%, due 7/15/38 | 3,100,000 | 3,355,383 |
The notes to the financial statements are an integral part of, and should be read in conjunction with, the financial statements.
| 44 | MainStay MacKay High Yield Municipal Bond Fund |
| | Principal
Amount | Value |
| Long-Term Municipal Bonds (continued) |
| Pennsylvania (continued) |
| Allegheny County Industrial Development Authority, Propel Charter School-Montour, Revenue Bonds | | |
| Series A | | |
| 6.75%, due 8/15/35 | $ 265,000 | $ 265,960 |
| Allentown Neighborhood Improvement Zone Development Authority, City Center Project, Revenue Bonds (a) | | |
| 5.00%, due 5/1/42 | 13,250,000 | 15,679,772 |
| 5.00%, due 5/1/42 | 15,075,000 | 17,414,031 |
| 5.125%, due 5/1/32 | 4,600,000 | 5,438,878 |
| 5.375%, due 5/1/42 | 4,225,000 | 4,961,271 |
| Allentown Neighborhood Improvement Zone Development Authority, Revenue Bonds | | |
| 6.00%, due 5/1/42 (a) | 5,000,000 | 6,234,641 |
| Bucks County Industrial Development Authority, Grand View Hospital Project, Revenue Bonds | | |
| 4.00%, due 7/1/51 | 10,450,000 | 11,413,809 |
| 5.00%, due 7/1/40 | 3,155,000 | 3,841,921 |
| Chambersburg Area Municipal Authority, Wilson College, Revenue Bonds | | |
| 5.50%, due 10/1/33 | 1,230,000 | 1,362,983 |
| 5.75%, due 10/1/38 | 3,450,000 | 3,828,378 |
| 5.75%, due 10/1/43 | 2,290,000 | 2,525,342 |
| Chester County Industrial Development Authority, Woodlands at Greystone Project, Special Assessment | | |
| 5.125%, due 3/1/48 (a) | 1,046,000 | 1,206,623 |
| City of Erie Higher Education Building Authority, Mercyhurst University Project, Revenue Bonds | | |
| 5.00%, due 9/15/27 | 820,000 | 900,242 |
| 5.00%, due 9/15/28 | 860,000 | 941,034 |
| 5.00%, due 9/15/29 | 175,000 | 190,785 |
| 5.00%, due 9/15/37 | 4,590,000 | 4,866,233 |
| | Principal
Amount | Value |
| |
| Pennsylvania (continued) |
| City of Harrisburg PA, Capital Appreciation, Unlimited General Obligation | | |
| Series F, Insured: AMBAC | | |
| (zero coupon), due 9/15/22 | $ 545,000 | $ 517,289 |
| City of York PA, Unlimited General Obligation | | |
| Series A | | |
| 7.25%, due 11/15/41 | 265,000 | 274,887 |
| Commonwealth Financing Authority, Tobacco Master Settlement Payment, Revenue Bonds | | |
| Insured: AGM | | |
| 4.00%, due 6/1/39 | 14,000,000 | 16,003,670 |
| Cumberland County Municipal Authority, Diakon Lutheran Social Ministries Project, Revenue Bonds | | |
| Series A | | |
| 5.00%, due 1/1/39 | 2,000,000 | 2,372,504 |
| Cumberland County Municipal Authority, Asbury Pennsylvania Obligated Group, Revenue Bonds | | |
| 5.25%, due 1/1/32 | 300,000 | 305,026 |
| Dauphin County General Authority, Harrisburg University Science Technology Project (The), Revenue Bonds (a) | | |
| 5.00%, due 10/15/34 | 6,150,000 | 6,210,552 |
| 5.125%, due 10/15/41 | 5,000,000 | 5,008,276 |
| 5.875%, due 10/15/40 | 4,000,000 | 4,228,004 |
| 6.25%, due 10/15/53 | 7,550,000 | 8,005,351 |
| Delaware County Authority, Cabrini University, Revenue Bonds | | |
| 5.00%, due 7/1/42 | 1,405,000 | 1,588,014 |
| Erie County Hospital Authority, St. Mary's Home Erie of Project, Revenue Bonds | | |
| Series A, Insured: AGC | | |
| 4.50%, due 7/1/23 | 120,000 | 120,392 |
| Franklin County Industrial Development Authority, Menno-Haven, Inc. Project, Revenue Bonds | | |
| 5.00%, due 12/1/39 | 375,000 | 404,847 |
| 5.00%, due 12/1/49 | 1,020,000 | 1,086,747 |
The notes to the financial statements are an integral part of, and should be read in conjunction with, the financial statements.
45
Portfolio of Investments April 30, 2021† (Unaudited) (continued)
| | Principal
Amount | Value |
| Long-Term Municipal Bonds (continued) |
| Pennsylvania (continued) |
| General Authority of Southcentral Pennsylvania, York Academy Regional Charter School Project, Revenue Bonds (a) | | |
| Series A | | |
| 6.00%, due 7/15/38 | $ 3,000,000 | $ 3,483,704 |
| Series A | | |
| 6.50%, due 7/15/48 | 4,500,000 | 5,283,257 |
| Huntingdon County General Authority, Aicup Financing Program, Revenue Bonds | | |
| Series 2 | | |
| 5.00%, due 5/1/46 | 4,255,000 | 4,648,291 |
| Lancaster County Hospital Authority, St. Anne's Retirement Community, Inc. Project, Revenue Bonds | | |
| 5.00%, due 3/1/45 | 500,000 | 544,587 |
| 5.00%, due 3/1/50 | 750,000 | 811,513 |
| Lancaster Industrial Development Authority, Willow Valley Communities Project, Revenue Bonds | | |
| 4.00%, due 12/1/44 | 1,550,000 | 1,698,066 |
| 4.00%, due 12/1/49 | 1,900,000 | 2,075,601 |
| 5.00%, due 12/1/44 | 1,675,000 | 1,938,991 |
| 5.00%, due 12/1/49 | 2,365,000 | 2,730,078 |
| Montgomery County Higher Education and Health Authority, Thomas Jefferson University Project, Revenue Bonds | | |
| 4.00%, due 9/1/44 | 3,000,000 | 3,441,073 |
| 4.00%, due 9/1/49 | 17,310,000 | 19,738,328 |
| Series A | | |
| 4.00%, due 9/1/49 | 1,660,000 | 1,879,060 |
| 4.00%, due 9/1/51 | 4,000,000 | 4,553,269 |
| Montgomery County Higher Education and Health Authority, Philadelphia Presbyterian Homes Project, Revenue Bonds | | |
| 4.00%, due 12/1/48 | 4,110,000 | 4,389,697 |
| Montgomery County Industrial Development Authority, ACTS Retirement-Life Communities, Inc. Obligated Group, Revenue Bonds | | |
| 5.00%, due 11/15/36 | 5,000,000 | 5,830,057 |
| | Principal
Amount | Value |
| |
| Pennsylvania (continued) |
| Montgomery County Industrial Development Authority, Albert Einstein Healthcare Network, Revenue Bonds | | |
| Series 2015A | | |
| 5.25%, due 1/15/45 | $ 6,300,000 | $ 7,002,126 |
| Series 2015A | | |
| 5.25%, due 1/15/46 | 1,000,000 | 1,111,088 |
| New Wilmington Municipal Authority, Westminster College Project, Revenue Bonds | | |
| Series PP1 | | |
| 5.25%, due 5/1/46 | 3,700,000 | 4,078,335 |
| Northeastern Pennsylvania Hospital and Education Authority, King's College Project, Revenue Bonds | | |
| 5.00%, due 5/1/44 | 1,000,000 | 1,160,651 |
| 5.00%, due 5/1/49 | 1,350,000 | 1,561,841 |
| Northeastern Pennsylvania Hospital and Education Authority, Wilkes University Project, Revenue Bonds | | |
| Series A | | |
| 5.25%, due 3/1/42 | 7,640,000 | 7,802,009 |
| Pennsylvania Economic Development Financing Authority, Rapid Bridge Replacement Project, Revenue Bonds | | |
| 4.125%, due 12/31/38 | 4,000,000 | 4,462,144 |
| Pennsylvania Economic Development Financing Authority, American Airlines Group, Inc., Revenue Bonds | | |
| Series B | | |
| 8.00%, due 5/1/29 | 245,000 | 246,355 |
| Pennsylvania Higher Educational Facilities Authority, University of Pennsylvania Health System, Revenue Bonds | | |
| 4.00%, due 8/15/49 | 10,335,000 | 12,016,572 |
| Pennsylvania Higher Educational Facilities Authority, Shippensburg University Student Services, Inc., Revenue Bonds | | |
| 5.00%, due 10/1/44 | 1,000,000 | 1,068,205 |
The notes to the financial statements are an integral part of, and should be read in conjunction with, the financial statements.
| 46 | MainStay MacKay High Yield Municipal Bond Fund |
| | Principal
Amount | Value |
| Long-Term Municipal Bonds (continued) |
| Pennsylvania (continued) |
| Pennsylvania Higher Educational Facilities Authority, Widener University, Revenue Bonds | | |
| Series A | | |
| 5.50%, due 7/15/38 | $ 2,500,000 | $ 2,661,328 |
| 5.50%, due 7/15/43 | 2,400,000 | 2,544,182 |
| Pennsylvania Higher Educational Facilities Authority, Holy Family University, Revenue Bonds | | |
| Series A | | |
| 6.25%, due 9/1/33 | 1,560,000 | 1,711,967 |
| Series A | | |
| 6.50%, due 9/1/38 | 1,000,000 | 1,096,240 |
| Pennsylvania Higher Educational Facilities Authority, Shippensburg University of Pennsylvania, Revenue Bonds | | |
| 6.25%, due 10/1/43 | 1,000,000 | 1,024,890 |
| Pennsylvania Turnpike Commission, Revenue Bonds | | |
| Series A | | |
| 4.00%, due 12/1/50 | 40,735,000 | 47,123,605 |
| Series C | | |
| 5.00%, due 12/1/44 | 16,535,000 | 18,916,983 |
| Philadelphia Authority for Industrial Development, Russell Byers Charter School, Revenue Bonds | | |
| Series A | | |
| 5.00%, due 5/1/40 | 1,105,000 | 1,247,536 |
| Series A | | |
| 5.00%, due 5/1/50 | 3,130,000 | 3,489,113 |
| Philadelphia Authority for Industrial Development, MaST Charter School Project, Revenue Bonds | | |
| Series A | | |
| 5.00%, due 8/1/40 | 600,000 | 714,570 |
| Series A | | |
| 5.00%, due 8/1/50 | 1,050,000 | 1,227,328 |
| Philadelphia Authority for Industrial Development, University of the Arts (The), Revenue Bonds | | |
| 5.00%, due 3/15/45 (a) | 5,500,000 | 5,857,492 |
| | Principal
Amount | Value |
| |
| Pennsylvania (continued) |
| Philadelphia Authority for Industrial Development, Philadelphia Performing Arts Charter School, Revenue Bonds | | |
| Series A | | |
| 5.00%, due 6/15/50 (a) | $ 1,700,000 | $ 1,958,815 |
| Philadelphia Authority for Industrial Development, International Education & Community Initiatives Project, Revenue Bonds (a) | | |
| Series A | | |
| 5.125%, due 6/1/38 | 2,000,000 | 2,246,019 |
| Series A | | |
| 5.25%, due 6/1/48 | 3,085,000 | 3,451,421 |
| Philadelphia Authority for Industrial Development, Greater Philadelphia Health Action, Inc., Revenue Bonds | | |
| Series A | | |
| 6.50%, due 6/1/45 | 2,200,000 | 2,346,048 |
| Philadelphia Authority for Industrial Development, New Foundation Charter School Project, Revenue Bonds | | |
| 6.625%, due 12/15/41 | 1,000,000 | 1,102,955 |
| Philadelphia Authority for Industrial Development, First Philadelphia Preparatory Charter School, Revenue Bonds | | |
| Series A | | |
| 7.25%, due 6/15/43 | 4,500,000 | 5,175,769 |
| Philadelphia Authority for Industrial Development, Tacony Academy Charter School, Revenue Bonds | | |
| 7.375%, due 6/15/43 | 1,500,000 | 1,668,336 |
| Philadelphia Authority for Industrial Development, Esperanza Academy Charter School Project, Revenue Bonds | | |
| 8.20%, due 12/1/43 | 1,800,000 | 2,033,103 |
| Scranton Redevelopment Authority, Revenue Bonds | | |
| Series A, Insured: MUN GOVT GTD | | |
| 5.00%, due 11/15/28 | 9,000,000 | 9,233,673 |
The notes to the financial statements are an integral part of, and should be read in conjunction with, the financial statements.
47
Portfolio of Investments April 30, 2021† (Unaudited) (continued)
| | Principal
Amount | Value |
| Long-Term Municipal Bonds (continued) |
| Pennsylvania (continued) |
| Scranton-Lackawanna Health and Welfare Authority, Marywood University Project, Revenue Bonds | | |
| 5.00%, due 6/1/36 | $ 1,000,000 | $ 1,076,878 |
| 5.00%, due 6/1/46 | 2,625,000 | 2,782,753 |
| Susquehanna Area Regional Airport Authority, Revenue Bonds | | |
| Series B, Insured: BAM | | |
| 4.00%, due 1/1/33 | 3,000,000 | 3,068,243 |
| | | 377,154,804 |
| Puerto Rico 12.1% |
| Children's Trust Fund, Asset-Backed, Revenue Bonds | | |
| Series A | | |
| (zero coupon), due 5/15/50 | 46,000,000 | 7,189,170 |
| 5.375%, due 5/15/33 | 2,650,000 | 2,666,649 |
| 5.50%, due 5/15/39 | 1,475,000 | 1,511,423 |
| 5.625%, due 5/15/43 | 37,890,000 | 38,090,101 |
| Commonwealth of Puerto Rico, Public Improvement, Unlimited General Obligation | | |
| Insured: AMBAC | | |
| 4.50%, due 7/1/23 | 605,000 | 605,914 |
| Series A | | |
| 4.75%, due 7/1/18 (f)(g) | 750,000 | 650,625 |
| Series A | | |
| 4.75%, due 7/1/30 (f)(g) | 1,109,000 | 917,698 |
| Series A | | |
| 4.75%, due 7/1/31 (f)(g) | 1,767,000 | 1,453,357 |
| Series A | | |
| 5.00%, due 7/1/19 (f)(g) | 5,000,000 | 4,350,000 |
| Series A | | |
| 5.00%, due 7/1/20 (f)(g) | 3,000,000 | 2,610,000 |
| Series A | | |
| 5.00%, due 7/1/22 (f)(g) | 2,570,000 | 2,168,437 |
| Series A, Insured: AGC | | |
| 5.00%, due 7/1/25 | 250,000 | 256,972 |
| Series A | | |
| 5.00%, due 7/1/25 (f)(g) | 3,070,000 | 2,713,112 |
| Series A | | |
| 5.00%, due 7/1/27 (f)(g) | 410,000 | 362,338 |
| Series A-4, Insured: AGM | | |
| 5.00%, due 7/1/31 | 5,000,000 | 5,139,444 |
| Series A, Insured: AGM | | |
| 5.00%, due 7/1/35 | 550,000 | 572,194 |
| | Principal
Amount | Value |
| |
| Puerto Rico (continued) |
| Commonwealth of Puerto Rico, Public Improvement, Unlimited General Obligation (continued) | | |
| Series A | | |
| 5.125%, due 7/1/31 (f)(g) | $ 1,880,000 | $ 1,656,750 |
| Series A | | |
| 5.125%, due 7/1/37 (f)(g) | 4,796,000 | 3,980,680 |
| Series A | | |
| 5.25%, due 7/1/20 (f)(g) | 1,520,000 | 1,330,000 |
| Series A | | |
| 5.25%, due 7/1/23 (f)(g) | 4,590,000 | 3,872,812 |
| Series A | | |
| 5.25%, due 7/1/24 (f)(g) | 7,435,000 | 6,589,269 |
| Series A | | |
| 5.25%, due 7/1/26 (f)(g) | 4,780,000 | 4,218,350 |
| Series A | | |
| 5.25%, due 7/1/26 (f)(g) | 1,520,000 | 1,347,100 |
| Series A-4, Insured: AGM | | |
| 5.25%, due 7/1/30 | 7,080,000 | 7,285,668 |
| Series A | | |
| 5.50%, due 7/1/26 (f)(g) | 2,490,000 | 2,107,162 |
| Series A | | |
| 5.50%, due 7/1/26 (f)(g) | 1,960,000 | 1,658,650 |
| Series A | | |
| 5.50%, due 7/1/32 (f)(g) | 2,620,000 | 2,302,325 |
| Series A | | |
| 5.50%, due 7/1/39 (f)(g) | 23,300,000 | 19,770,050 |
| Series E | | |
| 5.625%, due 7/1/32 (f)(g) | 2,145,000 | 1,879,556 |
| Series B | | |
| 5.75%, due 7/1/38 (f)(g) | 2,090,000 | 1,813,075 |
| Series A | | |
| 6.00%, due 7/1/28 (f)(g) | 900,000 | 797,625 |
| Series B | | |
| 6.00%, due 7/1/39 (f)(g) | 7,250,000 | 6,488,750 |
| Series C | | |
| 6.00%, due 7/1/39 (f)(g) | 14,245,000 | 12,464,375 |
| Series B | | |
| 6.50%, due 7/1/37 (f)(g) | 5,630,000 | 5,074,037 |
| Series C | | |
| 6.50%, due 7/1/40 (f)(g) | 1,150,000 | 989,000 |
| Commonwealth of Puerto Rico, Unlimited General Obligation | | |
| Series A | | |
| 5.00%, due 7/1/24 (f)(g) | 1,240,000 | 1,095,850 |
| Series A | | |
| 5.00%, due 7/1/28 (f)(g) | 770,000 | 680,488 |
The notes to the financial statements are an integral part of, and should be read in conjunction with, the financial statements.
| 48 | MainStay MacKay High Yield Municipal Bond Fund |
| | Principal
Amount | Value |
| Long-Term Municipal Bonds (continued) |
| Puerto Rico (continued) |
Commonwealth of Puerto Rico, Unlimited General Obligation
(continued) | | |
| Series A | | |
| 5.25%, due 7/1/29 (f)(g) | $ 2,650,000 | $ 2,348,562 |
| Series A | | |
| 5.25%, due 7/1/33 (f)(g) | 2,070,000 | 1,834,537 |
| Series A | | |
| 5.25%, due 7/1/37 (f)(g) | 3,895,000 | 3,451,944 |
| Series A | | |
| 5.375%, due 7/1/33 (f)(g) | 1,450,000 | 1,274,187 |
| 5.50%, due 7/1/18 (f)(g) | 6,045,000 | 5,319,600 |
| Series A, Insured: NATL-RE | | |
| 5.50%, due 7/1/21 | 1,205,000 | 1,210,276 |
| Series A | | |
| 6.00%, due 7/1/38 (f)(g) | 13,245,000 | 11,854,275 |
| Commonwealth of Puerto Rico, Unrefunded, Unlimited General Obligation | | |
| Series A | | |
| 5.00%, due 7/1/33 (f)(g) | 2,504,000 | 2,209,780 |
| GDB Debt Recovery Authority of Puerto Rico, Revenue Bonds | | |
| 7.50%, due 8/20/40 | 188,273,015 | 161,444,110 |
| Puerto Rico Commonwealth Aqueduct & Sewer Authority, Revenue Bonds, Senior Lien | | |
| Series 2020A | | |
| 4.00%, due 7/1/21 (a) | 33,280,000 | 33,532,928 |
| Series A | | |
| 5.00%, due 7/1/21 | 2,080,000 | 2,098,553 |
| Series A | | |
| 5.00%, due 7/1/22 | 4,705,000 | 4,965,620 |
| Series 2020A | | |
| 5.00%, due 7/1/25 (a) | 10,000,000 | 11,251,200 |
| Series 2020A | | |
| 5.00%, due 7/1/30 (a) | 26,000,000 | 31,499,780 |
| Series A | | |
| 5.00%, due 7/1/33 | 21,200,000 | 22,374,313 |
| Series 2020A | | |
| 5.00%, due 7/1/35 (a) | 38,000,000 | 45,176,680 |
| Series 2020A | | |
| 5.00%, due 7/1/47 (a) | 33,000,000 | 38,646,300 |
| Series A | | |
| 5.125%, due 7/1/37 | 2,625,000 | 2,774,303 |
| Series A | | |
| 5.25%, due 7/1/42 | 49,690,000 | 52,589,908 |
| | Principal
Amount | Value |
| |
| Puerto Rico (continued) |
Puerto Rico Commonwealth Aqueduct & Sewer Authority, Revenue Bonds, Senior Lien
(continued) | | |
| Series B | | |
| 5.35%, due 7/1/27 | $ 7,625,000 | $ 7,644,062 |
| Series A | | |
| 5.50%, due 7/1/28 | 13,510,000 | 14,338,607 |
| Series A | | |
| 6.00%, due 7/1/47 | 15,310,000 | 16,339,579 |
| Puerto Rico Convention Center District Authority, Hotel Occupancy Tax, Revenue Bonds | | |
| Series A, Insured: AGC | | |
| 4.50%, due 7/1/36 | 6,240,000 | 6,357,558 |
| Series A, Insured: AMBAC | | |
| 5.00%, due 7/1/31 | 7,765,000 | 7,952,076 |
| Puerto Rico Electric Power Authority, Revenue Bonds | | |
| Series DDD-RSA-1 | | |
| 3.30%, due 7/1/19 (f)(g) | 1,015,000 | 897,006 |
| Series ZZ-RSA-1 | | |
| 4.25%, due 7/1/20 (f)(g) | 1,355,000 | 1,231,356 |
| Series CCC | | |
| 4.25%, due 7/1/23 (f)(g) | 1,150,000 | 1,062,313 |
| Series CCC-RSA-1 | | |
| 4.375%, due 7/1/22 (f)(g) | 115,000 | 106,231 |
| Series CCC-RSA-1 | | |
| 4.60%, due 7/1/24 (f)(g) | 200,000 | 184,750 |
| Series CCC-RSA-1 | | |
| 4.625%, due 7/1/25 (f)(g) | 1,085,000 | 1,002,269 |
| Series XX-RSA-1 | | |
| 4.75%, due 7/1/26 (f)(g) | 320,000 | 295,600 |
| Series ZZ-RSA-1 | | |
| 4.75%, due 7/1/27 (f)(g) | 405,000 | 374,119 |
| Series A-RSA-1 | | |
| 4.80%, due 7/1/29 (f)(g) | 690,000 | 637,388 |
| Series TT-RSA-1 | | |
| 5.00%, due 7/1/20 (f)(g) | 2,195,000 | 2,019,400 |
| Series DDD-RSA-1 | | |
| 5.00%, due 7/1/20 (f)(g) | 3,250,000 | 2,990,000 |
| Series TT-RSA-1 | | |
| 5.00%, due 7/1/21 (f)(g) | 1,215,000 | 1,126,913 |
| Series CCC | | |
| 5.00%, due 7/1/21 (f)(g) | 470,000 | 435,925 |
| Series DDD-RSA-1 | | |
| 5.00%, due 7/1/21 (f)(g) | 275,000 | 255,063 |
The notes to the financial statements are an integral part of, and should be read in conjunction with, the financial statements.
49
Portfolio of Investments April 30, 2021† (Unaudited) (continued)
| | Principal
Amount | Value |
| Long-Term Municipal Bonds (continued) |
| Puerto Rico (continued) |
Puerto Rico Electric Power Authority, Revenue Bonds
(continued) | | |
| Series PP, Insured: NATL-RE | | |
| 5.00%, due 7/1/22 | $ 200,000 | $ 202,892 |
| Series SS, Insured: NATL-RE | | |
| 5.00%, due 7/1/22 | 1,140,000 | 1,156,485 |
| Series RR, Insured: NATL-RE | | |
| 5.00%, due 7/1/23 | 4,580,000 | 4,657,259 |
| Series TT-RSA-1 | | |
| 5.00%, due 7/1/23 (f)(g) | 365,000 | 338,538 |
| Series RR, Insured: NATL-RE | | |
| 5.00%, due 7/1/24 | 115,000 | 117,494 |
| Series RR | | |
| 5.00%, due 7/1/24 (f)(g) | 295,000 | 273,613 |
| Series CCC | | |
| 5.00%, due 7/1/24 (f)(g) | 1,845,000 | 1,711,237 |
| Series SS, Insured: NATL-RE | | |
| 5.00%, due 7/1/25 | 770,000 | 790,404 |
| Series TT-RSA-1 | | |
| 5.00%, due 7/1/25 (f)(g) | 1,030,000 | 955,325 |
| Series CCC-RSA-1 | | |
| 5.00%, due 7/1/25 (f)(g) | 575,000 | 533,313 |
| Series TT-RSA-1 | | |
| 5.00%, due 7/1/26 (f)(g) | 1,050,000 | 973,875 |
| Series TT, Insured: AGM | | |
| 5.00%, due 7/1/27 | 150,000 | 154,183 |
| Series TT-RSA-1 | | |
| 5.00%, due 7/1/27 (f)(g) | 1,250,000 | 1,159,375 |
| Series WW | | |
| 5.00%, due 7/1/28 (f)(g) | 380,000 | 352,450 |
| Series TT-RSA-1 | | |
| 5.00%, due 7/1/32 (f)(g) | 9,570,000 | 8,876,175 |
| Series TT-RSA-1 | | |
| 5.00%, due 7/1/37 (f)(g) | 1,620,000 | 1,502,550 |
| Series A-RSA-1 | | |
| 5.00%, due 7/1/42 (f)(g) | 9,005,000 | 8,352,137 |
| Series A-RSA-1 | | |
| 5.05%, due 7/1/42 (f)(g) | 825,000 | 765,188 |
| Series ZZ-RSA-1 | | |
| 5.25%, due 7/1/20 (f)(g) | 225,000 | 207,563 |
| Series ZZ-RSA-1 | | |
| 5.25%, due 7/1/23 (f)(g) | 620,000 | 576,600 |
| Series AAA-RSA-1 | | |
| 5.25%, due 7/1/24 (f)(g) | 3,000,000 | 2,790,000 |
| Series WW | | |
| 5.25%, due 7/1/25 (f)(g) | 1,605,000 | 1,492,650 |
| | Principal
Amount | Value |
| |
| Puerto Rico (continued) |
Puerto Rico Electric Power Authority, Revenue Bonds
(continued) | | |
| Series ZZ-RSA-1 | | |
| 5.25%, due 7/1/26 (f)(g) | $ 3,520,000 | $ 3,273,600 |
| Series AAA-RSA-1 | | |
| 5.25%, due 7/1/26 (f)(g) | 110,000 | 102,300 |
| Series VV, Insured: NATL-RE | | |
| 5.25%, due 7/1/29 | 630,000 | 703,264 |
| Series VV, Insured: NATL-RE | | |
| 5.25%, due 7/1/30 | 3,850,000 | 4,303,600 |
| Series AAA-RSA-1 | | |
| 5.25%, due 7/1/30 (f)(g) | 985,000 | 916,050 |
| Series VV, Insured: NATL-RE | | |
| 5.25%, due 7/1/32 | 345,000 | 386,132 |
| Series WW | | |
| 5.25%, due 7/1/33 (f)(g) | 5,060,000 | 4,705,800 |
| Series XX-RSA-1 | | |
| 5.25%, due 7/1/35 (f)(g) | 2,265,000 | 2,106,450 |
| Series XX-RSA-1 | | |
| 5.25%, due 7/1/40 (f)(g) | 18,655,000 | 17,349,150 |
| Series BBB | | |
| 5.40%, due 7/1/28 (f)(g) | 4,245,000 | 3,735,600 |
| Series BBB | | |
| 5.40%, due 7/1/28 (f)(g) | 5,620,000 | 4,755,925 |
| Series WW | | |
| 5.50%, due 7/1/21 (f)(g) | 2,120,000 | 1,976,900 |
| Series WW | | |
| 5.50%, due 7/1/38 (f)(g) | 11,895,000 | 11,092,087 |
| Series XX | | |
| 5.75%, due 7/1/36 (f)(g) | 4,055,000 | 3,791,425 |
| Series 2013A-RSA-1 | | |
| 6.75%, due 7/1/36 (f)(g) | 11,850,000 | 11,272,312 |
| Series 2013A-RSA-1 | | |
| 7.00%, due 7/1/33 (f)(g) | 1,500,000 | 1,430,625 |
| Series 2013A-RSA-1 | | |
| 7.00%, due 7/1/40 (f)(g) | 140,000 | 133,525 |
| Series 2013A-RSA-1 | | |
| 7.00%, due 7/1/43 (f)(g) | 5,000,000 | 4,768,750 |
| Puerto Rico Electric Power Authority, Build America Bonds, Revenue Bonds (f)(g) | | |
| Series EEE-RSA-1 | | |
| 5.95%, due 7/1/30 | 16,310,000 | 14,923,650 |
| Series EEE | | |
| 5.95%, due 7/1/30 | 10,225,000 | 8,908,531 |
| Series EEE-RSA-1 | | |
| 6.05%, due 7/1/32 | 11,340,000 | 10,376,100 |
The notes to the financial statements are an integral part of, and should be read in conjunction with, the financial statements.
| 50 | MainStay MacKay High Yield Municipal Bond Fund |
| | Principal
Amount | Value |
| Long-Term Municipal Bonds (continued) |
| Puerto Rico (continued) |
| Puerto Rico Electric Power Authority, Build America Bonds, Revenue Bonds (f)(g) (continued) | | |
| Series EEE | | |
| 6.05%, due 7/1/32 | $ 1,225,000 | $ 1,068,813 |
| Series YY | | |
| 6.125%, due 7/1/40 | 21,475,000 | 19,649,625 |
| Series YY | | |
| 6.125%, due 7/1/40 | 25,075,000 | 21,877,937 |
| Series EEE | | |
| 6.25%, due 7/1/40 | 1,730,000 | 1,589,437 |
| Series EEE | | |
| 6.25%, due 7/1/40 | 8,685,000 | 7,566,806 |
| Puerto Rico Highway & Transportation Authority, Revenue Bonds | | |
| Insured: AMBAC | | |
| (zero coupon), due 7/1/27 | 200,000 | 156,141 |
| Series A, Insured: NATL-IBC | | |
| 4.75%, due 7/1/38 | 1,070,000 | 1,082,845 |
| Series A, Insured: AGM | | |
| 4.75%, due 7/1/38 | 650,000 | 664,961 |
| Insured: NATL-IBC | | |
| 5.00%, due 7/1/22 | 345,000 | 346,732 |
| Insured: AGC | | |
| 5.00%, due 7/1/23 | 2,870,000 | 2,950,041 |
| Insured: NATL-IBC | | |
| 5.00%, due 7/1/28 | 460,000 | 464,023 |
| Series N, Insured: AMBAC | | |
| 5.25%, due 7/1/30 | 3,680,000 | 4,046,808 |
| Series N, Insured: AMBAC | | |
| 5.25%, due 7/1/31 | 9,295,000 | 10,259,464 |
| Series N, Insured: NATL-RE | | |
| 5.25%, due 7/1/33 | 7,490,000 | 8,399,440 |
| Series L, Insured: AMBAC | | |
| 5.25%, due 7/1/38 | 1,035,000 | 1,167,227 |
| Series N, Insured: AGM-CR AGC-ICC | | |
| 5.50%, due 7/1/25 | 2,235,000 | 2,560,320 |
| Series CCC, Insured: NATL-RE | | |
| 5.50%, due 7/1/28 | 7,550,000 | 8,540,679 |
| Series CC, Insured: NATL-IBC | | |
| 5.50%, due 7/1/29 | 5,010,000 | 5,680,503 |
| | Principal
Amount | Value |
| |
| Puerto Rico (continued) |
| Puerto Rico Infrastructure Financing Authority, Revenue Bonds | | |
| Series A, Insured: COMMWLTH GTD | | |
| 8.25%, due 5/1/17 (a)(f)(g) | $ 7,100,000 | $ 6,736,125 |
| Puerto Rico Municipal Finance Agency, Revenue Bonds | | |
| Series A, Insured: AGM | | |
| 5.00%, due 8/1/27 | 2,530,000 | 2,600,559 |
| Puerto Rico Public Buildings Authority, Revenue Bonds | | |
| Series G, Insured: AGC | | |
| 4.75%, due 7/1/32 | 270,000 | 275,785 |
| Series I, Insured: AGC | | |
| 5.25%, due 7/1/33 | 680,000 | 699,753 |
| Series D, Insured: AMBAC ST GTD | | |
| 5.45%, due 7/1/31 | 305,000 | 314,550 |
| Series Q, Insured: COMMWLTH GTD | | |
| 5.625%, due 7/1/39 (f)(g) | 8,695,000 | 8,608,050 |
| Puerto Rico Public Buildings Authority, Government Facilities, Revenue Bonds | | |
| Series I, Insured: COMMWLTH GTD | | |
| 5.00%, due 7/1/36 (f)(g) | 6,070,000 | 5,781,675 |
| Series N, Insured: COMMWLTH GTD | | |
| 5.00%, due 7/1/37 (f)(g) | 10,000,000 | 9,737,500 |
| Series K, Insured: AGM ST GTD | | |
| 5.25%, due 7/1/27 | 5,970,000 | 6,143,424 |
| Series U, Insured: COMMWLTH GTD | | |
| 5.25%, due 7/1/42 (f)(g) | 23,460,000 | 21,553,875 |
| Series N, Insured: COMMWLTH GTD | | |
| 5.50%, due 7/1/22 (f)(g) | 5,000,000 | 4,950,000 |
| Series N, Insured: COMMWLTH GTD | | |
| 5.50%, due 7/1/26 (f)(g) | 3,000,000 | 2,970,000 |
| Series Q, Insured: COMMWLTH GTD | | |
| 5.50%, due 7/1/37 (f)(g) | 1,095,000 | 1,075,838 |
| Series S, Insured: COMMWLTH GTD | | |
| 5.75%, due 7/1/22 (f)(g) | 1,355,000 | 1,332,981 |
The notes to the financial statements are an integral part of, and should be read in conjunction with, the financial statements.
51
Portfolio of Investments April 30, 2021† (Unaudited) (continued)
| | Principal
Amount | Value |
| Long-Term Municipal Bonds (continued) |
| Puerto Rico (continued) |
| Puerto Rico Public Buildings Authority, Government Facilities, Revenue Bonds (continued) | | |
| Series 2011-S, Insured: COMMWLTH GTD | | |
| 5.875%, due 7/1/39 (f)(g) | $ 8,095,000 | $ 7,983,694 |
| Series S, Insured: COMMWLTH GTD | | |
| 6.00%, due 7/1/41 (f)(g) | 5,960,000 | 5,900,400 |
| Series P, Insured: COMMWLTH GTD | | |
| 6.125%, due 7/1/23 (f)(g) | 800,000 | 804,000 |
| Series M, Insured: COMMWLTH GTD | | |
| 6.25%, due 7/1/21 (f)(g) | 1,175,000 | 1,192,625 |
| Series M, Insured: COMMWLTH GTD | | |
| 6.25%, due 7/1/22 (f)(g) | 5,580,000 | 5,663,700 |
| Series M, Insured: COMMWLTH GTD | | |
| 6.25%, due 7/1/31 (f)(g) | 1,000,000 | 1,015,000 |
| Series P, Insured: COMMWLTH GTD | | |
| 6.75%, due 7/1/36 (f)(g) | 5,528,000 | 5,624,740 |
| Series P, Insured: COMMWLTH GTD | | |
| 7.00%, due 7/1/21 (f)(g) | 5,150,000 | 5,317,375 |
| Series P, Insured: COMMWLTH GTD | | |
| 7.00%, due 7/1/25 (f)(g) | 5,000,000 | 5,162,500 |
| Puerto Rico Public Buildings Authority, Unrefunded, Government Facilities, Revenue Bonds | | |
| Series I, Insured: COMMWLTH GTD | | |
| 5.25%, due 7/1/33 (f)(g) | 5,670,000 | 5,542,425 |
| Puerto Rico Sales Tax Financing Corp., Revenue Bonds | | |
| Series A-1 | | |
| (zero coupon), due 7/1/27 | 700,000 | 624,556 |
| Series A-1 | | |
| (zero coupon), due 7/1/31 | 879,000 | 687,102 |
| Series A-1 | | |
| (zero coupon), due 7/1/33 | 990,000 | 717,301 |
| (zero coupon), due 8/1/54 | 516,302 | 110,212 |
| | Principal
Amount | Value |
| |
| Puerto Rico (continued) |
Puerto Rico Sales Tax Financing Corp., Revenue Bonds
(continued) | | |
| Series A-2 | | |
| 4.329%, due 7/1/40 | $ 5,000,000 | $ 5,477,925 |
| Series A-1 | | |
| 4.50%, due 7/1/34 | 725,000 | 792,875 |
| Series A-1 | | |
| 4.75%, due 7/1/53 | 58,592,000 | 65,177,741 |
| Series A-2 | | |
| 4.784%, due 7/1/58 | 20,533,000 | 22,898,617 |
| Series A-1 | | |
| 5.00%, due 7/1/58 | 185,565,000 | 209,514,019 |
| | | 1,329,775,883 |
| Rhode Island 0.2% |
| Providence Redevelopment Agency, Port Providence Lease, Certificate of Participation | | |
| Series A, Insured: AGC | | |
| (zero coupon), due 9/1/24 | 1,735,000 | 1,655,297 |
| Series A, Insured: AGC | | |
| (zero coupon), due 9/1/26 | 685,000 | 623,176 |
| Series A, Insured: AGC | | |
| (zero coupon), due 9/1/29 | 1,835,000 | 1,515,668 |
| Series A, Insured: AGC | | |
| (zero coupon), due 9/1/30 | 1,835,000 | 1,460,764 |
| Series A, Insured: AGC | | |
| (zero coupon), due 9/1/32 | 1,500,000 | 1,113,119 |
| Series A, Insured: AGC | | |
| (zero coupon), due 9/1/34 | 1,000,000 | 690,494 |
| Series A, Insured: AGC | | |
| (zero coupon), due 9/1/35 | 360,000 | 239,680 |
| Series A, Insured: AGC | | |
| (zero coupon), due 9/1/36 | 470,000 | 300,860 |
| Rhode Island Health and Educational Building Corp., Public Schools Financing Program Issue, Revenue Bonds | | |
| Series 2007B, Insured: AMBAC | | |
| 5.00%, due 5/15/21 | 65,000 | 65,092 |
| Rhode Island Health and Educational Building Corp., Lifespan Obligated Group, Revenue Bonds | | |
| 5.00%, due 5/15/39 | 750,000 | 858,614 |
The notes to the financial statements are an integral part of, and should be read in conjunction with, the financial statements.
| 52 | MainStay MacKay High Yield Municipal Bond Fund |
| | Principal
Amount | Value |
| Long-Term Municipal Bonds (continued) |
| Rhode Island (continued) |
| Rhode Island Turnpike & Bridge Authority, Motor Fuel Tax, Revenue Bonds | | |
| Series A | | |
| 4.00%, due 10/1/44 | $ 1,500,000 | $ 1,729,736 |
| Tobacco Settlement Financing Corp., Revenue Bonds | | |
| Series A | | |
| (zero coupon), due 6/1/52 | 97,920,000 | 15,883,417 |
| | | 26,135,917 |
| South Carolina 0.8% |
| South Carolina Jobs-Economic Development Authority, Bishop Gadsden Episcopal Retirement Community, Revenue Bonds | | |
| Series A | | |
| 4.00%, due 4/1/54 | 1,160,000 | 1,201,360 |
| Series A | | |
| 5.00%, due 4/1/54 | 3,000,000 | 3,323,322 |
| South Carolina Jobs-Economic Development Authority, Woodlands at Furman Project, Revenue Bonds | | |
| Series A | | |
| 5.00%, due 11/15/54 | 1,000,000 | 1,081,881 |
| 5.25%, due 11/15/47 | 5,375,000 | 5,763,920 |
| 5.25%, due 11/15/52 | 1,625,000 | 1,739,778 |
| South Carolina Public Service Authority, Santee Cooper Project, Revenue Bonds | | |
| Series D | | |
| 5.00%, due 12/1/43 | 5,570,000 | 5,860,057 |
| South Carolina Public Service Authority, Revenue Bonds | | |
| Series C | | |
| 5.00%, due 12/1/46 | 5,900,000 | 6,744,238 |
| Series E | | |
| 5.00%, due 12/1/48 | 21,570,000 | 23,933,817 |
| Series A | | |
| 5.00%, due 12/1/50 | 4,660,000 | 5,380,959 |
| Series B | | |
| 5.00%, due 12/1/56 | 6,055,000 | 7,230,461 |
| Series E | | |
| 5.25%, due 12/1/55 | 13,900,000 | 16,428,035 |
| | Principal
Amount | Value |
| |
| South Carolina (continued) |
South Carolina Public Service Authority, Revenue Bonds
(continued) | | |
| Series A | | |
| 5.50%, due 12/1/54 | $ 5,100,000 | $ 5,795,418 |
| | | 84,483,246 |
| South Dakota 0.0% ‡ |
| South Dakota Health & Educational Facilities Authority, Sanford Obligated Group, Revenue Bonds | | |
| Series E | | |
| 5.00%, due 11/1/42 | 3,150,000 | 3,348,316 |
| Tennessee 0.5% |
| Chattanooga-Hamilton County Hospital Authority, Revenue Bonds | | |
| Series A | | |
| 5.00%, due 10/1/44 | 6,500,000 | 7,118,823 |
| Metropolitan Government Nashville & Davidson County Health & Educational Facilities Board, Lipscomb University Project, Revenue Bonds | | |
| Series A | | |
| 5.00%, due 10/1/45 | 11,910,000 | 13,168,519 |
| Series A | | |
| 5.25%, due 10/1/58 | 9,000,000 | 10,501,401 |
| Metropolitan Government Nashville & Davidson County Health & Educational Facilities Board, Revenue Bonds | | |
| 5.00%, due 10/1/48 | 1,000,000 | 1,144,437 |
| Metropolitan Nashville Airport Authority (The), Revenue Bonds | | |
| Series B | | |
| 5.00%, due 7/1/54 (b) | 19,050,000 | 23,341,039 |
| | | 55,274,219 |
| Texas 4.1% |
| Bexar County Health Facilities Development Corp., Army Retirement Residence Foundation Project, Revenue Bonds | | |
| 5.00%, due 7/15/41 | 3,300,000 | 3,515,428 |
The notes to the financial statements are an integral part of, and should be read in conjunction with, the financial statements.
53
Portfolio of Investments April 30, 2021† (Unaudited) (continued)
| | Principal
Amount | Value |
| Long-Term Municipal Bonds (continued) |
| Texas (continued) |
| Central Texas Regional Mobility Authority, Manor Expressway Project, Revenue Bonds, Senior Lien | | |
| (zero coupon), due 1/1/23 | $ 1,000,000 | $ 983,594 |
| Central Texas Regional Mobility Authority, Capital Appreciation, Revenue Bonds | | |
| (zero coupon), due 1/1/33 | 315,000 | 244,980 |
| (zero coupon), due 1/1/34 | 3,275,000 | 2,471,878 |
| (zero coupon), due 1/1/35 | 3,700,000 | 2,711,977 |
| (zero coupon), due 1/1/36 | 2,000,000 | 1,421,300 |
| (zero coupon), due 1/1/39 | 3,500,000 | 2,253,114 |
| Central Texas Regional Mobility Authority, Revenue Bonds | | |
| 4.00%, due 1/1/41 | 6,250,000 | 6,873,266 |
| Central Texas Regional Mobility Authority, Revenue Bonds, Sub. Lien | | |
| 5.00%, due 1/1/33 | 1,225,000 | 1,324,432 |
| 5.00%, due 1/1/42 | 2,340,000 | 2,529,936 |
| Central Texas Regional Mobility Authority, Revenue Bonds, Senior Lien | | |
| 5.00%, due 1/1/46 | 12,215,000 | 14,179,585 |
| Central Texas Turnpike System, Revenue Bonds | | |
| Series C | | |
| 5.00%, due 8/15/42 | 12,000,000 | 13,360,974 |
| City of Houston TX, Airport System, United Airlines Inc. Project, Revenue Bonds (b) | | |
| 5.00%, due 7/1/29 | 11,400,000 | 12,466,524 |
| Series B-1 | | |
| 5.00%, due 7/15/30 | 2,000,000 | 2,236,776 |
| City of Lago Vista TX, Tessera on Lake Travis Public Improvement District Project, Special Assessment | | |
| Series B | | |
| 4.875%, due 9/1/50 (a) | 1,250,000 | 1,326,867 |
| Clifton Higher Education Finance Corp., Uplift Education, Revenue Bonds | | |
| Series A | | |
| 5.00%, due 12/1/45 | 2,500,000 | 2,749,004 |
| | Principal
Amount | Value |
| |
| Texas (continued) |
| Clifton Higher Education Finance Corp., IDEA Public Schools, Revenue Bonds | | |
| 5.75%, due 8/15/41 | $ 1,750,000 | $ 1,777,322 |
| 6.00%, due 8/15/43 | 3,500,000 | 3,820,661 |
| Danbury Higher Education Authority, Inc., Golden Rule School, Inc., Revenue Bonds | | |
| Series A | | |
| 4.00%, due 8/15/49 | 4,000,000 | 4,059,344 |
| Decatur Hospital Authority, Wise Regional Health System, Revenue Bonds | | |
| Series A | | |
| 5.25%, due 9/1/44 | 3,250,000 | 3,624,926 |
| Grand Parkway Transportation Corp., Revenue Bonds | | |
| Series C | | |
| 4.00%, due 10/1/49 | 75,140,000 | 87,402,638 |
| Series A | | |
| 5.50%, due 4/1/53 | 600,000 | 676,827 |
| Harris County Cultural Education Facilities Finance Corp., YMCA Greater Houston Area, Revenue Bonds | | |
| Series A | | |
| 5.00%, due 6/1/33 | 900,000 | 931,335 |
| Series A | | |
| 5.00%, due 6/1/38 | 1,960,000 | 2,017,108 |
| Harris County Cultural Education Facilities Finance Corp., Brazos Presbyterian Homes, Revenue Bonds | | |
| Series B | | |
| 7.00%, due 1/1/43 | 1,500,000 | 1,663,192 |
| Harris County-Houston Sports Authority, Revenue Bonds, Junior Lien | | |
| Series H, Insured: NATL-RE | | |
| (zero coupon), due 11/15/24 | 175,000 | 171,579 |
| Series H, Insured: NATL-RE | | |
| (zero coupon), due 11/15/24 | 795,000 | 742,487 |
| Series H, Insured: NATL-RE | | |
| (zero coupon), due 11/15/26 | 65,000 | 61,987 |
| Series H, Insured: NATL-RE | | |
| (zero coupon), due 11/15/26 | 535,000 | 471,174 |
The notes to the financial statements are an integral part of, and should be read in conjunction with, the financial statements.
| 54 | MainStay MacKay High Yield Municipal Bond Fund |
| | Principal
Amount | Value |
| Long-Term Municipal Bonds (continued) |
| Texas (continued) |
| Harris County-Houston Sports Authority, Revenue Bonds, Junior Lien (continued) | | |
| Series H, Insured: NATL-RE | | |
| (zero coupon), due 11/15/29 | $ 10,000 | $ 8,953 |
| Series H, Insured: NATL-RE | | |
| (zero coupon), due 11/15/29 | 725,000 | 570,254 |
| Series H, Insured: NATL-RE | | |
| (zero coupon), due 11/15/32 | 250,000 | 169,503 |
| Series H, Insured: NATL-RE | | |
| (zero coupon), due 11/15/33 | 185,000 | 117,610 |
| Series H, Insured: NATL-RE | | |
| (zero coupon), due 11/15/38 | 1,395,000 | 641,801 |
| Series H, Insured: NATL-RE | | |
| (zero coupon), due 11/15/39 | 1,525,000 | 657,066 |
| Series H, Insured: NATL-RE | | |
| (zero coupon), due 11/15/40 | 1,855,000 | 748,283 |
| Series H, Insured: NATL-RE | | |
| (zero coupon), due 11/15/41 | 700,000 | 264,719 |
| Harris County-Houston Sports Authority, Revenue Bonds, Third Lien | | |
| Series A-3, Insured: NATL-RE | | |
| (zero coupon), due 11/15/32 | 1,670,000 | 953,070 |
| Series A-3, Insured: NATL-RE | | |
| (zero coupon), due 11/15/33 | 890,000 | 478,220 |
| Series A, Insured: NATL-RE | | |
| (zero coupon), due 11/15/34 | 220,000 | 120,125 |
| Series A, Insured: NATL-RE | | |
| (zero coupon), due 11/15/34 | 2,320,000 | 1,173,468 |
| Harris County-Houston Sports Authority, Revenue Bonds, Senior Lien | | |
| Series A, Insured: AGM NATL-RE | | |
| (zero coupon), due 11/15/34 | 2,035,000 | 1,216,926 |
| Series A, Insured: AGM NATL-RE | | |
| (zero coupon), due 11/15/38 | 36,815,000 | 16,961,731 |
| Series A, Insured: AGM NATL-RE | | |
| (zero coupon), due 11/15/40 | 1,060,000 | 429,034 |
| Hemphill County Hospital District, Limited General Obligation | | |
| 4.625%, due 2/1/39 | 2,765,000 | 2,995,124 |
| Montgomery County Toll Road Authority, Revenue Bonds, Senior Lien | | |
| 5.00%, due 9/15/48 | 2,500,000 | 2,791,390 |
| | Principal
Amount | Value |
| |
| Texas (continued) |
| New Hope Cultural Education Facilities Finance Corp., CHF-Collegiate Housing Denton LLC, Revenue Bonds | | |
| Series B-1, Insured: AGM | | |
| 4.00%, due 7/1/48 | $ 1,000,000 | $ 1,103,058 |
| New Hope Cultural Education Facilities Finance Corp., Jubilee Academic Center, Inc., Revenue Bonds (a) | | |
| Series A | | |
| 5.00%, due 8/15/36 | 5,000,000 | 5,027,363 |
| Series A | | |
| 5.125%, due 8/15/47 | 2,085,000 | 2,095,009 |
| New Hope Cultural Education Facilities Finance Corp., Cumberland Academy, Inc., Revenue Bonds | | |
| Series A | | |
| 5.00%, due 8/15/40 (a) | 5,000,000 | 5,361,263 |
| New Hope Cultural Education Facilities Finance Corp., CHF - Collegiate Housing Stephenville II, LLC - Tarleton State University Project, Revenue Bonds | | |
| Series A | | |
| 5.00%, due 4/1/46 | 3,000,000 | 3,379,060 |
| New Hope Cultural Education Facilities Finance Corp., Southwest Preparatory School, Revenue Bonds | | |
| Series A | | |
| 5.00%, due 8/15/50 (a) | 4,180,000 | 4,616,533 |
| New Hope Cultural Education Facilities Finance Corp., Quality Senior Housing Foundation of East Texas, Inc., Revenue Bonds | | |
| Series A-1 | | |
| 5.00%, due 12/1/54 | 2,770,000 | 3,009,124 |
| New Hope Cultural Education Facilities Finance Corp., Wesleyan Homes, Inc., Project, Revenue Bonds | | |
| 5.00%, due 1/1/55 | 1,500,000 | 1,546,083 |
The notes to the financial statements are an integral part of, and should be read in conjunction with, the financial statements.
55
Portfolio of Investments April 30, 2021† (Unaudited) (continued)
| | Principal
Amount | Value |
| Long-Term Municipal Bonds (continued) |
| Texas (continued) |
| New Hope Cultural Education Facilities Finance Corp., Legacy at Midtown Park Project, Revenue Bonds | | |
| Series A | | |
| 5.50%, due 7/1/54 | $ 1,500,000 | $ 1,574,868 |
| New Hope Cultural Education Facilities Finance Corp., CHF-Stephenville LLC, Revenue Bonds | | |
| Series A | | |
| 6.00%, due 4/1/45 | 3,550,000 | 3,937,636 |
| North East Texas Regional Mobility Authority, Revenue Bonds, Senior Lien | | |
| Series B | | |
| 5.00%, due 1/1/41 | 6,000,000 | 6,819,443 |
| Series B | | |
| 5.00%, due 1/1/46 | 3,535,000 | 3,991,039 |
| North Texas Tollway Authority, North Texas Tollway System, Revenue Bonds, Second Tier | | |
| 5.00%, due 1/1/50 | 1,750,000 | 2,084,717 |
| Port Beaumont Navigation District, Jefferson Gulf Coast Energy Project, Revenue Bonds (a)(b) | | |
| Series A | | |
| 3.625%, due 1/1/35 | 3,635,000 | 3,765,420 |
| Series A | | |
| 4.00%, due 1/1/50 | 12,000,000 | 12,437,524 |
| Port Freeport, Revenue Bonds, Senior Lien (b) | | |
| Series A | | |
| 4.00%, due 6/1/38 | 1,650,000 | 1,856,971 |
| Series A | | |
| 4.00%, due 6/1/39 | 1,620,000 | 1,818,876 |
| Port of Port Arthur Navigation District, Port Improvement, Unlimited General Obligation | | |
| 4.00%, due 3/1/47 | 4,450,000 | 4,884,296 |
| Red River Education Finance Corp., Houston Baptist University Project, Revenue Bonds | | |
| 5.50%, due 10/1/46 | 6,250,000 | 7,268,565 |
| | Principal
Amount | Value |
| |
| Texas (continued) |
| Tarrant County Cultural Education Facilities Finance Corp., Barton Creek Senior Living Center Project, Revenue Bonds | | |
| 5.00%, due 11/15/40 | $ 1,500,000 | $ 1,630,827 |
| Tarrant County Cultural Education Facilities Finance Corp., Buckner Retirement Services, Revenue Bonds | | |
| Series B | | |
| 5.00%, due 11/15/40 | 1,250,000 | 1,440,733 |
| Tarrant County Cultural Education Facilities Finance Corp., Buckner Retirement Services, Inc. Project, Revenue Bonds | | |
| 5.00%, due 11/15/46 | 3,000,000 | 3,502,169 |
| Texas Private Activity Bond Surface Transportation Corp., North Tarrant Express Managed Lanes Project, Revenue Bonds, Senior Lien | | |
| Series A | | |
| 4.00%, due 12/31/38 | 6,135,000 | 7,116,536 |
| Series A | | |
| 4.00%, due 12/31/39 | 5,000,000 | 5,787,647 |
| Texas Private Activity Bond Surface Transportation Corp., Blueridge Transportation Group LLC, Revenue Bonds, Senior Lien (b) | | |
| 5.00%, due 12/31/50 | 5,235,000 | 5,898,443 |
| 5.00%, due 12/31/55 | 10,390,000 | 11,686,950 |
| Texas Private Activity Bond Surface Transportation Corp., NTE Mobility Partners Segments 3 LLC, Revenue Bonds, Senior Lien (b) | | |
| 5.00%, due 6/30/58 | 79,130,000 | 95,259,107 |
| 6.75%, due 6/30/43 | 11,700,000 | 13,279,844 |
| Texas Transportation Commission, Revenue Bonds, First Tier | | |
| (zero coupon), due 8/1/43 | 3,750,000 | 1,524,244 |
| (zero coupon), due 8/1/44 | 4,200,000 | 1,611,947 |
| (zero coupon), due 8/1/46 | 1,000,000 | 345,095 |
| (zero coupon), due 8/1/47 | 2,000,000 | 654,941 |
| (zero coupon), due 8/1/48 | 1,000,000 | 310,923 |
| (zero coupon), due 8/1/50 | 1,500,000 | 417,071 |
The notes to the financial statements are an integral part of, and should be read in conjunction with, the financial statements.
| 56 | MainStay MacKay High Yield Municipal Bond Fund |
| | Principal
Amount | Value |
| Long-Term Municipal Bonds (continued) |
| Texas (continued) |
| Texas Transportation Commission, State Highway 249, Revenue Bonds, First Tier | | |
| Series A | | |
| 5.00%, due 8/1/57 | $ 10,000,000 | $ 11,687,298 |
| | | 447,098,115 |
| U.S. Virgin Islands 1.0% |
| Virgin Islands Public Finance Authority, Matching Fund Loan, Revenue Bonds | | |
| Series A | | |
| 4.00%, due 10/1/22 | 855,000 | 846,219 |
| Series A | | |
| 6.00%, due 10/1/39 | 780,000 | 781,786 |
| Series A | | |
| 6.625%, due 10/1/29 | 3,530,000 | 3,558,755 |
| Series A | | |
| 6.75%, due 10/1/37 | 15,340,000 | 15,464,958 |
| Virgin Islands Public Finance Authority, Matching Fund Loan, Revenue Bonds, Senior Lien | | |
| Series 2009A-1 | | |
| 4.50%, due 10/1/24 | 890,000 | 880,011 |
| Series A-1 | | |
| 5.00%, due 10/1/24 | 590,000 | 591,384 |
| Series 2009A-1 | | |
| 5.00%, due 10/1/39 | 1,000,000 | 1,002,346 |
| Virgin Islands Public Finance Authority, Matching Fund Loan, Revenue Bonds, Sub. Lien | | |
| Series C | | |
| 5.00%, due 10/1/22 | 5,815,000 | 5,794,451 |
| Virgin Islands Public Finance Authority, Matching Fund Loan Note, Revenue Bonds, Senior Lien | | |
| Series B | | |
| 5.00%, due 10/1/25 | 14,425,000 | 14,458,835 |
| Series A | | |
| 5.00%, due 10/1/29 | 11,175,000 | 11,201,212 |
| Virgin Islands Public Finance Authority, Matching Fund Loan Note, Revenue Bonds, Sub. Lien | | |
| Series B | | |
| 5.00%, due 10/1/25 | 4,825,000 | 4,753,090 |
| | Principal
Amount | Value |
| |
| U.S. Virgin Islands (continued) |
Virgin Islands Public Finance Authority, Matching Fund Loan Note, Revenue Bonds, Sub. Lien
(continued) | | |
| Series B | | |
| 5.25%, due 10/1/29 | $ 6,410,000 | $ 6,310,439 |
| Virgin Islands Public Finance Authority, Gross Receipts Taxes Loan, Revenue Bonds | | |
| Series C | | |
| 5.00%, due 10/1/30 | 17,270,000 | 16,502,423 |
| Series A | | |
| 5.00%, due 10/1/32 | 15,600,000 | 14,782,770 |
| Series A | | |
| 5.00%, due 10/1/34 | 2,600,000 | 2,440,418 |
| Series C | | |
| 5.00%, due 10/1/39 | 9,910,000 | 9,176,544 |
| Virgin Islands Water & Power Authority, Revenue Bonds | | |
| Series A | | |
| 4.00%, due 7/1/21 | 430,000 | 429,039 |
| | | 108,974,680 |
| Utah 0.5% |
| Medical School Campus Public Infrastructure District, Limited General Obligation (a) | | |
| Series A | | |
| 5.25%, due 2/1/40 | 1,430,000 | 1,479,909 |
| Series A | | |
| 5.50%, due 2/1/50 | 2,915,000 | 3,018,368 |
| Mida Mountain Village Public Infrastructure District, Assessment Area No. 2 | | |
| 4.00%, due 8/1/50 (a) | 2,000,000 | 2,062,104 |
| Mida Mountain Village Public Infrastructure District, Special Assessment | | |
| Series A | | |
| 4.50%, due 8/1/40 | 1,500,000 | 1,684,438 |
| Series A | | |
| 5.00%, due 8/1/50 | 5,250,000 | 5,903,703 |
| Utah Charter School Finance Authority, Spectrum Academy Project, Revenue Bonds | | |
| Insured: UT CSCE | | |
| 4.00%, due 4/15/45 | 2,975,000 | 3,379,653 |
The notes to the financial statements are an integral part of, and should be read in conjunction with, the financial statements.
57
Portfolio of Investments April 30, 2021† (Unaudited) (continued)
| | Principal
Amount | Value |
| Long-Term Municipal Bonds (continued) |
| Utah (continued) |
Utah Charter School Finance Authority, Spectrum Academy Project, Revenue Bonds
(continued) | | |
| Insured: UT CSCE | | |
| 4.00%, due 4/15/50 | $ 3,645,000 | $ 4,118,466 |
| Utah Charter School Finance Authority, North Star Academy Project, Revenue Bonds | | |
| Insured: UT CSCE | | |
| 4.00%, due 4/15/45 | 2,020,000 | 2,300,009 |
| Utah Charter School Finance Authority, Vista School, Revenue Bonds | | |
| Series 2020A, Insured: UT CSCE | | |
| 4.00%, due 10/15/45 | 1,870,000 | 2,144,292 |
| Series 2020A, Insured: UT CSCE | | |
| 4.00%, due 10/15/54 | 5,000,000 | 5,706,369 |
| Utah Infrastructure Agency, Revenue Bonds | | |
| 3.00%, due 10/15/45 | 4,675,000 | 4,806,327 |
| Utah Infrastructure Agency, Telecommunication, Revenue Bonds | | |
| 4.00%, due 10/15/39 | 2,175,000 | 2,503,659 |
| 4.00%, due 10/15/42 | 1,970,000 | 2,251,497 |
| Series A | | |
| 5.00%, due 10/15/32 | 1,615,000 | 1,947,055 |
| Series A | | |
| 5.00%, due 10/15/34 | 3,385,000 | 4,052,483 |
| Series A | | |
| 5.00%, due 10/15/37 | 1,100,000 | 1,311,341 |
| Series A | | |
| 5.00%, due 10/15/40 | 4,130,000 | 4,897,038 |
| Series A | | |
| 5.375%, due 10/15/40 | 6,260,000 | 7,606,659 |
| | | 61,173,370 |
| Vermont 0.0% ‡ |
| Vermont Educational & Health Buildings Financing Agency, Developmental & Mental Health Services, Revenue Bonds | | |
| Series A, Insured: AGC | | |
| 4.75%, due 8/15/36 | 500,000 | 510,592 |
| | Principal
Amount | Value |
| |
| Vermont (continued) ‡ |
| Vermont Student Assistance Corp., Education Loan, Revenue Bonds | | |
| Series B | | |
| 4.50%, due 6/15/45 (b) | $ 3,500,000 | $ 3,673,008 |
| | | 4,183,600 |
| Virginia 1.9% |
| Farmville Industrial Development Authority, Longwood University Student Project, Revenue Bonds | | |
| Series A | | |
| 5.00%, due 1/1/48 | 7,000,000 | 8,096,416 |
| Series A | | |
| 5.00%, due 1/1/55 | 16,000,000 | 18,422,507 |
| Farmville Industrial Development Authority, Longwood University Student Housing Project, Revenue Bonds | | |
| Series A | | |
| 5.00%, due 1/1/59 | 7,605,000 | 8,927,933 |
| Henrico County Economic Development Authority, LifeSpire of Virginia, Residential Care Facility, Revenue Bonds | | |
| Series C | | |
| 5.00%, due 12/1/47 | 2,200,000 | 2,538,730 |
| Lynchburg Economic Development Authority, Randolph College Project, Revenue Bonds | | |
| 5.00%, due 9/1/48 | 3,705,000 | 4,293,439 |
| Newport News Economic Development Authority, LifeSpire of Virginia Obligated Group, Revenue Bonds | | |
| 5.00%, due 12/1/38 | 2,575,000 | 2,902,676 |
| Norfolk Redevelopment & Housing Authority, Norfolk Retirement Community, Harbors Edge Project, Revenue Bonds | | |
| Series B | | |
| 4.00%, due 1/1/25 | 1,200,000 | 1,200,222 |
| Series A | | |
| 5.25%, due 1/1/54 | 3,300,000 | 3,509,501 |
| Roanoke Economic Development Authority, Lynchburg College, Revenue Bonds | | |
| Series A | | |
| 4.00%, due 9/1/48 | 4,890,000 | 5,178,279 |
The notes to the financial statements are an integral part of, and should be read in conjunction with, the financial statements.
| 58 | MainStay MacKay High Yield Municipal Bond Fund |
| | Principal
Amount | Value |
| Long-Term Municipal Bonds (continued) |
| Virginia (continued) |
| Salem Economic Development Authority, Educational Facilities, Roanoke College, Revenue Bonds | | |
| 4.00%, due 4/1/45 | $ 1,000,000 | $ 1,085,204 |
| 5.00%, due 4/1/49 | 1,000,000 | 1,177,207 |
| Tobacco Settlement Financing Corp., Tobacco Settlement Asset-Backed, Revenue Bonds, Senior Lien | | |
| Series B-1 | | |
| 5.00%, due 6/1/47 | 29,205,000 | 29,367,336 |
| Series B2 | | |
| 5.20%, due 6/1/46 | 2,000,000 | 2,002,565 |
| Tobacco Settlement Financing Corp., Tobacco Settlement Asset-Backed, Revenue Bonds | | |
| Series 2007A-1 | | |
| 6.706%, due 6/1/46 | 32,855,000 | 34,292,252 |
| Virginia College Building Authority, Marymount University Project, Green Bond, Revenue Bonds | | |
| Series B | | |
| 5.00%, due 7/1/45 (a) | 1,945,000 | 2,041,533 |
| Virginia Small Business Financing Authority, National Senior Campuses Inc. Obligated Group, Revenue Bonds | | |
| 4.00%, due 1/1/51 | 15,000,000 | 16,519,223 |
| Virginia Small Business Financing Authority, Express Lanes LLC, Revenue Bonds, Senior Lien | | |
| 5.00%, due 1/1/40 | 10,000,000 | 10,280,499 |
| Virginia Small Business Financing Authority, Transform 66 P3 Project, Revenue Bonds, Senior Lien (b) | | |
| 5.00%, due 12/31/52 | 12,160,000 | 14,542,692 |
| 5.00%, due 12/31/56 | 17,040,000 | 20,323,864 |
| Virginia Small Business Financing Authority, Elizabeth River Crossing, Revenue Bonds, Senior Lien | | |
| 5.50%, due 1/1/42 | 18,245,000 | 19,214,063 |
| | | 205,916,141 |
| | Principal
Amount | Value |
| |
| Washington 0.7% |
| Pend Oreille County Public Utility District No. 1 Box Canyon, Revenue Bonds | | |
| 4.00%, due 1/1/41 | $ 3,000,000 | $ 3,161,672 |
| Pend Oreille County Public Utility District No. 1 Box Canyon, Green Bond, Revenue Bonds | | |
| 5.00%, due 1/1/48 | 5,430,000 | 6,034,281 |
| Port of Seattle Industrial Development Corp., Delta Air Lines, Inc., Revenue Bonds | | |
| 5.00%, due 4/1/30 (b) | 1,825,000 | 1,953,966 |
| Washington Economic Development Finance Authority, North Pacific Paper Co. Recycling Project, Green Bond, Revenue Bonds | | |
| Series A | | |
| 5.625%, due 12/1/40 (a)(b) | 4,000,000 | 4,526,319 |
| Washington Higher Education Facilities Authority, Whitworth University Project, Revenue Bonds | | |
| Series A | | |
| 5.00%, due 10/1/40 | 3,000,000 | 3,415,931 |
| Washington Higher Education Facilities Authority, Seattle Pacific University Project, Revenue Bonds | | |
| Series A | | |
| 5.00%, due 10/1/45 | 3,800,000 | 4,582,760 |
| Washington State Convention Center Public Facilities District, Revenue Bonds | | |
| 4.00%, due 7/1/58 | 9,035,000 | 9,812,432 |
| 5.00%, due 7/1/58 | 19,020,000 | 22,362,278 |
| 5.00%, due 7/1/58 | 5,000,000 | 5,799,936 |
| Washington State Housing Finance Commission, Riverview Retirement Community, Revenue Bonds | | |
| 5.00%, due 1/1/48 | 3,000,000 | 3,086,414 |
| Whidbey Island Public Hospital District, Whidbey General Hospital, Limited General Obligation | | |
| 3.75%, due 12/1/32 | 100,000 | 100,455 |
| 4.00%, due 12/1/37 | 290,000 | 295,245 |
The notes to the financial statements are an integral part of, and should be read in conjunction with, the financial statements.
59
Portfolio of Investments April 30, 2021† (Unaudited) (continued)
| | Principal
Amount | Value |
| Long-Term Municipal Bonds (continued) |
| Washington (continued) |
| Whidbey Island Public Hospital District, Unlimited General Obligation | | |
| 5.375%, due 12/1/39 | $ 9,920,000 | $ 10,329,969 |
| 5.50%, due 12/1/33 | 2,070,000 | 2,166,552 |
| | | 77,628,210 |
| West Virginia 0.3% |
| County of Ohio, Special District Excise Tax, The Highlands Project, Revenue Bonds | | |
| Series B | | |
| 4.25%, due 3/1/35 | 4,000,000 | 4,094,579 |
| Glenville State College, Board of Governors, Revenue Bonds | | |
| 5.25%, due 6/1/47 | 4,000,000 | 4,169,211 |
| Monongalia County Commission Special District, University Town Center, Revenue Bonds | | |
| Series A | | |
| 5.50%, due 6/1/37 (a) | 4,000,000 | 4,341,506 |
| West Virginia Hospital Finance Authority, Cabell Huntington Hospital Obligated Group, Revenue Bonds | | |
| Series A | | |
| 4.00%, due 1/1/37 | 5,125,000 | 5,866,374 |
| Series A | | |
| 4.00%, due 1/1/38 | 2,500,000 | 2,854,352 |
| Series A | | |
| 4.125%, due 1/1/47 | 13,650,000 | 15,438,042 |
| | | 36,764,064 |
| Wisconsin 1.8% |
| Public Finance Authority, Wonderful Foundations Charter School, Revenue Bonds (a) | | |
| Series B | | |
| (zero coupon), due 1/1/60 | 72,000,000 | 6,795,425 |
| Series A-1 | | |
| 5.00%, due 1/1/55 | 5,795,000 | 6,468,904 |
| Public Finance Authority, North Carolina Leadership Charter Academy, Inc., Revenue Bonds | | |
| Series A | | |
| 4.00%, due 6/15/29 (a) | 325,000 | 347,522 |
| | Principal
Amount | Value |
| |
| Wisconsin (continued) |
| Public Finance Authority, National Gypsum Co., Revenue Bonds | | |
| 4.00%, due 8/1/35 (b) | $ 4,000,000 | $ 4,022,378 |
| Public Finance Authority, Fellowship Senior Living Project, Revenue Bonds | | |
| Series A | | |
| 4.00%, due 1/1/46 | 2,955,000 | 3,146,256 |
| Series A | | |
| 4.00%, due 1/1/52 | 12,085,000 | 12,810,687 |
| Public Finance Authority, WakeMed Obligated Group, Revenue Bonds | | |
| Series A | | |
| 4.00%, due 10/1/49 | 7,000,000 | 7,919,953 |
| Public Finance Authority, Appalachian State University Project, Revenue Bonds | | |
| Series A, Insured: AGM | | |
| 4.00%, due 7/1/50 | 1,000,000 | 1,118,458 |
| Series A, Insured: AGM | | |
| 4.00%, due 7/1/55 | 1,250,000 | 1,393,623 |
| Series A, Insured: AGM | | |
| 4.00%, due 7/1/59 | 1,600,000 | 1,782,907 |
| Public Finance Authority, Appalachian Regional Healthcare System Obligated Group, Revenue Bonds | | |
| 4.00%, due 7/1/56 | 2,250,000 | 2,537,756 |
| Public Finance Authority, Ultimate Medical Academy Project, Revenue Bonds (a) | | |
| Series A | | |
| 5.00%, due 10/1/22 | 2,245,000 | 2,362,462 |
| Series A | | |
| 5.00%, due 10/1/24 | 2,200,000 | 2,466,582 |
| Series A | | |
| 5.00%, due 10/1/29 | 3,000,000 | 3,716,879 |
| Series A | | |
| 5.00%, due 10/1/34 | 1,090,000 | 1,317,517 |
| Series A | | |
| 5.00%, due 10/1/39 | 17,000,000 | 20,347,023 |
| Public Finance Authority, Roseman University of Health Sciences, Revenue Bonds | | |
| 5.00%, due 4/1/30 (a) | 700,000 | 845,687 |
| 5.00%, due 4/1/40 (a) | 300,000 | 351,452 |
| 5.00%, due 4/1/50 (a) | 1,000,000 | 1,151,927 |
The notes to the financial statements are an integral part of, and should be read in conjunction with, the financial statements.
| 60 | MainStay MacKay High Yield Municipal Bond Fund |
| | Principal
Amount | Value |
| Long-Term Municipal Bonds (continued) |
| Wisconsin (continued) |
| Public Finance Authority, Roseman University of Health Sciences, Revenue Bonds (continued) | | |
| 5.50%, due 4/1/32 | $ 1,250,000 | $ 1,295,154 |
| 5.875%, due 4/1/45 | 6,650,000 | 7,522,962 |
| Public Finance Authority, Bancroft NeuroHealth Project, Revenue Bonds | | |
| Series A | | |
| 5.00%, due 6/1/36 (a) | 750,000 | 830,533 |
| Public Finance Authority, Carmelite System, Inc. Obligated Group (The), Revenue Bonds | | |
| 5.00%, due 1/1/40 | 4,335,000 | 5,163,323 |
| 5.00%, due 1/1/45 | 3,060,000 | 3,608,061 |
| Public Finance Authority, TRIPS Obligated Group, Revenue Bonds | | |
| Series B | | |
| 5.00%, due 7/1/42 (b) | 10,000,000 | 10,391,576 |
| Public Finance Authority, NC A&T Real Estate Foundation LLC Project, Revenue Bonds | | |
| Series A | | |
| 5.00%, due 6/1/44 | 1,350,000 | 1,571,771 |
| Series A | | |
| 5.00%, due 6/1/49 | 7,125,000 | 8,256,278 |
| Series B | | |
| 5.00%, due 6/1/49 | 2,720,000 | 3,151,870 |
| Public Finance Authority, Guilford College, Revenue Bonds | | |
| Series A | | |
| 5.00%, due 1/1/48 | 5,730,000 | 6,193,872 |
| 5.50%, due 1/1/47 | 6,160,000 | 6,767,024 |
| Public Finance Authority, Coral Academy of Science Las Vegas, Revenue Bonds | | |
| Series A | | |
| 5.00%, due 7/1/48 | 2,000,000 | 2,280,627 |
| Public Finance Authority, Wilson Preparatory Academy, Revenue Bonds | | |
| Series A | | |
| 5.00%, due 6/15/49 (a) | 1,100,000 | 1,178,203 |
| Public Finance Authority, Nevada State College, Revenue Bonds | | |
| 5.00%, due 5/1/55 (a) | 8,600,000 | 7,783,384 |
| | Principal
Amount | Value |
| |
| Wisconsin (continued) |
| Public Finance Authority, Wingate University, Revenue Bonds | | |
| Series A | | |
| 5.25%, due 10/1/38 | $ 3,250,000 | $ 3,836,196 |
| Public Finance Authority, CHF-Cullowhee, LLC - Western Carolina University Project, Revenue Bonds | | |
| Series A | | |
| 5.25%, due 7/1/47 | 2,000,000 | 2,186,894 |
| Public Finance Authority, Wisconsin Airport Facilities, AFCO Investors II Portfolio, Revenue Bonds | | |
| 5.75%, due 10/1/31 (a) | 1,670,000 | 1,717,736 |
| Public Finance Authority, Rose Villa Project, Revenue Bonds | | |
| Series A | | |
| 5.75%, due 11/15/44 (a) | 1,400,000 | 1,509,052 |
| Public Finance Authority, Lake Erie College Project, Revenue Bonds | | |
| Series A | | |
| 5.875%, due 10/1/54 (a) | 2,000,000 | 2,093,671 |
| Public Finance Authority, Affinity Living Group NC-12 Obligated Group, Revenue Bonds | | |
| 6.75%, due 11/1/24 (a) | 10,000,000 | 10,243,907 |
| Public Finance Authority, Irving Convention Center Hotel Project, Revenue Bonds | | |
| Series A-2 | | |
| 7.00%, due 1/1/50 (a) | 13,990,000 | 13,168,353 |
| Public Finance Authority, Glenridge on Palmer Ranch Obligated Group, Revenue Bonds | | |
| Series A | | |
| 8.25%, due 6/1/46 (a) | 1,000,000 | 1,023,528 |
| Wisconsin Health & Educational Facilities Authority, St. Camillus Health System, Inc., Revenue Bonds | | |
| Series B-3 | | |
| 2.25%, due 11/1/26 | 3,000,000 | 3,001,454 |
| Series B-2 | | |
| 2.55%, due 11/1/27 | 3,000,000 | 3,003,931 |
The notes to the financial statements are an integral part of, and should be read in conjunction with, the financial statements.
61
Portfolio of Investments April 30, 2021† (Unaudited) (continued)
| | Principal
Amount | Value |
| Long-Term Municipal Bonds (continued) |
| Wisconsin (continued) |
| Wisconsin Health & Educational Facilities Authority, Rogers Memorial Hospital Inc. Obligated Group, Revenue Bonds | | |
| Series A | | |
| 5.00%, due 7/1/49 | $ 2,400,000 | $ 2,818,312 |
| Wisconsin Health & Educational Facilities Authority, Sauk-Prairie Memorial Hospital Inc. Obligated Group, Revenue Bonds | | |
| Series A | | |
| 5.375%, due 2/1/48 | 4,400,000 | 4,504,994 |
| | | 196,006,064 |
| Wyoming 0.0% ‡ |
| West Park Hospital District, West Park Hospital Project, Revenue Bonds | | |
| Series B | | |
| 6.50%, due 6/1/27 | 500,000 | 502,356 |
| Wyoming Community Development Authority, CHF-Wyoming LLC, Revenue Bonds | | |
| 6.50%, due 7/1/43 | 930,000 | 935,861 |
| | | 1,438,217 |
Total Long-Term Municipal Bonds
(Cost $8,540,967,027) | | 9,375,641,450 |
| Short-Term Municipal Notes 9.4% |
| Alabama 0.1% |
| Hoover Industrial Development Board, United States Steel Corp., Green Bond, Revenue Bonds | | |
| 6.375%, due 11/1/50 (b)(h)(i) | 4,250,000 | 5,370,928 |
| Arkansas 0.1% |
| Tender Option Bond Trust Receipts/Certificates, Limited General Obligation | | |
| Series 2020-XF0954, Insured: State Aid Withholding | | |
| 0.10%, due 6/1/50 (a)(h)(i) | 8,000,000 | 8,000,000 |
| | Principal
Amount | Value |
| |
| California 2.1% |
| Bay Area Toll Authority, Revenue Bonds (h)(i) | | |
| Series E-1 | | |
| 0.03%, due 4/1/45 | $ 25,000,000 | $ 25,000,000 |
| Series G1 | | |
| 0.03%, due 4/1/47 | 23,330,000 | 23,330,000 |
| California Infrastructure and Economic Development Bank, Brightline West Passenger Rail Project, Revenue Bonds | | |
| Series A | | |
| 0.45%, due 1/1/50 (a)(b)(i) | 28,000,000 | 28,003,074 |
| Northern California Gas Authority No. 1, Gas Project, Revenue Bonds | | |
| Series B | | |
| 0.855%, due 7/1/27 (i)(j) | 34,335,000 | 34,546,281 |
| Nuveen California Quality Municipal Income Fund | | |
| Series A | | |
| 0.41%, due 10/1/47 (a)(i)(j) | 38,000,000 | 38,000,000 |
| Regents of the University of California Medical Center, Pooled, Revenue Bonds | | |
| Series O-2 | | |
| 0.01%, due 5/15/45 (h)(i) | 10,000,000 | 10,000,000 |
| Sacramento Transportation Authority, Revenue Bonds | | |
| Series A | | |
| 0.04%, due 10/1/38 (h)(i) | 16,100,000 | 16,100,000 |
| Tender Option Bond Trust Receipts/Certificates, Revenue Bonds (a)(h)(i) | | |
| Series 2018-XF2698 | | |
| 0.08%, due 11/1/44 | 4,800,000 | 4,800,000 |
| Series 2020-YX1155 | | |
| 0.08%, due 12/1/45 | 8,360,000 | 8,360,000 |
| Series 2017-XG0125 | | |
| 0.08%, due 8/15/47 | 20,455,000 | 20,455,000 |
| Series 2020-XF2904 | | |
| 0.08%, due 7/1/50 | 11,625,000 | 11,625,000 |
| Series 2020-XL0155 | | |
| 0.10%, due 4/1/49 | 4,255,000 | 4,255,000 |
| University of California, Revenue Bonds | | |
| Series AL-4 | | |
| 0.02%, due 5/15/48 (h)(i) | 8,625,000 | 8,625,000 |
| | | 233,099,355 |
The notes to the financial statements are an integral part of, and should be read in conjunction with, the financial statements.
| 62 | MainStay MacKay High Yield Municipal Bond Fund |
| | Principal
Amount | Value |
| Short-Term Municipal Notes (continued) |
| Florida 0.3% |
| City of Gainesville FL, Revenue Bonds | | |
| Series B | | |
| 0.03%, due 10/1/42 (h)(i) | $ 410,000 | $ 410,000 |
| Lee Memorial Health System, Lee Memorial Health System Obligated Group, Revenue Bonds | | |
| Series B | | |
| 0.16%, due 4/1/49 (h)(i) | 14,000,000 | 14,000,000 |
| Tender Option Bond Trust Receipts/Certificates, Revenue Bonds | | |
| Series 2020-XF2920 | | |
| 0.10%, due 12/1/48 (a)(h)(i) | 21,670,000 | 21,670,000 |
| | | 36,080,000 |
| Georgia 0.2% |
| Development Authority of Burke County (The), Georgia Power Company Plant Vogtle Project, Revenue Bonds | | |
| 0.06%, due 11/1/52 (i) | 16,500,000 | 16,500,000 |
| Illinois 0.5% |
| Illinois Finance Authority, Northwestern Memorial Hospital, Revenue Bonds | | |
| Series A | | |
| 0.02%, due 8/15/42 (h)(i) | 15,605,000 | 15,605,000 |
| Illinois Finance Authority, Northshore University Health System, Revenue Bonds | | |
| Series C | | |
| 0.02%, due 8/15/49 (h)(i) | 18,010,000 | 18,010,000 |
| Illinois Finance Authority, Navistar International Corp., Revenue Bonds | | |
| 4.75%, due 10/15/40 (a)(h)(i) | 21,800,000 | 23,117,324 |
| | | 56,732,324 |
| | Principal
Amount | Value |
| |
| Indiana 0.4% |
| Indiana Finance Authority, Educational Facilities-DePauw University Project, Revenue Bonds | | |
| Series A | | |
| 0.04%, due 7/1/36 (h)(i) | $ 3,000,000 | $ 3,000,000 |
| Indiana Finance Authority, Republic Services, Inc. Project, Revenue Bonds (h)(i) | | |
| Series B | | |
| 0.15%, due 5/1/28 | 9,000,000 | 9,000,068 |
| Series A | | |
| 0.20%, due 5/1/34 (b) | 5,960,000 | 5,960,044 |
| 0.20%, due 12/1/37 (b) | 25,000,000 | 25,000,185 |
| | | 42,960,297 |
| Kentucky 0.1% |
| County of Meade, Nucor Corp., Green Bond, Revenue Bonds | | |
| Series A-1 | | |
| 0.11%, due 7/1/60 (b)(i) | 8,160,000 | 8,160,000 |
| Tender Option Bond Trust Receipts, Revenue Bonds | | |
| Series 2017-XG0123 | | |
| 0.10%, due 6/1/45 (a)(h)(i) | 5,195,000 | 5,195,000 |
| | | 13,355,000 |
| Louisiana 0.1% |
| Parish of St John the Baptist, Marathon Oil Corp. Project, Revenue Bonds (h)(i) | | |
| 2.00%, due 6/1/37 | 3,000,000 | 3,065,734 |
| Series B-2 | | |
| 2.375%, due 6/1/37 | 12,500,000 | 13,091,629 |
| | | 16,157,363 |
| Massachusetts 0.1% |
| Massachusetts Development Finance Agency, Boston University, Revenue Bonds | | |
| Series U6C | | |
| 0.01%, due 10/1/42 (h)(i) | 7,000,000 | 7,000,000 |
| Mississippi 0.2% |
| County of Jackson, Chevron Corp., Revenue Bonds | | |
| 0.03%, due 6/1/23 (h)(i) | 24,655,000 | 24,655,000 |
The notes to the financial statements are an integral part of, and should be read in conjunction with, the financial statements.
63
Portfolio of Investments April 30, 2021† (Unaudited) (continued)
| | Principal
Amount | Value |
| Short-Term Municipal Notes (continued) |
| Missouri 0.3% |
| Rib Floater Trust Various States, Revenue Bonds | | |
| Series 2019-016 | | |
| 0.10%, due 6/1/45 (a)(i) | $ 31,600,000 | $ 31,600,000 |
| Nevada 0.2% |
| State of Nevada Department of Business & Industry, Brightline West Passenger Rail Project, Revenue Bonds | | |
| Series A | | |
| 0.50%, due 1/1/50 (a)(b)(h)(i) | 12,500,000 | 12,502,361 |
| Tender Option Bond Trust Receipts/Certificates, Revenue Bonds | | |
| Series 2019-XF2806 | | |
| 0.10%, due 7/1/49 (a)(h)(i) | 5,000,000 | 5,000,000 |
| | | 17,502,361 |
| New Jersey 1.1% |
| New Jersey Turnpike Authority, Revenue Bonds | | |
| Series D-1 | | |
| 0.781%, due 1/1/24 (i)(j) | 66,500,000 | 67,118,251 |
| Tender Option Bond Trust Receipts/Certificates, Revenue Bonds (a)(h)(i) | | |
| Series 2018-XG0168, Insured: State Appropriations | | |
| 0.09%, due 3/1/28 | 7,725,000 | 7,725,000 |
| Series 2020-YX1160 | | |
| 0.09%, due 6/15/37 | 5,820,000 | 5,820,000 |
| Series 2018-XF2702 | | |
| 0.09%, due 7/1/39 | 2,070,000 | 2,070,000 |
| 0.09%, due 6/15/41 | 8,200,000 | 8,200,000 |
| Series 2020-XF2865 | | |
| 0.09%, due 11/1/44 | 4,500,000 | 4,500,000 |
| Series 2020-YX1162 | | |
| 0.09%, due 6/15/45 | 10,380,000 | 10,380,000 |
| Series 2021-XL0163 | | |
| 0.09%, due 6/15/46 | 5,885,000 | 5,885,000 |
| Series 2018-XF2525 | | |
| 0.09%, due 6/15/47 | 3,900,000 | 3,900,000 |
| Series 2018-XG0205 | | |
| 0.09%, due 6/15/50 | 7,895,000 | 7,895,000 |
| | | 123,493,251 |
| | Principal
Amount | Value |
| |
| New York 1.3% |
| City of New York NY, Limited General Obligation (i) | | |
| Series 3 | | |
| 0.22%, due 4/1/42 | $ 7,500,000 | $ 7,500,000 |
| Series 2 | | |
| 0.22%, due 4/1/42 | 9,900,000 | 9,900,000 |
| Metropolitan Transportation Authority, Revenue Bonds | | |
| Series A-2 | | |
| 0.07%, due 11/15/41 (h)(i) | 6,000,000 | 6,000,000 |
| New York City Water & Sewer System, Revenue Bonds | | |
| Series F-1 | | |
| 0.04%, due 6/15/33 (h)(i) | 22,835,000 | 22,835,000 |
| Nuveen New York Quality Municipal Income Fund, Preferred Shares | | |
| 0.41%, due 5/1/47 (a)(b)(i) | 20,000,000 | 20,000,000 |
| Tender Option Bond Trust Receipts/Certificates, Revenue Bonds (a)(h)(i) | | |
| Series 2020-YX1158 | | |
| 0.09%, due 11/1/47 | 6,740,000 | 6,740,000 |
| Series 2020-XL0153 | | |
| 0.10%, due 7/1/45 | 2,500,000 | 2,500,000 |
| Series 2020-XX1156 | | |
| 0.10%, due 11/15/53 | 9,165,000 | 9,165,000 |
| Triborough Bridge & Tunnel Authority, Revenue Bonds (i) | | |
| 0.085%, due 1/1/32 | 21,000,000 | 21,000,000 |
| 0.10%, due 1/1/32 | 34,600,000 | 34,600,000 |
| | | 140,240,000 |
| North Carolina 0.7% |
| Invesco Municipal Income Opportunities Trust II | | |
| 1.12%, due 12/1/22 (a)(i)(j) | 80,000,000 | 80,000,000 |
| Ohio 0.3% |
| State of Ohio, University Hospitals Health System, Revenue Bonds | | |
| Series A | | |
| 0.04%, due 1/15/46 (h)(i) | 9,750,000 | 9,750,000 |
| State of Ohio, Republic Services, Inc., Revenue Bonds | | |
| 0.15%, due 11/1/35 (h)(i) | 9,250,000 | 9,250,069 |
The notes to the financial statements are an integral part of, and should be read in conjunction with, the financial statements.
| 64 | MainStay MacKay High Yield Municipal Bond Fund |
| | Principal
Amount | Value |
| Short-Term Municipal Notes (continued) |
| Ohio (continued) |
| Tender Option Bond Trust Receipts/Certificates, Revenue Bonds | | |
| Series 2020-XF2906 | | |
| 0.10%, due 11/15/40 (a)(h)(i) | $ 10,140,000 | $ 10,140,000 |
| | | 29,140,069 |
| Pennsylvania 0.0% ‡ |
| Tender Option Bond Trust Receipts, Revenue Bonds | | |
| Series 2018-XX1094 | | |
| 0.09%, due 4/1/47 (a)(h)(i) | 5,260,000 | 5,260,000 |
| Puerto Rico 0.0% ‡ |
| Puerto Rico Electric Power Authority, Revenue Bonds | | |
| Series UU, Insured: AGM | | |
| 0.655%, due 7/1/29 (i)(j) | 4,940,000 | 4,588,169 |
| Texas 0.9% |
| Clifton Higher Education Finance Corp., Revenue Bonds | | |
| Insured: PSF | | |
| 0.75%, due 8/15/50 (a)(i)(j) | 55,450,000 | 55,440,773 |
| Harris County Health Facilities Development Corp., Methodist Hospital, Revenue Bonds (i) | | |
| Series A-1 | | |
| 0.02%, due 12/1/41 | 23,595,000 | 23,595,000 |
| Series A-2 | | |
| 0.02%, due 12/1/41 | 16,715,000 | 16,715,000 |
| | | 95,750,773 |
| Utah 0.1% |
| City of Murray UT, IHC Health Services, Inc., Revenue Bonds (h)(i) | | |
| Series D | | |
| 0.01%, due 5/15/36 | 1,810,000 | 1,810,000 |
| Series C | | |
| 0.01%, due 5/15/36 | 11,180,000 | 11,180,000 |
| | | 12,990,000 |
| | Principal
Amount | Value |
| |
| Virginia 0.1% |
| Tender Option Bond Trust Receipts/Certificates, Revenue Bonds | | |
| Series 2020-XF2923 | | |
| 0.09%, due 7/1/51 (a)(h)(i) | $ 8,600,000 | $ 8,600,000 |
| Virginia Small Business Financing Authority, University Real Estate Foundation, Revenue Bonds | | |
| 0.05%, due 7/1/30 (h)(i) | 60,000 | 60,000 |
| | | 8,660,000 |
| West Virginia 0.0% ‡ |
| West Virginia Economic Development Authority, Arch Resources, Inc. Project, Revenue Bonds | | |
| 4.125%, due 7/1/45 (b)(h)(i) | 2,400,000 | 2,464,286 |
| Wisconsin 0.2% |
| State of Wisconsin, Unlimited General Obligation | | |
| Series A | | |
| 0.07%, due 5/1/29 (i) | 12,000,000 | 12,000,000 |
| Tender Option Bond Trust Receipts/Certificates, Revenue Bonds | | |
| Series 2020-XL0147, Insured: AGM | | |
| 0.10%, due 6/1/45 (a)(h)(i) | 10,635,000 | 10,635,000 |
| | | 22,635,000 |
Total Short-Term Municipal Notes
(Cost $1,030,098,140) | | 1,034,234,176 |
Total Municipal Bonds
(Cost $9,571,065,167) | | 10,409,875,626 |
| |
| Long-Term Bonds 0.1% |
| Corporate Bonds 0.1% |
| Commercial Services 0.1% |
| Howard University | | |
| Series 21A | | |
| 4.756%, due 10/1/51 | 5,500,000 | 5,827,041 |
The notes to the financial statements are an integral part of, and should be read in conjunction with, the financial statements.
65
Portfolio of Investments April 30, 2021† (Unaudited) (continued)
| | Principal
Amount | Value |
| Corporate Bonds (continued) |
| Commercial Services (continued) |
| Wildflower Improvement Association | | |
| 6.625%, due 3/1/31 (a) | $ 6,603,684 | $ 6,605,714 |
Total Long-Term Bonds
(Cost $11,986,156) | | 12,432,755 |
| |
| | Shares | Value |
| Closed-End Funds 0.8% |
| California 0.1% |
| BlackRock MuniHoldings California Quality Fund, Inc. | 652,094 | 9,866,182 |
| Massachusetts 0.1% |
| BlackRock Muni Intermediate Duration Fund, Inc. | 240,316 | 3,626,368 |
| DWS Municipal Income Trust | 131,002 | 1,557,614 |
| Eaton Vance Municipal Bond Fund | 154,604 | 2,080,970 |
| Pioneer Municipal High Income Advantage Trust | 316,387 | 3,831,447 |
| Pioneer Municipal High Income Trust | 332,691 | 4,195,233 |
| | | 15,291,632 |
| Michigan 0.0% ‡ |
| BlackRock MuniYield Michigan Quality Fund, Inc. | 287,270 | 4,392,358 |
| Multi-State 0.3% |
| BlackRock Municipal 2030 Target Term Trust | 442,357 | 11,501,282 |
| BlackRock Municipal Income Quality Trust | 93,332 | 1,472,779 |
| BlackRock MuniHoldings Fund, Inc. | 146,484 | 2,392,084 |
| BlackRock MuniHoldings Investment Quality Fund | 70,458 | 1,015,300 |
| BlackRock MuniYield Quality Fund II, Inc. | 621,423 | 8,650,208 |
| BlackRock MuniYield Quality Fund, Inc. | 287,227 | 4,572,654 |
| BNY Mellon Municipal Bond Infrastructure Fund, Inc. | 17,508 | 254,216 |
| | | 29,858,523 |
| | Shares | | Value |
| |
| New Jersey 0.1% |
| BlackRock MuniHoldings New Jersey Quality Fund, Inc. | 394,470 | | $ 6,055,115 |
| New York 0.2% |
| BlackRock MuniHoldings New York Quality Fund, Inc. | 557,777 | | 8,020,833 |
| BlackRock MuniYield New York Quality Fund, Inc. | 598,791 | | 8,269,304 |
| BlackRock New York Municipal Income Trust | 58,647 | | 848,622 |
| | | | 17,138,759 |
| Pennsylvania 0.0% ‡ |
| Invesco Pennsylvania Value Municipal Income Trust | 68,544 | | 900,668 |
Total Closed-End Funds
(Cost $78,690,083) | | | 83,503,237 |
| Short-Term Investment 1.5% |
| Unaffiliated Investment Company 1.5% |
| BlackRock Liquidity Funds MuniCash, 0.01% (k) | 162,362,592 | | 162,395,065 |
Total Short-Term Investment
(Cost $162,395,065) | | | 162,395,065 |
Total Investments
(Cost $9,824,136,471) | 96.9% | | 10,668,206,683 |
| Other Assets, Less Liabilities | 3.1 | | 346,198,426 |
| Net Assets | 100.0% | | $ 11,014,405,109 |
| † | Percentages indicated are based on Fund net assets. |
| ‡ | Less than one-tenth of a percent. |
| (a) | May be sold to institutional investors only under Rule 144A or securities offered pursuant to Section 4(a)(2) of the Securities Act of 1933, as amended. |
| (b) | Interest on these securities was subject to alternative minimum tax. |
| (c) | Delayed delivery security. |
| (d) | Step coupon—Rate shown was the rate in effect as of April 30, 2021. |
| (e) | Illiquid security—As of April 30, 2021, the total market value deemed illiquid under procedures approved by the Board of Trustees was $189,895,225, which represented 1.7% of the Fund’s net assets. |
| (f) | Issue in default. |
| (g) | Issue in non-accrual status. |
The notes to the financial statements are an integral part of, and should be read in conjunction with, the financial statements.
| 66 | MainStay MacKay High Yield Municipal Bond Fund |
| (h) | Coupon rate may change based on changes of the underlying collateral or prepayments of principal. Rate shown was the rate in effect as of April 30, 2021. |
| (i) | Variable-rate demand notes (VRDNs)—Provide the right to sell the security at face value on either that day or within the rate-reset period. VRDNs will normally trade as if the maturity is the earlier put date, even though stated maturity is longer. The interest rate is reset on the put date at a stipulated daily, weekly, monthly, quarterly, or other specified time interval to reflect current market conditions. These securities do not indicate a reference rate and spread in their description. The maturity date shown is the final maturity. |
| (j) | Floating rate—Rate shown was the rate in effect as of April 30, 2021. |
| (k) | Current yield as of April 30, 2021. |
Futures Contracts
As of April 30, 2021, the Fund held the following futures contracts1:
| Type | Number of
Contracts | Expiration
Date | Value at
Trade Date | Current
Notional
Amount | Unrealized
Appreciation
(Depreciation)2 |
| Short Contracts | | | | | |
| U.S. Treasury Long Bonds | (250) | June 2021 | $ (40,424,838) | $ (39,312,500) | $ 1,112,338 |
| 1. | As of April 30, 2021, cash in the amount of $925,000 was on deposit with a broker or futures commission merchant for futures transactions. |
| 2. | Represents the difference between the value of the contracts at the time they were opened and the value as of April 30, 2021. |
| Abbreviation(s): |
| ACA—ACA Financial Guaranty Corp. |
| AGC—Assured Guaranty Corp. |
| AGM—Assured Guaranty Municipal Corp. |
| AMBAC—Ambac Assurance Corp. |
| BAM—Build America Mutual Assurance Co. |
| CHF—Collegiate Housing Foundation |
| COMMWLTH GTD—Commonwealth Guaranteed |
| MUN GOVT GTD—Municipal Government Guaranteed |
| NATL-RE—National Public Finance Guarantee Corp. |
| PSF—Permanent School Fund |
| UT CSCE—Utah Charter School Credit Enhancement Program |
The notes to the financial statements are an integral part of, and should be read in conjunction with, the financial statements.
67
Portfolio of Investments April 30, 2021† (Unaudited) (continued)
The following is a summary of the fair valuations according to the inputs used as of April 30, 2021, for valuing the Fund’s assets:
| Description | Quoted
Prices in
Active
Markets for
Identical
Assets
(Level 1) | | Significant
Other
Observable
Inputs
(Level 2) | | Significant
Unobservable
Inputs
(Level 3) | | Total |
| Asset Valuation Inputs | | | | | | | |
| Investments in Securities (a) | | | | | | | |
| Municipal Bonds | | | | | | | |
| Long-Term Municipal Bonds | $ — | | $ 9,375,641,450 | | $ — | | $ 9,375,641,450 |
| Short-Term Municipal Notes | — | | 1,034,234,176 | | — | | 1,034,234,176 |
| Total Municipal Bonds | — | | 10,409,875,626 | | — | | 10,409,875,626 |
| Long-Term Bonds | | | | | | | |
| Corporate Bonds | — | | 12,432,755 | | — | | 12,432,755 |
| Total Corporate Bonds | — | | 12,432,755 | | — | | 12,432,755 |
| Closed-End Funds | 83,503,237 | | — | | — | | 83,503,237 |
| Short-Term Investment | | | | | | | |
| Unaffiliated Investment Company | 162,395,065 | | — | | — | | 162,395,065 |
| Total Investments in Securities | 245,898,302 | | 10,422,308,381 | | — | | 10,668,206,683 |
| Other Financial Instruments | | | | | | | |
| Futures Contracts (b) | 1,112,338 | | — | | — | | 1,112,338 |
| Total Other Financial Instruments | 1,112,338 | | — | | — | | 1,112,338 |
| Total Investments in Securities and Other Financial Instruments | $ 247,010,640 | | $ 10,422,308,381 | | $ — | | $ 10,669,319,021 |
| (a) | For a complete listing of investments and their industries, see the Portfolio of Investments. |
| (b) | The value listed for these securities reflects unrealized appreciation (depreciation) as shown on the Portfolio of Investments. |
The notes to the financial statements are an integral part of, and should be read in conjunction with, the financial statements.
| 68 | MainStay MacKay High Yield Municipal Bond Fund |
Statement of Assets and Liabilities as of April 30, 2021 (Unaudited)
| Assets |
Investment in securities, at value
(identified cost $9,824,136,471) | $10,668,206,683 |
| Cash collateral on deposit at broker for futures contracts | 925,000 |
| Cash | 239,922,102 |
| Receivables: | |
| Dividends and interest | 111,794,578 |
| Fund shares sold | 30,706,754 |
| Variation margin on futures contracts | 62,500 |
| Investment securities sold | 53,844 |
| Other assets | 307,771 |
| Total assets | 11,051,979,232 |
| Liabilities |
| Payables: | |
| Fund shares redeemed | 13,303,665 |
| Investment securities purchased | 8,815,898 |
| Manager (See Note 3) | 4,656,381 |
| NYLIFE Distributors (See Note 3) | 794,313 |
| Transfer agent (See Note 3) | 619,443 |
| Professional fees | 143,437 |
| Shareholder communication | 95,289 |
| Custodian | 32,110 |
| Accrued expenses | 5,195 |
| Distributions payable | 9,108,392 |
| Total liabilities | 37,574,123 |
| Net assets | $11,014,405,109 |
| Composition of Net Assets |
| Shares of beneficial interest outstanding (par value of $.001 per share) unlimited number of shares authorized | $ 817,926 |
| Additional paid-in-capital | 10,232,198,012 |
| | 10,233,015,938 |
| Total distributable earnings (loss) | 781,389,171 |
| Net assets | $11,014,405,109 |
| Class A | |
| Net assets applicable to outstanding shares | $2,495,412,873 |
| Shares of beneficial interest outstanding | 185,318,578 |
| Net asset value per share outstanding | $ 13.47 |
| Maximum sales charge (4.50% of offering price) | 0.63 |
| Maximum offering price per share outstanding | $ 14.10 |
| Investor Class | |
| Net assets applicable to outstanding shares | $ 5,393,784 |
| Shares of beneficial interest outstanding | 401,037 |
| Net asset value per share outstanding | $ 13.45 |
| Maximum sales charge (4.00% of offering price) | 0.56 |
| Maximum offering price per share outstanding | $ 14.01 |
| Class C | |
| Net assets applicable to outstanding shares | $ 350,530,811 |
| Shares of beneficial interest outstanding | 26,095,250 |
| Net asset value and offering price per share outstanding | $ 13.43 |
| Class I | |
| Net assets applicable to outstanding shares | $7,099,180,664 |
| Shares of beneficial interest outstanding | 527,093,282 |
| Net asset value and offering price per share outstanding | $ 13.47 |
| Class R6 | |
| Net assets applicable to outstanding shares | $1,063,886,977 |
| Shares of beneficial interest outstanding | 79,017,860 |
| Net asset value and offering price per share outstanding | $ 13.46 |
The notes to the financial statements are an integral part of, and should be read in conjunction with, the financial statements.
69
Statement of Operations for the six months ended April 30, 2021 (Unaudited)
| Investment Income (Loss) |
| Income | |
| Interest | $185,390,861 |
| Dividends | 1,690,795 |
| Other | 60 |
| Total income | 187,081,716 |
| Expenses | |
| Manager (See Note 3) | 25,550,887 |
| Distribution/Service—Class A (See Note 3) | 2,829,367 |
| Distribution/Service—Investor Class (See Note 3) | 6,638 |
| Distribution/Service—Class C (See Note 3) | 1,803,877 |
| Transfer agent (See Note 3) | 2,101,748 |
| Professional fees | 269,290 |
| Registration | 168,137 |
| Shareholder communication | 133,650 |
| Trustees | 90,498 |
| Insurance | 36,745 |
| Custodian | 36,231 |
| Miscellaneous | 100,779 |
| Total expenses | 33,127,847 |
| Net investment income (loss) | 153,953,869 |
| Realized and Unrealized Gain (Loss) |
| Net realized gain (loss) on: | |
| Unaffiliated investment transactions | 5,671,646 |
| Futures transactions | 3,492,147 |
| Net realized gain (loss) | 9,163,793 |
| Net change in unrealized appreciation (depreciation) on: | |
| Unaffiliated investments | 510,413,149 |
| Futures contracts | 247,691 |
| Net change in unrealized appreciation (depreciation) | 510,660,840 |
| Net realized and unrealized gain (loss) | 519,824,633 |
| Net increase (decrease) in net assets resulting from operations | $673,778,502 |
The notes to the financial statements are an integral part of, and should be read in conjunction with, the financial statements.
| 70 | MainStay MacKay High Yield Municipal Bond Fund |
Statements of Changes in Net Assets
for the six months ended April 30, 2021 (Unaudited) and the year ended October 31, 2020
| | 2021 | 2020 |
| Increase (Decrease) in Net Assets |
| Operations: | | |
| Net investment income (loss) | $ 153,953,869 | $ 239,107,464 |
| Net realized gain (loss) | 9,163,793 | (18,447,907) |
| Net change in unrealized appreciation (depreciation) | 510,660,840 | (134,096,371) |
| Net increase (decrease) in net assets resulting from operations | 673,778,502 | 86,563,186 |
| Distributions to shareholders: | | |
| Class A | (36,203,567) | (71,801,368) |
| Investor Class | (84,903) | (178,402) |
| Class C | (4,419,465) | (10,617,139) |
| Class I | (107,107,146) | (171,136,444) |
| Class R6 | (14,914,659) | (1,490,352) |
| Total distributions to shareholders | (162,729,740) | (255,223,705) |
| Capital share transactions: | | |
| Net proceeds from sales of shares | 2,887,501,802 | 4,385,326,767 |
| Net asset value of shares issued to shareholder in reinvestment of distributions | 108,556,127 | 184,287,567 |
| Cost of shares redeemed | (996,414,733) | (2,962,509,546) |
| Increase (decrease) in net assets derived from capital share transactions | 1,999,643,196 | 1,607,104,788 |
| Net increase (decrease) in net assets | 2,510,691,958 | 1,438,444,269 |
| Net Assets |
| Beginning of period | 8,503,713,151 | 7,065,268,882 |
| End of period | $11,014,405,109 | $ 8,503,713,151 |
The notes to the financial statements are an integral part of, and should be read in conjunction with, the financial statements.
71
Financial Highlights selected per share data and ratios
| | Six months ended
April 30,
2021* | | Year Ended October 31, |
| Class A | 2020 | | 2019 | | 2018 | | 2017 | | 2016 |
| Net asset value at beginning of period | $ 12.75 | | $ 12.98 | | $ 12.33 | | $ 12.32 | | $ 12.52 | | $ 12.04 |
| Net investment income (loss) | 0.20 | | 0.40 | | 0.47 | | 0.48 | | 0.49 | | 0.49 |
| Net realized and unrealized gain (loss) on investments | 0.73 | | (0.20) | | 0.66 | | 0.01 | | (0.19) | | 0.51 |
| Total from investment operations | 0.93 | | 0.20 | | 1.13 | | 0.49 | | 0.30 | | 1.00 |
| Less distributions: | | | | | | | | | | | |
| From net investment income | (0.21) | | (0.43) | | (0.47) | | (0.48) | | (0.49) | | (0.49) |
| From net realized gain on investments | — | | (0.00)‡ | | (0.01) | | — | | (0.01) | | (0.03) |
| Total distributions | (0.21) | | (0.43) | | (0.48) | | (0.48) | | (0.50) | | (0.52) |
| Net asset value at end of period | $ 13.47 | | $ 12.75 | | $ 12.98 | | $ 12.33 | | $ 12.32 | | $ 12.52 |
| Total investment return (a) | 7.34% | | 1.60% | | 9.28% | | 4.03% | | 2.48% | | 8.43% |
| Ratios (to average net assets)/Supplemental Data: | | | | | | | | | | | |
| Net investment income (loss) | 2.99%†† | | 3.15% | | 3.69% | | 3.84% | | 3.99% | | 3.91% |
| Net expenses (b) | 0.84%†† | | 0.86% | | 0.87% | | 0.87% | | 0.87% | | 0.87% |
| Portfolio turnover rate | 4% (c) | | 37% (c) | | 27% (c) | | 32% | | 34% | | 41% |
| Net assets at end of period (in 000’s) | $ 2,495,413 | | $ 2,073,226 | | $ 2,210,862 | | $ 1,616,061 | | $ 882,736 | | $ 874,512 |
| * | Unaudited. |
| ‡ | Less than one cent per share. |
| †† | Annualized. |
| (a) | Total investment return is calculated exclusive of sales charges and assumes the reinvestment of dividends and distributions. For periods of less than one year, total return is not annualized. |
| (b) | In addition to the fees and expenses which the Fund bears directly, it also indirectly bears a pro-rata share of the fees and expenses of the underlying funds in which it invests. Such indirect expenses are not included in the above expense ratios. |
| (c) | The portfolio turnover rate includes variable rate demand notes. |
| | Six months ended
April 30,
2021* | | Year Ended October 31, |
| Investor Class | 2020 | | 2019 | | 2018 | | 2017 | | 2016 |
| Net asset value at beginning of period | $ 12.73 | | $ 12.96 | | $ 12.32 | | $ 12.30 | | $ 12.50 | | $ 12.02 |
| Net investment income (loss) | 0.20 | | 0.40 | | 0.47 | | 0.48 | | 0.49 | | 0.49 |
| Net realized and unrealized gain (loss) on investments | 0.73 | | (0.20) | | 0.65 | | 0.02 | | (0.19) | | 0.51 |
| Total from investment operations | 0.93 | | 0.20 | | 1.12 | | 0.50 | | 0.30 | | 1.00 |
| Less distributions: | | | | | | | | | | | |
| From net investment income | (0.21) | | (0.43) | | (0.47) | | (0.48) | | (0.49) | | (0.49) |
| From net realized gain on investments | — | | (0.00)‡ | | (0.01) | | — | | (0.01) | | (0.03) |
| Total distributions | (0.21) | | (0.43) | | (0.48) | | (0.48) | | (0.50) | | (0.52) |
| Net asset value at end of period | $ 13.45 | | $ 12.73 | | $ 12.96 | | $ 12.32 | | $ 12.30 | | $ 12.50 |
| Total investment return (a) | 7.34% | | 1.59% | | 9.19% | | 4.10% | | 2.45% | | 8.42% |
| Ratios (to average net assets)/Supplemental Data: | | | | | | | | | | | |
| Net investment income (loss) | 3.07%†† | | 3.15% | | 3.69% | | 3.85% | | 3.98% | | 3.90% |
| Net expenses (b) | 0.86%†† | | 0.87% | | 0.88% | | 0.89% | | 0.90% | | 0.90% |
| Portfolio turnover rate | 4% (c) | | 37% (c) | | 27% (c) | | 32% | | 34% | | 41% |
| Net assets at end of period (in 000’s) | $ 5,394 | | $ 5,211 | | $ 5,449 | | $ 4,383 | | $ 3,483 | | $ 4,249 |
| * | Unaudited. |
| ‡ | Less than one cent per share. |
| †† | Annualized. |
| (a) | Total investment return is calculated exclusive of sales charges and assumes the reinvestment of dividends and distributions. For periods of less than one year, total return is not annualized. |
| (b) | In addition to the fees and expenses which the Fund bears directly, it also indirectly bears a pro-rata share of the fees and expenses of the underlying funds in which it invests. Such indirect expenses are not included in the above expense ratios. |
| (c) | The portfolio turnover rate includes variable rate demand notes. |
The notes to the financial statements are an integral part of, and should be read in conjunction with, the financial statements.
| 72 | MainStay MacKay High Yield Municipal Bond Fund |
Financial Highlights selected per share data and ratios
| | Six months ended
April 30,
2021* | | Year Ended October 31, |
| Class C | 2020 | | 2019 | | 2018 | | 2017 | | 2016 |
| Net asset value at beginning of period | $ 12.71 | | $ 12.95 | | $ 12.30 | | $ 12.29 | | $ 12.49 | | $ 12.01 |
| Net investment income (loss) | 0.14 | | 0.29 | | 0.37 | | 0.39 | | 0.39 | | 0.39 |
| Net realized and unrealized gain (loss) on investments | 0.74 | | (0.20) | | 0.66 | | 0.01 | | (0.19) | | 0.51 |
| Total from investment operations | 0.88 | | 0.09 | | 1.03 | | 0.40 | | 0.20 | | 0.90 |
| Less distributions: | | | | | | | | | | | |
| From net investment income | (0.16) | | (0.33) | | (0.37) | | (0.39) | | (0.39) | | (0.39) |
| From net realized gain on investments | — | | (0.00)‡ | | (0.01) | | — | | (0.01) | | (0.03) |
| Total distributions | (0.16) | | (0.33) | | (0.38) | | (0.39) | | (0.40) | | (0.42) |
| Net asset value at end of period | $ 13.43 | | $ 12.71 | | $ 12.95 | | $ 12.30 | | $ 12.29 | | $ 12.49 |
| Total investment return (a) | 6.95% | | 0.75% | | 8.47% | | 3.24% | | 1.69% | | 7.61% |
| Ratios (to average net assets)/Supplemental Data: | | | | | | | | | | | |
| Net investment income (loss) | 2.19%†† | | 2.41% | | 2.94% | | 3.11% | | 3.22% | | 3.14% |
| Net expenses (b) | 1.61%†† | | 1.62% | | 1.63% | | 1.63% | | 1.65% | | 1.65% |
| Portfolio turnover rate | 4% (c) | | 37% (c) | | 27% (c) | | 32% | | 34% | | 41% |
| Net assets at end of period (in 000’s) | $ 350,531 | | $ 355,498 | | $ 433,318 | | $ 396,092 | | $ 395,042 | | $ 401,279 |
| * | Unaudited. |
| ‡ | Less than one cent per share. |
| †† | Annualized. |
| (a) | Total investment return is calculated exclusive of sales charges and assumes the reinvestment of dividends and distributions. For periods of less than one year, total return is not annualized. |
| (b) | In addition to the fees and expenses which the Fund bears directly, it also indirectly bears a pro-rata share of the fees and expenses of the underlying funds in which it invests. Such indirect expenses are not included in the above expense ratios. |
| (c) | The portfolio turnover rate includes variable rate demand notes. |
| | Six months ended
April 30,
2021* | | Year Ended October 31, |
| Class I | 2020 | | 2019 | | 2018 | | 2017 | | 2016 |
| Net asset value at beginning of period | $ 12.75 | | $ 12.98 | | $ 12.34 | | $ 12.32 | | $ 12.52 | | $ 12.04 |
| Net investment income (loss) | 0.22 | | 0.45 | | 0.50 | | 0.51 | | 0.52 | | 0.52 |
| Net realized and unrealized gain (loss) on investments | 0.73 | | (0.22) | | 0.65 | | 0.02 | | (0.19) | | 0.51 |
| Total from investment operations | 0.95 | | 0.23 | | 1.15 | | 0.53 | | 0.33 | | 1.03 |
| Less distributions: | | | | | | | | | | | |
| From net investment income | (0.23) | | (0.46) | | (0.50) | | (0.51) | | (0.52) | | (0.52) |
| From net realized gain on investments | — | | (0.00)‡ | | (0.01) | | — | | (0.01) | | (0.03) |
| Total distributions | (0.23) | | (0.46) | | (0.51) | | (0.51) | | (0.53) | | (0.55) |
| Net asset value at end of period | $ 13.47 | | $ 12.75 | | $ 12.98 | | $ 12.34 | | $ 12.32 | | $ 12.52 |
| Total investment return (a) | 7.47% | | 1.86% | | 9.46% | | 4.38% | | 2.74% | | 8.70% |
| Ratios (to average net assets)/Supplemental Data: | | | | | | | | | | | |
| Net investment income (loss) | 3.27%†† | | 3.38% | | 3.93% | | 4.09% | | 4.21% | | 4.16% |
| Net expenses (b) | 0.59%†† | | 0.61% | | 0.62% | | 0.62% | | 0.62% | | 0.62% |
| Portfolio turnover rate | 4% (c) | | 37% (c) | | 27% (c) | | 32% | | 34% | | 41% |
| Net assets at end of period (in 000’s) | $ 7,099,181 | | $ 6,063,243 | | $ 4,415,639 | | $ 3,024,665 | | $ 2,094,251 | | $ 1,420,936 |
| * | Unaudited. |
| ‡ | Less than one cent per share. |
| †† | Annualized. |
| (a) | Total investment return is calculated exclusive of sales charges and assumes the reinvestment of dividends and distributions. For periods of less than one year, total return is not annualized. |
| (b) | In addition to the fees and expenses which the Fund bears directly, it also indirectly bears a pro-rata share of the fees and expenses of the underlying funds in which it invests. Such indirect expenses are not included in the above expense ratios. |
| (c) | The portfolio turnover rate includes variable rate demand notes. |
The notes to the financial statements are an integral part of, and should be read in conjunction with, the financial statements.
73
Financial Highlights selected per share data and ratios
| | Six months ended
April 30,
2021* | | November 1, 2019^ through
October 31, |
| Class R6 | 2020 |
| Net asset value at beginning of period | $ 12.74 | | $ 12.98 |
| Net investment income (loss) | 0.22 | | 0.43(a) |
| Net realized and unrealized gain (loss) on investments | 0.73 | | (0.21) |
| Total from investment operations | 0.95 | | 0.22 |
| Less distributions: | | | |
| From net investment income | (0.23) | | (0.46) |
| From net realized gain on investments | — | | (0.00)‡ |
| Total distributions | (0.23) | | (0.46) |
| Net asset value at end of period | $ 13.46 | | $ 12.74 |
| Total investment return (b) | 7.50% | | 1.80% |
| Ratios (to average net assets)/Supplemental Data: | | | |
| Net investment income (loss) | 3.28%†† | | 3.40% |
| Net expenses (c) | 0.55%†† | | 0.56% |
| Portfolio turnover rate (d) | 4% | | 37% |
| Net assets at end of period (in 000’s) | $ 1,063,887 | | $ 6,535 |
| * | Unaudited. |
| ^ | Inception date. |
| ‡ | Less than one cent per share. |
| †† | Annualized. |
| (a) | Per share data based on average shares outstanding during the period. |
| (b) | Total investment return is calculated exclusive of sales charges and assumes the reinvestment of dividends and distributions. Class R6 shares are not subject to sales charges. For periods of less than one year, total return is not annualized. |
| (c) | In addition to the fees and expenses which the Fund bears directly, it also indirectly bears a pro-rata share of the fees and expenses of the underlying funds in which it invests. Such indirect expenses are not included in the above expense ratios. |
| (d) | The portfolio turnover rate includes variable rate demand notes. |
The notes to the financial statements are an integral part of, and should be read in conjunction with, the financial statements.
| 74 | MainStay MacKay High Yield Municipal Bond Fund |
Notes to Financial Statements (Unaudited)
Note 1-Organization and Business
MainStay Funds Trust (the “Trust”) was organized as a Delaware statutory trust on April 28, 2009. The Trust is registered under the Investment Company Act of 1940, as amended (the “1940 Act”), as an open-end management investment company, and is comprised of thirty-two funds (collectively referred to as the “Funds”). These financial statements and notes relate to the MainStay MacKay High Yield Municipal Bond Fund (the "Fund"), a “diversified” fund, as that term is defined in the 1940 Act, as interpreted or modified by regulatory authorities having jurisdiction, from time to time.
The following table lists the Fund's share classes that have been registered and commenced operations:
| Class | Commenced Operations |
| Class A | March 31, 2010 |
| Investor Class | March 31, 2010 |
| Class C | March 31, 2010 |
| Class I | March 31, 2010 |
| Class R6 | November 1, 2019 |
| SIMPLE Class | N/A* |
| • | SIMPLE Class shares were registered for sale effective as of August 31, 2020 but have not yet commenced operations. |
Class A and Investor Class shares are offered at net asset value (“NAV”) per share plus an initial sales charge. No initial sales charge applies to investments of $250,000 or more (and certain other qualified purchases) in Class A and Investor Class shares. However, a contingent deferred sales charge (“CDSC”) of 1.00% may be imposed on certain redemptions made within 18 months of the date of purchase on shares that were purchased without an initial sales charge. Class C shares are offered at NAV without an initial sales charge, although a 1.00% CDSC may be imposed on certain redemptions of such shares made within one year of the date of purchase of Class C shares. Class I and Class R6 shares are offered at NAV without a sales charge. SIMPLE Class shares are currently expected to be offered at NAV without a sales charge. In addition, depending upon eligibility, Class C shares convert to either Class A or Investor Class shares at the end of the calendar quarter ten years after the date they were purchased. Investor Class shares may convert automatically to Class A shares. Under certain circumstances and as may be permitted by the Trust’s multiple class plan pursuant to Rule 18f-3 under the 1940 Act, specified share classes of the Fund may be converted to one or more other share classes of the Fund as disclosed in the capital share transactions within these Notes. The classes of shares have the same voting (except for issues that relate solely to one class), dividend, liquidation and other rights, and the same terms and conditions, except that under distribution plans pursuant to Rule 12b-1 under the 1940 Act, Class C shares are subject to higher distribution and/or service fees than Class A, Investor Class and SIMPLE Class shares. Class I and Class R6 shares are not subject to a distribution and/or service fee.
The Fund's investment objective is to seek a high level of current income exempt from federal income taxes. The Fund’s secondary investment objective is total return.
Note 2–Significant Accounting Policies
The Fund is an investment company and accordingly follows the investment company accounting and reporting guidance of the Financial Accounting Standards Board (“FASB”) Accounting Standard Codification Topic 946 Financial Services—Investment Companies. The Fund prepares its financial statements in accordance with generally accepted accounting principles (“GAAP”) in the United States of America and follows the significant accounting policies described below.
(A) Securities Valuation. Investments are usually valued as of the close of regular trading on the New York Stock Exchange (the "Exchange") (usually 4:00 p.m. Eastern time) on each day the Fund is open for business ("valuation date").
The Board of Trustees of the Trust (the "Board") adopted procedures establishing methodologies for the valuation of the Fund's securities and other assets and delegated the responsibility for valuation determinations under those procedures to the Valuation Committee of the Trust (the “Valuation Committee”). The procedures state that, subject to the oversight of the Board and unless otherwise noted, the responsibility for the day-to-day valuation of portfolio assets (including fair value measurements for the Fund's assets and liabilities) rests with New York Life Investment Management LLC (“New York Life Investments” or the "Manager"), aided to whatever extent necessary by the Subadvisor (as defined in Note 3(A)). To assess the appropriateness of security valuations, the Manager, the Subadvisor or the Fund's third-party service provider, who is subject to oversight by the Manager, regularly compares prior day prices, prices on comparable securities and the sale prices to the prior and current day prices and challenges prices with changes exceeding certain tolerance levels with third-party pricing services or broker sources.
The Board authorized the Valuation Committee to appoint a Valuation Subcommittee (the “Subcommittee”) to establish the prices of securities for which market quotations are not readily available or the prices of which are not otherwise readily determinable under the procedures. The Subcommittee meets (in person, via electronic mail or via teleconference) on an as-needed basis. The Valuation Committee meets to ensure that actions taken by the Subcommittee were appropriate.
For those securities valued through either a standardized fair valuation methodology or a fair valuation measurement, the Subcommittee deals with such valuation and the Valuation Committee reviews and affirms, if appropriate, the reasonableness of the valuation based on such methodologies and measurements on a regular basis after considering information that is reasonably available and deemed relevant by the Valuation Committee. Any action taken by the Subcommittee with respect to the valuation of a portfolio security or other asset is submitted for
Notes to Financial Statements (Unaudited) (continued)
review and ratification (if appropriate) to the Valuation Committee and the Board at the next regularly scheduled meeting.
"Fair value" is defined as the price the Fund would reasonably expect to receive upon selling an asset or liability in an orderly transaction to an independent buyer in the principal or most advantageous market for the asset or liability. Fair value measurements are determined within a framework that establishes a three-tier hierarchy that maximizes the use of observable market data and minimizes the use of unobservable inputs to establish a classification of fair value measurements for disclosure purposes. "Inputs" refer broadly to the assumptions that market participants would use in pricing the asset or liability, including assumptions about risk, such as the risk inherent in a particular valuation technique used to measure fair value using a pricing model and/or the risk inherent in the inputs for the valuation technique. Inputs may be observable or unobservable. Observable inputs reflect the assumptions market participants would use in pricing the asset or liability based on market data obtained from sources independent of the Fund. Unobservable inputs reflect the Fund’s own assumptions about the assumptions market participants would use in pricing the asset or liability based on the information available. The inputs or methodology used for valuing assets or liabilities may not be an indication of the risks associated with investing in those assets or liabilities. The three-tier hierarchy of inputs is summarized below.
| • | Level 1—quoted prices in active markets for an identical asset or liability |
| • | Level 2—other significant observable inputs (including quoted prices for a similar asset or liability in active markets, interest rates and yield curves, prepayment speeds, credit risk, etc.) |
| • | Level 3—significant unobservable inputs (including the Fund's own assumptions about the assumptions that market participants would use in measuring fair value of an asset or liability) |
The level of an asset or liability within the fair value hierarchy is based on the lowest level of an input, both individually and in the aggregate, that is significant to the fair value measurement. The aggregate value by input level of the Fund’s assets and liabilities as of April 30, 2021, is included at the end of the Portfolio of Investments.
The Fund may use third-party vendor evaluations, whose prices may be derived from one or more of the following standard inputs, among others:
| • Benchmark yields | • Reported trades |
| • Broker/dealer quotes | • Issuer spreads |
| • Two-sided markets | • Benchmark securities |
| • Bids/offers | • Reference data (corporate actions or material event notices) |
| • Industry and economic events | • Comparable bonds |
| • Monthly payment information | |
An asset or liability for which market values cannot be measured using the methodologies described above is valued by methods deemed
reasonable in good faith by the Valuation Committee, following the procedures established by the Board, to represent fair value. Under these procedures, the Fund generally uses a market-based approach which may use related or comparable assets or liabilities, recent transactions, market multiples, book values and other relevant information. The Fund may also use an income-based valuation approach in which the anticipated future cash flows of the asset or liability are discounted to calculate fair value. Discounts may also be applied due to the nature and/or duration of any restrictions on the disposition of the asset or liability. Fair value represents a good faith approximation of the value of a security. Fair value determinations involve the consideration of a number of subjective factors, an analysis of applicable facts and circumstances and the exercise of judgment. As a result, it is possible that the fair value for a security determined in good faith in accordance with the Fund's valuation procedures may differ from valuations for the same security determined by other funds using their own valuation procedures. Although the Fund's valuation procedures are designed to value a security at the price the Fund may reasonably expect to receive upon the security's sale in an orderly transaction, there can be no assurance that any fair value determination thereunder would, in fact, approximate the amount that the Fund would actually realize upon the sale of the security or the price at which the security would trade if a reliable market price were readily available. During the six-month period ended April 30, 2021, there were no material changes to the fair value methodologies.
Securities which may be valued in this manner include, but are not limited to: (i) a security for which trading has been halted or suspended; (ii) a debt security that has recently gone into default and for which there is not a current market quotation; (iii) a security of an issuer that has entered into a restructuring; (iv) a security that has been delisted from a national exchange; (v) a security for which the market price is not readily available from a third-party pricing source or, if so provided, does not, in the opinion of the Manager or the Subadvisor, reflect the security's market value; (vi) a security subject to trading collars for which no or limited trading takes place; and (vii) a security whose principal market has been temporarily closed at a time when, under normal conditions, it would be open. Securities valued in this manner are generally categorized as Level 3 in the hierarchy. No securities held by the Fund as of April 30, 2021 were fair valued in such a manner.
Investments in mutual funds, including money market funds, are valued at their respective NAVs at the close of business each day on the valuation date. These securities are generally categorized as Level 1 in the hierarchy.
Futures contracts are valued at the last posted settlement price on the market where such futures are primarily traded. These securities are generally categorized as Level 1 in the hierarchy.
Municipal debt securities are valued at the evaluated mean prices supplied by a pricing agent or broker selected by the Manager, in consultation with the Subadvisor. The evaluations are market-based measurements processed through a pricing application and represents the pricing agent's good faith determination as to what a holder may
| 76 | MainStay MacKay High Yield Municipal Bond Fund |
receive in an orderly transaction under market conditions. The rules-based logic utilizes valuation techniques that reflect participants' assumptions and vary by asset class and per methodology, maximizing the use of relevant observable data including quoted prices for similar assets, benchmark yield curves and market corroborated inputs. The evaluated bid or mean prices are deemed by the Manager, in consultation with the Subadvisor, to be representative of market values, at the regular close of trading of the Exchange on each valuation date. Municipal debt securities purchased on a delayed delivery basis are marked to market daily until settlement at the forward settlement date. Municipal debt securities are generally categorized as Level 2 in the hierarchy.
In calculating NAV, each closed-end fund is valued at market value, which will generally be determined using the last reported official closing or last trading price on the exchange or market on which the security is primarily traded at the time of valuation. Price information on closed end funds is taken from the exchange where the security is primarily traded. In addition, because closed-end funds and exchange-traded funds trade on a secondary market, their shares may trade at a premium or discount to the actual net asset value of their portfolio securities and their shares may have greater volatility because of the potential lack of liquidity. These closed-end funds are generally categorized as Level 1 in the hierarchy.
Temporary cash investments acquired in excess of 60 days to maturity at the time of purchase are valued using the latest bid prices or using valuations based on a matrix system (which considers such factors as security prices, yields, maturities and ratings), both as furnished by independent pricing services. Temporary cash investments that mature in 60 days or less at the time of purchase ("Short-Term Investments") are valued using the amortized cost method of valuation, unless the use of such method would be inappropriate. The amortized cost method involves valuing a security at its cost on the date of purchase and thereafter assuming a constant amortization to maturity of the difference between such cost and the value on maturity date. Amortized cost approximates the current fair value of a security. Securities valued using the amortized cost method are not valued using quoted prices in an active market and are generally categorized as Level 2 in the hierarchy.
The information above is not intended to reflect an exhaustive list of the methodologies that may be used to value portfolio investments. The valuation procedures permit the use of a variety of valuation methodologies in connection with valuing portfolio investments. The methodology used for a specific type of investment may vary based on the market data available or other considerations. The methodologies summarized above may not represent the specific means by which portfolio investments are valued on any particular business day.
A portfolio investment may be classified as an illiquid investment under the Trust's written liquidity risk management program and related procedures (“Liquidity Program”). Illiquidity of an investment might prevent the sale of such investment at a time when the Manager or the Subadvisor might wish to sell, and these investments could have the effect of decreasing the overall level of the Fund's liquidity. Further, the lack of an established secondary market may make it more difficult to
value illiquid investments, requiring the Fund to rely on judgments that may be somewhat subjective in measuring value, which could vary materially from the amount that the Fund could realize upon disposition. Difficulty in selling illiquid investments may result in a loss or may be costly to the Fund. An illiquid investment is any investment that the Manager or Subadvisor reasonably expects cannot be sold or disposed of in current market conditions in seven calendar days or less without the sale or disposition significantly changing the market value of the investment. The liquidity classification of each investment will be made using information obtained after reasonable inquiry and taking into account, among other things, relevant market, trading and investment-specific considerations in accordance with the Liquidity Program. Illiquid investments are often valued in accordance with methods deemed by the Board in good faith to be reasonable and appropriate to accurately reflect their fair value. The liquidity of the Fund's investments was determined as of April 30, 2021, and can change at any time. Illiquid investments as of April 30, 2021, are shown in the Portfolio of Investments.
(B) Income Taxes. The Fund's policy is to comply with the requirements of the Internal Revenue Code of 1986, as amended (the “Internal Revenue Code”), applicable to regulated investment companies and to distribute all of its taxable income to the shareholders of the Fund within the allowable time limits.
The Manager evaluates the Fund’s tax positions to determine if the tax positions taken meet the minimum recognition threshold in connection with accounting for uncertainties in income tax positions taken or expected to be taken for the purposes of measuring and recognizing tax liabilities in the financial statements. Recognition of tax benefits of an uncertain tax position is permitted only to the extent the position is “more likely than not” to be sustained assuming examination by taxing authorities. The Manager analyzed the Fund's tax positions taken on federal, state and local income tax returns for all open tax years (for up to three tax years) and has concluded that no provisions for federal, state and local income tax are required in the Fund's financial statements. The Fund's federal, state and local income tax and federal excise tax returns for tax years for which the applicable statutes of limitations have not expired are subject to examination by the Internal Revenue Service and state and local departments of revenue.
(C) Dividends and Distributions to Shareholders. Dividends and distributions are recorded on the ex-dividend date. The Fund intends to declare dividends from net investment income, if any, daily and intends to pay them at least monthly and declares and pays distributions from net realized capital gains, if any, at least annually. Unless a shareholder elects otherwise, all dividends and distributions are reinvested at NAV in the same class of shares of the Fund. Dividends and distributions to shareholders are determined in accordance with federal income tax regulations and may differ from determinations using GAAP.
(D) Security Transactions and Investment Income. The Fund records security transactions on the trade date. Realized gains and losses on security transactions are determined using the identified cost method.
Notes to Financial Statements (Unaudited) (continued)
Distributions received from real estate investment trusts may be classified as dividends, capital gains and/or return of capital. Discounts and premiums on securities purchased, other than temporary cash investments that mature in 60 days or less at the time of purchase, for the Fund are accreted and amortized, respectively, on the effective interest rate method.
Investment income and realized and unrealized gains and losses on investments of the Fund are allocated pro rata to the separate classes of shares based upon their relative net assets on the date the income is earned or realized and unrealized gains and losses are incurred.
The Fund may place a debt security on non-accrual status and reduce related interest income by ceasing current accruals and writing off all or a portion of any interest receivables when the collection of all or a portion of such interest has become doubtful. A debt security is removed from non-accrual status when the issuer resumes interest payments or when collectability of interest is reasonably assured.
(E) Expenses. Expenses of the Trust are allocated to the individual Funds in proportion to the net assets of the respective Funds when the expenses are incurred, except where direct allocations of expenses can be made. Expenses (other than transfer agent expenses and fees incurred under the shareholder services plans and/or the distribution plans further discussed in Note 3(B)) are allocated to separate classes of shares pro rata based upon their relative net assets on the date the expenses are incurred. The expenses borne by the Fund, including those of related parties to the Fund, are shown in the Statement of Operations.
Additionally, the Fund may invest in mutual funds, which are subject to management fees and other fees that may cause the costs of investing in mutual funds to be greater than the costs of owning the underlying securities directly. These indirect expenses of mutual funds are not included in the amounts shown as expenses in the Statement of Operations or in the expense ratios included in the Financial Highlights.
(F) Use of Estimates. In preparing financial statements in conformity with GAAP, the Manager makes estimates and assumptions that affect the reported amounts and disclosures in the financial statements. Actual results could differ from those estimates and assumptions.
(G) Futures Contracts. A futures contract is an agreement to purchase or sell a specified quantity of an underlying instrument at a specified future date and price, or to make or receive a cash payment based on the value of a financial instrument (e.g., foreign currency, interest rate, security or securities index). The Fund is subject to risks such as market price risk and/or interest rate risk in the normal course of investing in these contracts. Upon entering into a futures contract, the Fund is required to pledge to the broker or futures commission merchant an amount of cash and/or U.S. government securities equal to a certain percentage of the collateral amount, known as the “initial margin.” During the period the futures contract is open, changes in the value of the contract are recognized as unrealized appreciation or depreciation by marking to market such contract on a daily basis to reflect the market value of the contract at the end of each day’s trading. The Fund agrees to
receive from or pay to the broker or futures commission merchant an amount of cash equal to the daily fluctuation in the value of the contract. Such receipts or payments are known as “variation margin.” When the futures contract is closed, the Fund records a realized gain or loss equal to the difference between the proceeds from (or cost of) the closing transaction and the Fund's basis in the contract.
The use of futures contracts involves, to varying degrees, elements of market risk in excess of the amount recognized in the Statement of Assets and Liabilities. The contract or notional amounts and variation margin reflect the extent of the Fund's involvement in open futures positions. There are several risks associated with the use of futures contracts as hedging techniques. There can be no assurance that a liquid market will exist at the time when the Fund seeks to close out a futures contract. If no liquid market exists, the Fund would remain obligated to meet margin requirements until the position is closed. Futures contracts may involve a small initial investment relative to the risk assumed, which could result in losses greater than if the Fund did not invest in futures contracts. Futures contracts may be more volatile than direct investments in the instrument underlying the futures and may not correlate to the underlying instrument, causing a given hedge not to achieve its objectives. The Fund's activities in futures contracts have minimal counterparty risk as they are conducted through regulated exchanges that guarantee the futures against default by the counterparty. In the event of a bankruptcy or insolvency of a futures commission merchant that holds margin on behalf of the Fund, the Fund may not be entitled to the return of the entire margin owed to the Fund, potentially resulting in a loss. The Fund may invest in futures contracts to seek enhanced returns or to reduce the risk of loss by hedging certain of its holdings. The Fund's investment in futures contracts and other derivatives may increase the volatility of the Fund's NAVs and may result in a loss to the Fund. Open futures contracts as of April 30, 2021 are shown in the Portfolio of Investments.
(H) Delayed Delivery Transactions. The Fund may purchase or sell securities on a delayed delivery basis. These transactions involve a commitment by the Fund to purchase or sell securities for a predetermined price or yield, with payment and delivery taking place beyond the customary settlement period. When delayed delivery purchases are outstanding, the Fund will designate liquid assets in an amount sufficient to meet the purchase price. When purchasing a security on a delayed delivery basis, the Fund assumes the rights and risks of ownership of the security, including the risk of price and yield fluctuations, and takes such fluctuations into account when determining its NAV. The Fund may dispose of or renegotiate a delayed delivery transaction after it is entered into, and may sell delayed delivery securities before they are delivered, which may result in a realized gain or loss. When the Fund has sold a security it owns on a delayed delivery basis, the Fund does not participate in future gains and losses with respect to the security. As of April 30, 2021, delayed delivery transactions are shown in the Portfolio of Investments.
| 78 | MainStay MacKay High Yield Municipal Bond Fund |
(I) Municipal Bond Risk. The Fund may invest more heavily in municipal bonds from certain cities, states, territories or regions than others, which may increase the Fund’s exposure to losses resulting from economic, political, regulatory occurrences, or declines in tax revenue impacting these particular cities, states, territories or regions. In addition, many state and municipal governments that issue securities are under significant economic and financial stress and may not be able to satisfy their obligations, and these events may be made worse due to economic challenges posed by COVID-19. The Fund may invest a substantial amount of its assets in municipal bonds whose interest is paid solely from revenues of similar projects, such as tobacco settlement bonds. If the Fund concentrates its investments in this manner, it assumes the legal and economic risks relating to such projects and this may have a significant impact on the Fund’s investment performance.
Certain of the issuers in which the Fund may invest have recently experienced, or may experience, significant financial difficulties and repeated credit rating downgrades. On May 3, 2017, the Commonwealth of Puerto Rico began proceedings pursuant to the Puerto Rico Oversight, Management, and Economic Stability Act (“PROMESA”) to seek bankruptcy-type protections from approximately $74 billion in debt and approximately $48 billion in unfunded pension obligations. In addition, the economic downturn following the outbreak of COVID-19 and the resulting pressure on Puerto Rico’s budget have further contributed to its financial challenges. The federal government has passed certain relief packages, such as the Coronavirus Aid, Relief, and Economic Security Act and the American Rescue Plan, which include more than $5 billion in disaster relief funds for the U.S. territories, including Puerto Rico. However, there can be no assurances that the federal funds allocated to the Commonwealth will be sufficient to address the economic challenges arising from COVID-19. Puerto Rico has reached agreements with certain bondholders to restructure outstanding debt issued by certain of Puerto Rico’s instrumentalities and is negotiating the restructuring of its debt with certain other bondholders. Under the terms of these agreements, amounts due to bondholders, including the Fund, may be substantially lower than the original investment. Any agreement to restructure such outstanding debt must be approved by the judge overseeing the debt restructuring. Puerto Rico’s debt restructuring process and other economic, political, social, environmental or health factors or developments could occur rapidly and may significantly affect the value of municipal securities of Puerto Rico. Due to the ongoing budget impact from COVID-19 on the Commonwealth’s finances, the Federal Oversight and Management Board or the Commonwealth could seek to revise or even terminate earlier agreements reached with certain creditors prior to the outbreak of COVID-19. Any agreement between the Federal Oversight and Management Board and creditors is subject to approval by the judge overseeing the Title III proceedings. The composition of the Federal Oversight and Management Board has changed significantly during the past year due to existing members either stepping down or being replaced following the expiration of a member's term. There is no assurance that board members will approve the restructuring agreements the prior board had negotiated.
The Fund’s vulnerability to potential losses associated with such developments may be reduced through investing in municipal securities that feature credit enhancements (such as bond insurance). The bond insurance provider pays both principal and interest when due to the bond holder. The magnitude of Puerto Rico’s debt restructuring or other adverse economic developments could pose significant strains on the ability of municipal securities insurers to meet all future claims. As of April 30, 2021, 32.4% of the Puerto Rico municipal securities held by the Fund were insured.
(J) Indemnifications. Under the Trust’s organizational documents, its officers and trustees are indemnified against certain liabilities that may arise out of performance of their duties to the Trust. Additionally, in the normal course of business, the Fund enters into contracts with third-party service providers that contain a variety of representations and warranties and that may provide general indemnifications. The Fund's maximum exposure under these arrangements is unknown, as this would involve future claims that may be made against the Fund that have not yet occurred. The Manager believes that the risk of loss in connection with these potential indemnification obligations is remote. However, there can be no assurance that material liabilities related to such obligations will not arise in the future, which could adversely impact the Fund.
(K) Quantitative Disclosure of Derivative Holdings. The following tables show additional disclosures related to the Fund's derivative and hedging activities, including how such activities are accounted for and their effect on the Fund's financial positions, performance and cash flows.
The Fund entered into futures contracts to help manage the duration and yield curve positioning of the portfolio. These derivatives are not accounted for as hedging instruments.
Fair value of derivative instruments as of April 30, 2021:
| Asset Derivatives | Interest
Rate
Contracts
Risk | Total |
| Futures Contracts - Net Assets—Net unrealized appreciation on futures contracts (a) | $1,112,338 | $1,112,338 |
| Total Fair Value | $1,112,338 | $1,112,338 |
| (a) | Includes cumulative appreciation (depreciation) of futures contracts as reported in the Portfolio of Investments. Only current day’s variation margin is reported within the Statement of Assets and Liabilities. |
The effect of derivative instruments on the Statement of Operations for the six-month period ended April 30, 2021:
| Net Realized Gain (Loss) from: | Interest
Rate
Contracts
Risk | Total |
| Futures Contracts | $3,492,147 | $3,492,147 |
| Total Net Realized Gain (Loss) | $3,492,147 | $3,492,147 |
Notes to Financial Statements (Unaudited) (continued)
| Net Change in Unrealized Appreciation (Depreciation) | Interest
Rate
Contracts
Risk | Total |
| Futures Contracts | $247,691 | $247,691 |
| Total Net Change in Unrealized Appreciation (Depreciation) | $247,691 | $247,691 |
| Average Notional Amount | Total |
| Futures Contracts Short | $(41,161,458) |
Note 3–Fees and Related Party Transactions
(A) Manager and Subadvisor. New York Life Investments, a registered investment adviser and an indirect, wholly-owned subsidiary of New York Life Insurance Company ("New York Life"), serves as the Fund's Manager, pursuant to an Amended and Restated Management Agreement ("Management Agreement"). The Manager provides offices, conducts clerical, recordkeeping and bookkeeping services and keeps most of the financial and accounting records required to be maintained by the Fund. Except for the portion of salaries and expenses that are the responsibility of the Fund, the Manager pays the salaries and expenses of all personnel affiliated with the Fund and certain operational expenses of the Fund. The Fund reimburses New York Life Investments in an amount equal to the portion of the compensation of the Chief Compliance Officer attributable to the Fund. MacKay Shields LLC ("MacKay Shields" or the "Subadvisor"), a registered investment adviser and an indirect, wholly-owned subsidiary of New York Life, serves as Subadvisor to the Fund and is responsible for the day-to-day portfolio management of the Fund. Pursuant to the terms of an Amended and Restated Subadvisory Agreement ("Subadvisory Agreement") between New York Life Investments and MacKay Shields, New York Life Investments pays for the services of the Subadvisor.
Effective February 28, 2021, pursuant to the Management Agreement, the Fund pays the Manager a monthly fee for the services performed and the facilities furnished at an annual rate of the Fund’s average daily net assets as follows: 0.55% up to $1 billion; 0.54% from $1 billion to $3 billion; 0.53% from $3 billion to $5 billion; 0.52% from $5 billion to $7 billion; 0.51% from $7 billion to $9 billion and 0.50% in excess of $9 billion. During the six-month period ended April 30, 2021, the effective management fee rate was 0.53 of the Fund’s average daily net assets, exclusive of any applicable waivers/reimbursements.
Prior to February 28, 2021, the Fund paid the Manager a monthly fee for the services performed and the facilities furnished at an annual rate of the Fund’s average daily net assets as follows: 0.55% up to $1 billion; 0.54% from $1 billion to $3 billion; 0.53% from $3 billion to $5 billion; 0.52% from $5 billion to $7 billion and 0.51% in excess of $7 billion.
New York Life Investments has contractually agreed to waive fees and/or reimburse expenses so that Total Annual Fund Operating Expenses (excluding taxes, interest, litigation, extraordinary expenses, brokerage and other transaction expenses relating to the purchase or sale of
portfolio investments and acquired (underlying) fund fees and expenses) of Class A shares do not exceed 0.875% of its average daily net assets. New York Life Investments will apply an equivalent waiver or reimbursement, in an equal number of basis points to Investor Class, Class C and Class I shares. New York Life Investments has contractually agreed to waive fees and/or reimburse expenses so that Total Annual Fund Operating Expenses (excluding taxes, interest, litigation, extraordinary expenses, brokerage and other transaction expenses relating to the purchase or sale of portfolio investments, and acquired (underlying) fund fees and expenses) of Class R6 do not exceed those of Class I. These agreements will remain in effect until February 28, 2022, and shall renew automatically for one-year terms unless New York Life Investments provides written notice of termination prior to the start of the next term or upon approval of the Board.
During the six-month period ended April 30, 2021, New York Life Investments earned fees from the Fund in the amount of $25,550,887 and paid the Subadvisor fees in the amount of $12,776,505. There were no waived fees and/or reimbursed expenses.
JPMorgan Chase Bank, N.A. ("JPMorgan") provides sub-administration and sub-accounting services to the Fund pursuant to an agreement with New York Life Investments. These services include calculating the daily NAVs of the Fund, maintaining the general ledger and sub-ledger accounts for the calculation of the Fund's NAVs, and assisting New York Life Investments in conducting various aspects of the Fund's administrative operations. For providing these services to the Fund, JPMorgan is compensated by New York Life Investments.
Prior to November 23, 2020, these services were provided by State Street Bank and Trust Company ("State Street").
Pursuant to an agreement between the Trust and New York Life Investments, New York Life Investments is responsible for providing or procuring certain regulatory reporting services for the Fund. The Fund will reimburse New York Life Investments for the actual costs incurred by New York Life Investments in connection with providing or procuring these services for the Fund.
(B) Distribution and Service Fees. The Trust, on behalf of the Fund, has entered into a distribution agreement with NYLIFE Distributors LLC (the “Distributor”), an affiliate of New York Life Investments. The Fund has adopted distribution plans (the “Plans”) in accordance with the provisions of Rule 12b-1 under the 1940 Act.
Pursuant to the Class A and Investor Class Plans, the Distributor receives a monthly distribution fee from the Class A and Investor Class shares at an annual rate of 0.25% of the average daily net assets of the Class A and Investor Class shares for distribution and/or service activities as designated by the Distributor. Pursuant to the Class C Plan, Class C shares pay the Distributor a monthly distribution fee at an annual rate of 0.75% of the average daily net assets of the Class C shares, along with a service fee at an annual rate of 0.25% of the average daily net assets of the Class C shares, for a total 12b-1 fee of 1.00%. Class I and Class R6 shares are not subject to a distribution and/or service fee.
| 80 | MainStay MacKay High Yield Municipal Bond Fund |
The Plans provide that the distribution and service fees are payable to the Distributor regardless of the amounts actually expended by the Distributor for distribution of the Fund's shares and service activities.
(C) Sales Charges. The Fund was advised by the Distributor that the amount of initial sales charges retained on sales of Class A and Investor Class shares during the six-month period ended April 30, 2021, were $75,900 and $1,012, respectively.
The Fund was also advised that the Distributor retained CDSCs on redemptions of Class A and Class C shares during the six-month period ended April 30, 2021, of $138,974 and $10,980, respectively.
(D) Transfer, Dividend Disbursing and Shareholder Servicing Agent. NYLIM Service Company LLC, an affiliate of New York Life Investments, is the Fund's transfer, dividend disbursing and shareholder servicing agent pursuant to an agreement between NYLIM Service Company LLC and the Trust. NYLIM Service Company LLC has entered into an agreement with DST Asset Manager Solutions, Inc. ("DST"), pursuant to which DST performs certain transfer agent services on behalf of NYLIM Service Company LLC. New York Life Investments has contractually agreed to limit the transfer agency expenses charged to the Fund’s share classes to a maximum of 0.35% of that share class’s average daily net assets on an annual basis after deducting any applicable Fund or class-level expense reimbursement or small account fees. This agreement will remain in effect until February 28, 2022, and shall renew automatically for one-year terms unless New York Life Investments provides written notice of termination prior to the start of the next term or upon approval of the Board. During the six-month period ended April 30, 2021, transfer agent expenses incurred by the Fund and any reimbursements, pursuant to the aforementioned Transfer Agency expense limitation agreement, were as follows:
| Class | Expense | Waived |
| Class A | $ 522,354 | $— |
| Investor Class | 1,802 | — |
| Class C | 122,446 | — |
| Class I | 1,437,938 | — |
| Class R6 | 17,208 | — |
(E) Small Account Fee. Shareholders with small accounts adversely impact the cost of providing transfer agency services. In an effort to reduce total transfer agency expenses, the Fund has implemented a small account fee on certain types of accounts. As described in the Fund's prospectus, certain shareholders with an account balance of less than $1,000 ($5,000 for Class A share accounts) are charged an annual per account fee of $20 (assessed semi-annually), the proceeds from which offset transfer agent fees as reflected in the Statement of Operations. This small account fee will not apply to certain types of accounts as described further in the Fund’s prospectus.
(F) Capital. As of April 30, 2021, New York Life and its affiliates beneficially held shares of the Fund with the values and percentages of net assets as follows:
| ‡ | Less than one-tenth of a percent. |
Note 4-Federal Income Tax
As of April 30, 2021, the cost and unrealized appreciation (depreciation) of the Fund’s investment portfolio, including applicable derivative contracts and other financial instruments, as determined on a federal income tax basis, were as follows:
| | Federal Tax
Cost | Gross
Unrealized
Appreciation | Gross
Unrealized
(Depreciation) | Net
Unrealized
Appreciation/
(Depreciation) |
| Investments | $9,837,353,423 | $865,338,360 | $(34,485,100) | $830,853,260 |
As of October 31, 2020, for federal income tax purposes, capital loss carryforwards of $24,019,977 were available as shown in the table below, to the extent provided by the regulations to offset future realized gains of the Fund through the years indicated. To the extent that these capital loss carryforwards are used to offset future capital gains, it is probable that the capital gains so offset will not be distributed to shareholders. No capital gain distributions shall be made until any capital loss carryforwards have been fully utilized.
Capital Loss
Available Through | Short-Term
Capital Loss
Amounts (000’s) | Long-Term
Capital Loss
Amounts (000’s) |
| Unlimited | $24,020 | $— |
During the year ended October 31, 2020, the tax character of distributions paid as reflected in the Statements of Changes in Net Assets was as follows:
| | 2020 |
| Distributions paid from: | |
| Ordinary Income | $ 13,759,472 |
| Long-Term Capital Gains | 110,318 |
| Exempt Interest Dividends | 241,353,915 |
| Total | $255,223,705 |
Note 5–Custodian
JPMorgan is the custodian of cash and securities held by the Fund. Custodial fees are charged to the Fund based on the Fund's net assets and/or the market value of securities held by the Fund and the number of certain transactions incurred by the Fund.
Prior to November 23, 2020, these services were provided by State Street. The services provided by State Street were a direct expense of the Fund and are included in the Statement of Operations as Custodian fees
Notes to Financial Statements (Unaudited) (continued)
which totaled $4,404 for the period November 1, 2020 through November 22, 2020.
Note 6–Line of Credit
The Fund and certain other funds managed by New York Life Investments maintain a line of credit with a syndicate of banks in order to secure a source of funds for temporary purposes to meet unanticipated or excessive redemption requests.
Effective July 28, 2020, under the credit agreement (the “Credit Agreement”), the aggregate commitment amount is $600,000,000 with an additional uncommitted amount of $100,000,000. The commitment fee is an annual rate of 0.15% of the average commitment amount payable quarterly, regardless of usage, to JPMorgan, who serves as the agent to the syndicate. The commitment fee is allocated among the Fund and certain other funds managed by New York Life Investments based upon their respective net assets and other factors. Interest on any revolving credit loan is charged based upon the Federal Funds Rate or the one-month London Interbank Offered Rate ("LIBOR"), whichever is higher. The Credit Agreement expires on July 27, 2021, although the Fund, certain other funds managed by New York Life Investments and the syndicate of banks may renew the Credit Agreement for an additional year on the same or different terms or enter into a credit agreement with a different syndicate of banks. Prior to July 28, 2020, the aggregate commitment amount and the commitment fee were the same as those under the current Credit Agreement, but State Street served as agent to the syndicate. During the six-month period ended April 30, 2021, there were no borrowings made or outstanding with respect to the Fund under the Credit Agreement or the credit agreement for which State Street served as agent.
Note 7–Interfund Lending Program
Pursuant to an exemptive order issued by the SEC, the Fund, along with certain other funds managed by New York Life Investments, may participate in an interfund lending program. The interfund lending program provides an alternative credit facility that permits the Fund and certain other funds managed by New York Life Investments to lend or borrow money for temporary purposes directly to or from one another, subject to the conditions of the exemptive order. During the six-month period ended April 30, 2021, there were no interfund loans made or outstanding with respect to the Fund.
Note 8–Purchases and Sales of Securities (in 000’s)
During the six-month period ended April 30, 2021, purchases and sales of securities, other than short-term securities, were $2,393,943 and $410,364, respectively.
The Fund may purchase securities from or sell securities to other portfolios managed by the Subadvisor. These interportfolio transactions are primarily used for cash management purposes and are made
pursuant to Rule 17a-7 under the 1940 Act. During the six-month period ended April 30, 2021, such purchases were $6,059.
Note 9–Capital Share Transactions
Transactions in capital shares for the six-month period ended April 30, 2021 and the year ended October 31, 2020, were as follows:
| Class A | Shares | Amount |
| Period ended April 30, 2021: | | |
| Shares sold | 34,752,124 | $ 460,837,770 |
| Shares issued to shareholders in reinvestment of distributions | 2,292,025 | 30,434,964 |
| Shares redeemed | (14,659,028) | (193,983,039) |
| Net increase (decrease) in shares outstanding before conversion | 22,385,121 | 297,289,695 |
| Shares converted into Class A (See Note 1) | 371,793 | 4,946,960 |
| Shares converted from Class A (See Note 1) | (101,113) | (1,321,313) |
| Net increase (decrease) | 22,655,801 | $ 300,915,342 |
| Year ended October 31, 2020: | | |
| Shares sold | 64,134,306 | $ 808,878,188 |
| Shares issued to shareholders in reinvestment of distributions | 4,927,540 | 62,683,454 |
| Shares redeemed | (76,759,902) | (949,839,658) |
| Net increase (decrease) in shares outstanding before conversion | (7,698,056) | (78,278,016) |
| Shares converted into Class A (See Note 1) | 237,167 | 3,013,015 |
| Shares converted from Class A (See Note 1) | (221,310) | (2,861,337) |
| Net increase (decrease) | (7,682,199) | $ (78,126,338) |
| |
| 82 | MainStay MacKay High Yield Municipal Bond Fund |
| Investor Class | Shares | Amount |
| Period ended April 30, 2021: | | |
| Shares sold | 50,484 | $ 669,780 |
| Shares issued to shareholders in reinvestment of distributions | 6,220 | 82,442 |
| Shares redeemed | (23,520) | (312,472) |
| Net increase (decrease) in shares outstanding before conversion | 33,184 | 439,750 |
| Shares converted into Investor Class (See Note 1) | 19,864 | 263,865 |
| Shares converted from Investor Class (See Note 1) | (61,337) | (811,568) |
| Net increase (decrease) | (8,289) | $ (107,953) |
| Year ended October 31, 2020: | | |
| Shares sold | 199,492 | $ 2,547,545 |
| Shares issued to shareholders in reinvestment of distributions | 13,647 | 173,248 |
| Shares redeemed | (73,368) | (934,794) |
| Net increase (decrease) in shares outstanding before conversion | 139,771 | 1,785,999 |
| Shares converted into Investor Class (See Note 1) | 5,726 | 70,787 |
| Shares converted from Investor Class (See Note 1) | (156,569) | (1,993,820) |
| Net increase (decrease) | (11,072) | $ (137,034) |
| |
| Class C | Shares | Amount |
| Period ended April 30, 2021: | | |
| Shares sold | 2,387,047 | $ 31,613,528 |
| Shares issued to shareholders in reinvestment of distributions | 273,731 | 3,622,759 |
| Shares redeemed | (4,335,397) | (57,416,811) |
| Net increase (decrease) in shares outstanding before conversion | (1,674,619) | (22,180,524) |
| Shares converted from Class C (See Note 1) | (189,506) | (2,505,498) |
| Net increase (decrease) | (1,864,125) | $ (24,686,022) |
| Year ended October 31, 2020: | | |
| Shares sold | 5,029,236 | $ 63,935,114 |
| Shares issued to shareholders in reinvestment of distributions | 626,019 | 7,935,493 |
| Shares redeemed | (11,060,398) | (139,104,400) |
| Net increase (decrease) in shares outstanding before conversion | (5,405,143) | (67,233,793) |
| Shares converted from Class C (See Note 1) | (103,459) | (1,309,737) |
| Net increase (decrease) | (5,508,602) | $ (68,543,530) |
| |
| Class I | Shares | Amount |
| Period ended April 30, 2021: | | |
| Shares sold | 150,680,963 | $ 1,998,054,836 |
| Shares issued to shareholders in reinvestment of distributions | 5,585,707 | 74,209,606 |
| Shares redeemed | (46,749,142) | (620,336,908) |
| Net increase (decrease) in shares outstanding before conversion | 109,517,528 | 1,451,927,534 |
| Shares converted into Class I (See Note 1) | 128,133 | 1,681,738 |
| Shares converted from Class I (See Note 1) | (58,124,631) | (753,324,570) |
| Net increase (decrease) | 51,521,030 | $ 700,284,702 |
| Year ended October 31, 2020: | | |
| Shares sold | 276,884,232 | $ 3,499,814,791 |
| Shares issued to shareholders in reinvestment of distributions | 8,804,329 | 112,056,531 |
| Shares redeemed | (143,249,946) | (1,776,211,777) |
| Net increase (decrease) in shares outstanding before conversion | 142,438,615 | 1,835,659,545 |
| Shares converted into Class I (See Note 1) | 237,826 | 3,081,092 |
| Shares converted from Class I (See Note 1) | (7,232,876) | (93,882,728) |
| Net increase (decrease) | 135,443,565 | $ 1,744,857,909 |
| |
| Class R6 | Shares | Amount |
| Period ended April 30, 2021: | | |
| Shares sold | 29,830,858 | $ 396,325,888 |
| Shares issued to shareholders in reinvestment of distributions | 15,520 | 206,356 |
| Shares redeemed | (9,342,490) | (124,365,503) |
| Net increase (decrease) in shares outstanding before conversion | 20,503,888 | 272,166,741 |
| Shares converted into Class R6 (See Note 1) | 58,179,043 | 753,452,955 |
| Shares converted from Class R6 (See Note 1) | (178,088) | (2,382,569) |
| Net increase (decrease) | 78,504,843 | $ 1,023,237,127 |
| Year ended October 31, 2020:(a) | | |
| Shares sold | 784,866 | $ 10,151,129 |
| Shares issued to shareholders in reinvestment of distributions | 111,721 | 1,438,841 |
| Shares redeemed | (7,616,446) | (96,418,917) |
| Net increase (decrease) in shares outstanding before conversion | (6,719,859) | (84,828,947) |
| Shares converted into Class R6 (See Note 1) | 7,232,876 | 93,882,728 |
| Net increase (decrease) | 513,017 | $ 9,053,781 |
| (a) | The inception date of the class was November 1, 2019. |
Notes to Financial Statements (Unaudited) (continued)
Note 10–Recent Accounting Pronouncement
In March 2020, the Financial Accounting Standards Board issued Accounting Standards Update 2020-04 (“ASU 2020-04”), which provides optional guidance to ease the potential accounting burden associated with transitioning away from LIBOR and other reference rates that are expected to be discontinued. ASU 2020-04 was effective immediately upon release of the update on March 12, 2020 and remains effective through December 31, 2022. At this time, the Manager is evaluating the implications of certain other provisions of ASU 2020-04 related to new disclosure requirements and any impact on the financial statement disclosures has not yet been determined.
Note 11–Other Matters
An outbreak of COVID-19, first detected in December 2019, has developed into a global pandemic and has resulted in travel restrictions, closure of international borders, certain businesses and securities markets, restrictions on securities trading activities, prolonged quarantines, supply chain disruptions, and lower consumer demand, as well as general concern and uncertainty. The continued impact of COVID-19 is uncertain and could further adversely affect the global economy, national economies, individual issuers and capital markets in unforeseeable ways and result in a substantial and extended economic downturn. Developments that disrupt global economies and financial markets, such as COVID-19, may magnify factors that affect the Fund's performance.
Note 12–Subsequent Events
In connection with the preparation of the financial statements of the Fund as of and for the six-month period ended April 30, 2021, events and transactions subsequent to April 30, 2021, through the date the financial statements were issued have been evaluated by the Manager for possible adjustment and/or disclosure. No subsequent events requiring financial statement adjustment or disclosure have been identified.
| 84 | MainStay MacKay High Yield Municipal Bond Fund |
Board Consideration and Approval of Management Agreement and Subadvisory Agreement (Unaudited)
The continuation of the Management Agreement with respect to the MainStay MacKay High Yield Municipal Bond Fund (“Fund”) and New York Life Investment Management LLC (“New York Life Investments”) and the Subadvisory Agreement between New York Life Investments and MacKay Shields LLC (“MacKay”) with respect to the Fund (together, “Advisory Agreements”), following an initial term of up to two years, is subject to annual review and approval by the Board of Trustees of MainStay Funds Trust (“Board” of the “Trust”) in accordance with Section 15 of the Investment Company Act of 1940, as amended (“1940 Act”). At its December 9–10, 2020 meeting, the Board, including the Trustees who are not an “interested person” (as such term is defined in the 1940 Act) of the Trust (“Independent Trustees”) voting separately, unanimously approved the continuation of each of the Advisory Agreements for a one-year period.
In reaching the decision to approve the continuation of each of the Advisory Agreements, the Board considered information furnished by New York Life Investments and MacKay in connection with an annual contract review process undertaken by the Board that took place at meetings of the Board and its Contracts Committee during September 2020 through December 2020, as well as other information furnished to the Board and its Committees throughout the year, as deemed relevant by the Trustees. Information requested by and furnished to the Board for consideration in connection with the contract review process included, among other items, reports on the Fund and “peer funds” prepared by Strategic Insight Mutual Fund Research and Consulting, LLC (“Strategic Insight”), an independent third-party service provider engaged by the Board to report objectively on the Fund’s investment performance, management fee and total expenses. The Board also considered information on the fees charged to other investment advisory clients of New York Life Investments and/or MacKay that follow investment strategies similar to those of the Fund, if any, and, when applicable, the rationale for any differences in the Fund’s management and subadvisory fees and the fees charged to those other investment advisory clients. In addition, the Board considered information furnished by New York Life Investments and MacKay in response to requests prepared on behalf of the Board, and in consultation with the Independent Trustees, by independent legal counsel to the Independent Trustees, which encompassed a variety of topics, including those summarized below.
The Board took into account information provided in connection with its meetings throughout the year, including, among other items, information regarding the legal standards and fiduciary obligations applicable to its consideration of the continuation of each of the Advisory Agreements and investment performance reports on the Fund as well as presentations from New York Life Investments and MacKay personnel. The Board also took into account other information received from New York Life Investments throughout the year, including, among other items, periodic reports on legal and compliance matters, risk management, portfolio turnover, brokerage commissions and non-advisory services provided to the Fund by New York Life Investments. The contract review process, including the structure and format for materials provided to the Board, has been developed in consultation with the Board. The Independent
Trustees also met in executive sessions with their independent legal counsel and, for a portion thereof, with senior management of New York Life Investments.
In addition to information provided to the Board throughout the year, the Board received information in connection with its June 2020 meeting provided specifically in response to requests prepared on behalf of the Board, and in consultation with the Independent Trustees, by independent legal counsel regarding the Fund’s distribution arrangements. In addition, the Board received information regarding the Fund’s asset levels, share purchase and redemption activity and the payment of Rule 12b-1 and/or other fees by applicable share classes of the Fund, among other information.
In considering the continuation of each of the Advisory Agreements, the Trustees reviewed and evaluated the information and factors they believed to reasonably be necessary and appropriate in light of legal advice furnished to them by independent legal counsel and through the exercise of their own business judgment. Although individual Trustees may have weighed certain factors or information differently, the factors considered by the Board are described in greater detail below and include, among other factors: (i) the nature, extent and quality of the services provided to the Fund by New York Life Investments and MacKay; (ii) the qualifications of the portfolio managers of the Fund and the historical investment performance of the Fund, New York Life Investments and MacKay; (iii) the costs of the services provided, and profits realized, by New York Life Investments and MacKay from their relationships with the Fund; (iv) the extent to which economies of scale have been realized or may be realized as the Fund grows and the extent to which economies of scale have benefited or may benefit the Fund’s shareholders; and (v) the reasonableness of the Fund’s management and subadvisory fees and total ordinary operating expenses. Although the Board recognized that comparisons between the Fund’s fees and expenses and those of other funds are imprecise given different terms of agreements, variations in fund strategies and other factors, the Board considered the reasonableness of the Fund’s management fee and total ordinary operating expenses as compared to the peer funds identified by Strategic Insight. Throughout their considerations, the Trustees acknowledged the commitment of New York Life Investments and its affiliates to serve the MainStay Group of Funds, as well as their capacity, experience, resources, financial stability and reputations. The Trustees also acknowledged the entrepreneurial and other risks assumed by New York Life Investments in sponsoring and managing the Fund.
The Trustees noted that, throughout the year, the Trustees are afforded an opportunity to ask questions of, and request additional information or materials from, New York Life Investments and MacKay. The Board’s decision with respect to each of the Advisory Agreements may have also been based, in part, on the Board’s knowledge of New York Life Investments and MacKay resulting from, among other things, the Board’s consideration of each of the Advisory Agreements in prior years, the advisory agreements for other funds in the MainStay Group of Funds, the Board’s review throughout the year of the performance and operations of other funds in the MainStay Group of Funds and each Trustee’s business
Board Consideration and Approval of Management Agreement and Subadvisory Agreement (Unaudited) (continued)
judgment and industry experience. In addition to considering the above-referenced factors, the Board observed that in the marketplace there are a range of investment options available to the Fund’s shareholders and such shareholders, having had the opportunity to consider other investment options, have chosen to invest in the Fund.
The factors that figured prominently in the Board’s decision to approve the continuation of each of the Advisory Agreements during its December 9–10, 2020 meeting are summarized in more detail below, and the Board did not consider any factor or information controlling in reaching such decision.
Nature, Extent and Quality of Services Provided by New York Life Investments and MacKay
The Board examined the nature, extent and quality of the services that New York Life Investments provides to the Fund. The Board evaluated New York Life Investments’ experience and capabilities in serving as manager of the Fund and considered that the Fund operates in a “manager-of-managers” structure. The Board also considered New York Life Investments’ responsibilities and services provided pursuant to this structure, including evaluating the performance of MacKay, making recommendations to the Board as to whether the Subadvisory Agreement should be renewed, modified or terminated and periodically reporting to the Board regarding the results of New York Life Investments’ evaluation and monitoring functions. The Board noted that New York Life Investments manages other mutual funds, serves a variety of other investment advisory clients, including other pooled investment vehicles, and has experience overseeing mutual fund service providers, including subadvisors. The Board considered the experience of senior personnel at New York Life Investments providing management and administrative and other non-advisory services to the Fund as well as New York Life Investments’ reputation and financial condition. The Board observed that New York Life Investments devotes significant resources and time to providing management and non-advisory services to the Fund, including New York Life Investments’ supervision and due diligence reviews of MacKay and ongoing analysis of, and interactions with, MacKay with respect to, among other things, the Fund’s investment performance and risks as well as MacKay’s investment capabilities and subadvisory services with respect to the Fund.
The Board also considered the range of services that New York Life Investments provides to the Fund under the terms of the Management Agreement, including: (i) fund accounting and ongoing supervisory services provided by New York Life Investments’ Fund Administration and Accounting Group; (ii) investment supervisory and analytical services provided by New York Life Investments’ Investment Consulting Group; (iii) compliance services provided by the Trust’s Chief Compliance Officer as well as New York Life Investments’ compliance department, including supervision and implementation of the Fund’s compliance program; (iv) legal services provided by New York Life Investments’ Office of the General Counsel; and (v) risk management monitoring and analysis by compliance and investment personnel. The Board noted that New York Life Investments provides certain other non-advisory services to the Fund.
In addition, the Board considered New York Life Investments’ willingness to invest in personnel, infrastructure, technology, operational enhancements, cyber security, information security, shareholder privacy resources and business continuity planning designed to benefit the Fund and noted that New York Life Investments is responsible for compensating the Trust’s officers, except for a portion of the salary of the Trust’s Chief Compliance Officer. The Board recognized that New York Life Investments has provided an increasingly broad array of non-advisory services to the MainStay Group of Funds as a result of regulatory and other developments, including in connection with the designation of New York Life Investments as the administrator of the MainStay Group of Funds’ liquidity risk management program adopted under the 1940 Act. The Board considered benefits to shareholders from being part of the MainStay Group of Funds, including the privilege of exchanging investments between the same class of shares of funds in the MainStay Group of Funds, including without the imposition of a sales charge (if any).
The Board also examined the nature, extent and quality of the investment advisory services that MacKay provides to the Fund and considered the terms of each of the Advisory Agreements. The Board evaluated MacKay’s experience in serving as subadvisor to the Fund and advising other portfolios and MacKay’s track record and experience in providing investment advisory services, the experience of investment advisory, senior management and administrative personnel at MacKay and New York Life Investments’ and MacKay’s overall resources, legal and compliance environment, capabilities and history. In addition to information provided in connection with quarterly meetings with the Trust’s Chief Compliance Officer, the Board considered information regarding the compliance policies and procedures of New York Life Investments and MacKay and acknowledged their commitment to further developing and strengthening compliance programs relating to the Fund. The Board reviewed MacKay’s ability to attract and retain qualified investment professionals and willingness to invest in personnel to service and support the Fund. In this regard, the Board considered the experience of the Fund’s portfolio managers, the number of accounts managed by the portfolio managers and the method for compensating the portfolio managers.
In addition, the Board considered discussions with New York Life Investments regarding the implementation of its business continuity plans and recognized steps taken by New York Life Investments and MacKay to continue to provide the same nature, extent and quality of services to the Fund during the COVID-19 pandemic.
Based on these considerations, the Board concluded that the Fund would likely continue to benefit from the nature, extent and quality of these services.
Investment Performance
In evaluating the Fund’s investment performance, the Board considered investment performance results over various periods in light of the Fund’s investment objective, strategies and risks. The Board considered
| 86 | MainStay MacKay High Yield Municipal Bond Fund |
investment reports on, and analysis of, the Fund’s performance provided to the Board throughout the year. These reports include, among other items, information on the Fund’s gross and net returns, the Fund’s investment performance compared to relevant investment categories and the Fund’s benchmarks, the Fund’s risk-adjusted investment performance and the Fund’s investment performance as compared to peer funds, as appropriate, as well as portfolio attribution information and commentary on the effect of market conditions. The Board also considered information provided by Strategic Insight showing the investment performance of the Fund as compared to peer funds.
The Board also gave weight to its discussions with senior management at New York Life Investments concerning the Fund’s investment performance attributable to MacKay as well as discussions between the Fund’s portfolio managers and the members of the Board’s Investment Committee, which generally occur on an annual basis. In addition, the Board considered any specific actions that New York Life Investments or MacKay had taken, or had agreed to take, to seek to enhance Fund investment performance and the results of those actions.
Based on these considerations, the Board concluded that its review of the Fund’s investment performance and related information supported a determination to approve the continuation of each of the Advisory Agreements.
Costs of the Services Provided, and Profits Realized, by New York Life Investments and MacKay
The Board considered the costs of the services provided under each of the Advisory Agreements. The Board also considered the profits realized by New York Life Investments and its affiliates, including MacKay, due to their relationships with the Fund. Because MacKay is an affiliate of New York Life Investments whose subadvisory fee is paid by New York Life Investments, not the Fund, the Board considered cost and profitability information for New York Life Investments and MacKay in the aggregate.
In addition, the Board acknowledged the difficulty in obtaining reliable comparative data about mutual fund managers’ profitability because such information generally is not publicly available and may be impacted by numerous factors, including the structure of a fund manager’s organization, the types of funds it manages, the methodology used to allocate certain fixed costs to specific funds and the manager’s capital structure and costs of capital.
In evaluating the costs of the services provided by New York Life Investments and MacKay and profits realized by New York Life Investments and its affiliates, including MacKay, the Board considered, among other factors, each party’s continuing investments in, or willingness to invest in, personnel, systems, equipment and other resources and infrastructure to support and further enhance the management of the Fund, and that New York Life Investments is responsible for paying the subadvisory fee for the Fund. The Board also considered the financial resources of New York Life Investments and MacKay and acknowledged that New York Life Investments and MacKay must be in a position to attract and retain experienced professional
personnel and to maintain a strong financial position for New York Life Investments and MacKay to continue to provide high-quality services to the Fund. The Board recognized that the Fund benefits from the allocation of certain fixed costs among the funds in the MainStay Group of Funds, among other expected benefits resulting from its relationship with New York Life Investments.
The Board considered information regarding New York Life Investments’ methodology for calculating profitability and allocating costs provided by New York Life Investments in connection with the fund profitability analysis presented to the Board. The Board previously engaged an independent consultant to review the methods used to allocate costs among the funds in the MainStay Group of Funds. The Board noted that the independent consultant had concluded that New York Life Investments’ methods for allocating costs and procedures for estimating overall profitability of the relationship with the funds in the MainStay Group of Funds are reasonable and that New York Life Investments continued to use the same method of calculating profit and allocating costs since the independent consultant’s review. The Board recognized the difficulty in calculating and evaluating a manager’s profitability with respect to the Fund and noted that other profitability methodologies may also be reasonable.
The Board also considered certain fall-out benefits that may be realized by New York Life Investments and its affiliates due to their relationships with the Fund, including reputational and other indirect benefits. In addition, the Board considered its review of a money market fund advised by New York Life Investments and an affiliated subadvisor that serves as an investment option for the Fund, including the potential rationale for and costs associated with investments in this money market fund by the Fund, if any, and considered information from New York Life Investments that the nature and type of specific investment advisory services provided to this money market fund are distinct from, or in addition to, the investment advisory services provided to the Fund.
The Board observed that, in addition to fees earned by New York Life Investments for managing the Fund, New York Life Investments’ affiliates also earn revenues from serving the Fund in various other capacities, including as the Fund’s transfer agent and distributor. The Board considered information about these other revenues and their impact on the profitability of the relationship with the Fund to New York Life Investments and its affiliates. The Board noted that, although it assessed the overall profitability of the Fund to New York Life Investments and its affiliates as part of the contract review process, when considering the reasonableness of the fee paid to New York Life Investments and its affiliates under each of the Advisory Agreements, the Board considered the profitability of New York Life Investments’ relationship with the Fund on a pre-tax basis and without regard to distribution expenses incurred by New York Life Investments from its own resources.
After evaluating the information deemed relevant by the Trustees, the Board concluded that any profits realized by New York Life Investments and its affiliates, including MacKay, due to their relationships with the Fund were not excessive.
Board Consideration and Approval of Management Agreement and Subadvisory Agreement (Unaudited) (continued)
Management and Subadvisory Fees and Total Ordinary Operating Expenses
The Board evaluated the reasonableness of the fee paid under each of the Advisory Agreements and the Fund’s total ordinary operating expenses. The Board primarily considered the reasonableness of the management fee paid by the Fund to New York Life Investments, because the subadvisory fee paid to MacKay is paid by New York Life Investments, not the Fund. The Board also considered the reasonableness of the subadvisory fee paid by New York Life Investments and the amount of the management fee retained by New York Life Investments.
In assessing the reasonableness of the Fund’s fees and expenses, the Board primarily considered comparative data provided by Strategic Insight on the fees and expenses charged by similar mutual funds managed by other investment advisers. In addition, the Board considered information provided by New York Life Investments and MacKay on fees charged to other investment advisory clients, including institutional separate accounts and/or other funds that follow investment strategies similar to those of the Fund, if any. The Board considered the similarities and differences in the contractual management fee schedules of the Fund and these similarly-managed accounts and/or funds, taking into account the rationale for any differences in fee schedules. The Board also took into account explanations provided by New York Life Investments about the more extensive scope of services provided to registered investment companies, such as the Fund, as compared with other investment advisory clients. Additionally, the Board considered the impact of contractual breakpoints, voluntary waivers and expense limitation arrangements on the Fund’s net management fee and expenses. The Board also considered that in proposing fees for the Fund, New York Life Investments considers the competitive marketplace for mutual funds. The Board considered its discussions with representatives from New York Life Investments regarding the management fee paid by the Fund. The Board noted that New York Life Investments proposed, and the Board had approved, an additional management fee breakpoint for the Fund, effective February 28, 2021.
The Board noted that, outside of the Fund’s management fee and the fees charged under a share class’s Rule 12b-1 and/or shareholder services plans, a share class’s most significant “other expenses” are transfer agent fees. Transfer agent fees are charged to the Fund based on the number of shareholder accounts (a “per-account” fee). The Board took into account information from New York Life Investments regarding the reasonableness of the Fund’s transfer agent fee schedule, including industry data demonstrating that the per-account fees that NYLIM Service Company LLC, an affiliate of New York Life Investments and the Fund’s transfer agent, charges the Fund are within the range of per-account fees charged by transfer agents to other mutual funds. In addition, the Board considered NYLIM Service Company LLC’s profitability in connection with the transfer agent services it provides to the Fund. The Board also took into account information received from NYLIM Service Company LLC regarding the sub-transfer agency payments it made to intermediaries in connection with the provision of sub-transfer agency services to the Fund.
The Board considered that, because the Fund’s transfer agent fees are billed on a per-account basis, the impact of transfer agent fees on a share class’s expense ratio may be more significant in cases where the share class has a high number of small accounts. The Board considered the extent to which transfer agent fees comprised total expenses of the Fund. The Board acknowledged the role that the MainStay Group of Funds historically has played in serving the investment needs of New York Life Insurance Company customers, who often maintain smaller account balances than other shareholders of funds, and the impact of small accounts on the expense ratios of Fund share classes. The Board also recognized measures that it and New York Life Investments have taken to mitigate the effect of small accounts on the expense ratios of Fund share classes, including through the imposition of an expense limitation on net transfer agency expenses. The Board noted that, for purposes of allocating transfer agency fees and expenses, each retail fund in the MainStay Group of Funds combines the shareholder accounts of its Class A, A2, I, R1, R2 and R3 shares (as applicable) into one group and the shareholder accounts of its Investor Class, SIMPLE Class and Class B, C and C2 shares (as applicable) into another group. The Board also noted that the per-account fees attributable to each group of share classes is then allocated among the constituent share classes based on relative net assets and that a MainStay Fund’s Class R6 shares, if any, are not combined with any other share class for this purpose. The Board considered New York Life Investments’ rationale with respect to these groupings and previously received a report from an independent consultant engaged to conduct comparative analysis of these groupings. The Board also considered that NYLIM Service Company LLC had waived its contractual cost of living adjustments during the past seven years.
Based on the factors outlined above, the Board concluded that the Fund’s management fee and total ordinary operating expenses were within a range that is competitive and support a conclusion that these fees and expenses are reasonable.
Economies of Scale
The Board considered information regarding economies of scale, including whether the Fund’s expense structure permits economies of scale to be appropriately shared with the Fund’s shareholders. The Board also considered a report from New York Life Investments, previously prepared at the request of the Board, that addressed economies of scale, including with respect to the mutual fund business generally and the various ways in which the benefits of economies of scale may be shared with the funds in the MainStay Group of Funds. Although the Board recognized the difficulty of determining economies of scale with precision, the Board acknowledged that economies of scale may be shared with the Fund in a number of ways, including, for example, through the imposition of management fee breakpoints, initially setting management fee rates at scale or making additional investments to enhance services. The Board reviewed information from New York Life Investments showing how the Fund’s management fee schedule compared to fee schedules of other funds and accounts managed by New York Life Investments. The Board
| 88 | MainStay MacKay High Yield Municipal Bond Fund |
also reviewed information from Strategic Insight showing how the Fund’s management fee schedule compared with fees paid for similar services by peer funds at varying asset levels.
Based on this information, the Board concluded that economies of scale are appropriately reflected for the benefit of the Fund’s shareholders through the Fund’s expense structure and other methods to share benefits from economies of scale.
Conclusion
On the basis of the information and factors summarized above, among other information and factors deemed relevant by the Trustees, and the evaluation thereof, the Board, including the Independent Trustees voting separately, unanimously voted to approve the continuation of each of the Advisory Agreements.
Discussion of the Operation and Effectiveness of the Fund's Liquidity Risk Management Program (Unaudited)
In compliance with Rule 22e-4 under the Investment Company Act of 1940, as amended (the “Liquidity Rule”), the Fund has adopted and implemented a liquidity risk management program (the “Program”), which New York Life Investment Management LLC believes is reasonably designed to assess and manage the Fund's liquidity risk (the risk that the Fund could not meet requests to redeem shares issued by the Fund without significant dilution of remaining investors’ interests in the Fund). The Board of Trustees of MainStay Funds Trust (the "Board") designated New York Life Investment Management LLC as administrator of the Program (the “Administrator”). The Administrator has established a Liquidity Risk Management Committee to assist the Administrator in the implementation and day-to-day administration of the Program and to otherwise support the Administrator in fulfilling its responsibilities under the Program.
At a meeting of the Board held on March 8, 2021, the Administrator provided the Board with a written report addressing the Program’s operation and assessing its adequacy and effectiveness of implementation for the period from January 1, 2020 through December 31, 2020 (the "Review Period"), as required under the Liquidity Rule. The report noted that the Administrator concluded that (i) the Program operated effectively to assess and manage the Fund's liquidity risk, (ii) the Program has been adequately and effectively implemented to monitor and, as applicable, respond to the Fund's liquidity developments and (iii) the Fund's investment strategy continues to be appropriate for an open-end fund. In addition, the report discussed notable events that impacted liquidity risk during the Review Period, including the COVID-19 pandemic and the resulting economic shutdown.
In accordance with the Program, the Fund's liquidity risk is assessed no less frequently than annually taking into consideration certain factors, as applicable, such as (i) investment strategy and liquidity of portfolio investments, (ii) short-term and long-term cash flow projections and (iii) holdings of cash and cash equivalents, as well as borrowing arrangements and other funding sources. Certain factors are considered under both normal and reasonably foreseeable stressed conditions.
Each Fund portfolio investment is classified into one of four liquidity categories. The classification is based on a determination of the number of days it is reasonably expected to take to convert the investment into cash, or sell or dispose of the investment, in current market conditions without significantly changing the market value of the investment. The Administrator has delegated liquidity classification determinations to the Fund’s subadvisor, subject to appropriate oversight by the Administrator, and classification determinations are made by taking into account the Fund's reasonably anticipated trade size, various market, trading and investment-specific considerations, as well as market depth, and, in certain cases, third-party vendor data.
The Liquidity Rule requires funds that do not primarily hold assets that are highly liquid investments to adopt a minimum amount of net assets that must be invested in highly liquid investments that are assets (an “HLIM”). In addition, the Liquidity Rule limits a fund's investments in illiquid investments. Specifically, the Liquidity Rule prohibits acquisition of illiquid investments if doing so would result in a fund holding more than 15% of its net assets in illiquid investments that are assets. The Program includes provisions reasonably designed to determine, periodically review and comply with the HLIM requirement, as applicable, and to comply with the 15% limit on illiquid investments.
There can be no assurance that the Program will achieve its objectives under all circumstances in the future. Please refer to the Fund's prospectus for more information regarding the Fund's exposure to liquidity risk and other risks to which it may be subject.
| 90 | MainStay MacKay High Yield Municipal Bond Fund |
Proxy Voting Record
The Fund is required to file with the Securities and Exchange Commissions's ("SEC") its proxy voting records for the 12-month period ending June 30 on Form N-PX. The most recent Form N-PX or proxy voting record is available free of charge upon request by calling 800-624-6782; visiting the MainStay Funds’ website at newyorklifeinvestments.com; or visiting the SEC’s website at www.sec.gov.
Shareholder Reports and Quarterly Portfolio Disclosure
The Fund is required to file its complete schedule of portfolio holdings with the SEC 60 days after its first and third fiscal quarter on Form N-PORT. The Fund's holdings report is available free of charge upon request by calling New York Life Investments at 800-624-6782.
This page intentionally left blank.
This page intentionally left blank.
This page intentionally left blank.
Equity
U.S. Equity
MainStay Epoch U.S. Equity Yield Fund
MainStay MacKay S&P 500 Index Fund
MainStay Winslow Large Cap Growth Fund
MainStay WMC Enduring Capital Fund
MainStay WMC Growth Fund
MainStay WMC Small Companies Fund
MainStay WMC Value Fund
International Equity
MainStay Epoch International Choice Fund
MainStay MacKay International Equity Fund
MainStay WMC International Research Equity Fund
Emerging Markets Equity
MainStay Candriam Emerging Markets Equity Fund
Global Equity
MainStay Epoch Capital Growth Fund
MainStay Epoch Global Equity Yield Fund
Fixed Income
Taxable Income
MainStay Candriam Emerging Markets Debt Fund
MainStay Floating Rate Fund
MainStay MacKay High Yield Corporate Bond Fund
MainStay MacKay Short Duration High Yield Fund
MainStay MacKay Strategic Bond Fund
MainStay MacKay Total Return Bond Fund
MainStay MacKay U.S. Infrastructure Bond Fund
MainStay Short Term Bond Fund
Tax-Exempt Income
MainStay MacKay California Tax Free Opportunities Fund1
MainStay MacKay High Yield Municipal Bond Fund
MainStay MacKay Intermediate Tax Free Bond Fund
MainStay MacKay New York Tax Free Opportunities Fund2
MainStay MacKay Short Term Municipal Fund
MainStay MacKay Tax Free Bond Fund
Money Market
MainStay Money Market Fund
Mixed Asset
MainStay Balanced Fund
MainStay Income Builder Fund
MainStay MacKay Convertible Fund
Speciality
MainStay CBRE Global Infrastructure Fund
MainStay CBRE Real Estate Fund
MainStay Cushing MLP Premier Fund
Asset Allocation
MainStay Conservative Allocation Fund
MainStay Conservative ETF Allocation Fund
MainStay Defensive ETF Allocation Fund
MainStay Equity Allocation Fund
MainStay Equity ETF Allocation Fund
MainStay Growth Allocation Fund
MainStay Growth ETF Allocation Fund
MainStay Moderate Allocation Fund
MainStay Moderate ETF Allocation Fund
Manager
New York Life Investment Management LLC
New York, New York
Subadvisors
Candriam Belgium S.A.3
Brussels, Belgium
Candriam Luxembourg S.C.A.3
Strassen, Luxembourg
CBRE Clarion Securities LLC
Radnor, Pennsylvania
Cushing Asset Management, LP
Dallas, Texas
Epoch Investment Partners, Inc.
New York, New York
MacKay Shields LLC3
New York, New York
NYL Investors LLC3
New York, New York
Wellington Management Company LLP
Boston, Massachusetts
Winslow Capital Management, LLC
Minneapolis, Minnesota
Legal Counsel
Dechert LLP
Washington, District of Columbia
Independent Registered Public Accounting Firm
KPMG LLP
Philadelphia, Pennsylvania
Distributor
NYLIFE Distributors LLC3
Jersey City, New Jersey
Custodian
JPMorgan Chase Bank, N.A.
New York, New York
1.
This Fund is registered for sale in AZ, CA, NV, OR, TX, UT, WA and MI (Class A and I shares only), and CO, FL, GA, HI, ID, MA, MD, NH, NJ and NY (Class I shares only).
| 2. | This Fund is registered for sale in CA, CT, DE, FL, MA, NJ, NY and VT. |
| 3. | An affiliate of New York Life Investment Management LLC. |
Not part of the Semiannual Report
For more information
800-624-6782
newyorklifeinvestments.com
“New York Life Investments” is both a service mark, and the common trade name, of certain investment advisors affiliated with New York Life Insurance Company. The MainStay Funds® are managed by New York Life Investment Management LLC and distributed by NYLIFE Distributors LLC, 30 Hudson Street, Jersey City, NJ 07302, a wholly owned subsidiary of New York Life Insurance Company. NYLIFE Distributors LLC is a Member FINRA/SIPC.
©2021 NYLIFE Distributors LLC. All rights reserved.
| 1738288MS071-21 | MSMHY10-06/21 |
(NYLIM) NL243
MainStay MacKay New York Tax Free Opportunities Fund
Message from the President and Semiannual Report
Unaudited | April 30, 2021
Sign up for e-delivery of your shareholder reports. For full details on e-delivery, including who can participate and what you can receive via e-delivery,
please log in to newyorklifeinvestments.com/accounts.
| Not FDIC/NCUA Insured | Not a Deposit | May Lose Value | No Bank Guarantee | Not Insured by Any Government Agency |
This page intentionally left blank
Message from the President
With the approval of COVID-19 vaccines and the passage of relief packages by the U.S. Congress, economic prospects improved during the reporting period, and investor risk appetite increased, benefiting both equities and fixed-income markets. Despite some volatility stemming from a sell-off in longer-dated Treasury securities, the stock market and higher-risk segments of the fixed-income market posted gains for the six months ended April 30, 2021.
By the beginning of the reporting period, the economy had made tremendous progress from the second quarter of 2020, when economic activity plunged. But uncertainty about when vaccines would be available and how quickly they could be administered left investors unsure about the economic outlook.
With the approval of several vaccines in November, the outlook brightened and investors became less risk-averse. Anticipating the likely end of the pandemic and a continuation of the economic recovery, they began to see opportunities in investment-grade and high-yield bonds and more cyclical segments of the stock market. The $900 billion relief and stimulus package passed in December provided further assurance.
In January, the Federal Reserve opted to leave interest rates unchanged, pointing to some uncertainty about the pace of the global recovery. Officials also noted that inflation remained low, citing oil prices in particular.
In March, President Biden signed the $1.9 billion American Rescue Plan, which, among other provisions, called for payments of $1,400 for those earning less than $75,000 per year, plus $1,400 per dependent. This, combined with the Federal Reserve’s new tolerance for inflation and an anticipated $2 trillion infrastructure spending bill, added to growing concerns about higher prices. Supply shortages in some markets caused some prices to soar, heightening concerns further.
In fixed-income markets, an improving economic outlook and rising inflation expectations led to a sell-off in longer-term Treasuries, with the result that the yield on the 10-year note rose sharply, particularly in February and March. Investment grade corporate bonds were also affected. Early in the reporting period, they performed well as investors shifted out of Treasuries, but as the reporting period progressed, they faltered. Longer-dated securities issued in recent years at historically low interest rates became especially unattractive.
High-yield bonds remained steady, supported by more favorable yields and an improved economic outlook, which reduced their perceived risk. Municipal bonds produced modest gains, and
although the sell-off in Treasuries produced some volatility early in 2021, stronger-than-expected tax revenues, $350 billion in financial support from the federal government, and the possibility of an increase in federal income tax rates appeared to buoy the market late in the reporting period.
Inflation concerns and volatility in the Treasury market led to a shift in equities markets. Although the S&P 500® Index, a widely followed measure of U.S. equities, posted double-digit gains and hit a record high, the rise of Treasury yields disrupted valuations, especially those of growth stocks. Technology companies that saw their valuations soar amid the work-from-home trend in 2020 suffered large declines.
But the fiscal stimulus and continued accommodation from the Federal Reserve gave investors confidence the economic recovery would continue. Combined with the sky-high valuations in technology and growth stocks, this increased the appeal of more cyclical and value-oriented shares. As a result, value stocks outperformed growth stocks during the reporting period.
Reflecting the shift in investor sentiment, the performance of S&P 500® Index sectors varied widely. While the information technology sector kept up with the broader market, it lagged cyclical sectors such as energy and financials, which led the way. The shift was further reflected in the performance of small-cap stocks, which outperformed large caps. While developed markets kept pace with the U.S. market, lagging economic and pandemic recoveries appeared to weigh on emerging markets late in the reporting period.
With the lockdown restrictions lifting in the U.S. and the pandemic easing in many regions, we at New York Life Investments are looking forward to a return to a more normal economy. We anticipate that over the next several years, a variety of trends will likely offer long-term investors many attractive opportunities. With this in mind, we continue to develop products and services to help you to take advantage of these trends, manage your risks, and ultimately meet your investment goals.
Sincerely,
Kirk C. Lehneis
President
The opinions expressed are as of the date of this report and are subject to change. There is no guarantee that any forecast made will come to pass. This material does not constitute investment advice and is not intended as an endorsement of any specific investment. Past performance is no guarantee of future results.
Not part of the Semiannual Report
Investors should refer to the Fund’s Summary Prospectus and/or Prospectus and consider the Fund’s investment objectives, strategies, risks, charges and expenses carefully before investing. The Summary Prospectus and/or Prospectus contain this and other information about the Fund. You may obtain copies of the Fund’s Summary Prospectus, Prospectus and Statement of Additional Information free of charge, upon request, by calling toll-free 800-624-6782, by writing to NYLIFE Distributors LLC, Attn: MainStay Marketing Department, 30 Hudson Street, Jersey City, NJ 07302 or by sending an e-mail to MainStayShareholderServices@nylim.com. These documents are also available via the MainStay Funds’ website at newyorklifeinvestments.com. Please read the Fund’s Summary Prospectus and/or Prospectus carefully before investing.
Investment and Performance Comparison (Unaudited)
Performance data quoted represents past performance. Past performance is no guarantee of future results. Because of market volatility and other factors, current performance may be lower or higher than the figures shown. Investment return and principal value will fluctuate, and as a result, when shares are redeemed, they may be worth more or less than their original cost. The graph below depicts the historical performance of Class I shares of the Fund. Performance will vary from class to class based on differences in class-specific expenses and sales charges. For performance information current to the most recent month-end, please call 800-624-6782 or visit newyorklifeinvestments.com.
The performance table and graph do not reflect the deduction of taxes that a shareholder would pay on distributions or Fund share redemptions. Total returns reflect maximum applicable sales charges as indicated in the table below, if any, changes in share price, and reinvestment of dividend and capital gain distributions. The graph assumes the initial investment amount shown below and reflects the deduction of all sales charges that would have applied for the period of investment. Performance figures may reflect certain fee waivers and/or expense limitations, without which total returns may have been lower. For more information on share classes and current fee waivers and/or expense limitations (if any), please refer to the Notes to Financial Statements.
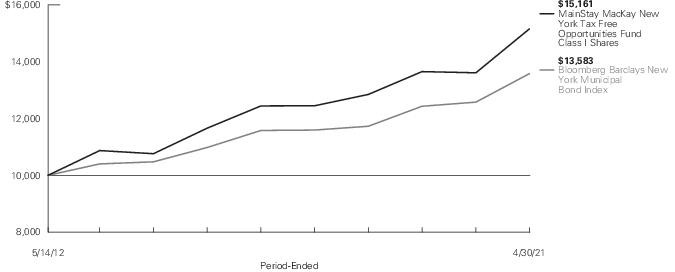
| Average Annual Total Returns for the Period-Ended April 30, 2021 |
| Class | Sales Charge | | Inception
Date | Six
Months | One
Year
or Since
Inception | Five
Years | Since
Inception | Gross
Expense
Ratio1 |
| Class A Shares | Maximum 4.5% Initial Sales Charge | With sales charges | 5/14/2012 | -0.26% | 6.22% | 2.82% | 3.95% | 0.75% |
| | | Excluding sales charges | | 4.44 | 11.23 | 3.77 | 4.48 | 0.75 |
| Investor Class Shares2 | Maximum 4% Initial Sales Charge | With sales charges | 5/14/2012 | 0.26 | 6.21 | 2.80 | 3.88 | 0.77 |
| | | Excluding sales charges | | 4.44 | 11.22 | 3.75 | 4.42 | 0.77 |
| Class C Shares | Maximum 1% CDSC | With sales charges | 5/14/2012 | 3.30 | 9.83 | 3.49 | 4.15 | 1.02 |
| | if Redeemed Within One Year of Purchase | Excluding sales charges | | 4.30 | 10.83 | 3.49 | 4.15 | 1.02 |
| Class C2 Shares | Maximum 1% CDSC | With sales charges | 8/31/2020 | 3.12 | 2.60 | N/A | N/A | 1.17 |
| | if Redeemed Within One Year of Purchase | Excluding sales charges | | 4.12 | 3.60 | N/A | N/A | 1.17 |
| Class I Shares | No Sales Charge | | 5/14/2012 | 4.57 | 11.39 | 4.03 | 4.75 | 0.50 |
| Class R6 Shares | No Sales Charge | | 11/1/2019 | 4.58 | 11.42 | N/A | 4.81 | 0.48 |
| 1. | The gross expense ratios presented reflect the Fund’s “Total Annual Fund Operating Expenses” from the most recent Prospectus, as supplemented, and may differ from other expense ratios disclosed in this report. |
| 2. | Prior to June 30, 2020, the maximum initial sales charge for Investor Class shares was 4.5%, which is reflected in the average annual total return figures shown. |
The footnotes on the next page are an integral part of the table and graph and should be carefully read in conjunction with them.
| Benchmark Performance | Six
Months | One
Year | Five
Years | Since
Inception |
| Bloomberg Barclays New York Municipal Bond Index1 | 3.50% | 8.00% | 3.24% | 3.48% |
| Morningstar Muni New York Long Category Average2 | 4.48 | 10.35 | 3.44 | 3.42 |
| 1. | The Bloomberg Barclays New York Municipal Bond Index is the Fund’s primary broad-based securities market index for comparison purposes. The Bloomberg Barclays New York Municipal Bond Index is a market valueweighted index of New York investment grade tax exempt fixed-rate municipal bonds with maturities of one year or more. Results assume reinvestment of all dividends and capital gains. An investment cannot be made directly in an index. |
| 2. | The Morningstar Muni New York Long Category Average is representative of funds that invest at least 80% of assets in New York municipal debt. These portfolios have durations of more than 7.0 years. Results are based on average total returns of similar funds with all dividends and capital gain distributions reinvested. |
The footnotes on the preceding page are an integral part of the table and graph and should be carefully read in conjunction with them.
| 6 | MainStay MacKay New York Tax Free Opportunities Fund |
Cost in Dollars of a $1,000 Investment in MainStay MacKay New York Tax Free Opportunities Fund (Unaudited)
The example below is intended to describe the fees and expenses borne by shareholders during the six-month period from November 1, 2020, to April 30, 2021, and the impact of those costs on your investment.
Example
As a shareholder of the Fund you incur two types of costs: (1) transaction costs, including exchange fees and sales charges (loads) on purchases (as applicable), and (2) ongoing costs, including management fees, distribution and/or service (12b-1) fees, and other Fund expenses (as applicable). This example is intended to help you understand your ongoing costs (in dollars) of investing in the Fund and to compare these costs with the ongoing costs of investing in other mutual funds. The example is based on an investment of $1,000 made at the beginning of the six-month period and held for the entire period from November 1, 2020, to April 30, 2021.
This example illustrates your Fund’s ongoing costs in two ways:
Actual Expenses
The second and third data columns in the table below provide information about actual account values and actual expenses. You may use the information in these columns, together with the amount you invested, to estimate the expenses that you paid during the six months ended April 30, 2021. Simply divide your account value by $1,000 (for example, an
$8,600 account value divided by $1,000 = 8.6), then multiply the result by the number under the heading entitled “Expenses Paid During Period” to estimate the expenses you paid on your account during this period.
Hypothetical Example for Comparison Purposes
The fourth and fifth data columns in the table below provide information about hypothetical account values and hypothetical expenses based on the Fund’s actual expense ratio and an assumed rate of return of 5% per year before expenses, which is not the Fund’s actual return. The hypothetical account values and expenses may not be used to estimate the actual ending account balances or expenses you paid for the six-month period shown. You may use this information to compare the ongoing costs of investing in the Fund with the ongoing costs of investing in other mutual funds. To do so, compare this 5% hypothetical example with the 5% hypothetical examples that appear in the shareholder reports of the other mutual funds.
Please note that the expenses shown in the table are meant to highlight your ongoing costs only and do not reflect any transactional costs, such as exchange fees or sales charges (loads). Therefore, the fourth and fifth data columns of the table are useful in comparing ongoing costs only and will not help you determine the relative total costs of owning different funds. In addition, if these transactional costs were included, your costs would have been higher.
| Share Class | Beginning
Account
Value
11/1/20 | Ending Account
Value (Based
on Actual
Returns and
Expenses)
4/30/21 | Expenses
Paid
During
Period1 | Ending Account
Value (Based
on Hypothetical
5% Annualized
Return and
Actual Expenses)
4/30/21 | Expenses
Paid
During
Period1 | Net Expense
Ratio
During
Period2 |
| Class A Shares | $1,000.00 | $1,044.40 | $3.80 | $1,021.08 | $3.76 | 0.75% |
| Investor Class Shares | $1,000.00 | $1,044.40 | $3.85 | $1,021.03 | $3.81 | 0.76% |
| Class C Shares | $1,000.00 | $1,043.00 | $5.12 | $1,019.79 | $5.06 | 1.01% |
| Class C2 Shares | $1,000.00 | $1,041.20 | $5.82 | $1,019.09 | $5.76 | 1.15% |
| Class I Shares | $1,000.00 | $1,045.70 | $2.54 | $1,022.32 | $2.51 | 0.50% |
| Class R6 Shares | $1,000.00 | $1,045.80 | $2.38 | $1,022.46 | $2.36 | 0.47% |
| 1. | Expenses are equal to the Fund’s annualized expense ratio of each class multiplied by the average account value over the period, divided by 365 and multiplied by 181 (to reflect the six-month period). The table above represents the actual expenses incurred during the six-month period. In addition to the fees and expenses which the Fund bears directly, it also indirectly bears a pro rata share of the fees and expenses of the underlying funds in which it invests. Such indirect expenses are not included in the above-reported expense figures. |
| 2. | Expenses are equal to the Fund's annualized expense ratio to reflect the six-month period. |
Industry Composition as of April 30, 2021 (Unaudited)
| Other Revenue | 35.0% |
| Education | 14.1 |
| Transportation | 12.5 |
| Hospital | 12.2 |
| General Obligation | 9.1 |
| Water & Sewer | 5.9 |
| Utilities | 3.0 |
| Housing | 1.9 |
| Development | 0.2% |
| Certificate of Participation/Lease | 0.1 |
| Multi–Family Housing | 0.0‡ |
| Closed–End Funds | 0.1 |
| Short–Term Investment | 4.2 |
| Other Assets, Less Liabilities | 1.7 |
| | 100.0% |
‡ Less than one-tenth of a percent.
See Portfolio of Investments beginning on page 11 for specific holdings within these categories. The Fund's holdings are subject to change.
Top Ten Issuers Held as of April 30, 2021 (excluding short-term investments) (Unaudited)
| 1. | New York State Dormitory Authority, 0.15%-6.00%, due 7/1/32–7/1/53 |
| 2. | New York Transportation Development Corp., 4.00%-5.375%, due 8/1/26–4/30/53 |
| 3. | Metropolitan Transportation Authority, 4.00%-5.25%, due 5/15/22–11/15/52 |
| 4. | Triborough Bridge & Tunnel Authority, 0.085%-5.00%, due 1/1/32–11/15/54 |
| 5. | New York City Industrial Development Agency, (zero coupon)-5.00%, due 7/1/28–3/1/49 |
| 6. | Build NYC Resource Corp., 4.00%-5.50%, due 7/1/30–6/1/52 |
| 7. | Monroe County Industrial Development Corp., 4.00%-5.00%, due 6/1/24–7/1/50 |
| 8. | Brookhaven Local Development Corp., 3.375%-5.25%, due 10/1/33–11/1/55 |
| 9. | New York City Housing Development Corp., 3.00%-5.00%, due 7/1/23–2/15/48 |
| 10. | New York City Water & Sewer System, 0.04%-5.00%, due 6/15/34–6/15/50 |
| 8 | MainStay MacKay New York Tax Free Opportunities Fund |
Portfolio Management Discussion and Analysis (Unaudited)
Questions answered by portfolio managers John Loffredo, CFA, Robert DiMella, CFA, Michael Petty, David Dowden, Scott Sprauer and Frances Lewis of MacKay Shields LLC, the Fund’s Subadvisor.
How did MainStay MacKay New York Tax Free Opportunities Fund perform relative to its benchmark and peer group during the six months ended April 30, 2021?
For the six months ended April 30, 2021, Class I shares of MainStay MacKay New York Tax Free Opportunities Fund returned 4.57%, outperforming the 3.50% return of the Fund’s primary benchmark, the Bloomberg Barclays New York Municipal Bond Index (the "Index"). Over the same period, Class I shares also outperformed the 4.48% return of the Morningstar Muni New York Long Category Average.1
What factors affected the Fund’s relative performance during the reporting period?
During the reporting period, both tax-exempt and taxable investment-grade municipal bonds posted positive returns. However, the high-yield segment of the market outperformed both investment-grade and taxable municipal bonds as investors extended out the yield curve2 and went down the rating scale looking for yield. Furthermore, relative performance in the long end outperformed short-end maturities.
In addition, municipal demand was revived with the availability of COVID-19 vaccines and the growing expectation of the impact of the American Rescue Plan Act of 2021 on the fiscal health of states, local governments and various municipal government agencies and authorities.
During this period, the Fund outperformed the Bloomberg Barclays New York Municipal Bond Index primarily due to security selection among, and underweight exposure to, higher-quality investment-grade bonds. From a geographic perspective, overweight exposure to bonds from Puerto Rico also made positive contributions to relative performance. (Contributions take weightings and total returns into account.)
During the reporting period, how was the Fund’s performance materially affected by investments in derivatives?
During the reporting period, the Fund held a small position in U.S. Treasury futures that had minimal impact on relative performance.
What was the Fund’s duration3 strategy during the reporting period?
During the reporting period, the Fund maintained a longer duration posture than the benchmark. The Fund’s duration was targeted to remain in a neutral range relative to the municipal bonds in which the Fund can invest, as outlined in its prospectus. In addition to investment-grade New York municipal bonds, the Fund may also invest in bonds of U.S. territories (Puerto Rico, Guam and the U.S. Virgin Islands) and up to 20% of net assets in municipal securities rated below investment grade. Because the Fund’s investable universe is broader than that of the Bloomberg Barclays New York Municipal Bond Index, the Fund’s duration may differ from that of the Index. As of April 30, 2021, the Fund’s modified duration to worst4 was 5.40 years, while the Index had a modified duration to worst of 4.77 years.
During the reporting period, which sectors were the strongest positive contributors to the Fund’s relative performance and which sectors were particularly weak?
During the reporting period, security selection in the special tax, education and IDR/PCR (industry development revenue/pollution control revenue) sectors made positive contributions to the Fund’s relative performance. Conversely, underweight exposure to the transportation sector was a drag on relative performance.
What were some of the Fund’s largest purchases and sales during the reporting period?
As the Fund remains focused on diversification and liquidity, no individual purchase or sale was considered significant, although sector overweights or security structure, in their entirety, had an impact on the Fund's performance during the reporting period.
| 1. | See page 5 for other share class returns, which may be higher or lower than Class I share returns. See page 6 for more information on benchmark and peer group returns. |
| 2. | The yield curve is a line that plots the yields of various securities of similar quality—typically U.S. Treasury issues—across a range of maturities. The U.S. Treasury yield curve serves as a benchmark for other debt and is used in economic forecasting. |
| 3. | Duration is a measure of the price sensitivity of a fixed-income investment to changes in interest rates. Duration is expressed as a number of years and is considered a more accurate sensitivity gauge than average maturity. |
| 4. | Modified duration is inversely related to the approximate percentage change in price for a given change in yield. Duration to worst is the duration of a bond computed using the bond’s nearest call date or maturity, whichever comes first. This measure ignores future cash flow fluctuations due to embedded optionality. |
How did the Fund’s sector weighting change during the reporting period?
During the reporting period, there were no material changes to the sector allocations. There was an increase in the Fund’s allocation to the other revenue, special tax and leasing sectors. Conversely, there was a decrease in the Fund’s allocation to the prerefunded/ETM (escrowed to maturity), education and hospital sectors. Across geography, consistent with the team's 2021 Municipal Market Insights,5 the Fund increased its state exposure to bonds from Puerto Rico. Lastly, the Fund increased its credit exposure to bonds rated CCC and CC, while decreasing its credit exposure to bonds rated A and B.6
How was the Fund positioned at the end of the reporting period?
As of April 30, 2021, the Fund held overweight positions relative to the Bloomberg Barclays New York Municipal Bond Index in the hospital and education sectors. The Fund also held overweight exposure to bonds from Puerto Rico, which are not held in the benchmark, and an overweight position in credits rated BBB.7
As of the same date, the Fund held relatively underweight exposure to the special tax and transportation sectors. Other underweight exposures relative to the benchmark included AA-rated8 securities and bonds with maturities of five to ten years.
| 5. | To view the 2021 Municipal Market Insights visit newyorklifeinvestments.com/insights. |
| 6. | An obligation rated ‘A’ by Standard & Poor’s (“S&P”) is deemed by S&P to be somewhat more susceptible to the adverse effects of changes in circumstances and economic conditions than obligations in higher-rated categories. In the opinion of S&P, however, the obligor's capacity to meet its commitment on the obligation is still strong. An obligation rated ‘B’ by S&P is deemed by S&P to be more vulnerable to nonpayment than obligations rated ‘BB’, but in the opinion of S&P, the obligor currently has the capacity to meet its financial commitment on the obligation. It is the opinion of S&P that adverse business, financial, or economic conditions will likely impair the obligor's capacity or willingness to meet its financial commitment on the obligation. An obligation rated ‘CCC’ by S&P is deemed by S&P to be currently vulnerable to nonpayment and is dependent upon favorable business, financial and economic conditions for the obligor to meet its financial commitment on the obligation. It is the opinion of S&P that in the event of adverse business, financial or economic conditions, the obligor is not likely to have the capacity to meet its financial commitment on the obligation. An obligation rated 'CC' by S&P is deemed by S&P to be currently highly vulnerable to nonpayment. The 'CC' rating is used when a default has not yet occurred, but S&P expects default to be a virtual certainty, regardless of the anticipated time to default. When applied to Fund holdings, ratings are based solely on the creditworthiness of the bonds in the portfolio and are not meant to represent the security or safety of the Fund. |
| 7. | An obligation rated ‘BBB’ by S&P is deemed by S&P to exhibit adequate protection parameters. In the opinion of S&P, however, adverse economic conditions or changing circumstances are more likely to lead to a weakened capacity of the obligor to meet its financial commitment on the obligation. When applied to Fund holdings, ratings are based solely on the creditworthiness of the bonds in the portfolio and are not meant to represent the security or safety of the Fund. |
| 8. | An obligation rated ‘AA’ by S&P is deemed by S&P to differ from the highest-rated obligations only to a small degree. In the opinion of S&P, the obligor's capacity to meet its financial commitment on the obligation is very strong. When applied to Fund holdings, ratings are based solely on the creditworthiness of the bonds in the portfolio and are not meant to represent the security or safety of the Fund. |
The opinions expressed are those of the portfolio managers as of the date of this report and are subject to change. There is no guarantee that any forecasts will come to pass. This material does not constitute investment advice and is not intended as an endorsement of any specific investment.
| 10 | MainStay MacKay New York Tax Free Opportunities Fund |
Portfolio of Investments April 30, 2021† (Unaudited)
| | Principal
Amount | Value |
| Municipal Bonds 94.0% |
| Long-Term Municipal Bonds 91.9% |
| Certificate of Participation/Lease 0.1% |
| Rensselaer City School District, Certificate Participation | | |
| Insured: AGM ST AID WITHHLDG | | |
| 4.00%, due 6/1/34 | $ 650,000 | $ 724,661 |
| Insured: AGM ST AID WITHHLDG | | |
| 4.00%, due 6/1/35 | 850,000 | 945,991 |
| | | 1,670,652 |
| Development 0.2% |
| Build NYC Resource Corp., YMCA of Greater New York, Revenue Bonds | | |
| 5.00%, due 8/1/32 | 1,000,000 | 1,060,270 |
| 5.00%, due 8/1/42 | 1,000,000 | 1,060,269 |
| Dutchess County Local Development Corp., Health Quest Systems, Inc., Revenue Bonds | | |
| Series A | | |
| 5.00%, due 7/1/34 | 500,000 | 573,472 |
| | | 2,694,011 |
| Education 14.1% |
| Albany Capital Resource Corp., Albany College of Pharmacy and Health Sciences, Revenue Bonds | | |
| Series A | | |
| 5.00%, due 12/1/33 | 150,000 | 167,256 |
| Albany Capital Resource Corp., Albany Leadership Charter High School For Girls Project, Revenue Bonds | | |
| 5.00%, due 6/1/49 | 2,380,000 | 2,616,045 |
| Albany Industrial Development Agency, Brighter Choice Charter School, Revenue Bonds | | |
| Series A | | |
| 5.00%, due 4/1/27 | 1,205,000 | 1,208,649 |
| Series A | | |
| 5.00%, due 4/1/37 | 1,000,000 | 1,002,076 |
| Amherst Development Corp., Daemen College Project, Revenue Bonds | | |
| 4.00%, due 10/1/37 | 1,000,000 | 1,049,004 |
| 5.00%, due 10/1/43 | 2,000,000 | 2,237,076 |
| 5.00%, due 10/1/48 | 2,000,000 | 2,224,509 |
| | Principal
Amount | Value |
| |
| Education (continued) |
| Buffalo & Erie County Industrial Land Development Corp., D'Youville College Project, Revenue Bonds | | |
| Series A | | |
| 4.00%, due 11/1/40 | $ 1,000,000 | $ 1,153,008 |
| Series A | | |
| 4.00%, due 11/1/50 | 5,000,000 | 5,659,329 |
| Buffalo & Erie County Industrial Land Development Corp., Tapestry Charter School Project, Revenue Bonds | | |
| Series A | | |
| 5.00%, due 8/1/47 | 500,000 | 554,411 |
| Series A | | |
| 5.00%, due 8/1/52 | 3,995,000 | 4,417,791 |
| Build NYC Resource Corp., Children's Aid Society Project, Revenue Bonds | | |
| 5.00%, due 7/1/45 | 1,120,000 | 1,285,619 |
| Build NYC Resource Corp., Inwood Academy Leadership Charter School Project, Revenue Bonds (a) | | |
| Series A | | |
| 5.125%, due 5/1/38 | 800,000 | 908,122 |
| Series A | | |
| 5.50%, due 5/1/48 | 1,500,000 | 1,708,556 |
| Build NYC Resource Corp., Manhattan College Project, Revenue Bonds | | |
| 4.00%, due 8/1/42 | 1,500,000 | 1,645,075 |
| 5.00%, due 8/1/47 | 240,000 | 281,738 |
| Build NYC Resource Corp., Metropolitan College of New York, Revenue Bonds | | |
| 5.50%, due 11/1/44 | 2,500,000 | 2,721,060 |
| Build NYC Resource Corp., Metropolitan Lighthouse Charter School Project, Revenue Bonds (a) | | |
| Series A | | |
| 5.00%, due 6/1/32 | 1,000,000 | 1,131,888 |
| Series A | | |
| 5.00%, due 6/1/37 | 1,500,000 | 1,682,733 |
| Series A | | |
| 5.00%, due 6/1/47 | 3,100,000 | 3,436,549 |
| Series A | | |
| 5.00%, due 6/1/52 | 1,500,000 | 1,659,764 |
| Build NYC Resource Corp., New York Law School Project, Revenue Bonds | | |
| 5.00%, due 7/1/30 | 3,865,000 | 4,383,782 |
The notes to the financial statements are an integral part of, and should be read in conjunction with, the financial statements.
11
Portfolio of Investments April 30, 2021† (Unaudited) (continued)
| | Principal
Amount | Value |
| Long-Term Municipal Bonds (continued) |
| Education (continued) |
| Build NYC Resource Corp., New York Law School Project, Revenue Bonds (continued) | | |
| 5.00%, due 7/1/33 | $ 1,520,000 | $ 1,699,392 |
| 5.00%, due 7/1/41 | 1,050,000 | 1,160,420 |
| County of Cattaraugus, St. Bonaventure University Project, Revenue Bonds | | |
| Series A | | |
| 5.00%, due 5/1/44 | 1,200,000 | 1,298,315 |
| Dutchess County Local Development Corp., Bard College Project, Revenue Bonds (a) | | |
| Series A | | |
| 5.00%, due 7/1/40 | 1,100,000 | 1,330,834 |
| Series A | | |
| 5.00%, due 7/1/51 | 1,000,000 | 1,189,046 |
| Dutchess County Local Development Corp., Culinary Institute of America Project (The), Revenue Bonds | | |
| Series A-1 | | |
| 5.00%, due 7/1/31 | 375,000 | 428,595 |
| Series A-1 | | |
| 5.00%, due 7/1/33 | 700,000 | 795,714 |
| Dutchess County Local Development Corp., Marist College Project, Revenue Bonds | | |
| Series A | | |
| 5.00%, due 7/1/39 | 1,000,000 | 1,089,779 |
| 5.00%, due 7/1/43 | 2,000,000 | 2,489,981 |
| 5.00%, due 7/1/48 | 4,000,000 | 4,980,295 |
| Hempstead Town Local Development Corp., Molloy College Project, Revenue Bonds | | |
| 5.00%, due 7/1/38 | 870,000 | 1,046,949 |
| 5.00%, due 7/1/43 | 1,020,000 | 1,213,227 |
| 5.00%, due 7/1/48 | 1,100,000 | 1,300,457 |
| Madison County Capital Resource Corp., Colgate University Project, Revenue Bonds | | |
| Series A | | |
| 5.00%, due 7/1/29 | 1,000,000 | 1,056,831 |
| | Principal
Amount | Value |
| |
| Education (continued) |
| Monroe County Industrial Development Corp., Nazareth College of Rochester, Revenue Bonds | | |
| Series A | | |
| 4.00%, due 10/1/47 | $ 1,695,000 | $ 1,844,479 |
| Monroe County Industrial Development Corp., St John Fisher College, Revenue Bonds | | |
| Series A | | |
| 5.00%, due 6/1/24 | 330,000 | 345,137 |
| Monroe County Industrial Development Corp., University of Rochester, Revenue Bonds | | |
| Series C | | |
| 4.00%, due 7/1/43 | 3,000,000 | 3,392,010 |
| Series D | | |
| 4.00%, due 7/1/43 | 2,470,000 | 2,792,755 |
| Series A | | |
| 4.00%, due 7/1/50 | 6,500,000 | 7,540,430 |
| New York State Dormitory Authority, Brooklyn Law School, Revenue Bonds | | |
| Series A | | |
| 5.00%, due 7/1/33 | 1,650,000 | 2,048,602 |
| New York State Dormitory Authority, Culinary Institute of America (The), Revenue Bonds | | |
| 6.00%, due 7/1/38 | 1,500,000 | 1,505,208 |
| New York State Dormitory Authority, Fordham University, Revenue Bonds | | |
| 4.00%, due 7/1/50 | 13,330,000 | 15,239,020 |
| Series A | | |
| 5.00%, due 7/1/41 | 1,075,000 | 1,289,548 |
| New York State Dormitory Authority, Friends of The Bay Shore-Brightwaters Public Library, Inc., Revenue Bonds | | |
| Insured: AMBAC | | |
| 4.625%, due 7/1/36 | 200,000 | 200,057 |
| New York State Dormitory Authority, New School (The), Revenue Bonds | | |
| Series A | | |
| 5.00%, due 7/1/35 | 210,000 | 243,912 |
The notes to the financial statements are an integral part of, and should be read in conjunction with, the financial statements.
| 12 | MainStay MacKay New York Tax Free Opportunities Fund |
| | Principal
Amount | Value |
| Long-Term Municipal Bonds (continued) |
| Education (continued) |
| New York State Dormitory Authority, New York University, Revenue Bonds | | |
| Series A | | |
| 4.00%, due 7/1/43 | $ 2,950,000 | $ 3,281,820 |
| Series A | | |
| 4.00%, due 7/1/45 | 9,675,000 | 11,249,462 |
| New York State Dormitory Authority, Pace University, Revenue Bonds | | |
| Series A | | |
| 4.00%, due 5/1/33 | 400,000 | 415,665 |
| Series A | | |
| 4.25%, due 5/1/42 | 450,000 | 467,087 |
| New York State Dormitory Authority, Rockefeller University (The), Revenue Bonds | | |
| Series C | | |
| 4.00%, due 7/1/49 | 7,055,000 | 8,159,385 |
| New York State Dormitory Authority, St Joseph's College, Revenue Bonds | | |
| 4.00%, due 7/1/40 | 200,000 | 222,118 |
| 5.00%, due 7/1/51 | 1,475,000 | 1,746,923 |
| New York State Dormitory Authority, St Lawrence-Lewis Board of Cooperative Educational Services, Revenue Bonds | | |
| Series A | | |
| 4.00%, due 8/15/42 | 5,500,000 | 6,136,262 |
| Series B, Insured: BAM | | |
| 4.00%, due 8/15/45 | 4,320,000 | 4,796,153 |
| Series B, Insured: BAM | | |
| 4.00%, due 8/15/50 | 1,340,000 | 1,481,149 |
| New York State Dormitory Authority, Touro College and University System Obligated Group, Revenue Bonds | | |
| 5.00%, due 1/1/42 | 5,000,000 | 5,702,903 |
| Oneida County Local Development Corp., Utica College Project, Revenue Bonds | | |
| 5.00%, due 7/1/49 | 3,250,000 | 3,725,325 |
| Onondaga County Trust for Cultural Resources, Syracuse University Project, Revenue Bonds | | |
| 4.00%, due 12/1/41 | 5,165,000 | 6,098,491 |
| 4.00%, due 12/1/47 | 4,000,000 | 4,674,319 |
| 4.00%, due 12/1/49 | 2,000,000 | 2,331,917 |
| | Principal
Amount | Value |
| |
| Education (continued) |
| Orange County Funding Corp., Mount St Mary College, Revenue Bonds | | |
| Series A | | |
| 5.00%, due 7/1/42 | $ 1,010,000 | $ 1,040,260 |
| Riverhead Industrial Development Agency, Riverhead Charter School, Revenue Bonds | | |
| Series 2013A | | |
| 7.00%, due 8/1/43 | 925,000 | 1,011,017 |
| Series 2013A | | |
| 7.00%, due 8/1/48 | 730,000 | 796,585 |
| St Lawrence County Industrial Development Agency, Clarkson University Project, Revenue Bonds | | |
| 5.00%, due 9/1/47 | 2,975,000 | 3,387,710 |
| 5.375%, due 9/1/41 | 200,000 | 202,224 |
| St Lawrence County Industrial Development Agency, St Lawrence University, Revenue Bonds | | |
| Series A | | |
| 4.00%, due 7/1/43 | 3,000,000 | 3,339,013 |
| Syracuse Industrial Development Agency, Syracuse City School District Project, Revenue Bonds | | |
| Series A, Insured: State Aid Withholding | | |
| 3.25%, due 5/1/34 | 1,000,000 | 1,078,853 |
| Series 2020A, Insured: State Aid Withholding | | |
| 4.00%, due 5/1/36 | 1,500,000 | 1,756,961 |
| Troy Capital Resource Corp., Rensselaer Polytechnic Institute, Revenue Bonds | | |
| 5.00%, due 8/1/32 | 1,000,000 | 1,172,243 |
| Yonkers Economic Development Corp., Charter School of Educational Excellence Project, Revenue Bonds | | |
| Series A | | |
| 4.00%, due 10/15/29 | 200,000 | 219,839 |
| Series A | | |
| 5.00%, due 10/15/39 | 840,000 | 970,628 |
| Series A | | |
| 5.00%, due 10/15/49 | 640,000 | 724,668 |
| 5.00%, due 10/15/50 | 1,350,000 | 1,542,013 |
| | | 178,386,026 |
The notes to the financial statements are an integral part of, and should be read in conjunction with, the financial statements.
13
Portfolio of Investments April 30, 2021† (Unaudited) (continued)
| | Principal
Amount | Value |
| Long-Term Municipal Bonds (continued) |
| General Obligation 9.1% |
| City of Buffalo NY, Limited General Obligation | | |
| Series A | | |
| 5.00%, due 4/1/27 | $ 500,000 | $ 607,512 |
| Series A | | |
| 5.00%, due 4/1/28 | 400,000 | 484,065 |
| City of Glens Falls NY, Limited General Obligation | | |
| Insured: AGM | | |
| 4.00%, due 1/15/31 | 500,000 | 567,267 |
| Insured: AGM | | |
| 4.00%, due 1/15/32 | 315,000 | 356,386 |
| Insured: AGM | | |
| 4.00%, due 1/15/33 | 250,000 | 282,118 |
| City of New York NY, Unlimited General Obligation | | |
| Series C | | |
| 4.00%, due 8/1/40 | 4,200,000 | 4,949,781 |
| Series C | | |
| 4.00%, due 8/1/41 | 4,885,000 | 5,736,434 |
| Series A-1, Insured: BAM | | |
| 4.00%, due 8/1/44 | 4,930,000 | 5,677,489 |
| Series D-1, Insured: BAM | | |
| 4.00%, due 3/1/50 | 5,440,000 | 6,288,630 |
| City of Newburgh NY, Limited General Obligation | | |
| Series A, Insured: AGM | | |
| 3.50%, due 7/15/36 | 725,000 | 754,385 |
| Series A | | |
| 5.50%, due 6/15/31 | 500,000 | 529,818 |
| City of Ogdensburg NY, Public Improvement, Limited General Obligation | | |
| 5.50%, due 4/15/23 | 40,000 | 42,345 |
| 5.50%, due 4/15/24 | 45,000 | 48,659 |
| 5.50%, due 4/15/26 | 50,000 | 54,741 |
| 5.50%, due 4/15/28 | 55,000 | 59,466 |
| City of Plattsburgh NY, Limited General Obligation | | |
| Series B, Insured: AGM | | |
| 5.00%, due 9/15/21 | 450,000 | 457,216 |
| Series B, Insured: AGM | | |
| 5.00%, due 9/15/22 | 455,000 | 481,764 |
| Series B, Insured: AGM | | |
| 5.00%, due 9/15/24 | 510,000 | 582,696 |
| Series B, Insured: AGM | | |
| 5.00%, due 9/15/25 | 470,000 | 553,534 |
| | Principal
Amount | Value |
| |
| General Obligation (continued) |
| City of Plattsburgh NY, Limited General Obligation (continued) | | |
| Series B, Insured: AGM | | |
| 5.00%, due 9/15/26 | $ 395,000 | $ 478,244 |
| City of Poughkeepsie NY, Limited General Obligation | | |
| 2.50%, due 4/29/22 | 770,000 | 781,413 |
| 5.00%, due 6/1/31 | 600,000 | 668,936 |
| City of Yonkers NY, Limited General Obligation | | |
| Series B, Insured: AGM ST AID WITHHLDG | | |
| 3.00%, due 2/15/39 | 600,000 | 650,584 |
| Series A, Insured: BAM | | |
| 4.00%, due 9/1/31 | 1,500,000 | 1,728,149 |
| Series A, Insured: BAM | | |
| 4.00%, due 5/1/35 | 1,550,000 | 1,832,637 |
| Series A, Insured: AGM | | |
| 4.00%, due 2/15/36 | 700,000 | 838,976 |
| Series B, Insured: AGM ST AID WITHHLDG | | |
| 4.00%, due 2/15/36 | 740,000 | 886,917 |
| Series A, Insured: BAM | | |
| 4.00%, due 5/1/36 | 1,700,000 | 1,996,543 |
| Series A, Insured: BAM | | |
| 4.00%, due 5/1/37 | 2,000,000 | 2,338,019 |
| Series B, Insured: AGM ST AID WITHHLDG | | |
| 4.00%, due 2/15/38 | 1,300,000 | 1,546,512 |
| Series A, Insured: AGM | | |
| 5.00%, due 2/15/32 | 850,000 | 1,130,168 |
| Series B, Insured: AGM ST AID WITHHLDG | | |
| 5.00%, due 2/15/32 | 855,000 | 1,136,816 |
| Series A, Insured: AGM | | |
| 5.00%, due 2/15/34 | 600,000 | 789,672 |
| Series B, Insured: AGM ST AID WITHHLDG | | |
| 5.00%, due 2/15/34 | 750,000 | 987,888 |
| City of Yonkers NY, Unlimited General Obligation | | |
| Series B, Insured: BAM | | |
| 4.00%, due 5/1/39 | 2,000,000 | 2,322,565 |
| Commonwealth of Puerto Rico, Public Improvement, Unlimited General Obligation | | |
| Insured: NATL-IBC | | |
| 5.00%, due 7/1/28 | 150,000 | 153,975 |
The notes to the financial statements are an integral part of, and should be read in conjunction with, the financial statements.
| 14 | MainStay MacKay New York Tax Free Opportunities Fund |
| | Principal
Amount | Value |
| Long-Term Municipal Bonds (continued) |
| General Obligation (continued) |
| Commonwealth of Puerto Rico, Public Improvement, Unlimited General Obligation (continued) | | |
| Series A, Insured: AGM | | |
| 5.00%, due 7/1/35 | $ 835,000 | $ 868,694 |
| Series A, Insured: AGM | | |
| 5.375%, due 7/1/25 | 340,000 | 343,945 |
| Series C | | |
| 6.00%, due 7/1/35 (b)(c) | 1,000,000 | 845,000 |
| Series B | | |
| 6.00%, due 7/1/39 (b)(c) | 5,000,000 | 4,475,000 |
| County of Clinton, Limited General Obligation | | |
| Insured: AGM | | |
| 4.00%, due 6/1/38 (d) | 1,500,000 | 1,623,745 |
| County of Nassau, Limited General Obligation | | |
| Series B, Insured: AGM | | |
| 5.00%, due 4/1/49 | 10,000,000 | 12,572,344 |
| County of Onondaga, Limited General Obligation | | |
| 3.00%, due 6/1/39 | 2,150,000 | 2,272,046 |
| 3.25%, due 4/15/34 | 1,250,000 | 1,331,142 |
| County of Rockland, Limited General Obligation | | |
| Insured: BAM | | |
| 5.00%, due 6/1/24 | 500,000 | 570,905 |
| Insured: BAM | | |
| 5.00%, due 6/1/25 | 560,000 | 661,508 |
| Insured: BAM | | |
| 5.00%, due 6/1/26 | 550,000 | 670,075 |
| County of Rockland, Various Purpopse, Limited General Obligation | | |
| Insured: AGM | | |
| 4.00%, due 5/1/44 | 915,000 | 1,017,288 |
| Insured: AGM | | |
| 4.00%, due 5/1/45 | 950,000 | 1,054,632 |
| Insured: AGM | | |
| 4.00%, due 5/1/46 | 985,000 | 1,092,777 |
| Insured: AGM | | |
| 4.00%, due 5/1/48 | 1,065,000 | 1,180,238 |
| County of Suffolk, Limited General Obligation | | |
| Series A, Insured: BAM | | |
| 4.00%, due 4/1/33 | 2,190,000 | 2,487,742 |
| | Principal
Amount | Value |
| |
| General Obligation (continued) |
| County of Suffolk, Public Improvement, Limited General Obligation | | |
| Series B, Insured: AGM | | |
| 3.00%, due 10/15/32 | $ 5,480,000 | $ 5,831,231 |
| Series B, Insured: AGM | | |
| 3.00%, due 10/15/33 | 2,400,000 | 2,539,193 |
| Series B, Insured: AGM | | |
| 3.00%, due 10/15/34 | 5,740,000 | 6,052,788 |
| Series A, Insured: AGM | | |
| 3.25%, due 6/1/36 | 715,000 | 752,921 |
| Series A, Insured: AGM | | |
| 3.25%, due 6/1/37 | 725,000 | 761,931 |
| Genesee Valley Central School District, Unlimited General Obligation | | |
| Insured: AGM ST AID WITHHLDG | | |
| 4.00%, due 6/15/30 | 665,000 | 683,685 |
| Harrison Central School District, Unlimited General Obligation | | |
| Insured: State Aid Withholding | | |
| 3.50%, due 3/15/44 | 1,015,000 | 1,081,646 |
| Insured: State Aid Withholding | | |
| 3.50%, due 3/15/45 | 1,055,000 | 1,122,644 |
| Insured: State Aid Withholding | | |
| 3.55%, due 3/15/47 | 1,130,000 | 1,203,449 |
| Lackawanna City School District, Unlimited General Obligation | | |
| Insured: BAM | | |
| 4.00%, due 6/15/32 | 745,000 | 834,821 |
| Niagara Falls City School District, Unlimited General Obligation | | |
| Insured: BAM | | |
| 5.00%, due 6/15/27 | 960,000 | 1,176,737 |
| Poughkeepsie School District, New York School District Refunding, Unlimited General Obligation | | |
| Insured: AGM ST AID WITHHLDG | | |
| 3.00%, due 5/1/33 | 400,000 | 425,632 |
| Town of Oyster Bay, Limited General Obligation | | |
| Insured: AGM | | |
| 4.00%, due 8/1/30 | 365,000 | 380,673 |
| Town of Oyster Bay, Public Improvement Project, Limited General Obligation | | |
| 4.00%, due 2/15/26 | 3,440,000 | 3,870,850 |
The notes to the financial statements are an integral part of, and should be read in conjunction with, the financial statements.
15
Portfolio of Investments April 30, 2021† (Unaudited) (continued)
| | Principal
Amount | Value |
| Long-Term Municipal Bonds (continued) |
| General Obligation (continued) |
| Town of Oyster Bay, Public Improvement Project, Limited General Obligation (continued) | | |
| Series A, Insured: BAM | | |
| 5.00%, due 1/15/28 | $ 500,000 | $ 556,569 |
| Village of Valley Stream, Various Purpose, Limited General Obligation | | |
| Insured: BAM | | |
| 4.00%, due 4/1/33 | 490,000 | 539,436 |
| Insured: BAM | | |
| 4.00%, due 4/1/34 | 510,000 | 560,051 |
| Insured: BAM | | |
| 4.00%, due 4/1/35 | 530,000 | 581,553 |
| Insured: BAM | | |
| 4.00%, due 4/1/36 | 550,000 | 601,869 |
| Insured: BAM | | |
| 4.00%, due 4/1/37 | 570,000 | 621,715 |
| West Islip Union Free School District, Limited General Obligation | | |
| Insured: State Aid Withholding | | |
| 1.75%, due 6/21/21 | 2,650,000 | 2,655,008 |
| | | 114,683,803 |
| Hospital 12.2% |
| Brookhaven Local Development Corp., Long Island Community Hospital Project, Revenue Bonds | | |
| Series A | | |
| 3.375%, due 10/1/40 | 7,990,000 | 8,495,735 |
| Series A | | |
| 4.00%, due 10/1/45 | 3,500,000 | 3,938,979 |
| Series A | | |
| 5.00%, due 10/1/33 | 1,000,000 | 1,275,442 |
| Series A | | |
| 5.00%, due 10/1/35 | 1,000,000 | 1,261,632 |
| Series A | | |
| 5.00%, due 10/1/50 | 6,250,000 | 7,673,384 |
| Broome County Local Development Corp., United Health Services Hospitals Obligated Group, Revenue Bonds | | |
| Insured: AGM | | |
| 3.00%, due 4/1/45 | 13,050,000 | 13,465,486 |
| Insured: AGM | | |
| 3.00%, due 4/1/50 | 2,550,000 | 2,622,646 |
| | Principal
Amount | Value |
| |
| Hospital (continued) |
| Broome County Local Development Corp., United Health Services Hospitals Obligated Group, Revenue Bonds (continued) | | |
| Insured: AGM | | |
| 4.00%, due 4/1/39 | $ 700,000 | $ 813,173 |
| Insured: AGM | | |
| 4.00%, due 4/1/50 | 4,265,000 | 4,802,441 |
| Build NYC Resource Corp., Children's Aid Society Project (The), Revenue Bonds | | |
| 4.00%, due 7/1/44 | 600,000 | 683,473 |
| 4.00%, due 7/1/49 | 1,300,000 | 1,466,832 |
| Dutchess County Local Development Corp., Health Quest Systems, Inc., Revenue Bonds | | |
| Series B | | |
| 5.00%, due 7/1/46 | 6,000,000 | 6,822,280 |
| Jefferson County Civic Facility Development Corp., Samaritan Medical Center Project, Revenue Bonds | | |
| Series A | | |
| 4.00%, due 11/1/31 | 2,705,000 | 3,011,809 |
| Series A | | |
| 4.00%, due 11/1/47 | 880,000 | 929,289 |
| Monroe County Industrial Development Corp., Highland Hospital, Revenue Bonds | | |
| 4.00%, due 7/1/40 | 3,100,000 | 3,537,613 |
| Monroe County Industrial Development Corp., Rochester General Hospital (The), Revenue Bonds | | |
| 4.00%, due 12/1/37 | 1,000,000 | 1,111,600 |
| Series A | | |
| 5.00%, due 12/1/32 | 540,000 | 571,184 |
| Series A | | |
| 5.00%, due 12/1/42 | 1,000,000 | 1,049,695 |
| Monroe County Industrial Development Corp., Rochester Regional Health Project, Revenue Bonds | | |
| Series A | | |
| 4.00%, due 12/1/46 | 750,000 | 856,806 |
The notes to the financial statements are an integral part of, and should be read in conjunction with, the financial statements.
| 16 | MainStay MacKay New York Tax Free Opportunities Fund |
| | Principal
Amount | Value |
| Long-Term Municipal Bonds (continued) |
| Hospital (continued) |
| Nassau County Local Economic Assistance Corp., Catholic Health Services of Long Island Obligated Group, Revenue Bonds | | |
| 5.00%, due 7/1/34 | $ 250,000 | $ 278,620 |
| New York State Dormitory Authority, Catholic Health System Obligated Group, Revenue Bonds | | |
| Series A | | |
| 4.00%, due 7/1/45 | 3,490,000 | 3,956,104 |
| Series A | | |
| 5.00%, due 7/1/32 | 600,000 | 626,118 |
| Series B | | |
| 5.00%, due 7/1/32 | 390,000 | 406,977 |
| New York State Dormitory Authority, Maimonides Medical Center, Revenue Bonds | | |
| Insured: FHA 241 | | |
| 3.00%, due 2/1/50 | 14,000,000 | 14,677,624 |
| New York State Dormitory Authority, Memorial Sloan-Kettering Cancer Center, Revenue Bonds | | |
| Series 1 | | |
| 4.00%, due 7/1/38 | 8,500,000 | 10,016,970 |
| New York State Dormitory Authority, Montefiore Obligated Group, Revenue Bonds | | |
| Series A | | |
| 4.00%, due 8/1/36 | 5,750,000 | 6,530,485 |
| Series A | | |
| 4.00%, due 8/1/37 | 2,750,000 | 3,115,074 |
| New York State Dormitory Authority, North Shore Long Island Jewish Obligated Group, Revenue Bonds | | |
| Series B | | |
| 5.00%, due 5/1/39 | 1,500,000 | 1,557,850 |
| New York State Dormitory Authority, Northwell Health Obligated Group, Revenue Bonds | | |
| Series B-3 | | |
| 5.00%, due 5/1/48 (e) | 5,000,000 | 5,949,796 |
| New York State Dormitory Authority, NYU Langone Hospitals Obligated Group, Revenue Bonds | | |
| Series A | | |
| 3.00%, due 7/1/48 | 750,000 | 799,448 |
| | Principal
Amount | Value |
| |
| Hospital (continued) |
| New York State Dormitory Authority, NYU Langone Hospitals Obligated Group, Revenue Bonds (continued) | | |
| Series A | | |
| 4.00%, due 7/1/40 | $ 1,000,000 | $ 1,118,209 |
| Series A | | |
| 4.00%, due 7/1/50 | 9,830,000 | 11,439,084 |
| Series A | | |
| 4.00%, due 7/1/53 | 3,545,000 | 4,115,403 |
| New York State Dormitory Authority, Orange Regional Medical Center Obligated Group, Revenue Bonds (a) | | |
| 5.00%, due 12/1/32 | 800,000 | 932,460 |
| 5.00%, due 12/1/34 | 3,500,000 | 4,048,926 |
| 5.00%, due 12/1/35 | 100,000 | 112,516 |
| Oneida County Local Development Corp., Mohawk Valley Health System Project, Revenue Bonds | | |
| Series A, Insured: AGM | | |
| 3.00%, due 12/1/44 | 4,150,000 | 4,316,932 |
| Series A, Insured: AGM | | |
| 4.00%, due 12/1/32 | 1,000,000 | 1,166,824 |
| Series A, Insured: AGM | | |
| 4.00%, due 12/1/33 | 1,255,000 | 1,457,109 |
| Series A, Insured: AGM | | |
| 4.00%, due 12/1/34 | 1,585,000 | 1,835,629 |
| Series A, Insured: AGM | | |
| 4.00%, due 12/1/36 | 1,650,000 | 1,899,999 |
| Series A, Insured: AGM | | |
| 4.00%, due 12/1/37 | 1,155,000 | 1,326,201 |
| Series A, Insured: AGM | | |
| 4.00%, due 12/1/38 | 1,000,000 | 1,145,251 |
| Series A, Insured: AGM | | |
| 4.00%, due 12/1/49 | 4,000,000 | 4,491,993 |
| Suffolk County Economic Development Corp., Catholic Health Services of Long Island Obligated Group, Revenue Bonds | | |
| Series C | | |
| 5.00%, due 7/1/33 | 250,000 | 279,032 |
| Westchester County Local Development Corp., Westchester Medical Center, Revenue Bonds | | |
| 5.00%, due 11/1/46 | 2,500,000 | 2,811,421 |
| | | 154,801,554 |
The notes to the financial statements are an integral part of, and should be read in conjunction with, the financial statements.
17
Portfolio of Investments April 30, 2021† (Unaudited) (continued)
| | Principal
Amount | Value |
| Long-Term Municipal Bonds (continued) |
| Housing 1.9% |
| Albany Capital Resource Corp., Empire Commons Student Housing, Inc., Revenue Bonds | | |
| Series A | | |
| 5.00%, due 5/1/29 | $ ��600,000 | $ 710,787 |
| Series A | | |
| 5.00%, due 5/1/30 | 350,000 | 412,393 |
| Series A | | |
| 5.00%, due 5/1/31 | 200,000 | 234,913 |
| Amherst Development Corp., UBF Faculty-Student Housing Corp., Revenue Bonds | | |
| Series A, Insured: AGM | | |
| 5.00%, due 10/1/45 | 2,000,000 | 2,343,960 |
| New York City Housing Development Corp. | | |
| Series 2014-8SPR, Class D | | |
| 3.00%, due 2/15/48 | 7,900,000 | 8,089,569 |
| New York City Housing Development Corp., College of Staten Island Residences, Revenue Bonds | | |
| Series A, Insured: AGM | | |
| 3.25%, due 7/1/27 | 2,950,000 | 3,000,313 |
| New York State Dormitory Authority, University Facilities, Revenue Bonds | | |
| Series 2019A | | |
| 4.00%, due 7/1/49 | 3,050,000 | 3,475,531 |
| Series A | | |
| 5.00%, due 7/1/43 | 1,500,000 | 1,811,813 |
| Onondaga Civic Development Corp., Onondaga Community College Housing Development Corp., Revenue Bonds | | |
| Series A | | |
| 5.00%, due 10/1/22 | 325,000 | 338,652 |
| Series A | | |
| 5.00%, due 10/1/24 | 400,000 | 436,713 |
| Series A | | |
| 5.00%, due 10/1/25 | 250,000 | 278,139 |
| Westchester County Local Development Corp., Purchase Housing Corp. II Project, Revenue Bonds | | |
| 5.00%, due 6/1/29 | 185,000 | 217,175 |
| 5.00%, due 6/1/30 | 330,000 | 385,129 |
| 5.00%, due 6/1/31 | 320,000 | 371,673 |
| | Principal
Amount | Value |
| |
| Housing (continued) |
| Westchester County Local Development Corp., Purchase Housing Corp. II Project, Revenue Bonds (continued) | | |
| 5.00%, due 6/1/37 | $ 1,000,000 | $ 1,143,105 |
| 5.00%, due 6/1/42 | 1,000,000 | 1,131,044 |
| | | 24,380,909 |
| Multi-Family Housing 0.0% ‡ |
| Rensselaer Housing Authority, Van Rensselaer & Renwyck Apartments, Revenue Bonds | | |
| Series 2012A | | |
| 5.00%, due 12/1/47 | 175,000 | 188,087 |
| Other Revenue 34.2% |
| Battery Park City Authority, Green Bond, Revenue Bonds, Senior Lien | | |
| Series A | | |
| 4.00%, due 11/1/44 | 4,355,000 | 5,184,248 |
| Brookhaven Local Development Corp., Jefferson's Ferry Project, Revenue Bonds | | |
| Series A | | |
| 4.00%, due 11/1/55 | 3,565,000 | 3,797,923 |
| 5.25%, due 11/1/36 | 1,130,000 | 1,309,266 |
| Build NYC Resource Corp., Bronx Charter School for Excellence Project, Revenue Bonds | | |
| Series A | | |
| 5.50%, due 4/1/43 | 1,160,000 | 1,223,658 |
| Build NYC Resource Corp., Pratt Paper, Inc. Project, Revenue Bonds | | |
| 5.00%, due 1/1/35 (a)(d) | 4,305,000 | 4,818,110 |
| Build NYC Resource Corp., Royal Charter Properties, Inc., Revenue Bonds | | |
| Insured: AGM | | |
| 4.75%, due 12/15/32 | 2,000,000 | 2,093,532 |
| Chautauqua Tobacco Asset Securitization Corp., Revenue Bonds | | |
| 5.00%, due 6/1/34 | 750,000 | 789,893 |
| Children's Trust Fund, Asset-Backed, Revenue Bonds | | |
| Series A | | |
| (zero coupon), due 5/15/50 | 2,500,000 | 390,716 |
| 5.625%, due 5/15/43 | 2,300,000 | 2,312,147 |
The notes to the financial statements are an integral part of, and should be read in conjunction with, the financial statements.
| 18 | MainStay MacKay New York Tax Free Opportunities Fund |
| | Principal
Amount | Value |
| Long-Term Municipal Bonds (continued) |
| Other Revenue (continued) |
| City of New York, Alvin Ailey Dance Foundation, Inc., Revenue Bonds | | |
| Series A | | |
| 4.00%, due 7/1/46 | $ 1,515,000 | $ 1,656,836 |
| City of New York, American Museum of Natural History (The), Revenue Bonds | | |
| Series A | | |
| 5.00%, due 7/1/41 | 1,000,000 | 1,128,414 |
| City of New York, Museum of Modern Art (The), Revenue Bonds | | |
| Series 2016-ONE-E | | |
| 4.00%, due 4/1/30 | 1,200,000 | 1,387,786 |
| Development Authority of the North Country, Solid Waste Management System, Revenue Bonds | | |
| Insured: AGM | | |
| 3.25%, due 9/1/39 | 550,000 | 586,933 |
| Insured: AGM | | |
| 3.25%, due 9/1/40 | 570,000 | 606,929 |
| Insured: AGM | | |
| 3.25%, due 9/1/42 | 610,000 | 646,571 |
| Insured: AGM | | |
| 3.25%, due 9/1/43 | 630,000 | 670,110 |
| Insured: AGM | | |
| 3.25%, due 9/1/44 | 650,000 | 690,550 |
| Insured: AGM | | |
| 3.375%, due 9/1/38 | 535,000 | 579,211 |
| Insured: AGM | | |
| 3.50%, due 9/1/37 | 515,000 | 566,047 |
| Dobbs Ferry Local Development Corp., Mercy College Project, Revenue Bonds | | |
| 5.00%, due 7/1/39 | 1,000,000 | 1,117,219 |
| Dutchess County Resource Recovery Agency, Solid Waste System, Revenue Bonds (d) | | |
| 5.00%, due 1/1/25 | 1,000,000 | 1,150,710 |
| 5.00%, due 1/1/26 | 1,000,000 | 1,184,336 |
| Erie Tobacco Asset Securitization Corp., Revenue Bonds | | |
| Series B | | |
| (zero coupon), due 6/1/47 | 18,000,000 | 3,977,237 |
| GDB Debt Recovery Authority of Puerto Rico, Revenue Bonds | | |
| 7.50%, due 8/20/40 | 4,205,584 | 3,606,288 |
| | Principal
Amount | Value |
| |
| Other Revenue (continued) |
| Hudson Yards Infrastructure Corp., Revenue Bonds | | |
| Series A | | |
| 4.00%, due 2/15/44 | $ 4,000,000 | $ 4,476,080 |
| Series A | | |
| 5.00%, due 2/15/42 | 7,500,000 | 8,897,267 |
| Hudson Yards Infrastructure Corp., Revenue Bonds, Senior Lien | | |
| Series A | | |
| 5.25%, due 2/15/47 | 1,320,000 | 1,324,660 |
| Series A | | |
| 5.75%, due 2/15/47 | 755,000 | 758,047 |
| Huntington Local Development Corp., Fountaingate Gardens Project, Revenue Bonds | | |
| Series A | | |
| 5.00%, due 7/1/36 | 900,000 | 964,121 |
| Series A | | |
| 5.25%, due 7/1/56 | 2,500,000 | 2,650,871 |
| Long Island Power Authority, Revenue Bonds | | |
| Series A | | |
| 4.00%, due 9/1/38 | 2,000,000 | 2,318,765 |
| Series A | | |
| 4.00%, due 9/1/39 | 4,750,000 | 5,652,271 |
| Series A | | |
| 4.00%, due 9/1/40 | 550,000 | 652,463 |
| 5.00%, due 9/1/42 | 2,000,000 | 2,453,594 |
| Series A | | |
| 5.00%, due 9/1/44 | 2,000,000 | 2,258,195 |
| Series B | | |
| 5.00%, due 9/1/45 | 1,000,000 | 1,157,459 |
| Series B | | |
| 5.00%, due 9/1/46 | 245,000 | 289,905 |
| Long Island Power Authority, Electric System, Revenue Bonds | | |
| 5.00%, due 9/1/37 | 2,000,000 | 2,516,550 |
| 5.00%, due 9/1/38 | 1,000,000 | 1,255,459 |
| 5.00%, due 9/1/39 | 1,000,000 | 1,252,944 |
| Metropolitan Transportation Authority, Metropolitan Transportation Authority Dedicated Tax Fund, Green Bond, Revenue Bonds | | |
| Series B-2 | | |
| 5.25%, due 11/15/33 | 5,000,000 | 6,257,230 |
The notes to the financial statements are an integral part of, and should be read in conjunction with, the financial statements.
19
Portfolio of Investments April 30, 2021† (Unaudited) (continued)
| | Principal
Amount | Value |
| Long-Term Municipal Bonds (continued) |
| Other Revenue (continued) |
| Monroe County Industrial Development Corp., St. Ann's Community Project, Revenue Bonds | | |
| 5.00%, due 1/1/40 | $ 2,500,000 | $ 2,744,118 |
| 5.00%, due 1/1/50 | 2,400,000 | 2,609,209 |
| Nassau County Tobacco Settlement Corp., Tobacco Settlement Asset-Backed, Revenue Bonds | | |
| Series A-3 | | |
| 5.00%, due 6/1/35 | 750,000 | 759,931 |
| Series A-3 | | |
| 5.125%, due 6/1/46 | 4,015,000 | 4,090,196 |
| New York City Housing Development Corp., Capital Fund Grant Program, Revenue Bonds | | |
| Series A | | |
| 5.00%, due 7/1/23 | 1,300,000 | 1,427,489 |
| New York City Housing Development Corp., Multi-Family Housing, Revenue Bonds | | |
| Series G | | |
| 3.85%, due 11/1/45 | 595,000 | 632,007 |
| Series L-2-A | | |
| 4.00%, due 5/1/44 | 5,000,000 | 5,156,146 |
| New York City Housing Development Corp., Multifamily, Sustainable Neighborhood, Revenue Bonds | | |
| Series E-1-A | | |
| 3.40%, due 11/1/47 | 3,000,000 | 3,155,367 |
| Series I-1-A | | |
| 4.05%, due 11/1/41 | 1,000,000 | 1,089,870 |
| Series I-1-A | | |
| 4.15%, due 11/1/46 | 3,250,000 | 3,545,725 |
| New York City Housing Development Corp., Multifamily, Sustainable Neighborhood, Green Bond, Revenue Bonds | | |
| Series G-1 | | |
| 3.70%, due 11/1/47 | 1,000,000 | 1,068,566 |
| New York City Industrial Development Agency, Queens Baseball Stadium Project, Revenue Bonds | | |
| Insured: AGM | | |
| 3.00%, due 1/1/37 | 2,500,000 | 2,707,893 |
| Insured: AGM | | |
| 3.00%, due 1/1/39 | 3,250,000 | 3,495,626 |
| | Principal
Amount | Value |
| |
| Other Revenue (continued) |
| New York City Industrial Development Agency, Queens Baseball Stadium Project, Revenue Bonds (continued) | | |
| Insured: AGM | | |
| 3.00%, due 1/1/40 | $ 5,500,000 | $ 5,896,509 |
| New York City Industrial Development Agency, TRIPS Obligated Group, Revenue Bonds | | |
| Series A | | |
| 5.00%, due 7/1/28 | 1,500,000 | 1,566,674 |
| New York City Industrial Development Agency, United Jewish Appeal-Federation of Jewish Philanthropies of New York, Inc., Revenue Bonds | | |
| Series B | | |
| 5.00%, due 7/1/34 | 1,000,000 | 1,031,160 |
| New York City Industrial Development Agency, Yankee Stadium Project, Revenue Bonds | | |
| Series A, Insured: AGC | | |
| (zero coupon), due 3/1/40 | 380,000 | 239,703 |
| Series A, Insured: AGC | | |
| (zero coupon), due 3/1/44 | 1,065,000 | 584,989 |
| Series A, Insured: AGC | | |
| (zero coupon), due 3/1/45 | 200,000 | 105,953 |
| Series A, Insured: AGC | | |
| (zero coupon), due 3/1/46 | 3,800,000 | 1,947,099 |
| Series A, Insured: AGC | | |
| (zero coupon), due 3/1/47 | 1,115,000 | 552,849 |
| Series A | | |
| 3.00%, due 3/1/49 | 14,980,000 | 15,332,460 |
| Series A, Insured: AGM | | |
| 3.00%, due 3/1/49 | 5,000,000 | 5,256,727 |
| Series A, Insured: AGM | | |
| 4.00%, due 3/1/45 | 6,500,000 | 7,568,042 |
| New York City Transitional Finance Authority, Future Tax Secured, Revenue Bonds | | |
| Series C-1 | | |
| 4.00%, due 11/1/42 | 7,000,000 | 8,156,886 |
| New York City Transitional Finance Authority Building Aid, Revenue Bonds | | |
| Series S-1, Insured: State Aid Withholding | | |
| 4.00%, due 7/15/36 | 1,500,000 | 1,734,887 |
The notes to the financial statements are an integral part of, and should be read in conjunction with, the financial statements.
| 20 | MainStay MacKay New York Tax Free Opportunities Fund |
| | Principal
Amount | Value |
| Long-Term Municipal Bonds (continued) |
| Other Revenue (continued) |
| New York City Transitional Finance Authority Building Aid, Revenue Bonds (continued) | | |
| Series S-3, Insured: State Aid Withholding | | |
| 4.00%, due 7/15/46 | $ 2,905,000 | $ 3,328,898 |
| Series S-3, Insured: State Aid Withholding | | |
| 5.00%, due 7/15/43 | 2,500,000 | 3,076,913 |
| New York Convention Center Development Corp., Hotel Unit Fee, Revenue Bonds, Senior Lien | | |
| Series A | | |
| (zero coupon), due 11/15/47 | 6,500,000 | 2,963,057 |
| New York Convention Center Development Corp., Hotel Unit Fee Secured, Revenue Bonds | | |
| 5.00%, due 11/15/40 | 1,620,000 | 1,850,933 |
| New York Counties Tobacco Trust IV, Settlement Pass Through, Revenue Bonds | | |
| Series A | | |
| 5.00%, due 6/1/42 | 1,000,000 | 1,010,972 |
| Series A | | |
| 5.00%, due 6/1/45 | 245,000 | 247,159 |
| Series A | | |
| 6.25%, due 6/1/41 (a) | 5,000,000 | 5,095,855 |
| New York Counties Tobacco Trust V, Pass Through, Capital Appreciation, Revenue Bonds | | |
| Series S | | |
| (zero coupon), due 6/1/38 | 1,600,000 | 583,432 |
| New York Counties Tobacco Trust VI, Tobacco Settlement Pass Through, Revenue Bonds | | |
| Series B | | |
| 5.00%, due 6/1/30 | 135,000 | 159,600 |
| New York Liberty Development Corp., 3 World Trade Center LLC, Revenue Bonds | | |
| 5.375%, due 11/15/40 (a) | 1,500,000 | 1,674,448 |
| New York Liberty Development Corp., 7 World Trade Center II LLC, Revenue Bonds | | |
| 5.00%, due 9/15/43 | 1,040,000 | 1,075,513 |
| 5.00%, due 3/15/44 | 1,500,000 | 1,553,858 |
| | Principal
Amount | Value |
| |
| Other Revenue (continued) |
| New York Liberty Development Corp., Bank of America Tower at One Bryant Park Project, Revenue Bonds | | |
| 2.45%, due 9/15/69 | $ 4,085,000 | $ 4,247,990 |
| 2.80%, due 9/15/69 | 14,700,000 | 14,720,489 |
| New York Liberty Development Corp., Goldman Sachs Headquarters LLC, Revenue Bonds | | |
| 5.50%, due 10/1/37 | 700,000 | 1,046,772 |
| New York Liberty Development Corp., World Trade Center Project, Revenue Bonds | | |
| 5.75%, due 11/15/51 | 1,500,000 | 1,541,840 |
| New York State Dormitory Authority, Revenue Bonds | | |
| Series A | | |
| 4.00%, due 3/15/40 | 6,000,000 | 7,143,981 |
| New York State Dormitory Authority, State Personal Income Tax, Revenue Bonds | | |
| Series D | | |
| 4.00%, due 2/15/47 | 15,500,000 | 17,897,591 |
| New York State Urban Development Corp., Bidding Group 3, Revenue Bonds | | |
| Series A | | |
| 4.00%, due 3/15/44 | 11,320,000 | 13,165,852 |
| New York Transportation Development Corp., American Airlines, Inc. John F. Kennedy International Airport Project, Revenue Bonds (d) | | |
| 5.00%, due 8/1/26 | 5,485,000 | 5,542,956 |
| 5.25%, due 8/1/31 | 1,640,000 | 2,052,373 |
| 5.375%, due 8/1/36 | 2,110,000 | 2,609,687 |
| New York Transportation Development Corp., Delta Air Lines, Inc. - Laguardia Airport Terminals C&D Redevelopment Project, Revenue Bonds (d) | | |
| 4.375%, due 10/1/45 | 4,000,000 | 4,688,179 |
| 5.00%, due 10/1/35 | 3,000,000 | 3,831,188 |
| 5.00%, due 10/1/40 | 3,000,000 | 3,766,759 |
| New York Transportation Development Corp., John F. kennedy International Airport Project, Revenue Bonds | | |
| 4.00%, due 12/1/38 (d) | 1,275,000 | 1,486,883 |
The notes to the financial statements are an integral part of, and should be read in conjunction with, the financial statements.
21
Portfolio of Investments April 30, 2021† (Unaudited) (continued)
| | Principal
Amount | Value |
| Long-Term Municipal Bonds (continued) |
| Other Revenue (continued) |
| New York Transportation Development Corp., New York State Thruway Serive Areas Project, Revenue Bonds (d) | | |
| 4.00%, due 10/31/41 | $ 3,880,000 | $ 4,503,332 |
| 4.00%, due 10/31/46 | 5,075,000 | 5,803,606 |
| 4.00%, due 4/30/53 | 6,245,000 | 7,098,018 |
| New York Transportation Development Corp., Terminal 4 John F. Kennedy International Airport Project, Revenue Bonds | | |
| Series A | | |
| 4.00%, due 12/1/42 (d) | 1,350,000 | 1,558,094 |
| Series C | | |
| 4.00%, due 12/1/42 | 7,090,000 | 8,323,215 |
| Series A | | |
| 5.00%, due 12/1/32 (d) | 1,000,000 | 1,285,976 |
| Series A | | |
| 5.00%, due 12/1/36 (d) | 1,600,000 | 2,035,070 |
| Niagara Tobacco Asset Securitization Corp., Tobacco Settlement Asset-Backed, Revenue Bonds | | |
| 5.25%, due 5/15/40 | 500,000 | 546,566 |
| Puerto Rico Convention Center District Authority, Hotel Occupancy Tax, Revenue Bonds | | |
| Series A, Insured: AGC | | |
| 4.50%, due 7/1/36 | 400,000 | 407,536 |
| Puerto Rico Municipal Finance Agency, Revenue Bonds | | |
| Series A, Insured: AGM | | |
| 4.75%, due 8/1/22 | 1,420,000 | 1,435,895 |
| Series C, Insured: AGC | | |
| 5.25%, due 8/1/23 | 100,000 | 108,350 |
| Puerto Rico Public Buildings Authority, Government Facilities, Revenue Bonds (b)(c) | | |
| Series S, Insured: COMMWLTH GTD | | |
| 5.00%, due 7/1/24 | 1,000,000 | 965,000 |
| Series N, Insured: COMMWLTH GTD | | |
| 5.00%, due 7/1/37 | 4,340,000 | 4,226,075 |
| Series U, Insured: COMMWLTH GTD | | |
| 5.25%, due 7/1/42 | 1,000,000 | 918,750 |
| | Principal
Amount | Value |
| |
| Other Revenue (continued) |
| Puerto Rico Public Buildings Authority, Government Facilities, Revenue Bonds (b)(c) (continued) | | |
| Series N, Insured: COMWLTH GTD | | |
| 5.50%, due 7/1/23 | $ 2,405,000 | $ 2,395,981 |
| Series S, Insured: COMMWLTH GTD | | |
| 5.75%, due 7/1/22 | 3,500,000 | 3,443,125 |
| Series 2011-S, Insured: COMMWLTH GTD | | |
| 5.875%, due 7/1/39 | 1,000,000 | 986,250 |
| Puerto Rico Public Buildings Authority, Unrefunded, Government Facilities, Revenue Bonds | | |
| Series D, Insured: COMWLTH GTD | | |
| 5.25%, due 7/1/27 (b)(c) | 2,810,000 | 2,760,825 |
| Puerto Rico Sales Tax Financing Corp., Revenue Bonds | | |
| Series A-1 | | |
| 5.00%, due 7/1/58 | 21,900,000 | 24,726,414 |
| Rockland Tobacco Asset Securitization Corp., Tobacco Settlement Asset-Backed, Revenue Bonds | | |
| Series B | | |
| (zero coupon), due 8/15/50 (a) | 13,000,000 | 1,929,424 |
| Schenectady Metroplex Development Authority, General Resolution Bonds, Revenue Bonds | | |
| Series A, Insured: AGM | | |
| 5.50%, due 8/1/33 | 1,000,000 | 1,112,815 |
| Southold Local Development Corp., Peconic Landing, Inc. Project, Revenue Bonds | | |
| 5.00%, due 12/1/45 | 1,625,000 | 1,756,711 |
| State of New York Mortgage Agency, Homeowner Mortgage, Revenue Bonds | | |
| 4.00%, due 10/1/48 | 2,430,000 | 2,644,673 |
| Series 213 | | |
| 4.25%, due 10/1/47 | 830,000 | 920,185 |
| Suffolk County Economic Development Corp., Peconic Landing at Southold, Inc., Revenue Bonds | | |
| Series A | | |
| 5.00%, due 12/1/29 | 175,000 | 205,166 |
| Series A | | |
| 5.00%, due 12/1/34 | 165,000 | 190,972 |
The notes to the financial statements are an integral part of, and should be read in conjunction with, the financial statements.
| 22 | MainStay MacKay New York Tax Free Opportunities Fund |
| | Principal
Amount | Value |
| Long-Term Municipal Bonds (continued) |
| Other Revenue (continued) |
| Suffolk County Economic Development Corp., Peconic Landing at Southold, Inc., Revenue Bonds (continued) | | |
| Series A | | |
| 5.00%, due 12/1/40 | $ 175,000 | $ 200,544 |
| Suffolk Tobacco Asset Securitization Corp., Tobacco Settlement Asset-Backed, Revenue Bonds | | |
| Series B | | |
| 5.25%, due 6/1/37 | 840,000 | 866,329 |
| Series B | | |
| 6.00%, due 6/1/48 | 1,000,000 | 1,001,629 |
| Suffolk Tobacco Asset Securitization Corp., Tobacco Settlement Asset-Backed, Capital Appreciation, Revenue Bonds | | |
| Series C | | |
| 6.625%, due 6/1/44 | 5,600,000 | 5,765,660 |
| Tender Option Bond Trust Receipts/Certificates, Revenue Bonds | | |
| Series 2016-ZF0414 | | |
| 0.28%, due 11/15/23 (a)(e) | 770,000 | 770,000 |
| Territory of Guam, Business Privilege Tax, Revenue Bonds | | |
| Series D | | |
| 4.00%, due 11/15/39 | 795,000 | 839,301 |
| Series D | | |
| 5.00%, due 11/15/27 | 1,825,000 | 2,098,027 |
| Series B-1 | | |
| 5.00%, due 1/1/32 | 1,070,000 | 1,099,664 |
| Series A | | |
| 5.125%, due 1/1/42 | 3,100,000 | 3,189,566 |
| Series A | | |
| 5.25%, due 1/1/36 | 1,875,000 | 1,930,364 |
| Territory of Guam, Hotel Occupancy Tax, Revenue Bonds | | |
| Series A | | |
| 6.00%, due 11/1/26 | 3,000,000 | 3,000,000 |
| Series A | | |
| 6.50%, due 11/1/40 | 2,500,000 | 2,500,000 |
| Territory of Guam, Section 30, Revenue Bonds | | |
| Series A | | |
| 5.00%, due 12/1/36 | 1,020,000 | 1,170,042 |
| | Principal
Amount | Value |
| |
| Other Revenue (continued) |
| Tompkins County Development Corp., Kendal at Ithaca, Inc. Project, Revenue Bonds | | |
| Series 2014A | | |
| 5.00%, due 7/1/44 | $ 690,000 | $ 743,358 |
| Triborough Bridge & Tunnel Authority, Revenue Bonds, Senior Lien | | |
| Series A-1 | | |
| 4.00%, due 5/15/46 | 8,500,000 | 10,144,474 |
| Series A-1 | | |
| 5.00%, due 5/15/51 | 10,000,000 | 12,880,049 |
| TSASC, Inc., Tobacco Settlement Bonds, Revenue Bonds | | |
| Series B | | |
| 5.00%, due 6/1/22 | 500,000 | 518,969 |
| Series A | | |
| 5.00%, due 6/1/41 | 2,000,000 | 2,324,195 |
| Series B | | |
| 5.00%, due 6/1/48 | 8,390,000 | 9,106,606 |
| Virgin Islands Public Finance Authority, Gross Receipts Taxes Loan, Revenue Bonds | | |
| Series A | | |
| 5.00%, due 10/1/29 | 1,000,000 | 960,219 |
| Series A | | |
| 5.00%, due 10/1/32 | 1,000,000 | 947,614 |
| Series A, Insured: AGM | | |
| 5.00%, due 10/1/32 | 1,200,000 | 1,261,133 |
| Virgin Islands Public Finance Authority, Matching Fund Loan, Revenue Bonds | | |
| Series A | | |
| 6.00%, due 10/1/39 | 640,000 | 641,465 |
| Series A | | |
| 6.625%, due 10/1/29 | 2,420,000 | 2,439,713 |
| Series A | | |
| 6.75%, due 10/1/37 | 1,630,000 | 1,643,278 |
| Virgin Islands Public Finance Authority, Matching Fund Loan, Revenue Bonds, Senior Lien | | |
| Series A-1 | | |
| 5.00%, due 10/1/24 | 1,265,000 | 1,267,967 |
| Series A | | |
| 5.00%, due 10/1/25 | 410,000 | 410,962 |
The notes to the financial statements are an integral part of, and should be read in conjunction with, the financial statements.
23
Portfolio of Investments April 30, 2021† (Unaudited) (continued)
| | Principal
Amount | Value |
| Long-Term Municipal Bonds (continued) |
| Other Revenue (continued) |
| Virgin Islands Public Finance Authority, United States Virgin Islands Federal Excise Tax, Revenue Bonds | | |
| Series A, Insured: AGM | | |
| 5.00%, due 10/1/32 | $ 1,415,000 | $ 1,487,086 |
| Westchester County Local Development Corp., Miriam Osborn Memorial Home Association Project, Revenue Bonds | | |
| 5.00%, due 7/1/27 | 270,000 | 310,544 |
| 5.00%, due 7/1/28 | 270,000 | 309,199 |
| 5.00%, due 7/1/29 | 100,000 | 114,063 |
| 5.00%, due 7/1/34 | 200,000 | 225,288 |
| Westchester County Local Development Corp., Pace University, Revenue Bonds | | |
| Series A | | |
| 5.50%, due 5/1/42 | 3,265,000 | 3,604,381 |
| Westchester Tobacco Asset Securitization Corp., Revenue Bonds, Senior Lien | | |
| Series B | | |
| 5.00%, due 6/1/41 | 250,000 | 296,390 |
| | | 433,785,913 |
| Transportation 11.7% |
| Albany County Airport Authority, Revenue Bonds | | |
| 4.00%, due 12/15/44 | 835,000 | 970,283 |
| Series A | | |
| 5.00%, due 12/15/43 | 1,750,000 | 2,144,538 |
| Series A | | |
| 5.00%, due 12/15/48 | 2,585,000 | 3,148,706 |
| Antonio B Won Pat International Airport Authority, Revenue Bonds | | |
| Series C, Insured: AGM | | |
| 6.00%, due 10/1/34 (d) | 1,000,000 | 1,095,779 |
| Buffalo & Fort Erie Public Bridge Authority, Toll Bridge System, Revenue Bonds | | |
| 5.00%, due 1/1/42 | 1,500,000 | 1,771,559 |
| Metropolitan Transportation Authority, Revenue Bonds | | |
| Series D | | |
| 4.00%, due 11/15/42 | 1,230,000 | 1,380,833 |
| | Principal
Amount | Value |
| |
| Transportation (continued) |
| Metropolitan Transportation Authority, Revenue Bonds (continued) | | |
| Series B-1 | | |
| 5.00%, due 5/15/22 | $ 5,350,000 | $ 5,610,244 |
| Series D | | |
| 5.00%, due 11/15/29 | 550,000 | 687,166 |
| Series B | | |
| 5.00%, due 11/15/40 | 2,500,000 | 2,838,887 |
| Series E | | |
| 5.00%, due 11/15/42 | 685,000 | 736,431 |
| Metropolitan Transportation Authority, Climate Certified Green Bond, Revenue Bonds | | |
| Series C, Insured: AGM | | |
| 4.00%, due 11/15/47 | 10,500,000 | 11,970,823 |
| Metropolitan Transportation Authority, Green Bond, Revenue Bonds | | |
| Series E | | |
| 4.00%, due 11/15/45 | 2,000,000 | 2,285,348 |
| Series C, Insured: AGM | | |
| 4.00%, due 11/15/48 | 1,240,000 | 1,412,163 |
| Series A-1, Insured: AGM | | |
| 4.00%, due 11/15/50 | 6,000,000 | 6,862,425 |
| Series A-1 | | |
| 4.00%, due 11/15/50 | 3,300,000 | 3,773,635 |
| Series A-1 | | |
| 4.00%, due 11/15/52 | 1,460,000 | 1,648,243 |
| Series A-2 | | |
| 5.00%, due 11/15/27 | 590,000 | 720,191 |
| Series C | | |
| 5.00%, due 11/15/42 | 2,325,000 | 2,851,696 |
| Series D | | |
| 5.00%, due 11/15/45 | 2,000,000 | 2,487,095 |
| MTA Hudson Rail Yards Trust Obligations, Election 2016, Revenue Bonds | | |
| Series A | | |
| 5.00%, due 11/15/56 | 7,205,000 | 7,811,854 |
| New York State Thruway Authority, Revenue Bonds | | |
| Series L | | |
| 4.00%, due 1/1/36 | 4,000,000 | 4,605,645 |
| Series N | | |
| 4.00%, due 1/1/47 | 5,500,000 | 6,383,312 |
The notes to the financial statements are an integral part of, and should be read in conjunction with, the financial statements.
| 24 | MainStay MacKay New York Tax Free Opportunities Fund |
| | Principal
Amount | Value |
| Long-Term Municipal Bonds (continued) |
| Transportation (continued) |
| New York State Thruway Authority, General Revenue Junior Indebtedness Obligation, Revenue Bonds | | |
| Series B, Insured: AGM | | |
| 4.00%, due 1/1/50 | $ 13,500,000 | $ 15,537,809 |
| New York Transportation Development Corp., Laguardia Airport Terminal B Redevelopment Project, Revenue Bonds | | |
| Series A | | |
| 5.25%, due 1/1/50 (d) | 2,000,000 | 2,263,910 |
| New York Transportation Development Corp., Laguardia Gateway Partners LLC, Revenue Bonds (d) | | |
| Series A, Insured: AGM | | |
| 4.00%, due 7/1/46 | 5,000,000 | 5,425,049 |
| Series A | | |
| 5.00%, due 7/1/41 | 1,000,000 | 1,128,433 |
| Niagara Frontier Transportation Authority, Buffalo Niagara International Airport, Revenue Bonds (d) | | |
| Series A | | |
| 5.00%, due 4/1/23 | 225,000 | 244,160 |
| Series A | | |
| 5.00%, due 4/1/24 | 490,000 | 552,195 |
| Series A | | |
| 5.00%, due 4/1/27 | 610,000 | 679,924 |
| Series A | | |
| 5.00%, due 4/1/29 | 325,000 | 361,263 |
| Series A | | |
| 5.00%, due 4/1/29 | 600,000 | 771,001 |
| Series A | | |
| 5.00%, due 4/1/30 | 375,000 | 476,736 |
| Series A | | |
| 5.00%, due 4/1/31 | 350,000 | 441,304 |
| Series A | | |
| 5.00%, due 4/1/32 | 400,000 | 500,957 |
| Series A | | |
| 5.00%, due 4/1/34 | 450,000 | 559,961 |
| Series A | | |
| 5.00%, due 4/1/35 | 400,000 | 496,817 |
| Series A | | |
| 5.00%, due 4/1/36 | 600,000 | 743,210 |
| Series A | | |
| 5.00%, due 4/1/38 | 375,000 | 462,034 |
| | Principal
Amount | Value |
| |
| Transportation (continued) |
| Ogdensburg Bridge and Port Authority, Revenue Bonds | | |
| 5.75%, due 7/1/47 (a) | $ 2,290,000 | $ 2,410,999 |
| Port Authority of Guam, Revenue Bonds | | |
| Series B | | |
| 5.00%, due 7/1/36 (d) | 625,000 | 740,533 |
| Series B | | |
| 5.00%, due 7/1/37 (d) | 200,000 | 236,216 |
| Series A | | |
| 5.00%, due 7/1/48 | 1,235,000 | 1,453,801 |
| Port Authority of New York & New Jersey, Consolidated 178th, Revenue Bonds | | |
| Series 178 | | |
| 5.00%, due 12/1/38 (d) | 1,500,000 | 1,662,917 |
| Port Authority of New York & New Jersey, Consolidated 1st, Revenue Bonds | | |
| Series 207 | | |
| 5.00%, due 9/15/48 (d) | 2,500,000 | 2,988,547 |
| Port Authority of New York & New Jersey, Consolidated 214th, Revenue Bonds (d) | | |
| Series 214 | | |
| 4.00%, due 9/1/37 | 2,955,000 | 3,447,303 |
| Series 214 | | |
| 4.00%, due 9/1/39 | 4,350,000 | 5,050,239 |
| Series 214 | | |
| 4.00%, due 9/1/43 | 2,030,000 | 2,326,966 |
| Port Authority of New York & New Jersey, Consolidated 218th, Revenue Bonds | | |
| Series 218 | | |
| 4.00%, due 11/1/47 (d) | 5,500,000 | 6,280,106 |
| Puerto Rico Highway & Transportation Authority, Revenue Bonds | | |
| Insured: AGC | | |
| 5.00%, due 7/1/23 | 340,000 | 349,482 |
| Series N, Insured: NATL-RE | | |
| 5.25%, due 7/1/32 | 1,010,000 | 1,130,414 |
| Triborough Bridge & Tunnel Authority, Revenue Bonds | | |
| Series B | | |
| 5.00%, due 11/15/45 | 2,000,000 | 2,342,675 |
The notes to the financial statements are an integral part of, and should be read in conjunction with, the financial statements.
25
Portfolio of Investments April 30, 2021† (Unaudited) (continued)
| | Principal
Amount | Value |
| Long-Term Municipal Bonds (continued) |
| Transportation (continued) |
| Triborough Bridge & Tunnel Authority, MTA Bridges & Tunnels, Revenue Bonds | | |
| Series A | | |
| 4.00%, due 11/15/44 | $ 1,105,000 | $ 1,274,848 |
| Series A | | |
| 4.00%, due 11/15/54 | 5,000,000 | 5,804,290 |
| Series A | | |
| 5.00%, due 11/15/49 | 5,000,000 | 6,177,307 |
| | | 147,518,262 |
| Utilities 2.6% |
| Guam Government Waterworks Authority, Water and Wastewater System, Revenue Bonds | | |
| 5.25%, due 7/1/33 | 1,230,000 | 1,360,319 |
| 5.50%, due 7/1/43 | 1,725,000 | 1,917,032 |
| Guam Power Authority, Revenue Bonds | | |
| Series A | | |
| 5.00%, due 10/1/33 | 1,055,000 | 1,236,589 |
| Series A | | |
| 5.00%, due 10/1/34 | 2,000,000 | 2,079,157 |
| Series A | | |
| 5.00%, due 10/1/38 | 2,700,000 | 3,131,806 |
| Series A | | |
| 5.00%, due 10/1/40 | 1,250,000 | 1,445,036 |
| Long Island Power Authority, Revenue Bonds | | |
| Series A, Insured: AGM | | |
| (zero coupon), due 12/1/26 | 1,500,000 | 1,399,679 |
| New York Power Authority, Green Bond, Revenue Bonds | | |
| Series A | | |
| 4.00%, due 11/15/50 | 2,400,000 | 2,804,269 |
| Series A | | |
| 4.00%, due 11/15/60 | 10,000,000 | 11,590,275 |
| Puerto Rico Electric Power Authority, Revenue Bonds | | |
| Series TT, Insured: NATL-IBC | | |
| 5.00%, due 7/1/23 | 265,000 | 269,470 |
| Series TT, Insured: NATL-IBC | | |
| 5.00%, due 7/1/26 | 215,000 | 220,697 |
| Series XX-RSA-1 | | |
| 5.25%, due 7/1/40 (b)(c) | 5,630,000 | 5,235,900 |
| | | 32,690,229 |
| | Principal
Amount | Value |
| |
| Water & Sewer 5.8% |
| Albany Municipal Water Finance Authority, Revenue Bonds | | |
| Series A | | |
| 4.00%, due 12/1/45 | $ 3,000,000 | $ 3,590,271 |
| Great Neck North Water Authority, Revenue Bonds | | |
| Series A | | |
| 4.00%, due 1/1/32 | 250,000 | 284,557 |
| Series A | | |
| 4.00%, due 1/1/33 | 425,000 | 482,096 |
| Series A | | |
| 4.00%, due 1/1/34 | 250,000 | 282,771 |
| Guam Government Waterworks Authority, Water and Wastewater System, Revenue Bonds | | |
| Series A | | |
| 5.00%, due 7/1/35 | 4,000,000 | 4,388,195 |
| 5.00%, due 1/1/46 | 3,365,000 | 3,799,319 |
| Series A | | |
| 5.00%, due 1/1/50 | 9,975,000 | 12,155,025 |
| Monroe County Water Authority, Revenue Bonds | | |
| 3.50%, due 3/1/45 | 2,000,000 | 2,242,512 |
| 5.00%, due 8/1/37 | 750,000 | 794,051 |
| New York City Water & Sewer System, Revenue Bonds | | |
| Series FF-1 | | |
| 4.00%, due 6/15/49 | 3,000,000 | 3,489,448 |
| New York City Water & Sewer System, Second General Resolution, Revenue Bonds | | |
| Series AA-2 | | |
| 3.00%, due 6/15/40 | 4,000,000 | 4,318,620 |
| Series BB-1 | | |
| 3.00%, due 6/15/50 | 5,000,000 | 5,308,505 |
| Series AA | | |
| 4.00%, due 6/15/40 | 3,000,000 | 3,568,835 |
| Series DD-3 | | |
| 4.00%, due 6/15/42 | 5,000,000 | 5,924,292 |
| Series DD | | |
| 5.00%, due 6/15/34 | 1,000,000 | 1,096,804 |
| Series AA-1 | | |
| 5.00%, due 6/15/50 | 755,000 | 967,285 |
| Niagara Falls Public Water Authority, Water & Sewer System, Revenue Bonds | | |
| Series A | | |
| 5.00%, due 7/15/34 | 770,000 | 926,962 |
The notes to the financial statements are an integral part of, and should be read in conjunction with, the financial statements.
| 26 | MainStay MacKay New York Tax Free Opportunities Fund |
| | Principal
Amount | Value |
| Long-Term Municipal Bonds (continued) |
| Water & Sewer (continued) |
| Onondaga County Water Authority, Revenue Bonds | | |
| Series A | | |
| 4.00%, due 9/15/34 | $ 845,000 | $ 1,023,027 |
| Series A | | |
| 4.00%, due 9/15/35 | 600,000 | 723,147 |
| Series A | | |
| 4.00%, due 9/15/36 | 1,375,000 | 1,649,746 |
| Series A | | |
| 4.00%, due 9/15/37 | 1,945,000 | 2,320,064 |
| Series A | | |
| 4.00%, due 9/15/39 | 700,000 | 827,948 |
| Puerto Rico Commonwealth Aqueduct & Sewer Authority, Revenue Bonds, Senior Lien | | |
| Series A | | |
| 5.00%, due 7/1/33 | 1,085,000 | 1,145,100 |
| Series A | | |
| 5.25%, due 7/1/24 | 3,000,000 | 3,175,088 |
| Series A | | |
| 5.25%, due 7/1/29 | 1,000,000 | 1,058,363 |
| Saratoga County Water Authority, Revenue Bonds | | |
| 4.00%, due 9/1/48 | 4,600,000 | 5,056,602 |
| Upper Mohawk Valley Regional Water Finance Authority, Green Bond, Revenue Bonds | | |
| Series A, Insured: AGM | | |
| 4.00%, due 4/1/46 | 2,675,000 | 3,111,213 |
| | | 73,709,846 |
Total Long-Term Municipal Bonds
(Cost $1,093,163,481) | | 1,164,509,292 |
| Short-Term Municipal Notes 2.1% |
| Other Revenue 0.8% |
| Albany Housing Authority, Nutgrove Garden Apartments Project, Revenue Bonds | | |
| 0.64%, due 12/1/25 (e)(f) | 560,000 | 560,000 |
| New York State Dormitory Authority, State Personal Income Tax, Revenue Bonds | | |
| Series 2016-XFT910 | | |
| 0.15%, due 3/15/40 (a)(e)(f) | 8,000,000 | 8,000,000 |
| | Principal
Amount | Value |
| |
| Other Revenue (continued) |
| New York State Housing Finance Agency, Variable Housing, 160 Madison Avenue, Revenue Bonds | | |
| Series A | | |
| 0.03%, due 11/1/46 (e)(f) | $ 1,200,000 | $ 1,200,000 |
| | | 9,760,000 |
| Transportation 0.8% |
| Triborough Bridge & Tunnel Authority, Revenue Bonds | | |
| 0.085%, due 1/1/32 (e)(f)(g) | 10,000,000 | 10,000,000 |
| Utility 0.4% |
| Puerto Rico Electric Power Authority, Revenue Bonds | | |
| Series UU, Insured: AGM | | |
| 0.655%, due 7/1/29 (f)(g) | 5,000,000 | 4,643,896 |
| Water & Sewer 0.1% |
| New York City Water & Sewer System, Revenue Bonds | | |
| Series A-1 | | |
| 0.04%, due 6/15/44 (e)(f) | 2,000,000 | 2,000,000 |
Total Short-Term Municipal Notes
(Cost $26,473,918) | | 26,403,896 |
Total Municipal Bonds
(Cost $1,119,637,399) | | 1,190,913,188 |
| |
| | Shares | |
| Closed-End Funds 0.1% |
| New York 0.1% |
| BlackRock New York Municipal Income Trust | 12,602 | 182,351 |
| Eaton Vance New York Municipal Bond Fund | 13,241 | 164,586 |
| Nuveen New York Quality Municipal Income Fund | 100,000 | 1,384,000 |
Total Closed-End Funds
(Cost $1,685,625) | | 1,730,937 |
The notes to the financial statements are an integral part of, and should be read in conjunction with, the financial statements.
27
Portfolio of Investments April 30, 2021† (Unaudited) (continued)
| | Shares | | Value |
| Short-Term Investment 4.2% |
| Unaffiliated Investment Company 4.2% |
| BlackRock Liquidity Funds MuniCash, 0.01% | 52,540,861 | | $ 52,551,369 |
Total Short-Term Investment
(Cost $52,551,369) | | | 52,551,369 |
Total Investments
(Cost $1,173,874,393) | 98.3% | | 1,245,195,494 |
| Other Assets, Less Liabilities | 1.7 | | 21,775,269 |
| Net Assets | 100.0% | | $ 1,266,970,763 |
| † | Percentages indicated are based on Fund net assets. |
| ‡ | Less than one-tenth of a percent. |
| (a) | May be sold to institutional investors only under Rule 144A or securities offered pursuant to Section 4(a)(2) of the Securities Act of 1933, as amended. |
| (b) | Issue in default. |
| (c) | Issue in non-accrual status. |
| (d) | Interest on these securities was subject to alternative minimum tax. |
| (e) | Coupon rate may change based on changes of the underlying collateral or prepayments of principal. Rate shown was the rate in effect as of April 30, 2021. |
| (f) | Variable-rate demand notes (VRDNs)—Provide the right to sell the security at face value on either that day or within the rate-reset period. VRDNs will normally trade as if the maturity is the earlier put date, even though stated maturity is longer. The interest rate is reset on the put date at a stipulated daily, weekly, monthly, quarterly, or other specified time interval to reflect current market conditions. These securities do not indicate a reference rate and spread in their description. The maturity date shown is the final maturity. |
| (g) | Floating rate—Rate shown was the rate in effect as of April 30, 2021. |
Futures Contracts
As of April 30, 2021, the Fund held the following futures contracts1:
| Type | Number of
Contracts | Expiration
Date | Value at
Trade Date | Current
Notional
Amount | Unrealized
Appreciation
(Depreciation)2 |
| Short Contracts | | | | | |
| U.S. Treasury Long Bonds | (14) | June 2021 | $ (2,263,791) | $ (2,201,500) | $ 62,291 |
| 1. | As of April 30, 2021, cash in the amount of $51,800 was on deposit with a broker or futures commission merchant for futures transactions. |
| 2. | Represents the difference between the value of the contracts at the time they were opened and the value as of April 30, 2021. |
| Abbreviation(s): |
| AGC—Assured Guaranty Corp. |
| AGM—Assured Guaranty Municipal Corp. |
| AMBAC—Ambac Assurance Corp. |
The notes to the financial statements are an integral part of, and should be read in conjunction with, the financial statements.
| 28 | MainStay MacKay New York Tax Free Opportunities Fund |
| BAM—Build America Mutual Assurance Co. |
| COMMWLTH GTD—Commonwealth Guaranteed |
| NATL-RE—National Public Finance Guarantee Corp. |
The following is a summary of the fair valuations according to the inputs used as of April 30, 2021, for valuing the Fund’s assets:
| Description | Quoted
Prices in
Active
Markets for
Identical
Assets
(Level 1) | | Significant
Other
Observable
Inputs
(Level 2) | | Significant
Unobservable
Inputs
(Level 3) | | Total |
| Asset Valuation Inputs | | | | | | | |
| Investments in Securities (a) | | | | | | | |
| Municipal Bonds | | | | | | | |
| Long-Term Municipal Bonds | $ — | | $ 1,164,509,292 | | $ — | | $ 1,164,509,292 |
| Short-Term Municipal Notes | — | | 26,403,896 | | — | | 26,403,896 |
| Total Municipal Bonds | — | | 1,190,913,188 | | — | | 1,190,913,188 |
| Closed-End Funds | 1,730,937 | | — | | — | | 1,730,937 |
| Short-Term Investment | | | | | | | |
| Unaffiliated Investment Company | 52,551,369 | | — | | — | | 52,551,369 |
| Total Investments in Securities | 54,282,306 | | 1,190,913,188 | | — | | 1,245,195,494 |
| Other Financial Instruments | | | | | | | |
| Futures Contracts (b) | 62,291 | | — | | — | | 62,291 |
| Total Other Financial Instruments | 62,291 | | — | | — | | 62,291 |
| Total Investments in Securities and Other Financial Instruments | $ 54,344,597 | | $ 1,190,913,188 | | $ — | | $ 1,245,257,785 |
| (a) | For a complete listing of investments and their industries, see the Portfolio of Investments. |
| (b) | The value listed for these securities reflects unrealized appreciation (depreciation) as shown on the Portfolio of Investments. |
The notes to the financial statements are an integral part of, and should be read in conjunction with, the financial statements.
29
Statement of Assets and Liabilities as of April 30, 2021 (Unaudited)
| Assets |
Investment in securities, at value
(identified cost $1,173,874,393) | $1,245,195,494 |
| Cash collateral on deposit at broker for futures contracts | 51,800 |
| Cash | 29,995,625 |
| Receivables: | |
| Dividends and interest | 12,573,288 |
| Fund shares sold | 4,507,059 |
| Variation margin on futures contracts | 3,500 |
| Other assets | 24,179 |
| Total assets | 1,292,350,945 |
| Liabilities |
| Payables: | |
| Investment securities purchased | 23,029,905 |
| Fund shares redeemed | 1,144,756 |
| Manager (See Note 3) | 456,079 |
| NYLIFE Distributors (See Note 3) | 213,905 |
| Professional fees | 50,397 |
| Transfer agent (See Note 3) | 26,045 |
| Custodian | 12,594 |
| Shareholder communication | 12,576 |
| Accrued expenses | 186 |
| Distributions payable | 433,739 |
| Total liabilities | 25,380,182 |
| Net assets | $1,266,970,763 |
| Composition of Net Assets |
| Shares of beneficial interest outstanding (par value of $.001 per share) unlimited number of shares authorized | $ 115,512 |
| Additional paid-in-capital | 1,222,739,551 |
| | 1,222,855,063 |
| Total distributable earnings (loss) | 44,115,700 |
| Net assets | $1,266,970,763 |
| Class A | |
| Net assets applicable to outstanding shares | $831,545,800 |
| Shares of beneficial interest outstanding | 75,819,721 |
| Net asset value per share outstanding | $ 10.97 |
| Maximum sales charge (4.50% of offering price) | 0.52 |
| Maximum offering price per share outstanding | $ 11.49 |
| Investor Class | |
| Net assets applicable to outstanding shares | $ 402,809 |
| Shares of beneficial interest outstanding | 36,720 |
| Net asset value per share outstanding | $ 10.97 |
| Maximum sales charge (4.00% of offering price) | 0.46 |
| Maximum offering price per share outstanding | $ 11.43 |
| Class C | |
| Net assets applicable to outstanding shares | $110,778,371 |
| Shares of beneficial interest outstanding | 10,099,353 |
| Net asset value and offering price per share outstanding | $ 10.97 |
| Class C2 | |
| Net assets applicable to outstanding shares | $ 1,460,390 |
| Shares of beneficial interest outstanding | 133,197 |
| Net asset value and offering price per share outstanding | $ 10.96 |
| Class I | |
| Net assets applicable to outstanding shares | $321,741,750 |
| Shares of beneficial interest outstanding | 29,327,763 |
| Net asset value and offering price per share outstanding | $ 10.97 |
| Class R6 | |
| Net assets applicable to outstanding shares | $ 1,041,643 |
| Shares of beneficial interest outstanding | 94,941 |
| Net asset value and offering price per share outstanding | $ 10.97 |
The notes to the financial statements are an integral part of, and should be read in conjunction with, the financial statements.
| 30 | MainStay MacKay New York Tax Free Opportunities Fund |
Statement of Operations for the six months ended April 30, 2021 (Unaudited)
| Investment Income (Loss) |
| Income | |
| Interest | $17,005,383 |
| Dividends | 37,953 |
| Total income | 17,043,336 |
| Expenses | |
| Manager (See Note 3) | 2,795,713 |
| Distribution/Service—Class A (See Note 3) | 953,398 |
| Distribution/Service—Investor Class (See Note 3) | 500 |
| Distribution/Service—Class C (See Note 3) | 273,456 |
| Distribution/Service—Class C2 (See Note 3) | 3,303 |
| Transfer agent (See Note 3) | 164,934 |
| Professional fees | 59,205 |
| Registration | 16,393 |
| Custodian | 15,054 |
| Shareholder communication | 14,543 |
| Trustees | 11,463 |
| Insurance | 4,536 |
| Miscellaneous | 16,324 |
| Total expenses before waiver/reimbursement | 4,328,822 |
| Expense waiver/reimbursement from Manager (See Note 3) | (187,760) |
| Net expenses | 4,141,062 |
| Net investment income (loss) | 12,902,274 |
| Realized and Unrealized Gain (Loss) |
| Net realized gain (loss) on: | |
| Unaffiliated investment transactions | (69,390) |
| Futures transactions | 195,560 |
| Net realized gain (loss) | 126,170 |
| Net change in unrealized appreciation (depreciation) on: | |
| Unaffiliated investments | 35,639,629 |
| Futures contracts | 13,871 |
| Net change in unrealized appreciation (depreciation) | 35,653,500 |
| Net realized and unrealized gain (loss) | 35,779,670 |
| Net increase (decrease) in net assets resulting from operations | $48,681,944 |
The notes to the financial statements are an integral part of, and should be read in conjunction with, the financial statements.
31
Statements of Changes in Net Assets
for the six months ended April 30, 2021 (Unaudited) and the year ended October 31, 2020
| | 2021 | 2020 |
| Increase (Decrease) in Net Assets |
| Operations: | | |
| Net investment income (loss) | $ 12,902,274 | $ 21,060,892 |
| Net realized gain (loss) | 126,170 | (10,587,425) |
| Net change in unrealized appreciation (depreciation) | 35,653,500 | 5,528,154 |
| Net increase (decrease) in net assets resulting from operations | 48,681,944 | 16,001,621 |
| Distributions to shareholders: | | |
| Class A | (9,149,064) | (15,380,566) |
| Investor Class | (4,804) | (13,031) |
| Class C | (1,174,930) | (2,583,964) |
| Class C2 | (9,633) | (326) |
| Class I | (3,870,240) | (6,515,603) |
| Class R6 | (16,098) | (31,548) |
| Total distributions to shareholders | (14,224,769) | (24,525,038) |
| Capital share transactions: | | |
| Net proceeds from sales of shares | 294,908,977 | 552,007,801 |
| Net asset value of shares issued to shareholder in reinvestment of distributions | 11,332,976 | 19,254,510 |
| Cost of shares redeemed | (133,667,827) | (217,517,858) |
| Increase (decrease) in net assets derived from capital share transactions | 172,574,126 | 353,744,453 |
| Net increase (decrease) in net assets | 207,031,301 | 345,221,036 |
| Net Assets |
| Beginning of period | 1,059,939,462 | 714,718,426 |
| End of period | $1,266,970,763 | $1,059,939,462 |
The notes to the financial statements are an integral part of, and should be read in conjunction with, the financial statements.
| 32 | MainStay MacKay New York Tax Free Opportunities Fund |
Financial Highlights selected per share data and ratios
| | Six months ended
April 30,
2021* | | Year Ended October 31, |
| Class A | 2020 | | 2019 | | 2018 | | 2017 | | 2016 |
| Net asset value at beginning of period | $ 10.63 | | $ 10.68 | | $ 10.12 | | $ 10.34 | | $ 10.58 | | $ 10.33 |
| Net investment income (loss) | 0.12 | | 0.29 | | 0.32 | | 0.34 | | 0.36 | | 0.36 |
| Net realized and unrealized gain (loss) on investments | 0.35 | | (0.04) | | 0.56 | | (0.22) | | (0.24) | | 0.25 |
| Total from investment operations | 0.47 | | 0.25 | | 0.88 | | 0.12 | | 0.12 | | 0.61 |
| Less distributions: | | | | | | | | | | | |
| From net investment income | (0.13) | | (0.30) | | (0.32) | | (0.34) | | (0.36) | | (0.36) |
| Net asset value at end of period | $ 10.97 | | $ 10.63 | | $ 10.68 | | $ 10.12 | | $ 10.34 | | $ 10.58 |
| Total investment return (a) | 4.44% | | 2.35% | | 8.84% | | 1.17% | | 1.23% | | 5.95% |
| Ratios (to average net assets)/Supplemental Data: | | | | | | | | | | | |
| Net investment income (loss) | 2.18%†† | | 2.38% | | 3.00% | | 3.31% | | 3.50% | | 3.33% |
| Net expenses (b) | 0.75%†† | | 0.75% | | 0.75% | | 0.75% | | 0.75% | | 0.75% |
| Expenses (before waiver/reimbursement) (b) | 0.78%†† | | 0.80% | | 0.82% | | 0.82% | | 0.83% | | 0.85% |
| Portfolio turnover rate | 3% (c) | | 29% (c) | | 28% (c) | | 33% | | 30% | | 28% |
| Net assets at end of period (in 000’s) | $ 831,546 | | $ 688,870 | | $ 462,499 | | $ 186,579 | | $ 148,823 | | $ 120,368 |
| * | Unaudited. |
| †† | Annualized. |
| (a) | Total investment return is calculated exclusive of sales charges and assumes the reinvestment of dividends and distributions. For periods of less than one year, total return is not annualized. |
| (b) | In addition to the fees and expenses which the Fund bears directly, it also indirectly bears a pro-rata share of the fees and expenses of the underlying funds in which it invests. Such indirect expenses are not included in the above expense ratios. |
| (c) | The portfolio turnover rate includes variable rate demand notes. |
| | Six months ended
April 30,
2021* | | Year Ended October 31, |
| Investor Class | 2020 | | 2019 | | 2018 | | 2017 | | 2016 |
| Net asset value at beginning of period | $ 10.63 | | $ 10.68 | | $ 10.13 | | $ 10.34 | | $ 10.59 | | $ 10.33 |
| Net investment income (loss) | 0.11 | | 0.25 | | 0.32 | | 0.34 | | 0.36 | | 0.36 |
| Net realized and unrealized gain (loss) on investments | 0.36 | | 0.00‡ | | 0.55 | | (0.21) | | (0.25) | | 0.26 |
| Total from investment operations | 0.47 | | 0.25 | | 0.87 | | 0.13 | | 0.11 | | 0.62 |
| Less distributions: | | | | | | | | | | | |
| From net investment income | (0.13) | | (0.30) | | (0.32) | | (0.34) | | (0.36) | | (0.36) |
| Net asset value at end of period | $ 10.97 | | $ 10.63 | | $ 10.68 | | $ 10.13 | | $ 10.34 | | $ 10.59 |
| Total investment return (a) | 4.44% | | 2.33% | | 8.72% | | 1.25% | | 1.10% | | 6.02% |
| Ratios (to average net assets)/Supplemental Data: | | | | | | | | | | | |
| Net investment income (loss) | 2.04%†† | | 2.39% | | 3.06% | | 3.29% | | 3.48% | | 3.33% |
| Net expenses (b) | 0.76%†† | | 0.77% | | 0.77% | | 0.78% | | 0.79% | | 0.79% |
| Expenses (before waiver/reimbursement) (b) | 0.79%†† | | 0.82% | | 0.84% | | 0.85% | | 0.87% | | 0.89% |
| Portfolio turnover rate | 3% (c) | | 29% (c) | | 28% (c) | | 33% | | 30% | | 28% |
| Net assets at end of period (in 000’s) | $ 403 | | $ 414 | | $ 463 | | $ 385 | | $ 356 | | $ 334 |
| * | Unaudited. |
| ‡ | Less than one cent per share. |
| †† | Annualized. |
| (a) | Total investment return is calculated exclusive of sales charges and assumes the reinvestment of dividends and distributions. For periods of less than one year, total return is not annualized. |
| (b) | In addition to the fees and expenses which the Fund bears directly, it also indirectly bears a pro-rata share of the fees and expenses of the underlying funds in which it invests. Such indirect expenses are not included in the above expense ratios. |
| (c) | The portfolio turnover rate includes variable rate demand notes. |
The notes to the financial statements are an integral part of, and should be read in conjunction with, the financial statements.
33
Financial Highlights selected per share data and ratios
| | Six months ended
April 30,
2021* | | Year Ended October 31, |
| Class C | 2020 | | 2019 | | 2018 | | 2017 | | 2016 |
| Net asset value at beginning of period | $ 10.63 | | $ 10.68 | | $ 10.12 | | $ 10.34 | | $ 10.59 | | $ 10.34 |
| Net investment income (loss) | 0.10 | | 0.24 | | 0.30 | | 0.31 | | 0.33 | | 0.33 |
| Net realized and unrealized gain (loss) on investments | 0.36 | | (0.02) | | 0.56 | | (0.22) | | (0.25) | | 0.25 |
| Total from investment operations | 0.46 | | 0.22 | | 0.86 | | 0.09 | | 0.08 | | 0.58 |
| Less distributions: | | | | | | | | | | | |
| From net investment income | (0.12) | | (0.27) | | (0.30) | | (0.31) | | (0.33) | | (0.33) |
| Net asset value at end of period | $ 10.97 | | $ 10.63 | | $ 10.68 | | $ 10.12 | | $ 10.34 | | $ 10.59 |
| Total investment return (a) | 4.30% | | 2.08% | | 8.55% | | 0.90% | | 0.85% | | 5.65% |
| Ratios (to average net assets)/Supplemental Data: | | | | | | | | | | | |
| Net investment income (loss) | 1.82%†† | | 2.13% | | 2.77% | | 3.04% | | 3.23% | | 3.04% |
| Net expenses (b) | 1.01%†† | | 1.02% | | 1.02% | | 1.03% | | 1.03% | | 1.04% |
| Expenses (before waiver/reimbursement) (b) | 1.04%†† | | 1.07% | | 1.09% | | 1.10% | | 1.11% | | 1.14% |
| Portfolio turnover rate | 3% (c) | | 29% (c) | | 28% (c) | | 33% | | 30% | | 28% |
| Net assets at end of period (in 000’s) | $ 110,778 | | $ 107,117 | | $ 90,553 | | $ 54,258 | | $ 45,547 | | $ 43,644 |
| * | Unaudited. |
| †† | Annualized. |
| (a) | Total investment return is calculated exclusive of sales charges and assumes the reinvestment of dividends and distributions. For periods of less than one year, total return is not annualized. |
| (b) | In addition to the fees and expenses which the Fund bears directly, it also indirectly bears a pro-rata share of the fees and expenses of the underlying funds in which it invests. Such indirect expenses are not included in the above expense ratios. |
| (c) | The portfolio turnover rate includes variable rate demand notes. |
| | Six months ended
April 30,
2021* | | August 31, 2020^ through
October 31, |
| Class C2 | 2020 |
| Net asset value at beginning of period | $ 10.63 | | $ 10.72 |
| Net investment income (loss) | 0.14 | | 0.04 |
| Net realized and unrealized gain (loss) on investments | 0.30 | | (0.09) |
| Total from investment operations | 0.44 | | (0.05) |
| Less distributions: | | | |
| From net investment income | (0.11) | | (0.04) |
| Net asset value at end of period | $ 10.96 | | $ 10.63 |
| Total investment return (a) | 4.12% | | (0.50)% |
| Ratios (to average net assets)/Supplemental Data: | | | |
| Net investment income (loss) | 2.50%†† | | 1.32%†† |
| Net expenses (b) | 1.15%†† | | 1.17%†† |
| Expenses (before waiver/reimbursement) (b) | 1.18%†† | | 1.22%†† |
| Portfolio turnover rate (c) | 3% | | 29% |
| Net assets at end of period (in 000’s) | $ 1,460 | | $ 315 |
| * | Unaudited. |
| ^ | Inception date. |
| †† | Annualized. |
| (a) | Total investment return is calculated exclusive of sales charges and assumes the reinvestment of dividends and distributions. For periods of less than one year, total return is not annualized. |
| (b) | In addition to the fees and expenses which the Fund bears directly, it also indirectly bears a pro-rata share of the fees and expenses of the underlying funds in which it invests. Such indirect expenses are not included in the above expense ratios. |
| (c) | The portfolio turnover rate includes variable rate demand notes. |
The notes to the financial statements are an integral part of, and should be read in conjunction with, the financial statements.
| 34 | MainStay MacKay New York Tax Free Opportunities Fund |
Financial Highlights selected per share data and ratios
| | Six months ended
April 30,
2021* | | Year Ended October 31, |
| Class I | 2020 | | 2019 | | 2018 | | 2017 | | 2016 |
| Net asset value at beginning of period | $ 10.63 | | $ 10.68 | | $ 10.13 | | $ 10.34 | | $ 10.59 | | $ 10.34 |
| Net investment income (loss) | 0.13 | | 0.32 | | 0.35 | | 0.37 | | 0.39 | | 0.39 |
| Net realized and unrealized gain (loss) on investments | 0.35 | | (0.05) | | 0.55 | | (0.21) | | (0.25) | | 0.25 |
| Total from investment operations | 0.48 | | 0.27 | | 0.90 | | 0.16 | | 0.14 | | 0.64 |
| Less distributions: | | | | | | | | | | | |
| From net investment income | (0.14) | | (0.32) | | (0.35) | | (0.37) | | (0.39) | | (0.39) |
| Net asset value at end of period | $ 10.97 | | $ 10.63 | | $ 10.68 | | $ 10.13 | | $ 10.34 | | $ 10.59 |
| Total investment return (a) | 4.57% | | 2.61% | | 9.01% | | 1.53% | | 1.39% | | 6.22% |
| Ratios (to average net assets)/Supplemental Data: | | | | | | | | | | | |
| Net investment income (loss) | 2.44%†† | | 2.64% | | 3.37% | | 3.54% | | 3.76% | | 3.61% |
| Net expenses (b) | 0.50%†† | | 0.50% | | 0.50% | | 0.50% | | 0.50% | | 0.50% |
| Expenses (before waiver/reimbursement) (b) | 0.53%†† | | 0.55% | | 0.57% | | 0.57% | | 0.58% | | 0.60% |
| Portfolio turnover rate | 3% (c) | | 29% (c) | | 28% (c) | | 33% | | 30% | | 28% |
| Net assets at end of period (in 000’s) | $ 321,742 | | $ 261,819 | | $ 161,203 | | $ 181,059 | | $ 62,078 | | $ 53,894 |
| * | Unaudited. |
| †† | Annualized. |
| (a) | Total investment return is calculated exclusive of sales charges and assumes the reinvestment of dividends and distributions. Class I shares are not subject to sales charges. For periods of less than one year, total return is not annualized. |
| (b) | In addition to the fees and expenses which the Fund bears directly, it also indirectly bears a pro-rata share of the fees and expenses of the underlying funds in which it invests. Such indirect expenses are not included in the above expense ratios. |
| (c) | The portfolio turnover rate includes variable rate demand notes. |
| | Six months ended
April 30,
2021* | | November 1, 2019^ through
October 31, |
| Class R6 | 2020 |
| Net asset value at beginning of period | $ 10.63 | | $ 10.69 |
| Net investment income (loss) | 0.11 | | 0.29 |
| Net realized and unrealized gain (loss) on investments | 0.37 | | (0.03) |
| Total from investment operations | 0.48 | | 0.26 |
| Less distributions: | | | |
| From net investment income | (0.14) | | (0.32) |
| Net asset value at end of period | $ 10.97 | | $ 10.63 |
| Total investment return (a) | 4.58% | | 2.60% |
| Ratios (to average net assets)/Supplemental Data: | | | |
| Net investment income (loss) | 2.10%†† | | 2.39% |
| Net expenses (b) | 0.47%†† | | 0.48% |
| Expenses (before waiver/reimbursement) (b) | 0.50%†† | | 0.54% |
| Portfolio turnover rate (c) | 3% | | 29% |
| Net assets at end of period (in 000’s) | $ 1,042 | | $ 1,404 |
| * | Unaudited. |
| ^ | Inception date. |
| †† | Annualized. |
| (a) | Total investment return is calculated exclusive of sales charges and assumes the reinvestment of dividends and distributions. Class R6 shares are not subject to sales charges. For periods of less than one year, total return is not annualized. |
| (b) | In addition to the fees and expenses which the Fund bears directly, it also indirectly bears a pro-rata share of the fees and expenses of the underlying funds in which it invests. Such indirect expenses are not included in the above expense ratios. |
| (c) | The portfolio turnover rate includes variable rate demand notes. |
The notes to the financial statements are an integral part of, and should be read in conjunction with, the financial statements.
35
Notes to Financial Statements (Unaudited)
Note 1-Organization and Business
MainStay Funds Trust (the “Trust”) was organized as a Delaware statutory trust on April 28, 2009. The Trust is registered under the Investment Company Act of 1940, as amended (the “1940 Act”), as an open-end management investment company, and is comprised of thirty-two funds (collectively referred to as the “Funds”). These financial statements and notes relate to the MainStay MacKay New York Tax Free Opportunities Fund (the "Fund"), a “diversified” fund, as that term is defined in the 1940 Act, as interpreted or modified by regulatory authorities having jurisdiction, from time to time.
The following table lists the Fund's share classes that have been registered and commenced operations:
| Class | Commenced Operations |
| Class A | May 14, 2012 |
| Investor Class | May 14, 2012 |
| Class C | May 14, 2012 |
| Class C2 | August 31, 2020 |
| Class I | May 14, 2012 |
| Class R6 | November 1, 2019 |
| SIMPLE Class | N/A* |
| * | SIMPLE Class shares were registered for sale effective as of August 31, 2020 but have not yet commenced operations. |
Class A and Investor Class shares are offered at net asset value (“NAV”) per share plus an initial sales charge. No initial sales charge applies to investments of $250,000 or more (and certain other qualified purchases) in Class A and Investor Class shares. However, a contingent deferred sales charge (“CDSC”) of 1.00% may be imposed on certain redemptions made within 18 months of the date of purchase on shares that were purchased without an initial sales charge. Class C and Class C2 shares are offered at NAV without an initial sales charge, although a 1.00% CDSC may be imposed on certain redemptions of such shares made within one year of the date of purchase of Class C and Class C2 shares. Class I and Class R6 shares are offered at NAV without a sales charge. SIMPLE Class shares are currently expected to be offered at NAV without a sales charge. In addition, depending upon eligibility, Class C shares convert to either Class A or Investor Class shares at the end of the calendar quarter ten years after the date they were purchased. Additionally, Investor Class shares may convert automatically to Class A shares based on a shareholder’s account balance as described in the Fund’s prospectus. Under certain circumstances and as may be permitted by the Trust’s multiple class plan pursuant to Rule 18f-3 under the 1940 Act, specified share classes of the Fund may be converted to one or more other share classes of the Fund as disclosed in the capital share transactions within these Notes. The classes of shares have the same voting (except for issues that relate solely to one class), dividend, liquidation and other rights, and the same terms and conditions, except that under distribution plans pursuant to Rule 12b-1 under the 1940 Act, Class C and Class C2 shares are subject to higher distribution and/or
service fees than Class A, Investor Class and SIMPLE Class shares. Class I and Class R6 shares are not subject to a distribution and/or service fee.
The Fund's investment objective is to seek current income exempt from federal and New York state and, in some cases, New York local income taxes.
Note 2–Significant Accounting Policies
The Fund is an investment company and accordingly follows the investment company accounting and reporting guidance of the Financial Accounting Standards Board (“FASB”) Accounting Standard Codification Topic 946 Financial Services—Investment Companies. The Fund prepares its financial statements in accordance with generally accepted accounting principles (“GAAP”) in the United States of America and follows the significant accounting policies described below.
(A) Securities Valuation. Investments are usually valued as of the close of regular trading on the New York Stock Exchange (the "Exchange") (usually 4:00 p.m. Eastern time) on each day the Fund is open for business ("valuation date").
The Board of Trustees of the Trust (the "Board") adopted procedures establishing methodologies for the valuation of the Fund's securities and other assets and delegated the responsibility for valuation determinations under those procedures to the Valuation Committee of the Trust (the “Valuation Committee”). The procedures state that, subject to the oversight of the Board and unless otherwise noted, the responsibility for the day-to-day valuation of portfolio assets (including fair value measurements for the Fund's assets and liabilities) rests with New York Life Investment Management LLC (“New York Life Investments” or the "Manager"), aided to whatever extent necessary by the Subadvisor (as defined in Note 3(A)). To assess the appropriateness of security valuations, the Manager, the Subadvisor or the Fund's third-party service provider, who is subject to oversight by the Manager, regularly compares prior day prices, prices on comparable securities and the sale prices to the prior and current day prices and challenges prices with changes exceeding certain tolerance levels with third-party pricing services or broker sources.
The Board authorized the Valuation Committee to appoint a Valuation Subcommittee (the “Subcommittee”) to establish the prices of securities for which market quotations are not readily available or the prices of which are not otherwise readily determinable under the procedures. The Subcommittee meets (in person, via electronic mail or via teleconference) on an as-needed basis. The Valuation Committee meets to ensure that actions taken by the Subcommittee were appropriate.
For those securities valued through either a standardized fair valuation methodology or a fair valuation measurement, the Subcommittee deals with such valuation and the Valuation Committee reviews and affirms, if appropriate, the reasonableness of the valuation based on such methodologies and measurements on a regular basis after considering information that is reasonably available and deemed relevant by the
| 36 | MainStay MacKay New York Tax Free Opportunities Fund |
Valuation Committee. Any action taken by the Subcommittee with respect to the valuation of a portfolio security or other asset is submitted for review and ratification (if appropriate) to the Valuation Committee and the Board at the next regularly scheduled meeting.
"Fair value" is defined as the price the Fund would reasonably expect to receive upon selling an asset or liability in an orderly transaction to an independent buyer in the principal or most advantageous market for the asset or liability. Fair value measurements are determined within a framework that establishes a three-tier hierarchy that maximizes the use of observable market data and minimizes the use of unobservable inputs to establish a classification of fair value measurements for disclosure purposes. "Inputs" refer broadly to the assumptions that market participants would use in pricing the asset or liability, including assumptions about risk, such as the risk inherent in a particular valuation technique used to measure fair value using a pricing model and/or the risk inherent in the inputs for the valuation technique. Inputs may be observable or unobservable. Observable inputs reflect the assumptions market participants would use in pricing the asset or liability based on market data obtained from sources independent of the Fund. Unobservable inputs reflect the Fund’s own assumptions about the assumptions market participants would use in pricing the asset or liability based on the information available. The inputs or methodology used for valuing assets or liabilities may not be an indication of the risks associated with investing in those assets or liabilities. The three-tier hierarchy of inputs is summarized below.
| • | Level 1—quoted prices in active markets for an identical asset or liability |
| • | Level 2—other significant observable inputs (including quoted prices for a similar asset or liability in active markets, interest rates and yield curves, prepayment speeds, credit risk, etc.) |
| • | Level 3—significant unobservable inputs (including the Fund's own assumptions about the assumptions that market participants would use in measuring fair value of an asset or liability) |
The level of an asset or liability within the fair value hierarchy is based on the lowest level of an input, both individually and in the aggregate, that is significant to the fair value measurement. The aggregate value by input level of the Fund’s assets and liabilities as of April 30, 2021, is included at the end of the Portfolio of Investments.
The Fund may use third-party vendor evaluations, whose prices may be derived from one or more of the following standard inputs, among others:
| • Benchmark yields | • Reported trades |
| • Broker/dealer quotes | • Issuer spreads |
| • Two-sided markets | • Benchmark securities |
| • Bids/offers | • Reference data (corporate actions or material event notices) |
| • Industry and economic events | • Comparable bonds |
| • Monthly payment information | |
An asset or liability for which market values cannot be measured using the methodologies described above is valued by methods deemed reasonable in good faith by the Valuation Committee, following the procedures established by the Board, to represent fair value. Under these procedures, the Fund generally uses a market-based approach which may use related or comparable assets or liabilities, recent transactions, market multiples, book values and other relevant information. The Fund may also use an income-based valuation approach in which the anticipated future cash flows of the asset or liability are discounted to calculate fair value. Discounts may also be applied due to the nature and/or duration of any restrictions on the disposition of the asset or liability. Fair value represents a good faith approximation of the value of a security. Fair value determinations involve the consideration of a number of subjective factors, an analysis of applicable facts and circumstances and the exercise of judgment. As a result, it is possible that the fair value for a security determined in good faith in accordance with the Fund's valuation procedures may differ from valuations for the same security determined by other funds using their own valuation procedures. Although the Fund's valuation procedures are designed to value a security at the price the Fund may reasonably expect to receive upon the security's sale in an orderly transaction, there can be no assurance that any fair value determination thereunder would, in fact, approximate the amount that the Fund would actually realize upon the sale of the security or the price at which the security would trade if a reliable market price were readily available. During the six-month period ended April 30, 2021, there were no material changes to the fair value methodologies.
Securities which may be valued in this manner include, but are not limited to: (i) a security for which trading has been halted or suspended; (ii) a debt security that has recently gone into default and for which there is not a current market quotation; (iii) a security of an issuer that has entered into a restructuring; (iv) a security that has been delisted from a national exchange; (v) a security for which the market price is not readily available from a third-party pricing source or, if so provided, does not, in the opinion of the Manager or the Subadvisor, reflect the security's market value; (vi) a security subject to trading collars for which no or limited trading takes place; and (vii) a security whose principal market has been temporarily closed at a time when, under normal conditions, it would be open. Securities valued in this manner are generally categorized as Level 3 in the hierarchy. No securities held by the Fund as of April 30, 2021 were fair valued in such a manner.
Investments in mutual funds, including money market funds, are valued at their respective NAVs at the close of business each day on the valuation date. These securities are generally categorized as Level 1 in the hierarchy.
Futures contracts are valued at the last posted settlement price on the market where such futures are primarily traded. These securities are generally categorized as Level 1 in the hierarchy.
Municipal debt securities are valued at the evaluated mean prices supplied by a pricing agent or broker selected by the Manager, in consultation with the Subadvisor. The evaluations are market-based
Notes to Financial Statements (Unaudited) (continued)
measurements processed through a pricing application and represents the pricing agent's good faith determination as to what a holder may receive in an orderly transaction under market conditions. The rules-based logic utilizes valuation techniques that reflect participants' assumptions and vary by asset class and per methodology, maximizing the use of relevant observable data including quoted prices for similar assets, benchmark yield curves and market corroborated inputs. The evaluated bid or mean prices are deemed by the Manager, in consultation with the Subadvisor, to be representative of market values, at the regular close of trading of the Exchange on each valuation date. Municipal debt securities purchased on a delayed delivery basis are marked to market daily until settlement at the forward settlement date. Municipal debt securities are generally categorized as Level 2 in the hierarchy.
In calculating NAV, each closed-end fund is valued at market value, which will generally be determined using the last reported official closing or last trading price on the exchange or market on which the security is primarily traded at the time of valuation. Price information on closed end funds is taken from the exchange where the security is primarily traded. In addition, because closed-end funds and exchange-traded funds trade on a secondary market, their shares may trade at a premium or discount to the actual net asset value of their portfolio securities and their shares may have greater volatility because of the potential lack of liquidity. These closed-end funds are generally categorized as Level 1 in the hierarchy.
Temporary cash investments acquired in excess of 60 days to maturity at the time of purchase are valued using the latest bid prices or using valuations based on a matrix system (which considers such factors as security prices, yields, maturities and ratings), both as furnished by independent pricing services. Temporary cash investments that mature in 60 days or less at the time of purchase ("Short-Term Investments") are valued using the amortized cost method of valuation, unless the use of such method would be inappropriate. The amortized cost method involves valuing a security at its cost on the date of purchase and thereafter assuming a constant amortization to maturity of the difference between such cost and the value on maturity date. Amortized cost approximates the current fair value of a security. Securities valued using the amortized cost method are not valued using quoted prices in an active market and are generally categorized as Level 2 in the hierarchy.
The information above is not intended to reflect an exhaustive list of the methodologies that may be used to value portfolio investments. The valuation procedures permit the use of a variety of valuation methodologies in connection with valuing portfolio investments. The methodology used for a specific type of investment may vary based on the market data available or other considerations. The methodologies summarized above may not represent the specific means by which portfolio investments are valued on any particular business day.
(B) Income Taxes. The Fund's policy is to comply with the requirements of the Internal Revenue Code of 1986, as amended (the “Internal Revenue Code”), applicable to regulated investment companies and to distribute all of its taxable income to the shareholders of the Fund within the allowable time limits.
The Manager evaluates the Fund’s tax positions to determine if the tax positions taken meet the minimum recognition threshold in connection with accounting for uncertainties in income tax positions taken or expected to be taken for the purposes of measuring and recognizing tax liabilities in the financial statements. Recognition of tax benefits of an uncertain tax position is permitted only to the extent the position is “more likely than not” to be sustained assuming examination by taxing authorities. The Manager analyzed the Fund's tax positions taken on federal, state and local income tax returns for all open tax years (for up to three tax years) and has concluded that no provisions for federal, state and local income tax are required in the Fund's financial statements. The Fund's federal, state and local income tax and federal excise tax returns for tax years for which the applicable statutes of limitations have not expired are subject to examination by the Internal Revenue Service and state and local departments of revenue.
(C) Dividends and Distributions to Shareholders. Dividends and distributions are recorded on the ex-dividend date. The Fund intends to declare dividends from net investment income, if any, daily and intends to pay them at least monthly and declares and pays distributions from net realized capital gains, if any, at least annually. Unless a shareholder elects otherwise, all dividends and distributions are reinvested at NAV in the same class of shares of the Fund. Dividends and distributions to shareholders are determined in accordance with federal income tax regulations and may differ from determinations using GAAP.
(D) Security Transactions and Investment Income. The Fund records security transactions on the trade date. Realized gains and losses on security transactions are determined using the identified cost method. Interest income is accrued as earned using the effective interest rate method. Distributions received from real estate investment trusts may be classified as dividends, capital gains and/or return of capital. Discounts and premiums on securities purchased for the Fund are accreted and amortized, respectively, on the effective interest rate method over the life of the respective securities.
Investment income and realized and unrealized gains and losses on investments of the Fund are allocated pro rata to the separate classes of shares based upon their relative net assets on the date the income is earned or realized and unrealized gains and losses are incurred.
The Fund may place a debt security on non-accrual status and reduce related interest income by ceasing current accruals and writing off all or a portion of any interest receivables when the collection of all or a portion of such interest has become doubtful. A debt security is removed from non-accrual status when the issuer resumes interest payments or when collectability of interest is reasonably assured.
(E) Expenses. Expenses of the Trust are allocated to the individual Funds in proportion to the net assets of the respective Funds when the expenses are incurred, except where direct allocations of expenses can be made. Expenses (other than transfer agent expenses and fees incurred under the shareholder services plans and/or the distribution plans further discussed in Note 3(B)) are allocated to separate classes of shares pro
| 38 | MainStay MacKay New York Tax Free Opportunities Fund |
rata based upon their relative net assets on the date the expenses are incurred. The expenses borne by the Fund, including those of related parties to the Fund, are shown in the Statement of Operations.
Additionally, the Fund may invest in mutual funds, which are subject to management fees and other fees that may cause the costs of investing in mutual funds to be greater than the costs of owning the underlying securities directly. These indirect expenses of mutual funds are not included in the amounts shown as expenses in the Statement of Operations or in the expense ratios included in the Financial Highlights.
(F) Use of Estimates. In preparing financial statements in conformity with GAAP, the Manager makes estimates and assumptions that affect the reported amounts and disclosures in the financial statements. Actual results could differ from those estimates and assumptions.
(G) Futures Contracts. A futures contract is an agreement to purchase or sell a specified quantity of an underlying instrument at a specified future date and price, or to make or receive a cash payment based on the value of a financial instrument (e.g., foreign currency, interest rate, security or securities index). The Fund is subject to risks such as market price risk and/or interest rate risk in the normal course of investing in these contracts. Upon entering into a futures contract, the Fund is required to pledge to the broker or futures commission merchant an amount of cash and/or U.S. government securities equal to a certain percentage of the collateral amount, known as the “initial margin.” During the period the futures contract is open, changes in the value of the contract are recognized as unrealized appreciation or depreciation by marking to market such contract on a daily basis to reflect the market value of the contract at the end of each day’s trading. The Fund agrees to receive from or pay to the broker or futures commission merchant an amount of cash equal to the daily fluctuation in the value of the contract. Such receipts or payments are known as “variation margin.” When the futures contract is closed, the Fund records a realized gain or loss equal to the difference between the proceeds from (or cost of) the closing transaction and the Fund's basis in the contract.
The use of futures contracts involves, to varying degrees, elements of market risk in excess of the amount recognized in the Statement of Assets and Liabilities. The contract or notional amounts and variation margin reflect the extent of the Fund's involvement in open futures positions. There are several risks associated with the use of futures contracts as hedging techniques. There can be no assurance that a liquid market will exist at the time when the Fund seeks to close out a futures contract. If no liquid market exists, the Fund would remain obligated to meet margin requirements until the position is closed. Futures contracts may involve a small initial investment relative to the risk assumed, which could result in losses greater than if the Fund did not invest in futures contracts. Futures contracts may be more volatile than direct investments in the instrument underlying the futures and may not correlate to the underlying instrument, causing a given hedge not to achieve its objectives. The Fund's activities in futures contracts have minimal counterparty risk as they are conducted through regulated exchanges that guarantee the futures against default by the counterparty. In the event of
a bankruptcy or insolvency of a futures commission merchant that holds margin on behalf of the Fund, the Fund may not be entitled to the return of the entire margin owed to the Fund, potentially resulting in a loss. The Fund may invest in futures contracts to seek enhanced returns or to reduce the risk of loss by hedging certain of its holdings. The Fund's investment in futures contracts and other derivatives may increase the volatility of the Fund's NAVs and may result in a loss to the Fund. Open futures contracts as of April 30, 2021 are shown in the Portfolio of Investments.
(H) Municipal Bond Risk. The Fund may invest more heavily in municipal bonds from certain cities, states, territories or regions than others, which may increase the Fund’s exposure to losses resulting from economic, political, regulatory occurrences, or declines in tax revenue impacting these particular cities, states, territories or regions. In addition, many state and municipal governments that issue securities are under significant economic and financial stress and may not be able to satisfy their obligations, and these events may be made worse due to economic challenges posed by COVID-19. The Fund may invest a substantial amount of its assets in municipal bonds whose interest is paid solely from revenues of similar projects, such as tobacco settlement bonds. If the Fund concentrates its investments in this manner, it assumes the legal and economic risks relating to such projects and this may have a significant impact on the Fund’s investment performance.
Certain of the issuers in which the Fund may invest have recently experienced, or may experience, significant financial difficulties and repeated credit rating downgrades. On May 3, 2017, the Commonwealth of Puerto Rico began proceedings pursuant to the Puerto Rico Oversight, Management, and Economic Stability Act (“PROMESA”) to seek bankruptcy-type protections from approximately $74 billion in debt and approximately $48 billion in unfunded pension obligations. In addition, the economic downturn following the outbreak of COVID-19 and the resulting pressure on Puerto Rico’s budget have further contributed to its financial challenges. The federal government has passed certain relief packages, such as the Coronavirus Aid, Relief, and Economic Security Act and the American Rescue Plan, which include more than $5 billion in disaster relief funds for the U.S. territories, including Puerto Rico. However, there can be no assurances that the federal funds allocated to the Commonwealth will be sufficient to address the economic challenges arising from COVID-19. Puerto Rico has reached agreements with certain bondholders to restructure outstanding debt issued by certain of Puerto Rico’s instrumentalities and is negotiating the restructuring of its debt with certain other bondholders. Under the terms of these agreements, amounts due to bondholders, including the Fund, may be substantially lower than the original investment. Any agreement to restructure such outstanding debt must be approved by the judge overseeing the debt restructuring. Puerto Rico’s debt restructuring process and other economic, political, social, environmental or health factors or developments could occur rapidly and may significantly affect the value of municipal securities of Puerto Rico. Due to the ongoing budget impact from COVID-19 on the Commonwealth’s finances, the Federal Oversight and Management Board or the Commonwealth could seek to revise or
Notes to Financial Statements (Unaudited) (continued)
even terminate earlier agreements reached with certain creditors prior to the outbreak of COVID-19. Any agreement between the Federal Oversight and Management Board and creditors is subject to approval by the judge overseeing the Title III proceedings. The composition of the Federal Oversight and Management Board has changed significantly during the past year due to existing members either stepping down or being replaced following the expiration of a member's term. There is no assurance that board members will approve the restructuring agreements the prior board had negotiated.
The Fund’s vulnerability to potential losses associated with such developments may be reduced through investing in municipal securities that feature credit enhancements (such as bond insurance). The bond insurance provider pays both principal and interest when due to the bond holder. The magnitude of Puerto Rico’s debt restructuring or other adverse economic developments could pose significant strains on the ability of municipal securities insurers to meet all future claims. As of April 30, 2021, 64.3% of the Puerto Rico municipal securities held by the Fund were insured.
(I) Indemnifications. Under the Trust’s organizational documents, its officers and trustees are indemnified against certain liabilities that may arise out of performance of their duties to the Trust. Additionally, in the normal course of business, the Fund enters into contracts with third-party service providers that contain a variety of representations and warranties and that may provide general indemnifications. The Fund's maximum exposure under these arrangements is unknown, as this would involve future claims that may be made against the Fund that have not yet occurred. The Manager believes that the risk of loss in connection with these potential indemnification obligations is remote. However, there can be no assurance that material liabilities related to such obligations will not arise in the future, which could adversely impact the Fund.
(J) Quantitative Disclosure of Derivative Holdings. The following tables show additional disclosures related to the Fund's derivative and hedging activities, including how such activities are accounted for and their effect on the Fund's financial positions, performance and cash flows.
The Fund entered into futures contracts to help manage the duration and yield curve positioning of the portfolio. These derivatives are not accounted for as hedging instruments.
Fair value of derivative instruments as of April 30, 2021:
| Asset Derivatives | Interest
Rate
Contracts
Risk | Total |
| Futures Contracts - Net Assets—Net unrealized appreciation on futures contracts (a) | $62,291 | $62,291 |
| Total Fair Value | $62,291 | $62,291 |
| (a) | Includes cumulative appreciation (depreciation) of futures contracts as reported in the Portfolio of Investments. Only current day’s variation margin is reported within the Statement of Assets and Liabilities. |
The effect of derivative instruments on the Statement of Operations for the six-month period ended April 30, 2021:
| Net Realized Gain (Loss) from: | Interest
Rate
Contracts
Risk | Total |
| Futures Contracts | $195,560 | $195,560 |
| Total Net Realized Gain (Loss) | $195,560 | $195,560 |
| Net Change in Unrealized Appreciation (Depreciation) | Interest
Rate
Contracts
Risk | Total |
| Futures Contracts | $13,871 | $13,871 |
| Total Net Change in Unrealized Appreciation (Depreciation) | $13,871 | $13,871 |
| Average Notional Amount | Total |
| Futures Contracts Short | $(2,305,042) |
Note 3–Fees and Related Party Transactions
(A) Manager and Subadvisor. New York Life Investments, a registered investment adviser and an indirect, wholly-owned subsidiary of New York Life Insurance Company ("New York Life"), serves as the Fund's Manager, pursuant to an Amended and Restated Management Agreement ("Management Agreement"). The Manager provides offices, conducts clerical, recordkeeping and bookkeeping services and keeps most of the financial and accounting records required to be maintained by the Fund. Except for the portion of salaries and expenses that are the responsibility of the Fund, the Manager pays the salaries and expenses of all personnel affiliated with the Fund and certain operational expenses of the Fund. The Fund reimburses New York Life Investments in an amount equal to the portion of the compensation of the Chief Compliance Officer attributable to the Fund. MacKay Shields LLC ("MacKay Shields" or the "Subadvisor"), a registered investment adviser and an indirect, wholly-owned subsidiary of New York Life, serves as Subadvisor to the Fund and is responsible for the day-to-day portfolio management of the Fund. Pursuant to the terms of an Amended and Restated Subadvisory Agreement ("Subadvisory Agreement") between New York Life Investments and MacKay Shields, New York Life Investments pays for the services of the Subadvisor.
Effective February 28, 2021, pursuant to the Management Agreement, the Fund pays the Manager a monthly fee for the services performed and the facilities furnished at an annual rate of the Fund’s average daily net assets as follows: 0.45% up to $1 billion; 0.43% from $1 billion up to $3 billion and 0.42% in excess of $3 billion.
Prior to February 28, 2021, the Fund paid the Manager a monthly fee for the services performed and the facilities furnished at an annual rate of the Fund’s average daily net assets as follows: 0.50% up to $1 billion and 0.48% in excess of $1 billion. During the six-month period ended April 30, 2021, the effective management fee rate was 0.48% of the Fund’s
| 40 | MainStay MacKay New York Tax Free Opportunities Fund |
average daily net assets, exclusive of any applicable waivers/reimbursements.
Prior to February 28, 2021, New York Life Investments had contractually agreed to waive a portion of its management fee so that the management fee would not exceed the Fund’s average daily net assets as follows: 0.45% up to $1 billion and 0.43% in excess of $1 billion.
New York Life Investments has also contractually agreed to waive fees and/or reimburse expenses so that Total Annual Fund Operating Expenses (excluding taxes, interest, litigation, extraordinary expenses, brokerage and other transaction expenses relating to the purchase or sale of portfolio investments and acquired (underlying) fund fees and expenses) of Class A shares do not exceed 0.75% of its average daily net assets. New York Life Investments will apply an equivalent waiver or reimbursement, in an equal number of basis points to Investor Class, Class C, Class C2 and Class I shares. New York Life Investments has contractually agreed to waive fees and/or reimburse expenses so that Total Annual Fund Operating Expenses (excluding taxes, interest, litigation, extraordinary expenses, brokerage and other transaction expenses relating to the purchase or sale of portfolio investments, and acquired (underlying) fund fees and expenses) of Class R6 do not exceed those of Class I. These agreements will remain in effect until February 28, 2022, and shall renew automatically for one-year terms unless New York Life Investments provides written notice of termination prior to the start of the next term or upon approval of the Board.
During the six-month period ended April 30, 2021, New York Life Investments earned fees from the Fund in the amount of $2,795,713 and waived fees and/or reimbursed expenses in the amount of $187,760 and paid the Subadvisor fees in the amount of $1,325,294.
JPMorgan Chase Bank, N.A. ("JPMorgan") provides sub-administration and sub-accounting services to the Fund pursuant to an agreement with New York Life Investments. These services include calculating the daily NAVs of the Fund, maintaining the general ledger and sub-ledger accounts for the calculation of the Fund's NAVs, and assisting New York Life Investments in conducting various aspects of the Fund's administrative operations. For providing these services to the Fund, JPMorgan is compensated by New York Life Investments.
Prior to November 23, 2020, these services were provided by State Street Bank and Trust Company ("State Street").
Pursuant to an agreement between the Trust and New York Life Investments, New York Life Investments is responsible for providing or procuring certain regulatory reporting services for the Fund. The Fund will reimburse New York Life Investments for the actual costs incurred by New York Life Investments in connection with providing or procuring these services for the Fund.
(B) Distribution and Service Fees. The Trust, on behalf of the Fund, has entered into a distribution agreement with NYLIFE Distributors LLC (the “Distributor”), an affiliate of New York Life
Investments. The Fund has adopted distribution plans (the “Plans”) in accordance with the provisions of Rule 12b-1 under the 1940 Act.
Pursuant to the Class A and Investor Class Plans, the Distributor receives a monthly distribution fee from the Class A and Investor Class shares at an annual rate of 0.25% of the average daily net assets of the Class A and Investor Class shares for distribution and/or service activities as designated by the Distributor. Pursuant to the Class C Plans, Class C shares pay the Distributor a monthly distribution fee at an annual rate of 0.25% of the average daily net assets of the Class C shares along with a service fee at an annual rate of 0.25% of the average daily net assets of the Class C shares, for a total 12b-1 fee of 0.50%. Pursuant to the Class C2 Plan, Class C2 shares pay the Distributor a monthly distribution fee at an annual rate of 0.40% of the average daily net assets of the Class C2 shares, along with a service fee at an annual rate of 0.25% of the average daily net assets of the Class C shares, for a total 12b-1 fee of 0.65%. Class I shares are not subject to a distribution and/or service fee.
The Plans provide that the distribution and service fees are payable to the Distributor regardless of the amounts actually expended by the Distributor for distribution of the Fund's shares and service activities.
(C) Sales Charges. The Fund was advised by the Distributor that the amount of initial sales charges retained on sales of Class A and Investor Class shares during the six-month period ended April 30, 2021, were $6,608 and $52, respectively.
The Fund was also advised that the Distributor retained CDSCs on redemptions of Class A and Class C shares during the six-month period ended April 30, 2021, of $79,239 and $5,500, respectively.
(D) Transfer, Dividend Disbursing and Shareholder Servicing Agent. NYLIM Service Company LLC, an affiliate of New York Life Investments, is the Fund's transfer, dividend disbursing and shareholder servicing agent pursuant to an agreement between NYLIM Service Company LLC and the Trust. NYLIM Service Company LLC has entered into an agreement with DST Asset Manager Solutions, Inc. ("DST"), pursuant to which DST performs certain transfer agent services on behalf of NYLIM Service Company LLC. New York Life Investments has contractually agreed to limit the transfer agency expenses charged to the Fund���s share classes to a maximum of 0.35% of that share class’s average daily net assets on an annual basis after deducting any applicable Fund or class-level expense reimbursement or small account fees. This agreement will remain in effect until February 28, 2022, and shall renew automatically for one-year terms unless New York Life Investments provides written notice of termination prior to the start of the next term or upon approval of the Board. During the six-month period ended April 30, 2021, transfer agent expenses incurred by the Fund and
Notes to Financial Statements (Unaudited) (continued)
any reimbursements, pursuant to the aforementioned Transfer Agency expense limitation agreement, were as follows:
| Class | Expense | Waived |
| Class A | $103,398 | $— |
| Investor Class | 79 | — |
| Class C | 21,612 | — |
| Class C2 | 200 | — |
| Class I | 39,621 | — |
| Class R6 | 24 | — |
(E) Small Account Fee. Shareholders with small accounts adversely impact the cost of providing transfer agency services. In an effort to reduce total transfer agency expenses, the Fund has implemented a small account fee on certain types of accounts. As described in the Fund's prospectus, certain shareholders with an account balance of less than $1,000 ($5,000 for Class A share accounts) are charged an annual per account fee of $20 (assessed semi-annually), the proceeds from which offset transfer agent fees as reflected in the Statement of Operations. This small account fee will not apply to certain types of accounts as described further in the Fund’s prospectus.
(F) Capital. As of April 30, 2021, New York Life and its affiliates beneficially held shares of the Fund with the values and percentages of net assets as follows:
| Class C2 | $25,864 | 1.8% |
| Class R6 | 26,748 | 2.6 |
Note 4-Federal Income Tax
As of April 30, 2021, the cost and unrealized appreciation (depreciation) of the Fund’s investment portfolio, including applicable derivative contracts and other financial instruments, as determined on a federal income tax basis, were as follows:
| | Federal Tax
Cost | Gross
Unrealized
Appreciation | Gross
Unrealized
(Depreciation) | Net
Unrealized
Appreciation/
(Depreciation) |
| Investments | $1,176,902,849 | $69,595,173 | $(1,302,528) | $68,292,645 |
As of October 31, 2020, for federal income tax purposes, capital loss carryforwards of $18,147,524 were available as shown in the table below, to the extent provided by the regulations to offset future realized gains of the Fund through the years indicated. To the extent that these capital loss carryforwards are used to offset future capital gains, it is probable that the capital gains so offset will not be distributed to
shareholders. No capital gain distributions shall be made until any capital loss carryforwards have been fully utilized.
Capital Loss
Available Through | Short-Term
Capital Loss
Amounts (000’s) | Long-Term
Capital Loss
Amounts (000’s) |
| Unlimited | $12,005 | $6,143 |
During the year ended October 31, 2020, the tax character of distributions paid as reflected in the Statements of Changes in Net Assets was as follows:
| | 2020 |
| Distributions paid from: | |
| Ordinary Income | $ 388,295 |
| Exempt Interest Dividends | 24,136,743 |
| Total | $24,525,038 |
Note 5–Custodian
JPMorgan is the custodian of cash and securities held by the Fund. Custodial fees are charged to the Fund based on the Fund's net assets and/or the market value of securities held by the Fund and the number of certain transactions incurred by the Fund.
Prior to November 23, 2020, these services were provided by State Street. The services provided by State Street were a direct expense of the Fund and are included in the Statement of Operations as Custodian fees which totaled $1,830 for the period November 1, 2020 through November 22, 2020.
Note 6–Line of Credit
The Fund and certain other funds managed by New York Life Investments maintain a line of credit with a syndicate of banks in order to secure a source of funds for temporary purposes to meet unanticipated or excessive redemption requests.
Effective July 28, 2020, under the credit agreement (the “Credit Agreement”), the aggregate commitment amount is $600,000,000 with an additional uncommitted amount of $100,000,000. The commitment fee is an annual rate of 0.15% of the average commitment amount payable quarterly, regardless of usage, to JPMorgan, who serves as the agent to the syndicate. The commitment fee is allocated among the Fund and certain other funds managed by New York Life Investments based upon their respective net assets and other factors. Interest on any revolving credit loan is charged based upon the Federal Funds Rate or the one-month London Interbank Offered Rate (“LIBOR”), whichever is higher. The Credit Agreement expires on July 27, 2021, although the Fund, certain other funds managed by New York Life Investments and the syndicate of banks may renew the Credit Agreement for an additional year on the same or different terms or enter into a credit agreement with a different syndicate of banks. Prior to July 28, 2020, the aggregate commitment amount and the commitment fee were the same as those under the current Credit Agreement, but State Street served as agent to the syndicate. During the six-month period ended April 30, 2021, there
| 42 | MainStay MacKay New York Tax Free Opportunities Fund |
were no borrowings made or outstanding with respect to the Fund under the Credit Agreement or the credit agreement for which State Street served as agent.
Note 7–Interfund Lending Program
Pursuant to an exemptive order issued by the SEC, the Fund, along with certain other funds managed by New York Life Investments, may participate in an interfund lending program. The interfund lending program provides an alternative credit facility that permits the Fund and certain other funds managed by New York Life Investments to lend or borrow money for temporary purposes directly to or from one another, subject to the conditions of the exemptive order. During the six-month period ended April 30, 2021, there were no interfund loans made or outstanding with respect to the Fund.
Note 8–Purchases and Sales of Securities (in 000’s)
During the six-month period ended April 30, 2021, purchases and sales of securities, other than short-term securities, were $211,151 and $32,438, respectively.
Note 9–Capital Share Transactions
Transactions in capital shares for the six-month period ended April 30, 2021 and the year ended October 31, 2020, were as follows:
| Class A | Shares | Amount |
| Period ended April 30, 2021: | | |
| Shares sold | 18,683,767 | $ 203,551,089 |
| Shares issued to shareholders in reinvestment of distributions | 715,167 | 7,786,549 |
| Shares redeemed | (8,365,955) | (90,935,651) |
| Net increase (decrease) in shares outstanding before conversion | 11,032,979 | 120,401,987 |
| Shares converted into Class A (See Note 1) | 16,824 | 182,133 |
| Shares converted from Class A (See Note 1) | (34,656) | (377,337) |
| Net increase (decrease) | 11,015,147 | $ 120,206,783 |
| Year ended October 31, 2020: | | |
| Shares sold | 32,818,972 | $ 350,186,364 |
| Shares issued to shareholders in reinvestment of distributions | 1,231,988 | 13,097,173 |
| Shares redeemed | (12,530,922) | (130,616,440) |
| Net increase (decrease) in shares outstanding before conversion | 21,520,038 | 232,667,097 |
| Shares converted into Class A (See Note 1) | 18,314 | 194,381 |
| Shares converted from Class A (See Note 1) | (38,924) | (406,838) |
| Net increase (decrease) | 21,499,428 | $ 232,454,640 |
| |
| Investor Class | Shares | Amount |
| Period ended April 30, 2021: | | |
| Shares sold | 1,932 | $ 21,110 |
| Shares issued to shareholders in reinvestment of distributions | 423 | 4,607 |
| Shares redeemed | (2,187) | (24,042) |
| Net increase (decrease) in shares outstanding before conversion | 168 | 1,675 |
| Shares converted from Investor Class (See Note 1) | (2,392) | (25,915) |
| Net increase (decrease) | (2,224) | $ (24,240) |
| Year ended October 31, 2020: | | |
| Shares sold | 30,793 | $ 329,132 |
| Shares issued to shareholders in reinvestment of distributions | 1,137 | 12,082 |
| Shares redeemed | (19,670) | (209,366) |
| Net increase (decrease) in shares outstanding before conversion | 12,260 | 131,848 |
| Shares converted into Investor Class (See Note 1) | 108 | 1,102 |
| Shares converted from Investor Class (See Note 1) | (16,815) | (178,343) |
| Net increase (decrease) | (4,447) | $ (45,393) |
| |
| Class C | Shares | Amount |
| Period ended April 30, 2021: | | |
| Shares sold | 1,077,919 | $ 11,744,669 |
| Shares issued to shareholders in reinvestment of distributions | 74,573 | 811,914 |
| Shares redeemed | (1,097,122) | (11,949,059) |
| Net increase (decrease) in shares outstanding before conversion | 55,370 | 607,524 |
| Shares converted from Class C (See Note 1) | (31,494) | (342,718) |
| Net increase (decrease) | 23,876 | $ 264,806 |
| Year ended October 31, 2020: | | |
| Shares sold | 3,464,848 | $ 37,021,349 |
| Shares issued to shareholders in reinvestment of distributions | 165,339 | 1,756,947 |
| Shares redeemed | (2,022,224) | (21,378,963) |
| Net increase (decrease) in shares outstanding before conversion | 1,607,963 | 17,399,333 |
| Shares converted from Class C (See Note 1) | (9,813) | (104,698) |
| Net increase (decrease) | 1,598,150 | $ 17,294,635 |
| |
Notes to Financial Statements (Unaudited) (continued)
| Class C2 | Shares | Amount |
| Period ended April 30, 2021: | | |
| Shares sold | 104,217 | $ 1,131,954 |
| Shares issued to shareholders in reinvestment of distributions | 885 | 9,633 |
| Shares redeemed | (1,558) | (16,975) |
| Net increase (decrease) | 103,544 | $ 1,124,612 |
| Period ended October 31, 2020:(a) | | |
| Shares sold | 29,644 | $ 314,957 |
| Shares issued to shareholders in reinvestment of distributions | 31 | 326 |
| Shares redeemed | (22) | (229) |
| Net increase (decrease) | 29,653 | $ 315,054 |
| |
| Class I | Shares | Amount |
| Period ended April 30, 2021: | | |
| Shares sold | 7,192,948 | $ 78,460,155 |
| Shares issued to shareholders in reinvestment of distributions | 248,375 | 2,704,175 |
| Shares redeemed | (2,788,508) | (30,320,759) |
| Net increase (decrease) in shares outstanding before conversion | 4,652,815 | 50,843,571 |
| Shares converted into Class I (See Note 1) | 51,708 | 563,837 |
| Net increase (decrease) | 4,704,523 | $ 51,407,408 |
| Year ended October 31, 2020: | | |
| Shares sold | 15,326,954 | $ 162,719,376 |
| Shares issued to shareholders in reinvestment of distributions | 409,861 | 4,356,434 |
| Shares redeemed | (6,249,028) | (65,266,661) |
| Net increase (decrease) in shares outstanding before conversion | 9,487,787 | 101,809,149 |
| Shares converted into Class I (See Note 1) | 47,130 | 494,396 |
| Net increase (decrease) | 9,534,917 | $ 102,303,545 |
| |
| Class R6 | Shares | Amount |
| Period ended April 30, 2021: | | |
| Shares issued to shareholders in reinvestment of distributions | 1,478 | $ 16,098 |
| Shares redeemed | (38,580) | (421,341) |
| Net increase (decrease) | (37,102) | $ (405,243) |
| Year ended October 31, 2020:(b) | | |
| Shares sold | 133,535 | $ 1,436,623 |
| Shares issued to shareholders in reinvestment of distributions | 2,976 | 31,548 |
| Shares redeemed | (4,468) | (46,199) |
| Net increase (decrease) | 132,043 | $ 1,421,972 |
| (a) | The inception date of the class was August 31, 2020. |
| (b) | The inception date of the class was November 1, 2019. |
Note 10–Recent Accounting Pronouncement
In March 2020, the Financial Accounting Standards Board issued Accounting Standards Update 2020-04 (“ASU 2020-04”), which provides optional guidance to ease the potential accounting burden associated with transitioning away from LIBOR and other reference rates that are expected to be discontinued. ASU 2020-04 was effective immediately upon release of the update on March 12, 2020 and remains effective through December 31, 2022. At this time, the Manager is evaluating the implications of certain other provisions of ASU 2020-04 related to new disclosure requirements and any impact on the financial statement disclosures has not yet been determined.
Note 11–Other Matters
An outbreak of COVID-19, first detected in December 2019, has developed into a global pandemic and has resulted in travel restrictions, closure of international borders, certain businesses and securities markets, restrictions on securities trading activities, prolonged quarantines, supply chain disruptions, and lower consumer demand, as well as general concern and uncertainty. The continued impact of COVID-19 is uncertain and could further adversely affect the global economy, national economies, individual issuers and capital markets in unforeseeable ways and result in a substantial and extended economic downturn. Developments that disrupt global economies and financial markets, such as COVID-19, may magnify factors that affect the Fund's performance.
Note 12–Subsequent Events
In connection with the preparation of the financial statements of the Fund as of and for the six-month period ended April 30, 2021, events and transactions subsequent to April 30, 2021, through the date the financial statements were issued have been evaluated by the Manager for possible adjustment and/or disclosure. No subsequent events requiring financial statement adjustment or disclosure have been identified.
| 44 | MainStay MacKay New York Tax Free Opportunities Fund |
Board Consideration and Approval of Management Agreement and Subadvisory Agreement (Unaudited)
The continuation of the Management Agreement with respect to the MainStay MacKay New York Tax Free Opportunities Fund (“Fund”) and New York Life Investment Management LLC (“New York Life Investments”) and the Subadvisory Agreement between New York Life Investments and MacKay Shields LLC (“MacKay”) with respect to the Fund (together, “Advisory Agreements”), following an initial term of up to two years, is subject to annual review and approval by the Board of Trustees of MainStay Funds Trust (“Board” of the “Trust”) in accordance with Section 15 of the Investment Company Act of 1940, as amended (“1940 Act”). At its December 9–10, 2020 meeting, the Board, including the Trustees who are not an “interested person” (as such term is defined in the 1940 Act) of the Trust (“Independent Trustees”) voting separately, unanimously approved the continuation of each of the Advisory Agreements for a one-year period.
In reaching the decision to approve the continuation of each of the Advisory Agreements, the Board considered information furnished by New York Life Investments and MacKay in connection with an annual contract review process undertaken by the Board that took place at meetings of the Board and its Contracts Committee during September 2020 through December 2020, as well as other information furnished to the Board and its Committees throughout the year, as deemed relevant by the Trustees. Information requested by and furnished to the Board for consideration in connection with the contract review process included, among other items, reports on the Fund and “peer funds” prepared by Strategic Insight Mutual Fund Research and Consulting, LLC (“Strategic Insight”), an independent third-party service provider engaged by the Board to report objectively on the Fund’s investment performance, management fee and total expenses. The Board also considered information on the fees charged to other investment advisory clients of New York Life Investments and/or MacKay that follow investment strategies similar to those of the Fund, if any, and, when applicable, the rationale for any differences in the Fund’s management and subadvisory fees and the fees charged to those other investment advisory clients. In addition, the Board considered information furnished by New York Life Investments and MacKay in response to requests prepared on behalf of the Board, and in consultation with the Independent Trustees, by independent legal counsel to the Independent Trustees, which encompassed a variety of topics, including those summarized below.
The Board took into account information provided in connection with its meetings throughout the year, including, among other items, information regarding the legal standards and fiduciary obligations applicable to its consideration of the continuation of each of the Advisory Agreements and investment performance reports on the Fund as well as presentations from New York Life Investments and MacKay personnel. The Board also took into account other information received from New York Life Investments throughout the year, including, among other items, periodic reports on legal and compliance matters, risk management, portfolio turnover, brokerage commissions and non-advisory services provided to the Fund by New York Life Investments. The contract review process, including the structure and format for materials provided to the Board, has been developed in consultation with the Board. The Independent
Trustees also met in executive sessions with their independent legal counsel and, for a portion thereof, with senior management of New York Life Investments.
In addition to information provided to the Board throughout the year, the Board received information in connection with its June 2020 meeting provided specifically in response to requests prepared on behalf of the Board, and in consultation with the Independent Trustees, by independent legal counsel regarding the Fund’s distribution arrangements. In addition, the Board received information regarding the Fund’s asset levels, share purchase and redemption activity and the payment of Rule 12b-1 and/or other fees by applicable share classes of the Fund, among other information.
In considering the continuation of each of the Advisory Agreements, the Trustees reviewed and evaluated the information and factors they believed to reasonably be necessary and appropriate in light of legal advice furnished to them by independent legal counsel and through the exercise of their own business judgment. Although individual Trustees may have weighed certain factors or information differently, the factors considered by the Board are described in greater detail below and include, among other factors: (i) the nature, extent and quality of the services provided to the Fund by New York Life Investments and MacKay; (ii) the qualifications of the portfolio managers of the Fund and the historical investment performance of the Fund, New York Life Investments and MacKay; (iii) the costs of the services provided, and profits realized, by New York Life Investments and MacKay from their relationships with the Fund; (iv) the extent to which economies of scale have been realized or may be realized as the Fund grows and the extent to which economies of scale have benefited or may benefit the Fund’s shareholders; and (v) the reasonableness of the Fund’s management and subadvisory fees and total ordinary operating expenses. Although the Board recognized that comparisons between the Fund’s fees and expenses and those of other funds are imprecise given different terms of agreements, variations in fund strategies and other factors, the Board considered the reasonableness of the Fund’s management fee and total ordinary operating expenses as compared to the peer funds identified by Strategic Insight. Throughout their considerations, the Trustees acknowledged the commitment of New York Life Investments and its affiliates to serve the MainStay Group of Funds, as well as their capacity, experience, resources, financial stability and reputations. The Trustees also acknowledged the entrepreneurial and other risks assumed by New York Life Investments in sponsoring and managing the Fund.
The Trustees noted that, throughout the year, the Trustees are afforded an opportunity to ask questions of, and request additional information or materials from, New York Life Investments and MacKay. The Board’s decision with respect to each of the Advisory Agreements may have also been based, in part, on the Board’s knowledge of New York Life Investments and MacKay resulting from, among other things, the Board’s consideration of each of the Advisory Agreements in prior years, the advisory agreements for other funds in the MainStay Group of Funds, the Board’s review throughout the year of the performance and operations of other funds in the MainStay Group of Funds and each Trustee’s business
Board Consideration and Approval of Management Agreement and Subadvisory Agreement (Unaudited) (continued)
judgment and industry experience. In addition to considering the above-referenced factors, the Board observed that in the marketplace there are a range of investment options available to the Fund’s shareholders and such shareholders, having had the opportunity to consider other investment options, have chosen to invest in the Fund.
The factors that figured prominently in the Board’s decision to approve the continuation of each of the Advisory Agreements during its December 9–10, 2020 meeting are summarized in more detail below, and the Board did not consider any factor or information controlling in reaching such decision.
Nature, Extent and Quality of Services Provided by New York Life Investments and MacKay
The Board examined the nature, extent and quality of the services that New York Life Investments provides to the Fund. The Board evaluated New York Life Investments’ experience and capabilities in serving as manager of the Fund and considered that the Fund operates in a “manager-of-managers” structure. The Board also considered New York Life Investments’ responsibilities and services provided pursuant to this structure, including evaluating the performance of MacKay, making recommendations to the Board as to whether the Subadvisory Agreement should be renewed, modified or terminated and periodically reporting to the Board regarding the results of New York Life Investments’ evaluation and monitoring functions. The Board noted that New York Life Investments manages other mutual funds, serves a variety of other investment advisory clients, including other pooled investment vehicles, and has experience overseeing mutual fund service providers, including subadvisors. The Board considered the experience of senior personnel at New York Life Investments providing management and administrative and other non-advisory services to the Fund as well as New York Life Investments’ reputation and financial condition. The Board observed that New York Life Investments devotes significant resources and time to providing management and non-advisory services to the Fund, including New York Life Investments’ supervision and due diligence reviews of MacKay and ongoing analysis of, and interactions with, MacKay with respect to, among other things, the Fund’s investment performance and risks as well as MacKay’s investment capabilities and subadvisory services with respect to the Fund.
The Board also considered the range of services that New York Life Investments provides to the Fund under the terms of the Management Agreement, including: (i) fund accounting and ongoing supervisory services provided by New York Life Investments’ Fund Administration and Accounting Group; (ii) investment supervisory and analytical services provided by New York Life Investments’ Investment Consulting Group; (iii) compliance services provided by the Trust’s Chief Compliance Officer as well as New York Life Investments’ compliance department, including supervision and implementation of the Fund’s compliance program; (iv) legal services provided by New York Life Investments’ Office of the General Counsel; and (v) risk management monitoring and analysis by compliance and investment personnel. The Board noted that New York Life Investments provides certain other non-advisory services to the Fund.
In addition, the Board considered New York Life Investments’ willingness to invest in personnel, infrastructure, technology, operational enhancements, cyber security, information security, shareholder privacy resources and business continuity planning designed to benefit the Fund and noted that New York Life Investments is responsible for compensating the Trust’s officers, except for a portion of the salary of the Trust’s Chief Compliance Officer. The Board recognized that New York Life Investments has provided an increasingly broad array of non-advisory services to the MainStay Group of Funds as a result of regulatory and other developments, including in connection with the designation of New York Life Investments as the administrator of the MainStay Group of Funds’ liquidity risk management program adopted under the 1940 Act. The Board considered benefits to shareholders from being part of the MainStay Group of Funds, including the privilege of exchanging investments between the same class of shares of funds in the MainStay Group of Funds, including without the imposition of a sales charge (if any).
The Board also examined the nature, extent and quality of the investment advisory services that MacKay provides to the Fund and considered the terms of each of the Advisory Agreements. The Board evaluated MacKay’s experience in serving as subadvisor to the Fund and advising other portfolios and MacKay’s track record and experience in providing investment advisory services, the experience of investment advisory, senior management and administrative personnel at MacKay and New York Life Investments’ and MacKay’s overall resources, legal and compliance environment, capabilities and history. In addition to information provided in connection with quarterly meetings with the Trust’s Chief Compliance Officer, the Board considered information regarding the compliance policies and procedures of New York Life Investments and MacKay and acknowledged their commitment to further developing and strengthening compliance programs relating to the Fund. The Board reviewed MacKay’s ability to attract and retain qualified investment professionals and willingness to invest in personnel to service and support the Fund. In this regard, the Board considered the experience of the Fund’s portfolio managers, the number of accounts managed by the portfolio managers and the method for compensating the portfolio managers.
In addition, the Board considered discussions with New York Life Investments regarding the implementation of its business continuity plans and recognized steps taken by New York Life Investments and MacKay to continue to provide the same nature, extent and quality of services to the Fund during the COVID-19 pandemic.
Based on these considerations, the Board concluded that the Fund would likely continue to benefit from the nature, extent and quality of these services.
Investment Performance
In evaluating the Fund’s investment performance, the Board considered investment performance results over various periods in light of the Fund’s investment objective, strategies and risks. The Board considered
| 46 | MainStay MacKay New York Tax Free Opportunities Fund |
investment reports on, and analysis of, the Fund’s performance provided to the Board throughout the year. These reports include, among other items, information on the Fund’s gross and net returns, the Fund’s investment performance compared to relevant investment categories and the Fund’s benchmark, the Fund’s risk-adjusted investment performance and the Fund’s investment performance as compared to peer funds, as appropriate, as well as portfolio attribution information and commentary on the effect of market conditions. The Board also considered information provided by Strategic Insight showing the investment performance of the Fund as compared to peer funds.
The Board also gave weight to its discussions with senior management at New York Life Investments concerning the Fund’s investment performance attributable to MacKay as well as discussions between the Fund’s portfolio managers and the members of the Board’s Investment Committee, which generally occur on an annual basis. In addition, the Board considered any specific actions that New York Life Investments or MacKay had taken, or had agreed to take, to seek to enhance Fund investment performance and the results of those actions.
Based on these considerations, the Board concluded that its review of the Fund’s investment performance and related information supported a determination to approve the continuation of each of the Advisory Agreements.
Costs of the Services Provided, and Profits Realized, by New York Life Investments and MacKay
The Board considered the costs of the services provided under each of the Advisory Agreements. The Board also considered the profits realized by New York Life Investments and its affiliates, including MacKay, due to their relationships with the Fund. Because MacKay is an affiliate of New York Life Investments whose subadvisory fee is paid by New York Life Investments, not the Fund, the Board considered cost and profitability information for New York Life Investments and MacKay in the aggregate.
In addition, the Board acknowledged the difficulty in obtaining reliable comparative data about mutual fund managers’ profitability because such information generally is not publicly available and may be impacted by numerous factors, including the structure of a fund manager’s organization, the types of funds it manages, the methodology used to allocate certain fixed costs to specific funds and the manager’s capital structure and costs of capital.
In evaluating the costs of the services provided by New York Life Investments and MacKay and profits realized by New York Life Investments and its affiliates, including MacKay, the Board considered, among other factors, each party’s continuing investments in, or willingness to invest in, personnel, systems, equipment and other resources and infrastructure to support and further enhance the management of the Fund, and that New York Life Investments is responsible for paying the subadvisory fee for the Fund. The Board also considered the financial resources of New York Life Investments and MacKay and acknowledged that New York Life Investments and MacKay must be in a position to attract and retain experienced professional
personnel and to maintain a strong financial position for New York Life Investments and MacKay to continue to provide high-quality services to the Fund. The Board recognized that the Fund benefits from the allocation of certain fixed costs among the funds in the MainStay Group of Funds, among other expected benefits resulting from its relationship with New York Life Investments.
The Board considered information regarding New York Life Investments’ methodology for calculating profitability and allocating costs provided by New York Life Investments in connection with the fund profitability analysis presented to the Board. The Board previously engaged an independent consultant to review the methods used to allocate costs among the funds in the MainStay Group of Funds. The Board noted that the independent consultant had concluded that New York Life Investments’ methods for allocating costs and procedures for estimating overall profitability of the relationship with the funds in the MainStay Group of Funds are reasonable and that New York Life Investments continued to use the same method of calculating profit and allocating costs since the independent consultant’s review. The Board recognized the difficulty in calculating and evaluating a manager’s profitability with respect to the Fund and noted that other profitability methodologies may also be reasonable.
The Board also considered certain fall-out benefits that may be realized by New York Life Investments and its affiliates due to their relationships with the Fund, including reputational and other indirect benefits. In addition, the Board considered its review of a money market fund advised by New York Life Investments and an affiliated subadvisor that serves as an investment option for the Fund, including the potential rationale for and costs associated with investments in this money market fund by the Fund, if any, and considered information from New York Life Investments that the nature and type of specific investment advisory services provided to this money market fund are distinct from, or in addition to, the investment advisory services provided to the Fund.
The Board observed that, in addition to fees earned by New York Life Investments for managing the Fund, New York Life Investments’ affiliates also earn revenues from serving the Fund in various other capacities, including as the Fund’s transfer agent and distributor. The Board considered information about these other revenues and their impact on the profitability of the relationship with the Fund to New York Life Investments and its affiliates. The Board noted that, although it assessed the overall profitability of the Fund to New York Life Investments and its affiliates as part of the contract review process, when considering the reasonableness of the fee paid to New York Life Investments and its affiliates under each of the Advisory Agreements, the Board considered the profitability of New York Life Investments’ relationship with the Fund on a pre-tax basis and without regard to distribution expenses incurred by New York Life Investments from its own resources.
After evaluating the information deemed relevant by the Trustees, the Board concluded that any profits realized by New York Life Investments and its affiliates, including MacKay, due to their relationships with the Fund were not excessive.
Board Consideration and Approval of Management Agreement and Subadvisory Agreement (Unaudited) (continued)
Management and Subadvisory Fees and Total Ordinary Operating Expenses
The Board evaluated the reasonableness of the fee paid under each of the Advisory Agreements and the Fund’s total ordinary operating expenses. The Board primarily considered the reasonableness of the management fee paid by the Fund to New York Life Investments, because the subadvisory fee paid to MacKay is paid by New York Life Investments, not the Fund. The Board also considered the reasonableness of the subadvisory fee paid by New York Life Investments and the amount of the management fee retained by New York Life Investments.
In assessing the reasonableness of the Fund’s fees and expenses, the Board primarily considered comparative data provided by Strategic Insight on the fees and expenses charged by similar mutual funds managed by other investment advisers. In addition, the Board considered information provided by New York Life Investments and MacKay on fees charged to other investment advisory clients, including institutional separate accounts and/or other funds that follow investment strategies similar to those of the Fund, if any. The Board considered the similarities and differences in the contractual management fee schedules of the Fund and these similarly-managed accounts and/or funds, taking into account the rationale for any differences in fee schedules. The Board also took into account explanations provided by New York Life Investments about the more extensive scope of services provided to registered investment companies, such as the Fund, as compared with other investment advisory clients. Additionally, the Board considered the impact of contractual breakpoints, voluntary waivers and expense limitation arrangements on the Fund’s net management fee and expenses. The Board also considered that in proposing fees for the Fund, New York Life Investments considers the competitive marketplace for mutual funds. The Board noted that New York Life Investments proposed, and the Board had approved, the elimination of the management fee waiver for the Fund and a reduction in the management fee for the Fund, effective February 28, 2021. The Board also noted that New York Life Investments proposed, and the Board had approved, an additional management fee breakpoint for the Fund, effective February 28, 2021.
The Board noted that, outside of the Fund’s management fee and the fees charged under a share class’s Rule 12b-1 and/or shareholder services plans, a share class’s most significant “other expenses” are transfer agent fees. Transfer agent fees are charged to the Fund based on the number of shareholder accounts (a “per-account” fee). The Board took into account information from New York Life Investments regarding the reasonableness of the Fund’s transfer agent fee schedule, including industry data demonstrating that the per-account fees that NYLIM Service Company LLC, an affiliate of New York Life Investments and the Fund’s transfer agent, charges the Fund are within the range of per-account fees charged by transfer agents to other mutual funds. In addition, the Board considered NYLIM Service Company LLC’s profitability in connection with the transfer agent services it provides to the Fund. The Board also took
into account information received from NYLIM Service Company LLC regarding the sub-transfer agency payments it made to intermediaries in connection with the provision of sub-transfer agency services to the Fund.
The Board considered that, because the Fund’s transfer agent fees are billed on a per-account basis, the impact of transfer agent fees on a share class’s expense ratio may be more significant in cases where the share class has a high number of small accounts. The Board considered the extent to which transfer agent fees comprised total expenses of the Fund. The Board acknowledged the role that the MainStay Group of Funds historically has played in serving the investment needs of New York Life Insurance Company customers, who often maintain smaller account balances than other shareholders of funds, and the impact of small accounts on the expense ratios of Fund share classes. The Board also recognized measures that it and New York Life Investments have taken to mitigate the effect of small accounts on the expense ratios of Fund share classes, including through the imposition of an expense limitation on net transfer agency expenses. The Board noted that, for purposes of allocating transfer agency fees and expenses, each retail fund in the MainStay Group of Funds combines the shareholder accounts of its Class A, A2, I, R1, R2 and R3 shares (as applicable) into one group and the shareholder accounts of its Investor Class, SIMPLE Class and Class B, C and C2 shares (as applicable) into another group. The Board also noted that the per-account fees attributable to each group of share classes is then allocated among the constituent share classes based on relative net assets and that a MainStay Fund’s Class R6 shares, if any, are not combined with any other share class for this purpose. The Board considered New York Life Investments’ rationale with respect to these groupings and previously received a report from an independent consultant engaged to conduct comparative analysis of these groupings. The Board also considered that NYLIM Service Company LLC had waived its contractual cost of living adjustments during the past seven years.
Based on the factors outlined above, the Board concluded that the Fund’s management fee and total ordinary operating expenses were within a range that is competitive and support a conclusion that these fees and expenses are reasonable.
Economies of Scale
The Board considered information regarding economies of scale, including whether the Fund’s expense structure permits economies of scale to be appropriately shared with the Fund’s shareholders. The Board also considered a report from New York Life Investments, previously prepared at the request of the Board, that addressed economies of scale, including with respect to the mutual fund business generally and the various ways in which the benefits of economies of scale may be shared with the funds in the MainStay Group of Funds. Although the Board recognized the difficulty of determining economies of scale with precision, the Board acknowledged that economies of scale may be shared with the Fund in a number of ways, including, for example, through the imposition of management fee breakpoints, initially setting management fee rates at scale or making additional investments to enhance services. The Board
| 48 | MainStay MacKay New York Tax Free Opportunities Fund |
reviewed information from New York Life Investments showing how the Fund’s management fee schedule compared to fee schedules of other funds and accounts managed by New York Life Investments. The Board also reviewed information from Strategic Insight showing how the Fund’s management fee schedule compared with fees paid for similar services by peer funds at varying asset levels.
Based on this information, the Board concluded that economies of scale are appropriately reflected for the benefit of the Fund’s shareholders through the Fund’s expense structure and other methods to share benefits from economies of scale.
Conclusion
On the basis of the information and factors summarized above, among other information and factors deemed relevant by the Trustees, and the evaluation thereof, the Board, including the Independent Trustees voting separately, unanimously voted to approve the continuation of each of the Advisory Agreements.
Discussion of the Operation and Effectiveness of the Fund's Liquidity Risk Management Program (Unaudited)
In compliance with Rule 22e-4 under the Investment Company Act of 1940, as amended (the “Liquidity Rule”), the Fund has adopted and implemented a liquidity risk management program (the “Program”), which New York Life Investment Management LLC believes is reasonably designed to assess and manage the Fund's liquidity risk (the risk that the Fund could not meet requests to redeem shares issued by the Fund without significant dilution of remaining investors’ interests in the Fund). The Board of Trustees of MainStay Funds Trust (the "Board") designated New York Life Investment Management LLC as administrator of the Program (the “Administrator”). The Administrator has established a Liquidity Risk Management Committee to assist the Administrator in the implementation and day-to-day administration of the Program and to otherwise support the Administrator in fulfilling its responsibilities under the Program.
At a meeting of the Board held on March 8, 2021, the Administrator provided the Board with a written report addressing the Program’s operation and assessing its adequacy and effectiveness of implementation for the period from January 1, 2020 through December 31, 2020 (the "Review Period"), as required under the Liquidity Rule. The report noted that the Administrator concluded that (i) the Program operated effectively to assess and manage the Fund's liquidity risk, (ii) the Program has been adequately and effectively implemented to monitor and, as applicable, respond to the Fund's liquidity developments and (iii) the Fund's investment strategy continues to be appropriate for an open-end fund. In addition, the report discussed notable events that impacted liquidity risk during the Review Period, including the COVID-19 pandemic and the resulting economic shutdown.
In accordance with the Program, the Fund's liquidity risk is assessed no less frequently than annually taking into consideration certain factors, as applicable, such as (i) investment strategy and liquidity of portfolio investments, (ii) short-term and long-term cash flow projections and (iii) holdings of cash and cash equivalents, as well as borrowing arrangements and other funding sources. Certain factors are considered under both normal and reasonably foreseeable stressed conditions.
Each Fund portfolio investment is classified into one of four liquidity categories. The classification is based on a determination of the number of days it is reasonably expected to take to convert the investment into cash, or sell or dispose of the investment, in current market conditions without significantly changing the market value of the investment. The Administrator has delegated liquidity classification determinations to the Fund’s subadvisor, subject to appropriate oversight by the Administrator, and classification determinations are made by taking into account the Fund's reasonably anticipated trade size, various market, trading and investment-specific considerations, as well as market depth, and, in certain cases, third-party vendor data.
The Liquidity Rule requires funds that do not primarily hold assets that are highly liquid investments to adopt a minimum amount of net assets that must be invested in highly liquid investments that are assets (an “HLIM”). In addition, the Liquidity Rule limits a fund's investments in illiquid investments. Specifically, the Liquidity Rule prohibits acquisition of illiquid investments if doing so would result in a fund holding more than 15% of its net assets in illiquid investments that are assets. The Program includes provisions reasonably designed to determine, periodically review and comply with the HLIM requirement, as applicable, and to comply with the 15% limit on illiquid investments.
There can be no assurance that the Program will achieve its objectives under all circumstances in the future. Please refer to the Fund's prospectus for more information regarding the Fund's exposure to liquidity risk and other risks to which it may be subject.
| 50 | MainStay MacKay New York Tax Free Opportunities Fund |
Proxy Voting Record
The Fund is required to file with the Securities and Exchange Commissions's ("SEC") its proxy voting records for the 12-month period ending June 30 on Form N-PX. The most recent Form N-PX or proxy voting record is available free of charge upon request by calling 800-624-6782; visiting the MainStay Funds’ website at newyorklifeinvestments.com; or visiting the SEC’s website at www.sec.gov.
Shareholder Reports and Quarterly Portfolio Disclosure
The Fund is required to file its complete schedule of portfolio holdings with the SEC 60 days after its first and third fiscal quarter on Form N-PORT. The Fund's holdings report is available free of charge upon request by calling New York Life Investments at 800-624-6782.
This page intentionally left blank.
This page intentionally left blank.
This page intentionally left blank.
Equity
U.S. Equity
MainStay Epoch U.S. Equity Yield Fund
MainStay MacKay S&P 500 Index Fund
MainStay Winslow Large Cap Growth Fund
MainStay WMC Enduring Capital Fund
MainStay WMC Growth Fund
MainStay WMC Small Companies Fund
MainStay WMC Value Fund
International Equity
MainStay Epoch International Choice Fund
MainStay MacKay International Equity Fund
MainStay WMC International Research Equity Fund
Emerging Markets Equity
MainStay Candriam Emerging Markets Equity Fund
Global Equity
MainStay Epoch Capital Growth Fund
MainStay Epoch Global Equity Yield Fund
Fixed Income
Taxable Income
MainStay Candriam Emerging Markets Debt Fund
MainStay Floating Rate Fund
MainStay MacKay High Yield Corporate Bond Fund
MainStay MacKay Short Duration High Yield Fund
MainStay MacKay Strategic Bond Fund
MainStay MacKay Total Return Bond Fund
MainStay MacKay U.S. Infrastructure Bond Fund
MainStay Short Term Bond Fund
Tax-Exempt Income
MainStay MacKay California Tax Free Opportunities Fund1
MainStay MacKay High Yield Municipal Bond Fund
MainStay MacKay Intermediate Tax Free Bond Fund
MainStay MacKay New York Tax Free Opportunities Fund2
MainStay MacKay Short Term Municipal Fund
MainStay MacKay Tax Free Bond Fund
Money Market
MainStay Money Market Fund
Mixed Asset
MainStay Balanced Fund
MainStay Income Builder Fund
MainStay MacKay Convertible Fund
Speciality
MainStay CBRE Global Infrastructure Fund
MainStay CBRE Real Estate Fund
MainStay Cushing MLP Premier Fund
Asset Allocation
MainStay Conservative Allocation Fund
MainStay Conservative ETF Allocation Fund
MainStay Defensive ETF Allocation Fund
MainStay Equity Allocation Fund
MainStay Equity ETF Allocation Fund
MainStay Growth Allocation Fund
MainStay Growth ETF Allocation Fund
MainStay Moderate Allocation Fund
MainStay Moderate ETF Allocation Fund
Manager
New York Life Investment Management LLC
New York, New York
Subadvisors
Candriam Belgium S.A.3
Brussels, Belgium
Candriam Luxembourg S.C.A.3
Strassen, Luxembourg
CBRE Clarion Securities LLC
Radnor, Pennsylvania
Cushing Asset Management, LP
Dallas, Texas
Epoch Investment Partners, Inc.
New York, New York
MacKay Shields LLC3
New York, New York
NYL Investors LLC3
New York, New York
Wellington Management Company LLP
Boston, Massachusetts
Winslow Capital Management, LLC
Minneapolis, Minnesota
Legal Counsel
Dechert LLP
Washington, District of Columbia
Independent Registered Public Accounting Firm
KPMG LLP
Philadelphia, Pennsylvania
Distributor
NYLIFE Distributors LLC3
Jersey City, New Jersey
Custodian
JPMorgan Chase Bank, N.A.
New York, New York
1.
This Fund is registered for sale in AZ, CA, NV, OR, TX, UT, WA and MI (Class A and I shares only), and CO, FL, GA, HI, ID, MA, MD, NH, NJ and NY (Class I shares only).
| 2. | This Fund is registered for sale in CA, CT, DE, FL, MA, NJ, NY and VT. |
| 3. | An affiliate of New York Life Investment Management LLC. |
Not part of the Semiannual Report
For more information
800-624-6782
newyorklifeinvestments.com
“New York Life Investments” is both a service mark, and the common trade name, of certain investment advisors affiliated with New York Life Insurance Company. The MainStay Funds® are managed by New York Life Investment Management LLC and distributed by NYLIFE Distributors LLC, 30 Hudson Street, Jersey City, NJ 07302, a wholly owned subsidiary of New York Life Insurance Company. NYLIFE Distributors LLC is a Member FINRA/SIPC.
©2021 NYLIFE Distributors LLC. All rights reserved.
| 1738064MS071-21 | MSNTF10-06/21 |
(NYLIM) NL222
MainStay MacKay S&P 500 Index Fund
Message from the President and Semiannual Report
Unaudited | April 30, 2021
Sign up for e-delivery of your shareholder reports. For full details on e-delivery, including who can participate and what you can receive via e-delivery,
please log in to newyorklifeinvestments.com/accounts.
| Not FDIC/NCUA Insured | Not a Deposit | May Lose Value | No Bank Guarantee | Not Insured by Any Government Agency |
This page intentionally left blank
Message from the President
With the approval of COVID-19 vaccines and the passage of relief packages by the U.S. Congress, economic prospects improved during the reporting period, and investor risk appetite increased, benefiting both equities and fixed-income markets. Despite some volatility stemming from a sell-off in longer-dated Treasury securities, the stock market and higher-risk segments of the fixed-income market posted gains for the six months ended April 30, 2021.
By the beginning of the reporting period, the economy had made tremendous progress from the second quarter of 2020, when economic activity plunged. But uncertainty about when vaccines would be available and how quickly they could be administered left investors unsure about the economic outlook.
With the approval of several vaccines in November, the outlook brightened and investors became less risk-averse. Anticipating the likely end of the pandemic and a continuation of the economic recovery, they began to see opportunities in investment-grade and high-yield bonds and more cyclical segments of the stock market. The $900 billion relief and stimulus package passed in December provided further assurance.
In January, the Federal Reserve opted to leave interest rates unchanged, pointing to some uncertainty about the pace of the global recovery. Officials also noted that inflation remained low, citing oil prices in particular.
In March, President Biden signed the $1.9 billion American Rescue Plan, which, among other provisions, called for payments of $1,400 for those earning less than $75,000 per year, plus $1,400 per dependent. This, combined with the Federal Reserve’s new tolerance for inflation and an anticipated $2 trillion infrastructure spending bill, added to growing concerns about higher prices. Supply shortages in some markets caused some prices to soar, heightening concerns further.
In fixed-income markets, an improving economic outlook and rising inflation expectations led to a sell-off in longer-term Treasuries, with the result that the yield on the 10-year note rose sharply, particularly in February and March. Investment grade corporate bonds were also affected. Early in the reporting period, they performed well as investors shifted out of Treasuries, but as the reporting period progressed, they faltered. Longer-dated securities issued in recent years at historically low interest rates became especially unattractive.
High-yield bonds remained steady, supported by more favorable yields and an improved economic outlook, which reduced their perceived risk. Municipal bonds produced modest gains, and
although the sell-off in Treasuries produced some volatility early in 2021, stronger-than-expected tax revenues, $350 billion in financial support from the federal government, and the possibility of an increase in federal income tax rates appeared to buoy the market late in the reporting period.
Inflation concerns and volatility in the Treasury market led to a shift in equities markets. Although the S&P 500® Index, a widely followed measure of U.S. equities, posted double-digit gains and hit a record high, the rise of Treasury yields disrupted valuations, especially those of growth stocks. Technology companies that saw their valuations soar amid the work-from-home trend in 2020 suffered large declines.
But the fiscal stimulus and continued accommodation from the Federal Reserve gave investors confidence the economic recovery would continue. Combined with the sky-high valuations in technology and growth stocks, this increased the appeal of more cyclical and value-oriented shares. As a result, value stocks outperformed growth stocks during the reporting period.
Reflecting the shift in investor sentiment, the performance of S&P 500® Index sectors varied widely. While the information technology sector kept up with the broader market, it lagged cyclical sectors such as energy and financials, which led the way. The shift was further reflected in the performance of small-cap stocks, which outperformed large caps. While developed markets kept pace with the U.S. market, lagging economic and pandemic recoveries appeared to weigh on emerging markets late in the reporting period.
With the lockdown restrictions lifting in the U.S. and the pandemic easing in many regions, we at New York Life Investments are looking forward to a return to a more normal economy. We anticipate that over the next several years, a variety of trends will likely offer long-term investors many attractive opportunities. With this in mind, we continue to develop products and services to help you to take advantage of these trends, manage your risks, and ultimately meet your investment goals.
Sincerely,
Kirk C. Lehneis
President
The opinions expressed are as of the date of this report and are subject to change. There is no guarantee that any forecast made will come to pass. This material does not constitute investment advice and is not intended as an endorsement of any specific investment. Past performance is no guarantee of future results.
Not part of the Semiannual Report
Investors should refer to the Fund’s Summary Prospectus and/or Prospectus and consider the Fund’s investment objectives, strategies, risks, charges and expenses carefully before investing. The Summary Prospectus and/or Prospectus contain this and other information about the Fund. You may obtain copies of the Fund’s Summary Prospectus, Prospectus and Statement of Additional Information free of charge, upon request, by calling toll-free 800-624-6782, by writing to NYLIFE Distributors LLC, Attn: MainStay Marketing Department, 30 Hudson Street, Jersey City, NJ 07302 or by sending an e-mail to MainStayShareholderServices@nylim.com. These documents are also available via the MainStay Funds’ website at newyorklifeinvestments.com. Please read the Fund’s Summary Prospectus and/or Prospectus carefully before investing.
Investment and Performance Comparison (Unaudited)
Performance data quoted represents past performance. Past performance is no guarantee of future results. Because of market volatility and other factors, current performance may be lower or higher than the figures shown. Investment return and principal value will fluctuate, and as a result, when shares are redeemed, they may be worth more or less than their original cost. The graph below depicts the historical performance of Class I shares of the Fund. Performance will vary from class to class based on differences in class-specific expenses and sales charges. For performance information current to the most recent month-end, please call 800-624-6782 or visit newyorklifeinvestments.com.
The performance table and graph do not reflect the deduction of taxes that a shareholder would pay on distributions or Fund share redemptions. Total returns reflect maximum applicable sales charges as indicated in the table below, if any, changes in share price, and reinvestment of dividend and capital gain distributions. The graph assumes the initial investment amount shown below and reflects the deduction of all sales charges that would have applied for the period of investment. Performance figures may reflect certain fee waivers and/or expense limitations, without which total returns may have been lower. For more information on share classes and current fee waivers and/or expense limitations (if any), please refer to the Notes to Financial Statements.

| Average Annual Total Returns for the Period-Ended April 30, 2021 |
| Class | Sales Charge | | Inception
Date | Six
Months | One Year
or Since
Inception | Five
Years | Ten
Years | Gross
Expense
Ratio1 |
| Class A Shares2 | Maximum 1.5% Initial Sales Charge | With sales charges | 1/2/2004 | 26.58% | 43.03% | 16.11% | 13.20% | 0.54% |
| | | Excluding sales charges | | 28.51 | 45.21 | 16.82 | 13.55 | 0.54 |
| Investor Class Shares2, 3 | Maximum 1% Initial Sales Charge | With sales charges | 2/28/2008 | 27.09 | 42.76 | 15.93 | 13.06 | 0.88 |
| | | Excluding sales charges | | 28.38 | 44.94 | 16.64 | 13.41 | 0.88 |
| Class I Shares | No Sales Charge | | 1/2/1991 | 28.67 | 45.58 | 17.10 | 13.83 | 0.29 |
| SIMPLE Class Shares | No Sales Charge | | 8/31/2020 | 28.24 | 19.89 | N/A | N/A | 1.13 |
| 1. | The gross expense ratios presented reflect the Fund’s “Total Annual Fund Operating Expenses” from the most recent Prospectus, as supplemented, and may differ from other expense ratios disclosed in this report. |
| 2. | Prior to March 19, 2020, the maximum initial sales charge for Class A Shares and Investor Class Shares was 3%, which is reflected in the average annual total return figures shown. |
| 3. | Prior to June 30, 2020, the maximum initial sales charge for Investor Class shares was 1.5%, which is reflected in the average annual total return figures shown. |
The footnotes on the next page are an integral part of the table and graph and should be carefully read in conjunction with them.
| Benchmark Performance | Six
Months | One
Year | Five
Years | Ten
Years |
| S&P 500® Index1 | 28.85% | 45.98% | 17.42% | 14.17% |
| Morningstar Large Blend Category Average2 | 28.98 | 45.28 | 15.35 | 11.88 |
| 1. | The S&P 500® Index is the Fund’s primary broad-based securities market index for comparison purposes. Information Regarding Standard & Poor's® "Standard & Poor's®," "S&P®," "S&P 500®," "Standard & Poor's 500," and "500" are trademarks of The McGraw-Hill Companies, Inc. The MainStay MacKay S&P 500 Index Fund is not sponsored, endorsed, sold or promoted by Standard & Poor's, and Standard & Poor's makes no representation regarding the advisability of investing in the Fund. Results assume reinvestment of all dividends and capital gains. An investment cannot be made directly in an index. |
| 2. | The Morningstar Large Blend Category Average is representative of funds that represent the overall U.S. stock market in size, growth rates and price. Stocks in the top 70% of the capitalization of the U.S. equity market are defined as large cap. The blend style is assigned to portfolios where neither growth nor value characteristics predominate. These portfolios tend to invest across the spectrum of U.S. industries, and owing to their broad exposure, the portfolios’ returns are often similar to those of the S&P 500® Index. Results are based on average total returns of similar funds with all dividends and capital gain distributions reinvested. |
The footnotes on the preceding page are an integral part of the table and graph and should be carefully read in conjunction with them.
| 6 | MainStay MacKay S&P 500 Index Fund |
Cost in Dollars of a $1,000 Investment in MainStay MacKay S&P 500 Index Fund (Unaudited)
The example below is intended to describe the fees and expenses borne by shareholders during the six-month period from November 1, 2020, to April 30, 2021, and the impact of those costs on your investment.
Example
As a shareholder of the Fund you incur two types of costs: (1) transaction costs, including exchange fees and sales charges (loads) on purchases (as applicable), and (2) ongoing costs, including management fees, distribution and/or service (12b-1) fees, and other Fund expenses (as applicable). This example is intended to help you understand your ongoing costs (in dollars) of investing in the Fund and to compare these costs with the ongoing costs of investing in other mutual funds. The example is based on an investment of $1,000 made at the beginning of the six-month period and held for the entire period from November 1, 2020, to April 30, 2021.
This example illustrates your Fund’s ongoing costs in two ways:
Actual Expenses
The second and third data columns in the table below provide information about actual account values and actual expenses. You may use the information in these columns, together with the amount you invested, to estimate the expenses that you paid during the six months ended April 30, 2021. Simply divide your account value by $1,000 (for example, an
$8,600 account value divided by $1,000 = 8.6), then multiply the result by the number under the heading entitled “Expenses Paid During Period” to estimate the expenses you paid on your account during this period.
Hypothetical Example for Comparison Purposes
The fourth and fifth data columns in the table below provide information about hypothetical account values and hypothetical expenses based on the Fund’s actual expense ratio and an assumed rate of return of 5% per year before expenses, which is not the Fund’s actual return. The hypothetical account values and expenses may not be used to estimate the actual ending account balances or expenses you paid for the six-month period shown. You may use this information to compare the ongoing costs of investing in the Fund with the ongoing costs of investing in other mutual funds. To do so, compare this 5% hypothetical example with the 5% hypothetical examples that appear in the shareholder reports of the other mutual funds.
Please note that the expenses shown in the table are meant to highlight your ongoing costs only and do not reflect any transactional costs, such as exchange fees or sales charges (loads). Therefore, the fourth and fifth data columns of the table are useful in comparing ongoing costs only and will not help you determine the relative total costs of owning different funds. In addition, if these transactional costs were included, your costs would have been higher.
| Share Class | Beginning
Account
Value
11/1/20 | Ending Account
Value (Based
on Actual
Returns and
Expenses)
4/30/21 | Expenses
Paid
During
Period1 | Ending Account
Value (Based
on Hypothetical
5% Annualized
Return and
Actual Expenses)
4/30/21 | Expenses
Paid
During
Period1 | Net Expense
Ratio
During
Period2 |
| Class A Shares | $1,000.00 | $1,285.10 | $2.89 | $1,022.27 | $2.56 | 0.51% |
| Investor Class Shares | $1,000.00 | $1,283.80 | $3.96 | $1,021.32 | $3.51 | 0.70% |
| Class I Shares | $1,000.00 | $1,286.70 | $1.47 | $1,023.51 | $1.30 | 0.26% |
| SIMPLE Class Shares | $1,000.00 | $1,282.40 | $5.38 | $1,020.08 | $4.76 | 0.95% |
| 1. | Expenses are equal to the Fund’s annualized expense ratio of each class multiplied by the average account value over the period, divided by 365 and multiplied by 181 (to reflect the six-month period). The table above represents the actual expenses incurred during the six-month period. In addition to the fees and expenses which the Fund bears directly, it also indirectly bears a pro rata share of the fees and expenses of the underlying funds in which it invests. Such indirect expenses are not included in the above-reported expense figures. |
| 2. | Expenses are equal to the Fund's annualized expense ratio to reflect the six-month period. |
Industry Composition as of April 30, 2021 (Unaudited)
| Software | 8.2% |
| Interactive Media & Services | 6.1 |
| Technology Hardware, Storage & Peripherals | 6.0 |
| Semiconductors & Semiconductor Equipment | 5.2 |
| IT Services | 5.1 |
| Banks | 4.3 |
| Internet & Direct Marketing Retail | 4.3 |
| Health Care Equipment & Supplies | 3.6 |
| Pharmaceuticals | 3.4 |
| Capital Markets | 2.9 |
| Health Care Providers & Services | 2.6 |
| Oil, Gas & Consumable Fuels | 2.4 |
| Equity Real Estate Investment Trusts | 2.4 |
| Specialty Retail | 2.3 |
| Hotels, Restaurants & Leisure | 2.1 |
| Entertainment | 2.0 |
| Insurance | 1.9 |
| Automobiles | 1.8 |
| Chemicals | 1.8 |
| Machinery | 1.7 |
| Biotechnology | 1.7 |
| Electric Utilities | 1.6 |
| Aerospace & Defense | 1.6 |
| Diversified Financial Services | 1.4 |
| Beverages | 1.4 |
| Household Products | 1.3 |
| Diversified Telecommunication Services | 1.3 |
| Food & Staples Retailing | 1.3 |
| Media | 1.3 |
| Industrial Conglomerates | 1.2 |
| Life Sciences Tools & Services | 1.1 |
| Road & Rail | 1.0 |
| Food Products | 0.9 |
| Multi–Utilities | 0.8 |
| Communications Equipment | 0.8% |
| Air Freight & Logistics | 0.7 |
| Textiles, Apparel & Luxury Goods | 0.7 |
| Tobacco | 0.7 |
| Electronic Equipment, Instruments & Components | 0.6 |
| Consumer Finance | 0.6 |
| Electrical Equipment | 0.5 |
| Multiline Retail | 0.5 |
| Building Products | 0.5 |
| Household Durables | 0.4 |
| Professional Services | 0.4 |
| Commercial Services & Supplies | 0.4 |
| Metals & Mining | 0.4 |
| Containers & Packaging | 0.3 |
| Airlines | 0.3 |
| Wireless Telecommunication Services | 0.2 |
| Energy Equipment & Services | 0.2 |
| Trading Companies & Distributors | 0.2 |
| Personal Products | 0.2 |
| Auto Components | 0.1 |
| Distributors | 0.1 |
| Construction Materials | 0.1 |
| Real Estate Management & Development | 0.1 |
| Water Utilities | 0.1 |
| Health Care Technology | 0.1 |
| Independent Power and Renewable Electricity Producers | 0.1 |
| Construction & Engineering | 0.0‡ |
| Gas Utilities | 0.0‡ |
| Leisure Products | 0.0‡ |
| Short–Term Investments | 2.7 |
| Other Assets, Less Liabilities | 0.0‡ |
| | 100.0% |
‡ Less than one-tenth of a percent.
See Portfolio of Investments beginning on page 10 for specific holdings within these categories. The Fund's holdings are subject to change.
Top Ten Holdings as of April 30, 2021 (excluding short-term investments) (Unaudited)
| 1. | Apple, Inc. |
| 2. | Microsoft Corp. |
| 3. | Amazon.com, Inc. |
| 4. | Alphabet, Inc. |
| 5. | Facebook, Inc., Class A |
| 6. | Tesla, Inc. |
| 7. | Berkshire Hathaway, Inc., Class B |
| 8. | JPMorgan Chase & Co. |
| 9. | Johnson & Johnson |
| 10. | Visa, Inc., Class A |
| 8 | MainStay MacKay S&P 500 Index Fund |
Portfolio Management Discussion and Analysis (Unaudited)
Questions answered by portfolio managers Francis J. Ok and Lee Baker1 of MacKay Shields LLC, the Fund’s Subadvisor.
How did MainStay MacKay S&P 500 Index Fund perform relative to its benchmark and peer group during the six months ended April 30, 2021?
For the six months ended April 30, 2021, Class I shares of MainStay MacKay S&P 500 Index Fund returned 28.67%, underperforming the 28.85% return of the Fund’s primary benchmark, the S&P 500® Index. Over the same period, Class I shares underperformed the 28.98% return of the Morningstar Large Blend Category Average.2
What factors affected the Fund’s relative performance during the reporting period?
Although the Fund seeks investment results that correspond to the total return performance of common stocks in the aggregate, as represented by the S&P 500® Index (the “Index”), the Fund’s relative performance will typically lag that of the Index, as it did during the reporting period, because the Fund incurs operating expenses that the Index does not.
During the reporting period, how was the Fund’s performance materially affected by investments in derivatives?
The Fund invests in futures contracts to provide an efficient means of maintaining liquidity while remaining fully invested in the market.
During the reporting period, which S&P 500® Index industries had the highest total returns and which industries had the lowest total returns?
The strongest performing S&P 500® Index industry groups during the reporting period in terms of total returns included consumer finance; oil, gas & consumable fuels; and real estate management & development. During the same period, the industry groups with the lowest total returns included household products, water utilities and multi-utilities.
During the reporting period, which S&P 500® Index industries made the strongest positive contributions to the Fund’s absolute performance and which industries made the weakest contributions?
The industry groups that made the strongest positive contributions to the Fund’s absolute performance during the reporting period were banks, interactive media & services, and software. (Contributions take weightings and total returns into account.) During the same period, the industry groups that made the weakest contributions to the Fund’s absolute performance included household products, water utilities and gas utilities.
During the reporting period, which individual stocks in the S&P 500® Index had the highest total returns and which stocks had the lowest total returns?
The S&P 500® Index stocks producing the highest total returns during the reporting period included Diamondback Energy, Marathon Oil and Occidental Petroleum. Conversely, the S&P 500® Index stocks with the lowest total returns over the same period were Regeneron Pharmaceuticals, Clorox and MarketAxess Holdings.
During the reporting period, which S&P 500® Index stocks made the strongest positive contributions to the Fund’s absolute performance and which stocks made the weakest contributions?
The strongest positive contributors to the Fund’s absolute performance during the reporting period were Microsoft, Apple and Alphabet. During the same period, the S&P 500® Index stocks that made the weakest contributions to the Fund’s absolute performance were Regeneron Pharmaceuticals, Procter & Gamble, and Clorox.
Were there any changes in the S&P 500® Index during the reporting period?
During the reporting period, there were nine additions and nine deletions in the S&P 500® Index.
| 1. | Lee Baker will serve as a portfolio manager for the Fund until June 2021. |
| 2. | See page 5 for other share class returns, which may be higher or lower than Class I share returns. See page 6 for more information on benchmark and peer group returns. |
The opinions expressed are those of the portfolio managers as of the date of this report and are subject to change. There is no guarantee that any forecasts will come to pass. This material does not constitute investment advice and is not intended as an endorsement of any specific investment.
Portfolio of Investments April 30, 2021† (Unaudited)
| | Shares | Value |
| Common Stocks 97.3% |
| Aerospace & Defense 1.6% |
| Boeing Co. (The) (a) | 21,115 | $ 4,947,456 |
| General Dynamics Corp. | 8,924 | 1,697,612 |
| Howmet Aerospace, Inc. (a) | 15,020 | 480,039 |
| Huntington Ingalls Industries, Inc. | 1,549 | 328,884 |
| L3Harris Technologies, Inc. | 7,912 | 1,655,428 |
| Lockheed Martin Corp. | 9,487 | 3,610,373 |
| Northrop Grumman Corp. | 5,967 | 2,114,943 |
| Raytheon Technologies Corp. | 58,478 | 4,867,709 |
| Teledyne Technologies, Inc. (a) | 1,425 | 638,044 |
| Textron, Inc. | 8,733 | 561,008 |
| TransDigm Group, Inc. (a) | 2,105 | 1,291,923 |
| | | 22,193,419 |
| Air Freight & Logistics 0.7% |
| CH Robinson Worldwide, Inc. | 5,151 | 500,059 |
| Expeditors International of Washington, Inc. | 6,518 | 716,068 |
| FedEx Corp. | 9,385 | 2,724,559 |
| United Parcel Service, Inc., Class B | 27,690 | 5,644,883 |
| | | 9,585,569 |
| Airlines 0.3% |
| Alaska Air Group, Inc. | 4,780 | 330,489 |
| American Airlines Group, Inc. (a)(b) | 24,618 | 534,703 |
| Delta Air Lines, Inc. (a) | 24,560 | 1,152,355 |
| Southwest Airlines Co. (a) | 22,732 | 1,427,115 |
| United Airlines Holdings, Inc. (a) | 12,257 | 666,781 |
| | | 4,111,443 |
| Auto Components 0.1% |
| Aptiv plc (a) | 10,392 | 1,495,305 |
| BorgWarner, Inc. | 9,200 | 446,936 |
| | | 1,942,241 |
| Automobiles 1.8% |
| Ford Motor Co. (a) | 150,397 | 1,735,582 |
| General Motors Co. (a) | 48,800 | 2,792,336 |
| Tesla, Inc. (a) | 29,553 | 20,966,080 |
| | | 25,493,998 |
| Banks 4.3% |
| Bank of America Corp. | 292,385 | 11,850,364 |
| Citigroup, Inc. | 80,332 | 5,722,852 |
| Citizens Financial Group, Inc. | 16,361 | 757,187 |
| Comerica, Inc. | 5,355 | 402,482 |
| Fifth Third Bancorp | 27,365 | 1,109,377 |
| First Republic Bank | 6,772 | 1,240,901 |
| Huntington Bancshares, Inc. | 39,149 | 599,763 |
| | Shares | Value |
| |
| Banks (continued) |
| JPMorgan Chase & Co. | 117,439 | $ 18,063,293 |
| KeyCorp | 37,286 | 811,343 |
| M&T Bank Corp. | 4,950 | 780,565 |
| People's United Financial, Inc. | 16,377 | 296,915 |
| PNC Financial Services Group, Inc. (The) | 16,319 | 3,050,837 |
| Regions Financial Corp. | 36,972 | 805,990 |
| SVB Financial Group (a) | 2,075 | 1,186,547 |
| Truist Financial Corp. | 51,848 | 3,075,105 |
| U.S. Bancorp | 52,609 | 3,122,344 |
| Wells Fargo & Co. | 159,104 | 7,167,635 |
| Zions Bancorp NA | 6,320 | 352,656 |
| | | 60,396,156 |
| Beverages 1.4% |
| Brown-Forman Corp., Class B | 7,030 | 536,248 |
| Coca-Cola Co. (The) | 149,263 | 8,057,217 |
| Constellation Brands, Inc., Class A | 6,544 | 1,572,654 |
| Molson Coors Beverage Co., Class B | 7,245 | 398,113 |
| Monster Beverage Corp. (a) | 14,229 | 1,380,925 |
| PepsiCo, Inc. | 53,095 | 7,654,175 |
| | | 19,599,332 |
| Biotechnology 1.7% |
| AbbVie, Inc. | 67,961 | 7,577,651 |
| Alexion Pharmaceuticals, Inc. (a) | 8,460 | 1,427,033 |
| Amgen, Inc. | 22,227 | 5,326,478 |
| Biogen, Inc. (a) | 5,863 | 1,567,356 |
| Gilead Sciences, Inc. | 48,362 | 3,069,536 |
| Incyte Corp. (a) | 7,191 | 613,968 |
| Regeneron Pharmaceuticals, Inc. (a) | 4,052 | 1,950,228 |
| Vertex Pharmaceuticals, Inc. (a) | 10,005 | 2,183,091 |
| | | 23,715,341 |
| Building Products 0.5% |
| Allegion plc | 3,492 | 469,255 |
| AO Smith Corp. | 5,212 | 353,113 |
| Carrier Global Corp. | 31,447 | 1,370,460 |
| Fortune Brands Home & Security, Inc. | 5,337 | 560,278 |
| Johnson Controls International plc | 27,720 | 1,728,065 |
| Masco Corp. | 9,897 | 632,221 |
| Trane Technologies plc | 9,175 | 1,594,890 |
| | | 6,708,282 |
| Capital Markets 2.9% |
| Ameriprise Financial, Inc. | 4,493 | 1,160,991 |
| Bank of New York Mellon Corp. (The) | 31,051 | 1,548,824 |
| BlackRock, Inc. | 5,463 | 4,475,836 |
| Cboe Global Markets, Inc. | 4,126 | 430,631 |
The notes to the financial statements are an integral part of, and should be read in conjunction with, the financial statements.
| 10 | MainStay MacKay S&P 500 Index Fund |
| | Shares | Value |
| Common Stocks (continued) |
| Capital Markets (continued) |
| Charles Schwab Corp. (The) | 57,595 | $ 4,054,688 |
| CME Group, Inc. | 13,816 | 2,790,694 |
| Franklin Resources, Inc. | 10,504 | 315,120 |
| Goldman Sachs Group, Inc. (The) | 13,242 | 4,614,175 |
| Intercontinental Exchange, Inc. | 21,618 | 2,544,655 |
| Invesco Ltd. | 14,488 | 391,176 |
| MarketAxess Holdings, Inc. | 1,463 | 714,617 |
| Moody's Corp. | 6,192 | 2,022,988 |
| Morgan Stanley | 57,754 | 4,767,593 |
| MSCI, Inc. | 3,178 | 1,543,777 |
| Nasdaq, Inc. | 4,440 | 717,238 |
| Northern Trust Corp. | 8,017 | 912,334 |
| Raymond James Financial, Inc. | 4,716 | 616,758 |
| S&P Global, Inc. | 9,264 | 3,616,573 |
| State Street Corp. | 13,539 | 1,136,599 |
| T. Rowe Price Group, Inc. | 8,773 | 1,572,121 |
| | | 39,947,388 |
| Chemicals 1.8% |
| Air Products and Chemicals, Inc. | 8,516 | 2,456,696 |
| Albemarle Corp. | 4,488 | 754,747 |
| Celanese Corp. | 4,394 | 688,320 |
| CF Industries Holdings, Inc. | 8,236 | 400,517 |
| Corteva, Inc. | 28,636 | 1,396,291 |
| Dow, Inc. | 28,680 | 1,792,500 |
| DuPont de Nemours, Inc. | 20,720 | 1,597,719 |
| Eastman Chemical Co. | 5,229 | 603,374 |
| Ecolab, Inc. | 9,571 | 2,145,053 |
| FMC Corp. | 4,978 | 588,599 |
| International Flavors & Fragrances, Inc. | 9,572 | 1,360,851 |
| Linde plc | 20,122 | 5,751,672 |
| LyondellBasell Industries NV, Class A | 9,902 | 1,027,233 |
| Mosaic Co. (The) | 13,277 | 467,085 |
| PPG Industries, Inc. | 9,120 | 1,561,709 |
| Sherwin-Williams Co. (The) | 9,310 | 2,549,730 |
| | | 25,142,096 |
| Commercial Services & Supplies 0.4% |
| Cintas Corp. | 3,395 | 1,171,750 |
| Copart, Inc. (a) | 8,003 | 996,454 |
| Republic Services, Inc. | 8,100 | 861,030 |
| Rollins, Inc. | 8,523 | 317,737 |
| Waste Management, Inc. | 14,983 | 2,067,205 |
| | | 5,414,176 |
| Communications Equipment 0.8% |
| Arista Networks, Inc. (a) | 2,115 | 666,584 |
| Cisco Systems, Inc. | 162,478 | 8,271,755 |
| | Shares | Value |
| |
| Communications Equipment (continued) |
| F5 Networks, Inc. (a) | 2,372 | $ 442,995 |
| Juniper Networks, Inc. | 12,630 | 320,676 |
| Motorola Solutions, Inc. | 6,506 | 1,225,080 |
| | | 10,927,090 |
| Construction & Engineering 0.0% ‡ |
| Quanta Services, Inc. | 5,325 | 514,608 |
| Construction Materials 0.1% |
| Martin Marietta Materials, Inc. | 2,397 | 846,429 |
| Vulcan Materials Co. | 5,101 | 909,202 |
| | | 1,755,631 |
| Consumer Finance 0.6% |
| American Express Co. | 25,113 | 3,851,079 |
| Capital One Financial Corp. | 17,674 | 2,634,840 |
| Discover Financial Services | 11,803 | 1,345,542 |
| Synchrony Financial | 20,903 | 914,297 |
| | | 8,745,758 |
| Containers & Packaging 0.3% |
| Amcor plc | 60,113 | 706,328 |
| Avery Dennison Corp. | 3,195 | 684,273 |
| Ball Corp. | 12,620 | 1,181,737 |
| International Paper Co. | 15,128 | 877,424 |
| Packaging Corp. of America | 3,649 | 538,775 |
| Sealed Air Corp. | 5,962 | 294,523 |
| Westrock Co. | 10,142 | 565,416 |
| | | 4,848,476 |
| Distributors 0.1% |
| Genuine Parts Co. | 5,557 | 694,458 |
| LKQ Corp. (a) | 10,739 | 501,619 |
| Pool Corp. | 1,549 | 654,483 |
| | | 1,850,560 |
| Diversified Financial Services 1.4% |
| Berkshire Hathaway, Inc., Class B (a) | 73,380 | 20,175,831 |
| Diversified Telecommunication Services 1.3% |
| AT&T, Inc. | 274,472 | 8,621,166 |
| Lumen Technologies, Inc. | 37,992 | 487,437 |
| Verizon Communications, Inc. | 159,260 | 9,203,635 |
| | | 18,312,238 |
| Electric Utilities 1.6% |
| Alliant Energy Corp. | 9,617 | 540,187 |
| American Electric Power Co., Inc. | 19,112 | 1,695,426 |
| Duke Energy Corp. | 29,583 | 2,978,712 |
The notes to the financial statements are an integral part of, and should be read in conjunction with, the financial statements.
11
Portfolio of Investments April 30, 2021† (Unaudited) (continued)
| | Shares | Value |
| Common Stocks (continued) |
| Electric Utilities (continued) |
| Edison International | 14,597 | $ 867,792 |
| Entergy Corp. | 7,715 | 843,172 |
| Evergy, Inc. | 8,734 | 558,714 |
| Eversource Energy | 13,201 | 1,138,190 |
| Exelon Corp. | 37,576 | 1,688,666 |
| FirstEnergy Corp. | 20,907 | 792,793 |
| NextEra Energy, Inc. | 75,428 | 5,846,424 |
| NRG Energy, Inc. | 9,419 | 337,389 |
| Pinnacle West Capital Corp. | 4,337 | 367,127 |
| PPL Corp. | 29,595 | 862,102 |
| Southern Co. (The) | 40,665 | 2,690,803 |
| Xcel Energy, Inc. | 20,693 | 1,475,411 |
| | | 22,682,908 |
| Electrical Equipment 0.5% |
| AMETEK, Inc. | 8,874 | 1,197,369 |
| Eaton Corp. plc | 15,321 | 2,189,830 |
| Emerson Electric Co. | 23,093 | 2,089,686 |
| Generac Holdings, Inc. (a) | 2,419 | 783,635 |
| Rockwell Automation, Inc. | 4,470 | 1,181,242 |
| | | 7,441,762 |
| Electronic Equipment, Instruments & Components 0.6% |
| Amphenol Corp., Class A | 23,059 | 1,552,793 |
| CDW Corp. | 5,426 | 967,619 |
| Corning, Inc. | 29,571 | 1,307,334 |
| FLIR Systems, Inc. | 5,051 | 302,908 |
| IPG Photonics Corp. (a) | 1,380 | 299,612 |
| Keysight Technologies, Inc. (a) | 7,162 | 1,033,835 |
| TE Connectivity Ltd. | 12,735 | 1,712,475 |
| Trimble, Inc. (a) | 9,659 | 792,038 |
| Zebra Technologies Corp., Class A (a) | 2,058 | 1,003,769 |
| | | 8,972,383 |
| Energy Equipment & Services 0.2% |
| Baker Hughes Co. | 28,054 | 563,324 |
| Halliburton Co. | 34,200 | 668,952 |
| NOV, Inc. | 14,941 | 223,368 |
| Schlumberger NV | 53,814 | 1,455,669 |
| | | 2,911,313 |
| Entertainment 2.0% |
| Activision Blizzard, Inc. | 29,816 | 2,718,921 |
| Electronic Arts, Inc. | 11,070 | 1,572,826 |
| Live Nation Entertainment, Inc. (a) | 5,523 | 452,223 |
| Netflix, Inc. (a) | 17,044 | 8,751,583 |
| Take-Two Interactive Software, Inc. (a) | 4,432 | 777,284 |
| | Shares | Value |
| |
| Entertainment (continued) |
| Walt Disney Co. (The) | 69,862 | $ 12,995,729 |
| | | 27,268,566 |
| Equity Real Estate Investment Trusts 2.4% |
| Alexandria Real Estate Equities, Inc. | 4,892 | 885,941 |
| American Tower Corp. | 17,103 | 4,357,331 |
| AvalonBay Communities, Inc. | 5,371 | 1,031,232 |
| Boston Properties, Inc. | 5,457 | 596,723 |
| Crown Castle International Corp. | 16,599 | 3,138,207 |
| Digital Realty Trust, Inc. | 10,820 | 1,669,634 |
| Duke Realty Corp. | 14,384 | 669,144 |
| Equinix, Inc. | 3,437 | 2,477,252 |
| Equity Residential | 13,195 | 979,465 |
| Essex Property Trust, Inc. | 2,501 | 726,590 |
| Extra Space Storage, Inc. | 5,082 | 755,643 |
| Federal Realty Investment Trust | 2,688 | 303,314 |
| Healthpeak Properties, Inc. | 20,732 | 711,937 |
| Host Hotels & Resorts, Inc. | 27,147 | 492,989 |
| Iron Mountain, Inc. | 11,100 | 445,332 |
| Kimco Realty Corp. | 16,643 | 349,503 |
| Mid-America Apartment Communities, Inc. | 4,402 | 692,567 |
| Prologis, Inc. | 28,460 | 3,316,444 |
| Public Storage | 5,852 | 1,645,348 |
| Realty Income Corp. | 14,371 | 993,755 |
| Regency Centers Corp. | 6,079 | 386,989 |
| SBA Communications Corp. | 4,207 | 1,260,922 |
| Simon Property Group, Inc. | 12,643 | 1,539,159 |
| UDR, Inc. | 11,423 | 530,598 |
| Ventas, Inc. | 14,419 | 799,678 |
| Vornado Realty Trust | 6,039 | 276,284 |
| Welltower, Inc. | 16,063 | 1,205,207 |
| Weyerhaeuser Co. | 28,779 | 1,115,762 |
| | | 33,352,950 |
| Food & Staples Retailing 1.3% |
| Costco Wholesale Corp. | 17,036 | 6,338,925 |
| Kroger Co. (The) | 29,301 | 1,070,659 |
| Sysco Corp. | 19,644 | 1,664,436 |
| Walgreens Boots Alliance, Inc. | 27,600 | 1,465,560 |
| Walmart, Inc. | 53,355 | 7,464,898 |
| | | 18,004,478 |
| Food Products 0.9% |
| Archer-Daniels-Midland Co. | 21,491 | 1,356,727 |
| Campbell Soup Co. | 7,812 | 373,023 |
| Conagra Brands, Inc. | 18,803 | 697,403 |
| General Mills, Inc. | 23,532 | 1,432,158 |
| Hershey Co. (The) | 5,641 | 926,816 |
The notes to the financial statements are an integral part of, and should be read in conjunction with, the financial statements.
| 12 | MainStay MacKay S&P 500 Index Fund |
| | Shares | Value |
| Common Stocks (continued) |
| Food Products (continued) |
| Hormel Foods Corp. | 10,809 | $ 499,376 |
| J M Smucker Co. (The) | 4,217 | 552,385 |
| Kellogg Co. | 9,796 | 611,466 |
| Kraft Heinz Co. (The) | 24,950 | 1,030,185 |
| Lamb Weston Holdings, Inc. | 5,632 | 453,376 |
| McCormick & Co., Inc. (Non-Voting) | 9,581 | 865,739 |
| Mondelez International, Inc., Class A | 54,346 | 3,304,780 |
| Tyson Foods, Inc., Class A | 11,346 | 878,748 |
| | | 12,982,182 |
| Gas Utilities 0.0% ‡ |
| Atmos Energy Corp. | 4,933 | 511,009 |
| Health Care Equipment & Supplies 3.6% |
| Abbott Laboratories | 68,179 | 8,186,934 |
| ABIOMED, Inc. (a) | 1,743 | 559,032 |
| Align Technology, Inc. (a) | 2,771 | 1,650,214 |
| Baxter International, Inc. | 19,439 | 1,665,728 |
| Becton Dickinson and Co. | 11,183 | 2,782,442 |
| Boston Scientific Corp. (a) | 54,541 | 2,377,988 |
| Cooper Cos., Inc. (The) | 1,892 | 777,404 |
| Danaher Corp. | 24,395 | 6,194,866 |
| Dentsply Sirona, Inc. | 8,430 | 569,109 |
| DexCom, Inc. (a) | 3,702 | 1,429,342 |
| Edwards Lifesciences Corp. (a) | 24,035 | 2,295,823 |
| Hologic, Inc. (a) | 9,916 | 649,994 |
| IDEXX Laboratories, Inc. (a) | 3,287 | 1,804,530 |
| Intuitive Surgical, Inc. (a) | 4,530 | 3,918,450 |
| Medtronic plc | 51,881 | 6,792,261 |
| ResMed, Inc. | 5,600 | 1,052,632 |
| STERIS plc | 3,284 | 692,990 |
| Stryker Corp. | 12,597 | 3,308,350 |
| Teleflex, Inc. | 1,796 | 758,774 |
| West Pharmaceutical Services, Inc. | 2,852 | 936,939 |
| Zimmer Biomet Holdings, Inc. | 7,999 | 1,417,103 |
| | | 49,820,905 |
| Health Care Providers & Services 2.6% |
| AmerisourceBergen Corp. | 5,672 | 685,178 |
| Anthem, Inc. | 9,425 | 3,575,751 |
| Cardinal Health, Inc. | 11,301 | 681,902 |
| Centene Corp. (a) | 22,384 | 1,381,988 |
| Cigna Corp. | 13,541 | 3,371,844 |
| CVS Health Corp. | 50,468 | 3,855,755 |
| DaVita, Inc. (a) | 2,779 | 323,837 |
| HCA Healthcare, Inc. | 10,204 | 2,051,616 |
| Henry Schein, Inc. (a) | 5,482 | 397,445 |
| | Shares | Value |
| |
| Health Care Providers & Services (continued) |
| Humana, Inc. | 4,959 | $ 2,207,945 |
| Laboratory Corp. of America Holdings (a) | 3,757 | 998,874 |
| McKesson Corp. | 6,119 | 1,147,680 |
| Quest Diagnostics, Inc. | 5,136 | 677,336 |
| UnitedHealth Group, Inc. | 36,381 | 14,508,743 |
| Universal Health Services, Inc., Class B | 2,998 | 444,933 |
| | | 36,310,827 |
| Health Care Technology 0.1% |
| Cerner Corp. | 11,788 | 884,689 |
| Hotels, Restaurants & Leisure 2.1% |
| Booking Holdings, Inc. (a) | 1,577 | 3,889,008 |
| Caesars Entertainment, Inc. (a) | 8,016 | 784,285 |
| Carnival Corp. (a) | 30,704 | 858,484 |
| Chipotle Mexican Grill, Inc. (a) | 1,082 | 1,614,376 |
| Darden Restaurants, Inc. | 5,016 | 735,948 |
| Domino's Pizza, Inc. | 1,493 | 630,554 |
| Expedia Group, Inc. (a) | 5,324 | 938,248 |
| Hilton Worldwide Holdings, Inc. (a) | 10,685 | 1,375,159 |
| Las Vegas Sands Corp. (a) | 12,641 | 774,388 |
| Marriott International, Inc., Class A (a) | 10,237 | 1,520,399 |
| McDonald's Corp. | 28,693 | 6,773,843 |
| MGM Resorts International | 15,807 | 643,661 |
| Norwegian Cruise Line Holdings Ltd. (a)(b) | 13,979 | 434,048 |
| Penn National Gaming, Inc. (a) | 5,722 | 509,945 |
| Royal Caribbean Cruises Ltd. | 8,425 | 732,554 |
| Starbucks Corp. | 45,310 | 5,187,542 |
| Wynn Resorts Ltd. | 4,049 | 519,892 |
| Yum! Brands, Inc. | 11,548 | 1,380,217 |
| | | 29,302,551 |
| Household Durables 0.4% |
| DR Horton, Inc. | 12,738 | 1,252,018 |
| Garmin Ltd. | 5,751 | 789,267 |
| Leggett & Platt, Inc. | 5,118 | 254,211 |
| Lennar Corp., Class A | 10,564 | 1,094,431 |
| Mohawk Industries, Inc. (a) | 2,270 | 466,485 |
| Newell Brands, Inc. | 14,544 | 392,106 |
| NVR, Inc. (a) | 133 | 667,407 |
| PulteGroup, Inc. | 10,233 | 604,975 |
| Whirlpool Corp. | 2,416 | 571,263 |
| | | 6,092,163 |
| Household Products 1.3% |
| Church & Dwight Co., Inc. | 9,432 | 808,700 |
| Clorox Co. (The) | 4,841 | 883,482 |
The notes to the financial statements are an integral part of, and should be read in conjunction with, the financial statements.
13
Portfolio of Investments April 30, 2021† (Unaudited) (continued)
| | Shares | Value |
| Common Stocks (continued) |
| Household Products (continued) |
| Colgate-Palmolive Co. | 32,657 | $ 2,635,420 |
| Kimberly-Clark Corp. | 13,008 | 1,734,226 |
| Procter & Gamble Co. (The) | 94,771 | 12,644,347 |
| | | 18,706,175 |
| Independent Power and Renewable Electricity Producers 0.1% |
| AES Corp. (The) | 25,712 | 715,308 |
| Industrial Conglomerates 1.2% |
| 3M Co. | 22,287 | 4,393,659 |
| General Electric Co. | 337,442 | 4,427,239 |
| Honeywell International, Inc. | 26,766 | 5,969,889 |
| Roper Technologies, Inc. | 4,039 | 1,803,171 |
| | | 16,593,958 |
| Insurance 1.9% |
| Aflac, Inc. | 24,645 | 1,324,176 |
| Allstate Corp. (The) | 11,656 | 1,477,981 |
| American International Group, Inc. | 33,282 | 1,612,513 |
| Aon plc, Class A | 8,698 | 2,187,025 |
| Arthur J Gallagher & Co. | 7,456 | 1,080,747 |
| Assurant, Inc. | 2,228 | 346,677 |
| Chubb Ltd. | 17,327 | 2,973,140 |
| Cincinnati Financial Corp. | 5,771 | 650,276 |
| Everest Re Group Ltd. | 1,542 | 427,057 |
| Globe Life, Inc. | 3,657 | 374,806 |
| Hartford Financial Services Group, Inc. (The) | 13,759 | 907,544 |
| Lincoln National Corp. | 6,944 | 445,319 |
| Loews Corp. | 8,736 | 487,032 |
| Marsh & McLennan Cos., Inc. | 19,559 | 2,654,156 |
| MetLife, Inc. | 28,931 | 1,840,879 |
| Principal Financial Group, Inc. | 9,758 | 623,243 |
| Progressive Corp. (The) | 22,543 | 2,270,982 |
| Prudential Financial, Inc. | 15,278 | 1,533,300 |
| Travelers Cos., Inc. (The) | 9,706 | 1,501,130 |
| Unum Group | 7,841 | 221,587 |
| W R Berkley Corp. | 5,392 | 429,850 |
| Willis Towers Watson plc | 4,964 | 1,284,981 |
| | | 26,654,401 |
| Interactive Media & Services 6.1% |
| Alphabet, Inc. (a) | | |
| Class A | 11,574 | 27,239,409 |
| Class C | 11,093 | 26,735,461 |
| |
| Facebook, Inc., Class A (a) | 92,576 | 30,094,606 |
| | Shares | Value |
| |
| Interactive Media & Services (continued) |
| |
| Twitter, Inc. (a) | 30,718 | $ 1,696,248 |
| | | 85,765,724 |
| Internet & Direct Marketing Retail 4.3% |
| Amazon.com, Inc. (a) | 16,473 | 57,118,810 |
| eBay, Inc. | 24,879 | 1,387,999 |
| Etsy, Inc. (a) | 4,850 | 964,131 |
| | | 59,470,940 |
| IT Services 5.1% |
| Accenture plc, Class A | 24,410 | 7,078,168 |
| Akamai Technologies, Inc. (a) | 6,282 | 682,853 |
| Automatic Data Processing, Inc. | 16,470 | 3,079,725 |
| Broadridge Financial Solutions, Inc. | 4,459 | 707,331 |
| Cognizant Technology Solutions Corp., Class A | 20,421 | 1,641,849 |
| DXC Technology Co. | 9,798 | 322,452 |
| Fidelity National Information Services, Inc. | 23,905 | 3,655,075 |
| Fiserv, Inc. (a) | 22,157 | 2,661,499 |
| FleetCor Technologies, Inc. (a) | 3,210 | 923,581 |
| Gartner, Inc. (a) | 3,415 | 668,930 |
| Global Payments, Inc. | 11,363 | 2,438,841 |
| International Business Machines Corp. | 34,390 | 4,879,253 |
| Jack Henry & Associates, Inc. | 2,927 | 476,604 |
| Mastercard, Inc., Class A | 33,744 | 12,892,233 |
| Paychex, Inc. | 12,353 | 1,204,294 |
| PayPal Holdings, Inc. (a) | 45,073 | 11,822,197 |
| VeriSign, Inc. (a) | 3,830 | 837,889 |
| Visa, Inc., Class A | 65,277 | 15,246,096 |
| Western Union Co. (The) | 15,815 | 407,394 |
| | | 71,626,264 |
| Leisure Products 0.0% ‡ |
| Hasbro, Inc. | 4,915 | 488,797 |
| Life Sciences Tools & Services 1.1% |
| Agilent Technologies, Inc. | 11,726 | 1,567,063 |
| Bio-Rad Laboratories, Inc., Class A (a) | 830 | 523,008 |
| Illumina, Inc. (a) | 5,615 | 2,205,796 |
| IQVIA Holdings, Inc. (a) | 7,361 | 1,727,553 |
| Mettler-Toledo International, Inc. (a) | 902 | 1,184,615 |
| PerkinElmer, Inc. | 4,313 | 559,094 |
| Thermo Fisher Scientific, Inc. | 15,156 | 7,126,806 |
| Waters Corp. (a) | 2,394 | 717,889 |
| | | 15,611,824 |
| Machinery 1.7% |
| Caterpillar, Inc. | 20,986 | 4,787,117 |
The notes to the financial statements are an integral part of, and should be read in conjunction with, the financial statements.
| 14 | MainStay MacKay S&P 500 Index Fund |
| | Shares | Value |
| Common Stocks (continued) |
| Machinery (continued) |
| Cummins, Inc. | 5,695 | $ 1,435,368 |
| Deere & Co. | 12,063 | 4,473,564 |
| Dover Corp. | 5,528 | 824,722 |
| Fortive Corp. | 13,010 | 921,368 |
| IDEX Corp. | 2,921 | 654,888 |
| Illinois Tool Works, Inc. | 11,090 | 2,555,801 |
| Ingersoll Rand, Inc. (a) | 14,344 | 708,737 |
| Otis Worldwide Corp. | 15,689 | 1,221,703 |
| PACCAR, Inc. | 13,352 | 1,200,078 |
| Parker-Hannifin Corp. | 4,968 | 1,559,008 |
| Pentair plc | 6,391 | 412,283 |
| Snap-on, Inc. | 2,085 | 495,396 |
| Stanley Black & Decker, Inc. | 6,191 | 1,280,113 |
| Westinghouse Air Brake Technologies Corp. | 6,833 | 560,784 |
| Xylem, Inc. | 6,941 | 768,022 |
| | | 23,858,952 |
| Media 1.3% |
| Charter Communications, Inc., Class A (a) | 5,444 | 3,666,262 |
| Comcast Corp., Class A | 175,927 | 9,878,301 |
| Discovery, Inc. (a) | | |
| Class A (b) | 6,254 | 235,526 |
| Class C | 11,149 | 360,224 |
| |
| DISH Network Corp., Class A (a) | 9,524 | 426,580 |
| Fox Corp. | | |
| Class A | 12,867 | 481,483 |
| Class B | 5,915 | 215,188 |
| |
| Interpublic Group of Cos., Inc. (The) | 15,036 | 477,393 |
| News Corp. | | |
| Class A | 15,052 | 394,287 |
| Class B | 4,687 | 113,941 |
| |
| Omnicom Group, Inc. | 8,276 | 680,784 |
| ViacomCBS, Inc. | 22,521 | 923,811 |
| | | 17,853,780 |
| Metals & Mining 0.4% |
| Freeport-McMoRan, Inc. | 56,131 | 2,116,700 |
| Newmont Corp. | 30,801 | 1,922,290 |
| Nucor Corp. | 11,471 | 943,605 |
| | | 4,982,595 |
| Multiline Retail 0.5% |
| Dollar General Corp. | 9,429 | 2,024,878 |
| Dollar Tree, Inc. (a) | 9,052 | 1,040,075 |
| | Shares | Value |
| |
| Multiline Retail (continued) |
| Target Corp. | 19,277 | $ 3,995,351 |
| | | 7,060,304 |
| Multi-Utilities 0.8% |
| Ameren Corp. | 9,750 | 827,190 |
| CenterPoint Energy, Inc. | 21,228 | 519,874 |
| CMS Energy Corp. | 11,120 | 716,017 |
| Consolidated Edison, Inc. | 13,178 | 1,020,109 |
| Dominion Energy, Inc. | 31,006 | 2,477,379 |
| DTE Energy Co. | 7,458 | 1,044,269 |
| NiSource, Inc. | 15,082 | 392,434 |
| Public Service Enterprise Group, Inc. | 19,439 | 1,227,767 |
| Sempra Energy | 11,646 | 1,602,140 |
| WEC Energy Group, Inc. | 12,140 | 1,179,644 |
| | | 11,006,823 |
| Oil, Gas & Consumable Fuels 2.4% |
| APA Corp. | 14,542 | 290,840 |
| Cabot Oil & Gas Corp. | 15,375 | 256,301 |
| Chevron Corp. | 74,138 | 7,641,404 |
| ConocoPhillips | 52,138 | 2,666,337 |
| Devon Energy Corp. | 22,795 | 532,947 |
| Diamondback Energy, Inc. | 6,958 | 568,677 |
| EOG Resources, Inc. | 22,460 | 1,653,954 |
| Exxon Mobil Corp. | 162,930 | 9,326,113 |
| Hess Corp. | 10,515 | 783,473 |
| HollyFrontier Corp. | 5,751 | 201,285 |
| Kinder Morgan, Inc. | 74,927 | 1,277,505 |
| Marathon Oil Corp. | 30,380 | 342,079 |
| Marathon Petroleum Corp. | 25,064 | 1,394,812 |
| Occidental Petroleum Corp. | 32,266 | 818,266 |
| ONEOK, Inc. | 17,125 | 896,322 |
| Phillips 66 | 16,811 | 1,360,178 |
| Pioneer Natural Resources Co. | 7,919 | 1,218,180 |
| Valero Energy Corp. | 15,725 | 1,163,021 |
| Williams Cos., Inc. (The) | 46,713 | 1,137,929 |
| | | 33,529,623 |
| Personal Products 0.2% |
| Estee Lauder Cos., Inc. (The), Class A | 8,842 | 2,774,620 |
| Pharmaceuticals 3.4% |
| Bristol-Myers Squibb Co. | 86,226 | 5,382,227 |
| Catalent, Inc. (a) | 6,551 | 736,791 |
| Eli Lilly and Co. | 30,616 | 5,595,686 |
| Johnson & Johnson | 101,167 | 16,462,906 |
| Merck & Co., Inc. | 97,382 | 7,254,959 |
| Perrigo Co. plc | 5,123 | 213,270 |
| Pfizer, Inc. | 214,660 | 8,296,609 |
The notes to the financial statements are an integral part of, and should be read in conjunction with, the financial statements.
15
Portfolio of Investments April 30, 2021† (Unaudited) (continued)
| | Shares | Value |
| Common Stocks (continued) |
| Pharmaceuticals (continued) |
| Viatris, Inc. (a) | 46,455 | $ 617,852 |
| Zoetis, Inc. | 18,287 | 3,164,200 |
| | | 47,724,500 |
| Professional Services 0.4% |
| Equifax, Inc. | 4,688 | 1,074,630 |
| IHS Markit Ltd. | 14,348 | 1,543,558 |
| Jacobs Engineering Group, Inc. | 5,007 | 668,985 |
| Leidos Holdings, Inc. | 5,133 | 519,870 |
| Nielsen Holdings plc | 13,771 | 353,226 |
| Robert Half International, Inc. | 4,353 | 381,367 |
| Verisk Analytics, Inc. | 6,265 | 1,179,073 |
| | | 5,720,709 |
| Real Estate Management & Development 0.1% |
| CBRE Group, Inc., Class A (a) | 12,916 | 1,100,443 |
| Road & Rail 1.0% |
| CSX Corp. | 29,346 | 2,956,610 |
| JB Hunt Transport Services, Inc. | 3,213 | 548,491 |
| Kansas City Southern | 3,496 | 1,021,566 |
| Norfolk Southern Corp. | 9,696 | 2,707,511 |
| Old Dominion Freight Line, Inc. | 3,690 | 951,319 |
| Union Pacific Corp. | 25,778 | 5,725,036 |
| | | 13,910,533 |
| Semiconductors & Semiconductor Equipment 5.2% |
| Advanced Micro Devices, Inc. (a) | 46,637 | 3,806,512 |
| Analog Devices, Inc. | 14,197 | 2,174,413 |
| Applied Materials, Inc. | 35,317 | 4,686,919 |
| Broadcom, Inc. | 15,710 | 7,166,902 |
| Enphase Energy, Inc. (a) | 4,965 | 691,376 |
| Intel Corp. | 156,368 | 8,995,851 |
| KLA Corp. | 5,930 | 1,870,025 |
| Lam Research Corp. | 5,500 | 3,412,475 |
| Maxim Integrated Products, Inc. | 10,315 | 969,610 |
| Microchip Technology, Inc. | 10,363 | 1,557,455 |
| Micron Technology, Inc. (a) | 43,053 | 3,705,572 |
| Monolithic Power Systems, Inc. | 1,650 | 596,277 |
| NVIDIA Corp. | 23,861 | 14,325,667 |
| NXP Semiconductors NV | 10,660 | 2,052,157 |
| Qorvo, Inc. (a) | 4,358 | 820,045 |
| QUALCOMM, Inc. | 43,719 | 6,068,197 |
| Skyworks Solutions, Inc. | 6,346 | 1,150,720 |
| Teradyne, Inc. | 6,415 | 802,388 |
| Texas Instruments, Inc. | 35,416 | 6,392,942 |
| | Shares | Value |
| |
| Semiconductors & Semiconductor Equipment (continued) |
| Xilinx, Inc. | 9,458 | $ 1,210,246 |
| | | 72,455,749 |
| Software 8.2% |
| Adobe, Inc. (a) | 18,447 | 9,377,348 |
| ANSYS, Inc. (a) | 3,339 | 1,220,939 |
| Autodesk, Inc. (a) | 8,462 | 2,470,142 |
| Cadence Design Systems, Inc. (a) | 10,736 | 1,414,683 |
| Citrix Systems, Inc. | 4,733 | 586,182 |
| Fortinet, Inc. (a) | 5,212 | 1,064,447 |
| Intuit, Inc. | 10,540 | 4,344,166 |
| Microsoft Corp. | 290,269 | 73,200,037 |
| NortonLifeLock, Inc. | 22,396 | 483,978 |
| Oracle Corp. | 71,381 | 5,409,966 |
| Paycom Software, Inc. (a) | 1,891 | 726,919 |
| PTC, Inc. (a) | 4,055 | 530,962 |
| salesforce.com, Inc. (a) | 35,320 | 8,134,902 |
| ServiceNow, Inc. (a) | 7,546 | 3,821,068 |
| Synopsys, Inc. (a) | 5,865 | 1,449,007 |
| Tyler Technologies, Inc. (a) | 1,562 | 663,631 |
| | | 114,898,377 |
| Specialty Retail 2.3% |
| Advance Auto Parts, Inc. | 2,522 | 504,804 |
| AutoZone, Inc. (a) | 854 | 1,250,358 |
| Best Buy Co., Inc. | 8,870 | 1,031,315 |
| CarMax, Inc. (a) | 6,256 | 833,549 |
| Gap, Inc. (The) | 7,918 | 262,086 |
| Home Depot, Inc. (The) | 41,434 | 13,410,943 |
| L Brands, Inc. (a) | 8,991 | 592,507 |
| Lowe's Cos., Inc. | 28,134 | 5,521,297 |
| O'Reilly Automotive, Inc. (a) | 2,702 | 1,493,882 |
| Ross Stores, Inc. | 13,701 | 1,794,009 |
| TJX Cos., Inc. (The) | 46,207 | 3,280,697 |
| Tractor Supply Co. | 4,476 | 844,174 |
| Ulta Beauty, Inc. (a) | 2,169 | 714,360 |
| | | 31,533,981 |
| Technology Hardware, Storage & Peripherals 6.0% |
| Apple, Inc. (c) | 607,338 | 79,840,653 |
| Hewlett Packard Enterprise Co. | 50,076 | 802,218 |
| HP, Inc. | 48,205 | 1,644,273 |
| NetApp, Inc. | 8,567 | 639,869 |
| Seagate Technology plc | 7,731 | 717,746 |
| Western Digital Corp. | 11,780 | 832,021 |
| | | 84,476,780 |
| Textiles, Apparel & Luxury Goods 0.7% |
| Hanesbrands, Inc. | 13,424 | 282,709 |
The notes to the financial statements are an integral part of, and should be read in conjunction with, the financial statements.
| 16 | MainStay MacKay S&P 500 Index Fund |
| | Shares | Value |
| Common Stocks (continued) |
| Textiles, Apparel & Luxury Goods (continued) |
| NIKE, Inc., Class B | 48,934 | $ 6,489,627 |
| PVH Corp. (a) | 2,737 | 309,774 |
| Ralph Lauren Corp. | 1,857 | 247,520 |
| Tapestry, Inc. (a) | 10,694 | 511,708 |
| Under Armour, Inc. (a) | | |
| Class A | 7,258 | 176,442 |
| Class C | 7,500 | 149,325 |
| |
| VF Corp. | 12,361 | 1,083,565 |
| | | 9,250,670 |
| Tobacco 0.7% |
| Altria Group, Inc. | 71,533 | 3,415,701 |
| Philip Morris International, Inc. | 59,934 | 5,693,730 |
| | | 9,109,431 |
| Trading Companies & Distributors 0.2% |
| Fastenal Co. | 22,105 | 1,155,650 |
| United Rentals, Inc. (a) | 2,779 | 889,141 |
| WW Grainger, Inc. | 1,693 | 733,983 |
| | | 2,778,774 |
| Water Utilities 0.1% |
| American Water Works Co., Inc. | 6,982 | 1,089,122 |
| Wireless Telecommunication Services 0.2% |
| T-Mobile US, Inc. (a) | 22,480 | 2,970,282 |
Total Common Stocks (d)
(Cost $347,345,545) | | 1,361,637,758 |
| |
| Short-Term Investments 2.7% |
| Affiliated Investment Company 0.0% ‡ |
| MainStay U.S. Government Liquidity Fund, 0.01% (e) | 506,808 | 506,808 |
| Unaffiliated Investment Company 0.0% ‡ |
| BlackRock Liquidity FedFund, 0.05% (e)(f) | 242,343 | 242,343 |
| |
| | Principal
Amount | | Value |
| U.S. Treasury Debt 2.7% |
| U.S. Treasury Bills (g) | | | |
| 0.01%, due 7/29/21 (c) | $ 2,100,000 | | $ 2,099,924 |
| 0.011%, due 7/8/21 | 35,400,000 | | 35,399,026 |
Total U.S. Treasury Debt
(Cost $37,499,194) | | | 37,498,950 |
Total Short-Term Investments
(Cost $38,248,345) | | | 38,248,101 |
Total Investments
(Cost $385,593,890) | 100.0% | | 1,399,885,859 |
| Other Assets, Less Liabilities | 0.0‡ | | 59,357 |
| Net Assets | 100.0% | | $ 1,399,945,216 |
| † | Percentages indicated are based on Fund net assets. |
| ‡ | Less than one-tenth of a percent. |
| (a) | Non-income producing security. |
| (b) | All or a portion of this security was held on loan. As of April 30, 2021, the aggregate market value of securities on loan was $1,107,394; the total market value of collateral held by the Fund was $1,115,019. The market value of the collateral held included non-cash collateral in the form of U.S. Treasury securities with a value of $872,676. The Fund received cash collateral with a value of $242,343. (See Note 2(I)) |
| (c) | Represents a security, or portion thereof, which was maintained at the broker as collateral for futures contracts. |
| (d) | The combined market value of common stocks and notional value of Standard & Poor’s 500 Index futures contracts represents 99.90% of the Fund’s net assets. |
| (e) | Current yield as of April 30, 2021. |
| (f) | Represents a security purchased with cash collateral received for securities on loan. |
| (g) | Interest rate shown represents yield to maturity. |
The notes to the financial statements are an integral part of, and should be read in conjunction with, the financial statements.
17
Portfolio of Investments April 30, 2021† (Unaudited) (continued)
Futures Contracts
As of April 30, 2021, the Fund held the following futures contracts1:
| Type | Number of
Contracts | Expiration
Date | Value at
Trade Date | Current
Notional
Amount | Unrealized
Appreciation
(Depreciation)2 |
| Long Contracts | | | | | |
| S&P 500 E-Mini Index | 177 | June 2021 | $ 35,916,443 | $ 36,943,440 | $ 1,026,997 |
| 1. | As of April 30, 2021, cash in the amount of $1,000,000 was on deposit with a broker or futures commission merchant for futures transactions. |
| 2. | Represents the difference between the value of the contracts at the time they were opened and the value as of April 30, 2021. |
The following is a summary of the fair valuations according to the inputs used as of April 30, 2021, for valuing the Fund’s assets:
| Description | Quoted
Prices in
Active
Markets for
Identical
Assets
(Level 1) | | Significant
Other
Observable
Inputs
(Level 2) | | Significant
Unobservable
Inputs
(Level 3) | | Total |
| Asset Valuation Inputs | | | | | | | |
| Investments in Securities (a) | | | | | | | |
| Common Stocks | $ 1,361,637,758 | | $ — | | $ — | | $ 1,361,637,758 |
| Short-Term Investments | | | | | | | |
| Affiliated Investment Company | 506,808 | | — | | — | | 506,808 |
| Unaffiliated Investment Company | 242,343 | | — | | — | | 242,343 |
| U.S. Treasury Debt | — | | 37,498,950 | | — | | 37,498,950 |
| Total Short-Term Investments | 749,151 | | 37,498,950 | | — | | 38,248,101 |
| Total Investments in Securities | 1,362,386,909 | | 37,498,950 | | — | | 1,399,885,859 |
| Other Financial Instruments | | | | | | | |
| Futures Contracts (b) | 1,026,997 | | — | | — | | 1,026,997 |
| Total Investments in Securities and Other Financial Instruments | $ 1,363,413,906 | | $ 37,498,950 | | $ — | | $ 1,400,912,856 |
| (a) | For a complete listing of investments and their industries, see the Portfolio of Investments. |
| (b) | The value listed for these securities reflects unrealized appreciation (depreciation) as shown on the Portfolio of Investments. |
The notes to the financial statements are an integral part of, and should be read in conjunction with, the financial statements.
| 18 | MainStay MacKay S&P 500 Index Fund |
Statement of Assets and Liabilities as of April 30, 2021 (Unaudited)
| Assets |
Investment in unaffiliated securities, at value
(identified cost $385,087,082) including securities on loan of $1,107,394 | $1,399,379,051 |
Investment in affiliated investment companies, at value
(identified cost $506,808) | 506,808 |
| Cash collateral on deposit at broker for futures contracts | 1,000,000 |
| Receivables: | |
| Fund shares sold | 1,121,491 |
| Dividends and interest | 973,044 |
| Securities lending | 87 |
| Other assets | 59,583 |
| Total assets | 1,403,040,064 |
| Liabilities |
| Cash collateral received for securities on loan | 242,342 |
| Due to custodian | 503,669 |
| Payables: | |
| Variation margin on futures contracts | 1,256,648 |
| Fund shares redeemed | 402,545 |
| Transfer agent (See Note 3) | 201,819 |
| Manager (See Note 3) | 173,350 |
| NYLIFE Distributors (See Note 3) | 171,440 |
| Professional fees | 51,556 |
| Shareholder communication | 41,553 |
| Custodian | 1,547 |
| Dividend payable | 87 |
| Accrued expenses | 48,292 |
| Total liabilities | 3,094,848 |
| Net assets | $1,399,945,216 |
| Composition of Net Assets |
| Shares of beneficial interest outstanding (par value of $.001 per share) unlimited number of shares authorized | $ 25,728 |
| Additional paid-in-capital | 358,076,664 |
| | 358,102,392 |
| Total distributable earnings (loss) | 1,041,842,824 |
| Net assets | $1,399,945,216 |
| Class A | |
| Net assets applicable to outstanding shares | $788,747,013 |
| Shares of beneficial interest outstanding | 14,600,173 |
| Net asset value per share outstanding | $ 54.02 |
| Maximum sales charge (1.50% of offering price) | 0.82 |
| Maximum offering price per share outstanding | $ 54.84 |
| Investor Class | |
| Net assets applicable to outstanding shares | $ 61,686,271 |
| Shares of beneficial interest outstanding | 1,144,824 |
| Net asset value per share outstanding | $ 53.88 |
| Maximum sales charge (1.00% of offering price) | 0.54 |
| Maximum offering price per share outstanding | $ 54.42 |
| Class I | |
| Net assets applicable to outstanding shares | $549,481,961 |
| Shares of beneficial interest outstanding | 9,982,688 |
| Net asset value and offering price per share outstanding | $ 55.04 |
| SIMPLE Class | |
| Net assets applicable to outstanding shares | $ 29,971 |
| Shares of beneficial interest outstanding | 554 |
| Net asset value and offering price per share outstanding | $ 54.10 |
The notes to the financial statements are an integral part of, and should be read in conjunction with, the financial statements.
19
Statement of Operations for the six months ended April 30, 2021 (Unaudited)
| Investment Income (Loss) |
| Income | |
| Dividends-unaffiliated (net of foreign tax withholding of $1,259) | $ 10,212,774 |
| Securities lending | 19,611 |
| Interest | 3,684 |
| Dividends-affiliated | 53 |
| Total income | 10,236,122 |
| Expenses | |
| Manager (See Note 3) | 1,020,751 |
| Distribution/Service—Class A (See Note 3) | 877,839 |
| Distribution/Service—Investor Class (See Note 3) | 74,742 |
| Distribution/Service—SIMPLE Class (See Note 3) | 68 |
| Transfer agent (See Note 3) | 480,863 |
| Professional fees | 61,261 |
| Registration | 48,111 |
| Shareholder communication | 32,899 |
| Custodian | 23,097 |
| Trustees | 12,460 |
| Insurance | 4,670 |
| Miscellaneous | 59,453 |
| Total expenses before waiver/reimbursement | 2,696,214 |
| Expense waiver/reimbursement from Manager (See Note 3) | (43,339) |
| Net expenses | 2,652,875 |
| Net investment income (loss) | 7,583,247 |
| Realized and Unrealized Gain (Loss) |
| Net realized gain (loss) on: | |
| Unaffiliated investment transactions | 24,027,638 |
| Futures transactions | 2,373,729 |
| Net realized gain (loss) | 26,401,367 |
| Net change in unrealized appreciation (depreciation) on: | |
| Unaffiliated investments | 278,136,178 |
| Futures contracts | 1,345,003 |
| Net change in unrealized appreciation (depreciation) | 279,481,181 |
| Net realized and unrealized gain (loss) | 305,882,548 |
| Net increase (decrease) in net assets resulting from operations | $313,465,795 |
The notes to the financial statements are an integral part of, and should be read in conjunction with, the financial statements.
| 20 | MainStay MacKay S&P 500 Index Fund |
Statements of Changes in Net Assets
for the six months ended April 30, 2021 (Unaudited) and the year ended October 31, 2020
| | 2021 | 2020 |
| Increase (Decrease) in Net Assets |
| Operations: | | |
| Net investment income (loss) | $ 7,583,247 | $ 14,221,087 |
| Net realized gain (loss) | 26,401,367 | 100,232,774 |
| Net change in unrealized appreciation (depreciation) | 279,481,181 | (7,098,240) |
| Net increase (decrease) in net assets resulting from operations | 313,465,795 | 107,355,621 |
| Distributions to shareholders: | | |
| Class A | (56,036,725) | (87,928,163) |
| Investor Class | (5,128,468) | (8,636,257) |
| Class I | (41,144,122) | (62,882,463) |
| SIMPLE Class | (1,984) | — |
| Total distributions to shareholders | (102,311,299) | (159,446,883) |
| Capital share transactions: | | |
| Net proceeds from sales of shares | 128,110,333 | 296,472,066 |
| Net asset value of shares issued to shareholder in reinvestment of distributions | 101,127,238 | 157,434,383 |
| Cost of shares redeemed | (134,498,547) | (321,890,809) |
| Increase (decrease) in net assets derived from capital share transactions | 94,739,024 | 132,015,640 |
| Net increase (decrease) in net assets | 305,893,520 | 79,924,378 |
| Net Assets |
| Beginning of period | 1,094,051,696 | 1,014,127,318 |
| End of period | $1,399,945,216 | $1,094,051,696 |
The notes to the financial statements are an integral part of, and should be read in conjunction with, the financial statements.
21
Financial Highlights selected per share data and ratios
| | Six months ended
April 30,
2021* | | Year Ended October 31, |
| Class A | 2020 | | 2019 | | 2018 | | 2017 | | 2016 |
| Net asset value at beginning of period | $ 45.82 | | $ 49.60 | | $ 49.27 | | $ 53.27 | | $ 47.57 | | $ 48.27 |
| Net investment income (loss) (a) | 0.27 | | 0.58 | | 0.67 | | 0.69 | | 0.65 | | 0.74 |
| Net realized and unrealized gain (loss) on investments | 12.18 | | 3.44 | | 5.52 | | 2.61 | | 9.47 | | 1.06 |
| Total from investment operations | 12.45 | | 4.02 | | 6.19 | | 3.30 | | 10.12 | | 1.80 |
| Less distributions: | | | | | | | | | | | |
| From net investment income | (0.55) | | (0.91) | | (0.77) | | (0.79) | | (1.07) | | (0.74) |
| From net realized gain on investments | (3.70) | | (6.89) | | (5.09) | | (6.51) | | (3.35) | | (1.76) |
| Total distributions | (4.25) | | (7.80) | | (5.86) | | (7.30) | | (4.42) | | (2.50) |
| Net asset value at end of period | $ 54.02 | | $ 45.82 | | $ 49.60 | | $ 49.27 | | $ 53.27 | | $ 47.57 |
| Total investment return (b) | 28.51% | | 9.21% | | 13.80% | | 6.77% | | 22.93% | | 3.92% |
| Ratios (to average net assets)/Supplemental Data: | | | | | | | | | | | |
| Net investment income (loss) | 1.11%†† | | 1.32% | | 1.44% | | 1.39% | | 1.33% | | 1.60% |
| Net expenses (c) | 0.51%†† | | 0.54% | | 0.54% | | 0.54% | | 0.60% | | 0.60% |
| Expenses (before waiver/reimbursement) (c) | 0.51%†† | | 0.54% | | 0.54% | | 0.54% | | 0.64% | | 0.61% |
| Portfolio turnover rate | 4% | | 15% | | 3% | | 3% | | 3% | | 4% |
| Net assets at end of period (in 000’s) | $ 788,747 | | $ 602,036 | | $ 559,780 | | $ 511,043 | | $ 527,768 | | $ 597,791 |
| * | Unaudited. |
| †† | Annualized. |
| (a) | Per share data based on average shares outstanding during the period. |
| (b) | Total investment return is calculated exclusive of sales charges and assumes the reinvestment of dividends and distributions. For periods of less than one year, total return is not annualized. |
| (c) | In addition to the fees and expenses which the Fund bears directly, it also indirectly bears a pro-rata share of the fees and expenses of the underlying funds in which it invests. Such indirect expenses are not included in the above expense ratios. |
| | Six months ended
April 30,
2021* | | Year Ended October 31, |
| Investor Class | 2020 | | 2019 | | 2018 | | 2017 | | 2016 |
| Net asset value at beginning of period | $ 45.68 | | $ 49.50 | | $ 49.18 | | $ 53.18 | | $ 47.51 | | $ 48.22 |
| Net investment income (loss) (a) | 0.22 | | 0.51 | | 0.59 | | 0.62 | | 0.63 | | 0.69 |
| Net realized and unrealized gain (loss) on investments | 12.14 | | 3.43 | | 5.52 | | 2.58 | | 9.43 | | 1.05 |
| Total from investment operations | 12.36 | | 3.94 | | 6.11 | | 3.20 | | 10.06 | | 1.74 |
| Less distributions: | | | | | | | | | | | |
| From net investment income | (0.46) | | (0.87) | | (0.70) | | (0.69) | | (1.04) | | (0.69) |
| From net realized gain on investments | (3.70) | | (6.89) | | (5.09) | | (6.51) | | (3.35) | | (1.76) |
| Total distributions | (4.16) | | (7.76) | | (5.79) | | (7.20) | | (4.39) | | (2.45) |
| Net asset value at end of period | $ 53.88 | | $ 45.68 | | $ 49.50 | | $ 49.18 | | $ 53.18 | | $ 47.51 |
| Total investment return (b) | 28.38% | | 9.03% | | 13.62% | | 6.58% | | 22.81% | | 3.81% |
| Ratios (to average net assets)/Supplemental Data: | | | | | | | | | | | |
| Net investment income (loss) | 0.88%†† | | 1.16% | | 1.26% | | 1.23% | | 1.29% | | 1.49% |
| Net expenses (c) | 0.70%†† | | 0.70% | | 0.70% | | 0.70% | | 0.70% | | 0.70% |
| Expenses (before waiver/reimbursement) (c) | 0.85%†† | | 0.88% | | 0.89% | | 0.87% | | 0.82% | | 0.84% |
| Portfolio turnover rate | 4% | | 15% | | 3% | | 3% | | 3% | | 4% |
| Net assets at end of period (in 000’s) | $ 61,686 | | $ 55,546 | | $ 54,505 | | $ 41,907 | | $ 38,052 | | $ 46,999 |
| * | Unaudited. |
| †† | Annualized. |
| (a) | Per share data based on average shares outstanding during the period. |
| (b) | Total investment return is calculated exclusive of sales charges and assumes the reinvestment of dividends and distributions. For periods of less than one year, total return is not annualized. |
| (c) | In addition to the fees and expenses which the Fund bears directly, it also indirectly bears a pro-rata share of the fees and expenses of the underlying funds in which it invests. Such indirect expenses are not included in the above expense ratios. |
The notes to the financial statements are an integral part of, and should be read in conjunction with, the financial statements.
| 22 | MainStay MacKay S&P 500 Index Fund |
Financial Highlights selected per share data and ratios
| | Six months ended
April 30,
2021* | | Year Ended October 31, |
| Class I | 2020 | | 2019 | | 2018 | | 2017 | | 2016 |
| Net asset value at beginning of period | $ 46.66 | | $ 50.38 | | $ 49.97 | | $ 53.93 | | $ 48.12 | | $ 48.81 |
| Net investment income (loss) (a) | 0.34 | | 0.70 | | 0.81 | | 0.83 | | 0.78 | | 0.87 |
| Net realized and unrealized gain (loss) on investments | 12.40 | | 3.50 | | 5.59 | | 2.64 | | 9.56 | | 1.06 |
| Total from investment operations | 12.74 | | 4.20 | | 6.40 | | 3.47 | | 10.34 | | 1.93 |
| Less distributions: | | | | | | | | | | | |
| From net investment income | (0.66) | | (1.03) | | (0.90) | | (0.92) | | (1.18) | | (0.86) |
| From net realized gain on investments | (3.70) | | (6.89) | | (5.09) | | (6.51) | | (3.35) | | (1.76) |
| Total distributions | (4.36) | | (7.92) | | (5.99) | | (7.43) | | (4.53) | | (2.62) |
| Net asset value at end of period | $ 55.04 | | $ 46.66 | | $ 50.38 | | $ 49.97 | | $ 53.93 | | $ 48.12 |
| Total investment return (b) | 28.67% | | 9.47% | | 14.08% | | 7.05% | | 23.20% | | 4.17% |
| Ratios (to average net assets)/Supplemental Data: | | | | | | | | | | | |
| Net investment income (loss) | 1.34%†† | | 1.56% | | 1.74% | | 1.64% | | 1.58% | | 1.88% |
| Net expenses (c) | 0.26%†† | | 0.29% | | 0.29% | | 0.29% | | 0.35% | | 0.35% |
| Expenses (before waiver/reimbursement) (c) | 0.26%†† | | 0.29% | | 0.29% | | 0.29% | | 0.39% | | 0.35% |
| Portfolio turnover rate | 4% | | 15% | | 3% | | 3% | | 3% | | 4% |
| Net assets at end of period (in 000’s) | $ 549,482 | | $ 436,446 | | $ 399,842 | | $ 592,457 | | $ 717,528 | | $ 755,952 |
| * | Unaudited. |
| †† | Annualized. |
| (a) | Per share data based on average shares outstanding during the period. |
| (b) | Total investment return is calculated exclusive of sales charges and assumes the reinvestment of dividends and distributions. Class I shares are not subject to sales charges. For periods of less than one year, total return is not annualized. |
| (c) | In addition to the fees and expenses which the Fund bears directly, it also indirectly bears a pro-rata share of the fees and expenses of the underlying funds in which it invests. Such indirect expenses are not included in the above expense ratios. |
The notes to the financial statements are an integral part of, and should be read in conjunction with, the financial statements.
23
Financial Highlights selected per share data and ratios
| | Six months ended
April 30,
2021* | | August 31, 2020^ through
October 31, |
| SIMPLE Class | 2020 |
| Net asset value at beginning of period | $ 45.65 | | $ 48.83** |
| Net investment income (loss) (a) | 0.15 | | 0.02 |
| Net realized and unrealized gain (loss) on investments | 12.17 | | (3.20) |
| Total from investment operations | 12.32 | | (3.18) |
| Less distributions: | | | |
| From net investment income | (0.17) | | — |
| From net realized gain on investments | (3.70) | | — |
| Total distributions | (3.87) | | — |
| Net asset value at end of period | $ 54.10 | | $ 45.65 |
| Total investment return (b) | 28.24% | | (6.51)% |
| Ratios (to average net assets)/Supplemental Data: | | | |
| Net investment income (loss)†† | 0.61% | | 0.30% |
| Net expenses†† (c) | 0.95% | | 0.95% |
| Expenses (before waiver/reimbursement)†† (c) | 1.10% | | 1.15% |
| Portfolio turnover rate | 4% | | 15% |
| Net assets at end of period (in 000’s) | $ 30 | | $ 23 |
| * | Unaudited. |
| ^ | Inception date. |
| ** | Based on the net asset value of Investor Class as of August 31, 2020. |
| †† | Annualized. |
| (a) | Per share data based on average shares outstanding during the period. |
| (b) | Total investment return is calculated exclusive of sales charges and assumes the reinvestment of dividends and distributions. SIMPLE Class shares are not subject to sales charges. For periods of less than one year, total return is not annualized. |
| (c) | In addition to the fees and expenses which the Fund bears directly, it also indirectly bears a pro-rata share of the fees and expenses of the underlying funds in which it invests. Such indirect expenses are not included in the above expense ratios. |
The notes to the financial statements are an integral part of, and should be read in conjunction with, the financial statements.
| 24 | MainStay MacKay S&P 500 Index Fund |
Notes to Financial Statements (Unaudited)
Note 1-Organization and Business
MainStay Funds Trust (the “Trust”) was organized as a Delaware statutory trust on April 28, 2009. The Trust is registered under the Investment Company Act of 1940, as amended (the “1940 Act”), as an open-end management investment company, and is comprised of thirty-two funds (collectively referred to as the “Funds”). These financial statements and notes relate to the MainStay MacKay S&P 500 Index Fund (the "Fund"), a “diversified” fund, as that term is defined in the 1940 Act, as interpreted or modified by regulatory authorities having jurisdiction, from time to time.
The following table lists the Fund's share classes that have been registered and commenced operations:
| Class | Commenced Operations |
| Class A | January 2, 2004 |
| Investor Class | February 28, 2008 |
| Class I | January 2, 1991 |
| SIMPLE Class | August 31, 2020 |
| Class R6 | N/A * |
| * | Class R6 shares were registered for sale effective as of February 28, 2017 but have not yet commenced operations. |
Class A and Investor Class shares are offered at net asset value (“NAV”) per share plus an initial sales charge. No initial sales charge applies to investments of $1 million or more (and certain other qualified purchases) in Class A and Investor Class shares. However, a contingent deferred sales charge (“CDSC”) of 1.00% may be imposed on certain redemptions made within 18 months of the date of purchase on shares that were purchased without an initial sales charge. Class I and SIMPLE Class shares are offered at NAV without a sales charge. Class R6 shares are currently expected to be offered at NAV without a sales charge. Investor Class shares may convert automatically to Class A shares. SIMPLE Class shares convert to Class A shares, or Investor Class shares if you are not eligible to hold Class A shares, at the end of the calendar quarter, ten years after the date they were purchased. Share class conversions are based on the relevant NAVs of the two classes at the time of the conversion, and no sales load or other charge is imposed. Under certain circumstances and as may be permitted by the Trust’s multiple class plan pursuant to Rule 18f-3 under the 1940 Act, specified share classes of the Fund may be converted to one or more other share classes of the Fund as disclosed in the capital share transactions within these Notes. The classes of shares have the same voting (except for issues that relate solely to one class), dividend, liquidation and other rights, and the same terms and conditions, except that under distribution plans pursuant to Rule 12b-1 under the 1940 Act, Class A, Investor Class and SIMPLE Class shares are subject to a distribution and/or service fee. Class I and Class R6 shares are not subject to a distribution and/or service fee.
The Fund's investment objective is to seek investment results that correspond to the total return performance (reflecting reinvestment of dividends) of common stocks in the aggregate, as represented by the S&P 500® Index.
Note 2–Significant Accounting Policies
The Fund is an investment company and accordingly follows the investment company accounting and reporting guidance of the Financial Accounting Standards Board (“FASB”) Accounting Standard Codification Topic 946 Financial Services—Investment Companies. The Fund prepares its financial statements in accordance with generally accepted accounting principles (“GAAP”) in the United States of America and follows the significant accounting policies described below.
(A) Securities Valuation. Investments are usually valued as of the close of regular trading on the New York Stock Exchange (the "Exchange") (usually 4:00 p.m. Eastern time) on each day the Fund is open for business ("valuation date").
The Board of Trustees of the Trust (the "Board") adopted procedures establishing methodologies for the valuation of the Fund's securities and other assets and delegated the responsibility for valuation determinations under those procedures to the Valuation Committee of the Trust (the “Valuation Committee”). The procedures state that, subject to the oversight of the Board and unless otherwise noted, the responsibility for the day-to-day valuation of portfolio assets (including fair value measurements for the Fund's assets and liabilities) rests with New York Life Investment Management LLC (“New York Life Investments” or the "Manager"), aided to whatever extent necessary by the Subadvisor (as defined in Note 3(A)). To assess the appropriateness of security valuations, the Manager, the Subadvisor or the Fund's third-party service provider, who is subject to oversight by the Manager, regularly compares prior day prices, prices on comparable securities and the sale prices to the prior and current day prices and challenges prices with changes exceeding certain tolerance levels with third-party pricing services or broker sources.
The Board authorized the Valuation Committee to appoint a Valuation Subcommittee (the “Subcommittee”) to establish the prices of securities for which market quotations are not readily available or the prices of which are not otherwise readily determinable under the procedures. The Subcommittee meets (in person, via electronic mail or via teleconference) on an as-needed basis. The Valuation Committee meets to ensure that actions taken by the Subcommittee were appropriate.
For those securities valued through either a standardized fair valuation methodology or a fair valuation measurement, the Subcommittee deals with such valuation and the Valuation Committee reviews and affirms, if appropriate, the reasonableness of the valuation based on such methodologies and measurements on a regular basis after considering information that is reasonably available and deemed relevant by the Valuation Committee. Any action taken by the Subcommittee with respect to the valuation of a portfolio security or other asset is submitted for review and ratification (if appropriate) to the Valuation Committee and the Board at the next regularly scheduled meeting.
"Fair value" is defined as the price the Fund would reasonably expect to receive upon selling an asset or liability in an orderly transaction to an independent buyer in the principal or most advantageous market for the
Notes to Financial Statements (Unaudited) (continued)
asset or liability. Fair value measurements are determined within a framework that establishes a three-tier hierarchy that maximizes the use of observable market data and minimizes the use of unobservable inputs to establish a classification of fair value measurements for disclosure purposes. "Inputs" refer broadly to the assumptions that market participants would use in pricing the asset or liability, including assumptions about risk, such as the risk inherent in a particular valuation technique used to measure fair value using a pricing model and/or the risk inherent in the inputs for the valuation technique. Inputs may be observable or unobservable. Observable inputs reflect the assumptions market participants would use in pricing the asset or liability based on market data obtained from sources independent of the Fund. Unobservable inputs reflect the Fund’s own assumptions about the assumptions market participants would use in pricing the asset or liability based on the information available. The inputs or methodology used for valuing assets or liabilities may not be an indication of the risks associated with investing in those assets or liabilities. The three-tier hierarchy of inputs is summarized below.
| • | Level 1—quoted prices in active markets for an identical asset or liability |
| • | Level 2—other significant observable inputs (including quoted prices for a similar asset or liability in active markets, interest rates and yield curves, prepayment speeds, credit risk, etc.) |
| • | Level 3—significant unobservable inputs (including the Fund's own assumptions about the assumptions that market participants would use in measuring fair value of an asset or liability) |
The level of an asset or liability within the fair value hierarchy is based on the lowest level of an input, both individually and in the aggregate, that is significant to the fair value measurement. The aggregate value by input level of the Fund’s assets and liabilities as of April 30, 2021, is included at the end of the Portfolio of Investments.
The Fund may use third-party vendor evaluations, whose prices may be derived from one or more of the following standard inputs, among others:
| • Broker/dealer quotes | • Benchmark securities |
| • Two-sided markets | • Reference data (corporate actions or material event notices) |
| • Bids/offers | • Monthly payment information |
| • Industry and economic events | • Reported trades |
An asset or liability for which market values cannot be measured using the methodologies described above is valued by methods deemed reasonable in good faith by the Valuation Committee, following the procedures established by the Board, to represent fair value. Under these procedures, the Fund generally uses a market-based approach which may use related or comparable assets or liabilities, recent transactions, market multiples, book values and other relevant information. The Fund may also use an income-based valuation approach in which the anticipated future cash flows of the asset or liability are discounted to calculate fair value. Discounts may also be applied due to the nature
and/or duration of any restrictions on the disposition of the asset or liability. Fair value represents a good faith approximation of the value of a security. Fair value determinations involve the consideration of a number of subjective factors, an analysis of applicable facts and circumstances and the exercise of judgment. As a result, it is possible that the fair value for a security determined in good faith in accordance with the Fund's valuation procedures may differ from valuations for the same security determined by other funds using their own valuation procedures. Although the Fund's valuation procedures are designed to value a security at the price the Fund may reasonably expect to receive upon the security's sale in an orderly transaction, there can be no assurance that any fair value determination thereunder would, in fact, approximate the amount that the Fund would actually realize upon the sale of the security or the price at which the security would trade if a reliable market price were readily available. During the six-month period ended April 30, 2021, there were no material changes to the fair value methodologies.
Securities which may be valued in this manner include, but are not limited to: (i) a security for which trading has been halted or suspended; (ii) a debt security that has recently gone into default and for which there is not a current market quotation; (iii) a security of an issuer that has entered into a restructuring; (iv) a security that has been delisted from a national exchange; (v) a security for which the market price is not readily available from a third-party pricing source or, if so provided, does not, in the opinion of the Manager or the Subadvisor, reflect the security's market value; (vi) a security subject to trading collars for which no or limited trading takes place; and (vii) a security whose principal market has been temporarily closed at a time when, under normal conditions, it would be open. Securities valued in this manner are generally categorized as Level 3 in the hierarchy. No securities held by the Fund as of April 30, 2021 were fair valued in such a manner.
Certain securities held by the Fund may principally trade in foreign markets. Events may occur between the time the foreign markets close and the time at which the Fund's NAVs are calculated. These events may include, but are not limited to, situations relating to a single issuer in a market sector, significant fluctuations in U.S. or foreign markets, natural disasters, armed conflicts, governmental actions or other developments not tied directly to the securities markets. Should the Manager or the Subadvisor conclude that such events may have affected the accuracy of the last price of such securities reported on the local foreign market, the Subcommittee may, pursuant to procedures adopted by the Board, adjust the value of the local price to reflect the estimated impact on the price of such securities as a result of such events. In this instance, securities are generally categorized as Level 3 in the hierarchy. Additionally, certain foreign equity securities are also fair valued whenever the movement of a particular index exceeds certain thresholds. In such cases, the securities are fair valued by applying factors provided by a third-party vendor in accordance with valuation procedures adopted by the Board and are generally categorized as Level 2 in the hierarchy. No foreign equity securities held by the Fund as of April 30, 2021 were fair valued in such a manner.
| 26 | MainStay MacKay S&P 500 Index Fund |
Equity securities are valued at the last quoted sales prices as of the close of regular trading on the relevant exchange on each valuation date. Securities that are not traded on the valuation date are valued at the mean of the last quoted bid and ask prices. Prices are normally taken from the principal market in which each security trades. These securities are generally categorized as Level 1 in the hierarchy.
Investments in mutual funds, including money market funds, are valued at their respective NAVs at the close of business each day on the valuation date. These securities are generally categorized as Level 1 in the hierarchy.
Futures contracts are valued at the last posted settlement price on the market where such futures are primarily traded. These securities are generally categorized as Level 1 in the hierarchy.
Temporary cash investments acquired in excess of 60 days to maturity at the time of purchase are valued using the latest bid prices or using valuations based on a matrix system (which considers such factors as security prices, yields, maturities and ratings), both as furnished by independent pricing services. Temporary cash investments that mature in 60 days or less at the time of purchase ("Short-Term Investments") are valued using the amortized cost method of valuation, unless the use of such method would be inappropriate. The amortized cost method involves valuing a security at its cost on the date of purchase and thereafter assuming a constant amortization to maturity of the difference between such cost and the value on maturity date. Amortized cost approximates the current fair value of a security. Securities valued using the amortized cost method are not valued using quoted prices in an active market and are generally categorized as Level 2 in the hierarchy.
The information above is not intended to reflect an exhaustive list of the methodologies that may be used to value portfolio investments. The valuation procedures permit the use of a variety of valuation methodologies in connection with valuing portfolio investments. The methodology used for a specific type of investment may vary based on the market data available or other considerations. The methodologies summarized above may not represent the specific means by which portfolio investments are valued on any particular business day.
(B) Income Taxes. The Fund's policy is to comply with the requirements of the Internal Revenue Code of 1986, as amended (the “Internal Revenue Code”), applicable to regulated investment companies and to distribute all of its taxable income to the shareholders of the Fund within the allowable time limits.
The Manager evaluates the Fund’s tax positions to determine if the tax positions taken meet the minimum recognition threshold in connection with accounting for uncertainties in income tax positions taken or expected to be taken for the purposes of measuring and recognizing tax liabilities in the financial statements. Recognition of tax benefits of an uncertain tax position is permitted only to the extent the position is “more likely than not” to be sustained assuming examination by taxing authorities. The Manager analyzed the Fund's tax positions taken on federal, state and local income tax returns for all open tax years (for up to
three tax years) and has concluded that no provisions for federal, state and local income tax are required in the Fund's financial statements. The Fund's federal, state and local income tax and federal excise tax returns for tax years for which the applicable statutes of limitations have not expired are subject to examination by the Internal Revenue Service and state and local departments of revenue.
(C) Foreign Taxes. The Fund may be subject to foreign taxes on income and other transaction-based taxes imposed by certain countries in which it invests. A portion of the taxes on gains on investments or currency purchases/repatriation may be reclaimable. The Fund will accrue such taxes and reclaims as applicable, based upon its current interpretation of tax rules and regulations that exist in the markets in which it invests.
The Fund may be subject to taxation on realized capital gains, repatriation proceeds and other transaction-based taxes imposed by certain countries in which it invests. The Fund will accrue such taxes as applicable based upon its current interpretation of tax rules and regulations that exist in the market in which it invests. Capital gains taxes relating to positions still held are reflected as a liability in the Statement of Assets and Liabilities, as well as an adjustment to the Fund's net unrealized appreciation (depreciation). Taxes related to capital gains realized, if any, are reflected as part of net realized gain (loss) in the Statement of Operations. Changes in tax liabilities related to capital gains taxes on unrealized investment gains, if any, are reflected as part of the change in net unrealized appreciation (depreciation) on investments in the Statement of Operations. Transaction-based charges are generally assessed as a percentage of the transaction amount.
(D) Dividends and Distributions to Shareholders. Dividends and distributions are recorded on the ex-dividend date. The Fund intends to declare and pay dividends from net investment income and distributions from net realized capital and currency gains, if any, at least annually. Unless a shareholder elects otherwise, all dividends and distributions are reinvested at NAV in the same class of shares of the Fund. Dividends and distributions to shareholders are determined in accordance with federal income tax regulations and may differ from determinations using GAAP.
(E) Security Transactions and Investment Income. The Fund records security transactions on the trade date. Realized gains and losses on security transactions are determined using the identified cost method. Dividend income is recognized on the ex-dividend date, net of any foreign tax withheld at the source, and interest income is accrued as earned using the effective interest rate method. Distributions received from real estate investment trusts may be classified as dividends, capital gains and/or return of capital.
Investment income and realized and unrealized gains and losses on investments of the Fund are allocated pro rata to the separate classes of shares based upon their relative net assets on the date the income is earned or realized and unrealized gains and losses are incurred.
Notes to Financial Statements (Unaudited) (continued)
(F) Expenses. Expenses of the Trust are allocated to the individual Funds in proportion to the net assets of the respective Funds when the expenses are incurred, except where direct allocations of expenses can be made. Expenses (other than transfer agent expenses and fees incurred under the shareholder services plans and/or the distribution plans further discussed in Note 3(B)) are allocated to separate classes of shares pro rata based upon their relative net assets on the date the expenses are incurred. The expenses borne by the Fund, including those of related parties to the Fund, are shown in the Statement of Operations.
Additionally, the Fund may invest in mutual funds, which are subject to management fees and other fees that may cause the costs of investing in mutual funds to be greater than the costs of owning the underlying securities directly. These indirect expenses of mutual funds are not included in the amounts shown as expenses in the Statement of Operations or in the expense ratios included in the Financial Highlights.
(G) Use of Estimates. In preparing financial statements in conformity with GAAP, the Manager makes estimates and assumptions that affect the reported amounts and disclosures in the financial statements. Actual results could differ from those estimates and assumptions.
(H) Futures Contracts. A futures contract is an agreement to purchase or sell a specified quantity of an underlying instrument at a specified future date and price, or to make or receive a cash payment based on the value of a financial instrument (e.g., foreign currency, interest rate, security or securities index). The Fund is subject to risks such as market price risk and/or interest rate risk in the normal course of investing in these contracts. Upon entering into a futures contract, the Fund is required to pledge to the broker or futures commission merchant an amount of cash and/or U.S. government securities equal to a certain percentage of the collateral amount, known as the “initial margin.” During the period the futures contract is open, changes in the value of the contract are recognized as unrealized appreciation or depreciation by marking to market such contract on a daily basis to reflect the market value of the contract at the end of each day’s trading. The Fund agrees to receive from or pay to the broker or futures commission merchant an amount of cash equal to the daily fluctuation in the value of the contract. Such receipts or payments are known as “variation margin.” When the futures contract is closed, the Fund records a realized gain or loss equal to the difference between the proceeds from (or cost of) the closing transaction and the Fund's basis in the contract.
The use of futures contracts involves, to varying degrees, elements of market risk in excess of the amount recognized in the Statement of Assets and Liabilities. The contract or notional amounts and variation margin reflect the extent of the Fund's involvement in open futures positions. There are several risks associated with the use of futures contracts as hedging techniques. There can be no assurance that a liquid market will exist at the time when the Fund seeks to close out a futures contract. If no liquid market exists, the Fund would remain obligated to meet margin requirements until the position is closed. Futures contracts may involve a small initial investment relative to the risk assumed, which could result in losses greater than if the Fund did not invest in futures
contracts. Futures contracts may be more volatile than direct investments in the instrument underlying the futures and may not correlate to the underlying instrument, causing a given hedge not to achieve its objectives. The Fund's activities in futures contracts have minimal counterparty risk as they are conducted through regulated exchanges that guarantee the futures against default by the counterparty. In the event of a bankruptcy or insolvency of a futures commission merchant that holds margin on behalf of the Fund, the Fund may not be entitled to the return of the entire margin owed to the Fund, potentially resulting in a loss. The Fund may invest in futures contracts to seek enhanced returns or to reduce the risk of loss by hedging certain of its holdings. The Fund's investment in futures contracts and other derivatives may increase the volatility of the Fund's NAVs and may result in a loss to the Fund. Open futures contracts as of April 30, 2021 are shown in the Portfolio of Investments.
(I) Securities Lending. In order to realize additional income, the Fund may engage in securities lending, subject to the limitations set forth in the 1940 Act and relevant guidance by the staff of the Securities and Exchange Commission (“SEC”). If the Fund engages in securities lending, the Fund will lend through its custodian, JPMorgan Chase Bank, N.A., ("JPMorgan"), acting as securities lending agent on behalf of the Fund. Under the current arrangement, JPMorgan will manage the Fund's collateral in accordance with the securities lending agency agreement between the Fund and JPMorgan, and indemnify the Fund against counterparty risk. The loans will be collateralized by cash (which may be invested in a money market fund) and/or non-cash collateral (which may include U.S. Treasury securities and/or U.S. government agency securities issued or guaranteed by the United States government or its agencies or instrumentalities) at least equal at all times to the market value of the securities loaned. The Fund bears the risk of delay in recovery of, or loss of rights in, the securities loaned. The Fund may also record a realized gain or loss on securities deemed sold due to a borrower’s inability to return securities on loan. The Fund bears the risk of any loss on investment of cash collateral. The Fund will receive compensation for lending its securities in the form of fees or it will retain a portion of interest earned on the investment of any cash collateral. The Fund will also continue to receive interest and dividends on the securities loaned and any gain or loss in the market price of the securities loaned that may occur during the term of the loan will be for the account of the Fund. Income earned from securities lending activities, if any, is reflected in the Statement of Operations. Securities on loan as of April 30, 2021, are shown in the Portfolio of Investments.
Prior to November 23, 2020, these services were provided by State Street Bank and Trust Company (“State Street”).
(J) Securities Risk. The ability of issuers of debt securities held by the Fund to meet their obligations may be affected by, among other things, economic or political developments in a specific country, industry or region. Debt securities are also subject to the risks associated with changes in interest rates.
| 28 | MainStay MacKay S&P 500 Index Fund |
(K) Large Transaction Risks. From time to time, the Fund may receive large purchase or redemption orders from affiliated or unaffiliated mutual funds or other investors. Such large transactions could have adverse effects on the Fund’s performance if the Fund were required to sell securities or invest cash at times when it otherwise would not do so. This activity could also accelerate the realization of capital gains and increase the Fund’s transaction costs. The Fund has adopted procedures designed to mitigate the negative impacts of such large transactions, but there can be no assurance that these procedures will be effective.
(L) Indemnifications. Under the Trust’s organizational documents, its officers and trustees are indemnified against certain liabilities that may arise out of performance of their duties to the Trust. Additionally, in the normal course of business, the Fund enters into contracts with third-party service providers that contain a variety of representations and warranties and that may provide general indemnifications. The Fund's maximum exposure under these arrangements is unknown, as this would involve future claims that may be made against the Fund that have not yet occurred. The Manager believes that the risk of loss in connection with these potential indemnification obligations is remote. However, there can be no assurance that material liabilities related to such obligations will not arise in the future, which could adversely impact the Fund.
(M) Quantitative Disclosure of Derivative Holdings. The following tables show additional disclosures related to the Fund's derivative and hedging activities, including how such activities are accounted for and their effect on the Fund's financial positions, performance and cash flows.
The Fund entered into futures contracts to provide an efficient means of maintaining liquidity while remaining fully invested in the market. These derivatives are not accounted for as hedging instruments.
Fair value of derivative instruments as of April 30, 2021:
| Asset Derivatives | Equity
Contracts
Risk | Total |
| Futures Contracts - Net Assets—Net unrealized appreciation on futures contracts (a) | $1,026,997 | $1,026,997 |
| Total Fair Value | $1,026,997 | $1,026,997 |
| (a) | Includes cumulative appreciation (depreciation) of futures contracts as reported in the Portfolio of Investments. Only current day’s variation margin is reported within the Statement of Assets and Liabilities. |
The effect of derivative instruments on the Statement of Operations for the six-month period ended April 30, 2021:
| Net Realized Gain (Loss) from: | Equity
Contracts
Risk | Total |
| Futures Contracts | $2,373,729 | $2,373,729 |
| Total Net Realized Gain (Loss) | $2,373,729 | $2,373,729 |
| Net Change in Unrealized Appreciation (Depreciation) | Equity
Contracts
Risk | Total |
| Futures Contracts | $1,345,003 | $1,345,003 |
| Total Net Change in Unrealized Appreciation (Depreciation) | $1,345,003 | $1,345,003 |
| Average Notional Amount | Total |
| Futures Contracts Long | $14,156,347 |
Note 3–Fees and Related Party Transactions
(A) Manager and Subadvisor. New York Life Investments, a registered investment adviser and an indirect, wholly-owned subsidiary of New York Life Insurance Company ("New York Life"), serves as the Fund's Manager, pursuant to an Amended and Restated Management Agreement ("Management Agreement"). The Manager provides offices, conducts clerical, recordkeeping and bookkeeping services and keeps most of the financial and accounting records required to be maintained by the Fund. Except for the portion of salaries and expenses that are the responsibility of the Fund, the Manager pays the salaries and expenses of all personnel affiliated with the Fund and certain operational expenses of the Fund. The Fund reimburses New York Life Investments in an amount equal to the portion of the compensation of the Chief Compliance Officer attributable to the Fund. MacKay Shields LLC ("MacKay Shields" or the "Subadvisor"), a registered investment adviser and an indirect, wholly-owned subsidiary of New York Life, serves as Subadvisor to the Fund and is responsible for the day-to-day portfolio management of the Fund. Pursuant to the terms of an Amended and Restated Subadvisory Agreement ("Subadvisory Agreement") between New York Life Investments and MacKay Shields, New York Life Investments pays for the services of the Subadvisor.
Pursuant to the Management Agreement, the Fund pays the Manager a monthly fee for the services performed and the facilities furnished at an annual rate of the Fund’s average daily net assets as follows: 0.16% up to $2.5 billion and 0.15% in excess of $2.5 billion. During the six-month period ended April 30, 2021, the effective management fee rate was 0.16% of the Fund’s average daily net assets, exclusive of any applicable waivers/reimbursements.
New York Life Investments has contractually agreed to waive fees and/or reimburse expenses so that Total Annual Fund Operating Expenses (excluding taxes, interest, litigation, extraordinary expenses, brokerage and other transaction expenses relating to the purchase or sale of portfolio investments, and acquired (underlying) fund fees and expenses) for Class A shares do not exceed 0.60% of the Fund’s average daily net assets. New York Life Investments will apply an equivalent waiver or reimbursement, in an equal number of basis points, to the other share classes of the Fund. This agreement will remain in effect until February 28, 2022, and shall renew automatically for one-year terms unless New York Life Investments provides written notice of termination prior to the start of the next term or upon approval of the Board.
Notes to Financial Statements (Unaudited) (continued)
Additionally, New York Life Investments has agreed to further voluntarily waive fees and/or reimburse expenses of the appropriate class of the Fund so that Total Annual Fund Operating Expenses (excluding taxes, interest, litigation, extraordinary expenses, brokerage and other transaction expenses relating to the purchase and sale of portfolio investments, and acquired (underlying) fund fees and expenses) for Investor Class and SIMPLE Class shares of the Fund do not exceed 0.70% and 0.95%, respectively, of the Fund’s average daily net assets. This voluntary waiver or reimbursement may be discontinued at any time without notice.
During the six-month period ended April 30, 2021, New York Life Investments earned fees from the Fund in the amount of $1,020,751 and waived fees and/or reimbursed expenses in the amount of $43,339 and paid the Subadvisor fees in the amount of $489,102.
JPMorgan provides sub-administration and sub-accounting services to the Fund pursuant to an agreement with New York Life Investments. These services include calculating the daily NAVs of the Fund, maintaining the general ledger and sub-ledger accounts for the calculation of the Fund's NAVs, and assisting New York Life Investments in conducting various aspects of the Fund's administrative operations. For providing these services to the Fund, JPMorgan is compensated by New York Life Investments.
Prior to November 23, 2020, these services were provided by State Street.
Pursuant to an agreement between the Trust and New York Life Investments, New York Life Investments is responsible for providing or procuring certain regulatory reporting services for the Fund. The Fund will reimburse New York Life Investments for the actual costs incurred by New York Life Investments in connection with providing or procuring these services for the Fund.
(B) Distribution and Service Fees. The Trust, on behalf of the Fund, has entered into a distribution agreement with NYLIFE Distributors LLC (the “Distributor”), an affiliate of New York Life Investments. The Fund has adopted distribution plans (the “Plans”) in accordance with the provisions of Rule 12b-1 under the 1940 Act.
Pursuant to the Class A and Investor Class Plans, the Distributor receives a monthly distribution fee from the Class A and Investor Class shares at an annual rate of 0.25% of the average daily net assets of the Class A and Investor Class shares for distribution and/or service activities as designated by the Distributor. Pursuant to the SIMPLE Class Plan, SIMPLE Class shares pay the Distributor a monthly fee at an annual rate of 0.25% of the average daily net assets of the SIMPLE Class shares, along with a service fee at an annual rate of 0.25% of the average daily net assets of the SIMPLE Class shares, for a total 12b-1 fee of 0.50%. Class I shares are not subject to a distribution and/or service fee.
The Plans provide that the distribution and service fees are payable to the Distributor regardless of the amounts actually expended by the Distributor for distribution of the Fund's shares and service activities.
(C) Sales Charges. The Fund was advised by the Distributor that the amount of initial sales charges retained on sales of Class A and Investor Class shares during the six-month period ended April 30, 2021, were $71,058 and $10,135, respectively.
The Fund was also advised that the Distributor retained CDSCs on redemptions of Class A shares during the six-month period ended April 30, 2021, of $4,189.
(D) Transfer, Dividend Disbursing and Shareholder Servicing Agent. NYLIM Service Company LLC, an affiliate of New York Life Investments, is the Fund's transfer, dividend disbursing and shareholder servicing agent pursuant to an agreement between NYLIM Service Company LLC and the Trust. NYLIM Service Company LLC has entered into an agreement with DST Asset Manager Solutions, Inc. ("DST"), pursuant to which DST performs certain transfer agent services on behalf of NYLIM Service Company LLC. New York Life Investments has contractually agreed to limit the transfer agency expenses charged to the Fund’s share classes to a maximum of 0.35% of that share class’s average daily net assets on an annual basis after deducting any applicable Fund or class-level expense reimbursement or small account fees. This agreement will remain in effect until February 28, 2022, and shall renew automatically for one-year terms unless New York Life Investments provides written notice of termination prior to the start of the next term or upon approval of the Board. During the six-month period ended April 30, 2021, transfer agent expenses incurred by the Fund and any reimbursements, pursuant to the aforementioned Transfer Agency expense limitation agreement, were as follows:
| Class | Expense | Waived |
| Class A | $209,036 | $— |
| Investor Class | 118,821 | — |
| Class I | 152,952 | — |
| SIMPLE Class | 54 | — |
(E) Small Account Fee. Shareholders with small accounts adversely impact the cost of providing transfer agency services. In an effort to reduce total transfer agency expenses, the Fund has implemented a small account fee on certain types of accounts. As described in the Fund's prospectus, certain shareholders with an account balance of less than $1,000 ($5,000 for Class A share accounts) are charged an annual per account fee of $20 (assessed semi-annually), the proceeds from which offset transfer agent fees as reflected in the Statement of Operations. This small account fee will not apply to certain types of accounts as described further in the Fund’s prospectus.
| 30 | MainStay MacKay S&P 500 Index Fund |
(F) Investments in Affiliates (in 000’s). During the six-month period ended April 30, 2021, purchases and sales transactions, income earned from investments and shares held of investment companies managed by New York Life Investments or its affiliates were as follows:
| Affiliated Investment Companies | Value,
Beginning
of Period | Purchases
at Cost | Proceeds
from
Sales | Net
Realized
Gain/(Loss)
on Sales | Change in
Unrealized
Appreciation/
(Depreciation) | Value,
End of
Period | Dividend
Income | Other
Distributions | Shares
End of
Period |
| MainStay U.S. Government Liquidity Fund | $ 3,588 | $ 54,971 | $ (58,052) | $ — | $ — | $ 507 | $ —(a) | $ — | 507 |
(G) Capital. As of April 30, 2021, New York Life and its affiliates beneficially held shares of the Fund with the values and percentages of net assets as follows:
| Class I | $7,296,833 | 1.3% |
| SIMPLE Class | 29,973 | 100.0 |
Note 4-Federal Income Tax
As of April 30, 2021, the cost and unrealized appreciation (depreciation) of the Fund’s investment portfolio, including applicable derivative contracts and other financial instruments, as determined on a federal income tax basis, were as follows:
| | Federal Tax
Cost | Gross
Unrealized
Appreciation | Gross
Unrealized
(Depreciation) | Net
Unrealized
Appreciation/
(Depreciation) |
| Investments | $385,796,386 | $1,018,710,262 | $(3,593,792) | $1,015,116,470 |
During the year ended October 31, 2020, the tax character of distributions paid as reflected in the Statements of Changes in Net Assets was as follows:
| | 2020 |
| Distributions paid from: | |
| Ordinary Income | $ 19,445,300 |
| Long-Term Capital Gains | 140,001,583 |
| Total | $159,446,883 |
Note 5–Custodian
JPMorgan is the custodian of cash and securities held by the Fund. Custodial fees are charged to the Fund based on the Fund's net assets and/or the market value of securities held by the Fund and the number of certain transactions incurred by the Fund.
Prior to November 23, 2020, these services were provided by State Street. The services provided by State Street were a direct expense of the Fund and are included in the Statement of Operations as Custodian fees which totaled $2,552 for the period November 1, 2020 through November 22, 2020.
Note 6–Line of Credit
The Fund and certain other funds managed by New York Life Investments maintain a line of credit with a syndicate of banks in order to secure a source of funds for temporary purposes to meet unanticipated or excessive redemption requests.
Effective July 28, 2020, under the credit agreement (the “Credit Agreement”), the aggregate commitment amount is $600,000,000 with an additional uncommitted amount of $100,000,000. The commitment fee is an annual rate of 0.15% of the average commitment amount payable quarterly, regardless of usage, to JPMorgan, who serves as the agent to the syndicate. The commitment fee is allocated among the Fund and certain other funds managed by New York Life Investments based upon their respective net assets and other factors. Interest on any revolving credit loan is charged based upon the Federal Funds Rate or the one-month London Interbank Offered Rate (“LIBOR”), whichever is higher. The Credit Agreement expires on July 27, 2021, although the Fund, certain other funds managed by New York Life Investments and the syndicate of banks may renew the Credit Agreement for an additional year on the same or different terms or enter into a credit agreement with a different syndicate of banks. Prior to July 28, 2020, the aggregate commitment amount and the commitment fee were the same as those under the current Credit Agreement, but State Street served as agent to the syndicate. During the six-month period ended April 30, 2021, there were no borrowings made or outstanding with respect to the Fund under the Credit Agreement or the credit agreement for which State Street served as agent.
Note 7–Interfund Lending Program
Pursuant to an exemptive order issued by the SEC, the Fund, along with certain other funds managed by New York Life Investments, may participate in an interfund lending program. The interfund lending program provides an alternative credit facility that permits the Fund and certain other funds managed by New York Life Investments to lend or borrow money for temporary purposes directly to or from one another, subject to the conditions of the exemptive order. During the six-month period ended April 30, 2021, there were no interfund loans made or outstanding with respect to the Fund.
Notes to Financial Statements (Unaudited) (continued)
Note 8–Purchases and Sales of Securities (in 000’s)
During the six-month period ended April 30, 2021, purchases and sales of securities, other than short-term securities, were $48,423 and $72,981, respectively.
Note 9–Capital Share Transactions
Transactions in capital shares for the six-month period ended April 30, 2021 and the year ended October 31, 2020, were as follows:
| Class A | Shares | Amount |
| Period ended April 30, 2021: | | |
| Shares sold | 1,208,259 | $ 60,601,813 |
| Shares issued to shareholders in reinvestment of distributions | 1,163,874 | 54,969,783 |
| Shares redeemed | (1,146,924) | (56,811,194) |
| Net increase (decrease) in shares outstanding before conversion | 1,225,209 | 58,760,402 |
| Shares converted into Class A (See Note 1) | 236,828 | 11,598,619 |
| Shares converted from Class A (See Note 1) | (654) | (33,352) |
| Net increase (decrease) | 1,461,383 | $ 70,325,669 |
| Year ended October 31, 2020: | | |
| Shares sold | 2,324,681 | $ 99,157,653 |
| Shares issued to shareholders in reinvestment of distributions | 2,011,976 | 86,132,703 |
| Shares redeemed | (2,829,898) | (120,164,291) |
| Net increase (decrease) in shares outstanding before conversion | 1,506,759 | 65,126,065 |
| Shares converted into Class A (See Note 1) | 363,219 | 16,153,296 |
| Shares converted from Class A (See Note 1) | (16,104) | (654,326) |
| Net increase (decrease) | 1,853,874 | $ 80,625,035 |
| |
| Investor Class | Shares | Amount |
| Period ended April 30, 2021: | | |
| Shares sold | 130,581 | $ 6,559,592 |
| Shares issued to shareholders in reinvestment of distributions | 108,660 | 5,122,224 |
| Shares redeemed | (73,811) | (3,674,982) |
| Net increase (decrease) in shares outstanding before conversion | 165,430 | 8,006,834 |
| Shares converted into Investor Class (See Note 1) | 655 | 33,352 |
| Shares converted from Investor Class (See Note 1) | (237,329) | (11,598,619) |
| Net increase (decrease) | (71,244) | $ (3,558,433) |
| Year ended October 31, 2020: | | |
| Shares sold | 467,524 | $ 19,715,548 |
| Shares issued to shareholders in reinvestment of distributions | 201,967 | 8,630,158 |
| Shares redeemed | (201,322) | (8,582,450) |
| Net increase (decrease) in shares outstanding before conversion | 468,169 | 19,763,256 |
| Shares converted into Investor Class (See Note 1) | 10,855 | 432,724 |
| Shares converted from Investor Class (See Note 1) | (364,103) | (16,153,296) |
| Net increase (decrease) | 114,921 | $ 4,042,684 |
| |
| Class I | Shares | Amount |
| Period ended April 30, 2021: | | |
| Shares sold | 1,198,873 | $ 60,948,928 |
| Shares issued to shareholders in reinvestment of distributions | 853,614 | 41,033,248 |
| Shares redeemed | (1,422,840) | (74,012,371) |
| Net increase (decrease) | 629,647 | $ 27,969,805 |
| Year ended October 31, 2020: | | |
| Shares sold | 4,290,457 | $ 177,573,865 |
| Shares issued to shareholders in reinvestment of distributions | 1,440,725 | 62,671,522 |
| Shares redeemed | (4,319,173) | (193,144,068) |
| Net increase (decrease) in shares outstanding before conversion | 1,412,009 | 47,101,319 |
| Shares converted into Class I (See Note 1) | 5,187 | 221,602 |
| Net increase (decrease) | 1,417,196 | $ 47,322,921 |
| |
| SIMPLE Class | Shares | Amount |
| Period ended April 30, 2021: | | |
| Shares issued to shareholders in reinvestment of distributions | 42 | $ 1,983 |
| Net increase (decrease) | 42 | $ 1,983 |
| Period ended October 31, 2020: | | |
| Shares sold | 512 | $ 25,000 |
| Net increase (decrease) | 512 | $ 25,000 |
| 32 | MainStay MacKay S&P 500 Index Fund |
Note 10-Litigation
The Fund has been named as a defendant in the case entitled Kirschner v. FitzSimons, No. 12-2652 (S.D.N.Y.) (the “FitzSimons action”) as a result of its ownership of shares in the Tribune Company (“Tribune”) in 2007 when Tribune effected a leveraged buyout transaction (“LBO”) by which Tribune converted to a privately-held company. In its complaint, the plaintiff asserts claims against certain insiders, shareholders, professional advisers, and others involved in the LBO.
Separately, the complaint also seeks to obtain from former Tribune shareholders, including the Fund, any proceeds they received in connection with the LBO. The sole claim and cause of action brought against the Fund is for fraudulent conveyance pursuant to United States Bankruptcy Code Section 548(a)(1)(A).
In June 2011, certain Tribune creditors filed numerous additional actions asserting state law constructive fraudulent conveyance claims (the “SLCFC actions”) against specifically-named former Tribune shareholders and, in some cases, putative defendant classes comprised of former Tribune shareholders. One of the SLCFC actions, entitled Deutsche Bank Trust Co. Americas v. Blackrock Institutional Trust Co., No. 11-9319 (S.D.N.Y.) (the “Deutsche Bank action”), named the Fund as a defendant.
The FitzSimons action and Deutsche Bank action have been consolidated with the majority of the other Tribune LBO-related lawsuits in a multidistrict litigation proceeding entitled In re Tribune Co. Fraudulent Conveyance Litig., No. 11-md-2296 (S.D.N.Y.) (the “MDL Proceeding”).
On September 23, 2013, the District Court granted the defendants’ motion to dismiss the SLCFC actions, including the Deutsche Bank action, on the basis that the plaintiffs did not have standing to pursue their claims. On September 30, 2013, the plaintiffs in the SLCFC actions filed a notice of appeal to the United States Court of Appeals for the Second Circuit. On October 28, 2013, the defendants filed a joint notice of cross-appeal of that same order. On November 5, 2014, the Second Circuit Court of Appeals held an oral argument on appeal. On March 29, 2016, the United States Court of Appeals for the Second Circuit issued its opinion on the appeal of the SLCFC actions. The appeals court affirmed the District Court’s dismissal of those lawsuits, but on different grounds than the District Court. The appeals court held that while the plaintiffs have standing under the U.S. Bankruptcy Code, their claims were pre-empted by Section 546(e) of the Bankruptcy Code—the statutory safe harbor for settlement payments. On April 12, 2016, the plaintiffs in the SLCFC actions filed a petition seeking rehearing en banc before the appeals court. On July 22, 2016, the appeals court denied the petition. On September 9, 2016, the plaintiffs filed a petition for writ of certiorari in the U.S. Supreme Court challenging the Second Circuit’s decision that the safe harbor of Section 546(e) applied to their claims. Certain shareholder defendants filed a joint brief in opposition to the petition for certiorari on October 24, 2016. The plaintiffs filed a reply in support of the petition on November 4, 2016. On April 3, 2018, Justice Kennedy and Justice Thomas issued a “Statement” related to the petition for certiorari suggesting that the Second Circuit and/or District Court may want to take
steps to reexamine the application of the Section 546(e) safe harbor to the previously dismissed state law constructive fraudulent transfer claims based on the Supreme Court’s decision in Merit Management Group LP v. FTI Consulting, Inc. On April 10, 2018, the plaintiffs filed in the Second Circuit a motion for that court to recall its mandate, vacate its prior decision, and remand to the District Court for further proceedings consistent with Merit Management. On April 20, 2018, the shareholder defendants filed a response to the plaintiffs’ motion to recall the mandate. On May 15, 2018, the Second Circuit issued an order recalling the mandate “in anticipation of further panel review.” On December 19, 2019, the Second Circuit issued an amended opinion that again affirmed the district court’s ruling on the basis that plaintiffs’ claims were preempted by Section 546(e) of the Bankruptcy Code. Plaintiffs filed a motion for rehearing and rehearing en banc on January 2, 2020, which was denied on February 6, 2020. Plaintiffs filed a new petition for certiorari with the Supreme Court on July 6, 2020. In that petition, plaintiffs stated that “[t]o make it more likely that there will be a quorum for this petition,” they have “abandon[ed] the case and let the judgment below stand” with respect to certain defendants. That list did not include the Fund. Defendants filed an opposition to the certiorari petition on August 26, 2020. Plaintiffs filed a reply in support of the petition for certiorari on September 8, 2020. On March 12, 2021, the Solicitor General filed an amicus brief recommending that certiorari be denied. Plaintiffs filed a supplemental brief in response to the Solicitor General’s amicus brief on March 31, 2021, and Defendants filed a supplemental brief on April 1, 2021. The Supreme Court denied the petition for certiorari on April 19, 2021.
On August 2, 2013, the plaintiff in the FitzSimons action filed a Fifth Amended Complaint. On May 23, 2014, the defendants filed motions to dismiss the FitzSimons action, including a global motion to dismiss Count I, which is the claim brought against former Tribune shareholders for intentional fraudulent conveyance under U.S. federal law. On January 6, 2017, the United States District Court for the Southern District of New York granted the shareholder defendants’ motion to dismiss the intentional fraudulent conveyance claim in the FitzSimons action. In dismissing the intentional fraudulent conveyance claim, the Court denied the plaintiff’s request to amend the complaint. The Court’s order is not immediately appealable, but the plaintiff has asked the Court to direct entry of a final judgment in order to make the order immediately appealable. On February 23, 2017, the Court issued an order stating that it intends to permit an interlocutory appeal of the dismissal order, but will wait to do so until it has resolved outstanding motions to dismiss filed by other defendants.
On July 18, 2017, the plaintiff submitted a letter to the District Court seeking leave to amend its complaint to add a constructive fraudulent transfer claim. The shareholder defendants opposed that request.
On August 24, 2017, the Court denied the plaintiff’s request without prejudice to renewal of the request in the event of an intervening change in the law. On March 8, 2018, the plaintiff renewed his request for leave to file a motion to amend the complaint to assert a constructive fraudulent transfer claim based on the Supreme Court’s ruling in Merit
Notes to Financial Statements (Unaudited) (continued)
Management. The shareholder defendants opposed that request. On June 18, 2018, the District Court ordered that the request would be stayed pending further action by the Second Circuit in the still-pending appeal, discussed above. On December 18, 2018, the plaintiff filed a letter with the District Court requesting that the stay be dissolved in order to permit briefing on the motion to amend the complaint and indicating the plaintiff’s intention to file another motion to amend the complaint to reinstate claims for intentional fraudulent transfer. The shareholder defendants opposed that request. On January 14, 2019, the Court held a case management conference, during which the Court stated that it would not lift the stay prior to further action from the Second Circuit. The Court stated that it would allow the plaintiff to file a motion to amend to try to reinstate its intentional fraudulent transfer claim. On January 23, 2019, the Court ordered the parties still facing pending claims to participate in a mediation. On March 27, 2019, the Court held a telephone conference and decided to allow the plaintiff to file a motion for leave to amend. On April 4, 2019, the plaintiff filed a motion to amend the Fifth Amended Complaint to assert a federal constructive fraudulent transfer claim against certain shareholder defendants. On April 10, 2019, the shareholder defendants filed a brief in opposition to the plaintiff’s motion to amend. On April 12, 2019, the plaintiff filed a reply brief. The Court denied leave to amend the complaint on April 23, 2019. On June 13, 2019, the Court entered judgment pursuant to Rule 54(b), which would permit an appeal of the Court’s dismissal of the claim against the share-holder defendants. On July 15, 2019, the Trustee filed a notice of appeal to the Second Circuit. Appellant filed his brief on January 7, 2020. The shareholder defendants filed an opposition brief on April 27, 2020, and Appellant filed a reply brief on May 18, 2020. The Court held oral argument on August 24, 2020. In addition, the District Court has entered two bar orders in connection with the plaintiff’s settlement with certain non-shareholder defendants. The orders bar claims against the settling defendants, but contain a judgment reduction provision that preserves the value of any potential claim by a shareholder defendant against a settling defendant. Specifically, the judgment reduction provision reduces the amount of money recoverable against a shareholder defendant to the extent the shareholder defendant could have recovered on a claim against a settling defendant.
The value of the proceeds received by the Fund in connection with the LBO and the Fund's cost basis in shares of Tribune was as follows:
| Fund | Proceeds | Cost Basis |
| MainStay MacKay S&P 500 Index Fund* | $1,025,100 | $907,116 |
| * | Inclusive of payments received into MainStay Equity Index Fund prior to its acquisition by the Fund. |
At this stage of the proceedings, it would be difficult to assess with any reasonable certainty the probable outcome of the pending litigation or the effect, if any, on the Fund's net asset value.
Note 11–Recent Accounting Pronouncement
In March 2020, the Financial Accounting Standards Board issued Accounting Standards Update 2020-04 (“ASU 2020-04”), which provides optional guidance to ease the potential accounting burden associated with transitioning away from LIBOR and other reference rates that are expected to be discontinued. ASU 2020-04 was effective immediately upon release of the update on March 12, 2020 and remains effective through December 31, 2022. At this time, the Manager is evaluating the implications of certain other provisions of ASU 2020-04 related to new disclosure requirements and any impact on the financial statement disclosures has not yet been determined.
Note 12–Other Matters
An outbreak of COVID-19, first detected in December 2019, has developed into a global pandemic and has resulted in travel restrictions, closure of international borders, certain businesses and securities markets, restrictions on securities trading activities, prolonged quarantines, supply chain disruptions, and lower consumer demand, as well as general concern and uncertainty. The continued impact of COVID-19 is uncertain and could further adversely affect the global economy, national economies, individual issuers and capital markets in unforeseeable ways and result in a substantial and extended economic downturn. Developments that disrupt global economies and financial markets, such as COVID-19, may magnify factors that affect the Fund's performance.
Note 13–Subsequent Events
In connection with the preparation of the financial statements of the Fund as of and for the six-month period ended April 30, 2021, events and transactions subsequent to April 30, 2021, through the date the financial statements were issued have been evaluated by the Manager for possible adjustment and/or disclosure. No subsequent events requiring financial statement adjustment or disclosure have been identified.
| 34 | MainStay MacKay S&P 500 Index Fund |
Board Consideration and Approval of Management Agreement and Subadvisory Agreement (Unaudited)
The continuation of the Management Agreement with respect to the MainStay MacKay S&P 500 Index Fund (“Fund”) and New York Life Investment Management LLC (“New York Life Investments”) and the Subadvisory Agreement between New York Life Investments and MacKay Shields LLC (“MacKay”) with respect to the Fund (together, “Advisory Agreements”), following an initial term of up to two years, is subject to annual review and approval by the Board of Trustees of MainStay Funds Trust (“Board” of the “Trust”) in accordance with Section 15 of the Investment Company Act of 1940, as amended (“1940 Act”). At its December 9–10, 2020 meeting, the Board, including the Trustees who are not an “interested person” (as such term is defined in the 1940 Act) of the Trust (“Independent Trustees”) voting separately, unanimously approved the continuation of each of the Advisory Agreements for a one-year period.
In reaching the decision to approve the continuation of each of the Advisory Agreements, the Board considered information furnished by New York Life Investments and MacKay in connection with an annual contract review process undertaken by the Board that took place at meetings of the Board and its Contracts Committee during September 2020 through December 2020, as well as other information furnished to the Board and its Committees throughout the year, as deemed relevant by the Trustees. Information requested by and furnished to the Board for consideration in connection with the contract review process included, among other items, reports on the Fund and “peer funds” prepared by Strategic Insight Mutual Fund Research and Consulting, LLC (“Strategic Insight”), an independent third-party service provider engaged by the Board to report objectively on the Fund’s investment performance, management fee and total expenses. The Board also considered information on the fees charged to other investment advisory clients of New York Life Investments and/or MacKay that follow investment strategies similar to those of the Fund, if any, and, when applicable, the rationale for any differences in the Fund’s management and subadvisory fees and the fees charged to those other investment advisory clients. In addition, the Board considered information furnished by New York Life Investments and MacKay in response to requests prepared on behalf of the Board, and in consultation with the Independent Trustees, by independent legal counsel to the Independent Trustees, which encompassed a variety of topics, including those summarized below.
The Board took into account information provided in connection with its meetings throughout the year, including, among other items, information regarding the legal standards and fiduciary obligations applicable to its consideration of the continuation of each of the Advisory Agreements and investment performance reports on the Fund as well as presentations from New York Life Investments and MacKay personnel. The Board also took into account other information received from New York Life Investments throughout the year, including, among other items, periodic reports on legal and compliance matters, risk management, portfolio turnover, brokerage commissions and non-advisory services provided to the Fund by New York Life Investments. The contract review process, including the structure and format for materials provided to the Board, has been developed in consultation with the Board. The Independent
Trustees also met in executive sessions with their independent legal counsel and, for a portion thereof, with senior management of New York Life Investments.
In addition to information provided to the Board throughout the year, the Board received information in connection with its June 2020 meeting provided specifically in response to requests prepared on behalf of the Board, and in consultation with the Independent Trustees, by independent legal counsel regarding the Fund’s distribution arrangements. In addition, the Board received information regarding the Fund’s asset levels, share purchase and redemption activity and the payment of Rule 12b-1 and/or other fees by applicable share classes of the Fund, among other information.
In considering the continuation of each of the Advisory Agreements, the Trustees reviewed and evaluated the information and factors they believed to reasonably be necessary and appropriate in light of legal advice furnished to them by independent legal counsel and through the exercise of their own business judgment. Although individual Trustees may have weighed certain factors or information differently, the factors considered by the Board are described in greater detail below and include, among other factors: (i) the nature, extent and quality of the services provided to the Fund by New York Life Investments and MacKay; (ii) the qualifications of the portfolio managers of the Fund and the historical investment performance of the Fund, New York Life Investments and MacKay; (iii) the costs of the services provided, and profits realized, by New York Life Investments and MacKay from their relationships with the Fund; (iv) the extent to which economies of scale have been realized or may be realized as the Fund grows and the extent to which economies of scale have benefited or may benefit the Fund’s shareholders; and (v) the reasonableness of the Fund’s management and subadvisory fees and total ordinary operating expenses. Although the Board recognized that comparisons between the Fund’s fees and expenses and those of other funds are imprecise given different terms of agreements, variations in fund strategies and other factors, the Board considered the reasonableness of the Fund’s management fee and total ordinary operating expenses as compared to the peer funds identified by Strategic Insight. Throughout their considerations, the Trustees acknowledged the commitment of New York Life Investments and its affiliates to serve the MainStay Group of Funds, as well as their capacity, experience, resources, financial stability and reputations. The Trustees also acknowledged the entrepreneurial and other risks assumed by New York Life Investments in sponsoring and managing the Fund.
The Trustees noted that, throughout the year, the Trustees are afforded an opportunity to ask questions of, and request additional information or materials from, New York Life Investments and MacKay. The Board’s decision with respect to each of the Advisory Agreements may have also been based, in part, on the Board’s knowledge of New York Life Investments and MacKay resulting from, among other things, the Board’s consideration of each of the Advisory Agreements in prior years, the advisory agreements for other funds in the MainStay Group of Funds, the Board’s review throughout the year of the performance and operations of other funds in the MainStay Group of Funds and each Trustee’s business
Board Consideration and Approval of Management Agreement and Subadvisory Agreement (Unaudited) (continued)
judgment and industry experience. In addition to considering the above-referenced factors, the Board observed that in the marketplace there are a range of investment options available to the Fund’s shareholders and such shareholders, having had the opportunity to consider other investment options, have chosen to invest in the Fund.
The factors that figured prominently in the Board’s decision to approve the continuation of each of the Advisory Agreements during its December 9–10, 2020 meeting are summarized in more detail below, and the Board did not consider any factor or information controlling in reaching such decision.
Nature, Extent and Quality of Services Provided by New York Life Investments and MacKay
The Board examined the nature, extent and quality of the services that New York Life Investments provides to the Fund. The Board evaluated New York Life Investments’ experience and capabilities in serving as manager of the Fund and considered that the Fund operates in a “manager-of-managers” structure. The Board also considered New York Life Investments’ responsibilities and services provided pursuant to this structure, including evaluating the performance of MacKay, making recommendations to the Board as to whether the Subadvisory Agreement should be renewed, modified or terminated and periodically reporting to the Board regarding the results of New York Life Investments’ evaluation and monitoring functions. The Board noted that New York Life Investments manages other mutual funds, serves a variety of other investment advisory clients, including other pooled investment vehicles, and has experience overseeing mutual fund service providers, including subadvisors. The Board considered the experience of senior personnel at New York Life Investments providing management and administrative and other non-advisory services to the Fund as well as New York Life Investments’ reputation and financial condition. The Board observed that New York Life Investments devotes significant resources and time to providing management and non-advisory services to the Fund, including New York Life Investments’ supervision and due diligence reviews of MacKay and ongoing analysis of, and interactions with, MacKay with respect to, among other things, the Fund’s investment performance and risks as well as MacKay’s investment capabilities and subadvisory services with respect to the Fund.
The Board also considered the range of services that New York Life Investments provides to the Fund under the terms of the Management Agreement, including: (i) fund accounting and ongoing supervisory services provided by New York Life Investments’ Fund Administration and Accounting Group; (ii) investment supervisory and analytical services provided by New York Life Investments’ Investment Consulting Group; (iii) compliance services provided by the Trust’s Chief Compliance Officer as well as New York Life Investments’ compliance department, including supervision and implementation of the Fund’s compliance program; (iv) legal services provided by New York Life Investments’ Office of the General Counsel; and (v) risk management monitoring and analysis by compliance and investment personnel. The Board noted that New York Life Investments provides certain other non-advisory services to the Fund.
In addition, the Board considered New York Life Investments’ willingness to invest in personnel, infrastructure, technology, operational enhancements, cyber security, information security, shareholder privacy resources and business continuity planning designed to benefit the Fund and noted that New York Life Investments is responsible for compensating the Trust’s officers, except for a portion of the salary of the Trust’s Chief Compliance Officer. The Board recognized that New York Life Investments has provided an increasingly broad array of non-advisory services to the MainStay Group of Funds as a result of regulatory and other developments, including in connection with the designation of New York Life Investments as the administrator of the MainStay Group of Funds’ liquidity risk management program adopted under the 1940 Act. The Board considered benefits to shareholders from being part of the MainStay Group of Funds, including the privilege of exchanging investments between the same class of shares of funds in the MainStay Group of Funds, including without the imposition of a sales charge (if any).
The Board also examined the nature, extent and quality of the investment advisory services that MacKay provides to the Fund and considered the terms of each of the Advisory Agreements. The Board evaluated MacKay’s experience in serving as subadvisor to the Fund and advising other portfolios and MacKay’s track record and experience in providing investment advisory services, the experience of investment advisory, senior management and administrative personnel at MacKay and New York Life Investments’ and MacKay’s overall resources, legal and compliance environment, capabilities and history. In addition to information provided in connection with quarterly meetings with the Trust’s Chief Compliance Officer, the Board considered information regarding the compliance policies and procedures of New York Life Investments and MacKay and acknowledged their commitment to further developing and strengthening compliance programs relating to the Fund. The Board reviewed MacKay’s ability to attract and retain qualified investment professionals and willingness to invest in personnel to service and support the Fund. In this regard, the Board considered the experience of the Fund’s portfolio managers, the number of accounts managed by the portfolio managers and the method for compensating the portfolio managers.
In addition, the Board considered discussions with New York Life Investments regarding the implementation of its business continuity plans and recognized steps taken by New York Life Investments and MacKay to continue to provide the same nature, extent and quality of services to the Fund during the COVID-19 pandemic.
Based on these considerations, the Board concluded that the Fund would likely continue to benefit from the nature, extent and quality of these services.
Investment Performance
In evaluating the Fund’s investment performance, the Board considered investment performance results over various periods in light of the Fund’s investment objective, strategies and risks. The Board considered
| 36 | MainStay MacKay S&P 500 Index Fund |
investment reports on, and analysis of, the Fund’s performance provided to the Board throughout the year. These reports include, among other items, information on the Fund’s gross and net returns, the Fund’s investment performance compared to relevant investment categories and the Fund’s benchmark, the Fund’s risk-adjusted investment performance and the Fund’s investment performance as compared to peer funds, as appropriate, as well as portfolio attribution information and commentary on the effect of market conditions. The Board also considered information provided by Strategic Insight showing the investment performance of the Fund as compared to peer funds.
The Board also gave weight to its discussions with senior management at New York Life Investments concerning the Fund’s investment performance attributable to MacKay as well as discussions between the Fund’s portfolio managers and the members of the Board’s Investment Committee, which generally occur on an annual basis. In addition, the Board considered any specific actions that New York Life Investments or MacKay had taken, or had agreed to take, to seek to enhance Fund investment performance and the results of those actions.
Based on these considerations, the Board concluded that its review of the Fund’s investment performance and related information supported a determination to approve the continuation of each of the Advisory Agreements.
Costs of the Services Provided, and Profits Realized, by New York Life Investments and MacKay
The Board considered the costs of the services provided under each of the Advisory Agreements. The Board also considered the profits realized by New York Life Investments and its affiliates, including MacKay, due to their relationships with the Fund. Because MacKay is an affiliate of New York Life Investments whose subadvisory fee is paid by New York Life Investments, not the Fund, the Board considered cost and profitability information for New York Life Investments and MacKay in the aggregate.
In addition, the Board acknowledged the difficulty in obtaining reliable comparative data about mutual fund managers’ profitability because such information generally is not publicly available and may be impacted by numerous factors, including the structure of a fund manager’s organization, the types of funds it manages, the methodology used to allocate certain fixed costs to specific funds and the manager’s capital structure and costs of capital.
In evaluating the costs of the services provided by New York Life Investments and MacKay and profits realized by New York Life Investments and its affiliates, including MacKay, the Board considered, among other factors, each party’s continuing investments in, or willingness to invest in, personnel, systems, equipment and other resources and infrastructure to support and further enhance the management of the Fund, and that New York Life Investments is responsible for paying the subadvisory fee for the Fund. The Board also considered the financial resources of New York Life Investments and MacKay and acknowledged that New York Life Investments and MacKay must be in a position to attract and retain experienced professional
personnel and to maintain a strong financial position for New York Life Investments and MacKay to continue to provide high-quality services to the Fund. The Board recognized that the Fund benefits from the allocation of certain fixed costs among the funds in the MainStay Group of Funds, among other expected benefits resulting from its relationship with New York Life Investments.
The Board considered information regarding New York Life Investments’ methodology for calculating profitability and allocating costs provided by New York Life Investments in connection with the fund profitability analysis presented to the Board. The Board previously engaged an independent consultant to review the methods used to allocate costs among the funds in the MainStay Group of Funds. The Board noted that the independent consultant had concluded that New York Life Investments’ methods for allocating costs and procedures for estimating overall profitability of the relationship with the funds in the MainStay Group of Funds are reasonable and that New York Life Investments continued to use the same method of calculating profit and allocating costs since the independent consultant’s review. The Board recognized the difficulty in calculating and evaluating a manager’s profitability with respect to the Fund and noted that other profitability methodologies may also be reasonable.
The Board also considered certain fall-out benefits that may be realized by New York Life Investments and its affiliates due to their relationships with the Fund, including reputational and other indirect benefits. The Board recognized, for example, the benefits to MacKay from legally permitted “soft-dollar” arrangements by which brokers provide research and other services to MacKay in exchange for commissions paid by the Fund with respect to trades on the Fund’s portfolio securities. In addition, the Board considered its review of a money market fund advised by New York Life Investments and an affiliated subadvisor that serves as an investment option for the Fund, including the potential rationale for and costs associated with investments in this money market fund by the Fund, if any, and considered information from New York Life Investments that the nature and type of specific investment advisory services provided to this money market fund are distinct from, or in addition to, the investment advisory services provided to the Fund.
The Board observed that, in addition to fees earned by New York Life Investments for managing the Fund, New York Life Investments’ affiliates also earn revenues from serving the Fund in various other capacities, including as the Fund’s transfer agent and distributor. The Board considered information about these other revenues and their impact on the profitability of the relationship with the Fund to New York Life Investments and its affiliates. The Board noted that, although it assessed the overall profitability of the Fund to New York Life Investments and its affiliates as part of the contract review process, when considering the reasonableness of the fee paid to New York Life Investments and its affiliates under each of the Advisory Agreements, the Board considered the profitability of New York Life Investments’ relationship with the Fund on a pre-tax basis and without regard to distribution expenses incurred by New York Life Investments from its own resources.
Board Consideration and Approval of Management Agreement and Subadvisory Agreement (Unaudited) (continued)
After evaluating the information deemed relevant by the Trustees, the Board concluded that any profits realized by New York Life Investments and its affiliates, including MacKay, due to their relationships with the Fund were not excessive.
Management and Subadvisory Fees and Total Ordinary Operating Expenses
The Board evaluated the reasonableness of the fee paid under each of the Advisory Agreements and the Fund’s total ordinary operating expenses. The Board primarily considered the reasonableness of the management fee paid by the Fund to New York Life Investments, because the subadvisory fee paid to MacKay is paid by New York Life Investments, not the Fund. The Board also considered the reasonableness of the subadvisory fee paid by New York Life Investments and the amount of the management fee retained by New York Life Investments.
In assessing the reasonableness of the Fund’s fees and expenses, the Board primarily considered comparative data provided by Strategic Insight on the fees and expenses charged by similar mutual funds managed by other investment advisers. In addition, the Board considered information provided by New York Life Investments and MacKay on fees charged to other investment advisory clients, including institutional separate accounts and/or other funds that follow investment strategies similar to those of the Fund, if any. The Board considered the similarities and differences in the contractual management fee schedules of the Fund and these similarly-managed accounts and/or funds, taking into account the rationale for any differences in fee schedules. The Board also took into account explanations provided by New York Life Investments about the more extensive scope of services provided to registered investment companies, such as the Fund, as compared with other investment advisory clients. Additionally, the Board considered the impact of contractual breakpoints, voluntary waivers and expense limitation arrangements on the Fund’s net management fee and expenses. The Board also considered that in proposing fees for the Fund, New York Life Investments considers the competitive marketplace for mutual funds.
The Board noted that, outside of the Fund’s management fee and the fees charged under a share class’s Rule 12b-1 and/or shareholder services plans, a share class’s most significant “other expenses” are transfer agent fees. Transfer agent fees are charged to the Fund based on the number of shareholder accounts (a “per-account” fee). The Board took into account information from New York Life Investments regarding the reasonableness of the Fund’s transfer agent fee schedule, including industry data demonstrating that the per-account fees that NYLIM Service Company LLC, an affiliate of New York Life Investments and the Fund’s transfer agent, charges the Fund are within the range of per-account fees charged by transfer agents to other mutual funds. In addition, the Board considered NYLIM Service Company LLC’s profitability in connection with the transfer agent services it provides to the Fund. The Board also took into account information received from NYLIM Service Company LLC regarding the sub-transfer agency payments it made to intermediaries in connection with the provision of sub-transfer agency services to the Fund.
The Board considered that, because the Fund’s transfer agent fees are billed on a per-account basis, the impact of transfer agent fees on a share class’s expense ratio may be more significant in cases where the share class has a high number of small accounts. The Board considered the extent to which transfer agent fees comprised total expenses of the Fund. The Board acknowledged the role that the MainStay Group of Funds historically has played in serving the investment needs of New York Life Insurance Company customers, who often maintain smaller account balances than other shareholders of funds, and the impact of small accounts on the expense ratios of Fund share classes. The Board also recognized measures that it and New York Life Investments have taken to mitigate the effect of small accounts on the expense ratios of Fund share classes, including through the imposition of an expense limitation on net transfer agency expenses. The Board noted that, for purposes of allocating transfer agency fees and expenses, each retail fund in the MainStay Group of Funds combines the shareholder accounts of its Class A, A2, I, R1, R2 and R3 shares (as applicable) into one group and the shareholder accounts of its Investor Class, SIMPLE Class and Class B, C and C2 shares (as applicable) into another group. The Board also noted that the per-account fees attributable to each group of share classes is then allocated among the constituent share classes based on relative net assets and that a MainStay Fund’s Class R6 shares, if any, are not combined with any other share class for this purpose. The Board considered New York Life Investments’ rationale with respect to these groupings and previously received a report from an independent consultant engaged to conduct comparative analysis of these groupings. The Board also considered that NYLIM Service Company LLC had waived its contractual cost of living adjustments during the past seven years.
Based on the factors outlined above, the Board concluded that the Fund’s management fee and total ordinary operating expenses were within a range that is competitive and support a conclusion that these fees and expenses are reasonable.
Economies of Scale
The Board considered information regarding economies of scale, including whether the Fund’s expense structure permits economies of scale to be appropriately shared with the Fund’s shareholders. The Board also considered a report from New York Life Investments, previously prepared at the request of the Board, that addressed economies of scale, including with respect to the mutual fund business generally and the various ways in which the benefits of economies of scale may be shared with the funds in the MainStay Group of Funds. Although the Board recognized the difficulty of determining economies of scale with precision, the Board acknowledged that economies of scale may be shared with the Fund in a number of ways, including, for example, through the imposition of management fee breakpoints, initially setting management fee rates at scale or making additional investments to enhance services. The Board reviewed information from New York Life Investments showing how the Fund’s management fee schedule compared to fee schedules of other funds and accounts managed by New York Life Investments. The Board
| 38 | MainStay MacKay S&P 500 Index Fund |
also reviewed information from Strategic Insight showing how the Fund’s management fee schedule compared with fees paid for similar services by peer funds at varying asset levels.
Based on this information, the Board concluded that economies of scale are appropriately reflected for the benefit of the Fund’s shareholders through the Fund’s expense structure and other methods to share benefits from economies of scale.
Conclusion
On the basis of the information and factors summarized above, among other information and factors deemed relevant by the Trustees, and the evaluation thereof, the Board, including the Independent Trustees voting separately, unanimously voted to approve the continuation of each of the Advisory Agreements.
Discussion of the Operation and Effectiveness of the Fund's Liquidity Risk Management Program (Unaudited)
In compliance with Rule 22e-4 under the Investment Company Act of 1940, as amended (the “Liquidity Rule”), the Fund has adopted and implemented a liquidity risk management program (the “Program”), which New York Life Investment Management LLC believes is reasonably designed to assess and manage the Fund's liquidity risk (the risk that the Fund could not meet requests to redeem shares issued by the Fund without significant dilution of remaining investors’ interests in the Fund). The Board of Trustees of MainStay Funds Trust (the "Board") designated New York Life Investment Management LLC as administrator of the Program (the “Administrator”). The Administrator has established a Liquidity Risk Management Committee to assist the Administrator in the implementation and day-to-day administration of the Program and to otherwise support the Administrator in fulfilling its responsibilities under the Program.
At a meeting of the Board held on March 8, 2021, the Administrator provided the Board with a written report addressing the Program’s operation and assessing its adequacy and effectiveness of implementation for the period from January 1, 2020 through December 31, 2020 (the "Review Period"), as required under the Liquidity Rule. The report noted that the Administrator concluded that (i) the Program operated effectively to assess and manage the Fund's liquidity risk, (ii) the Program has been adequately and effectively implemented to monitor and, as applicable, respond to the Fund's liquidity developments and (iii) the Fund's investment strategy continues to be appropriate for an open-end fund. In addition, the report discussed notable events that impacted liquidity risk during the Review Period, including the COVID-19 pandemic and the resulting economic shutdown.
In accordance with the Program, the Fund's liquidity risk is assessed no less frequently than annually taking into consideration certain factors, as applicable, such as (i) investment strategy and liquidity of portfolio investments, (ii) short-term and long-term cash flow projections and (iii) holdings of cash and cash equivalents, as well as borrowing arrangements and other funding sources. Certain factors are considered under both normal and reasonably foreseeable stressed conditions.
Each Fund portfolio investment is classified into one of four liquidity categories. The classification is based on a determination of the number of days it is reasonably expected to take to convert the investment into cash, or sell or dispose of the investment, in current market conditions without significantly changing the market value of the investment. The Administrator has delegated liquidity classification determinations to the Fund’s subadvisor, subject to appropriate oversight by the Administrator, and classification determinations are made by taking into account the Fund's reasonably anticipated trade size, various market, trading and investment-specific considerations, as well as market depth, and, in certain cases, third-party vendor data.
The Liquidity Rule requires funds that do not primarily hold assets that are highly liquid investments to adopt a minimum amount of net assets that must be invested in highly liquid investments that are assets (an “HLIM”). In addition, the Liquidity Rule limits a fund's investments in illiquid investments. Specifically, the Liquidity Rule prohibits acquisition of illiquid investments if doing so would result in a fund holding more than 15% of its net assets in illiquid investments that are assets. The Program includes provisions reasonably designed to determine, periodically review and comply with the HLIM requirement, as applicable, and to comply with the 15% limit on illiquid investments.
There can be no assurance that the Program will achieve its objectives under all circumstances in the future. Please refer to the Fund's prospectus for more information regarding the Fund's exposure to liquidity risk and other risks to which it may be subject.
| 40 | MainStay MacKay S&P 500 Index Fund |
Proxy Voting Record
The Fund is required to file with the Securities and Exchange Commissions's ("SEC") its proxy voting records for the 12-month period ending June 30 on Form N-PX. The most recent Form N-PX or proxy voting record is available free of charge upon request by calling 800-624-6782; visiting the MainStay Funds’ website at newyorklifeinvestments.com; or visiting the SEC’s website at www.sec.gov.
Shareholder Reports and Quarterly Portfolio Disclosure
The Fund is required to file its complete schedule of portfolio holdings with the SEC 60 days after its first and third fiscal quarter on Form N-PORT. The Fund's holdings report is available free of charge upon request by calling New York Life Investments at 800-624-6782.
This page intentionally left blank.
Equity
U.S. Equity
MainStay Epoch U.S. Equity Yield Fund
MainStay MacKay S&P 500 Index Fund
MainStay Winslow Large Cap Growth Fund
MainStay WMC Enduring Capital Fund
MainStay WMC Growth Fund
MainStay WMC Small Companies Fund
MainStay WMC Value Fund
International Equity
MainStay Epoch International Choice Fund
MainStay MacKay International Equity Fund
MainStay WMC International Research Equity Fund
Emerging Markets Equity
MainStay Candriam Emerging Markets Equity Fund
Global Equity
MainStay Epoch Capital Growth Fund
MainStay Epoch Global Equity Yield Fund
Fixed Income
Taxable Income
MainStay Candriam Emerging Markets Debt Fund
MainStay Floating Rate Fund
MainStay MacKay High Yield Corporate Bond Fund
MainStay MacKay Short Duration High Yield Fund
MainStay MacKay Strategic Bond Fund
MainStay MacKay Total Return Bond Fund
MainStay MacKay U.S. Infrastructure Bond Fund
MainStay Short Term Bond Fund
Tax-Exempt Income
MainStay MacKay California Tax Free Opportunities Fund1
MainStay MacKay High Yield Municipal Bond Fund
MainStay MacKay Intermediate Tax Free Bond Fund
MainStay MacKay New York Tax Free Opportunities Fund2
MainStay MacKay Short Term Municipal Fund
MainStay MacKay Tax Free Bond Fund
Money Market
MainStay Money Market Fund
Mixed Asset
MainStay Balanced Fund
MainStay Income Builder Fund
MainStay MacKay Convertible Fund
Speciality
MainStay CBRE Global Infrastructure Fund
MainStay CBRE Real Estate Fund
MainStay Cushing MLP Premier Fund
Asset Allocation
MainStay Conservative Allocation Fund
MainStay Conservative ETF Allocation Fund
MainStay Defensive ETF Allocation Fund
MainStay Equity Allocation Fund
MainStay Equity ETF Allocation Fund
MainStay Growth Allocation Fund
MainStay Growth ETF Allocation Fund
MainStay Moderate Allocation Fund
MainStay Moderate ETF Allocation Fund
Manager
New York Life Investment Management LLC
New York, New York
Subadvisors
Candriam Belgium S.A.3
Brussels, Belgium
Candriam Luxembourg S.C.A.3
Strassen, Luxembourg
CBRE Clarion Securities LLC
Radnor, Pennsylvania
Cushing Asset Management, LP
Dallas, Texas
Epoch Investment Partners, Inc.
New York, New York
MacKay Shields LLC3
New York, New York
NYL Investors LLC3
New York, New York
Wellington Management Company LLP
Boston, Massachusetts
Winslow Capital Management, LLC
Minneapolis, Minnesota
Legal Counsel
Dechert LLP
Washington, District of Columbia
Independent Registered Public Accounting Firm
KPMG LLP
Philadelphia, Pennsylvania
Distributor
NYLIFE Distributors LLC3
Jersey City, New Jersey
Custodian
JPMorgan Chase Bank, N.A.
New York, New York
1.
This Fund is registered for sale in AZ, CA, NV, OR, TX, UT, WA and MI (Class A and I shares only), and CO, FL, GA, HI, ID, MA, MD, NH, NJ and NY (Class I shares only).
| 2. | This Fund is registered for sale in CA, CT, DE, FL, MA, NJ, NY and VT. |
| 3. | An affiliate of New York Life Investment Management LLC. |
Not part of the Semiannual Report
For more information
800-624-6782
newyorklifeinvestments.com
“New York Life Investments” is both a service mark, and the common trade name, of certain investment advisors affiliated with New York Life Insurance Company. The MainStay Funds® are managed by New York Life Investment Management LLC and distributed by NYLIFE Distributors LLC, 30 Hudson Street, Jersey City, NJ 07302, a wholly owned subsidiary of New York Life Insurance Company. NYLIFE Distributors LLC is a Member FINRA/SIPC.
©2021 NYLIFE Distributors LLC. All rights reserved.
| 1737109MS071-21 | MSSP10-06/21 |
(NYLIM) NL226
MainStay MacKay Short Duration High Yield Fund
Message from the President and Semiannual Report
Unaudited | April 30, 2021
Sign up for e-delivery of your shareholder reports. For full details on e-delivery, including who can participate and what you can receive via e-delivery,
please log in to newyorklifeinvestments.com/accounts.
| Not FDIC/NCUA Insured | Not a Deposit | May Lose Value | No Bank Guarantee | Not Insured by Any Government Agency |
This page intentionally left blank
Message from the President
With the approval of COVID-19 vaccines and the passage of relief packages by the U.S. Congress, economic prospects improved during the reporting period, and investor risk appetite increased, benefiting both equities and fixed-income markets. Despite some volatility stemming from a sell-off in longer-dated Treasury securities, the stock market and higher-risk segments of the fixed-income market posted gains for the six months ended April 30, 2021.
By the beginning of the reporting period, the economy had made tremendous progress from the second quarter of 2020, when economic activity plunged. But uncertainty about when vaccines would be available and how quickly they could be administered left investors unsure about the economic outlook.
With the approval of several vaccines in November, the outlook brightened and investors became less risk-averse. Anticipating the likely end of the pandemic and a continuation of the economic recovery, they began to see opportunities in investment-grade and high-yield bonds and more cyclical segments of the stock market. The $900 billion relief and stimulus package passed in December provided further assurance.
In January, the Federal Reserve opted to leave interest rates unchanged, pointing to some uncertainty about the pace of the global recovery. Officials also noted that inflation remained low, citing oil prices in particular.
In March, President Biden signed the $1.9 billion American Rescue Plan, which, among other provisions, called for payments of $1,400 for those earning less than $75,000 per year, plus $1,400 per dependent. This, combined with the Federal Reserve’s new tolerance for inflation and an anticipated $2 trillion infrastructure spending bill, added to growing concerns about higher prices. Supply shortages in some markets caused some prices to soar, heightening concerns further.
In fixed-income markets, an improving economic outlook and rising inflation expectations led to a sell-off in longer-term Treasuries, with the result that the yield on the 10-year note rose sharply, particularly in February and March. Investment grade corporate bonds were also affected. Early in the reporting period, they performed well as investors shifted out of Treasuries, but as the reporting period progressed, they faltered. Longer-dated securities issued in recent years at historically low interest rates became especially unattractive.
High-yield bonds remained steady, supported by more favorable yields and an improved economic outlook, which reduced their perceived risk. Municipal bonds produced modest gains, and
although the sell-off in Treasuries produced some volatility early in 2021, stronger-than-expected tax revenues, $350 billion in financial support from the federal government, and the possibility of an increase in federal income tax rates appeared to buoy the market late in the reporting period.
Inflation concerns and volatility in the Treasury market led to a shift in equities markets. Although the S&P 500® Index, a widely followed measure of U.S. equities, posted double-digit gains and hit a record high, the rise of Treasury yields disrupted valuations, especially those of growth stocks. Technology companies that saw their valuations soar amid the work-from-home trend in 2020 suffered large declines.
But the fiscal stimulus and continued accommodation from the Federal Reserve gave investors confidence the economic recovery would continue. Combined with the sky-high valuations in technology and growth stocks, this increased the appeal of more cyclical and value-oriented shares. As a result, value stocks outperformed growth stocks during the reporting period.
Reflecting the shift in investor sentiment, the performance of S&P 500® Index sectors varied widely. While the information technology sector kept up with the broader market, it lagged cyclical sectors such as energy and financials, which led the way. The shift was further reflected in the performance of small-cap stocks, which outperformed large caps. While developed markets kept pace with the U.S. market, lagging economic and pandemic recoveries appeared to weigh on emerging markets late in the reporting period.
With the lockdown restrictions lifting in the U.S. and the pandemic easing in many regions, we at New York Life Investments are looking forward to a return to a more normal economy. We anticipate that over the next several years, a variety of trends will likely offer long-term investors many attractive opportunities. With this in mind, we continue to develop products and services to help you to take advantage of these trends, manage your risks, and ultimately meet your investment goals.
Sincerely,
Kirk C. Lehneis
President
The opinions expressed are as of the date of this report and are subject to change. There is no guarantee that any forecast made will come to pass. This material does not constitute investment advice and is not intended as an endorsement of any specific investment. Past performance is no guarantee of future results.
Not part of the Semiannual Report
Investors should refer to the Fund’s Summary Prospectus and/or Prospectus and consider the Fund’s investment objectives, strategies, risks, charges and expenses carefully before investing. The Summary Prospectus and/or Prospectus contain this and other information about the Fund. You may obtain copies of the Fund’s Summary Prospectus, Prospectus and Statement of Additional Information free of charge, upon request, by calling toll-free 800-624-6782, by writing to NYLIFE Distributors LLC, Attn: MainStay Marketing Department, 30 Hudson Street, Jersey City, NJ 07302 or by sending an e-mail to MainStayShareholderServices@nylim.com. These documents are also available via the MainStay Funds’ website at newyorklifeinvestments.com. Please read the Fund’s Summary Prospectus and/or Prospectus carefully before investing.
Investment and Performance Comparison (Unaudited)
Performance data quoted represents past performance. Past performance is no guarantee of future results. Because of market volatility and other factors, current performance may be lower or higher than the figures shown. Investment return and principal value will fluctuate, and as a result, when shares are redeemed, they may be worth more or less than their original cost. The graph below depicts the historical performance of Class I shares of the Fund. Performance will vary from class to class based on differences in class-specific expenses and sales charges. For performance information current to the most recent month-end, please call 800-624-6782 or visit newyorklifeinvestments.com.
The performance table and graph do not reflect the deduction of taxes that a shareholder would pay on distributions or Fund share redemptions. Total returns reflect maximum applicable sales charges as indicated in the table below, if any, changes in share price, and reinvestment of dividend and capital gain distributions. The graph assumes the initial investment amount shown below and reflects the deduction of all sales charges that would have applied for the period of investment. Performance figures may reflect certain fee waivers and/or expense limitations, without which total returns may have been lower. For more information on share classes and current fee waivers and/or expense limitations (if any), please refer to the Notes to Financial Statements.

| Average Annual Total Returns for the Period-Ended April 30, 2021 |
| Class | Sales Charge | | Inception
Date | Six
Months | One
Year | Five
Years | Since
Inception | Gross
Expense
Ratio1 |
| Class A Shares | Maximum 3% Initial Sales Charge | With sales charges | 12/17/2012 | 3.48% | 12.08% | 4.45% | 4.07% | 1.04% |
| | | Excluding sales charges | | 6.68 | 15.54 | 5.09 | 4.45 | 1.04 |
| Investor Class Shares2 | Maximum 2.5% Initial Sales Charge | With sales charges | 12/17/2012 | 3.85 | 11.97 | 4.37 | 3.96 | 1.13 |
| | | Excluding sales charges | | 6.52 | 15.43 | 5.01 | 4.34 | 1.13 |
| Class C Shares | Maximum 1% CDSC | With sales charges | 12/17/2012 | 5.12 | 13.45 | 4.20 | 3.56 | 1.88 |
| | if Redeemed Within 18 months of Purchase | Excluding sales charges | | 6.12 | 14.45 | 4.20 | 3.56 | 1.88 |
| Class I Shares | No Sales Charge | | 12/17/2012 | 6.70 | 15.83 | 5.33 | 4.70 | 0.79 |
| Class R2 Shares | No Sales Charge | | 12/17/2012 | 6.52 | 15.31 | 4.96 | 4.33 | 1.14 |
| Class R3 Shares | No Sales Charge | | 2/29/2016 | 6.37 | 15.13 | 4.70 | 5.53 | 1.39 |
| 1. | The gross expense ratios presented reflect the Fund’s “Total Annual Fund Operating Expenses” from the most recent Prospectus, as supplemented, and may differ from other expense ratios disclosed in this report. |
| 2. | Prior to June 30, 2020, the maximum initial sales charge for Investor Class shares was 3.0%, which is reflected in the average annual total return figures shown. |
The footnotes on the next page are an integral part of the table and graph and should be carefully read in conjunction with them.
| Benchmark Performance | Six
Months | One
Year | Five
Years | Since
Inception |
| ICE BofA 1-5 Year BB-B U.S. High Yield Corporate Cash Pay Index1 | 6.78% | 16.35% | 6.03% | 4.91% |
| Morningstar High Yield Bond Category Average2 | 7.92 | 18.47 | 6.04 | 4.69 |
| 1. | ICE BofA 1-5 Year BB-B U.S. High Yield Corporate Cash Pay Index is the Fund’s primary broad-based securities market index for comparison purposes. The ICE BofA 1-5 Year BB-B U.S. High Yield Corporate Cash Pay Index generally tracks the performance of BB-B rated U.S. dollar-denominated corporate bonds publicly issued in the U.S. domestic market with maturities of 1 to 5 years. Results assume reinvestment of all dividends and capital gains. An investment cannot be made directly in an index. |
| 2. | The Morningstar High Yield Bond Category Average is representative of funds that concentrate on lower-quality bonds, which are riskier than those of higher-quality companies. These portfolios primarily invest in U.S. high-income debt securities where at least 65% or more of bond assets are not rated or are rated by a major agency such as Standard & Poor’s or Moody’s at the level of BB and below. Results are based on average total returns of similar funds with all dividends and capital gain distributions reinvested. |
The footnotes on the preceding page are an integral part of the table and graph and should be carefully read in conjunction with them.
| 6 | MainStay MacKay Short Duration High Yield Fund |
Cost in Dollars of a $1,000 Investment in MainStay MacKay Short Duration High Yield Fund (Unaudited)
The example below is intended to describe the fees and expenses borne by shareholders during the six-month period from November 1, 2020, to April 30, 2021, and the impact of those costs on your investment.
Example
As a shareholder of the Fund you incur two types of costs: (1) transaction costs, including exchange fees and sales charges (loads) on purchases (as applicable), and (2) ongoing costs, including management fees, distribution and/or service (12b-1) fees, and other Fund expenses (as applicable). This example is intended to help you understand your ongoing costs (in dollars) of investing in the Fund and to compare these costs with the ongoing costs of investing in other mutual funds. The example is based on an investment of $1,000 made at the beginning of the six-month period and held for the entire period from November 1, 2020, to April 30, 2021.
This example illustrates your Fund’s ongoing costs in two ways:
Actual Expenses
The second and third data columns in the table below provide information about actual account values and actual expenses. You may use the information in these columns, together with the amount you invested, to estimate the expenses that you paid during the six months ended April 30, 2021. Simply divide your account value by $1,000 (for example, an
$8,600 account value divided by $1,000 = 8.6), then multiply the result by the number under the heading entitled “Expenses Paid During Period” to estimate the expenses you paid on your account during this period.
Hypothetical Example for Comparison Purposes
The fourth and fifth data columns in the table below provide information about hypothetical account values and hypothetical expenses based on the Fund’s actual expense ratio and an assumed rate of return of 5% per year before expenses, which is not the Fund’s actual return. The hypothetical account values and expenses may not be used to estimate the actual ending account balances or expenses you paid for the six-month period shown. You may use this information to compare the ongoing costs of investing in the Fund with the ongoing costs of investing in other mutual funds. To do so, compare this 5% hypothetical example with the 5% hypothetical examples that appear in the shareholder reports of the other mutual funds.
Please note that the expenses shown in the table are meant to highlight your ongoing costs only and do not reflect any transactional costs, such as exchange fees or sales charges (loads). Therefore, the fourth and fifth data columns of the table are useful in comparing ongoing costs only and will not help you determine the relative total costs of owning different funds. In addition, if these transactional costs were included, your costs would have been higher.
| Share Class | Beginning
Account
Value
11/1/20 | Ending Account
Value (Based
on Actual
Returns and
Expenses)
4/30/21 | Expenses
Paid
During
Period1 | Ending Account
Value (Based
on Hypothetical
5% Annualized
Return and
Actual Expenses)
4/30/21 | Expenses
Paid
During
Period1 | Net Expense
Ratio
During
Period2 |
| Class A Shares | $1,000.00 | $1,066.80 | $5.18 | $1,019.79 | $5.06 | 1.01% |
| Investor Class Shares | $1,000.00 | $1,065.20 | $5.68 | $1,019.29 | $5.56 | 1.11% |
| Class C Shares | $1,000.00 | $1,061.20 | $9.51 | $1,015.57 | $9.30 | 1.86% |
| Class I Shares | $1,000.00 | $1,067.00 | $3.90 | $1,021.03 | $3.81 | 0.76% |
| Class R2 Shares | $1,000.00 | $1,065.20 | $5.68 | $1,019.29 | $5.56 | 1.11% |
| Class R3 Shares | $1,000.00 | $1,063.70 | $6.96 | $1,018.05 | $6.81 | 1.36% |
| 1. | Expenses are equal to the Fund’s annualized expense ratio of each class multiplied by the average account value over the period, divided by 365 and multiplied by 181 (to reflect the six-month period). The table above represents the actual expenses incurred during the six-month period. In addition to the fees and expenses which the Fund bears directly, it also indirectly bears a pro rata share of the fees and expenses of the underlying funds in which it invests. Such indirect expenses are not included in the above-reported expense figures. |
| 2. | Expenses are equal to the Fund's annualized expense ratio to reflect the six-month period. |
Portfolio Composition as of April 30, 2021 (Unaudited)
‡ Less than one-tenth of a percent.
See Portfolio of Investments beginning on page 10 for specific holdings within these categories. The Fund's holdings are subject to change.
Top Ten Issuers Held as of April 30, 2021 (excluding short-term investments) (Unaudited)
| 1. | HCA, Inc., 5.375%-8.36%, due 5/1/23–2/15/26 |
| 2. | T-Mobile US, Inc., 2.25%-6.00%, due 4/15/22–4/15/27 |
| 3. | Sprint Corp., 7.875%, due 9/15/23 |
| 4. | Ford Motor Credit Co. LLC, 2.979%-5.584%, due 1/9/22–11/13/25 |
| 5. | Carnival Corp., 5.75%-11.50%, due 4/1/23–3/1/27 |
| 6. | MGM Growth Properties Operating Partnership LP, 4.625%-5.625%, due 5/1/24–6/15/25 |
| 7. | Grinding Media, Inc., 7.375%, due 12/15/23 |
| 8. | DISH Network Corp., 2.375%, due 3/15/24 |
| 9. | FS Energy and Power Fund, 7.50%, due 8/15/23 |
| 10. | Lumen Technologies, Inc., 5.80%-6.75%, due 6/15/21–12/1/23 |
| 8 | MainStay MacKay Short Duration High Yield Fund |
Portfolio Management Discussion and Analysis (Unaudited)
Questions answered by portfolio manager Andrew Susser of MacKay Shields LLC, the Fund’s Subadvisor.
How did MainStay MacKay Short Duration High Yield Fund perform relative to its benchmark and peer group during the six months ended April 30, 2021?
For the six months ended April 30, 2021, Class I shares of MainStay MacKay Short Duration High Yield Fund returned 6.70%, underperforming the 6.78% return of the Fund’s primary benchmark, the ICE BofA 1–5 Year BB-B U.S. High Yield Corporate Cash Pay Index (the "Index"). Over the same period, Class I shares also underperformed the 7.92% return of the Morningstar High Yield Bond Category Average.1
What factors affected the Fund’s relative performance during the reporting period?
During the reporting period, the high-yield market as a whole, produced strong absolute returns as positive news surrounding vaccine efficacy, coupled with the ongoing investor demand for yield, drove risk assets higher. By the end of the reporting period, spreads2 were below 350 basis points, tighter than in January 2020 prior to the pandemic. (A basis point is one one-hundredth of a percentage point.) The new issue market remained very strong, with the vast majority of issuance being refinancing. In calendar year 2020, close to $450 billion in new issuance came to market, followed by an additional $150 billion in the first quarter of 2021, both records.
During the reporting period, the Fund's returns were strong on an absolute basis and in-line with the return of the ICE BofA 1–5 Year BB-B U.S. High Yield Corporate Cash Pay Index. The Fund's positions in the energy and capital goods sectors were the largest contributors relative to the Index.
What was the Fund’s duration3 strategy during the reporting period?
The Fund’s duration is the result of our bottom-up fundamental analysis and is a residual of the investment process. The Fund’s modified duration to worst4 of 1.57% was lower than that of the ICE BofA 1–5 Year BB-B U.S. High Yield Corporate Cash Pay Index throughout the reporting period.
During the reporting period, which sectors were the strongest positive contributors to the Fund’s relative performance and which sectors were particularly weak?
Security selection within the energy, capital goods and services sectors made the strongest positive contributions to the Fund’s
returns relative to the ICE BofA 1–5 Year BB-B U.S. High Yield Corporate Cash Pay Index. (Contributions take weightings and total returns into account.) Conversely, overweight exposure to the health care and media sectors, as well as security selection in transportation, detracted from relative returns.
What were some of the Fund’s largest purchases and sales during the reporting period?
During the reporting period, we selectively trimmed the Fund’s positions in “fallen angels” (credits downgraded from investment grade to high yield) that were purchased at the height of the pandemic and subsequently recovered nicely. Toward the end of the reporting period, the Fund purchased new issues in toy manufacturer Mattel and energy producer New Fortress Energy.
How did the Fund’s sector weightings change during the reporting period?
There were no material changes to the Fund’s sector weightings during the reporting period. On the margin, we did add to the Fund’s holdings in the health care, capital goods and services sectors while moderately trimming exposure to the consumer goods, basic industry and media sectors.
How was the Fund positioned at the end of the reporting period?
As of April 30, 2021, relative to the ICE BofA 1–5 Year BB-B U.S. High Yield Corporate Cash Pay Index the Fund held overweight exposure to the basic industry, energy and real estate sectors. As of the same date, the Fund held underweight exposure to the consumer goods, telecommunications and technology/electronics sectors.
| 1. | See page 5 for other share class returns, which may be higher or lower than Class I share returns. See page 6 for more information on benchmark and peer group returns |
| 2. | The terms “spread” and “yield spread” may refer to the difference in yield between a security or type of security and comparable U.S. Treasury issues. The terms may also refer to the difference in yield between two specific securities or types of securities at a given time. |
| 3. | Duration is a measure of the price sensitivity of a fixed-income investment to changes in interest rates. Duration is expressed as a number of years and is considered a more accurate sensitivity gauge than average maturity. |
| 4. | Modified duration is inversely related to the approximate percentage change in price for a given change in yield. Duration to worst is the duration of a bond computed using the bond’s nearest call date or maturity, whichever comes first. This measure ignores future cash flow fluctuations due to embedded optionality. |
The opinions expressed are those of the portfolio manager as of the date of this report and are subject to change. There is no guarantee that any forecasts will come to pass. This material does not constitute investment advice and is not intended as an endorsement of any specific investment.
Portfolio of Investments April 30, 2021† (Unaudited)
| | Principal
Amount | Value |
| Long-Term Bonds 93.6% |
| Convertible Bonds 2.2% |
| Investment Companies 0.5% |
| Ares Capital Corp. | | |
| 3.75%, due 2/1/22 | $ 2,435,000 | $ 2,525,095 |
| 4.625%, due 3/1/24 | 4,500,000 | 4,907,700 |
| | | 7,432,795 |
| Media 1.3% |
| DISH Network Corp. | | |
| 2.375%, due 3/15/24 | 21,650,000 | 21,162,875 |
| Oil & Gas Services 0.4% |
| Forum Energy Technologies, Inc. | | |
| 9.00% (6.25% Cash and 2.75% PIK), due 8/4/25 (a) | 6,066,299 | 5,736,264 |
Total Convertible Bonds
(Cost $32,743,037) | | 34,331,934 |
| Corporate Bonds 74.2% |
| Advertising 0.3% |
| Outfront Media Capital LLC | | |
| 6.25%, due 6/15/25 (b) | 4,000,000 | 4,245,000 |
| Aerospace & Defense 1.0% |
| F-Brasile SpA | | |
| Series XR | | |
| 7.375%, due 8/15/26 (b) | 3,600,000 | 3,654,000 |
| Spirit AeroSystems, Inc. | | |
| 5.50%, due 1/15/25 (b) | 2,125,000 | 2,247,188 |
| SSL Robotics LLC | | |
| 9.75%, due 12/31/23 (b) | 592,000 | 660,429 |
| TransDigm UK Holdings plc | | |
| 6.875%, due 5/15/26 | 1,500,000 | 1,576,875 |
| TransDigm, Inc. (b) | | |
| 6.25%, due 3/15/26 | 2,650,000 | 2,805,687 |
| 8.00%, due 12/15/25 | 3,875,000 | 4,209,219 |
| | | 15,153,398 |
| Airlines 1.2% |
| American Airlines, Inc. | | |
| 5.50%, due 4/20/26 (b) | 2,200,000 | 2,310,000 |
| Delta Air Lines, Inc. | | |
| 4.50%, due 10/20/25 (b) | 2,000,000 | 2,145,304 |
| 7.00%, due 5/1/25 (b) | 4,125,000 | 4,796,704 |
| 7.375%, due 1/15/26 | 1,000,000 | 1,174,625 |
| Spirit Loyalty Cayman Ltd. | | |
| 8.00%, due 9/20/25 (b) | 1,650,000 | 1,858,048 |
| | Principal
Amount | Value |
| |
| Airlines (continued) |
| United Airlines, Inc. | | |
| 4.375%, due 4/15/26 (b) | $ 5,800,000 | $ 6,018,776 |
| | | 18,303,457 |
| Apparel 0.0% ‡ |
| Levi Strauss & Co. | | |
| 5.00%, due 5/1/25 | 300,000 | 306,000 |
| Auto Manufacturers 3.0% |
| Ford Motor Co. | | |
| 8.50%, due 4/21/23 | 1,800,000 | 2,016,000 |
| 9.00%, due 4/22/25 | 3,290,000 | 4,017,912 |
| Ford Motor Credit Co. LLC | | |
| 2.979%, due 8/3/22 | 1,797,000 | 1,824,674 |
| 3.087%, due 1/9/23 | 2,400,000 | 2,445,049 |
| 3.096%, due 5/4/23 | 1,065,000 | 1,088,942 |
| 3.219%, due 1/9/22 | 700,000 | 707,000 |
| 3.339%, due 3/28/22 | 2,000,000 | 2,027,600 |
| 3.37%, due 11/17/23 | 4,000,000 | 4,120,000 |
| 3.375%, due 11/13/25 | 7,000,000 | 7,161,770 |
| 3.664%, due 9/8/24 | 1,150,000 | 1,197,323 |
| 4.14%, due 2/15/23 | 1,100,000 | 1,139,875 |
| 5.125%, due 6/16/25 | 3,000,000 | 3,277,200 |
| 5.584%, due 3/18/24 | 840,000 | 915,600 |
| JB Poindexter & Co., Inc. | | |
| 7.125%, due 4/15/26 (b) | 8,000,000 | 8,450,000 |
| Mclaren Finance plc | | |
| 5.75%, due 8/1/22 (b) | 7,300,000 | 7,208,750 |
| | | 47,597,695 |
| Auto Parts & Equipment 0.8% |
| Adient Global Holdings Ltd. | | |
| 4.875%, due 8/15/26 (b) | 1,000,000 | 1,026,250 |
| Adient US LLC | | |
| 9.00%, due 4/15/25 (b) | 2,045,000 | 2,266,371 |
| American Axle & Manufacturing, Inc. | | |
| 6.25%, due 4/1/25 | 2,000,000 | 2,071,000 |
| Exide Global Holding Netherlands CV | | |
| 10.75%, due 10/26/24 (c)(d)(e) | 1,610,000 | 1,564,920 |
| IHO Verwaltungs GmbH (a)(b) | | |
| 4.75% (4.75% Cash or 5.50% PIK), due 9/15/26 | 2,000,000 | 2,051,200 |
| 6.00% (6.00% Cash or 6.75% PIK), due 5/15/27 | 2,220,000 | 2,337,105 |
| Meritor, Inc. | | |
| 6.25%, due 2/15/24 | 773,000 | 784,595 |
| 6.25%, due 6/1/25 (b) | 1,335,000 | 1,428,270 |
| | | 13,529,711 |
The notes to the financial statements are an integral part of, and should be read in conjunction with, the financial statements.
| 10 | MainStay MacKay Short Duration High Yield Fund |
| | Principal
Amount | Value |
| Corporate Bonds (continued) |
| Building Materials 0.6% |
| Koppers, Inc. | | |
| 6.00%, due 2/15/25 (b) | $ 4,475,000 | $ 4,598,062 |
| Patrick Industries, Inc. | | |
| 7.50%, due 10/15/27 (b) | 1,675,000 | 1,817,375 |
| Summit Materials LLC (b) | | |
| 5.125%, due 6/1/25 | 1,690,000 | 1,713,238 |
| 6.50%, due 3/15/27 | 1,000,000 | 1,055,000 |
| | | 9,183,675 |
| Chemicals 1.2% |
| GPD Cos., Inc. | | |
| 10.125%, due 4/1/26 (b) | 3,685,000 | 4,012,044 |
| Iris Holdings, Inc. | | |
| 8.75% (8.75% Cash or 9.50% PIK), due 2/15/26 (a)(b) | 3,000,000 | 3,090,000 |
| Kraton Polymers LLC | | |
| 4.25%, due 12/15/25 (b) | 1,540,000 | 1,563,100 |
| NOVA Chemicals Corp. | | |
| 4.875%, due 6/1/24 (b) | 2,150,000 | 2,266,659 |
| Olin Corp. | | |
| 9.50%, due 6/1/25 (b) | 1,000,000 | 1,253,750 |
| TPC Group, Inc. (b) | | |
| 10.50%, due 8/1/24 | 4,605,000 | 4,305,675 |
| 10.875%, due 8/1/24 | 2,600,000 | 2,704,000 |
| | | 19,195,228 |
| Coal 0.0% ‡ |
| Natural Resource Partners LP | | |
| 9.125%, due 6/30/25 (b) | 295,000 | 281,356 |
| Commercial Services 1.1% |
| Alta Equipment Group, Inc. | | |
| 5.625%, due 4/15/26 (b) | 5,000,000 | 5,076,600 |
| Graham Holdings Co. | | |
| 5.75%, due 6/1/26 (b) | 2,920,000 | 3,051,400 |
| IHS Markit Ltd. | | |
| 5.00%, due 11/1/22 (b) | 1,630,000 | 1,715,399 |
| Jaguar Holding Co. II | | |
| 4.625%, due 6/15/25 (b) | 3,600,000 | 3,784,248 |
| Legends Hospitality Holding Co. LLC | | |
| 5.00%, due 2/1/26 (b) | 2,000,000 | 2,065,000 |
| Ritchie Bros Auctioneers, Inc. | | |
| 5.375%, due 1/15/25 (b) | 2,175,000 | 2,238,075 |
| | | 17,930,722 |
| | Principal
Amount | Value |
| |
| Distribution & Wholesale 0.6% |
| Avient Corp. | | |
| 5.25%, due 3/15/23 | $ 1,750,000 | $ 1,881,250 |
| 5.75%, due 5/15/25 (b) | 3,665,000 | 3,866,355 |
| G-III Apparel Group Ltd. | | |
| 7.875%, due 8/15/25 (b) | 3,500,000 | 3,780,000 |
| | | 9,527,605 |
| Diversified Financial Services 1.7% |
| Credit Acceptance Corp. | | |
| 5.125%, due 12/31/24 (b) | 10,090,000 | 10,405,312 |
| Genworth Mortgage Holdings, Inc. | | |
| 6.50%, due 8/15/25 (b) | 3,260,000 | 3,540,067 |
| Oxford Finance LLC | | |
| 6.375%, due 12/15/22 (b) | 7,750,000 | 7,858,345 |
| PRA Group, Inc. | | |
| 7.375%, due 9/1/25 (b) | 2,650,000 | 2,838,813 |
| StoneX Group, Inc. | | |
| 8.625%, due 6/15/25 (b) | 1,920,000 | 2,054,400 |
| | | 26,696,937 |
| Electric 1.2% |
| DPL, Inc. | | |
| 4.125%, due 7/1/25 (b) | 3,650,000 | 3,926,670 |
| Keystone Power LLC | | |
| 9.00%, due 12/1/23 (d) | 810,709 | 778,281 |
| NextEra Energy Operating Partners LP (b) | | |
| 3.875%, due 10/15/26 | 3,500,000 | 3,660,667 |
| 4.25%, due 7/15/24 | 1,990,000 | 2,109,400 |
| NRG Energy, Inc. | | |
| 7.25%, due 5/15/26 | 1,000,000 | 1,035,470 |
| Pacific Gas and Electric Co. | | |
| 1.75%, due 6/16/22 | 2,000,000 | 2,001,754 |
| Vistra Operations Co. LLC | | |
| 3.55%, due 7/15/24 (b) | 4,650,000 | 4,824,613 |
| | | 18,336,855 |
| Electrical Components & Equipment 0.2% |
| WESCO Distribution, Inc. | | |
| 7.125%, due 6/15/25 (b) | 2,600,000 | 2,808,000 |
| Energy-Alternate Sources 0.2% |
| TerraForm Power Operating LLC | | |
| 4.25%, due 1/31/23 (b) | 2,520,000 | 2,586,150 |
The notes to the financial statements are an integral part of, and should be read in conjunction with, the financial statements.
11
Portfolio of Investments April 30, 2021† (Unaudited) (continued)
| | Principal
Amount | Value |
| Corporate Bonds (continued) |
| Engineering & Construction 0.7% |
| Brundage-Bone Concrete Pumping Holdings, Inc. | | |
| 6.00%, due 2/1/26 (b) | $ 1,600,000 | $ 1,683,784 |
| Great Lakes Dredge & Dock Corp. | | |
| 8.00%, due 5/15/22 | 7,650,000 | 7,668,207 |
| PowerTeam Services LLC | | |
| 9.033%, due 12/4/25 (b) | 2,000,000 | 2,217,500 |
| | | 11,569,491 |
| Entertainment 1.5% |
| Boyne USA, Inc. | | |
| 7.25%, due 5/1/25 (b) | 1,950,000 | 2,023,379 |
| Churchill Downs, Inc. | | |
| 5.50%, due 4/1/27 (b) | 3,625,000 | 3,762,986 |
| International Game Technology plc (b) | | |
| 4.125%, due 4/15/26 | 3,750,000 | 3,864,037 |
| 6.50%, due 2/15/25 | 1,400,000 | 1,550,500 |
| Jacobs Entertainment, Inc. | | |
| 7.875%, due 2/1/24 (b) | 1,000,000 | 1,042,500 |
| Live Nation Entertainment, Inc. | | |
| 4.875%, due 11/1/24 (b) | 2,875,000 | 2,928,906 |
| Powdr Corp. | | |
| 6.00%, due 8/1/25 (b) | 1,930,000 | 2,031,325 |
| Vail Resorts, Inc. | | |
| 6.25%, due 5/15/25 (b) | 5,667,000 | 6,014,104 |
| | | 23,217,737 |
| Environmental Control 0.1% |
| Covanta Holding Corp. | | |
| 5.875%, due 7/1/25 | 1,665,000 | 1,736,179 |
| Food 0.5% |
| B&G Foods, Inc. | | |
| 5.25%, due 4/1/25 | 4,300,000 | 4,426,162 |
| Ingles Markets, Inc. | | |
| 5.75%, due 6/15/23 | 990,000 | 999,603 |
| Lamb Weston Holdings, Inc. (b) | | |
| 4.625%, due 11/1/24 | 1,880,000 | 1,950,500 |
| 4.875%, due 11/1/26 | 205,000 | 212,687 |
| | | 7,588,952 |
| Food Service 0.8% |
| Aramark Services, Inc. | | |
| 6.375%, due 5/1/25 (b) | 12,185,000 | 12,961,794 |
| | Principal
Amount | Value |
| |
| Forest Products & Paper 0.1% |
| Smurfit Kappa Treasury Funding DAC | | |
| 7.50%, due 11/20/25 | $ 1,631,000 | $ 2,023,304 |
| Gas 1.0% |
| AmeriGas Partners LP | | |
| 5.625%, due 5/20/24 | 7,500,000 | 8,343,750 |
| Rockpoint Gas Storage Canada Ltd. | | |
| 7.00%, due 3/31/23 (b) | 6,800,000 | 6,885,000 |
| | | 15,228,750 |
| Healthcare-Products 0.0% ‡ |
| Hill-Rom Holdings, Inc. | | |
| 5.00%, due 2/15/25 (b) | 388,000 | 398,360 |
| Healthcare-Services 4.9% |
| AHP Health Partners, Inc. | | |
| 9.75%, due 7/15/26 (b) | 2,065,000 | 2,232,781 |
| Centene Corp. | | |
| 5.375%, due 6/1/26 (b) | 1,000,000 | 1,041,800 |
| Encompass Health Corp. | | |
| 5.125%, due 3/15/23 | 5,787,000 | 5,794,234 |
| 5.75%, due 9/15/25 | 3,400,000 | 3,514,750 |
| HCA, Inc. | | |
| 5.375%, due 2/1/25 | 13,100,000 | 14,599,033 |
| 5.875%, due 5/1/23 | 9,255,000 | 10,100,241 |
| 5.875%, due 2/15/26 | 2,000,000 | 2,297,500 |
| 7.50%, due 12/15/23 | 11,610,000 | 13,235,400 |
| 7.58%, due 9/15/25 | 1,663,000 | 1,978,970 |
| 8.36%, due 4/15/24 | 10,000,000 | 11,700,000 |
| ModivCare, Inc. | | |
| 5.875%, due 11/15/25 (b) | 5,675,000 | 6,029,687 |
| Molina Healthcare, Inc. | | |
| 5.375%, due 11/15/22 (f) | 1,750,000 | 1,835,313 |
| Tenet Healthcare Corp. | | |
| 7.50%, due 4/1/25 (b) | 3,500,000 | 3,771,250 |
| | | 78,130,959 |
| Holding Companies-Diversified 0.8% |
| Stena International SA | | |
| 6.125%, due 2/1/25 (b) | 12,220,000 | 12,403,300 |
| Home Builders 1.0% |
| Adams Homes, Inc. | | |
| 7.50%, due 2/15/25 (b) | 5,165,000 | 5,410,337 |
| Brookfield Residential Properties, Inc. | | |
| 6.375%, due 5/15/25 (b) | 1,500,000 | 1,533,750 |
| Century Communities, Inc. | | |
| 5.875%, due 7/15/25 | 3,100,000 | 3,208,500 |
The notes to the financial statements are an integral part of, and should be read in conjunction with, the financial statements.
| 12 | MainStay MacKay Short Duration High Yield Fund |
| | Principal
Amount | Value |
| Corporate Bonds (continued) |
| Home Builders (continued) |
| Century Communities, Inc. (continued) | | |
| 6.75%, due 6/1/27 | $ 1,000,000 | $ 1,076,025 |
| Picasso Finance Sub, Inc. | | |
| 6.125%, due 6/15/25 (b) | 2,980,000 | 3,169,975 |
| STL Holding Co. LLC | | |
| 7.50%, due 2/15/26 (b) | 1,600,000 | 1,672,000 |
| | | 16,070,587 |
| Household Products & Wares 0.1% |
| Spectrum Brands, Inc. | | |
| 5.75%, due 7/15/25 | 1,000,000 | 1,029,400 |
| Housewares 0.3% |
| Newell Brands, Inc. | | |
| 4.35%, due 4/1/23 (f) | 2,250,000 | 2,371,522 |
| 4.875%, due 6/1/25 | 1,750,000 | 1,933,750 |
| | | 4,305,272 |
| Insurance 0.6% |
| MGIC Investment Corp. | | |
| 5.75%, due 8/15/23 | 4,000,000 | 4,325,000 |
| NMI Holdings, Inc. | | |
| 7.375%, due 6/1/25 (b) | 4,485,000 | 5,157,750 |
| | | 9,482,750 |
| Internet 1.9% |
| Netflix, Inc. | | |
| 3.625%, due 6/15/25 (b) | 1,000,000 | 1,075,320 |
| 5.50%, due 2/15/22 | 6,300,000 | 6,528,375 |
| 5.75%, due 3/1/24 | 4,980,000 | 5,611,837 |
| 5.875%, due 2/15/25 | 665,000 | 768,906 |
| NortonLifeLock, Inc. | | |
| 5.00%, due 4/15/25 (b) | 4,555,000 | 4,613,851 |
| Uber Technologies, Inc. | | |
| 7.50%, due 5/15/25 (b) | 4,800,000 | 5,190,000 |
| VeriSign, Inc. | | |
| 4.625%, due 5/1/23 | 5,627,000 | 5,643,881 |
| | | 29,432,170 |
| Investment Companies 2.5% |
| Ares Capital Corp. | | |
| 3.875%, due 1/15/26 | 1,000,000 | 1,067,177 |
| FS Energy and Power Fund | | |
| 7.50%, due 8/15/23 (b) | 19,344,000 | 19,634,160 |
| | Principal
Amount | Value |
| |
| Investment Companies (continued) |
| Icahn Enterprises LP | | |
| 4.75%, due 9/15/24 | $ 15,195,000 | $ 15,922,840 |
| 6.75%, due 2/1/24 | 2,950,000 | 3,012,688 |
| | | 39,636,865 |
| Iron & Steel 0.4% |
| Allegheny Technologies, Inc. | | |
| 7.875%, due 8/15/23 (f) | 3,000,000 | 3,266,250 |
| Mineral Resources Ltd. | | |
| 8.125%, due 5/1/27 (b) | 3,400,000 | 3,765,772 |
| | | 7,032,022 |
| Leisure Time 3.3% |
| Carlson Travel, Inc. (b) | | |
| 6.75%, due 12/15/25 | 10,000,000 | 9,400,000 |
| 10.50%, due 3/31/25 (f) | 4,597,006 | 4,780,886 |
| Carnival Corp. (b) | | |
| 5.75%, due 3/1/27 | 8,000,000 | 8,435,040 |
| 7.625%, due 3/1/26 | 1,410,000 | 1,543,950 |
| 10.50%, due 2/1/26 | 8,500,000 | 10,018,525 |
| 11.50%, due 4/1/23 | 3,000,000 | 3,447,600 |
| Silversea Cruise Finance Ltd. | | |
| 7.25%, due 2/1/25 (b) | 14,035,000 | 14,524,822 |
| | | 52,150,823 |
| Lodging 2.1% |
| Boyd Gaming Corp. | | |
| 6.00%, due 8/15/26 | 1,750,000 | 1,815,625 |
| 6.375%, due 4/1/26 | 1,500,000 | 1,548,750 |
| 8.625%, due 6/1/25 (b) | 4,490,000 | 4,971,328 |
| Genting New York LLC | | |
| 3.30%, due 2/15/26 (b) | 2,985,000 | 2,976,041 |
| Hilton Domestic Operating Co., Inc. | | |
| 5.375%, due 5/1/25 (b) | 3,150,000 | 3,317,422 |
| Hyatt Hotels Corp. | | |
| 5.375%, due 4/23/25 | 5,070,000 | 5,723,691 |
| Marriott International, Inc. | | |
| 3.75%, due 10/1/25 | 1,000,000 | 1,077,305 |
| Series Z | | |
| 4.15%, due 12/1/23 | 1,500,000 | 1,610,600 |
| Series EE | | |
| 5.75%, due 5/1/25 | 8,845,000 | 10,181,861 |
| | | 33,222,623 |
| Machinery-Diversified 0.4% |
| Briggs & Stratton Corp. (Escrow Claim Shares) | | |
| 6.875%, due 12/15/20 (g)(h)(i) | 3,425,000 | 274,000 |
The notes to the financial statements are an integral part of, and should be read in conjunction with, the financial statements.
13
Portfolio of Investments April 30, 2021† (Unaudited) (continued)
| | Principal
Amount | Value |
| Corporate Bonds (continued) |
| Machinery-Diversified (continued) |
| Stevens Holding Co., Inc. | | |
| 6.125%, due 10/1/26 (b) | $ 2,500,000 | $ 2,687,500 |
| Tennant Co. | | |
| 5.625%, due 5/1/25 | 3,754,000 | 3,859,600 |
| | | 6,821,100 |
| Media 3.9% |
| CCO Holdings LLC (b) | | |
| 5.50%, due 5/1/26 | 8,800,000 | 9,081,600 |
| 5.75%, due 2/15/26 | 1,472,000 | 1,523,520 |
| CSC Holdings LLC | | |
| 5.25%, due 6/1/24 | 9,250,000 | 10,013,125 |
| 5.875%, due 9/15/22 | 3,250,000 | 3,413,800 |
| DISH DBS Corp. | | |
| 5.875%, due 7/15/22 | 3,550,000 | 3,716,850 |
| 5.875%, due 11/15/24 | 2,292,000 | 2,479,623 |
| EW Scripps Co. (The) | | |
| 5.125%, due 5/15/25 (b) | 2,555,000 | 2,622,171 |
| Meredith Corp. | | |
| 6.50%, due 7/1/25 (b) | 2,500,000 | 2,668,750 |
| 6.875%, due 2/1/26 | 4,060,000 | 4,166,575 |
| Quebecor Media, Inc. | | |
| 5.75%, due 1/15/23 | 6,920,000 | 7,395,750 |
| Sirius XM Radio, Inc. (b) | | |
| 3.875%, due 8/1/22 | 1,000,000 | 1,004,950 |
| 4.625%, due 7/15/24 | 5,000,000 | 5,131,250 |
| 5.375%, due 7/15/26 | 536,000 | 553,527 |
| Sterling Entertainment Enterprises LLC | | |
| 10.25%, due 1/15/25 (c)(d)(e)(i) | 3,000,000 | 3,105,000 |
| Townsquare Media, Inc. | | |
| 6.875%, due 2/1/26 (b) | 485,000 | 505,613 |
| Videotron Ltd. | | |
| 5.00%, due 7/15/22 | 4,869,000 | 5,075,932 |
| | | 62,458,036 |
| Metal Fabricate & Hardware 1.4% |
| Grinding Media, Inc. | | |
| 7.375%, due 12/15/23 (b) | 21,546,000 | 21,916,591 |
| Mining 2.1% |
| Arconic Corp. | | |
| 6.00%, due 5/15/25 (b) | 3,000,000 | 3,202,500 |
| Compass Minerals International, Inc. | | |
| 4.875%, due 7/15/24 (b) | 12,860,000 | 13,245,800 |
| Constellium SE | | |
| 5.75%, due 5/15/24 (b) | 3,500,000 | 3,521,735 |
| | Principal
Amount | Value |
| |
| Mining (continued) |
| First Quantum Minerals Ltd. (b) | | |
| 7.25%, due 4/1/23 | $ 3,856,000 | $ 3,928,300 |
| 7.50%, due 4/1/25 | 2,500,000 | 2,595,313 |
| Hudbay Minerals, Inc. | | |
| 4.50%, due 4/1/26 (b) | 1,000,000 | 1,015,000 |
| Novelis Corp. | | |
| 5.875%, due 9/30/26 (b) | 5,875,000 | 6,128,741 |
| | | 33,637,389 |
| Miscellaneous—Manufacturing 0.5% |
| FXI Holdings, Inc. | | |
| 7.875%, due 11/1/24 (b) | 1,965,000 | 2,028,862 |
| Hillenbrand, Inc. | | |
| 5.00%, due 9/15/26 (f) | 2,300,000 | 2,547,250 |
| 5.75%, due 6/15/25 | 3,515,000 | 3,765,444 |
| | | 8,341,556 |
| Oil & Gas 7.0% |
| Apache Corp. | | |
| 4.625%, due 11/15/25 | 1,950,000 | 2,059,688 |
| Ascent Resources Utica Holdings LLC | | |
| 9.00%, due 11/1/27 (b) | 1,556,000 | 2,018,910 |
| California Resources Corp. | | |
| 7.125%, due 2/1/26 (b) | 4,520,000 | 4,629,926 |
| Callon Petroleum Co. | | |
| 9.00%, due 4/1/25 (b) | 1,700,000 | 1,763,750 |
| Centennial Resource Production LLC | | |
| 5.375%, due 1/15/26 (b) | 2,280,000 | 2,134,650 |
| Chesapeake Energy Corp. | | |
| 5.50%, due 2/1/26 (b) | 2,020,000 | 2,131,100 |
| Chevron USA, Inc. | | |
| 3.90%, due 11/15/24 | 4,550,000 | 5,027,610 |
| Colgate Energy Partners III LLC | | |
| 7.75%, due 2/15/26 (b) | 3,000,000 | 3,030,000 |
| Comstock Resources, Inc. | | |
| 9.75%, due 8/15/26 | 1,387,000 | 1,508,057 |
| Encino Acquisition Partners Holdings LLC | | |
| 8.50%, due 5/1/28 (b) | 2,615,000 | 2,561,968 |
| Endeavor Energy Resources LP | | |
| 6.625%, due 7/15/25 (b) | 900,000 | 958,500 |
| EQT Corp. | | |
| 7.625%, due 2/1/25 (f) | 7,850,000 | 9,035,468 |
| Gulfport Energy Corp. (d)(g)(h) | | |
| 6.00%, due 10/15/24 | 2,245,000 | 2,250,613 |
| 6.625%, due 5/1/23 | 4,452,000 | 4,496,520 |
| Hess Corp. | | |
| 3.50%, due 7/15/24 | 910,000 | 962,565 |
The notes to the financial statements are an integral part of, and should be read in conjunction with, the financial statements.
| 14 | MainStay MacKay Short Duration High Yield Fund |
| | Principal
Amount | Value |
| Corporate Bonds (continued) |
| Oil & Gas (continued) |
| Hilcorp Energy I LP | | |
| 5.75%, due 10/1/25 (b) | $ 2,000,000 | $ 2,023,660 |
| Occidental Petroleum Corp. | | |
| 2.70%, due 2/15/23 | 1,502,000 | 1,505,755 |
| 5.50%, due 12/1/25 | 2,000,000 | 2,150,000 |
| 5.875%, due 9/1/25 | 3,160,000 | 3,452,300 |
| 8.00%, due 7/15/25 | 5,000,000 | 5,837,500 |
| Ovintiv Exploration, Inc. | | |
| 5.75%, due 1/30/22 | 4,000,000 | 4,126,825 |
| PBF Holding Co. LLC | | |
| 7.25%, due 6/15/25 | 7,845,000 | 6,687,862 |
| 9.25%, due 5/15/25 (b) | 3,100,000 | 3,247,250 |
| PDC Energy, Inc. | | |
| 6.125%, due 9/15/24 | 3,700,000 | 3,792,500 |
| Range Resources Corp. | | |
| 5.875%, due 7/1/22 | 2,828,000 | 2,849,210 |
| 9.25%, due 2/1/26 | 4,343,000 | 4,768,961 |
| Southwestern Energy Co. | | |
| 6.45%, due 1/23/25 (f) | 12,463,000 | 13,460,040 |
| Talos Production, Inc. | | |
| 12.00%, due 1/15/26 (b) | 11,410,000 | 11,438,525 |
| Transocean Guardian Ltd. | | |
| 5.875%, due 1/15/24 (b) | 1,232,500 | 1,146,225 |
| | | 111,055,938 |
| Oil & Gas Services 0.7% |
| Nine Energy Service, Inc. | | |
| 8.75%, due 11/1/23 (b) | 3,775,000 | 1,566,625 |
| TechnipFMC plc | | |
| 6.50%, due 2/1/26 (b) | 9,220,000 | 9,843,142 |
| | | 11,409,767 |
| Packaging & Containers 0.6% |
| Cascades USA, Inc. | | |
| 5.125%, due 1/15/26 (b) | 4,416,000 | 4,680,960 |
| Sealed Air Corp. | | |
| 5.25%, due 4/1/23 (b) | 1,000,000 | 1,058,750 |
| Silgan Holdings, Inc. | | |
| 4.75%, due 3/15/25 | 3,360,000 | 3,411,845 |
| | | 9,151,555 |
| Pharmaceuticals 1.3% |
| Bausch Health Americas, Inc. | | |
| 9.25%, due 4/1/26 (b) | 1,250,000 | 1,384,625 |
| Bausch Health Cos., Inc. (b) | | |
| 6.125%, due 4/15/25 | 9,335,000 | 9,531,315 |
| 7.00%, due 3/15/24 | 5,530,000 | 5,668,250 |
| | Principal
Amount | Value |
| |
| Pharmaceuticals (continued) |
| Endo DAC | | |
| 5.875%, due 10/15/24 (b) | $ 4,150,000 | $ 4,170,750 |
| | | 20,754,940 |
| Pipelines 4.7% |
| Antero Midstream Partners LP | | |
| 5.375%, due 9/15/24 | 2,500,000 | 2,540,625 |
| Cheniere Energy Partners LP | | |
| 5.625%, due 10/1/26 | 1,000,000 | 1,042,500 |
| Enable Midstream Partners LP | | |
| 3.90%, due 5/15/24 (f) | 1,500,000 | 1,599,144 |
| EQM Midstream Partners LP | | |
| 6.00%, due 7/1/25 (b) | 5,365,000 | 5,861,262 |
| Genesis Energy LP | | |
| 6.25%, due 5/15/26 | 2,190,000 | 2,144,558 |
| 6.50%, due 10/1/25 | 3,000,000 | 3,015,000 |
| Hess Midstream Operations LP | | |
| 5.625%, due 2/15/26 (b) | 4,829,000 | 5,010,088 |
| New Fortress Energy, Inc. | | |
| 6.50%, due 9/30/26 (b) | 2,500,000 | 2,550,825 |
| NGL Energy Operating LLC | | |
| 7.50%, due 2/1/26 (b) | 1,000,000 | 1,047,500 |
| NGPL PipeCo LLC | | |
| 4.375%, due 8/15/22 (b) | 5,565,000 | 5,762,758 |
| NuStar Logistics LP | | |
| 5.75%, due 10/1/25 | 1,500,000 | 1,614,375 |
| PBF Logistics LP | | |
| 6.875%, due 5/15/23 | 4,000,000 | 3,995,000 |
| Plains All American Pipeline LP | | |
| Series B | | |
| 6.125%, due 11/15/22 (j)(k) | 18,663,000 | 15,490,290 |
| Rattler Midstream LP | | |
| 5.625%, due 7/15/25 (b) | 760,000 | 800,850 |
| Rockies Express Pipeline LLC | | |
| 3.60%, due 5/15/25 (b) | 2,905,000 | 2,886,786 |
| Ruby Pipeline LLC | | |
| 8.00%, due 4/1/22 (b)(f) | 7,866,000 | 6,724,419 |
| Tallgrass Energy Partners LP | | |
| 5.50%, due 9/15/24 (b) | 5,075,000 | 5,170,156 |
| TransMontaigne Partners LP | | |
| 6.125%, due 2/15/26 | 2,370,000 | 2,381,850 |
| Western Midstream Operating LP | | |
| 4.00%, due 7/1/22 | 500,000 | 511,875 |
| 4.65%, due 7/1/26 | 4,315,000 | 4,619,747 |
| | | 74,769,608 |
| Real Estate 0.8% |
| Newmark Group, Inc. | | |
| 6.125%, due 11/15/23 | 12,225,000 | 13,326,501 |
The notes to the financial statements are an integral part of, and should be read in conjunction with, the financial statements.
15
Portfolio of Investments April 30, 2021† (Unaudited) (continued)
| | Principal
Amount | Value |
| Corporate Bonds (continued) |
| Real Estate Investment Trusts 3.4% |
| CTR Partnership LP | | |
| 5.25%, due 6/1/25 | $ 2,400,000 | $ 2,471,040 |
| Diversified Healthcare Trust | | |
| 9.75%, due 6/15/25 | 3,000,000 | 3,360,000 |
| GLP Capital LP | | |
| 5.25%, due 6/1/25 | 2,500,000 | 2,822,350 |
| 5.375%, due 11/1/23 | 3,110,000 | 3,416,646 |
| 5.375%, due 4/15/26 | 700,000 | 791,863 |
| MGM Growth Properties Operating Partnership LP | | |
| 4.625%, due 6/15/25 (b) | 1,935,000 | 2,058,617 |
| 5.625%, due 5/1/24 | 19,681,000 | 21,220,448 |
| MPT Operating Partnership LP | | |
| 5.25%, due 8/1/26 | 2,500,000 | 2,578,125 |
| SBA Communications Corp. | | |
| 4.875%, due 9/1/24 | 1,450,000 | 1,484,438 |
| Starwood Property Trust, Inc. | | |
| 5.00%, due 12/15/21 | 2,485,000 | 2,508,607 |
| VICI Properties LP | | |
| 3.50%, due 2/15/25 (b) | 10,640,000 | 10,866,100 |
| | | 53,578,234 |
| Retail 1.4% |
| CEC Entertainment LLC | | |
| 6.75%, due 5/1/26 (b) | 1,745,000 | 1,729,731 |
| Dave & Buster's, Inc. | | |
| 7.625%, due 11/1/25 (b) | 2,325,000 | 2,511,854 |
| KFC Holding Co. | | |
| 5.25%, due 6/1/26 (b) | 8,069,000 | 8,295,013 |
| NMG Holding Co., Inc. | | |
| 7.125%, due 4/1/26 (b) | 3,000,000 | 3,068,640 |
| Penske Automotive Group, Inc. | | |
| 3.50%, due 9/1/25 | 3,075,000 | 3,151,875 |
| Ultra Resources, Inc. Escrow Claim Shares | | |
| 6.875%, due 4/15/22 (c)(d)(e)(h) | 4,455,000 | — |
| Yum! Brands, Inc. | | |
| 3.875%, due 11/1/23 | 1,000,000 | 1,048,750 |
| 7.75%, due 4/1/25 (b) | 2,500,000 | 2,731,250 |
| | | 22,537,113 |
| Semiconductors 0.1% |
| Microchip Technology, Inc. | | |
| 4.25%, due 9/1/25 (b) | 1,300,000 | 1,365,230 |
| | Principal
Amount | Value |
| |
| Software 2.1% |
| BY Crown Parent LLC (b) | | |
| 4.25%, due 1/31/26 | $ 7,000,000 | $ 7,332,500 |
| 7.375%, due 10/15/24 | 1,687,000 | 1,722,090 |
| Camelot Finance SA | | |
| 4.50%, due 11/1/26 (b) | 8,225,000 | 8,512,875 |
| CDK Global, Inc. | | |
| 5.00%, due 10/15/24 (f) | 3,150,000 | 3,462,480 |
| Change Healthcare Holdings LLC | | |
| 5.75%, due 3/1/25 (b) | 1,500,000 | 1,524,375 |
| Open Text Corp. | | |
| 5.875%, due 6/1/26 (b) | 2,500,000 | 2,578,125 |
| PTC, Inc. | | |
| 3.625%, due 2/15/25 (b) | 6,870,000 | 7,048,276 |
| Veritas US, Inc. | | |
| 7.50%, due 9/1/25 (b) | 1,250,000 | 1,293,750 |
| | | 33,474,471 |
| Telecommunications 7.1% |
| CommScope Technologies LLC | | |
| 6.00%, due 6/15/25 (b) | 1,421,000 | 1,445,867 |
| Hughes Satellite Systems Corp. | | |
| 7.625%, due 6/15/21 | 2,255,000 | 2,270,334 |
| Level 3 Financing, Inc. | | |
| 5.375%, due 5/1/25 | 6,000,000 | 6,132,000 |
| Lumen Technologies, Inc. | | |
| Series T | | |
| 5.80%, due 3/15/22 | 9,200,000 | 9,489,800 |
| Series S | | |
| 6.45%, due 6/15/21 | 3,500,000 | 3,517,500 |
| Series W | | |
| 6.75%, due 12/1/23 | 6,000,000 | 6,622,500 |
| Sprint Communications, Inc. | | |
| 9.25%, due 4/15/22 | 2,500,000 | 2,681,250 |
| Sprint Corp. | | |
| 7.875%, due 9/15/23 | 29,145,000 | 33,225,300 |
| T-Mobile US, Inc. | | |
| 2.25%, due 2/15/26 | 29,000,000 | 29,183,569 |
| 4.00%, due 4/15/22 | 6,045,000 | 6,181,012 |
| 4.50%, due 2/1/26 | 2,000,000 | 2,050,000 |
| 5.125%, due 4/15/25 | 2,000,000 | 2,034,400 |
| 5.375%, due 4/15/27 | 570,000 | 603,488 |
| 6.00%, due 3/1/23 | 6,755,000 | 6,812,080 |
| | | 112,249,100 |
| Textiles 0.1% |
| Eagle Intermediate Global Holding BV | | |
| 7.50%, due 5/1/25 (b) | 1,610,000 | 1,461,075 |
The notes to the financial statements are an integral part of, and should be read in conjunction with, the financial statements.
| 16 | MainStay MacKay Short Duration High Yield Fund |
| | Principal
Amount | Value |
| Corporate Bonds (continued) |
| Toys, Games & Hobbies 0.6% |
| Mattel, Inc. | | |
| 3.15%, due 3/15/23 | $ 3,760,000 | $ 3,854,865 |
| 3.375%, due 4/1/26 (b) | 2,500,000 | 2,588,050 |
| 6.75%, due 12/31/25 (b) | 3,162,000 | 3,321,681 |
| | | 9,764,596 |
| Transportation 0.3% |
| Teekay Corp. | | |
| 9.25%, due 11/15/22 (b) | 1,935,000 | 1,973,700 |
| Watco Cos. LLC | | |
| 6.50%, due 6/15/27 (b) | 3,000,000 | 3,195,000 |
| | | 5,168,700 |
Total Corporate Bonds
(Cost $1,140,167,093) | | 1,176,544,627 |
| Loan Assignments 17.2% |
| Aerospace & Defense 1.0% |
| SkyMiles IP Ltd. | | |
| Initial Term Loan | | |
| 4.75% (3 Month LIBOR + 3.75%), due 10/20/27 (l) | 4,500,000 | 4,726,876 |
| Spirit Aerosystems, Inc. Initial Term Loan | | |
| 6.00% (1 Month LIBOR + 5.25%), due 1/15/25 (l) | 1,296,750 | 1,301,613 |
| TransDigm, Inc. | | |
| Tranche Refinancing Term Loan F | | |
| 2.363% (1 Month LIBOR + 2.25%), due 12/9/25 (l) | 9,875,000 | 9,748,195 |
| | | 15,776,684 |
| Automobile 0.6% |
| Dealer Tire LLC Term Loan B1 | | |
| 4.363% (1 Month LIBOR + 4.25%), due 1/1/38 (l) | 4,147,500 | 4,143,610 |
| Tenneco Inc. Tranche Term Loan B | | |
| 3.113% (1 Month LIBOR + 3.00%), due 10/1/25 (l) | 2,954,660 | 2,880,793 |
| Wheel Pros LLC Term Loan | | |
| TBD, due 4/23/28 | 3,200,000 | 3,196,000 |
| | | 10,220,403 |
| | Principal
Amount | Value |
| |
| Beverage, Food & Tobacco 0.6% |
| B&G Foods, Inc. | | |
| Tranche Term Loan B4 | | |
| 2.613% (1 Month LIBOR + 2.50%), due 10/10/26 (l) | $ 3,303,333 | $ 3,296,453 |
| United Natural Foods, Inc. | | |
| Initial Term Loan | | |
| 3.613% (1 Month LIBOR + 3.50%), due 10/22/25 (l) | 5,485,281 | 5,479,477 |
| | | 8,775,930 |
| Chemicals, Plastics & Rubber 1.5% |
| Innophos Holdings, Inc. | | |
| Initial Term Loan | | |
| 3.613% (1 Month LIBOR + 3.50%), due 2/5/27 (l) | 4,257,000 | 4,243,697 |
| Jazz Pharmaceuticals, Inc. | | |
| Term Loan | | |
| TBD, due 4/21/28 | 5,000,000 | 5,011,250 |
| Meredith Corp. Tranche Term Loan B2 | | |
| 2.613% (1 Month LIBOR + 2.50%), due 1/31/25 (l) | 2,140,080 | 2,111,844 |
| PPD, Inc. | | |
| Initial Term Loan | | |
| 2.75% (1 Month LIBOR + 2.25%), due 1/13/28 (l) | 5,000,000 | 4,988,750 |
| SCIH Salt Holdings, Inc. | | |
| Term Loan B | | |
| TBD, due 3/16/27 | 7,400,000 | 7,363,000 |
| | | 23,718,541 |
| Containers, Packaging & Glass 0.1% |
| Neenah Foundry Co. Term Loan | | |
| 10.00% (2 Month LIBOR + 9.00%), due 12/13/22 (l) | 2,630,226 | 2,235,692 |
| Diversified/Conglomerate Service 0.5% |
| Change Healthcare Holdings, Inc. | | |
| Closing Date Term Loan | | |
| 3.50% (1 Month LIBOR + 2.50%, 3 Month LIBOR + 2.50%), due 3/1/24 (l) | 2,047,254 | 2,044,696 |
| WEX, Inc. | | |
| Term Loan B | | |
| 2.363% (1 Month LIBOR + 2.25%), due 3/31/28 (l) | 6,600,000 | 6,567,000 |
| | | 8,611,696 |
The notes to the financial statements are an integral part of, and should be read in conjunction with, the financial statements.
17
Portfolio of Investments April 30, 2021† (Unaudited) (continued)
| | Principal
Amount | Value |
| Loan Assignments (continued) |
| Electronics 1.0% |
| Camelot U.S. Acquisition 1 Co. (l) | | |
| Initial Term Loan | | |
| 3.113% (1 Month LIBOR + 3.00%), due 10/30/26 | $ 9,240,817 | $ 9,148,408 |
| Amendment No. 2 Incremental Term Loan | | |
| 4.00% (1 Month LIBOR + 3.00%), due 10/30/26 | 2,992,500 | 2,993,248 |
| CommScope, Inc. | | |
| Initial Term Loan | | |
| 3.363% (1 Month LIBOR + 3.25%), due 4/6/26 (l) | 2,955,000 | 2,929,605 |
| | | 15,071,261 |
| Entertainment 0.4% |
| CCM Merger Inc. Term B Loan | | |
| 4.50% (3 Month LIBOR + 3.75%), due 11/4/25 (l) | 2,490,909 | 2,489,870 |
| NAI Entertainment Holdings LLC Tranche Term Loan B | | |
| 3.50% (1 Month LIBOR + 2.50%), due 5/8/25 (l) | 3,261,667 | 3,194,395 |
| | | 5,684,265 |
| Finance 3.0% |
| AAdvantage Loyalty IP Ltd. | | |
| Initial Term Loan | | |
| 5.50% (6 Month LIBOR + 4.75%), due 4/20/28 (l) | 1,750,000 | 1,796,758 |
| American Trailer World Corp. 1st Lien Initial Term Loan | | |
| 4.50% (1 Month LIBOR + 3.75%), due 3/3/28 (l) | 4,800,000 | 4,761,000 |
| BY Crown Parent LLC Initial Term Loan B1 | | |
| 4.00% (1 Month LIBOR + 3.00%), due 2/2/26 (l) | 5,967,181 | 5,959,723 |
| Cimpress Public Limited Co. Term Loan | | |
| TBD, due 4/14/28 | 5,000,000 | 4,950,000 |
| Great Outdoors Group LLC | | |
| Term Loan B1 | | |
| 5.00% (3 Month LIBOR + 4.25%), due 3/6/28 (l) | 14,962,500 | 15,014,869 |
| | Principal
Amount | Value |
| |
| Finance (continued) |
| Jefferies Finance LLC Closing Date Term Loan | | |
| 3.125% (1 Month LIBOR + 3.00%), due 6/3/26 (l) | $ 3,930,000 | $ 3,890,700 |
| Mileage Plus Holdings LLC Initial Term Loan | | |
| 6.25% (3 Month LIBOR + 5.25%), due 6/21/27 (l) | 2,500,000 | 2,664,845 |
| Rent-A-Center, Inc. Initial Term Loan | | |
| 4.75% (1 Month LIBOR + 4.00%), due 2/17/28 (l) | 750,000 | 752,812 |
| Schweitzer-Mauduit International, Inc. Term Loan B | | |
| 4.50%, due 1/27/28 | 3,350,000 | 3,333,250 |
| Truck Hero, Inc. | | |
| Initial Term Loan | | |
| 4.50% (1 Month LIBOR + 3.75%), due 1/31/28 (l) | 4,000,000 | 3,989,000 |
| | | 47,112,957 |
| Healthcare, Education & Childcare 1.9% |
| Ascend Learning LLC Amendment No. 2 Incremental Term Loan | | |
| 4.75% (1 Month LIBOR + 3.75%), due 7/12/24 (l) | 1,990,000 | 1,990,000 |
| Ascend Learning LLC Initial Term Loan | | |
| 4.00% (1 Month LIBOR + 3.00%), due 7/12/24 (l) | 7,900,768 | 7,882,430 |
| Catalent Pharma Solutions, Inc. Dollar Term Loan B3 | | |
| 2.50% (1 Month LIBOR + 2.00%), due 2/22/28 (l) | 2,515,324 | 2,514,275 |
| Endo Luxembourg Finance Co. I SARL | | |
| 2021 Term Loan B | | |
| 5.75% (1 Month LIBOR + 5.00%), due 3/27/28 (l) | 2,700,000 | 2,624,063 |
| LifePoint Health, Inc. | | |
| First Lien Term Loan B | | |
| 3.863% (1 Month LIBOR + 3.75%), due 11/16/25 (l) | 6,923,139 | 6,896,312 |
| Organon & Co. | | |
| Term Loan | | |
| TBD, due 4/8/28 | 9,000,000 | 8,972,676 |
| | | 30,879,756 |
The notes to the financial statements are an integral part of, and should be read in conjunction with, the financial statements.
| 18 | MainStay MacKay Short Duration High Yield Fund |
| | Principal
Amount | Value |
| Loan Assignments (continued) |
| Hotels, Motels, Inns & Gaming 0.7% |
| Churchill Downs, Inc. | | |
| Facility Term Loan B | | |
| 2.12% (1 Month LIBOR + 2.00%), due 12/27/24 (l) | $ 3,870,000 | $ 3,857,101 |
| Churchill Downs, Inc. Incremental Term Loan B | | |
| 2.12% (1 Month LIBOR + 2.00%), due 3/17/28 (l) | 2,500,000 | 2,492,187 |
| Four Seasons Holdings, Inc. | | |
| First Lien 2013 Term Loan | | |
| 2.113% (1 Month LIBOR + 2.00%), due 11/30/23 (l) | 5,495,363 | 5,480,097 |
| | | 11,829,385 |
| Insurance 0.6% |
| USI, Inc. | | |
| 2017 New Term Loan | | |
| 3.203% (3 Month LIBOR + 3.00%), due 5/16/24 (l) | 9,351,850 | 9,243,303 |
| Leisure, Amusement, Motion Pictures & Entertainment 0.2% |
| NASCAR Holdings LLC Initial Term Loan | | |
| 2.859% (1 Month LIBOR + 2.75%), due 10/19/26 (l) | 2,680,723 | 2,655,592 |
| Machinery (Non-Agriculture, Non-Construct & Non-Electronic) 0.1% |
| Altra Industrial Motion Corp. | | |
| Term Loan | | |
| 2.113% (1 Month LIBOR + 2.00%), due 10/1/25 (l) | 2,059,037 | 2,047,455 |
| Manufacturing 0.6% |
| Adient US LLC Term Loan B1 | | |
| 3.50% (1 Month LIBOR + 3.50%), due 4/10/28 (l) | 9,500,000 | 9,488,125 |
| Media 1.5% |
| Allen Media LLC Initial Term Loan | | |
| 5.703% (3 Month LIBOR + 5.50%), due 2/10/27 (l) | 5,097,688 | 5,089,190 |
| Block Communications, Inc. Term Loan | | |
| 2.453% (3 Month LIBOR + 2.25%), due 2/25/27 (l) | 11,632,500 | 11,574,338 |
| | Principal
Amount | Value |
| |
| Media (continued) |
| Lamar Media Corp. Term Loan B | | |
| 1.61% (1 Month LIBOR + 1.50%), due 2/5/27 (l) | $ 7,368,750 | $ 7,270,502 |
| | | 23,934,030 |
| Oil & Gas 0.4% |
| Ascent Resources Utica Holdings LLC Second Lien Term Loan | | |
| 10.00% (3 Month LIBOR + 9.00%), due 11/1/25 (l) | 3,240,000 | 3,578,175 |
| PetroQuest Energy LLC 2020 Term Loan | | |
| TBD, due 9/19/26 (c)(d)(e) | 208,858 | 208,858 |
| PetroQuest Energy LLC Term Loan | | |
| 8.50% (1 Month LIBOR + 7.50%), due 11/8/23 (c)(d)(e)(l) | 3,252,378 | 2,666,950 |
| | | 6,453,983 |
| Personal & Nondurable Consumer Products 0.3% |
| Prestige Brands, Inc. | | |
| Term Loan B4 | | |
| 2.109% (1 Month LIBOR + 2.00%), due 1/26/24 (l) | 1,397,657 | 1,398,749 |
| Twin River Worldwide Holdings, Inc. Facility Term Loan B | | |
| 2.953% (3 Month LIBOR + 2.75%), due 5/11/26 (l) | 3,438,750 | 3,402,643 |
| | | 4,801,392 |
| Personal, Food & Miscellaneous Services 0.5% |
| KFC Holding Co. | | |
| 2021 Term Loan B | | |
| 1.865% (1 Month LIBOR + 1.75%), due 3/15/28 (l) | 2,638,191 | 2,636,307 |
| WW International, Inc. | | |
| Initial Term Loan | | |
| 4.00% (1 Month LIBOR + 3.50%), due 4/13/28 (l) | 5,550,000 | 5,552,315 |
| | | 8,188,622 |
| Telecommunications 0.7% |
| Connect Finco SARL | | |
| Amendement No.1 Refinancing Term Loan | | |
| 4.50% (1 Month LIBOR + 3.50%), due 12/11/26 (l) | 8,811,000 | 8,781,633 |
The notes to the financial statements are an integral part of, and should be read in conjunction with, the financial statements.
19
Portfolio of Investments April 30, 2021† (Unaudited) (continued)
| | Principal
Amount | Value |
| Loan Assignments (continued) |
| Telecommunications (continued) |
| LogMeIn, Inc. First Lien Initial Term Loan | | |
| 4.86% (1 Month LIBOR + 4.75%), due 8/31/27 (l) | $ 1,496,250 | $ 1,493,311 |
| | | 10,274,944 |
| Utilities 1.0% |
| ExGen Renewables IV LLC | | |
| Term Loan | | |
| 3.75% (3 Month LIBOR + 2.75%), due 12/15/27 (l) | 2,992,500 | 2,991,878 |
| PG&E Corp. | | |
| Term Loan | | |
| 3.50% (3 Month LIBOR + 3.00%), due 6/23/25 (l) | 12,902,500 | 12,846,051 |
| | | 15,837,929 |
Total Loan Assignments
(Cost $272,082,885) | | 272,841,945 |
Total Long-Term Bonds
(Cost $1,444,993,015) | | 1,483,718,506 |
| |
| | Shares | |
| Common Stocks 0.5% |
| Electrical Equipment 0.2% |
| Energy Technologies, Inc. (c)(d)(e)(m) | 2,021 | 3,839,900 |
| Hotels, Restaurants & Leisure 0.0% ‡ |
| Carlson Travel, Inc. (c)(e)(i)(m) | 3,199 | 177,737 |
| Independent Power and Renewable Electricity Producers 0.2% |
| GenOn Energy, Inc. (c)(i) | 20,915 | 2,562,088 |
| Oil, Gas & Consumable Fuels 0.1% |
| California Resources Corp. (m) | 20,846 | 494,050 |
| PetroQuest Energy, Inc. (c)(d)(e)(m) | 1,186,631 | — |
| Talos Energy, Inc. (m) | 91,517 | 1,024,075 |
| | | 1,518,125 |
Total Common Stocks
(Cost $7,383,911) | | 8,097,850 |
| | Shares | | Value |
| Preferred Stock 0.2% |
| Electrical Equipment 0.2% |
| Energy Technologies Ltd. (c)(d)(e)(m) | 4,501 | | $ 3,555,790 |
Total Preferred Stock
(Cost $4,295,472) | | | 3,555,790 |
| |
| | Number of
Warrants | | |
| Warrant 0.0% ‡ |
| Oil, Gas & Consumable Fuels 0.0% ‡ |
| California Resources Corp. | | | |
| Expires 10/27/24 (m) | 2,650 | | 10,600 |
Total Warrant
(Cost $1,060) | | | 10,600 |
Total Investments
(Cost $1,456,673,458) | 94.3% | | 1,495,382,746 |
| Other Assets, Less Liabilities | 5.7 | | 89,628,795 |
| Net Assets | 100.0% | | $ 1,585,011,541 |
| † | Percentages indicated are based on Fund net assets. |
| ‡ | Less than one-tenth of a percent. |
| (a) | PIK ("Payment-in-Kind")—issuer may pay interest or dividends with additional securities and/or in cash. |
| (b) | May be sold to institutional investors only under Rule 144A or securities offered pursuant to Section 4(a)(2) of the Securities Act of 1933, as amended. |
| (c) | Fair valued security—Represents fair value as measured in good faith under procedures approved by the Board of Trustees. As of April 30, 2021, the total market value was $17,681,243, which represented 1.1% of the Fund’s net assets. |
| (d) | Illiquid security—As of April 30, 2021, the total market value deemed illiquid under procedures approved by the Board of Trustees was $22,466,832, which represented 1.4% of the Fund’s net assets. |
| (e) | Security in which significant unobservable inputs (Level 3) were used in determining fair value. |
| (f) | Step coupon—Rate shown was the rate in effect as of April 30, 2021. |
| (g) | Issue in default. |
| (h) | Issue in non-accrual status. |
| (i) | Restricted security. (See Note 6) |
| (j) | Fixed to floating rate—Rate shown was the rate in effect as of April 30, 2021. |
| (k) | Security is perpetual and, thus, does not have a predetermined maturity date. The date shown, if applicable, reflects the next call date. |
| (l) | Floating rate—Rate shown was the rate in effect as of April 30, 2021. |
| (m) | Non-income producing security. |
The notes to the financial statements are an integral part of, and should be read in conjunction with, the financial statements.
| 20 | MainStay MacKay Short Duration High Yield Fund |
| Abbreviation(s): |
| LIBOR—London Interbank Offered Rate |
| TBD—To Be Determined |
The following is a summary of the fair valuations according to the inputs used as of April 30, 2021, for valuing the Fund’s assets:
| Description | Quoted
Prices in
Active
Markets for
Identical
Assets
(Level 1) | | Significant
Other
Observable
Inputs
(Level 2) | | Significant
Unobservable
Inputs
(Level 3) | | Total |
| Asset Valuation Inputs | | | | | | | |
| Investments in Securities (a) | | | | | | | |
| Long-Term Bonds | | | | | | | |
| Convertible Bonds | $ — | | $ 34,331,934 | | $ — | | $ 34,331,934 |
| Corporate Bonds | — | | 1,171,874,707 | | 4,669,920 | | 1,176,544,627 |
| Loan Assignments | — | | 269,966,137 | | 2,875,808 | | 272,841,945 |
| Total Long-Term Bonds | — | | 1,476,172,778 | | 7,545,728 | | 1,483,718,506 |
| Common Stocks | 1,518,125 | | 2,562,088 | | 4,017,637 | | 8,097,850 |
| Preferred Stock | — | | — | | 3,555,790 | | 3,555,790 |
| Warrant | 10,600 | | — | | — | | 10,600 |
| Total Investments in Securities | $ 1,528,725 | | $ 1,478,734,866 | | $ 15,119,155 | | $ 1,495,382,746 |
| (a) | For a complete listing of investments and their industries, see the Portfolio of Investments. |
The following is a reconciliation of investments in which significant unobservable inputs (Level 3) were used in determining value:
Investments in
Securities | Balance
as of
October 31,
2020 | | Accrued
Discounts
(Premiums) | | Realized
Gain
(Loss) | | Change in
Unrealized
Appreciation
(Depreciation) | | Purchases | | Sales | | Transfers
in to
Level 3 | | Transfers
out of
Level 3 | | Balance
as of
April 30,
2021 | | Change in
Unrealized
Appreciation
(Depreciation)
from
Investments
Still Held as
of April 30,
2021 |
| Long-Term Bonds | | | | | | | | | | | | | | | | | | | |
| Corporate Bonds | $ 4,440,753 | | $23,767 | | $(1,303,311) | | $1,508,711 | | $ — | | $— | | $ — | | $ — | | $ 4,669,920 | | $1,508,711 |
| Loan Assignments | 7,414,622 | | — | | — | | (28,744) | | 167,131 | | — | | 201,417 | | (4,878,618) | | 2,875,808 | | (28,744) |
| Common Stocks | 4,582,974 | | — | | — | | 2,761,562 | | 19,501 | | — | | — | | (3,346,400) | | 4,017,637 | | 2,761,562 |
| Preferred Stock | 4,054,951 | | — | | — | | (499,161) | | — | | — | | — | | — | | 3,555,790 | | (499,161) |
| Total | $20,493,300 | | $23,767 | | $(1,303,311) | | $3,742,368 | | $186,632 | | $— | | $201,417 | | $(8,225,018) | | $15,119,155 | | $3,742,368 |
As of April 30, 2021, a Loan Assignment with a market value of $201,417 transferred from Level 2 to Level 3 as the the fair value for this Loan Assignment utilized significant unobservable inputs. As of October 31, 2020, the fair value obtained for this Loan Assignment utilized significant other observable inputs.
As of April 30, 2021, a Common Stock with a market value of $3,346,400 transferred from Level 3 to Level 2 as the fair value obtained for this Common Stock utilized significant other observable inputs. As of October 31, 2020, the fair value obtained for this Common Stock utilized significant unobservable inputs.
As of April 30, 2021, Loan Assignments with a market value of $4,878,618 transferred from Level 3 to Level 2 as the the fair value obtained by an independent pricing service, utilized significant other observable inputs. As of October 31, 2020, the fair value obtained for these Loan Assignments, as determined by an independent pricing service, utilized significant unobservable inputs.
The notes to the financial statements are an integral part of, and should be read in conjunction with, the financial statements.
21
Statement of Assets and Liabilities as of April 30, 2021 (Unaudited)
| Assets |
Investment in securities, at value
(identified cost $1,456,673,458) | $1,495,382,746 |
| Cash | 111,463,871 |
| Receivables: | |
| Interest | 19,654,570 |
| Fund shares sold | 3,969,111 |
| Investment securities sold | 421,836 |
| Other assets | 93,747 |
| Total assets | 1,630,985,881 |
| Liabilities |
| Payables: | |
| Investment securities purchased | 42,237,519 |
| Fund shares redeemed | 1,997,145 |
| Manager (See Note 3) | 835,756 |
| Dividend payable | 481,214 |
| Transfer agent (See Note 3) | 204,683 |
| NYLIFE Distributors (See Note 3) | 90,685 |
| Professional fees | 60,078 |
| Shareholder communication | 47,481 |
| Custodian | 12,744 |
| Accrued expenses | 7,035 |
| Total liabilities | 45,974,340 |
| Net assets | $1,585,011,541 |
| Composition of Net Assets |
| Shares of beneficial interest outstanding (par value of $.001 per share) unlimited number of shares authorized | $ 160,796 |
| Additional paid-in-capital | 1,609,789,526 |
| | 1,609,950,322 |
| Total distributable earnings (loss) | (24,938,781) |
| Net assets | $1,585,011,541 |
| Class A | |
| Net assets applicable to outstanding shares | $ 289,669,519 |
| Shares of beneficial interest outstanding | 29,392,244 |
| Net asset value per share outstanding | $ 9.86 |
| Maximum sales charge (3.00% of offering price) | 0.30 |
| Maximum offering price per share outstanding | $ 10.16 |
| Investor Class | |
| Net assets applicable to outstanding shares | $ 6,026,667 |
| Shares of beneficial interest outstanding | 611,374 |
| Net asset value per share outstanding | $ 9.86 |
| Maximum sales charge (2.50% of offering price) | 0.25 |
| Maximum offering price per share outstanding | $ 10.11 |
| Class C | |
| Net assets applicable to outstanding shares | $ 37,629,784 |
| Shares of beneficial interest outstanding | 3,819,287 |
| Net asset value and offering price per share outstanding | $ 9.85 |
| Class I | |
| Net assets applicable to outstanding shares | $1,251,050,622 |
| Shares of beneficial interest outstanding | 126,908,653 |
| Net asset value and offering price per share outstanding | $ 9.86 |
| Class R2 | |
| Net assets applicable to outstanding shares | $ 508,473 |
| Shares of beneficial interest outstanding | 51,603 |
| Net asset value and offering price per share outstanding | $ 9.85 |
| Class R3 | |
| Net assets applicable to outstanding shares | $ 126,476 |
| Shares of beneficial interest outstanding | 12,831 |
| Net asset value and offering price per share outstanding | $ 9.86 |
The notes to the financial statements are an integral part of, and should be read in conjunction with, the financial statements.
| 22 | MainStay MacKay Short Duration High Yield Fund |
Statement of Operations for the six months ended April 30, 2021 (Unaudited)
| Investment Income (Loss) |
| Income | |
| Interest | $36,266,942 |
| Dividends | 885,705 |
| Securities lending | 60 |
| Other | 35,919 |
| Total income | 37,188,626 |
| Expenses | |
| Manager (See Note 3) | 4,809,388 |
| Transfer agent (See Note 3) | 597,591 |
| Distribution/Service—Class A (See Note 3) | 332,498 |
| Distribution/Service—Investor Class (See Note 3) | 7,864 |
| Distribution/Service—Class C (See Note 3) | 198,416 |
| Distribution/Service—Class R2 (See Note 3) | 668 |
| Distribution/Service—Class R3 (See Note 3) | 368 |
| Registration | 75,272 |
| Professional fees | 72,405 |
| Shareholder communication | 44,776 |
| Custodian | 18,489 |
| Trustees | 15,599 |
| Insurance | 6,581 |
| Shareholder service (See Note 3) | 341 |
| Miscellaneous | 25,118 |
| Total expenses | 6,205,374 |
| Net investment income (loss) | 30,983,252 |
| Realized and Unrealized Gain (Loss) |
| Net realized gain (loss) on investments | (4,169,315) |
| Net change in unrealized appreciation (depreciation) on investments | 67,815,748 |
| Net realized and unrealized gain (loss) | 63,646,433 |
| Net increase (decrease) in net assets resulting from operations | $94,629,685 |
The notes to the financial statements are an integral part of, and should be read in conjunction with, the financial statements.
23
Statements of Changes in Net Assets
for the six months ended April 30, 2021 (Unaudited) and the year ended October 31, 2020
| | 2021 | 2020 |
| Increase (Decrease) in Net Assets |
| Operations: | | |
| Net investment income (loss) | $ 30,983,252 | $ 67,061,434 |
| Net realized gain (loss) | (4,169,315) | (38,702,247) |
| Net change in unrealized appreciation (depreciation) | 67,815,748 | (28,547,224) |
| Net increase (decrease) in net assets resulting from operations | 94,629,685 | (188,037) |
| Distributions to shareholders: | | |
| Class A | (5,994,444) | (11,620,625) |
| Investor Class | (137,188) | (305,824) |
| Class C | (713,137) | (1,732,272) |
| Class I | (27,623,388) | (56,139,473) |
| Class R2 | (11,610) | (23,902) |
| Class R3 | (2,942) | (5,766) |
| Total distributions to shareholders | (34,482,709) | (69,827,862) |
| Capital share transactions: | | |
| Net proceeds from sales of shares | 352,227,371 | 762,341,966 |
| Net asset value of shares issued to shareholder in reinvestment of distributions | 31,310,882 | 62,981,555 |
| Cost of shares redeemed | (260,413,928) | (916,343,150) |
| Increase (decrease) in net assets derived from capital share transactions | 123,124,325 | (91,019,629) |
| Net increase (decrease) in net assets | 183,271,301 | (161,035,528) |
| Net Assets |
| Beginning of period | 1,401,740,240 | 1,562,775,768 |
| End of period | $1,585,011,541 | $1,401,740,240 |
The notes to the financial statements are an integral part of, and should be read in conjunction with, the financial statements.
| 24 | MainStay MacKay Short Duration High Yield Fund |
Financial Highlights selected per share data and ratios
| | Six months ended
April 30,
2021* | | Year Ended October 31, |
| Class A | 2020 | | 2019 | | 2018 | | 2017 | | 2016 |
| Net asset value at beginning of period | $ 9.45 | | $ 9.84 | | $ 9.76 | | $ 9.96 | | $ 9.90 | | $ 9.77 |
| Net investment income (loss) | 0.19 | | 0.42 | | 0.44 | | 0.42 | | 0.42 | | 0.50 |
| Net realized and unrealized gain (loss) on investments | 0.44 | | (0.37) | | 0.08 | | (0.21) | | 0.06 | | 0.13 |
| Total from investment operations | 0.63 | | 0.05 | | 0.52 | | 0.21 | | 0.48 | | 0.63 |
| Less distributions: | | | | | | | | | | | |
| From net investment income | (0.22) | | (0.44) | | (0.44) | | (0.41) | | (0.42) | | (0.50) |
| Net asset value at end of period | $ 9.86 | | $ 9.45 | | $ 9.84 | | $ 9.76 | | $ 9.96 | | $ 9.90 |
| Total investment return (a) | 6.68% | | 0.65% | | 5.40% | | 2.09% | | 4.90% | | 6.79% |
| Ratios (to average net assets)/Supplemental Data: | | | | | | | | | | | |
| Net investment income (loss) | 4.01%†† | | 4.46% | | 4.48% | | 4.06% | | 4.18% | | 5.29% |
| Net expenses (b) | 1.01%†† | | 1.02% | | 1.04% | | 1.05% | | 1.04% | | 1.02% |
| Expenses (before waiver/reimbursement) (b) | 1.01%†† | | 1.02% | | 1.04% | | 1.07% | | 1.04% | | 1.02% |
| Portfolio turnover rate | 25% | | 64% | | 32% | | 62% | | 57% | | 50% |
| Net assets at end of period (in 000’s) | $ 289,670 | | $ 252,753 | | $ 237,475 | | $ 180,140 | | $ 341,056 | | $ 163,500 |
| * | Unaudited. |
| †† | Annualized. |
| (a) | Total investment return is calculated exclusive of sales charges and assumes the reinvestment of dividends and distributions. For periods of less than one year, total return is not annualized. |
| (b) | In addition to the fees and expenses which the Fund bears directly, it also indirectly bears a pro-rata share of the fees and expenses of the underlying funds in which it invests. Such indirect expenses are not included in the above expense ratios. |
| | Six months ended
April 30,
2021* | | Year Ended October 31, |
| Investor Class | 2020 | | 2019 | | 2018 | | 2017 | | 2016 |
| Net asset value at beginning of period | $ 9.46 | | $ 9.84 | | $ 9.76 | | $ 9.96 | | $ 9.90 | | $ 9.77 |
| Net investment income (loss) | 0.22 | | 0.42 | | 0.43 | | 0.40 | | 0.41 | | 0.49 |
| Net realized and unrealized gain (loss) on investments | 0.39 | | (0.36) | | 0.08 | | (0.20) | | 0.06 | | 0.13 |
| Total from investment operations | 0.61 | | 0.06 | | 0.51 | | 0.20 | | 0.47 | | 0.62 |
| Less distributions: | | | | | | | | | | | |
| From net investment income | (0.21) | | (0.44) | | (0.43) | | (0.40) | | (0.41) | | (0.49) |
| Net asset value at end of period | $ 9.86 | | $ 9.46 | | $ 9.84 | | $ 9.76 | | $ 9.96 | | $ 9.90 |
| Total investment return (a) | 6.52% | | 0.67% | | 5.33% | | 2.05% | | 4.82% | | 6.67% |
| Ratios (to average net assets)/Supplemental Data: | | | | | | | | | | | |
| Net investment income (loss) | 4.44%†† | | 4.38% | | 4.40% | | 4.03% | | 4.16% | | 5.18% |
| Net expenses (b) | 1.11%†† | | 1.11% | | 1.11% | | 1.09% | | 1.11% | | 1.13% |
| Expenses (before waiver/reimbursement) (b) | 1.11%†† | | 1.11% | | 1.11% | | 1.11% | | 1.11% | | 1.13% |
| Portfolio turnover rate | 25% | | 64% | | 32% | | 62% | | 57% | | 50% |
| Net assets at end of period (in 000’s) | $ 6,027 | | $ 6,278 | | $ 7,156 | | $ 6,193 | | $ 5,564 | | $ 6,044 |
| * | Unaudited. |
| †† | Annualized. |
| (a) | Total investment return is calculated exclusive of sales charges and assumes the reinvestment of dividends and distributions. For periods of less than one year, total return is not annualized. |
| (b) | In addition to the fees and expenses which the Fund bears directly, it also indirectly bears a pro-rata share of the fees and expenses of the underlying funds in which it invests. Such indirect expenses are not included in the above expense ratios. |
The notes to the financial statements are an integral part of, and should be read in conjunction with, the financial statements.
25
Financial Highlights selected per share data and ratios
| | Six months ended
April 30,
2021* | | Year Ended October 31, |
| Class C | 2020 | | 2019 | | 2018 | | 2017 | | 2016 |
| Net asset value at beginning of period | $ 9.45 | | $ 9.84 | | $ 9.76 | | $ 9.96 | | $ 9.90 | | $ 9.76 |
| Net investment income (loss) | 0.16 | | 0.34 | | 0.36 | | 0.32 | | 0.34 | | 0.42 |
| Net realized and unrealized gain (loss) on investments | 0.42 | | (0.37) | | 0.08 | | (0.19) | | 0.05 | | 0.14 |
| Total from investment operations | 0.58 | | (0.03) | | 0.44 | | 0.13 | | 0.39 | | 0.56 |
| Less distributions: | | | | | | | | | | | |
| From net investment income | (0.18) | | (0.36) | | (0.36) | | (0.33) | | (0.33) | | (0.42) |
| Net asset value at end of period | $ 9.85 | | $ 9.45 | | $ 9.84 | | $ 9.76 | | $ 9.96 | | $ 9.90 |
| Total investment return (a) | 6.12% | | (0.19)% | | 4.54% | | 1.29% | | 4.04% | | 5.99% |
| Ratios (to average net assets)/Supplemental Data: | | | | | | | | | | | |
| Net investment income (loss) | 3.23%†† | | 3.64% | | 3.65% | | 3.28% | | 3.42% | | 4.43% |
| Net expenses (b) | 1.86%†† | | 1.86% | | 1.86% | | 1.84% | | 1.86% | | 1.88% |
| Expenses (before waiver/reimbursement) (b) | 1.86%†† | | 1.86% | | 1.86% | | 1.86% | | 1.86% | | 1.88% |
| Portfolio turnover rate | 25% | | 64% | | 32% | | 62% | | 57% | | 50% |
| Net assets at end of period (in 000’s) | $ 37,630 | | $ 40,948 | | $ 48,550 | | $ 48,415 | | $ 51,738 | | $ 51,063 |
| * | Unaudited. |
| †† | Annualized. |
| (a) | Total investment return is calculated exclusive of sales charges and assumes the reinvestment of dividends and distributions. For periods of less than one year, total return is not annualized. |
| (b) | In addition to the fees and expenses which the Fund bears directly, it also indirectly bears a pro-rata share of the fees and expenses of the underlying funds in which it invests. Such indirect expenses are not included in the above expense ratios. |
| | Six months ended
April 30,
2021* | | Year Ended October 31, |
| Class I | 2020 | | 2019 | | 2018 | | 2017 | | 2016 |
| Net asset value at beginning of period | $ 9.46 | | $ 9.84 | | $ 9.76 | | $ 9.97 | | $ 9.90 | | $ 9.77 |
| Net investment income (loss) | 0.21 | | 0.45 | | 0.46 | | 0.43 | | 0.44 | | 0.53 |
| Net realized and unrealized gain (loss) on investments | 0.42 | | (0.36) | | 0.08 | | (0.21) | | 0.07 | | 0.13 |
| Total from investment operations | 0.63 | | 0.09 | | 0.54 | | 0.22 | | 0.51 | | 0.66 |
| Less distributions: | | | | | | | | | | | |
| From net investment income | (0.23) | | (0.47) | | (0.46) | | (0.43) | | (0.44) | | (0.53) |
| Net asset value at end of period | $ 9.86 | | $ 9.46 | | $ 9.84 | | $ 9.76 | | $ 9.97 | | $ 9.90 |
| Total investment return (a) | 6.70% | | 1.01% | | 5.67% | | 2.26% | | 5.27% | | 7.05% |
| Ratios (to average net assets)/Supplemental Data: | | | | | | | | | | | |
| Net investment income (loss) | 4.25%†† | | 4.72% | | 4.73% | | 4.31% | | 4.46% | | 5.53% |
| Net expenses (b) | 0.76%†† | | 0.77% | | 0.79% | | 0.80% | | 0.79% | | 0.77% |
| Expenses (before waiver/reimbursement) (b) | 0.76%†† | | 0.77% | | 0.79% | | 0.82% | | 0.79% | | 0.77% |
| Portfolio turnover rate | 25% | | 64% | | 32% | | 62% | | 57% | | 50% |
| Net assets at end of period (in 000’s) | $ 1,251,051 | | $ 1,101,084 | | $ 1,268,856 | | $ 771,533 | | $ 626,617 | | $ 431,040 |
| * | Unaudited. |
| †† | Annualized. |
| (a) | Total investment return is calculated exclusive of sales charges and assumes the reinvestment of dividends and distributions. Class I shares are not subject to sales charges. For periods of less than one year, total return is not annualized. |
| (b) | In addition to the fees and expenses which the Fund bears directly, it also indirectly bears a pro-rata share of the fees and expenses of the underlying funds in which it invests. Such indirect expenses are not included in the above expense ratios. |
The notes to the financial statements are an integral part of, and should be read in conjunction with, the financial statements.
| 26 | MainStay MacKay Short Duration High Yield Fund |
Financial Highlights selected per share data and ratios
| | Six months ended
April 30,
2021* | | Year Ended October 31, |
| Class R2 | 2020 | | 2019 | | 2018 | | 2017 | | 2016 |
| Net asset value at beginning of period | $ 9.45 | | $ 9.84 | | $ 9.76 | | $ 9.96 | | $ 9.90 | | $ 9.77 |
| Net investment income (loss) | 0.49 | | 0.41 | | 0.40 | | 0.39 | | 0.41 | | 0.47 |
| Net realized and unrealized gain (loss) on investments | 0.12 | | (0.37) | | 0.11 | | (0.20) | | 0.06 | | 0.16 |
| Total from investment operations | 0.61 | | 0.04 | | 0.51 | | 0.19 | | 0.47 | | 0.63 |
| Less distributions: | | | | | | | | | | | |
| From net investment income | (0.21) | | (0.43) | | (0.43) | | (0.39) | | (0.41) | | (0.50) |
| Net asset value at end of period | $ 9.85 | | $ 9.45 | | $ 9.84 | | $ 9.76 | | $ 9.96 | | $ 9.90 |
| Total investment return (a) | 6.52% | | 0.55% | | 5.31% | | 1.99% | | 4.80% | | 6.69% |
| Ratios (to average net assets)/Supplemental Data: | | | | | | | | | | | |
| Net investment income (loss) | 10.12%†† | | 4.36% | | 4.34% | | 3.97% | | 4.14% | | 5.19% |
| Net expenses (b) | 1.11%†† | | 1.12% | | 1.14% | | 1.15% | | 1.14% | | 1.12% |
| Expenses (before waiver/reimbursement) (b) | 1.11%†† | | 1.12% | | 1.14% | | 1.17% | | 1.14% | | 1.12% |
| Portfolio turnover rate | 25% | | 64% | | 32% | | 62% | | 57% | | 50% |
| Net assets at end of period (in 000’s) | $ 508 | | $ 523 | | $ 538 | | $ 63 | | $ 119 | | $ 111 |
| * | Unaudited. |
| †† | Annualized. |
| (a) | Total investment return is calculated exclusive of sales charges and assumes the reinvestment of dividends and distributions. Class R2 shares are not subject to sales charges. For periods of less than one year, total return is not annualized. |
| (b) | In addition to the fees and expenses which the Fund bears directly, it also indirectly bears a pro-rata share of the fees and expenses of the underlying funds in which it invests. Such indirect expenses are not included in the above expense ratios. |
| | Six months ended
April 30,
2021* | | Year Ended October 31, | | February 29, 2016^ through
October 31,
2016 |
| Class R3 | 2020 | | 2019 | | 2018 | | 2017 | |
| Net asset value at beginning of period | $ 9.46 | | $ 9.84 | | $ 9.76 | | $ 9.97 | | $ 9.91 | | $ 9.23 |
| Net investment income (loss) | 1.27 | | 0.40 | | 0.39 | | 0.37 | | 0.38 | | 0.32 |
| Net realized and unrealized gain (loss) on investments | (0.67) | | (0.37) | | 0.09 | | (0.21) | | 0.06 | | 0.67 |
| Total from investment operations | 0.60 | | 0.03 | | 0.48 | | 0.16 | | 0.44 | | 0.99 |
| Less distributions: | | | | | | | | | | | |
| From net investment income | (0.20) | | (0.41) | | (0.40) | | (0.37) | | (0.38) | | (0.31) |
| Net asset value at end of period | $ 9.86 | | $ 9.46 | | $ 9.84 | | $ 9.76 | | $ 9.97 | | $ 9.91 |
| Total investment return (a) | 6.37% | | 0.41% | | 5.05% | | 1.61% | | 4.54% | | 10.83% |
| Ratios (to average net assets)/Supplemental Data: | | | | | | | | | | | |
| Net investment income (loss) | 26.25%†† | | 4.13% | | 4.12% | | 3.72% | | 3.86% | | 4.84%†† |
| Net expenses (b) | 1.36%†† | | 1.36% | | 1.39% | | 1.40% | | 1.39% | | 1.37%†† |
| Expenses (before waiver/reimbursement) (b) | 1.36%†† | | 1.36% | | 1.39% | | 1.42% | | 1.39% | | 1.37%†† |
| Portfolio turnover rate | 25% | | 64% | | 32% | | 62% | | 57% | | 50% |
| Net assets at end of period (in 000’s) | $ 126 | | $ 154 | | $ 201 | | $ 58 | | $ 55 | | $ 28 |
| * | Unaudited. |
| ^ | Inception date. |
| †† | Annualized. |
| (a) | Total investment return is calculated exclusive of sales charges and assumes the reinvestment of dividends and distributions. Class R3 shares are not subject to sales charges. For periods of less than one year, total return is not annualized. |
| (b) | In addition to the fees and expenses which the Fund bears directly, it also indirectly bears a pro-rata share of the fees and expenses of the underlying funds in which it invests. Such indirect expenses are not included in the above expense ratios. |
The notes to the financial statements are an integral part of, and should be read in conjunction with, the financial statements.
27
Notes to Financial Statements (Unaudited)
Note 1-Organization and Business
MainStay Funds Trust (the “Trust”) was organized as a Delaware statutory trust on April 28, 2009. The Trust is registered under the Investment Company Act of 1940, as amended (the “1940 Act”), as an open-end management investment company, and is comprised of thirty-two funds (collectively referred to as the “Funds”). These financial statements and notes relate to the MainStay MacKay Short Duration High Yield Fund (the "Fund"), a “diversified” fund, as that term is defined in the 1940 Act, as interpreted or modified by regulatory authorities having jurisdiction, from time to time.
The following table lists the Fund's share classes that have been registered and commenced operations:
| Class | Commenced Operations |
| Class A | December 17, 2012 |
| Investor Class | December 17, 2012 |
| Class C | December 17, 2012 |
| Class I | December 17, 2012 |
| Class R2 | December 17, 2012 |
| Class R3 | February 29, 2016 |
| Class R6 | N/A* |
| SIMPLE Class | N/A* |
| * | Class R6 shares were registered for sale effective as of February 28, 2017 and SIMPLE Class shares were registered for sale effective as of August 31, 2020 but have not yet commenced operations. |
Class A and Investor Class shares are offered at net asset value (“NAV”) per share plus an initial sales charge. No initial sales charge applies to investments of $250,000 or more (and certain other qualified purchases) in Class A and Investor Class shares. Effective April 15, 2019, a contingent deferred sales charge (“CDSC”) of 1.00% may be imposed on certain redemptions of Class A and Investor Class shares made within 18 months of the date of purchase on shares that were purchased without an initial sales charge. For purchases of Class A and Investor Class shares made from August 1, 2017 through April 14, 2019, a CDSC of 1.00% may be imposed on certain redemptions (for investments of $500,000 which paid no initial sales charge) of such shares within 18 months of the date of purchase on shares that were purchased without an initial sales charge. Class C shares are offered at NAV without an initial sales charge and a 1.00% CDSC may be imposed on certain redemptions of such shares made within 18 months of the date of purchase of Class C shares. Investments in Class C shares are subject to a purchase maximum of $250,000. Class I, Class R2 and Class R3 shares are offered at NAV without a sales charge. Class R6 and SIMPLE Class shares are currently expected to be offered at NAV without a sales charge. In addition, depending upon eligibility, Class C shares convert to either Class A or Investor Class shares at the end of the calendar quarter ten years after the date they were purchased. Additionally, Investor Class shares may convert automatically to Class A shares. Under certain circumstances and as may be permitted by the Trust’s multiple class plan pursuant to Rule 18f-3 under the 1940 Act, specified share classes of the Fund may be converted to one or more other share classes of the Fund
as disclosed in the capital share transactions within these Notes. The classes of shares have the same voting (except for issues that relate solely to one class), dividend, liquidation and other rights, and the same terms and conditions, except that under a distribution plan pursuant to Rule 12b-1 under the 1940 Act, Class C shares are subject to higher distribution and/or service fees than Class A, Investor Class, Class R2, Class R3 and SIMPLE Class shares. Class I and Class R6 shares are not subject to a distribution and/or service fee. Class R2 and Class R3 shares are subject to a shareholder service fee, which is in addition to fees paid under the distribution plans for Class R2 and Class R3 shares.
The Fund's investment objective is to seek high current income. Capital appreciation is a secondary objective.
Note 2–Significant Accounting Policies
The Fund is an investment company and accordingly follows the investment company accounting and reporting guidance of the Financial Accounting Standards Board (“FASB”) Accounting Standard Codification Topic 946 Financial Services—Investment Companies. The Fund prepares its financial statements in accordance with generally accepted accounting principles (“GAAP”) in the United States of America and follows the significant accounting policies described below.
(A) Securities Valuation. Investments are usually valued as of the close of regular trading on the New York Stock Exchange (the "Exchange") (usually 4:00 p.m. Eastern time) on each day the Fund is open for business ("valuation date").
The Board of Trustees of the Trust (the "Board") adopted procedures establishing methodologies for the valuation of the Fund's securities and other assets and delegated the responsibility for valuation determinations under those procedures to the Valuation Committee of the Trust (the “Valuation Committee”). The procedures state that, subject to the oversight of the Board and unless otherwise noted, the responsibility for the day-to-day valuation of portfolio assets (including fair value measurements for the Fund's assets and liabilities) rests with New York Life Investment Management LLC (“New York Life Investments” or the "Manager"), aided to whatever extent necessary by the Subadvisor (as defined in Note 3(A)). To assess the appropriateness of security valuations, the Manager, the Subadvisor or the Fund's third-party service provider, who is subject to oversight by the Manager, regularly compares prior day prices, prices on comparable securities and the sale prices to the prior and current day prices and challenges prices with changes exceeding certain tolerance levels with third-party pricing services or broker sources.
The Board authorized the Valuation Committee to appoint a Valuation Subcommittee (the “Subcommittee”) to establish the prices of securities for which market quotations are not readily available or the prices of which are not otherwise readily determinable under the procedures. The Subcommittee meets (in person, via electronic mail or via teleconference) on an as-needed basis. The Valuation Committee meets to ensure that actions taken by the Subcommittee were appropriate.
| 28 | MainStay MacKay Short Duration High Yield Fund |
For those securities valued through either a standardized fair valuation methodology or a fair valuation measurement, the Subcommittee deals with such valuation and the Valuation Committee reviews and affirms, if appropriate, the reasonableness of the valuation based on such methodologies and measurements on a regular basis after considering information that is reasonably available and deemed relevant by the Valuation Committee. Any action taken by the Subcommittee with respect to the valuation of a portfolio security or other asset is submitted for review and ratification (if appropriate) to the Valuation Committee and the Board at the next regularly scheduled meeting.
"Fair value" is defined as the price the Fund would reasonably expect to receive upon selling an asset or liability in an orderly transaction to an independent buyer in the principal or most advantageous market for the asset or liability. Fair value measurements are determined within a framework that establishes a three-tier hierarchy that maximizes the use of observable market data and minimizes the use of unobservable inputs to establish a classification of fair value measurements for disclosure purposes. "Inputs" refer broadly to the assumptions that market participants would use in pricing the asset or liability, including assumptions about risk, such as the risk inherent in a particular valuation technique used to measure fair value using a pricing model and/or the risk inherent in the inputs for the valuation technique. Inputs may be observable or unobservable. Observable inputs reflect the assumptions market participants would use in pricing the asset or liability based on market data obtained from sources independent of the Fund. Unobservable inputs reflect the Fund’s own assumptions about the assumptions market participants would use in pricing the asset or liability based on the information available. The inputs or methodology used for valuing assets or liabilities may not be an indication of the risks associated with investing in those assets or liabilities. The three-tier hierarchy of inputs is summarized below.
| • | Level 1—quoted prices in active markets for an identical asset or liability |
| • | Level 2—other significant observable inputs (including quoted prices for a similar asset or liability in active markets, interest rates and yield curves, prepayment speeds, credit risk, etc.) |
| • | Level 3—significant unobservable inputs (including the Fund's own assumptions about the assumptions that market participants would use in measuring fair value of an asset or liability) |
The level of an asset or liability within the fair value hierarchy is based on the lowest level of an input, both individually and in the aggregate, that is significant to the fair value measurement. The aggregate value by input level of the Fund’s assets and liabilities as of April 30, 2021, is included at the end of the Portfolio of Investments.
The Fund may use third-party vendor evaluations, whose prices may be derived from one or more of the following standard inputs, among others:
| • Benchmark yields | • Reported trades |
| • Broker/dealer quotes | • Issuer spreads |
| • Two-sided markets | • Benchmark securities |
| • Bids/offers | • Reference data (corporate actions or material event notices) |
| • Industry and economic events | • Comparable bonds |
| • Monthly payment information | |
An asset or liability for which market values cannot be measured using the methodologies described above is valued by methods deemed reasonable in good faith by the Valuation Committee, following the procedures established by the Board, to represent fair value. Under these procedures, the Fund generally uses a market-based approach which may use related or comparable assets or liabilities, recent transactions, market multiples, book values and other relevant information. The Fund may also use an income-based valuation approach in which the anticipated future cash flows of the asset or liability are discounted to calculate fair value. Discounts may also be applied due to the nature and/or duration of any restrictions on the disposition of the asset or liability. Fair value represents a good faith approximation of the value of a security. Fair value determinations involve the consideration of a number of subjective factors, an analysis of applicable facts and circumstances and the exercise of judgment. As a result, it is possible that the fair value for a security determined in good faith in accordance with the Fund's valuation procedures may differ from valuations for the same security determined by other funds using their own valuation procedures. Although the Fund's valuation procedures are designed to value a security at the price the Fund may reasonably expect to receive upon the security's sale in an orderly transaction, there can be no assurance that any fair value determination thereunder would, in fact, approximate the amount that the Fund would actually realize upon the sale of the security or the price at which the security would trade if a reliable market price were readily available. During the six-month period ended April 30, 2021, there were no material changes to the fair value methodologies.
Securities which may be valued in this manner include, but are not limited to: (i) a security for which trading has been halted or suspended; (ii) a debt security that has recently gone into default and for which there is not a current market quotation; (iii) a security of an issuer that has entered into a restructuring; (iv) a security that has been delisted from a national exchange; (v) a security for which the market price is not readily available from a third-party pricing source or, if so provided, does not, in the opinion of the Manager or the Subadvisor, reflect the security's market value; (vi) a security subject to trading collars for which no or limited trading takes place; and (vii) a security whose principal market has been temporarily closed at a time when, under normal conditions, it would be open. Securities valued in this manner are generally categorized as Level 3 in the hierarchy. Securities that were fair valued in such a manner as of April 30, 2021, are shown in the Portfolio of Investments.
Notes to Financial Statements (Unaudited) (continued)
Equity securities are valued at the last quoted sales prices as of the close of regular trading on the relevant exchange on each valuation date. Securities that are not traded on the valuation date are valued at the mean of the last quoted bid and ask prices. Prices are normally taken from the principal market in which each security trades. These securities are generally categorized as Level 1 in the hierarchy.
Debt securities (other than convertible and municipal bonds) are valued at the evaluated bid prices (evaluated mean prices in the case of convertible and municipal bonds) supplied by a pricing agent or broker selected by the Manager, in consultation with the Subadvisor. The evaluations are market-based measurements processed through a pricing application and represents the pricing agent’s good faith determination as to what a holder may receive in an orderly transaction under market conditions. The rules based logic utilizes valuation techniques that reflect participants’ assumptions and vary by asset class and per methodology, maximizing the use of relevant observable data including quoted prices for similar assets, benchmark yield curves and market corroborated inputs. The evaluated bid or mean prices are deemed by the Manager, in consultation with the Subadvisor, to be representative of market values at the regular close of trading of the Exchange on each valuation date. Debt securities purchased on a delayed delivery basis are marked to market daily until settlement at the forward settlement date. Debt securities, including corporate bonds, U.S. government and federal agency bonds, municipal bonds, foreign bonds, convertible bonds, asset-backed securities and mortgage-backed securities are generally categorized as Level 2 in the hierarchy.
Loan assignments, participations and commitments are valued at the average of bid quotations obtained from the engaged independent pricing service and are generally categorized as Level 2 in the hierarchy. Certain loan assignments, participations and commitments may be valued by utilizing significant unobservable inputs obtained from the pricing service and are generally categorized as Level 3 in the hierarchy. No securities held by the Fund as of April 30, 2021 were fair valued in such a manner.
The information above is not intended to reflect an exhaustive list of the methodologies that may be used to value portfolio investments. The valuation procedures permit the use of a variety of valuation methodologies in connection with valuing portfolio investments. The methodology used for a specific type of investment may vary based on the market data available or other considerations. The methodologies summarized above may not represent the specific means by which portfolio investments are valued on any particular business day.
The valuation techniques and significant amounts of unobservable inputs used in the fair valuation measurement of the Fund’s Level 3 securities are outlined in the table below. A significant increase or decrease in any
of those inputs in isolation would result in a significantly higher or lower fair value measurement.
| Asset Class | Fair Value
at 4/30/21* | Valuation
Technique | Unobservable
Inputs | Inputs/
Range |
| Corporate Bonds | $ 1,564,920 | Income Approach | Spread
Adjustment | 0.97% |
| Loan Assignments | 2,875,808 | Market Approach | Implied natural
gas price | $2.00 |
| Common Stocks | 3,839,900 | Income Approach | Rate of Return | 14.00% |
| | | Market Approach | EBITDA Multiple | 6.5x-10.0x |
| | 177,737 | Market Approach | Discount Rate | 50.00% |
| | 0 | Market Approach | Implied natural
gas price | $2.00 |
| Preferred Stock | 3,555,790 | Income Approach | Spread
Adjustment | 4.46% |
| | $12,014,155 | | | |
| * The table above does not include a level 3 investment that was valued by a broker. As of April 30, 2021, the value of this investment was $3,105,000. The inputs for this investment was not readily available or cannot be reasonably estimated. |
A portfolio investment may be classified as an illiquid investment under the Trust's written liquidity risk management program and related procedures (“Liquidity Program”). Illiquidity of an investment might prevent the sale of such investment at a time when the Manager or the Subadvisor might wish to sell, and these investments could have the effect of decreasing the overall level of the Fund's liquidity. Further, the lack of an established secondary market may make it more difficult to value illiquid investments, requiring the Fund to rely on judgments that may be somewhat subjective in measuring value, which could vary materially from the amount that the Fund could realize upon disposition. Difficulty in selling illiquid investments may result in a loss or may be costly to the Fund. An illiquid investment is any investment that the Manager or Subadvisor reasonably expects cannot be sold or disposed of in current market conditions in seven calendar days or less without the sale or disposition significantly changing the market value of the investment. The liquidity classification of each investment will be made using information obtained after reasonable inquiry and taking into account, among other things, relevant market, trading and investment-specific considerations in accordance with the Liquidity Program. Illiquid investments are often valued in accordance with methods deemed by the Board in good faith to be reasonable and appropriate to accurately reflect their fair value. The liquidity of the Fund's investments was determined as of April 30, 2021, and can change at any time. Illiquid investments as of April 30, 2021, are shown in the Portfolio of Investments.
(B) Income Taxes. The Fund's policy is to comply with the requirements of the Internal Revenue Code of 1986, as amended (the “Internal Revenue Code”), applicable to regulated investment companies and to distribute all of its taxable income to the shareholders of the Fund within the allowable time limits.
| 30 | MainStay MacKay Short Duration High Yield Fund |
The Manager evaluates the Fund’s tax positions to determine if the tax positions taken meet the minimum recognition threshold in connection with accounting for uncertainties in income tax positions taken or expected to be taken for the purposes of measuring and recognizing tax liabilities in the financial statements. Recognition of tax benefits of an uncertain tax position is permitted only to the extent the position is “more likely than not” to be sustained assuming examination by taxing authorities. The Manager analyzed the Fund's tax positions taken on federal, state and local income tax returns for all open tax years (for up to three tax years) and has concluded that no provisions for federal, state and local income tax are required in the Fund's financial statements. The Fund's federal, state and local income tax and federal excise tax returns for tax years for which the applicable statutes of limitations have not expired are subject to examination by the Internal Revenue Service and state and local departments of revenue.
(C) Dividends and Distributions to Shareholders. Dividends and distributions are recorded on the ex-dividend date. The Fund intends to declare and pay dividends from net investment income, if any, at least monthly and distributions from net realized capital and currency gains, if any, at least annually. Unless a shareholder elects otherwise, all dividends and distributions are reinvested at NAV in the same class of shares of the Fund. Dividends and distributions to shareholders are determined in accordance with federal income tax regulations and may differ from determinations using GAAP.
(D) Security Transactions and Investment Income. The Fund records security transactions on the trade date. Realized gains and losses on security transactions are determined using the identified cost method. Dividend income is recognized on the ex-dividend date, net of any foreign tax withheld at the source, and interest income is accrued as earned using the effective interest rate method. Distributions received from real estate investment trusts may be classified as dividends, capital gains and/or return of capital. Discounts and premiums on securities purchased for the Fund are accreted and amortized, respectively, on the effective interest rate method. Income from payment-in-kind securities is accreted daily based on the effective interest method.
Investment income and realized and unrealized gains and losses on investments of the Fund are allocated pro rata to the separate classes of shares based upon their relative net assets on the date the income is earned or realized and unrealized gains and losses are incurred.
The Fund may place a debt security on non-accrual status and reduce related interest income by ceasing current accruals and writing off all or a portion of any interest receivables when the collection of all or a portion of such interest has become doubtful. A debt security is removed from non-accrual status when the issuer resumes interest payments or when collectability of interest is reasonably assured.
(E) Expenses. Expenses of the Trust are allocated to the individual Funds in proportion to the net assets of the respective Funds when the expenses are incurred, except where direct allocations of expenses can be made. Expenses (other than transfer agent expenses and fees incurred
under the shareholder services plans and/or the distribution plans further discussed in Note 3(B)) are allocated to separate classes of shares pro rata based upon their relative net assets on the date the expenses are incurred. The expenses borne by the Fund, including those of related parties to the Fund, are shown in the Statement of Operations.
(F) Use of Estimates. In preparing financial statements in conformity with GAAP, the Manager makes estimates and assumptions that affect the reported amounts and disclosures in the financial statements. Actual results could differ from those estimates and assumptions.
(G) Loan Assignments, Participations and Commitments. The Fund may invest in loan assignments and participations ("loans"). Commitments are agreements to make money available to a borrower in a specified amount, at a specified rate and within a specified time. The Fund records an investment when the borrower withdraws money on a commitment or when a funded loan is purchased (trade date) and records interest as earned. These loans pay interest at rates that are periodically reset by reference to a base lending rate plus a spread. These base lending rates are generally the prime rate offered by a designated U.S. bank or the London Interbank Offered Rate ("LIBOR").
The loans in which the Fund may invest are generally readily marketable, but may be subject to some restrictions on resale. For example, the Fund may be contractually obligated to receive approval from the agent bank and/or borrower prior to the sale of these investments. If the Fund purchases an assignment from a lender, the Fund will generally have direct contractual rights against the borrower in favor of the lender. If the Fund purchases a participation interest either from a lender or a participant, the Fund typically will have established a direct contractual relationship with the seller of the participation interest, but not with the borrower. Consequently, the Fund is subject to the credit risk of the lender or participant who sold the participation interest to the Fund, in addition to the usual credit risk of the borrower. In the event that the borrower, selling participant or intermediate participants become insolvent or enter into bankruptcy, the Fund may incur certain costs and delays in realizing payment, or may suffer a loss of principal and/or interest.
Unfunded commitments represent the remaining obligation of the Fund to the borrower. At any point in time, up to the maturity date of the issue, the borrower may demand the unfunded portion. Unfunded amounts, if any, are marked to market and any unrealized gains or losses are recorded in the Statement of Assets and Liabilities. As of April 30, 2021, the Fund held unfunded commitments. (See Note 5).
(H) Securities Lending. In order to realize additional income, the Fund may engage in securities lending, subject to the limitations set forth in the 1940 Act and relevant guidance by the staff of the Securities and Exchange Commission (“SEC”). If the Fund engages in securities lending, the Fund will lend through its custodian, JPMorgan Chase Bank, N.A., ("JPMorgan"), acting as securities lending agent on behalf of the Fund. Under the current arrangement, JPMorgan will manage the Fund's collateral in accordance with the securities lending agency agreement between the Fund and JPMorgan, and indemnify the Fund against
Notes to Financial Statements (Unaudited) (continued)
counterparty risk. The loans will be collateralized by cash (which may be invested in a money market fund) and/or non-cash collateral (which may include U.S. Treasury securities and/or U.S. government agency securities issued or guaranteed by the United States government or its agencies or instrumentalities) at least equal at all times to the market value of the securities loaned. The Fund bears the risk of delay in recovery of, or loss of rights in, the securities loaned. The Fund may also record a realized gain or loss on securities deemed sold due to a borrower’s inability to return securities on loan. The Fund bears the risk of any loss on investment of cash collateral. The Fund will receive compensation for lending its securities in the form of fees or it will retain a portion of interest earned on the investment of any cash collateral. The Fund will also continue to receive interest and dividends on the securities loaned and any gain or loss in the market price of the securities loaned that may occur during the term of the loan will be for the account of the Fund. Income earned from securities lending activities, if any, is reflected in the Statement of Operations. As of April 30, 2021, the Fund did not have any portfolio securities on loan.
Prior to November 23, 2020, these services were provided by State Street Bank and Trust Company (“State Street”).
(I) Rights and Warrants. Rights are certificates that permit the holder to purchase a certain number of shares, or a fractional share, of a new stock from the issuer at a specific price. Warrants are instruments that entitle the holder to buy an equity security at a specific price for a specific period of time. These investments can provide a greater potential for profit or loss than an equivalent investment in the underlying security. Prices of these investments do not necessarily move in tandem with the prices of the underlying securities.
There is risk involved in the purchase of rights and warrants in that these investments are speculative investments. The Fund could also lose the entire value of its investment in warrants if such warrants are not exercised by the date of its expiration. The Fund is exposed to risk until the sale or exercise of each right or warrant is completed. Rights as of April 30, 2021 are shown in the Portfolio of Investments.
(J) Securities Risk. The ability of issuers of debt securities held by the Fund to meet their obligations may be affected by, among other things, economic or political developments in a specific country, industry or region. Debt securities are also subject to the risks associated with changes in interest rates. The Fund primarily invests in high-yield debt securities (commonly referred to as “junk bonds”), which are considered speculative because they present a greater risk of loss, including default, than higher rated debt securities. These securities pay investors a premium—a higher interest rate or yield than investment grade debt securities—because of the increased risk of loss. These securities can also be subject to greater price volatility. In times of unusual or adverse market, economic or political conditions, these securities may experience higher than normal default rates.
The loans in which the Fund invests are usually rated below investment grade, or if unrated, determined by the Subadvisor to be of comparable
quality (commonly referred to as “junk bonds”) and are generally considered speculative because they present a greater risk of loss, including default, than higher quality debt securities. Moreover, such securities may, under certain circumstances, be particularly susceptible to liquidity and valuation risks. Although certain loans are collateralized, there is no guarantee that the value of the collateral will be sufficient or available to satisfy the borrower’s obligation. In times of unusual or adverse market, economic or political conditions, loans may experience higher than normal default rates. In the event of a recession or serious credit event, among other eventualities, the value of the Fund’s investments in loans are more likely to decline. The secondary market for loans is limited and, thus, the Fund’s ability to sell or realize the full value of its investment in these loans to reinvest sale proceeds or to meet redemption obligations may be impaired. In addition, loans generally are subject to extended settlement periods that may be longer than seven days. As a result, the Fund may be adversely affected by selling other investments at an unfavorable time and/or under unfavorable conditions or engaging in borrowing transactions, such as borrowing against its credit facility, to raise cash to meet redemption obligations or pursue other investment opportunities.
In certain circumstances, loans may not be deemed to be securities. As a result, the Fund may not have the protection of the anti-fraud provisions of the federal securities laws. In such cases, the Fund generally must rely on the contractual provisions in the loan agreement and common-law fraud protections under applicable state law.
(K) LIBOR Replacement Risk. The Fund may invest in certain debt securities, derivatives or other financial instruments that utilize the LIBOR, as a “benchmark” or “reference rate” for various interest rate calculations. The United Kingdom Financial Conduct Authority, which regulates LIBOR, announced that after 2021 it will cease its active encouragement of banks to provide the quotations needed to sustain LIBOR. However, it is possible that certain LIBOR tenors may continue beyond 2021 and the most widely used LIBOR tenors may continue until mid-2023. As a result, it is anticipated that LIBOR will be discontinued or will no longer be sufficiently robust to be representative of its underlying market around that time. Although financial regulators and industry working groups have suggested alternative reference rates, such as European Interbank Offer Rate (“EURIBOR”), Sterling Overnight Interbank Average Rate (“SONIA”) and Secured Overnight Financing Rate (“SOFR”), there are challenges to converting certain contracts and transactions to a new benchmark and neither the full effects of the transition process nor its ultimate outcome is known. New York Life Investments is currently working to assess exposure and will modify contracts as necessary.
The elimination of LIBOR or changes to other reference rates or any other changes or reforms to the determination or supervision of reference rates could have an adverse impact on the market for, or value of, any securities or payments linked to those reference rates, which may adversely affect the Fund's performance and/or net asset value. Uncertainty and risk also remain regarding the willingness and ability of issuers and lenders to include revised provisions in new and existing
| 32 | MainStay MacKay Short Duration High Yield Fund |
contracts or instruments. Consequently, the transition away from LIBOR to other reference rates may lead to increased volatility and illiquidity in markets that are tied to LIBOR, fluctuations in values of LIBOR-related investments or investments in issuers that utilize LIBOR, increased difficulty in borrowing or refinancing and diminished effectiveness of hedging strategies, adversely affecting the Fund's performance. Furthermore, the risks associated with the expected discontinuation of LIBOR and transition may be exacerbated if the work necessary to effect an orderly transition to an alternative reference rate is not completed in a timely manner. Because the usefulness of LIBOR as a benchmark could deteriorate during the transition period, these effects could occur prior to the end of 2021 with respect to certain LIBOR tenors or mid-2023 for the remaining LIBOR tenors.
(L) Indemnifications. Under the Trust’s organizational documents, its officers and trustees are indemnified against certain liabilities that may arise out of performance of their duties to the Trust. Additionally, in the normal course of business, the Fund enters into contracts with third-party service providers that contain a variety of representations and warranties and that may provide general indemnifications. The Fund's maximum exposure under these arrangements is unknown, as this would involve future claims that may be made against the Fund that have not yet occurred. The Manager believes that the risk of loss in connection with these potential indemnification obligations is remote. However, there can be no assurance that material liabilities related to such obligations will not arise in the future, which could adversely impact the Fund.
Note 3–Fees and Related Party Transactions
(A) Manager and Subadvisor. New York Life Investments, a registered investment adviser and an indirect, wholly-owned subsidiary of New York Life Insurance Company ("New York Life"), serves as the Fund's Manager, pursuant to an Amended and Restated Management Agreement ("Management Agreement"). The Manager provides offices, conducts clerical, recordkeeping and bookkeeping services and keeps most of the financial and accounting records required to be maintained by the Fund. Except for the portion of salaries and expenses that are the responsibility of the Fund, the Manager pays the salaries and expenses of all personnel affiliated with the Fund and certain operational expenses of the Fund. The Fund reimburses New York Life Investments in an amount equal to the portion of the compensation of the Chief Compliance Officer attributable to the Fund. MacKay Shields LLC ("MacKay Shields" or the "Subadvisor"), a registered investment adviser and an indirect, wholly-owned subsidiary of New York Life, serves as Subadvisor to the Fund and is responsible for the day-to-day portfolio management of the Fund. Pursuant to the terms of an Amended and Restated Subadvisory Agreement ("Subadvisory Agreement") between New York Life Investments and MacKay Shields, New York Life Investments pays for the services of the Subadvisor.
Pursuant to the Management Agreement, the Fund pays the Manager a monthly fee for the services performed and the facilities furnished at an annual rate of 0.65% of the Fund's average daily net assets.
New York Life Investments has contractually agreed to waive fees and/or reimburse expenses so that Total Annual Fund Operating Expenses (excluding taxes, interest, litigation, extraordinary expenses, brokerage and other transaction expenses relating to the purchase or sale of portfolio investments, and acquired (underlying) fund fees and expenses) for Class A shares do not exceed 1.05% of the Fund’s average daily net assets. New York Life Investments will apply an equivalent waiver or reimbursement, in an equal number of basis points, to the other share classes of the Fund. This agreement will remain in effect until February 28, 2022, and shall renew automatically for one-year terms unless New York Life Investments provides written notice of termination prior to the start of the next term or upon approval of the Board.
During the six-month period ended April 30, 2021, New York Life Investments earned fees from the Fund in the amount of $4,809,388 and paid the Subadvisor in the amount of $2,404,644. There were no waived fees and/or reimbursed expenses.
JPMorgan provides sub-administration and sub-accounting services to the Fund pursuant to an agreement with New York Life Investments. These services include calculating the daily NAVs of the Fund, maintaining the general ledger and sub-ledger accounts for the calculation of the Fund's NAVs, and assisting New York Life Investments in conducting various aspects of the Fund's administrative operations. For providing these services to the Fund, JPMorgan is compensated by New York Life Investments.
Prior to November 23, 2020, these services were provided by State Street.
Pursuant to an agreement between the Trust and New York Life Investments, New York Life Investments is responsible for providing or procuring certain regulatory reporting services for the Fund. The Fund will reimburse New York Life Investments for the actual costs incurred by New York Life Investments in connection with providing or procuring these services for the Fund.
(B) Distribution and Service Fees. The Trust, on behalf of the Fund, has entered into a distribution agreement with NYLIFE Distributors LLC (the “Distributor”), an affiliate of New York Life Investments. The Fund has adopted distribution plans (the “Plans”) in accordance with the provisions of Rule 12b-1 under the 1940 Act.
Pursuant to the Class A, Investor Class and Class R2 Plans, the Distributor receives a monthly distribution fee from the Class A, Investor Class and Class R2 shares at an annual rate of 0.25% of the average daily net assets of the Class A, Investor Class and Class R2 shares for distribution and/or service activities as designated by the Distributor. Pursuant to the Class C Plan, Class C shares pay the Distributor a monthly distribution fee at an annual rate of 0.75% of the average daily net assets of the Class C shares, along with a service fee at an annual rate of 0.25% of the average daily net assets of the Class C shares, for a total 12b-1 fee of 1.00%. Pursuant to the Class R3 Plan, Class R3 shares pay the Distributor a monthly fee at an annual rate of 0.25% of the average daily net assets of the Class R3 shares, along with a service fee
Notes to Financial Statements (Unaudited) (continued)
at an annual rate of 0.25% of the average daily net assets of the Class R3 shares, for a total 12b-1 fee of 0.50%. Class I and Class R6 shares are not subject to a distribution and/or service fee.
The Plans provide that the distribution and service fees are payable to the Distributor regardless of the amounts actually expended by the Distributor for distribution of the Fund's shares and service activities.
In accordance with the Shareholder Services Plans for the Class R2 and Class R3 shares, the Manager has agreed to provide, through its affiliates or independent third parties, various shareholder and administrative support services to shareholders of the Class R2 and Class R3 shares. For its services, the Manager, its affiliates or independent third-party service providers are entitled to a shareholder service fee accrued daily and paid monthly at an annual rate of 0.10% of the average daily net assets of the Class R2 and Class R3 shares. This is in addition to any fees paid under the Class R2 and Class R3 Plans.
During the six-month period ended April 30, 2021, shareholder service fees incurred by the Fund were as follows:
(C) Sales Charges. The Fund was advised by the Distributor that the amount of initial sales charges retained on sales of Class A and Investor Class shares during the six-month period ended April 30, 2021, were $8,130 and $528, respectively.
The Fund was also advised that the Distributor retained CDSCs on redemptions of Class A and Class C shares during the six-month period ended April 30, 2021, of $41,272 and $8,955, respectively.
(D) Transfer, Dividend Disbursing and Shareholder Servicing Agent. NYLIM Service Company LLC, an affiliate of New York Life Investments, is the Fund's transfer, dividend disbursing and shareholder servicing agent pursuant to an agreement between NYLIM Service Company LLC and the Trust. NYLIM Service Company LLC has entered into an agreement with DST Asset Manager Solutions, Inc. ("DST"), pursuant to which DST performs certain transfer agent services on behalf of NYLIM Service Company LLC. New York Life Investments has contractually agreed to limit the transfer agency expenses charged to the Fund’s share classes to a maximum of 0.35% of that share class’s average daily net assets on an annual basis after deducting any applicable Fund or class-level expense reimbursement or small account fees. This agreement will remain in effect until February 28, 2022, and shall renew automatically for one-year terms unless New York Life Investments provides written notice of termination prior to the start of the next term or upon approval of the Board. During the six-month period ended April 30, 2021, transfer agent expenses incurred by the Fund and
any reimbursements, pursuant to the aforementioned Transfer Agency expense limitation agreement, were as follows:
| Class | Expense | Waived |
| Class A | $103,416 | $— |
| Investor Class | 5,494 | — |
| Class C | 34,650 | — |
| Class I | 453,766 | — |
| Class R2 | 208 | — |
| Class R3 | 57 | — |
(E) Small Account Fee. Shareholders with small accounts adversely impact the cost of providing transfer agency services. In an effort to reduce total transfer agency expenses, the Fund has implemented a small account fee on certain types of accounts. As described in the Fund's prospectus, certain shareholders with an account balance of less than $1,000 ($5,000 for Class A share accounts) are charged an annual per account fee of $20 (assessed semi-annually), the proceeds from which offset transfer agent fees as reflected in the Statement of Operations. This small account fee will not apply to certain types of accounts as described further in the Fund’s prospectus.
(F) Capital. As of April 30, 2021, New York Life and its affiliates beneficially held shares of the Fund with the values and percentages of net assets as follows:
| Class A | $5,766,695 | 2.0% |
| Class R2 | 35,536 | 7.0 |
| Class R3 | 32,922 | 26.0 |
Note 4-Federal Income Tax
As of April 30, 2021, the cost and unrealized appreciation (depreciation) of the Fund’s investment portfolio, including applicable derivative contracts and other financial instruments, as determined on a federal income tax basis, were as follows:
| | Federal Tax
Cost | Gross
Unrealized
Appreciation | Gross
Unrealized
(Depreciation) | Net
Unrealized
Appreciation/
(Depreciation) |
| Investments | $1,455,384,751 | $55,592,908 | $(15,594,913) | $39,997,995 |
As of October 31, 2020, for federal income tax purposes, capital loss carryforwards of $54,367,146 were available as shown in the table below, to the extent provided by the regulations to offset future realized gains of the Fund through the years indicated. To the extent that these capital loss carryforwards are used to offset future capital gains, it is probable that the capital gains so offset will not be distributed to
| 34 | MainStay MacKay Short Duration High Yield Fund |
shareholders. No capital gain distributions shall be made until any capital loss carryforwards have been fully utilized.
Capital Loss
Available Through | Short-Term
Capital Loss
Amounts (000’s) | Long-Term
Capital Loss
Amounts (000’s) |
| Unlimited | $24,034 | $30,333 |
During the year ended October 31, 2020, the tax character of distributions paid as reflected in the Statements of Changes in Net Assets was as follows:
| | 2020 |
| Distributions paid from: | |
| Ordinary Income | $69,827,862 |
Note 5–Commitments and Contingencies
As of April 30, 2021, the Fund had unfunded commitments pursuant to the following loan agreements:
| Borrower | Unfunded
Commitments | Unrealized
Appreciation/
(Depreciation) |
PetroQuest Energy LLC 2020 Term Loan
(TBD),
due 9/19/26 | $1,371 | $0 |
Commitments are available until maturity date.
Note 6–Restricted Securities
Restricted securities are subject to legal or contractual restrictions on resale. Private placement securities are generally considered to be restricted except for those securities traded between qualified institutional investors under the provisions of Rule 144A of the Securities Act of 1933, as amended. Disposal of restricted securities may involve time consuming negotiations and expenses, and prompt sale at an acceptable price may be difficult to achieve.
As of April 30, 2021, restricted securities held by the Fund were as follows.
| Security | Date(s) of
Acquisition | Principal
Amount
/Shares | Cost | 4/30/21
Value | Percent of
Net Assets |
| Briggs & Stratton Corp. (Escrow Claim Shares) |
Corporate Bond
6.875%, due 12/15/20 | 2/26/21 | $ 3,425,000 | $ 3,724,482 | $ 274,000 | 0.0% ‡ |
| Carlson Travel, Inc. |
| Common Stock | 9/4/20-2/4/21 | 3,199 | — | 177,737 | 0.0‡ |
| GenOn Energy, Inc. |
| Common Stock | 12/14/18 | 20,915 | 2,342,005 | 2,562,088 | 0,2 |
| Sterling Entertainment Enterprises LLC |
Corporate Bond
10.25%, due 1/15/25 | 12/28/17 | $ 3,000,000 | 2,972,334 | 3,105,000 | 0,2 |
| Total | | | $ 9,038,821 | $ 6,118,825 | 0.4% |
| ‡ | Less than one-tenth of a percent. |
Note 7–Custodian
JPMorgan is the custodian of cash and securities held by the Fund. Custodial fees are charged to the Fund based on the Fund's net assets and/or the market value of securities held by the Fund and the number of certain transactions incurred by the Fund.
Prior to November 23, 2020, these services were provided by State Street. The services provided by State Street were a direct expense of the Fund and are included in the Statement of Operations as Custodian fees which totaled $2,043 for the period November 1, 2020 through November 22, 2020.
Note 8–Line of Credit
The Fund and certain other funds managed by New York Life Investments maintain a line of credit with a syndicate of banks in order to secure a source of funds for temporary purposes to meet unanticipated or excessive redemption requests.
Effective July 28, 2020, under the credit agreement (the “Credit Agreement”), the aggregate commitment amount is $600,000,000 with an additional uncommitted amount of $100,000,000. The commitment fee is an annual rate of 0.15% of the average commitment amount payable quarterly, regardless of usage, to JPMorgan, who serves as the agent to the syndicate. The commitment fee is allocated among the Fund and certain other funds managed by New York Life Investments based upon their respective net assets and other factors. Interest on any revolving credit loan is charged based upon the Federal Funds Rate or the
Notes to Financial Statements (Unaudited) (continued)
one-month LIBOR, whichever is higher. The Credit Agreement expires on July 27, 2021, although the Fund, certain other funds managed by New York Life Investments and the syndicate of banks may renew the Credit Agreement for an additional year on the same or different terms or enter into a credit agreement with a different syndicate of banks. Prior to July 28, 2020, the aggregate commitment amount and the commitment fee were the same as those under the current Credit Agreement, but State Street served as agent to the syndicate. During the six-month period ended April 30, 2021, there were no borrowings made or outstanding with respect to the Fund under the Credit Agreement or the credit agreement for which State Street served as agent.
Note 9–Interfund Lending Program
Pursuant to an exemptive order issued by the SEC, the Fund, along with certain other funds managed by New York Life Investments, may participate in an interfund lending program. The interfund lending program provides an alternative credit facility that permits the Fund and certain other funds managed by New York Life Investments to lend or borrow money for temporary purposes directly to or from one another, subject to the conditions of the exemptive order. During the six-month period ended April 30, 2021, there were no interfund loans made or outstanding with respect to the Fund.
Note 10–Purchases and Sales of Securities (in 000’s)
During the six-month period ended April 30, 2021, purchases and sales of securities, other than short-term securities, were $480,561 and $357,653, respectively.
The Fund may purchase securities from or sell securities to other portfolios managed by the Subadvisor. These interportfolio transactions are primarily used for cash management purposes and are made pursuant to Rule 17a-7 under the 1940 Act. During the six-month period ended April 30, 2021, such purchases were $8,738.
Note 11–Capital Share Transactions
Transactions in capital shares for the six-month period ended April 30, 2021 and the year ended October 31, 2020, were as follows:
| Class A | Shares | Amount |
| Period ended April 30, 2021: | | |
| Shares sold | 6,053,877 | $ 59,305,657 |
| Shares issued to shareholders in reinvestment of distributions | 554,921 | 5,418,140 |
| Shares redeemed | (4,091,355) | (39,958,310) |
| Net increase (decrease) in shares outstanding before conversion | 2,517,443 | 24,765,487 |
| Shares converted into Class A (See Note 1) | 146,245 | 1,432,023 |
| Shares converted from Class A (See Note 1) | (6,174) | (60,255) |
| Net increase (decrease) | 2,657,514 | $ 26,137,255 |
| Year ended October 31, 2020: | | |
| Shares sold | 13,960,236 | $ 133,282,869 |
| Shares issued to shareholders in reinvestment of distributions | 1,126,550 | 10,638,146 |
| Shares redeemed | (12,630,727) | (118,787,800) |
| Net increase (decrease) in shares outstanding before conversion | 2,456,059 | 25,133,215 |
| Shares converted into Class A (See Note 1) | 169,440 | 1,618,620 |
| Shares converted from Class A (See Note 1) | (18,596) | (170,363) |
| Net increase (decrease) | 2,606,903 | $ 26,581,472 |
| |
| Investor Class | Shares | Amount |
| Period ended April 30, 2021: | | |
| Shares sold | 90,650 | $ 888,581 |
| Shares issued to shareholders in reinvestment of distributions | 13,491 | 131,681 |
| Shares redeemed | (71,908) | (703,650) |
| Net increase (decrease) in shares outstanding before conversion | 32,233 | 316,612 |
| Shares converted into Investor Class (See Note 1) | 16,625 | 162,622 |
| Shares converted from Investor Class (See Note 1) | (101,275) | (992,125) |
| Net increase (decrease) | (52,417) | $ (512,891) |
| Year ended October 31, 2020: | | |
| Shares sold | 202,029 | $ 1,923,818 |
| Shares issued to shareholders in reinvestment of distributions | 31,380 | 296,387 |
| Shares redeemed | (158,710) | (1,497,290) |
| Net increase (decrease) in shares outstanding before conversion | 74,699 | 722,915 |
| Shares converted into Investor Class (See Note 1) | 14,414 | 131,050 |
| Shares converted from Investor Class (See Note 1) | (152,314) | (1,454,814) |
| Net increase (decrease) | (63,201) | $ (600,849) |
| |
| 36 | MainStay MacKay Short Duration High Yield Fund |
| Class C | Shares | Amount |
| Period ended April 30, 2021: | | |
| Shares sold | 335,958 | $ 3,288,210 |
| Shares issued to shareholders in reinvestment of distributions | 63,817 | 622,659 |
| Shares redeemed | (853,355) | (8,342,901) |
| Net increase (decrease) in shares outstanding before conversion | (453,580) | (4,432,032) |
| Shares converted from Class C (See Note 1) | (59,485) | (581,851) |
| Net increase (decrease) | (513,065) | $ (5,013,883) |
| Year ended October 31, 2020: | | |
| Shares sold | 1,114,889 | $ 10,742,150 |
| Shares issued to shareholders in reinvestment of distributions | 158,615 | 1,497,650 |
| Shares redeemed | (1,854,606) | (17,264,735) |
| Net increase (decrease) in shares outstanding before conversion | (581,102) | (5,024,935) |
| Shares converted from Class C (See Note 1) | (21,382) | (203,996) |
| Net increase (decrease) | (602,484) | $ (5,228,931) |
| |
| Class I | Shares | Amount |
| Period ended April 30, 2021: | | |
| Shares sold | 29,505,484 | $ 288,736,373 |
| Shares issued to shareholders in reinvestment of distributions | 2,572,740 | 25,123,850 |
| Shares redeemed | (21,602,321) | (211,328,148) |
| Net increase (decrease) in shares outstanding before conversion | 10,475,903 | 102,532,075 |
| Shares converted into Class I (See Note 1) | 5,350 | 52,504 |
| Net increase (decrease) | 10,481,253 | $ 102,584,579 |
| Year ended October 31, 2020: | | |
| Shares sold | 65,528,828 | $ 616,300,499 |
| Shares issued to shareholders in reinvestment of distributions | 5,332,877 | 50,519,704 |
| Shares redeemed | (83,336,097) | (778,632,650) |
| Net increase (decrease) in shares outstanding before conversion | (12,474,392) | (111,812,447) |
| Shares converted into Class I (See Note 1) | 8,406 | 79,503 |
| Net increase (decrease) | (12,465,986) | $(111,732,944) |
| |
| Class R2 | Shares | Amount |
| Period ended April 30, 2021: | | |
| Shares sold | 558 | $ 5,450 |
| Shares issued to shareholders in reinvestment of distributions | 1,190 | 11,610 |
| Shares redeemed | (4,134) | (40,652) |
| Net increase (decrease) in shares outstanding before conversion | (2,386) | (23,592) |
| Shares converted from Class R2 (See Note 1) | (1,315) | (12,918) |
| Net increase (decrease) | (3,701) | $ (36,510) |
| Year ended October 31, 2020: | | |
| Shares sold | 323 | $ 3,200 |
| Shares issued to shareholders in reinvestment of distributions | 2,534 | 23,902 |
| Shares redeemed | (2,203) | (20,833) |
| Net increase (decrease) | 654 | $ 6,269 |
| |
| Class R3 | Shares | Amount |
| Period ended April 30, 2021: | | |
| Shares sold | 317 | $ 3,100 |
| Shares issued to shareholders in reinvestment of distributions | 302 | 2,942 |
| Shares redeemed | (4,088) | (40,267) |
| Net increase (decrease) | (3,469) | $ (34,225) |
| Year ended October 31, 2020: | | |
| Shares sold | 9,500 | $ 89,430 |
| Shares issued to shareholders in reinvestment of distributions | 605 | 5,766 |
| Shares redeemed | (14,226) | (139,842) |
| Net increase (decrease) | (4,121) | $ (44,646) |
Note 12–Recent Accounting Pronouncement
In March 2020, the Financial Accounting Standards Board issued Accounting Standards Update 2020-04 (“ASU 2020-04”), which provides optional guidance to ease the potential accounting burden associated with transitioning away from LIBOR and other reference rates that are expected to be discontinued. ASU 2020-04 was effective immediately upon release of the update on March 12, 2020 and remains effective through December 31, 2022. At this time, the Manager is evaluating the implications of certain other provisions of ASU 2020-04 related to new disclosure requirements and any impact on the financial statement disclosures has not yet been determined.
Note 13–Other Matters
An outbreak of COVID-19, first detected in December 2019, has developed into a global pandemic and has resulted in travel restrictions, closure of international borders, certain businesses and securities markets, restrictions on securities trading activities, prolonged quarantines, supply chain disruptions, and lower consumer demand, as well as general concern and uncertainty. The continued impact of COVID-19 is uncertain and could further adversely affect the global
Notes to Financial Statements (Unaudited) (continued)
economy, national economies, individual issuers and capital markets in unforeseeable ways and result in a substantial and extended economic downturn. Developments that disrupt global economies and financial markets, such as COVID-19, may magnify factors that affect the Fund's performance.
Note 14–Subsequent Events
In connection with the preparation of the financial statements of the Fund as of and for the six-month period ended April 30, 2021, events and transactions subsequent to April 30, 2021, through the date the financial statements were issued have been evaluated by the Manager for possible adjustment and/or disclosure. No subsequent events requiring financial statement adjustment or disclosure have been identified.
| 38 | MainStay MacKay Short Duration High Yield Fund |
Board Consideration and Approval of Management Agreement and Subadvisory Agreement (Unaudited)
The continuation of the Management Agreement with respect to the MainStay MacKay Short Duration High Yield Fund (“Fund”) and New York Life Investment Management LLC (“New York Life Investments”) and the Subadvisory Agreement between New York Life Investments and MacKay Shields LLC (“MacKay”) with respect to the Fund (together, “Advisory Agreements”), following an initial term of up to two years, is subject to annual review and approval by the Board of Trustees of MainStay Funds Trust (“Board” of the “Trust”) in accordance with Section 15 of the Investment Company Act of 1940, as amended (“1940 Act”). At its December 9–10, 2020 meeting, the Board, including the Trustees who are not an “interested person” (as such term is defined in the 1940 Act) of the Trust (“Independent Trustees”) voting separately, unanimously approved the continuation of each of the Advisory Agreements for a one-year period.
In reaching the decision to approve the continuation of each of the Advisory Agreements, the Board considered information furnished by New York Life Investments and MacKay in connection with an annual contract review process undertaken by the Board that took place at meetings of the Board and its Contracts Committee during September 2020 through December 2020, as well as other information furnished to the Board and its Committees throughout the year, as deemed relevant by the Trustees. Information requested by and furnished to the Board for consideration in connection with the contract review process included, among other items, reports on the Fund and “peer funds” prepared by Strategic Insight Mutual Fund Research and Consulting, LLC (“Strategic Insight”), an independent third-party service provider engaged by the Board to report objectively on the Fund’s investment performance, management fee and total expenses. The Board also considered information on the fees charged to other investment advisory clients of New York Life Investments and/or MacKay that follow investment strategies similar to those of the Fund, if any, and, when applicable, the rationale for any differences in the Fund’s management and subadvisory fees and the fees charged to those other investment advisory clients. In addition, the Board considered information furnished by New York Life Investments and MacKay in response to requests prepared on behalf of the Board, and in consultation with the Independent Trustees, by independent legal counsel to the Independent Trustees, which encompassed a variety of topics, including those summarized below.
The Board took into account information provided in connection with its meetings throughout the year, including, among other items, information regarding the legal standards and fiduciary obligations applicable to its consideration of the continuation of each of the Advisory Agreements and investment performance reports on the Fund as well as presentations from New York Life Investments and MacKay personnel. The Board also took into account other information received from New York Life Investments throughout the year, including, among other items, periodic reports on legal and compliance matters, risk management, portfolio turnover, brokerage commissions and non-advisory services provided to the Fund by New York Life Investments. The contract review process, including the structure and format for materials provided to the Board, has been developed in consultation with the Board. The Independent
Trustees also met in executive sessions with their independent legal counsel and, for a portion thereof, with senior management of New York Life Investments.
In addition to information provided to the Board throughout the year, the Board received information in connection with its June 2020 meeting provided specifically in response to requests prepared on behalf of the Board, and in consultation with the Independent Trustees, by independent legal counsel regarding the Fund’s distribution arrangements. In addition, the Board received information regarding the Fund’s asset levels, share purchase and redemption activity and the payment of Rule 12b-1 and/or other fees by applicable share classes of the Fund, among other information.
In considering the continuation of each of the Advisory Agreements, the Trustees reviewed and evaluated the information and factors they believed to reasonably be necessary and appropriate in light of legal advice furnished to them by independent legal counsel and through the exercise of their own business judgment. Although individual Trustees may have weighed certain factors or information differently, the factors considered by the Board are described in greater detail below and include, among other factors: (i) the nature, extent and quality of the services provided to the Fund by New York Life Investments and MacKay; (ii) the qualifications of the portfolio manager of the Fund and the historical investment performance of the Fund, New York Life Investments and MacKay; (iii) the costs of the services provided, and profits realized, by New York Life Investments and MacKay from their relationships with the Fund; (iv) the extent to which economies of scale have been realized or may be realized as the Fund grows and the extent to which economies of scale have benefited or may benefit the Fund’s shareholders; and (v) the reasonableness of the Fund’s management and subadvisory fees and total ordinary operating expenses. Although the Board recognized that comparisons between the Fund’s fees and expenses and those of other funds are imprecise given different terms of agreements, variations in fund strategies and other factors, the Board considered the reasonableness of the Fund’s management fee and total ordinary operating expenses as compared to the peer funds identified by Strategic Insight. Throughout their considerations, the Trustees acknowledged the commitment of New York Life Investments and its affiliates to serve the MainStay Group of Funds, as well as their capacity, experience, resources, financial stability and reputations. The Trustees also acknowledged the entrepreneurial and other risks assumed by New York Life Investments in sponsoring and managing the Fund.
The Trustees noted that, throughout the year, the Trustees are afforded an opportunity to ask questions of, and request additional information or materials from, New York Life Investments and MacKay. The Board’s decision with respect to each of the Advisory Agreements may have also been based, in part, on the Board’s knowledge of New York Life Investments and MacKay resulting from, among other things, the Board’s consideration of each of the Advisory Agreements in prior years, the advisory agreements for other funds in the MainStay Group of Funds, the Board’s review throughout the year of the performance and operations of other funds in the MainStay Group of Funds and each Trustee’s business
Board Consideration and Approval of Management Agreement and Subadvisory Agreement (Unaudited) (continued)
judgment and industry experience. In addition to considering the above-referenced factors, the Board observed that in the marketplace there are a range of investment options available to the Fund’s shareholders and such shareholders, having had the opportunity to consider other investment options, have chosen to invest in the Fund.
The factors that figured prominently in the Board’s decision to approve the continuation of each of the Advisory Agreements during its December 9–10, 2020 meeting are summarized in more detail below, and the Board did not consider any factor or information controlling in reaching such decision.
Nature, Extent and Quality of Services Provided by New York Life Investments and MacKay
The Board examined the nature, extent and quality of the services that New York Life Investments provides to the Fund. The Board evaluated New York Life Investments’ experience and capabilities in serving as manager of the Fund and considered that the Fund operates in a “manager-of-managers” structure. The Board also considered New York Life Investments’ responsibilities and services provided pursuant to this structure, including evaluating the performance of MacKay, making recommendations to the Board as to whether the Subadvisory Agreement should be renewed, modified or terminated and periodically reporting to the Board regarding the results of New York Life Investments’ evaluation and monitoring functions. The Board noted that New York Life Investments manages other mutual funds, serves a variety of other investment advisory clients, including other pooled investment vehicles, and has experience overseeing mutual fund service providers, including subadvisors. The Board considered the experience of senior personnel at New York Life Investments providing management and administrative and other non-advisory services to the Fund as well as New York Life Investments’ reputation and financial condition. The Board observed that New York Life Investments devotes significant resources and time to providing management and non-advisory services to the Fund, including New York Life Investments’ supervision and due diligence reviews of MacKay and ongoing analysis of, and interactions with, MacKay with respect to, among other things, the Fund’s investment performance and risks as well as MacKay’s investment capabilities and subadvisory services with respect to the Fund.
The Board also considered the range of services that New York Life Investments provides to the Fund under the terms of the Management Agreement, including: (i) fund accounting and ongoing supervisory services provided by New York Life Investments’ Fund Administration and Accounting Group; (ii) investment supervisory and analytical services provided by New York Life Investments’ Investment Consulting Group; (iii) compliance services provided by the Trust’s Chief Compliance Officer as well as New York Life Investments’ compliance department, including supervision and implementation of the Fund’s compliance program; (iv) legal services provided by New York Life Investments’ Office of the General Counsel; and (v) risk management monitoring and analysis by compliance and investment personnel. The Board noted that New York Life Investments provides certain other non-advisory services to the Fund.
In addition, the Board considered New York Life Investments’ willingness to invest in personnel, infrastructure, technology, operational enhancements, cyber security, information security, shareholder privacy resources and business continuity planning designed to benefit the Fund and noted that New York Life Investments is responsible for compensating the Trust’s officers, except for a portion of the salary of the Trust’s Chief Compliance Officer. The Board recognized that New York Life Investments has provided an increasingly broad array of non-advisory services to the MainStay Group of Funds as a result of regulatory and other developments, including in connection with the designation of New York Life Investments as the administrator of the MainStay Group of Funds’ liquidity risk management program adopted under the 1940 Act. The Board considered benefits to shareholders from being part of the MainStay Group of Funds, including the privilege of exchanging investments between the same class of shares of funds in the MainStay Group of Funds, including without the imposition of a sales charge (if any).
The Board also examined the nature, extent and quality of the investment advisory services that MacKay provides to the Fund and considered the terms of each of the Advisory Agreements. The Board evaluated MacKay’s experience in serving as subadvisor to the Fund and advising other portfolios and MacKay’s track record and experience in providing investment advisory services, the experience of investment advisory, senior management and administrative personnel at MacKay and New York Life Investments’ and MacKay’s overall resources, legal and compliance environment, capabilities and history. In addition to information provided in connection with quarterly meetings with the Trust’s Chief Compliance Officer, the Board considered information regarding the compliance policies and procedures of New York Life Investments and MacKay and acknowledged their commitment to further developing and strengthening compliance programs relating to the Fund. The Board reviewed MacKay’s ability to attract and retain qualified investment professionals and willingness to invest in personnel to service and support the Fund. In this regard, the Board considered the experience of the Fund’s portfolio manager, the number of accounts managed by the portfolio manager and the method for compensating the portfolio manager.
In addition, the Board considered discussions with New York Life Investments regarding the implementation of its business continuity plans and recognized steps taken by New York Life Investments and MacKay to continue to provide the same nature, extent and quality of services to the Fund during the COVID-19 pandemic.
Based on these considerations, the Board concluded that the Fund would likely continue to benefit from the nature, extent and quality of these services.
Investment Performance
In evaluating the Fund’s investment performance, the Board considered investment performance results over various periods in light of the Fund’s investment objective, strategies and risks. The Board considered
| 40 | MainStay MacKay Short Duration High Yield Fund |
investment reports on, and analysis of, the Fund’s performance provided to the Board throughout the year. These reports include, among other items, information on the Fund’s gross and net returns, the Fund’s investment performance compared to relevant investment categories and the Fund’s benchmark, the Fund’s risk-adjusted investment performance and the Fund’s investment performance as compared to peer funds, as appropriate, as well as portfolio attribution information and commentary on the effect of market conditions. The Board also considered information provided by Strategic Insight showing the investment performance of the Fund as compared to peer funds.
The Board also gave weight to its discussions with senior management at New York Life Investments concerning the Fund’s investment performance attributable to MacKay as well as discussions between the Fund’s portfolio manager and the members of the Board’s Investment Committee, which generally occur on an annual basis. In addition, the Board considered any specific actions that New York Life Investments or MacKay had taken, or had agreed to take, to seek to enhance Fund investment performance and the results of those actions.
Based on these considerations, the Board concluded that its review of the Fund’s investment performance and related information supported a determination to approve the continuation of each of the Advisory Agreements.
Costs of the Services Provided, and Profits Realized, by New York Life Investments and MacKay
The Board considered the costs of the services provided under each of the Advisory Agreements. The Board also considered the profits realized by New York Life Investments and its affiliates, including MacKay, due to their relationships with the Fund. Because MacKay is an affiliate of New York Life Investments whose subadvisory fee is paid by New York Life Investments, not the Fund, the Board considered cost and profitability information for New York Life Investments and MacKay in the aggregate.
In addition, the Board acknowledged the difficulty in obtaining reliable comparative data about mutual fund managers’ profitability because such information generally is not publicly available and may be impacted by numerous factors, including the structure of a fund manager’s organization, the types of funds it manages, the methodology used to allocate certain fixed costs to specific funds and the manager’s capital structure and costs of capital.
In evaluating the costs of the services provided by New York Life Investments and MacKay and profits realized by New York Life Investments and its affiliates, including MacKay, the Board considered, among other factors, each party’s continuing investments in, or willingness to invest in, personnel, systems, equipment and other resources and infrastructure to support and further enhance the management of the Fund, and that New York Life Investments is responsible for paying the subadvisory fee for the Fund. The Board also considered the financial resources of New York Life Investments and MacKay and acknowledged that New York Life Investments and MacKay must be in a position to attract and retain experienced professional
personnel and to maintain a strong financial position for New York Life Investments and MacKay to continue to provide high-quality services to the Fund. The Board recognized that the Fund benefits from the allocation of certain fixed costs among the funds in the MainStay Group of Funds, among other expected benefits resulting from its relationship with New York Life Investments.
The Board considered information regarding New York Life Investments’ methodology for calculating profitability and allocating costs provided by New York Life Investments in connection with the fund profitability analysis presented to the Board. The Board previously engaged an independent consultant to review the methods used to allocate costs among the funds in the MainStay Group of Funds. The Board noted that the independent consultant had concluded that New York Life Investments’ methods for allocating costs and procedures for estimating overall profitability of the relationship with the funds in the MainStay Group of Funds are reasonable and that New York Life Investments continued to use the same method of calculating profit and allocating costs since the independent consultant’s review. The Board recognized the difficulty in calculating and evaluating a manager’s profitability with respect to the Fund and noted that other profitability methodologies may also be reasonable.
The Board also considered certain fall-out benefits that may be realized by New York Life Investments and its affiliates due to their relationships with the Fund, including reputational and other indirect benefits. In addition, the Board considered its review of a money market fund advised by New York Life Investments and an affiliated subadvisor that serves as an investment option for the Fund, including the potential rationale for and costs associated with investments in this money market fund by the Fund, if any, and considered information from New York Life Investments that the nature and type of specific investment advisory services provided to this money market fund are distinct from, or in addition to, the investment advisory services provided to the Fund.
The Board observed that, in addition to fees earned by New York Life Investments for managing the Fund, New York Life Investments’ affiliates also earn revenues from serving the Fund in various other capacities, including as the Fund’s transfer agent and distributor. The Board considered information about these other revenues and their impact on the profitability of the relationship with the Fund to New York Life Investments and its affiliates. The Board noted that, although it assessed the overall profitability of the Fund to New York Life Investments and its affiliates as part of the contract review process, when considering the reasonableness of the fee paid to New York Life Investments and its affiliates under each of the Advisory Agreements, the Board considered the profitability of New York Life Investments’ relationship with the Fund on a pre-tax basis and without regard to distribution expenses incurred by New York Life Investments from its own resources.
After evaluating the information deemed relevant by the Trustees, the Board concluded that any profits realized by New York Life Investments and its affiliates, including MacKay, due to their relationships with the Fund were not excessive.
Board Consideration and Approval of Management Agreement and Subadvisory Agreement (Unaudited) (continued)
Management and Subadvisory Fees and Total Ordinary Operating Expenses
The Board evaluated the reasonableness of the fee paid under each of the Advisory Agreements and the Fund’s total ordinary operating expenses. The Board primarily considered the reasonableness of the management fee paid by the Fund to New York Life Investments, because the subadvisory fee paid to MacKay is paid by New York Life Investments, not the Fund. The Board also considered the reasonableness of the subadvisory fee paid by New York Life Investments and the amount of the management fee retained by New York Life Investments.
In assessing the reasonableness of the Fund’s fees and expenses, the Board primarily considered comparative data provided by Strategic Insight on the fees and expenses charged by similar mutual funds managed by other investment advisers. In addition, the Board considered information provided by New York Life Investments and MacKay on fees charged to other investment advisory clients, including institutional separate accounts and/or other funds that follow investment strategies similar to those of the Fund, if any. The Board considered the similarities and differences in the contractual management fee schedules of the Fund and these similarly-managed accounts and/or funds, taking into account the rationale for any differences in fee schedules. The Board also took into account explanations provided by New York Life Investments about the more extensive scope of services provided to registered investment companies, such as the Fund, as compared with other investment advisory clients. Additionally, the Board considered the impact of voluntary waivers and expense limitation arrangements on the Fund’s net management fee and expenses. The Board also considered that in proposing fees for the Fund, New York Life Investments considers the competitive marketplace for mutual funds. The Board considered its discussions with representatives from New York Life Investments regarding the management fee paid by the Fund.
The Board noted that, outside of the Fund’s management fee and the fees charged under a share class’s Rule 12b-1 and/or shareholder services plans, a share class’s most significant “other expenses” are transfer agent fees. Transfer agent fees are charged to the Fund based on the number of shareholder accounts (a “per-account” fee). The Board took into account information from New York Life Investments regarding the reasonableness of the Fund’s transfer agent fee schedule, including industry data demonstrating that the per-account fees that NYLIM Service Company LLC, an affiliate of New York Life Investments and the Fund’s transfer agent, charges the Fund are within the range of per-account fees charged by transfer agents to other mutual funds. In addition, the Board considered NYLIM Service Company LLC’s profitability in connection with the transfer agent services it provides to the Fund. The Board also took into account information received from NYLIM Service Company LLC regarding the sub-transfer agency payments it made to intermediaries in connection with the provision of sub-transfer agency services to the Fund.
The Board considered that, because the Fund’s transfer agent fees are billed on a per-account basis, the impact of transfer agent fees on a share class’s expense ratio may be more significant in cases where the share class has a high number of small accounts. The Board considered the extent to which transfer agent fees comprised total expenses of the Fund. The Board acknowledged the role that the MainStay Group of Funds historically has played in serving the investment needs of New York Life Insurance Company customers, who often maintain smaller account balances than other shareholders of funds, and the impact of small accounts on the expense ratios of Fund share classes. The Board also recognized measures that it and New York Life Investments have taken to mitigate the effect of small accounts on the expense ratios of Fund share classes, including through the imposition of an expense limitation on net transfer agency expenses. The Board noted that, for purposes of allocating transfer agency fees and expenses, each retail fund in the MainStay Group of Funds combines the shareholder accounts of its Class A, A2, I, R1, R2 and R3 shares (as applicable) into one group and the shareholder accounts of its Investor Class, SIMPLE Class and Class B, C and C2 shares (as applicable) into another group. The Board also noted that the per-account fees attributable to each group of share classes is then allocated among the constituent share classes based on relative net assets and that a MainStay Fund’s Class R6 shares, if any, are not combined with any other share class for this purpose. The Board considered New York Life Investments’ rationale with respect to these groupings and previously received a report from an independent consultant engaged to conduct comparative analysis of these groupings. The Board also considered that NYLIM Service Company LLC had waived its contractual cost of living adjustments during the past seven years.
Based on the factors outlined above, the Board concluded that the Fund’s management fee and total ordinary operating expenses were within a range that is competitive and support a conclusion that these fees and expenses are reasonable.
Economies of Scale
The Board considered information regarding economies of scale, including whether the Fund’s expense structure permits economies of scale to be appropriately shared with the Fund’s shareholders. The Board also considered a report from New York Life Investments, previously prepared at the request of the Board, that addressed economies of scale, including with respect to the mutual fund business generally and the various ways in which the benefits of economies of scale may be shared with the funds in the MainStay Group of Funds. Although the Board recognized the difficulty of determining economies of scale with precision, the Board acknowledged that economies of scale may be shared with the Fund in a number of ways, including, for example, through the imposition of management fee breakpoints, initially setting management fee rates at scale or making additional investments to enhance services. The Board reviewed information from New York Life Investments showing how the Fund’s management fee schedule compared to fee schedules of other funds and accounts managed by New York Life Investments. The Board
| 42 | MainStay MacKay Short Duration High Yield Fund |
also reviewed information from Strategic Insight showing how the Fund’s management fee schedule compared with fees paid for similar services by peer funds at varying asset levels.
Based on this information, the Board concluded that economies of scale are appropriately reflected for the benefit of the Fund’s shareholders through the Fund’s expense structure and other methods to share benefits from economies of scale.
Conclusion
On the basis of the information and factors summarized above, among other information and factors deemed relevant by the Trustees, and the evaluation thereof, the Board, including the Independent Trustees voting separately, unanimously voted to approve the continuation of each of the Advisory Agreements.
Discussion of the Operation and Effectiveness of the Fund's Liquidity Risk Management Program (Unaudited)
In compliance with Rule 22e-4 under the Investment Company Act of 1940, as amended (the “Liquidity Rule”), the Fund has adopted and implemented a liquidity risk management program (the “Program”), which New York Life Investment Management LLC believes is reasonably designed to assess and manage the Fund's liquidity risk (the risk that the Fund could not meet requests to redeem shares issued by the Fund without significant dilution of remaining investors’ interests in the Fund). The Board of Trustees of MainStay Funds Trust (the "Board") designated New York Life Investment Management LLC as administrator of the Program (the “Administrator”). The Administrator has established a Liquidity Risk Management Committee to assist the Administrator in the implementation and day-to-day administration of the Program and to otherwise support the Administrator in fulfilling its responsibilities under the Program.
At a meeting of the Board held on March 8, 2021, the Administrator provided the Board with a written report addressing the Program’s operation and assessing its adequacy and effectiveness of implementation for the period from January 1, 2020 through December 31, 2020 (the "Review Period"), as required under the Liquidity Rule. The report noted that the Administrator concluded that (i) the Program operated effectively to assess and manage the Fund's liquidity risk, (ii) the Program has been adequately and effectively implemented to monitor and, as applicable, respond to the Fund's liquidity developments and (iii) the Fund's investment strategy continues to be appropriate for an open-end fund. In addition, the report discussed notable events that impacted liquidity risk during the Review Period, including the COVID-19 pandemic and the resulting economic shutdown.
In accordance with the Program, the Fund's liquidity risk is assessed no less frequently than annually taking into consideration certain factors, as applicable, such as (i) investment strategy and liquidity of portfolio investments, (ii) short-term and long-term cash flow projections and (iii) holdings of cash and cash equivalents, as well as borrowing arrangements and other funding sources. Certain factors are considered under both normal and reasonably foreseeable stressed conditions.
Each Fund portfolio investment is classified into one of four liquidity categories. The classification is based on a determination of the number of days it is reasonably expected to take to convert the investment into cash, or sell or dispose of the investment, in current market conditions without significantly changing the market value of the investment. The Administrator has delegated liquidity classification determinations to the Fund’s subadvisor, subject to appropriate oversight by the Administrator, and classification determinations are made by taking into account the Fund's reasonably anticipated trade size, various market, trading and investment-specific considerations, as well as market depth, and, in certain cases, third-party vendor data.
The Liquidity Rule requires funds that do not primarily hold assets that are highly liquid investments to adopt a minimum amount of net assets that must be invested in highly liquid investments that are assets (an “HLIM”). In addition, the Liquidity Rule limits a fund's investments in illiquid investments. Specifically, the Liquidity Rule prohibits acquisition of illiquid investments if doing so would result in a fund holding more than 15% of its net assets in illiquid investments that are assets. The Program includes provisions reasonably designed to determine, periodically review and comply with the HLIM requirement, as applicable, and to comply with the 15% limit on illiquid investments.
There can be no assurance that the Program will achieve its objectives under all circumstances in the future. Please refer to the Fund's prospectus for more information regarding the Fund's exposure to liquidity risk and other risks to which it may be subject.
| 44 | MainStay MacKay Short Duration High Yield Fund |
Proxy Voting Record
The Fund is required to file with the Securities and Exchange Commissions's ("SEC") its proxy voting records for the 12-month period ending June 30 on Form N-PX. The most recent Form N-PX or proxy voting record is available free of charge upon request by calling 800-624-6782; visiting the MainStay Funds’ website at newyorklifeinvestments.com; or visiting the SEC’s website at www.sec.gov.
Shareholder Reports and Quarterly Portfolio Disclosure
The Fund is required to file its complete schedule of portfolio holdings with the SEC 60 days after its first and third fiscal quarter on Form N-PORT. The Fund's holdings report is available free of charge upon request by calling New York Life Investments at 800-624-6782.
This page intentionally left blank.
Equity
U.S. Equity
MainStay Epoch U.S. Equity Yield Fund
MainStay MacKay S&P 500 Index Fund
MainStay Winslow Large Cap Growth Fund
MainStay WMC Enduring Capital Fund
MainStay WMC Growth Fund
MainStay WMC Small Companies Fund
MainStay WMC Value Fund
International Equity
MainStay Epoch International Choice Fund
MainStay MacKay International Equity Fund
MainStay WMC International Research Equity Fund
Emerging Markets Equity
MainStay Candriam Emerging Markets Equity Fund
Global Equity
MainStay Epoch Capital Growth Fund
MainStay Epoch Global Equity Yield Fund
Fixed Income
Taxable Income
MainStay Candriam Emerging Markets Debt Fund
MainStay Floating Rate Fund
MainStay MacKay High Yield Corporate Bond Fund
MainStay MacKay Short Duration High Yield Fund
MainStay MacKay Strategic Bond Fund
MainStay MacKay Total Return Bond Fund
MainStay MacKay U.S. Infrastructure Bond Fund
MainStay Short Term Bond Fund
Tax-Exempt Income
MainStay MacKay California Tax Free Opportunities Fund1
MainStay MacKay High Yield Municipal Bond Fund
MainStay MacKay Intermediate Tax Free Bond Fund
MainStay MacKay New York Tax Free Opportunities Fund2
MainStay MacKay Short Term Municipal Fund
MainStay MacKay Tax Free Bond Fund
Money Market
MainStay Money Market Fund
Mixed Asset
MainStay Balanced Fund
MainStay Income Builder Fund
MainStay MacKay Convertible Fund
Speciality
MainStay CBRE Global Infrastructure Fund
MainStay CBRE Real Estate Fund
MainStay Cushing MLP Premier Fund
Asset Allocation
MainStay Conservative Allocation Fund
MainStay Conservative ETF Allocation Fund
MainStay Defensive ETF Allocation Fund
MainStay Equity Allocation Fund
MainStay Equity ETF Allocation Fund
MainStay Growth Allocation Fund
MainStay Growth ETF Allocation Fund
MainStay Moderate Allocation Fund
MainStay Moderate ETF Allocation Fund
Manager
New York Life Investment Management LLC
New York, New York
Subadvisors
Candriam Belgium S.A.3
Brussels, Belgium
Candriam Luxembourg S.C.A.3
Strassen, Luxembourg
CBRE Clarion Securities LLC
Radnor, Pennsylvania
Cushing Asset Management, LP
Dallas, Texas
Epoch Investment Partners, Inc.
New York, New York
MacKay Shields LLC3
New York, New York
NYL Investors LLC3
New York, New York
Wellington Management Company LLP
Boston, Massachusetts
Winslow Capital Management, LLC
Minneapolis, Minnesota
Legal Counsel
Dechert LLP
Washington, District of Columbia
Independent Registered Public Accounting Firm
KPMG LLP
Philadelphia, Pennsylvania
Distributor
NYLIFE Distributors LLC3
Jersey City, New Jersey
Custodian
JPMorgan Chase Bank, N.A.
New York, New York
1.
This Fund is registered for sale in AZ, CA, NV, OR, TX, UT, WA and MI (Class A and I shares only), and CO, FL, GA, HI, ID, MA, MD, NH, NJ and NY (Class I shares only).
| 2. | This Fund is registered for sale in CA, CT, DE, FL, MA, NJ, NY and VT. |
| 3. | An affiliate of New York Life Investment Management LLC. |
Not part of the Semiannual Report
For more information
800-624-6782
newyorklifeinvestments.com
“New York Life Investments” is both a service mark, and the common trade name, of certain investment advisors affiliated with New York Life Insurance Company. The MainStay Funds® are managed by New York Life Investment Management LLC and distributed by NYLIFE Distributors LLC, 30 Hudson Street, Jersey City, NJ 07302, a wholly owned subsidiary of New York Life Insurance Company. NYLIFE Distributors LLC is a Member FINRA/SIPC.
©2021 NYLIFE Distributors LLC. All rights reserved.
| 1739387MS071-21 | MSSHY10-06/21 |
(NYLIM) NL232
MainStay MacKay Total Return Bond Fund
Message from the President and Semiannual Report
Unaudited | April 30, 2021
Sign up for e-delivery of your shareholder reports. For full details on e-delivery, including who can participate and what you can receive via e-delivery,
please log in to newyorklifeinvestments.com/accounts.
| Not FDIC/NCUA Insured | Not a Deposit | May Lose Value | No Bank Guarantee | Not Insured by Any Government Agency |
This page intentionally left blank
Message from the President
With the approval of COVID-19 vaccines and the passage of relief packages by the U.S. Congress, economic prospects improved during the reporting period, and investor risk appetite increased, benefiting both equities and fixed-income markets. Despite some volatility stemming from a sell-off in longer-dated Treasury securities, the stock market and higher-risk segments of the fixed-income market posted gains for the six months ended April 30, 2021.
By the beginning of the reporting period, the economy had made tremendous progress from the second quarter of 2020, when economic activity plunged. But uncertainty about when vaccines would be available and how quickly they could be administered left investors unsure about the economic outlook.
With the approval of several vaccines in November, the outlook brightened and investors became less risk-averse. Anticipating the likely end of the pandemic and a continuation of the economic recovery, they began to see opportunities in investment-grade and high-yield bonds and more cyclical segments of the stock market. The $900 billion relief and stimulus package passed in December provided further assurance.
In January, the Federal Reserve opted to leave interest rates unchanged, pointing to some uncertainty about the pace of the global recovery. Officials also noted that inflation remained low, citing oil prices in particular.
In March, President Biden signed the $1.9 billion American Rescue Plan, which, among other provisions, called for payments of $1,400 for those earning less than $75,000 per year, plus $1,400 per dependent. This, combined with the Federal Reserve’s new tolerance for inflation and an anticipated $2 trillion infrastructure spending bill, added to growing concerns about higher prices. Supply shortages in some markets caused some prices to soar, heightening concerns further.
In fixed-income markets, an improving economic outlook and rising inflation expectations led to a sell-off in longer-term Treasuries, with the result that the yield on the 10-year note rose sharply, particularly in February and March. Investment grade corporate bonds were also affected. Early in the reporting period, they performed well as investors shifted out of Treasuries, but as the reporting period progressed, they faltered. Longer-dated securities issued in recent years at historically low interest rates became especially unattractive.
High-yield bonds remained steady, supported by more favorable yields and an improved economic outlook, which reduced their perceived risk. Municipal bonds produced modest gains, and
although the sell-off in Treasuries produced some volatility early in 2021, stronger-than-expected tax revenues, $350 billion in financial support from the federal government, and the possibility of an increase in federal income tax rates appeared to buoy the market late in the reporting period.
Inflation concerns and volatility in the Treasury market led to a shift in equities markets. Although the S&P 500® Index, a widely followed measure of U.S. equities, posted double-digit gains and hit a record high, the rise of Treasury yields disrupted valuations, especially those of growth stocks. Technology companies that saw their valuations soar amid the work-from-home trend in 2020 suffered large declines.
But the fiscal stimulus and continued accommodation from the Federal Reserve gave investors confidence the economic recovery would continue. Combined with the sky-high valuations in technology and growth stocks, this increased the appeal of more cyclical and value-oriented shares. As a result, value stocks outperformed growth stocks during the reporting period.
Reflecting the shift in investor sentiment, the performance of S&P 500® Index sectors varied widely. While the information technology sector kept up with the broader market, it lagged cyclical sectors such as energy and financials, which led the way. The shift was further reflected in the performance of small-cap stocks, which outperformed large caps. While developed markets kept pace with the U.S. market, lagging economic and pandemic recoveries appeared to weigh on emerging markets late in the reporting period.
With the lockdown restrictions lifting in the U.S. and the pandemic easing in many regions, we at New York Life Investments are looking forward to a return to a more normal economy. We anticipate that over the next several years, a variety of trends will likely offer long-term investors many attractive opportunities. With this in mind, we continue to develop products and services to help you to take advantage of these trends, manage your risks, and ultimately meet your investment goals.
Sincerely,
Kirk C. Lehneis
President
The opinions expressed are as of the date of this report and are subject to change. There is no guarantee that any forecast made will come to pass. This material does not constitute investment advice and is not intended as an endorsement of any specific investment. Past performance is no guarantee of future results.
Not part of the Semiannual Report
Investors should refer to the Fund’s Summary Prospectus and/or Prospectus and consider the Fund’s investment objectives, strategies, risks, charges and expenses carefully before investing. The Summary Prospectus and/or Prospectus contain this and other information about the Fund. You may obtain copies of the Fund’s Summary Prospectus, Prospectus and Statement of Additional Information free of charge, upon request, by calling toll-free 800-624-6782, by writing to NYLIFE Distributors LLC, Attn: MainStay Marketing Department, 30 Hudson Street, Jersey City, NJ 07302 or by sending an e-mail to MainStayShareholderServices@nylim.com. These documents are also available via the MainStay Funds’ website at newyorklifeinvestments.com. Please read the Fund’s Summary Prospectus and/or Prospectus carefully before investing.
Investment and Performance Comparison (Unaudited)
Performance data quoted represents past performance. Past performance is no guarantee of future results. Because of market volatility and other factors, current performance may be lower or higher than the figures shown. Investment return and principal value will fluctuate, and as a result, when shares are redeemed, they may be worth more or less than their original cost. The graph below depicts the historical performance of Class I shares of the Fund. Performance will vary from class to class based on differences in class-specific expenses and sales charges. For performance information current to the most recent month-end, please call 800-624-6782 or visit newyorklifeinvestments.com.
The performance table and graph do not reflect the deduction of taxes that a shareholder would pay on distributions or Fund share redemptions. Total returns reflect maximum applicable sales charges as indicated in the table below, if any, changes in share price, and reinvestment of dividend and capital gain distributions. The graph assumes the initial investment amount shown below and reflects the deduction of all sales charges that would have applied for the period of investment. Performance figures may reflect certain fee waivers and/or expense limitations, without which total returns may have been lower. For more information on share classes and current fee waivers and/or expense limitations (if any), please refer to the Notes to Financial Statements.
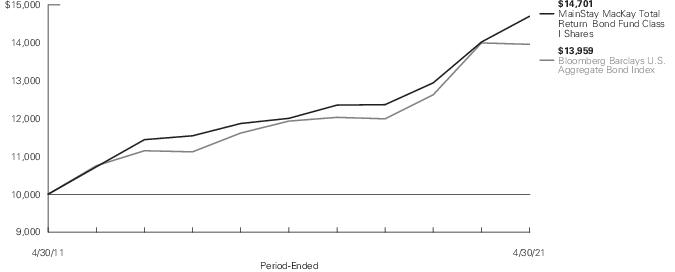
| Average Annual Total Returns for the Period-Ended April 30, 2021 |
| Class | Sales Charge | | Inception
Date | Six
Months | One Year
or Since
Inception | Five
Years | Ten Years
or Since
Inception | Gross
Expense
Ratio1 |
| Class A Shares | Maximum 4.5% Initial Sales Charge | With sales charges | 1/2/2004 | -4.16% | -0.19% | 2.87% | 3.13% | 0.85% |
| | | Excluding sales charges | | 0.35 | 4.51 | 3.82 | 3.61 | 0.85 |
| Investor Class Shares2 | Maximum 4% Initial Sales Charge | With sales charges | 2/28/2008 | -3.83 | -0.39 | 2.73 | 3.03 | 1.05 |
| | | Excluding sales charges | | 0.18 | 4.31 | 3.68 | 3.51 | 1.05 |
| Class B Shares3 | Maximum 5% CDSC | With sales charges | 1/2/2004 | -5.04 | -1.39 | 2.57 | 2.74 | 1.80 |
| | if Redeemed Within the First Six Years of Purchase | Excluding sales charges | | -0.13 | 3.61 | 2.93 | 2.74 | 1.80 |
| Class C Shares | Maximum 1% CDSC | With sales charges | 1/2/2004 | -1.11 | 2.61 | 2.93 | 2.73 | 1.80 |
| | if Redeemed Within One Year of Purchase | Excluding sales charges | | -0.13 | 3.61 | 2.93 | 2.73 | 1.80 |
| Class I Shares | No Sales Charge | | 1/2/1991 | 0.48 | 4.85 | 4.13 | 3.93 | 0.60 |
| Class R1 Shares | No Sales Charge | | 6/29/2012 | 0.42 | 4.66 | 4.01 | 3.40 | 0.70 |
| Class R2 Shares | No Sales Charge | | 6/29/2012 | 0.30 | 4.49 | 3.74 | 3.14 | 0.95 |
| Class R3 Shares | No Sales Charge | | 2/29/2016 | 0.18 | 4.14 | 3.49 | 3.91 | 1.20 |
| Class R6 Shares | No Sales Charge | | 12/29/2014 | 0.51 | 4.83 | 4.19 | 3.71 | 0.53 |
| SIMPLE Class Shares | No Sales Charge | | 8/31/2020 | 0.15 | -0.52 | N/A | N/A | 1.30 |
| 1. | The gross expense ratios presented reflect the Fund’s “Total Annual Fund Operating Expenses” from the most recent Prospectus, as supplemented, and may differ from other expense ratios disclosed in this report. |
| 2. | Prior to June 30, 2020, the maximum initial sales charge for Investor Class shares was 4.5%, which is reflected in the average annual total return figures shown. |
| 3. | Class B shares are closed to all new purchases as well as additional investments by existing Class B shareholders. |
The footnotes on the next page are an integral part of the table and graph and should be carefully read in conjunction with them.
| Benchmark Performance | Six
Months | One
Year | Five
Years | Ten
Years |
| Bloomberg Barclays U.S. Aggregate Bond Index1 | -1.52% | -0.27% | 3.19% | 3.39% |
| Morningstar Intermediate Core-Plus Bond Category Average2 | 0.49 | 4.65 | 3.80 | 3.75 |
| 1. | The Bloomberg Barclays U.S. Aggregate Bond Index is a broad-based benchmark that measures the investment grade, U.S. dollar-denominated, fixed-rate taxable bond market, including Treasurys, government-related and corporate securities, mortgage-backed securities (agency fixed-rate and hybrid adjustable rate mortgage passthroughs), asset-backed securities, and commercial mortgage-backed securities. Results assume reinvestment of all dividends and capital gains. An investment cannot be made directly in an index. |
| 2. | The Morningstar Intermediate Core-Plus Bond Category Average is representative of funds that invest primarily in investment-grade U.S. fixed-income issues including government, corporate, and securitized debt, but generally have greater flexibility than core offerings to hold non-core sectors such as corporate high yield, bank loan, emerging-markets debt, and non-U.S. currency exposures. Their durations (a measure of interest-rate sensitivity) typically range between 75% and 125% of the three-year average of the effective duration of the Morningstar Core Bond Index. Results are based on average total returns of similar funds with all dividends and capital gain distributions reinvested. |
The footnotes on the preceding page are an integral part of the table and graph and should be carefully read in conjunction with them.
| 6 | MainStay MacKay Total Return Bond Fund |
Cost in Dollars of a $1,000 Investment in MainStay MacKay Total Return Bond Fund (Unaudited)
The example below is intended to describe the fees and expenses borne by shareholders during the six-month period from November 1, 2020, to April 30, 2021, and the impact of those costs on your investment.
Example
As a shareholder of the Fund you incur two types of costs: (1) transaction costs, including exchange fees and sales charges (loads) on purchases (as applicable), and (2) ongoing costs, including management fees, distribution and/or service (12b-1) fees, and other Fund expenses (as applicable). This example is intended to help you understand your ongoing costs (in dollars) of investing in the Fund and to compare these costs with the ongoing costs of investing in other mutual funds. The example is based on an investment of $1,000 made at the beginning of the six-month period and held for the entire period from November 1, 2020, to April 30, 2021.
This example illustrates your Fund’s ongoing costs in two ways:
Actual Expenses
The second and third data columns in the table below provide information about actual account values and actual expenses. You may use the information in these columns, together with the amount you invested, to estimate the expenses that you paid during the six months ended April 30, 2021. Simply divide your account value by $1,000 (for example, an
$8,600 account value divided by $1,000 = 8.6), then multiply the result by the number under the heading entitled “Expenses Paid During Period” to estimate the expenses you paid on your account during this period.
Hypothetical Example for Comparison Purposes
The fourth and fifth data columns in the table below provide information about hypothetical account values and hypothetical expenses based on the Fund’s actual expense ratio and an assumed rate of return of 5% per year before expenses, which is not the Fund’s actual return. The hypothetical account values and expenses may not be used to estimate the actual ending account balances or expenses you paid for the six-month period shown. You may use this information to compare the ongoing costs of investing in the Fund with the ongoing costs of investing in other mutual funds. To do so, compare this 5% hypothetical example with the 5% hypothetical examples that appear in the shareholder reports of the other mutual funds.
Please note that the expenses shown in the table are meant to highlight your ongoing costs only and do not reflect any transactional costs, such as exchange fees or sales charges (loads). Therefore, the fourth and fifth data columns of the table are useful in comparing ongoing costs only and will not help you determine the relative total costs of owning different funds. In addition, if these transactional costs were included, your costs would have been higher.
| Share Class | Beginning
Account
Value
11/1/20 | Ending Account
Value (Based
on Actual
Returns and
Expenses)
4/30/21 | Expenses
Paid
During
Period1 | Ending Account
Value (Based
on Hypothetical
5% Annualized
Return and
Actual Expenses)
4/30/21 | Expenses
Paid
During
Period1 | Net Expense
Ratio
During
Period2 |
| Class A Shares | $1,000.00 | $1,003.50 | $4.22 | $1,020.58 | $4.26 | 0.85% |
| Investor Class Shares | $1,000.00 | $1,001.80 | $5.01 | $1,019.79 | $5.06 | 1.01% |
| Class B Shares | $1,000.00 | $ 998.70 | $8.72 | $1,016.07 | $8.80 | 1.76% |
| Class C Shares | $1,000.00 | $ 998.70 | $8.72 | $1,016.07 | $8.80 | 1.76% |
| Class I Shares | $1,000.00 | $1,004.80 | $2.98 | $1,021.82 | $3.01 | 0.60% |
| Class R1 Shares | $1,000.00 | $1,004.20 | $3.48 | $1,021.32 | $3.51 | 0.70% |
| Class R2 Shares | $1,000.00 | $1,003.00 | $4.67 | $1,020.13 | $4.71 | 0.94% |
| Class R3 Shares | $1,000.00 | $1,001.80 | $5.96 | $1,018.84 | $6.01 | 1.20% |
| Class R6 Shares | $1,000.00 | $1,005.10 | $2.63 | $1,022.17 | $2.66 | 0.53% |
| SIMPLE Class Shares | $1,000.00 | $1,001.50 | $6.20 | $1,018.60 | $6.26 | 1.25% |
| 1. | Expenses are equal to the Fund’s annualized expense ratio of each class multiplied by the average account value over the period, divided by 365 and multiplied by 181 (to reflect the six-month period). The table above represents the actual expenses incurred during the six-month period. In addition to the fees and expenses which the Fund bears directly, it also indirectly bears a pro rata share of the fees and expenses of the underlying funds in which it invests. Such indirect expenses are not included in the above-reported expense figures. |
| 2. | Expenses are equal to the Fund's annualized expense ratio to reflect the six-month period. |
Portfolio Composition as of April 30, 2021 (Unaudited)
‡ Less than one tenth of a percent.
See Portfolio of Investments beginning on page 11 for specific holdings within these categories. The Fund's holdings are subject to change.
Top Ten Issuers Held as of April 30, 2021 (excluding short-term investments) (Unaudited)
| 1. | U.S. Treasury Notes, 0.125%-1.25%, due 4/30/23–4/30/28 |
| 2. | U.S. Treasury Bonds, 1.875%-4.50%, due 5/15/38–2/15/51 |
| 3. | FNMA, 2.00%-4.556%, due 1/25/29–1/25/51 |
| 4. | UMBS, 30 Year, 2.00%-6.50%, due 7/1/39–4/1/51 |
| 5. | U.S. Treasury Inflation Linked Notes, 0.125%-0.875%, due 7/15/28–7/15/30 |
| 6. | Bank of America Corp., 2.496%-6.30%, due 1/28/25–4/22/42 |
| 7. | JPMorgan Chase & Co., 2.182%-5.50%, due 2/1/25–4/22/52 |
| 8. | FHLMC, 1.50%-4.00%, due 8/25/38–12/25/50 |
| 9. | FHLMC Structured Agency Credit Risk Debt Notes, 3.406%-4.756%, due 10/25/27–8/25/29 |
| 10. | UMBS, Single Family, 30 Year, 2.50%-3.50%, due 5/25/51 |
| 8 | MainStay MacKay Total Return Bond Fund |
Portfolio Management Discussion and Analysis (Unaudited)
Questions answered by portfolio managers Stephen R. Cianci, CFA, and Neil Moriarty III, of MacKay Shields LLC, the Fund’s Subadvisor.
How did MainStay MacKay Total Return Bond Fund perform relative to its benchmark and peer group during the six months ended April 30, 2021?
For the six months ended April 30, 2021, Class I shares of MainStay MacKay Total Return Bond Fund returned 0.48%, outperforming the −1.52% return of the Fund’s primary benchmark, the Bloomberg Barclays U.S. Aggregate Bond Index. Over the same period, Class I shares underperformed the 0.49% return of the Morningstar Intermediate Core-Plus Bond Category Average.1
What factors affected the Fund’s relative performance during the reporting period?
Overall risk continued to rally throughout the reporting period. This trend was accentuated by the approval of multiple vaccines in the fourth quarter of 2020, along with the global acceleration of actual vaccinations in the first quarter of 2021. Additionally, the fiscal packages that were passed by the U.S. Congress helped to propel risk assets. Lastly, the U.S. Federal Reserve’s monetary policy remained accommodative. These factors were catalysts that led to risk assets out-performing, especially in the first quarter of 2021 when credit spreads narrowed as risk assets rallied despite a volatile environment that saw long-term Treasury rates rise faster than short-term rates.
During the reporting period, the Fund outperformed the Bloomberg Barclays U.S. Aggregate Bond Index primarily due to overweight exposure to spread2 product, particularly investment-grade and high-yield corporate bonds. Conversely, a modestly overweight duration3 position detracted from the Fund’s relative performance.
During the reporting period, how was the Fund’s performance materially affected by investments in derivatives?
During the reporting period, the Fund used U.S. Treasury futures to manage its overall duration exposure. This strategy had a negative impact on returns as rates rose.
What was the Fund’s duration strategy during the reporting period?
Though we extended the Fund’s duration during the reporting period, it remained below that of the Bloomberg Barclays U.S. Aggregate Bond Index, contributing positively to performance
relative to the benchmark. (Contributions take weightings and total returns into account.)
During the reporting period, which sectors were the strongest positive contributors to the Fund’s relative performance and which sectors were particularly weak?
The Fund’s overweight exposure to corporate bonds, both investment grade and high yield, made positive contributions to performance relative to the Bloomberg Barclays U.S. Aggregate Bond Index for the entire reporting period. Additionally, select and timely purchases of both types of bonds after the market correction bolstered returns relative to the benchmark.
What were some of the Fund’s largest purchases and sales during the reporting period?
A robust primary calendar for corporate credit offered several opportunities to introduce new names into the Fund with midstream, financials and consumer non-cyclical industries. In addition, we trimmed the Fund’s exposure to higher quality credits with limited total return potential as spreads narrowed.
Within emerging markets, we reduced the Fund’s exposure to Chinese technology companies as well as to an oil major rumored to be delisted from U.S. stock exchanges. Through the primary market, the Fund added a new issue from a Mexican petrochemical company offered at favorable terms. Another purchase in the consumer non-cyclical sector involved a new credit issued by a Brazilian company with a strong global presence and solid fundamentals.
Among commercial mortgage-backed securities (“CMBS”), the Fund took advantage of rich valuations by selling AAA-rated4 conduit bonds at levels tighter than pre-pandemic. Instead, the Fund added more opportunistic single asset deals, such as securitizations backed by Las Vegas properties. The Fund was active in the CMBS primary market, including multifamily housing, an office building in Seattle and industrial properties spread throughout the country. In the secondary market, the Fund purchased seasoned subordinate bonds at attractive yields with sufficient credit enhancement to withstand stresses in the market.
Among non-agency residential mortgage-backed securities, given strong underlying housing fundamentals, the Fund participated in a credit risk transfer deal brought by Freddie Mac, the underlying collateral characteristics of which were broadly considered the
| 1. | See page 5 for other share class returns, which may be higher or lower than Class I share returns. See page 6 for more information on benchmark and peer group returns. |
| 2. | The terms “spread” and “yield spread” may refer to the difference in yield between a security or type of security and comparable U.S. Treasury issues. The terms may also refer to the difference in yield between two specific securities or types of securities at a given time. |
| 3. | Duration is a measure of the price sensitivity of a fixed-income investment to changes in interest rates. Duration is expressed as a number of years and is considered a more accurate sensitivity gauge than average maturity. |
| 4. | An obligation rated ‘AAA’ has the highest rating assigned by Standard & Poor’s (“S&P”), and in the opinion of S&P, the obligor’s capacity to meet its financial commitment on the obligation is extremely strong. When applied to Fund holdings, ratings are based solely on the creditworthiness of the bonds in the portfolio and are not meant to represent the security or safety of the Fund. |
strongest ever for the program given the high FICO scores of the borrowers.
How did the Fund’s sector weightings change during the reporting period?
During the reporting period, the Fund maintained its risk-positive positioning and kept broader exposures fairly consistent, making modest additions to CMBS exposure and agency commercial mortgage obligations while trimming a small amount in investment-grade credit and bank loans. The Fund’s most significant activity within sectors involved opportunities in new issue markets and rotating out of rich secondary positions in favor of cheaper new issues.
How was the Fund positioned at the end of the reporting period?
As of April 30, 2021, we expect the combination of easy monetary policy, ongoing fiscal support and the economy’s reopening to put some upward pressure on inflation in the months ahead. Thereafter, a return to full employment should lead to additional firming of consumer prices over the medium term, though we still expect only moderate levels of inflation. Therefore, in our opinion, the point at which the U.S. Federal Reserve’s Federal Open Market Committee would contemplate policy tightening to rein in inflation remains quite far off. Accordingly, we anticipate an extended economic expansion that should prove beneficial to risk assets, including credit.
Relative to the Bloomberg Barclays U.S. Aggregate Bond Index, as of April 30, 2021, the Fund held overweight exposure to high-yield investment-grade corporate bonds and securitized assets. As of the same date, the Fund held underweight exposure to U.S. Treasury securities and agency mortgages.
The opinions expressed are those of the portfolio managers as of the date of this report and are subject to change. There is no guarantee that any forecasts will come to pass. This material does not constitute investment advice and is not intended as an endorsement of any specific investment.
| 10 | MainStay MacKay Total Return Bond Fund |
Portfolio of Investments April 30, 2021† (Unaudited)
| | Principal
Amount | Value |
| Long-Term Bonds 96.2% |
| Asset-Backed Securities 7.1% |
| Automobile Asset-Backed Securities 1.9% |
| Avis Budget Rental Car Funding AESOP LLC (a) | |
| Series 2020-1A, Class A | | |
| 2.33%, due 8/20/26 | $ 1,745,000 | $ 1,817,930 |
| Series 2017-2A, Class A | | |
| 2.97%, due 3/20/24 | 820,000 | 853,934 |
| Series 2018-2A, Class A | | |
| 4.00%, due 3/20/25 | 3,275,000 | 3,549,157 |
| Drive Auto Receivables Trust | |
| Series 2020-2, Class C | | |
| 2.28%, due 8/17/26 | 1,800,000 | 1,848,896 |
| Flagship Credit Auto Trust | |
| Series 2020-4, Class C | | |
| 1.28%, due 2/16/27 (a) | 1,895,000 | 1,906,680 |
| Ford Credit Auto Owner Trust | |
| Series 2020-2, Class A | | |
| 1.06%, due 4/15/33 (a) | 1,430,000 | 1,421,499 |
| Ford Credit Floorplan Master Owner Trust | |
| Series 2019-4, Class A | | |
| 2.44%, due 9/15/26 | 2,800,000 | 2,957,128 |
| Series 2018-4, Class A | | |
| 4.06%, due 11/15/30 | 1,835,000 | 2,085,929 |
| GM Financial Automobile Leasing Trust | |
| Series 2020-2, Class B | | |
| 1.56%, due 7/22/24 | 1,780,000 | 1,814,042 |
| JPMorgan Chase Bank NA | |
| Series 2020-1, Class B | | |
| 0.991%, due 1/25/28 (a) | 634,128 | 635,872 |
| Santander Drive Auto Receivables Trust | |
| Series 2020-2, Class C | | |
| 1.46%, due 9/15/25 | 2,340,000 | 2,370,620 |
| Series 2020-4, Class D | | |
| 1.48%, due 1/15/27 | 4,575,000 | 4,631,951 |
| Santander Revolving Auto Loan Trust | |
| Series 2019-A, Class A | | |
| 2.51%, due 1/26/32 (a) | 2,215,000 | 2,330,540 |
| | | 28,224,178 |
| Credit Card Asset-Backed Security 0.2% |
| Capital One Multi-Asset Execution Trust | |
| Series 2019-A3, Class A3 | | |
| 2.06%, due 8/15/28 | 2,420,000 | 2,528,305 |
| | Principal
Amount | Value |
| |
| Home Equity Asset-Backed Security 0.3% |
| Carrington Mortgage Loan Trust | |
| Series 2007-HE1, Class A3 | | |
| 0.296% (1 Month LIBOR + 0.19%), due 6/25/37 (b) | $ 5,239,190 | $ 5,163,609 |
| Other Asset-Backed Securities 4.7% |
| American Airlines Pass-Through Trust | |
| Series 2019-1, Class AA | | |
| 3.15%, due 2/15/32 | 2,123,455 | 2,122,210 |
| Series 2013-2, Class A | | |
| 4.95%, due 1/15/23 | 6,726,206 | 6,794,893 |
| CF Hippolyta LLC (a) | |
| Series 2021-1A, Class A1 | | |
| 1.53%, due 3/15/61 | 2,855,000 | 2,855,792 |
| Series 2020-1, Class A1 | | |
| 1.69%, due 7/15/60 | 4,364,374 | 4,424,835 |
| Series 2020-1, Class A2 | | |
| 1.99%, due 7/15/60 | 2,050,705 | 2,055,326 |
| CVS Pass-Through Trust | |
| 5.789%, due 1/10/26 (a) | 36,350 | 39,978 |
| Hilton Grand Vacations Trust | |
| Series 2019-AA, Class A | | |
| 2.34%, due 7/25/33 (a) | 2,505,198 | 2,583,618 |
| JetBlue Pass-Through Trust | |
| Series 2019-1, Class AA | | |
| 2.75%, due 5/15/32 | 2,509,713 | 2,529,308 |
| MVW LLC (a) | |
| Series 2020-1A, Class A | | |
| 1.74%, due 10/20/37 | 1,626,756 | 1,656,665 |
| Series 2019-2A, Class A | | |
| 2.22%, due 10/20/38 | 2,190,063 | 2,236,350 |
| Navient Private Education Refi Loan Trust (a) | |
| Series 2020-DA, Class A | | |
| 1.69%, due 5/15/69 | 1,010,056 | 1,021,119 |
| Series 2020-HA, Class B | | |
| 2.78%, due 1/15/69 | 3,080,000 | 3,050,969 |
| New Residential Advance Receivables Trust | |
| Series 2020-APT1, Class AT1 | | |
| 1.035%, due 12/16/52 (a) | 3,055,000 | 3,055,280 |
| PFS Financing Corp. | |
| Series 2020-E, Class A | | |
| 1.00%, due 10/15/25 (a) | 2,335,000 | 2,353,715 |
| Progress Residential (a) | |
| Series 2021-SFR1, Class A | | |
| 1.052%, due 4/17/38 | 3,005,000 | 2,938,854 |
| Series 2021-SFR1, Class B | | |
| 1.303%, due 4/17/38 | 1,750,000 | 1,717,363 |
The notes to the financial statements are an integral part of, and should be read in conjunction with, the financial statements.
11
Portfolio of Investments April 30, 2021† (Unaudited) (continued)
| | Principal
Amount | Value |
| Asset-Backed Securities (continued) |
| Other Asset-Backed Securities (continued) |
| Progress Residential (a) (continued) | |
| Series 2021-SFR3, Class A | | |
| 1.637%, due 5/17/26 | $ 2,000,000 | $ 2,004,457 |
| Series 2021-SFR4, Class B | | |
| 1.808%, due 5/17/38 | 2,415,000 | 2,412,709 |
| Progress Residential Trust (a) | |
| Series 2021-SFR2, Class A | | |
| 1.546%, due 4/19/38 | 1,625,000 | 1,626,763 |
| Series 2021-SFR2, Class B | | |
| 1.796%, due 4/19/38 | 6,560,000 | 6,560,655 |
| SBA Tower Trust | |
| 1.631%, due 11/15/26 (a)(c) | 4,320,000 | 4,320,000 |
| Sierra Timeshare Receivables Funding LLC (a) | |
| Series 2020-2A, Class A | | |
| 1.33%, due 7/20/37 | 1,641,097 | 1,651,104 |
| Series 2019-3A, Class A | | |
| 2.34%, due 8/20/36 | 1,249,769 | 1,281,840 |
| Series 2020-2A, Class C | | |
| 3.51%, due 7/20/37 | 3,653,224 | 3,766,946 |
| United Airlines Pass-Through Trust | |
| Series 2020-1, Class A | | |
| 5.875%, due 10/15/27 | 3,152,817 | 3,487,661 |
| | | 68,548,410 |
Total Asset-Backed Securities
(Cost $101,420,946) | | 104,464,502 |
| Corporate Bonds 49.0% |
| Aerospace & Defense 0.3% |
| BAE Systems plc | | |
| 3.00%, due 9/15/50 (a) | 1,580,000 | 1,474,212 |
| L3Harris Technologies, Inc. | | |
| 4.854%, due 4/27/35 | 585,000 | 716,350 |
| 5.054%, due 4/27/45 | 1,215,000 | 1,536,134 |
| | | 3,726,696 |
| Agriculture 0.5% |
| Altria Group, Inc. | | |
| 2.45%, due 2/4/32 | 3,075,000 | 2,892,720 |
| 4.80%, due 2/14/29 | 470,000 | 534,633 |
| BAT Capital Corp. | | |
| 3.734%, due 9/25/40 | 2,990,000 | 2,791,414 |
| JBS Investments II GmbH | | |
| 7.00%, due 1/15/26 (a) | 900,000 | 958,320 |
| | | 7,177,087 |
| | Principal
Amount | Value |
| |
| Airlines 1.0% |
| American Airlines, Inc. (a) | | |
| 5.50%, due 4/20/26 | $ 2,405,000 | $ 2,525,250 |
| 5.75%, due 4/20/29 | 1,430,000 | 1,532,245 |
| Delta Air Lines, Inc. (a) | | |
| 4.50%, due 10/20/25 | 1,850,000 | 1,984,406 |
| 4.75%, due 10/20/28 | 1,470,000 | 1,614,241 |
| 7.00%, due 5/1/25 | 3,565,000 | 4,145,515 |
| Mileage Plus Holdings LLC | | |
| 6.50%, due 6/20/27 (a) | 2,995,000 | 3,287,012 |
| | | 15,088,669 |
| Auto Manufacturers 1.3% |
| Ford Motor Co. | | |
| 8.50%, due 4/21/23 | 3,330,000 | 3,729,600 |
| 9.00%, due 4/22/25 | 3,300,000 | 4,030,125 |
| Ford Motor Credit Co. LLC | | |
| 3.35%, due 11/1/22 | 1,280,000 | 1,309,811 |
| 4.063%, due 11/1/24 | 3,630,000 | 3,821,882 |
| 4.25%, due 9/20/22 | 1,015,000 | 1,048,546 |
| General Motors Co. | | |
| 6.125%, due 10/1/25 | 2,915,000 | 3,459,537 |
| Volkswagen Group of America Finance LLC | | |
| 1.25%, due 11/24/25 (a) | 2,100,000 | 2,094,751 |
| | | 19,494,252 |
| Banks 11.1% |
| Banco Santander Mexico SA Institucion de Banca Multiple Grupo Financiero Santand | | |
| 5.375%, due 4/17/25 (a) | 3,200,000 | 3,605,344 |
| Bank of America Corp. | | |
| 2.496%, due 2/13/31 (d) | 3,850,000 | 3,861,149 |
| 2.676%, due 6/19/41 (d) | 4,310,000 | 4,049,233 |
| 3.248%, due 10/21/27 | 5,450,000 | 5,913,833 |
| 3.311%, due 4/22/42 (d) | 1,625,000 | 1,657,969 |
| 3.419%, due 12/20/28 (d) | 468,000 | 506,877 |
| 3.593%, due 7/21/28 (d) | 2,300,000 | 2,515,335 |
| 3.705%, due 4/24/28 (d) | 5,000,000 | 5,513,255 |
| 4.25%, due 10/22/26 | 6,900,000 | 7,799,620 |
| Series MM | | |
| 4.30%, due 1/28/25 (d)(e) | 5,410,000 | 5,572,300 |
| Series DD | | |
| 6.30%, due 3/10/26 (d)(e) | 1,500,000 | 1,754,531 |
| Barclays plc | | |
| 4.61%, due 2/15/23 (d) | 1,205,000 | 1,242,548 |
| BNP Paribas SA (a) | | |
| 3.052%, due 1/13/31 (d) | 5,020,000 | 5,202,429 |
The notes to the financial statements are an integral part of, and should be read in conjunction with, the financial statements.
| 12 | MainStay MacKay Total Return Bond Fund |
| | Principal
Amount | Value |
| Corporate Bonds (continued) |
| Banks (continued) |
| BNP Paribas SA (a) (continued) | | |
| 4.625% (5 Year Treasury Constant Maturity Rate + 3.34%), due 2/25/31 (b)(e)(f) | $ 2,800,000 | $ 2,842,000 |
| Citigroup, Inc. | | |
| 3.887%, due 1/10/28 (d) | 3,489,000 | 3,880,916 |
| 5.30%, due 5/6/44 | 3,464,000 | 4,454,913 |
| Credit Suisse Group AG | | |
| 2.593%, due 9/11/25 (a)(d) | 3,550,000 | 3,693,026 |
| First Horizon Bank | | |
| 5.75%, due 5/1/30 | 2,671,000 | 3,247,559 |
| First Horizon Corp. | | |
| 4.00%, due 5/26/25 | 5,300,000 | 5,844,386 |
| Goldman Sachs Group, Inc. (The) | | |
| 1.431%, due 3/9/27 (d) | 2,110,000 | 2,101,761 |
| 1.992%, due 1/27/32 (d) | 2,430,000 | 2,308,069 |
| 2.615%, due 4/22/32 (d) | 1,680,000 | 1,688,198 |
| 6.75%, due 10/1/37 | 2,300,000 | 3,259,563 |
| HSBC Holdings plc | | |
| 3.973%, due 5/22/30 (d) | 1,830,000 | 2,003,850 |
| JPMorgan Chase & Co. | | |
| 2.182%, due 6/1/28 (d) | 2,920,000 | 2,981,353 |
| 2.956%, due 5/13/31 (d) | 3,015,000 | 3,097,198 |
| 3.157%, due 4/22/42 (d) | 1,970,000 | 1,973,194 |
| 3.328%, due 4/22/52 (d) | 1,490,000 | 1,490,280 |
| 3.782%, due 2/1/28 (d) | 2,600,000 | 2,886,499 |
| 4.005%, due 4/23/29 (d) | 4,000,000 | 4,497,760 |
| Series HH | | |
| 4.60%, due 2/1/25 (d)(e) | 11,707,000 | 12,072,844 |
| 5.50%, due 10/15/40 | 1,805,000 | 2,378,407 |
| Lloyds Banking Group plc | | |
| 4.582%, due 12/10/25 | 8,183,000 | 9,166,886 |
| Morgan Stanley | | |
| 3.591%, due 7/22/28 (d) | 5,265,000 | 5,794,950 |
| 5.00%, due 11/24/25 | 4,535,000 | 5,223,424 |
| Natwest Group plc | | |
| 3.073% (1 Year Treasury Constant Maturity Rate + 2.55%), due 5/22/28 (b) | 3,880,000 | 4,059,685 |
| PNC Financial Services Group, Inc. (The) | | |
| 2.55%, due 1/22/30 | 3,105,000 | 3,187,653 |
| Societe Generale SA | | |
| 5.375% (5 Year Treasury Constant Maturity Rate + 4.514%), due 11/18/30 (a)(b)(e) | 5,595,000 | 5,818,800 |
| | Principal
Amount | Value |
| |
| Banks (continued) |
| Standard Chartered plc | | |
| 4.75% (5 Year Treasury Constant Maturity Rate + 3.805%), due 1/14/31 (a)(b)(e) | $ 2,220,000 | $ 2,253,744 |
| SVB Financial Group | | |
| 4.10% (10 Year Treasury Constant Maturity Rate + 3.064%), due 2/15/31 (b)(e) | 1,720,000 | 1,732,900 |
| Truist Financial Corp. | | |
| Series P | | |
| 4.95% (5 Year Treasury Constant Maturity Rate + 4.605%), due 9/1/25 (b)(e) | 3,515,000 | 3,866,500 |
| UBS Group AG | | |
| 4.375% (5 Year Treasury Constant Maturity Rate + 3.313%), due 2/10/31 (a)(b)(e) | 4,295,000 | 4,278,937 |
| Wachovia Corp. | | |
| 5.50%, due 8/1/35 | 1,220,000 | 1,538,130 |
| Wells Fargo Bank NA | | |
| 5.85%, due 2/1/37 | 555,000 | 741,470 |
| | | 163,559,278 |
| Beverages 0.6% |
| Anheuser-Busch InBev Worldwide, Inc. | | |
| 4.75%, due 1/23/29 | 4,695,000 | 5,509,855 |
| Constellation Brands, Inc. | | |
| 4.50%, due 5/9/47 | 2,740,000 | 3,184,857 |
| | | 8,694,712 |
| Biotechnology 0.3% |
| Biogen, Inc. | | |
| 3.15%, due 5/1/50 | 4,315,000 | 3,936,178 |
| Building Materials 0.6% |
| Builders FirstSource, Inc. | | |
| 5.00%, due 3/1/30 (a) | 3,839,000 | 4,074,139 |
| Carrier Global Corp. | | |
| 2.242%, due 2/15/25 | 4,130,000 | 4,307,837 |
| Cemex SAB de CV | | |
| 7.375%, due 6/5/27 (a) | 1,080,000 | 1,224,720 |
| | | 9,606,696 |
| Chemicals 1.0% |
| Braskem Netherlands Finance BV | | |
| 4.50%, due 1/10/28 (a) | 2,830,000 | 2,943,200 |
| Huntsman International LLC | | |
| 4.50%, due 5/1/29 | 4,289,000 | 4,811,946 |
The notes to the financial statements are an integral part of, and should be read in conjunction with, the financial statements.
13
Portfolio of Investments April 30, 2021† (Unaudited) (continued)
| | Principal
Amount | Value |
| Corporate Bonds (continued) |
| Chemicals (continued) |
| Nutrition & Biosciences, Inc. | | |
| 2.30%, due 11/1/30 (a) | $ 5,155,000 | $ 5,020,928 |
| Orbia Advance Corp. SAB de CV | | |
| 4.00%, due 10/4/27 (a) | 2,400,000 | 2,620,320 |
| | | 15,396,394 |
| Commercial Services 1.4% |
| Allied Universal Holdco LLC | | |
| 6.625%, due 7/15/26 (a) | 2,570,000 | 2,717,775 |
| Ashtead Capital, Inc. | | |
| 4.00%, due 5/1/28 (a) | 1,435,000 | 1,504,956 |
| California Institute of Technology | | |
| 3.65%, due 9/1/19 | 2,914,000 | 3,104,866 |
| Herc Holdings, Inc. | | |
| 5.50%, due 7/15/27 (a) | 2,800,000 | 2,961,000 |
| IHS Markit Ltd. | | |
| 4.25%, due 5/1/29 | 5,055,000 | 5,721,704 |
| Sodexo, Inc. | | |
| 2.718%, due 4/16/31 (a) | 4,590,000 | 4,559,194 |
| | | 20,569,495 |
| Computers 1.1% |
| Dell International LLC (a) | | |
| 4.90%, due 10/1/26 | 6,467,000 | 7,429,027 |
| 5.30%, due 10/1/29 | 1,275,000 | 1,509,740 |
| 8.10%, due 7/15/36 | 1,750,000 | 2,589,102 |
| NCR Corp. (a) | | |
| 5.00%, due 10/1/28 | 3,298,000 | 3,396,940 |
| 6.125%, due 9/1/29 | 1,535,000 | 1,669,312 |
| | | 16,594,121 |
| Distribution & Wholesale 0.6% |
| Avient Corp. | | |
| 5.75%, due 5/15/25 (a) | 3,664,000 | 3,865,300 |
| Performance Food Group, Inc. | | |
| 5.50%, due 10/15/27 (a) | 5,420,000 | 5,711,813 |
| | | 9,577,113 |
| Diversified Financial Services 3.0% |
| AerCap Ireland Capital DAC | | |
| 3.50%, due 5/26/22 | 743,000 | 761,939 |
| Air Lease Corp. | | |
| 4.25%, due 9/15/24 | 6,445,000 | 7,050,764 |
| Ally Financial, Inc. | | |
| 3.875%, due 5/21/24 | 2,695,000 | 2,922,735 |
| 8.00%, due 11/1/31 | 6,085,000 | 8,558,281 |
| Aviation Capital Group LLC | | |
| 1.95%, due 1/30/26 (a) | 2,210,000 | 2,166,515 |
| | Principal
Amount | Value |
| |
| Diversified Financial Services (continued) |
| Avolon Holdings Funding Ltd. (a) | | |
| 2.125%, due 2/21/26 | $ 3,445,000 | $ 3,368,070 |
| 3.25%, due 2/15/27 | 2,895,000 | 2,944,740 |
| Banco BTG Pactual SA | | |
| 2.75%, due 1/11/26 (a) | 4,815,000 | 4,574,298 |
| Charles Schwab Corp. (The) | | |
| Series G | | |
| 5.375% (5 Year Treasury Constant Maturity Rate + 4.971%), due 6/1/25 (b)(e) | 3,600,000 | 4,002,840 |
| Home Point Capital, Inc. | | |
| 5.00%, due 2/1/26 (a) | 1,645,000 | 1,619,832 |
| Intercontinental Exchange, Inc. | | |
| 3.00%, due 9/15/60 | 3,320,000 | 2,977,366 |
| PennyMac Financial Services, Inc. | | |
| 5.375%, due 10/15/25 (a) | 3,253,000 | 3,427,849 |
| | | 44,375,229 |
| Electric 1.7% |
| Arizona Public Service Co. | | |
| 3.35%, due 5/15/50 | 2,700,000 | 2,752,190 |
| Connecticut Light and Power Co. (The) | | |
| 4.00%, due 4/1/48 | 1,805,000 | 2,099,624 |
| Duke Energy Progress LLC | | |
| 3.45%, due 3/15/29 | 3,695,000 | 4,054,021 |
| Duquesne Light Holdings, Inc. | | |
| 3.616%, due 8/1/27 (a) | 1,645,000 | 1,801,085 |
| Evergy Kansas Central, Inc. | | |
| 3.45%, due 4/15/50 | 4,230,000 | 4,427,876 |
| Pacific Gas and Electric Co. | | |
| 2.10%, due 8/1/27 | 4,405,000 | 4,294,242 |
| 3.50%, due 8/1/50 | 3,715,000 | 3,217,024 |
| Southern California Edison Co. | | |
| 4.00%, due 4/1/47 | 2,055,000 | 2,141,132 |
| | | 24,787,194 |
| Entertainment 0.1% |
| Cedar Fair LP | | |
| 5.50%, due 5/1/25 (a) | 1,991,000 | 2,085,811 |
| Environmental Control 0.2% |
| Stericycle, Inc. | | |
| 3.875%, due 1/15/29 (a) | 490,000 | 488,775 |
| Waste Connections, Inc. | | |
| 3.50%, due 5/1/29 | 1,880,000 | 2,046,029 |
| | | 2,534,804 |
The notes to the financial statements are an integral part of, and should be read in conjunction with, the financial statements.
| 14 | MainStay MacKay Total Return Bond Fund |
| | Principal
Amount | Value |
| Corporate Bonds (continued) |
| Food 1.2% |
| Kraft Heinz Foods Co. | | |
| 3.875%, due 5/15/27 | $ 1,362,000 | $ 1,483,255 |
| 5.00%, due 7/15/35 | 1,689,000 | 1,972,603 |
| MARB BondCo plc | | |
| 3.95%, due 1/29/31 (a) | 2,530,000 | 2,403,930 |
| Smithfield Foods, Inc. (a) | | |
| 4.25%, due 2/1/27 | 1,980,000 | 2,173,280 |
| 5.20%, due 4/1/29 | 960,000 | 1,112,579 |
| Sysco Corp. | | |
| 3.30%, due 2/15/50 | 1,745,000 | 1,687,952 |
| Tyson Foods, Inc. | | |
| 5.15%, due 8/15/44 (f) | 3,000,000 | 3,776,804 |
| US Foods, Inc. | | |
| 6.25%, due 4/15/25 (a) | 2,610,000 | 2,772,328 |
| | | 17,382,731 |
| Food Service 0.2% |
| Aramark Services, Inc. | | |
| 6.375%, due 5/1/25 (a) | 2,383,000 | 2,534,916 |
| Gas 0.4% |
| Atmos Energy Corp. | | |
| 4.30%, due 10/1/48 | 1,085,000 | 1,272,273 |
| National Fuel Gas Co. | | |
| 2.95%, due 3/1/31 | 1,510,000 | 1,474,146 |
| NiSource, Inc. | | |
| 3.49%, due 5/15/27 | 2,935,000 | 3,203,157 |
| | | 5,949,576 |
| Healthcare-Services 0.5% |
| Health Care Service Corp. A Mutual Legal Reserve Co. | | |
| 3.20%, due 6/1/50 (a) | 4,630,000 | 4,535,683 |
| NYU Langone Hospitals | | |
| Series 2020 | | |
| 3.38%, due 7/1/55 | 2,400,000 | 2,408,936 |
| | | 6,944,619 |
| Holding Companies-Diversified 0.3% |
| CK Hutchison International 17 II Ltd. | | |
| 3.25%, due 9/29/27 (a) | 3,675,000 | 3,993,722 |
| Home Builders 0.5% |
| Lennar Corp. | | |
| 4.75%, due 11/29/27 | 1,546,000 | 1,788,846 |
| Toll Brothers Finance Corp. | | |
| 3.80%, due 11/1/29 | 2,233,000 | 2,377,028 |
| | Principal
Amount | Value |
| |
| Home Builders (continued) |
Toll Brothers Finance Corp.
(continued) | | |
| 4.35%, due 2/15/28 | $ 1,364,000 | $ 1,500,400 |
| TRI Pointe Group, Inc. | | |
| 5.875%, due 6/15/24 | 1,320,000 | 1,467,510 |
| | | 7,133,784 |
| Housewares 0.1% |
| Newell Brands, Inc. | | |
| 4.875%, due 6/1/25 | 840,000 | 928,200 |
| Insurance 2.2% |
| Athene Global Funding | | |
| 2.50%, due 3/24/28 (a) | 4,600,000 | 4,636,564 |
| Equitable Holdings, Inc. | | |
| 4.35%, due 4/20/28 | 5,025,000 | 5,665,869 |
| Liberty Mutual Group, Inc. | | |
| 3.951%, due 10/15/50 (a) | 3,675,000 | 3,855,562 |
| Markel Corp. | | |
| 3.625%, due 3/30/23 | 2,515,000 | 2,653,304 |
| Nippon Life Insurance Co. | | |
| 3.40% (5 Year Treasury Constant Maturity Rate + 2.612%), due 1/23/50 (a)(b) | 3,065,000 | 3,114,806 |
| Peachtree Corners Funding Trust | | |
| 3.976%, due 2/15/25 (a) | 1,780,000 | 1,955,262 |
| Reliance Standard Life Global Funding II | | |
| 2.50%, due 10/30/24 (a) | 3,950,000 | 4,137,077 |
| Willis North America, Inc. | | |
| 2.95%, due 9/15/29 | 3,915,000 | 4,097,652 |
| 3.875%, due 9/15/49 | 2,620,000 | 2,823,470 |
| | | 32,939,566 |
| Internet 0.8% |
| Cablevision Lightpath LLC | | |
| 3.875%, due 9/15/27 (a) | 3,100,000 | 3,057,375 |
| Expedia Group, Inc. | | |
| 3.25%, due 2/15/30 | 4,965,000 | 5,040,145 |
| 3.60%, due 12/15/23 (a) | 1,780,000 | 1,896,890 |
| 6.25%, due 5/1/25 (a) | 321,000 | 373,414 |
| Match Group Holdings II LLC | | |
| 4.125%, due 8/1/30 (a) | 263,000 | 263,986 |
| Weibo Corp. | | |
| 3.50%, due 7/5/24 | 1,825,000 | 1,914,224 |
| | | 12,546,034 |
The notes to the financial statements are an integral part of, and should be read in conjunction with, the financial statements.
15
Portfolio of Investments April 30, 2021† (Unaudited) (continued)
| | Principal
Amount | Value |
| Corporate Bonds (continued) |
| Iron & Steel 0.7% |
| ArcelorMittal SA | | |
| 4.55%, due 3/11/26 | $ 3,215,000 | $ 3,569,539 |
| Steel Dynamics, Inc. | | |
| 3.25%, due 1/15/31 | 1,940,000 | 2,061,820 |
| Vale Overseas Ltd. | | |
| 6.25%, due 8/10/26 | 2,290,000 | 2,736,550 |
| 6.875%, due 11/21/36 | 1,094,000 | 1,486,483 |
| | | 9,854,392 |
| Lodging 0.9% |
| Boyd Gaming Corp. | | |
| 8.625%, due 6/1/25 (a) | 872,000 | 965,478 |
| Hilton Domestic Operating Co., Inc. | | |
| 4.875%, due 1/15/30 | 2,640,000 | 2,814,953 |
| 5.75%, due 5/1/28 (a) | 1,135,000 | 1,220,125 |
| Las Vegas Sands Corp. | | |
| 3.20%, due 8/8/24 | 2,205,000 | 2,312,658 |
| MGM Resorts International | | |
| 6.00%, due 3/15/23 | 5,000,000 | 5,350,000 |
| | | 12,663,214 |
| Media 1.5% |
| Charter Communications Operating LLC | | |
| 4.464%, due 7/23/22 | 4,000,000 | 4,161,482 |
| Comcast Corp. | | |
| 1.50%, due 2/15/31 | 1,730,000 | 1,611,593 |
| 3.70%, due 4/15/24 | 4,900 | 5,343 |
| 3.75%, due 4/1/40 | 2,565,000 | 2,829,799 |
| 3.95%, due 10/15/25 | 6,600 | 7,411 |
| 4.70%, due 10/15/48 | 3,170,000 | 3,969,524 |
| Grupo Televisa SAB | | |
| 5.25%, due 5/24/49 (f) | 1,890,000 | 2,276,996 |
| Sirius XM Radio, Inc. | | |
| 4.125%, due 7/1/30 (a) | 3,235,000 | 3,235,000 |
| Walt Disney Co. (The) | | |
| 6.65%, due 11/15/37 | 2,645,000 | 3,916,750 |
| | | 22,013,898 |
| Mining 0.3% |
| Glencore Funding LLC | | |
| 1.625%, due 9/1/25 (a) | 4,610,000 | 4,639,588 |
| Miscellaneous—Manufacturing 1.0% |
| General Electric Co. | | |
| 3.625%, due 5/1/30 | 2,340,000 | 2,542,310 |
| 4.25%, due 5/1/40 | 4,050,000 | 4,525,974 |
| | Principal
Amount | Value |
| |
| Miscellaneous—Manufacturing (continued) |
| General Electric Co. (continued) | | |
| 4.35%, due 5/1/50 | $ 3,395,000 | $ 3,780,049 |
| Textron Financial Corp. | | |
| 1.929% (3 Month LIBOR + 1.735%), due 2/15/42 (a)(b) | 5,685,000 | 4,604,850 |
| | | 15,453,183 |
| Oil & Gas 2.0% |
| BP Capital Markets America, Inc. | | |
| 3.00%, due 2/24/50 | 3,260,000 | 3,010,768 |
| BP Capital Markets plc | | |
| 4.875% (5 Year Treasury Constant Maturity Rate + 4.398%), due 3/22/30 (b)(e) | 4,215,000 | 4,524,803 |
| Gazprom PJSC Via Gaz Capital SA (a) | | |
| 4.95%, due 3/23/27 | 358,000 | 394,502 |
| 4.95%, due 2/6/28 | 2,531,000 | 2,796,755 |
| Marathon Petroleum Corp. | | |
| 4.70%, due 5/1/25 | 2,445,000 | 2,759,234 |
| 6.50%, due 3/1/41 | 2,665,000 | 3,537,049 |
| Petrobras Global Finance BV | | |
| 6.75%, due 6/3/50 | 1,985,000 | 2,172,007 |
| Total Capital International SA | | |
| 3.127%, due 5/29/50 | 4,275,000 | 4,100,444 |
| Valero Energy Corp. | | |
| 4.00%, due 4/1/29 | 2,270,000 | 2,477,457 |
| 6.625%, due 6/15/37 | 2,690,000 | 3,514,637 |
| | | 29,287,656 |
| Packaging & Containers 0.4% |
| Berry Global, Inc. | | |
| 4.875%, due 7/15/26 (a) | 282,000 | 298,652 |
| Graham Packaging Co., Inc. | | |
| 7.125%, due 8/15/28 (a) | 1,500,000 | 1,608,750 |
| Owens-Brockway Glass Container, Inc. | | |
| 6.625%, due 5/13/27 (a) | 3,800,000 | 4,104,000 |
| | | 6,011,402 |
| Pharmaceuticals 1.4% |
| AbbVie, Inc. | | |
| 4.05%, due 11/21/39 | 4,385,000 | 4,896,348 |
| 4.50%, due 5/14/35 | 2,570,000 | 3,013,647 |
| Becton Dickinson and Co. | | |
| 4.669%, due 6/6/47 | 3,575,000 | 4,269,319 |
| CVS Health Corp. | | |
| 4.78%, due 3/25/38 | 750,000 | 896,621 |
| 5.05%, due 3/25/48 | 2,275,000 | 2,797,551 |
The notes to the financial statements are an integral part of, and should be read in conjunction with, the financial statements.
| 16 | MainStay MacKay Total Return Bond Fund |
| | Principal
Amount | Value |
| Corporate Bonds (continued) |
| Pharmaceuticals (continued) |
| Teva Pharmaceutical Finance Netherlands III BV | | |
| 3.15%, due 10/1/26 | $ 4,688,000 | $ 4,402,032 |
| | | 20,275,518 |
| Pipelines 1.2% |
| Enterprise Products Operating LLC | | |
| 3.95%, due 1/31/60 | 2,200,000 | 2,206,348 |
| 4.20%, due 1/31/50 | 630,000 | 675,698 |
| Hess Midstream Operations LP | | |
| 5.625%, due 2/15/26 (a) | 726,000 | 753,225 |
| MPLX LP | | |
| 4.875%, due 6/1/25 | 5,305,000 | 5,981,494 |
| Sabine Pass Liquefaction LLC | | |
| 5.625%, due 3/1/25 | 800,000 | 917,972 |
| 5.875%, due 6/30/26 | 3,426,000 | 4,056,265 |
| Western Midstream Operating LP | | |
| 6.50%, due 2/1/50 (g) | 2,485,000 | 2,811,752 |
| | | 17,402,754 |
| Real Estate Investment Trusts 1.2% |
| Alexandria Real Estate Equities, Inc. | | |
| 3.375%, due 8/15/31 | 2,090,000 | 2,243,588 |
| American Tower Corp. | | |
| 3.375%, due 5/15/24 | 4,000,000 | 4,291,855 |
| Boston Properties LP | | |
| 3.20%, due 1/15/25 | 4,050,000 | 4,342,939 |
| CyrusOne LP | | |
| 3.45%, due 11/15/29 | 2,430,000 | 2,538,208 |
| Equinix, Inc. | | |
| 1.80%, due 7/15/27 | 1,335,000 | 1,323,572 |
| Iron Mountain, Inc. (a) | | |
| 4.875%, due 9/15/29 | 480,000 | 488,890 |
| 5.25%, due 7/15/30 | 2,720,000 | 2,825,400 |
| | | 18,054,452 |
| Retail 2.6% |
| 7-Eleven, Inc. (a) | | |
| 2.50%, due 2/10/41 | 655,000 | 596,124 |
| 2.80%, due 2/10/51 | 2,000,000 | 1,810,470 |
| AutoNation, Inc. | | |
| 4.75%, due 6/1/30 | 6,765,000 | 7,888,323 |
| Darden Restaurants, Inc. | | |
| 3.85%, due 5/1/27 | 5,980,000 | 6,592,448 |
| Home Depot, Inc. (The) | | |
| 2.375%, due 3/15/51 | 1,110,000 | 968,798 |
| Macy's Retail Holdings LLC | | |
| 5.875%, due 4/1/29 (a)(f) | 2,640,000 | 2,709,168 |
| | Principal
Amount | Value |
| |
| Retail (continued) |
| Macy's, Inc. | | |
| 8.375%, due 6/15/25 (a) | $ 4,660,000 | $ 5,141,052 |
| Nordstrom, Inc. | | |
| 4.25%, due 8/1/31 (a) | 2,895,000 | 2,933,450 |
| QVC, Inc. | | |
| 4.375%, due 9/1/28 | 3,580,000 | 3,664,237 |
| Starbucks Corp. | | |
| 3.35%, due 3/12/50 | 3,365,000 | 3,314,413 |
| 4.45%, due 8/15/49 | 2,300,000 | 2,713,311 |
| | | 38,331,794 |
| Semiconductors 0.5% |
| Broadcom, Inc. | | |
| 3.15%, due 11/15/25 | 622,000 | 666,198 |
| 3.419%, due 4/15/33 (a) | 2,048,000 | 2,075,775 |
| 3.50%, due 2/15/41 (a) | 1,425,000 | 1,375,358 |
| NVIDIA Corp. | | |
| 3.50%, due 4/1/50 | 1,365,000 | 1,470,313 |
| NXP BV | | |
| 3.40%, due 5/1/30 (a) | 1,775,000 | 1,898,149 |
| | | 7,485,793 |
| Software 0.1% |
| Oracle Corp. | | |
| 3.65%, due 3/25/41 | 990,000 | 1,011,615 |
| Telecommunications 4.2% |
| Altice France SA (a) | | |
| 5.125%, due 7/15/29 | 3,440,000 | 3,444,300 |
| 7.375%, due 5/1/26 | 5,216,000 | 5,407,949 |
| AT&T, Inc. | | |
| 2.55%, due 12/1/33 (a) | 6,467,000 | 6,164,021 |
| Series B | | |
| 2.875% (5 Month Euribor ICE Swap Rate + 3.14%), due 3/2/25 (b)(e) | EUR 3,100,000 | 3,736,486 |
| 3.85%, due 6/1/60 | $ 2,097,000 | 2,012,323 |
| 4.35%, due 3/1/29 | 1,040,000 | 1,180,441 |
| CommScope Technologies LLC | | |
| 5.00%, due 3/15/27 (a) | 4,200,000 | 4,160,887 |
| CommScope, Inc. | | |
| 7.125%, due 7/1/28 (a) | 2,790,000 | 3,016,688 |
| Level 3 Financing, Inc. | | |
| 3.40%, due 3/1/27 (a) | 4,555,000 | 4,833,994 |
| Sprint Spectrum Co. LLC | | |
| 4.738%, due 3/20/25 (a) | 6,245,000 | 6,686,053 |
| T-Mobile US, Inc. | | |
| 2.625%, due 2/15/29 | 2,805,000 | 2,732,421 |
The notes to the financial statements are an integral part of, and should be read in conjunction with, the financial statements.
17
Portfolio of Investments April 30, 2021† (Unaudited) (continued)
| | Principal
Amount | Value |
| Corporate Bonds (continued) |
| Telecommunications (continued) |
| T-Mobile US, Inc. (continued) | | |
| 4.50%, due 4/15/50 (a) | $ 2,995,000 | $ 3,377,791 |
| VEON Holdings BV | | |
| 4.95%, due 6/16/24 (a) | 3,950,000 | 4,226,460 |
| Verizon Communications, Inc. | | |
| 3.40%, due 3/22/41 | 1,340,000 | 1,372,727 |
| 3.55%, due 3/22/51 | 1,515,000 | 1,539,044 |
| 4.00%, due 3/22/50 | 2,870,000 | 3,133,157 |
| Vodafone Group plc | | |
| 4.25%, due 9/17/50 | 3,835,000 | 4,264,366 |
| | | 61,289,108 |
Total Corporate Bonds
(Cost $685,779,769) | | 721,331,244 |
| Foreign Government Bonds 1.8% |
| Brazil 0.3% |
| Federative Republic of Brazil | | |
| 4.625%, due 1/13/28 | 4,789,000 | 5,136,538 |
| Chile 0.2% |
| Corp. Nacional del Cobre de Chile | | |
| 3.00%, due 9/30/29 (a) | 2,435,000 | 2,503,107 |
| Colombia 0.1% |
| Colombia Government Bond | | |
| 3.25%, due 4/22/32 | 2,300,000 | 2,256,116 |
| Mexico 1.2% |
| Comision Federal de Electricidad | | |
| 4.75%, due 2/23/27 (a) | 2,490,000 | 2,735,888 |
| Mexico Government Bond | | |
| 2.659%, due 5/24/31 | 6,373,000 | 6,128,850 |
| 3.75%, due 4/19/71 | 3,540,000 | 3,091,128 |
| Petroleos Mexicanos | | |
| 6.75%, due 9/21/47 | 5,835,000 | 5,158,140 |
| | | 17,114,006 |
Total Foreign Government Bonds
(Cost $28,252,748) | | 27,009,767 |
| | Principal
Amount | Value |
| Loan Assignments 1.3% |
| Buildings & Real Estate 0.1% |
| Realogy Group LLC | | |
| Extended 2025 Term Loan | | |
| 3.00% (1 Month LIBOR + 2.25%), due 2/8/25 (b) | $ 1,064,496 | $ 1,054,611 |
| Containers, Packaging & Glass 0.3% |
| BWAY Holding Co. | | |
| Initial Term Loan | | |
| 3.443% (3 Month LIBOR + 3.25%), due 4/3/24 (b) | 4,878,964 | 4,707,439 |
| Diversified/Conglomerate Service 0.2% |
| TruGreen LP | | |
| First Lien Second Refinancing Term Loan | | |
| 4.75% (1 Month LIBOR + 4.00%), due 11/2/27 (b) | 2,354,100 | 2,350,176 |
| Finance 0.3% |
| Alliant Holdings Intermediate LLC 2018 Initial Term Loan | | |
| 3.363% (1 Month LIBOR + 3.25%), due 5/9/25 (b) | 4,864,962 | 4,806,913 |
| Personal, Food & Miscellaneous Services 0.4% |
| IRB Holding Corp. | | |
| Fourth Amendment Incremental Term Loan | | |
| 4.25% (3 Month LIBOR + 3.25%), due 12/15/27 (b) | 5,576,025 | 5,556,275 |
Total Loan Assignments
(Cost $18,525,663) | | 18,475,414 |
| Mortgage-Backed Securities 16.7% |
| Agency (Collateralized Mortgage Obligations) 4.6% |
| FHLMC | |
| REMIC, Series 5073, Class DG | | |
| 1.50%, due 8/25/38 | 3,480,000 | 3,533,487 |
| REMIC, Series 4993, Class D | | |
| 2.00%, due 9/25/47 | 3,825,000 | 3,967,137 |
| REMIC, Series 4913, Class UA | | |
| 3.00%, due 3/15/49 | 2,447,073 | 2,572,956 |
| REMIC, Series 4908, Class BD | | |
| 3.00%, due 4/25/49 | 1,972,547 | 2,031,079 |
The notes to the financial statements are an integral part of, and should be read in conjunction with, the financial statements.
| 18 | MainStay MacKay Total Return Bond Fund |
| | Principal
Amount | Value |
| Mortgage-Backed Securities (continued) |
| Agency (Collateralized Mortgage Obligations) (continued) |
| FHLMC (continued) | |
| REMIC, Series 5049, Class UI | | |
| 3.00%, due 12/25/50 | $ 9,788,163 | $ 1,760,578 |
| REMIC, Series 4869, Class BA | | |
| 3.50%, due 11/15/47 | 2,398,352 | 2,493,476 |
| REMIC, Series 4888, Class BA | | |
| 3.50%, due 9/15/48 | 1,241,045 | 1,296,110 |
| REMIC, Series 4877, Class AT | | |
| 3.50%, due 11/15/48 | 2,077,112 | 2,194,983 |
| REMIC, Series 4958, Class DL | | |
| 4.00%, due 1/25/50 | 5,244,400 | 5,623,990 |
| FNMA | |
| REMIC, Series 2020-97, Class CI | | |
| 2.00%, due 1/25/51 | 13,334,455 | 1,474,308 |
| REMIC, Series 2021-33, Class AI | | |
| 2.50%, due 5/25/47 | 10,992,740 | 1,514,778 |
| REMIC, Series 2013-77, Class CY | | |
| 3.00%, due 7/25/43 | 2,941,000 | 3,118,143 |
| REMIC, Series 2019-13, Class PE | | |
| 3.00%, due 3/25/49 | 2,306,530 | 2,449,333 |
| REMIC, Series 2021-6, Class ML | | |
| 3.50%, due 6/25/50 | 4,242,603 | 4,623,560 |
| REMIC, Series 2021-6, Class MC | | |
| 3.50%, due 6/25/50 | 7,194,999 | 7,844,620 |
| REMIC, Series 2021-12, Class GC | | |
| 3.50%, due 7/25/50 | 4,206,000 | 4,553,130 |
| GNMA | |
| REMIC, Series 2020-116, Class MI | | |
| 2.00%, due 8/20/50 | 8,886,189 | 908,445 |
| REMIC, Series 2021-15, Class AI | | |
| 2.00%, due 1/20/51 | 9,226,562 | 1,021,819 |
| UMBS, Single Family, 30 Year (h) | |
| 2.50%, due 5/25/51 TBA | 7,335,000 | 7,609,489 |
| 3.50%, due 5/25/51 TBA | 6,805,000 | 7,244,401 |
| | | 67,835,822 |
| Commercial Mortgage Loans (Collateralized Mortgage Obligations) 6.3% |
| BANK | |
| Series 2019-BN21, Class A5 | | |
| 2.851%, due 10/17/52 | 4,700,000 | 4,952,019 |
| Bayview Commercial Asset Trust | |
| Series 2006-4A, Class A1 | | |
| 0.336% (1 Month LIBOR + 0.23%), due 12/25/36 (a)(b) | 32,730 | 31,434 |
| Benchmark Mortgage Trust | |
| Series 2019-B12, Class A5 | | |
| 3.116%, due 8/15/52 | 4,417,000 | 4,749,339 |
| | Principal
Amount | Value |
| |
| Commercial Mortgage Loans (Collateralized Mortgage Obligations) (continued) |
| BX Commercial Mortgage Trust (a) | |
| Series 2020-VIV2, Class C | | |
| 3.66%, due 3/9/44 | $ 1,800,000 | $ 1,849,550 |
| Series 2020-VIV3, Class B | | |
| 3.662%, due 3/9/44 | 2,641,153 | 2,822,539 |
| BX Trust (a) | |
| Series 2018-GW, Class A | | |
| 0.915% (1 Month LIBOR + 0.80%), due 5/15/35 (b) | 2,825,000 | 2,824,960 |
| Series 2019-OC11, Class A | | |
| 3.202%, due 12/9/41 | 2,235,000 | 2,365,710 |
| Series 2019-OC11, Class B | | |
| 3.605%, due 12/9/41 | 710,000 | 762,317 |
| Series 2019-OC11, Class C | | |
| 3.856%, due 12/9/41 | 2,209,000 | 2,349,966 |
| Series 2019-OC11, Class E | | |
| 4.075%, due 12/9/41 (i) | 2,484,000 | 2,518,496 |
| Commercial Mortgage Trust | |
| Series 2014-CR20, Class A3 | | |
| 3.326%, due 11/10/47 | 3,251,854 | 3,452,078 |
| Series 2013-CR8, Class A4 | | |
| 3.334%, due 6/10/46 | 416,523 | 435,924 |
| Series 2013-CR9, Class B | | |
| 4.387%, due 7/10/45 (a) | 2,380,000 | 2,369,924 |
| CSAIL Commercial Mortgage Trust | |
| Series 2015-C3, Class A4 | | |
| 3.718%, due 8/15/48 | 2,955,000 | 3,235,614 |
| FREMF Mortgage Trust (a)(i) | |
| REMIC, Series 2015-K720, Class B | | |
| 3.51%, due 7/25/22 | 1,545,000 | 1,591,707 |
| REMIC, Series 2014-K41, Class B | | |
| 3.964%, due 11/25/47 | 1,285,000 | 1,402,149 |
| GB Trust 2020 FLIX | |
| Series 2020-FLIX, Class A | | |
| 1.235% (1 Month LIBOR + 1.12%), due 8/15/37 (a)(b) | 4,260,000 | 4,279,685 |
| GS Mortgage Securities Trust | |
| Series 2019-GC42, Class A4 | | |
| 3.001%, due 9/1/52 | 1,295,000 | 1,381,787 |
| Series 2019-GC40, Class A4 | | |
| 3.16%, due 7/10/52 | 3,114,000 | 3,357,304 |
| Hawaii Hotel Trust | |
| Series 2019-MAUI, Class A | | |
| 1.265% (1 Month LIBOR + 1.15%), due 5/15/38 (a)(b) | 2,600,000 | 2,603,225 |
The notes to the financial statements are an integral part of, and should be read in conjunction with, the financial statements.
19
Portfolio of Investments April 30, 2021† (Unaudited) (continued)
| | Principal
Amount | Value |
| Mortgage-Backed Securities (continued) |
| Commercial Mortgage Loans (Collateralized Mortgage Obligations) (continued) |
| Hudson Yards Mortgage Trust | |
| Series 2019-30HY, Class A | | |
| 3.228%, due 7/10/39 (a) | $ 2,465,000 | $ 2,655,143 |
| J.P. Morgan Chase Commercial Mortgage Securities Corp. | |
| Series 2018-AON, Class B | | |
| 4.379%, due 7/5/31 (a) | 3,130,000 | 3,314,195 |
| J.P. Morgan Chase Commercial Mortgage Securities Trust | |
| Series 2021-410T, Class A | | |
| 2.287%, due 3/5/42 (a) | 3,950,000 | 4,026,116 |
| JPMorgan Chase Commercial Mortgage Securities Corp. | |
| Series 2018-AON, Class A | | |
| 4.128%, due 7/5/31 (a) | 4,545,000 | 4,842,240 |
| Manhattan West Mortgage Trust | |
| Series 2020-1MW, Class A | | |
| 2.13%, due 9/10/39 (a) | 4,660,000 | 4,729,243 |
| Morgan Stanley Bank of America Merrill Lynch Trust | |
| Series 2015-C23, Class A3 | | |
| 3.451%, due 7/15/50 | 1,867,654 | 2,005,548 |
| Morgan Stanley Capital I Trust | |
| Series 2015-UBS8, Class A4 | | |
| 3.809%, due 12/15/48 | 2,983,000 | 3,285,585 |
| One Bryant Park Trust | |
| Series 2019-OBP, Class A | | |
| 2.516%, due 9/15/54 (a) | 4,140,000 | 4,221,199 |
| UBS-Barclays Commercial Mortgage Trust | |
| Series 2013-C6, Class B | | |
| 3.875%, due 4/10/46 (a) | 2,355,000 | 2,376,664 |
| Wells Fargo Commercial Mortgage Trust | |
| Series 2015-NXS4, Class A4 | | |
| 3.718%, due 12/15/48 | 975,000 | 1,076,240 |
| Series 2018-1745, Class A | | |
| 3.874%, due 6/15/36 (a) | 3,250,000 | 3,586,122 |
| Series 2018-AUS, Class A | | |
| 4.194%, due 8/17/36 (a) | 4,125,000 | 4,593,634 |
| WFRBS Commercial Mortgage Trust | |
| Series 2012-C7, Class AS | | |
| 4.09%, due 6/15/45 | 3,175,000 | 3,220,979 |
| | | 93,268,635 |
| Whole Loan (Collateralized Mortgage Obligations) 5.8% |
| Chase Home Lending Mortgage Trust | |
| Series 2019-ATR2, Class A3 | | |
| 3.50%, due 7/25/49 (a) | 364,497 | 377,222 |
| CIM Trust | |
| Series 2021-J1, Class A1 | | |
| 2.50%, due 3/25/51 (a)(j) | 1,689,027 | 1,723,445 |
| | Principal
Amount | Value |
| |
| Whole Loan (Collateralized Mortgage Obligations) (continued) |
| Connecticut Avenue Securities Trust | |
| Series 2020-R02, Class 2M2 | | |
| 2.106% (1 Month LIBOR + 2.00%), due 1/25/40 (a)(b) | $ 550,000 | $ 553,560 |
| FHLMC STACR REMIC Trust | |
| Series 2020-DNA6, Class M2 | | |
| 2.01% (SOFR 30A + 2.00%), due 12/25/50 (a)(b) | 4,465,000 | 4,470,375 |
| FHLMC Structured Agency Credit Risk Debt Notes (b) | |
| Series 2015-DNA1, Class M3 | | |
| 3.406% (1 Month LIBOR + 3.30%), due 10/25/27 | 3,267,722 | 3,322,133 |
| Series 2017-HQA1, Class M2 | | |
| 3.656% (1 Month LIBOR + 3.55%), due 8/25/29 | 5,760,814 | 5,952,292 |
| Series 2016-DNA4, Class M3 | | |
| 3.906% (1 Month LIBOR + 3.80%), due 3/25/29 | 3,077,896 | 3,207,896 |
| Series 2016-HQA3, Class M3 | | |
| 3.956% (1 Month LIBOR + 3.85%), due 3/25/29 | 2,487,000 | 2,587,163 |
| Series 2016-DNA2, Class M3 | | |
| 4.756% (1 Month LIBOR + 4.65%), due 10/25/28 | 2,750,562 | 2,876,339 |
| Flagstar Mortgage Trust | |
| Series 2021-2, Class A2 | | |
| 2.50%, due 4/25/51 (a)(j) | 3,610,000 | 3,685,325 |
| FNMA (b) | |
| Series 2017-C02, Class 2M2 | | |
| 3.756% (1 Month LIBOR + 3.65%), due 9/25/29 | 3,518,844 | 3,642,546 |
| Series 2016-C04, Class 1M2 | | |
| 4.356% (1 Month LIBOR + 4.25%), due 1/25/29 | 3,545,638 | 3,716,811 |
| Series 2016-C06, Class 1M2 | | |
| 4.356% (1 Month LIBOR + 4.25%), due 4/25/29 | 2,566,095 | 2,675,786 |
| Series 2016-C07, Class 2M2 | | |
| 4.456% (1 Month LIBOR + 4.35%), due 5/25/29 | 4,921,095 | 5,129,121 |
| Series 2016-C05, Class 2M2 | | |
| 4.556% (1 Month LIBOR + 4.45%), due 1/25/29 | 1,896,680 | 1,977,655 |
| GNR 2013-H24 FL | |
| 1.00%, due 5/20/27 | 2,615,000 | 2,597,635 |
| GNR-2017-H07 | |
| 1.00%, due 4/20/27 (c) | 10,215,000 | 10,143,679 |
The notes to the financial statements are an integral part of, and should be read in conjunction with, the financial statements.
| 20 | MainStay MacKay Total Return Bond Fund |
| | Principal
Amount | Value |
| Mortgage-Backed Securities (continued) |
| Whole Loan (Collateralized Mortgage Obligations) (continued) |
| J.P. Morgan Mortgage Trust (a)(j) | |
| Series 2021-6, Class A4 | | |
| 2.50%, due 10/25/51 | $ 3,440,000 | $ 3,535,137 |
| Series 2019-3, Class A3 | | |
| 4.00%, due 9/25/49 | 272,472 | 278,557 |
| JPMorgan Mortgage Trust | |
| Series 2019-1, Class A3 | | |
| 4.00%, due 5/25/49 (a) | 412,278 | 418,893 |
| Mello Warehouse Securitization Trust (a)(b) | |
| Series 2021-1, Class A | | |
| 0.806% (1 Month LIBOR + 0.70%), due 2/25/55 | 3,595,000 | 3,595,000 |
| Series 2021-2, Class A | | |
| 0.86% (1 Month LIBOR + 0.75%), due 4/25/55 | 1,280,000 | 1,280,005 |
| New Residential Mortgage Loan Trust (a) | |
| Series 2019-5A, Class B7 | | |
| 4.469%, due 8/25/59 | 5,389,646 | 4,300,329 |
| Series 2019-4A, Class B6 | | |
| 4.786%, due 12/25/58 | 4,752,446 | 3,856,964 |
| Series 2019-2A, Class B6 | | |
| 4.976%, due 12/25/57 | 1,750,136 | 1,253,619 |
| NewRez LLC | |
| Series 2021-1, Class A | | |
| (zero coupon) (1 Month LIBOR + 0.75%), due 5/25/55 (a)(b) | 4,300,000 | 4,300,000 |
| OBX Trust | |
| Series 2021-J1, Class A1 | | |
| 2.50%, due 5/25/51 (a)(j) | 1,500,000 | 1,525,430 |
| Wells Fargo Mortgage Backed Securities Trust | |
| Series 2020-2, Class A1 | | |
| 3.00%, due 12/25/49 (a)(j) | 2,026,357 | 2,056,201 |
| | | 85,039,118 |
Total Mortgage-Backed Securities
(Cost $240,471,988) | | 246,143,575 |
| Municipal Bonds 0.3% |
| California 0.3% |
| Regents of the University of California Medical Center, Pooled, Revenue Bonds | | |
| Series N | | |
| 3.006%, due 5/15/50 | 4,410,000 | 4,322,522 |
| | Principal
Amount | Value |
| |
| New York 0.0% ‡ |
| New York State Thruway Authority, Revenue Bonds | | |
| Series M | | |
| 2.90%, due 1/1/35 | $ 735,000 | $ 773,537 |
Total Municipal Bonds
(Cost $5,145,000) | | 5,096,059 |
| U.S. Government & Federal Agencies 20.0% |
| Federal Home Loan Mortgage Corporation (Mortgage Pass-Through Securities) 1.5% |
| FHLMC Gold Pools, 15 Year | | |
| 2.50%, due 5/1/30 | 248,900 | 261,084 |
| FHLMC Gold Pools, 30 Year | | |
| 3.50%, due 1/1/44 | 1,402,216 | 1,526,570 |
| 3.50%, due 11/1/45 | 1,233,165 | 1,346,353 |
| 3.50%, due 3/1/46 | 2,291,938 | 2,509,232 |
| 4.00%, due 10/1/48 | 1,072,266 | 1,175,886 |
| 6.50%, due 4/1/37 | 48,248 | 57,293 |
| FHLMC Gold Pools, Other | | |
| 4.00%, due 6/1/42 | 1,740,376 | 1,914,964 |
| UMBS, 30 Year | | |
| 2.00%, due 7/1/50 | 1,123,852 | 1,135,672 |
| 2.00%, due 8/1/50 | 7,353,731 | 7,483,178 |
| 2.00%, due 9/1/50 | 2,078,541 | 2,103,890 |
| 3.00%, due 11/1/48 | 2,901,469 | 3,064,810 |
| | | 22,578,932 |
| Federal National Mortgage Association (Mortgage Pass-Through Securities) 2.5% |
| FNMA, Other | | |
| 3.00%, due 6/1/57 | 4,388,998 | 4,767,802 |
| 3.50%, due 2/1/42 | 2,471,421 | 2,690,962 |
| 4.00%, due 3/1/42 | 826,083 | 904,336 |
| 4.00%, due 1/1/43 | 1,622,190 | 1,786,985 |
| 6.00%, due 4/1/37 | 6,962 | 7,807 |
| UMBS, 30 Year | | |
| 2.00%, due 10/1/50 | 707,026 | 717,749 |
| 2.50%, due 8/1/50 | 570,773 | 594,122 |
| 2.50%, due 1/1/51 | 1,387,621 | 1,443,653 |
| 2.50%, due 4/1/51 | 729,856 | 760,432 |
| 3.00%, due 12/1/47 | 289,056 | 305,261 |
| 3.00%, due 3/1/50 | 2,887,853 | 3,062,770 |
| 3.50%, due 5/1/43 | 2,418,402 | 2,649,379 |
| 3.50%, due 12/1/44 | 1,012,099 | 1,107,652 |
| 3.50%, due 3/1/46 | 4,634,880 | 5,044,158 |
| 4.00%, due 1/1/46 | 3,869,697 | 4,262,660 |
| 4.00%, due 8/1/48 | 3,526,946 | 3,794,994 |
The notes to the financial statements are an integral part of, and should be read in conjunction with, the financial statements.
21
Portfolio of Investments April 30, 2021† (Unaudited) (continued)
| | Principal
Amount | Value |
| U.S. Government & Federal Agencies (continued) |
| Federal National Mortgage Association (Mortgage Pass-Through Securities) (continued) |
| UMBS, 30 Year (continued) | | |
| 5.50%, due 7/1/41 | $ 1,816,613 | $ 2,110,527 |
| 6.00%, due 7/1/39 | 377,304 | 448,315 |
| 6.50%, due 10/1/39 | 371,904 | 429,921 |
| | | 36,889,485 |
| United States Treasury Bonds 4.6% |
| U.S. Treasury Bond | | |
| 1.875%, due 2/15/51 | 48,327,000 | 43,962,468 |
| U.S. Treasury Bonds | | |
| 2.50%, due 2/15/45 | 4,940,000 | 5,155,932 |
| 4.375%, due 11/15/39 | 8,855,000 | 12,016,858 |
| 4.375%, due 5/15/40 | 745,000 | 1,015,295 |
| 4.50%, due 5/15/38 | 4,255,000 | 5,790,457 |
| | | 67,941,010 |
| United States Treasury Inflation - Indexed Notes 2.7% |
| U.S. Treasury Inflation Linked Notes (k) | | |
| 0.125%, due 1/15/30 | 6,755,000 | 7,565,946 |
| 0.125%, due 7/15/30 | 8,340,000 | 9,402,944 |
| 0.75%, due 7/15/28 | 6,240,000 | 7,538,593 |
| 0.875%, due 1/15/29 | 12,965,000 | 15,675,162 |
| | | 40,182,645 |
| United States Treasury Notes 8.7% |
| U.S. Treasury Notes | | |
| 0.125%, due 4/30/23 | 38,030,000 | 38,003,260 |
| 0.375%, due 4/15/24 | 40,330,000 | 40,380,413 |
| 0.75%, due 4/30/26 | 15,875,000 | 15,800,586 |
| 1.25%, due 4/30/28 | 33,345,000 | 33,214,746 |
| | | 127,399,005 |
Total U.S. Government & Federal Agencies
(Cost $290,829,526) | | 294,991,077 |
Total Long-Term Bonds
(Cost $1,370,425,640) | | 1,417,511,638 |
| |
| | Shares | |
| Common Stocks 0.0% ‡ |
| Commercial Services & Supplies 0.0% ‡ |
| Quad/Graphics, Inc. | 1 | 3 |
Total Common Stocks
(Cost $0) | | 3 |
| | Shares | | Value |
| Short-Term Investments 4.4% |
| Affiliated Investment Company 3.9% |
| MainStay U.S. Government Liquidity Fund, 0.01% (l) | 57,844,204 | | $ 57,844,204 |
| Unaffiliated Investment Company 0.5% |
| BlackRock Liquidity FedFund, 0.05% (l)(m) | 6,639,875 | | 6,639,875 |
Total Short-Term Investments
(Cost $64,484,079) | | | 64,484,079 |
Total Investments
(Cost $1,434,909,719) | 100.6% | | 1,481,995,720 |
| Other Assets, Less Liabilities | (0.6) | | (8,781,637) |
| Net Assets | 100.0% | | $ 1,473,214,083 |
| † | Percentages indicated are based on Fund net assets. |
| ‡ | Less than one-tenth of a percent. |
| (a) | May be sold to institutional investors only under Rule 144A or securities offered pursuant to Section 4(a)(2) of the Securities Act of 1933, as amended. |
| (b) | Floating rate—Rate shown was the rate in effect as of April 30, 2021. |
| (c) | Delayed delivery security. |
| (d) | Fixed to floating rate—Rate shown was the rate in effect as of April 30, 2021. |
| (e) | Security is perpetual and, thus, does not have a predetermined maturity date. The date shown, if applicable, reflects the next call date. |
| (f) | All or a portion of this security was held on loan. As of April 30, 2021, the aggregate market value of securities on loan was $6,451,825. The Fund received cash collateral with a value of $6,639,875. (See Note 2(L)) |
| (g) | Step coupon—Rate shown was the rate in effect as of April 30, 2021. |
| (h) | TBA—Security purchased on a forward commitment basis with an approximate principal amount and maturity date. The actual principal amount and maturity date will be determined upon settlement. As of April 30, 2021, the total net market value was $14,853,890, which represented 1% of the Fund’s net assets. All or a portion of this security is a part of a mortgage dollar roll agreement. |
| (i) | Collateral strip rate—A bond whose interest was based on the weighted net interest rate of the collateral. The coupon rate adjusts periodically based on a predetermined schedule. Rate shown was the rate in effect as of April 30, 2021. |
| (j) | Coupon rate may change based on changes of the underlying collateral or prepayments of principal. Rate shown was the rate in effect as of April 30, 2021. |
| (k) | Treasury Inflation Protected Security—Pays a fixed rate of interest on a principal amount that is continuously adjusted for inflation based on the Consumer Price Index-Urban Consumers. |
The notes to the financial statements are an integral part of, and should be read in conjunction with, the financial statements.
| 22 | MainStay MacKay Total Return Bond Fund |
| (l) | Current yield as of April 30, 2021. |
| (m) | Represents a security purchased with cash collateral received for securities on loan. |
Foreign Currency Forward Contracts
As of April 30, 2021, the Fund held the following foreign currency forward contracts1:
| Currency Purchased | Currency Sold | Counterparty | Settlement
Date | Unrealized
Appreciation
(Depreciation) |
| USD | 3,869,956 | EUR | 3,176,000 | JPMorgan Chase Bank N.A. | 5/4/21 | $ 51,610 |
| USD | 3,889,069 | EUR | 3,214,000 | JPMorgan Chase Bank N.A. | 8/2/21 | 17,709 |
| Total Unrealized Appreciation | $ 69,319 |
| 1. | Foreign Currency Forward Contracts are subject to limitations such that they cannot be “sold or repurchased,” although the Fund would be able to exit the transaction through other means, such as through the execution of an offsetting transaction. |
Futures Contracts
As of April 30, 2021, the Fund held the following futures contracts1:
| Type | Number of
Contracts | Expiration
Date | Value at
Trade Date | Current
Notional
Amount | Unrealized
Appreciation
(Depreciation)2 |
| Long Contracts | | | | | |
| U.S. Treasury 2 Year Notes | 880 | June 2021 | $ 194,435,886 | $ 194,266,875 | $ (169,011) |
| U.S. Treasury 5 Year Notes | 545 | June 2021 | 67,596,707 | 67,545,938 | (50,769) |
| U.S. Treasury Long Bonds | 89 | June 2021 | 14,186,365 | 13,995,250 | (191,115) |
| U.S. Treasury Ultra Bonds | 101 | June 2021 | 18,883,086 | 18,776,531 | (106,555) |
| Total Long Contracts | | | | | (517,450) |
| Short Contracts | | | | | |
| U.S. Treasury 10 Year Notes | (107) | June 2021 | (14,250,463) | (14,127,344) | 123,119 |
| U.S. Treasury 10 Year Ultra Bonds | (345) | June 2021 | (50,904,076) | (50,213,672) | 690,404 |
| Total Short Contracts | | | | | 813,523 |
| Net Unrealized Appreciation | | | | | $ 296,073 |
| 1. | As of April 30, 2021, cash in the amount of $1,114,771 was on deposit with a broker or futures commission merchant for futures transactions. |
| 2. | Represents the difference between the value of the contracts at the time they were opened and the value as of April 30, 2021. |
| Abbreviation(s): |
| EUR—Euro |
| FHLMC—Federal Home Loan Mortgage Corp. |
| FNMA—Federal National Mortgage Association |
| GNMA—Government National Mortgage Association |
| LIBOR—London Interbank Offered Rate |
| REMIC—Real Estate Mortgage Investment Conduit |
| SOFR—Secured Overnight Financing Rate |
| TBA—To Be Announced |
| UMBS—Uniform Mortgage Backed Securities |
| USD—United States Dollar |
The notes to the financial statements are an integral part of, and should be read in conjunction with, the financial statements.
23
Portfolio of Investments April 30, 2021† (Unaudited) (continued)
The following is a summary of the fair valuations according to the inputs used as of April 30, 2021, for valuing the Fund’s assets and liabilities:
| Description | Quoted
Prices in
Active
Markets for
Identical
Assets
(Level 1) | | Significant
Other
Observable
Inputs
(Level 2) | | Significant
Unobservable
Inputs
(Level 3) | | Total |
| Asset Valuation Inputs | | | | | | | |
| Investments in Securities (a) | | | | | | | |
| Long-Term Bonds | | | | | | | |
| Asset-Backed Securities | $ — | | $ 104,464,502 | | $ — | | $ 104,464,502 |
| Corporate Bonds | — | | 721,331,244 | | — | | 721,331,244 |
| Foreign Government Bonds | — | | 27,009,767 | | — | | 27,009,767 |
| Loan Assignments | — | | 18,475,414 | | — | | 18,475,414 |
| Mortgage-Backed Securities | — | | 246,143,575 | | — | | 246,143,575 |
| Municipal Bonds | — | | 5,096,059 | | — | | 5,096,059 |
| U.S. Government & Federal Agencies | — | | 294,991,077 | | — | | 294,991,077 |
| Total Long-Term Bonds | — | | 1,417,511,638 | | — | | 1,417,511,638 |
| Common Stocks | 3 | | — | | — | | 3 |
| Short-Term Investments | | | | | | | |
| Affiliated Investment Company | 57,844,204 | | — | | — | | 57,844,204 |
| Unaffiliated Investment Company | 6,639,875 | | — | | — | | 6,639,875 |
| Total Short-Term Investments | 64,484,079 | | — | | — | | 64,484,079 |
| Total Investments in Securities | 64,484,082 | | 1,417,511,638 | | — | | 1,481,995,720 |
| Other Financial Instruments | | | | | | | |
| Foreign Currency Forward Contracts (b) | — | | 69,319 | | — | | 69,319 |
| Futures Contracts (b) | 813,523 | | — | | — | | 813,523 |
| Total Other Financial Instruments | 813,523 | | 69,319 | | — | | 882,842 |
| Total Investments in Securities and Other Financial Instruments | $ 65,297,605 | | $ 1,417,580,957 | | $ — | | $ 1,482,878,562 |
| Liability Valuation Inputs | | | | | | | |
| Other Financial Instruments | | | | | | | |
| Futures Contracts (b) | $ (517,450) | | $ — | | $ — | | $ (517,450) |
| (a) | For a complete listing of investments and their industries, see the Portfolio of Investments. |
| (b) | The value listed for these securities reflects unrealized appreciation (depreciation) as shown on the Portfolio of Investments. |
The notes to the financial statements are an integral part of, and should be read in conjunction with, the financial statements.
| 24 | MainStay MacKay Total Return Bond Fund |
Statement of Assets and Liabilities as of April 30, 2021 (Unaudited)
| Assets |
Investment in unaffiliated securities, at value
(identified cost $1,377,065,515) including securities on loan of $6,451,825 | $1,424,151,516 |
Investment in affiliated investment companies, at value
(identified cost $57,844,204) | 57,844,204 |
| Cash collateral on deposit at broker for futures contracts | 1,114,771 |
| Cash | 160,371 |
| Receivables: | |
| Investment securities sold | 27,465,142 |
| Interest | 9,435,904 |
| Fund shares sold | 1,226,696 |
| Securities lending | 797 |
| Unrealized appreciation on foreign currency forward contracts | 69,319 |
| Other assets | 92,685 |
| Total assets | 1,521,561,405 |
| Liabilities |
| Cash collateral due to broker for TBA | 52,101 |
| Cash collateral received for securities on loan | 6,639,875 |
| Payables: | |
| Investment securities purchased | 40,040,428 |
| Manager (See Note 3) | 593,519 |
| Fund shares redeemed | 367,612 |
| Variation margin on futures contracts | 325,631 |
| Transfer agent (See Note 3) | 146,377 |
| Professional fees | 65,910 |
| Shareholder communication | 43,268 |
| NYLIFE Distributors (See Note 3) | 32,926 |
| Custodian | 15,371 |
| Accrued expenses | 11,568 |
| Distributions payable | 12,736 |
| Total liabilities | 48,347,322 |
| Net assets | $1,473,214,083 |
| Composition of Net Assets |
| Shares of beneficial interest outstanding (par value of $.001 per share) unlimited number of shares authorized | $ 132,194 |
| Additional paid-in-capital | 1,422,468,540 |
| | 1,422,600,734 |
| Total distributable earnings (loss) | 50,613,349 |
| Net assets | $1,473,214,083 |
| Class A | |
| Net assets applicable to outstanding shares | $ 94,841,641 |
| Shares of beneficial interest outstanding | 8,512,066 |
| Net asset value per share outstanding | $ 11.14 |
| Maximum sales charge (4.50% of offering price) | 0.52 |
| Maximum offering price per share outstanding | $ 11.66 |
| Investor Class | |
| Net assets applicable to outstanding shares | $ 7,365,502 |
| Shares of beneficial interest outstanding | 657,374 |
| Net asset value per share outstanding | $ 11.20 |
| Maximum sales charge (4.00% of offering price) | 0.47 |
| Maximum offering price per share outstanding | $ 11.67 |
| Class B | |
| Net assets applicable to outstanding shares | $ 1,264,766 |
| Shares of beneficial interest outstanding | 113,353 |
| Net asset value and offering price per share outstanding | $ 11.16 |
| Class C | |
| Net assets applicable to outstanding shares | $ 11,935,241 |
| Shares of beneficial interest outstanding | 1,068,347 |
| Net asset value and offering price per share outstanding | $ 11.17 |
| Class I | |
| Net assets applicable to outstanding shares | $712,100,567 |
| Shares of beneficial interest outstanding | 63,887,992 |
| Net asset value and offering price per share outstanding | $ 11.15 |
| Class R1 | |
| Net assets applicable to outstanding shares | $ 28,909 |
| Shares of beneficial interest outstanding | 2,595 |
| Net asset value and offering price per share outstanding | $ 11.14 |
| Class R2 | |
| Net assets applicable to outstanding shares | $ 32,868 |
| Shares of beneficial interest outstanding | 2,950 |
| Net asset value and offering price per share outstanding | $ 11.14 |
| Class R3 | |
| Net assets applicable to outstanding shares | $ 341,817 |
| Shares of beneficial interest outstanding | 30,683 |
| Net asset value and offering price per share outstanding | $ 11.14 |
| Class R6 | |
| Net assets applicable to outstanding shares | $645,277,901 |
| Shares of beneficial interest outstanding | 57,916,725 |
| Net asset value and offering price per share outstanding | $ 11.14 |
| SIMPLE Class | |
| Net assets applicable to outstanding shares | $ 24,871 |
| Shares of beneficial interest outstanding | 2,221 |
| Net asset value and offering price per share outstanding | $ 11.20 |
The notes to the financial statements are an integral part of, and should be read in conjunction with, the financial statements.
25
Statement of Operations for the six months ended April 30, 2021 (Unaudited)
| Investment Income (Loss) |
| Income | |
| Interest (net of foreign tax withholding of $100) | $ 22,561,783 |
| Securities lending | 5,200 |
| Dividends-affiliated | 3,155 |
| Other | 17,886 |
| Total income | 22,588,024 |
| Expenses | |
| Manager (See Note 3) | 3,715,345 |
| Transfer agent (See Note 3) | 319,341 |
| Distribution/Service—Class A (See Note 3) | 121,185 |
| Distribution/Service—Investor Class (See Note 3) | 9,290 |
| Distribution/Service—Class B (See Note 3) | 7,817 |
| Distribution/Service—Class C (See Note 3) | 84,020 |
| Distribution/Service—Class R2 (See Note 3) | 57 |
| Distribution/Service—Class R3 (See Note 3) | 833 |
| Distribution/Service—SIMPLE Class (See Note 3) | 62 |
| Registration | 89,710 |
| Professional fees | 76,118 |
| Shareholder communication | 25,344 |
| Custodian | 21,213 |
| Trustees | 16,484 |
| Insurance | 6,961 |
| Shareholder service (See Note 3) | 204 |
| Miscellaneous | 27,834 |
| Total expenses | 4,521,818 |
| Net investment income (loss) | 18,066,206 |
| Realized and Unrealized Gain (Loss) |
| Net realized gain (loss) on: | |
| Unaffiliated investment transactions | 8,260,753 |
| Futures transactions | 227,659 |
| Foreign currency forward transactions | (222,865) |
| Net realized gain (loss) | 8,265,547 |
| Net change in unrealized appreciation (depreciation) on: | |
| Unaffiliated investments | (18,332,521) |
| Futures contracts | (361,608) |
| Foreign currency forward contracts | 140,318 |
| Translation of other assets and liabilities in foreign currencies | (14,757) |
| Net change in unrealized appreciation (depreciation) | (18,568,568) |
| Net realized and unrealized gain (loss) | (10,303,021) |
| Net increase (decrease) in net assets resulting from operations | $ 7,763,185 |
The notes to the financial statements are an integral part of, and should be read in conjunction with, the financial statements.
| 26 | MainStay MacKay Total Return Bond Fund |
Statements of Changes in Net Assets
for the six months ended April 30, 2021 (Unaudited) and the year ended October 31, 2020
| | 2021 | 2020 |
| Increase (Decrease) in Net Assets |
| Operations: | | |
| Net investment income (loss) | $ 18,066,206 | $ 34,629,085 |
| Net realized gain (loss) | 8,265,547 | 39,608,477 |
| Net change in unrealized appreciation (depreciation) | (18,568,568) | 10,979,805 |
| Net increase (decrease) in net assets resulting from operations | 7,763,185 | 85,217,367 |
| Distributions to shareholders: | | |
| Class A | (2,156,787) | (1,681,729) |
| Investor Class | (161,652) | (151,048) |
| Class B | (28,129) | (30,592) |
| Class C | (309,152) | (216,290) |
| Class I | (16,683,728) | (18,994,611) |
| Class R1 | (667) | (708) |
| Class R2 | (811) | (1,926) |
| Class R3 | (6,881) | (6,322) |
| Class R6 | (16,584,281) | (14,452,517) |
| SIMPLE Class | (503) | (73) |
| Total distributions to shareholders | (35,932,591) | (35,535,816) |
| Capital share transactions: | | |
| Net proceeds from sales of shares | 172,243,112 | 777,060,770 |
| Net asset value of shares issued to shareholder in reinvestment of distributions | 35,796,590 | 35,393,832 |
| Cost of shares redeemed | (231,483,636) | (657,455,223) |
| Increase (decrease) in net assets derived from capital share transactions | (23,443,934) | 154,999,379 |
| Net increase (decrease) in net assets | (51,613,340) | 204,680,930 |
| Net Assets |
| Beginning of period | 1,524,827,423 | 1,320,146,493 |
| End of period | $1,473,214,083 | $1,524,827,423 |
The notes to the financial statements are an integral part of, and should be read in conjunction with, the financial statements.
27
Financial Highlights selected per share data and ratios
| | Six months ended
April 30,
2021* | | Year Ended October 31, |
| Class A | 2020 | | 2019 | | 2018 | | 2017 | | 2016 |
| Net asset value at beginning of period | $ 11.35 | | $ 10.91 | | $ 10.10 | | $ 10.64 | | $ 10.66 | | $ 10.46 |
| Net investment income (loss) | 0.12 | | 0.24 | | 0.27 | | 0.25(a) | | 0.29 | | 0.28 |
| Net realized and unrealized gain (loss) on investments | (0.08) | | 0.47 | | 0.82 | | (0.54) | | (0.06) | | 0.18 |
| Net realized and unrealized gain (loss) on foreign currency transactions | — | | (0.00)‡ | | (0.00)‡ | | (0.00)‡ | | 0.00‡ | | 0.01‡ |
| Total from investment operations | 0.04 | | 0.71 | | 1.09 | | (0.29) | | 0.23 | | 0.47 |
| Less distributions: | | | | | | | | | | | |
| From net investment income | (0.12) | | (0.27) | | (0.28) | | (0.25) | | (0.25) | | (0.27) |
| From net realized gain on investments | (0.13) | | — | | — | | — | | — | | — |
| Return of capital | — | | — | | — | | (0.00)‡ | | (0.00)‡ | | — |
| Total distributions | (0.25) | | (0.27) | | (0.28) | | (0.25) | | (0.25) | | (0.27) |
| Net asset value at end of period | $ 11.14 | | $ 11.35 | | $ 10.91 | | $ 10.10 | | $ 10.64 | | $ 10.66 |
| Total investment return (b) | 0.35% | | 6.55% | | 10.88% | | (2.78)% | | 2.23% | | 4.56% |
| Ratios (to average net assets)/Supplemental Data: | | | | | | | | | | | |
| Net investment income (loss) | 2.15%†† | | 2.30% | | 2.63% | | 2.40% | | 2.44% | | 2.55% |
| Net expenses (c) | 0.85%†† | | 0.85% | | 0.88% | | 0.90% | | 0.91% | | 1.00% |
| Expenses (before waiver/reimbursement) (c) | 0.85%†† | | 0.85% | | 0.89% | | 0.90% | | 0.94% | | 1.13% |
| Portfolio turnover rate | 51% | | 123% | | 100% (d) | | 95% (d) | | 56% (d) | | 21% |
| Net assets at end of period (in 000’s) | $ 94,842 | | $ 92,997 | | $ 56,473 | | $ 44,527 | | $ 55,474 | | $ 294,002 |
| * | Unaudited. |
| ‡ | Less than one cent per share. |
| †† | Annualized. |
| (a) | Per share data based on average shares outstanding during the period. |
| (b) | Total investment return is calculated exclusive of sales charges and assumes the reinvestment of dividends and distributions. For periods of less than one year, total return is not annualized. |
| (c) | In addition to the fees and expenses which the Fund bears directly, it also indirectly bears a pro-rata share of the fees and expenses of the underlying funds in which it invests. Such indirect expenses are not included in the above expense ratios. |
| (d) | The portfolio turnover rates not including mortgage dollar rolls were 96%, 63% and 42% for the years ended October 31, 2019, 2018 and 2017, respectively. |
The notes to the financial statements are an integral part of, and should be read in conjunction with, the financial statements.
| 28 | MainStay MacKay Total Return Bond Fund |
Financial Highlights selected per share data and ratios
| | Six months ended
April 30,
2021* | | Year Ended October 31, |
| Investor Class | 2020 | | 2019 | | 2018 | | 2017 | | 2016 |
| Net asset value at beginning of period | $ 11.42 | | $ 10.97 | | $ 10.15 | | $ 10.70 | | $ 10.71 | | $ 10.51 |
| Net investment income (loss) | 0.11 | | 0.24 | | 0.26 | | 0.24(a) | | 0.24 | | 0.29 |
| Net realized and unrealized gain (loss) on investments | (0.09) | | 0.46 | | 0.82 | | (0.56) | | (0.01) | | 0.19 |
| Net realized and unrealized gain (loss) on foreign currency transactions | — | | (0.00)‡ | | (0.00)‡ | | (0.00)‡ | | 0.00‡ | | 0.01‡ |
| Total from investment operations | 0.02 | | 0.70 | | 1.08 | | (0.32) | | 0.23 | | 0.49 |
| Less distributions: | | | | | | | | | | | |
| From net investment income | (0.11) | | (0.25) | | (0.26) | | (0.23) | | (0.24) | | (0.29) |
| From net realized gain on investments | (0.13) | | — | | — | | — | | — | | — |
| Return of capital | — | | — | | — | | (0.00)‡ | | (0.00)‡ | | — |
| Total distributions | (0.24) | | (0.25) | | (0.26) | | (0.23) | | (0.24) | | (0.29) |
| Net asset value at end of period | $ 11.20 | | $ 11.42 | | $ 10.97 | | $ 10.15 | | $ 10.70 | | $ 10.71 |
| Total investment return (b) | 0.18% | | 6.40% | | 10.74% | | (2.99)% | | 2.11% | | 4.81% |
| Ratios (to average net assets)/Supplemental Data: | | | | | | | | | | | |
| Net investment income (loss) | 1.98%†† | | 2.11% | | 2.46% | | 2.27% | | 2.28% | | 2.71% |
| Net expenses (c) | 1.01%†† | | 1.05% | | 1.05% | | 1.04% | | 1.00% | | 0.83% |
| Expenses (before waiver/reimbursement) (c) | 1.01%†† | | 1.05% | | 1.06% | | 1.05% | | 1.03% | | 0.98% |
| Portfolio turnover rate | 51% | | 123% | | 100% (d) | | 95% (d) | | 56% (d) | | 21% |
| Net assets at end of period (in 000’s) | $ 7,366 | | $ 7,558 | | $ 6,557 | | $ 5,514 | | $ 6,265 | | $ 9,232 |
| * | Unaudited. |
| ‡ | Less than one cent per share. |
| †† | Annualized. |
| (a) | Per share data based on average shares outstanding during the period. |
| (b) | Total investment return is calculated exclusive of sales charges and assumes the reinvestment of dividends and distributions. For periods of less than one year, total return is not annualized. |
| (c) | In addition to the fees and expenses which the Fund bears directly, it also indirectly bears a pro-rata share of the fees and expenses of the underlying funds in which it invests. Such indirect expenses are not included in the above expense ratios. |
| (d) | The portfolio turnover rates not including mortgage dollar rolls were 96%, 63% and 42% for the years ended October 31, 2019, 2018 and 2017, respectively. |
The notes to the financial statements are an integral part of, and should be read in conjunction with, the financial statements.
29
Financial Highlights selected per share data and ratios
| | Six months ended
April 30,
2021* | | Year Ended October 31, |
| Class B | 2020 | | 2019 | | 2018 | | 2017 | | 2016 |
| Net asset value at beginning of period | $ 11.37 | | $ 10.92 | | $ 10.11 | | $ 10.65 | | $ 10.67 | | $ 10.47 |
| Net investment income (loss) | 0.07 | | 0.18 | | 0.20 | | 0.16(a) | | 0.17 | | 0.21 |
| Net realized and unrealized gain (loss) on investments | (0.08) | | 0.43 | | 0.79 | | (0.55) | | (0.03) | | 0.19 |
| Net realized and unrealized gain (loss) on foreign currency transactions | — | | (0.00)‡ | | (0.00)‡ | | (0.00)‡ | | 0.00‡ | | 0.01‡ |
| Total from investment operations | (0.01) | | 0.61 | | 0.99 | | (0.39) | | 0.14 | | 0.41 |
| Less distributions: | | | | | | | | | | | |
| From net investment income | (0.07) | | (0.16) | | (0.18) | | (0.15) | | (0.16) | | (0.21) |
| From net realized gain on investments | (0.13) | | — | | — | | — | | — | | — |
| Return of capital | — | | — | | — | | (0.00)‡ | | (0.00)‡ | | — |
| Total distributions | (0.20) | | (0.16) | | (0.18) | | (0.15) | | (0.16) | | (0.21) |
| Net asset value at end of period | $ 11.16 | | $ 11.37 | | $ 10.92 | | $ 10.11 | | $ 10.65 | | $ 10.67 |
| Total investment return (b) | (0.13)% | | 5.64% | | 9.85% | | (3.64)% | | 1.36% | | 3.95% |
| Ratios (to average net assets)/Supplemental Data: | | | | | | | | | | | |
| Net investment income (loss) | 1.22%†† | | 1.36% | | 1.73% | | 1.51% | | 1.53% | | 1.96% |
| Net expenses (c) | 1.76%†† | | 1.80% | | 1.80% | | 1.79% | | 1.75% | | 1.57% |
| Expenses (before waiver/reimbursement) (c) | 1.76%†† | | 1.80% | | 1.81% | | 1.80% | | 1.78% | | 1.73% |
| Portfolio turnover rate | 51% | | 123% | | 100% (d) | | 95% (d) | | 56% (d) | | 21% |
| Net assets at end of period (in 000’s) | $ 1,265 | | $ 1,838 | | $ 2,515 | | $ 2,987 | | $ 4,913 | | $ 6,746 |
| * | Unaudited. |
| ‡ | Less than one cent per share. |
| †† | Annualized. |
| (a) | Per share data based on average shares outstanding during the period. |
| (b) | Total investment return is calculated exclusive of sales charges and assumes the reinvestment of dividends and distributions. For periods of less than one year, total return is not annualized. |
| (c) | In addition to the fees and expenses which the Fund bears directly, it also indirectly bears a pro-rata share of the fees and expenses of the underlying funds in which it invests. Such indirect expenses are not included in the above expense ratios. |
| (d) | The portfolio turnover rates not including mortgage dollar rolls were 96%, 63% and 42% for the years ended October 31, 2019, 2018 and 2017, respectively. |
The notes to the financial statements are an integral part of, and should be read in conjunction with, the financial statements.
| 30 | MainStay MacKay Total Return Bond Fund |
Financial Highlights selected per share data and ratios
| | Six months ended
April 30,
2021* | | Year Ended October 31, |
| Class C | 2020 | | 2019 | | 2018 | | 2017 | | 2016 |
| Net asset value at beginning of period | $ 11.38 | | $ 10.93 | | $ 10.12 | | $ 10.66 | | $ 10.68 | | $ 10.48 |
| Net investment income (loss) | 0.07 | | 0.14 | | 0.20 | | 0.16(a) | | 0.17 | | 0.21 |
| Net realized and unrealized gain (loss) on investments | (0.08) | | 0.47 | | 0.79 | | (0.55) | | (0.03) | | 0.19 |
| Net realized and unrealized gain (loss) on foreign currency transactions | — | | (0.00)‡ | | (0.00)‡ | | (0.00)‡ | | 0.00‡ | | 0.01‡ |
| Total from investment operations | (0.01) | | 0.61 | | 0.99 | | (0.39) | | 0.14 | | 0.41 |
| Less distributions: | | | | | | | | | | | |
| From net investment income | (0.07) | | (0.16) | | (0.18) | | (0.15) | | (0.16) | | (0.21) |
| From net realized gain on investments | (0.13) | | — | | — | | — | | — | | — |
| Return of capital | — | | — | | — | | (0.00)‡ | | (0.00)‡ | | — |
| Total distributions | (0.20) | | (0.16) | | (0.18) | | (0.15) | | (0.16) | | (0.21) |
| Net asset value at end of period | $ 11.17 | | $ 11.38 | | $ 10.93 | | $ 10.12 | | $ 10.66 | | $ 10.68 |
| Total investment return (b) | (0.13)% | | 5.64% | | 9.84% | | (3.64)% | | 1.36% | | 3.95% |
| Ratios (to average net assets)/Supplemental Data: | | | | | | | | | | | |
| Net investment income (loss) | 1.21%†† | | 1.35% | | 1.74% | | 1.51% | | 1.53% | | 1.96% |
| Net expenses (c) | 1.76%†† | | 1.80% | | 1.80% | | 1.79% | | 1.75% | | 1.58% |
| Expenses (before waiver/reimbursement) (c) | 1.76%†† | | 1.80% | | 1.81% | | 1.80% | | 1.78% | | 1.73% |
| Portfolio turnover rate | 51% | | 123% | | 100% (d) | | 95% (d) | | 56% (d) | | 21% |
| Net assets at end of period (in 000’s) | $ 11,935 | | $ 18,434 | | $ 11,916 | | $ 14,837 | | $ 20,215 | | $ 28,430 |
| * | Unaudited. |
| ‡ | Less than one cent per share. |
| †† | Annualized. |
| (a) | Per share data based on average shares outstanding during the period. |
| (b) | Total investment return is calculated exclusive of sales charges and assumes the reinvestment of dividends and distributions. For periods of less than one year, total return is not annualized. |
| (c) | In addition to the fees and expenses which the Fund bears directly, it also indirectly bears a pro-rata share of the fees and expenses of the underlying funds in which it invests. Such indirect expenses are not included in the above expense ratios. |
| (d) | The portfolio turnover rates not including mortgage dollar rolls were 96%, 63% and 42% for the years ended October 31, 2019, 2018 and 2017, respectively. |
The notes to the financial statements are an integral part of, and should be read in conjunction with, the financial statements.
31
Financial Highlights selected per share data and ratios
| | Six months ended
April 30,
2021* | | Year Ended October 31, |
| Class I | 2020 | | 2019 | | 2018 | | 2017 | | 2016 |
| Net asset value at beginning of period | $ 11.36 | | $ 10.91 | | $ 10.10 | | $ 10.64 | | $ 10.66 | | $ 10.46 |
| Net investment income (loss) | 0.13 | | 0.29 | | 0.31 | | 0.28(a) | | 0.28 | | 0.31 |
| Net realized and unrealized gain (loss) on investments | (0.07) | | 0.45 | | 0.81 | | (0.54) | | (0.01) | | 0.19 |
| Net realized and unrealized gain (loss) on foreign currency transactions | — | | (0.00)‡ | | (0.00)‡ | | (0.00)‡ | | (0.00)‡ | | 0.01‡ |
| Total from investment operations | 0.06 | | 0.74 | | 1.12 | | (0.26) | | 0.27 | | 0.51 |
| Less distributions: | | | | | | | | | | | |
| From net investment income | (0.14) | | (0.29) | | (0.31) | | (0.28) | | (0.29) | | (0.31) |
| From net realized gain on investments | (0.13) | | — | | — | | — | | — | | — |
| Return of capital | — | | — | | — | | (0.00)‡ | | (0.00)‡ | | — |
| Total distributions | (0.27) | | (0.29) | | (0.31) | | (0.28) | | (0.29) | | (0.31) |
| Net asset value at end of period | $ 11.15 | | $ 11.36 | | $ 10.91 | | $ 10.10 | | $ 10.64 | | $ 10.66 |
| Total investment return (b) | 0.48% | | 6.91% | | 11.20% | | (2.49)% | | 2.56% | | 4.96% |
| Ratios (to average net assets)/Supplemental Data: | | | | | | | | | | | |
| Net investment income (loss) | 2.40%†† | | 2.56% | | 2.93% | | 2.70% | | 2.66% | | 2.94% |
| Net expenses (c) | 0.60%†† | | 0.60% | | 0.60% | | 0.60% | | 0.60% | | 0.60% |
| Expenses (before waiver/reimbursement) (c) | 0.60%†† | | 0.60% | | 0.64% | | 0.65% | | 0.67% | | 0.88% |
| Portfolio turnover rate | 51% | | 123% | | 100% (d) | | 95% (d) | | 56% (d) | | 21% |
| Net assets at end of period (in 000’s) | $ 712,101 | | $ 686,829 | | $ 1,056,594 | | $ 1,016,022 | | $ 1,173,384 | | $ 935,533 |
| * | Unaudited. |
| ‡ | Less than one cent per share. |
| †† | Annualized. |
| (a) | Per share data based on average shares outstanding during the period. |
| (b) | Total investment return is calculated exclusive of sales charges and assumes the reinvestment of dividends and distributions. Class I shares are not subject to sales charges. For periods of less than one year, total return is not annualized. |
| (c) | In addition to the fees and expenses which the Fund bears directly, it also indirectly bears a pro-rata share of the fees and expenses of the underlying funds in which it invests. Such indirect expenses are not included in the above expense ratios. |
| (d) | The portfolio turnover rates not including mortgage dollar rolls were 96%, 63% and 42% for the years ended October 31, 2019, 2018 and 2017, respectively. |
The notes to the financial statements are an integral part of, and should be read in conjunction with, the financial statements.
| 32 | MainStay MacKay Total Return Bond Fund |
Financial Highlights selected per share data and ratios
| | Six months ended
April 30,
2021* | | Year Ended October 31, |
| Class R1 | 2020 | | 2019 | | 2018 | | 2017 | | 2016 |
| Net asset value at beginning of period | $ 11.35 | | $ 10.90 | | $ 10.10 | | $ 10.64 | | $ 10.66 | | $ 10.46 |
| Net investment income (loss) | 0.13 | | 0.26 | | 0.29 | | 0.27(a) | | 0.27 | | 0.30 |
| Net realized and unrealized gain (loss) on investments | (0.08) | | 0.47 | | 0.80 | | (0.54) | | (0.01) | | 0.19 |
| Net realized and unrealized gain (loss) on foreign currency transactions | — | | (0.00)‡ | | (0.00)‡ | | (0.00)‡ | | 0.00‡ | | 0.01‡ |
| Total from investment operations | 0.05 | | 0.73 | | 1.09 | | (0.27) | | 0.26 | | 0.50 |
| Less distributions: | | | | | | | | | | | |
| From net investment income | (0.13) | | (0.28) | | (0.29) | | (0.27) | | (0.28) | | (0.30) |
| From net realized gain on investments | (0.13) | | — | | — | | — | | — | | — |
| Total distributions | (0.26) | | (0.28) | | (0.29) | | (0.27) | | (0.28) | | (0.30) |
| Net asset value at end of period | $ 11.14 | | $ 11.35 | | $ 10.90 | | $ 10.10 | | $ 10.64 | | $ 10.66 |
| Total investment return (b) | 0.42% | | 6.81% | | 10.98% | | (2.59)% | | 2.46% | | 4.86% |
| Ratios (to average net assets)/Supplemental Data: | | | | | | | | | | | |
| Net investment income (loss) | 2.29%†† | | 2.47% | | 2.97% | | 2.61% | | 2.58% | | 2.84% |
| Net expenses (c) | 0.70%†† | | 0.70% | | 0.70% | | 0.70% | | 0.70% | | 0.70% |
| Expenses (before waiver/reimbursement) (c) | 0.70%†† | | 0.70% | | 0.74% | | 0.75% | | 0.77% | | 0.98% |
| Portfolio turnover rate | 51% | | 123% | | 100% (d) | | 95% (d) | | 56% (d) | | 21% |
| Net assets at end of period (in 000’s) | $ 29 | | $ 29 | | $ 27 | | $ 4,148 | | $ 3,627 | | $ 3,846 |
| * | Unaudited. |
| ‡ | Less than one cent per share. |
| †† | Annualized. |
| (a) | Per share data based on average shares outstanding during the period. |
| (b) | Total investment return is calculated exclusive of sales charges and assumes the reinvestment of dividends and distributions. Class R1 shares are not subject to sales charges. For periods of less than one year, total return is not annualized. |
| (c) | In addition to the fees and expenses which the Fund bears directly, it also indirectly bears a pro-rata share of the fees and expenses of the underlying funds in which it invests. Such indirect expenses are not included in the above expense ratios. |
| (d) | The portfolio turnover rates not including mortgage dollar rolls were 96%, 63% and 42% for the years ended October 31, 2019, 2018 and 2017, respectively. |
The notes to the financial statements are an integral part of, and should be read in conjunction with, the financial statements.
33
Financial Highlights selected per share data and ratios
| | Six months ended
April 30,
2021* | | Year Ended October 31, |
| Class R2 | 2020 | | 2019 | | 2018 | | 2017 | | 2016 |
| Net asset value at beginning of period | $ 11.35 | | $ 10.90 | | $ 10.09 | | $ 10.63 | | $ 10.65 | | $ 10.46 |
| Net investment income (loss) | 0.11 | | 0.25 | | 0.27 | | 0.24(a) | | 0.24 | | 0.31 |
| Net realized and unrealized gain (loss) on investments | (0.07) | | 0.46 | | 0.81 | | (0.54) | | (0.01) | | 0.15 |
| Net realized and unrealized gain (loss) on foreign currency transactions | — | | (0.00)‡ | | (0.00)‡ | | (0.00)‡ | | 0.00‡ | | 0.00‡ |
| Total from investment operations | 0.04 | | 0.71 | | 1.08 | | (0.30) | | 0.23 | | 0.46 |
| Less distributions: | | | | | | | | | | | |
| From net investment income | (0.12) | | (0.26) | | (0.27) | | (0.24) | | (0.25) | | (0.27) |
| From net realized gain on investments | (0.13) | | — | | — | | — | | — | | — |
| Return of capital | — | | — | | — | | (0.00)‡ | | (0.00)‡ | | — |
| Total distributions | (0.25) | | (0.26) | | (0.27) | | (0.24) | | (0.25) | | (0.27) |
| Net asset value at end of period | $ 11.14 | | $ 11.35 | | $ 10.90 | | $ 10.09 | | $ 10.63 | | $ 10.65 |
| Total investment return (b) | 0.30% | | 6.54% | | 10.82% | | (2.83)% | | 2.18% | | 4.44% |
| Ratios (to average net assets)/Supplemental Data: | | | | | | | | | | | |
| Net investment income (loss) | 2.03%†† | | 2.21% | | 2.57% | | 2.35% | | 2.32% | | 2.64% |
| Net expenses (c) | 0.95%†† | | 0.95% | | 0.95% | | 0.95% | | 0.95% | | 0.95% |
| Expenses (before waiver/reimbursement) (c) | 0.95%†† | | 0.95% | | 0.99% | | 1.00% | | 1.02% | | 1.24% |
| Portfolio turnover rate | 51% | | 123% | | 100% (d) | | 95% (d) | | 56% (d) | | 21% |
| Net assets at end of period (in 000’s) | $ 33 | | $ 87 | | $ 81 | | $ 73 | | $ 127 | | $ 115 |
| * | Unaudited. |
| ‡ | Less than one cent per share. |
| †† | Annualized. |
| (a) | Per share data based on average shares outstanding during the period. |
| (b) | Total investment return is calculated exclusive of sales charges and assumes the reinvestment of dividends and distributions. Class R2 shares are not subject to sales charges. For periods of less than one year, total return is not annualized. |
| (c) | In addition to the fees and expenses which the Fund bears directly, it also indirectly bears a pro-rata share of the fees and expenses of the underlying funds in which it invests. Such indirect expenses are not included in the above expense ratios. |
| (d) | The portfolio turnover rates not including mortgage dollar rolls were 96%, 63% and 42% for the years ended October 31, 2019, 2018 and 2017, respectively. |
The notes to the financial statements are an integral part of, and should be read in conjunction with, the financial statements.
| 34 | MainStay MacKay Total Return Bond Fund |
Financial Highlights selected per share data and ratios
| | Six months ended
April 30,
2021* | | Year Ended October 31, | | February 29, 2016^ through
October 31,
2016 |
| Class R3 | 2020 | | 2019 | | 2018 | | 2017 | |
| Net asset value at beginning of period | $ 11.35 | | $ 10.90 | | $ 10.10 | | $ 10.64 | | $ 10.66 | | $ 10.31 |
| Net investment income (loss) | 0.10 | | 0.22 | | 0.24 | | 0.22(a) | | 0.21 | | 0.15 |
| Net realized and unrealized gain (loss) on investments | (0.08) | | 0.46 | | 0.80 | | (0.54) | | (0.01) | | 0.35 |
| Net realized and unrealized gain (loss) on foreign currency transactions | — | | (0.00)‡ | | (0.00)‡ | | (0.00)‡ | | 0.00‡ | | 0.01‡ |
| Total from investment operations | 0.02 | | 0.68 | | 1.04 | | (0.32) | | 0.20 | | 0.51 |
| Less distributions: | | | | | | | | | | | |
| From net investment income | (0.10) | | (0.23) | | (0.24) | | (0.22) | | (0.22) | | (0.16) |
| From net realized gain on investments | (0.13) | | — | | — | | — | | — | | — |
| Total distributions | (0.23) | | (0.23) | | (0.24) | | (0.22) | | (0.22) | | (0.16) |
| Net asset value at end of period | $ 11.14 | | $ 11.35 | | $ 10.90 | | $ 10.10 | | $ 10.64 | | $ 10.66 |
| Total investment return (b) | 0.18% | | 6.28% | | 10.44% | | (3.08)% | | 1.93% | | 4.98% |
| Ratios (to average net assets)/Supplemental Data: | | | | | | | | | | | |
| Net investment income (loss) | 1.80%†† | | 1.96% | | 2.30% | | 2.15% | | 2.07% | | 2.26%†† |
| Net expenses (c) | 1.20%†† | | 1.20% | | 1.20% | | 1.20% | | 1.20% | | 1.20%†† |
| Expenses (before waiver/reimbursement) (c) | 1.20%†† | | 1.20% | | 1.24% | | 1.24% | | 1.27% | | 1.48%†† |
| Portfolio turnover rate | 51% | | 123% | | 100% (d) | | 95% (d) | | 56% (d) | | 21% |
| Net assets at end of period (in 000’s) | $ 342 | | $ 329 | | $ 251 | | $ 173 | | $ 93 | | $ 79 |
| * | Unaudited. |
| ^ | Inception date. |
| ‡ | Less than one cent per share. |
| †† | Annualized. |
| (a) | Per share data based on average shares outstanding during the period. |
| (b) | Total investment return is calculated exclusive of sales charges and assumes the reinvestment of dividends and distributions. Class R3 shares are not subject to sales charges. For periods of less than one year, total return is not annualized. |
| (c) | In addition to the fees and expenses which the Fund bears directly, it also indirectly bears a pro-rata share of the fees and expenses of the underlying funds in which it invests. Such indirect expenses are not included in the above expense ratios. |
| (d) | The portfolio turnover rates not including mortgage dollar rolls were 96%, 63% and 42% for the years ended October 31, 2019, 2018 and 2017, respectively. |
The notes to the financial statements are an integral part of, and should be read in conjunction with, the financial statements.
35
Financial Highlights selected per share data and ratios
| | Six months ended
April 30,
2021* | | Year Ended October 31, |
| Class R6 | 2020 | | 2019 | | 2018 | | 2017 | | 2016 |
| Net asset value at beginning of period | $ 11.35 | | $ 10.91 | | $ 10.10 | | $ 10.64 | | $ 10.66 | | $ 10.46 |
| Net investment income (loss) | 0.14 | | 0.28 | | 0.30 | | 0.29(a) | | 0.29 | | 0.36 |
| Net realized and unrealized gain (loss) on investments | (0.08) | | 0.46 | | 0.82 | | (0.54) | | (0.02) | | 0.15 |
| Net realized and unrealized gain (loss) on foreign currency transactions | — | | (0.00)‡ | | (0.00)‡ | | (0.00)‡ | | 0.00‡ | | 0.01‡ |
| Total from investment operations | 0.06 | | 0.74 | | 1.12 | | (0.25) | | 0.27 | | 0.52 |
| Less distributions: | | | | | | | | | | | |
| From net investment income | (0.14) | | (0.30) | | (0.31) | | (0.29) | | (0.29) | | (0.32) |
| From net realized gain on investments | (0.13) | | — | | — | | — | | — | | — |
| Return of capital | — | | — | | — | | (0.00)‡ | | (0.00)‡ | | — |
| Total distributions | (0.27) | | (0.30) | | (0.31) | | (0.29) | | (0.29) | | (0.32) |
| Net asset value at end of period | $ 11.14 | | $ 11.35 | | $ 10.91 | | $ 10.10 | | $ 10.64 | | $ 10.66 |
| Total investment return (b) | 0.51% | | 6.89% | | 11.27% | | (2.42)% | | 2.62% | | 5.04% |
| Ratios (to average net assets)/Supplemental Data: | | | | | | | | | | | |
| Net investment income (loss) | 2.45%†† | | 2.61% | | 2.98% | | 2.81% | | 2.74% | | 3.02% |
| Net expenses (c) | 0.53%†† | | 0.53% | | 0.53% | | 0.53% | | 0.54% | | 0.53% |
| Portfolio turnover rate | 51% | | 123% | | 100% (d) | | 95% (d) | | 56% (d) | | 21% |
| Net assets at end of period (in 000’s) | $ 645,278 | | $ 716,703 | | $ 185,733 | | $ 119,963 | | $ 27 | | $ 26 |
| * | Unaudited. |
| ‡ | Less than one cent per share. |
| †† | Annualized. |
| (a) | Per share data based on average shares outstanding during the period. |
| (b) | Total investment return is calculated exclusive of sales charges and assumes the reinvestment of dividends and distributions. Class R6 shares are not subject to sales charges. For periods of less than one year, total return is not annualized. |
| (c) | In addition to the fees and expenses which the Fund bears directly, it also indirectly bears a pro-rata share of the fees and expenses of the underlying funds in which it invests. Such indirect expenses are not included in the above expense ratios. |
| (d) | The portfolio turnover rates not including mortgage dollar rolls were 96%, 63% and 42% for the years ended October 31, 2019, 2018 and 2017, respectively. |
The notes to the financial statements are an integral part of, and should be read in conjunction with, the financial statements.
| 36 | MainStay MacKay Total Return Bond Fund |
Financial Highlights selected per share data and ratios
| | Six months ended
April 30,
2021* | | August 31, 2020^ through
October 31, |
| SIMPLE Class | 2020 |
| Net asset value at beginning of period | $ 11.41 | | $ 11.52** |
| Net investment income (loss) | 0.10 | | 0.03 |
| Net realized and unrealized gain (loss) on investments | (0.08) | | (0.11) |
| Net realized and unrealized gain (loss) on foreign currency transactions | — | | 0.00‡ |
| Total from investment operations | 0.02 | | (0.08) |
| Less distributions: | | | |
| From net investment income | (0.10) | | (0.03) |
| From net realized gain on investments | (0.13) | | — |
| Total distributions | (0.23) | | (0.03) |
| Net asset value at end of period | $ 11.20 | | $ 11.41 |
| Total investment return (a) | 0.15% | | (0.66)% |
| Ratios (to average net assets)/Supplemental Data: | | | |
| Net investment income (loss)†† | 1.74% | | 1.80% |
| Net expenses†† (b) | 1.25% | | 1.26% |
| Portfolio turnover rate | 51% | | 123% |
| Net assets at end of period (in 000’s) | $ 25 | | $ 25 |
| * | Unaudited. |
| ^ | Inception date. |
| ‡ | Less than one cent per share. |
| ** | Based on the net asset value of Investor Class as of August 31, 2020. |
| †† | Annualized. |
| (a) | Total investment return is calculated exclusive of sales charges and assumes the reinvestment of dividends and distributions. SIMPLE Class shares are not subject to sales charges. For periods of less than one year, total return is not annualized. |
| (b) | In addition to the fees and expenses which the Fund bears directly, it also indirectly bears a pro-rata share of the fees and expenses of the underlying funds in which it invests. Such indirect expenses are not included in the above expense ratios. |
The notes to the financial statements are an integral part of, and should be read in conjunction with, the financial statements.
37
Notes to Financial Statements (Unaudited)
Note 1-Organization and Business
MainStay Funds Trust (the “Trust”) was organized as a Delaware statutory trust on April 28, 2009. The Trust is registered under the Investment Company Act of 1940, as amended (the “1940 Act”), as an open-end management investment company, and is comprised of thirty-two funds (collectively referred to as the “Funds”). These financial statements and notes relate to the MainStay MacKay Total Return Bond Fund (the "Fund"), a “diversified” fund, as that term is defined in the 1940 Act, as interpreted or modified by regulatory authorities having jurisdiction, from time to time.
The following table lists the Fund's share classes that have been registered and commenced operations:
| Class | Commenced Operations |
| Class A | January 2, 2004 |
| Investor Class | February 28, 2008 |
| Class B | January 2, 2004 |
| Class C | January 2, 2004 |
| Class I | January 2, 1991 |
| Class R1 | June 29, 2012 |
| Class R2 | June 29, 2012 |
| Class R3 | February 29, 2016 |
| Class R6 | December 29, 2014 |
| SIMPLE Class | August 31, 2020 |
Class B shares of the MainStay Group of Funds are closed to all new purchases as well as additional investments by existing Class B shareholders. Existing Class B shareholders may continue to reinvest dividends and capital gains distributions, as well as exchange their Class B shares for Class B shares of other funds in the MainStay Group of Funds as permitted by the current exchange privileges. Class B shareholders continue to be subject to any applicable contingent deferred sales charge ("CDSC") at the time of redemption. All other features of the Class B shares, including but not limited to the fees and expenses applicable to Class B shares, remain unchanged. Unless redeemed, Class B shareholders will remain in Class B shares of their respective fund until the Class B shares are converted to Class A or Investor Class shares pursuant to the applicable conversion schedule.
Class A and Investor Class shares are offered at net asset value (“NAV”) per share plus an initial sales charge. No initial sales charge applies to investments of $1 million or more (and certain other qualified purchases) in Class A and Investor Class shares. However, a CDSC of 1.00% may be imposed on certain redemptions made within 18 months of the date of purchase on shares that were purchased without an initial sales charge. Class C shares are offered at NAV without an initial sales charge, although a 1.00% CDSC may be imposed on certain redemptions of such shares made within one year of the date of purchase of Class C shares. When Class B shares were offered, they were offered at NAV without an initial sales charge, although a CDSC that declines depending on the number of years a shareholder held its Class B shares may be imposed on certain redemptions of such shares made within six years of the date
of purchase of such shares. Class I, Class R1, Class R2, Class R3, Class R6 and SIMPLE Class shares are offered at NAV without a sales charge. Depending upon eligibility, Class B shares convert to either Class A or Investor Class shares at the end of the calendar quarter eight years after the date they were purchased. In addition, depending upon eligibility, Class C shares convert to either Class A or Investor Class shares at the end of the calendar quarter ten years after the date they were purchased. Additionally, Investor Class shares may convert automatically to Class A shares. SIMPLE Class shares convert to Class A shares, or Investor Class shares if you are not eligible to hold Class A shares, at the end of the calendar quarter, ten years after the date they were purchased. Share class conversions are based on the relevant NAVs of the two classes at the time of the conversion, and no sales load or other charge is imposed. Under certain circumstances and as may be permitted by the Trust’s multiple class plan pursuant to Rule 18f-3 under the 1940 Act, specified share classes of the Fund may be converted to one or more other share classes of the Fund as disclosed in the capital share trans-actions within these Notes. The classes of shares have the same voting (except for issues that relate solely to one class), dividend, liquidation and other rights, and the same terms and conditions, except that under distribution plans pursuant to Rule 12b-1 under the 1940 Act, Class B and Class C shares are subject to higher distribution and/or service fees than Class A, Investor Class, Class R2, Class R3 and SIMPLE Class shares. Class I, Class R1 and Class R6 shares are not subject to a distribution and/or service fee. Class R1, Class R2 and Class R3 shares are subject to a shareholder service fee, which is in addition to fees paid under the distribution plans for Class R2 and Class R3 shares.
The Fund's investment objective is to seek total return.
Note 2–Significant Accounting Policies
The Fund is an investment company and accordingly follows the investment company accounting and reporting guidance of the Financial Accounting Standards Board (“FASB”) Accounting Standard Codification Topic 946 Financial Services—Investment Companies. The Fund prepares its financial statements in accordance with generally accepted accounting principles (“GAAP”) in the United States of America and follows the significant accounting policies described below.
(A) Securities Valuation. Investments are usually valued as of the close of regular trading on the New York Stock Exchange (the "Exchange") (usually 4:00 p.m. Eastern time) on each day the Fund is open for business ("valuation date").
The Board of Trustees of the Trust (the "Board") adopted procedures establishing methodologies for the valuation of the Fund's securities and other assets and delegated the responsibility for valuation determinations under those procedures to the Valuation Committee of the Trust (the “Valuation Committee”). The procedures state that, subject to the oversight of the Board and unless otherwise noted, the responsibility for the day-to-day valuation of portfolio assets (including fair value measurements for the Fund's assets and liabilities) rests with New York Life Investment Management LLC (“New York Life Investments” or the
| 38 | MainStay MacKay Total Return Bond Fund |
"Manager"), aided to whatever extent necessary by the Subadvisor (as defined in Note 3(A)). To assess the appropriateness of security valuations, the Manager, the Subadvisor or the Fund's third-party service provider, who is subject to oversight by the Manager, regularly compares prior day prices, prices on comparable securities and the sale prices to the prior and current day prices and challenges prices with changes exceeding certain tolerance levels with third-party pricing services or broker sources.
The Board authorized the Valuation Committee to appoint a Valuation Subcommittee (the “Subcommittee”) to establish the prices of securities for which market quotations are not readily available or the prices of which are not otherwise readily determinable under the procedures. The Subcommittee meets (in person, via electronic mail or via teleconference) on an as-needed basis. The Valuation Committee meets to ensure that actions taken by the Subcommittee were appropriate.
For those securities valued through either a standardized fair valuation methodology or a fair valuation measurement, the Subcommittee deals with such valuation and the Valuation Committee reviews and affirms, if appropriate, the reasonableness of the valuation based on such methodologies and measurements on a regular basis after considering information that is reasonably available and deemed relevant by the Valuation Committee. Any action taken by the Subcommittee with respect to the valuation of a portfolio security or other asset is submitted for review and ratification (if appropriate) to the Valuation Committee and the Board at the next regularly scheduled meeting.
"Fair value" is defined as the price the Fund would reasonably expect to receive upon selling an asset or liability in an orderly transaction to an independent buyer in the principal or most advantageous market for the asset or liability. Fair value measurements are determined within a framework that establishes a three-tier hierarchy that maximizes the use of observable market data and minimizes the use of unobservable inputs to establish a classification of fair value measurements for disclosure purposes. "Inputs" refer broadly to the assumptions that market participants would use in pricing the asset or liability, including assumptions about risk, such as the risk inherent in a particular valuation technique used to measure fair value using a pricing model and/or the risk inherent in the inputs for the valuation technique. Inputs may be observable or unobservable. Observable inputs reflect the assumptions market participants would use in pricing the asset or liability based on market data obtained from sources independent of the Fund. Unobservable inputs reflect the Fund’s own assumptions about the assumptions market participants would use in pricing the asset or liability based on the information available. The inputs or methodology used for valuing assets or liabilities may not be an indication of the risks associated with investing in those assets or liabilities. The three-tier hierarchy of inputs is summarized below.
| • | Level 1—quoted prices in active markets for an identical asset or liability |
| • | Level 2—other significant observable inputs (including quoted prices for a similar asset or liability in active markets, interest rates and yield curves, prepayment speeds, credit risk, etc.) |
| • | Level 3—significant unobservable inputs (including the Fund's own assumptions about the assumptions that market participants would use in measuring fair value of an asset or liability) |
The level of an asset or liability within the fair value hierarchy is based on the lowest level of an input, both individually and in the aggregate, that is significant to the fair value measurement. The aggregate value by input level of the Fund’s assets and liabilities as of April 30, 2021, is included at the end of the Portfolio of Investments.
The Fund may use third-party vendor evaluations, whose prices may be derived from one or more of the following standard inputs, among others:
| • Benchmark yields | • Reported trades |
| • Broker/dealer quotes | • Issuer spreads |
| • Two-sided markets | • Benchmark securities |
| • Bids/offers | • Reference data (corporate actions or material event notices) |
| • Industry and economic events | • Comparable bonds |
| • Monthly payment information | |
An asset or liability for which market values cannot be measured using the methodologies described above is valued by methods deemed reasonable in good faith by the Valuation Committee, following the procedures established by the Board, to represent fair value. Under these procedures, the Fund generally uses a market-based approach which may use related or comparable assets or liabilities, recent transactions, market multiples, book values and other relevant information. The Fund may also use an income-based valuation approach in which the anticipated future cash flows of the asset or liability are discounted to calculate fair value. Discounts may also be applied due to the nature and/or duration of any restrictions on the disposition of the asset or liability. Fair value represents a good faith approximation of the value of a security. Fair value determinations involve the consideration of a number of subjective factors, an analysis of applicable facts and circumstances and the exercise of judgment. As a result, it is possible that the fair value for a security determined in good faith in accordance with the Fund's valuation procedures may differ from valuations for the same security determined by other funds using their own valuation procedures. Although the Fund's valuation procedures are designed to value a security at the price the Fund may reasonably expect to receive upon the security's sale in an orderly transaction, there can be no assurance that any fair value determination thereunder would, in fact, approximate the amount that the Fund would actually realize upon the sale of the security or the price at which the security would trade if a reliable market price were readily available. During the six-month period ended April 30, 2021, there were no material changes to the fair value methodologies.
Securities which may be valued in this manner include, but are not limited to: (i) a security for which trading has been halted or suspended; (ii) a
Notes to Financial Statements (Unaudited) (continued)
debt security that has recently gone into default and for which there is not a current market quotation; (iii) a security of an issuer that has entered into a restructuring; (iv) a security that has been delisted from a national exchange; (v) a security for which the market price is not readily available from a third-party pricing source or, if so provided, does not, in the opinion of the Manager or the Subadvisor, reflect the security's market value; (vi) a security subject to trading collars for which no or limited trading takes place; and (vii) a security whose principal market has been temporarily closed at a time when, under normal conditions, it would be open. Securities valued in this manner are generally categorized as Level 3 in the hierarchy. No securities held by the Fund as of April 30, 2021 were fair valued in such a manner.
Equity securities are valued at the last quoted sales prices as of the close of regular trading on the relevant exchange on each valuation date. Securities that are not traded on the valuation date are valued at the mean of the last quoted bid and ask prices. Prices are normally taken from the principal market in which each security trades. These securities are generally categorized as Level 1 in the hierarchy.
Investments in mutual funds, including money market funds, are valued at their respective NAVs at the close of business each day on the valuation date. These securities are generally categorized as Level 1 in the hierarchy.
Futures contracts are valued at the last posted settlement price on the market where such futures are primarily traded. These securities are generally categorized as Level 1 in the hierarchy.
Municipal debt securities are valued at the evaluated mean prices supplied by a pricing agent or broker selected by the Manager, in consultation with the Subadvisor. The evaluations are market-based measurements processed through a pricing application and represents the pricing agent's good faith determination as to what a holder may receive in an orderly transaction under market conditions. The rules-based logic utilizes valuation techniques that reflect participants' assumptions and vary by asset class and per methodology, maximizing the use of relevant observable data including quoted prices for similar assets, benchmark yield curves and market corroborated inputs. The evaluated bid or mean prices are deemed by the Manager, in consultation with the Subadvisor, to be representative of market values, at the regular close of trading of the Exchange on each valuation date. Municipal debt securities purchased on a delayed delivery basis are marked to market daily until settlement at the forward settlement date. Municipal debt securities are generally categorized as Level 2 in the hierarchy.
Debt securities (other than convertible and municipal bonds) are valued at the evaluated bid prices (evaluated mean prices in the case of convertible and municipal bonds) supplied by a pricing agent or broker selected by the Manager, in consultation with the Subadvisor. The evaluations are market-based measurements processed through a pricing application and represents the pricing agent’s good faith determination as to what a holder may receive in an orderly transaction under market conditions. The rules based logic utilizes valuation techniques that reflect participants’ assumptions and vary by asset class and per methodology, maximizing
the use of relevant observable data including quoted prices for similar assets, benchmark yield curves and market corroborated inputs. The evaluated bid or mean prices are deemed by the Manager, in consultation with the Subadvisor, to be representative of market values at the regular close of trading of the Exchange on each valuation date. Debt securities purchased on a delayed delivery basis are marked to market daily until settlement at the forward settlement date. Debt securities, including corporate bonds, U.S. government and federal agency bonds, municipal bonds, foreign bonds, convertible bonds, asset-backed securities and mortgage-backed securities are generally categorized as Level 2 in the hierarchy.
Foreign currency forward contracts are valued at their fair market values measured on the basis of the mean between the last current bid and ask prices based on dealer or exchange quotations and are generally categorized as Level 2 in the hierarchy.
Loan assignments, participations and commitments are valued at the average of bid quotations obtained from the engaged independent pricing service and are generally categorized as Level 2 in the hierarchy. Certain loan assignments, participations and commitments may be valued by utilizing significant unobservable inputs obtained from the pricing service and are generally categorized as Level 3 in the hierarchy. No securities held by the Fund as of April 30, 2021 were fair valued in such a manner.
Temporary cash investments acquired in excess of 60 days to maturity at the time of purchase are valued using the latest bid prices or using valuations based on a matrix system (which considers such factors as security prices, yields, maturities and ratings), both as furnished by independent pricing services. Temporary cash investments that mature in 60 days or less at the time of purchase ("Short-Term Investments") are valued using the amortized cost method of valuation, unless the use of such method would be inappropriate. The amortized cost method involves valuing a security at its cost on the date of purchase and thereafter assuming a constant amortization to maturity of the difference between such cost and the value on maturity date. Amortized cost approximates the current fair value of a security. Securities valued using the amortized cost method are not valued using quoted prices in an active market and are generally categorized as Level 2 in the hierarchy.
The information above is not intended to reflect an exhaustive list of the methodologies that may be used to value portfolio investments. The valuation procedures permit the use of a variety of valuation methodologies in connection with valuing portfolio investments. The methodology used for a specific type of investment may vary based on the market data available or other considerations. The methodologies summarized above may not represent the specific means by which portfolio investments are valued on any particular business day.
(B) Income Taxes. The Fund's policy is to comply with the requirements of the Internal Revenue Code of 1986, as amended (the “Internal Revenue Code”), applicable to regulated investment companies and to distribute all of its taxable income to the shareholders of the Fund within the allowable time limits.
| 40 | MainStay MacKay Total Return Bond Fund |
The Manager evaluates the Fund’s tax positions to determine if the tax positions taken meet the minimum recognition threshold in connection with accounting for uncertainties in income tax positions taken or expected to be taken for the purposes of measuring and recognizing tax liabilities in the financial statements. Recognition of tax benefits of an uncertain tax position is permitted only to the extent the position is “more likely than not” to be sustained assuming examination by taxing authorities. The Manager analyzed the Fund's tax positions taken on federal, state and local income tax returns for all open tax years (for up to three tax years) and has concluded that no provisions for federal, state and local income tax are required in the Fund's financial statements. The Fund's federal, state and local income tax and federal excise tax returns for tax years for which the applicable statutes of limitations have not expired are subject to examination by the Internal Revenue Service and state and local departments of revenue.
(C) Foreign Taxes. The Fund may be subject to foreign taxes on income and other transaction-based taxes imposed by certain countries in which it invests. A portion of the taxes on gains on investments or currency purchases/repatriation may be reclaimable. The Fund will accrue such taxes and reclaims as applicable, based upon its current interpretation of tax rules and regulations that exist in the markets in which it invests.
The Fund may be subject to taxation on realized capital gains, repatriation proceeds and other transaction-based taxes imposed by certain countries in which it invests. The Fund will accrue such taxes as applicable based upon its current interpretation of tax rules and regulations that exist in the market in which it invests. Capital gains taxes relating to positions still held are reflected as a liability in the Statement of Assets and Liabilities, as well as an adjustment to the Fund's net unrealized appreciation (depreciation). Taxes related to capital gains realized, if any, are reflected as part of net realized gain (loss) in the Statement of Operations. Changes in tax liabilities related to capital gains taxes on unrealized investment gains, if any, are reflected as part of the change in net unrealized appreciation (depreciation) on investments in the Statement of Operations. Transaction-based charges are generally assessed as a percentage of the transaction amount.
(D) Dividends and Distributions to Shareholders. Dividends and distributions are recorded on the ex-dividend date. The Fund intends to declare and pay dividends from net investment income, if any, at least monthly and distributions from net realized capital and currency gains, if any, at least annually. Unless a shareholder elects otherwise, all dividends and distributions are reinvested at NAV in the same class of shares of the Fund. Dividends and distributions to shareholders are determined in accordance with federal income tax regulations and may differ from determinations using GAAP.
(E) Security Transactions and Investment Income. The Fund records security transactions on the trade date. Realized gains and losses on security transactions are determined using the identified cost method. Interest income is accrued as earned using the effective interest rate method and includes any realized gains and losses from repayments of
principal on mortgage-backed securities. Distributions received from real estate investment trusts may be classified as dividends, capital gains and/or return of capital. Discounts and premiums on securities purchased, for the Fund are accreted and amortized, respectively. Income from payment-in-kind securities is accreted daily based on the effective interest method.
Investment income and realized and unrealized gains and losses on investments of the Fund are allocated pro rata to the separate classes of shares based upon their relative net assets on the date the income is earned or realized and unrealized gains and losses are incurred.
The Fund may place a debt security on non-accrual status and reduce related interest income by ceasing current accruals and writing off all or a portion of any interest receivables when the collection of all or a portion of such interest has become doubtful. A debt security is removed from non-accrual status when the issuer resumes interest payments or when collectability of interest is reasonably assured.
(F) Expenses. Expenses of the Trust are allocated to the individual Funds in proportion to the net assets of the respective Funds when the expenses are incurred, except where direct allocations of expenses can be made. Expenses (other than transfer agent expenses and fees incurred under the shareholder services plans and/or the distribution plans further discussed in Note 3(B)) are allocated to separate classes of shares pro rata based upon their relative net assets on the date the expenses are incurred. The expenses borne by the Fund, including those of related parties to the Fund, are shown in the Statement of Operations.
Additionally, the Fund may invest in mutual funds, which are subject to management fees and other fees that may cause the costs of investing in mutual funds to be greater than the costs of owning the underlying securities directly. These indirect expenses of mutual funds are not included in the amounts shown as expenses in the Statement of Operations or in the expense ratios included in the Financial Highlights.
(G) Use of Estimates. In preparing financial statements in conformity with GAAP, the Manager makes estimates and assumptions that affect the reported amounts and disclosures in the financial statements. Actual results could differ from those estimates and assumptions.
(H) Futures Contracts. A futures contract is an agreement to purchase or sell a specified quantity of an underlying instrument at a specified future date and price, or to make or receive a cash payment based on the value of a financial instrument (e.g., foreign currency, interest rate, security or securities index). The Fund is subject to risks such as market price risk and/or interest rate risk in the normal course of investing in these contracts. Upon entering into a futures contract, the Fund is required to pledge to the broker or futures commission merchant an amount of cash and/or U.S. government securities equal to a certain percentage of the collateral amount, known as the “initial margin.” During the period the futures contract is open, changes in the value of the contract are recognized as unrealized appreciation or depreciation by marking to market such contract on a daily basis to reflect the market value of the contract at the end of each day’s trading. The Fund agrees to
Notes to Financial Statements (Unaudited) (continued)
receive from or pay to the broker or futures commission merchant an amount of cash equal to the daily fluctuation in the value of the contract. Such receipts or payments are known as “variation margin.” When the futures contract is closed, the Fund records a realized gain or loss equal to the difference between the proceeds from (or cost of) the closing transaction and the Fund's basis in the contract.
The use of futures contracts involves, to varying degrees, elements of market risk in excess of the amount recognized in the Statement of Assets and Liabilities. The contract or notional amounts and variation margin reflect the extent of the Fund's involvement in open futures positions. There are several risks associated with the use of futures contracts as hedging techniques. There can be no assurance that a liquid market will exist at the time when the Fund seeks to close out a futures contract. If no liquid market exists, the Fund would remain obligated to meet margin requirements until the position is closed. Futures contracts may involve a small initial investment relative to the risk assumed, which could result in losses greater than if the Fund did not invest in futures contracts. Futures contracts may be more volatile than direct investments in the instrument underlying the futures and may not correlate to the underlying instrument, causing a given hedge not to achieve its objectives. The Fund's activities in futures contracts have minimal counterparty risk as they are conducted through regulated exchanges that guarantee the futures against default by the counterparty. In the event of a bankruptcy or insolvency of a futures commission merchant that holds margin on behalf of the Fund, the Fund may not be entitled to the return of the entire margin owed to the Fund, potentially resulting in a loss. The Fund may invest in futures contracts to seek enhanced returns or to reduce the risk of loss by hedging certain of its holdings. The Fund's investment in futures contracts and other derivatives may increase the volatility of the Fund's NAVs and may result in a loss to the Fund. Open futures contracts as of April 30, 2021 are shown in the Portfolio of Investments.
(I) Loan Assignments, Participations and Commitments. The Fund may invest in loan assignments and participations ("loans"). Commitments are agreements to make money available to a borrower in a specified amount, at a specified rate and within a specified time. The Fund records an investment when the borrower withdraws money on a commitment or when a funded loan is purchased (trade date) and records interest as earned. These loans pay interest at rates that are periodically reset by reference to a base lending rate plus a spread. These base lending rates are generally the prime rate offered by a designated U.S. bank or the London Interbank Offered Rate ("LIBOR").
The loans in which the Fund may invest are generally readily marketable, but may be subject to some restrictions on resale. For example, the Fund may be contractually obligated to receive approval from the agent bank and/or borrower prior to the sale of these investments. If the Fund purchases an assignment from a lender, the Fund will generally have direct contractual rights against the borrower in favor of the lender. If the Fund purchases a participation interest either from a lender or a participant, the Fund typically will have established a direct contractual
relationship with the seller of the participation interest, but not with the borrower. Consequently, the Fund is subject to the credit risk of the lender or participant who sold the participation interest to the Fund, in addition to the usual credit risk of the borrower. In the event that the borrower, selling participant or intermediate participants become insolvent or enter into bankruptcy, the Fund may incur certain costs and delays in realizing payment, or may suffer a loss of principal and/or interest.
Unfunded commitments represent the remaining obligation of the Fund to the borrower. At any point in time, up to the maturity date of the issue, the borrower may demand the unfunded portion. Unfunded amounts, if any, are marked to market and any unrealized gains or losses are recorded in the Statement of Assets and Liabilities. As of April 30, 2021, the Fund did not hold any unfunded commitments.
(J) Foreign Currency Forward Contracts. The Fund may enter into foreign currency forward contracts, which are agreements to buy or sell foreign currencies on a specified future date at a specified rate. The Fund is subject to foreign currency exchange rate risk in the normal course of investing in these transactions. During the period the forward contract is open, changes in the value of the contract are recognized as unrealized appreciation or depreciation by marking to market such contract on a daily basis to reflect the market value of the contract at the end of each day’s trading. Cash movement occurs on the settlement date. When the forward contract is closed, the Fund records a realized gain or loss equal to the difference between the proceeds from (or cost of) the closing transaction and the Fund's basis in the contract. The Fund may purchase and sell foreign currency forward contracts for purposes of seeking to enhance portfolio returns and manage portfolio risk more efficiently. Foreign currency forward contracts may also be used to gain exposure to a particular currency or to hedge against the risk of loss due to changing currency exchange rates. Foreign currency forward contracts to purchase or sell a foreign currency may also be used in anticipation of future purchases or sales of securities denominated in foreign currency, even if the specific investments have not yet been selected.
The use of foreign currency forward contracts involves, to varying degrees, elements of risk in excess of the amount recognized in the Statement of Assets and Liabilities, including counterparty risk, market risk and illiquidity risk. Counterparty risk is heightened for these instruments because foreign currency forward contracts are not exchange-traded and therefore no clearinghouse or exchange stands ready to meet the obligations under such contracts. Thus, the Fund faces the risk that its counterparties under such contracts may not perform their obligations. Market risk is the risk that the value of a foreign currency forward contract will depreciate due to unfavorable changes in exchange rates. Illiquidity risk arises because the secondary market for foreign currency forward contracts may have less liquidity relative to markets for other securities and financial instruments. Risks also arise from the possible movements in the foreign exchange rates underlying these instruments. While the Fund may enter into forward contracts to reduce currency exchange risks, changes in currency exchange rates may result in poorer overall performance for the Fund than if it had not
| 42 | MainStay MacKay Total Return Bond Fund |
engaged in such transactions. Exchange rate movements can be large, depending on the currency, and can last for extended periods of time, affecting the value of the Fund's assets. Moreover, there may be an imperfect correlation between the Fund's holdings of securities denominated in a particular currency and forward contracts entered into by the Fund. Such imperfect correlation may prevent the Fund from achieving the intended hedge or expose the Fund to the risk of currency exchange loss. The unrealized appreciation (depreciation) on forward contracts also reflects the Fund's exposure at the valuation date to credit loss in the event of a counterparty’s failure to perform its obligations. Open foreign currency forward contracts as of April 30, 2021, are shown in the Portfolio of Investments.
(K) Foreign Currency Transactions. The Fund's books and records are maintained in U.S. dollars. Prices of securities denominated in foreign currency amounts are translated into U.S. dollars at the mean between the buying and selling rates last quoted by any major U.S. bank at the following dates:
(i) market value of investment securities, other assets and liabilities— at the valuation date; and
(ii) purchases and sales of investment securities, income and expenses—at the date of such transactions.
The assets and liabilities that are denominated in foreign currency amounts are presented at the exchange rates and market values at the close of the period. The realized and unrealized changes in net assets arising from fluctuations in exchange rates and market prices of securities are not separately presented.
Net realized gain (loss) on foreign currency transactions represents net currency gains or losses realized as a result of differences between the amounts of securities sale proceeds or purchase cost, dividends, interest and withholding taxes as recorded on the Fund's books, and the U.S. dollar equivalent amount actually received or paid. Net currency gains or losses from valuing such foreign currency denominated assets and liabilities, other than investments at valuation date exchange rates, are reflected in unrealized foreign exchange gains or losses.
(L) Securities Lending. In order to realize additional income, the Fund may engage in securities lending, subject to the limitations set forth in the 1940 Act and relevant guidance by the staff of the Securities and Exchange Commission (“SEC”). If the Fund engages in securities lending, the Fund will lend through its custodian, JPMorgan Chase Bank, N.A., ("JPMorgan"), acting as securities lending agent on behalf of the Fund. Under the current arrangement, JPMorgan will manage the Fund's collateral in accordance with the securities lending agency agreement between the Fund and JPMorgan, and indemnify the Fund against counterparty risk. The loans will be collateralized by cash (which may be invested in a money market fund) and/or non-cash collateral (which may include U.S. Treasury securities and/or U.S. government agency securities issued or guaranteed by the United States government or its agencies or instrumentalities) at least equal at all times to the market value of the securities loaned. The Fund bears the risk of delay in recovery of, or loss
of rights in, the securities loaned. The Fund may also record a realized gain or loss on securities deemed sold due to a borrower’s inability to return securities on loan. The Fund bears the risk of any loss on investment of cash collateral. The Fund will receive compensation for lending its securities in the form of fees or it will retain a portion of interest earned on the investment of any cash collateral. The Fund will also continue to receive interest and dividends on the securities loaned and any gain or loss in the market price of the securities loaned that may occur during the term of the loan will be for the account of the Fund. Income earned from securities lending activities, if any, is reflected in the Statement of Operations. Securities on loan as of April 30, 2021, are shown in the Portfolio of Investments.
Prior to November 23, 2020, these services were provided by State Street Bank and Trust Company (“State Street”).
(M) Dollar Rolls. The Fund may enter into dollar roll transactions in which it sells mortgage-backed securities ("MBS") from its portfolio to a counterparty from whom it simultaneously agrees to buy a similar security on a delayed delivery basis. The Fund generally transfers MBS where the MBS are "to be announced," therefore, the Fund accounts for these transactions as purchases and sales.
When accounted for as purchase and sales, the securities sold in connection with the dollar rolls are removed from the portfolio and a realized gain or loss is recognized. The securities the Fund has agreed to acquire are included at market value in the Portfolio of Investments and liabilities for such purchase commitments are included as payables for investments purchased. During the roll period, the Fund foregoes principal and interest paid on the securities. The Fund is compensated by the difference between the current sales price and the forward price for the future as well as by the earnings on the cash proceeds of the initial sale. Dollar rolls may be renewed without physical delivery of the securities subject to the contract. The Fund maintains liquid assets from its portfolio having a value not less than the repurchase price, including accrued interest. Dollar roll transactions involve certain risks, including the risk that the securities returned to the Fund at the end of the roll period, while substantially similar, could be inferior to what was initially sold to the counterparty.
(N) Delayed Delivery Transactions. The Fund may purchase or sell securities on a delayed delivery basis. These transactions involve a commitment by the Fund to purchase or sell securities for a predetermined price or yield, with payment and delivery taking place beyond the customary settlement period. When delayed delivery purchases are outstanding, the Fund will designate liquid assets in an amount sufficient to meet the purchase price. When purchasing a security on a delayed delivery basis, the Fund assumes the rights and risks of ownership of the security, including the risk of price and yield fluctuations, and takes such fluctuations into account when determining its NAV. The Fund may dispose of or renegotiate a delayed delivery transaction after it is entered into, and may sell delayed delivery securities before they are delivered, which may result in a realized gain or loss. When the Fund has sold a security it owns on a delayed delivery basis, the Fund does not
Notes to Financial Statements (Unaudited) (continued)
participate in future gains and losses with respect to the security. As of April 30, 2021, delayed delivery transactions are shown in the Portfolio of Investments.
(O) Foreign Securities Risk. The ability of issuers of debt securities held by the Fund to meet their obligations may be affected by, among other things, economic or political developments in a specific country, industry or region. Debt securities are also subject to the risks associated with changes in interest rates. The Fund may invest in foreign securities, which carry certain risks that are in addition to the usual risks inherent in domestic securities. These risks include those resulting from currency fluctuations, future adverse political or economic developments and possible imposition of currency exchange blockages or other foreign governmental laws or restrictions. These risks are likely to be greater in emerging markets than in developed markets. The ability of issuers of debt securities held by the Fund to meet their obligations may be affected by, among other things, economic or political developments in a specific country, industry or region.
(P) LIBOR Replacement Risk. The Fund may invest in certain debt securities, derivatives or other financial instruments that utilize the London Interbank Offered Rate ("LIBOR"), as a “benchmark” or “reference rate” for various interest rate calculations. The United Kingdom Financial Conduct Authority, which regulates LIBOR, announced that after 2021 it will cease its active encouragement of banks to provide the quotations needed to sustain LIBOR. However, it is possible that certain LIBOR tenors may continue beyond 2021 and the most widely used LIBOR tenors may continue until mid-2023. As a result, it is anticipated that LIBOR will be discontinued or will no longer be sufficiently robust to be representative of its underlying market around that time. Although financial regulators and industry working groups have suggested alternative reference rates, such as European Interbank Offer Rate (“EURIBOR”), Sterling Overnight Interbank Average Rate (“SONIA”) and Secured Overnight Financing Rate (“SOFR”), there are challenges to converting certain contracts and transactions to a new benchmark and neither the full effects of the transition process nor its ultimate outcome is known. New York Life Investments is currently working to assess exposure and will modify contracts as necessary.
The elimination of LIBOR or changes to other reference rates or any other changes or reforms to the determination or supervision of reference rates could have an adverse impact on the market for, or value of, any securities or payments linked to those reference rates, which may adversely affect the Fund's performance and/or net asset value. Uncertainty and risk also remain regarding the willingness and ability of issuers and lenders to include revised provisions in new and existing contracts or instruments. Consequently, the transition away from LIBOR to other reference rates may lead to increased volatility and illiquidity in markets that are tied to LIBOR, fluctuations in values of LIBOR-related investments or investments in issuers that utilize LIBOR, increased difficulty in borrowing or refinancing and diminished effectiveness of hedging strategies, adversely affecting the Fund's performance. Furthermore, the risks associated with the expected discontinuation of
LIBOR and transition may be exacerbated if the work necessary to effect an orderly transition to an alternative reference rate is not completed in a timely manner. Because the usefulness of LIBOR as a benchmark could deteriorate during the transition period, these effects could occur prior to the end of 2021 with respect to certain LIBOR tenors or mid-2023 for the remaining LIBOR tenors.
(Q) Large Transaction Risks. From time to time, the Fund may receive large purchase or redemption orders from affiliated or unaffiliated mutual funds or other investors. Such large transactions could have adverse effects on the Fund’s performance if the Fund were required to sell securities or invest cash at times when it otherwise would not do so. This activity could also accelerate the realization of capital gains and increase the Fund’s transaction costs. The Fund has adopted procedures designed to mitigate the negative impacts of such large transactions, but there can be no assurance that these procedures will be effective.
(R) Indemnifications. Under the Trust’s organizational documents, its officers and trustees are indemnified against certain liabilities that may arise out of performance of their duties to the Trust. Additionally, in the normal course of business, the Fund enters into contracts with third-party service providers that contain a variety of representations and warranties and that may provide general indemnifications. The Fund's maximum exposure under these arrangements is unknown, as this would involve future claims that may be made against the Fund that have not yet occurred. The Manager believes that the risk of loss in connection with these potential indemnification obligations is remote. However, there can be no assurance that material liabilities related to such obligations will not arise in the future, which could adversely impact the Fund.
(S) Quantitative Disclosure of Derivative Holdings. The following tables show additional disclosures related to the Fund's derivative and hedging activities, including how such activities are accounted for and their effect on the Fund's financial positions, performance and cash flows.
In order to keep the Fund nearly fully invested, while maintaining a short duration posture, the Fund executed a duration tilt with U.S. Treasury futures. The Fund entered into futures contracts to help manage the duration and yield curve positioning of the portfolio while minimizing the exposure to wider bid/ask spreads in traditional bonds. These derivatives are not accounted for as hedging instruments.
| 44 | MainStay MacKay Total Return Bond Fund |
Fair value of derivative instruments as of April 30, 2021:
| Asset Derivatives | Foreign
Exchange
Contracts
Risk | Interest
Rate
Contracts
Risk | Total |
| Futures Contracts - Net Assets—Net unrealized appreciation on futures contracts (a) | $ — | $813,523 | $813,523 |
| Forward Contracts - Unrealized appreciation on foreign currency forward contracts | 69,319 | — | 69,319 |
| Total Fair Value | $69,319 | $813,523 | $882,842 |
| (a) | Includes cumulative appreciation (depreciation) of futures contracts as reported in the Portfolio of Investments. Only current day’s variation margin is reported within the Statement of Assets and Liabilities. |
| Liability Derivatives | Interest
Rate
Contracts
Risk | Total |
| Futures Contracts - Net Assets—Net unrealized depreciation on futures contracts (a) | $(517,450) | $(517,450) |
| Total Fair Value | $(517,450) | $(517,450) |
| (a) | Includes cumulative appreciation (depreciation) of futures contracts as reported in the Portfolio of Investments. Only current day’s variation margin is reported within the Statement of Assets and Liabilities. |
The effect of derivative instruments on the Statement of Operations for the six-month period ended April 30, 2021:
| Net Realized Gain (Loss) from: | Foreign
Exchange
Contracts
Risk | Interest
Rate
Contracts
Risk | Total |
| Futures Contracts | $ — | $337,012 | $ 337,012 |
| Forward Contracts | (222,865) | — | (222,865) |
| Total Net Realized Gain (Loss) | $(222,865) | $337,012 | $ 114,147 |
| Net Change in Unrealized Appreciation (Depreciation) | Foreign
Exchange
Contracts
Risk | Interest
Rate
Contracts
Risk | Total |
| Futures Contracts | $ — | $(361,608) | $(361,608) |
| Forward Contracts | 140,318 | — | 140,318 |
| Total Net Change in Unrealized Appreciation (Depreciation) | $140,318 | $(361,608) | $(221,290) |
| Average Notional Amount | Total |
| Futures Contracts Long | $230,900,104 |
| Futures Contracts Short | $ (85,358,803) |
| Forward Contracts Long | $ 3,835,404 |
| Forward Contracts Short | $ (5,095,831) |
Note 3–Fees and Related Party Transactions
(A) Manager and Subadvisor. New York Life Investments, a registered investment adviser and an indirect, wholly-owned subsidiary of New York Life Insurance Company ("New York Life"), serves as the Fund's Manager, pursuant to an Amended and Restated Management Agreement ("Management Agreement"). The Manager provides offices, conducts clerical, recordkeeping and bookkeeping services and keeps most of the financial and accounting records required to be maintained by the Fund. Except for the portion of salaries and expenses that are the responsibility of the Fund, the Manager pays the salaries and expenses of all personnel affiliated with the Fund and certain operational expenses of the Fund. The Fund reimburses New York Life Investments in an amount equal to the portion of the compensation of the Chief Compliance Officer attributable to the Fund. MacKay Shields LLC ("MacKay Shields" or the "Subadvisor"), a registered investment adviser and an indirect, wholly-owned subsidiary of New York Life, serves as Subadvisor to the Fund and is responsible for the day-to-day portfolio management of the Fund. Pursuant to the terms of an Amended and Restated Subadvisory Agreement ("Subadvisory Agreement") between New York Life Investments and MacKay Shields, New York Life Investments pays for the services of the Subadvisor.
Pursuant to the Management Agreement, the Fund pays the Manager a monthly fee for the services performed and the facilities furnished at an annual rate of the Fund’s average daily net assets as follows: 0.50% up to $1 billion; 0.475% from $1 billion to $3 billion; and 0.465% in excess of $3 billion. During the six-month period ended April 30, 2021, the effective management fee rate was 0.49% of the Fund’s average daily net assets, exclusive of any applicable waivers/reimbursements.
New York Life Investments has contractually agreed to waive fees and/or reimburse expenses so that Total Annual Fund Operating Expenses (excluding taxes, interest, litigation, extraordinary expenses, brokerage and other transaction expenses relating to the purchase or sale of portfolio investments and acquired (underlying) fund fees and expenses) do not exceed the following percentages of daily net assets: 0.88% for Class A shares and 0.60% for Class I shares. New York Life Investments will apply an equivalent waiver or reimbursement, in an equal number of basis points of the Class A shares waiver/reimbursement to Investor Class shares, Class B shares, Class C shares, Class R1 shares, Class R2 shares, Class R3 shares and SIMPLE Class shares. New York Life Investments has also contractually agreed to waive fees and/or reimburse expenses so that Total Annual Fund Operating Expenses (excluding taxes, interest, litigation, extraordinary expenses, brokerage and other transaction expenses relating to the purchase or sale of portfolio investments, and acquired (underlying) fund fees and expenses) of Class R6 do not exceed those of Class I. These agreements will remain in effect until February 28, 2022, and shall renew automatically for one-year terms unless New York Life Investments provides written notice of termination prior to the start of the next term or upon approval of the Board.
Additionally, New York Life Investments has agreed to further voluntarily waive fees and/or reimburse expenses of the appropriate class of the
Notes to Financial Statements (Unaudited) (continued)
Fund so that Total Annual Fund Operating Expenses (excluding taxes, interest, litigation, extraordinary expenses, brokerage and other transaction expenses relating to the purchase and sale of portfolio investments, and acquired (underlying) fund fees and expenses) of Class R1, Class R2 and Class R3 shares of the Fund do not exceed 0.70%, 0.95% and 1.20%, respectively, of the Fund’s average daily net assets. This voluntary waiver or reimbursement may be discontinued at any time without notice.
During the six-month period ended April 30, 2021, New York Life Investments earned fees from the Fund in the amount of $3,715,345 and paid the Subadvisor fees in the amount of $1,857,563. There were no waived fees and/or reimbursed expenses.
JPMorgan provides sub-administration and sub-accounting services to the Fund pursuant to an agreement with New York Life Investments. These services include calculating the daily NAVs of the Fund, maintaining the general ledger and sub-ledger accounts for the calculation of the Fund's NAVs, and assisting New York Life Investments in conducting various aspects of the Fund's administrative operations. For providing these services to the Fund, JPMorgan is compensated by New York Life Investments.
Prior to November 23, 2020, these services were provided by State Street.
Pursuant to an agreement between the Trust and New York Life Investments, New York Life Investments is responsible for providing or procuring certain regulatory reporting services for the Fund. The Fund will reimburse New York Life Investments for the actual costs incurred by New York Life Investments in connection with providing or procuring these services for the Fund.
(B) Distribution and Service Fees. The Trust, on behalf of the Fund, has entered into a distribution agreement with NYLIFE Distributors LLC (the “Distributor”), an affiliate of New York Life Investments. The Fund has adopted distribution plans (the “Plans”) in accordance with the provisions of Rule 12b-1 under the 1940 Act.
The Plans provide that the distribution and service fees are payable to the Distributor regardless of the amounts actually expended by the Distributor for distribution of the Fund's shares and service activities.
In accordance with the Shareholder Services Plans for the Class R1, Class R2 and Class R3 shares, the Manager has agreed to provide, through its affiliates or independent third parties, various shareholder and administrative support services to shareholders of the Class R1, Class R2 and Class R3 shares. For its services, the Manager, its affiliates or independent third-party service providers are entitled to a shareholder service fee accrued daily and paid monthly at an annual rate of 0.10% of the average daily net assets of the Class R1, Class R2 and Class R3 shares. This is in addition to any fees paid under the Class R2 and Class R3 Plans.
During the six-month period ended April 30, 2021, shareholder service fees incurred by the Fund were as follows:
| |
| Class R1 | $ 14 |
| Class R2 | 23 |
| Class R3 | 167 |
(C) Sales Charges. The Fund was advised by the Distributor that the amount of initial sales charges retained on sales of Class A and Investor Class shares during the six-month period ended April 30, 2021, were $18,857 and $1,204, respectively.
(D) Transfer, Dividend Disbursing and Shareholder Servicing Agent. NYLIM Service Company LLC, an affiliate of New York Life Investments, is the Fund's transfer, dividend disbursing and shareholder servicing agent pursuant to an agreement between NYLIM Service Company LLC and the Trust. NYLIM Service Company LLC has entered into an agreement with DST Asset Manager Solutions, Inc. ("DST"), pursuant to which DST performs certain transfer agent services on behalf of NYLIM Service Company LLC. New York Life Investments has contractually agreed to limit the transfer agency expenses charged to the Fund’s share classes to a maximum of 0.35% of that share class’s average daily net assets on an annual basis after deducting any applicable Fund or class-level expense reimbursement or small account fees. This agreement will remain in effect until February 28, 2022, and shall renew automatically for one-year terms unless New York Life Investments provides written notice of termination prior to the start of the next term or upon approval of the Board. During the six-month period ended April 30, 2021, transfer agent expenses incurred by the Fund and any reimbursements, pursuant to the aforementioned Transfer Agency expense limitation agreement, were as follows:
| Class | Expense | Waived |
| Class A | $ 33,690 | $— |
| Investor Class | 8,640 | — |
| Class B | 1,817 | — |
| Class C | 19,535 | — |
| Class I | 241,619 | — |
| Class R1 | 11 | — |
| Class R2 | 15 | — |
| Class R3 | 116 | — |
| Class R6 | 13,869 | — |
| SIMPLE Class | 29 | — |
(E) Small Account Fee. Shareholders with small accounts adversely impact the cost of providing transfer agency services. In an effort to reduce total transfer agency expenses, the Fund has implemented a small account fee on certain types of accounts. As described in the Fund's prospectus, certain shareholders with an account balance of less than $1,000 ($5,000 for Class A share accounts) are charged an annual per account fee of $20 (assessed semi-annually), the proceeds from which offset transfer agent fees as reflected in the Statement of Operations.
| 46 | MainStay MacKay Total Return Bond Fund |
This small account fee will not apply to certain types of accounts as described further in the Fund’s prospectus.
(F) Investments in Affiliates (in 000’s). During the six-month period ended April 30, 2021, purchases and sales transactions, income earned from investments and shares held of investment companies managed by New York Life Investments or its affiliates were as follows:
| Affiliated Investment Companies | Value,
Beginning
of Period | Purchases
at Cost | Proceeds
from
Sales | Net
Realized
Gain/(Loss)
on Sales | Change in
Unrealized
Appreciation/
(Depreciation) | Value,
End of
Period | Dividend
Income | Other
Distributions | Shares
End of
Period |
| MainStay U.S. Government Liquidity Fund | $ 46,576 | $ 331,665 | $ (320,397) | $ — | $ — | $ 57,844 | $ 3 | $ — | 57,844 |
(G) Capital. As of April 30, 2021, New York Life and its affiliates beneficially held shares of the Fund with the values and percentages of net assets as follows:
| Class R1 | $28,840 | 99.8% |
| Class R2 | 32,805 | 99.8 |
| Class R3 | 30,433 | 8.9 |
| Class R6 | 31,426 | 0.0 |
| SIMPLE Class | 24,829 | 99.8 |
Note 4-Federal Income Tax
As of April 30, 2021, the cost and unrealized appreciation (depreciation) of the Fund’s investment portfolio, including applicable derivative contracts and other financial instruments, as determined on a federal income tax basis, were as follows:
| | Federal Tax
Cost | Gross
Unrealized
Appreciation | Gross
Unrealized
(Depreciation) | Net
Unrealized
Appreciation/
(Depreciation) |
| Investments | $1,438,914,341 | $56,350,917 | $(12,921,203) | $43,429,714 |
During the year ended October 31, 2020, the tax character of distributions paid as reflected in the Statements of Changes in Net Assets was as follows:
| | 2020 |
| Distributions paid from: | |
| Ordinary Income | $35,535,816 |
Note 5–Custodian
JPMorgan is the custodian of cash and securities held by the Fund. Custodial fees are charged to the Fund based on the Fund's net assets and/or the market value of securities held by the Fund and the number of certain transactions incurred by the Fund.
Prior to November 23, 2020, these services were provided by State Street. The services provided by State Street were a direct expense of the Fund and are included in the Statement of Operations as Custodian fees which totaled $2,344 for the period November 1, 2020 through November 22, 2020.
Note 6–Line of Credit
The Fund and certain other funds managed by New York Life Investments maintain a line of credit with a syndicate of banks in order to secure a source of funds for temporary purposes to meet unanticipated or excessive redemption requests.
Effective July 28, 2020, under the credit agreement (the “Credit Agreement”), the aggregate commitment amount is $600,000,000 with an additional uncommitted amount of $100,000,000. The commitment fee is an annual rate of 0.15% of the average commitment amount payable quarterly, regardless of usage, to JPMorgan, who serves as the agent to the syndicate. The commitment fee is allocated among the Fund and certain other funds managed by New York Life Investments based upon their respective net assets and other factors. Interest on any revolving credit loan is charged based upon the Federal Funds Rate or the one-month London Interbank Offered Rate ("LIBOR"), whichever is higher. The Credit Agreement expires on July 27, 2021, although the Fund, certain other funds managed by New York Life Investments and the syndicate of banks may renew the Credit Agreement for an additional year on the same or different terms or enter into a credit agreement with a different syndicate of banks. Prior to July 28, 2020, the aggregate commitment amount and the commitment fee were the same as those under the current Credit Agreement, but State Street served as agent to the syndicate. During the six-month period ended April 30, 2021, there were no borrowings made or outstanding with respect to the Fund under the Credit Agreement or the credit agreement for which State Street served as agent.
Note 7–Interfund Lending Program
Pursuant to an exemptive order issued by the SEC, the Fund, along with certain other funds managed by New York Life Investments, may participate in an interfund lending program. The interfund lending program provides an alternative credit facility that permits the Fund and certain other funds managed by New York Life Investments to lend or borrow money for temporary purposes directly to or from one another, subject to the conditions of the exemptive order. During the six-month period ended April 30, 2021, there were no interfund loans made or outstanding with respect to the Fund.
Notes to Financial Statements (Unaudited) (continued)
Note 8–Purchases and Sales of Securities (in 000’s)
During the six-month period ended April 30, 2021, purchases and sales of U.S. government securities were $451,913 and $520,918, respectively. Purchases and sales of securities, other than U.S. government securities and short-term securities, were $286,698 and $253,905 respectively.
Note 9–Capital Share Transactions
Transactions in capital shares for the six-month period ended April 30, 2021 and the year ended October 31, 2020, were as follows:
| Class A | Shares | Amount |
| Period ended April 30, 2021: | | |
| Shares sold | 1,663,448 | $ 18,874,787 |
| Shares issued to shareholders in reinvestment of distributions | 179,547 | 2,037,538 |
| Shares redeemed | (1,677,939) | (18,876,724) |
| Net increase (decrease) in shares outstanding before conversion | 165,056 | 2,035,601 |
| Shares converted into Class A (See Note 1) | 155,679 | 1,739,402 |
| Net increase (decrease) | 320,735 | $ 3,775,003 |
| Year ended October 31, 2020: | | |
| Shares sold | 4,364,085 | $ 48,920,444 |
| Shares issued to shareholders in reinvestment of distributions | 139,978 | 1,563,529 |
| Shares redeemed | (1,641,401) | (18,280,554) |
| Net increase (decrease) in shares outstanding before conversion | 2,862,662 | 32,203,419 |
| Shares converted into Class A (See Note 1) | 154,863 | 1,724,553 |
| Shares converted from Class A (See Note 1) | (4,596) | (50,828) |
| Net increase (decrease) | 3,012,929 | $ 33,877,144 |
| |
| Investor Class | Shares | Amount |
| Period ended April 30, 2021: | | |
| Shares sold | 60,054 | $ 682,670 |
| Shares issued to shareholders in reinvestment of distributions | 13,588 | 155,059 |
| Shares redeemed | (58,769) | (668,091) |
| Net increase (decrease) in shares outstanding before conversion | 14,873 | 169,638 |
| Shares converted into Investor Class (See Note 1) | 50,044 | 561,162 |
| Shares converted from Investor Class (See Note 1) | (69,577) | (788,903) |
| Net increase (decrease) | (4,660) | $ (58,103) |
| Year ended October 31, 2020: | | |
| Shares sold | 271,891 | $ 3,040,611 |
| Shares issued to shareholders in reinvestment of distributions | 13,324 | 149,269 |
| Shares redeemed | (124,522) | (1,378,361) |
| Net increase (decrease) in shares outstanding before conversion | 160,693 | 1,811,519 |
| Shares converted into Investor Class (See Note 1) | 29,424 | 331,865 |
| Shares converted from Investor Class (See Note 1) | (126,019) | (1,412,571) |
| Net increase (decrease) | 64,098 | $ 730,813 |
| |
| Class B | Shares | Amount |
| Period ended April 30, 2021: | | |
| Shares sold | 9,736 | $ 109,960 |
| Shares issued to shareholders in reinvestment of distributions | 2,356 | 26,848 |
| Shares redeemed | (44,538) | (502,325) |
| Net increase (decrease) in shares outstanding before conversion | (32,446) | (365,517) |
| Shares converted from Class B (See Note 1) | (15,915) | (182,022) |
| Net increase (decrease) | (48,361) | $ (547,539) |
| Year ended October 31, 2020: | | |
| Shares sold | 33,861 | $ 373,748 |
| Shares issued to shareholders in reinvestment of distributions | 2,604 | 28,947 |
| Shares redeemed | (77,332) | (854,199) |
| Net increase (decrease) in shares outstanding before conversion | (40,867) | (451,504) |
| Shares converted from Class B (See Note 1) | (27,800) | (309,902) |
| Net increase (decrease) | (68,667) | $ (761,406) |
| |
| 48 | MainStay MacKay Total Return Bond Fund |
| Class C | Shares | Amount |
| Period ended April 30, 2021: | | |
| Shares sold | 131,840 | $ 1,506,724 |
| Shares issued to shareholders in reinvestment of distributions | 27,039 | 308,570 |
| Shares redeemed | (595,324) | (6,671,442) |
| Net increase (decrease) in shares outstanding before conversion | (436,445) | (4,856,148) |
| Shares converted from Class C (See Note 1) | (115,057) | (1,274,588) |
| Net increase (decrease) | (551,502) | $ (6,130,736) |
| Year ended October 31, 2020: | | |
| Shares sold | 1,156,557 | $ 12,889,926 |
| Shares issued to shareholders in reinvestment of distributions | 18,554 | 207,818 |
| Shares redeemed | (620,031) | (6,951,253) |
| Net increase (decrease) in shares outstanding before conversion | 555,080 | 6,146,491 |
| Shares converted from Class C (See Note 1) | (25,228) | (283,117) |
| Net increase (decrease) | 529,852 | $ 5,863,374 |
| |
| Class I | Shares | Amount |
| Period ended April 30, 2021: | | |
| Shares sold | 8,179,762 | $ 92,784,456 |
| Shares issued to shareholders in reinvestment of distributions | 1,469,795 | 16,678,801 |
| Shares redeemed | (6,234,495) | (70,846,847) |
| Net increase (decrease) | 3,415,062 | $ 38,616,410 |
| Year ended October 31, 2020: | | |
| Shares sold | 15,167,128 | $ 168,259,219 |
| Shares issued to shareholders in reinvestment of distributions | 1,706,197 | 18,986,074 |
| Shares redeemed | (50,277,250) | (548,717,800) |
| Net increase (decrease) in shares outstanding before conversion | (33,403,925) | (361,472,507) |
| Shares converted from Class I (See Note 1) | (2,981,884) | (34,261,845) |
| Net increase (decrease) | (36,385,809) | $(395,734,352) |
| |
| Class R1 | Shares | Amount |
| Period ended April 30, 2021: | | |
| Shares issued to shareholders in reinvestment of distributions | 59 | $ 667 |
| Net increase (decrease) | 59 | $ 667 |
| Year ended October 31, 2020: | | |
| Shares issued to shareholders in reinvestment of distributions | 64 | $ 708 |
| Net increase (decrease) | 64 | $ 708 |
| |
| Class R2 | Shares | Amount |
| Period ended April 30, 2021: | | |
| Shares issued to shareholders in reinvestment of distributions | 71 | $ 811 |
| Net increase (decrease) in shares outstanding before conversion | 71 | 811 |
| Shares converted from Class R2 (See Note 1) | (4,762) | (55,051) |
| Net increase (decrease) | (4,691) | $ (54,240) |
| Year ended October 31, 2020: | | |
| Shares issued to shareholders in reinvestment of distributions | 173 | $ 1,926 |
| Net increase (decrease) | 173 | $ 1,926 |
| |
| Class R3 | Shares | Amount |
| Period ended April 30, 2021: | | |
| Shares sold | 1,635 | $ 18,531 |
| Shares issued to shareholders in reinvestment of distributions | 306 | 3,472 |
| Shares redeemed | (222) | (2,527) |
| Net increase (decrease) | 1,719 | $ 19,476 |
| Year ended October 31, 2020: | | |
| Shares sold | 8,735 | $ 96,904 |
| Shares issued to shareholders in reinvestment of distributions | 268 | 2,994 |
| Shares redeemed | (3,038) | (34,629) |
| Net increase (decrease) | 5,965 | $ 65,269 |
| |
| Class R6 | Shares | Amount |
| Period ended April 30, 2021: | | |
| Shares sold | 5,142,179 | $ 58,265,984 |
| Shares issued to shareholders in reinvestment of distributions | 1,461,005 | 16,584,321 |
| Shares redeemed | (11,813,838) | (133,915,680) |
| Net increase (decrease) | (5,210,654) | $ (59,065,375) |
| Year ended October 31, 2020: | | |
| Shares sold | 49,412,201 | $ 543,454,918 |
| Shares issued to shareholders in reinvestment of distributions | 1,294,237 | 14,452,494 |
| Shares redeemed | (7,591,919) | (81,238,427) |
| Net increase (decrease) in shares outstanding before conversion | 43,114,519 | 476,668,985 |
| Shares converted into Class R6 (See Note 1) | 2,981,884 | 34,261,845 |
| Net increase (decrease) | 46,096,403 | $ 510,930,830 |
| |
Notes to Financial Statements (Unaudited) (continued)
| SIMPLE Class | Shares | Amount |
| Period ended April 30, 2021: | | |
| Shares issued to shareholders in reinvestment of distributions | 44 | $ 503 |
| Net increase (decrease) | 44 | $ 503 |
| Period ended October 31, 2020:(a) | | |
| Shares sold | 2,171 | $ 25,000 |
| Shares issued to shareholders in reinvestment of distributions | 6 | 73 |
| Net increase (decrease) | 2,177 | $ 25,073 |
| (a) | The inception date of the SIMPLE Class was August 31, 2020. |
Note 10–Recent Accounting Pronouncement
In March 2020, the Financial Accounting Standards Board issued Accounting Standards Update 2020-04 (“ASU 2020-04”), which provides optional guidance to ease the potential accounting burden associated with transitioning away from LIBOR and other reference rates that are expected to be discontinued. ASU 2020-04 was effective immediately upon release of the update on March 12, 2020 and remains effective through December 31, 2022. At this time, the Manager is evaluating the implications of certain other provisions of ASU 2020-04 related to new disclosure requirements and any impact on the financial statement disclosures has not yet been determined.
Note 11–Other Matters
An outbreak of COVID-19, first detected in December 2019, has developed into a global pandemic and has resulted in travel restrictions, closure of international borders, certain businesses and securities markets, restrictions on securities trading activities, prolonged quarantines, supply chain disruptions, and lower consumer demand, as well as general concern and uncertainty. The continued impact of COVID-19 is uncertain and could further adversely affect the global economy, national economies, individual issuers and capital markets in unforeseeable ways and result in a substantial and extended economic downturn. Developments that disrupt global economies and financial markets, such as COVID-19, may magnify factors that affect the Fund's performance.
Note 12–Subsequent Events
In connection with the preparation of the financial statements of the Fund as of and for the six-month period ended April 30, 2021, events and transactions subsequent to April 30, 2021, through the date the financial statements were issued have been evaluated by the Manager for possible adjustment and/or disclosure. No subsequent events requiring financial statement adjustment or disclosure have been identified.
| 50 | MainStay MacKay Total Return Bond Fund |
Board Consideration and Approval of Management Agreement and Subadvisory Agreement (Unaudited)
The continuation of the Management Agreement with respect to the MainStay MacKay Total Return Bond Fund (“Fund”) and New York Life Investment Management LLC (“New York Life Investments”) and the Subadvisory Agreement between New York Life Investments and MacKay Shields LLC (“MacKay”) with respect to the Fund (together, “Advisory Agreements”), following an initial term of up to two years, is subject to annual review and approval by the Board of Trustees of MainStay Funds Trust (“Board” of the “Trust”) in accordance with Section 15 of the Investment Company Act of 1940, as amended (“1940 Act”). At its December 9–10, 2020 meeting, the Board, including the Trustees who are not an “interested person” (as such term is defined in the 1940 Act) of the Trust (“Independent Trustees”) voting separately, unanimously approved the continuation of each of the Advisory Agreements for a one-year period.
In reaching the decision to approve the continuation of each of the Advisory Agreements, the Board considered information furnished by New York Life Investments and MacKay in connection with an annual contract review process undertaken by the Board that took place at meetings of the Board and its Contracts Committee during September 2020 through December 2020, as well as other information furnished to the Board and its Committees throughout the year, as deemed relevant by the Trustees. Information requested by and furnished to the Board for consideration in connection with the contract review process included, among other items, reports on the Fund and “peer funds” prepared by Strategic Insight Mutual Fund Research and Consulting, LLC (“Strategic Insight”), an independent third-party service provider engaged by the Board to report objectively on the Fund’s investment performance, management fee and total expenses. The Board also considered information on the fees charged to other investment advisory clients of New York Life Investments and/or MacKay that follow investment strategies similar to those of the Fund, if any, and, when applicable, the rationale for any differences in the Fund’s management and subadvisory fees and the fees charged to those other investment advisory clients. In addition, the Board considered information furnished by New York Life Investments and MacKay in response to requests prepared on behalf of the Board, and in consultation with the Independent Trustees, by independent legal counsel to the Independent Trustees, which encompassed a variety of topics, including those summarized below.
The Board took into account information provided in connection with its meetings throughout the year, including, among other items, information regarding the legal standards and fiduciary obligations applicable to its consideration of the continuation of each of the Advisory Agreements and investment performance reports on the Fund as well as presentations from New York Life Investments and MacKay personnel. The Board also took into account other information received from New York Life Investments throughout the year, including, among other items, periodic reports on legal and compliance matters, risk management, portfolio turnover, brokerage commissions and non-advisory services provided to the Fund by New York Life Investments. The contract review process, including the structure and format for materials provided to the Board, has been developed in consultation with the Board. The Independent
Trustees also met in executive sessions with their independent legal counsel and, for a portion thereof, with senior management of New York Life Investments.
In addition to information provided to the Board throughout the year, the Board received information in connection with its June 2020 meeting provided specifically in response to requests prepared on behalf of the Board, and in consultation with the Independent Trustees, by independent legal counsel regarding the Fund’s distribution arrangements. In addition, the Board received information regarding the Fund’s asset levels, share purchase and redemption activity and the payment of Rule 12b-1 and/or other fees by applicable share classes of the Fund, among other information.
In considering the continuation of each of the Advisory Agreements, the Trustees reviewed and evaluated the information and factors they believed to reasonably be necessary and appropriate in light of legal advice furnished to them by independent legal counsel and through the exercise of their own business judgment. Although individual Trustees may have weighed certain factors or information differently, the factors considered by the Board are described in greater detail below and include, among other factors: (i) the nature, extent and quality of the services provided to the Fund by New York Life Investments and MacKay; (ii) the qualifications of the portfolio managers of the Fund and the historical investment performance of the Fund, New York Life Investments and MacKay; (iii) the costs of the services provided, and profits realized, by New York Life Investments and MacKay from their relationships with the Fund; (iv) the extent to which economies of scale have been realized or may be realized as the Fund grows and the extent to which economies of scale have benefited or may benefit the Fund’s shareholders; and (v) the reasonableness of the Fund’s management and subadvisory fees and total ordinary operating expenses. Although the Board recognized that comparisons between the Fund’s fees and expenses and those of other funds are imprecise given different terms of agreements, variations in fund strategies and other factors, the Board considered the reasonableness of the Fund’s management fee and total ordinary operating expenses as compared to the peer funds identified by Strategic Insight. Throughout their considerations, the Trustees acknowledged the commitment of New York Life Investments and its affiliates to serve the MainStay Group of Funds, as well as their capacity, experience, resources, financial stability and reputations. The Trustees also acknowledged the entrepreneurial and other risks assumed by New York Life Investments in sponsoring and managing the Fund.
The Trustees noted that, throughout the year, the Trustees are afforded an opportunity to ask questions of, and request additional information or materials from, New York Life Investments and MacKay. The Board’s decision with respect to each of the Advisory Agreements may have also been based, in part, on the Board’s knowledge of New York Life Investments and MacKay resulting from, among other things, the Board’s consideration of each of the Advisory Agreements in prior years, the advisory agreements for other funds in the MainStay Group of Funds, the Board’s review throughout the year of the performance and operations of other funds in the MainStay Group of Funds and each Trustee’s business
Board Consideration and Approval of Management Agreement and Subadvisory Agreement (Unaudited) (continued)
judgment and industry experience. In addition to considering the above-referenced factors, the Board observed that in the marketplace there are a range of investment options available to the Fund’s shareholders and such shareholders, having had the opportunity to consider other investment options, have chosen to invest in the Fund.
The factors that figured prominently in the Board’s decision to approve the continuation of each of the Advisory Agreements during its December 9–10, 2020 meeting are summarized in more detail below, and the Board did not consider any factor or information controlling in reaching such decision.
Nature, Extent and Quality of Services Provided by New York Life Investments and MacKay
The Board examined the nature, extent and quality of the services that New York Life Investments provides to the Fund. The Board evaluated New York Life Investments’ experience and capabilities in serving as manager of the Fund and considered that the Fund operates in a “manager-of-managers” structure. The Board also considered New York Life Investments’ responsibilities and services provided pursuant to this structure, including evaluating the performance of MacKay, making recommendations to the Board as to whether the Subadvisory Agreement should be renewed, modified or terminated and periodically reporting to the Board regarding the results of New York Life Investments’ evaluation and monitoring functions. The Board noted that New York Life Investments manages other mutual funds, serves a variety of other investment advisory clients, including other pooled investment vehicles, and has experience overseeing mutual fund service providers, including subadvisors. The Board considered the experience of senior personnel at New York Life Investments providing management and administrative and other non-advisory services to the Fund as well as New York Life Investments’ reputation and financial condition. The Board observed that New York Life Investments devotes significant resources and time to providing management and non-advisory services to the Fund, including New York Life Investments’ supervision and due diligence reviews of MacKay and ongoing analysis of, and interactions with, MacKay with respect to, among other things, the Fund’s investment performance and risks as well as MacKay’s investment capabilities and subadvisory services with respect to the Fund.
The Board also considered the range of services that New York Life Investments provides to the Fund under the terms of the Management Agreement, including: (i) fund accounting and ongoing supervisory services provided by New York Life Investments’ Fund Administration and Accounting Group; (ii) investment supervisory and analytical services provided by New York Life Investments’ Investment Consulting Group; (iii) compliance services provided by the Trust’s Chief Compliance Officer as well as New York Life Investments’ compliance department, including supervision and implementation of the Fund’s compliance program; (iv) legal services provided by New York Life Investments’ Office of the General Counsel; and (v) risk management monitoring and analysis by compliance and investment personnel. The Board noted that New York Life Investments provides certain other non-advisory services to the Fund.
In addition, the Board considered New York Life Investments’ willingness to invest in personnel, infrastructure, technology, operational enhancements, cyber security, information security, shareholder privacy resources and business continuity planning designed to benefit the Fund and noted that New York Life Investments is responsible for compensating the Trust’s officers, except for a portion of the salary of the Trust’s Chief Compliance Officer. The Board recognized that New York Life Investments has provided an increasingly broad array of non-advisory services to the MainStay Group of Funds as a result of regulatory and other developments, including in connection with the designation of New York Life Investments as the administrator of the MainStay Group of Funds’ liquidity risk management program adopted under the 1940 Act. The Board considered benefits to shareholders from being part of the MainStay Group of Funds, including the privilege of exchanging investments between the same class of shares of funds in the MainStay Group of Funds, including without the imposition of a sales charge (if any).
The Board also examined the nature, extent and quality of the investment advisory services that MacKay provides to the Fund and considered the terms of each of the Advisory Agreements. The Board evaluated MacKay’s experience in serving as subadvisor to the Fund and advising other portfolios and MacKay’s track record and experience in providing investment advisory services, the experience of investment advisory, senior management and administrative personnel at MacKay and New York Life Investments’ and MacKay’s overall resources, legal and compliance environment, capabilities and history. In addition to information provided in connection with quarterly meetings with the Trust’s Chief Compliance Officer, the Board considered information regarding the compliance policies and procedures of New York Life Investments and MacKay and acknowledged their commitment to further developing and strengthening compliance programs relating to the Fund. The Board reviewed MacKay’s ability to attract and retain qualified investment professionals and willingness to invest in personnel to service and support the Fund. In this regard, the Board considered the experience of the Fund’s portfolio managers, the number of accounts managed by the portfolio managers and the method for compensating the portfolio managers.
In addition, the Board considered discussions with New York Life Investments regarding the implementation of its business continuity plans and recognized steps taken by New York Life Investments and MacKay to continue to provide the same nature, extent and quality of services to the Fund during the COVID-19 pandemic.
Based on these considerations, the Board concluded that the Fund would likely continue to benefit from the nature, extent and quality of these services.
Investment Performance
In evaluating the Fund’s investment performance, the Board considered investment performance results over various periods in light of the Fund’s investment objective, strategies and risks. The Board considered
| 52 | MainStay MacKay Total Return Bond Fund |
investment reports on, and analysis of, the Fund’s performance provided to the Board throughout the year. These reports include, among other items, information on the Fund’s gross and net returns, the Fund’s investment performance compared to relevant investment categories and the Fund’s benchmark, the Fund’s risk-adjusted investment performance and the Fund’s investment performance as compared to peer funds, as appropriate, as well as portfolio attribution information and commentary on the effect of market conditions. The Board also considered information provided by Strategic Insight showing the investment performance of the Fund as compared to peer funds.
The Board also gave weight to its discussions with senior management at New York Life Investments concerning the Fund’s investment performance attributable to MacKay as well as discussions between the Fund’s portfolio managers and the members of the Board’s Investment Committee, which generally occur on an annual basis. In addition, the Board considered any specific actions that New York Life Investments or MacKay had taken, or had agreed to take, to seek to enhance Fund investment performance and the results of those actions.
Based on these considerations, the Board concluded that its review of the Fund’s investment performance and related information supported a determination to approve the continuation of each of the Advisory Agreements.
Costs of the Services Provided, and Profits Realized, by New York Life Investments and MacKay
The Board considered the costs of the services provided under each of the Advisory Agreements. The Board also considered the profits realized by New York Life Investments and its affiliates, including MacKay, due to their relationships with the Fund. Because MacKay is an affiliate of New York Life Investments whose subadvisory fee is paid by New York Life Investments, not the Fund, the Board considered cost and profitability information for New York Life Investments and MacKay in the aggregate.
In addition, the Board acknowledged the difficulty in obtaining reliable comparative data about mutual fund managers’ profitability because such information generally is not publicly available and may be impacted by numerous factors, including the structure of a fund manager’s organization, the types of funds it manages, the methodology used to allocate certain fixed costs to specific funds and the manager’s capital structure and costs of capital.
In evaluating the costs of the services provided by New York Life Investments and MacKay and profits realized by New York Life Investments and its affiliates, including MacKay, the Board considered, among other factors, each party’s continuing investments in, or willingness to invest in, personnel, systems, equipment and other resources and infrastructure to support and further enhance the management of the Fund, and that New York Life Investments is responsible for paying the subadvisory fee for the Fund. The Board also considered the financial resources of New York Life Investments and MacKay and acknowledged that New York Life Investments and MacKay must be in a position to attract and retain experienced professional
personnel and to maintain a strong financial position for New York Life Investments and MacKay to continue to provide high-quality services to the Fund. The Board recognized that the Fund benefits from the allocation of certain fixed costs among the funds in the MainStay Group of Funds, among other expected benefits resulting from its relationship with New York Life Investments.
The Board considered information regarding New York Life Investments’ methodology for calculating profitability and allocating costs provided by New York Life Investments in connection with the fund profitability analysis presented to the Board. The Board previously engaged an independent consultant to review the methods used to allocate costs among the funds in the MainStay Group of Funds. The Board noted that the independent consultant had concluded that New York Life Investments’ methods for allocating costs and procedures for estimating overall profitability of the relationship with the funds in the MainStay Group of Funds are reasonable and that New York Life Investments continued to use the same method of calculating profit and allocating costs since the independent consultant’s review. The Board recognized the difficulty in calculating and evaluating a manager’s profitability with respect to the Fund and noted that other profitability methodologies may also be reasonable.
The Board also considered certain fall-out benefits that may be realized by New York Life Investments and its affiliates due to their relationships with the Fund, including reputational and other indirect benefits. In addition, the Board considered its review of a money market fund advised by New York Life Investments and an affiliated subadvisor that serves as an investment option for the Fund, including the potential rationale for and costs associated with investments in this money market fund by the Fund, if any, and considered information from New York Life Investments that the nature and type of specific investment advisory services provided to this money market fund are distinct from, or in addition to, the investment advisory services provided to the Fund.
The Board observed that, in addition to fees earned by New York Life Investments for managing the Fund, New York Life Investments’ affiliates also earn revenues from serving the Fund in various other capacities, including as the Fund’s transfer agent and distributor. The Board considered information about these other revenues and their impact on the profitability of the relationship with the Fund to New York Life Investments and its affiliates. The Board noted that, although it assessed the overall profitability of the Fund to New York Life Investments and its affiliates as part of the contract review process, when considering the reasonableness of the fee paid to New York Life Investments and its affiliates under each of the Advisory Agreements, the Board considered the profitability of New York Life Investments’ relationship with the Fund on a pre-tax basis and without regard to distribution expenses incurred by New York Life Investments from its own resources.
After evaluating the information deemed relevant by the Trustees, the Board concluded that any profits realized by New York Life Investments and its affiliates, including MacKay, due to their relationships with the Fund were not excessive.
Board Consideration and Approval of Management Agreement and Subadvisory Agreement (Unaudited) (continued)
Management and Subadvisory Fees and Total Ordinary Operating Expenses
The Board evaluated the reasonableness of the fee paid under each of the Advisory Agreements and the Fund’s total ordinary operating expenses. The Board primarily considered the reasonableness of the management fee paid by the Fund to New York Life Investments, because the subadvisory fee paid to MacKay is paid by New York Life Investments, not the Fund. The Board also considered the reasonableness of the subadvisory fee paid by New York Life Investments and the amount of the management fee retained by New York Life Investments.
In assessing the reasonableness of the Fund’s fees and expenses, the Board primarily considered comparative data provided by Strategic Insight on the fees and expenses charged by similar mutual funds managed by other investment advisers. In addition, the Board considered information provided by New York Life Investments and MacKay on fees charged to other investment advisory clients, including institutional separate accounts and/or other funds that follow investment strategies similar to those of the Fund, if any. The Board considered the similarities and differences in the contractual management fee schedules of the Fund and these similarly-managed accounts and/or funds, taking into account the rationale for any differences in fee schedules. The Board also took into account explanations provided by New York Life Investments about the more extensive scope of services provided to registered investment companies, such as the Fund, as compared with other investment advisory clients. Additionally, the Board considered the impact of contractual breakpoints, voluntary waivers and expense limitation arrangements on the Fund’s net management fee and expenses. The Board also considered that in proposing fees for the Fund, New York Life Investments considers the competitive marketplace for mutual funds.
The Board noted that, outside of the Fund’s management fee and the fees charged under a share class’s Rule 12b-1 and/or shareholder services plans, a share class’s most significant “other expenses” are transfer agent fees. Transfer agent fees are charged to the Fund based on the number of shareholder accounts (a “per-account” fee). The Board took into account information from New York Life Investments regarding the reasonableness of the Fund’s transfer agent fee schedule, including industry data demonstrating that the per-account fees that NYLIM Service Company LLC, an affiliate of New York Life Investments and the Fund’s transfer agent, charges the Fund are within the range of per-account fees charged by transfer agents to other mutual funds. In addition, the Board considered NYLIM Service Company LLC’s profitability in connection with the transfer agent services it provides to the Fund. The Board also took into account information received from NYLIM Service Company LLC regarding the sub-transfer agency payments it made to intermediaries in connection with the provision of sub-transfer agency services to the Fund.
The Board considered that, because the Fund’s transfer agent fees are billed on a per-account basis, the impact of transfer agent fees on a share class’s expense ratio may be more significant in cases where the share class has a high number of small accounts. The Board considered
the extent to which transfer agent fees comprised total expenses of the Fund. The Board acknowledged the role that the MainStay Group of Funds historically has played in serving the investment needs of New York Life Insurance Company customers, who often maintain smaller account balances than other shareholders of funds, and the impact of small accounts on the expense ratios of Fund share classes. The Board also recognized measures that it and New York Life Investments have taken to mitigate the effect of small accounts on the expense ratios of Fund share classes, including through the imposition of an expense limitation on net transfer agency expenses. The Board noted that, for purposes of allocating transfer agency fees and expenses, each retail fund in the MainStay Group of Funds combines the shareholder accounts of its Class A, A2, I, R1, R2 and R3 shares (as applicable) into one group and the shareholder accounts of its Investor Class, SIMPLE Class and Class B, C and C2 shares (as applicable) into another group. The Board also noted that the per-account fees attributable to each group of share classes is then allocated among the constituent share classes based on relative net assets and that a MainStay Fund’s Class R6 shares, if any, are not combined with any other share class for this purpose. The Board considered New York Life Investments’ rationale with respect to these groupings and previously received a report from an independent consultant engaged to conduct comparative analysis of these groupings. The Board also considered that NYLIM Service Company LLC had waived its contractual cost of living adjustments during the past seven years.
Based on the factors outlined above, the Board concluded that the Fund’s management fee and total ordinary operating expenses were within a range that is competitive and support a conclusion that these fees and expenses are reasonable.
Economies of Scale
The Board considered information regarding economies of scale, including whether the Fund’s expense structure permits economies of scale to be appropriately shared with the Fund’s shareholders. The Board also considered a report from New York Life Investments, previously prepared at the request of the Board, that addressed economies of scale, including with respect to the mutual fund business generally and the various ways in which the benefits of economies of scale may be shared with the funds in the MainStay Group of Funds. Although the Board recognized the difficulty of determining economies of scale with precision, the Board acknowledged that economies of scale may be shared with the Fund in a number of ways, including, for example, through the imposition of management fee breakpoints, initially setting management fee rates at scale or making additional investments to enhance services. The Board reviewed information from New York Life Investments showing how the Fund’s management fee schedule compared to fee schedules of other funds and accounts managed by New York Life Investments. The Board also reviewed information from Strategic Insight showing how the Fund’s management fee schedule compared with fees paid for similar services by peer funds at varying asset levels.
| 54 | MainStay MacKay Total Return Bond Fund |
Based on this information, the Board concluded that economies of scale are appropriately reflected for the benefit of the Fund’s shareholders through the Fund’s expense structure and other methods to share benefits from economies of scale.
Conclusion
On the basis of the information and factors summarized above, among other information and factors deemed relevant by the Trustees, and the evaluation thereof, the Board, including the Independent Trustees voting separately, unanimously voted to approve the continuation of each of the Advisory Agreements.
Discussion of the Operation and Effectiveness of the Fund's Liquidity Risk Management Program (Unaudited)
In compliance with Rule 22e-4 under the Investment Company Act of 1940, as amended (the “Liquidity Rule”), the Fund has adopted and implemented a liquidity risk management program (the “Program”), which New York Life Investment Management LLC believes is reasonably designed to assess and manage the Fund's liquidity risk (the risk that the Fund could not meet requests to redeem shares issued by the Fund without significant dilution of remaining investors’ interests in the Fund). The Board of Trustees of MainStay Funds Trust (the "Board") designated New York Life Investment Management LLC as administrator of the Program (the “Administrator”). The Administrator has established a Liquidity Risk Management Committee to assist the Administrator in the implementation and day-to-day administration of the Program and to otherwise support the Administrator in fulfilling its responsibilities under the Program.
At a meeting of the Board held on March 8, 2021, the Administrator provided the Board with a written report addressing the Program’s operation and assessing its adequacy and effectiveness of implementation for the period from January 1, 2020 through December 31, 2020 (the "Review Period"), as required under the Liquidity Rule. The report noted that the Administrator concluded that (i) the Program operated effectively to assess and manage the Fund's liquidity risk, (ii) the Program has been adequately and effectively implemented to monitor and, as applicable, respond to the Fund's liquidity developments and (iii) the Fund's investment strategy continues to be appropriate for an open-end fund. In addition, the report discussed notable events that impacted liquidity risk during the Review Period, including the COVID-19 pandemic and the resulting economic shutdown.
In accordance with the Program, the Fund's liquidity risk is assessed no less frequently than annually taking into consideration certain factors, as applicable, such as (i) investment strategy and liquidity of portfolio investments, (ii) short-term and long-term cash flow projections and (iii) holdings of cash and cash equivalents, as well as borrowing arrangements and other funding sources. Certain factors are considered under both normal and reasonably foreseeable stressed conditions.
Each Fund portfolio investment is classified into one of four liquidity categories. The classification is based on a determination of the number of days it is reasonably expected to take to convert the investment into cash, or sell or dispose of the investment, in current market conditions without significantly changing the market value of the investment. The Administrator has delegated liquidity classification determinations to the Fund’s subadvisor, subject to appropriate oversight by the Administrator, and classification determinations are made by taking into account the Fund's reasonably anticipated trade size, various market, trading and investment-specific considerations, as well as market depth, and, in certain cases, third-party vendor data.
The Liquidity Rule requires funds that do not primarily hold assets that are highly liquid investments to adopt a minimum amount of net assets that must be invested in highly liquid investments that are assets (an “HLIM”). In addition, the Liquidity Rule limits a fund's investments in illiquid investments. Specifically, the Liquidity Rule prohibits acquisition of illiquid investments if doing so would result in a fund holding more than 15% of its net assets in illiquid investments that are assets. The Program includes provisions reasonably designed to determine, periodically review and comply with the HLIM requirement, as applicable, and to comply with the 15% limit on illiquid investments.
There can be no assurance that the Program will achieve its objectives under all circumstances in the future. Please refer to the Fund's prospectus for more information regarding the Fund's exposure to liquidity risk and other risks to which it may be subject.
| 56 | MainStay MacKay Total Return Bond Fund |
Proxy Voting Record
The Fund is required to file with the Securities and Exchange Commissions's ("SEC") its proxy voting records for the 12-month period ending June 30 on Form N-PX. The most recent Form N-PX or proxy voting record is available free of charge upon request by calling 800-624-6782; visiting the MainStay Funds’ website at newyorklifeinvestments.com; or visiting the SEC’s website at www.sec.gov.
Shareholder Reports and Quarterly Portfolio Disclosure
The Fund is required to file its complete schedule of portfolio holdings with the SEC 60 days after its first and third fiscal quarter on Form N-PORT. The Fund's holdings report is available free of charge upon request by calling New York Life Investments at 800-624-6782.
This page intentionally left blank.
Equity
U.S. Equity
MainStay Epoch U.S. Equity Yield Fund
MainStay MacKay S&P 500 Index Fund
MainStay Winslow Large Cap Growth Fund
MainStay WMC Enduring Capital Fund
MainStay WMC Growth Fund
MainStay WMC Small Companies Fund
MainStay WMC Value Fund
International Equity
MainStay Epoch International Choice Fund
MainStay MacKay International Equity Fund
MainStay WMC International Research Equity Fund
Emerging Markets Equity
MainStay Candriam Emerging Markets Equity Fund
Global Equity
MainStay Epoch Capital Growth Fund
MainStay Epoch Global Equity Yield Fund
Fixed Income
Taxable Income
MainStay Candriam Emerging Markets Debt Fund
MainStay Floating Rate Fund
MainStay MacKay High Yield Corporate Bond Fund
MainStay MacKay Short Duration High Yield Fund
MainStay MacKay Strategic Bond Fund
MainStay MacKay Total Return Bond Fund
MainStay MacKay U.S. Infrastructure Bond Fund
MainStay Short Term Bond Fund
Tax-Exempt Income
MainStay MacKay California Tax Free Opportunities Fund1
MainStay MacKay High Yield Municipal Bond Fund
MainStay MacKay Intermediate Tax Free Bond Fund
MainStay MacKay New York Tax Free Opportunities Fund2
MainStay MacKay Short Term Municipal Fund
MainStay MacKay Tax Free Bond Fund
Money Market
MainStay Money Market Fund
Mixed Asset
MainStay Balanced Fund
MainStay Income Builder Fund
MainStay MacKay Convertible Fund
Speciality
MainStay CBRE Global Infrastructure Fund
MainStay CBRE Real Estate Fund
MainStay Cushing MLP Premier Fund
Asset Allocation
MainStay Conservative Allocation Fund
MainStay Conservative ETF Allocation Fund
MainStay Defensive ETF Allocation Fund
MainStay Equity Allocation Fund
MainStay Equity ETF Allocation Fund
MainStay Growth Allocation Fund
MainStay Growth ETF Allocation Fund
MainStay Moderate Allocation Fund
MainStay Moderate ETF Allocation Fund
Manager
New York Life Investment Management LLC
New York, New York
Subadvisors
Candriam Belgium S.A.3
Brussels, Belgium
Candriam Luxembourg S.C.A.3
Strassen, Luxembourg
CBRE Clarion Securities LLC
Radnor, Pennsylvania
Cushing Asset Management, LP
Dallas, Texas
Epoch Investment Partners, Inc.
New York, New York
MacKay Shields LLC3
New York, New York
NYL Investors LLC3
New York, New York
Wellington Management Company LLP
Boston, Massachusetts
Winslow Capital Management, LLC
Minneapolis, Minnesota
Legal Counsel
Dechert LLP
Washington, District of Columbia
Independent Registered Public Accounting Firm
KPMG LLP
Philadelphia, Pennsylvania
Distributor
NYLIFE Distributors LLC3
Jersey City, New Jersey
Custodian
JPMorgan Chase Bank, N.A.
New York, New York
1.
This Fund is registered for sale in AZ, CA, NV, OR, TX, UT, WA and MI (Class A and I shares only), and CO, FL, GA, HI, ID, MA, MD, NH, NJ and NY (Class I shares only).
| 2. | This Fund is registered for sale in CA, CT, DE, FL, MA, NJ, NY and VT. |
| 3. | An affiliate of New York Life Investment Management LLC. |
Not part of the Semiannual Report
For more information
800-624-6782
newyorklifeinvestments.com
“New York Life Investments” is both a service mark, and the common trade name, of certain investment advisors affiliated with New York Life Insurance Company. The MainStay Funds® are managed by New York Life Investment Management LLC and distributed by NYLIFE Distributors LLC, 30 Hudson Street, Jersey City, NJ 07302, a wholly owned subsidiary of New York Life Insurance Company. NYLIFE Distributors LLC is a Member FINRA/SIPC.
©2021 NYLIFE Distributors LLC. All rights reserved.
| 1737263MS071-21 | MSTRB10-06/21 |
(NYLIM) NL229
MainStay Short Term Bond Fund
Message from the President and Semiannual Report
Unaudited | April 30, 2021
Sign up for e-delivery of your shareholder reports. For full details on e-delivery, including who can participate and what you can receive via e-delivery,
please log in to newyorklifeinvestments.com/accounts.
| Not FDIC/NCUA Insured | Not a Deposit | May Lose Value | No Bank Guarantee | Not Insured by Any Government Agency |
This page intentionally left blank
Message from the President
With the approval of COVID-19 vaccines and the passage of relief packages by the U.S. Congress, economic prospects improved during the reporting period, and investor risk appetite increased, benefiting both equities and fixed-income markets. Despite some volatility stemming from a sell-off in longer-dated Treasury securities, the stock market and higher-risk segments of the fixed-income market posted gains for the six months ended April 30, 2021.
By the beginning of the reporting period, the economy had made tremendous progress from the second quarter of 2020, when economic activity plunged. But uncertainty about when vaccines would be available and how quickly they could be administered left investors unsure about the economic outlook.
With the approval of several vaccines in November, the outlook brightened and investors became less risk-averse. Anticipating the likely end of the pandemic and a continuation of the economic recovery, they began to see opportunities in investment-grade and high-yield bonds and more cyclical segments of the stock market. The $900 billion relief and stimulus package passed in December provided further assurance.
In January, the Federal Reserve opted to leave interest rates unchanged, pointing to some uncertainty about the pace of the global recovery. Officials also noted that inflation remained low, citing oil prices in particular.
In March, President Biden signed the $1.9 billion American Rescue Plan, which, among other provisions, called for payments of $1,400 for those earning less than $75,000 per year, plus $1,400 per dependent. This, combined with the Federal Reserve’s new tolerance for inflation and an anticipated $2 trillion infrastructure spending bill, added to growing concerns about higher prices. Supply shortages in some markets caused some prices to soar, heightening concerns further.
In fixed-income markets, an improving economic outlook and rising inflation expectations led to a sell-off in longer-term Treasuries, with the result that the yield on the 10-year note rose sharply, particularly in February and March. Investment grade corporate bonds were also affected. Early in the reporting period, they performed well as investors shifted out of Treasuries, but as the reporting period progressed, they faltered. Longer-dated securities issued in recent years at historically low interest rates became especially unattractive.
High-yield bonds remained steady, supported by more favorable yields and an improved economic outlook, which reduced their perceived risk. Municipal bonds produced modest gains, and
although the sell-off in Treasuries produced some volatility early in 2021, stronger-than-expected tax revenues, $350 billion in financial support from the federal government, and the possibility of an increase in federal income tax rates appeared to buoy the market late in the reporting period.
Inflation concerns and volatility in the Treasury market led to a shift in equities markets. Although the S&P 500® Index, a widely followed measure of U.S. equities, posted double-digit gains and hit a record high, the rise of Treasury yields disrupted valuations, especially those of growth stocks. Technology companies that saw their valuations soar amid the work-from-home trend in 2020 suffered large declines.
But the fiscal stimulus and continued accommodation from the Federal Reserve gave investors confidence the economic recovery would continue. Combined with the sky-high valuations in technology and growth stocks, this increased the appeal of more cyclical and value-oriented shares. As a result, value stocks outperformed growth stocks during the reporting period.
Reflecting the shift in investor sentiment, the performance of S&P 500® Index sectors varied widely. While the information technology sector kept up with the broader market, it lagged cyclical sectors such as energy and financials, which led the way. The shift was further reflected in the performance of small-cap stocks, which outperformed large caps. While developed markets kept pace with the U.S. market, lagging economic and pandemic recoveries appeared to weigh on emerging markets late in the reporting period.
With the lockdown restrictions lifting in the U.S. and the pandemic easing in many regions, we at New York Life Investments are looking forward to a return to a more normal economy. We anticipate that over the next several years, a variety of trends will likely offer long-term investors many attractive opportunities. With this in mind, we continue to develop products and services to help you to take advantage of these trends, manage your risks, and ultimately meet your investment goals.
Sincerely,
Kirk C. Lehneis
President
The opinions expressed are as of the date of this report and are subject to change. There is no guarantee that any forecast made will come to pass. This material does not constitute investment advice and is not intended as an endorsement of any specific investment. Past performance is no guarantee of future results.
Not part of the Semiannual Report
Investors should refer to the Fund’s Summary Prospectus and/or Prospectus and consider the Fund’s investment objectives, strategies, risks, charges and expenses carefully before investing. The Summary Prospectus and/or Prospectus contain this and other information about the Fund. You may obtain copies of the Fund’s Summary Prospectus, Prospectus and Statement of Additional Information free of charge, upon request, by calling toll-free 800-624-6782, by writing to NYLIFE Distributors LLC, Attn: MainStay Marketing Department, 30 Hudson Street, Jersey City, NJ 07302 or by sending an e-mail to MainStayShareholderServices@nylim.com. These documents are also available via the MainStay Funds’ website at newyorklifeinvestments.com. Please read the Fund’s Summary Prospectus and/or Prospectus carefully before investing.
Investment and Performance Comparison (Unaudited)
Performance data quoted represents past performance. Past performance is no guarantee of future results. Because of market volatility and other factors, current performance may be lower or higher than the figures shown. Investment return and principal value will fluctuate, and as a result, when shares are redeemed, they may be worth more or less than their original cost. The graph below depicts the historical performance of Class I shares of the Fund. Performance will vary from class to class based on differences in class-specific expenses and sales charges. For performance information current to the most recent month-end, please call 800-624-6782 or visit newyorklifeinvestments.com.
The performance table and graph do not reflect the deduction of taxes that a shareholder would pay on distributions or Fund share redemptions. Total returns reflect maximum applicable sales charges as indicated in the table below, if any, changes in share price, and reinvestment of dividend and capital gain distributions. The graph assumes the initial investment amount shown below and reflects the deduction of all sales charges that would have applied for the period of investment. Performance figures may reflect certain fee waivers and/or expense limitations, without which total returns may have been lower. For more information on share classes and current fee waivers and/or expense limitations (if any), please refer to the Notes to Financial Statements.
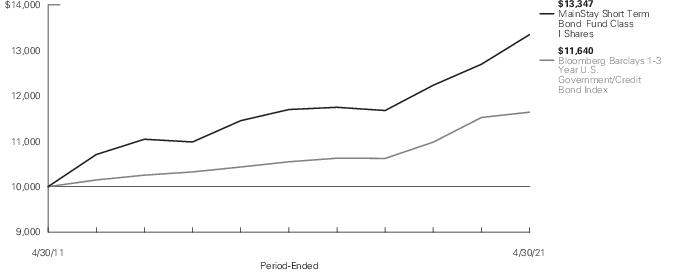
| Average Annual Total Returns for the Period-Ended April 30, 2021 |
| Class | Sales Charge | | Inception
Date | Six
Months | One Year
or Since
Inception | Five
Years | Ten
Years | Gross
Expense
Ratio1 |
| Class A Shares2 | Maximum 1% Initial Sales Charge | With sales charges | 1/2/2004 | -0.05% | 3.73% | 1.76% | 2.29% | 0.75% |
| | | Excluding sales charges | | 0.95 | 4.77 | 2.38 | 2.60 | 0.75 |
| Investor Class Shares2, 3 | Maximum 0.5% Initial Sales Charge | With sales charges | 2/28/2008 | 0.39 | 3.54 | 1.51 | 2.09 | 1.22 |
| | | Excluding sales charges | | 0.89 | 4.58 | 2.13 | 2.40 | 1.22 |
| Class I Shares | No Sales Charge | | 1/2/1991 | 1.06 | 5.14 | 2.67 | 2.93 | 0.48 |
| SIMPLE Class Shares | No Sales Charge | | 8/31/2020 | 0.77 | 0.59 | N/A | N/A | 1.47 |
| 1. | The gross expense ratios presented reflect the Fund’s “Total Annual Fund Operating Expenses” from the most recent Prospectus, as supplemented, and may differ from other expense ratios disclosed in this report. |
| 2. | Prior to February 28, 2020, the maximum initial sales charge was 3.0%, which is reflected in the average annual total return figures shown. |
| 3. | Prior to June 30, 2020, the maximum initial sales charge was 1.0%, which is reflected in the average annual total return figures shown. |
The footnotes on the next page are an integral part of the table and graph and should be carefully read in conjunction with them.
| Benchmark Performance | Six
Months | One
Year | Five
Years | Ten
Years |
| Bloomberg Barclays 1-3 Year U.S. Government/Credit Bond Index1 | 0.23% | 1.02% | 1.99% | 1.53% |
| Morningstar U.S. Fund Short-Term Bond Category Average2 | 1.17 | 4.36 | 2.33 | 1.86 |
| 1. | The Bloomberg Barclays 1-3 Year U.S. Government/Credit Bond Index is the Fund’s primary broad-based securities market index for comparison purposes. The Bloomberg Barclays 1-3 Year U.S. Government/Credit Bond Index is an unmanaged index comprised of investment grade, U.S. dollar denominated, fixed-rate Treasurys, government-related and corporate securities, with maturities of one to three years. Results assume reinvestment of all income. |
| 2. | The Morningstar U.S. Fund Short-Term Bond Category Average is representative of funds that invest primarily in corporate and other investment-grade U.S. fixed-income issues and typically have durations of 1.0 to 3.5 years. These portfolios are attractive to fairly conservative investors, because they are less sensitive to interest rates than portfolios with longer durations. Morningstar calculates monthly breakpoints using the effective duration of the Morningstar Core Bond Index in determining duration assignment. Short-term is defined as 25% to 75% of the three-year average effective duration of the MCBI. Results are based on average total returns of similar funds with all dividends and capital gain distributions reinvested. |
The footnotes on the preceding page are an integral part of the table and graph and should be carefully read in conjunction with them.
| 6 | MainStay Short Term Bond Fund |
Cost in Dollars of a $1,000 Investment in MainStay Short Term Bond Fund (Unaudited)
The example below is intended to describe the fees and expenses borne by shareholders during the six-month period from November 1, 2020, to April 30, 2021, and the impact of those costs on your investment.
Example
As a shareholder of the Fund you incur two types of costs: (1) transaction costs, including exchange fees and sales charges (loads) on purchases (as applicable), and (2) ongoing costs, including management fees, distribution and/or service (12b-1) fees, and other Fund expenses (as applicable). This example is intended to help you understand your ongoing costs (in dollars) of investing in the Fund and to compare these costs with the ongoing costs of investing in other mutual funds. The example is based on an investment of $1,000 made at the beginning of the six-month period and held for the entire period from November 1, 2020, to April 30, 2021.
This example illustrates your Fund’s ongoing costs in two ways:
Actual Expenses
The second and third data columns in the table below provide information about actual account values and actual expenses. You may use the information in these columns, together with the amount you invested, to estimate the expenses that you paid during the six months ended April 30, 2021. Simply divide your account value by $1,000 (for example, an
$8,600 account value divided by $1,000 = 8.6), then multiply the result by the number under the heading entitled “Expenses Paid During Period” to estimate the expenses you paid on your account during this period.
Hypothetical Example for Comparison Purposes
The fourth and fifth data columns in the table below provide information about hypothetical account values and hypothetical expenses based on the Fund’s actual expense ratio and an assumed rate of return of 5% per year before expenses, which is not the Fund’s actual return. The hypothetical account values and expenses may not be used to estimate the actual ending account balances or expenses you paid for the six-month period shown. You may use this information to compare the ongoing costs of investing in the Fund with the ongoing costs of investing in other mutual funds. To do so, compare this 5% hypothetical example with the 5% hypothetical examples that appear in the shareholder reports of the other mutual funds.
Please note that the expenses shown in the table are meant to highlight your ongoing costs only and do not reflect any transactional costs, such as exchange fees or sales charges (loads). Therefore, the fourth and fifth data columns of the table are useful in comparing ongoing costs only and will not help you determine the relative total costs of owning different funds. In addition, if these transactional costs were included, your costs would have been higher.
| Share Class | Beginning
Account
Value
11/1/20 | Ending Account
Value (Based
on Actual
Returns and
Expenses)
4/30/21 | Expenses
Paid
During
Period1 | Ending Account
Value (Based
on Hypothetical
5% Annualized
Return and
Actual Expenses)
4/30/21 | Expenses
Paid
During
Period1 | Net Expense
Ratio
During
Period2 |
| Class A Shares | $1,000.00 | $1,009.50 | $4.09 | $1,020.73 | $4.11 | 0.82% |
| Investor Class Shares | $1,000.00 | $1,008.90 | $4.58 | $1,020.23 | $4.61 | 0.92% |
| Class I Shares | $1,000.00 | $1,010.60 | $1.99 | $1,022.81 | $2.01 | 0.40% |
| SIMPLE Class Shares | $1,000.00 | $1,007.70 | $5.82 | $1,018.99 | $5.86 | 1.17% |
| 1. | Expenses are equal to the Fund’s annualized expense ratio of each class multiplied by the average account value over the period, divided by 365 and multiplied by 181 (to reflect the six-month period). The table above represents the actual expenses incurred during the six-month period. In addition to the fees and expenses which the Fund bears directly, it also indirectly bears a pro rata share of the fees and expenses of the underlying funds in which it invests. Such indirect expenses are not included in the above-reported expense figures. |
| 2. | Expenses are equal to the Fund's annualized expense ratio to reflect the six-month period. |
Portfolio Composition as of April 30, 2021 (Unaudited)
See Portfolio of Investments beginning on page 11 for specific holdings within these categories. The Fund's holdings are subject to change.
Top Ten Holdings or Issuers Held as of April 30, 2021 (excluding short-term investments) (Unaudited)
| 1. | U.S. Treasury Notes, 0.125%-0.75%, due 6/30/22–4/30/26 |
| 2. | FFCB, 0.68%-1.14%, due 1/13/27–8/20/29 |
| 3. | FHLB, 0.83%-1.50%, due 2/10/27–9/11/29 |
| 4. | FHLMC, Multifamily Structured Pass-Through Certificates, 0.678%-1.81%, due 1/25/30–1/25/31 |
| 5. | American Honda Finance Corp., 0.55%-2.40%, due 6/27/24–7/12/24 |
| 6. | Citigroup, Inc., 0.981%-1.122%, due 5/1/25–1/28/27 |
| 7. | iShares Trust iShares 1-5 Year Investment Grade Corporate Bond ETF |
| 8. | FHLMC, 0.625%-0.85%, due 12/17/25–12/30/27 |
| 9. | Goldman Sachs Group, Inc. (The), 3.625%, due 2/20/24 |
| 10. | Charles Schwab Corp. (The), 0.75%, due 3/18/24 |
| 8 | MainStay Short Term Bond Fund |
Portfolio Management Discussion and Analysis (Unaudited)
Questions answered by portfolio managers Kenneth Sommer and AJ Rzad, CFA, of NYL Investors LLC, the Fund’s Subadvisor.
How did MainStay Short Term Bond Fund perform relative to its benchmark and peer group during the six months ended April 30, 2021?
For the six months ended April 30, 2021, Class I shares of MainStay Short Term Bond Fund returned 1.06%, outperforming the 0.23% return of the Fund’s primary benchmark, the Bloomberg Barclays 1–3 Year U.S. Government/Credit Bond Index. Over the same period, Class I shares underperformed the 1.17% return of the Morningstar U.S. Fund Short-Term Bond Category Average.1
What factors affected the Fund’s relative performance during the reporting period?
Relative to the Bloomberg Barclays 1–3 Year U.S. Government/Credit Bond Index, the Fund held overweight positions in U.S. government agencies, corporates, asset-backed securities and commercial mortgage-backed securities throughout the reporting period. To facilitate these overweight positions, the Fund maintained underweight exposure to the Treasury sector. Option-adjusted spreads2 (OAS) on the designated benchmark tightened 4 basis points during the same period. (A basis point is one one-hundredth of a percentage point.) The corporate sector was the best performing sector during the reporting period, led by the financials and industrials sectors. Overweight exposure to asset-backed securities was also accretive to performance, driven by both the floating-rate and fixed-rate subcomponents. Positioning in commercial mortgage-backed securities, particularly the non-agency subcomponent, added to relative performance during the reporting period as did overweight exposure to U.S. government agencies. Rates positioning in the intermediate part of the yield curve3 detracted from performance during the same period.
During the reporting period, how was the Fund’s performance materially affected by investments in derivatives?
During the reporting period, the use of derivatives was limited to interest rate derivatives designed to keep the duration4 of the Fund in line with our target duration. The interest rate derivatives had a positive impact on performance during this portion of the reporting period.
What was the Fund’s duration strategy during the reporting period?
During the reporting period, the Fund maintained a duration that was relatively close to the duration of the Bloomberg Barclays 1–3 Year U.S. Government/Credit Bond Index. Throughout the reporting period, the Fund was positioned with a shorter duration than the benchmark in the front end of the interest rate curve (1–2 years) and a longer duration than the designated benchmark in the intermediate part of the curve (3+ years). This curve positioning detracted from performance as interest rates moved higher and steeper during the reporting period. As of April 30, 2021, the effective duration of the Fund was 1.84 years compared to a duration of 1.93 years for the Bloomberg Barclays 1–3 Year U.S. Government/Credit Bond Index.
During the reporting period, which sectors were the strongest positive contributors to the Fund’s relative performance and which sectors were particularly weak?
During the reporting period, the Fund maintained overweight exposure compared to the Bloomberg Barclays 1–3 Year U.S. Government/Credit Bond Index in the industrials and financials sectors, both of which were accretive to the Fund’s relative performance. Among industrials, holdings in the energy, consumer cyclical and capital goods subsectors were particularly strong led by bonds issued by Ford Motor Credit, Occidental Petroleum and Discovery Communications. Among financials, overweight exposure to REITs (real estate investment trusts) and banks had the most positive impact on the Fund’s relative performance, particularly holdings in Regency Centers, American Campus Communities, HSBC Holdings and BNP Paribas. Within securitized products, asset-backed securities was the best performing sector, particularly AAA-rated5 collateralized loan obligations. Conversely, the Fund’s relatively underweight exposure to the sovereign, supranational and foreign agency subsectors detracted slightly from performance.
What were some of the Fund’s largest purchases and sales during the reporting period?
The largest additions to the Fund during the reporting period included bonds issued by Charles Schwab, Verizon Communications, LSEGA Financing, American Honda Finance and Coca-Cola European Partners. These purchases were a result of participation in the new issue calendar. The Fund looked to diversify its holdings while improving its yield profile.
| 1. | See page 5 for other share class returns, which may be higher or lower than Class I share returns. See page 6 for more information on benchmark and peer group returns. |
| 2. | The terms “spread” and “yield spread” may refer to the difference in yield between a security or type of security and comparable U.S. Treasury issues. The terms may also refer to the difference in yield between two specific securities or types of securities at a given time. |
| 3. | The yield curve is a line that plots the yields of various securities of similar quality—typically U.S. Treasury issues—across a range of maturities. The U.S. Treasury yield curve serves as a benchmark for other debt and is used in economic forecasting. |
| 4. | Duration is a measure of the price sensitivity of a fixed-income investment to changes in interest rates. Duration is expressed as a number of years and is considered a more accurate sensitivity gauge than average maturity. |
| 5. | An obligation rated ‘AAA’ has the highest rating assigned by Standard & Poor’s (“S&P”), and in the opinion of S&P, the obligor’s capacity to meet its financial commitment on the obligation is extremely strong. When applied to Portfolio holdings, ratings are based solely on the creditworthiness of the bonds in the portfolio and are not meant to represent the security or safety of the Portfolio. |
The largest reductions during the reporting period included bonds issued by AstraZeneca, Daimler Finance North America, National Securities Clearing, Lloyds Banking Group, and Agilent Technologies. These holdings were reduced due to lower yield profiles than opportunities in the new issue market.
How did the Fund’s sector weightings change during the reporting period?
During the reporting period, the Fund held overweight exposure to the industrials and financials sectors within the corporate sector. In the first quarter of 2021, the corporate weighting in the Fund decreased as short duration corporate credit spreads declined. Companies continued to tender and extend maturities, leading to less attractive valuations, and thereby resulting in a modestly lower allocation to the sector.
During the latter half of the reporting period, we reduced the Fund’s weighting in the U.S. government callable agency sector. As the economy continued to heal from the pandemic and volatility fell sharply, option-adjusted spreads within U.S. government callable agencies tightened dramatically. The spread compression drove us to reduce the Fund’s weighting within the sector.
Within the securitized products sector, we introduced interest-only agency commercial mortgage-backed securities into the Fund in 2021, viewing it as offering some of the best risk-adjusted yield in the investment-grade fixed-income landscape in the 2.25% to 2.50% context for a 4.5-year duration security.
How was the Fund positioned at the end of the reporting period?
As of April 30, 2021, the Fund held its most significantly overweight exposure relative to the Bloomberg Barclays 1–3 Year U.S. Government/Credit Bond Index in corporate bonds. Within the corporate sector, the Fund held overweight exposure in financials and industrials. The Fund also held overweight positions in asset-backed securities, commercial mortgage-backed securities and U.S. government agencies. As of the same date, the Fund held relatively underweight positions in the sovereign, supranational, foreign agency and foreign local government sectors, as well as in U.S. Treasury securities.
The opinions expressed are those of the portfolio managers as of the date of this report and are subject to change. There is no guarantee that any forecasts will come to pass. This material does not constitute investment advice and is not intended as an endorsement of any specific investment.
| 10 | MainStay Short Term Bond Fund |
Portfolio of Investments April 30, 2021† (Unaudited)
| | Principal
Amount | Value |
| Long-Term Bonds 96.6% |
| Asset-Backed Securities 16.1% |
| Other Asset-Backed Securities 16.1% |
| 522 Funding CLO Ltd. | |
| Series 2021-7A, Class A | | |
| 1.27% (3 Month LIBOR + 1.07%), due 4/23/34 (a)(b) | $ 500,000 | $ 500,393 |
| AIG CLO | |
| Series 2021-1A, Class A | | |
| 1.284% (3 Month LIBOR + 1.10%), due 4/22/34 (a)(b) | 300,000 | 300,028 |
| AIMCO CLO 10 Ltd. | |
| Series 2019-10A, Class A | | |
| 1.504% (3 Month LIBOR + 1.32%), due 7/22/32 (a)(b) | 500,000 | 500,148 |
| Apidos CLO XXX | |
| Series XXXA, Class A2 | | |
| 1.79% (3 Month LIBOR + 1.60%), due 10/18/31 (a)(b) | 500,000 | 496,053 |
| Apidos CLO XXXII | |
| Series 2019-32A, Class A1 | | |
| 1.508% (3 Month LIBOR + 1.32%), due 1/20/33 (a)(b) | 500,000 | 500,584 |
| Apidos CLO XXXV | |
| Series 2021-35A, Class A | | |
| 1.245% (3 Month LIBOR + 1.05%), due 4/20/34 (a)(b) | 500,000 | 500,094 |
| Aqua Finance Trust | |
| Series 2020-AA, Class A | | |
| 1.90%, due 7/17/46 (a) | 596,830 | 603,548 |
| ARES L CLO Ltd. | |
| Series 2018-50A, Class B | | |
| 1.884% (3 Month LIBOR + 1.70%), due 1/15/32 (a)(b) | 500,000 | 500,156 |
| ARES XLI CLO Ltd. | |
| Series 2016-41A, Class AR2 | | |
| 1.668% (3 Month LIBOR + 1.07%), due 4/15/34 (a)(b) | 500,000 | 500,096 |
| ARES XXXIV CLO Ltd. | |
| Series 2015-2A, Class AR2 | | |
| 1.44% (3 Month LIBOR + 1.25%), due 4/17/33 (a)(b) | 500,000 | 500,485 |
| ARES XXXVIII CLO Ltd. | |
| Series 2015-38A, Class BR | | |
| 1.588% (3 Month LIBOR + 1.40%), due 4/20/30 (a)(b) | 500,000 | 494,265 |
| | Principal
Amount | Value |
| |
| Other Asset-Backed Securities (continued) |
| Battalion CLO 17 Ltd. | |
| Series 2021-17A, Class A1 | | |
| 1.45% (3 Month LIBOR + 1.26%), due 3/9/34 (a)(b) | $ 250,000 | $ 250,294 |
| Benefit Street Partners CLO XXIII Ltd. | |
| Series 2021-23A, Class A1 | | |
| 2.297% (3 Month LIBOR + 1.08%), due 4/25/34 (a)(b) | 400,000 | 400,158 |
| Betony CLO 2 Ltd. | |
| Series 2018-1A, Class A1 | | |
| 1.266% (3 Month LIBOR + 1.08%), due 4/30/31 (a)(b) | 500,000 | 500,038 |
| CAL Funding IV Ltd. | |
| Series 2020-1A, Class A | | |
| 2.22%, due 9/25/45 (a) | 712,812 | 717,236 |
| Cedar Funding XII CLO Ltd. | |
| Series 2020-12A, Class A | | |
| 1.446% (3 Month LIBOR + 1.27%), due 10/25/32 (a)(b) | 400,000 | 400,216 |
| Galaxy XV CLO Ltd. | |
| Series 2013-15A, Class AR | | |
| 1.384% (3 Month LIBOR + 1.20%), due 10/15/30 (a)(b) | 500,000 | 500,199 |
| Laurel Road Prime Student Loan Trust | |
| Series 2020-A, Class A2FX | | |
| 1.40%, due 11/25/50 (a) | 356,000 | 354,949 |
| Magnetite XVIII Ltd. | |
| Series 2016-18A, Class AR | | |
| 1.274% (3 Month LIBOR + 1.08%), due 11/15/28 (a)(b) | 250,000 | 250,000 |
| MVW Owner Trust | |
| Series 2017-1A, Class A | | |
| 2.42%, due 12/20/34 (a) | 51,981 | 53,112 |
| Navient Private Education Refi Loan Trust (a) | |
| Series 2020-GA, Class A | | |
| 1.17%, due 9/16/69 | 197,987 | 198,915 |
| Series 2020-FA, Class A | | |
| 1.22%, due 7/15/69 | 148,969 | 150,048 |
| Neuberger Berman CLO XIV Ltd. | |
| Series 2013-14A, Class BR2 | | |
| 1.684% (3 Month LIBOR + 1.50%), due 1/28/30 (a)(b) | 500,000 | 500,024 |
| Neuberger Berman Loan Advisers CLO 32 Ltd. | |
| Series 2019-32A, Class BR | | |
| 1.59% (3 Month LIBOR + 1.40%), due 1/20/32 (a)(b) | 500,000 | 499,134 |
The notes to the financial statements are an integral part of, and should be read in conjunction with, the financial statements.
11
Portfolio of Investments April 30, 2021† (Unaudited) (continued)
| | Principal
Amount | Value |
| Asset-Backed Securities (continued) |
| Other Asset-Backed Securities (continued) |
| Oaktree CLO Ltd. | |
| Series 2015-1A, Class A2BR | | |
| 1.538% (3 Month LIBOR + 1.35%), due 10/20/27 (a)(b) | $ 500,000 | $ 500,077 |
| OZLM VI Ltd. | |
| Series 2014-6A, Class A1S | | |
| 1.27% (3 Month LIBOR + 1.08%), due 4/17/31 (a)(b) | 492,601 | 492,586 |
| Palmer Square CLO Ltd. (a)(b) | |
| Series 2015-2A, Class A1R2 | | |
| 1.288% (3 Month LIBOR + 1.10%), due 7/20/30 | 500,000 | 499,431 |
| Series 2015-2A, Class A2R2 | | |
| 1.738% (3 Month LIBOR + 1.55%), due 7/20/30 | 500,000 | 500,077 |
| Regatta VI Funding Ltd. | |
| Series 2016-1A, Class BR | | |
| 1.638% (3 Month LIBOR + 1.45%), due 7/20/28 (a)(b) | 500,000 | 500,044 |
| Romark CLO IV Ltd. | |
| Series 2021-4A, Class A1 | | |
| (zero coupon) (3 Month LIBOR + 1.17%), due 7/10/34 (a)(b)(c) | 500,000 | 500,053 |
| Silver Creek CLO Ltd. | |
| Series 2014-1A, Class AR | | |
| 1.428% (3 Month LIBOR + 1.24%), due 7/20/30 (a)(b) | 500,000 | 500,190 |
| Sixth Street CLO XVII Ltd. | |
| Series 2021-17A, Class A | | |
| 1.433% (3 Month LIBOR + 1.24%), due 1/20/34 (a)(b) | 300,000 | 300,527 |
| SMB Private Education Loan Trust (a) | |
| Series 2020-B, Class A1A | | |
| 1.29%, due 7/15/53 | 361,458 | 362,722 |
| Series 2020-PTB, Class A2A | | |
| 1.60%, due 9/15/54 | 500,000 | 506,235 |
| Taco Bell Funding LLC | |
| Series 2018-1A, Class A2I | | |
| 4.318%, due 11/25/48 (a) | 415,438 | 416,439 |
| Textainer Marine Containers VII Ltd. | |
| Series 2021-1A, Class A | | |
| 1.68%, due 2/20/46 (a) | 315,721 | 309,893 |
| Triton Container Finance VIII LLC | |
| Series 2020-1A, Class A | | |
| 2.11%, due 9/20/45 (a) | 712,811 | 718,225 |
| | Principal
Amount | Value |
| |
| Other Asset-Backed Securities (continued) |
| Vantage Data Centers LLC | |
| Series 2020-1A, Class A2 | | |
| 1.645%, due 9/15/45 (a) | $ 350,000 | $ 348,674 |
| Voya CLO Ltd. | |
| Series 2019-1A, Class BR | | |
| 1.734% (3 Month LIBOR + 1.55%), due 4/15/31 (a)(b) | 500,000 | 495,587 |
Total Asset-Backed Securities
(Cost $17,092,485) | | 17,120,933 |
| Corporate Bonds 50.4% |
| Aerospace & Defense 1.1% |
| Boeing Co. (The) | | |
| 2.70%, due 5/1/22 | 1,175,000 | 1,200,727 |
| Apparel 0.1% |
| Ralph Lauren Corp. | | |
| 1.70%, due 6/15/22 | 150,000 | 152,455 |
| Auto Manufacturers 5.0% |
| American Honda Finance Corp. | | |
| 0.55%, due 7/12/24 | 700,000 | 699,007 |
| 2.40%, due 6/27/24 | 950,000 | 1,001,171 |
| BMW US Capital LLC | | |
| 3.45%, due 4/12/23 (a) | 950,000 | 1,002,974 |
| Ford Motor Credit Co. LLC | | |
| 3.087%, due 1/9/23 | 275,000 | 280,162 |
| 3.664%, due 9/8/24 | 600,000 | 624,690 |
| General Motors Financial Co., Inc. | | |
| 1.05%, due 3/8/24 | 750,000 | 751,581 |
| Hyundai Capital America | | |
| 1.30%, due 1/8/26 (a) | 750,000 | 737,596 |
| Volkswagen Group of America Finance LLC | | |
| 1.25%, due 11/24/25 (a) | 200,000 | 199,500 |
| | | 5,296,681 |
| Auto Parts & Equipment 0.5% |
| Aptiv Corp. | | |
| 4.15%, due 3/15/24 | 525,000 | 572,107 |
| Banks 13.5% |
| Banco Santander SA | | |
| 2.746%, due 5/28/25 | 200,000 | 210,919 |
| Bank of America Corp. | | |
| 4.20%, due 8/26/24 | 700,000 | 771,682 |
The notes to the financial statements are an integral part of, and should be read in conjunction with, the financial statements.
| 12 | MainStay Short Term Bond Fund |
| | Principal
Amount | Value |
| Corporate Bonds (continued) |
| Banks (continued) |
| Bank of Nova Scotia (The) | | |
| 3.40%, due 2/11/24 | $ 525,000 | $ 565,240 |
| BNP Paribas SA | | |
| 4.25%, due 10/15/24 | 850,000 | 945,898 |
| Citigroup, Inc. (d) | | |
| 0.981%, due 5/1/25 | 500,000 | 501,484 |
| 1.122%, due 1/28/27 | 1,200,000 | 1,180,279 |
| Credit Suisse AG | | |
| 0.495%, due 2/2/24 | 850,000 | 843,309 |
| Goldman Sachs Group, Inc. (The) | | |
| 3.625%, due 2/20/24 | 1,275,000 | 1,375,371 |
| HSBC Holdings plc | | |
| 4.25%, due 8/18/25 | 1,075,000 | 1,191,975 |
| JPMorgan Chase & Co. | | |
| 3.875%, due 2/1/24 | 1,200,000 | 1,309,170 |
| Lloyds Banking Group plc | | |
| 0.695% (1 Year Treasury Constant Maturity Rate + 0.55%), due 5/11/24 (b) | 550,000 | 550,674 |
| Mizuho Financial Group, Inc. | | |
| 1.034% (3 Month LIBOR + 0.85%), due 9/13/23 (b) | 1,075,000 | 1,083,074 |
| Morgan Stanley | | |
| 4.10%, due 5/22/23 | 850,000 | 909,483 |
| Standard Chartered plc | | |
| 0.991% (1 Year Treasury Constant Maturity Rate + 0.78%), due 1/12/25 (a)(b) | 450,000 | 448,188 |
| Sumitomo Mitsui Financial Group, Inc. | | |
| 2.696%, due 7/16/24 | 950,000 | 1,002,829 |
| Truist Financial Corp. | | |
| 1.267%, due 3/2/27 (d) | 175,000 | 174,206 |
| UBS Group AG | | |
| 1.364% (1 Year Treasury Constant Maturity Rate + 1.08%), due 1/30/27 (a)(b) | 525,000 | 519,831 |
| Wells Fargo & Co. | | |
| Series M | | |
| 3.45%, due 2/13/23 | 700,000 | 738,207 |
| | | 14,321,819 |
| Beverages 0.8% |
| Coca-Cola European Partners plc | | |
| 0.80%, due 5/3/24 (a) | 850,000 | 849,812 |
| | Principal
Amount | Value |
| |
| Chemicals 2.1% |
| Dow Chemical Co. (The) | | |
| 3.625%, due 5/15/26 | $ 500,000 | $ 551,737 |
| DuPont de Nemours, Inc. | | |
| 2.169%, due 5/1/23 | 500,000 | 501,838 |
| LYB International Finance III LLC | | |
| 1.202% (3 Month LIBOR + 1.00%), due 10/1/23 (b) | 350,000 | 350,797 |
| Nutrien Ltd. | | |
| 3.625%, due 3/15/24 | 750,000 | 806,758 |
| | | 2,211,130 |
| Diversified Financial Services 4.4% |
| AIG Global Funding | | |
| 0.90%, due 9/22/25 (a) | 175,000 | 172,681 |
| Air Lease Corp. | | |
| 3.875%, due 7/3/23 | 650,000 | 692,763 |
| Aircastle Ltd. | | |
| 2.85%, due 1/26/28 (a) | 400,000 | 392,610 |
| Antares Holdings LP | | |
| 3.95%, due 7/15/26 (a) | 250,000 | 256,695 |
| ARES Finance Co. LLC | | |
| 4.00%, due 10/8/24 (a) | 525,000 | 565,310 |
| BOC Aviation USA Corp. | | |
| 1.625%, due 4/29/24 (a) | 250,000 | 251,019 |
| Charles Schwab Corp. (The) | | |
| 0.75%, due 3/18/24 | 1,350,000 | 1,358,858 |
| LSEGA Financing plc | | |
| 0.65%, due 4/6/24 (a) | 1,000,000 | 997,865 |
| | | 4,687,801 |
| Electric 1.7% |
| DTE Energy Co. | | |
| Series F | | |
| 1.05%, due 6/1/25 | 200,000 | 199,258 |
| Pacific Gas and Electric Co. | | |
| 1.75%, due 6/16/22 | 425,000 | 425,373 |
| Pinnacle West Capital Corp. | | |
| 1.30%, due 6/15/25 | 350,000 | 351,753 |
| Southern California Edison Co. | | |
| 1.10%, due 4/1/24 | 625,000 | 630,344 |
| Series 20C | | |
| 1.20%, due 2/1/26 | 175,000 | 173,550 |
| | | 1,780,278 |
| Electronics 0.4% |
| Flex Ltd. | | |
| 3.75%, due 2/1/26 | 350,000 | 380,247 |
The notes to the financial statements are an integral part of, and should be read in conjunction with, the financial statements.
13
Portfolio of Investments April 30, 2021† (Unaudited) (continued)
| | Principal
Amount | Value |
| Corporate Bonds (continued) |
| Gas 1.0% |
| CenterPoint Energy Resources Corp. | | |
| 0.70%, due 3/2/23 | $ 375,000 | $ 375,227 |
| Eastern Energy Gas Holdings LLC | | |
| 3.55%, due 11/1/23 | 650,000 | 693,651 |
| | | 1,068,878 |
| Healthcare-Services 0.7% |
| Laboratory Corp. of America Holdings | | |
| 3.25%, due 9/1/24 | 650,000 | 695,961 |
| Housewares 0.2% |
| Newell Brands, Inc. | | |
| 4.35%, due 4/1/23 (e) | 205,000 | 216,072 |
| Insurance 1.0% |
| Aon plc | | |
| 3.50%, due 6/14/24 | 525,000 | 564,505 |
| Brighthouse Financial Global Funding | | |
| 1.00%, due 4/12/24 (a) | 125,000 | 125,203 |
| Metropolitan Life Global Funding I | | |
| 3.60%, due 1/11/24 (a) | 390,000 | 420,946 |
| | | 1,110,654 |
| Iron & Steel 0.1% |
| Steel Dynamics, Inc. | | |
| 2.40%, due 6/15/25 | 125,000 | 130,771 |
| Machinery-Diversified 1.7% |
| CNH Industrial NV | | |
| 4.50%, due 8/15/23 | 935,000 | 1,013,067 |
| Flowserve Corp. | | |
| 3.50%, due 9/15/22 | 775,000 | 799,337 |
| | | 1,812,404 |
| Media 2.0% |
| Charter Communications Operating LLC | | |
| Series USD | | |
| 4.50%, due 2/1/24 | 700,000 | 765,126 |
| Discovery Communications LLC | | |
| 3.80%, due 3/13/24 | 1,250,000 | 1,347,060 |
| | | 2,112,186 |
| Miscellaneous—Manufacturing 0.8% |
| Siemens Financieringsmaatschappij NV | | |
| 0.65%, due 3/11/24 (a) | 800,000 | 801,940 |
| | Principal
Amount | Value |
| |
| Oil & Gas 0.7% |
| BP Capital Markets America, Inc. | | |
| 3.216%, due 11/28/23 | $ 730,000 | $ 778,556 |
| Oil & Gas Services 0.8% |
| Schlumberger Holdings Corp. | | |
| 3.75%, due 5/1/24 (a) | 750,000 | 808,379 |
| Packaging & Containers 0.4% |
| Berry Global, Inc. | | |
| 0.95%, due 2/15/24 (a) | 400,000 | 398,984 |
| Pharmaceuticals 3.1% |
| AbbVie, Inc. | | |
| 3.80%, due 3/15/25 | 180,000 | 197,171 |
| AmerisourceBergen Corp. | | |
| 0.737%, due 3/15/23 | 700,000 | 701,910 |
| Bayer US Finance II LLC | | |
| 3.875%, due 12/15/23 (a) | 930,000 | 999,919 |
| CVS Health Corp. | | |
| 3.375%, due 8/12/24 | 920,000 | 991,629 |
| Viatris, Inc. | | |
| 1.125%, due 6/22/22 (a) | 350,000 | 352,255 |
| | | 3,242,884 |
| Pipelines 2.0% |
| Energy Transfer Partners LP | | |
| 5.875%, due 3/1/22 | 750,000 | 772,462 |
| Kinder Morgan Energy Partners LP | | |
| 4.15%, due 2/1/24 | 750,000 | 810,821 |
| Plains All American Pipeline LP | | |
| 3.85%, due 10/15/23 | 525,000 | 555,622 |
| | | 2,138,905 |
| Real Estate Investment Trusts 3.1% |
| American Campus Communities Operating Partnership LP | | |
| 3.30%, due 7/15/26 | 775,000 | 836,045 |
| National Retail Properties, Inc. | | |
| 3.90%, due 6/15/24 | 950,000 | 1,029,777 |
| Regency Centers LP | | |
| 3.90%, due 11/1/25 | 700,000 | 768,705 |
| VEREIT Operating Partnership LP | | |
| 4.60%, due 2/6/24 | 600,000 | 656,610 |
| | | 3,291,137 |
| Retail 0.7% |
| 7-Eleven, Inc. | | |
| 0.80%, due 2/10/24 (a) | 700,000 | 699,003 |
The notes to the financial statements are an integral part of, and should be read in conjunction with, the financial statements.
| 14 | MainStay Short Term Bond Fund |
| | Principal
Amount | Value |
| Corporate Bonds (continued) |
| Telecommunications 2.5% |
| AT&T, Inc. | | |
| 1.70%, due 3/25/26 | $ 525,000 | $ 527,453 |
| NTT Finance Corp. | | |
| 0.373%, due 3/3/23 (a) | 750,000 | 750,573 |
| T-Mobile US, Inc. | | |
| 2.05%, due 2/15/28 (a) | 150,000 | 148,890 |
| Verizon Communications, Inc. | | |
| 0.75%, due 3/22/24 | 1,250,000 | 1,254,821 |
| | | 2,681,737 |
Total Corporate Bonds
(Cost $52,680,343) | | 53,441,508 |
| Foreign Government Bonds 0.5% |
| Norway 0.1% |
| Equinor ASA | | |
| 1.75%, due 1/22/26 | 125,000 | 128,718 |
| Supranational 0.4% |
| International Bank for Reconstruction & Development | | |
| 0.85%, due 2/10/27 | 375,000 | 366,673 |
Total Foreign Government Bonds
(Cost $499,578) | | 495,391 |
| Mortgage-Backed Securities 6.4% |
| Commercial Mortgage Loans (Collateralized Mortgage Obligations) 6.3% |
| BBCMS Trust | |
| Series 2013-TYSN, Class A2 | | |
| 3.756%, due 9/5/32 (a) | 510,666 | 511,414 |
| BWAY Mortgage Trust | |
| Series 2013-1515, Class A2 | | |
| 3.454%, due 3/10/33 (a) | 225,000 | 241,302 |
| BX Commercial Mortgage Trust (a)(b) | |
| Series 2019-IMC, Class A | | |
| 1.115% (1 Month LIBOR + 1.00%), due 4/15/34 | 500,000 | 498,595 |
| Series 2019-IMC, Class B | | |
| 1.415% (1 Month LIBOR + 1.30%), due 4/15/34 | 175,000 | 174,123 |
| CAMB Commercial Mortgage Trust | |
| Series 2019-LIFE, Class A | | |
| 1.185% (1 Month LIBOR + 1.07%), due 12/15/37 (a)(b) | 500,000 | 500,620 |
| | Principal
Amount | Value |
| |
| Commercial Mortgage Loans (Collateralized Mortgage Obligations) (continued) |
| FHLMC, Multifamily Structured Pass-Through Certificates (f) | |
| REMIC, Series K125, Class X1 | | |
| 0.678%, due 1/25/31 | $ 1,534 | $ 76 |
| REMIC, Series K123, Class X1 | | |
| 0.866%, due 12/25/30 | 11,997,447 | 763,453 |
| REMIC, Series K122, Class X1 | | |
| 0.974%, due 11/25/30 | 4,098,955 | 294,276 |
| REMIC, Series K120, Class X1 | | |
| 1.134%, due 10/25/30 | 9,244,071 | 768,426 |
| REMIC, Series K112, Class X1 | | |
| 1.536%, due 5/25/30 | 3,628,342 | 409,143 |
| REMIC, Series K107, Class X1 | | |
| 1.708%, due 1/25/30 | 6,295,101 | 762,123 |
| REMIC, Series K108, Class X1 | | |
| 1.81%, due 3/25/30 | 5,799,813 | 758,019 |
| GS Mortgage Securities Corp. II | |
| Series 2012-BWTR, Class A | | |
| 2.954%, due 11/5/34 (a) | 200,000 | 203,562 |
| Houston Galleria Mall Trust | |
| Series 2015-HGLR, Class A1A1 | | |
| 3.087%, due 3/5/37 (a) | 500,000 | 522,337 |
| WFLD Mortgage Trust | |
| Series 2014-MONT, Class A | | |
| 3.88%, due 8/10/31 (a)(f) | 300,000 | 315,161 |
| | | 6,722,630 |
| Whole Loan (Collateralized Mortgage Obligation) 0.1% |
| Sequoia Mortgage Trust | |
| Series 2017-7, Class A4 | | |
| 3.50%, due 10/25/47 (a)(g) | 54,584 | 54,619 |
Total Mortgage-Backed Securities
(Cost $6,774,569) | | 6,777,249 |
| U.S. Government & Federal Agencies 23.2% |
| Federal Home Loan Mortgage Corporation (Mortgage Pass-Through Securities) 9.8% |
| FFCB | | |
| 0.68%, due 1/13/27 | 780,000 | 764,473 |
| 0.75%, due 4/5/27 | 225,000 | 220,570 |
| 0.84%, due 2/2/28 | 500,000 | 485,860 |
| 0.95%, due 7/21/28 | 775,000 | 750,734 |
| 1.04%, due 5/27/27 | 900,000 | 890,924 |
| 1.05%, due 6/22/28 | 450,000 | 439,075 |
| 1.14%, due 8/20/29 | 1,500,000 | 1,448,752 |
| FHLB | | |
| 0.83%, due 2/10/27 | 1,000,000 | 984,492 |
The notes to the financial statements are an integral part of, and should be read in conjunction with, the financial statements.
15
Portfolio of Investments April 30, 2021† (Unaudited) (continued)
| | Principal
Amount | Value |
| U.S. Government & Federal Agencies (continued) |
| Federal Home Loan Mortgage Corporation (Mortgage Pass-Through Securities) (continued) |
| FHLB (continued) | | |
| 0.90%, due 2/26/27 | $ 1,000,000 | $ 987,433 |
| 1.00%, due 7/28/28 | 1,000,000 | 972,067 |
| 1.50%, due 9/11/29 | 1,000,000 | 978,825 |
| FHLMC | | |
| 0.625%, due 12/17/25 | 1,300,000 | 1,294,644 |
| 0.85%, due 12/30/27 | 175,000 | 169,409 |
| | | 10,387,258 |
| United States Treasury Notes 13.4% |
| U.S. Treasury Notes | | |
| 0.125%, due 6/30/22 | 2,000,000 | 2,001,094 |
| 0.125%, due 4/30/23 | 11,200,000 | 11,192,125 |
| 0.75%, due 3/31/26 | 550,000 | 547,852 |
| 0.75%, due 4/30/26 | 500,000 | 497,656 |
| | | 14,238,727 |
Total U.S. Government & Federal Agencies
(Cost $24,839,769) | | 24,625,985 |
Total Long-Term Bonds
(Cost $101,886,744) | | 102,461,066 |
| |
| | Shares | |
| Exchange-Traded Fund 1.5% |
| iShares Trust iShares 1-5 Year Investment Grade Corporate Bond ETF | 28,094 | 1,539,832 |
Total Exchange-Traded Fund
(Cost $1,541,799) | | 1,539,832 |
| | Shares | | Value |
| Short-Term Investment 2.4% |
| Unaffiliated Investment Company 2.4% |
| JPMorgan U.S. Government Money Market Fund-IM Shares, 0.00% (g) | 2,553,782 | | $ 2,553,782 |
Total Short-Term Investment
(Cost $2,553,782) | | | 2,553,782 |
Total Investments
(Cost $105,982,325) | 100.5% | | 106,554,680 |
| Other Assets, Less Liabilities | (0.5) | | (488,875) |
| Net Assets | 100.0% | | $ 106,065,805 |
| † | Percentages indicated are based on Fund net assets. |
| (a) | May be sold to institutional investors only under Rule 144A or securities offered pursuant to Section 4(a)(2) of the Securities Act of 1933, as amended. |
| (b) | Floating rate—Rate shown was the rate in effect as of April 30, 2021. |
| (c) | Delayed delivery security. |
| (d) | Fixed to floating rate—Rate shown was the rate in effect as of April 30, 2021. |
| (e) | Step coupon—Rate shown was the rate in effect as of April 30, 2021. |
| (f) | Collateral strip rate—A bond whose interest was based on the weighted net interest rate of the collateral. The coupon rate adjusts periodically based on a predetermined schedule. Rate shown was the rate in effect as of April 30, 2021. |
| (g) | Coupon rate may change based on changes of the underlying collateral or prepayments of principal. Rate shown was the rate in effect as of April 30, 2021. |
Futures Contracts
As of April 30, 2021, the Fund held the following futures contracts1:
| Type | Number of
Contracts | Expiration
Date | Value at
Trade Date | Current
Notional
Amount | Unrealized
Appreciation
(Depreciation)2 |
| Long Contracts | | | | | |
| U.S. Treasury 2 Year Notes | 148 | June 2021 | $ 32,693,765 | $ 32,672,156 | $ (21,609) |
| U.S. Treasury Long Bonds | 1 | June 2021 | 158,846 | 157,250 | (1,596) |
| Total Long Contracts | | | | | (23,205) |
| Short Contracts | | | | | |
| U.S. Treasury 5 Year Notes | (140) | June 2021 | (17,458,530) | (17,351,250) | 107,280 |
| U.S. Treasury 10 Year Notes | (62) | June 2021 | (8,268,729) | (8,185,937) | 82,792 |
The notes to the financial statements are an integral part of, and should be read in conjunction with, the financial statements.
| 16 | MainStay Short Term Bond Fund |
| Type | Number of
Contracts | Expiration
Date | Value at
Trade Date | Current
Notional
Amount | Unrealized
Appreciation
(Depreciation)2 |
| U.S. Treasury 10 Year Ultra Bonds | (10) | June 2021 | $ (1,476,386) | $ (1,455,469) | $ 20,917 |
| Total Short Contracts | | | | | 210,989 |
| Net Unrealized Appreciation | | | | | $ 187,784 |
| 1. | As of April 30, 2021, cash in the amount of $204,082 was on deposit with a broker or futures commission merchant for futures transactions. |
| 2. | The value listed for these securities reflects unrealized appreciation (depreciation) as shown on the Portfolio of Investments. |
| Abbreviation(s): |
| CLO—Collateralized Loan Obligation |
| CNH—Chinese Offshore Yuan |
| ETF—Exchange-Traded Fund |
| FFCB—Federal Farm Credit Bank |
| FHLB—Federal Home Loan Bank |
| FHLMC—Federal Home Loan Mortgage Corp. |
| LIBOR—London Interbank Offered Rate |
| REMIC—Real Estate Mortgage Investment Conduit |
| USD—United States Dollar |
The following is a summary of the fair valuations according to the inputs used as of April 30, 2021, for valuing the Fund’s assets and liabilities:
| Description | Quoted
Prices in
Active
Markets for
Identical
Assets
(Level 1) | | Significant
Other
Observable
Inputs
(Level 2) | | Significant
Unobservable
Inputs
(Level 3) | | Total |
| Asset Valuation Inputs | | | | | | | |
| Investments in Securities (a) | | | | | | | |
| Long-Term Bonds | | | | | | | |
| Asset-Backed Securities | $ — | | $ 17,120,933 | | $ — | | $ 17,120,933 |
| Corporate Bonds | — | | 53,441,508 | | — | | 53,441,508 |
| Foreign Government Bonds | — | | 495,391 | | — | | 495,391 |
| Mortgage-Backed Securities | — | | 6,777,249 | | — | | 6,777,249 |
| U.S. Government & Federal Agencies | — | | 24,625,985 | | — | | 24,625,985 |
| Total Long-Term Bonds | — | | 102,461,066 | | — | | 102,461,066 |
| Exchange-Traded Fund | 1,539,832 | | — | | — | | 1,539,832 |
| Short-Term Investment | | | | | | | |
| Unaffiliated Investment Company | — | | 2,553,782 | | — | | 2,553,782 |
| Total Investments in Securities | 1,539,832 | | 105,014,848 | | — | | 106,554,680 |
| Other Financial Instruments | | | | | | | |
| Futures Contracts (b) | 210,989 | | — | | — | | 210,989 |
| Total Investments in Securities and Other Financial Instruments | $ 1,750,821 | | $ 105,014,848 | | $ — | | $ 106,765,669 |
| Liability Valuation Inputs | | | | | | | |
| Other Financial Instruments | | | | | | | |
| Futures Contracts (b) | $ (23,205) | | $ — | | $ — | | $ (23,205) |
| (a) | For a complete listing of investments and their industries, see the Portfolio of Investments. |
| (b) | The value listed for these securities reflects unrealized appreciation (depreciation) as shown on the Portfolio of Investments. |
The notes to the financial statements are an integral part of, and should be read in conjunction with, the financial statements.
17
Statement of Assets and Liabilities as of April 30, 2021 (Unaudited)
| Assets |
Investment in securities, at value
(identified cost $105,982,325) | $106,554,680 |
| Cash collateral on deposit at broker for futures contracts | 204,082 |
| Cash | 3,014,744 |
| Receivables: | |
| Investment securities sold | 1,106,894 |
| Interest | 427,241 |
| Fund shares sold | 345,521 |
| Other assets | 47,784 |
| Total assets | 111,700,946 |
| Liabilities |
| Payables: | |
| Investment securities purchased | 4,894,707 |
| Fund shares redeemed | 610,200 |
| Professional fees | 45,442 |
| Manager (See Note 3) | 16,615 |
| Transfer agent (See Note 3) | 16,085 |
| Shareholder communication | 13,328 |
| Variation margin on futures contracts | 12,224 |
| NYLIFE Distributors (See Note 3) | 12,106 |
| Custodian | 11,632 |
| Accrued expenses | 1,872 |
| Distributions payable | 930 |
| Total liabilities | 5,635,141 |
| Net assets | $106,065,805 |
| Composition of Net Assets |
| Shares of beneficial interest outstanding (par value of $.001 per share) unlimited number of shares authorized | $ 10,761 |
| Additional paid-in-capital | 104,938,084 |
| | 104,948,845 |
| Total distributable earnings (loss) | 1,116,960 |
| Net assets | $106,065,805 |
| Class A | |
| Net assets applicable to outstanding shares | $57,561,207 |
| Shares of beneficial interest outstanding | 5,844,170 |
| Net asset value per share outstanding | $ 9.85 |
| Maximum sales charge (1.00% of offering price) | 0.10 |
| Maximum offering price per share outstanding | $ 9.95 |
| Investor Class | |
| Net assets applicable to outstanding shares | $ 3,536,705 |
| Shares of beneficial interest outstanding | 356,558 |
| Net asset value per share outstanding | $ 9.92 |
| Maximum sales charge (0.50% of offering price) | 0.05 |
| Maximum offering price per share outstanding | $ 9.97 |
| Class I | |
| Net assets applicable to outstanding shares | $44,942,750 |
| Shares of beneficial interest outstanding | 4,557,402 |
| Net asset value and offering price per share outstanding | $ 9.86 |
| SIMPLE Class | |
| Net assets applicable to outstanding shares | $ 25,143 |
| Shares of beneficial interest outstanding | 2,535 |
| Net asset value and offering price per share outstanding | $ 9.92 |
The notes to the financial statements are an integral part of, and should be read in conjunction with, the financial statements.
| 18 | MainStay Short Term Bond Fund |
Statement of Operations for the six months ended April 30, 2021 (Unaudited)
| Investment Income (Loss) |
| Income | |
| Interest | $ 612,993 |
| Dividends | 16,038 |
| Other | 57 |
| Total income | 629,088 |
| Expenses | |
| Manager (See Note 3) | 108,088 |
| Distribution/Service—Class A (See Note 3) | 62,218 |
| Distribution/Service—Investor Class (See Note 3) | 4,157 |
| Distribution/Service—SIMPLE Class (See Note 3) | 62 |
| Transfer agent (See Note 3) | 43,835 |
| Registration | 39,999 |
| Professional fees | 36,059 |
| Custodian | 14,811 |
| Shareholder communication | 9,446 |
| Trustees | 833 |
| Miscellaneous | 6,006 |
| Total expenses before waiver/reimbursement | 325,514 |
| Expense waiver/reimbursement from Manager (See Note 3) | (39,268) |
| Net expenses | 286,246 |
| Net investment income (loss) | 342,842 |
| Realized and Unrealized Gain (Loss) |
| Net realized gain (loss) on: | |
| Investment transactions | 123,527 |
| Futures transactions | 322,914 |
| Net realized gain (loss) | 446,441 |
| Net change in unrealized appreciation (depreciation) on: | |
| Investments | (176,904) |
| Futures contracts | 132,350 |
| Net change in unrealized appreciation (depreciation) | (44,554) |
| Net realized and unrealized gain (loss) | 401,887 |
| Net increase (decrease) in net assets resulting from operations | $ 744,729 |
The notes to the financial statements are an integral part of, and should be read in conjunction with, the financial statements.
19
Statements of Changes in Net Assets
for the six months ended April 30, 2021 (Unaudited) and the year ended October 31, 2020
| | 2021 | 2020 |
| Increase (Decrease) in Net Assets |
| Operations: | | |
| Net investment income (loss) | $ 342,842 | $ 1,978,995 |
| Net realized gain (loss) | 446,441 | 12,270,458 |
| Net change in unrealized appreciation (depreciation) | (44,554) | (12,608,886) |
| Net increase (decrease) in net assets resulting from operations | 744,729 | 1,640,567 |
| Distributions to shareholders: | | |
| Class A | (4,313,325) | (985,038) |
| Investor Class | (298,569) | (114,145) |
| Class I | (2,666,047) | (3,110,582) |
| SIMPLE Class | (2,207) | (26) |
| Total distributions to shareholders | (7,280,148) | (4,209,791) |
| Capital share transactions: | | |
| Net proceeds from sales of shares | 67,485,307 | 101,741,689 |
| Net asset value of shares issued to shareholder in reinvestment of distributions | 7,203,451 | 4,173,588 |
| Cost of shares redeemed | (42,270,749) | (340,777,292) |
| Increase (decrease) in net assets derived from capital share transactions | 32,418,009 | (234,862,015) |
| Net increase (decrease) in net assets | 25,882,590 | (237,431,239) |
| Net Assets |
| Beginning of period | 80,183,215 | 317,614,454 |
| End of period | $106,065,805 | $ 80,183,215 |
The notes to the financial statements are an integral part of, and should be read in conjunction with, the financial statements.
| 20 | MainStay Short Term Bond Fund |
Financial Highlights selected per share data and ratios
| | Six months ended
April 30,
2021* | | Year Ended October 31, |
| Class A | 2020 | | 2019 | | 2018 | | 2017 | | 2016 |
| Net asset value at beginning of period | $ 10.72 | | $ 10.91 | | $ 10.09 | | $ 10.66 | | $ 11.01 | | $ 10.99 |
| Net investment income (loss) | 0.04 | | 0.15 | | 0.27 | | 0.24 | | 0.23 | | 0.23 |
| Net realized and unrealized gain (loss) on investments | 0.06 | | 0.05 | | 0.82 | | (0.54) | | (0.22) | | 0.14 |
| Total from investment operations | 0.10 | | 0.20 | | 1.09 | | (0.30) | | 0.01 | | 0.37 |
| Less distributions: | | | | | | | | | | | |
| From net investment income | (0.05) | | (0.17) | | (0.27) | | (0.24) | | (0.23) | | (0.24) |
| From net realized gain on investments | (0.92) | | (0.22) | | — | | (0.03) | | (0.13) | | (0.11) |
| Total distributions | (0.97) | | (0.39) | | (0.27) | | (0.27) | | (0.36) | | (0.35) |
| Net asset value at end of period | $ 9.85 | | $ 10.72 | | $ 10.91 | | $ 10.09 | | $ 10.66 | | $ 11.01 |
| Total investment return (a) | 0.95% | | 2.00% | | 10.77% | | (2.82)% | | 0.23% | | 3.50% |
| Ratios (to average net assets)/Supplemental Data: | | | | | | | | | | | |
| Net investment income (loss) | 0.74%†† | | 1.32% | | 2.50% | | 2.26% | | 2.13% | | 2.09% (b) |
| Net expenses (c) | 0.82%†† | | 0.72% | | 0.60% | | 0.63% | | 0.71% | | 0.67% (d) |
| Expenses (before waiver/reimbursement) (c) | 0.83%†† | | 0.75% | | 0.60% | | 0.63% | | 0.71% | | 0.67% |
| Portfolio turnover rate | 133% | | 299% (e) | | 75% (e) | | 103% (e) | | 89% (e) | | 89% (e) |
| Net assets at end of period (in 000’s) | $ 57,561 | | $ 43,452 | | $ 23,771 | | $ 17,506 | | $ 22,258 | | $ 36,822 |
| * | Unaudited. |
| †† | Annualized. |
| (a) | Total investment return is calculated exclusive of sales charges and assumes the reinvestment of dividends and distributions. For periods of less than one year, total return is not annualized. |
| (b) | Without the custody fee reimbursement, net investment income (loss) would have been 2.01%. |
| (c) | In addition to the fees and expenses which the Fund bears directly, it also indirectly bears a pro-rata share of the fees and expenses of the underlying funds in which it invests. Such indirect expenses are not included in the above expense ratios. |
| (d) | Without the custody fee reimbursement, net expenses would have been 0.75%. |
| (e) | The portfolio turnover rates not including mortgage dollar rolls were 298%, 72%, 72%, 82% and 76% for the years ended October 31, 2020, 2019, 2018, 2017 and 2016, respectively. |
The notes to the financial statements are an integral part of, and should be read in conjunction with, the financial statements.
21
Financial Highlights selected per share data and ratios
| | Six months ended
April 30,
2021* | | Year Ended October 31, |
| Investor Class | 2020 | | 2019 | | 2018 | | 2017 | | 2016 |
| Net asset value at beginning of period | $ 10.79 | | $ 10.97 | | $ 10.15 | | $ 10.71 | | $ 11.06 | | $ 11.04 |
| Net investment income (loss) | 0.03 | | 0.13 | | 0.23 | | 0.21 | | 0.22 | | 0.21 |
| Net realized and unrealized gain (loss) on investments | 0.06 | | 0.06 | | 0.82 | | (0.53) | | (0.23) | | 0.14 |
| Total from investment operations | 0.09 | | 0.19 | | 1.05 | | (0.32) | | (0.01) | | 0.35 |
| Less distributions: | | | | | | | | | | | |
| From net investment income | (0.04) | | (0.15) | | (0.23) | | (0.21) | | (0.21) | | (0.22) |
| From net realized gain on investments | (0.92) | | (0.22) | | — | | (0.03) | | (0.13) | | (0.11) |
| Total distributions | (0.96) | | (0.37) | | (0.23) | | (0.24) | | (0.34) | | (0.33) |
| Net asset value at end of period | $ 9.92 | | $ 10.79 | | $ 10.97 | | $ 10.15 | | $ 10.71 | | $ 11.06 |
| Total investment return (a) | 0.89% | | 1.76% | | 10.46% | | (2.99)% | | (0.01)% | | 3.31% |
| Ratios (to average net assets)/Supplemental Data: | | | | | | | | | | | |
| Net investment income (loss) | 0.63%†† | | 1.18% | | 2.18% | | 1.98% | | 1.92% | | 1.92% (b) |
| Net expenses (c) | 0.92%†† | | 0.92% | | 0.92% | | 0.92% | | 0.92% | | 0.84% (d) |
| Expenses (before waiver/reimbursement) (c) | 1.29%†† | | 1.22% | | 1.12% | | 1.13% | | 0.98% | | 0.98% |
| Portfolio turnover rate | 133% | | 299% (e) | | 75% (e) | | 103% (e) | | 89% (e) | | 89% (e) |
| Net assets at end of period (in 000’s) | $ 3,537 | | $ 3,376 | | $ 3,433 | | $ 2,850 | | $ 3,094 | | $ 5,381 |
| * | Unaudited. |
| †† | Annualized. |
| (a) | Total investment return is calculated exclusive of sales charges and assumes the reinvestment of dividends and distributions. For periods of less than one year, total return is not annualized. |
| (b) | Without the custody fee reimbursement, net investment income (loss) would have been 1.84%. |
| (c) | In addition to the fees and expenses which the Fund bears directly, it also indirectly bears a pro-rata share of the fees and expenses of the underlying funds in which it invests. Such indirect expenses are not included in the above expense ratios. |
| (d) | Without the custody fee reimbursement, net expenses would have been 0.92%. |
| (e) | The portfolio turnover rates not including mortgage dollar rolls were 298%, 72%, 72%, 82% and 76% for the years ended October 31, 2020, 2019, 2018, 2017 and 2016, respectively. |
The notes to the financial statements are an integral part of, and should be read in conjunction with, the financial statements.
| 22 | MainStay Short Term Bond Fund |
Financial Highlights selected per share data and ratios
| | Six months ended
April 30,
2021* | | Year Ended October 31, |
| Class I | 2020 | | 2019 | | 2018 | | 2017 | | 2016 |
| Net asset value at beginning of period | $ 10.74 | | $ 10.92 | | $ 10.10 | | $ 10.67 | | $ 11.02 | | $ 11.00 |
| Net investment income (loss) | 0.04 | | 0.25 | | 0.29 | | 0.25 | | 0.28 | | 0.27 |
| Net realized and unrealized gain (loss) on investments | 0.07 | | (0.01) | | 0.82 | | (0.52) | | (0.23) | | 0.14 |
| Total from investment operations | 0.11 | | 0.24 | | 1.11 | | (0.27) | | 0.05 | | 0.41 |
| Less distributions: | | | | | | | | | | | |
| From net investment income | (0.07) | | (0.20) | | (0.29) | | (0.27) | | (0.27) | | (0.28) |
| From net realized gain on investments | (0.92) | | (0.22) | | — | | (0.03) | | (0.13) | | (0.11) |
| Total distributions | (0.99) | | (0.42) | | (0.29) | | (0.30) | | (0.40) | | (0.39) |
| Net asset value at end of period | $ 9.86 | | $ 10.74 | | $ 10.92 | | $ 10.10 | | $ 10.67 | | $ 11.02 |
| Total investment return (a) | 1.06% | | 2.29% | | 11.14% | | (2.57)% | | 0.53% | | 3.86% |
| Ratios (to average net assets)/Supplemental Data: | | | | | | | | | | | |
| Net investment income (loss) | 0.89%†† | | 1.78% | | 2.77% | | 2.58% | | 2.44% | | 2.43% (b) |
| Net expenses (c) | 0.40%†† | | 0.40% | | 0.35% | | 0.37% | | 0.40% | | 0.32% (d) |
| Expenses (before waiver/reimbursement) (c) | 0.58%†† | | 0.48% | | 0.35% | | 0.37% | | 0.46% | | 0.50% |
| Portfolio turnover rate | 133% | | 299% (e) | | 75% (e) | | 103% (e) | | 89% (e) | | 89% (e) |
| Net assets at end of period (in 000’s) | $ 44,943 | | $ 33,330 | | $ 290,411 | | $ 285,216 | | $ 109,750 | | $ 195,784 |
| * | Unaudited. |
| †† | Annualized. |
| (a) | Total investment return is calculated exclusive of sales charges and assumes the reinvestment of dividends and distributions. Class I shares are not subject to sales charges. For periods of less than one year, total return is not annualized. |
| (b) | Without the custody fee reimbursement, net investment income (loss) would have been 2.35%. |
| (c) | In addition to the fees and expenses which the Fund bears directly, it also indirectly bears a pro-rata share of the fees and expenses of the underlying funds in which it invests. Such indirect expenses are not included in the above expense ratios. |
| (d) | Without the custody fee reimbursement, net expenses would have been 0.40%. |
| (e) | The portfolio turnover rates not including mortgage dollar rolls were 298%, 72%, 72%, 82% and 76% for the years ended October 31, 2020, 2019, 2018, 2017 and 2016, respectively. |
The notes to the financial statements are an integral part of, and should be read in conjunction with, the financial statements.
23
Financial Highlights selected per share data and ratios
| | Six months ended
April 30,
2021* | | August 31, 2020^ through
October 31, |
| SIMPLE Class | 2020 |
| Net asset value at beginning of period | $ 10.79 | | $ 10.82** |
| Net investment income (loss) | 0.02 | | 0.01 |
| Net realized and unrealized gain (loss) on investments | 0.06 | | (0.03) |
| Total from investment operations | 0.08 | | (0.02) |
| Less distributions: | | | |
| From net investment income | (0.03) | | (0.01) |
| From net realized gain on investments | (0.92) | | — |
| Total distributions | (0.95) | | (0.01) |
| Net asset value at end of period | $ 9.92 | | $ 10.79 |
| Total investment return (a) | 0.77% | | (0.17)% |
| Ratios (to average net assets)/Supplemental Data: | | | |
| Net investment income (loss)†† | 0.45% | | 0.38% |
| Net expenses†† (b) | 1.17% | | 1.17% |
| Expenses (before waiver/reimbursement)†† (b) | 1.53% | | 1.55% |
| Portfolio turnover rate | 133% | | 299% (c) |
| Net assets at end of period (in 000’s) | $ 25 | | $ 25 |
| * | Unaudited. |
| ^ | Inception date. |
| ** | Based on the net asset value of Investor Class as of August 31, 2020. |
| †† | Annualized. |
| (a) | Total investment return is calculated exclusive of sales charges and assumes the reinvestment of dividends and distributions. SIMPLE Class shares are not subject to sales charges. For periods of less than one year, total return is not annualized. |
| (b) | In addition to the fees and expenses which the Fund bears directly, it also indirectly bears a pro-rata share of the fees and expenses of the underlying funds in which it invests. Such indirect expenses are not included in the above expense ratios. |
| (c) | The portfolio turnover rate not including mortgage dollar rolls was 298% for the year ended October 31, 2020. |
The notes to the financial statements are an integral part of, and should be read in conjunction with, the financial statements.
| 24 | MainStay Short Term Bond Fund |
Notes to Financial Statements (Unaudited)
Note 1-Organization and Business
MainStay Funds Trust (the “Trust”) was organized as a Delaware statutory trust on April 28, 2009. The Trust is registered under the Investment Company Act of 1940, as amended (the “1940 Act”), as an open-end management investment company, and is comprised of thirty-two funds (collectively referred to as the “Funds”). These financial statements and notes relate to the MainStay Short Term Bond Fund (the "Fund"), a “diversified” fund, as that term is defined in the 1940 Act, as interpreted or modified by regulatory authorities having jurisdiction, from time to time.
The following table lists the Fund's share classes that have been registered and commenced operations:
| Class | Commenced Operations |
| Class A | January 2, 2004 |
| Investor Class | February 28, 2008 |
| Class I | January 2, 1991 |
| Class R6 | N/A* |
| SIMPLE Class | August 31, 2020 |
| * | Class R6 shares were registered for sale effective as of February 28, 2017 but have not yet commenced operations. |
Class A and Investor Class shares are offered at net asset value (“NAV”) per share plus an initial sales charge. No initial sales charge applies to investments of $250,000 or more (and certain other qualified purchases) in Class A and Investor Class shares. However, a contingent deferred sales charge (“CDSC”) of 0.50% may be imposed on certain redemptions made within 12 months of the date of purchase on shares that were purchased without an initial sales charge. Class I and SIMPLE Class shares are offered at NAV without a sales charge. Class R6 shares are currently expected to be offered at NAV without a sales charge. Additionally, Investor Class shares may convert automatically to Class A shares. SIMPLE Class shares convert to Class A shares, or Investor Class shares if you are not eligible to hold Class A shares, at the end of the calendar quarter, ten years after the date they were purchased. Share class conversions are based on the relevant NAVs of the two classes at the time of the conversion, and no sales load or other charge is imposed. Under certain circumstances and as may be permitted by the Trust’s multiple class plan pursuant to Rule 18f-3 under the 1940 Act, specified share classes of the Fund may be converted to one or more other share classes of the Fund as disclosed in the capital share transactions within these Notes. The classes of shares have the same voting (except for issues that relate solely to one class), dividend, liquidation and other rights, and the same terms and conditions, except that under distribution plans pursuant to Rule 12b-1 under the 1940 Act, Class A, Investor Class and SIMPLE Class shares are subject to a distribution and/or service fee. Class I and Class R6 shares are not subject to a distribution and/or service fee.
The Fund's investment objective is to seek current income consistent with capital preservation.
Note 2–Significant Accounting Policies
The Fund is an investment company and accordingly follows the investment company accounting and reporting guidance of the Financial Accounting Standards Board (“FASB”) Accounting Standard Codification Topic 946 Financial Services—Investment Companies. The Fund prepares its financial statements in accordance with generally accepted accounting principles (“GAAP”) in the United States of America and follows the significant accounting policies described below.
(A) Securities Valuation. Investments are usually valued as of the close of regular trading on the New York Stock Exchange (the "Exchange") (usually 4:00 p.m. Eastern time) on each day the Fund is open for business ("valuation date").
The Board of Trustees of the Trust (the "Board") adopted procedures establishing methodologies for the valuation of the Fund's securities and other assets and delegated the responsibility for valuation determinations under those procedures to the Valuation Committee of the Trust (the “Valuation Committee”). The procedures state that, subject to the oversight of the Board and unless otherwise noted, the responsibility for the day-to-day valuation of portfolio assets (including fair value measurements for the Fund's assets and liabilities) rests with New York Life Investment Management LLC (“New York Life Investments” or the "Manager"), aided to whatever extent necessary by the Subadvisor (as defined in Note 3(A)). To assess the appropriateness of security valuations, the Manager, the Subadvisor or the Fund's third-party service provider, who is subject to oversight by the Manager, regularly compares prior day prices, prices on comparable securities and the sale prices to the prior and current day prices and challenges prices with changes exceeding certain tolerance levels with third-party pricing services or broker sources.
The Board authorized the Valuation Committee to appoint a Valuation Subcommittee (the “Subcommittee”) to establish the prices of securities for which market quotations are not readily available or the prices of which are not otherwise readily determinable under the procedures. The Subcommittee meets (in person, via electronic mail or via teleconference) on an as-needed basis. The Valuation Committee meets to ensure that actions taken by the Subcommittee were appropriate.
For those securities valued through either a standardized fair valuation methodology or a fair valuation measurement, the Subcommittee deals with such valuation and the Valuation Committee reviews and affirms, if appropriate, the reasonableness of the valuation based on such methodologies and measurements on a regular basis after considering information that is reasonably available and deemed relevant by the Valuation Committee. Any action taken by the Subcommittee with respect to the valuation of a portfolio security or other asset is submitted for review and ratification (if appropriate) to the Valuation Committee and the Board at the next regularly scheduled meeting.
"Fair value" is defined as the price the Fund would reasonably expect to receive upon selling an asset or liability in an orderly transaction to an independent buyer in the principal or most advantageous market for the
Notes to Financial Statements (Unaudited) (continued)
asset or liability. Fair value measurements are determined within a framework that establishes a three-tier hierarchy that maximizes the use of observable market data and minimizes the use of unobservable inputs to establish a classification of fair value measurements for disclosure purposes. "Inputs" refer broadly to the assumptions that market participants would use in pricing the asset or liability, including assumptions about risk, such as the risk inherent in a particular valuation technique used to measure fair value using a pricing model and/or the risk inherent in the inputs for the valuation technique. Inputs may be observable or unobservable. Observable inputs reflect the assumptions market participants would use in pricing the asset or liability based on market data obtained from sources independent of the Fund. Unobservable inputs reflect the Fund’s own assumptions about the assumptions market participants would use in pricing the asset or liability based on the information available. The inputs or methodology used for valuing assets or liabilities may not be an indication of the risks associated with investing in those assets or liabilities. The three-tier hierarchy of inputs is summarized below.
| • | Level 1—quoted prices in active markets for an identical asset or liability |
| • | Level 2—other significant observable inputs (including quoted prices for a similar asset or liability in active markets, interest rates and yield curves, prepayment speeds, credit risk, etc.) |
| • | Level 3—significant unobservable inputs (including the Fund's own assumptions about the assumptions that market participants would use in measuring fair value of an asset or liability) |
The level of an asset or liability within the fair value hierarchy is based on the lowest level of an input, both individually and in the aggregate, that is significant to the fair value measurement. The aggregate value by input level of the Fund’s assets and liabilities as of April 30, 2021, is included at the end of the Portfolio of Investments.
The Fund may use third-party vendor evaluations, whose prices may be derived from one or more of the following standard inputs, among others:
| • Benchmark yields | • Reported trades |
| • Broker/dealer quotes | • Issuer spreads |
| • Two-sided markets | • Benchmark securities |
| • Bids/offers | • Reference data (corporate actions or material event notices) |
| • Industry and economic events | • Comparable bonds |
| • Monthly payment information | |
An asset or liability for which market values cannot be measured using the methodologies described above is valued by methods deemed reasonable in good faith by the Valuation Committee, following the procedures established by the Board, to represent fair value. Under these procedures, the Fund generally uses a market-based approach which may use related or comparable assets or liabilities, recent transactions, market multiples, book values and other relevant information. The Fund may also use an income-based valuation approach in which the
anticipated future cash flows of the asset or liability are discounted to calculate fair value. Discounts may also be applied due to the nature and/or duration of any restrictions on the disposition of the asset or liability. Fair value represents a good faith approximation of the value of a security. Fair value determinations involve the consideration of a number of subjective factors, an analysis of applicable facts and circumstances and the exercise of judgment. As a result, it is possible that the fair value for a security determined in good faith in accordance with the Fund's valuation procedures may differ from valuations for the same security determined by other funds using their own valuation procedures. Although the Fund's valuation procedures are designed to value a security at the price the Fund may reasonably expect to receive upon the security's sale in an orderly transaction, there can be no assurance that any fair value determination thereunder would, in fact, approximate the amount that the Fund would actually realize upon the sale of the security or the price at which the security would trade if a reliable market price were readily available. During the six-month period ended April 30, 2021, there were no material changes to the fair value methodologies.
Securities which may be valued in this manner include, but are not limited to: (i) a security for which trading has been halted or suspended; (ii) a debt security that has recently gone into default and for which there is not a current market quotation; (iii) a security of an issuer that has entered into a restructuring; (iv) a security that has been delisted from a national exchange; (v) a security for which the market price is not readily available from a third-party pricing source or, if so provided, does not, in the opinion of the Manager or the Subadvisor, reflect the security's market value; (vi) a security subject to trading collars for which no or limited trading takes place; and (vii) a security whose principal market has been temporarily closed at a time when, under normal conditions, it would be open. Securities valued in this manner are generally categorized as Level 3 in the hierarchy. No securities held by the Fund as of April 30, 2021 were fair valued in such a manner.
Exchange-traded funds (“ETFs”) are valued at the last quoted sales prices as of the close of regular trading on the relevant exchange on each valuation date. Securities that are not traded on the valuation date are valued at the mean of the last quoted bid and ask prices. Prices are normally taken from the principal market in which each security trades. These securities are generally categorized as Level 1 in the hierarchy.
Investments in mutual funds, including money market funds, are valued at their respective NAVs at the close of business each day on the valuation date. These securities are generally categorized as Level 1 in the hierarchy.
Futures contracts are valued at the last posted settlement price on the market where such futures are primarily traded. These securities are generally categorized as Level 1 in the hierarchy.
Debt securities (other than convertible and municipal bonds) are valued at the evaluated bid prices (evaluated mean prices in the case of convertible and municipal bonds) supplied by a pricing agent or broker selected by the Manager, in consultation with the Subadvisor. The evaluations are market-based measurements processed through a pricing application
| 26 | MainStay Short Term Bond Fund |
and represents the pricing agent’s good faith determination as to what a holder may receive in an orderly transaction under market conditions. The rules based logic utilizes valuation techniques that reflect participants’ assumptions and vary by asset class and per methodology, maximizing the use of relevant observable data including quoted prices for similar assets, benchmark yield curves and market corroborated inputs. The evaluated bid or mean prices are deemed by the Manager, in consultation with the Subadvisor, to be representative of market values at the regular close of trading of the Exchange on each valuation date. Debt securities purchased on a delayed delivery basis are marked to market daily until settlement at the forward settlement date. Debt securities, including corporate bonds, U.S. government and federal agency bonds, municipal bonds, foreign bonds, convertible bonds, asset-backed securities and mortgage-backed securities are generally categorized as Level 2 in the hierarchy.
Temporary cash investments acquired in excess of 60 days to maturity at the time of purchase are valued using the latest bid prices or using valuations based on a matrix system (which considers such factors as security prices, yields, maturities and ratings), both as furnished by independent pricing services. Temporary cash investments that mature in 60 days or less at the time of purchase ("Short-Term Investments") are valued using the amortized cost method of valuation, unless the use of such method would be inappropriate. The amortized cost method involves valuing a security at its cost on the date of purchase and thereafter assuming a constant amortization to maturity of the difference between such cost and the value on maturity date. Amortized cost approximates the current fair value of a security. Securities valued using the amortized cost method are not valued using quoted prices in an active market and are generally categorized as Level 2 in the hierarchy.
The information above is not intended to reflect an exhaustive list of the methodologies that may be used to value portfolio investments. The valuation procedures permit the use of a variety of valuation methodologies in connection with valuing portfolio investments. The methodology used for a specific type of investment may vary based on the market data available or other considerations. The methodologies summarized above may not represent the specific means by which portfolio investments are valued on any particular business day.
(B) Income Taxes. The Fund's policy is to comply with the requirements of the Internal Revenue Code of 1986, as amended (the “Internal Revenue Code”), applicable to regulated investment companies and to distribute all of its taxable income to the shareholders of the Fund within the allowable time limits.
The Manager evaluates the Fund’s tax positions to determine if the tax positions taken meet the minimum recognition threshold in connection with accounting for uncertainties in income tax positions taken or expected to be taken for the purposes of measuring and recognizing tax liabilities in the financial statements. Recognition of tax benefits of an uncertain tax position is permitted only to the extent the position is “more likely than not” to be sustained assuming examination by taxing authorities. The Manager analyzed the Fund's tax positions taken on
federal, state and local income tax returns for all open tax years (for up to three tax years) and has concluded that no provisions for federal, state and local income tax are required in the Fund's financial statements. The Fund's federal, state and local income tax and federal excise tax returns for tax years for which the applicable statutes of limitations have not expired are subject to examination by the Internal Revenue Service and state and local departments of revenue.
(C) Dividends and Distributions to Shareholders. Dividends and distributions are recorded on the ex-dividend date. The Fund intends to declare and pay dividends from net investment income, if any, at least monthly and distributions from net realized capital and currency gains, if any, at least annually. Unless a shareholder elects otherwise, all dividends and distributions are reinvested at NAV in the same class of shares of the Fund. Dividends and distributions to shareholders are determined in accordance with federal income tax regulations and may differ from determinations using GAAP.
(D) Security Transactions and Investment Income. The Fund records security transactions on the trade date. Realized gains and losses on security transactions are determined using the identified cost method. Interest income is accrued as earned using the effective interest rate method and includes any realized gains and losses from repayments of principal on mortgage-backed securities. Distributions received from real estate investment trusts may be classified as dividends, capital gains and/or return of capital. Discounts and premiums on securities purchased, other than temporary cash investments that mature in 60 days or less at the time of purchase, for the Fund are accreted and amortized, respectively, on the effective interest rate method.
Investment income and realized and unrealized gains and losses on investments of the Fund are allocated pro rata to the separate classes of shares based upon their relative net assets on the date the income is earned or realized and unrealized gains and losses are incurred.
The Fund may place a debt security on non-accrual status and reduce related interest income by ceasing current accruals and writing off all or a portion of any interest receivables when the collection of all or a portion of such interest has become doubtful. A debt security is removed from non-accrual status when the issuer resumes interest payments or when collectability of interest is reasonably assured.
(E) Expenses. Expenses of the Trust are allocated to the individual Funds in proportion to the net assets of the respective Funds when the expenses are incurred, except where direct allocations of expenses can be made. Expenses (other than transfer agent expenses and fees incurred under the shareholder services plans and/or the distribution plans further discussed in Note 3(B)) are allocated to separate classes of shares pro rata based upon their relative net assets on the date the expenses are incurred. The expenses borne by the Fund, including those of related parties to the Fund, are shown in the Statement of Operations.
Additionally, the Fund may invest in mutual funds, which are subject to management fees and other fees that may cause the costs of investing in mutual funds to be greater than the costs of owning the underlying
Notes to Financial Statements (Unaudited) (continued)
securities directly. These indirect expenses of mutual funds are not included in the amounts shown as expenses in the Statement of Operations or in the expense ratios included in the Financial Highlights.
(F) Use of Estimates. In preparing financial statements in conformity with GAAP, the Manager makes estimates and assumptions that affect the reported amounts and disclosures in the financial statements. Actual results could differ from those estimates and assumptions.
(G) Futures Contracts. A futures contract is an agreement to purchase or sell a specified quantity of an underlying instrument at a specified future date and price, or to make or receive a cash payment based on the value of a financial instrument (e.g., foreign currency, interest rate, security or securities index). The Fund is subject to risks such as market price risk and/or interest rate risk in the normal course of investing in these contracts. Upon entering into a futures contract, the Fund is required to pledge to the broker or futures commission merchant an amount of cash and/or U.S. government securities equal to a certain percentage of the collateral amount, known as the “initial margin.” During the period the futures contract is open, changes in the value of the contract are recognized as unrealized appreciation or depreciation by marking to market such contract on a daily basis to reflect the market value of the contract at the end of each day’s trading. The Fund agrees to receive from or pay to the broker or futures commission merchant an amount of cash equal to the daily fluctuation in the value of the contract. Such receipts or payments are known as “variation margin.” When the futures contract is closed, the Fund records a realized gain or loss equal to the difference between the proceeds from (or cost of) the closing transaction and the Fund's basis in the contract.
The use of futures contracts involves, to varying degrees, elements of market risk in excess of the amount recognized in the Statement of Assets and Liabilities. The contract or notional amounts and variation margin reflect the extent of the Fund's involvement in open futures positions. There are several risks associated with the use of futures contracts as hedging techniques. There can be no assurance that a liquid market will exist at the time when the Fund seeks to close out a futures contract. If no liquid market exists, the Fund would remain obligated to meet margin requirements until the position is closed. Futures contracts may involve a small initial investment relative to the risk assumed, which could result in losses greater than if the Fund did not invest in futures contracts. Futures contracts may be more volatile than direct investments in the instrument underlying the futures and may not correlate to the underlying instrument, causing a given hedge not to achieve its objectives. The Fund's activities in futures contracts have minimal counterparty risk as they are conducted through regulated exchanges that guarantee the futures against default by the counterparty. In the event of a bankruptcy or insolvency of a futures commission merchant that holds margin on behalf of the Fund, the Fund may not be entitled to the return of the entire margin owed to the Fund, potentially resulting in a loss. The Fund may invest in futures contracts to seek enhanced returns or to reduce the risk of loss by hedging certain of its holdings. The Fund's investment in futures contracts and other derivatives may increase the
volatility of the Fund's NAVs and may result in a loss to the Fund. Open futures contracts as of April 30, 2021 are shown in the Portfolio of Investments.
(H) Securities Lending. In order to realize additional income, the Fund may engage in securities lending, subject to the limitations set forth in the 1940 Act and relevant guidance by the staff of the Securities and Exchange Commission (“SEC”). If the Fund engages in securities lending, the Fund will lend through its custodian, JPMorgan Chase Bank, N.A., ("JPMorgan"), acting as securities lending agent on behalf of the Fund. Under the current arrangement, JPMorgan will manage the Fund's collateral in accordance with the securities lending agency agreement between the Fund and JPMorgan, and indemnify the Fund against counterparty risk. The loans will be collateralized by cash (which may be invested in a money market fund) and/or non-cash collateral (which may include U.S. Treasury securities and/or U.S. government agency securities issued or guaranteed by the United States government or its agencies or instrumentalities) at least equal at all times to the market value of the securities loaned. The Fund bears the risk of delay in recovery of, or loss of rights in, the securities loaned. The Fund may also record a realized gain or loss on securities deemed sold due to a borrower’s inability to return securities on loan. The Fund bears the risk of any loss on investment of cash collateral. The Fund will receive compensation for lending its securities in the form of fees or it will retain a portion of interest earned on the investment of any cash collateral. The Fund will also continue to receive interest and dividends on the securities loaned and any gain or loss in the market price of the securities loaned that may occur during the term of the loan will be for the account of the Fund. Income earned from securities lending activities, if any, is reflected in the Statement of Operations. As of April 30, 2021, the Fund did not have any portfolio securities on loan.
Prior to November 23, 2020, these services were provided by State Street Bank and Trust Company (“State Street”).
(I) Dollar Rolls. The Fund may enter into dollar roll transactions in which it sells mortgage-backed securities ("MBS") from its portfolio to a counterparty from whom it simultaneously agrees to buy a similar security on a delayed delivery basis. The Fund generally transfers MBS where the MBS are "to be announced," therefore, the Fund accounts for these transactions as purchases and sales.
When accounted for as purchase and sales, the securities sold in connection with the dollar rolls are removed from the portfolio and a realized gain or loss is recognized. The securities the Fund has agreed to acquire are included at market value in the Portfolio of Investments and liabilities for such purchase commitments are included as payables for investments purchased. During the roll period, the Fund foregoes principal and interest paid on the securities. The Fund is compensated by the difference between the current sales price and the forward price for the future as well as by the earnings on the cash proceeds of the initial sale. Dollar rolls may be renewed without physical delivery of the securities subject to the contract. The Fund maintains liquid assets from its portfolio having a value not less than the repurchase price, including
| 28 | MainStay Short Term Bond Fund |
accrued interest. Dollar roll transactions involve certain risks, including the risk that the securities returned to the Fund at the end of the roll period, while substantially similar, could be inferior to what was initially sold to the counterparty.
(J) Delayed Delivery Transactions. The Fund may purchase or sell securities on a delayed delivery basis. These transactions involve a commitment by the Fund to purchase or sell securities for a predetermined price or yield, with payment and delivery taking place beyond the customary settlement period. When delayed delivery purchases are outstanding, the Fund will designate liquid assets in an amount sufficient to meet the purchase price. When purchasing a security on a delayed delivery basis, the Fund assumes the rights and risks of ownership of the security, including the risk of price and yield fluctuations, and takes such fluctuations into account when determining its NAV. The Fund may dispose of or renegotiate a delayed delivery transaction after it is entered into, and may sell delayed delivery securities before they are delivered, which may result in a realized gain or loss. When the Fund has sold a security it owns on a delayed delivery basis, the Fund does not participate in future gains and losses with respect to the security. As of April 30, 2021, delayed delivery transactions are shown in the Portfolio of Investments.
(K) Debt Securities Risk. Investments in the Fund are not guaranteed, even though some of the Fund’s underlying investments are guaranteed by the U.S. government or its agencies or instrumentalities. The principal risk of mortgage-related and asset-backed securities is that the underlying debt may be prepaid ahead of schedule, if interest rates fall, thereby reducing the value of the Fund’s investment. If interest rates rise, less of the debt may be prepaid and the Fund may lose money. The Fund is subject to interest-rate risk and its holdings in bonds can lose principal value when interest rates rise. Bonds are also subject to credit risk, in which the bond issuer may fail to pay interest and principal in a timely manner.
The Fund may invest in foreign debt securities, which carry certain risks that are in addition to the usual risks inherent in domestic debt securities. These risks include those resulting from currency fluctuations, future adverse political or economic developments and possible imposition of currency exchange blockages or other foreign governmental laws or restrictions. These risks are likely to be greater in emerging markets than in developed markets. The ability of issuers of securities held by the Fund to meet their obligations may be affected by, among other things, economic or political developments in a specific country, industry or region.
(L) LIBOR Replacement Risk. The Fund may invest in certain debt securities, derivatives or other financial instruments that utilize the London Interbank Offered Rate ("LIBOR"), as a “benchmark” or “reference rate” for various interest rate calculations. The United Kingdom Financial Conduct Authority, which regulates LIBOR, announced that after 2021 it will cease its active encouragement of banks to provide the quotations needed to sustain LIBOR. However, it is possible that certain LIBOR tenors may continue beyond 2021 and the most widely used LIBOR tenors may
continue until mid-2023. As a result, it is anticipated that LIBOR will be discontinued or will no longer be sufficiently robust to be representative of its underlying market around that time. Although financial regulators and industry working groups have suggested alternative reference rates, such as European Interbank Offer Rate (“EURIBOR”), Sterling Overnight Interbank Average Rate (“SONIA”) and Secured Overnight Financing Rate (“SOFR”), there are challenges to converting certain contracts and transactions to a new benchmark and neither the full effects of the transition process nor its ultimate outcome is known. New York Life Investments is currently working to assess exposure and will modify contracts as necessary.
The elimination of LIBOR or changes to other reference rates or any other changes or reforms to the determination or supervision of reference rates could have an adverse impact on the market for, or value of, any securities or payments linked to those reference rates, which may adversely affect the Fund's performance and/or net asset value. Uncertainty and risk also remain regarding the willingness and ability of issuers and lenders to include revised provisions in new and existing contracts or instruments. Consequently, the transition away from LIBOR to other reference rates may lead to increased volatility and illiquidity in markets that are tied to LIBOR, fluctuations in values of LIBOR-related investments or investments in issuers that utilize LIBOR, increased difficulty in borrowing or refinancing and diminished effectiveness of hedging strategies, adversely affecting the Fund's performance. Furthermore, the risks associated with the expected discontinuation of LIBOR and transition may be exacerbated if the work necessary to effect an orderly transition to an alternative reference rate is not completed in a timely manner. Because the usefulness of LIBOR as a benchmark could deteriorate during the transition period, these effects could occur prior to the end of 2021 with respect to certain LIBOR tenors or mid-2023 for the remaining LIBOR tenors.
(M) Indemnifications. Under the Trust’s organizational documents, its officers and trustees are indemnified against certain liabilities that may arise out of performance of their duties to the Trust. Additionally, in the normal course of business, the Fund enters into contracts with third-party service providers that contain a variety of representations and warranties and that may provide general indemnifications. The Fund's maximum exposure under these arrangements is unknown, as this would involve future claims that may be made against the Fund that have not yet occurred. The Manager believes that the risk of loss in connection with these potential indemnification obligations is remote. However, there can be no assurance that material liabilities related to such obligations will not arise in the future, which could adversely impact the Fund.
(N) Quantitative Disclosure of Derivative Holdings. The following tables show additional disclosures related to the Fund's derivative and hedging activities, including how such activities are accounted for and their effect on the Fund's financial positions, performance and cash flows.
The Fund entered into futures contracts to hedge against anticipated changes in interest rates that might otherwise have an adverse effect
Notes to Financial Statements (Unaudited) (continued)
upon the value of the Fund's securities as well as help manage the duration and yield curve positioning of the portolio. These derivatives are not accounted for as hedging instruments.
Fair value of derivative instruments as of April 30, 2021:
| Asset Derivatives | Interest
Rate
Contracts
Risk | Total |
| Futures Contracts - Net Assets—Net unrealized appreciation on futures contracts (a) | $210,989 | $210,989 |
| Total Fair Value | $210,989 | $210,989 |
| (a) | Includes cumulative appreciation (depreciation) of futures contracts as reported in the Portfolio of Investments. Only current day’s variation margin is reported within the Statement of Assets and Liabilities. |
| Liability Derivatives | Interest
Rate
Contracts
Risk | Total |
| Futures Contracts - Net Assets—Net unrealized depreciation on futures contracts (a) | $(23,205) | $(23,205) |
| Total Fair Value | $(23,205) | $(23,205) |
| (a) | Includes cumulative appreciation (depreciation) of futures contracts as reported in the Portfolio of Investments. Only current day’s variation margin is reported within the Statement of Assets and Liabilities. |
The effect of derivative instruments on the Statement of Operations for the six-month period ended April 30, 2021:
| Net Realized Gain (Loss) from: | Interest
Rate
Contracts
Risk | Total |
| Futures Contracts | $322,914 | $322,914 |
| Total Net Realized Gain (Loss) | $322,914 | $322,914 |
| Net Change in Unrealized Appreciation (Depreciation) | Interest
Rate
Contracts
Risk | Total |
| Futures Contracts | $132,350 | $132,350 |
| Total Net Change in Unrealized Appreciation (Depreciation) | $132,350 | $132,350 |
| Average Notional Amount | Total |
| Futures Contracts Long | $ 24,611,276 |
| Futures Contracts Short | $(20,491,461) |
Note 3–Fees and Related Party Transactions
(A) Manager and Subadvisor. New York Life Investments, a registered investment adviser and an indirect, wholly-owned subsidiary of New York Life Insurance Company ("New York Life"), serves as the Fund's Manager pursuant to an Amended and Restated Management Agreement
("Management Agreement"). The Manager provides offices, conducts clerical, recordkeeping and bookkeeping services and keeps most of the financial and accounting records required to be maintained by the Fund. Except for the portion of salaries and expenses that are the responsibility of the Fund, the Manager pays the salaries and expenses of all personnel affiliated with the Fund and certain operational expenses of the Fund. The Fund reimburses New York Life Investments in an amount equal to the portion of the compensation of the Chief Compliance Officer attributable to the Fund. NYL Investors LLC ("NYL Investors" or ''Subadvisor''), a registered investment adviser and a direct, wholly-owned subsidiary of New York Life, serves as Subadvisor to the Fund and is responsible for the day-to-day portfolio management of the Fund. Pursuant to the terms of a Subadvisory Agreement ("Subadvisory Agreement") between New York Life Investments and NYL Investors, New York Life Investments pays for the services of the Subadvisor.
Pursuant to the Management Agreement, the Fund pays the Manager a monthly fee for the services performed and the facilities furnished at an annual rate of the Fund’s average daily net assets as follows: 0.25% up to $1 billion and 0.20% in excess of $1 billion. During the six-month period ended April 30, 2021, the effective management fee rate was 0.25% of the Fund’s average daily net assets, exclusive of any applicable waivers/reimbursements.
New York Life Investments has contractually agreed to waive fees and/or reimburse expenses so that Total Annual Fund Operating Expenses (excluding taxes, interest, litigation, extraordinary expenses, brokerage and other transaction expenses relating to the purchase or sale of portfolio investments and acquired (underlying) fund fees and expenses) do not exceed the following percentages of average daily net assets: Class A, 0.82%; Investor Class, 0.92%; Class I, 0.40% and SIMPLE Class, 1.17%. This agreement will remain in effect until February 28, 2022, and shall renew automatically for one-year terms unless New York Life Investments provides written notice of termination prior to the start of the next term or upon approval of the Board.
During the six-month period ended April 30, 2021, New York Life Investments earned fees from the Fund in the amount of $108,088 and waived fees and/or reimbursed expenses in the amount of $39,268 and paid the Subadvisor fees in the amount of $34,410.
JPMorgan provides sub-administration and sub-accounting services to the Fund pursuant to an agreement with New York Life Investments. These services include calculating the daily NAVs of the Fund, maintaining the general ledger and sub-ledger accounts for the calculation of the Fund's NAVs, and assisting New York Life Investments in conducting various aspects of the Fund's administrative operations. For providing these services to the Fund, JPMorgan is compensated by New York Life Investments.
Prior to November 23, 2020, these services were provided by State Street.
Pursuant to an agreement between the Trust and New York Life Investments, New York Life Investments is responsible for providing or
| 30 | MainStay Short Term Bond Fund |
procuring certain regulatory reporting services for the Fund. The Fund will reimburse New York Life Investments for the actual costs incurred by New York Life Investments in connection with providing or procuring these services for the Fund.
(B) Distribution and Service Fees. The Trust, on behalf of the Fund, has entered into a distribution agreement with NYLIFE Distributors LLC (the “Distributor”), an affiliate of New York Life Investments. The Fund has adopted distribution plans (the “Plans”) in accordance with the provisions of Rule 12b-1 under the 1940 Act.
Pursuant to the Class A and Investor Class Plans, the Distributor receives a monthly distribution fee from the Class A and Investor Class shares at an annual rate of 0.25% of the average daily net assets of the Class A and Investor Class shares for distribution and/or service activities as designated by the Distributor. Pursuant to the SIMPLE Class Plan, SIMPLE Class shares pay the Distributor a monthly fee at an annual rate of 0.25% of the average daily net assets of the SIMPLE Class shares, along with a service fee at an annual rate of 0.25% of the average daily net assets of the SIMPLE Class shares, for a total 12b-1 fee of 0.50%. Class I shares are not subject to a distribution and/or service fee.
The Plans provide that the distribution and service fees are payable to the Distributor regardless of the amounts actually expended by the Distributor for distribution of the Fund's shares and service activities.
(C) Sales Charges. The Fund was advised by the Distributor that the amount of initial sales charges retained on sales of Class A and Investor Class shares during the six-month period ended April 30, 2021, were $749 and $3, respectively.
The Fund was also advised that the Distributor retained CDSCs on redemptions of Class A shares during the six-month period ended April 30, 2021, of $9,649.
(D) Transfer, Dividend Disbursing and Shareholder Servicing Agent. NYLIM Service Company LLC, an affiliate of New York Life Investments, is the Fund's transfer, dividend disbursing and shareholder servicing agent pursuant to an agreement between NYLIM Service Company LLC and the Trust. NYLIM Service Company LLC has entered into an agreement with DST Asset Manager Solutions, Inc. ("DST"), pursuant to which DST performs certain transfer agent services on behalf of NYLIM Service Company LLC. New York Life Investments has contractually agreed to limit the transfer agency expenses charged to the Fund’s share classes to a maximum of 0.35% of that share class’s average daily net assets on an annual basis after deducting any applicable Fund or class-level expense reimbursement or small account fees. This agreement will remain in effect until February 28, 2022, and shall renew automatically for one-year terms unless New York Life Investments provides written notice of termination prior to the start of the next term or upon approval of the Board. During the six-month period ended April 30, 2021, transfer agent expenses incurred by the Fund and
any reimbursements, pursuant to the aforementioned Transfer Agency expense limitation agreement, were as follows:
| Class | Expense | Waived |
| Class A | $20,825 | $— |
| Investor Class | 8,964 | — |
| Class I | 13,979 | — |
| SIMPLE Class | 67 | — |
(E) Small Account Fee. Shareholders with small accounts adversely impact the cost of providing transfer agency services. In an effort to reduce total transfer agency expenses, the Fund has implemented a small account fee on certain types of accounts. As described in the Fund's prospectus, certain shareholders with an account balance of less than $1,000 ($5,000 for Class A share accounts) are charged an annual per account fee of $20 (assessed semi-annually), the proceeds from which offset transfer agent fees as reflected in the Statement of Operations. This small account fee will not apply to certain types of accounts as described further in the Fund’s prospectus.
(F) Capital. As of April 30, 2021, New York Life and its affiliates beneficially held shares of the Fund with the values and percentages of net assets as follows:
| SIMPLE Class | $25,143 | 100.0% |
Note 4-Federal Income Tax
As of April 30, 2021, the cost and unrealized appreciation (depreciation) of the Fund’s investment portfolio, including applicable derivative contracts and other financial instruments, as determined on a federal income tax basis, were as follows:
| | Federal Tax
Cost | Gross
Unrealized
Appreciation | Gross
Unrealized
(Depreciation) | Net
Unrealized
Appreciation/
(Depreciation) |
| Investments | $105,989,300 | $890,040 | $(324,660) | $565,380 |
During the year ended October 31, 2020, the tax character of distributions paid as reflected in the Statements of Changes in Net Assets was as follows:
| | 2020 |
| Distributions paid from: | |
| Ordinary Income | $3,620,275 |
| Long-Term Capital Gains | 589,516 |
| Total | $4,209,791 |
Note 5–Custodian
JPMorgan is the custodian of cash and securities held by the Fund. Custodial fees are charged to the Fund based on the Fund's net assets and/or the market value of securities held by the Fund and the number of certain transactions incurred by the Fund.
Notes to Financial Statements (Unaudited) (continued)
Prior to November 23, 2020, these services were provided by State Street. The services provided by State Street were a direct expense of the Fund and are included in the Statement of Operations as Custodian fees which totaled $1,637 for the period November 1, 2020 through November 22, 2020.
Note 6–Line of Credit
The Fund and certain other funds managed by New York Life Investments maintain a line of credit with a syndicate of banks in order to secure a source of funds for temporary purposes to meet unanticipated or excessive redemption requests.
Effective July 28, 2020, under the credit agreement (the “Credit Agreement”), the aggregate commitment amount is $600,000,000 with an additional uncommitted amount of $100,000,000. The commitment fee is an annual rate of 0.15% of the average commitment amount payable quarterly, regardless of usage, to JPMorgan, who serves as the agent to the syndicate. The commitment fee is allocated among the Fund and certain other funds managed by New York Life Investments based upon their respective net assets and other factors. Interest on any revolving credit loan is charged based upon the Federal Funds Rate or the one-month London Interbank Offered Rate ("LIBOR"), whichever is higher. The Credit Agreement expires on July 27, 2021, although the Fund, certain other funds managed by New York Life Investments and the syndicate of banks may renew the Credit Agreement for an additional year on the same or different terms or enter into a credit agreement with a different syndicate of banks. Prior to July 28, 2020, the aggregate commitment amount and the commitment fee were the same as those under the current Credit Agreement, but State Street served as agent to the syndicate. During the six-month period ended April 30, 2021, there were no borrowings made or outstanding with respect to the Fund under the Credit Agreement or the credit agreement for which State Street served as agent.
Note 7–Interfund Lending Program
Pursuant to an exemptive order issued by the SEC, the Fund, along with certain other funds managed by New York Life Investments, may participate in an interfund lending program. The interfund lending program provides an alternative credit facility that permits the Fund and certain other funds managed by New York Life Investments to lend or borrow money for temporary purposes directly to or from one another, subject to the conditions of the exemptive order. During the six-month period ended April 30, 2021, there were no interfund loans made or outstanding with respect to the Fund.
Note 8–Purchases and Sales of Securities (in 000’s)
During the six-month period ended April 30, 2021, purchases and sales of U.S. government securities were $81,390 and $92,914, respectively. Purchases and sales of securities, other than U.S. government securities and short-term securities, were $58,676 and $21,181 respectively.
Note 9–Capital Share Transactions
Transactions in capital shares for the six-month period ended April 30, 2021 and the year ended October 31, 2020, were as follows:
| Class A | Shares | Amount |
| Period ended April 30, 2021: | | |
| Shares sold | 3,208,491 | $ 32,217,160 |
| Shares issued to shareholders in reinvestment of distributions | 434,795 | 4,289,632 |
| Shares redeemed | (1,878,913) | (18,783,548) |
| Net increase (decrease) in shares outstanding before conversion | 1,764,373 | 17,723,244 |
| Shares converted into Class A (See Note 1) | 28,377 | 280,862 |
| Shares converted from Class A (See Note 1) | (356) | (3,504) |
| Net increase (decrease) | 1,792,394 | $ 18,000,602 |
| Year ended October 31, 2020: | | |
| Shares sold | 3,064,011 | $ 32,464,295 |
| Shares issued to shareholders in reinvestment of distributions | 91,320 | 969,261 |
| Shares redeemed | (1,337,274) | (14,165,355) |
| Net increase (decrease) in shares outstanding before conversion | 1,818,057 | 19,268,201 |
| Shares converted into Class A (See Note 1) | 58,281 | 618,638 |
| Shares converted from Class A (See Note 1) | (4,184) | (43,689) |
| Net increase (decrease) | 1,872,154 | $ 19,843,150 |
| |
| Investor Class | Shares | Amount |
| Period ended April 30, 2021: | | |
| Shares sold | 70,433 | $ 706,136 |
| Shares issued to shareholders in reinvestment of distributions | 29,483 | 292,925 |
| Shares redeemed | (28,312) | (290,747) |
| Net increase (decrease) in shares outstanding before conversion | 71,604 | 708,314 |
| Shares converted into Investor Class (See Note 1) | 353 | 3,504 |
| Shares converted from Investor Class (See Note 1) | (28,180) | (280,862) |
| Net increase (decrease) | 43,777 | $ 430,956 |
| Year ended October 31, 2020: | | |
| Shares sold | 132,232 | $ 1,390,248 |
| Shares issued to shareholders in reinvestment of distributions | 10,491 | 112,091 |
| Shares redeemed | (89,128) | (950,967) |
| Net increase (decrease) in shares outstanding before conversion | 53,595 | 551,372 |
| Shares converted into Investor Class (See Note 1) | 4,156 | 43,689 |
| Shares converted from Investor Class (See Note 1) | (57,916) | (618,638) |
| Net increase (decrease) | (165) | $ (23,577) |
| |
| 32 | MainStay Short Term Bond Fund |
| Class I | Shares | Amount |
| Period ended April 30, 2021: | | |
| Shares sold | 3,477,207 | $ 34,562,011 |
| Shares issued to shareholders in reinvestment of distributions | 265,082 | 2,618,687 |
| Shares redeemed | (2,288,772) | (23,196,454) |
| Net increase (decrease) | 1,453,517 | $ 13,984,244 |
| Year ended October 31, 2020: | | |
| Shares sold | 6,369,691 | $ 67,862,146 |
| Shares issued to shareholders in reinvestment of distributions | 291,166 | 3,092,210 |
| Shares redeemed | (30,159,210) | (325,660,970) |
| Net increase (decrease) | (23,498,353) | $(254,706,614) |
| |
| SIMPLE Class | Shares | Amount |
| Period ended April 30, 2021: | | |
| Shares issued to shareholders in reinvestment of distributions | 222 | $ 2,207 |
| Net increase (decrease) | 222 | $ 2,207 |
| Period ended October 31, 2020:(a) | | |
| Shares sold | 2,311 | $ 25,000 |
| Shares issued to shareholders in reinvestment of distributions | 2 | 26 |
| Net increase (decrease) | 2,313 | $ 25,026 |
| (a) | The inception date of the SIMPLE Class was August 31, 2020. |
Note 10–Recent Accounting Pronouncement
In March 2020, the Financial Accounting Standards Board issued Accounting Standards Update 2020-04 (“ASU 2020-04”), which provides optional guidance to ease the potential accounting burden associated with transitioning away from LIBOR and other reference rates that are expected to be discontinued. ASU 2020-04 was effective immediately upon release of the update on March 12, 2020 and remains effective through December 31, 2022. At this time, the Manager is evaluating the implications of certain other provisions of ASU 2020-04 related to new disclosure requirements and any impact on the financial statement disclosures has not yet been determined.
Note 11–Other Matters
An outbreak of COVID-19, first detected in December 2019, has developed into a global pandemic and has resulted in travel restrictions, closure of international borders, certain businesses and securities markets, restrictions on securities trading activities, prolonged quarantines, supply chain disruptions, and lower consumer demand, as well as general concern and uncertainty. The continued impact of COVID-19 is uncertain and could further adversely affect the global economy, national economies, individual issuers and capital markets in unforeseeable ways and result in a substantial and extended economic downturn. Developments that disrupt global economies and financial
markets, such as COVID-19, may magnify factors that affect the Fund's performance.
Note 12–Subsequent Events
In connection with the preparation of the financial statements of the Fund as of and for the six-month period ended April 30, 2021, events and transactions subsequent to April 30, 2021, through the date the financial statements were issued have been evaluated by the Manager for possible adjustment and/or disclosure. No subsequent events requiring financial statement adjustment or disclosure have been identified.
Board Consideration and Approval of Management Agreement and Subadvisory Agreement (Unaudited)
The continuation of the Management Agreement with respect to the MainStay Short Term Bond Fund (“Fund”) and New York Life Investment Management LLC (“New York Life Investments”) and the Subadvisory Agreement between New York Life Investments and NYL Investors LLC (“NYL Investors”) with respect to the Fund (together, “Advisory Agreements”), following an initial term of up to two years, is subject to annual review and approval by the Board of Trustees of MainStay Funds Trust (“Board” of the “Trust”) in accordance with Section 15 of the Investment Company Act of 1940, as amended (“1940 Act”). At its December 9–10, 2020 meeting, the Board, including the Trustees who are not an “interested person” (as such term is defined in the 1940 Act) of the Trust (“Independent Trustees”) voting separately, unanimously approved the continuation of each of the Advisory Agreements for a one-year period.
In reaching the decision to approve the continuation of each of the Advisory Agreements, the Board considered information furnished by New York Life Investments and NYL Investors in connection with an annual contract review process undertaken by the Board that took place at meetings of the Board and its Contracts Committee during September 2020 through December 2020, as well as other information furnished to the Board and its Committees throughout the year, as deemed relevant by the Trustees. Information requested by and furnished to the Board for consideration in connection with the contract review process included, among other items, reports on the Fund and “peer funds” prepared by Strategic Insight Mutual Fund Research and Consulting, LLC (“Strategic Insight”), an independent third-party service provider engaged by the Board to report objectively on the Fund’s investment performance, management fee and total expenses. The Board also considered information on the fees charged to other investment advisory clients of New York Life Investments and/or NYL Investors that follow investment strategies similar to those of the Fund, if any, and, when applicable, the rationale for any differences in the Fund’s management and subadvisory fees and the fees charged to those other investment advisory clients. In addition, the Board considered information furnished by New York Life Investments and NYL Investors in response to requests prepared on behalf of the Board, and in consultation with the Independent Trustees, by independent legal counsel to the Independent Trustees, which encompassed a variety of topics, including those summarized below.
The Board took into account information provided in connection with its meetings throughout the year, including, among other items, information regarding the legal standards and fiduciary obligations applicable to its consideration of the continuation of each of the Advisory Agreements and investment performance reports on the Fund as well as presentations from New York Life Investments and NYL Investors personnel. The Board also took into account other information received from New York Life Investments throughout the year, including, among other items, periodic reports on legal and compliance matters, risk management, portfolio turnover, brokerage commissions and non-advisory services provided to the Fund by New York Life Investments. The contract review process, including the structure and format for materials provided to the Board, has been developed in consultation with the Board. The Independent
Trustees also met in executive sessions with their independent legal counsel and, for a portion thereof, with senior management of New York Life Investments.
In addition to information provided to the Board throughout the year, the Board received information in connection with its June 2020 meeting provided specifically in response to requests prepared on behalf of the Board, and in consultation with the Independent Trustees, by independent legal counsel regarding the Fund’s distribution arrangements. In addition, the Board received information regarding the Fund’s asset levels, share purchase and redemption activity and the payment of Rule 12b-1 and/or other fees by applicable share classes of the Fund, among other information.
In considering the continuation of each of the Advisory Agreements, the Trustees reviewed and evaluated the information and factors they believed to reasonably be necessary and appropriate in light of legal advice furnished to them by independent legal counsel and through the exercise of their own business judgment. Although individual Trustees may have weighed certain factors or information differently, the factors considered by the Board are described in greater detail below and include, among other factors: (i) the nature, extent and quality of the services provided to the Fund by New York Life Investments and NYL Investors; (ii) the qualifications of the portfolio managers of the Fund and the historical investment performance of the Fund, New York Life Investments and NYL Investors; (iii) the costs of the services provided, and profits realized, by New York Life Investments and NYL Investors from their relationships with the Fund; (iv) the extent to which economies of scale have been realized or may be realized as the Fund grows and the extent to which economies of scale have benefited or may benefit the Fund’s shareholders; and (v) the reasonableness of the Fund’s management and subadvisory fees and total ordinary operating expenses. Although the Board recognized that comparisons between the Fund’s fees and expenses and those of other funds are imprecise given different terms of agreements, variations in fund strategies and other factors, the Board considered the reasonableness of the Fund’s management fee and total ordinary operating expenses as compared to the peer funds identified by Strategic Insight. Throughout their considerations, the Trustees acknowledged the commitment of New York Life Investments and its affiliates to serve the MainStay Group of Funds, as well as their capacity, experience, resources, financial stability and reputations. The Trustees also acknowledged the entrepreneurial and other risks assumed by New York Life Investments in sponsoring and managing the Fund.
The Trustees noted that, throughout the year, the Trustees are afforded an opportunity to ask questions of, and request additional information or materials from, New York Life Investments and NYL Investors. The Board’s decision with respect to each of the Advisory Agreements may have also been based, in part, on the Board’s knowledge of New York Life Investments and NYL Investors resulting from, among other things, the Board’s consideration of each of the Advisory Agreements in prior years, the advisory agreements for other funds in the MainStay Group of Funds, the Board’s review throughout the year of the performance and operations of other funds in the MainStay Group of Funds and each
| 34 | MainStay Short Term Bond Fund |
Trustee’s business judgment and industry experience. In addition to considering the above-referenced factors, the Board observed that in the marketplace there are a range of investment options available to the Fund’s shareholders and such shareholders, having had the opportunity to consider other investment options, have chosen to invest in the Fund.
The factors that figured prominently in the Board’s decision to approve the continuation of each of the Advisory Agreements during its December 9–10, 2020 meeting are summarized in more detail below, and the Board did not consider any factor or information controlling in reaching such decision.
Nature, Extent and Quality of Services Provided by New York Life Investments and NYL Investors
The Board examined the nature, extent and quality of the services that New York Life Investments provides to the Fund. The Board evaluated New York Life Investments’ experience and capabilities in serving as manager of the Fund and considered that the Fund operates in a “manager-of-managers” structure. The Board also considered New York Life Investments’ responsibilities and services provided pursuant to this structure, including evaluating the performance of NYL Investors, making recommendations to the Board as to whether the Subadvisory Agreement should be renewed, modified or terminated and periodically reporting to the Board regarding the results of New York Life Investments’ evaluation and monitoring functions. The Board noted that New York Life Investments manages other mutual funds, serves a variety of other investment advisory clients, including other pooled investment vehicles, and has experience overseeing mutual fund service providers, including subadvisors. The Board considered the experience of senior personnel at New York Life Investments providing management and administrative and other non-advisory services to the Fund as well as New York Life Investments’ reputation and financial condition. The Board observed that New York Life Investments devotes significant resources and time to providing management and non-advisory services to the Fund, including New York Life Investments’ supervision and due diligence reviews of NYL Investors and ongoing analysis of, and interactions with, NYL Investors with respect to, among other things, the Fund’s investment performance and risks as well as NYL Investors’ investment capabilities and subadvisory services with respect to the Fund.
The Board also considered the range of services that New York Life Investments provides to the Fund under the terms of the Management Agreement, including: (i) fund accounting and ongoing supervisory services provided by New York Life Investments’ Fund Administration and Accounting Group; (ii) investment supervisory and analytical services provided by New York Life Investments’ Investment Consulting Group; (iii) compliance services provided by the Trust’s Chief Compliance Officer as well as New York Life Investments’ compliance department, including supervision and implementation of the Fund’s compliance program; (iv) legal services provided by New York Life Investments’ Office of the General Counsel; and (v) risk management monitoring and analysis by compliance and investment personnel. The Board noted that New York Life Investments provides certain other non-advisory services to the Fund.
In addition, the Board considered New York Life Investments’ willingness to invest in personnel, infrastructure, technology, operational enhancements, cyber security, information security, shareholder privacy resources and business continuity planning designed to benefit the Fund and noted that New York Life Investments is responsible for compensating the Trust’s officers, except for a portion of the salary of the Trust’s Chief Compliance Officer. The Board recognized that New York Life Investments has provided an increasingly broad array of non-advisory services to the MainStay Group of Funds as a result of regulatory and other developments, including in connection with the designation of New York Life Investments as the administrator of the MainStay Group of Funds’ liquidity risk management program adopted under the 1940 Act. The Board considered benefits to shareholders from being part of the MainStay Group of Funds, including the privilege of exchanging investments between the same class of shares of funds in the MainStay Group of Funds, including without the imposition of a sales charge (if any).
The Board also examined the nature, extent and quality of the investment advisory services that NYL Investors provides to the Fund and considered the terms of each of the Advisory Agreements. The Board evaluated NYL Investors’ experience in serving as subadvisor to the Fund and advising other portfolios and NYL Investors’ track record and experience in providing investment advisory services, the experience of investment advisory, senior management and administrative personnel at NYL Investors and New York Life Investments’ and NYL Investors’ overall resources, legal and compliance environment, capabilities and history. In addition to information provided in connection with quarterly meetings with the Trust’s Chief Compliance Officer, the Board considered information regarding the compliance policies and procedures of New York Life Investments and NYL Investors and acknowledged their commitment to further developing and strengthening compliance programs relating to the Fund. The Board reviewed NYL Investors’ ability to attract and retain qualified investment professionals and willingness to invest in personnel to service and support the Fund. In this regard, the Board considered the experience of the Fund’s portfolio managers, the number of accounts managed by the portfolio managers and the method for compensating the portfolio managers.
In addition, the Board considered discussions with New York Life Investments regarding the implementation of its business continuity plans and recognized steps taken by New York Life Investments and NYL Investors to continue to provide the same nature, extent and quality of services to the Fund during the COVID-19 pandemic.
Based on these considerations, the Board concluded that the Fund would likely continue to benefit from the nature, extent and quality of these services.
Investment Performance
In evaluating the Fund’s investment performance, the Board considered investment performance results over various periods in light of the Fund’s investment objective, strategies and risks. The Board considered
Board Consideration and Approval of Management Agreement and Subadvisory Agreement (Unaudited) (continued)
investment reports on, and analysis of, the Fund’s performance provided to the Board throughout the year. These reports include, among other items, information on the Fund’s gross and net returns, the Fund’s investment performance compared to relevant investment categories and the Fund’s benchmarks, the Fund’s risk-adjusted investment performance and the Fund’s investment performance as compared to peer funds, as appropriate, as well as portfolio attribution information and commentary on the effect of market conditions. The Board also considered information provided by Strategic Insight showing the investment performance of the Fund as compared to peer funds.
The Board also gave weight to its discussions with senior management at New York Life Investments concerning the Fund’s investment performance attributable to NYL Investors as well as discussions between the Fund’s portfolio managers and the members of the Board’s Investment Committee, which generally occur on an annual basis. In addition, the Board considered any specific actions that New York Life Investments or NYL Investors had taken, or had agreed to take, to seek to enhance Fund investment performance and the results of those actions.
Based on these considerations, the Board concluded that its review of the Fund’s investment performance and related information supported a determination to approve the continuation of each of the Advisory Agreements.
Costs of the Services Provided, and Profits Realized, by New York Life Investments and NYL Investors
The Board considered the costs of the services provided under each of the Advisory Agreements. The Board also considered the profits realized by New York Life Investments and its affiliates, including NYL Investors, due to their relationships with the Fund. Because NYL Investors is an affiliate of New York Life Investments whose subadvisory fee is paid by New York Life Investments, not the Fund, the Board considered cost and profitability information for New York Life Investments and NYL Investors in the aggregate.
In addition, the Board acknowledged the difficulty in obtaining reliable comparative data about mutual fund managers’ profitability because such information generally is not publicly available and may be impacted by numerous factors, including the structure of a fund manager’s organization, the types of funds it manages, the methodology used to allocate certain fixed costs to specific funds and the manager’s capital structure and costs of capital.
In evaluating the costs of the services provided by New York Life Investments and NYL Investors and profits realized by New York Life Investments and its affiliates, including NYL Investors, the Board considered, among other factors, each party’s continuing investments in, or willingness to invest in, personnel, systems, equipment and other resources and infrastructure to support and further enhance the management of the Fund, and that New York Life Investments is responsible for paying the subadvisory fee for the Fund. The Board also considered the financial resources of New York Life Investments and NYL Investors and acknowledged that New York Life Investments and NYL
Investors must be in a position to attract and retain experienced professional personnel and to maintain a strong financial position for New York Life Investments and NYL Investors to continue to provide high-quality services to the Fund. The Board recognized that the Fund benefits from the allocation of certain fixed costs among the funds in the MainStay Group of Funds, among other expected benefits resulting from its relationship with New York Life Investments.
The Board considered information regarding New York Life Investments’ methodology for calculating profitability and allocating costs provided by New York Life Investments in connection with the fund profitability analysis presented to the Board. The Board previously engaged an independent consultant to review the methods used to allocate costs among the funds in the MainStay Group of Funds. The Board noted that the independent consultant had concluded that New York Life Investments’ methods for allocating costs and procedures for estimating overall profitability of the relationship with the funds in the MainStay Group of Funds are reasonable and that New York Life Investments continued to use the same method of calculating profit and allocating costs since the independent consultant’s review. The Board recognized the difficulty in calculating and evaluating a manager’s profitability with respect to the Fund and noted that other profitability methodologies may also be reasonable.
The Board also considered certain fall-out benefits that may be realized by New York Life Investments and its affiliates due to their relationships with the Fund, including reputational and other indirect benefits. In addition, the Board considered its review of a money market fund advised by New York Life Investments and an affiliated subadvisor that serves as an investment option for the Fund, including the potential rationale for and costs associated with investments in this money market fund by the Fund, if any, and considered information from New York Life Investments that the nature and type of specific investment advisory services provided to this money market fund are distinct from, or in addition to, the investment advisory services provided to the Fund.
The Board observed that, in addition to fees earned by New York Life Investments for managing the Fund, New York Life Investments’ affiliates also earn revenues from serving the Fund in various other capacities, including as the Fund’s transfer agent and distributor. The Board considered information about these other revenues and their impact on the profitability of the relationship with the Fund to New York Life Investments and its affiliates. The Board noted that, although it assessed the overall profitability of the Fund to New York Life Investments and its affiliates as part of the contract review process, when considering the reasonableness of the fee paid to New York Life Investments and its affiliates under each of the Advisory Agreements, the Board considered the profitability of New York Life Investments’ relationship with the Fund on a pre-tax basis and without regard to distribution expenses incurred by New York Life Investments from its own resources.
| 36 | MainStay Short Term Bond Fund |
After evaluating the information deemed relevant by the Trustees, the Board concluded that any profits realized by New York Life Investments and its affiliates, including NYL Investors, due to their relationships with the Fund were not excessive.
Management and Subadvisory Fees and Total Ordinary Operating Expenses
The Board evaluated the reasonableness of the fee paid under each of the Advisory Agreements and the Fund’s total ordinary operating expenses. The Board primarily considered the reasonableness of the management fee paid by the Fund to New York Life Investments, because the subadvisory fee paid to NYL Investors is paid by New York Life Investments, not the Fund. The Board also considered the reasonableness of the subadvisory fee paid by New York Life Investments and the amount of the management fee retained by New York Life Investments.
In assessing the reasonableness of the Fund’s fees and expenses, the Board primarily considered comparative data provided by Strategic Insight on the fees and expenses charged by similar mutual funds managed by other investment advisers. In addition, the Board considered information provided by New York Life Investments and NYL Investors on fees charged to other investment advisory clients, including institutional separate accounts and/or other funds that follow investment strategies similar to those of the Fund, if any. The Board considered the similarities and differences in the contractual management fee schedules of the Fund and these similarly-managed accounts and/or funds, taking into account the rationale for any differences in fee schedules. The Board also took into account explanations provided by New York Life Investments about the more extensive scope of services provided to registered investment companies, such as the Fund, as compared with other investment advisory clients. Additionally, the Board considered the impact of contractual breakpoints, voluntary waivers and expense limitation arrangements on the Fund’s net management fee and expenses. The Board also considered that in proposing fees for the Fund, New York Life Investments considers the competitive marketplace for mutual funds.
The Board noted that, outside of the Fund’s management fee and the fees charged under a share class’s Rule 12b-1 and/or shareholder services plans, a share class’s most significant “other expenses” are transfer agent fees. Transfer agent fees are charged to the Fund based on the number of shareholder accounts (a “per-account” fee). The Board took into account information from New York Life Investments regarding the reasonableness of the Fund’s transfer agent fee schedule, including industry data demonstrating that the per-account fees that NYLIM Service Company LLC, an affiliate of New York Life Investments and the Fund’s transfer agent, charges the Fund are within the range of per-account fees charged by transfer agents to other mutual funds. In addition, the Board considered NYLIM Service Company LLC’s profitability in connection with the transfer agent services it provides to the Fund. The Board also took into account information received from NYLIM Service Company LLC regarding the sub-transfer agency payments it made to intermediaries in connection with the provision of sub-transfer agency services to the Fund.
The Board considered that, because the Fund’s transfer agent fees are billed on a per-account basis, the impact of transfer agent fees on a share class’s expense ratio may be more significant in cases where the share class has a high number of small accounts. The Board considered the extent to which transfer agent fees comprised total expenses of the Fund. The Board acknowledged the role that the MainStay Group of Funds historically has played in serving the investment needs of New York Life Insurance Company customers, who often maintain smaller account balances than other shareholders of funds, and the impact of small accounts on the expense ratios of Fund share classes. The Board also recognized measures that it and New York Life Investments have taken to mitigate the effect of small accounts on the expense ratios of Fund share classes, including through the imposition of an expense limitation on net transfer agency expenses. The Board noted that, for purposes of allocating transfer agency fees and expenses, each retail fund in the MainStay Group of Funds combines the shareholder accounts of its Class A, A2, I, R1, R2 and R3 shares (as applicable) into one group and the shareholder accounts of its Investor Class, SIMPLE Class and Class B, C and C2 shares (as applicable) into another group. The Board also noted that the per-account fees attributable to each group of share classes is then allocated among the constituent share classes based on relative net assets and that a MainStay Fund’s Class R6 shares, if any, are not combined with any other share class for this purpose. The Board considered New York Life Investments’ rationale with respect to these groupings and previously received a report from an independent consultant engaged to conduct comparative analysis of these groupings. The Board also considered that NYLIM Service Company LLC had waived its contractual cost of living adjustments during the past seven years.
Based on the factors outlined above, the Board concluded that the Fund’s management fee and total ordinary operating expenses were within a range that is competitive and support a conclusion that these fees and expenses are reasonable.
Economies of Scale
The Board considered information regarding economies of scale, including whether the Fund’s expense structure permits economies of scale to be appropriately shared with the Fund’s shareholders. The Board also considered a report from New York Life Investments, previously prepared at the request of the Board, that addressed economies of scale, including with respect to the mutual fund business generally and the various ways in which the benefits of economies of scale may be shared with the funds in the MainStay Group of Funds. Although the Board recognized the difficulty of determining economies of scale with precision, the Board acknowledged that economies of scale may be shared with the Fund in a number of ways, including, for example, through the imposition of management fee breakpoints, initially setting management fee rates at scale or making additional investments to enhance services. The Board reviewed information from New York Life Investments showing how the Fund’s management fee schedule compared to fee schedules of other funds and accounts managed by New York Life Investments. The Board
Board Consideration and Approval of Management Agreement and Subadvisory Agreement (Unaudited) (continued)
also reviewed information from Strategic Insight showing how the Fund’s management fee schedule compared with fees paid for similar services by peer funds at varying asset levels.
Based on this information, the Board concluded that economies of scale are appropriately reflected for the benefit of the Fund’s shareholders through the Fund’s expense structure and other methods to share benefits from economies of scale.
Conclusion
On the basis of the information and factors summarized above, among other information and factors deemed relevant by the Trustees, and the evaluation thereof, the Board, including the Independent Trustees voting separately, unanimously voted to approve the continuation of each of the Advisory Agreements.
| 38 | MainStay Short Term Bond Fund |
Discussion of the Operation and Effectiveness of the Fund's Liquidity Risk Management Program (Unaudited)
In compliance with Rule 22e-4 under the Investment Company Act of 1940, as amended (the “Liquidity Rule”), the Fund has adopted and implemented a liquidity risk management program (the “Program”), which New York Life Investment Management LLC believes is reasonably designed to assess and manage the Fund's liquidity risk (the risk that the Fund could not meet requests to redeem shares issued by the Fund without significant dilution of remaining investors’ interests in the Fund). The Board of Trustees of MainStay Funds Trust (the "Board") designated New York Life Investment Management LLC as administrator of the Program (the “Administrator”). The Administrator has established a Liquidity Risk Management Committee to assist the Administrator in the implementation and day-to-day administration of the Program and to otherwise support the Administrator in fulfilling its responsibilities under the Program.
At a meeting of the Board held on March 8, 2021, the Administrator provided the Board with a written report addressing the Program’s operation and assessing its adequacy and effectiveness of implementation for the period from January 1, 2020 through December 31, 2020 (the "Review Period"), as required under the Liquidity Rule. The report noted that the Administrator concluded that (i) the Program operated effectively to assess and manage the Fund's liquidity risk, (ii) the Program has been adequately and effectively implemented to monitor and, as applicable, respond to the Fund's liquidity developments and (iii) the Fund's investment strategy continues to be appropriate for an open-end fund. In addition, the report discussed notable events that impacted liquidity risk during the Review Period, including the COVID-19 pandemic and the resulting economic shutdown.
In accordance with the Program, the Fund's liquidity risk is assessed no less frequently than annually taking into consideration certain factors, as applicable, such as (i) investment strategy and liquidity of portfolio investments, (ii) short-term and long-term cash flow projections and (iii) holdings of cash and cash equivalents, as well as borrowing arrangements and other funding sources. Certain factors are considered under both normal and reasonably foreseeable stressed conditions.
Each Fund portfolio investment is classified into one of four liquidity categories. The classification is based on a determination of the number of days it is reasonably expected to take to convert the investment into cash, or sell or dispose of the investment, in current market conditions without significantly changing the market value of the investment. The Administrator has delegated liquidity classification determinations to the Fund’s subadvisor, subject to appropriate oversight by the Administrator, and classification determinations are made by taking into account the Fund's reasonably anticipated trade size, various market, trading and investment-specific considerations, as well as market depth, and, in certain cases, third-party vendor data.
The Liquidity Rule requires funds that do not primarily hold assets that are highly liquid investments to adopt a minimum amount of net assets that must be invested in highly liquid investments that are assets (an “HLIM”). In addition, the Liquidity Rule limits a fund's investments in illiquid investments. Specifically, the Liquidity Rule prohibits acquisition of illiquid investments if doing so would result in a fund holding more than 15% of its net assets in illiquid investments that are assets. The Program includes provisions reasonably designed to determine, periodically review and comply with the HLIM requirement, as applicable, and to comply with the 15% limit on illiquid investments.
There can be no assurance that the Program will achieve its objectives under all circumstances in the future. Please refer to the Fund's prospectus for more information regarding the Fund's exposure to liquidity risk and other risks to which it may be subject.
Proxy Voting Record
The Fund is required to file with the Securities and Exchange Commissions's ("SEC") its proxy voting records for the 12-month period ending June 30 on Form N-PX. The most recent Form N-PX or proxy voting record is available free of charge upon request by calling 800-624-6782; visiting the MainStay Funds’ website at newyorklifeinvestments.com; or visiting the SEC’s website at www.sec.gov.
Shareholder Reports and Quarterly Portfolio Disclosure
The Fund is required to file its complete schedule of portfolio holdings with the SEC 60 days after its first and third fiscal quarter on Form N-PORT. The Fund's holdings report is available free of charge upon request by calling New York Life Investments at 800-624-6782.
| 40 | MainStay Short Term Bond Fund |
This page intentionally left blank.
This page intentionally left blank.
Equity
U.S. Equity
MainStay Epoch U.S. Equity Yield Fund
MainStay MacKay S&P 500 Index Fund
MainStay Winslow Large Cap Growth Fund
MainStay WMC Enduring Capital Fund
MainStay WMC Growth Fund
MainStay WMC Small Companies Fund
MainStay WMC Value Fund
International Equity
MainStay Epoch International Choice Fund
MainStay MacKay International Equity Fund
MainStay WMC International Research Equity Fund
Emerging Markets Equity
MainStay Candriam Emerging Markets Equity Fund
Global Equity
MainStay Epoch Capital Growth Fund
MainStay Epoch Global Equity Yield Fund
Fixed Income
Taxable Income
MainStay Candriam Emerging Markets Debt Fund
MainStay Floating Rate Fund
MainStay MacKay High Yield Corporate Bond Fund
MainStay MacKay Short Duration High Yield Fund
MainStay MacKay Strategic Bond Fund
MainStay MacKay Total Return Bond Fund
MainStay MacKay U.S. Infrastructure Bond Fund
MainStay Short Term Bond Fund
Tax-Exempt Income
MainStay MacKay California Tax Free Opportunities Fund1
MainStay MacKay High Yield Municipal Bond Fund
MainStay MacKay Intermediate Tax Free Bond Fund
MainStay MacKay New York Tax Free Opportunities Fund2
MainStay MacKay Short Term Municipal Fund
MainStay MacKay Tax Free Bond Fund
Money Market
MainStay Money Market Fund
Mixed Asset
MainStay Balanced Fund
MainStay Income Builder Fund
MainStay MacKay Convertible Fund
Speciality
MainStay CBRE Global Infrastructure Fund
MainStay CBRE Real Estate Fund
MainStay Cushing MLP Premier Fund
Asset Allocation
MainStay Conservative Allocation Fund
MainStay Conservative ETF Allocation Fund
MainStay Defensive ETF Allocation Fund
MainStay Equity Allocation Fund
MainStay Equity ETF Allocation Fund
MainStay Growth Allocation Fund
MainStay Growth ETF Allocation Fund
MainStay Moderate Allocation Fund
MainStay Moderate ETF Allocation Fund
Manager
New York Life Investment Management LLC
New York, New York
Subadvisors
Candriam Belgium S.A.3
Brussels, Belgium
Candriam Luxembourg S.C.A.3
Strassen, Luxembourg
CBRE Clarion Securities LLC
Radnor, Pennsylvania
Cushing Asset Management, LP
Dallas, Texas
Epoch Investment Partners, Inc.
New York, New York
MacKay Shields LLC3
New York, New York
NYL Investors LLC3
New York, New York
Wellington Management Company LLP
Boston, Massachusetts
Winslow Capital Management, LLC
Minneapolis, Minnesota
Legal Counsel
Dechert LLP
Washington, District of Columbia
Independent Registered Public Accounting Firm
KPMG LLP
Philadelphia, Pennsylvania
Distributor
NYLIFE Distributors LLC3
Jersey City, New Jersey
Custodian
JPMorgan Chase Bank, N.A.
New York, New York
1.
This Fund is registered for sale in AZ, CA, NV, OR, TX, UT, WA and MI (Class A and I shares only), and CO, FL, GA, HI, ID, MA, MD, NH, NJ and NY (Class I shares only).
| 2. | This Fund is registered for sale in CA, CT, DE, FL, MA, NJ, NY and VT. |
| 3. | An affiliate of New York Life Investment Management LLC. |
Not part of the Semiannual Report
For more information
800-624-6782
newyorklifeinvestments.com
“New York Life Investments” is both a service mark, and the common trade name, of certain investment advisors affiliated with New York Life Insurance Company. The MainStay Funds® are managed by New York Life Investment Management LLC and distributed by NYLIFE Distributors LLC, 30 Hudson Street, Jersey City, NJ 07302, a wholly owned subsidiary of New York Life Insurance Company. NYLIFE Distributors LLC is a Member FINRA/SIPC.
©2021 NYLIFE Distributors LLC. All rights reserved.
| 1737120MS071-21 | MSSTB10-06/21 |
(NYLIM) NL228
MainStay U.S. Government Liquidity Fund
Semiannual Report
Unaudited | April 30, 2021
Sign up for e-delivery of your shareholder reports. For full details on e-delivery, including who can participate and what you can receive via e-delivery,
please log in to newyorklifeinvestments.com/accounts.
| Not FDIC/NCUA Insured | Not a Deposit | May Lose Value | No Bank Guarantee | Not Insured by Any Government Agency |
This page intentionally left blank
Investors should refer to the Fund’s Summary Prospectus and/or Prospectus and consider the Fund’s investment objectives, strategies, risks, charges and expenses carefully before investing. The Summary Prospectus and/or Prospectus contain this and other information about the Fund. You may obtain copies of the Fund’s Summary Prospectus, Prospectus and Statement of Additional Information free of charge, upon request, by calling toll-free 800-624-6782, by writing to NYLIFE Distributors LLC, Attn: MainStay Marketing Department, 30 Hudson Street, Jersey City, NJ 07302 or by sending an e-mail to MainStayShareholderServices@nylim.com. These documents are also available via the MainStay Funds’ website at newyorklifeinvestments.com. Please read the Fund’s Summary Prospectus and/or Prospectus carefully before investing.
Cost in Dollars of a $1,000 Investment in MainStay U.S. Government Liquidity Fund (Unaudited)
The example below is intended to describe the fees and expenses borne by shareholders during the six-month period from November 1, 2020, to April 30, 2021, and the impact of those costs on your investment.
Example
As a shareholder of the Fund you incur two types of costs: (1) transaction costs, including exchange fees and sales charges (loads) on purchases (as applicable), and (2) ongoing costs, including management fees, distribution and/or service (12b-1) fees, and other Fund expenses (as applicable). This example is intended to help you understand your ongoing costs (in dollars) of investing in the Fund and to compare these costs with the ongoing costs of investing in other mutual funds. The example is based on an investment of $1,000 made at the beginning of the six-month period and held for the entire period from November 1, 2020, to April 30, 2021.
This example illustrates your Fund’s ongoing costs in two ways:
Actual Expenses
The second and third data columns in the table below provide information about actual account values and actual expenses. You may use the information in these columns, together with the amount you invested, to estimate the expenses that you paid during the six months ended April 30, 2021. Simply divide your account value by $1,000 (for example, an $8,600 account value divided by $1,000 = 8.6), then multiply the
result by the number under the heading entitled “Expenses Paid During Period” to estimate the expenses you paid on your account during this period.
Hypothetical Example for Comparison Purposes
The fourth and fifth data columns in the table below provide information about hypothetical account values and hypothetical expenses based on the Fund’s actual expense ratio and an assumed rate of return of 5% per year before expenses, which is not the Fund’s actual return. The hypothetical account values and expenses may not be used to estimate the actual ending account balances or expenses you paid for the six-month period shown. You may use this information to compare the ongoing costs of investing in the Fund with the ongoing costs of investing in other mutual funds. To do so, compare this 5% hypothetical example with the 5% hypothetical examples that appear in the shareholder reports of the other mutual funds.
Please note that the expenses shown in the table are meant to highlight your ongoing costs only and do not reflect any transactional costs, such as exchange fees or sales charges (loads). Therefore, the fourth and fifth data columns of the table are useful in comparing ongoing costs only and will not help you determine the relative total costs of owning different funds. In addition, if these transactional costs were included, your costs would have been higher.
| Share Class | Beginning
Account
Value
11/1/20 | Ending Account
Value (Based
on Actual
Returns and
Expenses)
4/30/21 | Expenses
Paid
During
Period1 | Ending Account
Value (Based
on Hypothetical
5% Annualized
Return and
Actual Expenses)
4/30/21 | Expenses
Paid
During
Period1 | Net Expense
Ratio
During
Period2 |
| Class I Shares | $1,000.00 | $1,000.10 | $0.30 | $1,024.50 | $0.30 | 0.06% |
| 1. | Expenses are equal to the Fund’s annualized expense ratio of each class multiplied by the average account value over the period, divided by 365 and multiplied by 181 (to reflect the six-month period). The table above represents the actual expenses incurred during the six-month period. In addition to the fees and expenses which the Fund bears directly, it also indirectly bears a pro rata share of the fees and expenses of the underlying funds in which it invests. Such indirect expenses are not included in the above-reported expense figures. |
| 2. | Expenses are equal to the Fund's annualized expense ratio to reflect the six-month period. |
| 4 | MainStay U.S. Government Liquidity Fund |
Portfolio Composition as of April 30, 2021 (Unaudited)
| U.S. Treasury Debt | 95.0% |
| U.S. Government Agency Debt | 5.0% |
| Other Assets, Less Liabilities | -0.0‡ |
‡ Less than one-tenth of a percent.
See Portfolio of Investments beginning on page 6 for specific holdings within these categories. The Fund's holdings are subject to change.
Portfolio of Investments April 30, 2021† (Unaudited)
| | Principal
Amount | | Value |
| Short-Term Investments 100.0% |
| U.S. Government Agency Debt 5.0% |
| Federal Home Loan Bank | | | |
| 0.005%, due 5/21/21 | $ 64,724,000 | | $ 64,723,820 |
Total U.S. Government Agency Debt
(Cost $64,723,820) | | | 64,723,820 |
| U.S. Treasury Debt 95.0% |
| U.S. Treasury Bills (a) | | | |
| 0.004%, due 6/1/21 | 19,657,000 | | 19,656,932 |
| 0.004%, due 6/10/21 | 8,462,000 | | 8,461,967 |
| 0.005%, due 5/6/21 | 26,894,000 | | 26,893,982 |
| 0.005%, due 6/22/21 | 85,623,000 | | 85,622,382 |
| 0.008%, due 5/20/21 | 251,049,000 | | 251,047,923 |
| 0.01%, due 6/8/21 | 186,348,000 | | 186,346,033 |
| 0.012%, due 5/18/21 | 384,776,000 | | 384,773,856 |
| 0.015%, due 6/15/21 | 15,927,000 | | 15,926,701 |
| 0.021%, due 5/27/21 | 242,964,000 | | 242,960,301 |
Total U.S. Treasury Debt
(Cost $1,221,690,077) | | | 1,221,690,077 |
Total Short-Term Investments
(Cost $1,286,413,897) | 100.0% | | 1,286,413,897 |
| Other Assets, Less Liabilities | (0.0)‡ | | (27,470) |
| Net Assets | 100.0% | | $ 1,286,386,427 |
| † | Percentages indicated are based on Fund net assets. |
| ‡ | Less than one-tenth of a percent. |
| (a) | Interest rate shown represents yield to maturity. |
The following is a summary of the fair valuations according to the inputs used as of April 30, 2021, for valuing the Fund’s assets:
| Description | Quoted
Prices in
Active
Markets for
Identical
Assets
(Level 1) | | Significant
Other
Observable
Inputs
(Level 2) | | Significant
Unobservable
Inputs
(Level 3) | | Total |
| Asset Valuation Inputs | | | | | | | |
| Investments in Securities (a) | | | | | | | |
| Short-Term Investments | | | | | | | |
| U.S. Government Agency Debt | $ — | | $ 64,723,820 | | $ — | | $ 64,723,820 |
| U.S. Treasury Debt | — | | 1,221,690,077 | | — | | 1,221,690,077 |
| Total Investments in Securities | $ — | | $ 1,286,413,897 | | $ — | | $ 1,286,413,897 |
| (a) | For a complete listing of investments and their industries, see the Portfolio of Investments. |
The notes to the financial statements are an integral part of, and should be read in conjunction with, the financial statements.
| 6 | MainStay U.S. Government Liquidity Fund |
Statement of Assets and Liabilities as of April 30, 2021 (Unaudited)
| Assets |
Investment in securities, at value
(amortized cost $1,286,413,897) | $1,286,413,897 |
| Cash | 11,055 |
| Other assets | 137,792 |
| Total assets | 1,286,562,744 |
| Liabilities |
| Payables: | |
| Manager (See Note 3) | 125,879 |
| Professional fees | 30,136 |
| Shareholder communication | 14,612 |
| Custodian | 2,651 |
| Accrued expenses | 3,039 |
| Total liabilities | 176,317 |
| Net assets | $1,286,386,427 |
| Composition of Net Assets |
| Shares of beneficial interest outstanding (par value of $.001 per share) unlimited number of shares authorized | $ 1,286,231 |
| Additional paid-in-capital | 1,284,944,579 |
| | 1,286,230,810 |
| Total distributable earnings (loss) | 155,617 |
| Net assets | $1,286,386,427 |
| Class I | |
| Net assets applicable to outstanding shares | $1,286,386,427 |
| Shares of beneficial interest outstanding | 1,286,230,810 |
| Net asset value per share outstanding | $ 1.00 |
The notes to the financial statements are an integral part of, and should be read in conjunction with, the financial statements.
7
Statement of Operations for the six months ended April 30, 2021 (Unaudited)
| Investment Income (Loss) |
| Income | |
| Interest | $ 336,122 |
| Other | 3,832 |
| Total income | 339,954 |
| Expenses | |
| Manager (See Note 3) | 618,097 |
| Professional fees | 45,207 |
| Custodian | 10,315 |
| Trustees | 7,374 |
| Insurance | 4,588 |
| Shareholder communication | 2,815 |
| Miscellaneous | 4,670 |
| Total expenses before waiver/reimbursement | 693,066 |
| Expense waiver/reimbursement from Manager (See Note 3) | (406,760) |
| Net expenses | 286,306 |
| Net investment income (loss) | 53,648 |
| Realized and Unrealized Gain (Loss) |
| Net realized gain (loss) on investments | 7,197 |
| Net increase (decrease) in net assets resulting from operations | $ 60,845 |
The notes to the financial statements are an integral part of, and should be read in conjunction with, the financial statements.
| 8 | MainStay U.S. Government Liquidity Fund |
Statements of Changes in Net Assets
for the six months ended April 30, 2021 (Unaudited) and the year ended October 31, 2020
| | 2021 | 2020 |
| Increase (Decrease) in Net Assets |
| Operations: | | |
| Net investment income (loss) | $ 53,648 | $ 5,364,991 |
| Net realized gain (loss) | 7,197 | 100,500 |
| Net increase (decrease) in net assets resulting from operations | 60,845 | 5,465,491 |
| Distributions to shareholders | | |
| Distributions to shareholders | (53,609) | (5,366,919) |
| Capital share transactions: | | |
| Net proceeds from sales of shares | 7,907,019,831 | 12,595,285,893 |
| Net asset value of shares issued to shareholder in reinvestment of distributions | 49,193 | 5,366,919 |
| Cost of shares redeemed | (7,259,790,534) | (12,876,127,593) |
| Increase (decrease) in net assets derived from capital share transactions | 647,278,490 | (275,474,781) |
| Net increase (decrease) in net assets | 647,285,726 | (275,376,209) |
| Net Assets |
| Beginning of period | 639,100,701 | 914,476,910 |
| End of period | $ 1,286,386,427 | $ 639,100,701 |
The notes to the financial statements are an integral part of, and should be read in conjunction with, the financial statements.
9
Financial Highlights selected per share data and ratios
| | Six months ended
April 30,
2021* | | Year Ended October 31, | | July 2, 2018^ through
October 31,
2018 |
| Class I | 2020 | | 2019 | |
| Net asset value at beginning of period | $ 1.00 | | $ 1.00 | | $ 1.00 | | $ 1.00 |
| Net investment income (loss) | 0.00‡ | | 0.01 | | 0.02 | | 0.01 |
| Total from investment operations | 0.00‡ | | 0.01 | | 0.02 | | 0.01 |
| Less distributions: | | | | | | | |
| From net investment income | (0.00)‡ | | (0.01) | | (0.02) | | (0.01) |
| Net asset value at end of period | $ 1.00 | | $ 1.00 | | $ 1.00 | | $ 1.00 |
| Total investment return (a) | 0.01% | | 0.55% | | 2.14% | | 0.61% |
| Ratios (to average net assets)/Supplemental Data: | | | | | | | |
| Net investment income (loss) | 0.01%†† | | 0.62% | | 2.11% | | 1.82%†† |
| Net expenses | 0.06%†† | | 0.13% | | 0.15% | | 0.15%†† |
| Expenses (before waiver/reimbursement) | 0.13%†† | | 0.13% | | 0.15% | | 0.16%†† |
| Net assets at end of period (in 000’s) | $ 1,286,386 | | $ 639,101 | | $ 914,477 | | $ 868,444 |
| * | Unaudited. |
| ^ | Inception date. |
| ‡ | Less than one cent per share. |
| †† | Annualized. |
| (a) | Total investment return is calculated exclusive of sales charges and assumes the reinvestment of distributions. For periods of less than one year, total return is not annualized. |
The notes to the financial statements are an integral part of, and should be read in conjunction with, the financial statements.
| 10 | MainStay U.S. Government Liquidity Fund |
Notes to Financial Statements (Unaudited)
Note 1-Organization and Business
MainStay Funds Trust (the “Trust”) was organized as a Delaware statutory trust on April 28, 2009. The Trust is registered under the Investment Company Act of 1940, as amended (the “1940 Act”), as an open-end management investment company, and is comprised of thirty-two funds (collectively referred to as the “Funds”). These financial statements and notes relate to the MainStay U.S. Government Liquidity Fund (the "Fund"), a “diversified” fund, as that term is defined in the 1940 Act, as interpreted or modified by regulatory authorities having jurisdiction, from time to time.
The following table lists the Fund's share classes that have been registered and commenced operations:
| Class | Commenced Operations |
| Class I | July 2, 2018 |
Shares of the Fund are offered and are redeemed at a price equal to their net asset value (“NAV”) per share. No sales or redemption charge is applicable to the purchase or redemption of the Fund’s shares.
The Fund's investment objective is to seek a high level of current income while preserving capital and maintaining liquidity.
Note 2–Significant Accounting Policies
The Fund is an investment company and accordingly follows the investment company accounting and reporting guidance of the Financial Accounting Standards Board (“FASB”) Accounting Standard Codification Topic 946 Financial Services—Investment Companies. The Fund prepares its financial statements in accordance with generally accepted accounting principles (“GAAP”) in the United States of America and follows the significant accounting policies described below.
(A) Valuation of Shares. You could lose money by investing in the Fund. Although the Fund seeks to preserve the value of your investment at $1.00 per share by using the amortized cost method of valuation, it cannot guarantee it will do so. The Fund may impose a fee upon the sale of your shares or may temporarily suspend your ability to sell shares if the Fund's liquidity falls below required minimums because of market conditions or other factors. An investment in the Fund is not insured or guaranteed by the Federal Deposit Insurance Corporation or any other government agency. The Fund's sponsor has no legal obligation to provide financial support to the Fund, and you should not expect that the sponsor will provide financial support to the Fund at any time.
(B) Securities Valuation. Securities are valued using the amortized cost method of valuation, unless the use of such method would be inappropriate per the requirements of Rule 2a-7 under the 1940 Act. The amortized cost method involves valuing a security at its cost on the date of purchase and thereafter assuming a constant amortization to maturity of the difference between such cost and the value on maturity date. Amortized cost approximates the current fair value of a security.
The Board of Trustees of the Trust (the "Board") adopted procedures establishing methodologies for the valuation of the Fund's securities and other assets and delegated the responsibility for valuation determinations under those procedures to the Valuation Committee of the Trust (the “Valuation Committee”). The procedures state that, subject to the oversight of the Board and unless otherwise noted, the responsibility for the day-to-day valuation of portfolio assets (including fair value measurements for the Fund's assets and liabilities) rests with New York Life Investment Management LLC (“New York Life Investments” or the "Manager"), aided to whatever extent necessary by the Subadvisor (as defined in Note 3(A)). To assess the appropriateness of security valuations, the Manager, the Subadvisor or the Fund's third-party service provider, who is subject to oversight by the Manager, regularly compares prior day prices, prices on comparable securities and the sale prices to the prior and current day prices and challenges prices with changes exceeding certain tolerance levels with third-party pricing services or broker sources.
The Board authorized the Valuation Committee to appoint a Valuation Subcommittee (the “Subcommittee”) to establish the prices of securities for which market quotations are not readily available or the prices of which are not otherwise readily determinable under the procedures. The Subcommittee meets (in person, via electronic mail or via teleconference) on an as-needed basis. The Valuation Committee meets to ensure that actions taken by the Subcommittee were appropriate.
For those securities valued through either a standardized fair valuation methodology or a fair valuation measurement, the Subcommittee deals with such valuation and the Valuation Committee reviews and affirms, if appropriate, the reasonableness of the valuation based on such methodologies and measurements on a regular basis after considering information that is reasonably available and deemed relevant by the Valuation Committee. Any action taken by the Subcommittee with respect to the valuation of a portfolio security or other asset is submitted for review and ratification (if appropriate) to the Valuation Committee and the Board at the next regularly scheduled meeting.
"Fair value" is defined as the price the Fund would reasonably expect to receive upon selling an asset or liability in an orderly transaction to an independent buyer in the principal or most advantageous market for the asset or liability. Fair value measurements are determined within a framework that establishes a three-tier hierarchy that maximizes the use of observable market data and minimizes the use of unobservable inputs to establish a classification of fair value measurements for disclosure purposes. "Inputs" refer broadly to the assumptions that market participants would use in pricing the asset or liability, including assumptions about risk, such as the risk inherent in a particular valuation technique used to measure fair value using a pricing model and/or the risk inherent in the inputs for the valuation technique. Inputs may be observable or unobservable. Observable inputs reflect the assumptions market participants would use in pricing the asset or liability based on market data obtained from sources independent of the Fund. Unobservable inputs reflect the Fund’s own assumptions about the assumptions market participants would use in pricing the asset or liability
Notes to Financial Statements (Unaudited) (continued)
based on the information available. The inputs or methodology used for valuing assets or liabilities may not be an indication of the risks associated with investing in those assets or liabilities. The three-tier hierarchy of inputs is summarized below.
| • | Level 1—quoted prices in active markets for an identical asset or liability |
| • | Level 2—other significant observable inputs (including quoted prices for a similar asset or liability in active markets, interest rates and yield curves, prepayment speeds, credit risk, etc.) |
| • | Level 3—significant unobservable inputs (including the Fund's own assumptions about the assumptions that market participants would use in measuring fair value of an asset or liability) |
Securities valued at amortized cost are not obtained from a quoted price in an active market and are generally categorized as Level 2 in the hierarchy. The level of an asset or liability within the fair value hierarchy is based on the lowest level of an input, both individually and in the aggregate, that is significant to the fair value measurement. As of April 30, 2021, the aggregate value by input level of the Fund’s assets and liabilities is included at the end of the Portfolio of Investments.
The Fund may use third-party vendor evaluations, whose prices may be derived from one or more of the following standard inputs, among others:
| • Benchmark yields | • Reported trades |
| • Broker/dealer quotes | • Issuer spreads |
| • Two-sided markets | • Benchmark securities |
| • Bids/offers | • Reference data (corporate actions or material event notices) |
| • Industry and economic events | • Comparable bonds |
| • Monthly payment information | |
An asset or liability for which market values cannot be measured using the methodologies described above is valued by methods deemed reasonable in good faith by the Valuation Committee, following the procedures established by the Board, to represent fair value. Under these procedures, the Fund may utilize some of the following fair value techniques: multi-dimensional relational pricing models and option adjusted spread pricing. During the six-month period ended April 30, 2021, there were no material changes to the fair value methodologies. Securities valued in this manner are generally categorized as Level 3 in the hierarchy. No securities held by the Fund as of April 30, 2021, were fair valued in such a manner.
The information above is not intended to reflect an exhaustive list of the methodologies that may be used to value portfolio investments. The valuation procedures permit the use of a variety of valuation methodologies in connection with valuing portfolio investments. The methodology used for a specific type of investment may vary based on the market data available or other considerations. The methodologies summarized above may not represent the specific means by which portfolio investments are valued on any particular business day.
(C) Income Taxes. The Fund's policy is to comply with the requirements of the Internal Revenue Code of 1986, as amended (the “Internal Revenue Code”), applicable to regulated investment companies and to distribute all of its taxable income to the shareholders of the Fund within the allowable time limits.
The Manager evaluates the Fund’s tax positions to determine if the tax positions taken meet the minimum recognition threshold in connection with accounting for uncertainties in income tax positions taken or expected to be taken for the purposes of measuring and recognizing tax liabilities in the financial statements. Recognition of tax benefits of an uncertain tax position is permitted only to the extent the position is “more likely than not” to be sustained assuming examination by taxing authorities. The Manager analyzed the Fund's tax positions taken on federal, state and local income tax returns for all open tax years (for up to three tax years) and has concluded that no provisions for federal, state and local income tax are required in the Fund's financial statements. The Fund's federal, state and local income tax and federal excise tax returns for tax years for which the applicable statutes of limitations have not expired are subject to examination by the Internal Revenue Service and state and local departments of revenue.
(D) Dividends and Distributions to Shareholders. Dividends and distributions are recorded on the ex-dividend date. The Fund intends to declare dividends from net investment income, if any, daily and intends to pay them at least monthly and declares and pays distributions from net realized capital and currency gains, if any, at least annually. Unless a shareholder elects otherwise, all dividends and distributions are reinvested at NAV in the same class of shares of the Fund. Dividends and distributions to shareholders are determined in accordance with federal income tax regulations and may differ from determinations using GAAP.
(E) Security Transactions and Investment Income. The Fund records security transactions on the trade date. Realized gains and losses on security transactions are determined using the identified cost method. Interest income is accrued daily and discounts and premiums on securities purchased for the Fund are accreted and amortized, respectively, on the straight-line method. The straight-line method approximates the effective interest rate for short-term investments.
(F) Expenses. Expenses of the Trust are allocated to the individual Funds in proportion to the net assets of the respective Funds when the expenses are incurred, except where direct allocations of expenses can be made. Expenses (other than transfer agent expenses) are allocated to separate classes of shares pro rata based upon their relative net assets on the date the expenses are incurred. The expenses borne by the Fund, including those of related parties to the Fund, are shown in the Statement of Operations.
(G) Use of Estimates. In preparing financial statements in conformity with GAAP, the Manager makes estimates and assumptions that affect the reported amounts and disclosures in the financial statements. Actual results could differ from those estimates and assumptions.
| 12 | MainStay U.S. Government Liquidity Fund |
(H) Debt Securities Risk. The Fund’s investments may include securities such as variable rate notes and floaters. If expectations about changes in interest rates, or assessments of an issuer’s credit worthiness or market conditions are incorrect, investments in these types of securities could lose money for the Fund. The ability of issuers of debt securities, including the U.S. government, held by the Fund to meet their obligations may be affected by, among other things, economic or political developments in a specific country, industry or region.
(I) LIBOR Replacement Risk. The Fund may invest in certain debt securities, derivatives or other financial instruments that utilize the London Interbank Offered Rate ("LIBOR"), as a “benchmark” or “reference rate” for various interest rate calculations. The United Kingdom Financial Conduct Authority, which regulates LIBOR, announced that after 2021 it will cease its active encouragement of banks to provide the quotations needed to sustain LIBOR. However, it is possible that certain LIBOR tenors may continue beyond 2021 and the most widely used LIBOR tenors may continue until mid-2023. As a result, it is anticipated that LIBOR will be discontinued or will no longer be sufficiently robust to be representative of its underlying market around that time. Although financial regulators and industry working groups have suggested alternative reference rates, such as European Interbank Offer Rate (“EURIBOR”), Sterling Overnight Interbank Average Rate (“SONIA”) and Secured Overnight Financing Rate (“SOFR”), there are challenges to converting certain contracts and transactions to a new benchmark and neither the full effects of the transition process nor its ultimate outcome is known. New York Life Investments is currently working to assess exposure and will modify contracts as necessary.
The elimination of LIBOR or changes to other reference rates or any other changes or reforms to the determination or supervision of reference rates could have an adverse impact on the market for, or value of, any securities or payments linked to those reference rates, which may adversely affect the Fund's performance and/or net asset value. Uncertainty and risk also remain regarding the willingness and ability of issuers and lenders to include revised provisions in new and existing contracts or instruments. Consequently, the transition away from LIBOR to other reference rates may lead to increased volatility and illiquidity in markets that are tied to LIBOR, fluctuations in values of LIBOR-related investments or investments in issuers that utilize LIBOR, increased difficulty in borrowing or refinancing and diminished effectiveness of hedging strategies, adversely affecting the Fund's performance. Furthermore, the risks associated with the expected discontinuation of LIBOR and transition may be exacerbated if the work necessary to effect an orderly transition to an alternative reference rate is not completed in a timely manner. Because the usefulness of LIBOR as a benchmark could deteriorate during the transition period, these effects could occur prior to the end of 2021 with respect to certain LIBOR tenors or mid-2023 for the remaining LIBOR tenors.
(J) Indemnifications. Under the Trust’s organizational documents, its officers and trustees are indemnified against certain liabilities that may arise out of performance of their duties to the Trust. Additionally, in the
normal course of business, the Fund enters into contracts with third-party service providers that contain a variety of representations and warranties and that may provide general indemnifications. The Fund's maximum exposure under these arrangements is unknown, as this would involve future claims that may be made against the Fund that have not yet occurred. The Manager believes that the risk of loss in connection with these potential indemnification obligations is remote. However, there can be no assurance that material liabilities related to such obligations will not arise in the future, which could adversely impact the Fund.
Note 3–Fees and Related Party Transactions
(A) Manager and Subadvisor. New York Life Investments, a registered investment adviser and an indirect, wholly-owned subsidiary of New York Life Insurance Company ("New York Life"), serves as the Fund's Manager pursuant to a Management Agreement ("Management Agreement"). The Manager provides offices, conducts clerical, recordkeeping and bookkeeping services and keeps most of the financial and accounting records required to be maintained by the Fund. Except for the portion of salaries and expenses that are the responsibility of the Fund, the Manager pays the salaries and expenses of all personnel affiliated with the Fund and certain operational expenses of the Fund. The Fund reimburses New York Life Investments in an amount equal to the portion of the compensation of the Chief Compliance Officer attributable to the Fund. NYL Investors LLC ("NYL Investors" or ''Subadvisor''), a registered investment adviser and a direct, wholly-owned subsidiary of New York Life, serves as Subadvisor to the Fund and is responsible for the day-to-day portfolio management of the Fund. Pursuant to the terms of a Subadvisory Agreement ("Subadvisory Agreement") between New York Life Investments and NYL Investors, New York Life Investments pays for the services of the Subadvisor.
Pursuant to the Management Agreement, the Fund pays the Manager a monthly fee for the services performed and the facilities furnished at an annual rate of 0.12% of the Fund's average daily net assets.
New York Life Investments has contractually agreed to waive fees and/or reimburse expenses so that Total Annual Fund Operating Expenses (excluding taxes, interest, litigation, extraordinary expenses, brokerage and other transaction expenses relating to the purchase or sale of portfolio investments and acquired (underlying) fund fees and expenses) for Class I shares do not exceed 0.15% of average daily net assets. This agreement will remain in effect until February 28, 2022, and shall renew automatically for one-year terms unless New York Life Investments provides written notice of termination prior to the start of the next term or upon approval of the Board.
During the six-month period ended April 30, 2021, New York Life Investments earned fees from the Fund in the amount of $618,097 and waived fees and/or reimbursed expenses in the amount of $406,760 and paid the Subadvisor fees in the amount of $309,049.
JPMorgan Chase Bank, N.A. ("JPMorgan") provides sub-administration and sub-accounting services to the Fund pursuant to an agreement with
Notes to Financial Statements (Unaudited) (continued)
New York Life Investments. These services include calculating the daily NAVs of the Fund, maintaining the general ledger and sub-ledger accounts for the calculation of the Fund's NAVs, and assisting New York Life Investments in conducting various aspects of the Fund's administrative operations. For providing these services to the Fund, JPMorgan is compensated by New York Life Investments.
Prior to November 23, 2020, these services were provided by State Street Bank and Trust Company ("State Street").
(B) Transfer, Dividend Disbursing and Shareholder Servicing Agent. NYLIM Service Company LLC, an affiliate of New York Life Investments, is the Fund's transfer, dividend disbursing and shareholder servicing agent pursuant to an agreement between NYLIM Service Company LLC and the Trust. NYLIM Service Company LLC has entered into an agreement with DST Asset Manager Solutions, Inc. ("DST"), pursuant to which DST performs certain transfer agent services on behalf of NYLIM Service Company LLC. New York Life Investments has contractually agreed to limit the transfer agency expenses charged to the Fund’s share classes to a maximum of 0.35% of that share class’s average daily net assets on an annual basis after deducting any applicable Fund or class-level expense reimbursement or small account fees. This agreement will remain in effect until February 28, 2022 and shall renew automatically for one-year terms unless New York Life Investments provides written notice of termination prior to the start of the next term or upon approval of the Board. During the six-month period ended April 30, 2021, the Fund did not record any transfer agent expenses.
Note 4-Federal Income Tax
The amortized cost also represents the aggregate cost for federal income tax purposes.
During the year ended October 31, 2020, the tax character of distributions paid as reflected in the Statements of Changes in Net Assets was as follows:
| | 2020 |
| Distributions paid from: | |
| Ordinary Income | $5,366,919 |
Note 5–Custodian
JPMorgan is the custodian of cash and securities held by the Fund. Custodial fees are charged to the Fund based on the Fund's net assets and/or the market value of securities held by the Fund and the number of certain transactions incurred by the Fund.
Prior to November 23, 2020, these services were provided by State Street. The services provided by State Street were a direct expense of the Fund and are included in the Statement of Operations as Custodian fees which totaled $1,254 for the period November 1, 2020 through November 22, 2020.
Note 6–Capital Share Transactions
Transactions in capital shares for the six-month period ended April 30, 2021 and the year ended October 31, 2020, were as follows:
| Class I (at $1 per share) | Shares |
| Six-month period ended April 30, 2021: | |
| Shares sold | 7,907,019,831 |
| Shares issued to shareholders in reinvestment of distributions | 49,193 |
| Shares redeemed | (7,259,790,534) |
| Net increase (decrease) | 647,278,490 |
| Year ended October 31, 2020 : | |
| Shares sold | 12,595,285,893 |
| Shares issued to shareholders in reinvestment of distributions | 5,366,919 |
| Shares redeemed | (12,876,127,593) |
| Net increase (decrease) | (275,474,781) |
Note 7–Recent Accounting Pronouncement
In March 2020, the Financial Accounting Standards Board issued Accounting Standards Update 2020-04 (“ASU 2020-04”), which provides optional guidance to ease the potential accounting burden associated with transitioning away from LIBOR and other reference rates that are expected to be discontinued. ASU 2020-04 was effective immediately upon release of the update on March 12, 2020 and remains effective through December 31, 2022. At this time, the Manager is evaluating the implications of certain other provisions of ASU 2020-04 related to new disclosure requirements and any impact on the financial statement disclosures has not yet been determined.
Note 8–Other Matters
An outbreak of COVID-19, first detected in December 2019, has developed into a global pandemic and has resulted in travel restrictions, closure of international borders, certain businesses and securities markets, restrictions on securities trading activities, prolonged quarantines, supply chain disruptions, and lower consumer demand, as well as general concern and uncertainty. The continued impact of COVID-19 is uncertain and could further adversely affect the global economy, national economies, individual issuers and capital markets in unforeseeable ways and result in a substantial and extended economic downturn. Developments that disrupt global economies and financial markets, such as COVID-19, may magnify factors that affect the Fund's performance.
Note 9–Subsequent Events
In connection with the preparation of the financial statements of the Fund as of and for the six-month period ended April 30, 2021, events and transactions subsequent to April 30, 2021, through the date the financial statements were issued have been evaluated by the Manager for possible
| 14 | MainStay U.S. Government Liquidity Fund |
adjustment and/or disclosure. No subsequent events requiring financial statement adjustment or disclosure have been identified.
Board Consideration and Approval of Management Agreement and Subadvisory Agreement (Unaudited)
The continuation of the Management Agreement with respect to the MainStay U.S. Government Liquidity Fund (“Fund”) and New York Life Investment Management LLC (“New York Life Investments”) and the Subadvisory Agreement between New York Life Investments and NYL Investors LLC (“NYL Investors”) with respect to the Fund (together, “Advisory Agreements”), following an initial term of up to two years, is subject to annual review and approval by the Board of Trustees of MainStay Funds Trust (“Board” of the “Trust”) in accordance with Section 15 of the Investment Company Act of 1940, as amended (“1940 Act”). At its December 9–10, 2020 meeting, the Board, including the Trustees who are not an “interested person” (as such term is defined in the 1940 Act) of the Trust (“Independent Trustees”) voting separately, unanimously approved the continuation of each of the Advisory Agreements for a one-year period.
In reaching the decision to approve the continuation of each of the Advisory Agreements, the Board considered information furnished by New York Life Investments and NYL Investors in connection with an annual contract review process undertaken by the Board that took place at meetings of the Board and its Contracts Committee during September 2020 through December 2020, as well as other information furnished to the Board and its Committees throughout the year, as deemed relevant by the Trustees. Information requested by and furnished to the Board for consideration in connection with the contract review process included, among other items, reports on the Fund and “peer funds” prepared by New York Life Investments. The Board also considered information on the fees charged to other investment advisory clients of New York Life Investments and/or NYL Investors that follow investment strategies similar to those of the Fund, if any, and, when applicable, the rationale for any differences in the Fund’s management and subadvisory fees and the fees charged to those other investment advisory clients. In addition, the Board considered information furnished by New York Life Investments and NYL Investors in response to requests prepared on behalf of the Board, and in consultation with the Independent Trustees, by independent legal counsel to the Independent Trustees, which encompassed a variety of topics, including those summarized below.
The Board took into account information provided in connection with its meetings throughout the year, including, among other items, information regarding the legal standards and fiduciary obligations applicable to its consideration of the continuation of each of the Advisory Agreements and investment performance reports on the Fund as well as presentations from New York Life Investments and NYL Investors personnel. The Board also took into account other information received from New York Life Investments throughout the year, including, among other items, periodic reports on legal and compliance matters, risk management, portfolio turnover, brokerage commissions and non-advisory services provided to the Fund by New York Life Investments. The contract review process, including the structure and format for materials provided to the Board, has been developed in consultation with the Board. The Independent Trustees also met in executive sessions with their independent legal counsel and, for a portion thereof, with senior management of New York Life Investments.
In addition to information provided to the Board throughout the year, the Board received information in connection with its June 2020 meeting provided specifically in response to requests prepared on behalf of the Board, and in consultation with the Independent Trustees, by independent legal counsel regarding the Fund’s distribution arrangements.
In considering the continuation of each of the Advisory Agreements, the Trustees reviewed and evaluated the information and factors they believed to reasonably be necessary and appropriate in light of legal advice furnished to them by independent legal counsel and through the exercise of their own business judgment. Although individual Trustees may have weighed certain factors or information differently, the factors considered by the Board are described in greater detail below and include, among other factors: (i) the nature, extent and quality of the services provided to the Fund by New York Life Investments and NYL Investors; (ii) the qualifications of the portfolio managers of the Fund and the historical investment performance of the Fund, New York Life Investments and NYL Investors; (iii) the costs of the services provided, and profits realized, by New York Life Investments and NYL Investors from their relationships with the Fund; (iv) the extent to which economies of scale have been realized or may be realized as the Fund grows and the extent to which economies of scale have benefited or may benefit the Fund’s shareholders; and (v) the reasonableness of the Fund’s management and subadvisory fees and total ordinary operating expenses. Although the Board recognized that comparisons between the Fund’s fees and expenses and those of other funds are imprecise given different terms of agreements, variations in fund strategies and other factors, the Board considered the reasonableness of the Fund’s management fee and total ordinary operating expenses as compared to the peer funds identified by New York Life Investments. Throughout their considerations, the Trustees acknowledged the commitment of New York Life Investments and its affiliates to serve the MainStay Group of Funds, as well as their capacity, experience, resources, financial stability and reputations. The Trustees also acknowledged the entrepreneurial and other risks assumed by New York Life Investments in sponsoring and managing the Fund.
The Trustees noted that, throughout the year, the Trustees are afforded an opportunity to ask questions of, and request additional information or materials from, New York Life Investments and NYL Investors. The Board’s decision with respect to each of the Advisory Agreements may have also been based, in part, on the Board’s knowledge of New York Life Investments and NYL Investors resulting from, among other things, the Board’s consideration of each of the Advisory Agreements in prior years, the advisory agreements for other funds in the MainStay Group of Funds, the Board’s review throughout the year of the performance and operations of other funds in the MainStay Group of Funds and each Trustee’s business judgment and industry experience. In addition to considering the above-referenced factors, the Board observed that in the marketplace there are a range of investment options available to the Fund’s shareholders and such shareholders, having had the opportunity to consider other investment options, have chosen to invest in the Fund.
| 16 | MainStay U.S. Government Liquidity Fund |
The factors that figured prominently in the Board’s decision to approve the continuation of each of the Advisory Agreements during its December 9–10, 2020 meeting are summarized in more detail below, and the Board did not consider any factor or information controlling in reaching such decision.
Nature, Extent and Quality of Services Provided by New York Life Investments and NYL Investors
The Board examined the nature, extent and quality of the services that New York Life Investments provides to the Fund. The Board evaluated New York Life Investments’ experience and capabilities in serving as manager of the Fund and considered that the Fund operates in a “manager-of-managers” structure. The Board also considered New York Life Investments’ responsibilities and services provided pursuant to this structure, including evaluating the performance of NYL Investors, making recommendations to the Board as to whether the Subadvisory Agreement should be renewed, modified or terminated and periodically reporting to the Board regarding the results of New York Life Investments’ evaluation and monitoring functions. The Board noted that New York Life Investments manages other mutual funds, serves a variety of other investment advisory clients, including other pooled investment vehicles, and has experience overseeing mutual fund service providers, including subadvisors. The Board considered the experience of senior personnel at New York Life Investments providing management and administrative and other non-advisory services to the Fund as well as New York Life Investments’ reputation and financial condition. The Board observed that New York Life Investments devotes significant resources and time to providing management and non-advisory services to the Fund, including New York Life Investments’ supervision and due diligence reviews of NYL Investors and ongoing analysis of, and interactions with, NYL Investors with respect to, among other things, the Fund’s investment performance and risks as well as NYL Investors’ investment capabilities and subadvisory services with respect to the Fund.
The Board also considered the range of services that New York Life Investments provides to the Fund under the terms of the Management Agreement, including: (i) fund accounting and ongoing supervisory services provided by New York Life Investments’ Fund Administration and Accounting Group; (ii) investment supervisory and analytical services provided by New York Life Investments’ Investment Consulting Group; (iii) compliance services provided by the Trust’s Chief Compliance Officer as well as New York Life Investments’ compliance department, including supervision and implementation of the Fund’s compliance program; (iv) legal services provided by New York Life Investments’ Office of the General Counsel; and (v) risk management monitoring and analysis by compliance and investment personnel. The Board noted that New York Life Investments provides certain other non-advisory services to the Fund. In addition, the Board considered New York Life Investments’ willingness to invest in personnel, infrastructure, technology, operational enhancements, cyber security, information security, shareholder privacy resources and business continuity planning designed to benefit the Fund and noted that New York Life Investments is responsible for compensating
the Trust’s officers, except for a portion of the salary of the Trust’s Chief Compliance Officer. The Board recognized that New York Life Investments has provided an increasingly broad array of non-advisory services to the MainStay Group of Funds as a result of regulatory and other developments.
The Board also examined the nature, extent and quality of the investment advisory services that NYL Investors provides to the Fund and considered the terms of each of the Advisory Agreements. The Board evaluated NYL Investors’ experience in serving as subadvisor to the Fund and advising other portfolios and NYL Investors’ track record and experience in providing investment advisory services, the experience of investment advisory, senior management and administrative personnel at NYL Investors and New York Life Investments’ and NYL Investors’ overall resources, legal and compliance environment, capabilities and history. In addition to information provided in connection with quarterly meetings with the Trust’s Chief Compliance Officer, the Board considered information regarding the compliance policies and procedures of New York Life Investments and NYL Investors and acknowledged their commitment to further developing and strengthening compliance programs relating to the Fund. The Board reviewed NYL Investors’ ability to attract and retain qualified investment professionals and willingness to invest in personnel to service and support the Fund. In this regard, the Board considered the experience of the Fund’s portfolio managers, the number of accounts managed by the portfolio managers and the method for compensating the portfolio managers.
In addition, the Board considered discussions with New York Life Investments regarding the implementation of its business continuity plans and recognized steps taken by New York Life Investments and NYL Investors to continue to provide the same nature, extent and quality of services to the Fund during the COVID-19 pandemic.
Based on these considerations, the Board concluded that the Fund would likely continue to benefit from the nature, extent and quality of these services.
Investment Performance
In evaluating the Fund’s investment performance, the Board considered investment performance results over various periods in light of the Fund’s investment objective, strategies and risks. The Board considered investment reports on, and analysis of, the Fund’s performance provided to the Board throughout the year. These reports include, among other items, information on the Fund’s gross and net returns, the Fund’s investment performance compared to relevant investment categories and the Fund’s benchmarks, the Fund’s risk-adjusted investment performance and the Fund’s investment performance as compared to peer funds, as appropriate, as well as portfolio attribution information and commentary on the effect of market conditions. The Board also considered information provided by New York Life Investments showing the investment performance of the Fund as compared to peer funds.
Board Consideration and Approval of Management Agreement and Subadvisory Agreement (Unaudited) (continued)
The Board also gave weight to its discussions with senior management at New York Life Investments concerning the Fund’s investment performance attributable to NYL Investors as well as discussions between the Fund’s portfolio managers and the members of the Board’s Investment Committee, which generally occur on an annual basis. In addition, the Board considered any specific actions that New York Life Investments or NYL Investors had taken, or had agreed to take, to seek to enhance Fund investment performance and the results of those actions.
Based on these considerations, the Board concluded that its review of the Fund’s investment performance and related information supported a determination to approve the continuation of each of the Advisory Agreements.
Costs of the Services Provided, and Profits Realized, by New York Life Investments and NYL Investors
The Board considered the costs of the services provided under each of the Advisory Agreements. The Board also considered the profits realized by New York Life Investments and its affiliates, including NYL Investors, due to their relationships with the Fund. Because NYL Investors is an affiliate of New York Life Investments whose subadvisory fee is paid by New York Life Investments, not the Fund, the Board considered cost and profitability information for New York Life Investments and NYL Investors in the aggregate.
In addition, the Board acknowledged the difficulty in obtaining reliable comparative data about mutual fund managers’ profitability because such information generally is not publicly available and may be impacted by numerous factors, including the structure of a fund manager’s organization, the types of funds it manages, the methodology used to allocate certain fixed costs to specific funds and the manager’s capital structure and costs of capital.
In evaluating the costs of the services provided by New York Life Investments and NYL Investors and profits realized by New York Life Investments and its affiliates, including NYL Investors, the Board considered, among other factors, each party’s continuing investments in, or willingness to invest in, personnel, systems, equipment and other resources and infrastructure to support and further enhance the management of the Fund, and that New York Life Investments is responsible for paying the subadvisory fee for the Fund. The Board also considered the financial resources of New York Life Investments and NYL Investors and acknowledged that New York Life Investments and NYL Investors must be in a position to attract and retain experienced professional personnel and to maintain a strong financial position for New York Life Investments and NYL Investors to continue to provide high-quality services to the Fund. The Board recognized that the Fund benefits from the allocation of certain fixed costs among the funds in the MainStay Group of Funds, among other expected benefits resulting from its relationship with New York Life Investments.
The Board considered information regarding New York Life Investments’ methodology for calculating profitability and allocating costs provided by New York Life Investments in connection with the fund profitability
analysis presented to the Board. The Board previously engaged an independent consultant to review the methods used to allocate costs among the funds in the MainStay Group of Funds. The Board noted that the independent consultant had concluded that New York Life Investments’ methods for allocating costs and procedures for estimating overall profitability of the relationship with the funds in the MainStay Group of Funds are reasonable and that New York Life Investments continued to use the same method of calculating profit and allocating costs since the independent consultant’s review. The Board recognized the difficulty in calculating and evaluating a manager’s profitability with respect to the Fund and noted that other profitability methodologies may also be reasonable. The Board considered the profitability of New York Life Investments’ relationship with the Fund on a pre-tax basis.
The Board also considered certain fall-out benefits that may be realized by New York Life Investments and its affiliates due to their relationships with the Fund, including reputational and other indirect benefits, as well as additional revenue that may be generated as a result of other funds in the MainStay Group of Funds choosing to invest uninvested cash in the Fund rather than investment options outside of the MainStay Group of Funds.
After evaluating the information deemed relevant by the Trustees, the Board concluded that any profits realized by New York Life Investments and its affiliates, including NYL Investors, due to their relationships with the Fund were not excessive.
Management and Subadvisory Fees and Total Ordinary Operating Expenses
The Board evaluated the reasonableness of the fee paid under each of the Advisory Agreements and the Fund’s total ordinary operating expenses. The Board primarily considered the reasonableness of the management fee paid by the Fund to New York Life Investments, because the subadvisory fee paid to NYL Investors is paid by New York Life Investments, not the Fund. The Board also considered the reasonableness of the subadvisory fee paid by New York Life Investments and the amount of the management fee retained by New York Life Investments.
In assessing the reasonableness of the Fund’s fees and expenses, the Board primarily considered comparative data provided by New York Life Investments on the fees and expenses charged by similar mutual funds managed by other investment advisers, including New York Life Investments’ previous statement that some similar funds managed by other investment advisers are not charged a management fee. In addition, the Board considered information provided by New York Life Investments and NYL Investors on fees charged to other investment advisory clients, including institutional separate accounts and/or other funds that follow investment strategies similar to those of the Fund, if any. The Board considered the similarities and differences in the contractual management fee schedules of the Fund and these similarly-managed accounts and/or funds, taking into account the rationale for any differences in fee schedules. The Board also took into account explanations provided by New York Life Investments about the more
| 18 | MainStay U.S. Government Liquidity Fund |
extensive scope of services provided to registered investment companies, such as the Fund, as compared with other investment advisory clients. Additionally, the Board considered the impact of voluntary waivers and expense limitation arrangements on the Fund’s net management fee and expenses. The Board noted that New York Life Investments had provided support to the Fund in the form of voluntary waivers and/or reimbursements of fees and expenses in order to maintain a positive yield. The Board also considered that in proposing fees for the Fund, New York Life Investments considers the competitive marketplace for mutual funds.
Based on the factors outlined above, the Board concluded that the Fund’s management fee and total ordinary operating expenses were within a range that is competitive and support a conclusion that these fees and expenses are reasonable.
Economies of Scale
The Board considered information regarding economies of scale, including whether the Fund’s expense structure permits economies of scale to be appropriately shared with the Fund’s shareholders. The Board also considered a report from New York Life Investments, previously prepared at the request of the Board, that addressed economies of scale, including with respect to the mutual fund business generally and the various ways in which the benefits of economies of scale may be shared with the funds in the MainStay Group of Funds. Although the Board recognized the difficulty of determining economies of scale with precision, the Board acknowledged that economies of scale may be shared with the Fund in a number of ways, including, for example, through the imposition of management fee breakpoints, initially setting management fee rates at scale or making additional investments to enhance services. The Board reviewed information from New York Life Investments showing how the Fund’s management fee schedule compared to fee schedules of other funds and accounts managed by New York Life Investments.
Based on this information, the Board concluded that economies of scale are appropriately reflected for the benefit of the Fund’s shareholders through the Fund’s expense structure and other methods to share benefits from economies of scale.
Conclusion
On the basis of the information and factors summarized above, among other information and factors deemed relevant by the Trustees, and the evaluation thereof, the Board, including the Independent Trustees voting separately, unanimously voted to approve the continuation of each of the Advisory Agreements.
Proxy Voting Record
The Fund is required to file with the Securities and Exchange Commissions's ("SEC") its proxy voting records for the 12-month period ending June 30 on Form N-PX. The most recent Form N-PX or proxy voting record is available free of charge upon request by calling 800-624-6782; visiting the MainStay Funds’ website at newyorklifeinvestments.com; or visiting the SEC’s website at www.sec.gov.
Shareholder Reports and Quarterly Portfolio Disclosure
The Fund is required to file a Form N-MFP every month disclosing its portfolio holdings. The Fund's Form N-MFP is available free of charge upon request by calling New York Life Investments at 800-624-6782.
| 20 | MainStay U.S. Government Liquidity Fund |
This page intentionally left blank.
This page intentionally left blank.
Equity
U.S. Equity
MainStay Epoch U.S. Equity Yield Fund
MainStay MacKay S&P 500 Index Fund
MainStay Winslow Large Cap Growth Fund
MainStay WMC Enduring Capital Fund
MainStay WMC Growth Fund
MainStay WMC Small Companies Fund
MainStay WMC Value Fund
International Equity
MainStay Epoch International Choice Fund
MainStay MacKay International Equity Fund
MainStay WMC International Research Equity Fund
Emerging Markets Equity
MainStay Candriam Emerging Markets Equity Fund
Global Equity
MainStay Epoch Capital Growth Fund
MainStay Epoch Global Equity Yield Fund
Fixed Income
Taxable Income
MainStay Candriam Emerging Markets Debt Fund
MainStay Floating Rate Fund
MainStay MacKay High Yield Corporate Bond Fund
MainStay MacKay Short Duration High Yield Fund
MainStay MacKay Strategic Bond Fund
MainStay MacKay Total Return Bond Fund
MainStay MacKay U.S. Infrastructure Bond Fund
MainStay Short Term Bond Fund
Tax-Exempt Income
MainStay MacKay California Tax Free Opportunities Fund1
MainStay MacKay High Yield Municipal Bond Fund
MainStay MacKay Intermediate Tax Free Bond Fund
MainStay MacKay New York Tax Free Opportunities Fund2
MainStay MacKay Short Term Municipal Fund
MainStay MacKay Tax Free Bond Fund
Money Market
MainStay Money Market Fund
Mixed Asset
MainStay Balanced Fund
MainStay Income Builder Fund
MainStay MacKay Convertible Fund
Speciality
MainStay CBRE Global Infrastructure Fund
MainStay CBRE Real Estate Fund
MainStay Cushing MLP Premier Fund
Asset Allocation
MainStay Conservative Allocation Fund
MainStay Conservative ETF Allocation Fund
MainStay Defensive ETF Allocation Fund
MainStay Equity Allocation Fund
MainStay Equity ETF Allocation Fund
MainStay Growth Allocation Fund
MainStay Growth ETF Allocation Fund
MainStay Moderate Allocation Fund
MainStay Moderate ETF Allocation Fund
Manager
New York Life Investment Management LLC
New York, New York
Subadvisors
Candriam Belgium S.A.3
Brussels, Belgium
Candriam Luxembourg S.C.A.3
Strassen, Luxembourg
CBRE Clarion Securities LLC
Radnor, Pennsylvania
Cushing Asset Management, LP
Dallas, Texas
Epoch Investment Partners, Inc.
New York, New York
MacKay Shields LLC3
New York, New York
NYL Investors LLC3
New York, New York
Wellington Management Company LLP
Boston, Massachusetts
Winslow Capital Management, LLC
Minneapolis, Minnesota
Legal Counsel
Dechert LLP
Washington, District of Columbia
Independent Registered Public Accounting Firm
KPMG LLP
Philadelphia, Pennsylvania
Distributor
NYLIFE Distributors LLC3
Jersey City, New Jersey
Custodian
JPMorgan Chase Bank, N.A.
New York, New York
1.
This Fund is registered for sale in AZ, CA, NV, OR, TX, UT, WA and MI (Class A and I shares only), and CO, FL, GA, HI, ID, MA, MD, NH, NJ and NY (Class I shares only).
| 2. | This Fund is registered for sale in CA, CT, DE, FL, MA, NJ, NY and VT. |
| 3. | An affiliate of New York Life Investment Management LLC. |
Not part of the Semiannual Report
For more information
800-624-6782
newyorklifeinvestments.com
“New York Life Investments” is both a service mark, and the common trade name, of certain investment advisors affiliated with New York Life Insurance Company. The MainStay Funds® are managed by New York Life Investment Management LLC and distributed by NYLIFE Distributors LLC, 30 Hudson Street, Jersey City, NJ 07302, a wholly owned subsidiary of New York Life Insurance Company. NYLIFE Distributors LLC is a Member FINRA/SIPC.
| ©2021 NYLIFE Distributors LLC. All rights reserved. | MSUGL10a-06/21 |
MainStay WMC Growth Fund
(formerly known as MainStay MacKay Growth Fund)
Message from the President and Semiannual Report
Unaudited | April 30, 2021
Sign up for e-delivery of your shareholder reports. For full details on e-delivery, including who can participate and what you can receive via e-delivery,
please log in to newyorklifeinvestments.com/accounts.
| Not FDIC/NCUA Insured | Not a Deposit | May Lose Value | No Bank Guarantee | Not Insured by Any Government Agency |
This page intentionally left blank
Message from the President
With the approval of COVID-19 vaccines and the passage of relief packages by the U.S. Congress, economic prospects improved during the reporting period, and investor risk appetite increased, benefiting both equities and fixed-income markets. Despite some volatility stemming from a sell-off in longer-dated Treasury securities, the stock market and higher-risk segments of the fixed-income market posted gains for the six months ended April 30, 2021.
By the beginning of the reporting period, the economy had made tremendous progress from the second quarter of 2020, when economic activity plunged. But uncertainty about when vaccines would be available and how quickly they could be administered left investors unsure about the economic outlook.
With the approval of several vaccines in November, the outlook brightened and investors became less risk-averse. Anticipating the likely end of the pandemic and a continuation of the economic recovery, they began to see opportunities in investment-grade and high-yield bonds and more cyclical segments of the stock market. The $900 billion relief and stimulus package passed in December provided further assurance.
In January, the Federal Reserve opted to leave interest rates unchanged, pointing to some uncertainty about the pace of the global recovery. Officials also noted that inflation remained low, citing oil prices in particular.
In March, President Biden signed the $1.9 billion American Rescue Plan, which, among other provisions, called for payments of $1,400 for those earning less than $75,000 per year, plus $1,400 per dependent. This, combined with the Federal Reserve’s new tolerance for inflation and an anticipated $2 trillion infrastructure spending bill, added to growing concerns about higher prices. Supply shortages in some markets caused some prices to soar, heightening concerns further.
In fixed-income markets, an improving economic outlook and rising inflation expectations led to a sell-off in longer-term Treasuries, with the result that the yield on the 10-year note rose sharply, particularly in February and March. Investment grade corporate bonds were also affected. Early in the reporting period, they performed well as investors shifted out of Treasuries, but as the reporting period progressed, they faltered. Longer-dated securities issued in recent years at historically low interest rates became especially unattractive.
High-yield bonds remained steady, supported by more favorable yields and an improved economic outlook, which reduced their perceived risk. Municipal bonds produced modest gains, and
although the sell-off in Treasuries produced some volatility early in 2021, stronger-than-expected tax revenues, $350 billion in financial support from the federal government, and the possibility of an increase in federal income tax rates appeared to buoy the market late in the reporting period.
Inflation concerns and volatility in the Treasury market led to a shift in equities markets. Although the S&P 500® Index, a widely followed measure of U.S. equities, posted double-digit gains and hit a record high, the rise of Treasury yields disrupted valuations, especially those of growth stocks. Technology companies that saw their valuations soar amid the work-from-home trend in 2020 suffered large declines.
But the fiscal stimulus and continued accommodation from the Federal Reserve gave investors confidence the economic recovery would continue. Combined with the sky-high valuations in technology and growth stocks, this increased the appeal of more cyclical and value-oriented shares. As a result, value stocks outperformed growth stocks during the reporting period.
Reflecting the shift in investor sentiment, the performance of S&P 500® Index sectors varied widely. While the information technology sector kept up with the broader market, it lagged cyclical sectors such as energy and financials, which led the way. The shift was further reflected in the performance of small-cap stocks, which outperformed large caps. While developed markets kept pace with the U.S. market, lagging economic and pandemic recoveries appeared to weigh on emerging markets late in the reporting period.
With the lockdown restrictions lifting in the U.S. and the pandemic easing in many regions, we at New York Life Investments are looking forward to a return to a more normal economy. We anticipate that over the next several years, a variety of trends will likely offer long-term investors many attractive opportunities. With this in mind, we continue to develop products and services to help you to take advantage of these trends, manage your risks, and ultimately meet your investment goals.
Sincerely,
Kirk C. Lehneis
President
The opinions expressed are as of the date of this report and are subject to change. There is no guarantee that any forecast made will come to pass. This material does not constitute investment advice and is not intended as an endorsement of any specific investment. Past performance is no guarantee of future results.
Not part of the Semiannual Report
Investors should refer to the Fund’s Summary Prospectus and/or Prospectus and consider the Fund’s investment objectives, strategies, risks, charges and expenses carefully before investing. The Summary Prospectus and/or Prospectus contain this and other information about the Fund. You may obtain copies of the Fund’s Summary Prospectus, Prospectus and Statement of Additional Information free of charge, upon request, by calling toll-free 800-624-6782, by writing to NYLIFE Distributors LLC, Attn: MainStay Marketing Department, 30 Hudson Street, Jersey City, NJ 07302 or by sending an e-mail to MainStayShareholderServices@nylim.com. These documents are also available via the MainStay Funds’ website at newyorklifeinvestments.com. Please read the Fund’s Summary Prospectus and/or Prospectus carefully before investing.
Investment and Performance Comparison (Unaudited)
Performance data quoted represents past performance. Past performance is no guarantee of future results. Because of market volatility and other factors, current performance may be lower or higher than the figures shown. Investment return and principal value will fluctuate, and as a result, when shares are redeemed, they may be worth more or less than their original cost. The graph below depicts the historical performance of Class I shares of the Fund. Performance will vary from class to class based on differences in class-specific expenses and sales charges. For performance information current to the most recent month-end, please call 800-624-6782 or visit newyorklifeinvestments.com.
The performance table and graph do not reflect the deduction of taxes that a shareholder would pay on distributions or Fund share redemptions. Total returns reflect maximum applicable sales charges as indicated in the table below, if any, changes in share price, and reinvestment of dividend and capital gain distributions. The graph assumes the initial investment amount shown below and reflects the deduction of all sales charges that would have applied for the period of investment. Performance figures may reflect certain fee waivers and/or expense limitations, without which total returns may have been lower. For more information on share classes and current fee waivers and/or expense limitations (if any), please refer to the Notes to Financial Statements.
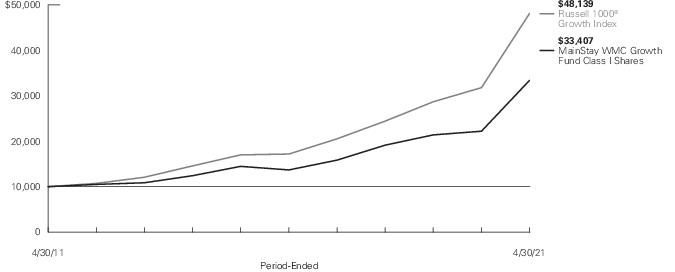
| Average Annual Total Returns for the Period-Ended April 30, 2021 |
| Class | Sales Charge | | Inception
Date1 | Six
Months | One
Year | Five Years
or Since
Inception | Ten
Years | Gross
Expense
Ratio2 |
| Class A Shares | Maximum 5.5% Initial Sales Charge | With sales charges | 8/7/2006 | 18.25% | 41.77% | 17.89% | 11.90% | 1.04% |
| | | Excluding sales charges | | 25.13 | 50.02 | 19.23 | 12.53 | 1.04 |
| Investor Class Shares3 | Maximum 5% Initial Sales Charge | With sales charges | 1/18/2013 | 18.71 | 41.37 | 17.58 | 13.38 | 1.41 |
| | | Excluding sales charges | | 24.96 | 49.60 | 18.92 | 14.16 | 1.41 |
| Class B Shares4 | Maximum 5% CDSC | With sales charges | 1/18/2013 | 19.51 | 43.48 | 17.83 | 13.31 | 2.15 |
| | if Redeemed Within First Six Years of Purchase | Excluding sales charges | | 24.51 | 48.48 | 18.04 | 13.31 | 2.15 |
| Class C Shares | Maximum 1% CDSC | With sales charges | 1/18/2013 | 23.49 | 47.51 | 18.03 | 13.30 | 2.15 |
| | if Redeemed Within One Year of Purchase | Excluding sales charges | | 24.49 | 48.51 | 18.03 | 13.30 | 2.15 |
| Class I Shares | No Sales Charge | | 11/2/2009 | 25.32 | 50.44 | 19.54 | 12.82 | 0.79 |
| Class R2 Shares | No Sales Charge | | 1/18/2013 | 25.06 | 49.86 | 19.12 | 14.29 | 1.14 |
| Class R6 Shares | No Sales Charge | | 4/26/2021 | -1.18 | N/A | N/A | N/A | 0.72 |
| 1. | Effective March 5, 2021, the Fund replaced its subadvisor and modified its principal investment strategies. The past performance in the graph and table prior to that date reflects the Fund's prior subadvisor and principal investment strategies. |
| 2. | The gross expense ratios presented reflect the Fund’s “Total Annual Fund Operating Expenses” from the most recent Prospectus, as supplemented, and may differ from other expense ratios disclosed in this report. |
| 3. | Prior to June 30, 2020, the maximum initial sales charge was 5.5%, which is reflected in the average annual total return figures shown. |
| 4. | Class B shares are closed to all new purchases as well as additional investments by existing Class B shareholders. |
The footnotes on the next page are an integral part of the table and graph and should be carefully read in conjunction with them.
| Benchmark Performance | Six
Months | One
Year | Five
Years | Ten
Years |
| Russell 1000® Growth Index1 | 24.31% | 51.41% | 22.88% | 17.02% |
| Morningstar Large Growth Category Average2 | 25.34 | 51.64 | 20.63 | 14.64 |
| 1. | The Russell 1000® Growth Index is the Fund’s primary broad-based securities market index for comparison purposes. The Russell 1000® Growth Index measures the performance of the large-cap growth segment of the U.S. equity universe. It includes those Russell 1000® Index companies with higher price-to-book ratios and higher forecasted growth values. Results assume reinvestment of all dividends and capital gains. An investment cannot be made directly in an index. |
| 2. | The Morningstar Large Growth Category Average is representative of funds that invest primarily in big U.S. companies that are projected to grow faster than other large-cap stocks. Stocks in the top 70% of the capitalization of the U.S. equity market are defined as large cap. Growth is defined based on fast growth and high valuations. Most of these portfolios focus on companies in rapidly expanding industries. Results are based on average total returns of similar funds with all dividends and capital gain distributions reinvested. |
The footnotes on the preceding page are an integral part of the table and graph and should be carefully read in conjunction with them.
| 6 | MainStay WMC Growth Fund |
Cost in Dollars of a $1,000 Investment in MainStay WMC Growth Fund (Unaudited)
The example below is intended to describe the fees and expenses borne by shareholders during the six-month period from November 1, 2020, to April 30, 2021, and the impact of those costs on your investment.
Example
As a shareholder of the Fund you incur two types of costs: (1) transaction costs, including exchange fees and sales charges (loads) on purchases (as applicable), and (2) ongoing costs, including management fees, distribution and/or service (12b-1) fees, and other Fund expenses (as applicable). This example is intended to help you understand your ongoing costs (in dollars) of investing in the Fund and to compare these costs with the ongoing costs of investing in other mutual funds. The example is based on an investment of $1,000 made at the beginning of the six-month period and held for the entire period from November 1, 2020, to April 30, 2021.
This example illustrates your Fund’s ongoing costs in two ways:
Actual Expenses
The second and third data columns in the table below provide information about actual account values and actual expenses. You may use the information in these columns, together with the amount you invested, to estimate the expenses that you paid during the six months ended April 30, 2021. Simply divide your account value by $1,000 (for example, an
$8,600 account value divided by $1,000 = 8.6), then multiply the result by the number under the heading entitled “Expenses Paid During Period” to estimate the expenses you paid on your account during this period.
Hypothetical Example for Comparison Purposes
The fourth and fifth data columns in the table below provide information about hypothetical account values and hypothetical expenses based on the Fund’s actual expense ratio and an assumed rate of return of 5% per year before expenses, which is not the Fund’s actual return. The hypothetical account values and expenses may not be used to estimate the actual ending account balances or expenses you paid for the six-month period shown. You may use this information to compare the ongoing costs of investing in the Fund with the ongoing costs of investing in other mutual funds. To do so, compare this 5% hypothetical example with the 5% hypothetical examples that appear in the shareholder reports of the other mutual funds.
Please note that the expenses shown in the table are meant to highlight your ongoing costs only and do not reflect any transactional costs, such as exchange fees or sales charges (loads). Therefore, the fourth and fifth data columns of the table are useful in comparing ongoing costs only and will not help you determine the relative total costs of owning different funds. In addition, if these transactional costs were included, your costs would have been higher.
| Share Class | Beginning
Account
Value
11/1/20 | Ending Account
Value (Based
on Actual
Returns and
Expenses)
4/30/21 | Expenses
Paid
During
Period1 | Ending Account
Value (Based
on Hypothetical
5% Annualized
Return and
Actual Expenses)
4/30/21 | Expenses
Paid
During
Period1 | Net Expense
Ratio
During
Period2 |
| Class A Shares | $1,000.00 | $1,251.30 | $ 5.75 | $1,019.69 | $ 5.16 | 1.03% |
| Investor Class Shares | $1,000.00 | $1,249.60 | $ 7.42 | $1,018.20 | $ 6.66 | 1.33% |
| Class B Shares | $1,000.00 | $1,245.10 | $11.58 | $1,014.48 | $10.39 | 2.08% |
| Class C Shares | $1,000.00 | $1,244.90 | $11.58 | $1,014.48 | $10.39 | 2.08% |
| Class I Shares | $1,000.00 | $1,253.20 | $ 4.30 | $1,020.98 | $ 3.86 | 0.77% |
| Class R2 Shares | $1,000.00 | $1,250.60 | $ 6.31 | $1,019.19 | $ 5.66 | 1.13% |
| Class R6 Shares 3, 4 | $1,000.00 | $ 988.20 | $ 0.10 | $1,000.59 | $ 0.10 | 0.72% |
| 1. | Expenses are equal to the Fund’s annualized expense ratio of each class multiplied by the average account value over the period, divided by 365 and multiplied by 181 (to reflect the six-month period) and 5 days for Class R6 (to reflect the since-inception period). The table above represents the actual expenses incurred during the six-month period. In addition to the fees and expenses which the Fund bears directly, it also indirectly bears a pro rata share of the fees and expenses of the underlying funds in which it invests. Such indirect expenses are not included in the above-reported expense figures. |
| 2. | Expenses are equal to the Fund's annualized expense ratio to reflect the six-month period. |
| 3. | Expenses paid during the period reflect ongoing costs for the period from inception through 4/30/21. Had these shares been offered for the full six-month period ended 4/30/21, and had the Fund provided a hypothetical 5% annualized return, expenses paid during the period would have been $3.16 for Class R6 shares and the ending account value would have been $1,021.22 for Class R6 shares. |
| 4. | The inception date was April 26, 2021. |
Industry Composition as of April 30, 2021 (Unaudited)
| Software | 19.5% |
| IT Services | 15.5 |
| Interactive Media & Services | 10.9 |
| Internet & Direct Marketing Retail | 8.2 |
| Technology Hardware, Storage & Peripherals | 7.2 |
| Semiconductors & Semiconductor Equipment | 5.1 |
| Hotels, Restaurants & Leisure | 3.6 |
| Health Care Equipment & Supplies | 3.3 |
| Beverages | 3.0 |
| Professional Services | 2.8 |
| Capital Markets | 2.6 |
| Specialty Retail | 2.4 |
| Life Sciences Tools & Services | 1.8 |
| Health Care Providers & Services | 1.7 |
| Insurance | 1.5 |
| Consumer Finance | 1.5% |
| Road & Rail | 1.4 |
| Aerospace & Defense | 1.3 |
| Commercial Services & Supplies | 1.2 |
| Electronic Equipment, Instruments & Components | 1.2 |
| Textiles, Apparel & Luxury Goods | 1.1 |
| Biotechnology | 1.0 |
| Entertainment | 0.8 |
| Equity Real Estate Investment Trusts | 0.4 |
| Machinery | 0.2 |
| Short–Term Investments | 1.7 |
| Other Assets, Less Liabilities | –0.9 |
| | 100.0% |
See Portfolio of Investments beginning on page 11 for specific holdings within these categories. The Fund's holdings are subject to change.
Top Ten Holdings as of April 30, 2021 (excluding short-term investments) (Unaudited)
| 1. | Microsoft Corp. |
| 2. | Amazon.com, Inc. |
| 3. | Apple, Inc. |
| 4. | Alphabet, Inc., Class C |
| 5. | Facebook, Inc., Class A |
| 6. | Mastercard, Inc., Class A |
| 7. | PayPal Holdings, Inc. |
| 8. | Adobe, Inc. |
| 9. | salesforce.com, Inc. |
| 10. | Square, Inc., Class A |
| 8 | MainStay WMC Growth Fund |
Portfolio Management Discussion and Analysis (Unaudited)
Questions answered by portfolio managers Migene Kim, CFA, and Mona Patni of MacKay Shields LLC (“MacKay Shields”), the Fund’s former Subadvisor, and portfolio manager Andrew J. Shilling of Wellington Management Company LLP (“Wellington”), the Fund’s current Subadvisor.
How did MainStay WMC Growth Fund perform relative to its benchmark and peer group during the six months ended April 30, 2021?
For the six months ended April 30, 2021, Class I shares of MainStay WMC Growth Fund returned 25.32%, outperforming the 24.31% return of the Fund’s primary benchmark, the Russell 1000® Growth Index. Over the same period, Class I shares underperformed the 25.34% return of the Morningstar Large Growth Category Average.1
Were there any changes to the Fund during the reporting period?
At meetings held on January 21, January 25, and February 3, 2021, the Board of Trustees of MainStay Funds Trust considered and approved, among other related proposals: (i) appointing Wellington Management Company LLP as the Fund’s subadvisor, and the related subadvisory agreement; (ii) changing the Fund’s name; (iii) modifying the Fund’s principal investment strategies and investment process; and (iv) establishing a new expense cap for Class I shares of the Fund. These changes were effective on March 5, 2021. For more information on these and other changes refer to the supplement dated February 5, 2021.
In the process of implementing the new principal investment strategies and investment process, the Fund experienced a high level of portfolio turnover. Also, during this transition period, the Fund may not have been pursuing its investment objective or may not have been managed consistently with its investment strategies as stated in the Prospectus. This may have impacted the Fund’s performance.
What factors affected the Fund’s relative performance during the reporting period?
MacKay Shields
During the time that MacKay Shields managed the Fund, sector allocation and stock selection within sectors were positive, helping the Fund outperform the Russell 1000® Growth Index. In terms of stock-selection model efficacy, the combination of signals used by the quantitative stock selection model was rewarded over this portion of the reporting period, primarily driven by valuation measures.
Wellington
During the time Wellington managed the Fund, the Fund underperformed the Russell 1000® Growth Index primarily due to adverse security selection in the consumer discretionary and information technology sectors. Security selection in the consumer staples and health care sectors slightly offset weak relative performance. Sector allocation, a result of our bottom-up stock selection process, was muted. Underweight exposure to the real
estate sector weighed on relative results but was offset by the Fund’s underweight exposure to the health care sector, which bolstered returns.
During the reporting period, which sectors were the strongest positive contributors to the Fund’s relative performance, and which sectors were particularly weak?
MacKay Shields
The strongest positive contributions to the Fund’s performance during the time MacKay Shields managed the Fund relative to the Russell 1000® Growth Index came from the consumer discretionary, industrials and financials sectors. (Contributions take weightings and total returns into account.) Over the same period, the energy and materials sectors were the weakest contributors to relative performance.
Wellington
The health care, consumer staples and industrials sectors provided the strongest positive contributions to relative performance during the time Wellington managed the Fund. Over the same period, the consumer discretionary, information technology and real estate sectors detracted most from the Fund’s relative performance.
During the reporting period, which individual stocks made the strongest positive contributions to the Fund’s absolute performance and which stocks detracted the most?
MacKay Shields
The individual stocks that made the strongest positive contributions to the Fund’s absolute performance during the time MacKay Shields managed the Fund included hardware storage and peripherals company Apple, automobile manufacturer Tesla and systems software company Microsoft. The stocks that detracted most significantly from the Fund’s absolute performance during the same period were application software developer Zoom Video Communications, biotechnology company Regeneron Pharmaceuticals and research and consulting services provider Booz Allen Hamilton.
Wellington
At the issuer level, the most significant detractors from the Fund’s absolute performance during the time Wellington managed the Fund were social media company Twitter and fintech lending platform for digital commerce Affirm Holdings. The share price of Twitter ended lower after surging earlier in 2021. Despite market headwinds for growth companies, management maintains a favorable outlook and expects to significantly increase its user base each of the next three years. The share price of Affirm Holdings was pressured by a broad sell-off in high-priced tech
| 1. | See page 5 for other share class returns, which may be higher or lower than Class I share returns. See page 6 for more information on benchmark and peer group returns. |
stocks. Both positions were still held by the Fund as of the end of the reporting period.
The leading contributors to the Fund’s absolute performance during the same period were Amazon and Microsoft. The share price of Amazon increased after the company reported first quarter earnings that exceeded analysts’ expectations. Revenue and profit increases were led by Amazon Web Services (AWS), which represented nearly half of the company’s operating profits. AWS cloud services revenue benefited from work-from-home trends as businesses were driven to increase their pace of digitalization. The share price of Microsoft rose on the company’s strong earnings results, highlighted by growth in its Azure and Office areas, and reacceleration in Windows, LinkedIn and Dynamics. Operating margins were strong in all three reporting segments, and free cash flow grew significantly year over year. Both positions were still held by the Fund as of the end of the reporting period.
What were some of the Fund’s largest purchases and sales during the reporting period?
MacKay Shields
During the time MacKay Shields managed the Fund, the Fund’s largest initial purchase was in semiconductor equipment maker Lam Research, while its largest increased position was in Tesla. During the same period, the Fund sold its full position in aerospace and defense contractor Lockheed Martin, while its most significantly reduced position size was in online travel and restaurant reservations service provider Booking Holdings.
Wellington
During the time Wellington managed the Fund, notable additions to the Fund included cloud-based tax compliance software vendor Avalara and cloud computing-based data warehousing company Snowflake. Avalara software is used by businesses to calculate, file and pay taxes related to transactions. In light of the broad-based weakness in many software stocks, the Fund initiated a position. We believe the company’s leadership in this niche is protected by the extensive library of tax content they have assembled over decades, as well as their deep relationships and integration with third party vendors. In our view, there is a long and underappreciated growth runway for the company to expand into a large addressable market. Snowflake’s software platform uses third-party cloud services to bring a corporation’s various data assets into one place for analyzing, using and sharing. The company, founded in 2012, went public at the end of 2020 and, more recently, sold off from the highs it set after its initial public offering. The Fund used this weakness as an opportunity to add a position, as we believe the company has among the best unit economics in software and a very large, long-term market
opportunity with a strong management team to execute on its growth potential.
During the same period, we eliminated the Fund’s positions in software company Splunk and rail and related transportation company Canadian National Railway. Splunk offers solutions for searching, monitoring and analyzing machine-generated big data. Ultimately, we eliminated the position on growing concerns over mounting competitive pressure. In the case of Canadian National Railway, we eliminated the position on the back of the company’s intention to acquire railroad company Kansas City Southern. In our view, the acquisition calls into question our initial investment thesis. Given lengthy regulatory timelines in this space, we believe the acquisition could prove to be an overhang on the stock for the indefinite future.
How did the Fund’s sector and weightings change during the reporting period?
MacKay Shields
During the time MacKay Shields managed the Fund, the Fund's largest increases in sector exposures relative to the Russell 1000® Growth Index were in the consumer staples and industrials sectors. Conversely, the Fund's largest decreases in benchmark-relative sector exposures were in the health care and information technology sectors.
Wellington
During the time Wellington managed the Fund, the Fund’s largest increase in sector exposures relative to the Russell 1000® Growth Index was in information technology. During the same period, the most significant decrease in benchmark-relative sector exposures was in industrials.
How was the Fund positioned at the end of the reporting period?
MacKay Shields
At the end of the period when MacKay Shields managed the Fund, the Fund held overweight exposure relative to the Russell 1000® Growth Index in the consumer discretionary and communication services sectors. As of the same date, the Fund’s most significantly underweight positions relative to the benchmark were in the consumer staples and industrials sectors.
Wellington
As of April 30, 2021, the Fund held overweight exposure relative to the Russell 1000® Growth Index in the information technology and financials sectors. As of the same date, the Fund’s most significantly underweight positions relative to the benchmark were in the health care and consumer discretionary sectors.
The opinions expressed are those of the portfolio managers as of the date of this report and are subject to change. There is no guarantee that any forecasts will come to pass. This material does not constitute investment advice and is not intended as an endorsement of any specific investment.
| 10 | MainStay WMC Growth Fund |
Portfolio of Investments April 30, 2021† (Unaudited)
| | Shares | Value |
| Common Stocks 99.2% |
| Aerospace & Defense 1.3% |
| Airbus SE, ADR | 138,563 | $ 4,158,276 |
| Northrop Grumman Corp. | 21,053 | 7,462,025 |
| | | 11,620,301 |
| Beverages 3.0% |
| Constellation Brands, Inc., Class A | 68,024 | 16,347,528 |
| Monster Beverage Corp. (a) | 101,928 | 9,892,112 |
| | | 26,239,640 |
| Biotechnology 1.0% |
| Biogen, Inc. (a) | 7,511 | 2,007,916 |
| Seagen, Inc. (a) | 45,544 | 6,547,405 |
| | | 8,555,321 |
| Capital Markets 2.6% |
| Blackstone Group, Inc. (The) | 70,770 | 6,262,437 |
| Coinbase Global, Inc., Class A (a) | 11,717 | 3,487,448 |
| MarketAxess Holdings, Inc. | 15,623 | 7,631,210 |
| S&P Global, Inc. | 14,907 | 5,819,544 |
| | | 23,200,639 |
| Commercial Services & Supplies 1.2% |
| Copart, Inc. (a) | 84,851 | 10,564,798 |
| Consumer Finance 1.5% |
| American Express Co. | 86,254 | 13,227,051 |
| Electronic Equipment, Instruments & Components 1.2% |
| CDW Corp. | 58,532 | 10,438,012 |
| Entertainment 0.8% |
| Walt Disney Co. (The) | 39,030 | 7,260,361 |
| Equity Real Estate Investment Trusts 0.4% |
| Equinix, Inc. | 5,413 | 3,901,474 |
| Health Care Equipment & Supplies 3.3% |
| ABIOMED, Inc. (a) | 34,172 | 10,959,987 |
| Boston Scientific Corp. (a) | 266,079 | 11,601,044 |
| Penumbra, Inc. (a) | 22,024 | 6,739,124 |
| | | 29,300,155 |
| Health Care Providers & Services 1.7% |
| UnitedHealth Group, Inc. | 36,492 | 14,553,010 |
| | Shares | Value |
| |
| Hotels, Restaurants & Leisure 3.6% |
| Airbnb, Inc., Class A (a) | 41,611 | $ 7,186,636 |
| Booking Holdings, Inc. (a) | 3,637 | 8,969,133 |
| DraftKings, Inc., Class A (a)(b) | 159,670 | 9,046,902 |
| Hilton Worldwide Holdings, Inc. (a) | 51,612 | 6,642,464 |
| | | 31,845,135 |
| Insurance 1.5% |
| Markel Corp. (a) | 4,459 | 5,245,657 |
| Marsh & McLennan Cos., Inc. | 43,304 | 5,876,353 |
| Progressive Corp. (The) | 24,176 | 2,435,490 |
| | | 13,557,500 |
| Interactive Media & Services 10.9% |
| Alphabet, Inc., Class C (a) | 18,114 | 43,656,914 |
| Facebook, Inc., Class A (a) | 98,556 | 32,038,584 |
| Match Group, Inc. (a) | 27,706 | 4,311,885 |
| Snap, Inc., Class A (a) | 59,426 | 3,673,715 |
| Twitter, Inc. (a) | 60,695 | 3,351,578 |
| ZoomInfo Technologies, Inc., Class A (a) | 161,244 | 8,362,114 |
| | | 95,394,790 |
| Internet & Direct Marketing Retail 8.2% |
| Alibaba Group Holding Ltd., Sponsored ADR (a) | 23,439 | 5,413,237 |
| Amazon.com, Inc. (a) | 19,225 | 66,661,149 |
| | | 72,074,386 |
| IT Services 15.5% |
| Affirm Holdings, Inc. (a)(b) | 64,635 | 4,556,768 |
| Fidelity National Information Services, Inc. | 78,565 | 12,012,589 |
| FleetCor Technologies, Inc. (a) | 52,256 | 15,035,096 |
| Global Payments, Inc. | 55,441 | 11,899,302 |
| Mastercard, Inc., Class A | 77,431 | 29,583,288 |
| PayPal Holdings, Inc. (a) | 91,422 | 23,979,076 |
| Shopify, Inc., Class A (a) | 4,178 | 4,940,527 |
| Snowflake, Inc., Class A (a) | 23,010 | 5,328,886 |
| Square, Inc., Class A (a) | 67,987 | 16,644,577 |
| Visa, Inc., Class A | 51,086 | 11,931,646 |
| | | 135,911,755 |
| Life Sciences Tools & Services 1.8% |
| Illumina, Inc. (a) | 27,982 | 10,992,449 |
| Mettler-Toledo International, Inc. (a) | 3,559 | 4,674,106 |
| | | 15,666,555 |
| Machinery 0.2% |
| IDEX Corp. | 9,257 | 2,075,419 |
The notes to the financial statements are an integral part of, and should be read in conjunction with, the financial statements.
11
Portfolio of Investments April 30, 2021† (Unaudited) (continued)
| | Shares | Value |
| Common Stocks (continued) |
| Professional Services 2.8% |
| IHS Markit Ltd. | 86,001 | $ 9,251,988 |
| TransUnion | 145,717 | 15,240,541 |
| | | 24,492,529 |
| Road & Rail 1.4% |
| JB Hunt Transport Services, Inc. | 26,064 | 4,449,385 |
| Uber Technologies, Inc. (a) | 138,209 | 7,569,707 |
| | | 12,019,092 |
| Semiconductors & Semiconductor Equipment 5.1% |
| Advanced Micro Devices, Inc. (a) | 191,563 | 15,635,372 |
| Microchip Technology, Inc. | 95,748 | 14,389,967 |
| Monolithic Power Systems, Inc. | 6,953 | 2,512,675 |
| NVIDIA Corp. | 20,902 | 12,549,143 |
| | | 45,087,157 |
| Software 19.5% |
| Adobe, Inc. (a) | 36,478 | 18,543,227 |
| Autodesk, Inc. (a) | 47,132 | 13,758,302 |
| Avalara, Inc. (a) | 40,432 | 5,729,619 |
| DocuSign, Inc. (a) | 16,725 | 3,728,671 |
| Intuit, Inc. | 20,117 | 8,291,423 |
| Microsoft Corp. | 268,907 | 67,812,967 |
| nCino, Inc. (a) | 96,852 | 6,333,152 |
| salesforce.com, Inc. (a) | 76,753 | 17,677,751 |
| ServiceNow, Inc. (a) | 22,962 | 11,627,268 |
| Tyler Technologies, Inc. (a) | 12,684 | 5,388,924 |
| UiPath, Inc., Class A (a)(b) | 4,000 | 288,000 |
| Workday, Inc., Class A (a) | 47,542 | 11,742,874 |
| | | 170,922,178 |
| Specialty Retail 2.4% |
| Burlington Stores, Inc. (a) | 26,986 | 8,806,341 |
| TJX Cos., Inc. (The) | 166,866 | 11,847,486 |
| | | 20,653,827 |
| Technology Hardware, Storage & Peripherals 7.2% |
| Apple, Inc. | 479,503 | 63,035,464 |
| | Shares | | Value |
| |
| Textiles, Apparel & Luxury Goods 1.1% |
| Lululemon Athletica, Inc. (a) | 28,371 | | $ 9,511,945 |
Total Common Stocks
(Cost $585,198,870) | | | 871,108,494 |
| Short-Term Investments 1.7% |
| Affiliated Investment Company 0.5% |
| MainStay U.S. Government Liquidity Fund, 0.01% (c) | 4,609,493 | | 4,609,493 |
| Unaffiliated Investment Company 1.2% |
| BlackRock Liquidity FedFund, 0.05% (c)(d) | 10,619,621 | | 10,619,621 |
Total Short-Term Investments
(Cost $15,229,114) | | | 15,229,114 |
Total Investments
(Cost $600,427,984) | 100.9% | | 886,337,608 |
| Other Assets, Less Liabilities | (0.9) | | (8,318,941) |
| Net Assets | 100.0% | | $ 878,018,667 |
| † | Percentages indicated are based on Fund net assets. |
| (a) | Non-income producing security. |
| (b) | All or a portion of this security was held on loan. As of April 30, 2021, the aggregate market value of securities on loan was $13,862,870; the total market value of collateral held by the Fund was $14,582,508. The market value of the collateral held included non-cash collateral in the form of U.S. Treasury securities with a value of $3,962,887. The Fund received cash collateral with a value of $10,619,621. (See Note 2(H)) |
| (c) | Current yield as of April 30, 2021. |
| (d) | Represents a security purchased with cash collateral received for securities on loan. |
| Abbreviation(s): |
| ADR—American Depositary Receipt |
The notes to the financial statements are an integral part of, and should be read in conjunction with, the financial statements.
| 12 | MainStay WMC Growth Fund |
The following is a summary of the fair valuations according to the inputs used as of April 30, 2021, for valuing the Fund’s assets:
| Description | Quoted
Prices in
Active
Markets for
Identical
Assets
(Level 1) | | Significant
Other
Observable
Inputs
(Level 2) | | Significant
Unobservable
Inputs
(Level 3) | | Total |
| Asset Valuation Inputs | | | | | | | |
| Investments in Securities (a) | | | | | | | |
| Common Stocks | $ 871,108,494 | | $ — | | $ — | | $ 871,108,494 |
| Short-Term Investments | | | | | | | |
| Affiliated Investment Company | 4,609,493 | | — | | — | | 4,609,493 |
| Unaffiliated Investment Company | 10,619,621 | | — | | — | | 10,619,621 |
| Total Short-Term Investments | 15,229,114 | | — | | — | | 15,229,114 |
| Total Investments in Securities | $ 886,337,608 | | $ — | | $ — | | $ 886,337,608 |
| (a) | For a complete listing of investments and their industries, see the Portfolio of Investments. |
The notes to the financial statements are an integral part of, and should be read in conjunction with, the financial statements.
13
Statement of Assets and Liabilities as of April 30, 2021 (Unaudited)
| Assets |
Investment in unaffiliated securities, at value
(identified cost $595,818,491) including securities on loan of $13,862,870 | $881,728,115 |
Investment in affiliated investment companies, at value
(identified cost $4,609,493) | 4,609,493 |
| Cash | 44,545 |
| Receivables: | |
| Investment securities sold | 8,266,107 |
| Dividends and interest | 166,675 |
| Fund shares sold | 52,000 |
| Securities lending | 2,136 |
| Other assets | 86,735 |
| Total assets | 894,955,806 |
| Liabilities |
| Cash collateral received for securities on loan | 10,619,621 |
| Payables: | |
| Investment securities purchased | 4,885,537 |
| Fund shares redeemed | 529,028 |
| Manager (See Note 3) | 481,760 |
| NYLIFE Distributors (See Note 3) | 171,923 |
| Transfer agent (See Note 3) | 161,644 |
| Shareholder communication | 49,543 |
| Professional fees | 22,140 |
| Custodian | 9,279 |
| Accrued expenses | 6,664 |
| Total liabilities | 16,937,139 |
| Net assets | $878,018,667 |
| Composition of Net Assets |
| Shares of beneficial interest outstanding (par value of $.001 per share) unlimited number of shares authorized | $ 17,143 |
| Additional paid-in-capital | 388,968,653 |
| | 388,985,796 |
| Total distributable earnings (loss) | 489,032,871 |
| Net assets | $878,018,667 |
| Class A | |
| Net assets applicable to outstanding shares | $662,014,029 |
| Shares of beneficial interest outstanding | 12,906,213 |
| Net asset value per share outstanding | $ 51.29 |
| Maximum sales charge (5.50% of offering price) | 2.99 |
| Maximum offering price per share outstanding | $ 54.28 |
| Investor Class | |
| Net assets applicable to outstanding shares | $104,283,536 |
| Shares of beneficial interest outstanding | 2,070,036 |
| Net asset value per share outstanding | $ 50.38 |
| Maximum sales charge (5.00% of offering price) | 2.65 |
| Maximum offering price per share outstanding | $ 53.03 |
| Class B | |
| Net assets applicable to outstanding shares | $ 17,067,564 |
| Shares of beneficial interest outstanding | 366,684 |
| Net asset value and offering price per share outstanding | $ 46.55 |
| Class C | |
| Net assets applicable to outstanding shares | $ 3,062,216 |
| Shares of beneficial interest outstanding | 65,817 |
| Net asset value and offering price per share outstanding | $ 46.53 |
| Class I | |
| Net assets applicable to outstanding shares | $ 12,423,921 |
| Shares of beneficial interest outstanding | 235,220 |
| Net asset value and offering price per share outstanding | $ 52.82 |
| Class R2 | |
| Net assets applicable to outstanding shares | $ 128,719 |
| Shares of beneficial interest outstanding | 2,531 |
| Net asset value and offering price per share outstanding | $ 50.86 |
| Class R6 | |
| Net assets applicable to outstanding shares | $ 79,038,682 |
| Shares of beneficial interest outstanding | 1,496,828 |
| Net asset value and offering price per share outstanding | $ 52.80 |
The notes to the financial statements are an integral part of, and should be read in conjunction with, the financial statements.
| 14 | MainStay WMC Growth Fund |
Statement of Operations for the six months ended April 30, 2021 (Unaudited)
| Investment Income (Loss) |
| Income | |
| Dividends-unaffiliated (net of foreign tax withholding of $4,209) | $ 3,356,550 |
| Securities lending | 4,126 |
| Dividends-affiliated | 80 |
| Total income | 3,360,756 |
| Expenses | |
| Manager (See Note 3) | 2,795,570 |
| Distribution/Service—Class A (See Note 3) | 766,202 |
| Distribution/Service—Investor Class (See Note 3) | 128,269 |
| Distribution/Service—Class B (See Note 3) | 86,525 |
| Distribution/Service—Class C (See Note 3) | 16,361 |
| Distribution/Service—Class R2 (See Note 3) | 154 |
| Transfer agent (See Note 3) | 433,947 |
| Professional fees | 73,500 |
| Registration | 46,383 |
| Shareholder communication | 38,691 |
| Custodian | 13,763 |
| Trustees | 8,894 |
| Insurance | 3,472 |
| Shareholder service (See Note 3) | 62 |
| Miscellaneous | 15,323 |
| Total expenses before waiver/reimbursement | 4,427,116 |
| Expense waiver/reimbursement from Manager (See Note 3) | (56,373) |
| Net expenses | 4,370,743 |
| Net investment income (loss) | (1,009,987) |
| Realized and Unrealized Gain (Loss) |
| Net realized gain (loss) on: | |
| Unaffiliated investment transactions(a) | 208,423,011 |
| Foreign currency transactions | 115 |
| Net realized gain (loss) | 208,423,126 |
| Net change in unrealized appreciation (depreciation) on investments | (25,086,832) |
| Net realized and unrealized gain (loss) | 183,336,294 |
| Net increase (decrease) in net assets resulting from operations | $182,326,307 |
| (a) | Includes transition cost of $124,334. |
The notes to the financial statements are an integral part of, and should be read in conjunction with, the financial statements.
15
Statements of Changes in Net Assets
for the six months ended April 30, 2021 (Unaudited) and the year ended October 31, 2020
| | 2021 | 2020 |
| Increase (Decrease) in Net Assets |
| Operations: | | |
| Net investment income (loss) | $ (1,009,987) | $ (72,935) |
| Net realized gain (loss) | 208,423,126 | 29,311,805 |
| Net change in unrealized appreciation (depreciation) | (25,086,832) | 121,106,263 |
| Net increase (decrease) in net assets resulting from operations | 182,326,307 | 150,345,133 |
| Distributions to shareholders: | | |
| Class A | (21,718,012) | (15,403,716) |
| Investor Class | (4,061,019) | (3,676,176) |
| Class B | (733,259) | (628,523) |
| Class C | (136,352) | (104,423) |
| Class I | (3,507,825) | (5,087,745) |
| Class R2 | (4,524) | (2,047) |
| Total distributions to shareholders | (30,160,991) | (24,902,630) |
| Capital share transactions: | | |
| Net proceeds from sales of shares | 25,370,794 | 36,498,118 |
| Net asset value of shares issued to shareholder in reinvestment of distributions | 29,968,036 | 24,744,914 |
| Cost of shares redeemed | (80,758,231) | (144,222,198) |
| Increase (decrease) in net assets derived from capital share transactions | (25,419,401) | (82,979,166) |
| Net increase (decrease) in net assets | 126,745,915 | 42,463,337 |
| Net Assets |
| Beginning of period | 751,272,752 | 708,809,415 |
| End of period | $878,018,667 | $ 751,272,752 |
The notes to the financial statements are an integral part of, and should be read in conjunction with, the financial statements.
| 16 | MainStay WMC Growth Fund |
Financial Highlights selected per share data and ratios
| | Six months ended
April 30,
2021* | | Year Ended October 31, |
| Class A | 2020 | | 2019 | | 2018 | | 2017 | | 2016 |
| Net asset value at beginning of period | $ 42.56 | | $ 36.07 | | $ 36.41 | | $ 34.18 | | $ 29.07 | | $ 32.33 |
| Net investment income (loss) (a) | (0.05) | | (0.00)‡ | | 0.10 | | 0.09 | | 0.12 | | (0.04) |
| Net realized and unrealized gain (loss) on investments | 10.53 | | 7.78 | | 2.87 | | 3.47 | | 7.39 | | (0.97) |
| Net realized and unrealized gain (loss) on foreign currency transactions | 0.00‡ | | — | | — | | — | | — | | — |
| Total from investment operations | 10.48 | | 7.78 | | 2.97 | | 3.56 | | 7.51 | | (1.01) |
| Less distributions: | | | | | | | | | | | |
| From net investment income | — | | (0.16) | | (0.06) | | (0.02) | | — | | — |
| From net realized gain on investments | (1.75) | | (1.13) | | (3.25) | | (1.31) | | (2.40) | | (2.25) |
| Total distributions | (1.75) | | (1.29) | | (3.31) | | (1.33) | | (2.40) | | (2.25) |
| Net asset value at end of period | $ 51.29 | | $ 42.56 | | $ 36.07 | | $ 36.41 | | $ 34.18 | | $ 29.07 |
| Total investment return (b) | 25.13% | | 22.21% | | 8.90% | | 10.74% | | 27.88% | | (3.39)% |
| Ratios (to average net assets)/Supplemental Data: | | | | | | | | | | | |
| Net investment income (loss) | (0.22)%†† | | 0.01% | | 0.30% | | 0.23% | | 0.39% | | (0.14)% (c) |
| Net expenses (d) | 1.03%†† | | 1.04% | | 1.06% | | 1.06% | | 1.09% | | 1.15% (e) |
| Expenses (before waiver/reimbursement) (d) | 1.03%†† | | 1.04% | | 1.06% | | 1.06% | | 1.09% | | 1.16% |
| Portfolio turnover rate | 33% | | 150% | | 153% | | 116% | | 139% | | 137% |
| Net assets at end of period (in 000’s) | $ 662,014 | | $ 531,715 | | $ 436,508 | | $ 431,854 | | $ 391,245 | | $ 260,670 |
| * | Unaudited. |
| ‡ | Less than one cent per share. |
| †† | Annualized. |
| (a) | Per share data based on average shares outstanding during the period. |
| (b) | Total investment return is calculated exclusive of sales charges and assumes the reinvestment of dividends and distributions. For periods of less than one year, total return is not annualized. |
| (c) | Without the custody fee reimbursement, net investment income (loss) would have been (0.15)%. |
| (d) | In addition to the fees and expenses which the Fund bears directly, it also indirectly bears a pro-rata share of the fees and expenses of the underlying funds in which it invests. Such indirect expenses are not included in the above expense ratios. |
| (e) | Without the custody fee reimbursement, net expenses would have been 1.16%. |
The notes to the financial statements are an integral part of, and should be read in conjunction with, the financial statements.
17
Financial Highlights selected per share data and ratios
| | Six months ended
April 30,
2021* | | Year Ended October 31, |
| Investor Class | 2020 | | 2019 | | 2018 | | 2017 | | 2016 |
| Net asset value at beginning of period | $ 41.89 | | $ 35.53 | | $ 35.94 | | $ 33.82 | | $ 28.86 | | $ 32.17 |
| Net investment income (loss) (a) | (0.11) | | (0.10) | | 0.01 | | 0.00‡ | | 0.06 | | (0.10) |
| Net realized and unrealized gain (loss) on investments | 10.35 | | 7.65 | | 2.83 | | 3.43 | | 7.30 | | (0.96) |
| Net realized and unrealized gain (loss) on foreign currency transactions | 0.00‡ | | — | | — | | — | | — | | — |
| Total from investment operations | 10.24 | | 7.55 | | 2.84 | | 3.43 | | 7.36 | | (1.06) |
| Less distributions: | | | | | | | | | | | |
| From net investment income | — | | (0.06) | | — | | — | | — | | — |
| From net realized gain on investments | (1.75) | | (1.13) | | (3.25) | | (1.31) | | (2.40) | | (2.25) |
| Total distributions | (1.75) | | (1.19) | | (3.25) | | (1.31) | | (2.4) | | (2.25) |
| Net asset value at end of period | $ 50.38 | | $ 41.89 | | $ 35.53 | | $ 35.94 | | $ 33.82 | | $ 28.86 |
| Total investment return (b) | 24.96% | | 21.84% | | 8.61% | | 10.47% | | 27.54% | | (3.60)% |
| Ratios (to average net assets)/Supplemental Data: | | | | | | | | | | | |
| Net investment income (loss) | (0.48)%†† | | (0.26)% | | 0.03% | | 0.01% | | 0.21% | | (0.34)% |
| Net expenses (c) | 1.33%†† | | 1.34% | | 1.33% | | 1.31% | | 1.35% | | 1.35% |
| Expenses (before waiver/reimbursement) (c) | 1.38%†† | | 1.41% | | 1.42% | | 1.37% | | 1.35% | | 1.35% |
| Portfolio turnover rate | 33% | | 150% | | 153% | | 116% | | 139% | | 137% |
| Net assets at end of period (in 000’s) | $ 104,284 | | $ 97,709 | | $ 110,762 | | $ 108,043 | | $ 134,867 | | $ 200,772 |
| * | Unaudited. |
| ‡ | Less than one cent per share. |
| †† | Annualized. |
| (a) | Per share data based on average shares outstanding during the period. |
| (b) | Total investment return is calculated exclusive of sales charges and assumes the reinvestment of dividends and distributions. For periods of less than one year, total return is not annualized. |
| (c) | In addition to the fees and expenses which the Fund bears directly, it also indirectly bears a pro-rata share of the fees and expenses of the underlying funds in which it invests. Such indirect expenses are not included in the above expense ratios. |
| | Six months ended
April 30,
2021* | | Year Ended October 31, |
| Class B | 2020 | | 2019 | | 2018 | | 2017 | | 2016 |
| Net asset value at beginning of period | $ 38.96 | | $ 33.31 | | $ 34.13 | | $ 32.42 | | $ 27.95 | | $ 31.45 |
| Net investment income (loss) (a) | (0.27) | | (0.36) | | (0.22) | | (0.26) | | (0.16) | | (0.30) |
| Net realized and unrealized gain (loss) on investments | 9.61 | | 7.14 | | 2.65 | | 3.28 | | 7.03 | | (0.95) |
| Net realized and unrealized gain (loss) on foreign currency transactions | 0.00‡ | | — | | — | | — | | — | | — |
| Total from investment operations | 9.34 | | 6.78 | | 2.43 | | 3.02 | | 6.87 | | (1.25) |
| Less distributions: | | | | | | | | | | | |
| From net realized gain on investments | (1.75) | | (1.13) | | (3.25) | | (1.31) | | (2.40) | | (2.25) |
| Net asset value at end of period | $ 46.55 | | $ 38.96 | | $ 33.31 | | $ 34.13 | | $ 32.42 | | $ 27.95 |
| Total investment return (b) | 24.51% | | 20.93% | | 7.79% | | 9.63% | | 26.61% | | (4.30)% |
| Ratios (to average net assets)/Supplemental Data: | | | | | | | | | | | |
| Net investment income (loss) | (1.23)%†† | | (1.01)% | | (0.69)% | | (0.74)% | | (0.56)% | | (1.09)% |
| Net expenses (c) | 2.08%†† | | 2.08% | | 2.08% | | 2.06% | | 2.10% | | 2.10% |
| Expenses (before waiver/reimbursement) (c) | 2.13%†† | | 2.15% | | 2.18% | | 2.12% | | 2.10% | | 2.10% |
| Portfolio turnover rate | 33% | | 150% | | 153% | | 116% | | 139% | | 137% |
| Net assets at end of period (in 000’s) | $ 17,068 | | $ 16,382 | | $ 18,749 | | $ 23,554 | | $ 30,064 | | $ 33,468 |
| * | Unaudited. |
| ‡ | Less than one cent per share. |
| †† | Annualized. |
| (a) | Per share data based on average shares outstanding during the period. |
| (b) | Total investment return is calculated exclusive of sales charges and assumes the reinvestment of dividends and distributions. For periods of less than one year, total return is not annualized. |
| (c) | In addition to the fees and expenses which the Fund bears directly, it also indirectly bears a pro-rata share of the fees and expenses of the underlying funds in which it invests. Such indirect expenses are not included in the above expense ratios. |
The notes to the financial statements are an integral part of, and should be read in conjunction with, the financial statements.
| 18 | MainStay WMC Growth Fund |
Financial Highlights selected per share data and ratios
| | Six months ended
April 30,
2021* | | Year Ended October 31, |
| Class C | 2020 | | 2019 | | 2018 | | 2017 | | 2016 |
| Net asset value at beginning of period | $ 38.95 | | $ 33.30 | | $ 34.12 | | $ 32.41 | | $ 27.94 | | $ 31.44 |
| Net investment income (loss) (a) | (0.27) | | (0.36) | | (0.21) | | (0.27) | | (0.17) | | (0.31) |
| Net realized and unrealized gain (loss) on investments | 9.60 | | 7.14 | | 2.64 | | 3.29 | | 7.04 | | (0.94) |
| Net realized and unrealized gain (loss) on foreign currency transactions | 0.00‡ | | — | | — | | — | | — | | — |
| Total from investment operations | 9.33 | | 6.78 | | 2.43 | | 3.02 | | 6.87 | | (1.25) |
| Less distributions: | | | | | | | | | | | |
| From net realized gain on investments | (1.75) | | (1.13) | | (3.25) | | (1.31) | | (2.40) | | (2.25) |
| Net asset value at end of period | $ 46.53 | | $ 38.95 | | $ 33.30 | | $ 34.12 | | $ 32.41 | | $ 27.94 |
| Total investment return (b) | 24.49% | | 20.94% | | 7.80% | | 9.63% | | 26.62% | | (4.34)% |
| Ratios (to average net assets)/Supplemental Data: | | | | | | | | | | | |
| Net investment income (loss) | (1.24)%†† | | (1.02)% | | (0.67)% | | (0.77)% | | (0.58)% | | (1.10)% |
| Net expenses (c) | 2.08%†† | | 2.08% | | 2.08% | | 2.06% | | 2.10% | | 2.10% |
| Expenses (before waiver/reimbursement) (c) | 2.13%†† | | 2.15% | | 2.18% | | 2.12% | | 2.10% | | 2.10% |
| Portfolio turnover rate | 33% | | 150% | | 153% | | 116% | | 139% | | 137% |
| Net assets at end of period (in 000’s) | $ 3,062 | | $ 3,068 | | $ 3,144 | | $ 5,331 | | $ 4,884 | | $ 4,831 |
| * | Unaudited. |
| ‡ | Less than one cent per share. |
| †† | Annualized. |
| (a) | Per share data based on average shares outstanding during the period. |
| (b) | Total investment return is calculated exclusive of sales charges and assumes the reinvestment of dividends and distributions. For periods of less than one year, total return is not annualized. |
| (c) | In addition to the fees and expenses which the Fund bears directly, it also indirectly bears a pro-rata share of the fees and expenses of the underlying funds in which it invests. Such indirect expenses are not included in the above expense ratios. |
The notes to the financial statements are an integral part of, and should be read in conjunction with, the financial statements.
19
Financial Highlights selected per share data and ratios
| | Six months ended
April 30,
2021* | | Year Ended October 31, |
| Class I | 2020 | | 2019 | | 2018 | | 2017 | | 2016 |
| Net asset value at beginning of period | $ 43.72 | | $ 37.01 | | $ 37.28 | | $ 34.96 | | $ 29.62 | | $ 32.83 |
| Net investment income (loss) (a) | 0.03 | | 0.11 | | 0.19 | | 0.18 | | 0.20 | | (0.02) |
| Net realized and unrealized gain (loss) on investments | 10.82 | | 7.97 | | 2.95 | | 3.55 | | 7.54 | | (0.94) |
| Net realized and unrealized gain (loss) on foreign currency transactions | 0.00‡ | | — | | — | | — | | — | | — |
| Total from investment operations | 10.85 | | 8.08 | | 3.14 | | 3.73 | | 7.74 | | (0.96) |
| Less distributions: | | | | | | | | | | | |
| From net investment income | — | | (0.24) | | (0.16) | | (0.10) | | — | | — |
| From net realized gain on investments | (1.75) | | (1.13) | | (3.25) | | (1.31) | | (2.40) | | (2.25) |
| Total distributions | (1.75) | | (1.37) | | (3.41) | | (1.41) | | (2.40) | | (2.25) |
| Net asset value at end of period | $ 52.82 | | $ 43.72 | | $ 37.01 | | $ 37.28 | | $ 34.96 | | $ 29.62 |
| Total investment return (b) | 25.32% | | 22.53% | | 9.18% | | 11.03% | | 28.16% | | (3.17)% |
| Ratios (to average net assets)/Supplemental Data: | | | | | | | | | | | |
| Net investment income (loss) | 0.11%†† | | 0.33% | | 0.53% | | 0.49% | | 0.62% | | (0.07)% |
| Net expenses (c) | 0.77%†† | | 0.80% | | 0.81% | | 0.81% | | 0.83% | | 0.92% |
| Expenses (before waiver/reimbursement) (c) | 0.78%†† | | 0.80% | | 0.81% | | 0.81% | | 0.83% | | 0.98% |
| Portfolio turnover rate | 33% | | 150% | | 153% | | 116% | | 139% | | 137% |
| Net assets at end of period (in 000’s) | $ 12,424 | | $ 102,290 | | $ 139,588 | | $ 87,866 | | $ 87,115 | | $ 15,473 |
| * | Unaudited. |
| ‡ | Less than one cent per share. |
| †† | Annualized. |
| (a) | Per share data based on average shares outstanding during the period. |
| (b) | Total investment return is calculated exclusive of sales charges and assumes the reinvestment of dividends and distributions. Class I shares are not subject to sales charges. For periods of less than one year, total return is not annualized. |
| (c) | In addition to the fees and expenses which the Fund bears directly, it also indirectly bears a pro-rata share of the fees and expenses of the underlying funds in which it invests. Such indirect expenses are not included in the above expense ratios. |
The notes to the financial statements are an integral part of, and should be read in conjunction with, the financial statements.
| 20 | MainStay WMC Growth Fund |
Financial Highlights selected per share data and ratios
| | Six months ended
April 30,
2021* | | Year Ended October 31, |
| Class R2 | 2020 | | 2019 | | 2018 | | 2017 | | 2016 |
| Net asset value at beginning of period | $ 42.24 | | $ 35.81 | | $ 36.16 | | $ 33.97 | | $ 28.94 | | $ 32.22 |
| Net investment income (loss) (a) | (0.07) | | (0.04) | | 0.07 | | 0.05 | | 0.09 | | (0.06) |
| Net realized and unrealized gain (loss) on investments | 10.44 | | 7.72 | | 2.86 | | 3.45 | | 7.34 | | (0.97) |
| Total from investment operations | 10.37 | | 7.68 | | 2.93 | | 3.50 | | 7.43 | | (1.03) |
| Less distributions: | | | | | | | | | | | |
| From net investment income | — | | (0.12) | | (0.03) | | — | | — | | — |
| From net realized gain on investments | (1.75) | | (1.13) | | (3.25) | | (1.31) | | (2.40) | | (2.25) |
| Total distributions | (1.75) | | (1.25) | | (3.3) | | (1.31) | | (2.40) | | (2.25) |
| Net asset value at end of period | $ 50.86 | | $ 42.24 | | $ 35.81 | | $ 36.16 | | $ 33.97 | | $ 28.94 |
| Total investment return (b) | 25.06% | | 22.08% | | 8.81% | | 10.64% | | 27.72% | | (3.46)% |
| Ratios (to average net assets)/Supplemental Data: | | | | | | | | | | | |
| Net investment income (loss) | (0.31)%†† | | (0.11)% | | 0.21% | | 0.13% | | 0.31% | | (0.23)% |
| Net expenses (c) | 1.13%†† | | 1.14% | | 1.16% | | 1.16% | | 1.19% | | 1.24% |
| Portfolio turnover rate | 33% | | 150% | | 153% | | 116% | | 139% | | 137% |
| Net assets at end of period (in 000’s) | $ 129 | | $ 109 | | $ 59 | | $ 58 | | $ 52 | | $ 38 |
| * | Unaudited. |
| †† | Annualized. |
| (a) | Per share data based on average shares outstanding during the period. |
| (b) | Total investment return is calculated exclusive of sales charges and assumes the reinvestment of dividends and distributions. Class R2 shares are not subject to sales charges. For periods of less than one year, total return is not annualized. |
| (c) | In addition to the fees and expenses which the Fund bears directly, it also indirectly bears a pro-rata share of the fees and expenses of the underlying funds in which it invests. Such indirect expenses are not included in the above expense ratios. |
| | April 26, 2021^ through
April 30,
2021* |
| Class R6 |
| Net asset value at beginning of period | $ 53.43 |
| Net investment income (loss) (a) | 0.01 |
| Net realized and unrealized gain (loss) on investments | (0.64) |
| Total from investment operations | (0.63) |
| Net asset value at end of period | $ 52.80 |
| Total investment return (b) | (1.18)% |
| Ratios (to average net assets)/Supplemental Data: | |
| Net investment income (loss)†† | 0.05% |
| Net expenses†† (c) | 0.72% |
| Expenses (before waiver/reimbursement)†† (c) | 0.92% |
| Portfolio turnover rate | 33% |
| Net assets at end of period (in 000’s) | $ 79,039 |
| * | Unaudited. |
| ^ | Inception date. |
| †† | Annualized. |
| (a) | Per share data based on average shares outstanding during the period. |
| (b) | Total investment return is calculated exclusive of sales charges and assumes the reinvestment of dividends and distributions. Class R6 shares are not subject to sales charges. For periods of less than one year, total return is not annualized. |
| (c) | In addition to the fees and expenses which the Fund bears directly, it also indirectly bears a pro-rata share of the fees and expenses of the underlying funds in which it invests. Such indirect expenses are not included in the above expense ratios. |
The notes to the financial statements are an integral part of, and should be read in conjunction with, the financial statements.
21
Notes to Financial Statements (Unaudited)
Note 1-Organization and Business
MainStay Funds Trust (the “Trust”) was organized as a Delaware statutory trust on April 28, 2009. The Trust is registered under the Investment Company Act of 1940, as amended (the “1940 Act”), as an open-end management investment company, and is comprised of thirty-two funds (collectively referred to as the “Funds”). These financial statements and notes relate to the MainStay WMC Growth Fund (formerly known as MainStay MacKay Growth Fund) (the "Fund"), a “diversified” fund, as that term is defined in the 1940 Act, as interpreted or modified by regulatory authorities having jurisdiction, from time to time.
The following table lists the Fund's share classes that have been registered and commenced operations:
| Class | Commenced Operations |
| Class A | August 7, 2006 |
| Investor Class | January 18, 2013 |
| Class B | January 18, 2013 |
| Class C | January 18, 2013 |
| Class I | November 2, 2009 |
| Class R2 | January 18, 2013 |
| Class R6 | April 26, 2021 |
| SIMPLE Class | N/A* |
| * | SIMPLE Class shares were registered for sale effective as of August 31, 2020 but have not yet commenced operations. |
Class B shares of the MainStay Group of Funds are closed to all new purchases as well as additional investments by existing Class B shareholders. Existing Class B shareholders may continue to reinvest dividends and capital gains distributions, as well as exchange their Class B shares for Class B shares of other funds in the MainStay Group of Funds as permitted by the current exchange privileges. Class B shareholders continue to be subject to any applicable contingent deferred sales charge ("CDSC") at the time of redemption. All other features of the Class B shares, including but not limited to the fees and expenses applicable to Class B shares, remain unchanged. Unless redeemed, Class B shareholders will remain in Class B shares of their respective fund until the Class B shares are converted to Class A or Investor Class shares pursuant to the applicable conversion schedule.
Class A and Investor Class shares are offered at net asset value (“NAV”) per share plus an initial sales charge. No initial sales charge applies to investments of $1 million or more (and certain other qualified purchases) in Class A and Investor Class shares. However, a CDSC of 1.00% may be imposed on certain redemptions made within 18 months of the date of purchase on shares that were purchased without an initial sales charge Class C shares are offered at NAV without an initial sales charge, although a 1.00% CDSC may be imposed on certain redemptions of such shares made within one year of the date of purchase of Class C shares. When Class B shares were offered, they were offered at NAV without an initial sales charge, although a CDSC that declines depending on the number of years a shareholder held its Class B shares may be imposed on certain redemptions of such shares made within six years of the date
of purchase of such shares. Class I and Class R2 shares are offered at NAV without a sales charge. Class R6 and SIMPLE Class shares are currently expected to be offered at NAV without a sales charge. Depending upon eligibility, Class B shares convert to either Class A or Investor Class shares at the end of the calendar quarter eight years after the date they were purchased. In addition, depending upon eligibility, Class C shares convert to either Class A or Investor Class shares at the end of the calendar quarter ten years after the date they were purchased. Additionally, Investor Class shares may convert automatically to Class A shares. Under certain circumstances and as may be permitted by the Trust’s multiple class plan pursuant to Rule 18f-3 under the 1940 Act, specified share classes of the Fund may be converted to one or more other share classes of the Fund as disclosed in the capital share transactions within these Notes. The classes of shares have the same voting (except for issues that relate solely to one class), dividend, liquidation and other rights, and the same terms and conditions, except that under a distribution plan pursuant to Rule 12b-1 under the 1940 Act, Class B and Class C shares are subject to higher distribution and/or service fees than Class A, Investor Class, Class R2 and SIMPLE Class shares. Class I and Class R6 shares are not subject to a distribution and/or service fee. Class R2 shares are subject to a shareholder service fee. This is in addition to any fees paid under a distribution plan, where applicable.
The Fund's investment objective is to seek long-term growth of capital.
Note 2–Significant Accounting Policies
The Fund is an investment company and accordingly follows the investment company accounting and reporting guidance of the Financial Accounting Standards Board (“FASB”) Accounting Standard Codification Topic 946 Financial Services—Investment Companies. The Fund prepares its financial statements in accordance with generally accepted accounting principles (“GAAP”) in the United States of America and follows the significant accounting policies described below.
(A) Securities Valuation. Investments are usually valued as of the close of regular trading on the New York Stock Exchange (the "Exchange") (usually 4:00 p.m. Eastern time) on each day the Fund is open for business ("valuation date").
The Board of Trustees of the Trust (the "Board") adopted procedures establishing methodologies for the valuation of the Fund's securities and other assets and delegated the responsibility for valuation determinations under those procedures to the Valuation Committee of the Trust (the “Valuation Committee”). The procedures state that, subject to the oversight of the Board and unless otherwise noted, the responsibility for the day-to-day valuation of portfolio assets (including fair value measurements for the Fund's assets and liabilities) rests with New York Life Investment Management LLC (“New York Life Investments” or the "Manager"), aided to whatever extent necessary by the Subadvisor (as defined in Note 3(A)). To assess the appropriateness of security valuations, the Manager, the Subadvisor or the Fund's third-party service provider, who is subject to oversight by the Manager, regularly compares
| 22 | MainStay WMC Growth Fund |
prior day prices, prices on comparable securities and the sale prices to the prior and current day prices and challenges prices with changes exceeding certain tolerance levels with third-party pricing services or broker sources.
The Board authorized the Valuation Committee to appoint a Valuation Subcommittee (the “Subcommittee”) to establish the prices of securities for which market quotations are not readily available or the prices of which are not otherwise readily determinable under the procedures. The Subcommittee meets (in person, via electronic mail or via teleconference) on an as-needed basis. The Valuation Committee meets to ensure that actions taken by the Subcommittee were appropriate.
For those securities valued through either a standardized fair valuation methodology or a fair valuation measurement, the Subcommittee deals with such valuation and the Valuation Committee reviews and affirms, if appropriate, the reasonableness of the valuation based on such methodologies and measurements on a regular basis after considering information that is reasonably available and deemed relevant by the Valuation Committee. Any action taken by the Subcommittee with respect to the valuation of a portfolio security or other asset is submitted for review and ratification (if appropriate) to the Valuation Committee and the Board at the next regularly scheduled meeting.
"Fair value" is defined as the price the Fund would reasonably expect to receive upon selling an asset or liability in an orderly transaction to an independent buyer in the principal or most advantageous market for the asset or liability. Fair value measurements are determined within a framework that establishes a three-tier hierarchy that maximizes the use of observable market data and minimizes the use of unobservable inputs to establish a classification of fair value measurements for disclosure purposes. "Inputs" refer broadly to the assumptions that market participants would use in pricing the asset or liability, including assumptions about risk, such as the risk inherent in a particular valuation technique used to measure fair value using a pricing model and/or the risk inherent in the inputs for the valuation technique. Inputs may be observable or unobservable. Observable inputs reflect the assumptions market participants would use in pricing the asset or liability based on market data obtained from sources independent of the Fund. Unobservable inputs reflect the Fund’s own assumptions about the assumptions market participants would use in pricing the asset or liability based on the information available. The inputs or methodology used for valuing assets or liabilities may not be an indication of the risks associated with investing in those assets or liabilities. The three-tier hierarchy of inputs is summarized below.
| • | Level 1—quoted prices in active markets for an identical asset or liability |
| • | Level 2—other significant observable inputs (including quoted prices for a similar asset or liability in active markets, interest rates and yield curves, prepayment speeds, credit risk, etc.) |
| • | Level 3—significant unobservable inputs (including the Fund's own assumptions about the assumptions that market participants would use in measuring fair value of an asset or liability) |
The level of an asset or liability within the fair value hierarchy is based on the lowest level of an input, both individually and in the aggregate, that is significant to the fair value measurement. The aggregate value by input level of the Fund’s assets and liabilities as of April 30, 2021, is included at the end of the Portfolio of Investments.
The Fund may use third-party vendor evaluations, whose prices may be derived from one or more of the following standard inputs, among others:
| • Broker/dealer quotes | • Benchmark securities |
| • Two-sided markets | • Reference data (corporate actions or material event notices) |
| • Bids/offers | • Monthly payment information |
| • Industry and economic events | • Reported trades |
An asset or liability for which market values cannot be measured using the methodologies described above is valued by methods deemed reasonable in good faith by the Valuation Committee, following the procedures established by the Board, to represent fair value. Under these procedures, the Fund generally uses a market-based approach which may use related or comparable assets or liabilities, recent transactions, market multiples, book values and other relevant information. The Fund may also use an income-based valuation approach in which the anticipated future cash flows of the asset or liability are discounted to calculate fair value. Discounts may also be applied due to the nature and/or duration of any restrictions on the disposition of the asset or liability. Fair value represents a good faith approximation of the value of a security. Fair value determinations involve the consideration of a number of subjective factors, an analysis of applicable facts and circumstances and the exercise of judgment. As a result, it is possible that the fair value for a security determined in good faith in accordance with the Fund's valuation procedures may differ from valuations for the same security determined by other funds using their own valuation procedures. Although the Fund's valuation procedures are designed to value a security at the price the Fund may reasonably expect to receive upon the security's sale in an orderly transaction, there can be no assurance that any fair value determination thereunder would, in fact, approximate the amount that the Fund would actually realize upon the sale of the security or the price at which the security would trade if a reliable market price were readily available. During the six-month period ended April 30, 2021, there were no material changes to the fair value methodologies.
Securities which may be valued in this manner include, but are not limited to: (i) a security for which trading has been halted or suspended; (ii) a debt security that has recently gone into default and for which there is not a current market quotation; (iii) a security of an issuer that has entered into a restructuring; (iv) a security that has been delisted from a national exchange; (v) a security for which the market price is not readily available from a third-party pricing source or, if so provided, does not, in the opinion of the Manager or the Subadvisor, reflect the security's market
Notes to Financial Statements (Unaudited) (continued)
value; (vi) a security subject to trading collars for which no or limited trading takes place; and (vii) a security whose principal market has been temporarily closed at a time when, under normal conditions, it would be open. Securities valued in this manner are generally categorized as Level 3 in the hierarchy. No securities held by the Fund as of April 30, 2021 were fair valued in such a manner.
Certain securities held by the Fund may principally trade in foreign markets. Events may occur between the time the foreign markets close and the time at which the Fund's NAVs are calculated. These events may include, but are not limited to, situations relating to a single issuer in a market sector, significant fluctuations in U.S. or foreign markets, natural disasters, armed conflicts, governmental actions or other developments not tied directly to the securities markets. Should the Manager or the Subadvisor conclude that such events may have affected the accuracy of the last price of such securities reported on the local foreign market, the Subcommittee may, pursuant to procedures adopted by the Board, adjust the value of the local price to reflect the estimated impact on the price of such securities as a result of such events. In this instance, securities are generally categorized as Level 3 in the hierarchy. Additionally, certain foreign equity securities are also fair valued whenever the movement of a particular index exceeds certain thresholds. In such cases, the securities are fair valued by applying factors provided by a third-party vendor in accordance with valuation procedures adopted by the Board and are generally categorized as Level 2 in the hierarchy. No foreign equity securities held by the Fund as of April 30, 2021 were fair valued in such a manner.
Equity securities are valued at the last quoted sales prices as of the close of regular trading on the relevant exchange on each valuation date. Securities that are not traded on the valuation date are valued at the mean of the last quoted bid and ask prices. Prices are normally taken from the principal market in which each security trades. These securities are generally categorized as Level 1 in the hierarchy.
Investments in mutual funds, including money market funds, are valued at their respective NAVs at the close of business each day on the valuation date. These securities are generally categorized as Level 1 in the hierarchy.
Temporary cash investments acquired in excess of 60 days to maturity at the time of purchase are valued using the latest bid prices or using valuations based on a matrix system (which considers such factors as security prices, yields, maturities and ratings), both as furnished by independent pricing services. Temporary cash investments that mature in 60 days or less at the time of purchase ("Short-Term Investments") are valued using the amortized cost method of valuation, unless the use of such method would be inappropriate. The amortized cost method involves valuing a security at its cost on the date of purchase and thereafter assuming a constant amortization to maturity of the difference between such cost and the value on maturity date. Amortized cost approximates the current fair value of a security. Securities valued using the amortized cost method are not valued using quoted prices in an active market and are generally categorized as Level 2 in the hierarchy.
The information above is not intended to reflect an exhaustive list of the methodologies that may be used to value portfolio investments. The valuation procedures permit the use of a variety of valuation methodologies in connection with valuing portfolio investments. The methodology used for a specific type of investment may vary based on the market data available or other considerations. The methodologies summarized above may not represent the specific means by which portfolio investments are valued on any particular business day.
(B) Income Taxes. The Fund's policy is to comply with the requirements of the Internal Revenue Code of 1986, as amended (the “Internal Revenue Code”), applicable to regulated investment companies and to distribute all of its taxable income to the shareholders of the Fund within the allowable time limits.
The Manager evaluates the Fund’s tax positions to determine if the tax positions taken meet the minimum recognition threshold in connection with accounting for uncertainties in income tax positions taken or expected to be taken for the purposes of measuring and recognizing tax liabilities in the financial statements. Recognition of tax benefits of an uncertain tax position is permitted only to the extent the position is “more likely than not” to be sustained assuming examination by taxing authorities. The Manager analyzed the Fund's tax positions taken on federal, state and local income tax returns for all open tax years (for up to three tax years) and has concluded that no provisions for federal, state and local income tax are required in the Fund's financial statements. The Fund's federal, state and local income tax and federal excise tax returns for tax years for which the applicable statutes of limitations have not expired are subject to examination by the Internal Revenue Service and state and local departments of revenue.
(C) Foreign Taxes. The Fund may be subject to foreign taxes on income and other transaction-based taxes imposed by certain countries in which it invests. A portion of the taxes on gains on investments or currency purchases/repatriation may be reclaimable. The Fund will accrue such taxes and reclaims as applicable, based upon its current interpretation of tax rules and regulations that exist in the markets in which it invests.
The Fund may be subject to taxation on realized capital gains, repatriation proceeds and other transaction-based taxes imposed by certain countries in which it invests. The Fund will accrue such taxes as applicable based upon its current interpretation of tax rules and regulations that exist in the market in which it invests. Capital gains taxes relating to positions still held are reflected as a liability in the Statement of Assets and Liabilities, as well as an adjustment to the Fund's net unrealized appreciation (depreciation). Taxes related to capital gains realized, if any, are reflected as part of net realized gain (loss) in the Statement of Operations. Changes in tax liabilities related to capital gains taxes on unrealized investment gains, if any, are reflected as part of the change in net unrealized appreciation (depreciation) on investments in the Statement of Operations. Transaction-based charges are generally assessed as a percentage of the transaction amount.
| 24 | MainStay WMC Growth Fund |
(D) Dividends and Distributions to Shareholders. Dividends and distributions are recorded on the ex-dividend date. The Fund intends to declare and pay dividends from net investment income and distributions from net realized capital and currency gains, if any, at least annually. Unless a shareholder elects otherwise, all dividends and distributions are reinvested at NAV in the same class of shares of the Fund. Dividends and distributions to shareholders are determined in accordance with federal income tax regulations and may differ from determinations using GAAP.
(E) Security Transactions and Investment Income. The Fund records security transactions on the trade date. Realized gains and losses on security transactions are determined using the identified cost method. Dividend income is recognized on the ex-dividend date, net of any foreign tax withheld at the source, and interest income is accrued as earned using the effective interest rate method. Distributions received from real estate investment trusts may be classified as dividends, capital gains and/or return of capital.
Investment income and realized and unrealized gains and losses on investments of the Fund are allocated pro rata to the separate classes of shares based upon their relative net assets on the date the income is earned or realized and unrealized gains and losses are incurred.
(F) Expenses. Expenses of the Trust are allocated to the individual Funds in proportion to the net assets of the respective Funds when the expenses are incurred, except where direct allocations of expenses can be made. Expenses (other than transfer agent expenses and fees incurred under the shareholder services plans and/or the distribution plans further discussed in Note 3(B)) are allocated to separate classes of shares pro rata based upon their relative net assets on the date the expenses are incurred. The expenses borne by the Fund, including those of related parties to the Fund, are shown in the Statement of Operations.
Additionally, the Fund may invest in mutual funds, which are subject to management fees and other fees that may cause the costs of investing in mutual funds to be greater than the costs of owning the underlying securities directly. These indirect expenses of mutual funds are not included in the amounts shown as expenses in the Statement of Operations or in the expense ratios included in the Financial Highlights.
(G) Use of Estimates. In preparing financial statements in conformity with GAAP, the Manager makes estimates and assumptions that affect the reported amounts and disclosures in the financial statements. Actual results could differ from those estimates and assumptions.
(H) Securities Lending. In order to realize additional income, the Fund may engage in securities lending, subject to the limitations set forth in the 1940 Act and relevant guidance by the staff of the Securities and Exchange Commission (“SEC”). If the Fund engages in securities lending, the Fund will lend through its custodian, JPMorgan Chase Bank, N.A., ("JPMorgan"), acting as securities lending agent on behalf of the Fund. Under the current arrangement, JPMorgan will manage the Fund's collateral in accordance with the securities lending agency agreement between the Fund and JPMorgan, and indemnify the Fund against counterparty risk. The loans will be collateralized by cash (which may be
invested in a money market fund) and/or non-cash collateral (which may include U.S. Treasury securities and/or U.S. government agency securities issued or guaranteed by the United States government or its agencies or instrumentalities) at least equal at all times to the market value of the securities loaned. The Fund bears the risk of delay in recovery of, or loss of rights in, the securities loaned. The Fund may also record a realized gain or loss on securities deemed sold due to a borrower’s inability to return securities on loan. The Fund bears the risk of any loss on investment of cash collateral. The Fund will receive compensation for lending its securities in the form of fees or it will retain a portion of interest earned on the investment of any cash collateral. The Fund will also continue to receive interest and dividends on the securities loaned and any gain or loss in the market price of the securities loaned that may occur during the term of the loan will be for the account of the Fund. Income earned from securities lending activities, if any, is reflected in the Statement of Operations. Securities on loan as of April 30, 2021, are shown in the Portfolio of Investments.
Prior to November 23, 2020, these services were provided by State Street Bank and Trust Company (“State Street”).
(I) Indemnifications. Under the Trust’s organizational documents, its officers and trustees are indemnified against certain liabilities that may arise out of performance of their duties to the Trust. Additionally, in the normal course of business, the Fund enters into contracts with third-party service providers that contain a variety of representations and warranties and that may provide general indemnifications. The Fund's maximum exposure under these arrangements is unknown, as this would involve future claims that may be made against the Fund that have not yet occurred. The Manager believes that the risk of loss in connection with these potential indemnification obligations is remote. However, there can be no assurance that material liabilities related to such obligations will not arise in the future, which could adversely impact the Fund.
Note 3–Fees and Related Party Transactions
(A) Manager and Subadvisor. New York Life Investments, a registered investment adviser and an indirect, wholly-owned subsidiary of New York Life Insurance Company ("New York Life"), serves as the Fund's Manager, pursuant to an Amended and Restated Management Agreement ("Management Agreement"). The Manager provides offices, conducts clerical, recordkeeping and bookkeeping services and keeps most of the financial and accounting records required to be maintained by the Fund. Except for the portion of salaries and expenses that are the responsibility of the Fund, the Manager pays the salaries and expenses of all personnel affiliated with the Fund and certain operational expenses of the Fund. The Fund reimburses New York Life Investments in an amount equal to the portion of the compensation of the Chief Compliance Officer attributable to the Fund. The Fund’s subadvisor changed effective March 5, 2021 due to the replacement of MacKay Shields LLC ("MacKay") as the Fund’s subadvisor and the appointment of Wellington Management Company LLP (“Wellington” or the “Subadvisor”) as the Fund’s subadvisor. Wellington, a registered investment adviser, is responsible for
Notes to Financial Statements (Unaudited) (continued)
the day-to-day portfolio management of the Fund. Pursuant to the terms of a Subadvisory Agreement ("Subadvisory Agreement") between New York Life Investments and Wellington, New York Life Investments pays for the services of the Subadvisor.
Pursuant to the Management Agreement, the Fund pays the Manager a monthly fee for the services performed and the facilities furnished at an annual rate of the Fund’s average daily net assets as follows: 0.70% up to $500 million; 0.65% from $500 million to $1 billion; 0.625% from $1 billion to $2 billion; and 0.60% in excess of $2 billion. During the six-month period ended April 30, 2021, the effective management fee rate was 0.68% of the Fund’s average daily net assets, exclusive of any applicable waivers/reimbursements.
Effective March 5, 2021, New York Life Investments has contractually agreed to waive fees and/or reimburse expenses so that Total Annual Fund Operating Expenses (excluding taxes, interest, litigation, extraordinary expenses, brokerage and other transaction expenses relating to the purchase or sale of portfolio investments, and acquired (underlying) fund fees and expenses) for Class I shares do not exceed 0.75% of its average daily net assets. In addition, New York Life Investments will waive fees and/or reimburse expenses so that Total Annual Fund Operating Expenses (excluding taxes, interest, litigation, extraordinary expenses, brokerage and other transaction expenses relating to the purchase or sale of portfolio investments, and acquired (underlying) fund fees and expenses) for Class R6 do not exceed those of Class I. This agreement will remain in effect until February 28, 2023, and shall renew automatically for one-year terms unless New York Life Investments provides written notice of termination prior to the start of the next term or upon approval of the Board.
Additionally, New York Life Investments has agreed to further voluntarily waive fees and/or reimburse expenses of the appropriate class of the Fund so that Total Annual Fund Operating Expenses (excluding taxes, interest, litigation, extraordinary expenses, brokerage and other transaction expenses relating to the purchase and sale of portfolio investments, and acquired (underlying) fund fees and expenses) of Class I shares do not exceed 0.92%. This voluntary waiver or reimbursement may be discontinued at any time without notice.
Prior to March 5, 2021, New York Life Investments had contractually agreed to waive fees and/or reimburse expenses so that Total Annual Fund Operating Expenses (excluding taxes, interest, litigation, extraordinary expenses, brokerage and other transaction expenses relating to the purchase or sale of portfolio investments, and acquired (underlying) fund fees and expenses) for Class I shares would not exceed 1.09% of its average daily net assets. In addition, New York Life Investments would waive fees and/or reimburse expenses so that Total Annual Fund Operating Expenses (excluding taxes, interest, litigation, extraordinary expenses, brokerage and other transaction expenses relating to the purchase or sale of portfolio investments, and acquired (underlying) fund fees and expenses) for Class R6 shares would not exceed those of Class I shares.
During the six-month period ended April 30, 2021, New York Life Investments earned fees from the Fund in the amount of $2,795,570 and waived fees and/or reimbursed expenses, including the voluntary waiver/reimbursement of certain class specific expenses in the amount of $56,373 and paid Wellington and MacKay $366,959 and $941,984, respectively.
JPMorgan provides sub-administration and sub-accounting services to the Fund pursuant to an agreement with New York Life Investments. These services include calculating the daily NAVs of the Fund, maintaining the general ledger and sub-ledger accounts for the calculation of the Fund's NAVs, and assisting New York Life Investments in conducting various aspects of the Fund's administrative operations. For providing these services to the Fund, JPMorgan is compensated by New York Life Investments.
Prior to November 23, 2020, these services were provided by State Street.
Pursuant to an agreement between the Trust and New York Life Investments, New York Life Investments is responsible for providing or procuring certain regulatory reporting services for the Fund. The Fund will reimburse New York Life Investments for the actual costs incurred by New York Life Investments in connection with providing or procuring these services for the Fund.
(B) Distribution and Service Fees. The Trust, on behalf of the Fund, has entered into a distribution agreement with NYLIFE Distributors LLC (the “Distributor”), an affiliate of New York Life Investments. The Fund has adopted distribution plans (the “Plans”) in accordance with the provisions of Rule 12b-1 under the 1940 Act.
Pursuant to the Class A, Investor Class and Class R2 Plans, the Distributor receives a monthly distribution fee from the Class A, Investor Class and Class R2 shares at an annual rate of 0.25% of the average daily net assets of the Class A, Investor Class and Class R2 shares for distribution and/or service activities as designated by the Distributor. Pursuant to the Class B and Class C Plans, Class B and Class C shares pay the Distributor a monthly distribution fee at an annual rate of 0.75%of the average daily net assets of the Class B and Class C shares, along with a service fee at an annual rate of 0.25% of the average daily net assets of the Class B and Class C shares, for a total 12b-1 fee of 1.00%. Class I shares are not subject to a distribution and/or service fee.
The Plans provide that the distribution and service fees are payable to the Distributor regardless of the amounts actually expended by the Distributor for distribution of the Fund's shares and service activities.
In accordance with the Shareholder Services Plans for the Class R2 shares, the Manager has agreed to provide, through its affiliates or independent third parties, various shareholder and administrative support services to shareholders of the Class R2 shares. For its services, the Manager, its affiliates or independent third-party service providers are entitled to a shareholder service fee accrued daily and paid monthly at an
| 26 | MainStay WMC Growth Fund |
annual rate of 0.10% of the average daily net assets of the Class R2 shares. This is in addition to any fees paid under the Class R2 Plan.
During the six-month period ended April 30, 2021, shareholder service fees incurred by the Fund were as follows:
(C) Sales Charges. The Fund was advised by the Distributor that the amount of initial sales charges retained on sales of Class A and Investor Class shares during the six-month period ended April 30, 2021, were $17,463 and $6,026, respectively.
The Fund was also advised that the Distributor retained CDSCs on redemptions of Class A, Class B and Class C shares during the six-month period ended April 30, 2021, of $602, $1,174 and $122, respectively.
(D) Transfer, Dividend Disbursing and Shareholder Servicing Agent. NYLIM Service Company LLC, an affiliate of New York Life Investments, is the Fund's transfer, dividend disbursing and shareholder servicing agent pursuant to an agreement between NYLIM Service Company LLC and the Trust. NYLIM Service Company LLC has entered into an agreement with DST Asset Manager Solutions, Inc. ("DST"), pursuant to which DST performs certain transfer agent services on behalf of NYLIM Service Company LLC. New York Life Investments has contractually agreed to limit the transfer agency expenses charged to the Fund’s share classes to a maximum of 0.35% of that share class’s average daily net assets on an annual basis after deducting any applicable Fund or class-level expense reimbursement or small account
fees. This agreement will remain in effect until February 28, 2022, and shall renew automatically for one-year terms unless New York Life Investments provides written notice of termination prior to the start of the next term or upon approval of the Board. During the six-month period ended April 30, 2021, transfer agent expenses incurred by the Fund and any reimbursements, pursuant to the aforementioned Transfer Agency expense limitation agreement, were as follows:
| Class | Expense | Waived |
| Class A | $164,490 | $ — |
| Investor Class | 205,632 | (24,539) |
| Class B | 34,679 | (4,141) |
| Class C | 6,558 | (784) |
| Class I | 22,520 | — |
| Class R2 | 33 | — |
| Class R6 | 35 | — |
(E) Small Account Fee. Shareholders with small accounts adversely impact the cost of providing transfer agency services. In an effort to reduce total transfer agency expenses, the Fund has implemented a small account fee on certain types of accounts. As described in the Fund's prospectus, certain shareholders with an account balance of less than $1,000 ($5,000 for Class A share accounts) are charged an annual per account fee of $20 (assessed semi-annually), the proceeds from which offset transfer agent fees as reflected in the Statement of Operations. This small account fee will not apply to certain types of accounts as described further in the Fund’s prospectus.
(F) Investments in Affiliates (in 000’s). During the six-month period ended April 30, 2021, purchases and sales transactions, income earned from investments and shares held of investment companies managed by New York Life Investments or its affiliates were as follows:
| Affiliated Investment Companies | Value,
Beginning
of Period | Purchases
at Cost | Proceeds
from
Sales | Net
Realized
Gain/(Loss)
on Sales | Change in
Unrealized
Appreciation/
(Depreciation) | Value,
End of
Period | Dividend
Income | Other
Distributions | Shares
End of
Period |
| MainStay U.S. Government Liquidity Fund | $ 16 | $ 55,379 | $ (50,786) | $ — | $ — | $ 4,609 | $ —(a) | $ — | 4,609 |
(G) Capital. As of April 30, 2021, New York Life and its affiliates beneficially held shares of the Fund with the values and percentages of net assets as follows:
| Class R2 | $75,627 | 58.8% |
| Class R6 | 24,705 | 0.0‡ |
| ‡ | Less than one-tenth of a percent. |
Note 4-Federal Income Tax
As of April 30, 2021, the cost and unrealized appreciation (depreciation) of the Fund’s investment portfolio, including applicable derivative contracts and other financial instruments, as determined on a federal income tax basis, were as follows:
| | Federal Tax
Cost | Gross
Unrealized
Appreciation | Gross
Unrealized
(Depreciation) | Net
Unrealized
Appreciation/
(Depreciation) |
| Investments | $602,818,002 | $292,772,949 | $(9,253,343) | $283,519,606 |
Notes to Financial Statements (Unaudited) (continued)
During the year ended October 31, 2020, the tax character of distributions paid as reflected in the Statements of Changes in Net Assets was as follows:
| | 2020 |
| Distributions paid from: | |
| Ordinary Income | $ 1,475,413 |
| Long-Term Capital Gains | 23,427,217 |
| Total | $24,902,630 |
Note 5–Custodian
JPMorgan is the custodian of cash and securities held by the Fund. Custodial fees are charged to the Fund based on the Fund's net assets and/or the market value of securities held by the Fund and the number of certain transactions incurred by the Fund.
Prior to November 23, 2020, these services were provided by State Street. The services provided by State Street were a direct expense of the Fund and are included in the Statement of Operations as Custodian fees which totaled $1,521 for the period November 1, 2020 through November 22, 2020.
Note 6–Line of Credit
The Fund and certain other funds managed by New York Life Investments maintain a line of credit with a syndicate of banks in order to secure a source of funds for temporary purposes to meet unanticipated or excessive redemption requests.
Effective July 28, 2020, under the credit agreement (the “Credit Agreement”), the aggregate commitment amount is $600,000,000 with an additional uncommitted amount of $100,000,000. The commitment fee is an annual rate of 0.15% of the average commitment amount payable quarterly, regardless of usage, to JPMorgan, who serves as the agent to the syndicate. The commitment fee is allocated among the Fund and certain other funds managed by New York Life Investments based upon their respective net assets and other factors. Interest on any revolving credit loan is charged based upon the Federal Funds Rate or the one-month London Interbank Offered Rate (“LIBOR”), whichever is higher. The Credit Agreement expires on July 27, 2021, although the Fund, certain other funds managed by New York Life Investments and the syndicate of banks may renew the Credit Agreement for an additional year on the same or different terms or enter into a credit agreement with a different syndicate of banks. Prior to July 28, 2020, the aggregate commitment amount and the commitment fee were the same as those under the current Credit Agreement, but State Street served as agent to the syndicate. During the six-month period ended April 30, 2021, there were no borrowings made or outstanding with respect to the Fund under the Credit Agreement or the credit agreement for which State Street served as agent.
Note 7–Interfund Lending Program
Pursuant to an exemptive order issued by the SEC, the Fund, along with certain other funds managed by New York Life Investments, may participate in an interfund lending program. The interfund lending program provides an alternative credit facility that permits the Fund and certain other funds managed by New York Life Investments to lend or borrow money for temporary purposes directly to or from one another, subject to the conditions of the exemptive order. During the six-month period ended April 30, 2021, there were no interfund loans made or outstanding with respect to the Fund.
Note 8–Purchases and Sales of Securities (in 000’s)
During the six-month period ended April 30, 2021, purchases and sales of securities, other than short-term securities, were $267,613 and $319,433, respectively.
Note 9–Capital Share Transactions
Transactions in capital shares for the six-month period ended April 30, 2021 and the year ended October 31, 2020, were as follows:
| Class A | Shares | Amount |
| Period ended April 30, 2021: | | |
| Shares sold | 204,499 | $ 9,852,458 |
| Shares issued to shareholders in reinvestment of distributions | 472,039 | 21,548,559 |
| Shares redeemed | (597,534) | (28,648,969) |
| Net increase (decrease) in shares outstanding before conversion | 79,004 | 2,752,048 |
| Shares converted into Class A (See Note 1) | 337,469 | 15,893,483 |
| Shares converted from Class A (See Note 1) | (2,748) | (128,931) |
| Net increase (decrease) | 413,725 | $ 18,516,600 |
| Year ended October 31, 2020: | | |
| Shares sold | 473,414 | $ 18,528,543 |
| Shares issued to shareholders in reinvestment of distributions | 425,258 | 15,262,561 |
| Shares redeemed | (1,298,637) | (49,809,704) |
| Net increase (decrease) in shares outstanding before conversion | (399,965) | (16,018,600) |
| Shares converted into Class A (See Note 1) | 826,899 | 33,047,928 |
| Shares converted from Class A (See Note 1) | (35,553) | (1,252,348) |
| Net increase (decrease) | 391,381 | $ 15,776,980 |
| |
| 28 | MainStay WMC Growth Fund |
| Investor Class | Shares | Amount |
| Period ended April 30, 2021: | | |
| Shares sold | 28,553 | $ 1,366,839 |
| Shares issued to shareholders in reinvestment of distributions | 90,206 | 4,049,334 |
| Shares redeemed | (87,863) | (4,144,784) |
| Net increase (decrease) in shares outstanding before conversion | 30,896 | 1,271,389 |
| Shares converted into Investor Class (See Note 1) | 11,072 | 514,364 |
| Shares converted from Investor Class (See Note 1) | (304,450) | (14,112,498) |
| Net increase (decrease) | (262,482) | $ (12,326,745) |
| Year ended October 31, 2020: | | |
| Shares sold | 63,065 | $ 2,351,254 |
| Shares issued to shareholders in reinvestment of distributions | 103,520 | 3,666,605 |
| Shares redeemed | (215,785) | (8,192,794) |
| Net increase (decrease) in shares outstanding before conversion | (49,200) | (2,174,935) |
| Shares converted into Investor Class (See Note 1) | 29,114 | 1,058,148 |
| Shares converted from Investor Class (See Note 1) | (765,119) | (30,325,947) |
| Net increase (decrease) | (785,205) | $ (31,442,734) |
| |
| Class B | Shares | Amount |
| Period ended April 30, 2021: | | |
| Shares sold | 1,391 | $ 61,039 |
| Shares issued to shareholders in reinvestment of distributions | 17,550 | 730,277 |
| Shares redeemed | (23,341) | (1,024,239) |
| Net increase (decrease) in shares outstanding before conversion | (4,400) | (232,923) |
| Shares converted from Class B (See Note 1) | (49,351) | (2,095,779) |
| Net increase (decrease) | (53,751) | $ (2,328,702) |
| Year ended October 31, 2020: | | |
| Shares sold | 3,567 | $ 117,449 |
| Shares issued to shareholders in reinvestment of distributions | 18,907 | 627,151 |
| Shares redeemed | (63,215) | (2,234,960) |
| Net increase (decrease) in shares outstanding before conversion | (40,741) | (1,490,360) |
| Shares converted from Class B (See Note 1) | (101,662) | (3,490,030) |
| Net increase (decrease) | (142,403) | $ (4,980,390) |
| |
| Class C | Shares | Amount |
| Period ended April 30, 2021: | | |
| Shares sold | 2,816 | $ 121,657 |
| Shares issued to shareholders in reinvestment of distributions | 3,278 | 136,353 |
| Shares redeemed | (14,857) | (653,784) |
| Net increase (decrease) in shares outstanding before conversion | (8,763) | (395,774) |
| Shares converted from Class C (See Note 1) | (4,196) | (181,708) |
| Net increase (decrease) | (12,959) | $ (577,482) |
| Year ended October 31, 2020: | | |
| Shares sold | 10,964 | $ 381,883 |
| Shares issued to shareholders in reinvestment of distributions | 3,102 | 102,837 |
| Shares redeemed | (28,616) | (1,034,924) |
| Net increase (decrease) in shares outstanding before conversion | (14,550) | (550,204) |
| Shares converted from Class C (See Note 1) | (1,089) | (37,131) |
| Net increase (decrease) | (15,639) | $ (587,335) |
| |
| Class I | Shares | Amount |
| Period ended April 30, 2021: | | |
| Shares sold | 276,373 | $ 13,940,823 |
| Shares issued to shareholders in reinvestment of distributions | 74,526 | 3,498,989 |
| Shares redeemed | (961,489) | (46,276,395) |
| Net increase (decrease) in shares outstanding before conversion | (610,590) | (28,836,583) |
| Shares converted into Class I (See Note 1) | 2,314 | 111,069 |
| Shares converted from Class I (See Note 1) | (1,496,360) | (79,950,534) |
| Net increase (decrease) | (2,104,636) | $(108,676,048) |
| Year ended October 31, 2020: | | |
| Shares sold | 452,184 | $ 15,077,191 |
| Shares issued to shareholders in reinvestment of distributions | 138,219 | 5,083,713 |
| Shares redeemed | (2,049,697) | (82,944,646) |
| Net increase (decrease) in shares outstanding before conversion | (1,459,294) | (62,783,742) |
| Shares converted into Class I (See Note 1) | 27,838 | 999,380 |
| Net increase (decrease) | (1,431,456) | $ (61,784,362) |
| |
Notes to Financial Statements (Unaudited) (continued)
| Class R2 | Shares | Amount |
| Period ended April 30, 2021: | | |
| Shares sold | 63 | $ 2,978 |
| Shares issued to shareholders in reinvestment of distributions | 100 | 4,524 |
| Shares redeemed | (207) | (10,060) |
| Net increase (decrease) | (44) | $ (2,558) |
| Year ended October 31, 2020: | | |
| Shares sold | 994 | $ 41,798 |
| Shares issued to shareholders in reinvestment of distributions | 57 | 2,047 |
| Shares redeemed | (135) | (5,170) |
| Net increase (decrease) | 916 | $ 38,675 |
| |
| Class R6 | Shares | Amount |
| Period ended April 30, 2021: (a) | | |
| Shares sold | 468 | $ 25,000 |
| Net increase (decrease) in shares outstanding before conversion | 468 | 25,000 |
| Shares converted into Class R6 (See Note 1) | 1,496,360 | 79,950,534 |
| Net increase (decrease) | 1,496,828 | $ 79,975,534 |
| (a) | The inception of the class was April 26, 2021. |
Note 10–Recent Accounting Pronouncement
In March 2020, the Financial Accounting Standards Board issued Accounting Standards Update 2020-04 (“ASU 2020-04”), which provides optional guidance to ease the potential accounting burden associated with transitioning away from LIBOR and other reference rates that are expected to be discontinued. ASU 2020-04 was effective immediately upon release of the update on March 12, 2020 and remains effective through December 31, 2022. At this time, the Manager is evaluating the implications of certain other provisions of ASU 2020-04 related to new disclosure requirements and any impact on the financial statement disclosures has not yet been determined.
Note 11–Other Matters
An outbreak of COVID-19, first detected in December 2019, has developed into a global pandemic and has resulted in travel restrictions, closure of international borders, certain businesses and securities markets, restrictions on securities trading activities, prolonged quarantines, supply chain disruptions, and lower consumer demand, as well as general concern and uncertainty. The continued impact of COVID-19 is uncertain and could further adversely affect the global economy, national economies, individual issuers and capital markets in unforeseeable ways and result in a substantial and extended economic downturn. Developments that disrupt global economies and financial markets, such as COVID-19, may magnify factors that affect the Fund's performance.
Note 12–Subsequent Events
In connection with the preparation of the financial statements of the Fund as of and for the six-month period ended April 30, 2021, events and transactions subsequent to April 30, 2021, through the date the financial statements were issued have been evaluated by the Manager for possible adjustment and/or disclosure. No subsequent events requiring financial statement adjustment or disclosure have been identified.
| 30 | MainStay WMC Growth Fund |
Board Consideration and Approval of Management Agreement and Subadvisory Agreement (Unaudited)
The continuation of the Management Agreement with respect to the MainStay WMC Growth Fund (formerly known as the MainStay MacKay Growth Fund) (“Fund”) and New York Life Investment Management LLC (“New York Life Investments”) and the Subadvisory Agreement between New York Life Investments and MacKay Shields LLC (“MacKay”) with respect to the Fund (together, “Advisory Agreements”), following an initial term of up to two years, is subject to annual review and approval by the Board of Trustees of MainStay Funds Trust (“Board” of the “Trust”) in accordance with Section 15 of the Investment Company Act of 1940, as amended (“1940 Act”). At its December 9–10, 2020 meeting, the Board, including the Trustees who are not an “interested person” (as such term is defined in the 1940 Act) of the Trust (“Independent Trustees”) voting separately, unanimously approved the continuation of each of the Advisory Agreements for a one-year period.
In reaching the decision to approve the continuation of each of the Advisory Agreements, the Board considered information furnished by New York Life Investments and MacKay in connection with an annual contract review process undertaken by the Board that took place at meetings of the Board and its Contracts Committee during September 2020 through December 2020, as well as other information furnished to the Board and its Committees throughout the year, as deemed relevant by the Trustees. Information requested by and furnished to the Board for consideration in connection with the contract review process included, among other items, reports on the Fund and “peer funds” prepared by Strategic Insight Mutual Fund Research and Consulting, LLC (“Strategic Insight”), an independent third-party service provider engaged by the Board to report objectively on the Fund’s investment performance, management fee and total expenses. The Board also considered information on the fees charged to other investment advisory clients of New York Life Investments and/or MacKay that follow investment strategies similar to those of the Fund, if any, and, when applicable, the rationale for any differences in the Fund’s management and subadvisory fees and the fees charged to those other investment advisory clients. In addition, the Board considered information furnished by New York Life Investments and MacKay in response to requests prepared on behalf of the Board, and in consultation with the Independent Trustees, by independent legal counsel to the Independent Trustees, which encompassed a variety of topics, including those summarized below.
The Board took into account information provided in connection with its meetings throughout the year, including, among other items, information regarding the legal standards and fiduciary obligations applicable to its consideration of the continuation of each of the Advisory Agreements and investment performance reports on the Fund as well as presentations from New York Life Investments and MacKay personnel. The Board also took into account other information received from New York Life Investments throughout the year, including, among other items, periodic reports on legal and compliance matters, risk management, portfolio turnover, brokerage commissions and non-advisory services provided to the Fund by New York Life Investments. The contract review process, including the structure and format for materials provided to the Board, has been developed in consultation with the Board. The Independent
Trustees also met in executive sessions with their independent legal counsel and, for a portion thereof, with senior management of New York Life Investments.
In addition to information provided to the Board throughout the year, the Board received information in connection with its June 2020 meeting provided specifically in response to requests prepared on behalf of the Board, and in consultation with the Independent Trustees, by independent legal counsel regarding the Fund’s distribution arrangements. In addition, the Board received information regarding the Fund’s asset levels, share purchase and redemption activity and the payment of Rule 12b-1 and/or other fees by applicable share classes of the Fund, among other information.
In considering the continuation of each of the Advisory Agreements, the Trustees reviewed and evaluated the information and factors they believed to reasonably be necessary and appropriate in light of legal advice furnished to them by independent legal counsel and through the exercise of their own business judgment. Although individual Trustees may have weighed certain factors or information differently, the factors considered by the Board are described in greater detail below and include, among other factors: (i) the nature, extent and quality of the services provided to the Fund by New York Life Investments and MacKay; (ii) the qualifications of the portfolio managers of the Fund and the historical investment performance of the Fund, New York Life Investments and MacKay; (iii) the costs of the services provided, and profits realized, by New York Life Investments and MacKay from their relationships with the Fund; (iv) the extent to which economies of scale have been realized or may be realized as the Fund grows and the extent to which economies of scale have benefited or may benefit the Fund’s shareholders; and (v) the reasonableness of the Fund’s management and subadvisory fees and total ordinary operating expenses. Although the Board recognized that comparisons between the Fund’s fees and expenses and those of other funds are imprecise given different terms of agreements, variations in fund strategies and other factors, the Board considered the reasonableness of the Fund’s management fee and total ordinary operating expenses as compared to the peer funds identified by Strategic Insight. Throughout their considerations, the Trustees acknowledged the commitment of New York Life Investments and its affiliates to serve the MainStay Group of Funds, as well as their capacity, experience, resources, financial stability and reputations. The Trustees also acknowledged the entrepreneurial and other risks assumed by New York Life Investments in sponsoring and managing the Fund.
The Trustees noted that, throughout the year, the Trustees are afforded an opportunity to ask questions of, and request additional information or materials from, New York Life Investments and MacKay. The Board’s decision with respect to each of the Advisory Agreements may have also been based, in part, on the Board’s knowledge of New York Life Investments and MacKay resulting from, among other things, the Board’s consideration of each of the Advisory Agreements in prior years, the advisory agreements for other funds in the MainStay Group of Funds, the Board’s review throughout the year of the performance and operations of other funds in the MainStay Group of Funds and each Trustee’s business
Board Consideration and Approval of Management Agreement and Subadvisory Agreement (Unaudited) (continued)
judgment and industry experience. In addition to considering the above-referenced factors, the Board observed that in the marketplace there are a range of investment options available to the Fund’s shareholders and such shareholders, having had the opportunity to consider other investment options, have chosen to invest in the Fund.
The factors that figured prominently in the Board’s decision to approve the continuation of each of the Advisory Agreements during its December 9–10, 2020 meeting are summarized in more detail below, and the Board did not consider any factor or information controlling in reaching such decision.
Nature, Extent and Quality of Services Provided by New York Life Investments and MacKay
The Board examined the nature, extent and quality of the services that New York Life Investments provides to the Fund. The Board evaluated New York Life Investments’ experience and capabilities in serving as manager of the Fund and considered that the Fund operates in a “manager-of-managers” structure. The Board also considered New York Life Investments’ responsibilities and services provided pursuant to this structure, including evaluating the performance of MacKay, making recommendations to the Board as to whether the Subadvisory Agreement should be renewed, modified or terminated and periodically reporting to the Board regarding the results of New York Life Investments’ evaluation and monitoring functions. The Board noted that New York Life Investments manages other mutual funds, serves a variety of other investment advisory clients, including other pooled investment vehicles, and has experience overseeing mutual fund service providers, including subadvisors. The Board considered the experience of senior personnel at New York Life Investments providing management and administrative and other non-advisory services to the Fund as well as New York Life Investments’ reputation and financial condition. The Board observed that New York Life Investments devotes significant resources and time to providing management and non-advisory services to the Fund, including New York Life Investments’ supervision and due diligence reviews of MacKay and ongoing analysis of, and interactions with, MacKay with respect to, among other things, the Fund’s investment performance and risks as well as MacKay’s investment capabilities and subadvisory services with respect to the Fund.
The Board also considered the range of services that New York Life Investments provides to the Fund under the terms of the Management Agreement, including: (i) fund accounting and ongoing supervisory services provided by New York Life Investments’ Fund Administration and Accounting Group; (ii) investment supervisory and analytical services provided by New York Life Investments’ Investment Consulting Group; (iii) compliance services provided by the Trust’s Chief Compliance Officer as well as New York Life Investments’ compliance department, including supervision and implementation of the Fund’s compliance program; (iv) legal services provided by New York Life Investments’ Office of the General Counsel; and (v) risk management monitoring and analysis by compliance and investment personnel. The Board noted that New York Life Investments provides certain other non-advisory services to the Fund.
In addition, the Board considered New York Life Investments’ willingness to invest in personnel, infrastructure, technology, operational enhancements, cyber security, information security, shareholder privacy resources and business continuity planning designed to benefit the Fund and noted that New York Life Investments is responsible for compensating the Trust’s officers, except for a portion of the salary of the Trust’s Chief Compliance Officer. The Board recognized that New York Life Investments has provided an increasingly broad array of non-advisory services to the MainStay Group of Funds as a result of regulatory and other developments, including in connection with the designation of New York Life Investments as the administrator of the MainStay Group of Funds’ liquidity risk management program adopted under the 1940 Act. The Board considered benefits to shareholders from being part of the MainStay Group of Funds, including the privilege of exchanging investments between the same class of shares of funds in the MainStay Group of Funds, including without the imposition of a sales charge (if any).
The Board also examined the nature, extent and quality of the investment advisory services that MacKay provides to the Fund and considered the terms of each of the Advisory Agreements. The Board evaluated MacKay’s experience in serving as subadvisor to the Fund and advising other portfolios and MacKay’s track record and experience in providing investment advisory services, the experience of investment advisory, senior management and administrative personnel at MacKay and New York Life Investments’ and MacKay’s overall resources, legal and compliance environment, capabilities and history. In addition to information provided in connection with quarterly meetings with the Trust’s Chief Compliance Officer, the Board considered information regarding the compliance policies and procedures of New York Life Investments and MacKay and acknowledged their commitment to further developing and strengthening compliance programs relating to the Fund. The Board reviewed MacKay’s ability to attract and retain qualified investment professionals and willingness to invest in personnel to service and support the Fund. In this regard, the Board considered the experience of the Fund’s portfolio managers, the number of accounts managed by the portfolio managers and the method for compensating the portfolio managers.
In addition, the Board considered discussions with New York Life Investments regarding the implementation of its business continuity plans and recognized steps taken by New York Life Investments and MacKay to continue to provide the same nature, extent and quality of services to the Fund during the COVID-19 pandemic.
Based on these considerations, the Board concluded that the Fund would likely continue to benefit from the nature, extent and quality of these services.
Investment Performance
In evaluating the Fund’s investment performance, the Board considered investment performance results over various periods in light of the Fund’s investment objective, strategies and risks. The Board considered
| 32 | MainStay WMC Growth Fund |
investment reports on, and analysis of, the Fund’s performance provided to the Board throughout the year. These reports include, among other items, information on the Fund’s gross and net returns, the Fund’s investment performance compared to relevant investment categories and the Fund’s benchmarks, the Fund’s risk-adjusted investment performance and the Fund’s investment performance as compared to peer funds, as appropriate, as well as portfolio attribution information and commentary on the effect of market conditions. The Board also considered information provided by Strategic Insight showing the investment performance of the Fund as compared to peer funds.
The Board also gave weight to its discussions with senior management at New York Life Investments concerning the Fund’s investment performance attributable to MacKay as well as discussions between the Fund’s portfolio managers and the members of the Board’s Investment Committee, which generally occur on an annual basis. In addition, the Board considered any specific actions that New York Life Investments or MacKay had taken, or had agreed to take, to seek to enhance Fund investment performance and the results of those actions.
Based on these considerations, the Board concluded that its review of the Fund’s investment performance and related information supported a determination to approve the continuation of each of the Advisory Agreements.
Costs of the Services Provided, and Profits Realized, by New York Life Investments and MacKay
The Board considered the costs of the services provided under each of the Advisory Agreements. The Board also considered the profits realized by New York Life Investments and its affiliates, including MacKay, due to their relationships with the Fund. Because MacKay is an affiliate of New York Life Investments whose subadvisory fee is paid by New York Life Investments, not the Fund, the Board considered cost and profitability information for New York Life Investments and MacKay in the aggregate.
In addition, the Board acknowledged the difficulty in obtaining reliable comparative data about mutual fund managers’ profitability because such information generally is not publicly available and may be impacted by numerous factors, including the structure of a fund manager’s organization, the types of funds it manages, the methodology used to allocate certain fixed costs to specific funds and the manager’s capital structure and costs of capital.
In evaluating the costs of the services provided by New York Life Investments and MacKay and profits realized by New York Life Investments and its affiliates, including MacKay, the Board considered, among other factors, each party’s continuing investments in, or willingness to invest in, personnel, systems, equipment and other resources and infrastructure to support and further enhance the management of the Fund, and that New York Life Investments is responsible for paying the subadvisory fee for the Fund. The Board also considered the financial resources of New York Life Investments and MacKay and acknowledged that New York Life Investments and MacKay must be in a position to attract and retain experienced professional
personnel and to maintain a strong financial position for New York Life Investments and MacKay to continue to provide high-quality services to the Fund. The Board recognized that the Fund benefits from the allocation of certain fixed costs among the funds in the MainStay Group of Funds, among other expected benefits resulting from its relationship with New York Life Investments.
The Board considered information regarding New York Life Investments’ methodology for calculating profitability and allocating costs provided by New York Life Investments in connection with the fund profitability analysis presented to the Board. The Board previously engaged an independent consultant to review the methods used to allocate costs among the funds in the MainStay Group of Funds. The Board noted that the independent consultant had concluded that New York Life Investments’ methods for allocating costs and procedures for estimating overall profitability of the relationship with the funds in the MainStay Group of Funds are reasonable and that New York Life Investments continued to use the same method of calculating profit and allocating costs since the independent consultant’s review. The Board recognized the difficulty in calculating and evaluating a manager’s profitability with respect to the Fund and noted that other profitability methodologies may also be reasonable.
The Board also considered certain fall-out benefits that may be realized by New York Life Investments and its affiliates due to their relationships with the Fund, including reputational and other indirect benefits. The Board recognized, for example, the benefits to MacKay from legally permitted “soft-dollar” arrangements by which brokers provide research and other services to MacKay in exchange for commissions paid by the Fund with respect to trades on the Fund’s portfolio securities. In addition, the Board considered its review of a money market fund advised by New York Life Investments and an affiliated subadvisor that serves as an investment option for the Fund, including the potential rationale for and costs associated with investments in this money market fund by the Fund, if any, and considered information from New York Life Investments that the nature and type of specific investment advisory services provided to this money market fund are distinct from, or in addition to, the investment advisory services provided to the Fund.
The Board observed that, in addition to fees earned by New York Life Investments for managing the Fund, New York Life Investments’ affiliates also earn revenues from serving the Fund in various other capacities, including as the Fund’s transfer agent and distributor. The Board considered information about these other revenues and their impact on the profitability of the relationship with the Fund to New York Life Investments and its affiliates. The Board noted that, although it assessed the overall profitability of the Fund to New York Life Investments and its affiliates as part of the contract review process, when considering the reasonableness of the fee paid to New York Life Investments and its affiliates under each of the Advisory Agreements, the Board considered the profitability of New York Life Investments’ relationship with the Fund on a pre-tax basis and without regard to distribution expenses incurred by New York Life Investments from its own resources.
Board Consideration and Approval of Management Agreement and Subadvisory Agreement (Unaudited) (continued)
After evaluating the information deemed relevant by the Trustees, the Board concluded that any profits realized by New York Life Investments and its affiliates, including MacKay, due to their relationships with the Fund were not excessive.
Management and Subadvisory Fees and Total Ordinary Operating Expenses
The Board evaluated the reasonableness of the fee paid under each of the Advisory Agreements and the Fund’s total ordinary operating expenses. The Board primarily considered the reasonableness of the management fee paid by the Fund to New York Life Investments, because the subadvisory fee paid to MacKay is paid by New York Life Investments, not the Fund. The Board also considered the reasonableness of the subadvisory fee paid by New York Life Investments and the amount of the management fee retained by New York Life Investments.
In assessing the reasonableness of the Fund��s fees and expenses, the Board primarily considered comparative data provided by Strategic Insight on the fees and expenses charged by similar mutual funds managed by other investment advisers. In addition, the Board considered information provided by New York Life Investments and MacKay on fees charged to other investment advisory clients, including institutional separate accounts and/or other funds that follow investment strategies similar to those of the Fund, if any. The Board considered the similarities and differences in the contractual management fee schedules of the Fund and these similarly-managed accounts and/or funds, taking into account the rationale for any differences in fee schedules. The Board also took into account explanations provided by New York Life Investments about the more extensive scope of services provided to registered investment companies, such as the Fund, as compared with other investment advisory clients. Additionally, the Board considered the impact of contractual breakpoints, voluntary waivers and expense limitation arrangements on the Fund’s net management fee and expenses. The Board also considered that in proposing fees for the Fund, New York Life Investments considers the competitive marketplace for mutual funds.
The Board noted that, outside of the Fund’s management fee and the fees charged under a share class’s Rule 12b-1 and/or shareholder services plans, a share class’s most significant “other expenses” are transfer agent fees. Transfer agent fees are charged to the Fund based on the number of shareholder accounts (a “per-account” fee). The Board took into account information from New York Life Investments regarding the reasonableness of the Fund’s transfer agent fee schedule, including industry data demonstrating that the per-account fees that NYLIM Service Company LLC, an affiliate of New York Life Investments and the Fund’s transfer agent, charges the Fund are within the range of per-account fees charged by transfer agents to other mutual funds. In addition, the Board considered NYLIM Service Company LLC’s profitability in connection with the transfer agent services it provides to the Fund. The Board also took into account information received from NYLIM Service Company LLC regarding the sub-transfer agency payments it made to intermediaries in connection with the provision of sub-transfer agency services to the Fund.
The Board considered that, because the Fund’s transfer agent fees are billed on a per-account basis, the impact of transfer agent fees on a share class’s expense ratio may be more significant in cases where the share class has a high number of small accounts. The Board considered the extent to which transfer agent fees comprised total expenses of the Fund. The Board acknowledged the role that the MainStay Group of Funds historically has played in serving the investment needs of New York Life Insurance Company customers, who often maintain smaller account balances than other shareholders of funds, and the impact of small accounts on the expense ratios of Fund share classes. The Board also recognized measures that it and New York Life Investments have taken to mitigate the effect of small accounts on the expense ratios of Fund share classes, including through the imposition of an expense limitation on net transfer agency expenses. The Board noted that, for purposes of allocating transfer agency fees and expenses, each retail fund in the MainStay Group of Funds combines the shareholder accounts of its Class A, A2, I, R1, R2 and R3 shares (as applicable) into one group and the shareholder accounts of its Investor Class, SIMPLE Class and Class B, C and C2 shares (as applicable) into another group. The Board also noted that the per-account fees attributable to each group of share classes is then allocated among the constituent share classes based on relative net assets and that a MainStay Fund’s Class R6 shares, if any, are not combined with any other share class for this purpose. The Board considered New York Life Investments’ rationale with respect to these groupings and previously received a report from an independent consultant engaged to conduct comparative analysis of these groupings. The Board also considered that NYLIM Service Company LLC had waived its contractual cost of living adjustments during the past seven years.
Based on the factors outlined above, the Board concluded that the Fund’s management fee and total ordinary operating expenses were within a range that is competitive and support a conclusion that these fees and expenses are reasonable.
Economies of Scale
The Board considered information regarding economies of scale, including whether the Fund’s expense structure permits economies of scale to be appropriately shared with the Fund’s shareholders. The Board also considered a report from New York Life Investments, previously prepared at the request of the Board, that addressed economies of scale, including with respect to the mutual fund business generally and the various ways in which the benefits of economies of scale may be shared with the funds in the MainStay Group of Funds. Although the Board recognized the difficulty of determining economies of scale with precision, the Board acknowledged that economies of scale may be shared with the Fund in a number of ways, including, for example, through the imposition of management fee breakpoints, initially setting management fee rates at scale or making additional investments to enhance services. The Board reviewed information from New York Life Investments showing how the Fund’s management fee schedule compared to fee schedules of other funds and accounts managed by New York Life Investments. The Board
| 34 | MainStay WMC Growth Fund |
also reviewed information from Strategic Insight showing how the Fund’s management fee schedule compared with fees paid for similar services by peer funds at varying asset levels.
Based on this information, the Board concluded that economies of scale are appropriately reflected for the benefit of the Fund’s shareholders through the Fund’s expense structure and other methods to share benefits from economies of scale.
Conclusion
On the basis of the information and factors summarized above, among other information and factors deemed relevant by the Trustees, and the evaluation thereof, the Board, including the Independent Trustees voting separately, unanimously voted to approve the continuation of each of the Advisory Agreements.
Board consideration and Approval of Subadvisory Agreement with Wellington Management Company LLP (Unaudited)
The Subadvisory Agreement between New York Life Investment Management LLC (“New York Life Investments”) and Wellington Management Company LLP (“Wellington”) with respect to the MainStay WMC Growth Fund (formerly known as the MainStay MacKay Growth Fund) (“Fund”) (“New Subadvisory Agreement”), must be approved initially and, following an initial term of up to two years, is subject to annual review and approval by the Board of Trustees of MainStay Funds Trust (“Board” of the “Trust”) in accordance with Section 15 of the Investment Company Act of 1940, as amended (“1940 Act”). At its February 3, 2021 meeting, the Board, including the Trustees who are not an “interested person” (as such term is defined in the 1940 Act) of the Trust (“Independent Trustees”) voting separately, unanimously approved the New Subadvisory Agreement for an initial two-year period.
At meetings held on January 21, January 25 and February 3, 2021, the Board considered and approved New York Life Investments’ recommendations to appoint Wellington as the subadvisor to the Fund, to approve the New Subadvisory Agreement, to approve the related changes to the Fund’s principal investment strategies, name and investment process and to approve the establishment of a new expense limitation agreement for Class I shares of the Fund (the “Repositioning”), all effective on or about March 5, 2021. The Board noted that the material terms of the New Subadvisory Agreement are substantially identical to the terms of the then-current subadvisory agreement with MacKay Shields LLC (“MacKay”) with respect to the Fund, but that the subadvisory fee schedule under the New Subadvisory Agreement with Wellington includes fees that are lower at every level of assets than the subadvisory fees paid to MacKay under the then-current subadvisory agreement.
In reaching the decisions to approve the Repositioning and New Subadvisory Agreement, the Board considered information furnished by New York Life Investments and Wellington in connection with meetings of the Board and its Contracts, Investment and Risk and Compliance Oversight Committees held on January 21, January 25 and February 3, 2021, as well as other information furnished to the Board and its Committees throughout the year, as deemed relevant by the Trustees. The Board also considered information on the fees charged to other investment advisory clients of Wellington that follow investment strategies similar to those proposed for the Fund, as repositioned, and, when applicable, the rationale for any differences in the Fund’s proposed subadvisory fee and the fees charged to those other investment advisory clients. In addition, the Board considered information previously provided to the Board in connection with its review of the subadvisory agreements for other funds in the MainStay Group of Funds, as deemed relevant to each Trustee. The Board also considered information furnished by Wellington in response to requests prepared on behalf of the Board, and in consultation with the Independent Trustees, by independent legal counsel to the Independent Trustees, which encompassed a variety of topics, including those summarized below.
The Board took into account information provided in connection with its meetings throughout the year, including, among other items, information regarding the legal standards and fiduciary obligations applicable to its consideration of the New Subadvisory Agreement and investment
performance reports on the Fund as well as presentations from New York Life Investments and Wellington personnel. The contract review process, including the structure and format for materials provided to the Board, has been developed in consultation with the Board. The Independent Trustees also met in executive sessions with their independent legal counsel and, for a portion thereof, with senior management of New York Life Investments.
In considering the Repositioning and the New Subadvisory Agreement, the Trustees reviewed and evaluated the information and factors they believed to reasonably be necessary and appropriate in light of legal advice furnished to them by independent legal counsel and through the exercise of their own business judgment. Although individual Trustees may have weighed certain factors or information differently, the factors considered by the Board are described in greater detail below and include, among other factors: (i) the nature, extent and quality of the services to be provided to the Fund by Wellington; (ii) the investment performance of the Fund, the qualifications of the proposed portfolio managers of the Fund and the historical investment performance of products managed by such portfolio managers with investment strategies similar to those of the Fund, as repositioned; (iii) the anticipated costs of the services to be provided, and profits expected to be realized, by Wellington from its relationship with the Fund; (iv) the extent to which economies of scale may be realized if the Fund grows and the extent to which economies of scale may benefit the Fund’s shareholders; and (v) the reasonableness of the Fund’s proposed subadvisory fee to be paid by New York Life Investments to Wellington and estimated total ordinary operating expenses. Although the Board recognized that comparisons between the Fund’s proposed fees and estimated expenses and those of other funds are imprecise given different terms of agreements, variations in fund strategies and other factors, the Board considered the reasonableness of the Fund’s proposed fees and estimated total ordinary operating expenses as compared to the peer funds identified by New York Life Investments.
Although individual Trustees may have weighed certain factors or information differently, the Board’s decisions to approve the Repositioning and the New Subadvisory Agreement were based on a consideration of the information provided to the Trustees throughout the year, such as presentations from Wellington personnel, as well as information furnished specifically in connection with the contract review process for the Fund, in each case as deemed relevant to each Trustee. The Trustees noted that, throughout the year, the Trustees would be afforded an opportunity to ask questions of, and request additional information or materials from, New York Life Investments and Wellington with respect to the Fund. The Board took note of New York Life Investments’ belief that Wellington, with its resources and historical investment performance track record for strategies similar to those of the Fund, as repositioned, is well qualified to serve as the Fund’s subadvisor. In addition to considering the above-referenced factors, the Board observed that in the marketplace there are a range of investment options available to the Fund’s shareholders and such shareholders, having had the opportunity to consider other investment options, have chosen to invest in the Fund.
| 36 | MainStay WMC Growth Fund |
The factors that figured prominently in the Board’s decisions to approve the Repositioning and the New Subadvisory Agreement are summarized in more detail below, and the Board did not consider any factor or information controlling in reaching such decisions.
Nature, Extent and Quality of Services to be Provided by Wellington
In considering the Repositioning and the New Subadvisory Agreement, the Board considered New York Life Investments’ responsibilities as manager of the Fund, noting that New York Life Investments is responsible for supervising the Fund’s subadvisor. The Board examined the nature, extent and quality of the investment advisory services that Wellington proposed to provide to the Fund. Further, the Board evaluated and/or examined the following with regard to Wellington:
| • | experience in providing investment advisory services; |
| • | experience in serving as advisor or subadvisor to other funds with similar strategies as those of the Fund, as repositioned, and the performance track record of those funds; |
| • | experience of investment advisory, senior management and administrative personnel; |
| • | overall legal and compliance environment, resources and history and policies and procedures in place with respect to matters that may involve conflicts of interest between the Fund’s investments and those of other accounts managed by Wellington; |
| • | New York Life Investments’ and Wellington’s belief that their respective compliance policies, procedures and systems are reasonably designed to prevent violation of the federal securities laws and their commitment to further developing and strengthening compliance programs relating to the MainStay Group of Funds generally and the Fund specifically; |
| • | ability to attract and retain qualified investment professionals and willingness to invest in personnel to service and support the Fund; |
| • | portfolio construction and risk management processes; |
| • | experience of the Fund’s proposed portfolio managers, including with respect to investment strategies similar to those of the Fund, the number of accounts managed by the portfolio managers and the method for compensating the portfolio managers; and |
| • | overall reputation, financial condition and assets under management. |
Based on these considerations, the Board concluded that the Fund would likely benefit from the nature, extent and quality of the proposed investment advisory services to be provided by Wellington.
Investment Performance
In evaluating the Fund’s investment performance, the Board considered investment performance results over various periods in light of the Fund’s investment objective, strategies and risks. The Board considered investment reports on, and analysis of, the Fund’s performance provided
to the Board throughout the year. These reports include, among other items, information on the Fund’s gross and net returns, the Fund’s investment performance compared to relevant investment categories and the Fund’s benchmarks, the Fund’s risk-adjusted investment performance and the Fund’s investment performance as compared to peer funds, as appropriate, as well as portfolio attribution information and commentary on the effect of market conditions.
The Board also gave weight to its discussions with senior management at New York Life Investments concerning the Fund’s investment performance and remediation efforts undertaken by New York Life Investments, and other alternatives to the Repositioning, and the New Subadvisory Agreement considered by New York Life Investments. In addition, the Board considered steps taken to seek to improve the Fund’s investment performance and discussions between the Fund’s current portfolio management team and the Investment Committee of the Board. The Board further considered that shareholders may benefit from Wellington’s investment process, including its portfolio construction and risk management processes. The Board noted that the Repositioning had not yet been implemented so an investment performance track record for the Fund, as repositioned, was not available.
The Board evaluated the Fund’s proposed portfolio management team, investment process, strategies and risks. The Board noted that Wellington currently manages one or more portfolios with investment strategies similar to those of the Fund, as repositioned. Additionally, the Board considered the historical performance of such portfolio or portfolios and other portfolios managed by the proposed portfolio managers for the Fund. Based on these considerations, the Board concluded that the Fund was likely to be managed responsibly and capably by Wellington.
Based on these considerations, the Board concluded that the selection of Wellington as the subadvisor to the Fund is likely to benefit the Fund’s long-term investment performance.
Costs of the Services to be Provided, and Profits to be Realized, by Wellingtony
The Board considered the anticipated costs of the services to be provided by Wellington under the New Subadvisory Agreement and the profits expected to be realized by Wellington due to its relationship with the Fund. The Board considered that Wellington’s subadvisory fee had been negotiated at arm’s-length by New York Life Investments and that these fees would be paid by New York Life Investments, not the Fund.
In evaluating the anticipated costs of the services to be provided by Wellington and profits expected to be realized by Wellington, the Board considered, among other factors, Wellington’s investments in, or willingness to invest in, personnel, systems, equipment and other resources and infrastructure to support and further enhance the services proposed to be provided to the Fund, and that New York Life Investments would be responsible for paying the subadvisory fee to Wellington. The Board also considered the financial resources of Wellington and acknowledged that Wellington must be in a position to attract and retain experienced professional personnel and to maintain a strong financial
Board consideration and Approval of Subadvisory Agreement with Wellington Management Company LLP (Unaudited) (continued)
position for Wellington to be able to provide high-quality services to the Fund. The Board also considered that New York Life Investments proposed an expense limitation agreement for Class I shares of the Fund.
In considering anticipated costs and profitability, the Board also considered certain fall-out benefits that may be realized by Wellington due to its relationship with the Fund, including reputational and other indirect benefits. The Board recognized, for example, the potential benefits to Wellington from legally permitted “soft-dollar” arrangements by which brokers would provide research and other services to Wellington in exchange for commissions paid by the Fund with respect to trades in the Fund’s portfolio securities. In addition, the Board also requested and received information from New York Life Investments concerning other material business relationships between Wellington and its affiliates and New York Life Investments and its affiliates, and considered the existence of a strategic partnership between New York Life Investments and Wellington that relates to certain current and future products that represented a conflict of interest associated with New York Life Investments’ recommendation to approve the Repositioning and the New Subadvisory Agreement.
The Board took into account the fact that the Fund would undergo changes to its principal investment strategies in connection with the Repositioning. The Board noted estimates from New York Life Investments and Wellington that a significant portion of the holdings of the Fund would be sold to align the Fund’s holdings with the strategies that would be pursued by Wellington. Additionally, the Board considered New York Life Investments’ representation that New York Life Investments would work closely with Wellington to seek to execute the optimal transition strategy and that New York Life Investments would make every effort to minimize potential direct and indirect costs associated with the Repositioning.
The Board considered that any profits realized by Wellington due to its relationship with the Fund would be the result of arm’s-length negotiations between New York Life Investments and Wellington, acknowledging that any such profits would be based on fees paid to Wellington by New York Life Investments, not the Fund.
Subadvisory Fee and Estimated Total Ordinary Operating Expenses
The Board evaluated the reasonableness of the fee to be paid under the New Subadvisory Agreement and the Fund’s estimated total ordinary operating expenses. The Board primarily considered the reasonableness of the management fee to be paid by the Fund to New York Life Investments because the subadvisory fee to be paid to Wellington would be paid by New York Life Investments, not the Fund. The Board also considered the reasonableness of the subadvisory fee to be paid by New York Life Investments and the amount of the management fee expected to be retained by New York Life Investments.
In assessing the reasonableness of the Fund’s proposed fees and estimated expenses, the Board considered information provided by New York Life Investments on fees and expenses of peer funds, and the Board considered information provided by Wellington on fees charged to other
investment advisory clients, including institutional separate accounts and/or other funds that follow investment strategies similar to those of the Fund, as repositioned. The Board considered the similarities and differences in the contractual fee schedules of the Fund and these similarly-managed accounts and/or funds, taking into account the rationale for any differences in fee schedules. The Board also considered that in proposing fees for the Fund, New York Life Investments considers the competitive marketplace for mutual funds.
Based on the factors outlined above, the Board concluded that the Fund’s management fee and total ordinary operating expenses were within a range that is competitive and support a conclusion that these fees and expenses are reasonable.
Economies of Scale
The Board considered information regarding economies of scale, including whether the Fund’s proposed expense structure would permit economies of scale to be appropriately shared with the Fund’s shareholders. The Board also considered a report from New York Life Investments, previously prepared at the request of the Board, that addressed economies of scale, including with respect to the mutual fund business generally and the various ways in which the benefits of economies of scale may be shared with the funds in the MainStay Group of Funds. Although the Board recognized the difficulty of determining economies of scale with precision, the Board acknowledged that economies of scale may be shared with the Fund in a number of ways, including, for example, through the imposition of fee breakpoints, initially setting management fee rates at scale or making additional investments to enhance services.
Based on this information, the Board concluded that economies of scale are appropriately reflected for the benefit of the Fund’s shareholders through the Fund’s proposed expense structure and other methods to share benefits from economies of scale.
Conclusion
On the basis of the information and factors summarized above, among other information and factors deemed relevant by the Trustees, and the evaluation thereof, the Board, including the Independent Trustees voting separately, unanimously voted to approve the Repositioning and the New Subadvisory Agreement.
| 38 | MainStay WMC Growth Fund |
Discussion of the Operation and Effectiveness of the Fund's Liquidity Risk Management Program (Unaudited)
In compliance with Rule 22e-4 under the Investment Company Act of 1940, as amended (the “Liquidity Rule”), the Fund has adopted and implemented a liquidity risk management program (the “Program”), which New York Life Investment Management LLC believes is reasonably designed to assess and manage the Fund's liquidity risk (the risk that the Fund could not meet requests to redeem shares issued by the Fund without significant dilution of remaining investors’ interests in the Fund). The Board of Trustees of MainStay Funds Trust (the "Board") designated New York Life Investment Management LLC as administrator of the Program (the “Administrator”). The Administrator has established a Liquidity Risk Management Committee to assist the Administrator in the implementation and day-to-day administration of the Program and to otherwise support the Administrator in fulfilling its responsibilities under the Program.
At a meeting of the Board held on March 8, 2021, the Administrator provided the Board with a written report addressing the Program’s operation and assessing its adequacy and effectiveness of implementation for the period from January 1, 2020 through December 31, 2020 (the "Review Period"), as required under the Liquidity Rule. The report noted that the Administrator concluded that (i) the Program operated effectively to assess and manage the Fund's liquidity risk, (ii) the Program has been adequately and effectively implemented to monitor and, as applicable, respond to the Fund's liquidity developments and (iii) the Fund's investment strategy continues to be appropriate for an open-end fund. In addition, the report discussed notable events that impacted liquidity risk during the Review Period, including the COVID-19 pandemic and the resulting economic shutdown.
In accordance with the Program, the Fund's liquidity risk is assessed no less frequently than annually taking into consideration certain factors, as applicable, such as (i) investment strategy and liquidity of portfolio investments, (ii) short-term and long-term cash flow projections and (iii) holdings of cash and cash equivalents, as well as borrowing arrangements and other funding sources. Certain factors are considered under both normal and reasonably foreseeable stressed conditions.
Each Fund portfolio investment is classified into one of four liquidity categories. The classification is based on a determination of the number of days it is reasonably expected to take to convert the investment into cash, or sell or dispose of the investment, in current market conditions without significantly changing the market value of the investment. The Administrator has delegated liquidity classification determinations to the Fund’s subadvisor, subject to appropriate oversight by the Administrator, and classification determinations are made by taking into account the Fund's reasonably anticipated trade size, various market, trading and investment-specific considerations, as well as market depth, and, in certain cases, third-party vendor data.
The Liquidity Rule requires funds that do not primarily hold assets that are highly liquid investments to adopt a minimum amount of net assets that must be invested in highly liquid investments that are assets (an “HLIM”). In addition, the Liquidity Rule limits a fund's investments in illiquid investments. Specifically, the Liquidity Rule prohibits acquisition of illiquid investments if doing so would result in a fund holding more than 15% of its net assets in illiquid investments that are assets. The Program includes provisions reasonably designed to determine, periodically review and comply with the HLIM requirement, as applicable, and to comply with the 15% limit on illiquid investments.
There can be no assurance that the Program will achieve its objectives under all circumstances in the future. Please refer to the Fund's prospectus for more information regarding the Fund's exposure to liquidity risk and other risks to which it may be subject.
Proxy Voting Record
The Fund is required to file with the Securities and Exchange Commissions's ("SEC") its proxy voting records for the 12-month period ending June 30 on Form N-PX. The most recent Form N-PX or proxy voting record is available free of charge upon request by calling 800-624-6782; visiting the MainStay Funds’ website at newyorklifeinvestments.com; or visiting the SEC’s website at www.sec.gov.
Shareholder Reports and Quarterly Portfolio Disclosure
The Fund is required to file its complete schedule of portfolio holdings with the SEC 60 days after its first and third fiscal quarter on Form N-PORT. The Fund's holdings report is available free of charge upon request by calling New York Life Investments at 800-624-6782.
| 40 | MainStay WMC Growth Fund |
This page intentionally left blank.
This page intentionally left blank.
Equity
U.S. Equity
MainStay Epoch U.S. Equity Yield Fund
MainStay MacKay S&P 500 Index Fund
MainStay Winslow Large Cap Growth Fund
MainStay WMC Enduring Capital Fund
MainStay WMC Growth Fund
MainStay WMC Small Companies Fund
MainStay WMC Value Fund
International Equity
MainStay Epoch International Choice Fund
MainStay MacKay International Equity Fund
MainStay WMC International Research Equity Fund
Emerging Markets Equity
MainStay Candriam Emerging Markets Equity Fund
Global Equity
MainStay Epoch Capital Growth Fund
MainStay Epoch Global Equity Yield Fund
Fixed Income
Taxable Income
MainStay Candriam Emerging Markets Debt Fund
MainStay Floating Rate Fund
MainStay MacKay High Yield Corporate Bond Fund
MainStay MacKay Short Duration High Yield Fund
MainStay MacKay Strategic Bond Fund
MainStay MacKay Total Return Bond Fund
MainStay MacKay U.S. Infrastructure Bond Fund
MainStay Short Term Bond Fund
Tax-Exempt Income
MainStay MacKay California Tax Free Opportunities Fund1
MainStay MacKay High Yield Municipal Bond Fund
MainStay MacKay Intermediate Tax Free Bond Fund
MainStay MacKay New York Tax Free Opportunities Fund2
MainStay MacKay Short Term Municipal Fund
MainStay MacKay Tax Free Bond Fund
Money Market
MainStay Money Market Fund
Mixed Asset
MainStay Balanced Fund
MainStay Income Builder Fund
MainStay MacKay Convertible Fund
Speciality
MainStay CBRE Global Infrastructure Fund
MainStay CBRE Real Estate Fund
MainStay Cushing MLP Premier Fund
Asset Allocation
MainStay Conservative Allocation Fund
MainStay Conservative ETF Allocation Fund
MainStay Defensive ETF Allocation Fund
MainStay Equity Allocation Fund
MainStay Equity ETF Allocation Fund
MainStay Growth Allocation Fund
MainStay Growth ETF Allocation Fund
MainStay Moderate Allocation Fund
MainStay Moderate ETF Allocation Fund
Manager
New York Life Investment Management LLC
New York, New York
Subadvisors
Candriam Belgium S.A.3
Brussels, Belgium
Candriam Luxembourg S.C.A.3
Strassen, Luxembourg
CBRE Clarion Securities LLC
Radnor, Pennsylvania
Cushing Asset Management, LP
Dallas, Texas
Epoch Investment Partners, Inc.
New York, New York
MacKay Shields LLC3
New York, New York
NYL Investors LLC3
New York, New York
Wellington Management Company LLP
Boston, Massachusetts
Winslow Capital Management, LLC
Minneapolis, Minnesota
Legal Counsel
Dechert LLP
Washington, District of Columbia
Independent Registered Public Accounting Firm
KPMG LLP
Philadelphia, Pennsylvania
Distributor
NYLIFE Distributors LLC3
Jersey City, New Jersey
Custodian
JPMorgan Chase Bank, N.A.
New York, New York
1.
This Fund is registered for sale in AZ, CA, NV, OR, TX, UT, WA and MI (Class A and I shares only), and CO, FL, GA, HI, ID, MA, MD, NH, NJ and NY (Class I shares only).
| 2. | This Fund is registered for sale in CA, CT, DE, FL, MA, NJ, NY and VT. |
| 3. | An affiliate of New York Life Investment Management LLC. |
Not part of the Semiannual Report
For more information
800-624-6782
newyorklifeinvestments.com
“New York Life Investments” is both a service mark, and the common trade name, of certain investment advisors affiliated with New York Life Insurance Company. The MainStay Funds® are managed by New York Life Investment Management LLC and distributed by NYLIFE Distributors LLC, 30 Hudson Street, Jersey City, NJ 07302, a wholly owned subsidiary of New York Life Insurance Company. NYLIFE Distributors LLC is a Member FINRA/SIPC.
©2021 NYLIFE Distributors LLC. All rights reserved.
| 1737427MS071-21 | MSWG10-06/21 |
(NYLIM) NL529
MainStay WMC International Research Equity Fund
(formerly known as MainStay MacKay International Opportunities Fund)
Message from the President and Semiannual Report
Unaudited | April 30, 2021
Sign up for e-delivery of your shareholder reports. For full details on e-delivery, including who can participate and what you can receive via e-delivery,
please log in to newyorklifeinvestments.com/accounts.
| Not FDIC/NCUA Insured | Not a Deposit | May Lose Value | No Bank Guarantee | Not Insured by Any Government Agency |
This page intentionally left blank
Message from the President
With the approval of COVID-19 vaccines and the passage of relief packages by the U.S. Congress, economic prospects improved during the reporting period, and investor risk appetite increased, benefiting both equities and fixed-income markets. Despite some volatility stemming from a sell-off in longer-dated Treasury securities, the stock market and higher-risk segments of the fixed-income market posted gains for the six months ended April 30, 2021.
By the beginning of the reporting period, the economy had made tremendous progress from the second quarter of 2020, when economic activity plunged. But uncertainty about when vaccines would be available and how quickly they could be administered left investors unsure about the economic outlook.
With the approval of several vaccines in November, the outlook brightened and investors became less risk-averse. Anticipating the likely end of the pandemic and a continuation of the economic recovery, they began to see opportunities in investment-grade and high-yield bonds and more cyclical segments of the stock market. The $900 billion relief and stimulus package passed in December provided further assurance.
In January, the Federal Reserve opted to leave interest rates unchanged, pointing to some uncertainty about the pace of the global recovery. Officials also noted that inflation remained low, citing oil prices in particular.
In March, President Biden signed the $1.9 billion American Rescue Plan, which, among other provisions, called for payments of $1,400 for those earning less than $75,000 per year, plus $1,400 per dependent. This, combined with the Federal Reserve’s new tolerance for inflation and an anticipated $2 trillion infrastructure spending bill, added to growing concerns about higher prices. Supply shortages in some markets caused some prices to soar, heightening concerns further.
In fixed-income markets, an improving economic outlook and rising inflation expectations led to a sell-off in longer-term Treasuries, with the result that the yield on the 10-year note rose sharply, particularly in February and March. Investment grade corporate bonds were also affected. Early in the reporting period, they performed well as investors shifted out of Treasuries, but as the reporting period progressed, they faltered. Longer-dated securities issued in recent years at historically low interest rates became especially unattractive.
High-yield bonds remained steady, supported by more favorable yields and an improved economic outlook, which reduced their perceived risk. Municipal bonds produced modest gains, and
although the sell-off in Treasuries produced some volatility early in 2021, stronger-than-expected tax revenues, $350 billion in financial support from the federal government, and the possibility of an increase in federal income tax rates appeared to buoy the market late in the reporting period.
Inflation concerns and volatility in the Treasury market led to a shift in equities markets. Although the S&P 500® Index, a widely followed measure of U.S. equities, posted double-digit gains and hit a record high, the rise of Treasury yields disrupted valuations, especially those of growth stocks. Technology companies that saw their valuations soar amid the work-from-home trend in 2020 suffered large declines.
But the fiscal stimulus and continued accommodation from the Federal Reserve gave investors confidence the economic recovery would continue. Combined with the sky-high valuations in technology and growth stocks, this increased the appeal of more cyclical and value-oriented shares. As a result, value stocks outperformed growth stocks during the reporting period.
Reflecting the shift in investor sentiment, the performance of S&P 500® Index sectors varied widely. While the information technology sector kept up with the broader market, it lagged cyclical sectors such as energy and financials, which led the way. The shift was further reflected in the performance of small-cap stocks, which outperformed large caps. While developed markets kept pace with the U.S. market, lagging economic and pandemic recoveries appeared to weigh on emerging markets late in the reporting period.
With the lockdown restrictions lifting in the U.S. and the pandemic easing in many regions, we at New York Life Investments are looking forward to a return to a more normal economy. We anticipate that over the next several years, a variety of trends will likely offer long-term investors many attractive opportunities. With this in mind, we continue to develop products and services to help you to take advantage of these trends, manage your risks, and ultimately meet your investment goals.
Sincerely,
Kirk C. Lehneis
President
The opinions expressed are as of the date of this report and are subject to change. There is no guarantee that any forecast made will come to pass. This material does not constitute investment advice and is not intended as an endorsement of any specific investment. Past performance is no guarantee of future results.
Not part of the Semiannual Report
Investors should refer to the Fund’s Summary Prospectus and/or Prospectus and consider the Fund’s investment objectives, strategies, risks, charges and expenses carefully before investing. The Summary Prospectus and/or Prospectus contain this and other information about the Fund. You may obtain copies of the Fund’s Summary Prospectus, Prospectus and Statement of Additional Information free of charge, upon request, by calling toll-free 800-624-6782, by writing to NYLIFE Distributors LLC, Attn: MainStay Marketing Department, 30 Hudson Street, Jersey City, NJ 07302 or by sending an e-mail to MainStayShareholderServices@nylim.com. These documents are also available via the MainStay Funds’ website at newyorklifeinvestments.com. Please read the Fund’s Summary Prospectus and/or Prospectus carefully before investing.
Investment and Performance Comparison (Unaudited)
Performance data quoted represents past performance. Past performance is no guarantee of future results. Because of market volatility and other factors, current performance may be lower or higher than the figures shown. Investment return and principal value will fluctuate, and as a result, when shares are redeemed, they may be worth more or less than their original cost. The graph below depicts the historical performance of Class I shares of the Fund. Performance will vary from class to class based on differences in class-specific expenses and sales charges. For performance information current to the most recent month-end, please call 800-624-6782 or visit newyorklifeinvestments.com.
The performance table and graph do not reflect the deduction of taxes that a shareholder would pay on distributions or Fund share redemptions. Total returns reflect maximum applicable sales charges as indicated in the table below, if any, changes in share price, and reinvestment of dividend and capital gain distributions. The graph assumes the initial investment amount shown below and reflects the deduction of all sales charges that would have applied for the period of investment. Performance figures may reflect certain fee waivers and/or expense limitations, without which total returns may have been lower. For more information on share classes and current fee waivers and/or expense limitations (if any), please refer to the Notes to Financial Statements.

| Average Annual Total Returns for the Period-Ended April 30, 2021 |
| Class | Sales Charge | | Inception
Date1 | Six
Months | One
Year | Five
Years | Ten
Years | Gross
Expense
Ratio2 |
| Class A Shares | Maximum 5.5% Initial Sales Charge | With sales charges | 9/28/2007 | 19.32% | 31.22% | 3.14% | 3.36% | 1.20% |
| | | Excluding sales charges | | 26.27 | 38.85 | 4.32 | 3.95 | 1.20 |
| Investor Class Shares3 | Maximum 5% Initial Sales Charge | With sales charges | 2/28/2008 | 19.83 | 30.71 | 2.96 | 3.21 | 1.45 |
| | | Excluding sales charges | | 26.14 | 38.32 | 4.13 | 3.79 | 1.45 |
| Class C Shares | Maximum 1% CDSC | With sales charges | 9/28/2007 | 24.71 | 36.30 | 3.36 | 3.03 | 2.20 |
| | If Redeemed Within One Year of Purchase | Excluding sales charges | | 25.71 | 37.30 | 3.36 | 3.03 | 2.20 |
| Class I Shares | No Sales Charge | | 9/28/2007 | 26.40 | 39.13 | 4.57 | 4.21 | 0.95 |
| 1. | Effective March 5, 2021, the Fund replaced its subadvisor and modified its principal investment strategies. The past performance in the graph and table prior to that date reflects the Fund's prior subadvisor and principal investment strategies. |
| 2. | The gross expense ratios presented reflect the Fund’s “Total Annual Fund Operating Expenses” from the most recent Prospectus, as supplemented, and may differ from other expense ratios disclosed in this report. |
| 3. | Prior to June 30, 2020, the maximum initial sales charge was 5.5%, which is reflected in the average annual total return figures shown. |
The footnotes on the next page are an integral part of the table and graph and should be carefully read in conjunction with them.
| Benchmark Performance | Six
Months | One
Year | Five
Years | Ten
Years |
| MSCI ACWI® ex USA Index (Net)1 | 27.40% | 42.98% | 9.83% | 4.73% |
| MSCI EAFE Index® (Net)2 | 28.84 | 39.88 | 8.87 | 5.22 |
| Morningstar Foreign Large Blend Category Average3 | 27.60 | 41.69 | 8.84 | 4.72 |
| 1. | The Fund has selected the MSCI ACWI® (All Country World Index) ex USA Index (Net) as its primary broad-based securities market index for comparison purposes. The MSCI ACWI® ex USA Index (Net) is a free float-adjusted market capitalization weighted index that is designed to measure the equity market performance of developed and emerging markets, excluding the U.S. Results assume reinvestment of all income and capital gains. An investment cannot be made directly in an index. |
| 2. | The MSCI EAFE® Index (Net) is the Fund’s secondary benchmark. The MSCI EAFE® Index (Net) consists of international stocks representing the developed world outside of North America. Results assume reinvestment of all dividends and capital gains. An investment cannot be made directly in an index. |
| 3. | The Morningstar Foreign Large Blend Category Average is representative of funds that invest in a variety of big international stocks. Most of these portfolios divide their assets among a dozen or more developed markets, including Japan, Britain, France, and Germany. These portfolios primarily invest in stocks that have market caps in the top 70% of each economically integrated market (such as Europe or Asia ex-Japan). The blend style is assigned to portfolios where neither growth nor value characteristics predominate. These portfolios typically will have less than 20% of assets invested in U.S. stocks. Results are based on average total returns of similar funds with all dividends and capital gain distributions reinvested. |
The footnotes on the preceding page are an integral part of the table and graph and should be carefully read in conjunction with them.
| 6 | MainStay WMC International Research Equity Fund |
Cost in Dollars of a $1,000 Investment in MainStay WMC International Research Equity Fund (Unaudited)
The example below is intended to describe the fees and expenses borne by shareholders during the six-month period from November 1, 2020, to April 30, 2021, and the impact of those costs on your investment.
Example
As a shareholder of the Fund you incur two types of costs: (1) transaction costs, including exchange fees and sales charges (loads) on purchases (as applicable), and (2) ongoing costs, including management fees, distribution and/or service (12b-1) fees, and other Fund expenses (as applicable). This example is intended to help you understand your ongoing costs (in dollars) of investing in the Fund and to compare these costs with the ongoing costs of investing in other mutual funds. The example is based on an investment of $1,000 made at the beginning of the six-month period and held for the entire period from November 1, 2020, to April 30, 2021.
This example illustrates your Fund’s ongoing costs in two ways:
Actual Expenses
The second and third data columns in the table below provide information about actual account values and actual expenses. You may use the information in these columns, together with the amount you invested, to estimate the expenses that you paid during the six months ended April 30, 2021. Simply divide your account value by $1,000 (for example, an
$8,600 account value divided by $1,000 = 8.6), then multiply the result by the number under the heading entitled “Expenses Paid During Period” to estimate the expenses you paid on your account during this period.
Hypothetical Example for Comparison Purposes
The fourth and fifth data columns in the table below provide information about hypothetical account values and hypothetical expenses based on the Fund’s actual expense ratio and an assumed rate of return of 5% per year before expenses, which is not the Fund’s actual return. The hypothetical account values and expenses may not be used to estimate the actual ending account balances or expenses you paid for the six-month period shown. You may use this information to compare the ongoing costs of investing in the Fund with the ongoing costs of investing in other mutual funds. To do so, compare this 5% hypothetical example with the 5% hypothetical examples that appear in the shareholder reports of the other mutual funds.
Please note that the expenses shown in the table are meant to highlight your ongoing costs only and do not reflect any transactional costs, such as exchange fees or sales charges (loads). Therefore, the fourth and fifth data columns of the table are useful in comparing ongoing costs only and will not help you determine the relative total costs of owning different funds. In addition, if these transactional costs were included, your costs would have been higher.
| Share Class | Beginning
Account
Value
11/1/20 | Ending Account
Value (Based
on Actual
Returns and
Expenses)
4/30/21 | Expenses
Paid
During
Period1 | Ending Account
Value (Based
on Hypothetical
5% Annualized
Return and
Actual Expenses)
4/30/21 | Expenses
Paid
During
Period1 | Net Expense
Ratio
During
Period2, 3 |
| Class A Shares | $1,000.00 | $1,262.70 | $ 8.70 | $1,017.11 | $ 7.75 | 1.55% |
| Investor Class Shares | $1,000.00 | $1,261.40 | $10.43 | $1,015.57 | $ 9.30 | 1.86% |
| Class C Shares | $1,000.00 | $1,257.10 | $14.61 | $1,011.85 | $13.02 | 2.61% |
| Class I Shares | $1,000.00 | $1,264.00 | $ 7.30 | $1,018.35 | $ 6.51 | 1.30% |
| 1. | Expenses are equal to the Fund’s annualized expense ratio of each class multiplied by the average account value over the period, divided by 365 and multiplied by 181 (to reflect the six-month period). The table above represents the actual expenses incurred during the six-month period. In addition to the fees and expenses which the Fund bears directly, it also indirectly bears a pro rata share of the fees and expenses of the underlying funds in which it invests. Such indirect expenses are not included in the above-reported expense figures. |
| 2. | Expenses are equal to the Fund's annualized expense ratio to reflect the six-month period. |
| 3. | Expenses are inclusive of dividends and interest on investments sold short. |
Country Composition as of April 30, 2021 (Unaudited)
| Japan | 18.3% |
| France | 11.2 |
| United Kingdom | 10.9 |
| China | 9.6 |
| Netherlands | 5.2 |
| Taiwan | 4.8 |
| Canada | 4.0 |
| Germany | 4.0 |
| Australia | 3.6 |
| Republic of Korea | 3.1 |
| Switzerland | 3.0 |
| United States | 2.8 |
| Denmark | 2.5 |
| Sweden | 2.4 |
| Spain | 1.9 |
| Hong Kong | 1.9 |
| Brazil | 1.7 |
| Italy | 1.4 |
| Ireland | 1.2 |
| South Africa | 1.2 |
| Russia | 1.1% |
| Belgium | 0.6 |
| Thailand | 0.6 |
| Israel | 0.5 |
| Finland | 0.5 |
| Singapore | 0.5 |
| Austria | 0.4 |
| Luxembourg | 0.3 |
| Greece | 0.3 |
| Jersey, Channel Islands | 0.2 |
| Peru | 0.2 |
| United Arab Emirates | 0.2 |
| Macao | 0.2 |
| Cayman Islands | 0.1 |
| Norway | 0.0‡ |
| Other Assets, Less Liabilities | –0.4 |
| Investments Sold Short | –0.0‡ |
| | 100.0% |
| ‡ | Less than one–tenth of a percent. |
See Portfolio of Investments beginning on page 11 for specific holdings within these categories. The Fund's holdings are subject to change.
Top Ten Holdings as of April 30, 2021 (excluding short-term investments) (Unaudited)
| 1. | Tencent Holdings Ltd. |
| 2. | ASML Holding NV |
| 3. | Alibaba Group Holding Ltd., Sponsored |
| 4. | Taiwan Semiconductor Manufacturing Co. Ltd., Sponsored |
| 5. | Diageo plc |
| 6. | Samsung Electronics Co. Ltd. |
| 7. | Pernod Ricard SA |
| 8. | Carlsberg A/S, Class B |
| 9. | Coca-Cola European Partners plc |
| 10. | LVMH Moet Hennessy Louis Vuitton SE |
| 8 | MainStay WMC International Research Equity Fund |
Portfolio Management Discussion and Analysis (Unaudited)
Questions answered by portfolio managers Ping Wang, PhD, and Rui Tang, CFA, of MacKay Shields LLC (“MacKay Shields”), the Fund’s former Subadvisor, and portfolio managers Jonathan G. White and Mary L. Pryshlak of Wellington Management Company LLP (“Wellington”), the Fund’s current Subadvisor.
How did MainStay WMC International Research Equity Fund perform relative to its benchmarks and peer group during the six months ended April 30, 2021?
For the six months ended April 30, 2021, Class I shares of MainStay WMC International Research Equity Fund returned 26.40%, underperforming the 27.40% return of the Fund’s primary benchmark, the MSCI ACWI® (All Country World Index) ex USA Index (Net), and the 28.84% return of the Fund’s secondary benchmark, the MSCI EAFE® Index (Net). Over the same period, Class I shares underperformed the 27.60% return of the Morningstar Foreign Large Blend Category Average.1
Were there any changes to the Fund during the reporting period?
At meetings held on January 21, January 25, and February 3, 2021, the Board of Trustees of MainStay Funds Trust considered and approved, among other related proposals: (i) appointing Wellington Management Company LLP as the Fund’s subadvisor, and the related subadvisory agreement; (ii) changing the Fund’s name and adopting a non-fundamental “names rule” investment policy; (iii) modifying the Fund’s principal investment strategies, investment process and primary benchmark; (iv) reducing the Fund’s contractual management fee; and (v) establishing an expense cap for Class I shares of the Fund. These changes were effective on March 5, 2021. Also effective on this date, the MSCI ACWI® ex USA Index (Net) became the Fund’s primary benchmark and the MSCI EAFE® Index (Net) became the secondary benchmark of the Fund. For more information on these and other changes, refer to the supplement dated February 5, 2021.
In the process of implementing the new principal investment strategies and investment process, the Fund experienced a high level of portfolio turnover. Also, during this transition period, the Fund may not have been pursuing its investment objective or may not have been managed consistently with its investment strategies as stated in the Prospectus. This may have impacted the Fund’s performance.
What factors affected the Fund’s relative performance during the reporting period?
MacKay Shields
During the time MacKay Shields managed the Fund, the Fund’s performance relative to the MSCI ACWI® ex USA Index (Net) suffered primarily due to stock selection, particularly in the health care, consumer discretionary and consumer staples sectors.
Wellington
During the time Wellington managed the Fund, the Fund outperformed the MSCI ACWI® ex USA Index (Net) primarily due to positive security selection. Strong selection in the information technology, consumer discretionary and utilities sectors was partially offset by underperforming selection in financials and energy. Sector allocation, a result of our bottom-up stock selection
process, also made positive contributions to relative returns. (Contributions take weightings and total returns into account.) Positive allocation effect was driven by the Fund’s overweight exposure to information technology and underweight exposure to energy and consumer discretionary, but was partially offset by the Fund’s underweight exposure to materials.
During the reporting period, which sectors were the strongest positive contributors to the Fund’s relative performance and which sectors were particularly weak?
MacKay Shields
During the time MacKay Shields managed the Fund, the strongest positive contributions to performance relative to the MSCI ACWI® ex USA Index (Net) were the financials, information technology and energy sectors. During the same period, the health care, consumer discretionary and consumer staples sectors were the weakest contributors to relative performance.
Wellington
During the time Wellington managed the Fund, the information technology, consumer discretionary and consumer staples sectors provided the strongest positive contributions to relative performance. Over the same period, the financials, materials and industrials sectors detracted most significantly from the Fund’s relative performance.
During the reporting period, which individual stocks made the strongest positive contributions to the Fund’s absolute performance and which stocks detracted the most?
MacKay Shields
The individual stocks that made the strongest positive contributions to the Fund’s absolute performance during the time MacKay Shields managed the Fund included semiconductor equipment maker ASML Holding, diversified banking firm BNP Paribas, and diversified metals & mining company Rio Tinto. The stocks that detracted most significantly from the Fund’s absolute performance during the same period were interactive home entertainment provider Kahoot!, multisector holding company Aker ASA, and movies & entertainment firm Kinepolis Group.
Wellington
At the issuer level, the top two contributors to the Fund’s absolute returns during the time Wellington managed the Fund were ASML and China Longyuan Power. Shares of ASML, a semiconductor equipment maker, rose as the company benefited from worries over global chip shortages and the need to ramp up production capacity. News of semiconductor maker Intel’s plan to make major capital expenditures to revise manufacturing and create a new foundry business provided additional tailwinds. Shares rose further at the end of April 2021 after the company released strong first-quarter results and raised 2021 guidance significantly on the expectation of an increase in demand during the global
| 1. | See page 5 for other share class returns, which may be higher or lower than Class I share returns. See page 6 for more information on benchmark and peer group returns. |
semiconductor shortage. Shares of China Longyuan Power, a China-based wind power producer, rebounded after falling sharply in early March 2021 over Chinese domestic policy concerns. Both positions were still held by the Fund at the end of the reporting period.
The Fund’s most significant detractors during the same period were China-based online services provider Tencent and petrochemical company Royal Dutch Shell. Shares of Tencent declined over concern that Chinese regulators may target the company for increased oversight of the firm’s businesses, particularly in the areas of fintech and games. Similar to Ant Group, the government may require the company to establish a financial holding company to include its banking, insurance and payment services units, potentially hindering future growth. Shares came under pressure again in late March 2021 after U.S. regulators revived threats to remove China’s largest technology companies from U.S. stock exchanges. Shares of Royal Dutch Shell fell despite releasing strong first-quarter results at the end of April 2021 as profit surged more than expected. The company’s earnings and revenues benefited from rising oil prices and energy consumption, but share prices were undermined by the company’s cautious outlook and uncertainty regarding future share buybacks. Both positions were still held by the Fund at the end of the reporting period.
What were some of the Fund’s largest purchases and sales during the reporting period?
MacKay Shields
During the time MacKay Shields managed the Fund, the Fund’s largest initial purchase was in industrial conglomerate CK Hutchison Holdings, while the largest increased position size was in global chemical company BASF. During the same period, the Fund’s largest full sale was in tool and equipment maker Techtronic Industries, while the most significantly reduced position size was in packaged foods company Nestlé.
Wellington
During the time Wellington managed the Fund, the Fund initiated positions in LVMH Moet Hennessy, a luxury goods company, and Globalwafers, a Taiwan-based producer of silicon wafers used in circuits and chips in electronics. Globalwafers has historically generated strong profitability and free cash flow generation, and has established a solid track record of creating value through mergers and acquisitions. We believe attractive trends remain in place due to 5G equipment and handset demand, inventory restocking, memory market recovery and China localization. With LVMH, we see potential for a robust recovery in sales growth, mainly driven by the company’s two largest profit drivers: fashion & leather goods and wine & spirits. We hold a positive outlook on luxury spending, particularly driven by Chinese and U.S. markets, and expect to see this category benefit if high-end customer spending remains resilient. We believe the outlook is likely to remain positive whether or not travel retail fully recovers.
During the same period, we eliminated the Fund’s positions in Adidas, a Germany-based sports apparel company, and Nestlé, a Switzerland-based global food and beverage producer. Adidas began to face boycotts in China, with significant consumer backlash and drops in online and in-store traffic. We eliminated the position in favor of more attractive investment opportunities. While we continue to believe Nestlé is a best-in-class global food company that has made meaningful progress in improving its organic growth performance, we eliminated the position for opportunities where we see more upside potential.
How did the Fund’s sector and/or country weightings change during the reporting period?
MacKay Shields
The Fund’s largest increases in sector exposures relative to the MSCI ACWI® ex USA Index (Net) during the time MacKay Shields managed the Fund were in communication services and financials. Conversely, the Fund’s most significant decreases in benchmark-relative sector exposures were in consumer staples and health care.
Wellington
During the time Wellington managed the Fund, the largest increases in active weight were in the information technology, consumer staples and financials sectors. During the same period, the most significant decreases in sector exposure were in industrials, health care and materials.
How was the Fund positioned at the end of the reporting period?
MacKay Shields
At the end of the period when MacKay Shields managed the Fund, the Fund held its largest overweight exposures relative to the MSCI ACWI® ex USA Index (Net) in the communication services and financials sectors. As of the same date, the Fund’s most significantly underweight positions relative to the benchmark were in the consumer staples and utilities sectors.
Wellington
As of April 30, 2021, the Fund’s largest overweight exposures relative to its benchmark were in the information technology and consumer staples sectors. As of the same date, Fund’s most significantly underweight positions relative to the benchmark were in the materials and industrials sectors.
The opinions expressed are those of the portfolio managers as of the date of this report and are subject to change. There is no guarantee that any forecasts will come to pass. This material does not constitute investment advice and is not intended as an endorsement of any specific investment.
| 10 | MainStay WMC International Research Equity Fund |
Portfolio of Investments April 30, 2021† (Unaudited)
| | Shares | Value |
| Common Stocks 94.7% |
| Australia 3.6% |
| Australia & New Zealand Banking Group Ltd. (Banks) | 93,769 | $ 2,076,033 |
| BHP Group plc (Metals & Mining) | 61,662 | 1,860,283 |
| Brambles Ltd. (Commercial Services & Supplies) | 24,108 | 193,145 |
| Codan Ltd. (Electronic Equipment, Instruments & Components) | 1 | 14 |
| Commonwealth Bank of Australia (Banks) | 10,383 | 712,190 |
| Goodman Group (Equity Real Estate Investment Trusts) | 79,321 | 1,155,494 |
| Newcrest Mining Ltd. (Metals & Mining) | 48,099 | 982,647 |
| Orora Ltd. (Containers & Packaging) | 79,591 | 194,975 |
| Rio Tinto plc (Metals & Mining) | 18,673 | 1,566,900 |
| | | 8,741,681 |
| Austria 0.4% |
| BAWAG Group AG (Banks) (a) | 11,633 | 628,521 |
| Erste Group Bank AG (Banks) | 13,412 | 477,287 |
| OMV AG (Oil, Gas & Consumable Fuels) | 1 | 49 |
| | | 1,105,857 |
| Belgium 0.6% |
| KBC Group NV (Banks) | 6,286 | 488,356 |
| UCB SA (Pharmaceuticals) | 10,673 | 988,804 |
| | | 1,477,160 |
| Brazil 1.7% |
| Cia de Saneamento Basico do Estado de Sao Paulo (Water Utilities) | 95,600 | 752,896 |
| Petroleo Brasileiro SA (Oil, Gas & Consumable Fuels) | 69,800 | 296,827 |
| Rumo SA (Road & Rail) (b) | 73,700 | 271,353 |
| StoneCo Ltd., Class A (IT Services) (b) | 17,216 | 1,112,842 |
| Vale SA (Metals & Mining) | 37,200 | 746,596 |
| XP, Inc., Class A (Capital Markets) (b) | 22,037 | 872,665 |
| | | 4,053,179 |
| Canada 4.0% |
| Agnico Eagle Mines Ltd. (Metals & Mining) | 7,800 | 487,488 |
| Barrick Gold Corp. (Metals & Mining) | 35,039 | 746,590 |
| Boat Rocker Media, Inc. (Entertainment) (b) | 39,939 | 279,117 |
| Brookfield Asset Management, Inc., Class A (Capital Markets) | 26,500 | 1,207,870 |
| Canadian Natural Resources Ltd. (Oil, Gas & Consumable Fuels) | 25,715 | 780,561 |
| Constellation Software, Inc. (Software) | 572 | 839,481 |
| Intact Financial Corp. (Insurance) | 10,483 | 1,393,412 |
| | Shares | Value |
| |
| Canada (continued) |
| Magna International, Inc. (Auto Components) | 2,502 | $ 236,287 |
| Methanex Corp. (Chemicals) | 14,400 | 525,788 |
| Nuvei Corp. (IT Services) (a)(b) | 10,530 | 734,783 |
| Shopify, Inc., Class A (IT Services) (b) | 1,322 | 1,560,501 |
| TC Energy Corp. (Oil, Gas & Consumable Fuels) | 19,826 | 980,856 |
| | | 9,772,734 |
| Cayman Islands 0.1% |
| Patria Investments Ltd., Class A (Capital Markets) (b) | 15,000 | 207,750 |
| China 9.6% |
| Alibaba Group Holding Ltd., Sponsored ADR (Internet & Direct Marketing Retail) (b) | 21,534 | 4,973,277 |
| China Construction Bank Corp., Class H (Banks) | 1,140,000 | 902,578 |
| China Longyuan Power Group Corp. Ltd., Class H (Independent Power and Renewable Electricity Producers) | 1,684,000 | 2,480,121 |
| China Merchants Bank Co. Ltd., Class H (Banks) | 183,000 | 1,475,968 |
| China Yangtze Power Co. Ltd., Class A (Independent Power and Renewable Electricity Producers) | 179,400 | 553,599 |
| CIFI Holdings Group Co. Ltd. (Real Estate Management & Development) | 560,000 | 501,046 |
| ENN Energy Holdings Ltd. (Gas Utilities) | 55,500 | 945,988 |
| Meituan (Internet & Direct Marketing Retail) (b) | 13,600 | 521,747 |
| Minth Group Ltd. (Auto Components) | 160,000 | 649,866 |
| Ningbo Joyson Electronic Corp., Class A (Auto Components) | 225,140 | 630,733 |
| Niu Technologies, Sponsored ADR (Automobiles) (b)(c) | 22,280 | 832,381 |
| Ping An Insurance Group Co. of China Ltd., Class H (Insurance) | 150,255 | 1,643,225 |
| Precision Tsugami China Corp. Ltd. (Machinery) | 60,000 | 84,194 |
| Shandong Weigao Group Medical Polymer Co. Ltd., Class H (Health Care Equipment & Supplies) | 232,000 | 520,285 |
| Tencent Holdings Ltd. (Interactive Media & Services) | 68,600 | 5,501,954 |
| Zai Lab Ltd. ADR (Biotechnology) (b) | 6,336 | 1,053,107 |
| | | 23,270,069 |
The notes to the financial statements are an integral part of, and should be read in conjunction with, the financial statements.
11
Portfolio of Investments April 30, 2021† (Unaudited) (continued)
| | Shares | Value |
| Common Stocks (continued) |
| Denmark 2.5% |
| A.P. Moller - Maersk A/S, Class B (Marine) | 198 | $ 491,516 |
| Carlsberg A/S, Class B (Beverages) | 21,615 | 3,786,325 |
| Genmab A/S (Biotechnology) (b) | 4,276 | 1,577,533 |
| Novo Nordisk A/S, Class B (Pharmaceuticals) | 2,488 | 183,891 |
| | | 6,039,265 |
| Finland 0.5% |
| Cargotec Oyj, Class B (Machinery) | 10,272 | 595,494 |
| Kone Oyj, Class B (Machinery) | 7,359 | 578,086 |
| | | 1,173,580 |
| France 10.9% |
| Accor SA (Hotels, Restaurants & Leisure) | 21,972 | 884,138 |
| Airbus SE (Aerospace & Defense) | 6,524 | 783,877 |
| Arkema SA (Chemicals) | 3,264 | 408,111 |
| AXA SA (Insurance) | 69,466 | 1,964,702 |
| Bureau Veritas SA (Professional Services) | 31,602 | 944,898 |
| Capgemini SE (IT Services) | 3,967 | 726,845 |
| Cie de Saint-Gobain (Building Products) | 4,038 | 254,871 |
| Credit Agricole SA (Banks) | 83,134 | 1,286,529 |
| Edenred (IT Services) | 17,566 | 995,748 |
| Engie SA (Multi-Utilities) | 109,165 | 1,623,484 |
| Faurecia SE (Auto Components) | 23,311 | 1,258,352 |
| JCDecaux SA (Media) | 20,081 | 511,336 |
| Kering SA (Textiles, Apparel & Luxury Goods) | 2,009 | 1,609,811 |
| LVMH Moet Hennessy Louis Vuitton SE (Textiles, Apparel & Luxury Goods) | 4,058 | 3,055,061 |
| Pernod Ricard SA (Beverages) | 18,688 | 3,835,228 |
| Rothschild & Co. (Capital Markets) | 7,103 | 252,772 |
| Safran SA (Aerospace & Defense) | 2,787 | 416,086 |
| Sartorius Stedim Biotech (Life Sciences Tools & Services) | 544 | 249,837 |
| Schneider Electric SE (Electrical Equipment) (c) | 10,006 | 1,600,192 |
| TOTAL SE (Oil, Gas & Consumable Fuels) | 46,781 | 2,071,128 |
| Vinci SA (Construction & Engineering) | 8,764 | 963,038 |
| Worldline SA (IT Services) (a)(b) | 7,588 | 744,684 |
| | | 26,440,728 |
| Germany 2.7% |
| Brenntag SE (Trading Companies & Distributors) | 11,868 | 1,065,557 |
| Carl Zeiss Meditec AG (Health Care Equipment & Supplies) | 2,492 | 439,065 |
| Covestro AG (Chemicals) (a) | 71 | 4,645 |
| | Shares | Value |
| |
| Germany (continued) |
| Deutsche Telekom AG (Registered) (Diversified Telecommunication Services) | 53,320 | $ 1,025,664 |
| RWE AG (Multi-Utilities) | 26,034 | 987,182 |
| Siemens AG (Registered) (Industrial Conglomerates) | 6,247 | 1,042,601 |
| Siemens Healthineers AG (Health Care Equipment & Supplies) (a) | 14,637 | 835,521 |
| Talanx AG (Insurance) | 11,273 | 475,438 |
| United Internet AG (Registered) (Diversified Telecommunication Services) | 9,944 | 418,551 |
| Vonovia SE (Real Estate Management & Development) | 2,770 | 181,964 |
| | | 6,476,188 |
| Greece 0.3% |
| Hellenic Telecommunications Organization SA (Diversified Telecommunication Services) | 38,975 | 659,854 |
| Hong Kong 1.9% |
| AIA Group Ltd. (Insurance) | 156,205 | 1,988,822 |
| CK Asset Holdings Ltd. (Real Estate Management & Development) | 190,000 | 1,192,430 |
| HKBN Ltd. (Diversified Telecommunication Services) | 308,000 | 451,230 |
| Link REIT (Equity Real Estate Investment Trusts) | 112,600 | 1,064,719 |
| | | 4,697,201 |
| Ireland 1.2% |
| AerCap Holdings NV (Trading Companies & Distributors) (b) | 12,170 | 708,902 |
| AIB Group plc (Banks) (c) | 247,295 | 723,654 |
| Ryanair Holdings plc, Sponsored ADR (Airlines) (b) | 6,085 | 711,032 |
| Smurfit Kappa Group plc (Containers & Packaging) | 16,749 | 857,009 |
| | | 3,000,597 |
| Israel 0.5% |
| Wix.com Ltd. (IT Services) (b) | 3,926 | 1,247,997 |
| Italy 1.4% |
| Banca Generali SpA (Capital Markets) | 14,846 | 567,942 |
| Davide Campari-Milano NV (Beverages) | 32,047 | 378,042 |
| DiaSorin SpA (Health Care Equipment & Supplies) | 2,955 | 501,812 |
The notes to the financial statements are an integral part of, and should be read in conjunction with, the financial statements.
| 12 | MainStay WMC International Research Equity Fund |
| | Shares | Value |
| Common Stocks (continued) |
| Italy (continued) |
| Ferrari NV (Automobiles) | 7,825 | $ 1,675,965 |
| Nexi SpA (IT Services) (a)(b) | 18,166 | 348,131 |
| | | 3,471,892 |
| Japan 18.3% |
| Advantest Corp. (Semiconductors & Semiconductor Equipment) | 14,600 | 1,386,659 |
| Amada Co. Ltd. (Machinery) | 66,000 | 714,411 |
| Asahi Group Holdings Ltd. (Beverages) | 51,900 | 2,167,842 |
| Astellas Pharma, Inc. (Pharmaceuticals) | 92,800 | 1,392,977 |
| Chugai Pharmaceutical Co. Ltd. (Pharmaceuticals) | 25,900 | 971,872 |
| Daiichi Sankyo Co. Ltd. (Pharmaceuticals) | 55,600 | 1,417,853 |
| East Japan Railway Co. (Road & Rail) | 17,600 | 1,204,414 |
| FANUC Corp. (Machinery) | 3,900 | 898,367 |
| GMO Payment Gateway, Inc. (IT Services) | 7,300 | 931,787 |
| Hino Motors Ltd. (Machinery) | 99,500 | 833,036 |
| Hoya Corp. (Health Care Equipment & Supplies) | 14,200 | 1,615,674 |
| Isuzu Motors Ltd. (Automobiles) | 116,900 | 1,183,012 |
| KDDI Corp. (Wireless Telecommunication Services) | 44,126 | 1,334,802 |
| Keyence Corp. (Electronic Equipment, Instruments & Components) | 2,500 | 1,201,391 |
| MINEBEA MITSUMI, Inc. (Machinery) | 28,000 | 702,242 |
| Mitsubishi UFJ Financial Group, Inc. (Banks) | 311,200 | 1,645,838 |
| Mitsui Fudosan Co. Ltd. (Real Estate Management & Development) | 49,600 | 1,075,597 |
| Musashi Seimitsu Industry Co. Ltd. (Auto Components) | 23,800 | 415,721 |
| Nexon Co. Ltd. (Entertainment) | 48,300 | 1,602,045 |
| Nippon Thompson Co. Ltd. (Machinery) | 77,900 | 461,170 |
| Nomura Holdings, Inc. (Capital Markets) | 68,600 | 368,390 |
| Ono Pharmaceutical Co. Ltd. (Pharmaceuticals) | 46,800 | 1,178,029 |
| ORIX Corp. (Diversified Financial Services) | 46,700 | 750,986 |
| Resona Holdings, Inc. (Banks) | 230,400 | 946,561 |
| Seino Holdings Co. Ltd. (Road & Rail) | 13,500 | 185,534 |
| Seven & i Holdings Co. Ltd. (Food & Staples Retailing) | 34,300 | 1,474,753 |
| Shin-Etsu Chemical Co. Ltd. (Chemicals) | 7,400 | 1,249,245 |
| Shinsei Bank Ltd. (Banks) | 67,600 | 984,094 |
| SMC Corp. (Machinery) | 1,800 | 1,045,018 |
| SoftBank Corp. (Wireless Telecommunication Services) | 83,300 | 1,074,310 |
| Sony Group Corp. (Household Durables) | 20,477 | 2,042,266 |
| | Shares | Value |
| |
| Japan (continued) |
| SUMCO Corp. (Semiconductors & Semiconductor Equipment) | 34,500 | $ 893,989 |
| Taiyo Yuden Co. Ltd. (Electronic Equipment, Instruments & Components) | 24,000 | 1,102,388 |
| THK Co. Ltd. (Machinery) | 18,500 | 630,547 |
| Tokio Marine Holdings, Inc. (Insurance) | 20,700 | 990,585 |
| Tokyo Electron Ltd. (Semiconductors & Semiconductor Equipment) | 6,300 | 2,785,397 |
| Tokyo Ohka Kogyo Co. Ltd. (Chemicals) | 9,700 | 644,359 |
| Toyota Motor Corp. (Automobiles) | 2,466 | 183,376 |
| Yamaha Motor Co. Ltd. (Automobiles) | 85,000 | 2,122,472 |
| Z Holdings Corp. (Interactive Media & Services) | 136,300 | 629,806 |
| | | 44,438,815 |
| Jersey, Channel Islands 0.2% |
| Sanne Group plc (Capital Markets) | 68,039 | 607,015 |
| Luxembourg 0.3% |
| Arrival Group (Automobiles) (b)(c) | 24,965 | 464,349 |
| Eurofins Scientific SE (Life Sciences Tools & Services) | 2,380 | 235,632 |
| | | 699,981 |
| Macao 0.2% |
| Sands China Ltd. (Hotels, Restaurants & Leisure) | 88,400 | 419,936 |
| Netherlands 5.2% |
| Adyen NV (IT Services) (a)(b) | 321 | 787,860 |
| Akzo Nobel NV (Chemicals) | 4,508 | 541,541 |
| ASML Holding NV (Semiconductors & Semiconductor Equipment) | 7,721 | 5,023,728 |
| IMCD NV (Trading Companies & Distributors) | 5,652 | 821,869 |
| Koninklijke KPN NV (Diversified Telecommunication Services) | 254,236 | 876,008 |
| Koninklijke Philips NV (Health Care Equipment & Supplies) | 20,913 | 1,178,688 |
| Royal Dutch Shell plc | | |
| Class A (Oil, Gas & Consumable Fuels) | 80,707 | 1,521,435 |
| Class B (Oil, Gas & Consumable Fuels) | 70,624 | 1,266,983 |
| |
| Wolters Kluwer NV (Professional Services) | 7,546 | 682,772 |
| | | 12,700,884 |
| Norway 0.0% ‡ |
| Norsk Hydro ASA (Metals & Mining) | 17,786 | 113,588 |
The notes to the financial statements are an integral part of, and should be read in conjunction with, the financial statements.
13
Portfolio of Investments April 30, 2021† (Unaudited) (continued)
| | Shares | Value |
| Common Stocks (continued) |
| Peru 0.2% |
| Credicorp Ltd. (Banks) (b) | 4,294 | $ 512,704 |
| Republic of Korea 1.4% |
| Koh Young Technology, Inc. (Semiconductors & Semiconductor Equipment) | 16,195 | 404,748 |
| LG Chem Ltd. (Chemicals) | 911 | 763,296 |
| Shinhan Financial Group Co. Ltd. (Banks) | 8,017 | 288,290 |
| Shinhan Financial Group Co. Ltd. ADR (Banks) (c) | 21,691 | 775,236 |
| SK Hynix, Inc. (Semiconductors & Semiconductor Equipment) | 10,647 | 1,225,168 |
| | | 3,456,738 |
| Russia 1.1% |
| LUKOIL PJSC, Sponsored ADR (Oil, Gas & Consumable Fuels) | 13,471 | 1,040,500 |
| Mobile TeleSystems PJSC, Sponsored ADR (Wireless Telecommunication Services) | 67,200 | 569,184 |
| Sberbank of Russia PJSC (Banks) | 301,257 | 1,192,570 |
| | | 2,802,254 |
| Singapore 0.5% |
| Best World International Ltd. (Personal Products) (c)(d)(e)(f) | 618,500 | 355,553 |
| United Overseas Bank Ltd. (Banks) | 38,700 | 773,273 |
| | | 1,128,826 |
| South Africa 1.2% |
| Anglo American plc (Metals & Mining) | 33,246 | 1,409,572 |
| FirstRand Ltd. (Diversified Financial Services) | 275,411 | 969,279 |
| Old Mutual Ltd. (Insurance) (c) | 630,062 | 549,580 |
| | | 2,928,431 |
| Spain 1.9% |
| Bankinter SA (Banks) | 91,442 | 500,979 |
| Cellnex Telecom SA (Diversified Telecommunication Services) | 34,157 | 1,931,709 |
| Grifols SA (Biotechnology) | 21,616 | 586,026 |
| Iberdrola SA (Electric Utilities) | 115,841 | 1,564,697 |
| Linea Directa Aseguradora SA Cia de Seguros y Reaseguros (Insurance) (b)(e) | 91,442 | 179,196 |
| | | 4,762,607 |
| Sweden 2.4% |
| Alfa Laval AB (Machinery) (c) | 17,976 | 608,150 |
| Assa Abloy AB, Class B (Building Products) | 27,782 | 791,891 |
| | Shares | Value |
| |
| Sweden (continued) |
| Fastighets AB Balder, Class B (Real Estate Management & Development) (b) | 9,912 | $ 571,030 |
| Lundin Energy AB (Oil, Gas & Consumable Fuels) | 5,595 | 179,240 |
| Sandvik AB (Machinery) (c) | 25,513 | 630,777 |
| Svenska Handelsbanken AB, Class A (Banks) | 87,054 | 1,009,617 |
| Swedish Match AB (Tobacco) | 13,112 | 1,075,532 |
| Volvo AB, Class B (Machinery) | 40,351 | 985,950 |
| | | 5,852,187 |
| Switzerland 3.0% |
| Alcon, Inc. (Health Care Equipment & Supplies) (b) | 13,576 | 1,018,293 |
| Coca-Cola HBC AG (Beverages) | 85,533 | 2,955,497 |
| Novartis AG (Registered) (Pharmaceuticals) | 31,747 | 2,710,097 |
| Roche Holding AG (Pharmaceuticals) | 526 | 171,407 |
| Tecan Group AG (Registered) (Life Sciences Tools & Services) | 967 | 470,979 |
| UBS Group AG (Registered) (Capital Markets) | 1,446 | 22,048 |
| | | 7,348,321 |
| Taiwan 4.8% |
| Formosa Sumco Technology Corp. (Semiconductors & Semiconductor Equipment) | 178,000 | 1,233,461 |
| Globalwafers Co. Ltd. (Semiconductors & Semiconductor Equipment) | 78,000 | 2,438,472 |
| MediaTek, Inc. (Semiconductors & Semiconductor Equipment) | 42,000 | 1,801,575 |
| Sino-American Silicon Products, Inc. (Semiconductors & Semiconductor Equipment) | 181,000 | 1,275,212 |
| Taiwan Semiconductor Manufacturing Co. Ltd., Sponsored ADR (Semiconductors & Semiconductor Equipment) | 42,124 | 4,917,555 |
| | | 11,666,275 |
| Thailand 0.6% |
| Kasikornbank PCL NVDR (Banks) (c) | 303,000 | 1,284,496 |
| PTT Global Chemical PCL (Chemicals) | 45,700 | 99,436 |
| | | 1,383,932 |
| United Arab Emirates 0.2% |
| Network International Holdings plc (IT Services) (a)(b) | 81,306 | 471,496 |
The notes to the financial statements are an integral part of, and should be read in conjunction with, the financial statements.
| 14 | MainStay WMC International Research Equity Fund |
| | Shares | Value |
| Common Stocks (continued) |
| United Kingdom 10.9% |
| Abcam plc (Biotechnology) | 38,427 | $ 810,904 |
| Allfunds Group plc (Capital Markets) (b) | 19,107 | 321,140 |
| AstraZeneca plc (Pharmaceuticals) | 28,056 | 2,989,311 |
| BAE Systems plc (Aerospace & Defense) | 27,357 | 191,249 |
| Beazley plc (Insurance) | 137,804 | 644,784 |
| Coca-Cola European Partners plc (Beverages) | 55,790 | 3,169,988 |
| Compass Group plc (Hotels, Restaurants & Leisure) | 82,965 | 1,801,752 |
| ConvaTec Group plc (Health Care Equipment & Supplies) (a) | 134,958 | 406,689 |
| Croda International plc (Chemicals) | 7,150 | 667,912 |
| Diageo plc (Beverages) | 99,040 | 4,446,691 |
| easyJet plc (Airlines) | 15,809 | 226,190 |
| Experian plc (Professional Services) | 27,084 | 1,044,330 |
| HSBC Holdings plc (Banks) | 180,220 | 1,126,987 |
| Hyve Group plc (Media) | 140,612 | 232,836 |
| Intermediate Capital Group plc (Capital Markets) | 56,367 | 1,701,706 |
| Lancashire Holdings Ltd. (Insurance) | 77,930 | 765,215 |
| Ninety One plc (Capital Markets) | 150,537 | 508,105 |
| Prudential plc (Insurance) | 62,539 | 1,325,340 |
| Rolls-Royce Holdings plc (Aerospace & Defense) | 121,579 | 175,664 |
| Smith & Nephew plc (Health Care Equipment & Supplies) | 42,107 | 913,275 |
| Standard Chartered plc (Banks) | 277,702 | 1,992,772 |
| Trainline plc (Hotels, Restaurants & Leisure) (a)(b) | 46,698 | 295,117 |
| WPP plc (Media) | 51,385 | 692,337 |
| | | 26,450,294 |
| United States 0.4% |
| Ardagh Group SA (Containers & Packaging) | 5,100 | 136,986 |
| Atlassian Corp. plc, Class A (Software) (b) | 3,435 | 816,019 |
| | | 953,005 |
Total Common Stocks
(Cost $217,238,056) | | 230,533,021 |
| Preferred Stocks 3.3% |
| France 0.3% |
| Criteo SA, Sponsored ADR (Media) (b) | 18,100 | 719,113 |
| | Shares | Value |
| |
| Germany 1.3% |
| Sartorius AG., 0.28% (Health Care Equipment & Supplies) | 401 | $ 226,203 |
| Volkswagen AG, 2.91% (Automobiles) | 11,705 | 3,049,475 |
| | | 3,275,678 |
| Republic of Korea 1.7% |
| Samsung Electronics Co. Ltd. GDR (Technology Hardware, Storage & Peripherals) (a) | 2,479 | 4,083,937 |
Total Preferred Stocks
(Cost $6,726,330) | | 8,078,728 |
| Exchange-Traded Fund 0.3% |
| United States 0.3% |
| iShares MSCI ACWI ex US ETF | 13,318 | 753,666 |
Total Exchange-Traded Fund
(Cost $722,069) | | 753,666 |
| |
| Short-Term Investments 2.1% |
| Affiliated Investment Company 0.4% |
| United States 0.4% |
| MainStay U.S. Government Liquidity Fund, 0.01% (g) | 993,162 | 993,162 |
| Unaffiliated Investment Company 1.7% |
| United States 1.7% |
| BlackRock Liquidity FedFund, 0.05% (g)(h) | 3,969,104 | 3,969,104 |
Total Short-Term Investments
(Cost $4,962,266) | | 4,962,266 |
Total Investments, Before Investments Sold Short
(Cost $229,648,721) | 100.4% | 244,327,681 |
| Investments Sold Short (0.0)% ‡ |
| Common Stock Sold Short (0.0)% ‡ |
| Australia (0.0)% ‡ |
| Virgin Australia Airlines Holdings Pty Ltd (Airlines) (b)(d)(e)(f) | (444,108) | (34) |
Total Common Stock Sold Short
(Proceeds $0) | | (34) |
| |
The notes to the financial statements are an integral part of, and should be read in conjunction with, the financial statements.
15
Portfolio of Investments April 30, 2021† (Unaudited) (continued)
| | Number of
Rights | | Value |
| Right Sold Short (0.0)% ‡ |
| United States (0.0)% ‡ |
Intercell (Biotechnology)
Expires 12/31/49 (b)(d)(e)(f) | (19,159) | | $ (2) |
Total Right Sold Short
(Proceeds $0) | | | (2) |
| |
| | Number of
Warrants | | |
| Warrant Sold Short (0.0)% ‡ |
| Singapore (0.0)% ‡ |
| Ezion Holdings Ltd. (Energy Equipment & Services) | | | |
| Expires 4/16/23 (b)(d)(e)(f) | (2,005,620) | | — |
Total Warrant Sold Short
(Proceeds $0) | | | — |
Total Investments Sold Short
(Proceeds $0) | | | (36) |
Total Investments, Net of Investments Sold Short
(Cost $229,648,721) | 100.4% | | 244,327,645 |
| Other Assets, Less Liabilities | (0.4) | | (963,025) |
| Net Assets | 100.0% | | $ 243,364,620 |
| † | Percentages indicated are based on Fund net assets. |
| ‡ | Less than one-tenth of a percent. |
| (a) | May be sold to institutional investors only under Rule 144A or securities offered pursuant to Section 4(a)(2) of the Securities Act of 1933, as amended. |
| (b) | Non-income producing security. |
| (c) | All or a portion of this security was held on loan. As of April 30, 2021, the aggregate market value of securities on loan was $6,539,185; the total market value of collateral held by the Fund was $7,259,197. The market value of the collateral held included non-cash collateral in the form of U.S. Treasury securities with a value of $3,290,093. The Fund received cash collateral with a value of $3,969,104. (See Note 2(K)) |
| (d) | Fair valued security—Represents fair value as measured in good faith under procedures approved by the Board of Trustees. As of April 30, 2021, the total market value was $355,517, which represented 0.1% of the Fund’s net assets. |
| (e) | Illiquid security—As of April 30, 2021, the total market value deemed illiquid under procedures approved by the Board of Trustees was $534,713, which represented 0.2% of the Fund’s net assets. |
| (f) | Security in which significant unobservable inputs (Level 3) were used in determining fair value. |
| (g) | Current yield as of April 30, 2021. |
| (h) | Represents a security purchased with cash collateral received for securities on loan. |
Swap Contracts
Open OTC total return equity swap contracts as of April 30, 2021 were as follows1:
Swap
Counterparty | Reference Obligation | Floating Rate | Termination
Date(s) | Payment
Frequency
Paid/
Received | Notional
Amount
Long/
(Short)
(000)2 | Unrealized
Depreciation |
| |
| Belgium |
| Citibank NA | Xior Student Housing NV | 1 month LIBOR BBA minus 0.40% | 12/31/49 | Monthly | (7) | $ (7,355) |
| 1. | Fund pays or receives the floating rate and receives or pays the total return of the referenced entity. |
| 2. | Notional amounts reflected as a positive value indicate a long position held by the Fund or Index and a negative value indicates a short position. |
| Abbreviation(s): |
| ADR—American Depositary Receipt |
| BBA—British Bankers’ Association |
| ETF—Exchange-Traded Fund |
| GDR—Global Depositary Receipt |
| LIBOR—London Interbank Offered Rate |
| MSCI—Morgan Stanley Capital International |
The notes to the financial statements are an integral part of, and should be read in conjunction with, the financial statements.
| 16 | MainStay WMC International Research Equity Fund |
| NVDR—Non-Voting Depositary Receipt |
| PCL—Provision for Credit Losses |
| REIT—Real Estate Investment Trust |
The following is a summary of the fair valuations according to the inputs used as of April 30, 2021, for valuing the Fund’s assets and liabilities:
| Description | Quoted
Prices in
Active
Markets for
Identical
Assets
(Level 1) | | Significant
Other
Observable
Inputs
(Level 2) | | Significant
Unobservable
Inputs
(Level 3) | | Total |
| Asset Valuation Inputs | | | | | | | |
| Investments in Securities (a) | | | | | | | |
| Common Stocks | $ 216,729,629 | | $ 13,447,839 | | $ 355,553 | | $ 230,533,021 |
| Preferred Stocks | 8,078,728 | | — | | — | | 8,078,728 |
| Exchange-Traded Fund | 753,666 | | — | | — | | 753,666 |
| Short-Term Investments | | | | | | | |
| Affiliated Investment Company | 993,162 | | — | | — | | 993,162 |
| Unaffiliated Investment Company | 3,969,104 | | — | | — | | 3,969,104 |
| Total Short-Term Investments | 4,962,266 | | — | | — | | 4,962,266 |
| Total Investments in Securities | $ 230,524,289 | | $ 13,447,839 | | $ 355,553 | | $ 244,327,681 |
| Liability Valuation Inputs | | | | | | | |
| Common Stock Sold Short | $ — | | $ — | | $ (34) | | $ (34) |
| Right Sold Short | — | | — | | (2) | | (2) |
| Warrant Sold Short | — | | — | | — | | — |
| Total Investments in Securities Sold Short | — | | — | | (36) | | (36) |
| Other Financial Instruments | | | | | | | |
| Total Return Equity Swap Contract (b) | — | | (7,355) | | — | | (7,355) |
| Total Investments in Securities Sold Short and Other Financial Instruments | $ — | | $ (7,355) | | $ (36) | | $ (7,391) |
| (a) | For a complete listing of investments and their industries, see the Portfolio of Investments. |
| (b) | The value listed for these securities reflects unrealized appreciation (depreciation) as shown on the Portfolio of Investments. |
The notes to the financial statements are an integral part of, and should be read in conjunction with, the financial statements.
17
Portfolio of Investments April 30, 2021† (Unaudited) (continued)
The table below sets forth the diversification of the Fund’s investments by industry.
Industry Diversification
| | Value | Percent |
| Aerospace & Defense | $ 1,566,876 | 0.7% |
| Airlines | 937,222 | 0.4 |
| Auto Components | 3,190,959 | 1.4 |
| Automobiles | 9,511,030 | 3.9 |
| Banks | 21,804,533 | 8.8 |
| Beverages | 20,739,613 | 8.6 |
| Biotechnology | 4,027,570 | 1.5 |
| Building Products | 1,046,762 | 0.4 |
| Capital Markets | 6,637,403 | 2.6 |
| Chemicals | 4,904,333 | 2.1 |
| Commercial Services & Supplies | 193,145 | 0.1 |
| Construction & Engineering | 963,038 | 0.4 |
| Containers & Packaging | 1,188,970 | 0.5 |
| Diversified Financial Services | 1,720,265 | 0.7 |
| Diversified Telecommunication Services | 5,363,016 | 2.3 |
| Electric Utilities | 1,564,697 | 0.6 |
| Electrical Equipment | 1,600,192 | 0.7 |
| Electronic Equipment, Instruments & Components | 2,303,793 | 0.9 |
| Entertainment | 1,881,162 | 0.7 |
| Equity Real Estate Investment Trusts | 2,220,213 | 0.9 |
| Food & Staples Retailing | 1,474,753 | 0.6 |
| Gas Utilities | 945,988 | 0.4 |
| Health Care Equipment & Supplies | 7,655,505 | 3.3 |
| Hotels, Restaurants & Leisure | 3,400,943 | 1.4 |
| Household Durables | 2,042,266 | 0.8 |
| Independent Power and Renewable Electricity Producers | 3,033,720 | 1.2 |
| Industrial Conglomerates | 1,042,601 | 0.4 |
| Insurance | 11,920,299 | 5.0 |
| Interactive Media & Services | 6,131,760 | 2.6 |
| Internet & Direct Marketing Retail | 5,495,024 | 2.3 |
| IT Services | 9,662,674 | 3.9 |
| Life Sciences Tools & Services | 956,448 | 0.4 |
| Machinery | 8,767,442 | 3.7 |
| Marine | 491,516 | 0.2 |
| Media | 2,155,622 | 0.9 |
| Metals & Mining | 7,913,664 | 3.2 |
| Multi-Utilities | 2,610,666 | 1.1 |
| Oil, Gas & Consumable Fuels | 8,137,579 | 3.2 |
| Personal Products | 355,553 | 0.2 |
| Pharmaceuticals | 12,004,241 | 5.0 |
| Professional Services | 2,672,000 | 1.1 |
| Real Estate Management & Development | 3,522,067 | 1.4 |
| Road & Rail | 1,661,301 | 0.7 |
| | Value | | Percent |
| Semiconductors & Semiconductor Equipment | $ 23,385,964 | | 9.7% |
| Software | 1,655,500 | | 0.7 |
| Technology Hardware, Storage & Peripherals | 4,083,937 | | 1.7 |
| Textiles, Apparel & Luxury Goods | 4,664,872 | | 1.9 |
| Tobacco | 1,075,532 | | 0.4 |
| Trading Companies & Distributors | 2,596,328 | | 1.0 |
| Unknown GICS Industry | 753,666 | | 0.3 |
| Water Utilities | 752,896 | | 0.3 |
| Wireless Telecommunication Services | 2,978,296 | | 1.1 |
| | 239,365,415 | | 98.3 |
| Short-Term Investments | 4,962,266 | | 2.1 |
| Other Assets, Less Liabilities* | (963,061) | | (0.4) |
| Net Assets | $243,364,620 | | 100.0% |
| † | Percentages indicated are based on Fund net assets. |
| * | Includes Investments sold short (details are shown below). |
The table below sets forth the diversification of MainStay WMC International Research Equity Fund investments sold short by industry.
| | Value | | Percent |
| Airlines | $(34) | | (0.0)%‡ |
| Biotechnology | (2) | | (0.0)‡ |
| Energy Equipment & Services | — | | (0.0)‡ |
| | $(36) | | (0.0)%‡ |
| † | Percentages indicated are based on Fund net assets. |
| ‡ | Less than one-tenth of a percent. |
The notes to the financial statements are an integral part of, and should be read in conjunction with, the financial statements.
| 18 | MainStay WMC International Research Equity Fund |
Statement of Assets and Liabilities as of April 30, 2021 (Unaudited)
| Assets |
Investment in unaffiliated securities before investments sold short, at value
(identified cost $228,655,559) including securities on loan of $6,539,185 | $243,334,519 |
Investment in affiliated investment companies, at value
(identified cost $993,162) | 993,162 |
| Cash collateral on deposit at broker for swap contracts | 733,361 |
Cash denominated in foreign currencies
(identified cost $281,675) | 281,401 |
| Receivables: | |
| Dividends and interest | 2,447,380 |
| Investment securities sold | 1,917,360 |
| Securities lending | 17,550 |
| Fund shares sold | 12,496 |
| Other assets | 36,781 |
| Total assets | 249,774,010 |
| Liabilities |
| Investments sold short (proceeds $0) | 36 |
| Cash collateral received for securities on loan | 3,969,104 |
| Due to custodian | 44,375 |
| Payables: | |
| Investment securities purchased | 1,740,847 |
| Fund shares redeemed | 203,605 |
| Manager (See Note 3) | 141,158 |
| Broker fees and charges on short sales | 92,514 |
| Custodian | 91,162 |
| Professional fees | 55,948 |
| Transfer agent (See Note 3) | 28,903 |
| Shareholder communication | 23,812 |
| NYLIFE Distributors (See Note 3) | 8,723 |
| Unrealized depreciation on OTC swap contracts | 7,355 |
| Accrued expenses | 1,848 |
| Total liabilities | 6,409,390 |
| Net assets | $243,364,620 |
| Composition of Net Assets |
| Shares of beneficial interest outstanding (par value of $.001 per share) unlimited number of shares authorized | $ 30,537 |
| Additional paid-in-capital | 320,814,381 |
| | 320,844,918 |
| Total distributable earnings (loss) | (77,480,298) |
| Net assets | $243,364,620 |
| Class A | |
| Net assets applicable to outstanding shares | $ 14,504,929 |
| Shares of beneficial interest outstanding | 1,828,988 |
| Net asset value per share outstanding | $ 7.93 |
| Maximum sales charge (5.50% of offering price) | 0.46 |
| Maximum offering price per share outstanding | $ 8.39 |
| Investor Class | |
| Net assets applicable to outstanding shares | $ 2,735,605 |
| Shares of beneficial interest outstanding | 346,642 |
| Net asset value per share outstanding | $ 7.89 |
| Maximum sales charge (5.00% of offering price) | 0.42 |
| Maximum offering price per share outstanding | $ 8.31 |
| Class C | |
| Net assets applicable to outstanding shares | $ 6,243,845 |
| Shares of beneficial interest outstanding | 812,020 |
| Net asset value and offering price per share outstanding | $ 7.69 |
| Class I | |
| Net assets applicable to outstanding shares | $219,880,241 |
| Shares of beneficial interest outstanding | 27,549,366 |
| Net asset value and offering price per share outstanding | $ 7.98 |
The notes to the financial statements are an integral part of, and should be read in conjunction with, the financial statements.
19
Statement of Operations for the six months ended April 30, 2021 (Unaudited)
| Investment Income (Loss) |
| Income | |
| Dividends-unaffiliated (net of foreign tax withholding of $276,210) | $ 2,576,081 |
| Securities lending | 39,564 |
| Dividends-affiliated | 373 |
| Interest | 280 |
| Total income | 2,616,298 |
| Expenses | |
| Manager (See Note 3) | 1,246,800 |
| Custodian | 124,946 |
| Broker fees and charges on short sales | 84,125 |
| Transfer agent (See Note 3) | 80,189 |
| Professional fees | 54,139 |
| Distribution/Service—Class A (See Note 3) | 16,935 |
| Distribution/Service—Investor Class (See Note 3) | 3,701 |
| Distribution/Service—Class C (See Note 3) | 32,800 |
| Registration | 30,939 |
| Shareholder communication | 16,028 |
| Dividends on investments sold short | 4,680 |
| Trustees | 2,948 |
| Insurance | 1,318 |
| Miscellaneous | 13,170 |
| Total expenses before waiver/reimbursement | 1,712,718 |
| Expense waiver/reimbursement from Manager (See Note 3) | (19,422) |
| Net expenses | 1,693,296 |
| Net investment income (loss) | 923,002 |
| Realized and Unrealized Gain (Loss) |
| Net realized gain (loss) on: | |
| Unaffiliated investment transactions | 56,815,786 |
| Investments sold short | 294,283 |
| Swap transactions | (7,912,467) |
| Foreign currency transactions | 504,995 |
| Net realized gain (loss) | 49,702,597 |
| Net change in unrealized appreciation (depreciation) on: | |
| Unaffiliated investments | 11,345,387 |
| Investments sold short | (286,961) |
| Swap contracts | (726,892) |
| Translation of other assets and liabilities in foreign currencies | 26,862 |
| Net change in unrealized appreciation (depreciation) | 10,358,396 |
| Net realized and unrealized gain (loss) | 60,060,993 |
| Net increase (decrease) in net assets resulting from operations | $60,983,995 |
The notes to the financial statements are an integral part of, and should be read in conjunction with, the financial statements.
| 20 | MainStay WMC International Research Equity Fund |
Statements of Changes in Net Assets
for the six months ended April 30, 2021 (Unaudited) and the year ended October 31, 2020
| | 2021 | 2020 |
| Increase (Decrease) in Net Assets |
| Operations: | | |
| Net investment income (loss) | $ 923,002 | $ 3,119,928 |
| Net realized gain (loss) | 49,702,597 | (12,440,054) |
| Net change in unrealized appreciation (depreciation) | 10,358,396 | (18,021,169) |
| Net increase (decrease) in net assets resulting from operations | 60,983,995 | (27,341,295) |
| Distributions to shareholders: | | |
| Class A | (251,503) | (1,739,689) |
| Investor Class | (51,029) | (339,120) |
| Class C | (47,871) | (1,169,574) |
| Class I | (5,460,954) | (26,566,143) |
| Total distributions to shareholders | (5,811,357) | (29,814,526) |
| Capital share transactions: | | |
| Net proceeds from sales of shares | 9,074,102 | 20,103,256 |
| Net asset value of shares issued to shareholder in reinvestment of distributions | 5,762,226 | 29,446,340 |
| Cost of shares redeemed | (78,076,963) | (59,690,310) |
| Increase (decrease) in net assets derived from capital share transactions | (63,240,635) | (10,140,714) |
| Net increase (decrease) in net assets | (8,067,997) | (67,296,535) |
| Net Assets |
| Beginning of period | 251,432,617 | 318,729,152 |
| End of period | $243,364,620 | $251,432,617 |
The notes to the financial statements are an integral part of, and should be read in conjunction with, the financial statements.
21
Financial Highlights selected per share data and ratios
| | Six months ended
April 30,
2021* | | Year Ended October 31, |
| Class A | 2020 | | 2019 | | 2018 | | 2017 | | 2016 |
| Net asset value at beginning of period | $ 6.40 | | $ 7.77 | | $ 7.93 | | $ 9.58 | | $ 8.06 | | $ 8.36 |
| Net investment income (loss) | 0.02(a) | | 0.06(a) | | 0.15(a) | | 0.13 | | 0.02 | | 0.11 |
| Net realized and unrealized gain (loss) on investments | 1.64 | | (0.70) | | 0.10 | | (1.63) | | 1.73 | | (0.35) |
| Net realized and unrealized gain (loss) on foreign currency transactions | 0.01 | | 0.00‡ | | (0.00)‡ | | (0.00)‡ | | 0.00‡ | | (0.00)‡ |
| Total from investment operations | 1.67 | | (0.64) | | 0.25 | | (1.50) | | 1.75 | | (0.24) |
| Less distributions: | | | | | | | | | | | |
| From net investment income | (0.14) | | (0.73) | | (0.41) | | (0.15) | | (0.23) | | (0.06) |
| Net asset value at end of period | $ 7.93 | | $ 6.40 | | $ 7.77 | | $ 7.93 | | $ 9.58 | | $ 8.06 |
| Total investment return (b) | 26.27% | | (9.21)% | | 3.83% | | (15.94)% (c) | | 22.36% | | (2.85)% |
| Ratios (to average net assets)/Supplemental Data: | | | | | | | | | | | |
| Net investment income (loss) | 0.67%†† | | 0.89% | | 2.04% | | 1.37% | | 0.24% | | 1.37% (d) |
| Net expenses (e)(f) | 1.55%†† | | 1.63% | | 1.75% | | 1.78% | | 3.22% | | 3.33% |
| Expenses (before waiver/reimbursement) (e)(f) | 1.55%†† | | 1.63% | | 1.75% | | 1.78% | | 3.22% | | 3.33% |
| Portfolio turnover rate | 88% | | 136% | | 182% | | 223% | | 179% | | 137% |
| Net assets at end of period (in 000’s) | $ 14,505 | | $ 12,373 | | $ 19,557 | | $ 31,870 | | $ 55,580 | | $ 98,856 |
| * | Unaudited. |
| ‡ | Less than one cent per share. |
| †† | Annualized. |
| (a) | Per share data based on average shares outstanding during the period. |
| (b) | Total investment return is calculated exclusive of sales charges and assumes the reinvestment of dividends and distributions. For periods of less than one year, total return is not annualized. |
| (c) | Total investment return may reflect adjustments to conform to generally accepted accounting principles. |
| (d) | Without the custody fee reimbursement, net investment income (loss) would have been 1.35%. |
| (e) | In addition to the fees and expenses which the Fund bears directly, it also indirectly bears a pro-rata share of the fees and expenses of the underlying funds in which it invests. Such indirect expenses are not included in the above expense ratios. |
| (f) | The expense ratios presented below show the impact of short sales expense: |
| Period Ended | | Net Expenses
(excluding short
sale expenses) | | Short Sales
Expenses |
| April 30, 2021 | | 1.48% | | 0.07% |
| October 31, 2020 | | 1.60% | | 0.03% |
| October 31, 2019 | | 1.64% | | 0.11% |
| October 31, 2018 | | 1.65% | | 0.13% |
| October 31, 2017 | | 1.56% | | 1.66% |
| October 31, 2016 | | 1.53% (g) | | 1.78% |
| (g) | Without the custody fee reimbursement, net expenses would have been 1.55%. |
The notes to the financial statements are an integral part of, and should be read in conjunction with, the financial statements.
| 22 | MainStay WMC International Research Equity Fund |
Financial Highlights selected per share data and ratios
| | Six months ended
April 30,
2021* | | Year Ended October 31, |
| Investor Class | 2020 | | 2019 | | 2018 | | 2017 | | 2016 |
| Net asset value at beginning of period | $ 6.36 | | $ 7.73 | | $ 7.90 | | $ 9.54 | | $ 8.02 | | $ 8.33 |
| Net investment income (loss) | 0.00‡ (a) | | 0.04(a) | | 0.15(a) | | 0.12 | | 0.04 | | 0.09 |
| Net realized and unrealized gain (loss) on investments | 1.64 | | (0.70) | | 0.08 | | (1.62) | | 1.70 | | (0.34) |
| Net realized and unrealized gain (loss) on foreign currency transactions | 0.01 | | 0.00‡ | | (0.00)‡ | | (0.00)‡ | | 0.00‡ | | (0.00)‡ |
| Total from investment operations | 1.65 | | (0.66) | | 0.23 | | (1.50) | | 1.74 | | (0.25) |
| Less distributions: | | | | | | | | | | | |
| From net investment income | (0.12) | | (0.71) | | (0.40) | | (0.14) | | (0.22) | | (0.06) |
| Net asset value at end of period | $ 7.89 | | $ 6.36 | | $ 7.73 | | $ 7.90 | | $ 9.54 | | $ 8.02 |
| Total investment return (b) | 26.14% | | (9.47)% | | 3.54% | | (15.97)% (c) | | 22.29% | | (3.04)% |
| Ratios (to average net assets)/Supplemental Data: | | | | | | | | | | | |
| Net investment income (loss) | 0.13%†† | | 0.66% | | 2.00% | | 1.29% | | 0.43% | | 1.19% (d) |
| Net expenses (e)(f) | 1.86%†† | | 1.89% | | 1.93% | | 1.88% | | 3.34% | | 3.54% |
| Expenses (before waiver/reimbursement) (e)(f) | 1.87%†† | | 1.89% | | 1.93% | | 1.88% | | 3.34% | | 3.54% |
| Portfolio turnover rate | 88% | | 136% | | 182% | | 223% | | 179% | | 137% |
| Net assets at end of period (in 000’s) | $ 2,736 | | $ 2,731 | | $ 3,690 | | $ 3,407 | | $ 4,294 | | $ 5,755 |
| * | Unaudited. |
| ‡ | Less than one cent per share. |
| †† | Annualized. |
| (a) | Per share data based on average shares outstanding during the period. |
| (b) | Total investment return is calculated exclusive of sales charges and assumes the reinvestment of dividends and distributions. For periods of less than one year, total return is not annualized. |
| (c) | Total investment return may reflect adjustments to conform to generally accepted accounting principles. |
| (d) | Without the custody fee reimbursement, net investment income (loss) would have been 1.17%. |
| (e) | In addition to the fees and expenses which the Fund bears directly, it also indirectly bears a pro-rata share of the fees and expenses of the underlying funds in which it invests. Such indirect expenses are not included in the above expense ratios. |
| (f) | The expense ratios presented below show the impact of short sales expense: |
| Period Ended | | Net Expenses
(excluding short
sale expenses) | | Short Sales
Expenses |
| April 30, 2021 | | 1.79% | | 0.07% |
| October 31, 2020 | | 1.86% | | 0.03% |
| October 31, 2019 | | 1.81% | | 0.12% |
| October 31, 2018 | | 1.75% | | 0.13% |
| October 31, 2017 | | 1.65% | | 1.66% |
| October 31, 2016 | | 1.68% (g) | | 1.78% |
| (g) | Without the custody fee reimbursement, net expenses would have been 1.70%. |
The notes to the financial statements are an integral part of, and should be read in conjunction with, the financial statements.
23
Financial Highlights selected per share data and ratios
| | Six months ended
April 30,
2021* | | Year Ended October 31, |
| Class C | 2020 | | 2019 | | 2018 | | 2017 | | 2016 |
| Net asset value at beginning of period | $ 6.16 | | $ 7.49 | | $ 7.63 | | $ 9.23 | | $ 7.75 | | $ 8.08 |
| Net investment income (loss) | (0.01) (a) | | (0.01) (a) | | 0.08(a) | | 0.05 | | (0.01) | | 0.03 |
| Net realized and unrealized gain (loss) on investments | 1.58 | | (0.68) | | 0.10 | | (1.57) | | 1.64 | | (0.34) |
| Net realized and unrealized gain (loss) on foreign currency transactions | 0.01 | | 0.00‡ | | (0.00)‡ | | (0.00)‡ | | 0.00‡ | | (0.00)‡ |
| Total from investment operations | 1.58 | | (0.69) | | 0.18 | | (1.52) | | 1.63 | | (0.31) |
| Less distributions: | | | | | | | | | | | |
| From net investment income | (0.05) | | (0.64) | | (0.32) | | (0.08) | | (0.15) | | (0.02) |
| Net asset value at end of period | $ 7.69 | | $ 6.16 | | $ 7.49 | | $ 7.63 | | $ 9.23 | | $ 7.75 |
| Total investment return (b) | 25.71% | | (10.16)% | | 2.81% | | (16.61)% | | 21.38% | | (3.84)% |
| Ratios (to average net assets)/Supplemental Data: | | | | | | | | | | | |
| Net investment income (loss) | (0.41)%†† | | (0.22)% | | 1.14% | | 0.52% | | (0.17)% | | 0.45% (c) |
| Net expenses (d)(e) | 2.61%†† | | 2.64% | | 2.66% | | 2.62% | | 4.06% | | 4.06% |
| Expenses (before waiver/reimbursement) (d)(e) | 2.62%†† | | 2.64% | | 2.66% | | 2.62% | | 4.06% | | 4.06% |
| Portfolio turnover rate | 88% | | 136% | | 182% | | 223% | | 179% | | 137% |
| Net assets at end of period (in 000’s) | $ 6,244 | | $ 6,229 | | $ 14,203 | | $ 27,699 | | $ 42,231 | | $ 36,489 |
| * | Unaudited. |
| ‡ | Less than one cent per share. |
| †† | Annualized. |
| (a) | Per share data based on average shares outstanding during the period. |
| (b) | Total investment return is calculated exclusive of sales charges and assumes the reinvestment of dividends and distributions. For periods of less than one year, total return is not annualized. |
| (c) | Without the custody fee reimbursement, net investment income (loss) would have been 0.43%. |
| (d) | In addition to the fees and expenses which the Fund bears directly, it also indirectly bears a pro-rata share of the fees and expenses of the underlying funds in which it invests. Such indirect expenses are not included in the above expense ratios. |
| (e) | The expense ratios presented below show the impact of short sales expense: |
| Period Ended | | Net Expenses
(excluding short
sale expenses) | | Short Sales
Expenses |
| April 30, 2021 | | 2.54% | | 0.07% |
| October 31, 2020 | | 2.61% | | 0.03% |
| October 31, 2019 | | 2.55% | | 0.11% |
| October 31, 2018 | | 2.49% | | 0.13% |
| October 31, 2017 | | 2.39% | | 1.64% |
| October 31, 2016 | | 2.43% (f) | | 1.78% |
| (f) | Without the custody fee reimbursement, net expenses would have been 2.45%. |
The notes to the financial statements are an integral part of, and should be read in conjunction with, the financial statements.
| 24 | MainStay WMC International Research Equity Fund |
Financial Highlights selected per share data and ratios
| | Six months ended
April 30,
2021* | | Year Ended October 31, |
| Class I | 2020 | | 2019 | | 2018 | | 2017 | | 2016 |
| Net asset value at beginning of period | $ 6.45 | | $ 7.83 | | $ 8.00 | | $ 9.66 | | $ 8.12 | | $ 8.42 |
| Net investment income (loss) | 0.03(a) | | 0.08(a) | | 0.17(a) | | 0.15 | | 0.09 | | 0.13 |
| Net realized and unrealized gain (loss) on investments | 1.65 | | (0.71) | | 0.10 | | (1.64) | | 1.70 | | (0.36) |
| Net realized and unrealized gain (loss) on foreign currency transactions | 0.01 | | 0.00‡ | | (0.00)‡ | | (0.00)‡ | | 0.00‡ | | (0.00)‡ |
| Total from investment operations | 1.69 | | (0.63) | | 0.27 | | (1.49) | | 1.79 | | (0.23) |
| Less distributions: | | | | | | | | | | | |
| From net investment income | (0.16) | | (0.75) | | (0.44) | | (0.17) | | (0.25) | | (0.07) |
| Net asset value at end of period | $ 7.98 | | $ 6.45 | | $ 7.83 | | $ 8.00 | | $ 9.66 | | $ 8.12 |
| Total investment return (b) | 26.40% | | (8.98)% | | 4.08% | | (15.72)% (c) | | 22.78% | | (2.69)% |
| Ratios (to average net assets)/Supplemental Data: | | | | | | | | | | | |
| Net investment income (loss) | 0.78%†† | | 1.19% | | 2.20% | | 1.63% | | 0.96% | | 1.66% (d) |
| Net expenses (e)(f) | 1.30%†† | | 1.38% | | 1.50% | | 1.53% | | 2.93% | | 3.07% |
| Expenses (before waiver/reimbursement) (e)(f) | 1.31%†† | | 1.38% | | 1.50% | | 1.53% | | 2.93% | | 3.07% |
| Portfolio turnover rate | 88% | | 136% | | 182% | | 223% | | 179% | | 137% |
| Net assets at end of period (in 000’s) | $ 219,880 | | $ 230,100 | | $ 281,279 | | $ 521,050 | | $ 653,051 | | $ 394,785 |
| * | Unaudited. |
| ‡ | Less than one cent per share. |
| †† | Annualized. |
| (a) | Per share data based on average shares outstanding during the period. |
| (b) | Total investment return is calculated exclusive of sales charges and assumes the reinvestment of dividends and distributions. Class I shares are not subject to sales charges. For periods of less than one year, total return is not annualized. |
| (c) | Total investment return may reflect adjustments to conform to generally accepted accounting principles. |
| (d) | Without the custody fee reimbursement, net investment income (loss) would have been 1.64%. |
| (e) | In addition to the fees and expenses which the Fund bears directly, it also indirectly bears a pro-rata share of the fees and expenses of the underlying funds in which it invests. Such indirect expenses are not included in the above expense ratios. |
| (f) | The expense ratios presented below show the impact of short sales expense: |
| Period Ended | | Net Expenses
(excluding short
sale expenses) | | Short Sales
Expenses |
| April 30, 2021 | | 1.23% | | 0.07% |
| October 31, 2020 | | 1.35% | | 0.03% |
| October 31, 2019 | | 1.40% | | 0.10% |
| October 31, 2018 | | 1.40% | | 0.13% |
| October 31, 2017 | | 1.29% | | 1.63% |
| October 31, 2016 | | 1.28% (g) | | 1.78% |
| (g) | Without the custody fee reimbursement, net expenses would have been 1.30%. |
The notes to the financial statements are an integral part of, and should be read in conjunction with, the financial statements.
25
Notes to Financial Statements (Unaudited)
Note 1-Organization and Business
MainStay Funds Trust (the “Trust”) was organized as a Delaware statutory trust on April 28, 2009. The Trust is registered under the Investment Company Act of 1940, as amended (the “1940 Act”), as an open-end management investment company, and is comprised of thirty-two funds (collectively referred to as the “Funds”). These financial statements and notes relate to the MainStay WMC International Research Equity Fund (formerly known as MainStay MacKay International Opportunities Fund) (the "Fund"), a “diversified” fund, as that term is defined in the 1940 Act, as interpreted or modified by regulatory authorities having jurisdiction, from time to time.
The following table lists the Fund's share classes that have been registered and commenced operations:
| Class | Commenced Operations |
| Class A | 9/28/2007 |
| Investor Class | 2/28/2008 |
| Class C | 9/28/2007 |
| Class I | 9/28/2007 |
| Class R6 | N/A * |
| SIMPLE Class | N/A * |
| * | Class R6 shares were registered for sale effective as of February 28, 2017 and SIMPLE Class shares were registered for sale effective as of August 31, 2020 but have not yet commenced operations. |
Class A and Investor Class shares are offered at net asset value (“NAV”) per share plus an initial sales charge. No initial sales charge applies to investments of $1 million or more (and certain other qualified purchases) in Class A and Investor Class shares. However, a contingent deferred sales charge (“CDSC”) of 1.00% may be imposed on certain redemptions made within 18 months of the date of purchase on shares that were purchased without an initial sales charge. Class C shares are offered at NAV without an initial sales charge, although a 1.00% CDSC may be imposed on certain redemptions of such shares made within one year of the date of purchase of Class C shares. Class I shares are offered at NAV without a sales charge. Class R6 shares are currently expected to be offered at NAV without a sales charge. SIMPLE Class shares are currently expected to be offered at NAV without a sales charge. Depending upon eligibility, Class C shares convert to either Class A or Investor Class shares at the end of the calendar quarter ten years after the date they were purchased. Additionally, Investor Class shares may convert automatically to Class A shares. Under certain circumstances and as may be permitted by the Trust’s multiple class plan pursuant to Rule 18f-3 under the 1940 Act, specified share classes of the Fund may be converted to one or more other share classes of the Fund as disclosed in the capital share transactions within these Notes. The classes of shares have the same voting (except for issues that relate solely to one class), dividend, liquidation and other rights, and the same terms and conditions, except that under distribution plans pursuant to Rule 12b-1 under the 1940 Act, Class C shares are subject to higher distribution and/or service fees than Class A, Investor Class and SIMPLE Class shares. Class I and Class R6 shares are not subject to a distribution and/or service fee.
The Fund's investment objective is to seek long-term growth of capital.
Note 2–Significant Accounting Policies
The Fund is an investment company and accordingly follows the investment company accounting and reporting guidance of the Financial Accounting Standards Board (“FASB”) Accounting Standard Codification Topic 946 Financial Services—Investment Companies. The Fund prepares its financial statements in accordance with generally accepted accounting principles (“GAAP”) in the United States of America and follows the significant accounting policies described below.
(A) Securities Valuation. Investments are usually valued as of the close of regular trading on the New York Stock Exchange (the "Exchange") (usually 4:00 p.m. Eastern time) on each day the Fund is open for business ("valuation date").
The Board of Trustees of the Trust (the "Board") adopted procedures establishing methodologies for the valuation of the Fund's securities and other assets and delegated the responsibility for valuation determinations under those procedures to the Valuation Committee of the Trust (the “Valuation Committee”). The procedures state that, subject to the oversight of the Board and unless otherwise noted, the responsibility for the day-to-day valuation of portfolio assets (including fair value measurements for the Fund's assets and liabilities) rests with New York Life Investment Management LLC (“New York Life Investments” or the "Manager"), aided to whatever extent necessary by the Subadvisor (as defined in Note 3(A)). To assess the appropriateness of security valuations, the Manager, the Subadvisor or the Fund's third-party service provider, who is subject to oversight by the Manager, regularly compares prior day prices, prices on comparable securities and the sale prices to the prior and current day prices and challenges prices with changes exceeding certain tolerance levels with third-party pricing services or broker sources.
The Board authorized the Valuation Committee to appoint a Valuation Subcommittee (the “Subcommittee”) to establish the prices of securities for which market quotations are not readily available or the prices of which are not otherwise readily determinable under the procedures. The Subcommittee meets (in person, via electronic mail or via teleconference) on an as-needed basis. The Valuation Committee meets to ensure that actions taken by the Subcommittee were appropriate.
For those securities valued through either a standardized fair valuation methodology or a fair valuation measurement, the Subcommittee deals with such valuation and the Valuation Committee reviews and affirms, if appropriate, the reasonableness of the valuation based on such methodologies and measurements on a regular basis after considering information that is reasonably available and deemed relevant by the Valuation Committee. Any action taken by the Subcommittee with respect to the valuation of a portfolio security or other asset is submitted for review and ratification (if appropriate) to the Valuation Committee and the Board at the next regularly scheduled meeting.
| 26 | MainStay WMC International Research Equity Fund |
"Fair value" is defined as the price the Fund would reasonably expect to receive upon selling an asset or liability in an orderly transaction to an independent buyer in the principal or most advantageous market for the asset or liability. Fair value measurements are determined within a framework that establishes a three-tier hierarchy that maximizes the use of observable market data and minimizes the use of unobservable inputs to establish a classification of fair value measurements for disclosure purposes. "Inputs" refer broadly to the assumptions that market participants would use in pricing the asset or liability, including assumptions about risk, such as the risk inherent in a particular valuation technique used to measure fair value using a pricing model and/or the risk inherent in the inputs for the valuation technique. Inputs may be observable or unobservable. Observable inputs reflect the assumptions market participants would use in pricing the asset or liability based on market data obtained from sources independent of the Fund. Unobservable inputs reflect the Fund’s own assumptions about the assumptions market participants would use in pricing the asset or liability based on the information available. The inputs or methodology used for valuing assets or liabilities may not be an indication of the risks associated with investing in those assets or liabilities. The three-tier hierarchy of inputs is summarized below.
| • | Level 1—quoted prices in active markets for an identical asset or liability |
| • | Level 2—other significant observable inputs (including quoted prices for a similar asset or liability in active markets, interest rates and yield curves, prepayment speeds, credit risk, etc.) |
| • | Level 3—significant unobservable inputs (including the Fund's own assumptions about the assumptions that market participants would use in measuring fair value of an asset or liability) |
The level of an asset or liability within the fair value hierarchy is based on the lowest level of an input, both individually and in the aggregate, that is significant to the fair value measurement. The aggregate value by input level of the Fund’s assets and liabilities as of April 30, 2021, is included at the end of the Portfolio of Investments.
The Fund may use third-party vendor evaluations, whose prices may be derived from one or more of the following standard inputs, among others:
| • Broker/dealer quotes | • Benchmark securities |
| • Two-sided markets | • Reference data (corporate actions or material event notices) |
| • Bids/offers | • Monthly payment information |
| • Industry and economic events | • Reported trades |
An asset or liability for which market values cannot be measured using the methodologies described above is valued by methods deemed reasonable in good faith by the Valuation Committee, following the procedures established by the Board, to represent fair value. Under these procedures, the Fund generally uses a market-based approach which may use related or comparable assets or liabilities, recent transactions, market multiples, book values and other relevant information. The Fund
may also use an income-based valuation approach in which the anticipated future cash flows of the asset or liability are discounted to calculate fair value. Discounts may also be applied due to the nature and/or duration of any restrictions on the disposition of the asset or liability. Fair value represents a good faith approximation of the value of a security. Fair value determinations involve the consideration of a number of subjective factors, an analysis of applicable facts and circumstances and the exercise of judgment. As a result, it is possible that the fair value for a security determined in good faith in accordance with the Fund's valuation procedures may differ from valuations for the same security determined by other funds using their own valuation procedures. Although the Fund's valuation procedures are designed to value a security at the price the Fund may reasonably expect to receive upon the security's sale in an orderly transaction, there can be no assurance that any fair value determination thereunder would, in fact, approximate the amount that the Fund would actually realize upon the sale of the security or the price at which the security would trade if a reliable market price were readily available. During the six-month period ended April 30, 2021, there were no material changes to the fair value methodologies.
Securities which may be valued in this manner include, but are not limited to: (i) a security for which trading has been halted or suspended; (ii) a debt security that has recently gone into default and for which there is not a current market quotation; (iii) a security of an issuer that has entered into a restructuring; (iv) a security that has been delisted from a national exchange; (v) a security for which the market price is not readily available from a third-party pricing source or, if so provided, does not, in the opinion of the Manager or the Subadvisor, reflect the security's market value; (vi) a security subject to trading collars for which no or limited trading takes place; and (vii) a security whose principal market has been temporarily closed at a time when, under normal conditions, it would be open. Securities valued in this manner are generally categorized as Level 3 in the hierarchy. Securities that were fair valued in such a manner as of April 30, 2021, are shown in the Portfolio of Investments.
Certain securities held by the Fund may principally trade in foreign markets. Events may occur between the time the foreign markets close and the time at which the Fund's NAVs are calculated. These events may include, but are not limited to, situations relating to a single issuer in a market sector, significant fluctuations in U.S. or foreign markets, natural disasters, armed conflicts, governmental actions or other developments not tied directly to the securities markets. Should the Manager or the Subadvisor conclude that such events may have affected the accuracy of the last price of such securities reported on the local foreign market, the Subcommittee may, pursuant to procedures adopted by the Board, adjust the value of the local price to reflect the estimated impact on the price of such securities as a result of such events. In this instance, securities are generally categorized as Level 3 in the hierarchy. Additionally, certain foreign equity securities are also fair valued whenever the movement of a particular index exceeds certain thresholds. In such cases, the securities are fair valued by applying factors provided by a third-party vendor in accordance with valuation procedures adopted by the Board and are
Notes to Financial Statements (Unaudited) (continued)
generally categorized as Level 2 in the hierarchy. No foreign equity securities held by the Fund as of April 30, 2021 were fair valued in such a manner.
Equity securities, including rights and warrants and exchange-traded funds ("ETFs"), are valued at the last quoted sales prices as of the close of regular trading on the relevant exchange on each valuation date. Securities that are not traded on the valuation date are valued at the mean of the last quoted bid and ask prices. Prices are normally taken from the principal market in which each security trades. These securities are generally categorized as Level 1 in the hierarchy.
Investments in mutual funds, including money market funds, are valued at their respective NAVs at the close of business each day on the valuation date. These securities are generally categorized as Level 1 in the hierarchy.
Swaps are marked to market daily based upon quotations from pricing agents, brokers or market makers. These securities are generally categorized as Level 2 in the hierarchy.
Total return swap contracts, which are arrangements to exchange a market-linked return for a periodic payment, are based on a notional principal amount. To the extent that the total return of the security, index or other financial measure underlying the transaction exceeds or falls short of the offsetting interest rate obligation, the Fund will receive a payment from or make a payment to the counterparty. Total return swap contracts are marked to market daily based upon quotations from market makers and these securities are generally categorized as Level 2 in the hierarchy.
Temporary cash investments acquired in excess of 60 days to maturity at the time of purchase are valued using the latest bid prices or using valuations based on a matrix system (which considers such factors as security prices, yields, maturities and ratings), both as furnished by independent pricing services. Temporary cash investments that mature in 60 days or less at the time of purchase ("Short-Term Investments") are valued using the amortized cost method of valuation, unless the use of such method would be inappropriate. The amortized cost method involves valuing a security at its cost on the date of purchase and thereafter assuming a constant amortization to maturity of the difference between such cost and the value on maturity date. Amortized cost approximates the current fair value of a security. Securities valued using the amortized cost method are not valued using quoted prices in an active market and are generally categorized as Level 2 in the hierarchy.
The information above is not intended to reflect an exhaustive list of the methodologies that may be used to value portfolio investments. The valuation procedures permit the use of a variety of valuation methodologies in connection with valuing portfolio investments. The methodology used for a specific type of investment may vary based on the market data available or other considerations. The methodologies summarized above may not represent the specific means by which portfolio investments are valued on any particular business day.
A portfolio investment may be classified as an illiquid investment under the Trust's written liquidity risk management program and related procedures (“Liquidity Program”). Illiquidity of an investment might prevent the sale of such investment at a time when the Manager or the Subadvisor might wish to sell, and these investments could have the effect of decreasing the overall level of the Fund's liquidity. Further, the lack of an established secondary market may make it more difficult to value illiquid investments, requiring the Fund to rely on judgments that may be somewhat subjective in measuring value, which could vary materially from the amount that the Fund could realize upon disposition. Difficulty in selling illiquid investments may result in a loss or may be costly to the Fund. An illiquid investment is any investment that the Manager or Subadvisor reasonably expects cannot be sold or disposed of in current market conditions in seven calendar days or less without the sale or disposition significantly changing the market value of the investment. The liquidity classification of each investment will be made using information obtained after reasonable inquiry and taking into account, among other things, relevant market, trading and investment-specific considerations in accordance with the Liquidity Program. Illiquid investments are often valued in accordance with methods deemed by the Board in good faith to be reasonable and appropriate to accurately reflect their fair value. The liquidity of the Fund's investments was determined as of April 30, 2021, and can change at any time. Illiquid investments as of April 30, 2021, are shown in the Portfolio of Investments.
(B) Income Taxes. The Fund's policy is to comply with the requirements of the Internal Revenue Code of 1986, as amended (the “Internal Revenue Code”), applicable to regulated investment companies and to distribute all of its taxable income to the shareholders of the Fund within the allowable time limits.
The Manager evaluates the Fund’s tax positions to determine if the tax positions taken meet the minimum recognition threshold in connection with accounting for uncertainties in income tax positions taken or expected to be taken for the purposes of measuring and recognizing tax liabilities in the financial statements. Recognition of tax benefits of an uncertain tax position is permitted only to the extent the position is “more likely than not” to be sustained assuming examination by taxing authorities. The Manager analyzed the Fund's tax positions taken on federal, state and local income tax returns for all open tax years (for up to three tax years) and has concluded that no provisions for federal, state and local income tax are required in the Fund's financial statements. The Fund's federal, state and local income tax and federal excise tax returns for tax years for which the applicable statutes of limitations have not expired are subject to examination by the Internal Revenue Service and state and local departments of revenue.
(C) Foreign Taxes. The Fund may be subject to foreign taxes on income and other transaction-based taxes imposed by certain countries in which it invests. A portion of the taxes on gains on investments or currency purchases/repatriation may be reclaimable. The Fund will accrue such taxes and reclaims as applicable, based upon its current
| 28 | MainStay WMC International Research Equity Fund |
interpretation of tax rules and regulations that exist in the markets in which it invests.
The Fund may be subject to taxation on realized capital gains, repatriation proceeds and other transaction-based taxes imposed by certain countries in which it invests. The Fund will accrue such taxes as applicable based upon its current interpretation of tax rules and regulations that exist in the market in which it invests. Capital gains taxes relating to positions still held are reflected as a liability in the Statement of Assets and Liabilities, as well as an adjustment to the Fund's net unrealized appreciation (depreciation). Taxes related to capital gains realized, if any, are reflected as part of net realized gain (loss) in the Statement of Operations. Changes in tax liabilities related to capital gains taxes on unrealized investment gains, if any, are reflected as part of the change in net unrealized appreciation (depreciation) on investments in the Statement of Operations. Transaction-based charges are generally assessed as a percentage of the transaction amount.
(D) Dividends and Distributions to Shareholders. Dividends and distributions are recorded on the ex-dividend date. The Fund intends to declare and pay dividends from net investment income and distributions from net realized capital and currency gains, if any, at least annually. Unless a shareholder elects otherwise, all dividends and distributions are reinvested at NAV in the same class of shares of the Fund. Dividends and distributions to shareholders are determined in accordance with federal income tax regulations and may differ from determinations using GAAP.
(E) Security Transactions and Investment Income. The Fund records security transactions on the trade date. Realized gains and losses on security transactions are determined using the identified cost method. Dividend income is recognized on the ex-dividend date, net of any foreign tax withheld at the source, and interest income is accrued as earned using the effective interest rate method. Distributions received from real estate investment trusts may be classified as dividends, capital gains and/or return of capital.
Investment income and realized and unrealized gains and losses on investments of the Fund are allocated pro rata to the separate classes of shares based upon their relative net assets on the date the income is earned or realized and unrealized gains and losses are incurred.
(F) Expenses. Expenses of the Trust are allocated to the individual Funds in proportion to the net assets of the respective Funds when the expenses are incurred, except where direct allocations of expenses can be made. Expenses (other than transfer agent expenses and fees incurred under the shareholder services plans and/or the distribution plans further discussed in Note 3(B)) are allocated to separate classes of shares pro rata based upon their relative net assets on the date the expenses are incurred. The expenses borne by the Fund, including those of related parties to the Fund, are shown in the Statement of Operations.
Additionally, the Fund may invest in ETFs and mutual funds, which are subject to management fees and other fees that may cause the costs of investing in ETFs and mutual funds to be greater than the costs of owning the underlying securities directly. These indirect expenses of ETFs and
mutual funds are not included in the amounts shown as expenses in the Statement of Operations or in the expense ratios included in the Financial Highlights.
(G) Use of Estimates. In preparing financial statements in conformity with GAAP, the Manager makes estimates and assumptions that affect the reported amounts and disclosures in the financial statements. Actual results could differ from those estimates and assumptions.
(H) Swap Contracts. The Fund may enter into credit default, interest rate, equity, index and currency exchange rate swap contracts (“swaps”). In a typical swap transaction, two parties agree to exchange the future returns (or differentials in rates of future returns) earned or realized at periodic intervals on a particular investment or instrument based on a notional principal amount. Generally, the Fund will enter into a swap on a net basis, which means that the two payment streams under the swap are netted, with the Fund receiving or paying (as the case may be) only the net amount of the two payment streams. Therefore, the Fund's current obligation under a swap generally will be equal to the net amount to be paid or received under the swap, based on the relative value of notional positions attributable to each counterparty to the swap. The payments may be adjusted for transaction costs, interest payments, the amount of interest paid on the investment or instrument or other factors. Collateral, in the form of cash or securities, may be required to be held in segregated accounts with the custodian bank or broker in accordance with the terms of the swap. Swap agreements are privately negotiated in the over the counter (“OTC”) market and may be executed in a multilateral or other trade facilities platform, such as a registered commodities exchange (“centrally cleared swaps”).
Certain standardized swaps, including certain credit default and interest rate swaps, are subject to mandatory clearing and exchange-trading, and more types of standardized swaps are expected to be subject to mandatory clearing and exchange-trading in the future. The counterparty risk for exchange-traded and cleared derivatives is expected to be generally lower than for uncleared derivatives, but cleared contracts are not risk-free. In a cleared derivative transaction, the Fund typically enters into the transaction with a financial institution counterparty, and performance of the transaction is effectively guaranteed by a central clearinghouse, thereby reducing or eliminating the Fund's exposure to the credit risk of its original counterparty. The Fund will be required to post specified levels of margin with the clearinghouse or at the instruction of the clearinghouse; the margin required by a clearinghouse may be greater than the margin the Fund would be required to post in an uncleared transaction.
Swaps are marked to market daily based upon quotations from pricing agents, brokers, or market makers and the change in value, if any, is recorded as unrealized appreciation or depreciation. Any payments made or received upon entering into a swap would be amortized or accreted over the life of the swap and recorded as a realized gain or loss. Early termination of a swap is recorded as a realized gain or loss. Daily changes in valuation of centrally cleared swaps, if any, are recorded as a
Notes to Financial Statements (Unaudited) (continued)
receivable or payable for the change in value as appropriate on the Statement of Assets and Liabilities.
The Fund bears the risk of loss of the amount expected to be received under a swap in the event of the default or bankruptcy of the swap counterparty. The Fund may be able to eliminate its exposure under a swap either by assignment or other disposition, or by entering into an offsetting swap with the same party or a similar credit-worthy party. Swaps are not actively traded on financial markets. Entering into swaps involves elements of credit, market, and documentation risk in excess of the amounts recognized on the Statement of Assets and Liabilities. Such risks involve the possibilities that there will be no liquid market for these swaps, that the counterparty to the swaps may default on its obligation to perform or disagree as to the meaning of the contractual terms in the swaps and that there may be unfavorable changes in interest rates, the price of the index or the security underlying these transactions.
Equity Swaps (Total Return Swaps). Total return swap contracts are agreements between counterparties to exchange cash flow, one based on a market-linked return of an individual asset or group of assets (such as an index), and the other on a fixed or floating rate. As a total return swap, an equity swap may be structured in different ways. For example, when the Fund enters into a “long” equity swap, the counterparty may agree to pay the Fund the amount, if any, by which the notional amount of the equity swap would have increased in value had it been invested in a particular referenced security or securities, plus the dividends that would have been received on those securities. In return, the Fund will generally agree to pay the counterparty interest on the notional amount of the equity swap plus the amount, if any, by which that notional amount would have decreased in value had it been invested in such referenced security or securities, plus, in certain instances, commissions or trading spreads on the notional amounts. Therefore, the Fund's return on the equity swap generally should equal the gain or loss on the notional amount, plus dividends on the referenced security or securities less the interest paid by the Fund on the notional amount. Alternatively, when the Fund enters into a “short” equity swap, the counterparty will generally agree to pay the Fund the amount, if any, by which the notional amount of the equity swap would have decreased in value had the Fund sold a particular referenced security or securities short, less the dividend expense that the Fund would have incurred on the referenced security or securities, as adjusted for interest payments or other economic factors. In this situation, the Fund will generally be obligated to pay the amount, if any, by which the notional amount of the swap would have increased in value had it been invested directly in the referenced security or securities.
Equity swaps generally do not involve the delivery of securities or other referenced assets. Accordingly, the risk of loss with respect to equity swaps is normally limited to the net amount of payments that the Fund is contractually obligated to make. If the other party to an equity swap defaults, the Fund's risk of loss consists of the net amount of payments that the Fund is contractually entitled to receive, if any. The Fund will segregate cash or liquid assets, enter into offsetting transactions or use other measures permitted by applicable law to “cover” the Fund's current obligations. The Fund and New York Life Investments, however, believe
these transactions do not constitute senior securities under the 1940 Act and, accordingly, will not treat them as being subject to the Fund's borrowing restrictions.
Equity swaps are derivatives and their value can be very volatile. The Fund may engage in total return swaps to gain exposure to emerging markets securities, along with offsetting long total return swap positions to maintain appropriate currency balances and risk exposures across all swap positions. To the extent that the Manager, or the Subadvisor do not accurately analyze and predict future market trends, the values or assets or economic factors, the Fund may suffer a loss, which may be substantial.
(I) Foreign Currency Transactions. The Fund's books and records are maintained in U.S. dollars. Prices of securities denominated in foreign currency amounts are translated into U.S. dollars at the mean between the buying and selling rates last quoted by any major U.S. bank at the following dates:
(i) market value of investment securities, other assets and liabilities— at the valuation date; and
(ii) purchases and sales of investment securities, income and expenses—at the date of such transactions.
The assets and liabilities that are denominated in foreign currency amounts are presented at the exchange rates and market values at the close of the period. The realized and unrealized changes in net assets arising from fluctuations in exchange rates and market prices of securities are not separately presented.
Net realized gain (loss) on foreign currency transactions represents net currency gains or losses realized as a result of differences between the amounts of securities sale proceeds or purchase cost, dividends, interest and withholding taxes as recorded on the Fund's books, and the U.S. dollar equivalent amount actually received or paid. Net currency gains or losses from valuing such foreign currency denominated assets and liabilities, other than investments at valuation date exchange rates, are reflected in unrealized foreign exchange gains or losses.
(J) Securities Sold Short. During the six-month period ended April 30, 2021, the Fund engaged in sales of securities it did not own ("short sales") as part of its investment strategies. When the Fund enters into a short sale, it must segregate or maintain with a broker the cash proceeds from the security sold short or other securities as collateral for its obligation to deliver the security upon conclusion of the sale. During the period a short position is open, depending on the nature and type of security, a short position is reflected as a liability and is marked to market in accordance with the valuation methodologies previously detailed (See Note 2(A)). Liabilities for securities sold short are closed out by purchasing the applicable securities for delivery to the counterparty broker. A gain, limited to the price at which the Fund sold the security short, or a loss, unlimited as to dollar amount, will be recognized upon termination of a short sale if the market price on the date the short position is closed out is less or greater, respectively, than the proceeds
| 30 | MainStay WMC International Research Equity Fund |
originally received. Any such gain or loss may be offset, completely or in part, by the change in the value of the hedged investments. Interest on short positions held is accrued daily, while dividends declared on short positions existing on the record date are recorded on the ex-dividend date as a dividend expense in the Statement of Operations. Broker fees and other expenses related to securities sold short are disclosed in the Statement of Operations. Short sales involve risk of loss in excess of the related amounts reflected in the Statement of Assets and Liabilities. As of April 30, 2021, the securities sold short are shown in the Portfolio of Investments.
(K) Securities Lending. In order to realize additional income, the Fund may engage in securities lending, subject to the limitations set forth in the 1940 Act and relevant guidance by the staff of the Securities and Exchange Commission (“SEC”). If the Fund engages in securities lending, the Fund will lend through its custodian, JPMorgan Chase Bank, N.A., ("JPMorgan"), acting as securities lending agent on behalf of the Fund. Under the current arrangement, JPMorgan will manage the Fund's collateral in accordance with the securities lending agency agreement between the Fund and JPMorgan, and indemnify the Fund against counterparty risk. The loans will be collateralized by cash (which may be invested in a money market fund) and/or non-cash collateral (which may include U.S. Treasury securities and/or U.S. government agency securities issued or guaranteed by the United States government or its agencies or instrumentalities) at least equal at all times to the market value of the securities loaned. The Fund bears the risk of delay in recovery of, or loss of rights in, the securities loaned. The Fund may also record a realized gain or loss on securities deemed sold due to a borrower’s inability to return securities on loan. The Fund bears the risk of any loss on investment of cash collateral. The Fund will receive compensation for lending its securities in the form of fees or it will retain a portion of interest earned on the investment of any cash collateral. The Fund will also continue to receive interest and dividends on the securities loaned and any gain or loss in the market price of the securities loaned that may occur during the term of the loan will be for the account of the Fund. Income earned from securities lending activities, if any, is reflected in the Statement of Operations. Securities on loan as of April 30, 2021, are shown in the Portfolio of Investments.
Prior to November 23, 2020, these services were provided by State Street Bank and Trust Company (“State Street”).
(L) Rights and Warrants. Rights are certificates that permit the holder to purchase a certain number of shares, or a fractional share, of a new stock from the issuer at a specific price. Warrants are instruments that entitle the holder to buy an equity security at a specific price for a specific period of time. These investments can provide a greater potential for profit or loss than an equivalent investment in the underlying security. Prices of these investments do not necessarily move in tandem with the prices of the underlying securities.
There is risk involved in the purchase of rights and warrants in that these investments are speculative investments. The Fund could also lose the entire value of its investment in warrants if such warrants are not
exercised by the date of its expiration. The Fund is exposed to risk until the sale or exercise of each right or warrant is completed. Rights and Warrants as of April 30, 2021 are shown in the Portfolio of Investments.
(M) Foreign Securities Risk. The Fund invests in foreign securities, which carry certain risks that are in addition to the usual risks inherent in domestic securities. These risks include those resulting from currency fluctuations, future adverse political or economic developments and possible imposition of currency exchange blockages or other foreign governmental laws or restrictions. These risks are likely to be greater in emerging markets than in developed markets. The ability of issuers of debt securities held by the Fund to meet their obligations may be affected by, among other things, economic or political developments in a specific country, industry or region.
(N) Counterparty Credit Risk. In order to better define its contractual rights and to secure rights that will help the Fund mitigate its counterparty risk, the Fund may enter into an International Swaps and Derivatives Association, Inc. Master Agreement (“ISDA Master Agreement”) or similar agreement with its counterparties. An ISDA Master Agreement is a bilateral agreement between the Fund and a counterparty that governs certain OTC derivatives and typically contains collateral posting terms and netting provisions. Under an ISDA Master Agreement, the Fund may, under certain circumstances, offset with the counterparty certain derivative financial instruments’ payables and/ or receivables with collateral held and/or posted and create one single net payment. The provisions of the ISDA Master Agreement typically permit a single net payment in the event of default including the bankruptcy or insolvency of the counterparty. Bankruptcy or insolvency laws of a particular jurisdiction may restrict or prohibit the right of offset in bankruptcy, insolvency or other events. In addition, certain ISDA Master Agreements may contain provisions for early termination of OTC derivative transactions in the event the net assets of the Fund decline below specific levels or if the Fund fails to meet the terms of its ISDA Master Agreements. The result would cause the Fund to accelerate payment of any net liability owed to the counterparty.
For financial reporting purposes, the Fund does not offset derivative assets and derivative liabilities that are subject to netting arrangements, if any, in the Statement of Assets and Liabilities.
(O) LIBOR Replacement Risk. The Fund may invest in certain debt securities, derivatives or other financial instruments that utilize the London Interbank Offered Rate ("LIBOR"), as a “benchmark” or “reference rate” for various interest rate calculations. The United Kingdom Financial Conduct Authority, which regulates LIBOR, announced that after 2021 it will cease its active encouragement of banks to provide the quotations needed to sustain LIBOR. However, it is possible that certain LIBOR tenors may continue beyond 2021 and the most widely used LIBOR tenors may continue until mid-2023. As a result, it is anticipated that LIBOR will be discontinued or will no longer be sufficiently robust to be representative of its underlying market around that time. Although financial regulators and industry working groups have suggested alternative reference rates, such as European Interbank Offer Rate (“EURIBOR”), Sterling Overnight
Notes to Financial Statements (Unaudited) (continued)
Interbank Average Rate (“SONIA”) and Secured Overnight Financing Rate (“SOFR”), there are challenges to converting certain contracts and transactions to a new benchmark and neither the full effects of the transition process nor its ultimate outcome is known. New York Life Investments is currently working to assess exposure and will modify contracts as necessary.
The elimination of LIBOR or changes to other reference rates or any other changes or reforms to the determination or supervision of reference rates could have an adverse impact on the market for, or value of, any securities or payments linked to those reference rates, which may adversely affect the Fund's performance and/or net asset value. Uncertainty and risk also remain regarding the willingness and ability of issuers and lenders to include revised provisions in new and existing contracts or instruments. Consequently, the transition away from LIBOR to other reference rates may lead to increased volatility and illiquidity in markets that are tied to LIBOR, fluctuations in values of LIBOR-related investments or investments in issuers that utilize LIBOR, increased difficulty in borrowing or refinancing and diminished effectiveness of hedging strategies, adversely affecting the Fund's performance. Furthermore, the risks associated with the expected discontinuation of LIBOR and transition may be exacerbated if the work necessary to effect an orderly transition to an alternative reference rate is not completed in a timely manner. Because the usefulness of LIBOR as a benchmark could deteriorate during the transition period, these effects could occur prior to the end of 2021 with respect to certain LIBOR tenors or mid-2023 for the remaining LIBOR tenors.
(P) Indemnifications. Under the Trust’s organizational documents, its officers and trustees are indemnified against certain liabilities that may arise out of performance of their duties to the Trust. Additionally, in the normal course of business, the Fund enters into contracts with third-party service providers that contain a variety of representations and warranties and that may provide general indemnifications. The Fund's maximum exposure under these arrangements is unknown, as this would involve future claims that may be made against the Fund that have not yet occurred. The Manager believes that the risk of loss in connection with these potential indemnification obligations is remote. However, there can be no assurance that material liabilities related to such obligations will not arise in the future, which could adversely impact the Fund.
(Q) Quantitative Disclosure of Derivative Holdings. The following tables show additional disclosures related to the Fund's derivative and hedging activities, including how such activities are accounted for and their effect on the Fund's financial positions, performance and cash flows.
The Fund entered into total return swap contracts to seek to enhance returns or reduce the risk of loss by hedging certain of the Fund's holdings. These derivatives are not accounted for as hedging instruments.
Fair value of derivative instruments as of April 30, 2021:
| Liability Derivatives | Equity
Contracts
Risk | Total |
| OTC Swap Contracts - Unrealized depreciation on OTC swap contracts | $(7,355) | $(7,355) |
| Total Fair Value | $(7,355) | $(7,355) |
The effect of derivative instruments on the Statement of Operations for the six-month period ended April 30, 2021:
| Net Realized Gain (Loss) from: | Equity
Contracts
Risk | Total |
| Swap Contracts | $(7,912,467) | $(7,912,467) |
| Total Net Realized Gain (Loss) | $(7,912,467) | $(7,912,467) |
| Net Change in Unrealized Appreciation (Depreciation) | Equity
Contracts
Risk | Total |
| Swap Contracts | $(726,892) | $(726,892) |
| Total Net Change in Unrealized Appreciation (Depreciation) | $(726,892) | $(726,892) |
| Average Notional Amount | Total |
| Swap Contracts Long | $ 49,363,306 |
| Swap Contracts Short | $(21,465,752) |
| Forward Contracts Short | $ (114,645) |
Note 3–Fees and Related Party Transactions
(A) Manager and Subadvisor. New York Life Investments, a registered investment adviser and an indirect, wholly-owned subsidiary of New York Life Insurance Company ("New York Life"), serves as the Fund's Manager, pursuant to an Amended and Restated Management Agreement ("Management Agreement"). The Manager provides offices, conducts clerical, recordkeeping and bookkeeping services and keeps most of the financial and accounting records required to be maintained by the Fund. Except for the portion of salaries and expenses that are the responsibility of the Fund, the Manager pays the salaries and expenses of all personnel affiliated with the Fund and certain operational expenses of the Fund. The Fund reimburses New York Life Investments in an amount equal to the portion of the compensation of the Chief Compliance Officer attributable to the Fund. The Fund’s subadvisor changed effective March 5, 2021 due to the replacement of MacKay Shields LLC as the Fund’s subadvisor and the appointment of Wellington Management Company LLP (“Wellington” or the “Subadvisor”) as the Fund’s subadvisor. Wellington, a registered investment adviser, is responsible for the day-to-day portfolio management of the Fund. Pursuant to the terms of a Subadvisory Agreement ("Subadvisory Agreement") between New York Life Investments and Wellington, New York Life Investments pays for the services of the Subadvisor.
| 32 | MainStay WMC International Research Equity Fund |
Effective March 5, 2021, under the Management Agreement, the Fund pays the Manager a monthly fee for the services performed and the facilities furnished at an annual rate of 0.75% of average daily net assets of the Fund. During the six-month period ended April 30, 2021, the effective management fee rate was 0.99%.
Prior to March 5, 2021, the Fund paid the Manager a monthly fee for the services performed and the facilities furnished at an annual rate of 1.10% of the Fund's average daily net assets.
New York Life Investments has contractually agreed to waive fees and/or reimburse expenses so that Total Annual Fund Operating Expenses (excluding taxes, interest, litigation, extraordinary expenses, brokerage and other transaction expenses relating to the purchase or sale of portfolio investments, and acquired (underlying) fund fees and expenses) for Class A shares do not exceed 1.85% of the Fund’s average daily net assets. New York Life Investments will apply an equivalent waiver or reimbursement, in an equal number of basis points, to the other share classes of the Fund. This agreement will remain in effect until February 28, 2023, and shall renew automatically for one-year terms unless New York Life Investments provides written notice of termination prior to the start of the next term or upon approval of the Board.
Effective March 5, 2021, New York Life Investments had contractually agreed to waive fees and/or reimburse expenses so that Total Annual Fund Operating Expenses (excluding taxes, interest, litigation, extraordinary expenses, brokerage and other transaction expenses relating to the purchase or sale of portfolio investments, and acquired (underlying) fund fees and expenses) for Class I shares do not exceed 0.86% of the Fund’s average daily net assets. This agreement will remain in effect until February 28, 2023, and shall renew automatically for one-year terms unless New York Life Investments provides written notice of termination prior to the start of the next term or upon approval of the Board.
New York Life Investments has agreed to voluntarily waive fees and/or reimburse expenses of the appropriate class of the Fund so that Total Annual Fund Operating Expenses (excluding taxes, interest, litigation, extraordinary expenses, brokerage and other transaction expenses relating to the purchase and sale of portfolio investments, and acquired (underlying) fund fees and expenses) of a class do not exceed the following percentages of average daily net assets: 1.95% for Investor Class shares and 2.70% for Class C shares. These voluntary waivers or reimbursements may be discontinued at any time without notice.
During the six-month period ended April 30, 2021, New York Life Investments earned fees from the Fund in the amount of $1,246,800 and waived fees and/or reimbursed expenses in the amount of $19,422 and paid the Subadvisor fees in the amount of $599,491.
JPMorgan provides sub-administration and sub-accounting services to the Fund pursuant to an agreement with New York Life Investments. These services include calculating the daily NAVs of the Fund, maintaining the general ledger and sub-ledger accounts for the calculation of the Fund's NAVs, and assisting New York Life Investments
in conducting various aspects of the Fund's administrative operations. For providing these services to the Fund, JPMorgan is compensated by New York Life Investments.
Prior to November 23, 2020, these services were provided by State Street.
Pursuant to an agreement between the Trust and New York Life Investments, New York Life Investments is responsible for providing or procuring certain regulatory reporting services for the Fund. The Fund will reimburse New York Life Investments for the actual costs incurred by New York Life Investments in connection with providing or procuring these services for the Fund.
(B) Distribution and Service Fees. The Trust, on behalf of the Fund, has entered into a distribution agreement with NYLIFE Distributors LLC (the “Distributor”), an affiliate of New York Life Investments. The Fund has adopted distribution plans (the “Plans”) in accordance with the provisions of Rule 12b-1 under the 1940 Act.
Pursuant to the Class A and Investor Class Plans, the Distributor receives a monthly distribution fee from the Class A and Investor Class shares at an annual rate of 0.25% of the average daily net assets of the Class A and Investor Class shares for distribution and/or service activities as designated by the Distributor. Pursuant to the Class C Plan, Class C shares pay the Distributor a monthly distribution fee at an annual rate of 0.75% of the average daily net assets of the Class C shares, along with a service fee at an annual rate of 0.25% of the average daily net assets of the Class C shares, for a total 12b-1 fee of 1.00%. Class I and Class R6 shares are not subject to a distribution and/or service fee.
The Plans provide that the distribution and service fees are payable to the Distributor regardless of the amounts actually expended by the Distributor for distribution of the Fund's shares and service activities.
(C) Sales Charges. The Fund was advised by the Distributor that the amount of initial sales charges retained on sales of Class A and Investor Class shares during the six-month period ended April 30, 2021, were $1,283 and $337, respectively.
The Fund was also advised that the Distributor retained CDSCs on redemptions of Class C shares during the six-month period ended April 30, 2021, of $107.
(D) Transfer, Dividend Disbursing and Shareholder Servicing Agent. NYLIM Service Company LLC, an affiliate of New York Life Investments, is the Fund's transfer, dividend disbursing and shareholder servicing agent pursuant to an agreement between NYLIM Service Company LLC and the Trust. NYLIM Service Company LLC has entered into an agreement with DST Asset Manager Solutions, Inc. ("DST"), pursuant to which DST performs certain transfer agent services on behalf of NYLIM Service Company LLC. New York Life Investments has contractually agreed to limit the transfer agency expenses charged to the Fund’s share classes to a maximum of 0.35% of that share class’s average daily net assets on an annual basis after deducting any applicable Fund or class-level expense reimbursement or small account
Notes to Financial Statements (Unaudited) (continued)
fees. This agreement will remain in effect until February 28, 2022, and shall renew automatically for one-year terms unless New York Life Investments provides written notice of termination prior to the start of the next term or upon approval of the Board. During the six-month period ended April 30, 2021, transfer agent expenses incurred by the Fund and any reimbursements, pursuant to the aforementioned Transfer Agency expense limitation agreement, were as follows:
| Class | Expense | Waived |
| Class A | $ 3,554 | $— |
| Investor Class | 5,271 | — |
| Class C | 11,673 | — |
| Class I | 59,691 | — |
(E) Small Account Fee. Shareholders with small accounts adversely impact the cost of providing transfer agency services. In an effort to reduce total transfer agency expenses, the Fund has implemented a small account fee on certain types of accounts. As described in the Fund's prospectus, certain shareholders with an account balance of less than $1,000 ($5,000 for Class A share accounts) are charged an annual per account fee of $20 (assessed semi-annually), the proceeds from which offset transfer agent fees as reflected in the Statement of Operations. This small account fee will not apply to certain types of accounts as described further in the Fund’s prospectus.
(F) Investments in Affiliates (in 000’s). During the six-month period ended April 30, 2021, purchases and sales transactions, income earned from investments and shares held of investment companies managed by New York Life Investments or its affiliates were as follows:
| Affiliated Investment Companies | Value,
Beginning
of Period | Purchases
at Cost | Proceeds
from
Sales | Net
Realized
Gain/(Loss)
on Sales | Change in
Unrealized
Appreciation/
(Depreciation) | Value,
End of
Period | Dividend
Income | Other
Distributions | Shares
End of
Period |
| MainStay U.S. Government Liquidity Fund | $ 4,027 | $ 121,758 | $ (124,792) | $ — | $ — | $ 993 | $ —(a) | $ — | 993 |
Note 4-Federal Income Tax
As of April 30, 2021, the cost and unrealized appreciation (depreciation) of the Fund’s investment portfolio, including applicable derivative contracts and other financial instruments, as determined on a federal income tax basis, were as follows:
| | Federal Tax
Cost | Gross
Unrealized
Appreciation | Gross
Unrealized
(Depreciation) | Net
Unrealized
Appreciation/
(Depreciation) |
| Investments | $230,530,286 | $19,431,226 | $(5,633,867) | $13,797,359 |
As of October 31, 2020, for federal income tax purposes, capital loss carryforwards of $140,897,993 were available as shown in the table below, to the extent provided by the regulations to offset future realized gains of the Fund through the years indicated. To the extent that these capital loss carryforwards are used to offset future capital gains, it is probable that the capital gains so offset will not be distributed to shareholders. No capital gain distributions shall be made until any capital loss carryforwards have been fully utilized.
Capital Loss
Available Through | Short-Term
Capital Loss
Amounts (000’s) | Long-Term
Capital Loss
Amounts (000’s) |
| Unlimited | $124,851 | $16,047 |
During the year ended October 31, 2020, the tax character of distributions paid as reflected in the Statements of Changes in Net Assets was as follows:
| | 2020 |
| Distributions paid from: | |
| Ordinary Income | $29,814,526 |
Note 5–Custodian
JPMorgan is the custodian of cash and securities held by the Fund. Custodial fees are charged to the Fund based on the Fund's net assets and/or the market value of securities held by the Fund and the number of certain transactions incurred by the Fund.
Prior to November 23, 2020, these services were provided by State Street. The services provided by State Street were a direct expense of the Fund and are included in the Statement of Operations as Custodian fees which totaled $23,881 for the period November 1, 2020 through November 22, 2020.
Note 6–Line of Credit
The Fund and certain other funds managed by New York Life Investments maintain a line of credit with a syndicate of banks in order to secure a source of funds for temporary purposes to meet unanticipated or excessive redemption requests.
Effective July 28, 2020, under the credit agreement (the “Credit Agreement”), the aggregate commitment amount is $600,000,000 with
| 34 | MainStay WMC International Research Equity Fund |
an additional uncommitted amount of $100,000,000. The commitment fee is an annual rate of 0.15% of the average commitment amount payable quarterly, regardless of usage, to JPMorgan, who serves as the agent to the syndicate. The commitment fee is allocated among the Fund and certain other funds managed by New York Life Investments based upon their respective net assets and other factors. Interest on any revolving credit loan is charged based upon the Federal Funds Rate or the one-month London Interbank Offered Rate ("LIBOR"), whichever is higher. The Credit Agreement expires on July 27, 2021, although the Fund, certain other funds managed by New York Life Investments and the syndicate of banks may renew the Credit Agreement for an additional year on the same or different terms or enter into a credit agreement with a different syndicate of banks. Prior to July 28, 2020, the aggregate commitment amount and the commitment fee were the same as those under the current Credit Agreement, but State Street served as agent to the syndicate. During the six-month period ended April 30, 2021, there were no borrowings made or outstanding with respect to the Fund under the Credit Agreement or the credit agreement for which State Street served as agent.
Note 7–Interfund Lending Program
Pursuant to an exemptive order issued by the SEC, the Fund, along with certain other funds managed by New York Life Investments, may participate in an interfund lending program. The interfund lending program provides an alternative credit facility that permits the Fund and certain other funds managed by New York Life Investments to lend or borrow money for temporary purposes directly to or from one another, subject to the conditions of the exemptive order. During the six-month period ended April 30, 2021, there were no interfund loans made or outstanding with respect to the Fund.
Note 8–Purchases and Sales of Securities (in 000’s)
During the six-month period ended April 30, 2021, purchases and sales of securities, other than short-term securities, were $204,068 and $263,210, respectively.
Note 9–Capital Share Transactions
Transactions in capital shares for the six-month period ended April 30, 2021 and the year ended October 31, 2020, were as follows:
| Class A | Shares | Amount |
| Period ended April 30, 2021: | | |
| Shares sold | 203,589 | $ 1,556,862 |
| Shares issued to shareholders in reinvestment of distributions | 33,548 | 240,873 |
| Shares redeemed | (364,100) | (2,697,580) |
| Net increase (decrease) in shares outstanding before conversion | (126,963) | (899,845) |
| Shares converted into Class A (See Note 1) | 22,235 | 167,335 |
| Net increase (decrease) | (104,728) | $ (732,510) |
| Year ended October 31, 2020: | | |
| Shares sold | 304,489 | $ 2,074,100 |
| Shares issued to shareholders in reinvestment of distributions | 239,794 | 1,709,730 |
| Shares redeemed | (1,164,431) | (7,702,927) |
| Net increase (decrease) in shares outstanding before conversion | (620,148) | (3,919,097) |
| Shares converted into Class A (See Note 1) | 43,011 | 270,177 |
| Shares converted from Class A (See Note 1) | (5,617) | (32,184) |
| Net increase (decrease) | (582,754) | $ (3,681,104) |
| |
| Investor Class | Shares | Amount |
| Period ended April 30, 2021: | | |
| Shares sold | 13,082 | $ 97,558 |
| Shares issued to shareholders in reinvestment of distributions | 7,076 | 50,598 |
| Shares redeemed | (84,042) | (634,654) |
| Net increase (decrease) in shares outstanding before conversion | (63,884) | (486,498) |
| Shares converted into Investor Class (See Note 1) | 2,331 | 17,587 |
| Shares converted from Investor Class (See Note 1) | (20,936) | (156,545) |
| Net increase (decrease) | (82,489) | $ (625,456) |
| Year ended October 31, 2020: | | |
| Shares sold | 54,587 | $ 368,340 |
| Shares issued to shareholders in reinvestment of distributions | 47,308 | 336,357 |
| Shares redeemed | (111,252) | (742,902) |
| Net increase (decrease) in shares outstanding before conversion | (9,357) | (38,205) |
| Shares converted into Investor Class (See Note 1) | 4,407 | 26,427 |
| Shares converted from Investor Class (See Note 1) | (42,961) | (268,699) |
| Net increase (decrease) | (47,911) | $ (280,477) |
| |
Notes to Financial Statements (Unaudited) (continued)
| Class C | Shares | Amount |
| Period ended April 30, 2021: | | |
| Shares sold | 4,719 | $ 34,591 |
| Shares issued to shareholders in reinvestment of distributions | 6,756 | 47,223 |
| Shares redeemed | (206,452) | (1,501,538) |
| Net increase (decrease) in shares outstanding before conversion | (194,977) | (1,419,724) |
| Shares converted from Class C (See Note 1) | (3,841) | (28,377) |
| Net increase (decrease) | (198,818) | $ (1,448,101) |
| Year ended October 31, 2020: | | |
| Shares sold | 82,424 | $ 592,715 |
| Shares issued to shareholders in reinvestment of distributions | 161,472 | 1,118,998 |
| Shares redeemed | (1,126,164) | (7,264,586) |
| Net increase (decrease) in shares outstanding before conversion | (882,268) | (5,552,873) |
| Shares converted from Class C (See Note 1) | (2,120) | (13,261) |
| Net increase (decrease) | (884,388) | $ (5,566,134) |
| |
| Class I | Shares | Amount |
| Period ended April 30, 2021: | | |
| Shares sold | 966,872 | $ 7,385,091 |
| Shares issued to shareholders in reinvestment of distributions | 751,182 | 5,423,532 |
| Shares redeemed | (9,853,500) | (73,243,191) |
| Net increase (decrease) | (8,135,446) | $(60,434,568) |
| Year ended October 31, 2020: | | |
| Shares sold | 2,542,984 | $ 17,068,101 |
| Shares issued to shareholders in reinvestment of distributions | 3,665,446 | 26,281,255 |
| Shares redeemed | (6,441,307) | (43,979,895) |
| Net increase (decrease) in shares outstanding before conversion | (232,877) | (630,539) |
| Shares converted into Class I (See Note 1) | 3,045 | 17,540 |
| Net increase (decrease) | (229,832) | $ (612,999) |
Note 10–Recent Accounting Pronouncement
In March 2020, the Financial Accounting Standards Board issued Accounting Standards Update 2020-04 (“ASU 2020-04”), which provides optional guidance to ease the potential accounting burden associated with transitioning away from LIBOR and other reference rates that are expected to be discontinued. ASU 2020-04 was effective immediately upon release of the update on March 12, 2020 and remains effective through December 31, 2022. At this time, the Manager is evaluating the implications of certain other provisions of ASU 2020-04 related to new disclosure requirements and any impact on the financial statement disclosures has not yet been determined.
Note 11–Other Matters
An outbreak of COVID-19, first detected in December 2019, has developed into a global pandemic and has resulted in travel restrictions, closure of international borders, certain businesses and securities markets, restrictions on securities trading activities, prolonged quarantines, supply chain disruptions, and lower consumer demand, as well as general concern and uncertainty. The continued impact of COVID-19 is uncertain and could further adversely affect the global economy, national economies, individual issuers and capital markets in unforeseeable ways and result in a substantial and extended economic downturn. Developments that disrupt global economies and financial markets, such as COVID-19, may magnify factors that affect the Fund's performance.
Note 12–Subsequent Events
In connection with the preparation of the financial statements of the Fund as of and for the six-month period ended April 30, 2021, events and transactions subsequent to April 30, 2021, through the date the financial statements were issued have been evaluated by the Manager for possible adjustment and/or disclosure. No subsequent events requiring financial statement adjustment or disclosure have been identified.
| 36 | MainStay WMC International Research Equity Fund |
Board Consideration and Approval of Management Agreement and Subadvisory Agreement (Unaudited)
The continuation of the Management Agreement with respect to the MainStay WMC International Research Equity Fund (formerly known as the MainStay MacKay International Opportunities Fund) (“Fund”) and New York Life Investment Management LLC (“New York Life Investments”) and the Subadvisory Agreement between New York Life Investments and MacKay Shields LLC (“MacKay”) with respect to the Fund (together, “Advisory Agreements���), following an initial term of up to two years, is subject to annual review and approval by the Board of Trustees of MainStay Funds Trust (“Board” of the “Trust”) in accordance with Section 15 of the Investment Company Act of 1940, as amended (“1940 Act”). At its December 9–10, 2020 meeting, the Board, including the Trustees who are not an “interested person” (as such term is defined in the 1940 Act) of the Trust (“Independent Trustees”) voting separately, unanimously approved the continuation of each of the Advisory Agreements for a one-year period.
In reaching the decision to approve the continuation of each of the Advisory Agreements, the Board considered information furnished by New York Life Investments and MacKay in connection with an annual contract review process undertaken by the Board that took place at meetings of the Board and its Contracts Committee during September 2020 through December 2020, as well as other information furnished to the Board and its Committees throughout the year, as deemed relevant by the Trustees. Information requested by and furnished to the Board for consideration in connection with the contract review process included, among other items, reports on the Fund and “peer funds” prepared by Strategic Insight Mutual Fund Research and Consulting, LLC (“Strategic Insight”), an independent third-party service provider engaged by the Board to report objectively on the Fund’s investment performance, management fee and total expenses. The Board also considered information on the fees charged to other investment advisory clients of New York Life Investments and/or MacKay that follow investment strategies similar to those of the Fund, if any, and, when applicable, the rationale for any differences in the Fund’s management and subadvisory fees and the fees charged to those other investment advisory clients. In addition, the Board considered information furnished by New York Life Investments and MacKay in response to requests prepared on behalf of the Board, and in consultation with the Independent Trustees, by independent legal counsel to the Independent Trustees, which encompassed a variety of topics, including those summarized below.
The Board took into account information provided in connection with its meetings throughout the year, including, among other items, information regarding the legal standards and fiduciary obligations applicable to its consideration of the continuation of each of the Advisory Agreements and investment performance reports on the Fund as well as presentations from New York Life Investments and MacKay personnel. The Board also took into account other information received from New York Life Investments throughout the year, including, among other items, periodic reports on legal and compliance matters, risk management, portfolio turnover, brokerage commissions and non-advisory services provided to the Fund by New York Life Investments. The contract review process, including the structure and format for materials provided to the Board,
has been developed in consultation with the Board. The Independent Trustees also met in executive sessions with their independent legal counsel and, for a portion thereof, with senior management of New York Life Investments.
In addition to information provided to the Board throughout the year, the Board received information in connection with its June 2020 meeting provided specifically in response to requests prepared on behalf of the Board, and in consultation with the Independent Trustees, by independent legal counsel regarding the Fund’s distribution arrangements. In addition, the Board received information regarding the Fund’s asset levels, share purchase and redemption activity and the payment of Rule 12b-1 and/or other fees by applicable share classes of the Fund, among other information.
In considering the continuation of each of the Advisory Agreements, the Trustees reviewed and evaluated the information and factors they believed to reasonably be necessary and appropriate in light of legal advice furnished to them by independent legal counsel and through the exercise of their own business judgment. Although individual Trustees may have weighed certain factors or information differently, the factors considered by the Board are described in greater detail below and include, among other factors: (i) the nature, extent and quality of the services provided to the Fund by New York Life Investments and MacKay; (ii) the qualifications of the portfolio managers of the Fund and the historical investment performance of the Fund, New York Life Investments and MacKay; (iii) the costs of the services provided, and profits realized, by New York Life Investments and MacKay from their relationships with the Fund; (iv) the extent to which economies of scale have been realized or may be realized as the Fund grows and the extent to which economies of scale have benefited or may benefit the Fund’s shareholders; and (v) the reasonableness of the Fund’s management and subadvisory fees and total ordinary operating expenses. Although the Board recognized that comparisons between the Fund’s fees and expenses and those of other funds are imprecise given different terms of agreements, variations in fund strategies and other factors, the Board considered the reasonableness of the Fund’s management fee and total ordinary operating expenses as compared to the peer funds identified by Strategic Insight. Throughout their considerations, the Trustees acknowledged the commitment of New York Life Investments and its affiliates to serve the MainStay Group of Funds, as well as their capacity, experience, resources, financial stability and reputations. The Trustees also acknowledged the entrepreneurial and other risks assumed by New York Life Investments in sponsoring and managing the Fund.
The Trustees noted that, throughout the year, the Trustees are afforded an opportunity to ask questions of, and request additional information or materials from, New York Life Investments and MacKay. The Board’s decision with respect to each of the Advisory Agreements may have also been based, in part, on the Board’s knowledge of New York Life Investments and MacKay resulting from, among other things, the Board’s consideration of each of the Advisory Agreements in prior years, the advisory agreements for other funds in the MainStay Group of Funds, the Board’s review throughout the year of the performance and operations of
Board Consideration and Approval of Management Agreement and Subadvisory Agreement (Unaudited) (continued)
other funds in the MainStay Group of Funds and each Trustee’s business judgment and industry experience. In addition to considering the above-referenced factors, the Board observed that in the marketplace there are a range of investment options available to the Fund’s shareholders and such shareholders, having had the opportunity to consider other investment options, have chosen to invest in the Fund.
The factors that figured prominently in the Board’s decision to approve the continuation of each of the Advisory Agreements during its December 9–10, 2020 meeting are summarized in more detail below, and the Board did not consider any factor or information controlling in reaching such decision.
Nature, Extent and Quality of Services Provided by New York Life Investments and MacKay
The Board examined the nature, extent and quality of the services that New York Life Investments provides to the Fund. The Board evaluated New York Life Investments’ experience and capabilities in serving as manager of the Fund and considered that the Fund operates in a “manager-of-managers” structure. The Board also considered New York Life Investments’ responsibilities and services provided pursuant to this structure, including evaluating the performance of MacKay, making recommendations to the Board as to whether the Subadvisory Agreement should be renewed, modified or terminated and periodically reporting to the Board regarding the results of New York Life Investments’ evaluation and monitoring functions. The Board noted that New York Life Investments manages other mutual funds, serves a variety of other investment advisory clients, including other pooled investment vehicles, and has experience overseeing mutual fund service providers, including subadvisors. The Board considered the experience of senior personnel at New York Life Investments providing management and administrative and other non-advisory services to the Fund as well as New York Life Investments’ reputation and financial condition. The Board observed that New York Life Investments devotes significant resources and time to providing management and non-advisory services to the Fund, including New York Life Investments’ supervision and due diligence reviews of MacKay and ongoing analysis of, and interactions with, MacKay with respect to, among other things, the Fund’s investment performance and risks as well as MacKay’s investment capabilities and subadvisory services with respect to the Fund.
The Board also considered the range of services that New York Life Investments provides to the Fund under the terms of the Management Agreement, including: (i) fund accounting and ongoing supervisory services provided by New York Life Investments’ Fund Administration and Accounting Group; (ii) investment supervisory and analytical services provided by New York Life Investments’ Investment Consulting Group; (iii) compliance services provided by the Trust’s Chief Compliance Officer as well as New York Life Investments’ compliance department, including supervision and implementation of the Fund’s compliance program; (iv) legal services provided by New York Life Investments’ Office of the General Counsel; and (v) risk management monitoring and analysis by compliance and investment personnel. The Board noted that New York
Life Investments provides certain other non-advisory services to the Fund. In addition, the Board considered New York Life Investments’ willingness to invest in personnel, infrastructure, technology, operational enhancements, cyber security, information security, shareholder privacy resources and business continuity planning designed to benefit the Fund and noted that New York Life Investments is responsible for compensating the Trust’s officers, except for a portion of the salary of the Trust’s Chief Compliance Officer. The Board recognized that New York Life Investments has provided an increasingly broad array of non-advisory services to the MainStay Group of Funds as a result of regulatory and other developments, including in connection with the designation of New York Life Investments as the administrator of the MainStay Group of Funds’ liquidity risk management program adopted under the 1940 Act. The Board considered benefits to shareholders from being part of the MainStay Group of Funds, including the privilege of exchanging investments between the same class of shares of funds in the MainStay Group of Funds, including without the imposition of a sales charge (if any).
The Board also examined the nature, extent and quality of the investment advisory services that MacKay provides to the Fund and considered the terms of each of the Advisory Agreements. The Board evaluated MacKay’s experience in serving as subadvisor to the Fund and advising other portfolios and MacKay’s track record and experience in providing investment advisory services, the experience of investment advisory, senior management and administrative personnel at MacKay and New York Life Investments’ and MacKay’s overall resources, legal and compliance environment, capabilities and history. In addition to information provided in connection with quarterly meetings with the Trust’s Chief Compliance Officer, the Board considered information regarding the compliance policies and procedures of New York Life Investments and MacKay and acknowledged their commitment to further developing and strengthening compliance programs relating to the Fund. The Board reviewed MacKay’s ability to attract and retain qualified investment professionals and willingness to invest in personnel to service and support the Fund. In this regard, the Board considered the experience of the Fund’s portfolio managers, the number of accounts managed by the portfolio managers and the method for compensating the portfolio managers.
In addition, the Board considered discussions with New York Life Investments regarding the implementation of its business continuity plans and recognized steps taken by New York Life Investments and MacKay to continue to provide the same nature, extent and quality of services to the Fund during the COVID-19 pandemic.
Based on these considerations, the Board concluded that the Fund would likely continue to benefit from the nature, extent and quality of these services.
| 38 | MainStay WMC International Research Equity Fund |
Investment Performance
In evaluating the Fund’s investment performance, the Board considered investment performance results over various periods in light of the Fund’s investment objective, strategies and risks. The Board considered investment reports on, and analysis of, the Fund’s performance provided to the Board throughout the year. These reports include, among other items, information on the Fund’s gross and net returns, the Fund’s investment performance compared to relevant investment categories and the Fund’s benchmark, the Fund’s risk-adjusted investment performance and the Fund’s investment performance as compared to peer funds, as appropriate, as well as portfolio attribution information and commentary on the effect of market conditions. The Board also considered information provided by Strategic Insight showing the investment performance of the Fund as compared to peer funds.
The Board also gave weight to its discussions with senior management at New York Life Investments concerning the Fund’s investment performance attributable to MacKay as well as discussions between the Fund’s portfolio managers and the members of the Board’s Investment Committee, which generally occur on an annual basis. In addition, the Board considered any specific actions that New York Life Investments or MacKay had taken, or had agreed to take, to seek to enhance Fund investment performance and the results of those actions. In considering the investment performance of the Fund, the Board noted that the Fund underperformed its peer funds for the three- and five-year periods ended July 31, 2020, and performed favorably relative to its peer funds for the one- and ten-year periods ended July 31, 2020. The Board considered its discussions with representatives from New York Life Investments and MacKay regarding the Fund’s investment performance.
Based on these considerations, the Board concluded that its review of the Fund’s investment performance and related information supported a determination to approve the continuation of each of the Advisory Agreements.
Costs of the Services Provided, and Profits Realized, by New York Life Investments and MacKay
The Board considered the costs of the services provided under each of the Advisory Agreements. The Board also considered the profits realized by New York Life Investments and its affiliates, including MacKay, due to their relationships with the Fund. Because MacKay is an affiliate of New York Life Investments whose subadvisory fee is paid by New York Life Investments, not the Fund, the Board considered cost and profitability information for New York Life Investments and MacKay in the aggregate.
In addition, the Board acknowledged the difficulty in obtaining reliable comparative data about mutual fund managers’ profitability because such information generally is not publicly available and may be impacted by numerous factors, including the structure of a fund manager’s organization, the types of funds it manages, the methodology used to allocate certain fixed costs to specific funds and the manager’s capital structure and costs of capital.
In evaluating the costs of the services provided by New York Life Investments and MacKay and profits realized by New York Life Investments and its affiliates, including MacKay, the Board considered, among other factors, each party’s continuing investments in, or willingness to invest in, personnel, systems, equipment and other resources and infrastructure to support and further enhance the management of the Fund, and that New York Life Investments is responsible for paying the subadvisory fee for the Fund. The Board also considered the financial resources of New York Life Investments and MacKay and acknowledged that New York Life Investments and MacKay must be in a position to attract and retain experienced professional personnel and to maintain a strong financial position for New York Life Investments and MacKay to continue to provide high-quality services to the Fund. The Board recognized that the Fund benefits from the allocation of certain fixed costs among the funds in the MainStay Group of Funds, among other expected benefits resulting from its relationship with New York Life Investments.
The Board considered information regarding New York Life Investments’ methodology for calculating profitability and allocating costs provided by New York Life Investments in connection with the fund profitability analysis presented to the Board. The Board previously engaged an independent consultant to review the methods used to allocate costs among the funds in the MainStay Group of Funds. The Board noted that the independent consultant had concluded that New York Life Investments’ methods for allocating costs and procedures for estimating overall profitability of the relationship with the funds in the MainStay Group of Funds are reasonable and that New York Life Investments continued to use the same method of calculating profit and allocating costs since the independent consultant’s review. The Board recognized the difficulty in calculating and evaluating a manager’s profitability with respect to the Fund and noted that other profitability methodologies may also be reasonable.
The Board also considered certain fall-out benefits that may be realized by New York Life Investments and its affiliates due to their relationships with the Fund, including reputational and other indirect benefits. The Board recognized, for example, the benefits to MacKay from legally permitted “soft-dollar” arrangements by which brokers provide research and other services to MacKay in exchange for commissions paid by the Fund with respect to trades on the Fund’s portfolio securities. In addition, the Board considered its review of a money market fund advised by New York Life Investments and an affiliated subadvisor that serves as an investment option for the Fund, including the potential rationale for and costs associated with investments in this money market fund by the Fund, if any, and considered information from New York Life Investments that the nature and type of specific investment advisory services provided to this money market fund are distinct from, or in addition to, the investment advisory services provided to the Fund.
The Board observed that, in addition to fees earned by New York Life Investments for managing the Fund, New York Life Investments’ affiliates also earn revenues from serving the Fund in various other capacities, including as the Fund’s transfer agent and distributor. The Board
Board Consideration and Approval of Management Agreement and Subadvisory Agreement (Unaudited) (continued)
considered information about these other revenues and their impact on the profitability of the relationship with the Fund to New York Life Investments and its affiliates. The Board noted that, although it assessed the overall profitability of the Fund to New York Life Investments and its affiliates as part of the contract review process, when considering the reasonableness of the fee paid to New York Life Investments and its affiliates under each of the Advisory Agreements, the Board considered the profitability of New York Life Investments’ relationship with the Fund on a pre-tax basis and without regard to distribution expenses incurred by New York Life Investments from its own resources.
After evaluating the information deemed relevant by the Trustees, the Board concluded that any profits realized by New York Life Investments and its affiliates, including MacKay, due to their relationships with the Fund were not excessive.
Management and Subadvisory Fees and Total Ordinary Operating Expenses
The Board evaluated the reasonableness of the fee paid under each of the Advisory Agreements and the Fund’s total ordinary operating expenses. The Board primarily considered the reasonableness of the management fee paid by the Fund to New York Life Investments, because the subadvisory fee paid to MacKay is paid by New York Life Investments, not the Fund. The Board also considered the reasonableness of the subadvisory fee paid by New York Life Investments and the amount of the management fee retained by New York Life Investments.
In assessing the reasonableness of the Fund’s fees and expenses, the Board primarily considered comparative data provided by Strategic Insight on the fees and expenses charged by similar mutual funds managed by other investment advisers. In addition, the Board considered information provided by New York Life Investments and MacKay on fees charged to other investment advisory clients, including institutional separate accounts and/or other funds that follow investment strategies similar to those of the Fund, if any. The Board considered the similarities and differences in the contractual management fee schedules of the Fund and these similarly-managed accounts and/or funds, taking into account the rationale for any differences in fee schedules. The Board also took into account explanations provided by New York Life Investments about the more extensive scope of services provided to registered investment companies, such as the Fund, as compared with other investment advisory clients. Additionally, the Board considered the impact of voluntary waivers and expense limitation arrangements on the Fund’s net management fee and expenses. The Board also considered that in proposing fees for the Fund, New York Life Investments considers the competitive marketplace for mutual funds.
The Board noted that, outside of the Fund’s management fee and the fees charged under a share class’s Rule 12b-1 and/or shareholder services plans, a share class’s most significant “other expenses” are transfer agent fees. Transfer agent fees are charged to the Fund based on the number of shareholder accounts (a “per-account” fee). The Board took into account information from New York Life Investments regarding the
reasonableness of the Fund’s transfer agent fee schedule, including industry data demonstrating that the per-account fees that NYLIM Service Company LLC, an affiliate of New York Life Investments and the Fund’s transfer agent, charges the Fund are within the range of per-account fees charged by transfer agents to other mutual funds. In addition, the Board considered NYLIM Service Company LLC’s profitability in connection with the transfer agent services it provides to the Fund. The Board also took into account information received from NYLIM Service Company LLC regarding the sub-transfer agency payments it made to intermediaries in connection with the provision of sub-transfer agency services to the Fund.
The Board considered that, because the Fund’s transfer agent fees are billed on a per-account basis, the impact of transfer agent fees on a share class’s expense ratio may be more significant in cases where the share class has a high number of small accounts. The Board considered the extent to which transfer agent fees comprised total expenses of the Fund. The Board acknowledged the role that the MainStay Group of Funds historically has played in serving the investment needs of New York Life Insurance Company customers, who often maintain smaller account balances than other shareholders of funds, and the impact of small accounts on the expense ratios of Fund share classes. The Board also recognized measures that it and New York Life Investments have taken to mitigate the effect of small accounts on the expense ratios of Fund share classes, including through the imposition of an expense limitation on net transfer agency expenses. The Board noted that, for purposes of allocating transfer agency fees and expenses, each retail fund in the MainStay Group of Funds combines the shareholder accounts of its Class A, A2, I, R1, R2 and R3 shares (as applicable) into one group and the shareholder accounts of its Investor Class, SIMPLE Class and Class B, C and C2 shares (as applicable) into another group. The Board also noted that the per-account fees attributable to each group of share classes is then allocated among the constituent share classes based on relative net assets and that a MainStay Fund’s Class R6 shares, if any, are not combined with any other share class for this purpose. The Board considered New York Life Investments’ rationale with respect to these groupings and previously received a report from an independent consultant engaged to conduct comparative analysis of these groupings. The Board also considered that NYLIM Service Company LLC had waived its contractual cost of living adjustments during the past seven years.
Based on the factors outlined above, the Board concluded that the Fund’s management fee and total ordinary operating expenses were within a range that is competitive and support a conclusion that these fees and expenses are reasonable.
Economies of Scale
The Board considered information regarding economies of scale, including whether the Fund’s expense structure permits economies of scale to be appropriately shared with the Fund’s shareholders. The Board also considered a report from New York Life Investments, previously prepared at the request of the Board, that addressed economies of scale, including with respect to the mutual fund business generally and the
| 40 | MainStay WMC International Research Equity Fund |
various ways in which the benefits of economies of scale may be shared with the funds in the MainStay Group of Funds. Although the Board recognized the difficulty of determining economies of scale with precision, the Board acknowledged that economies of scale may be shared with the Fund in a number of ways, including, for example, through the imposition of management fee breakpoints, initially setting management fee rates at scale or making additional investments to enhance services. The Board reviewed information from New York Life Investments showing how the Fund’s management fee schedule compared to fee schedules of other funds and accounts managed by New York Life Investments. The Board also reviewed information from Strategic Insight showing how the Fund’s management fee schedule compared with fees paid for similar services by peer funds at varying asset levels.
Based on this information, the Board concluded that economies of scale are appropriately reflected for the benefit of the Fund’s shareholders through the Fund’s expense structure and other methods to share benefits from economies of scale.
Conclusion
On the basis of the information and factors summarized above, among other information and factors deemed relevant by the Trustees, and the evaluation thereof, the Board, including the Independent Trustees voting separately, unanimously voted to approve the continuation of each of the Advisory Agreements.
Board consideration and Approval of Subadvisory Agreement with Wellington Management Company LLP (Unaudited)
The Subadvisory Agreement between New York Life Investment Management LLC (“New York Life Investments”) and Wellington Management Company LLP (“Wellington”) with respect to the MainStay WMC International Research Equity Fund (formerly known as the MainStay MacKay International Opportunities Fund) (“Fund”) (“New Subadvisory Agreement”), must be approved initially and, following an initial term of up to two years, is subject to annual review and approval by the Board of Trustees of MainStay Funds Trust (“Board” of the “Trust”) in accordance with Section 15 of the Investment Company Act of 1940, as amended (“1940 Act”). At its February 3, 2021 meeting, the Board, including the Trustees who are not an “interested person” (as such term is defined in the 1940 Act) of the Trust (“Independent Trustees”) voting separately, unanimously approved the New Subadvisory Agreement for an initial two-year period.
At meetings held on January 21, January 25 and February 3, 2021, the Board considered and approved New York Life Investments’ recommendations to appoint Wellington as the subadvisor to the Fund, to approve the New Subadvisory Agreement, to approve the related changes to the Fund’s principal investment strategies, name and investment process, to approve the reduction of the contractual management fee for the Fund and to approve the establishment of a new expense limitation agreement for Class I shares of the Fund (the “Repositioning”), all effective on or about March 5, 2021. The Board noted that the material terms of the New Subadvisory Agreement are substantially identical to the terms of the then-current subadvisory agreement with MacKay Shields LLC (“MacKay”) with respect to the Fund, but that the subadvisory fee schedule under the New Subadvisory Agreement with Wellington includes fees that are lower at every level of assets than the subadvisory fees paid to MacKay under the then-current subadvisory agreement.
In reaching the decisions to approve the Repositioning and New Subadvisory Agreement, the Board considered information furnished by New York Life Investments and Wellington in connection with meetings of the Board and its Contracts, Investment and Risk and Compliance Oversight Committees held on January 21, January 25 and February 3, 2021, as well as other information furnished to the Board and its Committees throughout the year, as deemed relevant by the Trustees. In addition, the Board considered information previously provided to the Board in connection with its review of the subadvisory agreements for other funds in the MainStay Group of Funds, as deemed relevant to each Trustee. The Board also considered information furnished by Wellington in response to requests prepared on behalf of the Board, and in consultation with the Independent Trustees, by independent legal counsel to the Independent Trustees, which encompassed a variety of topics, including those summarized below.
The Board took into account information provided in connection with its meetings throughout the year, including, among other items, information regarding the legal standards and fiduciary obligations applicable to its consideration of the New Subadvisory Agreement and investment performance reports on the Fund as well as presentations from New York Life Investments and Wellington personnel. The contract review process, including the structure and format for materials provided to the Board,
has been developed in consultation with the Board. The Independent Trustees also met in executive sessions with their independent legal counsel and, for a portion thereof, with senior management of New York Life Investments.
In considering the Repositioning and the New Subadvisory Agreement, the Trustees reviewed and evaluated the information and factors they believed to reasonably be necessary and appropriate in light of legal advice furnished to them by independent legal counsel and through the exercise of their own business judgment. Although individual Trustees may have weighed certain factors or information differently, the factors considered by the Board are described in greater detail below and include, among other factors: (i) the nature, extent and quality of the services to be provided to the Fund by Wellington; (ii) the investment performance of the Fund, the qualifications of the proposed portfolio managers of the Fund and the historical investment performance of products managed by such portfolio managers with investment strategies similar to those of the Fund, as repositioned; (iii) the anticipated costs of the services to be provided, and profits expected to be realized, by Wellington from its relationship with the Fund; (iv) the extent to which economies of scale may be realized if the Fund grows and the extent to which economies of scale may benefit the Fund’s shareholders; and (v) the reasonableness of the Fund’s proposed subadvisory fee to be paid by New York Life Investments to Wellington and estimated total ordinary operating expenses. Although the Board recognized that comparisons between the Fund’s proposed fees and estimated expenses and those of other funds are imprecise given different terms of agreements, variations in fund strategies and other factors, the Board considered the reasonableness of the Fund’s proposed fees and estimated total ordinary operating expenses as compared to the peer funds identified by New York Life Investments.
Although individual Trustees may have weighed certain factors or information differently, the Board’s decisions to approve the Repositioning and the New Subadvisory Agreement were based on a consideration of the information provided to the Trustees throughout the year, such as presentations from Wellington personnel, as well as information furnished specifically in connection with the contract review process for the Fund, in each case as deemed relevant to each Trustee. The Trustees noted that, throughout the year, the Trustees would be afforded an opportunity to ask questions of, and request additional information or materials from, New York Life Investments and Wellington with respect to the Fund. The Board took note of New York Life Investments’ belief that Wellington, with its resources and historical investment performance track record for strategies similar to those of the Fund, as repositioned, is well qualified to serve as the Fund’s subadvisor. In addition to considering the above-referenced factors, the Board observed that in the marketplace there are a range of investment options available to the Fund’s shareholders and such shareholders, having had the opportunity to consider other investment options, have chosen to invest in the Fund.
| 42 | MainStay WMC International Research Equity Fund |
The factors that figured prominently in the Board’s decisions to approve the Repositioning and the New Subadvisory Agreement are summarized in more detail below, and the Board did not consider any factor or information controlling in reaching such decisions.
Nature, Extent and Quality of Services to be Provided by Wellington
In considering the Repositioning and the New Subadvisory Agreement, the Board considered New York Life Investments’ responsibilities as manager of the Fund, noting that New York Life Investments is responsible for supervising the Fund’s subadvisor. The Board examined the nature, extent and quality of the investment advisory services that Wellington proposed to provide to the Fund. Further, the Board evaluated and/or examined the following with regard to Wellington:
| • | experience in providing investment advisory services; |
| • | experience in serving as advisor or subadvisor to other funds with similar strategies as those of the Fund, as repositioned, and the performance track record of those funds; |
| • | experience of investment advisory, senior management and administrative personnel; |
| • | overall legal and compliance environment, resources and history and policies and procedures in place with respect to matters that may involve conflicts of interest between the Fund’s investments and those of other accounts managed by Wellington; |
| • | New York Life Investments’ and Wellington’s belief that their respective compliance policies, procedures and systems are reasonably designed to prevent violation of the federal securities laws and their commitment to further developing and strengthening compliance programs relating to the MainStay Group of Funds generally and the Fund specifically; |
| • | ability to attract and retain qualified investment professionals and willingness to invest in personnel to service and support the Fund; |
| • | portfolio construction and risk management processes; |
| • | experience of the Fund’s proposed portfolio managers, including with respect to investment strategies similar to those of the Fund, the number of accounts managed by the portfolio managers and the method for compensating the portfolio managers; and |
| • | overall reputation, financial condition and assets under management. |
Based on these considerations, the Board concluded that the Fund would likely benefit from the nature, extent and quality of the proposed investment advisory services to be provided by Wellington.
Investment Performance
In evaluating the Fund’s investment performance, the Board considered investment performance results over various periods in light of the Fund’s investment objective, strategies and risks. The Board considered investment reports on, and analysis of, the Fund’s performance provided
to the Board throughout the year. These reports include, among other items, information on the Fund’s gross and net returns, the Fund’s investment performance compared to relevant investment categories and the Fund’s benchmark, the Fund’s risk-adjusted investment performance and the Fund’s investment performance as compared to peer funds, as appropriate, as well as portfolio attribution information and commentary on the effect of market conditions.
The Board also gave weight to its discussions with senior management at New York Life Investments concerning the Fund’s investment performance and remediation efforts undertaken by New York Life Investments, and other alternatives to the Repositioning, and the New Subadvisory Agreement considered by New York Life Investments. In addition, the Board considered steps taken to seek to improve the Fund’s investment performance and discussions between the Fund’s current portfolio management team and the Investment Committee of the Board. The Board further considered that shareholders may benefit from Wellington’s investment process, including its portfolio construction and risk management processes. The Board noted that the Repositioning had not yet been implemented so an investment performance track record for the Fund, as repositioned, was not available.
The Board evaluated the Fund’s proposed portfolio management team, investment process, strategies and risks. The Board noted that Wellington currently manages one or more portfolios with investment strategies similar to those of the Fund, as repositioned. Additionally, the Board considered the historical performance of such portfolio or portfolios and other portfolios managed by the proposed portfolio managers for the Fund. Based on these considerations, the Board concluded that the Fund was likely to be managed responsibly and capably by Wellington.
Based on these considerations, the Board concluded that the selection of Wellington as the subadvisor to the Fund is likely to benefit the Fund’s long-term investment performance.
Costs of the Services to be Provided, and Profits to be Realized, by Wellington
The Board considered the anticipated costs of the services to be provided by Wellington under the New Subadvisory Agreement and the profits expected to be realized by Wellington due to its relationship with the Fund. The Board considered that Wellington’s subadvisory fee had been negotiated at arm’s-length by New York Life Investments and that these fees would be paid by New York Life Investments, not the Fund.
In evaluating the anticipated costs of the services to be provided by Wellington and profits expected to be realized by Wellington, the Board considered, among other factors, Wellington’s investments in, or willingness to invest in, personnel, systems, equipment and other resources and infrastructure to support and further enhance the services proposed to be provided to the Fund, and that New York Life Investments would be responsible for paying the subadvisory fee to Wellington. The Board also considered the financial resources of Wellington and acknowledged that Wellington must be in a position to attract and retain experienced professional personnel and to maintain a strong financial
Board consideration and Approval of Subadvisory Agreement with Wellington Management Company LLP (Unaudited) (continued)
position for Wellington to be able to provide high-quality services to the Fund. The Board also considered that New York Life Investments proposed to reduce the contractual management fee for the Fund and proposed an expense limitation agreement for Class I shares of the Fund.
In considering anticipated costs and profitability, the Board also considered certain fall-out benefits that may be realized by Wellington due to its relationship with the Fund, including reputational and other indirect benefits. The Board recognized, for example, the potential benefits to Wellington from legally permitted “soft-dollar” arrangements by which brokers would provide research and other services to Wellington in exchange for commissions paid by the Fund with respect to trades in the Fund’s portfolio securities. In addition, the Board also requested and received information from New York Life Investments concerning other material business relationships between Wellington and its affiliates and New York Life Investments and its affiliates, and considered the existence of a strategic partnership between New York Life Investments and Wellington that relates to certain current and future products that represented a conflict of interest associated with New York Life Investments’ recommendation to approve the Repositioning and the New Subadvisory Agreement.
The Board took into account the fact that the Fund would undergo changes to its principal investment strategies in connection with the Repositioning. The Board noted estimates from New York Life Investments and Wellington that a significant portion of the holdings of the Fund would be sold to align the Fund’s holdings with the strategies that would be pursued by Wellington. Additionally, the Board considered New York Life Investments’ representation that New York Life Investments would work closely with Wellington to seek to execute the optimal transition strategy and that New York Life Investments would make every effort to minimize potential direct and indirect costs associated with the Repositioning.
The Board considered that any profits realized by Wellington due to its relationship with the Fund would be the result of arm’s-length negotiations between New York Life Investments and Wellington, acknowledging that any such profits would be based on fees paid to Wellington by New York Life Investments, not the Fund.
Subadvisory Fee and Estimated Total Ordinary Operating Expenses
The Board evaluated the reasonableness of the fee to be paid under the New Subadvisory Agreement and the Fund’s estimated total ordinary operating expenses. The Board primarily considered the reasonableness of the management fee to be paid by the Fund to New York Life Investments because the subadvisory fee to be paid to Wellington would be paid by New York Life Investments, not the Fund. The Board also considered the reasonableness of the subadvisory fee to be paid by New York Life Investments and the amount of the management fee expected to be retained by New York Life Investments.
In assessing the reasonableness of the Fund’s proposed fees and estimated expenses, the Board considered information provided by New York Life Investments on fees and expenses of peer funds. The Board also considered that in proposing fees for the Fund, New York Life Investments considers the competitive marketplace for mutual funds.
Based on the factors outlined above, the Board concluded that the Fund’s management fee and total ordinary operating expenses were within a range that is competitive and support a conclusion that these fees and expenses are reasonable.
Economies of Scale
The Board considered information regarding economies of scale, including whether the Fund’s proposed expense structure would permit economies of scale to be appropriately shared with the Fund’s shareholders. The Board also considered a report from New York Life Investments, previously prepared at the request of the Board, that addressed economies of scale, including with respect to the mutual fund business generally and the various ways in which the benefits of economies of scale may be shared with the funds in the MainStay Group of Funds. Although the Board recognized the difficulty of determining economies of scale with precision, the Board acknowledged that economies of scale may be shared with the Fund in a number of ways, including, for example, through the imposition of fee breakpoints, initially setting management fee rates at scale or making additional investments to enhance services.
Based on this information, the Board concluded that economies of scale are appropriately reflected for the benefit of the Fund’s shareholders through the Fund’s proposed expense structure and other methods to share benefits from economies of scale.
Conclusion
On the basis of the information and factors summarized above, among other information and factors deemed relevant by the Trustees, and the evaluation thereof, the Board, including the Independent Trustees voting separately, unanimously voted to approve the Repositioning and the New Subadvisory Agreement.
| 44 | MainStay WMC International Research Equity Fund |
Discussion of the Operation and Effectiveness of the Fund's Liquidity Risk Management Program (Unaudited)
In compliance with Rule 22e-4 under the Investment Company Act of 1940, as amended (the “Liquidity Rule”), the Fund has adopted and implemented a liquidity risk management program (the “Program”), which New York Life Investment Management LLC believes is reasonably designed to assess and manage the Fund's liquidity risk (the risk that the Fund could not meet requests to redeem shares issued by the Fund without significant dilution of remaining investors’ interests in the Fund). The Board of Trustees of MainStay Funds Trust (the "Board") designated New York Life Investment Management LLC as administrator of the Program (the “Administrator”). The Administrator has established a Liquidity Risk Management Committee to assist the Administrator in the implementation and day-to-day administration of the Program and to otherwise support the Administrator in fulfilling its responsibilities under the Program.
At a meeting of the Board held on March 8, 2021, the Administrator provided the Board with a written report addressing the Program’s operation and assessing its adequacy and effectiveness of implementation for the period from January 1, 2020 through December 31, 2020 (the "Review Period"), as required under the Liquidity Rule. The report noted that the Administrator concluded that (i) the Program operated effectively to assess and manage the Fund's liquidity risk, (ii) the Program has been adequately and effectively implemented to monitor and, as applicable, respond to the Fund's liquidity developments and (iii) the Fund's investment strategy continues to be appropriate for an open-end fund. In addition, the report discussed notable events that impacted liquidity risk during the Review Period, including the COVID-19 pandemic and the resulting economic shutdown.
In accordance with the Program, the Fund's liquidity risk is assessed no less frequently than annually taking into consideration certain factors, as applicable, such as (i) investment strategy and liquidity of portfolio investments, (ii) short-term and long-term cash flow projections and (iii) holdings of cash and cash equivalents, as well as borrowing arrangements and other funding sources. Certain factors are considered under both normal and reasonably foreseeable stressed conditions.
Each Fund portfolio investment is classified into one of four liquidity categories. The classification is based on a determination of the number of days it is reasonably expected to take to convert the investment into cash, or sell or dispose of the investment, in current market conditions without significantly changing the market value of the investment. The Administrator has delegated liquidity classification determinations to the Fund’s subadvisor, subject to appropriate oversight by the Administrator, and classification determinations are made by taking into account the Fund's reasonably anticipated trade size, various market, trading and investment-specific considerations, as well as market depth, and, in certain cases, third-party vendor data.
The Liquidity Rule requires funds that do not primarily hold assets that are highly liquid investments to adopt a minimum amount of net assets that must be invested in highly liquid investments that are assets (an “HLIM”). In addition, the Liquidity Rule limits a fund's investments in illiquid investments. Specifically, the Liquidity Rule prohibits acquisition of illiquid investments if doing so would result in a fund holding more than 15% of its net assets in illiquid investments that are assets. The Program includes provisions reasonably designed to determine, periodically review and comply with the HLIM requirement, as applicable, and to comply with the 15% limit on illiquid investments.
There can be no assurance that the Program will achieve its objectives under all circumstances in the future. Please refer to the Fund's prospectus for more information regarding the Fund's exposure to liquidity risk and other risks to which it may be subject.
Proxy Voting Record
The Fund is required to file with the Securities and Exchange Commissions's ("SEC") its proxy voting records for the 12-month period ending June 30 on Form N-PX. The most recent Form N-PX or proxy voting record is available free of charge upon request by calling 800-624-6782; visiting the MainStay Funds’ website at newyorklifeinvestments.com; or visiting the SEC’s website at www.sec.gov.
Shareholder Reports and Quarterly Portfolio Disclosure
The Fund is required to file its complete schedule of portfolio holdings with the SEC 60 days after its first and third fiscal quarter on Form N-PORT. The Fund's holdings report is available free of charge upon request by calling New York Life Investments at 800-624-6782.
| 46 | MainStay WMC International Research Equity Fund |
Equity
U.S. Equity
MainStay Epoch U.S. Equity Yield Fund
MainStay MacKay S&P 500 Index Fund
MainStay Winslow Large Cap Growth Fund
MainStay WMC Enduring Capital Fund
MainStay WMC Growth Fund
MainStay WMC Small Companies Fund
MainStay WMC Value Fund
International Equity
MainStay Epoch International Choice Fund
MainStay MacKay International Equity Fund
MainStay WMC International Research Equity Fund
Emerging Markets Equity
MainStay Candriam Emerging Markets Equity Fund
Global Equity
MainStay Epoch Capital Growth Fund
MainStay Epoch Global Equity Yield Fund
Fixed Income
Taxable Income
MainStay Candriam Emerging Markets Debt Fund
MainStay Floating Rate Fund
MainStay MacKay High Yield Corporate Bond Fund
MainStay MacKay Short Duration High Yield Fund
MainStay MacKay Strategic Bond Fund
MainStay MacKay Total Return Bond Fund
MainStay MacKay U.S. Infrastructure Bond Fund
MainStay Short Term Bond Fund
Tax-Exempt Income
MainStay MacKay California Tax Free Opportunities Fund1
MainStay MacKay High Yield Municipal Bond Fund
MainStay MacKay Intermediate Tax Free Bond Fund
MainStay MacKay New York Tax Free Opportunities Fund2
MainStay MacKay Short Term Municipal Fund
MainStay MacKay Tax Free Bond Fund
Money Market
MainStay Money Market Fund
Mixed Asset
MainStay Balanced Fund
MainStay Income Builder Fund
MainStay MacKay Convertible Fund
Speciality
MainStay CBRE Global Infrastructure Fund
MainStay CBRE Real Estate Fund
MainStay Cushing MLP Premier Fund
Asset Allocation
MainStay Conservative Allocation Fund
MainStay Conservative ETF Allocation Fund
MainStay Defensive ETF Allocation Fund
MainStay Equity Allocation Fund
MainStay Equity ETF Allocation Fund
MainStay Growth Allocation Fund
MainStay Growth ETF Allocation Fund
MainStay Moderate Allocation Fund
MainStay Moderate ETF Allocation Fund
Manager
New York Life Investment Management LLC
New York, New York
Subadvisors
Candriam Belgium S.A.3
Brussels, Belgium
Candriam Luxembourg S.C.A.3
Strassen, Luxembourg
CBRE Clarion Securities LLC
Radnor, Pennsylvania
Cushing Asset Management, LP
Dallas, Texas
Epoch Investment Partners, Inc.
New York, New York
MacKay Shields LLC3
New York, New York
NYL Investors LLC3
New York, New York
Wellington Management Company LLP
Boston, Massachusetts
Winslow Capital Management, LLC
Minneapolis, Minnesota
Legal Counsel
Dechert LLP
Washington, District of Columbia
Independent Registered Public Accounting Firm
KPMG LLP
Philadelphia, Pennsylvania
Distributor
NYLIFE Distributors LLC3
Jersey City, New Jersey
Custodian
JPMorgan Chase Bank, N.A.
New York, New York
1.
This Fund is registered for sale in AZ, CA, NV, OR, TX, UT, WA and MI (Class A and I shares only), and CO, FL, GA, HI, ID, MA, MD, NH, NJ and NY (Class I shares only).
| 2. | This Fund is registered for sale in CA, CT, DE, FL, MA, NJ, NY and VT. |
| 3. | An affiliate of New York Life Investment Management LLC. |
Not part of the Semiannual Report
For more information
800-624-6782
newyorklifeinvestments.com
“New York Life Investments” is both a service mark, and the common trade name, of certain investment advisors affiliated with New York Life Insurance Company. The MainStay Funds® are managed by New York Life Investment Management LLC and distributed by NYLIFE Distributors LLC, 30 Hudson Street, Jersey City, NJ 07302, a wholly owned subsidiary of New York Life Insurance Company. NYLIFE Distributors LLC is a Member FINRA/SIPC.
©2021 NYLIFE Distributors LLC. All rights reserved.
| 1737581MS071-21 | MSWIRE10-06/21 |
(NYLIM) NL530
MainStay WMC Small Companies Fund
(formerly known as MainStay MacKay Small Cap Core Fund)
Message from the President and Semiannual Report
Unaudited | April 30, 2021
Sign up for e-delivery of your shareholder reports. For full details on e-delivery, including who can participate and what you can receive via e-delivery,
please log in to newyorklifeinvestments.com/accounts.
| Not FDIC/NCUA Insured | Not a Deposit | May Lose Value | No Bank Guarantee | Not Insured by Any Government Agency |
This page intentionally left blank
Message from the President
With the approval of COVID-19 vaccines and the passage of relief packages by the U.S. Congress, economic prospects improved during the reporting period, and investor risk appetite increased, benefiting both equities and fixed-income markets. Despite some volatility stemming from a sell-off in longer-dated Treasury securities, the stock market and higher-risk segments of the fixed-income market posted gains for the six months ended April 30, 2021.
By the beginning of the reporting period, the economy had made tremendous progress from the second quarter of 2020, when economic activity plunged. But uncertainty about when vaccines would be available and how quickly they could be administered left investors unsure about the economic outlook.
With the approval of several vaccines in November, the outlook brightened and investors became less risk-averse. Anticipating the likely end of the pandemic and a continuation of the economic recovery, they began to see opportunities in investment-grade and high-yield bonds and more cyclical segments of the stock market. The $900 billion relief and stimulus package passed in December provided further assurance.
In January, the Federal Reserve opted to leave interest rates unchanged, pointing to some uncertainty about the pace of the global recovery. Officials also noted that inflation remained low, citing oil prices in particular.
In March, President Biden signed the $1.9 billion American Rescue Plan, which, among other provisions, called for payments of $1,400 for those earning less than $75,000 per year, plus $1,400 per dependent. This, combined with the Federal Reserve’s new tolerance for inflation and an anticipated $2 trillion infrastructure spending bill, added to growing concerns about higher prices. Supply shortages in some markets caused some prices to soar, heightening concerns further.
In fixed-income markets, an improving economic outlook and rising inflation expectations led to a sell-off in longer-term Treasuries, with the result that the yield on the 10-year note rose sharply, particularly in February and March. Investment grade corporate bonds were also affected. Early in the reporting period, they performed well as investors shifted out of Treasuries, but as the reporting period progressed, they faltered. Longer-dated securities issued in recent years at historically low interest rates became especially unattractive.
High-yield bonds remained steady, supported by more favorable yields and an improved economic outlook, which reduced their perceived risk. Municipal bonds produced modest gains, and
although the sell-off in Treasuries produced some volatility early in 2021, stronger-than-expected tax revenues, $350 billion in financial support from the federal government, and the possibility of an increase in federal income tax rates appeared to buoy the market late in the reporting period.
Inflation concerns and volatility in the Treasury market led to a shift in equities markets. Although the S&P 500® Index, a widely followed measure of U.S. equities, posted double-digit gains and hit a record high, the rise of Treasury yields disrupted valuations, especially those of growth stocks. Technology companies that saw their valuations soar amid the work-from-home trend in 2020 suffered large declines.
But the fiscal stimulus and continued accommodation from the Federal Reserve gave investors confidence the economic recovery would continue. Combined with the sky-high valuations in technology and growth stocks, this increased the appeal of more cyclical and value-oriented shares. As a result, value stocks outperformed growth stocks during the reporting period.
Reflecting the shift in investor sentiment, the performance of S&P 500® Index sectors varied widely. While the information technology sector kept up with the broader market, it lagged cyclical sectors such as energy and financials, which led the way. The shift was further reflected in the performance of small-cap stocks, which outperformed large caps. While developed markets kept pace with the U.S. market, lagging economic and pandemic recoveries appeared to weigh on emerging markets late in the reporting period.
With the lockdown restrictions lifting in the U.S. and the pandemic easing in many regions, we at New York Life Investments are looking forward to a return to a more normal economy. We anticipate that over the next several years, a variety of trends will likely offer long-term investors many attractive opportunities. With this in mind, we continue to develop products and services to help you to take advantage of these trends, manage your risks, and ultimately meet your investment goals.
Sincerely,
Kirk C. Lehneis
President
The opinions expressed are as of the date of this report and are subject to change. There is no guarantee that any forecast made will come to pass. This material does not constitute investment advice and is not intended as an endorsement of any specific investment. Past performance is no guarantee of future results.
Not part of the Semiannual Report
Investors should refer to the Fund’s Summary Prospectus and/or Prospectus and consider the Fund’s investment objectives, strategies, risks, charges and expenses carefully before investing. The Summary Prospectus and/or Prospectus contain this and other information about the Fund. You may obtain copies of the Fund’s Summary Prospectus, Prospectus and Statement of Additional Information free of charge, upon request, by calling toll-free 800-624-6782, by writing to NYLIFE Distributors LLC, Attn: MainStay Marketing Department, 30 Hudson Street, Jersey City, NJ 07302 or by sending an e-mail to MainStayShareholderServices@nylim.com. These documents are also available via the MainStay Funds’ website at newyorklifeinvestments.com. Please read the Fund’s Summary Prospectus and/or Prospectus carefully before investing.
Investment and Performance Comparison (Unaudited)
Performance data quoted represents past performance. Past performance is no guarantee of future results. Because of market volatility and other factors, current performance may be lower or higher than the figures shown. Investment return and principal value will fluctuate, and as a result, when shares are redeemed, they may be worth more or less than their original cost. The graph below depicts the historical performance of Class I shares of the Fund. Performance will vary from class to class based on differences in class-specific expenses and sales charges. For performance information current to the most recent month-end, please call 800-624-6782 or visit newyorklifeinvestments.com.
The performance table and graph do not reflect the deduction of taxes that a shareholder would pay on distributions or Fund share redemptions. Total returns reflect maximum applicable sales charges as indicated in the table below, if any, changes in share price, and reinvestment of dividend and capital gain distributions. The graph assumes the initial investment amount shown below and reflects the deduction of all sales charges that would have applied for the period of investment. Performance figures may reflect certain fee waivers and/or expense limitations, without which total returns may have been lower. For more information on share classes and current fee waivers and/or expense limitations (if any), please refer to the Notes to Financial Statements.
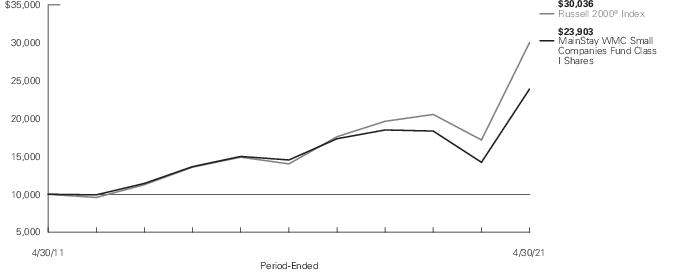
| Average Annual Total Returns for the Period-Ended April 30, 20211 |
| Class | Sales Charge | | Inception
Date2 | Six
Months | One
Year | Five
Years | Ten Years
or Since
Inception | Gross
Expense
Ratio3 |
| Class A Shares | Maximum 5.5% Initial Sales Charge | With sales charges | 1/2/2004 | 36.95% | 58.53% | 8.96% | 8.22% | 1.25% |
| | | Excluding sales charges | | 44.92 | 67.76 | 10.20 | 8.84 | 1.25 |
| Investor Class Shares4 | Maximum 5% Initial Sales Charge | With sales charges | 2/28/2008 | 37.52 | 58.08 | 8.66 | 7.92 | 1.70 |
| | | Excluding sales charges | | 44.76 | 67.28 | 9.90 | 8.53 | 1.70 |
| Class B Shares5 | Maximum 5% CDSC | With sales charges | 1/2/2004 | 39.22 | 61.02 | 8.79 | 7.72 | 2.45 |
| | if Redeemed Within the First Six Years of Purchase | Excluding sales charges | | 44.22 | 66.02 | 9.08 | 7.72 | 2.45 |
| Class C Shares | Maximum 1% CDSC | With sales charges | 12/30/2002 | 43.19 | 65.00 | 9.07 | 7.71 | 2.45 |
| | if Redeemed Within One Year of Purchase | Excluding sales charges | | 44.19 | 66.00 | 9.07 | 7.71 | 2.45 |
| Class I Shares | No Sales Charge | | 1/12/1987 | 45.13 | 68.12 | 10.47 | 9.11 | 1.00 |
| Class R1 Shares | No Sales Charge | | 7/31/2012 | 45.00 | 67.99 | 10.36 | 11.31 | 1.10 |
| Class R2 Shares | No Sales Charge | | 7/31/2012 | 44.84 | 67.56 | 10.08 | 11.03 | 1.35 |
| Class R3 Shares | No Sales Charge | | 2/29/2016 | 44.70 | 67.13 | 9.80 | 11.10 | 1.60 |
| 1. | The Fund replaced its subadvisor, changed its investment objective and modified its principal investment strategies as of April 1, 2019. Therefore, the performance information shown in this report prior to April 1, 2019 reflects that of the Fund’s prior subadvisor, investment objective and principal investment strategies. |
| 2. | Effective March 5, 2021, the Fund replaced its subadvisor and modified its principal investment strategies. The past performance in the graph and table prior to that date reflects the Fund's prior subadvisor and principal investment strategies. |
| 3. | The gross expense ratios presented reflect the Fund’s “Total Annual Fund Operating Expenses” from the most recent Prospectus, as supplemented, and may differ from other expense ratios disclosed in this report. |
| 4. | Prior to June 30, 2020, the maximum initial sales charge was 5.5%, which is reflected in the average annual total return figures shown. |
| 5. | Class B shares are closed to all new purchases as well as additional investments by existing Class B shareholders. |
The footnotes on the next page are an integral part of the table and graph and should be carefully read in conjunction with them.
| Benchmark Performance | Six
Months | One
Year | Five
Years | Ten
Years |
| Russell 2000® Index1 | 48.06% | 74.91% | 16.48% | 11.63% |
| Morningstar Small Blend Category Average2 | 48.62 | 71.22 | 13.52 | 9.98 |
| 1. | The Fund has selected the Russell 2000® Index as its primary benchmark. The Russell 2000® Index measures the performance of the small-cap segment of the U.S. equity universe. It is a subset of the Russell 3000® Index and includes approximately 2,000 of the smallest securities based on a combination of their market cap and current index membership. |
| 2. | The Morningstar Small Blend Category Average is representative of funds that favor U.S. firms at the smaller end of the market-capitalization range. Some aim to own an array of value and growth stocks while others employ a discipline that leads to holdings with valuations and growth rates close to the small-cap averages. Stocks in the bottom 10% of the capitalization of the U.S. equity market are defined as small cap. The blend style is assigned to portfolios where neither growth nor value characteristics predominate. Results are based on average total returns of similar funds with all dividends and capital gain distributions reinvested. |
The footnotes on the preceding page are an integral part of the table and graph and should be carefully read in conjunction with them.
| 6 | MainStay WMC Small Companies Fund |
Cost in Dollars of a $1,000 Investment in MainStay WMC Small Companies Fund (Unaudited)
The example below is intended to describe the fees and expenses borne by shareholders during the six-month period from November 1, 2020, to April 30, 2021, and the impact of those costs on your investment.
Example
As a shareholder of the Fund you incur two types of costs: (1) transaction costs, including exchange fees and sales charges (loads) on purchases (as applicable), and (2) ongoing costs, including management fees, distribution and/or service (12b-1) fees, and other Fund expenses (as applicable). This example is intended to help you understand your ongoing costs (in dollars) of investing in the Fund and to compare these costs with the ongoing costs of investing in other mutual funds. The example is based on an investment of $1,000 made at the beginning of the six-month period and held for the entire period from November 1, 2020, to April 30, 2021.
This example illustrates your Fund’s ongoing costs in two ways:
Actual Expenses
The second and third data columns in the table below provide information about actual account values and actual expenses. You may use the information in these columns, together with the amount you invested, to estimate the expenses that you paid during the six months ended April 30, 2021. Simply divide your account value by $1,000 (for example, an
$8,600 account value divided by $1,000 = 8.6), then multiply the result by the number under the heading entitled “Expenses Paid During Period” to estimate the expenses you paid on your account during this period.
Hypothetical Example for Comparison Purposes
The fourth and fifth data columns in the table below provide information about hypothetical account values and hypothetical expenses based on the Fund’s actual expense ratio and an assumed rate of return of 5% per year before expenses, which is not the Fund’s actual return. The hypothetical account values and expenses may not be used to estimate the actual ending account balances or expenses you paid for the six-month period shown. You may use this information to compare the ongoing costs of investing in the Fund with the ongoing costs of investing in other mutual funds. To do so, compare this 5% hypothetical example with the 5% hypothetical examples that appear in the shareholder reports of the other mutual funds.
Please note that the expenses shown in the table are meant to highlight your ongoing costs only and do not reflect any transactional costs, such as exchange fees or sales charges (loads). Therefore, the fourth and fifth data columns of the table are useful in comparing ongoing costs only and will not help you determine the relative total costs of owning different funds. In addition, if these transactional costs were included, your costs would have been higher.
| Share Class | Beginning
Account
Value
11/1/20 | Ending Account
Value (Based
on Actual
Returns and
Expenses)
4/30/21 | Expenses
Paid
During
Period1 | Ending Account
Value (Based
on Hypothetical
5% Annualized
Return and
Actual Expenses)
4/30/21 | Expenses
Paid
During
Period1 | Net Expense
Ratio
During
Period2 |
| Class A Shares | $1,000.00 | $1,449.20 | $ 7.35 | $1,018.79 | $ 6.06 | 1.21% |
| Investor Class Shares | $1,000.00 | $1,447.60 | $ 9.04 | $1,017.41 | $ 7.45 | 1.49% |
| Class B Shares | $1,000.00 | $1,442.20 | $13.56 | $1,013.69 | $11.18 | 2.24% |
| Class C Shares | $1,000.00 | $1,441.90 | $13.56 | $1,013.69 | $11.18 | 2.24% |
| Class I Shares | $1,000.00 | $1,451.30 | $ 5.83 | $1,020.03 | $ 4.81 | 0.96% |
| Class R1 Shares | $1,000.00 | $1,450.00 | $ 6.44 | $1,019.54 | $ 5.31 | 1.06% |
| Class R2 Shares | $1,000.00 | $1,448.40 | $ 7.95 | $1,018.30 | $ 6.56 | 1.31% |
| Class R3 Shares | $1,000.00 | $1,447.00 | $ 9.46 | $1,017.06 | $ 7.80 | 1.56% |
| 1. | Expenses are equal to the Fund’s annualized expense ratio of each class multiplied by the average account value over the period, divided by 365 and multiplied by 181 (to reflect the six-month period). The table above represents the actual expenses incurred during the six-month period. In addition to the fees and expenses which the Fund bears directly, it also indirectly bears a pro rata share of the fees and expenses of the underlying funds in which it invests. Such indirect expenses are not included in the above-reported expense figures. |
| 2. | Expenses are equal to the Fund's annualized expense ratio to reflect the six-month period. |
Industry Composition as of April 30, 2021 (Unaudited)
| Biotechnology | 9.6% |
| Software | 9.1 |
| Household Durables | 6.9 |
| Building Products | 5.5 |
| Banks | 5.0 |
| Health Care Equipment & Supplies | 4.4 |
| Thrifts & Mortgage Finance | 4.3 |
| Auto Components | 3.6 |
| Machinery | 3.4 |
| Equity Real Estate Investment Trusts | 3.2 |
| Chemicals | 3.1 |
| Electronic Equipment, Instruments & Components | 2.9 |
| Capital Markets | 2.8 |
| Consumer Finance | 2.7 |
| Energy Equipment & Services | 2.6 |
| Food Products | 2.5 |
| Trading Companies & Distributors | 2.2 |
| Internet & Direct Marketing Retail | 2.0 |
| Semiconductors & Semiconductor Equipment | 1.8 |
| Life Sciences Tools & Services | 1.7% |
| Gas Utilities | 1.7 |
| Construction & Engineering | 1.7 |
| Marine | 1.6 |
| Media | 1.5 |
| Professional Services | 1.5 |
| Diversified Financial Services | 1.5 |
| Air Freight & Logistics | 1.4 |
| Health Care Providers & Services | 1.4 |
| Communications Equipment | 1.3 |
| Electrical Equipment | 1.3 |
| Metals & Mining | 1.2 |
| Real Estate Management & Development | 1.2 |
| Exchange–Traded Fund | 0.7 |
| Diversified Telecommunication Services | 0.0‡ |
| Short–Term Investments | 5.0 |
| Other Assets, Less Liabilities | –2.3 |
| | 100.0% |
| ‡ | Less than one–tenth of a percent. |
See Portfolio of Investments beginning on page 11 for specific holdings within these categories. The Fund's holdings are subject to change.
Top Ten Holdings as of April 30, 2021 (excluding short-term investments) (Unaudited)
| 1. | Boise Cascade Co. |
| 2. | Quotient Technology, Inc. |
| 3. | Astec Industries, Inc. |
| 4. | Dana, Inc. |
| 5. | Insteel Industries, Inc. |
| 6. | GoPro, Inc., Class A |
| 7. | JELD-WEN Holding, Inc. |
| 8. | Tower Semiconductor Ltd. |
| 9. | Agilysys, Inc. |
| 10. | Cloudera, Inc. |
| 8 | MainStay WMC Small Companies Fund |
Portfolio Management Discussion and Analysis (Unaudited)
Questions answered by Migene Kim, CFA, and Mona Patni of MacKay Shields LLC (“MacKay Shields”), the Fund’s former Subadvisor, and portfolio manager Peter W. Carpi, CFA, of Wellington Management Company LLP (“Wellington”), the Fund’s current Subadvisor.
How did MainStay WMC Small Companies Fund perform relative to its benchmark and peer group during the six months ended April 30, 2021?
For the six months ended April 30, 2021, Class I shares of WMC Small Companies Fund returned 45.13%, underperforming the 48.06% return of the Fund’s primary benchmark, the Russell 2000® Index. Over the same period, Class I shares also underperformed the 48.62% return of the Morningstar Small Blend Category Average.1
Were there any changes to the Fund during the reporting period?
At meetings held on January 21, January 25, and February 3, 2021, the Board of Trustees of MainStay Funds Trust considered and approved, among other related proposals: (i) appointing Wellington Management Company LLP as the Fund’s subadvisor, and the related subadvisory agreement; (ii) changing the Fund’s name; and (iii) modifying the Fund’s principal investment strategies and investment process. For more information on these and other changes, refer to the supplement dated February 5, 2021.
In the process of implementing the new principal investment strategies and investment process, the Fund experienced a high level of portfolio turnover. Also, during this transition period, the Fund may not have been pursuing its investment objective or may not have been managed consistent with its investment strategies as stated in the Prospectus. This may have impacted the Fund’s performance.
What factors affected the Fund’s relative performance during the reporting period?
MacKay Shields
During the time MacKay Shields managed the Fund, adverse stock selection undermined returns relative to the Russell 2000® Index. In terms of stock selection model efficacy, the combination of signals used by the quantitative stock selection model was not rewarded due mostly to weakness in valuation and sentiment measures.
Wellington
During the time Wellington managed the Fund, security selection and sector allocation were responsible for the Fund’s underperformance relative to the Russell 2000® Index. Weak selection in the energy, materials and information technology sectors was partially offset by positive selection in the consumer discretionary and industrials sectors. Sector allocation, a result of our bottom-up stock selection process, also detracted from returns. The Fund’s overweight exposure to the information technology and energy sectors weighed on relative returns but
was partially offset by the positive impact of the Fund’s underweight exposure to health care.
During the reporting period, which sectors were the strongest positive contributors to the Fund’s relative performance and which sectors were particularly weak?
MacKay Shields
During the time MacKay Shields managed the Fund, the strongest positive contributions to the Fund’s performance relative to the Russell 2000® Index came from the financials, information technology and utilities sectors. (Contributions take weightings and total returns into account.) Over the same period, the consumer discretionary, health care and industrials sectors were the weakest contributors to relative performance.
Wellington
During the time Wellington managed the Fund, the industrials, consumer discretionary and communication services sectors provided the strongest positive contributions to relative performance. Over the same period, the energy, information technology and materials sectors detracted most significantly from the Fund’s relative performance.
During the reporting period, which individual stocks made the strongest positive contributions to the Fund’s absolute performance and which stocks detracted the most?
MacKay Shields
The individual stocks that made the strongest positive contributions to the Fund’s absolute performance during the time MacKay Shields managed the Fund included electrical component & equipment maker Plug Power, biotechnology company Novavax and electrical component & equipment maker Atkore. The stocks that detracted most significantly from the Fund’s absolute performance during the same period were movie and entertainment company AMC Entertainment Holdings, apparel retailer Express and biotechnology firm Arena Pharmaceuticals.
Wellington
During the time Wellington managed the Fund, the individual stocks that detracted most significantly from absolute performance were industrial drilling contractor Nabors Industries and biotechnology company Odonate Therapeutics. The share price of Nabors fell from earlier highs as uncertainty regarding the company’s capital deployment decisions—and their impact on the bottom line—weighed on shares. Management stated a focus on debt repayment to reflect an improving operating environment. The Fund continued to hold a position in Nabors at the end of the reporting period. Odonate Therapeutics’ shares declined as the company announced the discontinuation of the development of
| 1. | See page 5 for other share class returns, which may be higher or lower than Class I share returns. See page 6 for more information on benchmark and peer group returns. |
Tesetaxel, a drug candidate for the treatment of metastatic breast cancer. The company determined that U.S. Food and Drug Administration (FDA) approval was unlikely based on the FDA’s feedback that the drug’s risk of toxicity did not outweigh the benefit. We eliminated the position in Odonate Therapeutics from the Fund.
The Fund’s top two contributors to absolute performance during the same period were integrated wood products manufacturer and building materials distributor Boise Cascade, and wearable camera manufacturer GoPro. The share price of Boise Cascade rose as the company benefited from tight industry conditions. While total volumes were down, margins rose as the imbalance of demand for building materials continued to drive pricing higher. The share price of GoPro rose as the company introduced a rebranded, subscription-based mobile app with powerful video and photo editing capabilities, named Quik, in an effort to expand their application’s addressable market beyond GoPro camera owners. Both positions were still held in the Fund as of the end of the reporting period.
What were some of the Fund’s largest purchases and sales during the reporting period?
MacKay Shields
During the time MacKay Shields managed the Fund, the Fund’s largest initial purchase was in staffing and employment services provider Upwork, while its largest increased position size was in Plug Power, mentioned above. During the same period, the Fund exited its full position in heart medication specialist MyoKardia, while its most significantly reduced position size was in engineering and construction firm TopBuild.
Wellington
During the time Wellington managed the Fund, the Fund initiated positions in Enova International, a financial technology company offering artificial intelligence and machine learning lending solutions, and Veritone, a cloud-based artificial intelligence media technology company. During the same period, the Fund eliminated positions in Kulicke & Soffa Industries, a capital equipment manufacturer, and B. Riley Financial, a diversified financial company.
How did the Fund’s sector and/or country weightings change during the reporting period?
MacKay Shields
During the time MacKay Shields managed the Fund, the Fund's largest increases in sector exposures relative to the Russell 2000® Index were in the financials and utilities sectors. Conversely, the Fund's largest decreases in benchmark-relative
sector exposures were in the health care and information technology sectors.
Wellington
Wellington seeks to keep the Fund’s sector and industry exposures close to those of the Russell 2000® Index so that stock selection drives returns. Changes in sector and industry exposures tend to be modest. The largest increases in active weight during the time Wellington managed the Fund were in the industrials, real estate and materials sectors, while the largest decrease was within the information technology sector.
How was the Fund positioned at the end of the reporting period?
MacKay Shields
At the end of the period when MacKay Shields managed the Fund, the Fund held overweight exposure relative to the Russell 2000® Index in the consumer discretionary and information technology sectors. As of the same date, the Fund’s most significantly underweight positions relative to the benchmark were in the real estate and materials sectors.
Wellington
As of April 30, 2021, the Fund’s largest overweight exposures relative to the Russell 2000® Index were in the information technology and industrials sectors. As of the same date, the Fund’s most significantly underweight exposures were to the consumer discretionary and real estate sectors.
The opinions expressed are those of the portfolio managers as of the date of this report and are subject to change. There is no guarantee that any forecasts will come to pass. This material does not constitute investment advice and is not intended as an endorsement of any specific investment.
| 10 | MainStay WMC Small Companies Fund |
Portfolio of Investments April 30, 2021† (Unaudited)
| | Shares | Value |
| Common Stocks 96.6% |
| Air Freight & Logistics 1.4% |
| Hub Group, Inc., Class A (a) | 82,446 | $ 5,418,351 |
| Auto Components 3.6% |
| Dana, Inc. | 296,807 | 7,509,217 |
| Gentherm, Inc. (a) | 92,348 | 6,575,178 |
| | | 14,084,395 |
| Banks 5.0% |
| Allegiance Bancshares, Inc. | 90,290 | 3,575,484 |
| First Midwest Bancorp, Inc. | 186,319 | 3,907,110 |
| OceanFirst Financial Corp. | 125,058 | 2,858,826 |
| United Community Banks, Inc. | 134,335 | 4,395,441 |
| Veritex Holdings, Inc. | 138,353 | 4,673,564 |
| | | 19,410,425 |
| Biotechnology 9.6% |
| Apellis Pharmaceuticals, Inc. (a) | 84,922 | 4,302,998 |
| Arena Pharmaceuticals, Inc. (a) | 55,151 | 3,785,013 |
| Celldex Therapeutics, Inc. (a) | 220,138 | 6,676,785 |
| ChemoCentryx, Inc. (a) | 42,400 | 2,049,192 |
| Dicerna Pharmaceuticals, Inc. (a) | 130,940 | 4,084,019 |
| Global Blood Therapeutics, Inc. (a) | 68,777 | 2,804,726 |
| Kura Oncology, Inc. (a) | 106,862 | 2,877,794 |
| Myovant Sciences Ltd. (a)(b) | 201,328 | 4,207,755 |
| Sage Therapeutics, Inc. (a) | 44,975 | 3,542,231 |
| TCR2 Therapeutics, Inc. (a) | 141,560 | 3,214,828 |
| | | 37,545,341 |
| Building Products 5.5% |
| Insteel Industries, Inc. | 195,974 | 7,472,489 |
| JELD-WEN Holding, Inc. (a) | 245,878 | 7,172,261 |
| PGT Innovations, Inc. (a) | 250,247 | 6,589,003 |
| | | 21,233,753 |
| Capital Markets 2.8% |
| Hamilton Lane, Inc., Class A | 57,422 | 5,193,820 |
| Moelis & Co., Class A | 105,168 | 5,708,519 |
| | | 10,902,339 |
| Chemicals 3.1% |
| Livent Corp. (a) | 358,300 | 6,456,566 |
| Minerals Technologies, Inc. | 71,287 | 5,570,366 |
| | | 12,026,932 |
| Communications Equipment 1.3% |
| Harmonic, Inc. (a) | 667,416 | 5,219,193 |
| | Shares | Value |
| |
| Construction & Engineering 1.7% |
| Badger Daylighting Ltd. (b) | 191,405 | $ 6,474,897 |
| Consumer Finance 2.7% |
| Enova International, Inc. (a) | 175,849 | 6,021,070 |
| PRA Group, Inc. (a) | 117,508 | 4,427,701 |
| | | 10,448,771 |
| Diversified Financial Services 1.5% |
| ECN Capital Corp. | 888,172 | 5,954,145 |
| Diversified Telecommunication Services 0.0% ‡ |
| CONTRA BMTECHNOLOGIES (a) | 7,029 | 68,955 |
| Electrical Equipment 1.3% |
| EnerSys | 53,864 | 4,932,865 |
| Electronic Equipment, Instruments & Components 2.9% |
| FARO Technologies, Inc. (a) | 74,352 | 5,639,228 |
| Knowles Corp. (a) | 273,527 | 5,716,714 |
| | | 11,355,942 |
| Energy Equipment & Services 2.6% |
| DMC Global, Inc. (a) | 94,039 | 5,078,106 |
| Nabors Industries Ltd. | 62,142 | 5,024,181 |
| | | 10,102,287 |
| Equity Real Estate Investment Trusts 3.2% |
| Acadia Realty Trust | 313,824 | 6,555,783 |
| Uniti Group, Inc. | 499,900 | 5,698,860 |
| | | 12,254,643 |
| Food Products 2.5% |
| Calavo Growers, Inc. | 56,759 | 4,434,581 |
| Hostess Brands, Inc. (a) | 357,110 | 5,460,212 |
| | | 9,894,793 |
| Gas Utilities 1.7% |
| New Jersey Resources Corp. | 154,720 | 6,490,504 |
| Health Care Equipment & Supplies 4.4% |
| Avanos Medical, Inc. (a) | 114,938 | 4,966,471 |
| Orthofix Medical, Inc. (a) | 123,558 | 5,479,797 |
| SI-BONE, Inc. (a) | 184,777 | 6,559,584 |
| | | 17,005,852 |
| Health Care Providers & Services 1.4% |
| AMN Healthcare Services, Inc. (a) | 67,648 | 5,364,486 |
The notes to the financial statements are an integral part of, and should be read in conjunction with, the financial statements.
11
Portfolio of Investments April 30, 2021† (Unaudited) (continued)
| | Shares | Value |
| Common Stocks (continued) |
| Household Durables 6.9% |
| Century Communities, Inc. (a) | 93,513 | $ 6,914,351 |
| GoPro, Inc., Class A (a) | 657,812 | 7,387,229 |
| Installed Building Products, Inc. | 50,834 | 6,844,798 |
| Skyline Champion Corp. (a) | 125,217 | 5,563,391 |
| | | 26,709,769 |
| Internet & Direct Marketing Retail 2.0% |
| Quotient Technology, Inc. (a) | 482,848 | 7,889,736 |
| Life Sciences Tools & Services 1.7% |
| Codexis, Inc. (a) | 285,160 | 6,610,009 |
| Machinery 3.4% |
| Astec Industries, Inc. | 100,911 | 7,569,334 |
| Lydall, Inc. (a) | 153,049 | 5,639,856 |
| | | 13,209,190 |
| Marine 1.6% |
| Kirby Corp. (a) | 94,688 | 6,031,626 |
| Media 1.5% |
| Cardlytics, Inc. (a) | 43,651 | 6,003,322 |
| Metals & Mining 1.2% |
| MP Materials Corp. (a)(b) | 157,300 | 4,725,292 |
| Professional Services 1.5% |
| ICF International, Inc. | 65,808 | 5,992,476 |
| Real Estate Management & Development 1.2% |
| Marcus & Millichap, Inc. (a) | 132,401 | 4,676,403 |
| Semiconductors & Semiconductor Equipment 1.8% |
| Tower Semiconductor Ltd. (a) | 252,655 | 7,150,137 |
| Software 9.1% |
| Agilysys, Inc. (a) | 141,018 | 7,108,717 |
| Box, Inc., Class A (a) | 298,944 | 6,367,507 |
| Cloudera, Inc. (a) | 552,127 | 7,006,492 |
| Envestnet, Inc. (a) | 59,234 | 4,373,246 |
| PROS Holdings, Inc. (a) | 125,854 | 5,409,205 |
| Veritone, Inc. (a)(b) | 209,400 | 5,050,728 |
| | | 35,315,895 |
| | Shares | | Value |
| |
| Thrifts & Mortgage Finance 4.3% |
| Federal Agricultural Mortgage Corp., Class C | 4,600 | | $ 473,156 |
| MGIC Investment Corp. | 432,116 | | 6,585,448 |
| NMI Holdings, Inc., Class A (a) | 224,100 | | 5,790,744 |
| WSFS Financial Corp. | 75,656 | | 3,865,265 |
| | | | 16,714,613 |
| Trading Companies & Distributors 2.2% |
| Boise Cascade Co. | 127,534 | | 8,509,068 |
Total Common Stocks
(Cost $367,575,656) | | | 375,726,405 |
| Exchange-Traded Fund 0.7% |
| iShares Russell 2000 ETF (b) | 12,279 | | 2,761,425 |
Total Exchange-Traded Fund
(Cost $2,365,632) | | | 2,761,425 |
| Short-Term Investments 5.0% |
| Affiliated Investment Company 2.6% |
| MainStay U.S. Government Liquidity Fund, 0.01% (c) | 10,184,663 | | 10,184,663 |
| Unaffiliated Investment Company 2.4% |
| BlackRock Liquidity FedFund, 0.05% (c)(d) | 9,388,946 | | 9,388,946 |
Total Short-Term Investments
(Cost $19,573,609) | | | 19,573,609 |
Total Investments
(Cost $389,514,897) | 102.3% | | 398,061,439 |
| Other Assets, Less Liabilities | (2.3) | | (8,868,795) |
| Net Assets | 100.0% | | $ 389,192,644 |
| † | Percentages indicated are based on Fund net assets. |
| ‡ | Less than one-tenth of a percent. |
| (a) | Non-income producing security. |
| (b) | All or a portion of this security was held on loan. As of April 30, 2021, the aggregate market value of securities on loan was $11,021,670; the total market value of collateral held by the Fund was $11,631,245. The market value of the collateral held included non-cash collateral in the form of U.S. Treasury securities with a value of $2,242,299. The Fund received cash collateral with a value of $9,388,946. (See Note 2(H)) |
| (c) | Current yield as of April 30, 2021. |
| (d) | Represents a security purchased with cash collateral received for securities on loan. |
The notes to the financial statements are an integral part of, and should be read in conjunction with, the financial statements.
| 12 | MainStay WMC Small Companies Fund |
| Abbreviation(s): |
| ETF—Exchange-Traded Fund |
The following is a summary of the fair valuations according to the inputs used as of April 30, 2021, for valuing the Fund’s assets:
| Description | Quoted
Prices in
Active
Markets for
Identical
Assets
(Level 1) | | Significant
Other
Observable
Inputs
(Level 2) | | Significant
Unobservable
Inputs
(Level 3) | | Total |
| Asset Valuation Inputs | | | | | | | |
| Investments in Securities (a) | | | | | | | |
| Common Stocks | $ 375,657,450 | | $ 68,955 | | $ — | | $ 375,726,405 |
| Exchange-Traded Fund | 2,761,425 | | — | | — | | 2,761,425 |
| Short-Term Investments | | | | | | | |
| Affiliated Investment Company | 10,184,663 | | — | | — | | 10,184,663 |
| Unaffiliated Investment Company | 9,388,946 | | — | | — | | 9,388,946 |
| Total Short-Term Investments | 19,573,609 | | — | | — | | 19,573,609 |
| Total Investments in Securities | $ 397,992,484 | | $ 68,955 | | $ — | | $ 398,061,439 |
| (a) | For a complete listing of investments and their industries, see the Portfolio of Investments. |
The notes to the financial statements are an integral part of, and should be read in conjunction with, the financial statements.
13
Statement of Assets and Liabilities as of April 30, 2021 (Unaudited)
| Assets |
Investment in unaffiliated securities, at value
(identified cost $379,330,234) including securities on loan of $11,021,670 | $387,876,776 |
Investment in affiliated investment companies, at value
(identified cost $10,184,663) | 10,184,663 |
Cash denominated in foreign currencies
(identified cost $3,511) | 3,583 |
| Cash | 27,700 |
| Receivables: | |
| Fund shares sold | 1,042,471 |
| Investment securities sold | 918,472 |
| Dividends and interest | 7,741 |
| Securities lending | 5,082 |
| Other assets | 187,714 |
| Total assets | 400,254,202 |
| Liabilities |
| Cash collateral received for securities on loan | 9,388,946 |
| Payables: | |
| Investment securities purchased | 1,105,028 |
| Manager (See Note 3) | 250,954 |
| Transfer agent (See Note 3) | 101,254 |
| Fund shares redeemed | 62,375 |
| NYLIFE Distributors (See Note 3) | 53,973 |
| Professional fees | 42,862 |
| Shareholder communication | 35,833 |
| Custodian | 16,551 |
| Accrued expenses | 3,782 |
| Total liabilities | 11,061,558 |
| Net assets | $389,192,644 |
| Composition of Net Assets |
| Shares of beneficial interest outstanding (par value of $.001 per share) unlimited number of shares authorized | $ 11,804 |
| Additional paid-in-capital | 279,075,547 |
| | 279,087,351 |
| Total distributable earnings (loss) | 110,105,293 |
| Net assets | $389,192,644 |
| Class A | |
| Net assets applicable to outstanding shares | $180,478,556 |
| Shares of beneficial interest outstanding | 5,506,343 |
| Net asset value per share outstanding | $ 32.78 |
| Maximum sales charge (5.50% of offering price) | 1.91 |
| Maximum offering price per share outstanding | $ 34.69 |
| Investor Class | |
| Net assets applicable to outstanding shares | $ 48,541,063 |
| Shares of beneficial interest outstanding | 1,514,818 |
| Net asset value per share outstanding (a) | $ 32.05 |
| Maximum sales charge (5.00% of offering price) | 1.69 |
| Maximum offering price per share outstanding | $ 33.74 |
| Class B | |
| Net assets applicable to outstanding shares | $ 5,197,357 |
| Shares of beneficial interest outstanding | 189,287 |
| Net asset value and offering price per share outstanding | $ 27.46 |
| Class C | |
| Net assets applicable to outstanding shares | $ 4,128,719 |
| Shares of beneficial interest outstanding | 150,441 |
| Net asset value and offering price per share outstanding | $ 27.44 |
| Class I | |
| Net assets applicable to outstanding shares | $150,130,558 |
| Shares of beneficial interest outstanding | 4,421,198 |
| Net asset value and offering price per share outstanding | $ 33.96 |
| Class R1 | |
| Net assets applicable to outstanding shares | $ 63,867 |
| Shares of beneficial interest outstanding | 1,889 |
| Net asset value and offering price per share outstanding (a) | $ 33.80 |
| Class R2 | |
| Net assets applicable to outstanding shares | $ 128,258 |
| Shares of beneficial interest outstanding | 3,935 |
| Net asset value and offering price per share outstanding | $ 32.59 |
| Class R3 | |
| Net assets applicable to outstanding shares | $ 524,266 |
| Shares of beneficial interest outstanding | 16,212 |
| Net asset value and offering price per share outstanding | $ 32.34 |
| (a) | The difference between the recalculated and stated NAV was caused by rounding. |
The notes to the financial statements are an integral part of, and should be read in conjunction with, the financial statements.
| 14 | MainStay WMC Small Companies Fund |
Statement of Operations for the six months ended April 30, 2021 (Unaudited)
| Investment Income (Loss) |
| Income | |
| Dividends-unaffiliated (net of foreign tax withholding of $11,352) | $ 1,867,423 |
| Securities lending | 66,800 |
| Dividends-affiliated | 153 |
| Total income | 1,934,376 |
| Expenses | |
| Manager (See Note 3) | 1,452,574 |
| Distribution/Service—Class A (See Note 3) | 195,675 |
| Distribution/Service—Investor Class (See Note 3) | 61,304 |
| Distribution/Service—Class B (See Note 3) | 26,123 |
| Distribution/Service—Class C (See Note 3) | 19,720 |
| Distribution/Service—Class R2 (See Note 3) | 145 |
| Distribution/Service—Class R3 (See Note 3) | 1,177 |
| Transfer agent (See Note 3) | 260,943 |
| Professional fees | 61,513 |
| Registration | 51,985 |
| Custodian | 32,533 |
| Shareholder communication | 28,305 |
| Trustees | 3,258 |
| Insurance | 1,330 |
| Shareholder service (See Note 3) | 323 |
| Miscellaneous | 8,776 |
| Total expenses before waiver/reimbursement | 2,205,684 |
| Expense waiver/reimbursement from Manager (See Note 3) | (68,669) |
| Net expenses | 2,137,015 |
| Net investment income (loss) | (202,639) |
| Realized and Unrealized Gain (Loss) |
| Net realized gain (loss) on: | |
| Unaffiliated investment transactions(a) | 137,713,156 |
| Foreign currency transactions | (33,258) |
| Net realized gain (loss) | 137,679,898 |
| Net change in unrealized appreciation (depreciation) on: | |
| Unaffiliated investments | (9,836,046) |
| Translation of other assets and liabilities in foreign currencies | 70 |
| Net change in unrealized appreciation (depreciation) | (9,835,976) |
| Net realized and unrealized gain (loss) | 127,843,922 |
| Net increase (decrease) in net assets resulting from operations | $127,641,283 |
| (a) | Includes transition cost of $20,816. |
The notes to the financial statements are an integral part of, and should be read in conjunction with, the financial statements.
15
Statements of Changes in Net Assets
for the six months ended April 30, 2021 (Unaudited) and the year ended October 31, 2020
| | 2021 | 2020 |
| Increase (Decrease) in Net Assets |
| Operations: | | |
| Net investment income (loss) | $ (202,639) | $ (825,725) |
| Net realized gain (loss) | 137,679,898 | (31,360,140) |
| Net change in unrealized appreciation (depreciation) | (9,835,976) | 5,309,960 |
| Net increase (decrease) in net assets resulting from operations | 127,641,283 | (26,875,905) |
| Distributions to shareholders: | | |
| Class A | — | (282,121) |
| Investor Class | — | (788) |
| Class I | — | (535,257) |
| Class R1 | — | (203) |
| Class R2 | — | (155) |
| | — | (818,524) |
| Distributions to shareholders from return of capital: | | |
| Class A | — | (112,552) |
| Investor Class | — | (315) |
| Class I | — | (213,538) |
| Class R1 | — | (81) |
| Class R2 | — | (62) |
| | — | (326,548) |
| Total distributions to shareholders | — | (1,145,072) |
| Capital share transactions: | | |
| Net proceeds from sales of shares | 22,138,983 | 19,857,172 |
| Net asset value of shares issued to shareholder in reinvestment of distributions | — | 1,124,044 |
| Cost of shares redeemed | (52,776,017) | (51,616,882) |
| Increase (decrease) in net assets derived from capital share transactions | (30,637,034) | (30,635,666) |
| Net increase (decrease) in net assets | 97,004,249 | (58,656,643) |
| Net Assets |
| Beginning of period | 292,188,395 | 350,845,038 |
| End of period | $389,192,644 | $292,188,395 |
The notes to the financial statements are an integral part of, and should be read in conjunction with, the financial statements.
| 16 | MainStay WMC Small Companies Fund |
Financial Highlights selected per share data and ratios
| | Six months ended
April 30,
2021* | | Year Ended October 31, |
| Class A | 2020 | | 2019 | | 2018 | | 2017 | | 2016 |
| Net asset value at beginning of period | $ 22.62 | | $ 24.59 | | $ 28.34 | | $ 31.91 | | $ 26.45 | | $ 26.35 |
| Net investment income (loss) (a) | (0.03) | | (0.07) | | 0.07 | | 0.06 | | 0.03 | | 0.22 |
| Net realized and unrealized gain (loss) on investments | 10.19 | | (1.83) | | 0.24 | | (0.98) | | 5.54 | | (0.09) |
| Net realized and unrealized gain (loss) on foreign currency transactions | (0.00)‡ | | — | | — | | — | | — | | — |
| Total from investment operations | 10.16 | | (1.90) | | 0.31 | | (0.92) | | 5.57 | | 0.13 |
| Less distributions: | | | | | | | | | | | |
| From net investment income | — | | (0.05) | | (0.05) | | — | | (0.11) | | (0.03) |
| From net realized gain on investments | — | | — | | (4.01) | | (2.65) | | — | | — |
| Return of capital | — | | (0.02) | | — | | — | | — | | — |
| Total distributions | — | | (0.07) | | (4.06) | | (2.65) | | (0.11) | | (0.03) |
| Net asset value at end of period | $ 32.78 | | $ 22.62 | | $ 24.59 | | $ 28.34 | | $ 31.91 | | $ 26.45 |
| Total investment return (b) | 44.92% | | (7.76)% | | 1.41% | | (3.48)% | | 21.09% | | 0.49% |
| Ratios (to average net assets)/Supplemental Data: | | | | | | | | | | | |
| Net investment income (loss) | (0.17)%†† | | (0.30)% | | 0.27% | | 0.19% | | 0.10% | | 0.85% |
| Net expenses (c) | 1.21%†† | | 1.25% | | 1.25% | | 1.23% | | 1.24% | | 1.25% |
| Expenses (before waiver/reimbursement) (c) | 1.23%†† | | —% | | —% | | —% | | —% | | —% |
| Portfolio turnover rate | 68% | | 208% | | 205% | | 92% | | 60% | | 65% |
| Net assets at end of period (in 000’s) | $ 180,479 | | $ 115,403 | | $ 141,548 | | $ 155,636 | | $ 163,350 | | $ 114,041 |
| * | Unaudited. |
| ‡ | Less than one cent per share. |
| †† | Annualized. |
| (a) | Per share data based on average shares outstanding during the period. |
| (b) | Total investment return is calculated exclusive of sales charges and assumes the reinvestment of dividends and distributions. For periods of less than one year, total return is not annualized. |
| (c) | In addition to the fees and expenses which the Fund bears directly, it also indirectly bears a pro-rata share of the fees and expenses of the underlying funds in which it invests. Such indirect expenses are not included in the above expense ratios. |
The notes to the financial statements are an integral part of, and should be read in conjunction with, the financial statements.
17
Financial Highlights selected per share data and ratios
| | Six months ended
April 30,
2021* | | Year Ended October 31, |
| Investor Class | 2020 | | 2019 | | 2018 | | 2017 | | 2016 |
| Net asset value at beginning of period | $ 22.14 | | $ 24.07 | | $ 27.85 | | $ 31.48 | | $ 26.09 | | $ 26.05 |
| Net investment income (loss) (a) | (0.06) | | (0.13) | | (0.01) | | (0.02) | | (0.05) | | 0.14 |
| Net realized and unrealized gain (loss) on investments | 9.97 | | (1.80) | | 0.24 | | (0.96) | | 5.48 | | (0.10) |
| Net realized and unrealized gain (loss) on foreign currency transactions | (0.00)‡ | | — | | — | | — | | — | | — |
| Total from investment operations | 9.91 | | (1.93) | | 0.23 | | (0.98) | | 5.43 | | 0.04 |
| Less distributions: | | | | | | | | | | | |
| From net investment income | — | | (0.00)‡ | | — | | — | | (0.04) | | — |
| From net realized gain on investments | — | | — | | (4.01) | | (2.65) | | — | | — |
| Return of capital | — | | (0.00)‡ | | — | | — | | — | | — |
| Total distributions | — | | (0.00)‡ | | (4.01) | | (2.65) | | (0.04) | | — |
| Net asset value at end of period | $ 32.05 | | $ 22.14 | | $ 24.07 | | $ 27.85 | | $ 31.48 | | $ 26.09 |
| Total investment return (b) | 44.76% | | (8.02)% | | 1.09% | | (3.74)% | | 20.82% | | 0.15% |
| Ratios (to average net assets)/Supplemental Data: | | | | | | | | | | | |
| Net investment income (loss) | (0.40)%†† | | (0.57)% | | (0.05)% | | (0.06)% | | (0.16)% | | 0.57% (c) |
| Net expenses (d) | 1.49%†† | | 1.52% | | 1.55% | | 1.49% | | 1.50% | | 1.52% (e) |
| Expenses (before waiver/reimbursement) (d) | 1.65%†† | | 1.70% | | 1.64% | | 1.56% | | 1.50% | | 1.52% (e) |
| Portfolio turnover rate | 68% | | 208% | | 205% | | 92% | | 60% | | 65% |
| Net assets at end of period (in 000’s) | $ 48,541 | | $ 41,547 | | $ 49,342 | | $ 48,569 | | $ 57,488 | | $ 79,614 |
| * | Unaudited. |
| ‡ | Less than one cent per share. |
| †† | Annualized. |
| (a) | Per share data based on average shares outstanding during the period. |
| (b) | Total investment return is calculated exclusive of sales charges and assumes the reinvestment of dividends and distributions. For periods of less than one year, total return is not annualized. |
| (c) | Without the custody fee reimbursement, net investment income (loss) would have been 0.56%. |
| (d) | In addition to the fees and expenses which the Fund bears directly, it also indirectly bears a pro-rata share of the fees and expenses of the underlying funds in which it invests. Such indirect expenses are not included in the above expense ratios. |
| (e) | Without the custody fee reimbursement, net expenses would have been 1.53%. |
The notes to the financial statements are an integral part of, and should be read in conjunction with, the financial statements.
| 18 | MainStay WMC Small Companies Fund |
Financial Highlights selected per share data and ratios
| | Six months ended
April 30,
2021* | | Year Ended October 31, |
| Class B | 2020 | | 2019 | | 2018 | | 2017 | | 2016 |
| Net asset value at beginning of period | $ 19.04 | | $ 20.86 | | $ 24.83 | | $ 28.54 | | $ 23.80 | | $ 23.94 |
| Net investment income (loss) (a) | (0.14) | | (0.25) | | (0.16) | | (0.22) | | (0.23) | | (0.03) |
| Net realized and unrealized gain (loss) on investments | 8.56 | | (1.57) | | 0.20 | | (0.84) | | 4.97 | | (0.11) |
| Net realized and unrealized gain (loss) on foreign currency transactions | (0.00)‡ | | — | | — | | — | | — | | — |
| Total from investment operations | 8.42 | | (1.82) | | 0.04 | | (1.06) | | 4.74 | | (0.14) |
| Less distributions: | | | | | | | | | | | |
| From net realized gain on investments | — | | — | | (4.01) | | (2.65) | | — | | — |
| Net asset value at end of period | $ 27.46 | | $ 19.04 | | $ 20.86 | | $ 24.83 | | $ 28.54 | | $ 23.80 |
| Total investment return (b) | 44.22% | | (8.72)% | | 0.35% | | (4.46)% | | 19.92% | | (0.58)% |
| Ratios (to average net assets)/Supplemental Data: | | | | | | | | | | | |
| Net investment income (loss) | (1.15)%†† | | (1.30)% | | (0.74)% | | (0.80)% | | (0.86)% | | (0.15)% (c) |
| Net expenses (d) | 2.24%†† | | 2.27% | | 2.30% | | 2.24% | | 2.25% | | 2.27% (e) |
| Expenses (before waiver/reimbursement) (d) | 2.40%†† | | 2.45% | | 2.39% | | 2.31% | | 2.25% | | 2.27% (e) |
| Portfolio turnover rate | 68% | | 208% | | 205% | | 92% | | 60% | | 65% |
| Net assets at end of period (in 000’s) | $ 5,197 | | $ 4,447 | | $ 7,442 | | $ 10,698 | | $ 15,188 | | $ 17,670 |
| * | Unaudited. |
| ‡ | Less than one cent per share. |
| †† | Annualized. |
| (a) | Per share data based on average shares outstanding during the period. |
| (b) | Total investment return is calculated exclusive of sales charges and assumes the reinvestment of dividends and distributions. For periods of less than one year, total return is not annualized. |
| (c) | Without the custody fee reimbursement, net investment income (loss) would have been (0.16)%. |
| (d) | In addition to the fees and expenses which the Fund bears directly, it also indirectly bears a pro-rata share of the fees and expenses of the underlying funds in which it invests. Such indirect expenses are not included in the above expense ratios. |
| (e) | Without the custody fee reimbursement, net expenses would have been 2.28%. |
The notes to the financial statements are an integral part of, and should be read in conjunction with, the financial statements.
19
Financial Highlights selected per share data and ratios
| | Six months ended
April 30,
2021* | | Year Ended October 31, |
| Class C | 2020 | | 2019 | | 2018 | | 2017 | | 2016 |
| Net asset value at beginning of period | $ 19.03 | | $ 20.84 | | $ 24.81 | | $ 28.52 | | $ 23.79 | | $ 23.93 |
| Net investment income (loss) (a) | (0.14) | | (0.25) | | (0.13) | | (0.22) | | (0.24) | | (0.04) |
| Net realized and unrealized gain (loss) on investments | 8.55 | | (1.56) | | 0.17 | | (0.84) | | 4.97 | | (0.10) |
| Net realized and unrealized gain (loss) on foreign currency transactions | (0.00)‡ | | — | | — | | — | | — | | — |
| Total from investment operations | 8.41 | | (1.81) | | 0.04 | | (1.06) | | 4.73 | | (0.14) |
| Less distributions: | | | | | | | | | | | |
| From net realized gain on investments | — | | — | | (4.01) | | (2.65) | | — | | — |
| Net asset value at end of period | $ 27.44 | | $ 19.03 | | $ 20.84 | | $ 24.81 | | $ 28.52 | | $ 23.79 |
| Total investment return (b) | 44.19% | | (8.69)% | | 0.35% | | (4.47)% | | 19.88% | | (0.59)% |
| Ratios (to average net assets)/Supplemental Data: | | | | | | | | | | | |
| Net investment income (loss) | (1.15)%†† | | (1.30)% | | (0.60)% | | (0.81)% | | (0.88)% | | (0.16)% (c) |
| Net expenses (d) | 2.24%†† | | 2.27% | | 2.30% | | 2.24% | | 2.25% | | 2.27% (e) |
| Expenses (before waiver/reimbursement) (d) | 2.40%†† | | 2.45% | | 2.39% | | 2.31% | | 2.25% | | 2.27% (e) |
| Portfolio turnover rate | 68% | | 208% | | 205% | | 92% | | 60% | | 65% |
| Net assets at end of period (in 000’s) | $ 4,129 | | $ 3,201 | | $ 5,469 | | $ 14,156 | | $ 17,770 | | $ 17,921 |
| * | Unaudited. |
| ‡ | Less than one cent per share. |
| †† | Annualized. |
| (a) | Per share data based on average shares outstanding during the period. |
| (b) | Total investment return is calculated exclusive of sales charges and assumes the reinvestment of dividends and distributions. For periods of less than one year, total return is not annualized. |
| (c) | Without the custody fee reimbursement, net investment income (loss) would have been (0.17)%. |
| (d) | In addition to the fees and expenses which the Fund bears directly, it also indirectly bears a pro-rata share of the fees and expenses of the underlying funds in which it invests. Such indirect expenses are not included in the above expense ratios. |
| (e) | Without the custody fee reimbursement, net expenses would have been 2.28%. |
The notes to the financial statements are an integral part of, and should be read in conjunction with, the financial statements.
| 20 | MainStay WMC Small Companies Fund |
Financial Highlights selected per share data and ratios
| | Six months ended
April 30,
2021* | | Year Ended October 31, |
| Class I | 2020 | | 2019 | | 2018 | | 2017 | | 2016 |
| Net asset value at beginning of period | $ 23.40 | | $ 25.44 | | $ 29.19 | | $ 32.72 | | $ 27.11 | | $ 27.02 |
| Net investment income (loss) (a) | 0.02 | | (0.01) | | 0.17 | | 0.14 | | 0.11 | | 0.29 |
| Net realized and unrealized gain (loss) on investments | 10.54 | | (1.90) | | 0.22 | | (1.02) | | 5.68 | | (0.10) |
| Net realized and unrealized gain (loss) on foreign currency transactions | (0.00)‡ | | — | | — | | — | | — | | — |
| Total from investment operations | 10.56 | | (1.91) | | 0.39 | | (0.88) | | 5.79 | | 0.19 |
| Less distributions: | | | | | | | | | | | |
| From net investment income | — | | (0.09) | | (0.13) | | — | | (0.18) | | (0.10) |
| From net realized gain on investments | — | | — | | (4.01) | | (2.65) | | — | | — |
| Return of capital | — | | (0.04) | | — | | — | | — | | — |
| Total distributions | — | | (0.13) | | (4.14) | | (2.65) | | (0.18) | | (0.10) |
| Net asset value at end of period | $ 33.96 | | $ 23.40 | | $ 25.44 | | $ 29.19 | | $ 32.72 | | $ 27.11 |
| Total investment return (b) | 45.13% | | (7.55)% | | 1.67% | | (3.26)% | | 21.40% | | 0.71% |
| Ratios (to average net assets)/Supplemental Data: | | | | | | | | | | | |
| Net investment income (loss) | 0.12%†† | | (0.06)% | | 0.66% | | 0.45% | | 0.36% | | 1.10% |
| Net expenses (c) | 0.96%†† | | 1.00% | | 1.00% | | 0.98% | | 0.99% | | 1.00% |
| Expenses (before waiver/reimbursement) (c) | 0.98%†† | | —% | | —% | | —% | | —% | | —% |
| Portfolio turnover rate | 68% | | 208% | | 205% | | 92% | | 60% | | 65% |
| Net assets at end of period (in 000’s) | $ 150,131 | | $ 127,115 | | $ 146,525 | | $ 306,746 | | $ 332,900 | | $ 325,316 |
| * | Unaudited. |
| ‡ | Less than one cent per share. |
| †† | Annualized. |
| (a) | Per share data based on average shares outstanding during the period. |
| (b) | Total investment return is calculated exclusive of sales charges and assumes the reinvestment of dividends and distributions. Class I shares are not subject to sales charges. For periods of less than one year, total return is not annualized. |
| (c) | In addition to the fees and expenses which the Fund bears directly, it also indirectly bears a pro-rata share of the fees and expenses of the underlying funds in which it invests. Such indirect expenses are not included in the above expense ratios. |
The notes to the financial statements are an integral part of, and should be read in conjunction with, the financial statements.
21
Financial Highlights selected per share data and ratios
| | Six months ended
April 30,
2021* | | Year Ended October 31, |
| Class R1 | 2020 | | 2019 | | 2018 | | 2017 | | 2016 |
| Net asset value at beginning of period | $ 23.31 | | $ 25.34 | | $ 29.09 | | $ 32.65 | | $ 27.05 | | $ 26.96 |
| Net investment income (loss) (a) | (0.00)‡ | | (0.04) | | 0.10 | | 0.12 | | 0.08 | | 0.26 |
| Net realized and unrealized gain (loss) on investments | 10.49 | | (1.88) | | 0.26 | | (1.03) | | 5.68 | | (0.10) |
| Net realized and unrealized gain (loss) on foreign currency transactions | (0.00)‡ | | — | | — | | — | | — | | — |
| Total from investment operations | 10.49 | | (1.92) | | 0.36 | | (0.91) | | 5.76 | | 0.16 |
| Less distributions: | | | | | | | | | | | |
| From net investment income | — | | (0.08) | | (0.10) | | — | | (0.16) | | (0.07) |
| From net realized gain on investments | — | | — | | (4.01) | | (2.65) | | — | | — |
| Return of capital | — | | (0.03) | | — | | — | | — | | — |
| Total distributions | — | | (0.11) | | (4.11) | | (2.65) | | (0.16) | | (0.07) |
| Net asset value at end of period | $ 33.80 | | $ 23.31 | | $ 25.34 | | $ 29.09 | | $ 32.65 | | $ 27.05 |
| Total investment return (b) | 45.00% | | (7.62)% | | 1.57% | | (3.36)% | | 21.34% | | 0.61% |
| Ratios (to average net assets)/Supplemental Data: | | | | | | | | | | | |
| Net investment income (loss) | (0.01)%†† | | (0.18)% | | 0.41% | | 0.38% | | 0.25% | | 0.97% |
| Net expenses (c) | 1.06%†† | | 1.10% | | 1.10% | | 1.08% | | 1.09% | | 1.10% |
| Expenses (before waiver/reimbursement) (c) | 1.08%†† | | —% | | —% | | —% | | —% | | —% |
| Portfolio turnover rate | 68% | | 208% | | 205% | | 92% | | 60% | | 65% |
| Net assets at end of period (in 000’s) | $ 64 | | $ 44 | | $ 65 | | $ 63 | | $ 97 | | $ 85 |
| * | Unaudited. |
| ‡ | Less than one cent per share. |
| †† | Annualized. |
| (a) | Per share data based on average shares outstanding during the period. |
| (b) | Total investment return is calculated exclusive of sales charges and assumes the reinvestment of dividends and distributions. Class R1 shares are not subject to sales charges. For periods of less than one year, total return is not annualized. |
| (c) | In addition to the fees and expenses which the Fund bears directly, it also indirectly bears a pro-rata share of the fees and expenses of the underlying funds in which it invests. Such indirect expenses are not included in the above expense ratios. |
The notes to the financial statements are an integral part of, and should be read in conjunction with, the financial statements.
| 22 | MainStay WMC Small Companies Fund |
Financial Highlights selected per share data and ratios
| | Six months ended
April 30,
2021* | | Year Ended October 31, |
| Class R2 | 2020 | | 2019 | | 2018 | | 2017 | | 2016 |
| Net asset value at beginning of period | $ 22.50 | | $ 24.47 | | $ 28.21 | | $ 31.81 | | $ 26.37 | | $ 26.28 |
| Net investment income (loss) (a) | (0.04) | | (0.09) | | 0.04 | | 0.03 | | (0.01) | | 0.19 |
| Net realized and unrealized gain (loss) on investments | 10.13 | | (1.83) | | 0.25 | | (0.98) | | 5.54 | | (0.10) |
| Net realized and unrealized gain (loss) on foreign currency transactions | (0.00)‡ | | — | | — | | — | | — | | — |
| Total from investment operations | 10.09 | | (1.92) | | 0.29 | | (0.95) | | 5.53 | | 0.09 |
| Less distributions: | | | | | | | | | | | |
| From net investment income | — | | (0.04) | | (0.02) | | — | | (0.09) | | (0.00)‡ |
| From net realized gain on investments | — | | — | | (4.01) | | (2.65) | | — | | — |
| Return of capital | — | | (0.01) | | — | | — | | — | | — |
| Total distributions | — | | (0.05) | | (4.03) | | (2.65) | | (0.09) | | (0.00)‡ |
| Net asset value at end of period | $ 32.59 | | $ 22.50 | | $ 24.47 | | $ 28.21 | | $ 31.81 | | $ 26.37 |
| Total investment return (b) | 44.84% | | (7.84)% | | 1.30% | | (3.59)% | | 21.00% | | 0.34% (c) |
| Ratios (to average net assets)/Supplemental Data: | | | | | | | | | | | |
| Net investment income (loss) | (0.26)%†† | | (0.40)% | | 0.18% | | 0.09% | | (0.03)% | | 0.73% |
| Net expenses (d) | 1.31%†† | | 1.35% | | 1.35% | | 1.33% | | 1.34% | | 1.35% |
| Expenses (before waiver/reimbursement) (d) | 1.33%†† | | —% | | —% | | —% | | —% | | —% |
| Portfolio turnover rate | 68% | | 208% | | 205% | | 92% | | 60% | | 65% |
| Net assets at end of period (in 000’s) | $ 128 | | $ 88 | | $ 111 | | $ 137 | | $ 137 | | $ 112 |
| * | Unaudited. |
| ‡ | Less than one cent per share. |
| †† | Annualized. |
| (a) | Per share data based on average shares outstanding during the period. |
| (b) | Total investment return is calculated exclusive of sales charges and assumes the reinvestment of dividends and distributions. Class R2 shares are not subject to sales charges. For periods of less than one year, total return is not annualized. |
| (c) | Total investment return may reflect adjustments to conform to generally accepted accounting principles. |
| (d) | In addition to the fees and expenses which the Fund bears directly, it also indirectly bears a pro-rata share of the fees and expenses of the underlying funds in which it invests. Such indirect expenses are not included in the above expense ratios. |
The notes to the financial statements are an integral part of, and should be read in conjunction with, the financial statements.
23
Financial Highlights selected per share data and ratios
| | Six months ended
April 30,
2021* | | Year Ended October 31, | | February 29, 2016^ through
October 31,
2016 |
| Class R3 | 2020 | | 2019 | | 2018 | | 2017 | |
| Net asset value at beginning of period | $ 22.35 | | $ 24.32 | | $ 28.11 | | $ 31.78 | | $ 26.39 | | $ 23.88 |
| Net investment income (loss) (a) | (0.08) | | (0.15) | | (0.04) | | (0.05) | | (0.10) | | (0.01) |
| Net realized and unrealized gain (loss) on investments | 10.07 | | (1.82) | | 0.26 | | (0.97) | | 5.55 | | 2.52 |
| Net realized and unrealized gain (loss) on foreign currency transactions | (0.00)‡ | | — | | — | | — | | — | | — |
| Total from investment operations | 9.99 | | (1.97) | | 0.22 | | (1.02) | | 5.45 | | 2.51 |
| Less distributions: | | | | | | | | | | | |
| From net investment income | — | | — | | — | | — | | (0.06) | | — |
| From net realized gain on investments | — | | — | | (4.01) | | (2.65) | | — | | — |
| Total distributions | — | | — | | (4.01) | | (2.65) | | (0.06) | | — |
| Net asset value at end of period | $ 32.34 | | $ 22.35 | | $ 24.32 | | $ 28.11 | | $ 31.78 | | $ 26.39 |
| Total investment return (b) | 44.70% | | (8.10)% | | 1.04% | | (3.83)% | | 20.68% | | 10.51% (c) |
| Ratios (to average net assets)/Supplemental Data: | | | | | | | | | | | |
| Net investment income (loss) | (0.51)%†† | | (0.67)% | | (0.15)% | | (0.15)% | | (0.32)% | | (0.07)%†† (d) |
| Net expenses (e) | 1.56%†† | | 1.60% | | 1.60% | | 1.58% | | 1.59% | | 1.60%†† (f) |
| Expenses (before waiver/reimbursement) (e) | 1.58%†† | | —% | | —% | | —% | | —% | | —% |
| Portfolio turnover rate | 68% | | 208% | | 205% | | 92% | | 60% | | 65% |
| Net assets at end of period (in 000’s) | $ 524 | | $ 343 | | $ 342 | | $ 204 | | $ 181 | | $ 81 |
| ^ | Commencement of operations. |
| * | Unaudited. |
| ‡ | Less than one cent per share. |
| †† | Annualized. |
| (a) | Per share data based on average shares outstanding during the period. |
| (b) | Total investment return is calculated exclusive of sales charges and assumes the reinvestment of dividends and distributions. Class R3 shares are not subject to sales charges. For periods of less than one year, total return is not annualized. |
| (c) | Total investment return may reflect adjustments to conform to generally accepted accounting principles. |
| (d) | Without the custody fee reimbursement, net investment income (loss) would have been (0.80)%. |
| (e) | In addition to the fees and expenses which the Fund bears directly, it also indirectly bears a pro-rata share of the fees and expenses of the underlying funds in which it invests. Such indirect expenses are not included in the above expense ratios. |
| (f) | Without the custody fee reimbursement, net expenses would have been 1.61%. |
The notes to the financial statements are an integral part of, and should be read in conjunction with, the financial statements.
| 24 | MainStay WMC Small Companies Fund |
Notes to Financial Statements (Unaudited)
Note 1-Organization and Business
MainStay Funds Trust (the “Trust”) was organized as a Delaware statutory trust on April 28, 2009. The Trust is registered under the Investment Company Act of 1940, as amended (the “1940 Act”), as an open-end management investment company, and is comprised of thirty-two funds (collectively referred to as the “Funds”). These financial statements and notes relate to the MainStay WMC Small Companies Fund (formerly known as MainStay MacKay Small Cap Core Fund) (the "Fund"), a “diversified” fund, as that term is defined in the 1940 Act, as interpreted or modified by regulatory authorities having jurisdiction, from time to time.
The following table lists the Fund's share classes that have been registered and commenced operations:
| Class | Commenced Operations |
| Class A | January 2, 2004 |
| Investor Class | February 28, 2008 |
| Class B | January 2, 2004 |
| Class C | December 30, 2002 |
| Class I | January 12, 1987 |
| Class R1 | July 31, 2012 |
| Class R2 | July 31, 2012 |
| Class R3 | February 29, 2016 |
| Class R6 | N/A* |
| SIMPLE Class | N/A* |
| * | Class R6 shares were registered for sale effective as of February 28, 2017 and SIMPLE Class shares were registered for sale effective as of August 31, 2020 but have not yet commenced operations. |
Class B shares of the MainStay Group of Funds are closed to all new purchases as well as additional investments by existing Class B shareholders. Existing Class B shareholders may continue to reinvest dividends and capital gains distributions, as well as exchange their Class B shares for Class B shares of other funds in the MainStay Group of Funds as permitted by the current exchange privileges. Class B shareholders continue to be subject to any applicable contingent deferred sales charge ("CDSC") at the time of redemption. All other features of the Class B shares, including but not limited to the fees and expenses applicable to Class B shares, remain unchanged. Unless redeemed, Class B shareholders will remain in Class B shares of their respective fund until the Class B shares are converted to Class A or Investor Class shares pursuant to the applicable conversion schedule.
Class A and Investor Class shares are offered at net asset value (“NAV”) per share plus an initial sales charge. No initial sales charge applies to investments of $1 million or more (and certain other qualified purchases) in Class A and Investor Class shares. However, a CDSC of 1.00% may be imposed on certain redemptions made within 18 months of the date of purchase on shares that were purchased without an initial sales charge. Class C shares are offered at NAV without an initial sales charge, although a 1.00% CDSC may be imposed on certain redemptions of such shares made within one year of the date of purchase of Class C shares. When Class B shares were offered, they were offered at NAV without an
initial sales charge, although a CDSC that declines depending on the number of years a shareholder held its Class B shares may be imposed on certain redemptions of such shares made within six years of the date of purchase of such shares. Class I, Class R1, Class R2, Class R3 and Class R6 shares are offered at NAV without a sales charge. SIMPLE Class shares are currently expected to be offered at NAV without a sales charge. Depending upon eligibility, Class B shares convert to either Class A or Investor Class shares at the end of the calendar quarter eight years after the date they were purchased. In addition, depending upon eligibility, Class C shares convert to either Class A or Investor Class shares at the end of the calendar quarter ten years after the date they were purchased. Additionally, Investor Class shares may convert automatically to Class A shares. Under certain circumstances and as may be permitted by the Trust’s multiple class plan pursuant to Rule 18f-3 under the 1940 Act, specified share classes of the Fund may be converted to one or more other share classes of the Fund as disclosed in the capital share transactions within these Notes. The classes of shares have the same voting (except for issues that relate solely to one class), dividend, liquidation and other rights, and the same terms and conditions, except that under distribution plans pursuant to Rule 12b-1 under the 1940 Act, Class B and Class C shares are subject to higher distribution and/or service fees than Class A, Investor Class, Class R2, Class R3 and SIMPLE Class shares. Class I, Class R1 and Class R6 shares are not subject to a distribution and/or service fee. Class R1, Class R2 and Class R3 shares are subject to a shareholder service fee, which is in addition to fees paid under the distribution plans for Class R2 and Class R3 shares.
The Fund's investment objective is to seek long-term growth of capital.
Note 2–Significant Accounting Policies
The Fund is an investment company and accordingly follows the investment company accounting and reporting guidance of the Financial Accounting Standards Board (“FASB”) Accounting Standard Codification Topic 946 Financial Services—Investment Companies. The Fund prepares its financial statements in accordance with generally accepted accounting principles (“GAAP”) in the United States of America and follows the significant accounting policies described below.
(A) Securities Valuation. Investments are usually valued as of the close of regular trading on the New York Stock Exchange (the "Exchange") (usually 4:00 p.m. Eastern time) on each day the Fund is open for business ("valuation date").
The Board of Trustees of the Trust (the "Board") adopted procedures establishing methodologies for the valuation of the Fund's securities and other assets and delegated the responsibility for valuation determinations under those procedures to the Valuation Committee of the Trust (the “Valuation Committee”). The procedures state that, subject to the oversight of the Board and unless otherwise noted, the responsibility for the day-to-day valuation of portfolio assets (including fair value measurements for the Fund's assets and liabilities) rests with New York Life Investment Management LLC (“New York Life Investments” or the
Notes to Financial Statements (Unaudited) (continued)
"Manager"), aided to whatever extent necessary by the Subadvisor (as defined in Note 3(A)). To assess the appropriateness of security valuations, the Manager, the Subadvisor or the Fund's third-party service provider, who is subject to oversight by the Manager, regularly compares prior day prices, prices on comparable securities and the sale prices to the prior and current day prices and challenges prices with changes exceeding certain tolerance levels with third-party pricing services or broker sources.
The Board authorized the Valuation Committee to appoint a Valuation Subcommittee (the “Subcommittee”) to establish the prices of securities for which market quotations are not readily available or the prices of which are not otherwise readily determinable under the procedures. The Subcommittee meets (in person, via electronic mail or via teleconference) on an as-needed basis. The Valuation Committee meets to ensure that actions taken by the Subcommittee were appropriate.
For those securities valued through either a standardized fair valuation methodology or a fair valuation measurement, the Subcommittee deals with such valuation and the Valuation Committee reviews and affirms, if appropriate, the reasonableness of the valuation based on such methodologies and measurements on a regular basis after considering information that is reasonably available and deemed relevant by the Valuation Committee. Any action taken by the Subcommittee with respect to the valuation of a portfolio security or other asset is submitted for review and ratification (if appropriate) to the Valuation Committee and the Board at the next regularly scheduled meeting.
"Fair value" is defined as the price the Fund would reasonably expect to receive upon selling an asset or liability in an orderly transaction to an independent buyer in the principal or most advantageous market for the asset or liability. Fair value measurements are determined within a framework that establishes a three-tier hierarchy that maximizes the use of observable market data and minimizes the use of unobservable inputs to establish a classification of fair value measurements for disclosure purposes. "Inputs" refer broadly to the assumptions that market participants would use in pricing the asset or liability, including assumptions about risk, such as the risk inherent in a particular valuation technique used to measure fair value using a pricing model and/or the risk inherent in the inputs for the valuation technique. Inputs may be observable or unobservable. Observable inputs reflect the assumptions market participants would use in pricing the asset or liability based on market data obtained from sources independent of the Fund. Unobservable inputs reflect the Fund’s own assumptions about the assumptions market participants would use in pricing the asset or liability based on the information available. The inputs or methodology used for valuing assets or liabilities may not be an indication of the risks associated with investing in those assets or liabilities. The three-tier hierarchy of inputs is summarized below.
| • | Level 1—quoted prices in active markets for an identical asset or liability |
| • | Level 2—other significant observable inputs (including quoted prices for a similar asset or liability in active markets, interest rates and yield curves, prepayment speeds, credit risk, etc.) |
| • | Level 3—significant unobservable inputs (including the Fund's own assumptions about the assumptions that market participants would use in measuring fair value of an asset or liability) |
The level of an asset or liability within the fair value hierarchy is based on the lowest level of an input, both individually and in the aggregate, that is significant to the fair value measurement. The aggregate value by input level of the Fund’s assets and liabilities as of April 30, 2021, is included at the end of the Portfolio of Investments.
The Fund may use third-party vendor evaluations, whose prices may be derived from one or more of the following standard inputs, among others:
| • Broker/dealer quotes | • Benchmark securities |
| • Two-sided markets | • Reference data (corporate actions or material event notices) |
| • Bids/offers | • Monthly payment information |
| • Industry and economic events | • Reported trades |
An asset or liability for which market values cannot be measured using the methodologies described above is valued by methods deemed reasonable in good faith by the Valuation Committee, following the procedures established by the Board, to represent fair value. Under these procedures, the Fund generally uses a market-based approach which may use related or comparable assets or liabilities, recent transactions, market multiples, book values and other relevant information. The Fund may also use an income-based valuation approach in which the anticipated future cash flows of the asset or liability are discounted to calculate fair value. Discounts may also be applied due to the nature and/or duration of any restrictions on the disposition of the asset or liability. Fair value represents a good faith approximation of the value of a security. Fair value determinations involve the consideration of a number of subjective factors, an analysis of applicable facts and circumstances and the exercise of judgment. As a result, it is possible that the fair value for a security determined in good faith in accordance with the Fund's valuation procedures may differ from valuations for the same security determined by other funds using their own valuation procedures. Although the Fund's valuation procedures are designed to value a security at the price the Fund may reasonably expect to receive upon the security's sale in an orderly transaction, there can be no assurance that any fair value determination thereunder would, in fact, approximate the amount that the Fund would actually realize upon the sale of the security or the price at which the security would trade if a reliable market price were readily available. During the six-month period ended April 30, 2021, there were no material changes to the fair value methodologies.
Securities which may be valued in this manner include, but are not limited to: (i) a security for which trading has been halted or suspended; (ii) a debt security that has recently gone into default and for which there is not a current market quotation; (iii) a security of an issuer that has entered into a restructuring; (iv) a security that has been delisted from a national
| 26 | MainStay WMC Small Companies Fund |
exchange; (v) a security for which the market price is not readily available from a third-party pricing source or, if so provided, does not, in the opinion of the Manager or the Subadvisor, reflect the security's market value; (vi) a security subject to trading collars for which no or limited trading takes place; and (vii) a security whose principal market has been temporarily closed at a time when, under normal conditions, it would be open. Securities valued in this manner are generally categorized as Level 3 in the hierarchy. No securities held by the Fund as of April 30, 2021 were fair valued in such a manner.
Certain securities held by the Fund may principally trade in foreign markets. Events may occur between the time the foreign markets close and the time at which the Fund's NAVs are calculated. These events may include, but are not limited to, situations relating to a single issuer in a market sector, significant fluctuations in U.S. or foreign markets, natural disasters, armed conflicts, governmental actions or other developments not tied directly to the securities markets. Should the Manager or the Subadvisor conclude that such events may have affected the accuracy of the last price of such securities reported on the local foreign market, the Subcommittee may, pursuant to procedures adopted by the Board, adjust the value of the local price to reflect the estimated impact on the price of such securities as a result of such events. In this instance, securities are generally categorized as Level 3 in the hierarchy. Additionally, certain foreign equity securities are also fair valued whenever the movement of a particular index exceeds certain thresholds. In such cases, the securities are fair valued by applying factors provided by a third-party vendor in accordance with valuation procedures adopted by the Board and are generally categorized as Level 2 in the hierarchy. No foreign equity securities held by the Fund as of April 30, 2021 were fair valued in such a manner.
Equity securities, including exchange-traded funds ("ETFs"), are valued at the last quoted sales prices as of the close of regular trading on the relevant exchange on each valuation date. Securities that are not traded on the valuation date are valued at the mean of the last quoted bid and ask prices. Prices are normally taken from the principal market in which each security trades. These securities are generally categorized as Level 1 in the hierarchy.
Investments in mutual funds, including money market funds, are valued at their respective NAVs at the close of business each day on the valuation date. These securities are generally categorized as Level 1 in the hierarchy.
Temporary cash investments acquired in excess of 60 days to maturity at the time of purchase are valued using the latest bid prices or using valuations based on a matrix system (which considers such factors as security prices, yields, maturities and ratings), both as furnished by independent pricing services. Temporary cash investments that mature in 60 days or less at the time of purchase ("Short-Term Investments") are valued using the amortized cost method of valuation, unless the use of such method would be inappropriate. The amortized cost method involves valuing a security at its cost on the date of purchase and thereafter assuming a constant amortization to maturity of the difference between
such cost and the value on maturity date. Amortized cost approximates the current fair value of a security. Securities valued using the amortized cost method are not valued using quoted prices in an active market and are generally categorized as Level 2 in the hierarchy.
The information above is not intended to reflect an exhaustive list of the methodologies that may be used to value portfolio investments. The valuation procedures permit the use of a variety of valuation methodologies in connection with valuing portfolio investments. The methodology used for a specific type of investment may vary based on the market data available or other considerations. The methodologies summarized above may not represent the specific means by which portfolio investments are valued on any particular business day.
(B) Income Taxes. The Fund's policy is to comply with the requirements of the Internal Revenue Code of 1986, as amended (the “Internal Revenue Code”), applicable to regulated investment companies and to distribute all of its taxable income to the shareholders of the Fund within the allowable time limits.
The Manager evaluates the Fund’s tax positions to determine if the tax positions taken meet the minimum recognition threshold in connection with accounting for uncertainties in income tax positions taken or expected to be taken for the purposes of measuring and recognizing tax liabilities in the financial statements. Recognition of tax benefits of an uncertain tax position is permitted only to the extent the position is “more likely than not” to be sustained assuming examination by taxing authorities. The Manager analyzed the Fund's tax positions taken on federal, state and local income tax returns for all open tax years (for up to three tax years) and has concluded that no provisions for federal, state and local income tax are required in the Fund's financial statements. The Fund's federal, state and local income tax and federal excise tax returns for tax years for which the applicable statutes of limitations have not expired are subject to examination by the Internal Revenue Service and state and local departments of revenue.
(C) Foreign Taxes. The Fund may be subject to foreign taxes on income and other transaction-based taxes imposed by certain countries in which it invests. A portion of the taxes on gains on investments or currency purchases/repatriation may be reclaimable. The Fund will accrue such taxes and reclaims as applicable, based upon its current interpretation of tax rules and regulations that exist in the markets in which it invests.
The Fund may be subject to taxation on realized capital gains, repatriation proceeds and other transaction-based taxes imposed by certain countries in which it invests. The Fund will accrue such taxes as applicable based upon its current interpretation of tax rules and regulations that exist in the market in which it invests. Capital gains taxes relating to positions still held are reflected as a liability in the Statement of Assets and Liabilities, as well as an adjustment to the Fund's net unrealized appreciation (depreciation). Taxes related to capital gains realized, if any, are reflected as part of net realized gain (loss) in the Statement of Operations. Changes in tax liabilities related to capital gains taxes on unrealized investment
Notes to Financial Statements (Unaudited) (continued)
gains, if any, are reflected as part of the change in net unrealized appreciation (depreciation) on investments in the Statement of Operations. Transaction-based charges are generally assessed as a percentage of the transaction amount.
(D) Dividends and Distributions to Shareholders. Dividends and distributions are recorded on the ex-dividend date. The Fund intends to declare and pay dividends from net investment income and distributions from net realized capital and currency gains, if any, at least annually. Unless a shareholder elects otherwise, all dividends and distributions are reinvested at NAV in the same class of shares of the Fund. Dividends and distributions to shareholders are determined in accordance with federal income tax regulations and may differ from determinations using GAAP.
(E) Security Transactions and Investment Income. The Fund records security transactions on the trade date. Realized gains and losses on security transactions are determined using the identified cost method. Dividend income is recognized on the ex-dividend date, net of any foreign tax withheld at the source, and interest income is accrued as earned using the effective interest rate method. Distributions received from real estate investment trusts may be classified as dividends, capital gains and/or return of capital.
Investment income and realized and unrealized gains and losses on investments of the Fund are allocated pro rata to the separate classes of shares based upon their relative net assets on the date the income is earned or realized and unrealized gains and losses are incurred.
(F) Expenses. Expenses of the Trust are allocated to the individual Funds in proportion to the net assets of the respective Funds when the expenses are incurred, except where direct allocations of expenses can be made. Expenses (other than transfer agent expenses and fees incurred under the shareholder services plans and/or the distribution plans further discussed in Note 3(B)) are allocated to separate classes of shares pro rata based upon their relative net assets on the date the expenses are incurred. The expenses borne by the Fund, including those of related parties to the Fund, are shown in the Statement of Operations.
Additionally, the Fund may invest in ETFs and mutual funds, which are subject to management fees and other fees that may cause the costs of investing in ETFs and mutual funds to be greater than the costs of owning the underlying securities directly. These indirect expenses of ETFs and mutual funds are not included in the amounts shown as expenses in the Statement of Operations or in the expense ratios included in the Financial Highlights.
(G) Use of Estimates. In preparing financial statements in conformity with GAAP, the Manager makes estimates and assumptions that affect the reported amounts and disclosures in the financial statements. Actual results could differ from those estimates and assumptions.
(H) Securities Lending. In order to realize additional income, the Fund may engage in securities lending, subject to the limitations set forth in the 1940 Act and relevant guidance by the staff of the Securities and Exchange Commission (“SEC”). If the Fund engages in securities lending,
the Fund will lend through its custodian, JPMorgan Chase Bank, N.A., ("JPMorgan"), acting as securities lending agent on behalf of the Fund. Under the current arrangement, JPMorgan will manage the Fund's collateral in accordance with the securities lending agency agreement between the Fund and JPMorgan, and indemnify the Fund against counterparty risk. The loans will be collateralized by cash (which may be invested in a money market fund) and/or non-cash collateral (which may include U.S. Treasury securities and/or U.S. government agency securities issued or guaranteed by the United States government or its agencies or instrumentalities) at least equal at all times to the market value of the securities loaned. The Fund bears the risk of delay in recovery of, or loss of rights in, the securities loaned. The Fund may also record a realized gain or loss on securities deemed sold due to a borrower’s inability to return securities on loan. The Fund bears the risk of any loss on investment of cash collateral. The Fund will receive compensation for lending its securities in the form of fees or it will retain a portion of interest earned on the investment of any cash collateral. The Fund will also continue to receive interest and dividends on the securities loaned and any gain or loss in the market price of the securities loaned that may occur during the term of the loan will be for the account of the Fund. Income earned from securities lending activities, if any, is reflected in the Statement of Operations. Securities on loan as of April 30, 2021, are shown in the Portfolio of Investments.
Prior to November 23, 2020, these services were provided by State Street Bank and Trust Company (“State Street”).
(I) Large Transaction Risks. From time to time, the Fund may receive large purchase or redemption orders from affiliated or unaffiliated mutual funds or other investors. Such large transactions could have adverse effects on the Fund’s performance if the Fund were required to sell securities or invest cash at times when it otherwise would not do so. This activity could also accelerate the realization of capital gains and increase the Fund’s transaction costs. The Fund has adopted procedures designed to mitigate the negative impacts of such large transactions, but there can be no assurance that these procedures will be effective.
(J) Indemnifications. Under the Trust’s organizational documents, its officers and trustees are indemnified against certain liabilities that may arise out of performance of their duties to the Trust. Additionally, in the normal course of business, the Fund enters into contracts with third-party service providers that contain a variety of representations and warranties and that may provide general indemnifications. The Fund's maximum exposure under these arrangements is unknown, as this would involve future claims that may be made against the Fund that have not yet occurred. The Manager believes that the risk of loss in connection with these potential indemnification obligations is remote. However, there can be no assurance that material liabilities related to such obligations will not arise in the future, which could adversely impact the Fund.
| 28 | MainStay WMC Small Companies Fund |
Note 3–Fees and Related Party Transactions
(A) Manager and Subadvisor. New York Life Investments, a registered investment adviser and an indirect, wholly-owned subsidiary of New York Life Insurance Company ("New York Life"), serves as the Fund's Manager, pursuant to an Amended and Restated Management Agreement ("Management Agreement"). The Manager provides offices, conducts clerical, recordkeeping and bookkeeping services and keeps most of the financial and accounting records required to be maintained by the Fund. Except for the portion of salaries and expenses that are the responsibility of the Fund, the Manager pays the salaries and expenses of all personnel affiliated with the Fund and certain operational expenses of the Fund. The Fund reimburses New York Life Investments in an amount equal to the portion of the compensation of the Chief Compliance Officer attributable to the Fund. The Fund’s subadvisor changed effective March 5, 2021 due to the replacement of MacKay Shields LLC ("MacKay") as the Fund’s subadvisor and the appointment of Wellington Management Company LLP (“Wellington” or the “Subadvisor”) as the Fund’s subadvisor. Wellington, a registered investment adviser, is responsible for the day-to-day portfolio management of the Fund. Pursuant to the terms of a Subadvisory Agreement ("Subadvisory Agreement") between New York Life Investments and Wellington, New York Life Investments pays for the services of the Subadvisor.
Pursuant to the Management Agreement, the Fund pays the Manager a monthly fee for the services performed and the facilities furnished at an annual rate of the Fund’s average daily net assets as follows: 0.80% up to $1 billion, 0.775% from $1 billion to $2 billion and 0.75% in excess of $2 billion. During the six-month period ended April 30, 2021, the effective management fee rate was 0.80% of the Fund’s average daily net assets, exclusive of any applicable waivers/reimbursements.
During the six-month period ended April 30, 2021, New York Life Investments earned fees from the Fund in the amount of $1,452,574 and waived fees and/or reimbursed expenses, including the voluntary waiver/reimbursement of certain class specific expenses in the amount of $68,669 and paid Wellington and MacKay $224,995 and $472,936, respectively.
JPMorgan provides sub-administration and sub-accounting services to the Fund pursuant to an agreement with New York Life Investments. These services include calculating the daily NAVs of the Fund, maintaining the general ledger and sub-ledger accounts for the calculation of the Fund's NAVs, and assisting New York Life Investments in conducting various aspects of the Fund's administrative operations. For providing these services to the Fund, JPMorgan is compensated by New York Life Investments.
Prior to November 23, 2020, these services were provided by State Street.
Pursuant to an agreement between the Trust and New York Life Investments, New York Life Investments is responsible for providing or procuring certain regulatory reporting services for the Fund. The Fund will reimburse New York Life Investments for the actual costs incurred by New
York Life Investments in connection with providing or procuring these services for the Fund.
(B) Distribution and Service Fees. The Trust, on behalf of the Fund, has entered into a distribution agreement with NYLIFE Distributors LLC (the “Distributor”), an affiliate of New York Life Investments. The Fund has adopted distribution plans (the “Plans”) in accordance with the provisions of Rule 12b-1 under the 1940 Act.
Pursuant to the Class A, Investor Class and Class R2 Plans, the Distributor receives a monthly distribution fee from the Class A, Investor Class and Class R2 shares at an annual rate of 0.25% of the average daily net assets of the Class A, Investor Class and Class R2 shares for distribution and/or service activities as designated by the Distributor. Pursuant to the Class B and Class C Plans, Class B and Class C shares pay the Distributor a monthly distribution fee at an annual rate of 0.75% of the average daily net assets of the Class B and Class C shares, along with a service fee at an annual rate of 0.25% of the average daily net assets of the Class B and Class C shares, for a total 12b-1 fee of 1.00%. Pursuant to the Class R3 Plan, Class R3 shares pay the Distributor a monthly fee at an annual rate of 0.25% of the average daily net assets of the Class R3 shares, along with a service fee at an annual rate of 0.25% of the average daily net assets of the Class R3 shares, for a total 12b-1 fee of 0.50%. Class I and Class R1 shares are not subject to a distribution and/or service fee.
The Plans provide that the distribution and service fees are payable to the Distributor regardless of the amounts actually expended by the Distributor for distribution of the Fund's shares and service activities.
In accordance with the Shareholder Services Plans for the Class R1, Class R2 and Class R3 shares, the Manager has agreed to provide, through its affiliates or independent third parties, various shareholder and administrative support services to shareholders of the Class R1, Class R2 and Class R3 shares. For its services, the Manager, its affiliates or independent third-party service providers are entitled to a shareholder service fee accrued daily and paid monthly at an annual rate of 0.10% of the average daily net assets of the Class R1, Class R2 and Class R3 shares. This is in addition to any fees paid under the Class R2 and Class R3 Plans.
During the six-month period ended April 30, 2021, shareholder service fees incurred by the Fund were as follows:
| |
| Class R1 | $ 29 |
| Class R2 | 58 |
| Class R3 | 236 |
(C) Sales Charges. The Fund was advised by the Distributor that the amount of initial sales charges retained on sales of Class A and Investor Class shares during the six-month period ended April 30, 2021, were $13,843 and $4,945, respectively.
Notes to Financial Statements (Unaudited) (continued)
The Fund was also advised that the Distributor retained CDSCs on redemptions of Class A, Class B and Class C shares during the six-month period ended April 30, 2021, of $4,026, $1,552 and $129, respectively.
(D) Transfer, Dividend Disbursing and Shareholder Servicing Agent. NYLIM Service Company LLC, an affiliate of New York Life Investments, is the Fund's transfer, dividend disbursing and shareholder servicing agent pursuant to an agreement between NYLIM Service Company LLC and the Trust. NYLIM Service Company LLC has entered into an agreement with DST Asset Manager Solutions, Inc. ("DST"), pursuant to which DST performs certain transfer agent services on behalf of NYLIM Service Company LLC. New York Life Investments has contractually agreed to limit the transfer agency expenses charged to the Fund’s share classes to a maximum of 0.35% of that share class’s average daily net assets on an annual basis after deducting any applicable Fund or class-level expense reimbursement or small account fees. This agreement will remain in effect until February 28, 2022, and shall renew automatically for one-year terms unless New York Life Investments provides written notice of termination prior to the start of the next term or upon approval of the Board. During the six-month period ended April 30, 2021, transfer agent expenses incurred by the Fund and any reimbursements, pursuant to the aforementioned Transfer Agency expense limitation agreement, were as follows:
| Class | Expense | Waived |
| Class A | $ 59,112 | $ — |
| Investor Class | 122,870 | (36,081) |
| Class B | 13,089 | (3,843) |
| Class C | 9,882 | (2,906) |
| Class I | 55,746 | — |
| Class R1 | 22 | — |
| Class R2 | 44 | — |
| Class R3 | 178 | — |
(E) Small Account Fee. Shareholders with small accounts adversely impact the cost of providing transfer agency services. In an effort to reduce total transfer agency expenses, the Fund has implemented a small account fee on certain types of accounts. As described in the Fund's prospectus, certain shareholders with an account balance of less than $1,000 ($5,000 for Class A share accounts) are charged an annual per account fee of $20 (assessed semi-annually), the proceeds from which offset transfer agent fees as reflected in the Statement of Operations. This small account fee will not apply to certain types of accounts as described further in the Fund’s prospectus.
(F) Investments in Affiliates (in 000’s). During the six-month period ended April 30, 2021, purchases and sales transactions, income earned from investments and shares held of investment companies managed by New York Life Investments or its affiliates were as follows:
| Affiliated Investment Companies | Value,
Beginning
of Period | Purchases
at Cost | Proceeds
from
Sales | Net
Realized
Gain/(Loss)
on Sales | Change in
Unrealized
Appreciation/
(Depreciation) | Value,
End of
Period | Dividend
Income | Other
Distributions | Shares
End of
Period |
| MainStay U.S. Government Liquidity Fund | $ 14 | $ 37,937 | $ (27,766) | $ — | $ — | $ 10,185 | $ —(a) | $ — | 10,185 |
(G) Capital. As of April 30, 2021, New York Life and its affiliates beneficially held shares of the Fund with the values and percentages of net assets as follows:
| Class R1 | $63,867 | 100.0% |
| Class R2 | 62,477 | 48.7 |
| Class R3 | 43,080 | 8.2 |
| 30 | MainStay WMC Small Companies Fund |
Note 4-Federal Income Tax
As of April 30, 2021, the cost and unrealized appreciation (depreciation) of the Fund’s investment portfolio, including applicable derivative contracts and other financial instruments, as determined on a federal income tax basis, were as follows:
| | Federal Tax
Cost | Gross
Unrealized
Appreciation | Gross
Unrealized
(Depreciation) | Net
Unrealized
Appreciation/
(Depreciation) |
| Investments | $394,717,413 | $28,895,109 | $(15,232,703) | $13,662,406 |
As of October 31, 2020, for federal income tax purposes, capital loss carryforwards of $28,988,630 were available as shown in the table below, to the extent provided by the regulations to offset future realized gains of the Fund through the years indicated. To the extent that these capital loss carryforwards are used to offset future capital gains, it is probable that the capital gains so offset will not be distributed to shareholders. No capital gain distributions shall be made until any capital loss carryforwards have been fully utilized.
Capital Loss
Available Through | Short-Term
Capital Loss
Amounts (000’s) | Long-Term
Capital Loss
Amounts (000’s) |
| Unlimited | $28,329 | $660 |
During the year ended October 31, 2020, the tax character of distributions paid as reflected in the Statements of Changes in Net Assets was as follows:
| | 2020 |
| Distributions paid from: | |
| Ordinary Income | $ 818,524 |
| Return of Capital | 326,548 |
| Total | $1,145,072 |
Note 5–Custodian
JPMorgan is the custodian of cash and securities held by the Fund. Custodial fees are charged to the Fund based on the Fund's net assets and/or the market value of securities held by the Fund and the number of certain transactions incurred by the Fund.
Prior to November 23, 2020, these services were provided by State Street. The services provided by State Street were a direct expense of the Fund and are included in the Statement of Operations as Custodian fees which totaled $3,595 for the period November 1, 2020 through November 22, 2020.
Note 6–Line of Credit
The Fund and certain other funds managed by New York Life Investments maintain a line of credit with a syndicate of banks in order to secure a source of funds for temporary purposes to meet unanticipated or excessive redemption requests.
Effective July 28, 2020, under the credit agreement (the “Credit Agreement”), the aggregate commitment amount is $600,000,000 with an additional uncommitted amount of $100,000,000. The commitment fee is an annual rate of 0.15% of the average commitment amount payable quarterly, regardless of usage, to JPMorgan, who serves as the agent to the syndicate. The commitment fee is allocated among the Fund and certain other funds managed by New York Life Investments based upon their respective net assets and other factors. Interest on any revolving credit loan is charged based upon the Federal Funds Rate or the one-month London Interbank Offered Rate ("LIBOR"), whichever is higher. The Credit Agreement expires on July 27, 2021, although the Fund, certain other funds managed by New York Life Investments and the syndicate of banks may renew the Credit Agreement for an additional year on the same or different terms or enter into a credit agreement with a different syndicate of banks. Prior to July 28, 2020, the aggregate commitment amount and the commitment fee were the same as those under the current Credit Agreement, but State Street served as agent to the syndicate. During the six-month period ended April 30, 2021, there were no borrowings made or outstanding with respect to the Fund under the Credit Agreement or the credit agreement for which State Street served as agent.
Note 7–Interfund Lending Program
Pursuant to an exemptive order issued by the SEC, the Fund, along with certain other funds managed by New York Life Investments, may participate in an interfund lending program. The interfund lending program provides an alternative credit facility that permits the Fund and certain other funds managed by New York Life Investments to lend or borrow money for temporary purposes directly to or from one another, subject to the conditions of the exemptive order. During the six-month period ended April 30, 2021, there were no interfund loans made or outstanding with respect to the Fund.
Note 8–Purchases and Sales of Securities (in 000’s)
During the six-month period ended April 30, 2021, purchases and sales of securities, other than short-term securities, were $240,316 and $265,638, respectively.
Note 9–Capital Share Transactions
Transactions in capital shares for the six-month period ended April 30, 2021 and the year ended October 31, 2020, were as follows:
Notes to Financial Statements (Unaudited) (continued)
| Class A | Shares | Amount |
| Period ended April 30, 2021: | | |
| Shares sold | 464,625 | $ 14,624,764 |
| Shares redeemed | (423,869) | (12,762,497) |
| Net increase (decrease) in shares outstanding before conversion | 40,756 | 1,862,267 |
| Shares converted into Class A (See Note 1) | 362,757 | 10,753,941 |
| Net increase (decrease) | 403,513 | $ 12,616,208 |
| Year ended October 31, 2020: | | |
| Shares sold | 419,388 | $ 9,148,407 |
| Shares issued to shareholders in reinvestment of distributions | 15,292 | 386,723 |
| Shares redeemed | (1,188,798) | (26,796,187) |
| Net increase (decrease) in shares outstanding before conversion | (754,118) | (17,261,057) |
| Shares converted into Class A (See Note 1) | 129,031 | 3,002,869 |
| Shares converted from Class A (See Note 1) | (28,861) | (553,897) |
| Net increase (decrease) | (653,948) | $(14,812,085) |
| |
| Investor Class | Shares | Amount |
| Period ended April 30, 2021: | | |
| Shares sold | 57,497 | $ 1,731,286 |
| Shares redeemed | (83,501) | (2,438,357) |
| Net increase (decrease) in shares outstanding before conversion | (26,004) | (707,071) |
| Shares converted into Investor Class (See Note 1) | 15,354 | 474,926 |
| Shares converted from Investor Class (See Note 1) | (351,211) | (10,166,918) |
| Net increase (decrease) | (361,861) | $(10,399,063) |
| Year ended October 31, 2020: | | |
| Shares sold | 111,230 | $ 2,363,416 |
| Shares issued to shareholders in reinvestment of distributions | 13 | 523 |
| Shares redeemed | (222,057) | (4,907,783) |
| Net increase (decrease) in shares outstanding before conversion | (110,814) | (2,543,844) |
| Shares converted into Investor Class (See Note 1) | 37,113 | 770,934 |
| Shares converted from Investor Class (See Note 1) | (99,326) | (2,314,940) |
| Net increase (decrease) | (173,027) | $ (4,087,850) |
| |
| Class B | Shares | Amount |
| Period ended April 30, 2021: | | |
| Shares sold | 2,112 | $ 55,676 |
| Shares redeemed | (18,683) | (468,337) |
| Net increase (decrease) in shares outstanding before conversion | (16,571) | (412,661) |
| Shares converted from Class B (See Note 1) | (27,696) | (703,349) |
| Net increase (decrease) | (44,267) | $ (1,116,010) |
| Year ended October 31, 2020: | | |
| Shares sold | 2,350 | $ 43,292 |
| Shares redeemed | (63,078) | (1,203,362) |
| Net increase (decrease) in shares outstanding before conversion | (60,728) | (1,160,070) |
| Shares converted from Class B (See Note 1) | (62,534) | (1,153,862) |
| Net increase (decrease) | (123,262) | $ (2,313,932) |
| |
| Class C | Shares | Amount |
| Period ended April 30, 2021: | | |
| Shares sold | 26,749 | $ 709,547 |
| Shares redeemed | (31,549) | (804,222) |
| Net increase (decrease) in shares outstanding before conversion | (4,800) | (94,675) |
| Shares converted from Class C (See Note 1) | (12,973) | (358,600) |
| Net increase (decrease) | (17,773) | $ (453,275) |
| Year ended October 31, 2020: | | |
| Shares sold | 19,589 | $ 345,692 |
| Shares redeemed | (105,175) | (1,949,802) |
| Net increase (decrease) in shares outstanding before conversion | (85,586) | (1,604,110) |
| Shares converted from Class C (See Note 1) | (8,584) | (155,033) |
| Net increase (decrease) | (94,170) | $ (1,759,143) |
| |
| Class I | Shares | Amount |
| Period ended April 30, 2021: | | |
| Shares sold | 151,888 | $ 4,987,421 |
| Shares redeemed | (1,162,771) | (36,297,595) |
| Net increase (decrease) | (1,010,883) | $(31,310,174) |
| Year ended October 31, 2020: | | |
| Shares sold | 314,190 | $ 7,865,459 |
| Shares issued to shareholders in reinvestment of distributions | 28,199 | 736,297 |
| Shares redeemed | (690,650) | (16,663,151) |
| Net increase (decrease) in shares outstanding before conversion | (348,261) | (8,061,395) |
| Shares converted into Class I (See Note 1) | 20,359 | 403,929 |
| Net increase (decrease) | (327,902) | $ (7,657,466) |
| |
| 32 | MainStay WMC Small Companies Fund |
| Class R1(a) | Shares | Amount |
| Year ended October 31, 2020: | | |
| Shares sold | 29 | $ 650 |
| Shares issued to shareholders in reinvestment of distributions | 11 | 284 |
| Shares redeemed | (705) | (15,558) |
| Net increase (decrease) | (665) | $ (14,624) |
| |
| Class R2 | Shares | Amount |
| Period ended April 30, 2021: | | |
| Shares sold | 46 | $ 1,389 |
| Shares redeemed | (1) | (29) |
| Net increase (decrease) | 45 | $ 1,360 |
| Year ended October 31, 2020: | | |
| Shares sold | 151 | $ 3,457 |
| Shares issued to shareholders in reinvestment of distributions | 9 | 217 |
| Shares redeemed | (826) | (20,394) |
| Net increase (decrease) | (666) | $ (16,720) |
| |
| Class R3 | Shares | Amount |
| Period ended April 30, 2021: | | |
| Shares sold | 1,027 | $ 28,900 |
| Shares redeemed | (165) | (4,980) |
| Net increase (decrease) | 862 | $ 23,920 |
| Year ended October 31, 2020: | | |
| Shares sold | 3,989 | $ 86,799 |
| Shares redeemed | (2,718) | (60,645) |
| Net increase (decrease) | 1,271 | $ 26,154 |
| (a) | No activity during the period ended April 30, 2021. |
Note 10–Recent Accounting Pronouncement
In March 2020, the Financial Accounting Standards Board issued Accounting Standards Update 2020-04 (“ASU 2020-04”), which provides optional guidance to ease the potential accounting burden associated with transitioning away from LIBOR and other reference rates that are expected to be discontinued. ASU 2020-04 was effective immediately upon release of the update on March 12, 2020 and remains effective through December 31, 2022. At this time, the Manager is evaluating the implications of certain other provisions of ASU 2020-04 related to new disclosure requirements and any impact on the financial statement disclosures has not yet been determined.
Note 11–Other Matters
An outbreak of COVID-19, first detected in December 2019, has developed into a global pandemic and has resulted in travel restrictions, closure of international borders, certain businesses and securities markets, restrictions on securities trading activities, prolonged quarantines, supply chain disruptions, and lower consumer demand, as well as general concern and uncertainty. The continued impact of
COVID-19 is uncertain and could further adversely affect the global economy, national economies, individual issuers and capital markets in unforeseeable ways and result in a substantial and extended economic downturn. Developments that disrupt global economies and financial markets, such as COVID-19, may magnify factors that affect the Fund's performance.
Note 12–Subsequent Events
In connection with the preparation of the financial statements of the Fund as of and for the six-month period ended April 30, 2021, events and transactions subsequent to April 30, 2021, through the date the financial statements were issued have been evaluated by the Manager for possible adjustment and/or disclosure. No subsequent events requiring financial statement adjustment or disclosure have been identified.
Board Consideration and Approval of Management Agreement and Subadvisory Agreement (Unaudited)
The continuation of the Management Agreement with respect to the MainStay WMC Small Companies Fund (formerly known as the MainStay MacKay Small Cap Core Fund) (“Fund”) and New York Life Investment Management LLC (“New York Life Investments”) and the Subadvisory Agreement between New York Life Investments and MacKay Shields LLC (“MacKay”) with respect to the Fund (together, “Advisory Agreements”), following an initial term of up to two years, is subject to annual review and approval by the Board of Trustees of MainStay Funds Trust (“Board” of the “Trust”) in accordance with Section 15 of the Investment Company Act of 1940, as amended (“1940 Act”). At its December 9–10, 2020 meeting, the Board, including the Trustees who are not an “interested person” (as such term is defined in the 1940 Act) of the Trust (“Independent Trustees”) voting separately, unanimously approved the continuation of each of the Advisory Agreements for a one-year period.
In reaching the decision to approve the continuation of each of the Advisory Agreements, the Board considered information furnished by New York Life Investments and MacKay in connection with an annual contract review process undertaken by the Board that took place at meetings of the Board and its Contracts Committee during September 2020 through December 2020, as well as other information furnished to the Board and its Committees throughout the year, as deemed relevant by the Trustees. Information requested by and furnished to the Board for consideration in connection with the contract review process included, among other items, reports on the Fund and “peer funds” prepared by Strategic Insight Mutual Fund Research and Consulting, LLC (“Strategic Insight”), an independent third-party service provider engaged by the Board to report objectively on the Fund’s investment performance, management fee and total expenses. The Board also considered information on the fees charged to other investment advisory clients of New York Life Investments and/or MacKay that follow investment strategies similar to those of the Fund, if any, and, when applicable, the rationale for any differences in the Fund’s management and subadvisory fees and the fees charged to those other investment advisory clients. In addition, the Board considered information furnished by New York Life Investments and MacKay in response to requests prepared on behalf of the Board, and in consultation with the Independent Trustees, by independent legal counsel to the Independent Trustees, which encompassed a variety of topics, including those summarized below.
The Board took into account information provided in connection with its meetings throughout the year, including, among other items, information regarding the legal standards and fiduciary obligations applicable to its consideration of the continuation of each of the Advisory Agreements and investment performance reports on the Fund as well as presentations from New York Life Investments and MacKay personnel. The Board also took into account other information received from New York Life Investments throughout the year, including, among other items, periodic reports on legal and compliance matters, risk management, portfolio turnover, brokerage commissions and non-advisory services provided to the Fund by New York Life Investments. The contract review process, including the structure and format for materials provided to the Board, has been developed in consultation with the Board. The Independent
Trustees also met in executive sessions with their independent legal counsel and, for a portion thereof, with senior management of New York Life Investments.
In addition to information provided to the Board throughout the year, the Board received information in connection with its June 2020 meeting provided specifically in response to requests prepared on behalf of the Board, and in consultation with the Independent Trustees, by independent legal counsel regarding the Fund’s distribution arrangements. In addition, the Board received information regarding the Fund’s asset levels, share purchase and redemption activity and the payment of Rule 12b-1 and/or other fees by applicable share classes of the Fund, among other information.
In considering the continuation of each of the Advisory Agreements, the Trustees reviewed and evaluated the information and factors they believed to reasonably be necessary and appropriate in light of legal advice furnished to them by independent legal counsel and through the exercise of their own business judgment. Although individual Trustees may have weighed certain factors or information differently, the factors considered by the Board are described in greater detail below and include, among other factors: (i) the nature, extent and quality of the services provided to the Fund by New York Life Investments and MacKay; (ii) the qualifications of the portfolio managers of the Fund and the historical investment performance of the Fund, New York Life Investments and MacKay; (iii) the costs of the services provided, and profits realized, by New York Life Investments and MacKay from their relationships with the Fund; (iv) the extent to which economies of scale have been realized or may be realized as the Fund grows and the extent to which economies of scale have benefited or may benefit the Fund’s shareholders; and (v) the reasonableness of the Fund’s management and subadvisory fees and total ordinary operating expenses. Although the Board recognized that comparisons between the Fund’s fees and expenses and those of other funds are imprecise given different terms of agreements, variations in fund strategies and other factors, the Board considered the reasonableness of the Fund’s management fee and total ordinary operating expenses as compared to the peer funds identified by Strategic Insight. Throughout their considerations, the Trustees acknowledged the commitment of New York Life Investments and its affiliates to serve the MainStay Group of Funds, as well as their capacity, experience, resources, financial stability and reputations. The Trustees also acknowledged the entrepreneurial and other risks assumed by New York Life Investments in sponsoring and managing the Fund.
The Trustees noted that, throughout the year, the Trustees are afforded an opportunity to ask questions of, and request additional information or materials from, New York Life Investments and MacKay. The Board’s decision with respect to each of the Advisory Agreements may have also been based, in part, on the Board’s knowledge of New York Life Investments and MacKay resulting from, among other things, the Board’s consideration of each of the Advisory Agreements in prior years, the advisory agreements for other funds in the MainStay Group of Funds, the Board’s review throughout the year of the performance and operations of other funds in the MainStay Group of Funds and each Trustee’s business
| 34 | MainStay WMC Small Companies Fund |
judgment and industry experience. In addition to considering the above-referenced factors, the Board observed that in the marketplace there are a range of investment options available to the Fund’s shareholders and such shareholders, having had the opportunity to consider other investment options, have chosen to invest in the Fund.
The factors that figured prominently in the Board’s decision to approve the continuation of each of the Advisory Agreements during its December 9–10, 2020 meeting are summarized in more detail below, and the Board did not consider any factor or information controlling in reaching such decision.
Nature, Extent and Quality of Services Provided by New York Life Investments and MacKay
The Board examined the nature, extent and quality of the services that New York Life Investments provides to the Fund. The Board evaluated New York Life Investments’ experience and capabilities in serving as manager of the Fund and considered that the Fund operates in a “manager-of-managers” structure. The Board also considered New York Life Investments’ responsibilities and services provided pursuant to this structure, including evaluating the performance of MacKay, making recommendations to the Board as to whether the Subadvisory Agreement should be renewed, modified or terminated and periodically reporting to the Board regarding the results of New York Life Investments’ evaluation and monitoring functions. The Board noted that New York Life Investments manages other mutual funds, serves a variety of other investment advisory clients, including other pooled investment vehicles, and has experience overseeing mutual fund service providers, including subadvisors. The Board considered the experience of senior personnel at New York Life Investments providing management and administrative and other non-advisory services to the Fund as well as New York Life Investments’ reputation and financial condition. The Board observed that New York Life Investments devotes significant resources and time to providing management and non-advisory services to the Fund, including New York Life Investments’ supervision and due diligence reviews of MacKay and ongoing analysis of, and interactions with, MacKay with respect to, among other things, the Fund’s investment performance and risks as well as MacKay’s investment capabilities and subadvisory services with respect to the Fund.
The Board also considered the range of services that New York Life Investments provides to the Fund under the terms of the Management Agreement, including: (i) fund accounting and ongoing supervisory services provided by New York Life Investments’ Fund Administration and Accounting Group; (ii) investment supervisory and analytical services provided by New York Life Investments’ Investment Consulting Group; (iii) compliance services provided by the Trust’s Chief Compliance Officer as well as New York Life Investments’ compliance department, including supervision and implementation of the Fund’s compliance program; (iv) legal services provided by New York Life Investments’ Office of the General Counsel; and (v) risk management monitoring and analysis by compliance and investment personnel. The Board noted that New York Life Investments provides certain other non-advisory services to the Fund.
In addition, the Board considered New York Life Investments’ willingness to invest in personnel, infrastructure, technology, operational enhancements, cyber security, information security, shareholder privacy resources and business continuity planning designed to benefit the Fund and noted that New York Life Investments is responsible for compensating the Trust’s officers, except for a portion of the salary of the Trust’s Chief Compliance Officer. The Board recognized that New York Life Investments has provided an increasingly broad array of non-advisory services to the MainStay Group of Funds as a result of regulatory and other developments, including in connection with the designation of New York Life Investments as the administrator of the MainStay Group of Funds’ liquidity risk management program adopted under the 1940 Act. The Board considered benefits to shareholders from being part of the MainStay Group of Funds, including the privilege of exchanging investments between the same class of shares of funds in the MainStay Group of Funds, including without the imposition of a sales charge (if any).
The Board also examined the nature, extent and quality of the investment advisory services that MacKay provides to the Fund and considered the terms of each of the Advisory Agreements. The Board evaluated MacKay’s experience in serving as subadvisor to the Fund and advising other portfolios and MacKay’s track record and experience in providing investment advisory services, the experience of investment advisory, senior management and administrative personnel at MacKay and New York Life Investments’ and MacKay’s overall resources, legal and compliance environment, capabilities and history. In addition to information provided in connection with quarterly meetings with the Trust’s Chief Compliance Officer, the Board considered information regarding the compliance policies and procedures of New York Life Investments and MacKay and acknowledged their commitment to further developing and strengthening compliance programs relating to the Fund. The Board reviewed MacKay’s ability to attract and retain qualified investment professionals and willingness to invest in personnel to service and support the Fund. In this regard, the Board considered the experience of the Fund’s portfolio managers, the number of accounts managed by the portfolio managers and the method for compensating the portfolio managers.
In addition, the Board considered discussions with New York Life Investments regarding the implementation of its business continuity plans and recognized steps taken by New York Life Investments and MacKay to continue to provide the same nature, extent and quality of services to the Fund during the COVID-19 pandemic.
Based on these considerations, the Board concluded that the Fund would likely continue to benefit from the nature, extent and quality of these services.
Investment Performance
In evaluating the Fund’s investment performance, the Board considered investment performance results over various periods in light of the Fund’s investment objective, strategies and risks. The Board considered
Board Consideration and Approval of Management Agreement and Subadvisory Agreement (Unaudited) (continued)
investment reports on, and analysis of, the Fund’s performance provided to the Board throughout the year. These reports include, among other items, information on the Fund’s gross and net returns, the Fund’s investment performance compared to relevant investment categories and the Fund’s benchmarks, the Fund’s risk-adjusted investment performance and the Fund’s investment performance as compared to peer funds, as appropriate, as well as portfolio attribution information and commentary on the effect of market conditions. The Board also considered information provided by Strategic Insight showing the investment performance of the Fund as compared to peer funds.
The Board also gave weight to its discussions with senior management at New York Life Investments concerning the Fund’s investment performance attributable to MacKay as well as discussions between the Fund’s portfolio managers and the members of the Board’s Investment Committee, which generally occur on an annual basis. In addition, the Board considered any specific actions that New York Life Investments or MacKay had taken, or had agreed to take, to seek to enhance Fund investment performance and the results of those actions. In considering the investment performance of the Fund, the Board noted that the Fund underperformed its peer funds for the one-, three-, five- and ten-year periods ended July 31, 2020. The Board considered its discussions with representatives from New York Life Investments and MacKay regarding the Fund’s investment performance.
Based on these considerations, the Board concluded that its review of the Fund’s investment performance and related information supported a determination to approve the continuation of each of the Advisory Agreements.
Costs of the Services Provided, and Profits Realized, by New York Life Investments and MacKay
The Board considered the costs of the services provided under each of the Advisory Agreements. The Board also considered the profits realized by New York Life Investments and its affiliates, including MacKay, due to their relationships with the Fund. Because MacKay is an affiliate of New York Life Investments whose subadvisory fee is paid by New York Life Investments, not the Fund, the Board considered cost and profitability information for New York Life Investments and MacKay in the aggregate.
In addition, the Board acknowledged the difficulty in obtaining reliable comparative data about mutual fund managers’ profitability because such information generally is not publicly available and may be impacted by numerous factors, including the structure of a fund manager’s organization, the types of funds it manages, the methodology used to allocate certain fixed costs to specific funds and the manager’s capital structure and costs of capital.
In evaluating the costs of the services provided by New York Life Investments and MacKay and profits realized by New York Life Investments and its affiliates, including MacKay, the Board considered, among other factors, each party’s continuing investments in, or willingness to invest in, personnel, systems, equipment and other resources and infrastructure to support and further enhance the
management of the Fund, and that New York Life Investments is responsible for paying the subadvisory fee for the Fund. The Board also considered the financial resources of New York Life Investments and MacKay and acknowledged that New York Life Investments and MacKay must be in a position to attract and retain experienced professional personnel and to maintain a strong financial position for New York Life Investments and MacKay to continue to provide high-quality services to the Fund. The Board recognized that the Fund benefits from the allocation of certain fixed costs among the funds in the MainStay Group of Funds, among other expected benefits resulting from its relationship with New York Life Investments.
The Board considered information regarding New York Life Investments’ methodology for calculating profitability and allocating costs provided by New York Life Investments in connection with the fund profitability analysis presented to the Board. The Board previously engaged an independent consultant to review the methods used to allocate costs among the funds in the MainStay Group of Funds. The Board noted that the independent consultant had concluded that New York Life Investments’ methods for allocating costs and procedures for estimating overall profitability of the relationship with the funds in the MainStay Group of Funds are reasonable and that New York Life Investments continued to use the same method of calculating profit and allocating costs since the independent consultant’s review. The Board recognized the difficulty in calculating and evaluating a manager’s profitability with respect to the Fund and noted that other profitability methodologies may also be reasonable.
The Board also considered certain fall-out benefits that may be realized by New York Life Investments and its affiliates due to their relationships with the Fund, including reputational and other indirect benefits. The Board recognized, for example, the benefits to MacKay from legally permitted “soft-dollar” arrangements by which brokers provide research and other services to MacKay in exchange for commissions paid by the Fund with respect to trades on the Fund’s portfolio securities. In addition, the Board considered its review of a money market fund advised by New York Life Investments and an affiliated subadvisor that serves as an investment option for the Fund, including the potential rationale for and costs associated with investments in this money market fund by the Fund, if any, and considered information from New York Life Investments that the nature and type of specific investment advisory services provided to this money market fund are distinct from, or in addition to, the investment advisory services provided to the Fund.
The Board observed that, in addition to fees earned by New York Life Investments for managing the Fund, New York Life Investments’ affiliates also earn revenues from serving the Fund in various other capacities, including as the Fund’s transfer agent and distributor. The Board considered information about these other revenues and their impact on the profitability of the relationship with the Fund to New York Life Investments and its affiliates. The Board noted that, although it assessed the overall profitability of the Fund to New York Life Investments and its affiliates as part of the contract review process, when considering the reasonableness of the fee paid to New York Life Investments and its
| 36 | MainStay WMC Small Companies Fund |
affiliates under each of the Advisory Agreements, the Board considered the profitability of New York Life Investments’ relationship with the Fund on a pre-tax basis and without regard to distribution expenses incurred by New York Life Investments from its own resources.
After evaluating the information deemed relevant by the Trustees, the Board concluded that any profits realized by New York Life Investments and its affiliates, including MacKay, due to their relationships with the Fund were not excessive.
Management and Subadvisory Fees and Total Ordinary Operating Expenses
The Board evaluated the reasonableness of the fee paid under each of the Advisory Agreements and the Fund’s total ordinary operating expenses. The Board primarily considered the reasonableness of the management fee paid by the Fund to New York Life Investments, because the subadvisory fee paid to MacKay is paid by New York Life Investments, not the Fund. The Board also considered the reasonableness of the subadvisory fee paid by New York Life Investments and the amount of the management fee retained by New York Life Investments.
In assessing the reasonableness of the Fund’s fees and expenses, the Board primarily considered comparative data provided by Strategic Insight on the fees and expenses charged by similar mutual funds managed by other investment advisers. In addition, the Board considered information provided by New York Life Investments and MacKay on fees charged to other investment advisory clients, including institutional separate accounts and/or other funds that follow investment strategies similar to those of the Fund, if any. The Board considered the similarities and differences in the contractual management fee schedules of the Fund and these similarly-managed accounts and/or funds, taking into account the rationale for any differences in fee schedules. The Board also took into account explanations provided by New York Life Investments about the more extensive scope of services provided to registered investment companies, such as the Fund, as compared with other investment advisory clients. Additionally, the Board considered the impact of contractual breakpoints, voluntary waivers and expense limitation arrangements on the Fund’s net management fee and expenses. The Board also considered that in proposing fees for the Fund, New York Life Investments considers the competitive marketplace for mutual funds.
The Board noted that, outside of the Fund’s management fee and the fees charged under a share class’s Rule 12b-1 and/or shareholder services plans, a share class’s most significant “other expenses” are transfer agent fees. Transfer agent fees are charged to the Fund based on the number of shareholder accounts (a “per-account” fee). The Board took into account information from New York Life Investments regarding the reasonableness of the Fund’s transfer agent fee schedule, including industry data demonstrating that the per-account fees that NYLIM Service Company LLC, an affiliate of New York Life Investments and the Fund’s transfer agent, charges the Fund are within the range of per-account fees charged by transfer agents to other mutual funds. In addition, the Board considered NYLIM Service Company LLC’s profitability in connection with
the transfer agent services it provides to the Fund. The Board also took into account information received from NYLIM Service Company LLC regarding the sub-transfer agency payments it made to intermediaries in connection with the provision of sub-transfer agency services to the Fund.
The Board considered that, because the Fund’s transfer agent fees are billed on a per-account basis, the impact of transfer agent fees on a share class’s expense ratio may be more significant in cases where the share class has a high number of small accounts. The Board considered the extent to which transfer agent fees comprised total expenses of the Fund. The Board acknowledged the role that the MainStay Group of Funds historically has played in serving the investment needs of New York Life Insurance Company customers, who often maintain smaller account balances than other shareholders of funds, and the impact of small accounts on the expense ratios of Fund share classes. The Board also recognized measures that it and New York Life Investments have taken to mitigate the effect of small accounts on the expense ratios of Fund share classes, including through the imposition of an expense limitation on net transfer agency expenses. The Board noted that, for purposes of allocating transfer agency fees and expenses, each retail fund in the MainStay Group of Funds combines the shareholder accounts of its Class A, A2, I, R1, R2 and R3 shares (as applicable) into one group and the shareholder accounts of its Investor Class, SIMPLE Class and Class B, C and C2 shares (as applicable) into another group. The Board also noted that the per-account fees attributable to each group of share classes is then allocated among the constituent share classes based on relative net assets and that a MainStay Fund’s Class R6 shares, if any, are not combined with any other share class for this purpose. The Board considered New York Life Investments’ rationale with respect to these groupings and previously received a report from an independent consultant engaged to conduct comparative analysis of these groupings. The Board also considered that NYLIM Service Company LLC had waived its contractual cost of living adjustments during the past seven years.
Based on the factors outlined above, the Board concluded that the Fund’s management fee and total ordinary operating expenses were within a range that is competitive and support a conclusion that these fees and expenses are reasonable.
Economies of Scale
The Board considered information regarding economies of scale, including whether the Fund’s expense structure permits economies of scale to be appropriately shared with the Fund’s shareholders. The Board also considered a report from New York Life Investments, previously prepared at the request of the Board, that addressed economies of scale, including with respect to the mutual fund business generally and the various ways in which the benefits of economies of scale may be shared with the funds in the MainStay Group of Funds. Although the Board recognized the difficulty of determining economies of scale with precision, the Board acknowledged that economies of scale may be shared with the Fund in a number of ways, including, for example, through the imposition of management fee breakpoints, initially setting management fee rates at
Board Consideration and Approval of Management Agreement and Subadvisory Agreement (Unaudited) (continued)
scale or making additional investments to enhance services. The Board reviewed information from New York Life Investments showing how the Fund’s management fee schedule compared to fee schedules of other funds and accounts managed by New York Life Investments. The Board also reviewed information from Strategic Insight showing how the Fund’s management fee schedule compared with fees paid for similar services by peer funds at varying asset levels.
Based on this information, the Board concluded that economies of scale are appropriately reflected for the benefit of the Fund’s shareholders through the Fund’s expense structure and other methods to share benefits from economies of scale.
Conclusion
On the basis of the information and factors summarized above, among other information and factors deemed relevant by the Trustees, and the evaluation thereof, the Board, including the Independent Trustees voting separately, unanimously voted to approve the continuation of each of the Advisory Agreements.
| 38 | MainStay WMC Small Companies Fund |
Board consideration and Approval of Subadvisory Agreement with Wellington Management Company LLP (Unaudited)
The Subadvisory Agreement between New York Life Investment Management LLC (“New York Life Investments”) and Wellington Management Company LLP (“Wellington”) with respect to the MainStay WMC Small Companies Fund (formerly known as the MainStay MacKay Small Cap Core Fund) (“Fund”) (“New Subadvisory Agreement”), must be approved initially and, following an initial term of up to two years, is subject to annual review and approval by the Board of Trustees of MainStay Funds Trust (“Board” of the “Trust”) in accordance with Section 15 of the Investment Company Act of 1940, as amended (“1940 Act”). At its February 3, 2021 meeting, the Board, including the Trustees who are not an “interested person” (as such term is defined in the 1940 Act) of the Trust (“Independent Trustees”) voting separately, unanimously approved the New Subadvisory Agreement for an initial two-year period.
At meetings held on January 21, January 25 and February 3, 2021, the Board considered and approved New York Life Investments’ recommendations to appoint Wellington as the subadvisor to the Fund, to approve the New Subadvisory Agreement and to approve the related changes to the Fund’s principal investment strategies, name and investment process (the “Repositioning”), all effective on or about March 5, 2021. The Board noted that the material terms of the New Subadvisory Agreement are substantially identical to the terms of the then-current subadvisory agreement with MacKay Shields LLC (“MacKay”) with respect to the Fund, but that the subadvisory fee schedule under the New Subadvisory Agreement with Wellington includes fees that are lower at every level of assets than the subadvisory fees paid to MacKay under the then-current subadvisory agreement.
In reaching the decisions to approve the Repositioning and New Subadvisory Agreement, the Board considered information furnished by New York Life Investments and Wellington in connection with meetings of the Board and its Contracts, Investment and Risk and Compliance Oversight Committees held on January 21, January 25 and February 3, 2021, as well as other information furnished to the Board and its Committees throughout the year, as deemed relevant by the Trustees. In addition, the Board considered information previously provided to the Board in connection with its review of the subadvisory agreements for other funds in the MainStay Group of Funds, as deemed relevant to each Trustee. The Board also considered information furnished by Wellington in response to requests prepared on behalf of the Board, and in consultation with the Independent Trustees, by independent legal counsel to the Independent Trustees, which encompassed a variety of topics, including those summarized below.
The Board took into account information provided in connection with its meetings throughout the year, including, among other items, information regarding the legal standards and fiduciary obligations applicable to its consideration of the New Subadvisory Agreement and investment performance reports on the Fund as well as presentations from New York Life Investments and Wellington personnel. The contract review process, including the structure and format for materials provided to the Board, has been developed in consultation with the Board. The Independent
Trustees also met in executive sessions with their independent legal counsel and, for a portion thereof, with senior management of New York Life Investments.
In considering the Repositioning and the New Subadvisory Agreement, the Trustees reviewed and evaluated the information and factors they believed to reasonably be necessary and appropriate in light of legal advice furnished to them by independent legal counsel and through the exercise of their own business judgment. Although individual Trustees may have weighed certain factors or information differently, the factors considered by the Board are described in greater detail below and include, among other factors: (i) the nature, extent and quality of the services to be provided to the Fund by Wellington; (ii) the investment performance of the Fund, the qualifications of the proposed portfolio managers of the Fund and the historical investment performance of products managed by such portfolio managers with investment strategies similar to those of the Fund, as repositioned; (iii) the anticipated costs of the services to be provided, and profits expected to be realized, by Wellington from its relationship with the Fund; (iv) the extent to which economies of scale may be realized if the Fund grows and the extent to which economies of scale may benefit the Fund’s shareholders; and (v) the reasonableness of the Fund’s proposed subadvisory fee to be paid by New York Life Investments to Wellington and estimated total ordinary operating expenses. Although the Board recognized that comparisons between the Fund’s proposed fees and estimated expenses and those of other funds are imprecise given different terms of agreements, variations in fund strategies and other factors, the Board considered the reasonableness of the Fund’s proposed fees and estimated total ordinary operating expenses as compared to the peer funds identified by New York Life Investments.
Although individual Trustees may have weighed certain factors or information differently, the Board’s decisions to approve the Repositioning and the New Subadvisory Agreement were based on a consideration of the information provided to the Trustees throughout the year, such as presentations from Wellington personnel, as well as information furnished specifically in connection with the contract review process for the Fund, in each case as deemed relevant to each Trustee. The Trustees noted that, throughout the year, the Trustees would be afforded an opportunity to ask questions of, and request additional information or materials from, New York Life Investments and Wellington with respect to the Fund. The Board took note of New York Life Investments’ belief that Wellington, with its resources and historical investment performance track record for strategies similar to those of the Fund, as repositioned, is well qualified to serve as the Fund’s subadvisor. In addition to considering the above-referenced factors, the Board observed that in the marketplace there are a range of investment options available to the Fund’s shareholders and such shareholders, having had the opportunity to consider other investment options, have chosen to invest in the Fund.
The factors that figured prominently in the Board’s decisions to approve the Repositioning and the New Subadvisory Agreement are summarized in more detail below, and the Board did not consider any factor or information controlling in reaching such decisions.
Board consideration and Approval of Subadvisory Agreement with Wellington Management Company LLP (Unaudited) (continued)
Nature, Extent and Quality of Services to be Provided by Wellington
In considering the Repositioning and the New Subadvisory Agreement, the Board considered New York Life Investments’ responsibilities as manager of the Fund, noting that New York Life Investments is responsible for supervising the Fund’s subadvisor. The Board examined the nature, extent and quality of the investment advisory services that Wellington proposed to provide to the Fund. Further, the Board evaluated and/or examined the following with regard to Wellington:
| • | experience in providing investment advisory services; |
| • | experience in serving as advisor or subadvisor to other funds with similar strategies as those of the Fund, as repositioned, and the performance track record of those funds; |
| • | experience of investment advisory, senior management and administrative personnel; |
| • | overall legal and compliance environment, resources and history and policies and procedures in place with respect to matters that may involve conflicts of interest between the Fund’s investments and those of other accounts managed by Wellington; |
| • | New York Life Investments’ and Wellington’s belief that their respective compliance policies, procedures and systems are reasonably designed to prevent violation of the federal securities laws and their commitment to further developing and strengthening compliance programs relating to the MainStay Group of Funds generally and the Fund specifically; |
| • | ability to attract and retain qualified investment professionals and willingness to invest in personnel to service and support the Fund; |
| • | portfolio construction and risk management processes; |
| • | experience of the Fund’s proposed portfolio managers, including with respect to investment strategies similar to those of the Fund, the number of accounts managed by the portfolio managers and the method for compensating the portfolio managers; and |
| • | overall reputation, financial condition and assets under management. |
Based on these considerations, the Board concluded that the Fund would likely benefit from the nature, extent and quality of the proposed investment advisory services to be provided by Wellington.
Investment Performance
In evaluating the Fund’s investment performance, the Board considered investment performance results over various periods in light of the Fund’s investment objective, strategies and risks. The Board considered investment reports on, and analysis of, the Fund’s performance provided to the Board throughout the year. These reports include, among other items, information on the Fund’s gross and net returns, the Fund’s investment performance compared to relevant investment categories and the Fund’s benchmarks, the Fund’s risk-adjusted investment performance
and the Fund’s investment performance as compared to peer funds, as appropriate, as well as portfolio attribution information and commentary on the effect of market conditions.
The Board also gave weight to its discussions with senior management at New York Life Investments concerning the Fund’s investment performance and remediation efforts undertaken by New York Life Investments, and other alternatives to the Repositioning, and the New Subadvisory Agreement considered by New York Life Investments. In addition, the Board considered steps taken to seek to improve the Fund’s investment performance and discussions between the Fund’s current portfolio management team and the Investment Committee of the Board. The Board further considered that shareholders may benefit from Wellington’s investment process, including its portfolio construction and risk management processes. The Board noted that the Repositioning had not yet been implemented so an investment performance track record for the Fund, as repositioned, was not available.
The Board evaluated the Fund’s proposed portfolio management team, investment process, strategies and risks. The Board noted that Wellington currently manages one or more portfolios with investment strategies similar to those of the Fund, as repositioned. Additionally, the Board considered the historical performance of such portfolio or portfolios and other portfolios managed by the proposed portfolio managers for the Fund. Based on these considerations, the Board concluded that the Fund was likely to be managed responsibly and capably by Wellington.
Based on these considerations, the Board concluded that the selection of Wellington as the subadvisor to the Fund is likely to benefit the Fund’s long-term investment performance.
Costs of the Services to be Provided, and Profits to be Realized, by Wellington
The Board considered the anticipated costs of the services to be provided by Wellington under the New Subadvisory Agreement and the profits expected to be realized by Wellington due to its relationship with the Fund. The Board considered that Wellington’s subadvisory fee had been negotiated at arm’s-length by New York Life Investments and that these fees would be paid by New York Life Investments, not the Fund.
In evaluating the anticipated costs of the services to be provided by Wellington and profits expected to be realized by Wellington, the Board considered, among other factors, Wellington’s investments in, or willingness to invest in, personnel, systems, equipment and other resources and infrastructure to support and further enhance the services proposed to be provided to the Fund, and that New York Life Investments would be responsible for paying the subadvisory fee to Wellington. The Board also considered the financial resources of Wellington and acknowledged that Wellington must be in a position to attract and retain experienced professional personnel and to maintain a strong financial position for Wellington to be able to provide high-quality services to the Fund.
| 40 | MainStay WMC Small Companies Fund |
In considering anticipated costs and profitability, the Board also considered certain fall-out benefits that may be realized by Wellington due to its relationship with the Fund, including reputational and other indirect benefits. The Board recognized, for example, the potential benefits to Wellington from legally permitted “soft-dollar” arrangements by which brokers would provide research and other services to Wellington in exchange for commissions paid by the Fund with respect to trades in the Fund’s portfolio securities. In addition, the Board also requested and received information from New York Life Investments concerning other material business relationships between Wellington and its affiliates and New York Life Investments and its affiliates, and considered the existence of a strategic partnership between New York Life Investments and Wellington that relates to certain current and future products that represented a conflict of interest associated with New York Life Investments’ recommendation to approve the Repositioning and the New Subadvisory Agreement.
The Board took into account the fact that the Fund would undergo changes to its principal investment strategies in connection with the Repositioning. The Board noted estimates from New York Life Investments and Wellington that a significant portion of the holdings of the Fund would be sold to align the Fund’s holdings with the strategies that would be pursued by Wellington. Additionally, the Board considered New York Life Investments’ representation that New York Life Investments would work closely with Wellington to seek to execute the optimal transition strategy and that New York Life Investments would make every effort to minimize potential direct and indirect costs associated with the Repositioning.
The Board considered that any profits realized by Wellington due to its relationship with the Fund would be the result of arm’s-length negotiations between New York Life Investments and Wellington, acknowledging that any such profits would be based on fees paid to Wellington by New York Life Investments, not the Fund.
Subadvisory Fee and Estimated Total Ordinary Operating Expenses
The Board evaluated the reasonableness of the fee to be paid under the New Subadvisory Agreement and the Fund’s estimated total ordinary operating expenses. The Board primarily considered the reasonableness of the management fee to be paid by the Fund to New York Life Investments because the subadvisory fee to be paid to Wellington would be paid by New York Life Investments, not the Fund. The Board also considered the reasonableness of the subadvisory fee to be paid by New York Life Investments and the amount of the management fee expected to be retained by New York Life Investments.
In assessing the reasonableness of the Fund’s proposed fees and estimated expenses, the Board considered information provided by New York Life Investments on fees and expenses of peer funds. The Board also considered that in proposing fees for the Fund, New York Life Investments considers the competitive marketplace for mutual funds.
Based on the factors outlined above, the Board concluded that the Fund’s management fee and total ordinary operating expenses were within a range that is competitive and support a conclusion that these fees and expenses are reasonable.
Economies of Scale
The Board considered information regarding economies of scale, including whether the Fund’s proposed expense structure would permit economies of scale to be appropriately shared with the Fund’s shareholders. The Board also considered a report from New York Life Investments, previously prepared at the request of the Board, that addressed economies of scale, including with respect to the mutual fund business generally and the various ways in which the benefits of economies of scale may be shared with the funds in the MainStay Group of Funds. Although the Board recognized the difficulty of determining economies of scale with precision, the Board acknowledged that economies of scale may be shared with the Fund in a number of ways, including, for example, through the imposition of fee breakpoints, initially setting management fee rates at scale or making additional investments to enhance services.
Based on this information, the Board concluded that economies of scale are appropriately reflected for the benefit of the Fund’s shareholders through the Fund’s proposed expense structure and other methods to share benefits from economies of scale.
Conclusion
On the basis of the information and factors summarized above, among other information and factors deemed relevant by the Trustees, and the evaluation thereof, the Board, including the Independent Trustees voting separately, unanimously voted to approve the Repositioning and the New Subadvisory Agreement.
Discussion of the Operation and Effectiveness of the Fund's Liquidity Risk Management Program (Unaudited)
In compliance with Rule 22e-4 under the Investment Company Act of 1940, as amended (the “Liquidity Rule”), the Fund has adopted and implemented a liquidity risk management program (the “Program”), which New York Life Investment Management LLC believes is reasonably designed to assess and manage the Fund's liquidity risk (the risk that the Fund could not meet requests to redeem shares issued by the Fund without significant dilution of remaining investors’ interests in the Fund). The Board of Trustees of MainStay Funds Trust (the "Board") designated New York Life Investment Management LLC as administrator of the Program (the “Administrator”). The Administrator has established a Liquidity Risk Management Committee to assist the Administrator in the implementation and day-to-day administration of the Program and to otherwise support the Administrator in fulfilling its responsibilities under the Program.
At a meeting of the Board held on March 8, 2021, the Administrator provided the Board with a written report addressing the Program’s operation and assessing its adequacy and effectiveness of implementation for the period from January 1, 2020 through December 31, 2020 (the "Review Period"), as required under the Liquidity Rule. The report noted that the Administrator concluded that (i) the Program operated effectively to assess and manage the Fund's liquidity risk, (ii) the Program has been adequately and effectively implemented to monitor and, as applicable, respond to the Fund's liquidity developments and (iii) the Fund's investment strategy continues to be appropriate for an open-end fund. In addition, the report discussed notable events that impacted liquidity risk during the Review Period, including the COVID-19 pandemic and the resulting economic shutdown.
In accordance with the Program, the Fund's liquidity risk is assessed no less frequently than annually taking into consideration certain factors, as applicable, such as (i) investment strategy and liquidity of portfolio investments, (ii) short-term and long-term cash flow projections and (iii) holdings of cash and cash equivalents, as well as borrowing arrangements and other funding sources. Certain factors are considered under both normal and reasonably foreseeable stressed conditions.
Each Fund portfolio investment is classified into one of four liquidity categories. The classification is based on a determination of the number of days it is reasonably expected to take to convert the investment into cash, or sell or dispose of the investment, in current market conditions without significantly changing the market value of the investment. The Administrator has delegated liquidity classification determinations to the Fund’s subadvisor, subject to appropriate oversight by the Administrator, and classification determinations are made by taking into account the Fund's reasonably anticipated trade size, various market, trading and investment-specific considerations, as well as market depth, and, in certain cases, third-party vendor data.
The Liquidity Rule requires funds that do not primarily hold assets that are highly liquid investments to adopt a minimum amount of net assets that must be invested in highly liquid investments that are assets (an “HLIM”). In addition, the Liquidity Rule limits a fund's investments in illiquid investments. Specifically, the Liquidity Rule prohibits acquisition of illiquid investments if doing so would result in a fund holding more than 15% of its net assets in illiquid investments that are assets. The Program includes provisions reasonably designed to determine, periodically review and comply with the HLIM requirement, as applicable, and to comply with the 15% limit on illiquid investments.
There can be no assurance that the Program will achieve its objectives under all circumstances in the future. Please refer to the Fund's prospectus for more information regarding the Fund's exposure to liquidity risk and other risks to which it may be subject.
| 42 | MainStay WMC Small Companies Fund |
Proxy Voting Record
The Fund is required to file with the Securities and Exchange Commissions's ("SEC") its proxy voting records for the 12-month period ending June 30 on Form N-PX. The most recent Form N-PX or proxy voting record is available free of charge upon request by calling 800-624-6782; visiting the MainStay Funds’ website at newyorklifeinvestments.com; or visiting the SEC’s website at www.sec.gov.
Shareholder Reports and Quarterly Portfolio Disclosure
The Fund is required to file its complete schedule of portfolio holdings with the SEC 60 days after its first and third fiscal quarter on Form N-PORT. The Fund's holdings report is available free of charge upon request by calling New York Life Investments at 800-624-6782.
This page intentionally left blank.
This page intentionally left blank.
This page intentionally left blank.
Equity
U.S. Equity
MainStay Epoch U.S. Equity Yield Fund
MainStay MacKay S&P 500 Index Fund
MainStay Winslow Large Cap Growth Fund
MainStay WMC Enduring Capital Fund
MainStay WMC Growth Fund
MainStay WMC Small Companies Fund
MainStay WMC Value Fund
International Equity
MainStay Epoch International Choice Fund
MainStay MacKay International Equity Fund
MainStay WMC International Research Equity Fund
Emerging Markets Equity
MainStay Candriam Emerging Markets Equity Fund
Global Equity
MainStay Epoch Capital Growth Fund
MainStay Epoch Global Equity Yield Fund
Fixed Income
Taxable Income
MainStay Candriam Emerging Markets Debt Fund
MainStay Floating Rate Fund
MainStay MacKay High Yield Corporate Bond Fund
MainStay MacKay Short Duration High Yield Fund
MainStay MacKay Strategic Bond Fund
MainStay MacKay Total Return Bond Fund
MainStay MacKay U.S. Infrastructure Bond Fund
MainStay Short Term Bond Fund
Tax-Exempt Income
MainStay MacKay California Tax Free Opportunities Fund1
MainStay MacKay High Yield Municipal Bond Fund
MainStay MacKay Intermediate Tax Free Bond Fund
MainStay MacKay New York Tax Free Opportunities Fund2
MainStay MacKay Short Term Municipal Fund
MainStay MacKay Tax Free Bond Fund
Money Market
MainStay Money Market Fund
Mixed Asset
MainStay Balanced Fund
MainStay Income Builder Fund
MainStay MacKay Convertible Fund
Speciality
MainStay CBRE Global Infrastructure Fund
MainStay CBRE Real Estate Fund
MainStay Cushing MLP Premier Fund
Asset Allocation
MainStay Conservative Allocation Fund
MainStay Conservative ETF Allocation Fund
MainStay Defensive ETF Allocation Fund
MainStay Equity Allocation Fund
MainStay Equity ETF Allocation Fund
MainStay Growth Allocation Fund
MainStay Growth ETF Allocation Fund
MainStay Moderate Allocation Fund
MainStay Moderate ETF Allocation Fund
Manager
New York Life Investment Management LLC
New York, New York
Subadvisors
Candriam Belgium S.A.3
Brussels, Belgium
Candriam Luxembourg S.C.A.3
Strassen, Luxembourg
CBRE Clarion Securities LLC
Radnor, Pennsylvania
Cushing Asset Management, LP
Dallas, Texas
Epoch Investment Partners, Inc.
New York, New York
MacKay Shields LLC3
New York, New York
NYL Investors LLC3
New York, New York
Wellington Management Company LLP
Boston, Massachusetts
Winslow Capital Management, LLC
Minneapolis, Minnesota
Legal Counsel
Dechert LLP
Washington, District of Columbia
Independent Registered Public Accounting Firm
KPMG LLP
Philadelphia, Pennsylvania
Distributor
NYLIFE Distributors LLC3
Jersey City, New Jersey
Custodian
JPMorgan Chase Bank, N.A.
New York, New York
1.
This Fund is registered for sale in AZ, CA, NV, OR, TX, UT, WA and MI (Class A and I shares only), and CO, FL, GA, HI, ID, MA, MD, NH, NJ and NY (Class I shares only).
| 2. | This Fund is registered for sale in CA, CT, DE, FL, MA, NJ, NY and VT. |
| 3. | An affiliate of New York Life Investment Management LLC. |
Not part of the Semiannual Report
For more information
800-624-6782
newyorklifeinvestments.com
“New York Life Investments” is both a service mark, and the common trade name, of certain investment advisors affiliated with New York Life Insurance Company. The MainStay Funds® are managed by New York Life Investment Management LLC and distributed by NYLIFE Distributors LLC, 30 Hudson Street, Jersey City, NJ 07302, a wholly owned subsidiary of New York Life Insurance Company. NYLIFE Distributors LLC is a Member FINRA/SIPC.
©2021 NYLIFE Distributors LLC. All rights reserved.
| 1736841MS071-21 | MSWSC10-06/21 |
(NYLIM) NL531
Not applicable.
| Item 3. | Audit Committee Financial Expert. |
Not applicable.
| Item 4. | Principal Accountant Fees and Services. |
Not applicable.
| Item 5. | Audit Committee of Listed Registrants. |
Not applicable.
The Schedule of Investments is included as part of Item 1 of this report.
| Item 7. | Disclosure of Proxy Voting Policies and Procedures for Closed-End Management Investment Companies. |
Not applicable.
| Item 8. | Portfolio Managers of Closed-End Management Investment Companies. |
Not applicable.
| Item 9. | Purchases of Equity Securities by Closed-End Management Investment Company and Affiliated Purchasers. |
Not applicable.
| Item 10. | Submission of Matters to a Vote of Security Holders. |
Since the Registrant’s last response to this Item, there have been no material changes to the procedures by which shareholders may recommend nominees to the Registrant’s Board of Trustees.
| Item 11. | Controls and Procedures. |
(a) Based on an evaluation of the Registrant’s Disclosure Controls and Procedures (as defined in Rule 30a-3(c) under the Investment Company Act of 1940) (the “Disclosure Controls”), as of a date within 90 days prior to the filing date (the “Filing Date”) of this Form N-CSR (the “Report”), the Registrant’s principal executive officer and principal financial officer have concluded that the Disclosure Controls are reasonably designed to ensure that information required to be disclosed by the Registrant in the Report is recorded, processed, summarized and reported by the Filing Date, including ensuring that information required to be disclosed in the Report is accumulated and communicated to the Registrant’s management, including the Registrant’s principal executive officer and principal financial officer, as appropriate to allow timely decisions regarding required disclosure.
(b) There were no changes in the Registrant’s internal control over financial reporting (as defined in Rule 30a-3(d)) under the Investment Company Act of 1940 that occurred during the period covered by this report that has materially affected, or is reasonably likely to materially affect, the Registrant’s internal control over financial reporting.
| Item 12. | Disclosure of Securities Lending Activities for Closed-End Management Investment Companies. |
Not applicable.
SIGNATURES
Pursuant to the requirements of the Securities Exchange Act of 1934 and the Investment Company Act of 1940, the Registrant has duly caused this Report to be signed on its behalf by the undersigned, thereunto duly authorized.
MAINSTAY FUNDS TRUST
| | |
| By: | | /s/ Kirk C. Lehneis |
| | Kirk C. Lehneis President and Principal Executive Officer |
Date: July 9, 2021
Pursuant to the requirements of the Securities Exchange Act of 1934 and the Investment Company Act of 1940, this Report has been signed below by the following persons on behalf of the Registrant and in the capacities and on the dates indicated.
| | |
| By: | | /s/ Kirk C. Lehneis |
| | Kirk C. Lehneis President and Principal Executive Officer |
Date: July 9, 2021
| | |
| By: | | /s/ Jack R. Benintende |
| | Jack R. Benintende Treasurer and Principal Financial and Accounting Officer |
Date: July 9, 2021
EXHIBIT INDEX